Sector policy experts are developing emissions-impact estimates for a large number of climate change policies. For each policy, sector teams are asked to provide:
A best estimate (most likely outcome)
A plausible best-case estimate (optimistic but realistic)
A plausible worst-case estimate (pessimistic but realistic)
From this, an overall uncertainty estimate, or confidence level is to be determined for the portfolio of policies. A simple approach to this would be achieved by summing the total best and worst estimate cases across all policies and calculate the difference to provide a single numerical range value. That is,
This would allow statements of the following form to be made:
“Based on expert estimates the total emissions reduction could plausibly go from 10 MtCO₂e to 50 MtCO₂e, with a range of 40 MtCO₂e”
While this gives a basic measure of spread, it has two major limitations:
It assumes all policies meet their respective extremes simultaneously, which is highly unlikely.
It does not convey how likely any given value within the range is – it’s a bounding box, not a probability distribution.
Thus, a more robust way is needed to present a meaningful range and confidence interval for the aggregated emissions reductions.
Proposed approach
A Monte Carlo simulation is well-suited for this type of uncertainty analysis. It improves upon the simple range aggregation method by:
Capturing the combined effect of many policies without assuming extremes occur simultaneously.
Providing a probabilistic estimate that better represents likely outcomes.
Allowing sensitivity testing (e.g. exploring the impact of policy correlations if relevant)
The key steps for conducting the Monte Carlo simulation are:
Define probability distributions – Each policy’s emissions impact is modelled using a probability distribution based on sector team inputs. Pragmatically, a triangular distribution (peaked at the best estimate, with plausible best/worst case as the range) is a practical and transparent choice given limited data.
Run simulations – Random values are drawn from each policy’s distribution and aggregated. This process is repeated potentially thousands of times to build a distribution of total emissions outcomes.
Analyse the output – The resulting distribution of aggregated policy impacts allows us to:
Derive a probable range (e.g. 10th – 90th percentile) rather than an extreme max-min spread of the simplified approach.
Identify a central estimate (e.g. the median or mean of the distribution).
Calculate confidence intervals (e.g. 95% confidence that total reductions fall within a specific range).
It is important to consider methodological choices before undertaking the analysis, including confidence in the policy estimates that are made by the experts, probability distributions chosen and treatment of policy dependencies.
The Monte Carlo simulations can be implemented using widely available tools, for example, Python, R, or Microsoft Excel (with appropriate plug-ins or add-ins).
Following the analysis of the outputs of the Monte Carlo simulations, specific commentary can be made on emissions-impact estimates for the full policy package, ensuring clarity in the communication of uncertainty.
Dependence on expert inputs
An important caveat in the robustness of the Monte Carlo results is that the method depends entirely on the quality of the underlying inputs. Since the method uses expert-provided worst-case, best estimate, and best-case values, any biases, inconsistencies, or overly optimistic/pessimistic assumptions will be carried through to the results. It is therefore essential to:
Encourage sector teams to provide realistic and well-considered bounds.
Be clear that the results reflect expert judgement about what could happen, rather than measured variability based on observed data.
Revisit and refine inputs as more data or evidence becomes available.
Outputs from Monte Carlo simulation
The Monte Carlo simulation approach would allow statements of the following forms to be made:
In relation to central estimates (median or mean):
“The median estimated emissions reduction from the policy package is 29 MtCO₂e.”
For confidence intervals:
“We estimate with 95% confidence that total emissions reductions will fall between 18 and 43 MtCO₂e.”
For percentile ranges:
“The 10th–90th percentile range for total emissions reduction is 20 to 40 MtCO₂e, reflecting where most outcomes are concentrated.”
For risk-based statements:
“There is less than a 5% chance that the policy package will achieve less than 20 MtCO₂e in emissions reductions.”
_____________
How to cite this publication:
Galloway, S. (2025) ‘ Briefing: Accounting for uncertainty in aggregated emissions – Impact estimates ‘, ClimateXChange. DOI: http://dx.doi.org/10.7488/era/5898
While every effort is made to ensure the information in this report is accurate, no legal responsibility is accepted for any errors, omissions or misleading statements. The views expressed represent those of the author(s), and do not necessarily represent those of the host institutions or funders.
This work was supported by the Rural and Environment Science and Analytical Services Division of the Scottish Government (CoE – CXC).
Over 72% of buildings in Scotland still rely on mains gas as their primary heat source. Scotland must further decarbonise heating in homes and buildings to achieve its climate change targets. The Scottish Government’s 2021 Heat in Buildings Strategy identified clean heat networks as a strategic decarbonisation technology. However, given the significant levels of capital investment required to transform Scotland’s buildings and limited public sector budgets, additional investment will be needed from the private sector.
Aims
This study examines present and potential future financing models in the heat network sector (“the sector”) and identifies suitable levers and actions for incentivising private finance. Findings are based on a series of interviews with stakeholders, including operators, funders, advisors and public sector representatives, as well as desk-based research. We draw comparisons and insights from other relevant utility sectors and from other countries (the Netherlands, Germany, Finland, Sweden and Estonia) as well as England and Wales.
Findings
Challenges facing the sector
In Scotland and across the UK, the heat network sector has typically been funded by early-stage financing from developers and significant levels of subsidy from the public sector. These public subsidies have encouraged private investment in the sector and supported the roll out of heat networks across Scotland.
The most impactful barriers in the sector are demand uncertainty, revenue instability and the evolving regulatory environment. This limits investment appetite, restricting the roll out of heat networks at scale in Scotland. The barriers are illustrated in Figure 1.
Figure 1: Heat network deployment barriers. Source: EY analysis and stakeholder feedback
International comparisons
Maturity – Scotland, the rest of the UK and the Netherlands have a developing heat network sector. Germany is expanding its market. Sweden, Finland and Estonia have mature markets where the sector is tried, tested and trusted.
Regulation – Many of the developed and mature markets are unregulated: they use self-governing frameworks and technical codes. This is coupled with high levels of local governance, greater pricing transparency and consistent contractual delivery and routes. These markets can focus on consumer pricing that supports investment and stimulates the sector’s development. Additionally, mandatory connections are being used in some circumstances in other countries, to make projects more investible and create demand assurance, which encourages private investment.
Ownership profiles and private finance – The more developed markets (including Sweden, Finland and Estonia) have a mixed degree of public ownership. More mature markets are likely to have a higher level of private finance penetration. In Finland, public sector ownership remains at a high level, whilst still seeking investment from the private sector. In Germany there’s a growing commitment to re-municipalise infrastructure and reverse privatisations. In the Netherlands, where over 90% of sector finance is private, the government proposed legislation to part-nationalise the sector in 2022 to mitigate concerns around the affordability and reliability of the sector.
The developed markets are mainly regulated by standard frameworks. These markets can access private finance due to the established nature of the sector. However, the technology has been embedded in the culture of these countries for much longer and so regulators can focus on price transparency and fairness for the end user rather than a framework for developing the market.
Financial levers – Most of the comparator countries have adopted a range of financial levers. Many have applied a similar approach to Scotland, including the continued use of capital grant funding, project development funding or individual grants for expanding and upgrading heat networks. Grant funding is still widely used in the less mature sectors. As the sector matures, intervention rates reduce or there is greater requirement for a higher degree of renewable heat sources to be used. Additionally, state-owned infrastructure banks have been investing in the sector to help refurbishments or provide debt financing for expansion.
Utility sectors
Various regulatory regimes and financial support mechanisms have been used in other sectors to stimulate private sector investment in the development of new infrastructure. The Scottish Government must consider the costs and practical challenges of pursuing financial support mechanism models that are not being adopted in England and Wales:
Contracts for Difference (CfDs) have proved very successful in securing the necessary investment in a wide range of renewable energy technologies. This approach could provide revenue support to heat networks to incentivise the transition to more sustainable forms of heat generation. In particular, CfDs could support heat networks that use decarbonised heat sources (e.g. heat pumps), which are likely to have a higher cost than conventional gas boilers or heat networks using waste heat. Therefore, as well as providing revenue certainty, a CfD has the potential to subsidise the increased cost of decarbonised heat for end users.
A Regulated Asset Base (RAB) model, alongside periodic price reviews, can protect consumer prices whilst also encouraging ongoing capital investment, supporting asset maintenance and providing predictable revenue streams. The model would, however, involve significant administrative and resource cost. Prior to the sector maturing, a RAB model might not result in financially viable heat networks without additional capital or revenue support.
The Renewable Heat Incentive (RHI) model is a well understood revenue support mechanism previously used in the energy sector. Similar to CfDs, an RHI model would subsidise the cost of heat for consumers if it was based on the amount of heat generated (as opposed to consumption of heat). It would therefore contribute to the cost of deployment, helping to address the increased cost of installing this technology and at the same time, mitigating demand risk. A cap on payments could also be introduced to avoid over-incentivisation. However, the value for money of previous schemes has been questioned.
Market feedback
The private sector views heat networks as an attractive investment opportunity but there are areas of uncertainty that must be resolved, including the need for greater clarity on the development of future regulation. To facilitate private investment, stakeholders highlighted the need for continued grant funding support to de-risk project cashflows. They also emphasised the importance of clear regulation on key topics, including heat zoning, mandatory connection policies, planning and building regulations, as well as a definitive policy direction on phasing out gas boilers.
Recommendations
We recommend that the Scottish Government:
1. Maintains capital funding support for the sector, either via existing programmes, or new bespoke capital schemes. Explore opportunities for extending the timescales for drawing down grant funding.
2. De-risking future revenues is key to unlocking heat network development – private capital is available for projects, but they need to be financeable. More detailed analysis of a revenue support model, such as CfD or a RHI equivalent, is merited. However, the Scottish Government must address the challenges of establishing such schemes, including the significant administrative and resource implications of previous schemes.
3. Explores the benefits of implementing a RAB model, following further regulatory developments and the creation of an established asset base (over 10-15 years). However, consider the complexity and feasibility of this model.
4. Continues to work closely with the Scottish National Investment Bank (SNIB) and the UK National Wealth Fund to explore investment opportunities, create a shared understanding of each party’s objectives and ultimately unlock the capital that has been made available to invest. Both organisations are committed to investing into the sector.
5. Maintains and increases support for pre-construction projects, via the Heat Network Support Unit (HNSU) and specific development funding programmes.
6. Monitors the implementation of the UK Government’s zoning approach and, where appropriate, leverage best practice from the Department for Energy Security and Net Zero (DESNZ). This should be used to complement Scotland’s existing zoning approach.
7. Reviews its approach to regulation to help reduce regulatory uncertainty. Where appropriate, this should include leveraging best practice from England and Wales.
8. Continues to work with the UK Government on rebalancing electricity and gas prices. However, this will not eliminate the price difference between electricity and gas.
9. Develops a national Heat Network Strategy setting out a clear long-term vision for heat networks in Scotland.
Glossary / Abbreviations table
£/€ bn
Billions of £/€
LCCC
Low Carbon Contracts Company
£/€ m
Millions of £/€
LCITP
Low Carbon Infrastructure Transition Programme
ACM
The Netherlands’ Authority for Consumers and Markets
LHEES
Local Heat and Energy Efficiency Strategies
AMP
Asset Management Plans
MWh
Megawatt hour
ASHP
Air source heat pumps
NFFO
Non-Fossil Fuel Obligation
CAA
Civil Aviation Authority
NIB
Nordic Investment Bank
CAP
Competitively Appointed Provider
NWF
National Wealth Fund
CCC
Climate Change Committee
ODI
Outcome delivery incentive
CCUS
Carbon Capture, Utilisation and Storage
OFTO
Offshore Transmission Owners
CfD
Contract for difference
ORR
Office of Rail and Road
CXC
ClimateXChange
RAB
Regulated asset base
DBFO
Design, Build, Finance and Operate
RAV
Regulated Asset Value
DESNZ
Department for Energy Security and Net Zero
REMA
Review of Electricity market arrangements
DHLF
District Heating Loan Fund
RESCo
Regional Energy Services Company
DHN
District heat network
RHI
Renewable Heat Incentive
DPC
Direct Procurement for Customers programme
RIIO
Revenue = Incentives + Innovation + Outputs
EfW
Energy from Waste
ROC
Renewable Obligation Certificates
EY
Ernst and Young LLP
rUK
Rest of the UK
FOAK
First of a Kind
SFT
Scottish Futures Trust
GHNF
Green Heat Network Fund
SHNF
Scotland’s Heat Network Fund
HN
Heat network
SNIB
Scottish National Investment Bank
HNDM
Heat networks delivery models
SPV
Special Purpose Vehicle
HNES
Heat Network Efficiency Scheme
SRO
Scottish Renewables Obligation
HNIP
Heat Networks Investment Project
T&SCo
Transport and storage infrastructure
HNSA
Heat Networks (Scotland) Act 2021
TWh
Terawatt hours
HNSU
Heat Network Support Unit
UK
United Kingdom
KfW
Germany’s infrastructure bank
WCW
Dutch Collective Heat Supply Act
KPI
Key Performance Indicators
WPG
Germany’s Local Heat Planning Act
Introduction
Research aims
This report examines the heat network sector (also referred to as “the sector”) and will contribute to the Scottish Government’s ambition to accelerate the pace and scale of heat network rollout in Scotland. The report:
Summarises current financing models, structures, and barriers in the sector and establishes a baseline for the Scottish heat network landscape
Draws comparisons and insights from relevant utility sectors
Draws comparisons with international heat networks and their financing models
Provides insight into how heat networks are currently viewed by the private and public sector
Recommends suitable financial levers, models and policies for the sector
“Heat Network” definition
The definition of a “heat network” in the Heat Networks (Scotland) Act 2021 (HNSA) covers both district heat networks and communal heat networks. A district heat network distributes heat from one or more sources to more than one building. In a communal heating system heat is supplied to one building comprised of more than one building unit (for example, a block of flats).[1]
The majority of the findings in this report refer to district heat networks, but we have included both communal heating and district heating in our definition of a heat network.
Heat networks can be powered by a range of different technologies. Historically, heat networks have often utilised fossil fuels, including gas boilers. As a result, many legacy networks still rely on fossil fuel-based technology. Our analysis considers these legacy networks; however, we recognise that the Scottish Government is committed to supporting the roll out of clean heat networks and supporting the reduction in emissions from the sector. This is important context for the conclusions in this report.
Methodology
Our findings are based on extensive desk-based research conducted by sector specialists. The analysis also draws on insights from a series of interviews with sector stakeholders, including operators, funders, advisors and public sector representatives. This information has been used, together with our own sector experience and evidence from existing literature, to set out the existing baseline position in Scotland (and the rest of the UK) and to develop our recommendations for suitable financial levers, models and structures for the heat network sector in Scotland. Finally, the stakeholder feedback also informed our approach for drawing comparisons with other utility sectors and international comparators.
Our stakeholder engagement methodology and questions were agreed with CXC and the Scottish Government Steering Group. The engagement exercise consisted of 20 meetings and Microsoft Teams calls. In advance of the sessions, participants were issued with the questions and given the opportunity to share feedback either in writing or verbally.
Policy Context
Scotland’s ambitious climate change targets are to achieve net zero greenhouse gas emissions by 2045. To deliver this, Scotland must instigate a step change in decarbonising the heating of its homes and buildings. Domestic buildings account for 15% of Scotland’s total greenhouse gas emissions and around 27% of its total energy consumption[2]. The scale of this decarbonisation challenge is significant – Figure 2 shows that in 2022, over 72% of Scotland’s homes relied on mains gas as their primary heating fuel[3].
Figure 2: Breakdown of primary heating fuel vs number of homes
The Scottish Government’s 2021 Heat in Building Strategy identified clean heat networks as a key strategic technology which is tried and tested and can be scaled up.
The Heat Networks (Scotland) Act 2021 established statutory targets for heat supplied by heat networks, requiring that they supply 2.6 Terawatt hours (TWh) of output by 2027, 6 TWh by 2030 and 7 TWh by 2035. In 2022, the Scottish Government estimated that heat networks supplied 1.35TWh of output[4]. To meet Scotland’s ambitious statutory targets, a significant acceleration in deployment is necessary.
Source: Scottish House Condition Survey 2022
The public sector plays an active role in the sector’s development, both at the national and local level. Local Heat and Energy Efficiency Strategies (LHEES) are local authority-led plans to decarbonise heat and improve energy efficiency, including rolling out heat networks in suitable locations. Momentum is building, with Scottish local authorities publishing their LHEES strategies, which include establishing the role of heat networks as a key decarbonisation measure.
The capital investment required to transform Scotland’s buildings (between now and 2045) is expected to be in the region of £33bn[5]. Given the size of this investment and the limited nature of public sector budgets, significant levels of finance will need to come from the private sector.
Current financing structures and models in Scotland’s heat networks
Scotland’s heat network sector
Heat networks distribute heat from a central source, avoiding the need for individual heating systems (such as gas boilers). There are over 1,090 known heat networks (the majority being communal heat networks) supplying heating and cooling to domestic and non-domestic properties[6]; however, most of the larger networks with significant heat loads are in Scotland’s larger towns and cities. Although recent projects have introduced clean heat sources, the sector still relies on mains gas as its primary heat source[7].
Figure 3: Heat networks in Scotland
The number of heat networks, both district and communal, is increasing across Scotland. Figure 3 illustrates the distribution of heat networks in Scotland, but the sector is still immature, especially compared to counterparts in Europe, where heat networks have played a central role in heat infrastructure since the 1940s.
Sector growth has been slow, and in recent years, the focus has been on a series of “demonstrator” projects, across a range of sizes and driven by early adopters in both the private and public sectors.
There is an emerging focus on the regulation of heat networks within Scotland and the rest of the UK. For the first time in the UK the sector is set to become regulated, like many other utility sectors. Given the decarbonisation requirement and recognising the growing importance and potential of heat networks, the Heat Networks (Scotland) Act 2021 (HNSA) created a regulatory framework for the sector in Scotland.
The regulation of consumer protection (including for heat networks) is reserved to the UK Government. In 2024, the UK Government and Ofgem jointly consulted on regulations to establish an authorisation system to protect heat network consumers under the Energy Act 2023. Ofgem will be the future regulator of that consumer protection regime across England, Scotland and Wales. Ofgem’s will also be responsible for heat network licences and authorisations in Scotland, as set out in the HNSA.
The HNSA includes a series of measures to support the sector and promote growth. These are summarised in table 1 below, alongside the relevant UK position. The UK Government has proposed a regulatory regime but has yet to introduce secondary legislation. For those measures not in force in Scotland, these will also be introduced by the secondary legislation.
Zones (in force) – Local authorities are required to identify, consult and designate zones suitable for heat networks. The Scottish Government can also designate some zones.
Building assessment reports (in force) – Owners of non-domestic public sector buildings must assess whether their buildings are suitable to connect to a heat network.
Permits (not yet in force) – Heat network operators may need a permit to build and operate a network in a designated zone, providing operators with exclusive access to the zone.
Consents (not yet in force) – Operators will require a consent for each network, ensuring developments take place in areas that will have the most benefit, with the opportunity for community engagement.
Licensing (not yet in force) – All heat network companies (including existing operators) will need a licence to operate in Scotland. A licence will give heat network developers certain rights and powers – such as compulsory purchase, road works and surveying rights – to help reduce construction time and costs.
Zoning, permitting and licensing
Heat network zones – Zoning proposals will differ in England and Wales. The UK Government (via its Heat Networking Zoning Authority) will designate areas as heat network zones, where heat networks providing decarbonised heat offer the lowest cost solution for consumers. In these zones, certain buildings may be required to connect to the networks through mandatory connection measures.
Authorisation – As a regulated activity, all heat networks will be required to be authorised by Ofgem to be able to supply heat to their network. This will be across Scotland, England and Wales, and may duplicate some of the Scottish licensing and consenting requirements.
Licensing – Operators will be granted a licence by Ofgem that give them rights and powers, including specific permits, for example for street works, and allow use of land when building and maintaining heat networks as electricity.
Consumer protection
The regulation of consumer protection (including pricing, transparency and quality of services) is reserved to the UK Government. Consumer protection ensures end users have the opportunity to switch heat network suppliers and have the right to challenge poor quality service. This is critical in order to attract future customers and allow operators to develop new projects and grow existing networks.
Ofgem will also establish “step-in” rights, to protect customers in the event that the operator does not meet these minimum standards or needs to be replaced.
Technical standards
GB-wide technical standards will be regulated through a Heat Network Technical Assurance Scheme (HNTAS), designed to ensure minimum levels of network performance and efficiency. Ofgem, as the regulator, will award a license to a technical standards Code Manager.
The HNSA and the new UK Energy Act both aim to introduce legislation that has the potential to align the regulatory landscape across the UK. However, our stakeholder engagement process found that significant regulatory uncertainty currently exists, including the diverging timetable for introducing legislation and the lack of clarity regarding the differences in proposals between Scotland, England and Wales. Without further developments on specific regulatory areas, such as permitting/zoning, this uncertainty will remain. We also acknowledge that there is a complex regulatory landscape, with input required from both the Scottish and UK Governments to clarify the balance between devolved and reserved powers. These observations are further developed in section 4.4.
The HNSA has created an opportunity for Scotland to benefit from a robust regulatory framework that builds trust for consumers and creates certainty for operators. In order to stimulate sector growth, the market requires further clarity on the ongoing process to regulate the sector and more detailed information regarding the introduction of secondary legislation. This should provide clarity regarding investment opportunities, reduce the complexity of the dual regulatory frameworks and make Scotland a more attractive investment proposition.
The sector is also impacted by other Scottish regulation, including the New Build Heat Standard, which requires new homes and buildings to install clean heating systems, rather than relying on mains gas. Additionally, the National Planning Framework 4 includes policies which states that development proposals (within or adjacent to a heat network zone) will only be supported if they connect to an existing heat network.
Existing financing models in the sector
In Scotland and across the UK, the sector has typically been funded by early-stage financing from developers and significant levels of subsidy from the public sector. The Scottish Government has supported clean heat networks through:
Grant support (also in the form of repayable assistance), including:
Scotland’s Heat Network Fund (SHNF) – The SHNF offers capital grant funding to support the roll out of new clean heat networks and communal heating systems, as well as the expansion and decarbonisation of existing heat networks across Scotland.
Low Carbon Infrastructure Transition Programme (LCITP) – From 2015 until it was replaced by the SHNF in 2022, LCITP provided grant funding support to several heat networks, including Queens Quay and Torry heat network.
Both programmes also provided project development and commercialisation support.
Loans via the District Heating Loan Fund (DHLF) – Managed by the Energy Savings Trust, the fund provided capital loan funding to support low emission small scale district heating in Scotland until it closed in April 2024.
Non-domestic rates reliefs – since April 2024 heat networks (where 80% of the thermal energy in any given year is generated from renewable sources) have been eligible for a 90% rates relief.[9] There is also a 50% rates relief if a premises is wholly or mainly being used for a district heating network.[10]
Many demonstrator projects also benefitted from historical UK Government revenue support through the Renewable Heat Incentive (RHI), now closed to new applicants.
These public subsidies have encouraged private investment in the sector and supported the roll out of clean heat networks across Scotland. Many clean heat demonstrator projects have been self-funded by operators (or funded through bespoke delivery vehicles). However, grant funding is required to bridge funding gaps and enable projects to achieve the internal rate of return – often referred to as a hurdle rate – required by operators. This is more important for clean heat networks than for fossil fuel-based systems, where the requirement for public subsidy is less pressing given the lower capital costs.
The hurdle rate is different for each operator and project. It is impacted by an operator’s cost of capital and project specific risks, but our analysis indicates that, at the time of this report, it tends to range between 8% and 12% (although this range will be impacted by several external factors and will vary on a project-by-project basis). This is explored further in section 0.
Grant support is among several financial mechanisms (or “financial levers”) which the Scottish Government has historically used. Such support could continue to de-risk heat network projects and help incentivise private sector investment. Figure 4 highlights some of the key mechanisms used to date and others which are considered further in this report. A summary of each mechanism can be found in Appendix B.
Figure 4: Funding levers the Scottish Government could deploy to attract private investment
Source: SFT and EY analysis
In order to understand how a step change in private investment might be instigated, it is important to highlight the key factors which drive investor confidence, namely:
Certainty of demand
Revenue stability
A stable regulatory environment
A clear understanding of project risks with shared ownership and mitigation strategies
These factors and wider deployment barriers are explored in the following section.
Heat network deployment barriers
Overview
The analysis contained in this section includes feedback from our stakeholder interview exercise, as well as our own professional observations. While many of these barriers are well understood in the market, key stakeholders confirmed that they continue to present significant live obstacles for private sector operators and investors, limiting their investment appetite and restricting the roll out of heat networks at scale in Scotland. Following stakeholder feedback, we have grouped these barriers (shown in figure 5) into four categories:
Financial
Regulatory and policy
Technical
Social and market barriers
Figure 5: Heat network deployment barriers
Source: EY analysis and stakeholder feedback
Within these categories, we present the barriers in order of importance (based on the strength of stakeholder feedback). It is important to note that whilst our report is primarily focussed on financial barriers and the private sector, many of these non-financial barriers add further uncertainty and therefore need to be taken into consideration. All these barriers – financial and non-financial – must be addressed in order to instigate a step change in private investment.
Financial barriers
Heat networks involve significant levels of financial risk and uncertainty, making it extremely challenging to forecast a project’s cashflows, thereby deterring private investment. These financial risks are highlighted below:
Demand uncertainty
Demand uncertainty is the biggest factor inhibiting private sector investment. For a heat network to be financially and commercially viable, it should generate a minimum level of committed revenue in order to meet the operating costs of the network and contribute to the repayment of the initial capital investment. This can be challenging if it is unclear when and how many buildings will connect to the network, their heat offtake requirements and the resulting revenue that will be generated.
For many Scottish “demonstrator” projects, demand and revenue risk have been reduced by securing anchor loads via public sector buildings, which require large heat offtake requirements and therefore to provide some revenue certainty. Developers and investors prioritise the de-risking of revenue flows as it provides greater certainty in a project’s ability to service the repayment of any debt or shareholder loans and/or equity return. As a result, securing longer term supply agreements with customers is a critical step in securing additional investment.
Operators stated that investment decisions are not speculative – the extent of committed revenue and certainty of connections are critical considerations to a potential developer and/or investor. To date, projects have typically been funded using balance sheet finance of the project sponsors (corporate finance) in the form of shareholder loans and equity, rather than more conventional third-party debt finance in the form of limited or non-recourse debt finance. When a heat network project reaches critical mass with mature connections and revenues, this provides an opportunity to refinance and secure more competitive finance terms due to reduced lending risk.
Long development and construction times
Many heat network projects have significant development and construction timescales, which present barriers to funders. In some cases, projects can take two or more years to develop and several more years to construct. This results in significant development and commercialisation costs, requiring high levels of upfront finance.
Historically, as a means of mitigating these development costs, the public sector offered support through the Heat Network Support Unit (HNSU) and specific grant funding programmes. However, stakeholders identified a misalignment between the grant funding drawdown profile (the existing grant funding programmes have shorter funding windows, typically four years) and the long construction cost profile (upwards of 5-7 years). This means that operators have had to condense the delivery programmes to meet the grant drawdown deadline or seek additional sources of financing.
High capital costs
Heat networks require significant levels of capital investment. Several recent Scottish heat network projects have had capital cost estimates of between £10m and £50m[11]. This barrier is exacerbated in times of high inflation and cost uncertainty. The high levels of capital investment are commensurate with other utilities such as water, gas and electricity. All require significant investment in underlying infrastructure prior to connection with residential, commercial and public sector buildings.
Large capital projects are often regarded as higher risk and therefore more challenging to finance. Due to cash flow uncertainties, this sector has historically relied on significant levels of grant funding. Public support (including Scottish Government programmes such as LCITP and SHNF) has been essential for improving private sector returns and sharing the risk of the high capital costs. When this support is unavailable, operators mitigate this risk in other ways, for example, by seeking increased connection fees for end users.
Diverse delivery models and procurement approaches
The lack of standardisation in procurement approaches and delivery models adds complexity, time and cost to a project’s development timeline. Projects develop bespoke approaches that are not necessarily repeatable for new projects. This inhibits the market’s ability to understand the investment landscape and reduces confidence. Investors are far more likely to pursue projects where there are standard procurement approaches and tried and tested delivery models, where the risks are understood.
The availability and access to financing
Debt lenders have been reluctant to invest in the sector due to the risks noted above. Current stakeholder feedback confirms that this remains the case. Typically, large infrastructure projects would look to include both equity and debt to optimise financing costs and spread the risk on investment. However, heat network projects typically struggle to demonstrate that they will have sufficient free cashflows to service the cost of debt. As such, debt lenders will seek to invest their funds in alternative sectors where they have more confidence in the cashflows. If these other sources of financing cannot be brought into the sector, the ability to roll out new projects at scale will be limited.
Regulatory and fiscal challenges
Although the financial barriers are significant, they must be considered alongside regulatory and fiscal challenges. These have created uncertainty in the market and have negatively impacted the private sector’s investment appetite. Stakeholder feedback highlighted the importance of these areas in unlocking Scotland’s heat network ambitions. However, as we discuss below, the Scottish Government does not have the ability to resolve all these issues.
Regulatory uncertainty
The Heat Networks (Scotland) Act in 2021 introduced powers to regulate the Scottish heat networks market for the first time. The Energy Act 2023 was passed by the UK Parliament in October 2023. Differences in implementation, content and timing of regulation between Scotland and the rest of the UK are negatively impacting investor sentiment and creating uncertainty. Developers and funders are also looking for clarity on the future GB-wide consumer protections and technical and service specifications for operators.
Without further clarity on the future secondary legislation in Scotland, operators stated they are more likely to focus resources outside Scotland – for example, in other UK areas – where there is more demand for larger urban heat network opportunities.
This uncertainty also extends to other relevant policy areas, such as the phasing out of domestic gas boilers, which presents barriers to operators. The Scottish Government has introduced the New Build Heat Standard, which states that by 2045, all homes in Scotland will need to have converted to a clean heating system. Across the rest of the UK, there is political uncertainty about this phase out. No equivalent legislation is currently in place, meaning heat networks operators are unclear when customers will be required to adopt low emission heating solutions.
Structural pricing considerations
Reducing the gap between the price of electricity and the price of gas may help support the rollout of low carbon heat networks. Under the current domestic[12] electricity pricing model, electrified low carbon heating solutions are unlikely to offer cost savings to consumers when compared against traditional gas boilers.
Historically, electricity has been more expensive than gas, partly due to the greater proportion of environmental and social obligation costs (green levies) placed on electricity (23%) compared to gas (2%), as shown by the figure 6 below.
Figure 6: Breakdown of domestic electricity and gas bill
The UK Government is currently consulting on the “Review of Electricity market arrangements” (REMA), which includes proposals for reducing electricity costs for consumers. Removing these levies from existing energy tariff structures would reduce the running costs of electrified heating solutions and encourage the uptake of low carbon heating.[13] However, there are many complexities involved in this change and the impact of rebalancing these costs must be understood further before it can be proven to be an effective mechanism for reducing electricity costs.
In addition to the impact of the levies, electricity prices (and gas prices) also include significant distribution and transmission charges (network costs). Electricity bills could be reduced by permitting heat networks connected to the electricity grid to pay lower network charges (recognising their ability to use electricity at times of low demand).
Regardless of these potential mechanisms, relatively low gas prices will continue to disincentivise the rollout of low emission heat networks, as they make any change to an alternative heat source appear more expensive. This is proving to be a significant barrier in the private sector.
Technical challenges
Operators and funders pointed to several heat network-related technical barriers which create further uncertainty and investor reluctance. The high-level technical challenges noted below are not an exhaustive list but rather provide important context for the rest of this report.
The need for density
In high density urban areas where there are large levels of heat demand, heat networks often provide the lowest cost low carbon heating option. The alternative is for properties to use individual air source heat pumps (ASHPs), which would place greater electricity demands on the grid and may result in higher customer costs and increased operational costs. Scotland has several areas where there is significant scale and suitable density levels for heat networks. However, operators noted that there are a greater number of large urban areas with multiple opportunities in England. This naturally provides significant competition for investment that might otherwise be made in the Scottish locations, especially for operators (operating both in England and Scotland) exploring opportunities across the UK. Additionally, smaller scale communal heating solutions may be appropriate for lower density areas; however, we do not explore this in detail as it is outside the scope of the report.
Technical complexity
Many of the existing heat network projects utilise different heat sources and technological solutions, including things as basic as pipework sizing. As projects increase in size, this lack of standardisation can present challenges for heat networks integrating and/or scaling up.
Decarbonisation challenges
Historically, many heat networks across the UK (and internationally) have been powered by carbon-based heat sources. However, operators consistently noted that customers now expect heat networks to use low emission heat sources. Low carbon technology is typically more expensive, and technologically complex than legacy carbon-based fuel sources and this therefore represents an additional factor impacting the commerciality of new projects.
Social and market challenges
The sector also experiences wider challenges in the development of the market for heat networks.
Consumer experience and scepticism
Operators and funders highlighted recurring customer concerns, including security of supply, pricing and consumer protection, that provide challenges to operators attracting potential domestic consumers to their heat networks.[14] Additionally, countries with a long history of operating heat networks, have an established culture of valuing and trusting the technology meaning consumers better understand the benefits. These factors have supported the development of international heat networks and have resulted in reduced levels of negative consumer experience and scepticism.
Lack of standardised commercial models
The lack of a standard delivery and operating model for heat networks results in developers and public sector partners (e.g. local authorities) having to invest significant time and resources developing proposals for their projects. This is explained further in section 4.5. This additional time and complexity increase development timescales.
Supply chain – the sector has a limited number of heat network developers
There are a limited number of private sector operators in Scotland, which in turn have a limited supply chain. The current developer landscape includes a number of balance sheet backed developers (SSE, EON, Vattenfall) and some infrastructure fund backed developers (Hemiko, 1Energy and Bring Energy).
This places a high dependency on a very small number of corporates relative to the scale of the heat network opportunities in the wider UK. Additionally, local authorities have a significant role to play in developing networks but they have limited in-house capacity and resource and therefore, rely on a small number of financial, technical and legal advisors.
Heat network delivery models – summary/overview
To address some of the barriers restricting the roll out of heat networks at scale, the Scottish Government is exploring a range of levers, including financial, technical and regulatory, and considering the optimum delivery models to support the sector. Although this report does not undertake a detailed assessment of these models, our overview provides context for the financial levers explored further in this report.
In 2022, the Scottish Government commissioned the Scottish Futures Trust (SFT) to undertake analysis on potential delivery models that could accelerate the pace and scale of heat network deployment in Scotland. The subsequent Heat Networks Delivery Models (HNDM) report, published in February 2024, identified four models that warranted further detailed development and consideration, namely:
Regional Heat Partnership / Regional Energy Services Company (RESCo) model
Local authority-led joint venture
Local authority-led delivery, with Scottish Government stake
Centrally-led delivery
Following the HNDM report’s publication, Scottish Government has collaborated with SFT to further develop the Regional Heat Partnership and Centrally-led models.
Overview of international experience
The Scottish Government can draw insight from comparable European and other international markets. It can be particularly helpful to consider how these sectors are developed, financed and regulated. To develop this insight, we have reviewed approaches in countries with high levels of market maturity, as well as those with characteristics similar to Scotland’s.
Our analysis is primarily based on five international examples, referred to in this section as the “comparator countries”. As shown in Figure 7, these are the Netherlands, Germany, Finland, Sweden and Estonia. During our shortlisting process, we considered jurisdictions such as the USA, Canada, Belgium, Ireland, Latvia and Poland, but found a lack of relevant data from which meaningful conclusions could be drawn. Our analysis will refer to these other countries where relevant.
Source: EY Analysis
Figure 7: Comparator Summary
Denmark has a mature and successful heat network sector and is often considered a valuable source of insight for Scotland. It is deliberately excluded from our analysis as the Scottish Government has a detailed understanding of the factors that have contributed to its success. These factors include cultural acceptance of heat networks and high consumer trust. Additionally, it has established regulatory levers such as mandatory connections.
This section provides an overview of:
The history of comparator countries’ heat networks with a brief market overview
The availability and impact of public financing levers
The regulatory structures
The market ownership profile and level of private finance penetration
The financial composition of heat network assets
0B provides supplementary information for each international example.
History of international heat networks and market overview
Figure 8 summarises the maturity of each country’s heat network sector, based on the definitions developed by Department for Energy Security and Net Zero (DESNZ)[15]:
Emerging – the market is still a nascent sector with lots of growth opportunity
Expanding – the sector is established but is continually growing
Consolidating – the market is mature and technology is being refined, updated or refreshed
Refurbishing – the market is very mature and heat network technology is on the nth generation, but the networks are aged and require significant replacement and/or refurbishment
The comparator countries have a range of heat network maturity levels, with Finland and Sweden widely acknowledged as having mature and well-established sectors, while the Netherlands has an emerging heat network sector with many similar characteristics as Scotland.
DESNZ classified the UK and therefore by implication, both Scotland and the rest of the UK as emerging markets. 0B provides a brief historical overview of each international comparator.
Figure 8: Maturity of international heat networks
Emerging
Expanding
Consolidating
Refurbishing
Scotland
Germany
Sweden
Estonia
rUK
Finland
Netherlands
Source: DESNZ (BEIS) “International review of heat network frameworks” (2020)
Key findings
The Nordic countries (Sweden and Finland) and Estonia are in the “consolidating” and “refurbishing” categories. In each country, the sectors are mature and the technology is tried, tested and trusted.
Overall, the Nordics have been leaders in district heat networks since the 1940s. The 1970s oil crisis stimulated a transition to alternative fuel sources and acted as a catalyst for rapid expansion in the sector. This early adoption is a significant factor driving the higher degrees of maturity in their district heating networks. Familiarity of the technology has supported the cultural acceptance. By 2015, 46% of Sweden’s heat networks were supplied by biomass and only 7% utilised oil or gas[16].
Heat networks are common in Germany, with the first pilot system having gone live in the 1950s. The sector has grown over the last decade with significant numbers of large-scale heat networks. Therefore, the market has surpassed the initial emerging phase of high growth but strives to continually expand toward becoming a mature market.
Germany is in the expanding category. Compared to Scotland, Germany has been using heat networks for much longer and the initial rapid growth phase has taken place. There is now a focus on continuing to add connections to existing networks.
Although the Netherlands implemented its first heat networks in a comparable time frame to Germany (Utrecht in 1923, followed by Rotterdam in 1949) this early adoption was not built upon, and no new networks were constructed in the 1950s and 1960s. However, there has been a moderate uptake of district heating schemes since the late 1980s.[17] The market is therefore relatively small but undergoing rapid change driven by a political commitment to decarbonise heat and reduce emissions from buildings. Therefore, there are strong similarities between Scotland and the Netherlands both in heat network market size and nascency and the Government’s ambition to decarbonise heat in buildings using district heating.
The scale of heat networks in most of the comparator countries differs significantly from Scotland. Figure 9 illustrates the cumulative length of heat networks in kilometres in each country[17]. While country size plays a role, Germany has nearly 35,000km of heat network infrastructure, whilst Estonia, although highly developed, is limited by its comparatively smaller size. Notwithstanding that, Scotland’s relative position to the comparator countries is clear.
Figure 9: Cumulative kilometres of heat networks
Source: EY analysis
Across Europe, the maturity of the sector varies, with countries such as Sweden, Finland and Estonia building on the successful implementation of decades worth of investment in the sector. The sector is still emerging in Scotland, like the Netherlands, where it does not demonstrate many of the characteristics of the more mature countries, such as cultural acceptance of heat networks and scale in the market. This provides important context for the following section reflecting on the appropriateness and availability of financial levers.
Impact of public financing levers
Public financing levers significantly influence the implementation and expansion of heat networks internationally. Financial levers serve as catalysts for innovation, growth and the adoption of low carbon technologies.
Table 2 provides an overview of the financial mechanisms that aid the development and expansion of heat networks. The levers include capital grants, tax exemptions and incentives, revenue grants, individual connection grants and decarbonisation incentives (for example, grant funding for decarbonised technology). Each country is discussed further in Appendix B.
Table 2: Summary of public financial levers used by international comparators
Country
Financial Levers
Rest of the UK
Capital grant funding
Feasibility study support
Revenue Grants (existing heat networks)
The Netherlands
Capital grant funding
Individual connection grants
Germany
Capital grant funding and operating cost support
Feasibility study support
Low carbon installation subsidies
Finland
Tax incentives
Sweden
Individual connection grants
Tax exemptions
Estonia
Investment support
Energy cost compensation
Individual connection grants
Source: EY Analysis
In addition to the financial levers shown above, most comparator countries also benefit from a state-owned infrastructure bank investing in their district heating sector. State-owned infrastructure banks operate on similar terms to commercial lenders but may have the ability to adopt an increased risk appetite. This enables them to support heat networks in circumstances where commercial banks cannot. Additionally, EU member states benefit from access to EU funding where there are no bespoke heat network funding pots.
Recent investments reflect a growing appetite to engage across different markets with varying levels of maturity. For example, banks like the Nordic Investment Bank (NIB) provide investment support to help refurbish existing heat network assets across the Nordics and Baltics, while Germany’s infrastructure bank (KfW) is providing grants to help continue the transition to a more mature market in Germany.
Stakeholder engagement confirmed that both Scottish National Investment Bank (SNIB) and National Wealth Fund (NWF) have ample capital to deploy. The issue was reported to be a lack of investible projects.
0 provides a summary of state-owned infrastructure banks and relevant examples across the chosen countries.
Key findings
As illustrated by Error! Reference source not found., most of the comparator countries have adopted a range of financial levers. Many have applied a similar approach to Scotland, including the continued use of capital grant funding, project development funding or individual grants for expanding and upgrading heat networks.
Grant funding is a common financing lever, especially for the countries who are growing their heat network sectors. For example, in 2022 Germany introduced a €3bn fund to support the development and construction costs of new decarbonised heat networks (where 75% of the heat is sourced from decarbonised heat sources)[18]. This provides grant funding up to 40% of the eligible capital costs. The fund also provides feasibility support to projects. Additionally, the Netherlands is using a €400m fund to support the capital costs of new heat networks. The analysis shows that capital grant funding continues to be popular as an effective funding lever available before the sector reaches maturity. Regarding the UK market, there is continued funding from the Green Heat Network Fund (GHNF), with £288m initially made available and an additional £485m allocated in December 2023. The GHNF is expected to run until 2028, however operators expect that this will continue past 2028.
Another common lever in more mature countries is using individual grants or connection grants to incentivise connection to heat networks. For example, KfW helps deliver anchor loads to networks by offering increased grant support to local authorities for the connection of public sector buildings. Examples of individual incentives include the Estonian Business and Innovation Agency grant, which offers up to €10,000 for small residential buildings to connect to existing networks.
Estonia also offers a phased compensation scheme for the use of heat networks versus existing carbon-based alternatives. The Estonian Government provided compensation of 80% of the additional costs faced by heat network users because of increased energy prices.
Finland is developing a tax credit scheme which projects will be able to benefit from after they become operationally profitable. This has the aim of making project cashflows more appealing to investors, helping increase early returns by reducing the tax expense.
It is clear that many countries are promoting the use of grant funding to varying degrees. Significant levels of support are provided in jurisdictions with less mature sectors, while more mature countries use and develop other forms of support. The use of grant funding in Scotland and the rest of the UK is well established. Similarly, the Netherlands with its less mature sector also provides significant grant funding programmes. In Germany (an expanding country), grant funding continues to be a well utilised financial lever but intervention rates have decreased from predecessor programmes. Additionally, there is a requirement for a much larger proportion of the heat to be from renewable sources. The example of other emerging countries in Europe indicates that the market in Scotland will continue to rely on grant funding, even if the intervention levels decrease (like Germany) or grant funding is targeted at specific areas of sectors.
Regulatory structures
Our international comparator countries employ a range of regulatory structures (regarding operation, pricing and decarbonisation requirements) and national oversight. These range from self-governing municipality frameworks with a limited role for national regulators to nationwide regulatory frameworks governing the entire heat networks market. Whilst regulatory landscapes differ, the varying regimes offer interesting lessons for heat networks in Scotland.
Table 3 provides an overview of the international regulatory landscape and each country’s approach to mandatory connections. Detailed findings for these countries are shown in 0.
Table 3: Overview of international regulatory landscape
Country
Regulated/Unregulated
Mandatory Connections
UK
Regulation in development
No*
The Netherlands
Regulated
Yes
Germany
Unregulated
No
Finland
Unregulated
No
Sweden
Regulated
No
Estonia
Regulated
Yes
*DESNZ is currently shaping its policy approach to mandatory connections. It is expected mandatory connections will be enforced on certain buildings in defined zones to be connected to heat networks by a given deadline[19]. However, details are yet to be fully confirmed.
Key Findings
Across our comparator countries, many of the developed and mature markets (e.g. Finland and Germany) are unregulated. The heat networks have a self-governing framework and abide by technical codes and industry standards but no third-party regulatory oversight. Municipalities have their own governance procedures; they are self-governing with greater pricing transparency, consistent contractual delivery and contractual routes. The evidence suggests that these countries focus on consumer pricing and that introducing standardisation supports investment and stimulates the sector’s development.
Mandatory connection to heat networks is used in some of the comparator countries, establishing base heat loads and reducing demand uncertainty. Mandatory connections are primarily applied to new developments, but barriers exist to using them in the retrofit market. For example, in relation to timing of connection for retrofits: where buildings may have recently installed new carbon-based technologies, connection to a heat network may not be considered for many years until their heat source needs replaced. Finland decided to repeal mandatory requirement having concluded they could be deemed anti-competitive given other decarbonised heating options are also used successfully.
Clear government policies on decarbonisation and the phasing out of carbon-based fuels are evident among the comparator countries. Germany’s Building and Energy Act 2020 requires municipalities to have heating (including heat networks) powered by 65% renewable energy from January 2024 onward and to phase out existing oil and gas heating systems. The German Government is incentivising the transition via KfW and offering bonus support for an accelerated switch to heat networks or other renewable sources. Similarly, the Netherlands has banned new developments from connecting to the gas grid from 2028 via amendments to Gas Act 2018.
Market ownership profile and private finance penetration
Our comparator countries also tend to have different ownership structures, with ownership split between the public and private sector in different ways.
Figure 10 below shows the current profile of heat network ownership across each country, with Finland’s ownership largely public, the Netherlands and Estonia mostly private, and rUK, Germany and Sweden demonstrating mixed ownership structures.
Figure 10: Asset ownership profile
Source: EY Analysis
Key findings
Ownership profiles differ across the selected comparator countries with several observable themes. For some comparator countries, there is a high proportion of private sector finance. For example, in the Netherlands more than 90% of heat networks are managed by the private sector. This has helped to scale up investment. Established heat networks offer attractive, stable investments to institutional investors looking for long term consistent returns – as evidenced by Dutch pension institution PGGM investing in Swedish networks.
In other countries, including Finland, public sector ownership in the sector is at a high level. However, they are still seeking investment from the private sector to support established municipally owned heat networks, where budget restrictions limit upgrades and refurbishments. This ownership profile provides an interesting reference point for Scotland, as it allows the sector to benefit from additional investment.
The analysis shows significant levels of public ownership in many of the mature and maturing countries. In Germany, for example, Berlin’s municipality acquired the Berlin heat network for €1.4bn from Vattenfall. This demonstrated a commitment to re-municipalising infrastructure and reversing privatisations to gain more influence over the city’s district heating and gas supply. The municipality believes the Berlin network to be profitable and that it will play a significant role in moving toward climate neutrality.
In the Netherlands, the high levels of private sector ownership have resulted in the Dutch government proposing legislation in 2022 to part-nationalise the sector. Municipalities will have the opportunity to own up to 51% of networks, thereby bringing market ownership into the public sector. The proposal is designed to mitigate concerns regarding the affordability of heat for end users, the reliability of the services and the need to safeguard public sector climate change ambitions and public values. However, this initiative has led to significant concerns from several operators who feel that it will lead to a significant downturn in private sector investment[20]. During our stakeholder interviews, one European operator warned that this move will make the Netherlands “uninvestable”.
Overall, more mature markets tend to have a greater level of private finance penetration due to reduced risks and more stable operations. However, public sector ownership still allows local government to maintain more control regarding price and climate targets. Operators in the Netherlands indicated that the introduction of legislation to restrict private sector investment (and therefore control over the heat networks) can have a significant negative impact on the market and reduce investment security in the private sector. Under the new Dutch model, the incentives for private companies to invest in public projects are small and short term, as the private sector will lose control of the decision making while retaining significant levels of financial risk. Scotland should consider the impact that future regulatory changes may have on private sector investment appetite while balancing this with its broader objectives of reducing fuel poverty and supporting clean heat networks.
Financial composition of heat networks
The upfront capital expenditure expected revenue receipts and cash flow for other asset classes can be estimated with enough certainty to attract debt financing. In contrast, heat networks under development tend to have multiple expansion options and uncertainty around which end users will connect and when. This means costs or revenue inflows are not certain enough to allow a traditional project finance approach.
Rabobank, a Dutch multinational bank, highlighted that district heating companies self-financing their heating grids is a common approach in developing markets like the Netherlands. Their balance sheets typically include a mixture of debt and equity. Additionally, they also identify that traditional project financing is much harder to implement as it requires a significant portion of a project’s cashflows to be secured (by having contracted demand), which is an inherent problem for heat networks.
Rabobank also stated that whilst large credit worthy companies may be able to raise finance to fund heat networks and reduce their equity component of a project, smaller less bankable heat network developments may require government guarantees over any debt to help improve their attractiveness to private sector.[21]
The stakeholder engagement sessions also reflected the view that corporate balance sheet financing will remain the main source of financing in developing markets in the near-term.
Mature markets like Sweden, Finland and Estonia, benefit from more traditional forms of debt financing because they are well established and understood by lenders. For example, the NIB provided a €12m loan repayable over 10 years to help finance the heat network in Pirkanmaa, Finland.[22] These mature markets can also access EU financing to reduce dependence on carbon-based fuels. For example, the Finnish energy company Helen Ltd received a €150m loan in April 2024 via REPowerEU[23] for building a new heat pump plant and converting fuel use from coal to biomass pellets.
Consequently, developing heat networks are often funded purely from equity financing until they reach operational profitability. Only once stable profits are achieved can network operators consider refinancing and attracting debt lenders to expand their networks. Private Equity firms often take an equity stake in a heat network, but the composition of their fund could be a mixture of institutional debt and equity.
Conclusions
Our comparator countries present a mix of maturity levels, various ownership profiles, regulatory structures and financing levers. Those with more developed sectors have a mixed degree of public ownership and the ability to access private finance. They are mainly regulated by standard frameworks within the municipalities with regulators adopting a back seat approach. However, these countries with less regulation have had the technology embedded in their culture for much longer. Therefore, the regulators can focus on price transparency and fairness for the end user rather than a framework for developing the market.
Scotland has the opportunity to overcome the barriers faced by the sector by adopting solutions that have been successful elsewhere, including regulation, clear direction on decarbonisation and financing levers:
Regulation: Standardised and practical regulatory frameworks help to ensure consistency across the market. They make it simpler for operators to undertake projects by reducing project complexity. Additionally, standardised frameworks and agreements provide greater certainty and transparency regarding control and responsibility of heat network assets. This provides operators with confidence over the assets.
Decarbonisation: All of the countries on our shortlist are actively moving away from fossil fuel heat networks and incentivising clean heat networks through policy choices. For example, sector development may be encouraged through connection subsidy or a phased ban on carbon-based alternatives. Additionally, mandatory connections provide a baseline for investment cases, making projects investible as demand assurance can be satisfied. Equally, contracted revenues obtained as part of the demand assurance may provide enough certainty to encourage private investment into heat networks.
Financing levers: Comparator countries have provided financial incentives for connecting to existing heat networks offering further incentives for accelerated uptake. Capital grant support is the most common lever used by international comparators across all market maturities as it can make the investment decision for expansion of heat networks more viable. Similarly, when networks are seeking connections, individuals need to be incentivised to connect. For example, by bridging the gap on cost to their current heat sources, particularly when there are no regulations requiring individuals to connect. Additionally, state-owned infrastructure banks can be used to leverage these solutions as the market develops. For example, if connection fees are mandatory, a connection fee facility could be rolled up into the overall financing solution as there will be enough clarity on contracted revenue cashflows to reduce demand assurance risk.
The key considerations can be summarised as follows:
simple and standardised frameworks to ensure consistency within the regulations
clear direction on decarbonisation
the use of mandatory connections (such as on new developments) to provide certainty
public financing levers to develop projects and also to incentivise individuals to connect.
Review of financing mechanisms in selected utility sectors
Introduction
The UK utilities sector is a multifaceted industry that provides essential services for the protection and maintenance of modern daily life and commerce. These services include the provision of electricity, gas, water, telecommunications and transport. Each segment and subsector of the utility sector is integral to the economy’s stability, growth and societal well-being. Regulation of such sectors ensures that individuals, and businesses have access to the critical resources they require at a reasonable cost.
Each UK utility sector is governed by a specific regulator responsible for consumer protection (including pricing), safety, reliability and sustainability, ensuring a well-developed network of public services provided under regulatory regimes, as outlined in Appendix C. The primary regulators include:
The Office of Gas and Electricity Markets (Ofgem)
The Water Services Regulation Authority (Ofwat) in England and Wales
The Office of Communications (Ofcom)
The Office of Rail and Road (ORR)
The Civil Aviation Authority (CAA)
The global shift towards net zero, with an emphasis on clean heating systems, requires the development of regulatory regimes to incorporate new energy solutions.
Regulatory oversight will remain crucial for balancing the objectives of climate change mitigation with continued access to reliable and affordable utility services. As a result, heat networks are planned to be subject to formal regulation across England, Wales and Scotland by 2024/25 in line with primary legislation introduced as part of the Energy Act 2023 and the Heat Networks (Scotland) Act 2021.
Purpose
This section of the report examines the origins and current characteristics of other regulated utility sectors. We also explore if specific aspects of the regulation of other sectors can inform the regulatory and financial environment, which will help accelerate the development of heat networks in Scotland.
To aid in understanding how potential heat networks regimes may develop, we outline how the sectors have historically been financed and how the regulatory structures have facilitated the deployment of capital.
Methodology
We performed analysis to identify regulated utilities which offer a good comparator to heat networks. This included examining the characteristics of a long list of 39 regulated sectors covering electricity, water, telecommunications, rail and air regulation against the criteria listed in Appendix D. Based upon the preliminary analysis, we progressed 17 utilities for further examination which is discussed in Appendix K.
Further to the completion of the detailed analysis (Appendix K), we determined that offshore wind electricity generation, household water & sewerage undertakers and Carbon Capture, Utilisation and Storage (CCUS) demonstrated relevant attributes for heat networks. The key characteristics of each sector are summarised in Appendix E. This includes risk profile, type of sector the utility operates within and the investment time horizon for each utility.
These three utilities are used to understand how the utility sector is regulated and how investment supports ongoing development. They are also used to explore how heat networks might be regulated and how regulatory approaches impact levels of financing. Each sector is analysed separately below before evaluating how aspects could be applied to heat networks. A summary of regulatory timelines for these sectors is shown in Appendix F.
Offshore wind
Overview
The UK’s offshore wind sector is rapidly expanding and plays a pivotal role in the nation’s transition to renewable energy. Between the UK’s first offshore wind allocation round (AR1 2015) and AR 6 (2024), a total of 21 GW of offshore wind capacity has been supported by Contracts for Difference (CfDs). CfDs are explained in more detail below.
Regulatory Structure
Following the Energy Act 2004, Ofgem has continued to regulate the sector and is adapting its approach as offshore wind projects continue to be deployed, offering new support mechanisms. Ofgem’s regulation of offshore wind is structured around several key elements. It is designed to promote the development of the sector whilst ensuring efficiency, competition and the protection of consumers interests. Regulations cover, licensing, support mechanisms, grid connection, market oversight and consumer protection. Further details can be found at Appendix G.
Ofgem’s remit also extends to the provision of Innovation Funding to support the transition to net-zero energy systems. This includes support to accelerate technological advancements, improve efficiency and reduce costs.
Regulatory Financing Mechanisms
Offshore wind is characterised by large upfront capital expenditure, availability risk (wind variability) and exposure to a competitive and volatile electricity market. All these factors impact the sector’s ability to secure much needed investment. The investment time horizon is around 15 years commensurate with the term of a CfD. Unlike the deployment of heat networks, offshore wind is not exposed to demand risk as it operates on a wholesale basis whereby electricity is exported directly to the national grid.
CfDs provide long-term stable and predictable revenue for offshore wind developers, thus making offshore wind attractive to investors, creating optimised financing structures that can reduce the overall cost of capital. A CfD has the effect of providing a fixed price for each MWh of electricity that the project generates over a specified period (typically 15 years) referred to as the “Strike Price”. The Strike Price typically reflects the price per MWh a developer considers necessary to achieve its applicable return on investment over the period of the CfD. CfDs are awarded through a competitive auction process (Allocation Round) administered by the Department of Energy Security and Net Zero (DESNZ).
The Strike Price is different to the actual market price, known as the “Reference Price”, which is calculated based on the average market price per MWh over a given period. When the Reference Price is lower than the Strike Price, a top up payment of the difference in price is made by the Low Carbon Contracts Company (LCCC) to the offshore generator. Conversely, if the Reference Price is greater than the Strike Price, then the generator must pay the difference to LCCC.
CfDs were originally introduced in 2013 and replaced the Renewable Obligation Certificate (ROC) regime, which was the main support mechanism for renewable energy prior to CfDs. CfDs are an evolution of the support mechanism for renewable energy projects that increases competition and whereby the Strike Price better reflects the underlying levelised cost of the technology.
Household water & sewerage undertakers
Overview
The household water and sewerage sector in the UK provides essential water supply and wastewater services to residential and commercial customers. The sector operates as a natural monopoly and is therefore highly regulated across England and Wales and Scotland.
Regulatory Structure
England and Wales
In England and Wales the sector is regulated by Ofwat. The regulator aims to ensure high-quality services, fair pricing, compliance with environmental standards, and the financial viability of water companies. The regulatory structure has evolved over time to address priorities such as infrastructure investment, customer service improvement and environmental concerns.
Key changes include the introduction of competition to drive efficiency, periodic price reviews by setting price limits and service targets, increased customer engagement, and innovation funding. These changes aim to create a more outcome-based regulatory regime that encourages water companies to be customer-oriented, efficient, and forward-thinking in their operations and investments, ensuring high standards of water quality and environmental stewardship.
Scotland
Scottish Water is regulated by the Water Industry Commission for Scotland (WICS), which ensures value for money and efficiency without a profit motive. This aligns with Scottish Government policies on affordability and public ownership. WICS is governed by the Water Industry (Scotland) Act 2002, as amended by the Water Services etc. (Scotland) Act 2005 and the Water Resources (Scotland) Act 2013.
WICS’ role is to set charge caps, monitor performance, facilitate retail competition for non-household customers, and support the Hydro Nation vision. Price reviews are conducted every six years. Reviews set price limits based on Scottish Water’s business plan, customer input, and factors such as debt service and operational efficiency, with a transition away from the RAB model since 2010.
WICS also sets efficiency targets and, while independent, can be influenced by Scottish Ministers on financial matters, potentially impacting long-term infrastructure maintenance if charges are set too low. Scottish Water receives government loans or grants for large capital projects, reducing reliance on customer charges. However, this funding depends on the impact on the Scottish Government’s balance sheet, requiring careful management for long-term sustainability. Further details on this can be found at Appendix H.
Regulatory Financing Mechanisms
England and Wales
The water and sewerage sector relies on long-term investment provided by the capital markets, typically in the form of shareholder equity and bond finance. Most utilities are highly geared and therefore very sensitive to adverse changes in credit ratings (via Moody’s, S&P and Fitch). Nearly all utilities aim for an investment-grade credit rating to secure optimum lending terms with the primary objective of lowering the company’s Weighted Average Cost of Capital (WACC).
Ofwat’s regulation and associated pricing reviews provide a stable financial environment for investors. They ensure reliable demand due to the monopolistic nature of the customer base despite some revenue risk from bad debt. The application of a Regulated Asset Base (RAB) model (discussed below) along with the submission of Asset Management Plans (AMPs) that contribute to periodic price reviews, is designed to incentivise investment in infrastructure and services whereby the water companies are required to manage risks related to capital programmes, asset maintenance and operational costs similar to those in the heat network sector.
Regulated Asset Based (RAB)
The RAB model regulates water company prices while ensuring infrastructure maintenance and service quality. The RAB represents the value of a company’s capital assets based on historical costs, depreciation, and new investments. Ofwat uses the RAB value to set allowed revenue requirements, applying a WACC to determine the maximum revenue companies can charge, incentivising efficient investment and continual infrastructure improvements. This model is effective in the water sector due to the manageable number of operators, encouraging companies to invest efficiently and include new investments in future revenue streams.
Periodic Price Reviews
Ofwat’s price reviews, conducted every five years, determine the revenue water companies can earn. They take into both capital and operational expenditures into consideration to set price controls and encourage large-scale investment projects. The submission of AMPs contributes to the periodic price review process, which includes performance incentives through Outcome Delivery Incentives (ODIs), rewarding companies for meeting targets and penalising underperformance, aligning financial interests with high-quality service delivery. The periodic pricing reviews, coupled with limited demand risk provides greater revenue certainty for investment.
The latest Asset Management Plan (AMP8) for 2025-2030 focuses on climate change, emissions reduction, water quality improvement, leakage reduction, and reliable services. It also introduces innovative funding solutions such as the Direct Procurement for Customers (DPC) programme to support significant infrastructure investments.
Innovation funding
Although there are many external innovation funds available to water companies, Ofwat has established its own Ofwat Innovation Fund. The aim of this £200m fund is to encourage collaborative initiatives and partnerships within the water sector to tackle the larger challenges the sector faces such as climate change, leakage and affordability.
Scotland
Whilst Ofwat regulates the water sector in England and Wales, privatisation of the sector has resulted in high debt leverage which can give rise to value leakage to shareholders and risk of under investment of infrastructure. Thames Water, England’s largest water company, has requested that Ofwat approves an increase in water bills of up to 40% by 2030.
Scotland has sought to mitigate these specific risks through the water services being publicly owned. Services are operated by Scottish Water which remains accountable to the Scottish Government and its customers. This helps to ensure profits are reinvested in the infrastructure rather than distributed to shareholders. WICS is an Executive Non-Departmental Public Body whose principle statutory functions are to:
Determine charge caps;
Monitor Scottish Water’s performance, encouraging efficiency and sustainability;
Facilitate competition by encouraging the entry of retail water and sewerage providers for non-household customers in Scotland; and
Support the Scottish Government’s vision of ensuring that Scotland is a Hydro Nation and meet their obligations under the Water Resources Act 2013.
Water charges are set by WICS and remain relatively stable as profits are reinvested. The domestic charges are linked to council tax bands, with prices increasing as bands increase. Historically charges were calculated using a version of the RAB model. However, since the price review in 2010, WICS has moved away from the RAB based model towards looking at business requirements as the basis for setting prices.
Price Reviews
Similar to Ofwat in England and Wales, WICS performs Strategic Reviews of Charges to set price limits for the next regulatory period, usually every six years. The Strategic Reviews of Charges is initially based upon Scottish Water’s long term business plan. This encompasses short and long-term infrastructure investment requirements, debt repayments and operating costs. WICS subsequently evaluates the business plan, with a focus on Debt Service Cover Ratio (DSCR), alongside multiple other factors including inflation, investment needs and operational efficiency to determine annual price caps for customers. These may be adjusted annually within the limits set by WICS to account for inflation or other changes.
Although a proxy RAB continues to exist to act as an internal comparator to England and Wales water sector, Scottish Water’s customer-focussed business plan helps align Scottish Water with Scotland Government objectives.
Government Grants and Incentives
Scottish Water receives loans or grants from the Scottish Government to finance large capital expenditure projects. These reduce reliance upon customer charges, improving affordability for households and businesses. While government-backed loans could offer more favourable terms than private market financing, such a mechanism could impact the Scottish Government balance sheet (borrowing requirement). This impact could mean funding is not granted for infrastructure development and maintenance projects and instead a short-term increase in customer prices would have to be required. As such, any borrowing is carefully managed to ensure long term financial sustainability for both Scottish Water and Scottish Government.
Carbon Capture, Utilisation and Storage (CCUS)
Overview
CCUS is an emerging sector in the UK, crucial for achieving the net zero emissions target by 2050. The government is actively developing a regulatory framework to support its deployment. This framework, shaped by legislation such as the Energy Act 2023, aims to ensure CCUS projects are financially viable, environmentally effective and resilient. It provides regulatory oversight from bodies like Ofgem, the Oil and Gas Authority, and the Department for Energy Security and Net Zero (DESNZ).
Regulatory Structure
The UK’s CCUS sector is in its infancy and, to date, no significant facilities have been developed. As a result, it is referred to as a First of a Kind (“FOAK”) project. To facilitate the development, financing and deployment of CCUS technology, a robust regulatory landscape is required, coupled with effective funding support mechanisms. This includes the need to address the revenue uncertainty associated with demand risk from emitter connections. Further details on this can be found within Appendix I. The proposed regulatory framework aims to enable the sector’s development while contributing to net zero goals, with current proposals including a RAB-based model with revenue support to encourage initial investment and asset maintenance, anticipating evolution as technology and risks develop.
Regulatory Financing Mechanisms
Similar to the water and sewerage sector, the proposed regulatory RAB model for entities developing, owning, and operating CCUS transport and storage infrastructure (T&SCo) aims to provide long-term reliable revenues in order to secure the private sector funding necessary to construct the infrastructure and meet ongoing operational costs. The allowed revenue is determined similarly to other RAB models. DESNZ will initially administer this for CCUS before Ofgem takes over shortly after commercial operations begin. Despite the significant resources and time required to administer a RAB model, it is considered appropriate and effective for attracting private sector investment in T&SCo projects due to the anticipated limited number of such projects. Further details on how a RAB model operates can be found at Appendix H and Appendix I.
Revenue Support Agreement
Due to the uncertain uptake of CCUS technology in the early years, there is significant risk that T&SCos may not generate sufficient allowed revenue under the RAB model. To mitigate this risk, the regulatory structure includes a revenue support agreement, like CfDs in sectors such as offshore wind, until the market matures. The Low Carbon Contracts Company (LCCC) is the proposed counterparty to this agreement, responsible for covering any shortfall in actual revenue compared to the forecasted allowed revenue, thereby mitigating demand and revenue risk until the sector matures.
The CCUS regulatory framework addresses risks associated with FOAK projects by combining previous regulatory support mechanisms and encouraging investment through long-term, predictable revenue for equity investors supported by a contract with LCCC. The RAB model ensures continual maintenance of assets by increasing allowed revenue to cover maintenance costs, promoting adequate net revenue and visibility for future projects. However, this amalgamation of support mechanisms is still in development and remains untested until large CCUS projects begin construction.
Integration of regulatory models with heat networks
For each model described above, the aim has been to provide an economic and financial environment that stimulates private sector investment and develops new infrastructure. Furthermore, it should be noted that such regimes and financial support have evolved over time depending on the maturity of the sector and UK Government’s priorities and policies.
Each energy or utility sector is very different, with unique characteristics necessitating a bespoke approach to both regulation and financial support mechanisms. Such differences can include the maturity of the sector or technology intervention, including FOAK projects such as CCUS, nature of service provision (e.g. wholesale versus retail) such as electricity and water, the extent and maturity of regulation and the quantum of investment required.
Furthermore, each sector will be heavily influenced by legislation, such as Section 92 of the HNSA that sets targets for the combined supply of thermal energy by heat networks, to reach 2.6 TWh by 2027 and 6 TWh by 2030.
Offshore Wind – Contract for Differences (CfDs)
The purpose, mechanism and award process for CfDs is very well understood and has proved very successful in securing the necessary investment in a wide range of renewable energy technologies, in particular Offshore Wind.
CfDs have evolved over time. Its predecessor was ROCs, which were in place between 2002 and 2017, and before that the Non-Fossil Fuel Obligations (NFFOs) and Scottish Renewables Obligation (SRO) launched as early as 1990.
CfDs’ primary purpose, like that of its predecessors, is to provide price assurance to the developer and associated investors in relation to each MWh of electricity generated and sold to the grid. In the majority of cases, the projects utilise proven technology such as Solar PV, On-Shore and Off-Shore Wind, together comprising c.96% of the CfD allocation within AR 6.
Construction and availability risks are both borne by the developer. While offshore wind generation can be reliably estimated, heat networks depend on gradually increasing connections over time, introducing demand uncertainty. With Solar PV and On-Shore and Off-Shore wind generation, capacity broadly remains the same over the operational life of the asset. For these reasons, a CfD may not be an appropriate mechanism at this moment in time for managing the demand risk associated with heat networks, which is currently a key inhibitor to the deployment of more private sector funding.
CfDs could however play a role in providing revenue support to those heat networks seeking to utilise decarbonised heat sources (other than industrial waste heat or heat from energy from waste plants). This type of mechanism could incentivise the transition from fossil-based heat sources (e.g. gas boilers) to more sustainable forms of heat generations (e.g. heat pumps). At present, residential customers are unlikely to be able to afford the increase in the cost of heat compared to conventional gas boilers or heat networks using waste heat.
Household water & sewerage undertakers – RAB-based Model
The RAB model utilised in the water sector, in conjunction with the associated price reviews, has proven to be an effective mechanism for encouraging investment and securing funding from the capital markets. This approach provides a tried and tested framework for recovering the costs of the investment over a period of time. This in turn encourages utilities to embark on much needed infrastructure development. Ofwat is also looking at new mechanisms such as Direct Procurement for Customers (DPC) for much larger scale capex projects.
Integral to the regulation and application of the RAB based model, is management of the inter-generational risk of customer charges. This means today’s customers should not feel any greater financial burden from new investment than the customers in the future. In the water sector, utilities still bear the risks associated with inflation, construction and operation costs, interest rates and to a lesser degree demand and bad debt risk within England and Wales.
The RAB model is widely used across sectors where revenue forecasting is relatively stable due to low demand risk. However, demand risk is highly uncertain for heat networks as a result of the uncertainty of connections. A key risk for potential investors is the heat network sector’s inability to manage demand risk and therefore a RAB model-based approach may not be a viable solution in the short term to incentivise investment. A RAB model could, however, play a key role in the regulation of the sector once it achieves critical mass and the impending regulation of the sector has had sufficient time to evolve and prove effective in the sector.
Key considerations for any RAB model are the resources and time required to regulate a sector effectively. The model and associated regulation works effectively in the water sector not least due the limited number of water utilities (11). Given that the heat network sector will comprise thousands of heat networks of various sizes, a RAB model may not be practical for all projects unless projects are first consolidated on a regional basis, or are subject to a minimum MW size requirement prior to utilising a RAB model. We do understand, however, that the impending regulation of the heat network sector will focus on tariffs (regarding Value for Money) and customer service, but it is unclear whether this will extend to a RAB-based model approach.
Carbon Capture, Utilisation and Storage (CCUS) – RAB Model and revenue support
The CCUS programme comprises T&SCo projects and carbon capture technologies developed at industrial and Energy from Waste (EfW) facilities. They are at a very early stage in the development cycle and as such referred to as FOAK projects. Furthermore, CCUS projects are not only exposed to technology and construction risk (i.e. the technology is considered unproven at such scale) but also are exposed to significant demand risk as industrial and waste emitters decarbonise over time. Such connections to the T&SCo infrastructure are therefore uncertain. Heat network technology is relatively tried and tested, but the issue of timing and quantum of connections is the same dilemma for both the heat network sector and CCUS. The CCUS sector has had to adapt its regulatory framework to address the issue of “demand risk” not mitigated by utilisation of a RAB model alone. A combination of RAB model and revenue support helps mitigate demand risk within CCUS.
This could potentially be largely replicated within heat networks, in particular to support the upfront capital expenditure. However, were this method to be adopted, extensive regulatory and legislative discussions would be required to ascertain a suitable counterparty to the revenue support mechanism. Furthermore, the positioning of who bears bad debt risk would need to be established. However, this risk is generally accepted within the water sector and arguably should be no different for heat networks. While this combination of regulatory support is planned for CCUS, it remains an untested regime with the potential for inefficiencies. This is particularly the case for heat networks given the limitations of a RAB model identified above.
Alternative regulatory structures for heat networks could include offering grants to offset upfront costs and revenue support mechanism to mitigate demand risk. This and other combinations of mechanisms, such as a cap on payments to reduce the risk of over-incentivising, could incentivise investment in heat networks without too great a departure from regulatory norms.
Renewable Heat Incentive (RHI) specifically for heat networks
It may be possible to develop a RHI specific to heat networks. This could bridge the price gap between gas and electric networks whilst encouraging investment. The RHI was a UK Government financial support scheme designed to encourage the uptake of renewable heat technologies. Since 31 March 2021 it has been closed for new applicants. A similar type of incentive for the deployment of heat networks would aim to promote the development and expansion of the sector and could include the features listed in Table 4.
Table 4: Summary of features for a potential RHI-type heat network incentive
Feature
Description
Tariff payments
Operators or users could receive periodic payments based on the amount of low carbon heat generated and supplied per MWh, which could be guaranteed for a period of time (usually quarterly payments over 20 years) to improve financial viability of projects.
Eligible technologies
The incentive could cover a range of renewable heat generation technologies that can be integrated into heat networks.
Tiered tariffs
A tiered tariff structure to encourage efficient operation which pays a higher rate up to a certain level of heat output and a lower rate beyond that could be implemented to incentivise operators to size systems appropriately and manage demand.
Upfront capital support
In addition to ongoing tariff payments, grants or loans to aid cover upfront capital expenditure would reduce the financial barriers to entry.
Performance standards
To qualify for the incentive, certain performance and efficiency standards would have to be met.
Metering and monitoring
Accurate metering of heat production and consumption would be required in order to calculate incentive payments.
Support for innovation
Additional funding could be made available for projects which demonstrate new technologies or business models helping the sectors development.
An RHI-type incentive in heat networks would aim to stimulate market growth and help achieve net zero emissions through the integration of carbon-based fuels to renewable energy. It could provide a financial impetus for the adoption of heat networks and making them an attractive option for developers, local authorities and consumers particularly if coupled with grants.
Stakeholder insight
This section summarises stakeholder feedback from the stakeholder interview exercise. The methodology underpinning this exercise is set out in Section 3.3. Stakeholder feedback also informed conclusions in other sections of this report, including:
Overall views and attractiveness of the sector
Key investment risks
Key initiatives that are required to move to a predominantly privately financed model
The private sector views heat networks as an attractive investment opportunity. However, there are areas of uncertainty that must be resolved, including the need for greater clarity on the development of future regulation. To facilitate private investment, stakeholders highlighted the need for continued grant funding support (which will help de-risk project cashflows), clear regulation on key areas such as zoning and mandatory connections, and clear direction on future policy banning carbon-based heat systems. Table 5 below summarises the detailed views of each stakeholder group.
Table 5: Stakeholder Engagement Summary
Stakeholder Group
How attractive is the sector?
What are the key sector investment risks?
What are the key initiatives that are required to move to a predominantly privately financed model?
Capital orientated stakeholders
Operators
Operators see significant interest from private infrastructure investors. However, there are concerns that private sector investment may move to other asset classes if the government does not provide certainty on future regulation and continue to financially support the sector.
The main observations from operators were:
Demand assurance risk – Uncertainty in cash flows due to lack of contracted revenue.
Development risk – Unforeseen issues arising during construction leading to cost overruns and delays.
Lack of regulation around statutory undertaking of rights – A barrier exists for the wide scale roll out when operators need to negotiate with each individual landowner rather than having a licence for the full network.
Scale of expansion – key strategic projects that support the overall development of the sector should be targeted for support rather than small stand-alone projects.
Consumer hearts and minds – Low carbon technology is a more expensive alternative than existing carbon-based technology. Consumers need incentives to adopt the technology.
Without continued support, zoning/permitting and regulation are insufficient to improve deployment of heat networks alone.
Operators would prefer aligned regulation between Scotland and UK Government.
The sector is likely to be primarily financed from developers’ balance sheets.
Mandatory connections are a key enabler for development.
Grant funding drawdown needs to be flexible to align with project needs.
Continued public sector support with extended funding round periods.
Long term political support is required.
Financial support to facilitate connections.
Regulation to address policy gaps including clarity on mandatory connections.
Clearer regulation on the decarbonisation of the sector (e.g. phasing out gas boilers).
Private capital / infrastructure funds
The sector is attractive to investors, with stable recurring cashflows.
There is a clear growth opportunity in the UK.
The main observations from private capital stakeholders were:
The pace of regulation needs to increase to bring clarity to the sector.
Limited and smaller investment opportunities: Projects with capital costs exceeding £10m are more attractive investment opportunities for funders. This means that larger city scale projects are typically prioritised by funders.
Local authority communication and collaboration – On local authority led projects there needs to be clear planning and alignment for projects coming to market between all parties. Investors need clarity on the timing of capital deployment to help them assess investment opportunities effectively.
There is uncertainty regarding the phasing out of carbon based heating solutions (e.g. gas boilers), making it difficult for investors to take a strong position in the sector.
Continued grant funding support that matches the needs and requirements of the projects.
Clear regulation around zoning/permitting and mandatory connections.
Clearer regulation on the decarbonisation of the sector (e.g. phasing out gas boilers).
Policy Banks
The sector is an attractive investment opportunity however the current market is lacking large commercially ready projects where policy banks can invest.
There is ample capital to deploy but limited commercially ready projects to finance.
Project scale – Project must be of sufficient size (e.g. £25m+ investment) and therefore, there are fewer investment opportunities in Scottish compared to rUK.
Continued grant funding support is needed that also matches project timelines and requirements.
Providing connection cost funding to enable public sector anchor loads.
Non-capital orientated stakeholders
Commercial Advisors
Established heat networks are viewed favourably by the private sector. The characteristics are similar to a bond therefore attractive to institutional investors.
Observations from commercial advisors included:
Procurement structures – Operators and investors need clarity on ownership and risk-reward responsibilities in joint ventures with public sector to assess and manage project risks.
Carbon based alternatives are still cheaper for consumers. Consumers need incentivised to adopt clean heat networks needs to improve.
Market uncertainty via a lack of regulatory clarity. For example, clarity on mandatory connections.
Continued public sector grant support that matches project timelines and needs.
Legal Advisors
Less appetite from lenders in early-stage heat networks due to uncertainty of payback.
Key observations from legal advisors included:
There is market uncertainty due to lack of regulatory clarity. The market needs greater regulatory alignment with England and Wales.
Demand assurance – Stability of revenue streams is crucial to investors.
There are too many procurement models from lenders’ perspective. They want a small list of possible approaches which provides familiarity and reduces development costs.
The current funding windows of grant support are too narrow and do not align to project development needs.
Property rights are difficult to navigate due to the potential disruption associated with construction of heat networks.
Continued public sector support in the form of Capex funding and/or revenue support to help provide assurance to lenders in the early stages of a heat network.
Public sector support for facilitating connection fees.
Clear regulation around zoning and mandatory connections.
Private capital and operator stakeholders were also asked specific questions regarding financial returns, types of financing, key financial metrics and shareholder structure. A summary of responses for each subcategory is provided below.
Rates of return: Stakeholders gave a consistent view of the minimum internal rate of return (IRR) requirement range for heat network developments. This was between 8% and 12% depending on a project’s specific risk profile (which can vary significantly). For example, established trunk/core developments can have lower IRR where demand assurance and contracted revenues are satisfied, while a higher IRR is required on expansions to make the developments feasible and appropriately mitigate risk.
Types of financing: Stakeholders unanimously agreed operators would likely use their own balance sheet for financing the short to medium term. Private Equity funds and infrastructure funds would predominantly continue to use equity to invest in the heat network sector. For the reasons outlined in earlier sections, the existing barriers around demand and revenue uncertainty limits debt investment in the sector.
Financial metrics: Stakeholders noted that they have certain size requirements when investing and deploying capital. For those stakeholders investing in the sector, the minimum investment required ranged from £10m to £25m+. These stakeholders highlighted this can limit their involvement in Scotland as, compared with rUK, there are fewer projects that meet their investment scale requirements. However, stakeholders did say this issue could be mitigated by investing in multiple projects rather one large project.
Scale: Similarly, stakeholders commented that rUK offers more opportunity due to the number of large city scale projects available. Scotland offers significant potential for large city scale networks but the greater number of cities and urban areas in the rest of the UK is more appealing as it offers more connection opportunities and a greater customer base.
Shareholder structure: Private capital and operator stakeholders were open to collaborating with Local Authorities in a Joint Venture structure; however, they flagged key legal areas that would need additional scrutiny. For example, clear roles and responsibilities regarding asset risk and reward.
As illustrated by the stakeholder engagement, stakeholder subgroups all highlighted similar risks and themes and what support mechanisms exist for the heat network sector. The engagement exercise identified key issues and barriers that must be addressed to attract private sector investment. The exercise has therefore helped inform our recommendations as set out in the next section.
Recommendations
Summary
The evidence from this report indicates that the Scottish heat network sector is still maturing and, in the short to medium term, requires significant financial support from the public sector. In the medium to long term, we also recommend models for securing private sector finance and for scaling and speeding up the roll out of large heat networks in Scotland.
Figure 11 summarises our recommendations, indicating the suggested timeframe and expected impact of each.
Figure 11: The impact of mechanisms over time
Source: EY analysis
Recommendations for rollout of mechanisms or policy initiatives
The recommendations are explored in more detail below.
Recommendation 1
The Scottish Government should maintain capital funding support for the sector through existing programmes or new bespoke capital schemes. The Scottish Government should also explore opportunities for extending grant funding drawdown timescales.
Timescales – short to medium term e.g. 1-10 years
This recommendation addresses barriers related to high capital costs, demand uncertainty and long development and construction times.
Stakeholders unanimously agreed that the large-scale deployment of heat networks requires continued public support. There is also precedent from other emerging countries to support the sector in this way.
Future grant funding programmes must reflect a heat network’s significant development and construction timescales. The Scottish Government aims to avoid piecemeal developments and the development of large-scale heat networks can be significantly longer than the existing grant funding windows. Although cross party support for the sector exists, the Scottish Government could consider secondary legislation which extends timescales. This would provide long term certainty to the market. However, we recognise government funding and budgetary restrictions will make this challenging. We also note that current schemes have open funding windows and seek to create as much flexibility as possible for applicants. Further sub-recommendations could also be considered including:
Reducing intervention rates. The level of grant support is subject to numerous factors, but any grant support should be sized to provide developers with a reasonable project IRR (noting that this is already standard practice). This will help support a greater number of projects, with lower levels of capital. There is precedent from the GHNF for lower levels of support, but differences between the GHNF and SHNF must be considered (including the varying volume of applications received through both programmes and different assessment criteria).
Targeting intervention at specific geographical areas or aligning with local regional strategies. This could include aligning support to regional zoning activity or targeting support at specific geographic areas where there are significant opportunities for future heat networks.
Target grant funding in other ways, for example, to support connection fees and/or enabling costs for end users of new residential areas. There is international precedent for this, including grant support to incentivise anchor loads. Further support for the public sector to meet connection fees could also be considered. Public Sector enabling costs are already supported through the Green Public Sector Estate Decarbonisation Scheme.
Grant funding could be exclusively targeted at district heating projects rather than smaller communal heating schemes.
Recommendation 2
Our review has found that de-risking future revenues is key to unlocking HN development – private capital is available for projects of this scale, but it must be financeable. Our initial analysis therefore concludes that more detailed analysis of a revenue support model, such as Contracts for Difference (CfD) or a Renewable Heat Incentive (RHI) equivalent, is merited. However, the Scottish Government must address the challenges of establishing such schemes, described below.
Timescale – Medium 5+ years
This recommendation addresses the barriers associated with demand uncertainty.
In section 6 we review the benefits of these models in the context of other relevant utility sectors. However, there are additional factors that the Scottish Government must consider before pursing this further. For example, it must consider the significant administrative and resource costs of establishing such schemes. Additionally, constrained revenue budgets mean that the creation of a new revenue model will represent a significant budgetary challenge for the Scottish Government. Lastly, with differences in regulation, policy and powers, the Scottish Government must also consider how a revenue model could be introduced in isolation from the rest of the UK. Additional CfD and RHI considerations are summarised below:
Contracts for Difference – Although this is a well-established model, certain complexities must be resolved before it can be deployed in the sector:
Calculating a reference price – heat prices are bespoke, and cannot be benchmarked to a national market price, unless there is regulation on the price of heat. This must be explored further before the model can be introduced.
Generation versus consumption – a CfD should be based on the generation of heat, rather than consumption of heat. This will help mitigate demand risk, as the model is not reliant on future unknown connections to the heat network.
The CfD could also subsidise the additional capital cost of installing expensive clean heat network technology.
Additionally, the higher cost of underlying electricity (compared to gas) could be mitigated and passed on to customers thereby reducing price risk. However, before introducing an alternative mechanism to grant funding, the CfD cost (compared to the level of grant) must be further understood.
RHI model – The RHI model is another well understood revenue support model, which has previously been used in the heat network sector. However, previous RHI schemes have been criticised, for example, the National Audit Office stated the UK Government did not achieve value for money.
RHI subsidises the cost of heat generated from clean heat networks, compared to alternative forms of heat generation. However, complexities remain that must be addressed before it can be deployed:
Generation versus consumption – Similar to CfD, an RHI model would need to be based on the amount of heat generated, rather than consumption of heat, and would therefore act as a contribution to the cost of deployment. It would help to address the increased cost of installing a more expensive heat network technology, and at the same time mitigate demand risk.
A payment cap could be introduced to avoid over-incentivisation within the sector.
Before adopting an alternative to grant funding, the RHI cost (compared to the level of grant) must be thoroughly assessed.
Recommendation 3
Following further regulatory developments and the creation of an established asset base (possibly 10-15 years), the Scottish Government could explore the benefits of implementing a RAB model.
Timescale – Long term e.g. 10 years +
This recommendation addresses barriers associated with consumer experience and regulatory uncertainty.
The RAB model (coupled with price reviews) has been shown to be helpful in protecting consumer prices whilst encouraging ongoing investment and maintaining assets.
However, the cost and resource implications of administering RAB models across a large number of very diverse projects will be significant. This may be mitigated through minimum generation requirements, but this must be explored further. EY and many stakeholders agreed that a RAB model may be appropriate / beneficial in 10-15+ years but only after certain market characteristics are met.
The Scottish Government must assess the feasibility of developing a Scottish RAB model, which may diverge from the approach in England and Wales.
A transition from one regulatory mechanism to another could occur in the future. However, for this to occur, the sector must mature and must focus on large scale capital investment. This will impact whether a RAB model alone could be introduced to provide consumer protection or whether it will need to be supported with a revenue support mechanism. Furthermore, the market must be economically feasible (meaning the sector is more mature and financially viable) to regulate the assets themselves prior to introducing a RAB model.
Importantly, without capital or revenue support, a RAB model will not by itself result in a financially viable heat network. It would therefore need to be coupled with other support mechanisms, as pioneered by CCUS. This reinforces the requirement to pursue short term sector support, including public sector capital funding.
Recommendation 4
SNIB and the UK National Wealth Fund are committed to investing in the sector. The Scottish Government must continue to work closely with these organisations in order to explore investment opportunities, create a shared understanding of each party’s objectives and ultimately unlock the capital that has been made available to invest.
Timescales – short term e.g. now -1 year
This recommendation addresses the barriers associated with access to funding.
The Scottish Government must also consider infrastructure bank restrictions, including who they can support (e.g. local authorities) and minimum lending requirements.
Recommendation 5
The Scottish Government should maintain and increase support for pre-construction projects, via the Heat Network Support Unit (HNSU) and specific development funding programmes.
Timescales – short term e.g. 1-2 years
This recommendation addresses the barriers associated with access to funding.
To support the sector’s development a strong pipeline of projects is required. In Scotland, and across the UK, there are a growing number of pre-construction projects that require commercialisation support.
All stakeholders commented on the need for improved funding to develop heat networks until there are sufficient cashflows enabling networks to support themselves and attract other forms of funding.
This could include expanding the role of the HNSU to take a more active development role similar to the UK Government’s Heat Network Delivery Unit. However, the HNSU would require additional resources and financial support before it could expand its remit.
The Scottish Government could also consider engaging with national development banks, e.g. SNIB or the NWF to co-develop development funding programmes.
Recommendation 6
The Sottish Government should monitor the implementation of the UK Government’s zoning approach, and where appropriate, leverage best practice from DESNZ. This should be used to compliment Scotland’s existing zoning approach.
Timescales – short term e.g. 1-2 years
This recommendation addresses the barriers associated with demand uncertainty.
Robust zoning regulations, with mandatory connections will help reduce demand risk and support private sector investment. Ultimately this will support the roll out of larger heat networks at scale by reducing demand uncertainty for operators and investors.
Regional Zones, across local authority boundaries, could be used to identify area of high heat demand, and key heat sources.
These proposals could leverage the Advanced Zoning Programme (AZP) model adopted by DESNZ, where pilot heat network zones have been identified to supply.
The HNSA creates the opportunity for local authorities and the Scottish Government (in some cases) to designate zones. This should be explored in more detail, including the number of zones required in Scotland. The Scottish Government could also use this route to create larger strategic zones across Scotland.
However, zoning proposals must account for heat costs and the risk that consumers are forced to connect to a heat source that is more expensive than alternatives.
The Scottish Government must also consider that its limited resources will reduce its ability to replicate the regulatory developments in England and Wales.
Recommendation 7
We recommend that Scottish Government reviews its regulatory approach to help reduce regulatory uncertainty, simplify delivery and align with the wider UK framework where appropriate.
Timescales – short term e.g. 1-2 years
This recommendation addresses the barriers associated with regulatory uncertainty.
The introduction of secondary legislation, including further details on consenting and authorisation, will help to reduce the existing uncertainty in the market.
The lack of standardisation in procurement approaches and delivery models adds complexity, time and cost to a project’s development timeline. The Scottish Government should accelerate its activity to provide more clarity to the market. The UK Government is also developing its delivery models. The Scottish Government could consider aligning with the UK Government approach to ensure a consistent landscape for the private sector.
As part of the Advance Zoning Programme for Heat Networks in England, DESNZ issued template delivery model guidance for the procurement of Heat Network delivery partners. The purpose this is to assist project sponsors in the identification of opportunities for the acceleration of the scale and pace of zonal heat network delivery. Template documentation provides greater clarity in the marketplace leading to quicker and more effective procurement processes, improving market appetite and reducing bidder fatigue. The guidance for the promoters of AZP projects sets out the principles of three potential delivery models and sets out the characteristics to consider when determining the delivery model to adopt. This includes Development Agreements, the Golden Share and Co-investor models.
Recommendation 8
We recommend that the Scottish Government continues to work with the UK Government on rebalancing electricity and gas prices; however, this will not eliminate the price difference between electricity and gas.
Timescale – Medium 5+ years. However, the Scottish Government does not have the developed powers to implement this recommendation by itself, and therefore further discussions with the UK Government are required.
This recommendation addresses the barriers associated with structured pricing challenges.
The UK Government is continuing to explore opportunities for rebalancing electricity and gas prices, to reduce electricity costs and support the affordability of clean heat networks for consumers. This initiative is not a devolved matter, so the Scottish Government should continue to work with the UK Government on the proposals. If unsuccessful, a revenue support model should be considered as an alternative to address pricing risk.
Recommendation 9
The Scottish Government should develop a national Heat Network Strategy setting out a long-term vision for Scotland’s heat networks.
Timescales – short term e.g. 1-2 years
This recommendation addresses multiple barriers.
Not only will this help provide further clarity and confidence to the private sector, but it will also help to educate and explain the benefits of heat networks to the wider Scottish public.
This view was shared by specific stakeholders and mirrors the recently published Scottish Renewables Heat Network Vision.
This strategy could also leverage the Scottish Futures Trust (SFT) analysis on sector delivery models which could accelerate the pace and scale of heat network deployment in Scotland.
Additionally, the strategy should provide:
Clarity on national and regional Heat Network implementation, crossing local authority boundaries.
A strategy for future public sector support, including where and how grant funding, should be targeted. This should also include Scottish Government’s external commitment and its ability to invest in the sector.
Inform the ongoing development and implementation of regulation.
Plans for engaging with the UK Government on recommendations reserved to the UK Government, e.g. structural pricing plans.
Appendices
Appendix A – Financing mechanisms
There are a number of financing mechanisms that the Scottish Government could utilise to help de-risk heat network investments. These mechanisms, or “financial levers”, could increase the attractiveness of heat network projects to private investors and ultimately increase the pace and scale of their deployment. They may achieve this through reducing investment hurdle rates (by decreasing risk), increasing gearing levels to reduce the overall cost of capital and/or improving the project’s IRR to meet the investors’ thresholds. However, the need for these levers and the decision on which (if any) to employ, will vary from project to project and these factors should be assessed as part of the financial structuring of a project.
The financial levers available to Scottish Government can be broadly grouped into the following categories:
Capital funding;
Revenue funding;
Investment; and
Business model support.
The need for these levers and the decision on which (if any) to employ, will vary from project to project and these factors should be assessed as part of the financial structuring of a project. This section will summarise the key elements of these funding mechanisms and discuss their implications for resource demand, balance sheet treatment and exist strategy.
Capital funding
Capital funding uses capital budgets to provide gap funding for heat networks. This may be in the form of, for example, a capital grant or repayable assistance.
Capital grant
Capital Grants are allocated to fund activities aligned with government priorities, benefiting public or private entities that contribute to specific public outcomes. These grants come with conditions that must be met to avoid repayment obligations. In Scotland, Repayable Assistance is typically preferred over Capital Grants for heat networks, with the possibility of repayment if profitability exceeds expectations. Administering Capital Grants demands significant resources, particularly during application assessment, construction monitoring and post-commissioning for a period of 3-5 years. The treatment of Capital Grants on balance sheets depends on various factors, including the grant’s size and terms, which may affect asset classification. After fulfilling all grant conditions, the grantee is released from obligations, but the grantor may benefit from maintaining a relationship for continued data access and to support future expansions.
Repayable assistance
Repayable Assistance functions similarly to Capital Grants, with the distinction that it must be repaid partially or in full if the project exceeds certain performance-related thresholds in the initial years of operation. This mechanism is designed to prevent grantees from benefiting excessively from public subsidies. Managing Repayable Assistance requires additional resource to evaluate and challenge financial returns and reports from grantees. The treatment of Repayable Assistance on the balance sheet is comparable to that of Capital Grants, with the classification determined by the delivery model, the proportion of Repayable Assistance to total capital costs of the project and the terms of risk allocation. The exit strategy involves ceasing monitoring once grant conditions are satisfied, which may take longer than for Capital Grants.
Revenue funding
Certain financial levers utilise revenue budgets to fund heat networks, such as revenue grants, heat purchase agreements (or demand guarantees) and outcomes-based funding.
Revenue grant
Revenue Grants fund activities that support government priorities and public benefits, with both public and private entities eligible as grantees. In Scotland, Revenue Grants have often been combined with Repayable Assistance and, from an investor perspective, can help mitigate revenue risk which is one of the most significant barriers to heat network investment. The grants, which are not typically repayable unless certain grant conditions are not met, can be performance-linked to ensure drawdowns align with financial need. The administration of Revenue Grants can be resource-intensive, as they require stringent monitoring across the project lifecycle. The treatment of these grants on government balance sheets is influenced by several factors, including the grants’ size and the delivery model. After fulfilling grant conditions, which may take many years, the grantor’s monitoring ceases, but a continued relationship with the grantee can be beneficial for gathering data and supporting future expansions.
Heat purchase
Heat Network developers require a level of assurance to ensure there will be a sufficient customer-base to make their investment viable. This assurance is crucial as it influences the decision to invest and the capacity to future-proof networks for anticipated demand growth. Anchor loads (significant heat demands that are likely to be the first connections to the heat network, typically large public buildings with sustained high heat demand) are essential for making networks investable. The Scottish Government could provide demand assurance through mechanisms such as Heat Purchase Agreements, where public buildings are offered as anchor loads without a guaranteed minimum demand and Demand Guarantees, which involve a “take or pay” commitment for a minimum quantity of heat.
These agreements require resources for due diligence, negotiation and ongoing monitoring, often requiring specialist expertise and governance to effectively manage the associated risks. The balance sheet treatment of these agreements may lead to on-balance-sheet classification of project assets, if risk transfer is diluted. The exit strategy for such agreements is to have a fixed contract term, after which they can be re-procured or renegotiated, with “take or pay” guarantees being time-bound and including withdrawal clauses under certain conditions, such as when sufficient third-party demand is secured.
Outcomes based funding
Outcomes based funding is a financial mechanism that focuses on achieving specific, pre-agreed outcomes rather than outputs. It operates on the principle of “payment by results”, where organisations (typically local authorities, though could also apply to a private company) invest in infrastructure to deliver set outcomes. If these outcomes are met, Scottish Government would make regular payments over a set period, reflecting the pre-agreed value of the outcomes achieved. For example, these outcomes may be successful commissioning of the heat network, the number of heat network connections, carbon savings and/or the social value created. This model shares risk between the organisation and the government, however it is resource-intensive, requiring careful project selection, development and ongoing monitoring to ensure that the agreed outcomes are met. While it may not be efficient for smaller projects due to the resources needed for monitoring, Outcomes Based Funding can support infrastructure without being classified on the Scottish Government’s balance sheet, if the delivery risk is fully transferred to the grantee. The monitoring period is predefined, often spanning 20-25 years, with revenue payments contingent on achieving these outcomes.
Investment
Equity
Special Purpose Vehicles (SPVs) are often formed for infrastructure projects. SPVs allow for project assets and risks to be held within the vehicle itself and enable investors to make more targeted investments into specific asset classes that align with their desired risk/return profiles. SPVs require one or more shareholders to own the company, appoint its board of directors and provide the necessary funding, typically through equity or shareholder loans as subordinated debt. These SPVs can be solely owned by one entity or jointly owned by multiple organisations, which may include a mix of public and private sector shareholders and can also take the form of corporate joint ventures.
The Scottish Government can participate in SPVs as an equity investor, either independently or in collaboration with private sector partners. This model affords Scottish Government a degree of control over the project’s strategic direction and the opportunity to share in the profits, but also exposes government to the associated investment risks. In heat network projects, government might invest in the network’s distribution assets and later recoup this investment through ‘use of system’ fees from other parties utilising the network. Managing such equity investments requires a long-term commitment and specialised expertise in investment structuring, due diligence and governance, ensuring that the government’s interests and public funds are appropriately safeguarded. The impact of these investments on the government’s balance sheet is influenced by the degree of control the government has as a shareholder, the size of the equity stake and the risk transfer mechanisms in place. In terms of exit strategies, the Scottish Government could sell its equity stake in the SPV once the project reaches a stage of profitable operation, allowing for the recycling of capital into other projects.
Debt finance
Debt finance is a financing mechanism where the government lends money to public or private sector borrowers, who are then obligated to repay the loan with interest according to the terms set out in a loan agreement. There are three key features of debt financing: the seniority of the debt, which determines the order of repayments from project cash flows between debt and equity holders; the security of loans, which may be secured or unsecure; and financial covenants that serve as safeguards for the lender by monitoring the borrower’s financial health and triggering repayment in case of covenant breaches.
Scottish Government could establish a revolving loan facility aimed at supporting projects during their riskier construction and early operational stages, with the possibility of refinancing by the private sector once more stable operations are achieved. This approach facilitates the recycling of capital into new projects and aligns with the preferences of long-term investors seeking lower-risk opportunities. Administering such finance requires significant resources for project selection, development and monitoring, with the balance sheet treatment determined by factors such as loan terms, size and risk. The exit strategy allows for the recovery of investments through repayments or refinancing, potentially leading to capital receipts that can be reinvested or the sale of loan portfolios to investors, thus enabling ongoing economic development.
Loan guarantee
A Loan Guarantee by the Scottish Government provides a safety net over debt repayments to lenders, covering either the entire loan or a portion, with the aim of reducing the cost of capital for borrowers, such as heat network developers. This can make investments more feasible and enable access to loans that might otherwise be unavailable due to risk considerations. While initially having limited budgetary impact, provided the risk of the guarantee being called upon is low, there are Subsidy Control implications that may be offset by charging a fee for the guarantee. Implementing a Loan Guarantee scheme requires resources for design, project assessment, due diligence and ongoing monitoring, requiring specialist expertise and governance to manage financial and reputational risks. The balance sheet treatment of a Loan Guarantee is influenced by various factors, including the delivery model and the size and terms of the guarantee. The Scottish Government’s exit strategy involves offering guarantees for a specific term with withdrawal clauses, allowing for the possibility of refinancing and withdrawing the guarantee once the project is operational and profitable.
Business Model Support
This section outlines common business model support mechanisms in the UK, such as Regulated Asset Base, Cap and Floor and Contracts for Difference, which could potentially be adapted for heat networks. These Business Model Supports would draw upon revenue budgets to heat networks. While these models are theoretically adaptable, they face significant challenges that require careful consideration to tailor them to the heat network sector.
Regulated asset base
A RAB is a regulatory framework that measures the capital used in a regulated entity, where companies are granted a licence by an economic regulator to charge users regulated prices for services linked to an infrastructure asset (operating on a “user pays” model). The regulator sets or caps the charges that the operator can levy for a certain period, reducing pricing risk for investors and ensuring charges allow for the efficient recovery of costs incurred by the operator in the interest of customers. Charges can be controlled through a revenue cap, which protects investors from both price and market existence/demand risk, or a price cap, which only shields from price risk.
Hybrid RAB models, combining a price cap with government cash injections, are being explored for Carbon Capture, Transport and Storage infrastructure to mitigate market existence/demand risk. The RAB operator’s prices are calculated to enable recovery of operating expenditure, depreciation costs and an allowed return on capital, balancing risk reduction for investors with cost-efficiency incentives. Charges are reviewed and reset periodically by the regulator in consultation with the operator and customers, protecting investors from subsidy risk within each regulatory period. If applied to heat networks, a RAB model could significantly shield investors from price and market existence risks. However, current regulatory and policy frameworks for heat networks are not conducive to the model’s deployment at this time.
Cap and floor
The cap and floor mechanism aims to offer investors a degree of revenue certainty while maintaining incentives for efficient operation. The floor guarantees a minimum revenue, covering at least operating costs and senior debt service, thus limiting investors’ risk and enabling financing. Conversely, the cap sets a maximum revenue, with any excess being repaid, limiting the investors’ returns.
A revenue sharing arrangement can be incorporated, where excess revenue is split between investors and user/taxpayers, rather than being fully retained by investors or returned to funders. The mechanism’s terms, including cap and floor levels and the applicable period, are contractually agreed, reducing subsidy risk as the support cannot be abruptly withdrawn. This arrangement mitigates price risk and market existence/demand risk by assuring minimum revenue, independent of demand, although it does not protect against cost variability.
Currently utilised by Ofgem for financing electricity interconnectors and considered for electricity storage in the UK, the mechanism is funded by electricity users or, alternatively, could adopt a ‘taxpayer pays’ model with government involvement. For heat networks, while ‘Cap and Floor’ offers some risk protection, it requires careful implementation to avoid disincentivising network operators from acquiring new customers or charging competitive rates. Additionally, the ‘taxpayer pays’ model could lead to significant financial exposure for the Scottish Government.
Contracts for difference
CfDs are a support mechanism that offers investors a fixed, contractually agreed ‘strike price’ per unit of output. This helps to mitigate potential subsidy risk for investors due to the subsidy being a binding, contractual obligation. The strike price may be fixed or index-linked and CfDs can be signed with the government or a government-backed third party, with funding from taxpayers or users. The ‘reference price’, generally the market price, determines the subsidy level during each CfD period, with investors receiving a subsidy if the market price is below the strike price, or paying back if it’s above. This support incentivises operational efficiency, as investors are exposed to cost variability risk and only receive support once the project is operational.
Although CfDs are used extensively for renewable electricity generation in the UK, applying this mechanism to heat networks poses challenges. It is difficult to define a reference price due to the absence of a wholesale heat market and the localised nature of heat network pricing, which relies on local factors such as the availability of low carbon heat sources and customer demand. Without regulated heat pricing or an accepted methodology for setting a wholesale price, the application of CfDs to heat networks remains complex.
Appendix B – International experience supplementary information
The supplementary narrative below provides a brief historical overview, a summary of the public financing levers available and a summary of the regulatory framework for each country. Additionally, the supplementary narrative is followed by additional information regarding the use of state-owned infrastructure banks.
Rest of the UK (rUK)
Overview
Heat network technology has been in the UK since the 1950s where the Pimlico District Heating Undertaking was the first true district heat network in the UK. The network connected 1,600 council homes to the waste heat generated by Battersea Power Station. However, heat networks fell out of popularity in the 1980s and 1990s as the UK shifted away from high rise flats but regained attention in the 2000s as energy prices increased and financial investment cases became more attractive[24].
Public financing levers:
The UK Government is aligned with international comparators offering up front capital grants in addition to grants for existing underperforming heat networks to encourage efficiency upgrades. These are as follows:
England and Wales have a designated heat network fund, the GHNF which was set up by DESNZ and managed by Triple Point Heat Networks Investment Management[25]. The GHNF is the next iteration of grant funding succeeding the Heat Networks Investment Project (HNIP) loans. The GHNF aims to provide up to 50% of upfront construction costs with the aim of making projects more investable for private sector. The GHNF initially had £288m of capital available but further funds of £485m has been additionally allocated.[26]
DESNZ has also recently published the Heat Network Efficiency Scheme (HNES)[27] which provides both capital grants to part fund installation and revenue grants to fund procurement or mobilisation of external third-party support to carry out Optimisation Studies. This scheme is targeting existing district heating or communal heating projects in England and Wales that are operating sub-optimally and resulting in poor outcomes for customers and operators.
Regulatory structures
Refer to section 4.2 for the UK regulatory structure overview.
Market ownership
The rest of the UK has a mixed market ownership profile with local authority owned, joint ventures and privately owned heat networks. For example, The London Borough of Enfield own the Energetik heat network, a growing network with its own energy from waste plant providing the heat for the network. Vattenfall own Bristol City’s heat network and work in partnership with Argent and Barnet council[28]. There are also private equity backed heat network developers such as 1Energy backed by Asper Investment who have four projects under development, including the Bradford Energy Network. Local authority budget constraints will mean a continued role for private sector involvement. For example, the UK Government’s routes to market proposals focus on the Concession and Joint Venture models.
The Netherlands
Overview
The Netherlands started exploring district heating in the 1920s, but the sector developed significantly following the 1970s oil crisis which prompted a search for more efficient and sustainable heating solutions. The country has since been expanding its heat network infrastructure, focusing on sustainability and the use of residual heat from industrial processes.
Public financing levers
The Netherlands is expanding its heat network market by providing capital grants for qualifying projects and incentivising individuals to connect to heat network via individual grants.
This includes the Heat Networks Investment Grant (referred to as the WIS programme), which supports the construction of new, efficient heat networks. This €400m programme was open between July 2024 and December 2024 and specifically targeted heat networks that help existing homes transition away from natural gas (capped at €30m available per project). The programme funds up to 45% of capital costs and aims to bridge the ‘unprofitable top’ of heating network investments (the difference between the eligible investment costs and the operating profit)[29]. The subsidy can never be more than 100% of this ‘unprofitable top’. WIS can provide support to full projects as well as individual consumers, as it also provides up to €7,000 for small scale consumer connections.
Regulatory structure
The sector has been regulated in the Netherlands since 2014. The legislation was updated with the 2020 Heat Act 2.0, which outlines the requirements for creating a reliable, affordable and sustainable sector. The Act oversees pricing (including price regulation for smaller customers), licensing, private sector profits and customer protections. The Act also sets price caps to ensure that all heat network operators provide price information in a standard format, allowing for greater transparency to consumers.[30] Regarding tariff setting, the Authority for Consumers and Markets (ACM) ensures that costs for a household with a district heat connection are less than an individual condensing gas boiler.[31]
The Netherlands is also developing the Collective Heat Supply Act which aims to bring the heat network sector into public ownership. The Act will look to incorporate a ‘cost plus’ model where tariffs are based on actual cost plus a reasonable regulated rate of return[32]. However, the Act still needs to finalise ownership arrangements between heat generating companies and operators.
Additionally, the Netherlands mandates connections. Municipalities are required to prepare heat plans for their respective areas. This specifies that new buildings have to be connected to a heat network for ten years as part of a heat plan.31 Furthermore, the Dutch Building Code states that a house will get a mandatory connection to a heat network when the network is within 40 metres.
Lastly, the Netherlands amended the Gas Act in 2018 to ban new buildings from connecting to the gas grid and introduced a new incentive scheme (SDE+). SDE+ provides subsidies to companies which generate renewable energy or reduce their CO2 emissions on a large scale. Similarly, the Netherlands will ban new fossil fuel-based heating systems from 2026.[33]
Market ownership
The Dutch heat network market has a large level of private finance penetration with more than 90% of heat networks managed by private heat companies (partly through Public-Private Partnerships) and less than 10% are owned fully by public sector heat companies. For example, Vattenfall (a Swedish state-owned company), Eneco Energy (privately owned) and Ennatuurlijk (Dutch utility company) dominate the market owning approximately 90% of the country’s district heating networks as heat infrastructure has not yet been separated by law from the production and supply of heat (unlike gas and electricity).[34] As such, in 2022, the Dutch government first considered part nationalisation of heat networks via the Collective Heat Supply Act (WCW) with the intention of protecting public interests such as affordability, reliability and sustainability.[35] The intention is that municipalities could own 51% of the network, to help encourage consumers to stop using gas fired central heating. The Dutch government believe more citizens would be willing to switch to heat networks if they are not forced into a model that requires the use of a private sector supplier.
This initiative was met with hostility from operators. Ennatuurlijk withdrew from development of the regional district heating grid Twente, as they were not clear how their assets and investments would be valued at the end of the transition period. Whilst the private sector supports opportunities to give more important roles to local authorities, there are concerns about losing control of the strategy and operations of the heating assets whilst remaining financially responsible for them.
Details and practicalities are still being refined, but it is envisaged that existing private network operators would be given a 20-30 year grace period to recoup their initial investments made before transferring ownership to municipalities35.
GERMANY
Overview
Germany’s district heating has its roots in the late 19th century, but it became more widespread after World War II, particularly in East Germany. Today, Germany continues to invest in district heating as part of its energy transition, with a focus on integrating renewable energy sources and improving efficiency.
Public financing levers
The German Government supports the development of heat networks up front via feasibility, capex funding and additionally operating cost subsidies for renewable projects. Individuals and building owners are also incentivised via grant funding to upgrade heating or connect and further rewarded for an accelerated transition. The levers include legislation where there is €3bn to support the development of 5th generation heat networks[36]. The previous legislation provided funding covering feasibility (up to 60% of costs) and construction (up to 50%). A new BEW fund provides 50% or €600k and 40% of eligible investment/operating cost subsidy, however this is only applicable to projects with 75% renewable heat sources.
Additionally, companies, landlords of rented family homes and condominium owners are now eligible for financing from KfW (Germany’s state-owned infrastructure development bank) for installing low carbon heating systems or connecting to existing heat networks. The scheme can provide up to 30% of investment costs (plus an additional 5% for more efficient heat pumps)[37]. A €2,500 fixed support payment for efficient biomass heating systems is included and a speed bonus is applied if existing gas or oil heating systems are replaced by 2028. The scheme also can support individual home-owners with up to 70% of costs and municipalities will also be able to apply for support in late 2024.
Regulatory structures
Germany has the largest scale heat network market in Europe (illustrated by Figure 9) but it is unregulated. Instead, Germany has regulated electricity and gas markets and operates in a similar manner to Finland, with oversight from competition authorities. Standard terms and conditions for supply of heat networks are defined by Federal law.
Additionally, Germany amended the Building and Energy Act 2020 in September 2023[38] requiring municipalities to:
Phase out oil and gas heating systems
develop heating plans by 2028, including a regional heating approach
that all heating systems installed in Germany after 1 January 2024 must be powered by at least 65% renewable energy
Initially the amendments will apply to new builds but extend to existing and under construction properties too.
The Local Heat Planning Act (WPG) also legally obliges district heating companies to decarbonise their networks[39]. Therefore, residents within these areas are removed from the transitioning process with responsibilities outsourced to professional entities such as private companies or municipal utilities. The WPG also requires building owners to switch from fossil fuels to renewable heating technologies and municipalities with a population over 100,000 to have draft heat plans by June 2026 (smaller municipalities by June 2028) identifying which heating technologies are available to connect to[40].
Market ownership
The German heat network market is in transition with several large heat networks becoming municipality owned. For example, in December 2023 Berlin’s municipality acquired the Berlin heat network for €1.4bn from Vattenfall, showing how one of Germany’s largest heat networks has moved into public sector ownership[41]. The heat network was bought by the state of Berlin as they are committed to re-municipalising infrastructure and reversing privatisations to gain more influence over the city’s district heating and gas supply.[42] They also believe the company will be profitable and key in moving toward climate neutrality. The state was able to buy the heat network via a state-owned financing company which received equity from the state budget and loans from Investitionsbank Berlin which the senate backed by a state guarantee.[43]
As it stands, private companies, for example large energy suppliers, hold a significant share of the market and municipalities owning and operating the other significant proportion of the market.[44] The small remainder of the market is made up via large industrial companies who operate their own networks for industrial processes and heating factory buildings. Whilst market share is small, it is significant in industrial areas. Large public buildings also have their own networks, for example, universities, hospitals and other public sector buildings.
FINLAND
Overview
Finland has a long history of district heating, dating back to the 1950s. The country’s cold climate makes district heating a practical choice for urban areas. Finnish district heating has evolved to use a mix of energy sources, including a significant proportion of renewable and waste energy and it is considered a key component of Finland’s strategy to reduce greenhouse gas emissions.
Public financing levers
The mature Finnish market is upgrading, refurbishing and decarbonising existing networks and is less focussed construction of new networks. The Finnish Government is facilitating the heat transition upgrades by Investing €21.8m across six projects for waste heat recovery, heat pump solutions and energy storage solutions to help move away from carbon-based heating[45]. Similarly, the Ministry of Economic Affairs and Employment has allocated €469m of energy aid from EU funding for renewable projects via the national Recovery and Resilience Plan[46]. However, there does not appear to be a bespoke heat network capital grant fund. Additionally, Finland is providing grant support for end users – €2k-€4 for heat exchangers and €0.5k-€2k for balanced and adjusted heating systems. Furthermore, the Government are introducing a new tax credit scheme to give projects up to €150m worth of tax credits.[47] The idea is once green projects (renewable projects aiding the transition to net zero) become operationally profitable, a tax credit would aid cash flows making the project more feasible and investible.
Regulatory Structures
Finland established a self-governing framework, where there is no official national regulation but instead a clear set of technical codes which form the industry standard[48]. Finland did have legislation with mandatory connections, which was repealed in 2019, as mandatory connections were deemed anti-competitive. Finland has alternative renewable energy heat sources to choose from.
The Finnish government also introduced a €90m scheme to incentivise the move away from carbon-based fuels to biomass CHP networks and €45m to non-combustion technologies (e.g. heat pumps).
Market ownership
The Finnish market currently has a low level of private finance penetration with heat networks being predominantly municipality owned. However, the Finnish Government is seeking foreign investment into the sector, as it recognises public sector budget pressure and the need to attract private sector investment. For example, an important driver behind the introduction of private finance is the requirement to refurbish existing networks as they become old and inefficient.
Private investors note that Finland is very attractive due to the stability of the heat network sector which allows institutional investors to gain comfort and certainty in their investment.[49]
Additionally, Finland has seen private equity infrastructure funds acquire individual networks. For example, the largest heat network owned by Fortum Energy (a state-owned energy company) was recently acquired in 2021[50] by a private equity infrastructure investor (Partners Group) demonstrating the shifting landscape.
Therefore, Finland is demonstrating both the need for private investment as local authorities are capital constrained and offers a stable asset class to invest in an established market.
SWEDEN
Overview
Sweden has been a pioneer in district heating since the early 20th century. The first commercial district heating system was introduced in 1948. The oil crisis of the 1970s also accelerated the transition to district heating, which now utilises a high proportion of renewable energy sources. Sweden’s extensive use of district heating is often cited as a model for other countries.
Public financing levers
The Swedish market is well developed and mature. The Government are using a range of capital funding, personal grant incentives and tax exemptions to expand and refine the heat network market. For example, the Swedish government can provide small grants up to 60,000 SEK (approximately £4,300) for conversion to a new heating system moving away from direct-acting electricity or gas for single family homes[51].
Additionally, Sweden also provides tax exemptions where renewable energy heating sources are exempt from energy and carbon dioxide taxes.[52]
Regulatory structures
The Swedish district heat market was deregulated in 1996 which brought issues surrounding high prices and lack of transparency. Subsequently, light-touch voluntary regulation was reintroduced via the District Heating Act (2008)[53] and overseen by the Swedish Energy Markets Inspectorate (who also regulate electricity and gas). For example, voluntary initiatives for pricing transparency where the Swedish Competition Authority can investigate any signs of potential market abuse. Additionally, the Swedish Energy Market Inspectorate also have standard contract terms for delivery of district heat networks to ensure a consistent delivery approach across the market.
Whilst there is regulatory oversight, connections are not mandatory in Sweden. Although Swedish municipalities are responsible for developing energy plans and have a monopoly planning of district heating developments, building owners decide on their sustainable heating source as long as they follow environmental standards[54].
Market ownership
The heat network sector in Sweden currently has a mixture of privately and publicly owned networks and operators. For example, the heat network assets are owned by the local authorities and municipalities or the state-owned operator Vattenfall, but there are also private sector operators such as Eon and Fortum. Additionally, Sweden also has some joint venture structures for example between the City of Stockholm and Achiale (private investors).
A recent example of private investment was the sale of 50% of the Fortum (a Finnish state-owned energy company) holding in Stockholm Exergi to a group of European institutional investors including pension funds.[55] This demonstrates institutional investors recognising the stable returns provided by established heat networks and the opportunity they present to private investors.
ESTONIA
Overview
Estonia’s district heating systems were developed during the Soviet era, with the first systems established in the 1940s and 1950s. After regaining independence, Estonia reformed its district heating sector, improving efficiency and incorporating more renewable energy sources. The country has one of the highest rates of district heating coverage in Europe.
Public financing levers
As Estonia’s heat network sector is well advanced, there are limited grants and subsidies available. However, Estonia is encouraging refinement of their heat network market via investment support, compensation schemes and individual connection grants. Examples include the recent €20m investment by Gren (a private energy company) into Tartu, Parnu and Ida-Virumaa heat networks. Gren also received €4.2m of financial support from the Estonian Environment Investment Centre via the European Cohesion Fund and European Regional Development Fund[56].
Other forms of public funding included the Government compensation scheme for household energy consumed to counter the rising energy prices[57]. For example, the state compensates up to 80 percent of the part of the average monthly price that exceeds 80 euros/MWh for district heating. The subsidies are automatically applied to the district heating bills.
Additionally, the Estonian Business and Innovation Agency will provide up to a €10,000 grant for small residential buildings for facilitating the connection to an existing heat network[58].
Regulatory structures
The Estonian district heat sector is regulated by the District Heating Act 2003 where heat operators must coordinate the price of heat sold to the consumer with the Competition Authority. Additionally, Estonia uses a dynamic pricing structure where changes in the heat price are influenced by changes in the underlying fuel prices and also the required investment that needs to be made in the heat network sector. The District Heating Act also stipulates that within district heating regions connection to the network is mandatory for all located in the region[59]. Furthermore, municipal governments within Finland, for example Tartu, mandated new and renovated buildings in district heating zones must be connected to a heat network.
Market ownership
The Estonian market has a high degree of private finance penetration as many heat networks are owned by private equity infrastructure funds. For example, Utilitas is the largest operator of heat networks in Estonia and is majority owned by an infrastructure fund. Similarly, recent transactions such as Gren acquiring Viljandi district heating company[60] and Partners Group acquiring a stake in the Finnish state-owned operator Fortum operating in Estonia demonstrate the attractiveness of a mature and developed heat network sector to private investors.
The role of state-owned infrastructure banks
In addition to the public financing levers noted in section 5.2, there are also state-owned infrastructure banks that can support the heat network sector. Table 7 provides a summary of the banks and their financing products. Examples relevant to heat networks are discussed below.
Table 7: State-owned infrastructure banks
Country
Name
Financing products
rUK
National Wealth Fund/ UK Infrastructure Bank (NWF/UKIB)
Public Sector Infrastructure loans £5m+
Low interest rate finance (lower than Public Works Loan Board)
Long maturities up to 50 years
Private sector products via Debt, Equity and Guarantees
The Netherlands
Bank Nederlandse Gemeenten (BNG)
Local authority and public sector loans
Bond issuance
Balance sheet financing
Project financing
Germany
KfW Development Bank
Project financings with maturities to match the investments
Corporate financings for investment measures
Structured financings tailored to individual situations
Guarantees
Derivatives to supplement the product range
Grant support
Finland, Sweden, Estonia
Nordic Investment Bank (NIB)
Project and structured financing
Debt financing of PPP projects
Long term loans 5-25 years
€20m+ ticket size
Source: EY analysis
Relevant Examples:
rUK: National Wealth Fund (NWF) was set up in2021 and allocated £27.8bn of capital to deploy from the UK Government. Heat networks are a key strategic pillar for the bank.
NWF explored a connection charge facility[61] to incentivise and fund connection to heat networks and give demand assurance. However, whilst the public sector like the facility to help develop a heat network with the cost of connection rolled into the capex facility, the private sector need clarity on who the risk and responsibility sits with (e.g. project co), and proof of concept to buy in.
NWF also look to provide project gap funding development expenditure and capital expenditure to make heat networks commercially viable for private sector investors. Similarly, the bank is considering early phase guarantees/loans to help crowd in private finance by bridging up front development risk and the early years of projects.
NWF has heat networks as a strategic investment pillar and has the capital available to deploy. However, from our stakeholder engagement sessions an additional barrier to deployment is that heat networks are not yet commercially viable enough to enable what NWF can offer.
Germany: KfW is the state-owned development bank with a commitment to sustainable infrastructure. The bank has recently introduced support for landlords, homeowners and municipalities to claim grant funding for connecting to existing heat networks or other renewable heating sources. The scheme supports those installing/gaining access to low carbon heating systems with up to 35% of investment costs.[62]
Nordics & Estonia: NIB was established as an intergovernmental bank between Denmark, Finland, Iceland, Norway and Sweden in 1975. Estonia, Latvia and Lithuania become members of the bank in 2005. The bank has approximately €8.4bn in authorised capital[63]. Whilst not a country in focus, NIB provided €18m loan to finance upgrades[64] to existing heat networks in Riga, Latvia in October 2024, demonstrating how infrastructure banks can support established heat networks.
Scotland: Scottish National Investment Bank (SNIB) has net zero as one of its key missions. The bank has identified there could be opportunities around decarbonising and expanding existing heat networks as well as financing new networks and connections[65]. The bank does not have any publications regarding bespoke financing solutions for heat networks yet. This presents the opportunity to shape heat network solutions by analysing the market looking at other international innovations.
Appendix C – Major UK regulators: a summary of objectives
Ofgem (The Office of Gas and Electricity Markets)
Ofgem are responsible for regulating the electricity and gas markets, implement measures that protect consumers and promote competition within the sector. Within the UK, there is a well-established group of entities who operate across the generation, transmission and distribution landscape. Generating firms provide the power, transmission networks transport the power and distribution networks move it into residential and commercial premises with electricity and gas retailers being the interface between the energy market and end consumers. The natural gas sector follows a similar delivery structure where gas is extracted, refined and piped into buildings for heating and energy generation (Ofgem, 2024).
Ofwat (The Water Services Regulation Authority)
Ofwat oversees the water and wastewater sector ensuring that water companies provide high quality services at fair prices to consumers whilst ensuring the security of long-term water supplies. Water utilities are responsible for treating and supplying clean water, as well as managing the collection and processing of wastewater. Entities provide these services under strict regulatory supervision to maintain public health and environmental standards. The waste management sector addresses the collection, treatment and disposal of waste, including recycling (Ofwat, 2024).
Ofcom (The Office of Communications)
Ofcom is responsible for regulating the broadcasting, telecommunications and postal industries through maintaining the integrity of communication services. Telecommunications serve a critical role in maintaining connectivity within an ever-increasing digital environment, providing phone services, mobile networks, internet access and the infrastructure that underpins them all (Ofcom, 2024).
ORR (The Office of Rail and Road)
The ORR is responsible for ensuring the safety, reliability and efficiency of the railways whilst protecting the interests of rail and road users. They supervise network operators, such as Network Rail, through licensing to ensure compliance with health and safety law as well as competition law whilst also enforcing economic regulation (ORR, 2024).
CAA (The Civil Aviation Authority)
The CAA maintains a high level of safety in the aviation industry whilst representing the interests of consumers and wider public. It regulates various aspects of airline operations and aircraft management whilst also enforcing economic regulation through controlling pricing at major UK airports to prevent the abuse of market power and ensuring fair charges for passengers and airlines (CAA, 2024).
Appendix D – Overview of utility comparators methodology
The different characteristics of utility sectors have been examined acknowledging the following key attributes associated with the development of heat networks:
A sector that is immature and in the early stages of its development and growth cycle within the UK
A sector that provides services direct to its customers (retail in nature) and therefore exposed to a degree of demand, payment and operational risks akin to more conventional services provided in the private sector
A sector that will be subject to incremental development of heat network infrastructure that will be dependent on accelerated connection of residential and commercial customers, ideally supported through zoning and policy in regard to the mandating such connections
A sector that must address the affordability challenge of decarbonisation, particularly the cost of transitioning from conventional fossil-based energy sources like gas boilers; noting also that air source heat pumps are increasingly used as the counterfactual cost benchmark when developing an economic case
The nature of the investment in heat networks, that involves significant upfront capital expenditure, requires funding that can be invested or repaid over extended time of 25 to 40 years, thus requiring investors and developers to take a long-term view of expected return on capital
A sector that has historically and for the foreseeable future (3 to 4 years) been supported by investment support from the Scottish and UK Governments
Initial analysis was undertaken which focussed on the maturities and similarities between various utility sectors and heat networks across 39 regulated utilities covering electricity, water, telecommunications, rail and air regulation against the criteria listed below, in Table 8. Based upon the preliminary analysis, 17 utilities were taken forward for further examination, which is discussed in Appendix K.
Table 8: Criteria for longlist analysis of maturity and similarity between utility sectors and heat networks
Long List Methodology
Area evaluated
Description
Maturity of Sector
This reflects the stage of development and stability of the sector within the utility industry as a whole:
A mature sector is well established with known and proven technologies and market structures, such as offshore wind electricity generation.
A developing sector, or one in its infancy, is characterised by emerging technologies, evolving regulatory frameworks and less certain market dynamics and funding solutions.
Similarities to heat network
This area examines the extent to which the utility sector shares similar characteristics to heat networks. It considers factors such as:
Whether recent infrastructure capital expenditure has occurred within the sector.
The type of environment the sector is within in terms of a natural monopoly or a competitive landscape.
Typical entities involved within the sector such as private or joint ventures.
Regulatory environment of the sector.
A shortlist was then derived in accordance with an assessment of the following criteria set out in Table 9.
Table 9: Assessment criteria for the shortlist
Short List Methodology
Area evaluated
Description
Investment Time Horizon
This indicates the anticipated timeframe one expects an investor to hold their investment to make an appropriate return on its investment. It can range from the short-term (a few years) to long-term (several decades) depending upon the useful and economic life of an asset, contractual arrangements, market conditions and funding solution.
Retail versus Wholesale Activity
This distinguishes between services that are provided direct to end consumers (retail) such as those in the water and sewerage sector and those activities that operate higher up in the supply chain within a wholesale market, such as electricity generation.
Stakeholders
This details the parties with an interest or influence over the sector including the customer base, user of assets base, owner of asset and who is subsidising the regulatory regime.
Investment Support
This refers to the mechanisms, incentives and financial environment and structure that exist to incentivize investment in the sector. It covers areas such as government grants/subsidies, regulatory frameworks like a RAB model alongside any market mechanisms such as Contracts for Difference (CfDs).
Areas of Regulatory / Financial Difference
This identifies some of the unique regulatory and financial characteristics of the sector in terms of market operations, investment models and compliance requirements.
Risk Profile
This evaluates the types and level of risk present within each sector. Whilst risk can be subjective and dependent on the risk appetite of the related party, it encompasses design, construction, operations, maintenance, revenue, availability and revenue risk (demand and bad debt).
Appendix E – Key characteristics of utility sectors evaluated
The table below summarises the key characteristics of each utility sector evaluated within Section 6.
Risk Profile
Sector
Investment time horizon
Heat networks
Further to achieving commercial operation of the heat network, there is material demand and revenue risk due to the uncertainty and timing of commercial and residential connections.
Operates essentially as a retail business whereby sales are direct to end customers and therefore subject to revenue risk (demand and bad debt risk).
Long term investment time horizon (between 20 and 40 years) due to large upfront capital expenditure, thin operating margins governed by the competitive pricing relative to the counterfactual of gas boilers and/or air source heat pumps.
Offshore wind
Once at commercial operations, projects are essentially at full operational capacity and connected to the national grid for energy distribution and as such no demand risk.
Some availability/revenue risk due to uncontrollable nature of wind.
Conventionally operates in the wholesale market (direct to grid).
Long term investment return of around 15 years commensurate with the term of a CfD due to significant upfront capital costs and competitive bid process for revenue pricing.
Household Water & Sewerage
Demand/revenue risk from users and price reviews by regulator respectively.
Large operating expenditure to meet quality assurance requirements.
In England and Wales, operates in the retail sector which inherently creates revenue risk, in particular, bad debt risk.
In Scotland, water is devolved with charges occurring alongside the council tax system.
Long term investment returns due to significant upfront capital costs, maintenance costs and price reviews for revenue pricing to ensure appropriate inter-generational cost recovery from customers in line with the useful and economic life of underlying assets (25 to 40 years).
CCUS
Currently a sector proposing to utilise unproven technology at scale, often referred to as a FOAK project (First of a Kind) and therefore subject to material design, construction and commissioning risk.
Once commercial operation is achieved, there is material demand and revenue risk due to the uncertainty and timing of connections.
Operates essentially as a retail business whereby sales are direct to end customers and therefore would be subject to revenue risk (demand and bad debt risk) without regulatory funding support mechanism until the sector matures.
Long term investment returns due to significant upfront capital costs, maintenance costs and pricing reviews to ensure an appropriate return on initial investment acknowledging the useful and economic life of underlying assets (20 to 40 years).
Sources: EY, Ofwat (2024)
Appendix F – Timeline of regulatory developments
The figure below represents a timeline of regulatory development across CCUS, offshore wind and household water & sewerage sectors.
CCUS
Offshore Wind
Household Water & Sewerage
Appendix G – Detailed overview of offshore wind sector
The below provides a detailed overview of offshore wind regulation within the UK alongside the regulatory structure and financing mechanisms within the sector.
Overview
Offshore wind electricity generation in the UK is a rapidly expanding sector which plays a pivotal role in the nation’s transition to renewable energy and the achievement of its climate change goals. The regulatory framework is overseen by Ofgem who ensure that the sector operates efficiently and contributes to the UK’s energy security since the early development of the sector, with regulation becoming more prominent following the significant expansion of the sector in the 2000s. Ofgem is aided by the Crown Estate and Crown Estate Scotland who own the seabed around the UK and are responsible for awarding leases to developers for offshore wind development.
Offshore wind farms are subject to a range of regulations, from environmental impact assessments to marine spatial planning, ensuring that developments are carried out responsibly. Ofgem’s regulatory activities encompass various aspects of offshore wind generation. These include connections to the national grid and ensuring that the market operates effectively to facilitate investment and main secure and sustainable electricity supplied.
Regulatory Structure
Following on from the Energy Act 2004, Ofgem has continued to regulate the sector and is adapting its approach and offering new support mechanisms as deployment continues to grow. Ofgem’s regulation of offshore wind is structured around several key elements designed to promote the development of the sector whilst ensuring efficiency, competition and the protection of consumers interests:
Licensing – generation licences are issued to offshore wind farm operators which set out the conditions operators must meet to legally generate electricity;
Support mechanisms – provide long term price/revenue stability and encourage investment in offshore wind through guaranteeing a fixed price for the electricity generated;
Grid connections and access – administrating the connections from offshore wind farms to the national grid through Offshore Transmission Owners (OFTOs) who own and operate the transmission assets;
Market oversight – monitoring of the market to prevent anti-competitive practices whilst also ensuring offshore electricity generation is integrated safely to aid in the security of electricity supply;
Financial incentives and penalties – through the RIIO (Revenue = Incentives + Innovation + Outputs) model, Ofgem sets price controls and performance incentives for offshore wind network entities;
Consumer protection – ensuring costs associated with offshore wind generation are reflected fairly on consumer bills, with the benefits of low carbon electricity generation passed on to consumers;
Innovation funding – innovation technologies and practices which reduce generation costs can be funded by Ofgem. The aim is to accelerate technological advancements, improving efficiency and reducing costs to support the transition to net-zero energy systems whilst ensuring best value for consumers. As part of RIIO-ED2, Ofgem extended their Strategic Innovation Fund to cover electricity distribution companies with £450m of funding across RIIO-ED2 alongside £68.4m of additional allowances for smaller scale innovation projects through the Network Innovation Allowances.
These structures collectively create a regulatory environment that supports the growth and investment in offshore wind development while managing costs and ensuring the electricity system remains reliable and sustainable.
Regulatory Financing Mechanisms
Offshore wind offers investors long term equity returns over a period of c.15 years commensurate with the term of a CfD. Offshore wind is characterised by large upfront capital expenditure, availability risk (wind), a competitive and volatile electricity market, all of which impacts the sector’s ability to secure much needed investment.
Offshore wind is not exposed to demand risk, given it operates on a wholesale basis. However, to aid in the mitigation of electricity price volatility, availability risk and premium over and above the wholesale price of electricity for the development of Offshore wind, Ofgem awards Contracts for Difference (CfDs) to provide long term stable and predictable revenue for offshore wind developers. The reduced revenue risk attributable to a CfD make Offshore wind attractive to investors resulting in optimised financing structures reducing the overall cost of capital.
CfDs represent an evolution in the Offshore wind sector from Renewable Obligation Certificates (ROCs) which were originally used as a support mechanism to promote investment in the sector. Further to CfDs offering stable and predictable revenue, continual development of offshore wind assets is promoted through government grants and incentives for innovation and infrastructure development.
Renewable Obligation Certificates
The ROCs framework was designed to promote investment across a number of different renewable energy technologies by providing a financial reward for renewable energy generation. It achieved this through the creation of a renewable energy certificate market whereby for each megawatt hour (MWh) of renewable electricity granted, generators would be eligible to claim ROCs.
These could then be traded on the open market to suppliers who did not meet ROC generation obligations imposed by Ofgem. If suppliers failed to present enough ROCs to meet their obligations, a buy-out fee would be imposed for the shortfall of ROCs. The buy-out fee was set by Ofgem and increased annually with inflation. The money collected by Ofgem from buy out fees was then redistributed to suppliers who had met their obligations to effectively incentivise renewable electricity generation.
ROCs were the main support mechanism for renewable energy before being gradually phased out and replaced by CfDs for new projects in 2013 with the aim of improving the regulatory regime. One of the reasons ROCs were phased out was due to the relatively primitive nature of the support mechanism whereby different technologies received varying amounts of ROCs per MWh produced in addition to the wholesale power price. In 2012, offshore wind typically received 2 ROCs per MWh compared to onshore wind which typically received 1 ROC per MWh.
The difference in ROC allocation by technology was arguably quite arbitrary and did not necessarily correlate with the underlying levelised cost of the technology. This potentially stifled the deployment of some technologies or encouraged the development of other sectors, resulting in windfall gains for developers
Contract for Difference
Offshore wind projects are eligible to participate in a competitive auction process to obtain a CfD. The auction determines the “Strike price”, which effectively equates to a fixed price per MWh of electricity that the project generates over a specified period (typically 15 years). The Strike Price is the price per MWh a developer considers necessary to make its applicable return on investment over the period of the CfD.
The Strike Price is different to the actual market price, known as the “Reference Price”, which is calculated based on the average market price per MWh over a given period. When the Reference Price is lower than the Strike Price, a top up payment of the difference in price is made by the Low Carbon Contracts Company (LCCC) to the offshore generator. Conversely, if the Reference Price is greater than the Strike Price, then the generator must pay the difference to LCCC.
By providing a guaranteed price for electricity, CfDs mitigate price volatility risk within the wholesale electricity market. This helps make offshore wind more attractive to investors and lenders as it reduces financial risk of the project whilst also incentivising generators to produce electricity efficiently and at lowest costs to maximise margins.
CfDs were originally introduced in 2013 whilst the sector was focussing on scaling but have enabled the sector to develop into a mature one. Recently, the CfD allocation round 6 has been completed. It included three new CfDs for offshore wind alongside seven offshore permitted reductions which allows projects previously awarded a CfD contract to withdraw up to 25% of their original capacity and apply to a future CfD round.
The balance in setting the correct Strike Price can prove difficult as demonstrated in allocation round 5 in 2023. Figure 11 highlights that there were no successful CfDs awarded for offshore wind in allocation round 5. This was a result of no bids being submitted by developers for offshore wind, which could have been due to the administrative Strike Price set by UK Government of £44/MWh. This Strike Price remained unchanged from allocation round 4 which made offshore wind developments economically unfeasible due to impacts of inflation on development costs.
Figure 11: Total renewable energy awarded during CfD allocation rounds
Government Grants & Incentives
Government grants and incentives are critical tools used to promote the development, operation and maintenance of offshore wind assets. Government grants can help to reduce the upfront capital required for the development of offshore wind farms including research, design and construction helping to mitigate some of the financial risks that developers face. The UK Government, often through Ofgem or other bodies such as Innovate UK, provide this funding and includes grants for innovation in turbine design, foundation structure, grid integration and operations alongside maintenance practices.
In addition to 21 GW of wind farms benefiting from CfDs through to allocation round 6, another example of government funding is the Strategic Innovation Fund (SIF). This aims to help transform gas and electricity networks for a low-carbon future. It provides funds to projects that could speed up the transition to net zero at the lowest cost to the consumer. After launching in 2021, Ofgem expects to invest £450m by 2028 through partnering with Innovate UK to deliver the programme. Innovate UK offers multiple innovation funding such as the Net Zero Living Pathfinder Places. Oldham Council has secured funding from this to develop an Oldham Green New Deal Delivery Partnership, focussing on delivering the £5.6bn of low carbon infrastructure Oldham needs to achieve Net Zero.
Appendix H – Detailed overview of household water & sewerage sector
The below provides a detailed overview of household water & sewerage undertakers within the UK alongside the regulatory structure and financing mechanisms within the sector.
Overview
Household water & sewerage undertakers within the UK are a well-established utility sector which provides residential and commercial customers essential water supply and wastewater services. The sector encompasses the entire process of sourcing, treating and delivering water to households and businesses alongside the collection, treatment and disposal of wastewater and sewage. The household water and sewerage sector within England and Wales is typically characterised by a natural monopoly due to the inefficiencies of having multiple sets of water and sewerage infrastructure competing in the same geographic area.
As a result, the sector is subject to economic regulation which, within England and Wales, is regulated by Ofwat to ensure the provision of high-quality water alongside reliable water and wastewater services at fair prices for consumers. The two main issues Ofwat regulation aims to address are service quality and tariff prices. Service quality is less important than in other sectors like electricity. Ofwat oversees the performance of water companies, enforces compliance with environmental standards and ensures that the sector remains financially viable.
Regulatory Structure
The regulatory structure for household water and sewerage companies within England and Wales has evolved over time to adapt to changing priorities in the sector, such as the need for increased investment in infrastructure, improving customer service and addressing environmental concerns. Some of the key changes in the regulatory structure include:
Introduction of competition – whilst the water industry in England and Wales has been privatised since 1989, there has been a gradual move to introducing competition within the household water sector to drive efficiency and innovation.
Periodic price reviews – Ofwat has moved towards conducting periodic price reviews (such as ‘PR19’ or ‘PR24’) typically every 5 years to set price limits and service targets for water companies. These reviews establish the framework within which water companies must operate and balance the need for investment in infrastructure with the protection of consumer interests.
Performance commitments – Ofwat has introduced performance commitments and outcome delivery incentives (ODIs) to ensure water companies focus on delivering outcomes relevant to their customers.
Resilience and sustainability – regulatory changes increasingly emphasise the importance of long-term resilience and environmental sustainability through encouraging water companies to invest in approaches that mitigate the risk of drought, flooding and other long term climate related challenges.
Customer engagement – a greater emphasis is now placed on customer engagement within the regulatory process with water companies required to consult with customers and consider their preferences in the development of their business plan.
Innovation funding – Ofwat has introduced mechanisms to fund innovation within the sector to encourage water companies to develop and adopt new technologies and practices.
These changes reflect a broader shift towards a more outcome based regulatory regime which encourages water companies to be customer orientated, efficient and forward thinking with their operations and investments. The regulatory framework is designed to incentivise water companies to invest in their networks, improve resilience, reduce leakage and maintain high standards of water quality and environmental stewardship.
Regulatory Financing Mechanisms
Within England and Wales, the water & sewerage sector is predicated on a long-term investment time horizon whereby balance sheets are supported by the capital markets in the form of debt (including bond finance) and shareholder equity. Typically, water utilities seek an investment grade credit rating in order to secure the most competitive form of lending within a highly optimised financial structure, most notably gearing. Regulation by Ofwat in England and Wales provides a stable financial environment for investors, whereby the monopolistic nature of the customer base for each utility provides a reliable level of demand assurance, albeit in a retail market that does result in an element of revenue risk from bad debt.
Ofwat uses various financial levers to encourage initial investment in water infrastructure whilst also encouraging water companies to invest in their infrastructure and services. These financial levers are primarily through a Regulated Asset Base (RAB) model, as well as through the existence of price reviews to adapt to market conditions and innovation funding. Key risks that are borne by utilities in the water sector is that of managing capital programmes, maintenance and operational costs. These risks will be similar in nature to those of the heat network sector.
Regulated Asset Base (RAB)
A RAB model provides a structured approach to regulating the prices that water companies can charge alongside ensuring they maintain and improve the infrastructure, whilst delivering high quality services to customers. The RAB represents the value of a water company’s capital assets, such as pipes and treatment plants and is calculated based on historical investment costs, depreciation and new qualifying capital expenditure. The general value of the RAB can be expressed as:
However, for previously privatised UK network infrastructure sectors such as water, the RAB is generally lower than the current replacement cost of the net book value as when privatised, the assets were sold at a substantial discount to the replacement cost. Within the water industry, the current replacement costs of the assets in 2010 prices are greater than £200bn but the privatisation proceeds were just £10.3bn in 2010 prices. This difference is a combination of the privatisation discount and the capital investment net of depreciation undertaken since privatisation. As such, for UK infrastructure industries privatised after 1980, such as water, the RAB value is further defined as:
Ofwat then uses the RAB value to derive the allowed revenue requirement, which is used to ultimately set prices for consumers, to cover the costs of operations, maintenance as well as providing a fair return on the capital investment on the RAB. This is done through the regulator setting a Weighted Average Cost of Capital (WACC)% which is then applied to the RAB value to calculate the total amount of allowed revenues each company can charge to its consumers. This process, albeit simplified and not considering inflation, is expressed as:
The RAB model inherently encourages water companies to invest efficiently in their assets as a company retains some of the savings as profit if it can deliver the required services at a lower cost than the allowed revenue. Furthermore, since depreciation is active in the RAB, unless ongoing capital expenditure is made, the allowed revenue dwindles. This incentivises water companies to continually invest in their infrastructure, with these investments eventually being included in the Regulated Asset Value (RAV) and therefore in future revenue streams (Frontier Economics, 2010). The RAB model works particularly well within the water sector due to the limited number of operators within the sector (11 regional water and wastewater companies in England and Wales) meaning the time and cost requirements of administrating this regime is manageable.
Price reviews
The price reviews performed by Ofwat determine the revenue that water companies can earn from customers, usually lasting for a 5-year period. Price reviews adopt a total expenditure approach, considering both capital expenditure and operational expenditure when setting price controls. Price reviews promote the development of new assets by providing a framework for recovering the costs of the investment over a period of time. This in turn encourages companies to undertake necessary large scale capex projects.
Furthermore, the price review process also includes performance incentives, through ODIs which reward companies for meeting or exceeding targets set by Ofwat. Conversely if targets are not met, water companies are penalised for underperformance. This system helps align the company’s financial interests with the delivery of high-quality utility services.
Every 5 years each utility must submit an Asset Management Plans (AMP) to the regulator Ofwat. Ofwat will then use the AMP to set price increases and review the quality of services provided which take the form of Key Performance Indicators (KPIs).
The latest AMP is AMP8 for the period 2025 to 2030. AMP 8 will have a greater focus on climate change & emissions reduction challenges, improving water quality, reducing leakage and ensuring reliable water supply and wastewater services. Ofwat has highlighted a strong desire to find new and innovative funding solutions to meet the significant investment in infrastructure required to achieve these goals. An example of this is the Direct Procurement for Customers programme (DPC) which involves the utilities competitively tendering services in relation to the delivery of large new water and wastewater assets. It is envisaged the projects will be similar in nature to Design, Build, Finance and Operate (DBFO) whereby the chosen Competitively Appointed Provider (CAP) will be paid essentially a service fee for a period of between 25 and 30 years.
Innovation funding
Innovation funding impacts the financial environment by providing the means and incentive for water companies to invest in the future. It supports an approach to asset management and service delivery which is proactive in nature. Although there are many external innovation funds available to water companies, Ofwat has established their own Ofwat Innovation Fund. The aim of this £200m fund is to encourage collaborative initiatives and partnerships within the water sector to tackle the larger challenges the sector faces such as climate change, leakage and affordability. Most recently, 17 projects have been awarded funding in the fourth round of the Water Breakthrough Challenge (‘Breakthrough 4’), sharing in approximately £40m towards solutions that will bring benefits to water customers, society and the environment. One example of this is the award of £1.6m to Pipebot Patrol. This aims to develop an autonomous sewer robot which constantly inspects sewers, raising alerts to the precise location of blockages as they begin to form. This proactive approach allows maintenance teams enough time to respond before sewer flooding occurs, potentially contaminating the environment.
Although Ofwat regulates the water sector in England and Wales, due to the privatisation of the sector combined with regulatory models used, profits made by companies can be either distributed to shareholders or reinvested in infrastructure. If too great an emphasis is placed on the former, issues can arise in under-investment in infrastructure, impacting the long-term viability of the sector. Thames Water, England’s largest water company, over the years has significantly borrowed debt totalling over £15 billion under the RAB model, creating about 80% leverage in the company. This has allowed owners of Thames Water to take billions of pounds out the company as loans or dividends within the last 5 years, including over £200m in dividends to other group entities. However, the debt servicing requirements, alongside the need for infrastructure investment to meet efficiency targets, has led to Thames Water requesting Ofwat to allow water bills to rise by 40% by 2030. Ofwat has however rejected these proposals and has currently suggested a rise of 23% as part of its 2024 price review and suggests further capital injection from shareholders to develop infrastructure and service debt payments. As such, without careful regulation throughout the years, potential mismanagement of utilities can arise leading to price increases for consumers.
Scotland has mitigated these specific risks through the water services being publicly owned and operated by Scottish Water who remains accountable to the Scottish Government and its customers. This helps to ensure profits are reinvested in the infrastructure rather than distributed to shareholders.
Water Regulation Within Scotland
Scottish Water remains economically regulated by the Water Industry Commission for Scotland (WICS) which ensures Scottish Water delivers value for money whilst achieving efficiency targets. Regulation ensures that public funds are used efficiently with no profit motive influencing decisions. The social focus of WICS places an emphasis on affordability and maintaining public ownership which is aligned with Scottish Government policies. Furthermore, since Scottish Water is the sole provider of water within Scotland, regulation can be simplified as it benefits from economies of scale.
WICS is governed by the Water Industry (Scotland) Act 2002, as amended by the Water Services etc (Scotland) Act 2005 and the Water Resources (Scotland) Act 2013. WICS is an Executive Non-Departmental Public Body whose principle statutory functions are to:
Determine charge caps and, in so doing, promote the interests of customers of Scottish Water both in terms of quality of services and the charges that have to be paid;
Monitor Scottish Water’s performance, encouraging efficiency and sustainability;
Facilitate (in a manner not detrimental to Scottish Water’s core functions) the entry of retail water and sewerage providers that want to supply non-household customers in Scotland;
Support the Scottish Government’s vision of ensuring that Scotland is a Hydro Nation and meet their obligations under the Water Resources Act 2013.
Water charges are set by WICS and remain relatively stable as profits are reinvested. The domestic charges are linked to council tax bands, with prices increasing as bands increase, and historically were calculated based off a version of the RAB model. However, since the price review in 2010, WICS have moved away from the RAB based model and instead moved towards looking at business requirements as the basis in setting prices during price reviews.
Price Reviews
Similar to Ofwat in England and Wales, WICS performs Strategic Reviews of Charges to set price limits for the next regulatory period (usually every 6 years). The Strategic Reviews of Charges is initially based upon Scottish Water’s long term business plan which encompasses short- and long-term infrastructure investment requirements, debt repayments and operating costs. As part of this business plan, Scottish Water also works with the Customer Forum to ensure that customer views influence the business plan and pricing requests. WICS subsequently evaluate the business plan, with a focus on Debt Service Cover Ratio (DSCR), alongside multiple other factors including inflation, investment needs and operational efficiency to determine annual price caps for customers. These may be adjusted annually within the limits set by WICS to account for inflation or other changes.
Alongside setting price caps, WICS will also set efficiency targets for each period based upon what it deems Scottish Water should be able to achieve. Although a proxy RAB continues to exist to act as an internal comparator to England and Wales water sector, this customer focussed business plan helps to align Scottish Water with Scotland Government objectives.
Although WICS exercises these functions independently of the Scottish Ministers, whose power to direct WICS, is confined to matters relating to the WICS financial management and administration, ministers can potentially influence agreed charges to customers. If agreed charges are lower than Scottish Water’s requirement, the cash surplus may be insufficient to meet required investment and maintenance programmes. This in turn could impact the long-term lifecycle maintenance and development of new assets meaning the extension of useful economic lives of existing assets is required. There is a risk that, despite it being a public body, if agreed charges are continually lower than what Scottish Water deems as necessary, the integrity of the network in the future is compromised.
If a cash shortfall is present for infrastructure expansion or maintenance of assets, public borrowing could provide the required capital for required expansion or maintenance of assets.
Government Grants and Incentives
Scottish Water receives loans or grants from the Scottish Government to finance large capital expenditure projects such as upgrading treatment plants, replacing aging pipes and building flood defences. This aids in reducing the reliance upon customer charges to fund these large capital expenditure projects helping to ensure affordability for households and businesses. This could provide an advantage over private companies as government-backed loans typically offer more favourable terms than private market financing resulting in further cost savings being passed onto consumers. However, this funding route depends upon the impact this borrowing would have upon Scottish Government balance sheet. This impact could mean funding is not granted for infrastructure development and maintenance projects and instead a short-term increase in customer prices would have to be required. As such, any borrowing is carefully managed to ensure long term financial sustainability for both Scottish Water and Scottish Government.
Appendix I – Detailed overview of CCUS sector
The below provides a detailed overview of CCUS within the UK alongside the regulatory structure and financing mechanisms within the sector.
Overview
CCUS is an emerging sector within the UK and is expected to play a crucial role in the UK achieving its net zero emissions target by 2050. The UK Government has recognised the importance of CCUS in reducing carbon emissions from industrial processes and power generation and as such is actively developing a regulatory framework to support the deployment of CCUS related projects.
This framework aims to ensure that CCUS projects are financially viable, environmentally effective and financially resilient to market uptake. The regulatory environment is shaped by multiple pieces of legislation including the Energy Act and the Infrastructure Act which establish the legal basis for CCUS operations and the regulatory role of bodies like Ofgem, the Oil and Gas Authority and Department for Energy Security and Net Zero.
Regulatory Structure
The CCUS sector is in its infancy within the UK and as such projects are unlikely to be at full operating capacity at the point the facilities are commissioned, in terms of emitter uptake. As such, any proposed regulatory structures will need to take into account:
Financial incentives: Providing financial incentives to encourage investment in CCUS technology and making it cost effective;
Economic regulation: To provide stable and predictable revenue streams for CCUS infrastructure investments;
Licensing: Licensing and permits for CCUS operations including the capture, transport and storage of carbon;
Safety Standards: Safety and environmental standards to protect public health and the environment;
Liability Frameworks: Liability and risk management frameworks given the first of a kind nature of CCUS;
Market Development: Facilitating the development of markets for carbon utilisation and promoting innovation in CCUS technologies; and
Infrastructure Planning: Planning and developing the necessary infrastructure for carbon transport and storage, including considering shared access and usage to maximise efficiency and reduce costs.
The proposed regulatory structure will need to enable the growth of the CCUS sector whilst ensuring it contributes effectively to net zero goals. It is anticipated that the regulatory framework is likely to evolve as technology and risks develop. Current regulatory proposals to encourage initial investment, development and maintenance of assets include having a RAB based model with revenue support.
Regulatory Financing Mechanisms
Regulated Asset Base
Similar to the RAB model used within the water and sewerage sector, it is proposed that the entities that will develop, own and operate the transport and storage infrastructure (T&SCo) will have a regulatory RAB model as the basis to provide long term reliable revenues to service the initial upfront expenditure and ongoing operating costs.
The process for establishing the amount of allowed revenue is derived in the same way as that used in other RAB models, such as that used in water and sewerage. The difference between the RAB model in water and sewerage sector when compared to CCUS is that the allowed revenue and qualifying operating and capital expenditure, will initially be administered by DESNZ prior to Ofgem fulfilling this regulatory role a short period after commercial operations date. RAB based models require significant resources requirements and time to administer. However, on the basis there is not anticipated to be a large number of T&SCo projects, a RAB based model is deemed an appropriate and effective mechanism to provide an attractive financial proposition (environment) to attract investment from the private sector in a cost-efficient manner.
Revenue Support Agreement
As uptake of CCUS technology is uncertain due to the maturity of the market there is a significant risk associated with T&SCos being able to generate sufficient allowed revenue under the RAB model based upon number of emitters committed to CCUS on day one. As such, the regulatory structure, at least until the market is more mature and developed, includes a revenue support agreement which acts in a similar manner as CfDs in other sectors such as offshore wind. LCCC is the proposed counterparty to the revenue support agreement responsible for paying T&SCo any shortfall in actual revenue generated when compared to the allowed revenue forecast as per the RAB model. This support mechanism helps to address demand risk as the sector develops.
The CCUS regulatory framework helps to address risks associated with a First of a Kind (“FOAK”) project through the amalgamation of previous regulatory support mechanisms. Although the current mechanism is likely to evolve as the sector matures, it currently encourages investment within the CCUS sector through providing long term and predictable revenue for equity investors which is supported through a contract with LCCC. Furthermore, it is predicted continual maintenance of assets will occur due to the RAB model and increasing allowed revenue to enable a return on maintenance expenditure. This helps to encourage the adequacy of the level of net revenue alongside the visibility of sufficient value of future similar projects. However, this amalgamation of support mechanisms is not yet practically tested and remains in development until construction beings on large CCUS projects.
Appendix J – Possible implications of regulatory regimes
Regulatory Support Mechanism
Possible impact within heat networks
CfDs
Competitive allocation of subsidy support could help to reduce the overall levels of subsidy required.
Helps to develop the market through smaller scale investors’ input, before large scale investors are involved as the sector develops and uncertainties reduce.
Demand risk heat networks are exposed to would still be present as unlike sectors for which CfDs are actively present, heat networks are not at full capacity from commercial operations.
CfDs more suited to competitive environments as opposed to natural monopolies.
Provides long term stable and predictable revenue for a specified period of time.
Counterparty for heat networks would need to be agreed.
Adequacy of the level of net revenue could be achieved through the competitive CfD process helping to promote investment in the sector.
Visibility of sufficient value of future similar projects could be achieved through governments ambition of renewable energy and the availability of implementation into networks.
RAB & Periodic Price Reviews
Could encourage investment within heat networks sector through competition for licencing rights with a set pricing mechanism.
Could help mitigate demand and revenue risk for projects of large enough size.
Provide long term stable and predictable returns whilst potentially mitigating revenue risk and demand risk if underpinned through a revenue support mechanism.
A minimum MWh requirement could be introduced to reduce administrative burden through limiting qualifying project numbers.
Potential district heat networks could be added to existing RAB network business subject to legal power and regulatory alignment.
Adequacy of the level of net revenue could be achieved through the RAB regime which allows for recovery of the notional cost of debt and equity alongside performance incentives helping to promote investment in the sector.
Visibility of sufficient value of future similar projects could be achieved through price controls for each RAB network.
Grants
Could encourage investment within heat networks through subsidising the upfront capital expenditure to aid in commercial operations.
Long term stable and predictable revenue alongside the adequacy of the level of net revenue would likely be dependent upon the company managing demand and revenue risk unless further regulatory support mechanisms are put in place.
Visibility of sufficient value of future similar projects could help to be addressed through the continuation of government grants and aims for renewable energy generation.
Grants could be used to prioritise the development of specific projects which could have the greatest impact in meeting net zero aims.
RHI type Incentive
Could provide long term stable revenue alongside the adequacy of level of net revenue through the aid of tariff payments.
Grants and incentives could be used concurrently with tariff payments to provide subsidy for upfront capital costs.
Visibility of sufficient value of future similar projects could be achieved through the incentive programme especially when coupled with grants and government net zero aims.
Appendix K – Regulatory regime overview
The table below includes analysis performed over regulatory regimes and serves as a basis in selecting comparators for heat networks. The analysis includes typical characteristics of the regulatory sector, timeframe of returns, stakeholders typically involved, key differences in the sector alongside the risk profile of each sector.
The table can be accessed by downloading the report as a PDF (see top of page).
How to cite this publication:
Thomson, N., Davidson, H., Smallman, J. (2025) ‘Funding and financing heat networks in Scotland’, ClimateXChange. DOI: http://dx.doi.org/10.7488/era/5740
While every effort is made to ensure the information in this report is accurate, no legal responsibility is accepted for any errors, omissions or misleading statements. The views expressed represent those of the author(s), and do not necessarily represent those of the host institutions or funders.
This work was supported by the Rural and Environment Science and Analytical Services Division of the Scottish Government (CoE – CXC).
ClimateXChange Edinburgh Climate Change Institute High School Yards Edinburgh EH1 1LZ +44 (0) 131 651 4783
Heat networks are often driven by non-domestic pricing arrangements. Green levies on non-domestic bills represent a smaller proportion of the total costs but are still a driver of higher electricity prices. ↑
DESNZ (BEIS) “International review of heat network frameworks” (2020) ↑
CXC “Lessons from European regulation and practice for Scottish district heating regulation” (2018) ↑
Euroheat & Power “DHC Market Outlook 2024” (2024), CXC “Lessons from European regulation and practice for Scottish district heating regulation” 2018, Ministry of Economic Affairs and Communications “Possibilities of efficiency in heating and cooling in Estonia” (2016) ↑
CXC “Lessons from European regulation and practice for Scottish district heating regulation” (2018) ↑
Salite et al (2024) “A comparative analysis of policies and strategies supporting district heating expansion and decarbonisation in Denmark, Sweden, the Netherlands and the United Kingdom – Lessons for slow adopters of district heating” ↑
The buildings sector in Scotland accounted for approximately 20% (8.6 MtCO2e) of the country’s greenhouse gas emissions (GHG) in 2020. To help meet Scotland’s climate change emission reduction targets measures to decarbonise heating and deployment of energy efficiency measures will be required. The Scottish Government has consulted on proposals for a Heat in Buildings Bill, setting out how Scotland plans to use its regulatory and policy levers to incentivise deployment of clean heating technologies and energy efficiency measures. The proposals would enforce minimum energy efficiency standards for Scottish homes and, after 2045, prohibit the use of polluting heating systems.
This study investigates potential impacts of the Bill on the housing market, through a literature review, interviews with stakeholders and a qualitative assessment. We considered potential impacts on a range of metrics, including property and rental prices, length of time properties spend on the market, the number of properties sold or privately let, geographical or archetypical distributional effects and the impact on the mortgage market. We assessed the following four different scenarios against a policy-free baseline:
Heat in Building Bill (S1-A): assumes the implementation of all proposals consulted on to form a Heat in Buildings Bill, which sets minimum energy efficiency standards for owner-occupiers and private landlords by the end of 2033 and 2028 respectively and prohibits polluting heating systems after 2045. It also assumes inclusion of the proposed early action trigger points including a requirement that properties replace polluting heating systems within a grace period of two years from the point of purchase, and that properties within a Heat Network Zone end their use of polluting heating systems by a certain date and with a minimum notice period.
Heat in Building Bill with a five-year grace period (S1-B): assumes the same regulatory measures as in S1-A, but includes a longer, five-year grace period following both early action trigger points.
No-trigger points (S2): assumes the same regulatory measures as in S1-A, but with the removal of early action trigger points.
First-time buyers’ exemption (S3): assumes the same backstop dates and early action trigger points as in S1-A, but with an exemption for first-time buyers from compliance with early action trigger points.
Findings
While the Heat in Buildings Bill scenario ensures earlier compliance with the regulation, it may also result in a slowdown in activity of the Scottish housing market.
In the rental market, tenants are likely to bear some of the upfront costs of energy efficiency retrofits in the form of higher rents. Following the introduction of the proposed Bill, landlords may decide to exit the market if they do not want to comply with the regulations.
Extending the grace periods to five years is not expected to affect compliance rates, compared to a two-year grace period. However, it could delay clean heating installation timings, as homeowners often defer action until the deadline.
If there were no early-action trigger points, compliance with the regulatory framework may be postponed, leading to delayed action in achieving emissions savings. This could result in a significant increase in demand for energy-efficient homes specifically around the backstop dates, potentially causing a shortage of energy efficient properties.
The market slowdown where an exemption for first-time buyers is introduced is relatively modest compared to the Heat in Buildings Bill scenario where there are no exemptions.
Policy implications
The potential introduction of heating decarbonisation and energy efficiency regulation could decrease purchasing activity in the Scottish housing market, particularly in the Heat in Building Bill scenario (S1-A). Deferring or setting varied deadlines for vulnerable segments of the market (i.e., first-time buyers, low-income households, small-scale private landlords etc.) could partially mitigate this downturn.
Additionally, extending the grace periods could partially mitigate the adverse market effects induced by the proposed early action trigger points.
Pairing the regulatory framework with targeted financial support programmes could help lessen these impacts, particularly where they are designed to safeguard vulnerable individuals and help ensure they are able to adhere to the regulations.
First-time buyers might still encounter difficulties with the additional costs required to meet minimum energy efficiency standards when purchasing properties that are not energy efficient. Extending the deadlines for first-time buyers to meet energy efficiency standards, even when they are exempt from trigger points, could be explored as an option. Additionally, integrating these exemptions with support from help-to-buy schemes could maximise market activity.
Glossary
Backstop date
Backstop dates in the context of Scottish consultation on proposals for a Heat in Buildings Bill are proposed deadlines before whichowners of properties are obliged to undertake any work required to meet the Heat in Buildings Standard.
Clean heating system
Clean heating systems do not produce emissions directly when used. The most common types include heat pumps, solar PVs and district heating.
Early action trigger point
Early action trigger points in the context of the Scottish Consultation on proposals for a Heat in Buildings Bill are obligations placed (a) on purchasers of properties to undertake any work required to meet the clean heating element of the proposed Heat in Buildings Standard after the purchase, within a reasonable timeframe, the so-called ‘grace period’ and (b) on homeowners to join a heat network or install an alternative clean heating system after a notice period when a heat network is available.
EPC rating
The Energy Performance Certificate (EPC) rating is a standardised, qualitative assessment of a building’s energy efficiency. It typically ranges from A (most efficient) to G (less efficient).
Green mortgage
In this report the term refers to loans intended to finance the purchase energy efficient properties and/or the installation of clean heating systems, as well as to finance energy efficiency retrofits and upgrading to a cleaner heating system. These mortgages often come with incentives such as lower interest rates, cashbacks or additional borrowing capacity to fund eco-friendly upgrades. The market for green mortgages has been growing rapidly in the UK, having grown from 4 such products in 2019 to over 60 in 2024, nevertheless there continue to exist cheaper non-green mortgages available in the UK that may be perceived as more attractive options.
Green premium/Brown discount
In this report green premium and brown discount refer to the price difference between comparable energy efficient (equivalent to EPC band A-C) and energy inefficient properties (equivalent to EPC band D-G), and the price difference between comparable clean heating system and polluting heating system properties.
Homeowner
Someone who owns a property. This includes both owner-occupiers and landlords.
Owner-occupier
Someone who has purchased the home that they live in.
Polluting heating system
Polluting heating systems produce emissions directly when used. These include technologies such as oil and gas boilers.
Introduction
Background
Through the Climate Change Act 2019, Scotland has committed to reach net zero greenhouse gas (GHG) emissions by 2045, across all sectors of the economy.
The buildings sector in Scotland accounts for approximately 20% of the country’s total GHG emissions (Scottish Government, 2024a), hence representing a major source of emissions. GHG emissions in the residential sector are caused mostly by polluting heating systems, such as gas and oil boilers, which produce emissions when used to heat buildings or produce hot water. Decarbonising the residential building stock by 2045 is therefore key to reducing Scotland’s contribution to climate change and achieving net zero targets.[1] However, the current installation rate of clean heating systems falls short of what is needed for Scotland to reach net zero. Taking no action to accelerate the transition to clean heating technologies is expected to lead to missing the 2045 net zero target.
In this context, effective regulation is expected to accelerate actions towards achieving desired climate and energy efficiency goals, by encouraging property owners to carry out necessary improvements to decarbonise homes. In November 2023, the Scottish Government published a consultation on proposals to make new laws around the energy efficiency of residential buildings and how they are heated (Scottish Government, 2023a). The proposals include homes across Scotland being required to meet a new Heat in Buildings Standard, encompassing both a minimum energy efficiency standard and a prohibition on the use of polluting heating systems. Specifically, the Consultation on proposals for a Heat in Buildings Bill includes the following proposals:
Use of polluting heating systems to be prohibited after 2045.
An early action trigger point to ease the transition to 2045, whereby those purchasing a home are required to end use of polluting heating systems within a grace period of 2-5 years following completion of the sale.
A further trigger point requiring properties within a Heat Network Zone to end use of polluting heating systems (by a certain date, and with a minimum notice period).
A minimum energy efficiency standard to be met by owner-occupiers by the end of 2033 and by the end of 2028 for private landlords.
Objectives of this study
This study aims to investigate the potential impacts of the Consultation proposals for a Heat in Buildings Bill on the Scottish housing market with a particular focus on the following key indicators:
Sales and rental prices;
Length of time properties spend on the market;
Number of properties sold or privately let;
Geographical or archetypical distributional effects;
Impacts on the mortgage market, particularly focusing on changes in supply and demand for green mortgages.
Specifically, it explores the implications for the housing market associated with four different scenarios of potential regulatory measures. These include the introduction of heating and energy efficiency regulations at proposed backstop dates and trigger points (S1-A), extension of the grace period for trigger points (S1-B), removal of point of purchase trigger points from regulatory proposals (S2), and potential exemptions for first-time buyers from trigger points (S3).
Data limitations hinder quantitative assessment, so the study included a systematic desk-based review to capture a wide body of evidence, followed by stakeholder engagement and an extensive qualitative assessment. These were used to infer potential housing market implications associated with the introduction of heat and energy efficiency regulatory measures. We consulted with a wide range of housing market actors, including Scottish Property Federation, Property Mark, Scottish Association of Landlords, Charted Institute of Housing, ESPC, Zoopla, Rightmove, Rettie, RICS, UK Finance, Lloyds Banking Group, Nationwide, and Savills (see Section 8.1).
A review of linkages between heating and energy efficiency regulations and the housing market
This section presents the evidence on the linkages between heating and energy efficiency regulations and the housing market. We carried out a literature review, examining both academic and grey literature sources to inform our work[2]. The key findings of this research are presented below. However, a more detailed summary of the literature review can be found in Section 8.3.
The literature review focused on the impact of domestic energy efficiency on house sale and rental prices and other elements of housing market dynamics, more specifically on whether and to what extent heating and energy efficiency regulations affect the housing market. We considered several different housing market impacts, including price premiums or discounts, and the time it takes to sell or let a property depending on its energy efficiency and the type of heating system (i.e., clean or polluting). The variation in these indicators was considered based on geography and property archetypes. Additionally, we carried out research on the potential impact of different grace period lengths on the housing market and on homeowners’ behaviours.
Only a very limited number of studies were found to assess the impact of the installation of clean heating systems on property prices. Also, the number of homes sold and the number of properties available for short-term let were found to be largely understudied in the reviewed literature. While we found no evidence of the impact of energy efficiency and the installation of heating systems on the Scottish housing market specifically, there is a body of relevant academic and grey literature that contains important findings:
Energy efficiency matters when purchasing or renting a home. Properties are sold or let at a higher price if they are more energy efficient. However, the green premium and brown discount (see Glossary) are less pronounced in the rental market than in the sales market. Also, it is difficult to decouple the green premium and brown discount from other property characteristics (i.e., style, quality, newness, decoration).
Limited information is available on the price impact of installing clean heating systems. While clean heating systems tend to increase property prices, studies have assessed this impact in climatic and market conditions that differ from Scotland. Some factors can significantly influence the existence and magnitude of green premiums and brown discounts. These include the region, climate conditions, urban-rural differences, local property prices and dwelling archetypes.
Longer grace periods associated with clean heating system installation trigger points reduce the perceived costs of installation.
There is a convincing business case for green mortgages and green retrofit mortgages, yet market availability in Scotland is currently quite low.
How different heating and energy efficiency regulation scenarios could affect the Scottish housing market
In order to assess the impact of different policy options for heating and energy efficiency regulations, we developed a policy-free baseline, which assumes that no proposed policies consulted in the Heat in Buildings Bill are introduced. Four regulatory scenarios were considered:
Heat in Buildings Bill scenario (S1-A), assuming all proposals included in the consultation on a Heat in Buildings Bill are implemented.
Heat in Buildings Bill scenario with a longer grace period for the proposed early action trigger points (S1-B).
Heat in Buildings Bill scenario with the removal of the proposed early action trigger points (S2).
Heat in Buildings Bill scenario with first-time buyer exemption from proposed early action trigger points (S3).
These are illustrated in Figure 1 and assessed in detail in the following sections.
We conducted a qualitative scenario analysis to compare each regulatory scenario against the policy-free scenario. The assessment draws upon important findings from the literature review (discussed in Section 4 and further explored in Section 8.3) with further insights from the stakeholder consultation process (see Section 8.1). The qualitative assessment reveals the relationship between different proposed regulatory measures and their expected impacts (e.g., the direction of the impact and potential consequences), but does not quantify them due to the scope of the research and limitations around data availability. As the scenarios differ only in their policy assumptions and assume the same evolution of other factors, only the impact of the policy is assessed.
We use the terms “(green) premium” and “(brown) discount” to refer to the price difference between comparable energy efficient (equivalent to EPC band A-C) and energy inefficient properties (equivalent to EPC band D-G), and the price difference between comparable clean heating system and polluting heating system properties (see Glossary).
Figure 1: Summary of regulatory scenarios considered in this study
Notes: The Heat in Buildings Bill scenario (S1-A) assumes the implementation of the proposals outlined in the Scottish Government’s consultation on a Heat in Buildings Bill. Trigger points refer to early actions requiring (a) property purchasers to install a clean heating system within a grace period after purchasing a property (property purchase trigger point) and (b) homeowners to join a heat network or install an alternative clean heating system after a notice period when a heat network is available.
Policy-free baseline
The policy-free baseline has been designed to capture the key underlying trends against which the other scenarios are compared.
Our policy-free baseline assumes that no further Scottish or UK-wide policies are introduced up to 2045 to regulate the installation of clean heating or energy efficiency in the residential buildings sector. However, this does not imply that decarbonisation of the residential building stock will stop. Several market drivers and behavioural changes are expected to continue driving energy efficiency and clean heating uptake without policy intervention. These drivers refer to regulations already in force, including changes to Building Regulations which require that all new build properties meet strict energy efficiency requirements from 2023, and the New Build Heat Standard (NBHS) which prohibits the installation of polluting heating systems in new buildings applying for a building warrant from 1 April 2024[3] (Scottish Government, 2024b). Drivers also include increasing climate awareness, greater awareness of the comfort enjoyed in energy efficient buildings and the expected reduction in the installation costs of clean heating systems.
Other key drivers including electricity and gas prices or general macroeconomic conditions (e.g., GDP growth rate, inflation) also affect the decarbonisation rate of domestic buildings. However, it was not within the scope of this project to make assumptions about the future evolution of these drivers.
Heat in Buildings Bill (S1-A)
The Heat in Buildings Bill scenario (hereafter S1-A) includes the proposed policies in the consultation on a Heat in Buildings Bill (hereafter: policies) (Scottish Government, 2023a), and assumes that all proposals as consulted on are introduced. It includes the following measures:
All domestic buildings achieve a minimum energy efficiency standard, which is broadly equivalent to EPC band C, before the end of 2033 for owner-occupied homes and before the end of 2028 for privately let properties.
Polluting heating systems are phased out by 2045, with trigger points ahead of this date in the following circumstances:
Point of purchase trigger point: all sold dwellings must end the use of any polluting heating systems within 2 years of purchase[4].
Heat network zones trigger point: properties within a Heat Network Zone end their use of polluting heating systems with a 3-year specified notice period[5].
This section first describes the expected impact of this scenario on the property market (for owner occupiers), followed by the rental market. Finally, the intra-market effects between the property and rental market are discussed.
Owner-occupied homes
The expected impacts of the policies are illustrated in Figure 8 (see Section 0) which separates owner-occupied homes into two categories: homes which do not meet the requirements of the policies (referred to as energy-inefficient properties, with EPC rating of D to G, without clean heating systems); and energy-efficient homes with an EPC rating of A-C (with or without a clean heating system)[6]. While several housing market impacts are described in this section, an in-depth analysis about the price premium of installing energy-efficiency retrofits and clean heating systems is included in Section 5.6.
The proposed property purchase trigger point, which requires clean heating systems to be installed within a set grace period following the purchase of a property (assumed to be 2 years in this scenario), is expected to place an additional financial burden on purchasers. This may substantially influence the decisions of individuals considering moving, as they will face an additional cost when moving to a new property without a clean heating system installed. The proposed property purchase trigger point affects both individuals living in energy-inefficient and energy-efficient homes. However, the proposed regulation is likely to particularly impact owner-occupiers currently living in energy-efficient properties. These owner-occupiers are not required to retrofit their homes under the proposed policies, which may result in them being discouraged from moving elsewhere (however, they are still required to install a clean heating system by 2045). A study by Zalejska-Jonsson (2014) indicates that people living in green properties are less likely to move to a non-green property[7]. As a result, the regulation could result in a reduction of the number of energy-efficient homes put up for sale.
Alternatively, trigger points may shift the demand towards properties where clean heating systems are already installed. Therefore, the prices of properties that have already had a clean heating system installed are expected to rise, reflecting the costs of installation in the property’s value[8],[9].
As a result, future homebuyers are likely to postpone or abandon their plans for moving, leading to a lower number of properties sold in the market. In other words, by raising the overall cost of moving for all potential buyers, early action trigger points may behave akin to a tax on a house purchase, reducing the number of transactions. As the housing market slows down, the time properties take to sell is also expected to increase. The housing market impacts of trigger points can be likened to the UK Stamp Duty Land Tax, which the literature deems to be an excessively distortive tax (Scanlon et al., 2021), causing market slowdown and ensuing housing inefficiencies (people do not move as expected when there is a change in their living circumstances, e.g., when children move away).
From a policy point of view, when people move from an energy-inefficient home to a new property, they face three options:
Moving to an energy-efficient property with clean heating system. When people move from an energy-inefficient property to an energy-efficient home with a clean heating system, they will not be required to carry out any further retrofitting after moving in. As a result, energy-efficient properties with a clean heating system can become more attractive when people are looking to buy. Retrofitting a home (either due to energy efficiency backstop dates or the property purchase trigger point) involves additional financial and non-financial costs. These include the time and effort spent making arrangements with professionals to carry out the retrofitting and installation works, as well as the general disruption the work causes. In fact, backstop dates in general may incentivise some people to move to an energy-efficient home with a clean heating system instead of retrofitting their own property to avoid these non-monetary burdens[10]. As a result, backstop dates may increase the number of homes sold [11]. Theoretically, regulation may also lead to a shift in the demand from houses to flats as they are typically more energy efficient than other building archetypes[12]. Some stakeholders could also imagine a shift towards different archetypes. However, they emphasised the high uncertainty behind this and the fact that energy efficiency is not a key driver when people buy (or rent) a property. Therefore, the proposed policies are expected to have only a marginal impact on demand for different building archetypes. As a result of the regulation, more people are expected to search for an energy-efficient property with a clean heating system when considering moving. This may lead to an increased demand for energy-efficient properties, while the supply of energy-inefficient properties may also increase. Ultimately, this may lead to greater brown discounts for energy-inefficient properties or properties without a clean heating system. Over time, however, energy-efficient properties with clean heating systems are expected to represent a higher proportion of the residential building stock due to the policies. This may lead to greater supply of these properties[13], counterbalancing the increased demand to some extent. For more discussion of the evolution of the price premium due to energy efficiency and clean heating system see Section 5.6.
Moving to an energy efficient property without a clean heating system. People moving into these types of properties are required to install a clean heating system within a defined grace period. This purchase trigger point will place both financial (i.e., the cost of installing a clean heating system) and non-financial (i.e., finding the optimal solution) costs on purchasers. This can lead to a higher brown discount for properties without a clean heating system. Purchasers comparing similar homes with or without a clean heating system may demand a discount for properties with a polluting heating system. This is because they are required to install a clean heating system within 2 years of the purchase, which is in addition to the purchase price.
Moving to an energy inefficient property without clean heating system. Moving to an energy-inefficient property without a clean heating system will activate the purchase trigger point and requires the owner to install a clean heating system within the grace period and meet energy efficiency requirements by the backstop date[14]. However, people are likely to factor in the upfront costs of retrofitting as an additional burden on the top of the purchase price. This is particularly important close to the energy efficiency backstop date. Higher additional costs due to the energy inefficiency of the property could lead to a harder negotiation when purchasing these kinds of properties, since people depreciate the value of the property to some extent. As a result, the brown discount could increase. This is broadly consistent with one of the key findings of the stakeholder interviews highlighting that closer to the backstop dates, fewer people will be willing to move to an energy-inefficient property, resulting in the brown discount increasing over time (see Section 8.1).
When people decide not to move, they will not be affected by the proposed property purchase trigger points and will only have to meet the policy requirements by the backstop dates. Others, who would not move anyway, will also be unaffected by the purchase trigger point but required to meet requirements by backstop dates.
However, properties that are not sold or purchased between the introduction of the regulations and 2045 may be affected by the proposed heat network zones trigger point and are still required to comply with the minimum energy efficiency standards by the end of 2033. If the owner of a property is notified (e.g. by the local government) that a heat network is available for connection, they need to stop using a polluting heating system within a specified period of time, such as 2 or 3 years. It is proposed that owner-occupiers would have a choice of either joining the heat network or installing alternative clean heating solutions within the same grace period. While this trigger point is important in accelerating the decarbonisation of the residential building stock, it is challenging to assess its impact. The First National Assessment of Potential Heat Network Zones study (Scottish Government, 2022) assessed the potential geographical areas for heat networks based on different criteria, but no decision has been made on the final area. Some stakeholders also mentioned that there is uncertainty about the extent of heat network zones. They also reported that current and potential future homeowners have a poor understanding and awareness of heat network technology and its potential zones. Therefore, in this study we assume that homeowners do not consider a heat network as an opportunity when looking for a new property or as a potential future cost if they decide not to move from their current home. This assumption significantly diminishes the potential housing market impacts of the heat network zones trigger point, but it may still affect it to some extent.
Due to the uncertainty around the future extension of the heat network zones, the heat network zone trigger point may interact with the housing market in three cases:
People may decide to purchase a property without a clean heating system installed in an area where connection to the heat network is not possible at the time of purchase. In this case, they will be required to install a clean heating system within the grace period, and they are likely to negotiate the price similarly to any other property without a clean heating system. If the heat network becomes available for connection within the grace period, the purchasers can decide to join it (or install a different type of clean heating system), but this is not expected to have an impact on the housing market as it was not known at the time of purchase. It is important to note that the proposed policies do not require a home located in a future heat network zone to join it if that home already has a clean heating system installed.
Alternatively, people may decide to move into a home which is located in an announced heat network zone but has not joined it. In this case, purchasers are free to install the most appropriate clean heating system option, such as joining the heat network or installing a different type of clean heating system[15]. If connecting to the heat network is cheaper than installing another type of clean heating system, the seller and the purchaser may agree on a higher price compared to a similar home not located in a heat network zone: the purchaser could offer a higher price because of the expected lower financial burden of connecting to a heat network.
For owner-occupiers who have not moved since the policy was introduced, the heat network trigger point could accelerate the phase-out of polluting heating systems. Notified owner-occupiers are required to connect to the heat network or install a clean heating system within a grace period which could be earlier than the backstop date. This requirement could increase the supply of homes with clean heating systems. However, most heat network zones won’t be available for connection until after 2035. Most owner-occupiers would therefore be phasing out their polluting heating system (due to the backstop dates) when most heat network connections become available (around 2040). The overall impacts of the heat network trigger point for existing owner-occupied homes are therefore likely to be minimal.
The proposed policies are also expected to increase the demand for green mortgages. The increase is expected due to the additional burden of covering the upfront costs of retrofitting (due to the trigger points or backstop dates). When people cannot fully finance the retrofit, they may apply for a loan[16]. If the supply of green mortgages is sufficient and the product is competitively priced, it is expected that the regulation could lead to the growth of the green mortgage market. Stakeholders involved in green mortgages also expect an increase in the total value of green mortgages over time.
One caveat is that, without further measures, the policies included in this scenario can have a disproportionally high cost on people in lower income groups. Due to their lower incomes, they are less likely to be able to afford the upfront costs of retrofitting and to get a green mortgage at a competitive price. In addition, the increase in the brown discount could have a negative impact on them as they may need to sell their homes at a lower price if they want to move.
Rental market
The proposed policies in the consultation on a Heat in Buildings Bill (hereafter: policies) also require private landlords to carry out energy efficiency retrofits (equivalent to EPC band C) before the end of 2028 and to install a clean heating system by 2045. The property purchase trigger would also be required to be met by landlords wishing to enter the market or expand their portfolio.
Three main factors can drive the impacts on the private rental market as a result of the policies, which are illustrated in Figure 9 (see Section 0):
Retrofitting due to the policies. The policies require landlords to retrofit their properties. A key issue is whether and to what extent landlords and tenants bear the upfront costs (in the form of higher rents). Stakeholders reported that there is a significant housing shortage in the Scottish rental market, particularly in larger cities. Therefore, an increase in rents is expected to have a low impact on the demand for rented properties. In other words, renters would have little or no opportunity to move to another property if they do not want to or cannot afford to pay a higher rent. This implies that tenants are expected to bear the costs of retrofitting, at least to some extent, in the form of higher rents. It is important to note that at the time of writing there were temporary modifications in place to the way in which applications for a review of a rent increase are determined by Rent Service Scotland, which limit rental increases to some extent where a review is sought. These measures are intended to support the transition away from the rent cap under the Cost of Living (Tenant Protection) (Scotland) Act 2022 which ended on the 31 March 2024. (Scottish Government, 2024c). Also, due to the shortage of rental properties, landlords may not be concerned about losing their tenants while carrying out refurbishments (i.e., tenants need to bear some non-financial costs, such as the general disruption installation work causes)[17],[18] as they expect new tenants to move into the property following completion of the works.
Exiting the market. Landlords who do not want to carry out or cannot afford the cost of retrofitting have the option of selling their properties. Stakeholders agreed that this option may be considered by many. According to interviewed representatives in the Scottish rental market, many landlords plan to reduce the size of their portfolios, as a result of market interventions during the pandemic and the energy crisis[19]. The heat and energy efficiency regulation might lead to a similar effect, particularly if the housing shortage in the sales market is taken into account (i.e., a high price in the property market can be achieved). According to a recent Rightmove report (2023), 33% of all landlords in Great Britain who own a property with an EPC rating below C would choose to sell rather than retrofit. If some landlords do decide to leave the rental market, this could exacerbate the rental housing shortage and lead to higher rental prices.
New dwellings can enter the market. Properties which meet the requirements of the policies may enter the rental market. These are likely to be new builds or already retrofitted homes which were owner-occupied or unoccupied prior to entering the rental market[20]. High rental prices can create an incentive (among other considerations[21]) for new landlords to enter the market and for the landlords already holding buy-to-let properties to expand their portfolio. As a result, these properties can reduce the shortage in the rental market (increase the supply) and, therefore, reduce rental prices.
Interactions between the sales and rental market
The policies proposed in the consultation on a Heat in Buildings Bill (hereafter: policies) are expected to have an impact on the number of homes sold and let. There are two main interacting impacts, partly outlined already in Sections 5.2.1 and in 5.2.2 and depicted in Figure 11 (Section 0):
Landlords may sell their properties due to the implementation of the regulation. This can have a negative impact on the rental market since it can reduce the supply of properties for letting and, therefore, rents may increase. Conversely, these properties can appear on the sales market. They therefore can increase the supply of properties for sale and may reduce sales prices.
New buy-to-let properties may enter the rental market. Properties that meet the policy requirements are more likely to enter the rental market, particularly when local rental prices are high. In this case, they can increase the supply in the rental market and, therefore, rent prices may be reduced. Conversely, these properties would not enter the sales market (e.g., new builds would not be sold for owner-occupation but used as buy-to-let properties). This can lead to a reduction in the housing supply and therefore can lead to higher sales prices.
The number of propertieson the rental and sales markets is not affected by decisions made by owner-occupiers and landlords to retrofit their homes (while retrofitting is likely to affect the rental prices and/or the value of the property).
In conclusion, the rental and sales markets are strongly linked to each other. Policy-induced actions (e.g., exit or entry to the rental market) can have a converse effect on the other market (e.g., increase or decrease in the number of homes sold). However, determining the relative magnitude of these impacts is challenging and therefore the overall impact on the rental and housing market cannot be concluded at this point.
Heat in Buildings Bill with 5-year grace period (S1-B)
The Heat in Buildings Bill with 5-year grace period (hereafter: S1-B) includes the same policies as the S1-A scenario, but the grace periods for the property purchase and heat network trigger points are set to 5 years (compared to 2 and 3 years, respectively) (see Figure 1). The reason for exploring S1-B is to consider the impact of a longer grace period for both early action trigger points on the housing market. For this reason, the outcomes of S1-B are compared against the outcomes of S1-A, and not against a policy-free baseline.
While key housing market impacts of the S1-B scenario are presented below, a more in-depth analysis about the price impact of installing energy-efficiency retrofits and clean heating systems are included in Section 5.6.
Sales market
We based findings from the literature presented in Section 8.3, which draws heavily on the findings of behavioural economics, and on the stakeholder interviews (see Section 8.1). Implications of a longer grace period for the heat network zone trigger point are discussed later in this section. Three key housing market drivers in the sales market associated with a longer grace period of the proposed property purchase trigger points have been identified (see also Figure 10 in Section 0).
Lower average cost per year. In the case of a longer grace period, the average cost per year of installing a clean heating system (the salient cost of compliance) is lower compared to a 2-year grace period (in the case of the purchase trigger point) as owner occupiers are expected to spread out the perceived costs over the longer 5-year period. This may result in a lower perceived financial burden for purchasers. In addition, some homeowners may expect further innovation in clean heating solutions (in particular a reduction in price) in future, which may lead to lower real cost of installation.
More time to plan and install the optimal solution. A longer grace period allows people to better plan their finances. Stakeholders agreed that a two-year grace period may rush people into decisions, and they may not properly consider their options in this period. This could lead them to install a clean heating system which is more expensive or less efficient than another solution.
Poorer understanding and/or appreciation of future costs and opportunities. Based on the findings of behavioural economics, supported by the views of stakeholders, it is realistic to assume that a longer grace period may lead to a poorer understanding of costs. This means, for example, that purchasers are more likely to see the installation of a clean heating system as a future problem. Purchasers would be more biased about how much the installation would cost and would have less incentive to track these future costs. This contrasts with the previous point, i.e., that people would plan more carefully if the grace period were longer. Instead of rational planning, many people may rush to install a clean heating system at the end of the grace period. Stakeholders mentioned that most purchasers are often unaware of the available clean heating system solutions and their financial and non-financial costs. Also, the type of the heating system in a property is not the primary focus of the purchasers and they may not be aware of or realistically consider the requirements of the policy.
These three drivers all lead to a lower perceived cost of installing a clean heating system in a newly purchased home and to a lower perceived value of an installed clean heating system. As a result, a longer grace period may reduce the green premium for properties with a clean heating system installed compared to a shorter grace period from the proposed property purchase trigger point. In addition, the purchase of a new home can be perceived to be relatively cheaper in the case of a longer grace period, compared to S1-A, due to the lower average cost per year and to the lower perception of future costs. Therefore, more properties are expected to be sold when the grace period is longer. In other words, the 2-year grace period for the property purchase trigger point can be a stronger disincentive to move than a 5-year grace period, as highlighted by stakeholders when interviewed[22].
It is also important to note that a 5-year grace period can make it more likely that people move into a different property before the end of the grace period. As highlighted by the interviewed stakeholders, this is especially the case for first-time buyers, who are the most likely to move multiple times in a shorter period of time compared to others, due better financial circumstances or a growing family. Those individuals who purchased a property after the introduction of the policy and are required to install a clean heating system within the grace period are more likely to resell their property prior to the installation of a clean heating system at the end of the grace period. This can lead to less intense negotiation when they buy a property without a clean heating system: they may consider moving again in a 5-year period, so they would not fully assess the cost of installing a clean heating system[23]. This can result in a smaller brown discount (i.e., a smaller difference in price between similar homes with and without a clean heating system). However, stakeholders mentioned that owner-occupiers are more likely to use this opportunity than landlords. This is due to the relatively high tax on purchase (which significantly diminishes the return on the property investment in the short term) and the general view that landlords purchase properties as a form of long-term investment.
The S1-B scenario also includes a longer grace period for the proposedheat network trigger point (i.e., 5 years compared to 3 years in the S1-A scenario). However, the extension of this grace period is expected to have little impact on the housing market under the assumption made in Section 5.2. As people are not aware of the future geographic extent of the heat network and the potential time when connection will be available, they cannot consider the potential costs and benefits of connection. This uncertainty is independent of the length of the grace period. However, when a home is purchased in an area where the connection to the heat network is possible, but not yet carried out, the purchasers have a longer period to comply with the regulation. Similar to the property purchase trigger point, this longer grace period can lead to a lower average cost per year, more time to plan and a poorer understanding of the benefits of connecting to the heat network[24]. This may result in a lower green premium for these homes compared to the S1-A scenario. As a key finding, the overall impact of the 5-year grace period on the heat network trigger point may lead to a smaller green premium compared to a 3-year grace period.
Rental market
The length of the grace period does not directly affect most rental market participants. Landlords who already own a property at the time of the introduction of the policy and those landlords who decide to leave the rental market (for any reason) are not affected by the property purchase trigger point and are therefore not affected by the length of the grace period (see Figure 12 in Section 0). However, a clean heating system needs to be installed by 2045.
The length of the grace period could affect the potential for new entrants to the rental market and therefore can have a direct impact on the supply of homes let. Potential new landlords (or landlords expanding their portfolio) considering buying a property to let, would face similar market drivers to owner-occupiers. These could include, in a case of a longer grace period, more time for financial and non-financial planning[25]; finding the optimal clean heating system without rushing to install one and a poorer understanding and lower perception of actual costs. In addition, some landlords may delay the installation due the expectation of lower future costs, driven by innovation (price reduction) or, if they manage a portfolio, through learning-by-doing effects (i.e., they can gain experience in installing a clean heating system in one property and apply it later in another property). As a result, a 5-year grace period could reduce the disincentive for landlords to purchase a property compared to a 2-year grace period, resulting in a relatively higher supply of rental properties. However, most stakeholders highlighted that the property purchase trigger point is likely to discourage landlords from entering the market in the first place, irrespective of the length of the grace period.
The aforementioned housing market impacts can also affect rental prices. Stakeholders agreed that most purchasers do not perceive a value in having a clean heating system installed in their rental property, and therefore landlords cannot fully pass on the cost to the tenants through higher rents (although there will of course be value-driven tenants in some cases). In other words, when comparing two similar properties with and without a clean heating system, landlords cannot fully differentiate through rents based on the type of clean heating system installed. However, the type of local housing market is also relevant here: if it is supply-driven (there is a shortage of rental properties), landlords have more power to pass on the upfront costs to the tenants in the form of higher rents. Conversely, in a demand-driven local market, where tenants have more power and choice, less differentiation in rents is possible. Ultimately, this means that in a supply-driven housing market, landlords can pass on the upfront cost of installing a clean heating system to the tenants, which can be higher if the grace period is shorter. Alternatively, a 5-year grace period may reduce the disincentive for new landlords to enter the market, resulting in a relatively higher supply of rental properties, ultimately leading to reduced rental prices.
No-trigger points (S2)
The ‘No-trigger points’ scenario (hereafter: S2) includes the same policies as the S1-A scenario but excludes both early action trigger points (see Figure 1). While key housing market impacts of the S2 scenario are presented below, a more in-depth analysis about the price impact of installing energy-efficiency retrofits and clean heating systems are included in Section 5.6. Figure 13 in Section 0 illustrates the main changes in the S2 scenario.
As discussed in Section 5.2, early action trigger points can raise the total cost of moving. This could be through the cost of installing a clean heating system where it had not been installed yet, or through the costs being included in the price where the installation had already been carried out. In the S2 scenario, this increase in costs is not present, so the sales market is not expected to slow down, and the time it takes to sell a property on the market is also expected to remain unaffected.
As buying and selling properties does not trigger any further actions from the buyers’ side, the main question owners of energy inefficient homes face is how they want to meet the energy efficiency requirements before the end of 2033 and later the clean heating system requirement by 2045. The closer in time a given backstop date is, the more it is expected to matter to buyers. Since the backstop date for clean heating systems is likely perceived to be far into the future, initially only a small fraction of buyers may take this into consideration and with a relatively small weight compared to a policy-free baseline. However, as the backstop dates approach, a growing fraction of market players could account for them, and the ensuing market dynamics impact everyone who participates in the housing market or is considering participation.
Owner-occupiers of energy-inefficient homes without a clean heating system face the choice of carrying out the retrofitting works and/or installing a clean heating system in their own homes, but they also have the option to move to another home in which the required works have already been carried out. This latter option can be attractive as not only have the financial costs of retrofitting been covered, but owner-occupiers can also avoid the non-financial costs associated with retrofitting (such as the time and effort spent on searching for and arranging professionals to carry out the installation, and the stress and disruption the work can cause). If owner-occupiers choose to move, the demand for energy-efficient homes with clean heating system and the supply for energy-inefficient homes can increase, while the demand for energy-inefficient homes would tend to decrease. This would bring about an increased brown discount. Although the backstop dates only directly concern owner-occupiers of energy inefficient properties, owners of energy-efficient properties moving for other reasons might also be increasingly inclined to look for energy-efficient properties. This could reinforce the increase of the brown discount.
If owner-occupiers choose to stay and carry out energy efficiency retrofitting in their homes as the relevant 2033 backstop date approaches, it is arguable that there are efficiencies to exploit if they also decide to install a clean heating system. Should they not do so, by the end of 2045 they will have to undergo further work to replace their heating system with a clean technology or move to a home with a clean heating system.
First-time buyer exemption (S3)
The final scenario (hereafter: S3) includes the same policies and trigger points as the S1-A scenario, but with an exemption from the property purchase trigger point for first-time buyers. In other words, first-time buyers would not need to replace polluting heating systems within the grace period (assumed to be 2 years in this scenario)[26]. Figure 14 in Section 0 illustrates the main changes in the S3 scenario.
Since the removal of help-to-buy schemes, first-time buyers cease to be financially supported by the government in buying a property. As their relative purchasing power is likely to be lower compared to those that have already owned a home, potential first-time buyers either have to remain in their current living arrangements (on the rental market or with family) or settle for more affordable, likely energy-inefficient properties (without a clean heating system).
Especially in the early years of the policy, a first-time buyer exemption from the proposed property purchase trigger point is similar to the 2017 Stamp Duty Land Tax First-time Buyers’ Relief in England and Northern Ireland. This amounted to a reduction of up to £10,000 of overall costs of moving. A report published by the UK Government (2023) suggests that the relief resulted in an 11% and 18% increase in transactions over and above the volume of the transactions of first-time buyers that would have taken place in absence of the policy for the two relevant discrete mortgage value bands studied. Although first-time buyers are subject to the clean heating system backstop date of 2045, the exemption from the proposed property purchase trigger point is likely to enhance their purchasing power in the housing market compared to S1-A and S1-B scenarios. It follows that exempting first-time buyers from the trigger point could make homes with a polluting heating systems more attractive to first-time buyers as it postpones the burden of having to upgrade to a clean heating system. Moreover, the brown discount for polluting heating system homes could still be present on the market, as the additional cost of the heating system upgrade would still remain for the majority of buyers. As a consequence, properties with polluting heating systems could be cheaper on the market. However, as first-time buyers are only obliged to install a clean heating system by the backstop date (the end of 2045), they do not bear the cost of installing a clean heating system in the near future. As a result, they would face a lower effective price for properties without a clean heating system. Although the costs of installation are expected to continue to affect first-time buyers in the long run, they could receive some short-term financial relief from their liquidity limitations.
Property price premium associated with energy efficiency and clean heating systems
In this section, the price premium associated with energy efficiency retrofitting and the installation of clean heating systems is analysed in greater detail.
Property price premium associated with installing a clean heating system
The expected property price premium associated with installing a clean heating system over time by scenario is visualised in Figure 2 below. Figure 2 is illustrative only, as no quantitative assessment has been carried out to estimate values. The blue line in the chart shows the main trend in the evolution of the price premium. The shaded area represents the degree of uncertainty: the larger the area is in a given year, the greater the expected uncertainty.
Stakeholders interviewed agree that there is currently no price premium for properties with clean heating systems in the Scottish housing market (see Section 8.1). This is due to several factors, including the fact that clean heating technologies are not yet widely used in Scotland, which leads to a lack of understanding about and confidence in these technologies. The most valued heating system is gas central heating as it is perceived to be easy to use and households are familiar with it. For these reasons, the price premium in Figure 2 starts at zero in all scenarios.
In the policy-freebaseline, we expect a slow increase in the price premium for properties with clean heating systems. The main drivers include the expected decrease in installation costs due to forthcoming innovation, increased supply of trained installers and the lower running cost due to the greater efficiency of clean heating systems (subject to the relative price of electricity to gas at any point in time). Additionally, the increasing climate consciousness and the increased confidence in new technologies (due to higher installation rates and awareness) could contribute to a slowly increasing price premium. These are supported by a study carried out in Finland, where heat pumps are already widely understood and used. Vimpari (2023) reported a significant price premium for homes with ground-source heat pumps compared to other heating technologies in Finland[27]. Also, properties with an air-source heat pump tend to have a higher price premium in those US regions where climate consciousness is higher (Shen et al., 2021).
In S1-A and S1-B, there are two main drivers of the premium:
Time effect: As the backstop date of the prohibition on polluting heating systems (2045) approaches, more people are expected to realise that they need to comply with the clean heating regulations. As shown earlier, this could lead to harder negotiations on price for properties without clean heating systems and higher demand for properties where they are already installed. As a result, the premium for properties with clean heating systems may increase over time.
Impact of trigger points: If the proposed property purchase trigger point is introduced, buyers are required to retrofit their heating system within a proposed grace period after a house purchase. However, close to the introduction of this proposed regulation, only a limited number of properties are expected to be equipped with clean heating systems. Those people who want to avoid retrofitting their home after moving will likely need to pay a higher premium for these homes as the supply is constrained. However, in time, the number of homes with clean heating systems will increase (e.g., due to the trigger points and due to the New Build Heat Standard (Scottish Government, 2024b) enforcing the installation of clean heating systems in new builds from 1 April 2024). This could lead to a jump in the green premium at the introduction of the policies, but it is expected to decrease over time.
The effects of time and trigger points are expected to work in the opposite direction over the regulatory period (i.e., from the introduction of the proposed regulations to 2045). This could lead to a ‘U’ shape over time, as visualised in Figure 2 below. However, it is important to note that there is a high degree of uncertainty in the magnitude of the different impacts. This uncertainty is particularly pronounced in the case of the impact of the trigger points (introduced in the second point above) as the housing shortage on the property market is a key driver. In addition, while buyers do consider the heating technology when purchasing a property, many stakeholders emphasised that other factors, such as characteristics of the neighbourhood, property archetype, size, etc. can be more important to buyers.
In S2, only time has an impact on the price premium. Therefore, a constant increase is expected in the price premium. As people become aware of the approaching backstop dates, the installation of clean heating systems cannot be postponed any longer. This is why the shaded area below the main trend in Figure 2 is shrinking: a relatively higher premium is expected for properties with clean heating systems, with less uncertainty. It is also important to note that the installation rate of clean heating systems (see Figure 4 in Section 8.2) is also a key driver of the premium. If only a limited number of properties have clean heating systems installed, and the backstop date for the prohibition on polluting heating systems is close (2045), potential purchasers are likely to pay more for a property with a clean heating system – otherwise, they will have to install it themselves. In S2, we expect the installation rate of clean heating systems to be relatively lower than S1-A due to the lack of trigger points resulting in the majority of installations taking place around the backstop date. This may inflate the price of properties with a clean heating system, as their supply is expected to be limited.
Finally, in S3, we expect the price premium to be a mix of the S1-A and S2 scenarios. This means that we expect first-time buyers to behave as in the S2 scenario, i.e. to postpone the installation of clean heating systems to some extent. Other buyers would (and are required to) behave similarly as in the S1-A scenario. As first-time buyers represent around 25% of the market (calculated from Scottish Government, 2023c and Bank of Scotland, 2024), the premium is expected to be closer to the premium observed in the S1-A scenario.
Figure 2: Price premium of properties with a clean heating system over time in all scenarios, compared to properties without a clean heating system.
Note: Price premium on the y-axis refers to the premium compared to the value of the property; blue line and shaded area indicate the mean estimate of the price premium, and the degree of uncertainty around it. The figures are illustrative only, as no quantitative assessment has been carried out to estimate their values.
Property price premiums associated with energy efficiency
In the case of the energy efficiency price premium, there are no differences between the S1-A&B, S2 and S3 scenarios (there are no relevant trigger points for energy efficiency, and the backstop dates are universal). As a result, these three scenarios are referred to in this section as the ‘Heat in Buildings Bill scenarios’ (S1-S3).
In the case of the policy-free baseline scenario, we expect a constant, and relatively low price premium for more energy-efficient homes. This is supported by the majority of academic sources and some of the stakeholders we consulted. However, many stakeholders were in disagreement that there is currently a green premium in the Scottish housing market (e.g., due to the housing shortage or because levels of energy efficiency are less important to buyers and renters). The lower band of the shaded area of Figure 3 is therefore zero[28]. Stakeholders also reported that energy efficiency (usually measured by EPC rating) is a good proxy for the quality of a property (e.g., having a high quality interior). It is therefore difficult, if not impossible, to disentangle the price impact of energy efficiency from the impact of quality.
In the case of the S1-S3 scenarios, the proposed backstop dates to achieve a minimum energy efficiency standard (i.e., before the end of 2028 for rented homes and before the end of 2033 for owner-occupied homes) can drive an increase in the price premium for energy-efficient homes. Investors of buy-to-let properties could have a higher interest in energy-efficient dwellings as they will have to install energy-efficiency retrofits before the end of 2028. Therefore, they would include these costs when investing in an energy-inefficient property.
However, as the majority (62%) of the residential building stock is owner-occupied (Scottish Government, 2023a), a steeper increase is expected close to 2033. Stakeholders mainly agreed that the proposed regulatory policy will create a green premium in future, even if they do not think that a green premium currently exists. However, the size of the potential price premium is uncertain, and stakeholders rather reported a discount for energy inefficient properties. This is explained by the fact that fewer people are expected to be willing to move into an energy-inefficient property as the backstop dates approach.
Additionally, we expect the price premium to decrease after the backstop dates. Some properties in the owner-occupied market are expected to remain energy inefficient (e.g. some people will not be able to afford to retrofit their home and may have been considered as temporarily exempt from the regulations). However, these properties will slowly be taken off the market (e.g., sold or retrofitted after the backstop date) and only a very limited number of them could remain. As the majority of homes are expected to meet the minimum energy efficiency standards, the price premium is expected to fall sharply after 2033. A few years after the policy comes into force, it is expected that there could be no price premium on the market as most homes will comply with the policy requirements[29],[30].
Figure : Price premium of energy efficiency over time in different scenarios, compared to properties which does not meet minimum energy efficiency standards.
Note: Price premium on the y-axis refers to the premium compared to the value of the property; blue line and shaded area indicate the mean estimate of the price premium, and the degree of uncertainty around it. The figures are illustrative only, as no quantitative assessment has been carried out to estimate their values.
Key takeaways
We created four scenarios to be compared against a policy-free baseline to analyse the potential housing market impacts of the proposed regulations in the consultation on a Heat in Buildings Bill. The main findings are as follows:
In the sales market, an increase in the brown discount for energy-inefficient homes without a clean heating system is expected as the energy efficiency and clean heating backstop dates approach under the Heat in Buildings Bill scenario. The proposed property purchase trigger point may lead to a jump in the green premium after the introduction of the proposed regulation. A longer grace period for trigger points is expected to lead to a smaller difference in the price of similar homes with and without a clean heating system. Without trigger points, a steadily increasing premium is expected, which is ultimately higher than in the Heat in Buildings Bill scenario.
In the rental market, tenants are likely to bear some of the upfront costs of energy efficiency retrofits in the form of higher rents (particularly in supply-driven local rental markets). Some landlords may decide to exit the market to avoid complying with the regulations. This would lead to further housing shortages and higher rents. However, high rental prices could also incentivise investors to enter the rental market, mainly purchasing new builds and already retrofitted properties, leading to an increase in the supply of rental properties and subsequently lower rents. A longer grace period for early action trigger points may be less of a disincentive to enter the rental market and increase supply compared to a scenario with shorter grace period. However, according to the interviewed stakeholders, the proposed minimum energy efficiency standard requirement and the proposed property purchase trigger point can be a significant disincentive for landlords to enter the market and an incentive to exit. The overall effect on the rental market depends on the strength of each impact.
The time properties take to sell is increased by the introduction of the proposed property purchase trigger point, as the increase in the overall costs of moving slows the market down.
We found that several factors may affect the number of homes sold as a result of the proposed policies. On the one hand, some factors could disincentivise purchasing a property. For example, the additional costs of installing a clean heating system required by the proposed trigger points mean an additional burden on purchasers. This burden is expected to decrease if the associated grace periods were set longer. On the other hand, other factors would increase the demand for energy-efficient properties and the supply of energy-inefficient properties (e.g., those who would rather prepare for the backstop dates by moving to an energy-efficient property from an energy-inefficient one). Due to these opposing impacts, the joint impact on the total number of sales is unclear.
The proposed policies are also likely to affect the number of homes let. On the one hand, proposed policy interventions (i.e., policy requirements) may cause some landlords to sell their properties. The proposed property purchase trigger point could be a significant disincentive to landlords entering the market or expanding their portfolio, but a longer grace period may partially mitigate its negative impact. On the other hand, new properties (particularly energy-efficient ones) may enter the rental market if rental prices are a good incentive to enter. Again, the joint impact on the number of homes let is ambiguous.
When considering geographical differences, we found that larger cities are more likely to face housing shortages. This shortage may override the potential positive price impact of energy efficiency as purchasers have limited options to select a home. Therefore, we expect a smaller difference in the price of energy efficient and inefficient homes and/or between homes with and without a clean heating system in urban areas, where the local market is more supply-driven (i.e., the supply of available homes for rent is more limited).
In considering the impacts of the policy we could not identify clear differences in the housing market impacts by dwelling archetype. While there may be a moderate shift from houses to flats (i.e. more people would prefer to choose a flat instead of a house when moving, as flats are in general more energy-efficient), this impact remains uncertain.
Regulation is expected to stimulate the green mortgage market if appropriate products are offered at a competitive price.
A first-time buyer exemption from the proposed property purchase trigger points is expected to give this group of buyers an advantage on the housing market by lowering potential financial pressures associated with the purchase of properties without a clean heating system installed.
Conclusions
The presence of strict backstop dates for energy efficiency standards is expected to ensure that actions to comply with the proposed Heat in Buildings Bill regulations are taken early on. This could lead to a green premium in the value of energy-efficient properties occurring gradually after the introduction of the regulatory frameworks, and then accelerating as the backstop dates approach in both sales and rental markets. However, the green premium attributed to efficient properties can be expected to diminish over time, as the market adjusts to a higher availability of such properties.
The introduction of the proposed early action trigger points can be expected to result in an additional financial burden for property purchasers.By raising the overall cost of moving for all potential buyers, trigger points behave akin to a tax on property purchases, reducing the number of transactions in the housing market. The inclusion of trigger points may ultimately reduce the number of owner-occupiers deciding to move as well as the number of landlords purchasing buy-to-let properties, likely leading to decreased activity in the Scottish residential housing market. Deferring or setting varied deadlines for more vulnerable segments of the market (i.e., first-time buyers, low-income households, small-scale landlords etc.) would mitigate this. The regulatory framework could be adjusted to extend the grace periods, thereby partially mitigating the adverse market effects induced by the property purchase trigger points.
In the rental market, tenants are likely to bear some of the upfront costs of energy efficiency retrofits in the form of higher rents. Following the introduction of the proposed Heat in Buildings Bill, landlords may decide to exit the market if they do not want to comply with the regulations. This could lead to potential housing shortages and higher rents. It then follows that high rental prices could also incentivise investors to enter the rental market, mainly purchasing new builds and already retrofitted properties, leading to an expected increase in the supply of rental properties and subsequently lower rents, which partially offsets the adverse effect of landlords exiting the market.
Although homeowners may postpone the installation of clean heating systems until the deadline looms, extending the grace period for trigger points from two to five years could alleviate their immediate financial strain and partially mitigate a potential slowdown of the housing market. However, in this context, the market slowdown is relatively modest compared to a scenario with a two-year grace period. A longer grace period can ease the financial burden on homeowners by providing more time for planning and by spreading compliance and cost over a longer period.
Not introducing early action trigger points could lead to delayed actions in complying with the proposed regulatory framework, resulting in a more gradual adoption of clean heating technologies. The absence of trigger points leads to both owner-occupiers and landlords postponing necessary actions until closer to the backstop dates. This causes the demand for properties with a clean heating system to surge significantly around the backstop dates, potentially leading to supply shortages, and a peak in the green premium for properties with a clean heating system during the same period, reaching higher levels than if trigger points were used.
The absence of trigger points prevents any distortion in property purchasing decisions. This contributes to keeping the Scottish housing market broadly as active as it would be in a scenario without any regulatory interventions.
An exemption for first-time buyer could assist individuals with lower purchasing power within the housing market, and who are more likely to be long-term renters, by lowering barriers to enter the property sales market. In the absence of targeted help-to-buy schemes, exempting first-time buyers from the property purchase trigger point is still expected to result in a slowdown in transactions in the Scottish residential housing market. However, this effect is less pronounced compared to scenarios where the property purchase trigger point applies to all homeowners, as it eases the financial burden on first-time buyers by granting exemptions from the proposed property purchase trigger point. Although the first-time buyer exemption aims to support these buyers, they might still encounter difficulties with the additional costs required to meet minimum energy efficiency standards when purchasing properties that are not energy efficient. Combining trigger points exemptions with extended deadlines for meeting energy efficiency standards could mitigate this.
While green mortgages only represent a niche segment of the Scottish mortgage market, the introduction of proposed heating decarbonisation and energy efficiency regulations and the need to comply with them, is expected to lead to a substantial increase in the demand for efficient properties and clean heating solutions, ultimately boosting the green mortgage market in Scotland. It may also boost demand for other financial products, including unsecure personal loans, where these are available. Targeted products and financial support schemes for first-time buyers and lower-income individuals could help these groups comply with the regulation, reducing the potential disproportionate impacts.
In the absence of additional financial assistance programs, the proposed implementation of heating decarbonisation and energy efficiency regulations could disproportionately impact those with lower incomes as well as the ‘late adopters’ of energy efficiency measures and clean heating systems. Targeted financial support could help lessen these impacts, particularly where they are designed to safeguard vulnerable individuals and help ensure they are able to adhere to the regulations. This can be achieved by offering a range of financial incentives to owner-occupiers, such as grants, subsidies, low-interest loans, favourable financing options, and tax credits. These incentives could be provided both by the UK Government, with the aim of leveraging additional private investment, or by private sector entities, particularly in the case of loans and financing options. Additionally, the Scottish Government could work in close collaboration with the clean heating and energy efficiency industries to identify and implement solutions that could help reduce costs for owner-occupiers.
The design of an effective regulatory framework requires consideration of various, and sometimes conflicting, priorities, including timely installation of clean heating systems, ensuring all homeowners can bear the costs of compliance and mitigating adverse effects on the housing market.
References
Bank of Scotland, 2024. Scottish first-time buyers make up over half of all home loans.
Billio, M., Costola, M., Pelizzon, L., Riedel, M., 2022. Buildings’ Energy Efficiency and the Probability of Mortgage Default: The Dutch Case. Journal of Real Estate Finance and Economics 65, 419–450.
Boonen, D., Kok, N., 2011. On the economics of energy labels in the housing market. J Environ Econ Manage 62, 166–179.
Cajias, M., Fuerst, F., Bienert, S., 2019. Tearing down the information barrier: the price impacts of energy efficiency ratings for buildings in the German rental market. Energy Res Soc Sci 47, 177–191.
Fuerst, F., Haddad, M.F.C., Adan, H., 2020. Is there an economic case for energy-efficient dwellings in the UK private rental market? J Clean Prod 245, 118642.
Fuerst, F., McAllister, P., Nanda, A., Wyatt, P., 2015. Does energy efficiency matter to home-buyers? An investigation of EPC ratings and transaction prices in England. Energy Econ 48, 145–156.
Fuerst, F., McAllister, P., Nanda, A., Wyatt, P., 2016. Energy performance ratings and house prices in Wales: An empirical study. Energy Policy 92, 20–33.
Green Finance Institute, 2023. Green Mortgages [WWW Document]. URL https://www.greenfinanceinstitute.com/programmes/ceeb/green-mortgages/ (accessed 2.14.24).
Hyland, M., Lyons, R.C., Lyons, S., 2013. The value of domestic building energy efficiency — evidence from Ireland. Energy Econ 40, 943–952.
Jensen, O.M., Hansen, A.R., Kragh, J., 2016. Market response to the public display of energy performance rating at property sales. Energy Policy 93, 229–235.
Kaza, N., Quercia, R., Sahadi, R.J., 2014. Home energy efficiency and mortgage risks: an extended abstract. Community Development Innovation Review 063–069.
La Paz, P.T., Perez-Sanchez, V.R., Mora-Garcia, R.T., Perez-Sanchez, J.C., 2019. Green Premium Evidence from Climatic Areas: A Case in Southern Europe, Alicante (Spain). Sustainability 2019, Vol. 11, Page 686 11, 686.
Lloyds Banking Group, 2021. Homebuyers pay a ‘green premium’ of up to £40,000 for the most energy efficient properties – Lloyds Banking Group plc [WWW Document]. URL https://www.lloydsbankinggroup.com/media/press-releases/2021/halifax/homebuyers-pay-a-green-premium-of-40000-for-the-most-energy-efficient-properties.html (accessed 4.12.24).
Propertymark, 2023. Energy efficiency in UK property: Where to go from here? | Propertymark [WWW Document]. URL https://www.propertymark.co.uk/resource/energy-efficiency-in-uk-property.html (accessed 4.12.24).
Santander, 2022. Buying into the Green Homes Revolution [WWW Document]. URL https://www.santander.co.uk/about-santander/media-centre/press-releases/a-green-premium-house-buyers-willing-to-pay-almost-10 (accessed 4.12.24).
Scanlon, K., Whitehead, C., Blanc, F., 2021. Lessons from the stamp duty holiday [WWW Document]. URL https://blogs.lse.ac.uk/lselondon/ (accessed 4.12.24).
Scottish Government, 2022. Potential heat network zones: first national assessment, Gov.Scot.
Scottish Government, 2023a. Delivering net zero for Scotland’s buildings – Heat in Buildings Bill: consultation [WWW Document]. URL https://www.gov.scot/publications/delivering-net-zero-scotlands-buildings-consultation-proposals-heat-buildings-bill/ (accessed 4.12.24).
Shen, X., Liu, P., Qiu, Y. (Lucy), Patwardhan, A., Vaishnav, P., 2021. Estimation of change in house sales prices in the United States after heat pump adoption. Nat Energy 6, 30–37.
The New York Times, 2006. Saving Both Money and Energy.
UK Government, 2013. An investigation of the effect of EPC ratings on house prices [WWW Document]. URL https://www.gov.uk/government/publications/an-investigation-of-the-effect-of-epc-ratings-on-house-prices (accessed 4.12.24).
UK Government, 2023. Evaluating the impact of the 2017 Stamp Duty Land Tax First Time Buyers’ Relief [WWW Document]. URL https://www.gov.uk/government/publications/evaluating-the-impact-of-the-2017-stamp-duty-land-tax-first-time-buyers-relief/evaluating-the-impact-of-the-2017-stamp-duty-land-tax-first-time-buyers-relief (accessed 4.12.24).
Vimpari, J., 2023. Impact of ground source heat pumps on house sales prices in Finland. Energy Effic 16, 1–13.
Zalejska-Jonsson, A., 2014. Stated WTP and rational WTP: Willingness to pay for green apartments in Sweden. Sustain Cities Soc 13, 46–56.
Appendices
Appendix A: Stakeholder consultations
Stakeholder interviews were carried out to gain an in-depth understanding of the Scottish housing market dynamics, to obtain views of different stakeholders on the impact of the proposed policies and to validate the findings of the literature review, specifically when the eviudence review was not Scotland-specific. The participants of the stakeholder interviews are listed in Table 1. As the S1-B scenario was decided to be added to the study later (to analyse the potential housing market impact of a longer grace period), it involved a second round of stakeholder interviews – the participants of the second round is noted in the last column.
Organisation
Number of interview stakeholders
Sector
Second interview about length of grace period
ESPC
2
Real estate agent
Yes
Houseful
2
Real estate agent
No
Lloyds
2
Banking institution
No
Nationwide
4
Banking institution
Yes
Property Mark
1
Real estate associations
Yes
Rettie
1
Real estate agent
No
RICS
2
Real estate agent
Yes
Rightmove
1
Real estate agent
No
River Clyde
1
Real estate associations
No
Savills
2
Real estate agent
No
Scottish Association of Landlords
1
Real estate associations
Yes
UK Finance
1
Banking institution
No
Table : List of interviewed stakeholders
The main topics covered in the stakeholder interviews included:
The assessment of the impact of energy efficiency and clean heating systems on the sales and rental market. The expected impact of the proposed regulation was also considered;
Any new, emerging trends due to the pandemic, energy crisis, climate change or any other factors;
The time it take to sell or let a property depending on its energy efficiency or on type of heating system;
Geographical differences, such as climatic conditions, local property prices in the neighbourhood, and urban-rural differences;
Differences between archetypes, potential shift to some types of properties due to the regulation;
Differences between the Scottish and English housing markets;
The current state of the green mortgage market, credit risks by EPC rating and the expected growth of the green mortgage market (e.g., key products, increase in the supply of them);
Discussion of fuel poverty and the expected impact of the proposed policies on it;
How first-time buyers behave in the housing market and the key challenges they face.
The second round of the interviews focused on the potential housing maket impact of a 5-year grace period of the purchase and heat network zone trigger points. This included more detailed questions on the difference between a shorter and longer grace period:
Perceptions of the financial and non-financial costs of installing a clean heating system (including differences between owner-occupiers and landlords).
The timing and compliance rate of installing a clean heating system (including differences between owner-occupiers and landlords)
The impact on financial planning
The potential impact of moving or reselling a home within the grace period
Impact on the green premium of properties with clean heating systems
Impact on rental prices and the number of homes let
Impact on the mortgage market
While most of the points were discussed with all stakeholders, the depth of their insights depended on their expertise and background. For instance, we had a closer look at the rental markets with the Scottish Association of Landlords, while stakeholders from financial institutions, such as Lloyds or UK Finance were able to provide more detailed information on the state of the green mortgage market in Scotland. Real estate agents could better assess the impact of energy efficiency and clean heating systems on property prices and provide further insights into customer decision making processes.
Appendix B: Installation rate of clean heating systems and rate of energy efficiency retrofit
Figure 4 illustrates the installation rate of clean heating systems by scenario from the current rate to 2045. The main factors driving the trends are summarised below:
In the case of the policy-free baseline scenario, a steady but small increase is expected in the installation rate of clean heating systems, as described in section 5.6.1. The main drivers are the prohibition on polluting heating systems in new builds from 2024 (Scottish Government, 2024b), the expected decrease in the installation costs, the lower running costs due to the high energy efficiency of heat pumps and other clean heating systems (subject to the relative price of electricity to gas at any point in time), the increasing climate consciousness and the increased confidence in new technologies due to higher installation rates and awareness.
The highest adaptation rate over time occurs in the Heat in Buildings Billscenario (S1-A). This is due to the proposed property purchase and heat network zone trigger points, which increase the installation rate of clean heating systems.
In the case of the no-trigger point scenario (S2), only a very moderate increase is expected in the installation rate of clean heating systems prior to a few years of the backstop date (2045). It is only expected to be slightly higher than in the policy-free baseline, as some people will realise earlier that they eventually need to comply with the clean heating regulation. However, there is expected to be a greater increase close to the proposed backstop date, as all homes are expected to face the prohibition on polluting heating systems by 2045.
In the first-time buyer exemption scenario (S3), the installation rate is the mix of the S1-A and S2 scenarios. First-time buyers are expected to behave as in the S2 scenario. Conversely, other buyers are expected to behave as in the S1-A scenario. As first-time buyers represent a smaller share of the purchasers, the joint impact is closer to the S1-A scenario.
It is important to note that we assume that all homes that are not exempted from the regulations will be fully adapted to clean heating by 2045. Failure to meet this target is likely to mean that Scotland would not fully meet its net zero target in the buildings sector.
Figure 4: Installation rate of clean heating systems by scenario
Figure 5 illustrates the installation rate of clean heating systems under different grace periods in the Heat in Buildings Bill scenario from the current rate to 2045. If there is a grace period of five years (S1-B) as opposed to two (S1-A), the installation rate could be impacted by the following factors:
The longer grace period would allow for later installation of clean heating systems or joining a heat network zone, so effectively adaptation is shifted to three years later in time (see Appendix 8.3.3 on procrastination).
A grace period of five years means more homeowners are expected to move again within the grace period without having installed a clean heating system or joining a heat network zone, further slowing adaptation.
As described in Section 5.3.1, more properties are expected to be sold under a longer grace period due to the lower perceived costs. Therefore, take-up is expected to be somewhat accelerated by those that do not move again within the grace period.
All in all, the first impact is expected to dominate the emerging installation dynamics, so a significantly slower take-up is expected in scenario S1-B, bringing about a steeper increase in take-up at the years right before the clean heating system installation backstop date at the end of 2045.
Figure 5: Installation rate of clean heating systems under different grace period lengths, S1-A and S1-B scenarios
Figure 6 illustrates the expected share of properties meeting the minimum energy efficiency standards. The policy-free baseline is driven by similar factors as in the case of clean heating systems: higher comfort of homes, lower running costs and increasing climate consciousness. The other scenarios, which do not differ in the case of the energy efficiency regulations, are visualised as the Heat in Buildings Bill scenario. As the private rented sector is required to meet energy efficiency standards by the end of 2028, an increase in the retrofits is expected in the following years. However, the majority (62%) of the residential building stock is owner-occupied and does not need to be retrofitted by the end of 2033. Therefore, we expect a sharper increase in the retrofits between 2028 and 2033 than between today and 2028.
Unlike the case of the clean heating system regulation, we do not expect that all homes which are not exempted from the policy will meet the policy requirements by the backstop date. This is due to the relatively short time to the backstop date (less than 10 years): fewer properties are expected to be sold in that time, and fewer people are likely to afford to retrofit. The consultation on proposals for a Heat in Buildings Bill also mentions that no ban on the sale of energy inefficient homes will be introduced to avoid people being unwillingly left in energy inefficient properties.
Figure 6: Rate of homes meeting minimum energy efficiency standards by scenario
Appendix C: Additional findings from the literature review
Property and rental prices
When analysing the impact of the installation of energy efficiency and clean heating systems in residential buildings on the housing market, we are interested in the existence of a green premium and/or brown discount. The main body of the literature defines a green premium (brown discount) as a term indicating the price premium (discount) of properties with high (low) energy-efficiency compared to their counterparts of EPC band D. The country or region where the impact is assessed is also important. While the focus of this study is solely the Scottish housing market, we found no Scotland-specific analysis available. However, the evidence gathered across the UK and in other countries in the northern hemisphere (e.g., Ireland, Finland, the US) is also relevant and is therefore used to inform our study. Indeed, it is reasonable to assume that energy efficiency has a similar impact on housing markets across various developed markets, particularly if the climate and the cost of energy is similar to those in Scotland.
Property sales prices
In the case of property sales prices, most UK-specific academic and grey literature sources report the existence of a green premium and brown discount based on the level of energy efficiency of properties (in England: Fuerst et al., 2015, 2020; in Wales: Fuerst et al., 2016; grey literature using more recent data: Lloyds Banking Group, 2021; Rightmove, 2023). Academic sources in other European countries also agree with the existence of green premiums and brown discounts (e.g., Brounen & Kok, 2011 in the Netherlands, and Jensen et al., 2016 in Denmark).
However, grey literature sources do not always agree with the existence of the green premium and brown discount. For example, most property agents surveyed by Propertymark (2023) reported that they do not think higher energy efficiency leads to a price premium. For example, 66% of them said that the property price does not increase more than the cost of the retrofitting. The controversy between the academic and grey literature sources can partly be explained by the fact that studies cannot fully control for the quality (i.e., overall condition, presentability) of a property[31]. Energy efficiency is usually correlated with the quality of a property: more energy-efficient homes tend to have other desirable characteristics, such as a high-quality interiors and design. This bias is difficult, if not impossible, to disentangle in a quantitative assessment.
A summary of the magnitude of the green premium and brown discount, based on different sources, is shown in Table 2. The different columns show the price difference due to energy efficiency compared to EPC band D by source. For example, a property with an EPC band ‘A’ or ‘B’ is sold at a premium of 5-11% compared to a property with an EPC band ‘D’, assuming all other factors equal (e.g., age, location). Conversely, less energy-efficient homes (in bands F or G) are priced 1-11% lower than comparable properties with an EPC band ‘D’.
Table 2: Price impact of energy efficiency on property prices
Note: Some sources only report results for merged categories (e.g., for F and G combined). Positive values indicate a green premium, while negative values indicate a brown discount compared to EPC band D. If the results are not significant, ‘no impact’ is reported.
A Swedish report used surveys and found that people who live in energy-efficient homes are willing to pay a higher green premium when buying or renting a new home (Zalejska-Jonsson, 2014). This indicates that people are less likely to move from an energy efficient home to an inefficient one.
Not only do energy efficiency measures impact property prices, but the type of heating system used also can affect the value of homes. While no Scottish or UK-specific evidence were found on this, some studies have assessed this impact in other developed countries, albeit, under different conditions. In Finland, where, unlike in Scotland, heat pumps are already widely used and gas heating is not common, ground-source heat pumps and district heating have a positive impact on property prices, particularly in the largest city, Helsinki (Vimpari, 2023). In addition, under different climatic conditions, air-source heat pumps (ASHPs) are associated with positive impacts on US sales prices, particularly in warmer regions (where cooling is more important, as ASHPs can provide cooling as well as heating) and where climate consciousness is higher (Shen et al., 2021).
Rental prices
In the rental market, price impacts follow a similar pattern to that of sales prices, although their magnitude differs. While both buyers and renters attribute a monetary value to the energy efficiency of homes, buyers place a higher value on it. Therefore, the green premium in rental markets (in a form of higher rents for more energy efficient properties) is smaller (Hyland et al., 2013).
While the premium for energy-efficient rental properties with EPC band A-C can range from 3% to 18%, the discount for energy-inefficient properties is often insignificant in various parts of the UK (Wales: Fuerst et al., 2016; England: Fuerst et al., 2020). In other words, energy efficiency is a factor in determining rental prices for properties in EPC band A-C, but rarely for those in bands E-G. This may be explained by sharper competition for the most energy-efficient properties between owner-occupiers and buy-to-let landlords (Fuerst et al., 2016). In Ireland, Hyland et al. (2013) found a significant brown discount (2-3). Table 3 summarises the key findings of the impact of energy on the rental market by source, similar to Table 2.
EPC band
Fuerst et al. 2020
Fuerst et al. 2016
Hyland et al. 2013
Impact
Impact
Impact
A/B or B
3-4%
18.5%
2-4%
C
3-5%
4%
No impact
D
Base of comparison
E
No impact
No impact
-2%
F/G
-4-5%
No impact
-3%
Geography
England
Wales
Ireland
Sample time
1995-2013
1995-2013
Jan/2008 – March/2012
Table 3: The impact of energy efficiency on rental prices
Note: Some sources only report results for merged categories (e.g., for F and G combined). Positive values indicate a green premium, while negative values indicate a brown discount compared to EPC band D. If the results are not significant, ‘no impact’ is reported.
Time to sell
The length of time a property spends on the market is a key factor to consider when evaluating its value. Properties that sell quickly are generally considered more liquid assets.
Academic sources usually report a reduction in the length of time properties spend on the rental market, if characterised by higher levels of energy efficiency. In other words, higher energy efficiency reduces the time taken to secure a tenant. For example, in England more energy efficient properties are let up to 35% faster compared to those with F or G ratings (Fuerst et al., 2020)[33]. In the rental market of the seven largest German cities, less efficient homes were found to spend 17% more time on the market, controlling for rent, living area, property age as well as hedonic, spatial and socioeconomic variables (Cajias et al., 2019, pp. 188-189).
On the sales market, a Santander study (2022) had a similar conclusion, reporting that 75% of agents in the UK think that properties with a higher EPC band rating can be sold two to four months quicker.
Regarding the installation of clean heating systems, no sources have been found which report its impact on the time to sell or let a property given the early stage of policy and the availability of technologies.
Geographical and archetypical considerations
Section 4.1. focused on the impact of the installation of energy efficiency and heating systems on property and rental prices in general. However, these price impacts may vary depending on other factors such as location (regional and urban-rural differences) and housing archetypes.
Our desk-based research did not discover any Scotland-specific evidence. Nevertheless, Irish, English and Welsh studies and findings from other developed countries in Europe describe impact mechanisms which can be applied to Scotland.
Geographical distribution
There is substantial variability in the impact of energy efficiency on property sales prices in England (Fuerst et al., 2015 and UK Government, 2013). Typically, the green premium is higher in the northern part of the country (see Figure 7). The evidence suggests that this variation can be attributed to the following drivers of regional differences:
Variation in climatic conditions: It can be expected that energy efficiency is valued more highly in regions where the average temperature is colder.
Variation in property prices: In areas where house prices are above average, a fixed amount of annual energy saving accounts for a smaller proportion of total property price. Therefore, the impact of higher energy efficiency is smaller in relative terms.
Variation in housing supply: In the south, where housing supply is more severely constrained, energy efficiency may be pushed down the list of pricing determinants. As there are relatively fewer housing options of given size and location in these areas, the cost savings due to energy efficiency are reflected less in prices.
In Germany, the rental price impact of energy efficiency was found to be less pronounced in more densely populated cities compared to other cities. This is likely driven by more severe housing shortages in big cities (Cajias et al., 2019). Although in a different climatic setting, evidence available from Spain shows that regions with more weather instability have a higher green premium for energy efficiency (La Paz et al., 2019). In the US, the price impact of air source heat pumps, which provide cooling as well as heating, was higher in regions with a warmer climate (Shen et al., 2021).
Urban-rural differences also have an impact on the magnitude of the green premium and brown discount. In Ireland, lower energy efficiency ratings have a significant negative impact on sales prices. This impact is smaller in urban areas than in rural areas. Also, green premiums and brown discounts are smaller in the rental market (Hyland et al., 2013). Urban-rural differences can be explained by stronger demand for houses in urban areas, for example due to increasing demand for living in the agglomeration of larger cities, and the increasing number of new job opportunities in larger cities[34]. Therefore, energy efficiency has a higher impact on sales prices where the supply of properties is higher (in rural markets) and a smaller impact where demand for properties is stronger (in urban areas) (Hyland et al., 2013).
Figure 7: Variations of green premium by UK regions. Source: UK Government, 2013
Archetypal distribution
It is also important to examine whether there are significant green premiums and brown discounts for different types of dwelling. In Scotland, the usual archetypal categories include detached, semi-detached, terraced houses, tenements and other flats (Scottish Government, 2024d). To our knowledge, no Scottish study has yet been carried out on the price impact of energy efficiency by different archetypes. Also, due to the early stage of clean heating systems adoption, we encountered a lack of literature on the property price impact of installing clean heating systems by different archetypes. Therefore, this section focuses solely on evidence related to the impact of energy efficiency.
Table 4 presents the key findings on whether the price impact of energy efficiency (i.e., the green premium and brown discount) was found to be significant for different archetypes. In general, studies using property sales data in England (Fuerst et al., 2015) and in Wales (Fuerst et al., 2016) report a significant brown discount for less energy efficient properties (EPC band E-G) for almost all archetypes. However, there is greater variability in green premiums. In England, there is a significant green premium for flats, terraced and semi-detached houses with EPC rating A-C. In Wales, only terraced houses and A or B rated semi-detached houses have a green premium – there is no green premium for detached houses and for flats. The variation in the price premium for different archetypes may be explained by other factors, as for example the local housing shortage[35]. If the supply of properties is severely constrained, purchasers may place less value on energy efficiency.
Detached- rural
Detached- urban
Semi-detached
Terraced
Flats
England
Green premium
Negative
No impact
Positive
Positive
Positive
Brown discount
No impact
Negative
Negative
Negative
Negative
Wales
Green premium
No impact
No impact
Positive or no impact
Positive
No impact
Brown discount
Negative
Negative
Negative
Negative
No impact
Table : The impact of energy efficiency on sales prices by different types of dwellings in England and Wales
Notes: In the case of a green premium, ‘Positive’ and ‘Negative‘ indicate that there is positive or negative price impact of energy efficiency in EPC band A-C, compared to D. In the case of brown discount, ‘Negative‘ indicates that there is a negative price impact of lower energy efficiency in EPC band E-G, compared to D. When there is ‘Negative‘ or ‘Positive’ sign and ‘no impact’ is also added to a cell, it means that results depend on the model specification Source: England – Fuerst et al., 2015 (Table 4); Wales – Fuerst et al., 2016 (Table 2)
Due to the large variety in the stock of detached houses, they are often divided into two categories, depending on whether they are located in urban or rural areas. In the case of rural detached houses, energy efficiency has a less pronounced or counterintuitive impact (i.e., in England there is a price discount for more energy efficient detached houses). The explanation might be that buyers are willing to pay more for inefficient rural detached houses due to their aesthetic characteristics and emotional values this fosters, without evaluating their energy performance (Fuerst et al., 2016). For example, a Georgian house is likely to be less energy-efficient than a modern home, but the buyers do not consider it as key barrier due to its historic charm.
In the case of rental markets, there is less evidence on differences across archetypes available. Fuerst et al. (2020) report that energy-efficiency has a higher premium for semi-detached and terraced houses, as well as for flats, compared to detached houses[36].
In summary, the price impact of energy efficiency varies for different types of dwellings. However, a brown discount for reduced energy efficiency is usually reported for almost all dwelling types, while a green premium is not significant in many cases. Emotional and aesthetic characteristics of properties can override the valuation of energy efficiency standards, especially in the case of detached houses. This impact is stronger in the case of rural detached houses, therefore urban-rural differences are relevant.
Grace period length
Our desk-based research covered a substantial range of academic and non-academic literature on policies encouraging the take-up of clean heating systems but have found no inquiry into the marginal effect of differing grace periods. Despite widening our scope to learn from the analysis of other policies which included grace periods, we still did not find any reliable policy-focused study. Therefore, we have directed our attention to theoretical and empirical studies of behavioural economics in the context of timing decisions and cost.
In standard economic thinking (including the so-called neoclassical models of mainstream economics), the timing of cost incurrence is mostly relevant because of liquidity constraints: not having enough available money to meet all consumption needs temporarily. A grace period is an instrument driving the timing of cost incurrence, as it defines the latest point in time when the cost of installing a new heating system after purchasing a new property will be incurred. The so-called ‘life cycle hypothesis,’ widely accepted in economics, would predict that consumers even out consumption throughout their lifetime. In other words, this means that spending behaviour is not affected specifically when costs are incurred, as people will optimise their borrowing and saving decisions to smooth consumption over time. However, as borrowing and saving is not possible for everyone and can be costly, the timing of costs would indeed become a relevant factor to consider.
Consequently, the prediction of the standard economic thinking is that a longer grace period alleviates some of the burden on liquidity-constrained consumers. In the context of the proposed Heat in Buildings Bill regulations, this would mean that buyers could save more money due to the longer grace period either to purchase a clean heating systems or to save enough for a down payment for a retrofit remortgage.
However, as Carter et al. (2022) show in the context of payday loan repayment, contrary to standard economic theory, consumers do not really benefit from a longer grace period. Borrowers who are granted an extended grace period exhibit repayment behaviours that are largely comparable to those who are not, with the primary distinction being the extension provided by the longer grace period. One driver they attribute this result to is “naïve present bias” as described by O’Donoghue and Rabin (1999): overweighting present costs and benefits, even slightly, leads to a procrastination of payments. Regardless of the length of the grace period, the necessary reduction in consumption would take place immediately before the end of the grace period. So, although this reduction in consumption could be spread out over a longer period, alleviating the liquidity burden, present biased consumers would not make use of it. In the context of the Heat in Buildings Bill, this means such present biased consumers would not benefit from a longer grace period.
Akerlof (1991) characterized present bias as occurring when “present costs are unduly salient in comparison with future costs, leading individuals to postpone tasks until tomorrow without foreseeing that when tomorrow comes, the required action will be delayed yet again” (p. 1). The lack of attention to the future costs of postponed tasks is very relevant in the context of our study, as for many people longer grace periods would indeed cause inattention to the costs of clean heating system installation. As these costs are to be incurred further in the future, many people will not fully account for the cost of installation of the clean heating system. Therefore, the price premium for properties with clean heating systems will be significantly smaller. Altmann et al. (2019) provide evidence that reminders increase the probability of timely compliance.
Another important behavioural phenomenon that could be relevant is described by uncertainty in the cost of retrofitting, in which case an individual may wait and delay incurring the cost in the hopes of lower costs in future. However, separating this driver (usually dubbed ’the option value of waiting’) from simple naïve present bias is very challenging (see Heidhues and Strack, 2021).
In summary, standard economic thinking (i.e., neoclassical theory) and behavioural economics both suggest that a longer grace period is less of a disincentive to purchase a property. As the costs of clean heating system installation is less salient and can be spread out over a longer period of time, potential buyers perceive a lower effective price. According to behavioural economics theories, installation can be expected to be carried out close to the end of the grace period due to present bias and the option value of waiting.
Mortgage market
In the US (Kaza et al., 2014) and Dutch (Billio et al., 2022) mortgage markets, higher energy efficiency of homes leads to lower energy bills, which in turn reduces the risk of default. Therefore, taking energy efficiency into account in the mortgage underwriting process has clear benefits for lenders via reduced financial risk. Moreover, in the Netherlands, three plausible impact mechanisms underlying the relationship between energy efficiency and the probability of mortgage default have been identified (Billio et al., 2022), namely:
personal borrower characteristics captured by the choice of an energy-efficient properties;
improvements in building performance that could help to free-up the borrower’s discretionary income;
improvements in dwelling value that lower the loan-to-value ratio.
Energy efficient mortgages or green mortgages that exploit this exact relationship have been on the market for decades (The New York Times, 2006). Recently however, they have become more available in the EU, gathering attention from policymakers (Euractiv, 2021, EEML, 2024)[37].
A high-level review of the current UK green mortgage market shows that some mortgage lenders offer better deals for borrowers that buy energy-efficient homes in the form of green mortgages. Green mortgages to finance retrofitting, so called ‘retrofit mortgages’, are also offered at the point of purchase and as a remortgage. Nevertheless, as green mortgages are still scarce, there continue to exist cheaper non-green mortgages available in the UK that can be more attractive options (Green Finance Institute, 2023; Money Saving Expert, 2024).
Fuel poverty
The Scottish Government has pledged to lift people out of fuel poverty[38]. The Fuel Poverty Act (2019) set out interim targets for 2030 and 2035, as well as final targets for 2040 to reduce the proportion of households in fuel poverty and extreme fuel poverty[39] to 5% and 1% respectively. In this study it is therefore useful to also touch on the fuel poverty implications of energy efficiency regulation.
According to the 2019 Scottish house condition survey, fuel poverty is most prevalent among households living in energy-inefficient homes and remote rural locations.
40% of households living in dwellings rated EPC band F or G are fuel poor
38% of households living in dwellings rated EPC band F or G are extremely fuel poor
Remote rural areas have the highest rates of fuel poverty and extreme fuel poverty:
43% of remote rural households are fuel poor
33% of remote rural households are extremely fuel poor
Appendix D: Theory of change – figures
The following pages includes the key theory of change charts. These are fully explained in the appropriate sections of the main report.
Figure 8: Expected impacts of proposed policies in Heat in Buildings Bill consultation on housing market, S1-A scenario Colour code: light blue – owner-occupier type; dark blue – actions available; turquoise – market impact; grey – mechanism driverFigure 9: Expected impacts of proposed policies in the consultation on a Heat in Buildings Bill on rental market, core scenario Colour code: dark blue – actions available; turquoise – market impact; grey – mechanism driver
Figure 10: Expected impact of a longer grace period on housing market, S1-B scenario Colour code: dark blue – actions available; turquoise – market impact; grey – mechanism driver
Figure 11: Expected interactions between the sales and rental market under the proposed policies in Heat in Buildings Bill consultation, S1-A scenarioFigure 12: Expected impact of a longer grace period in rental market, S1-B scenario Colour code: dark blue – actions available; turquoise – market impact; grey – mechanism driverFigure 13: Expected impacts of proposed policies in S2 scenario on housing marketFigure 14: Expected impacts of first-time buyer exemption on housing and rental market, compared to S1 Colour code: turquoise – market impact
How to cite this publication:
Benyak, B; Heilmann, I; Dicks, J and Dellaccio, O (2024) Housing market impacts from heating and energy efficiency regulations in Scotland, ClimateXChange. http://dx.doi.org/10.7488/era/4863
While every effort is made to ensure the information in this report is accurate as at the date of the report, no legal responsibility is accepted for any errors, omissions or misleading statements. The views expressed represent those of the author(s), and do not necessarily represent those of the host institutions or funders.
This work was supported by the Rural and Environment Science and Analytical Services Division of the Scottish Government (CoE – CXC).
If you require the report in an alternative format such as a Word document, please contact info@climatexchange.org.uk or 0131 651 4783.
The scope of this report is to provide evidence on the impact of heating and energy efficiency regulations on the residential housing market, while excluding considerations of the non-residential sector. ↑
Grey literature refers to non-academic publications and documents, usually published by various types of organisations, such as agencies, government bodies or experts. Examples include reports, studies, technical papers or conference proceedings (e.g. slides). ↑
The New Build Heat Standard (NBHS) is currently being reviewed, as announced by the Scottish Government on 28 May 2024. ↑
The Scottish Government consulted on a grace period of 2-5 years for installation of clean heat systems following the purchase of a property. For the purpose of this study, we have assumed a grace period of 2 years, in all scenarios except for S1-B which assumes 5 years. ↑
The Scottish Government did not specify a grace period for the proposed heat network trigger point in the consultation on a Heat in Buildings Bill, but for the purpose of this study, this scenario assumes a grace period of three years. ↑
Based on the consultation on proposals for a Heat in Buildings Bill, owner-occupied homes are not required to carry out energy efficiency improvements if they have clean heating systems installed (as they have no direct emissions). This can potentially create a loophole where owner-occupiers can avoid making energy efficiency improvements. ↑
The paper defines green properties as energy-efficient properties with low environmental impact. ↑
Hence, while people living in clean heating system homes are more likely to sell them at a competitive price, they would face more competition when searching for another clean heating system home. ↑
A few homeowners may install a clean heating system before they sell their property in order to increase its value. However, based on the stakeholder interviews, this effect is expected to be marginal. ↑
It is important to note that people are unlikely to move just to avoid carrying out energy efficiency retrofits as the financial (e.g., stamp duty, solicitors fee) and non-financial (e.g., the burden of moving or the emotional cost of leaving a familiar environment) costs can be high. However, those considering a move may advance their plans due to the backstop dates. It is also likely that most owner-occupiers will choose to stay and bear the costs of retrofitting, especially if the financial and non-financial costs of moving outweigh the costs of retrofitting. ↑
This also means that there are two opposing impacts (i.e., a driver increasing and a driver decreasing the market activity), but the slowdown due to the purchase trigger point is expected to be stronger. ↑
Based on the 2022 edition of the Scottish House Condition Survey (Scottish Government, 2024d), tenements and other flats had an average energy efficiency rating by 3-7 percentage points higher (on a scale of 100) and 67-68% of them were in EPC bands A-C, compared to 40-48% for other archetypes (detached, semi-detached, and terraced houses). ↑
As shown earlier, the proposed regulation could discourage people from moving out of energy-efficient properties with clean heating systems, resulting in a lower number of these types of properties being put up for sale. However, as the share of energy-efficient properties with clean heating systems in the residential building stock is expected to increase (also due to the policies), the supply of these homes is still expected to increase. ↑
If owner-occupiers install a clean heating system (e.g., due to the purchase trigger point), they are not required to meet the minimum energy efficiency standards. Therefore, the purchase trigger point can reduce the installation rate of energy efficiency retrofits. However, it is not expected that a large number of owner-occupiers will choose to install only a clean heating system without energy efficiency retrofits. ↑
A recent CCC study (2021) found that the low carbon heat network technology has the lowest average investment cost per home across the clean heating system options in the UK, both in 2020 and in 2035. Therefore, it is likely that most homeowners will choose this option if available. If the purchasers are aware of this cost difference, the price discount on these polluting heating system properties may be lower compared to properties which are not located in a heat network zone (as the upfront cost of installing a clean heating system is lower). ↑
This may be in addition to the mortgage they would have taken out anyway for a new home, or a green mortgage customised for green retrofitting. Some stakeholders mentioned that they already offer products for green retrofitting. ↑
However, landlords might face other non-financial costs, such as time spent finding workers to carry out the retrofitting work. ↑
Some types of retrofitting works do not cause major disruption to the lives of tenants, e.g., changing light bulbs, glazing windows. ↑
These interventions included the increase of eviction time (removed from April 2024) and a 3% temporary rent cap which is replaced by a new rent adjudication mechanism from April 2024 (Scottish Government, 2024c). ↑
For example, based on a Rightmove report (2023), 61% of landlords in Great Britain would not buy a rental property below an EPC rating of C, which is a significant increase from 47% in 2022. ↑
Potential new landlords may have to consider several other factors when deciding whether to enter the rental market. These may include financial (in particular, second home tax) and non-financial considerations (for example, potential issues with new tenants). ↑
Stakeholders emphasised that the purchase trigger point is expected to slow down the market in general. However, a shorter grace period can have a higher negative impact. ↑
Moreover, individuals who would typically move after a period slightly longer than the grace period (e.g., in 6 years) may advance their relocation plans (e.g., to 5 years) due to the purchase trigger point, thereby further stimulating the housing market. ↑
If the heat network zone trigger point has a longer, 5-year notice period, purchasers in areas where connection to the heat network is possible but not yet carried out, are more likely to postpone the decision whether they want to connect to the heat network or to install an alternative type of clean heating system as perceiving it as a future problem. Similar to a longer grace period after a purchase of property, this can lead to a delayed planning and to a poorer understanding of costs and benefits of alternatives. ↑
Landlords need to consider that tenants might need to be relocated elsewhere for the period of time when a new heating system is installed, particularly in colder periods. ↑
First-time buyers are not assumed to be exempted from the Heat Network Zone trigger point for the purpose of this scenario. ↑
In the case of some specific properties, such as Georgian and Victorian houses, stakeholders agree that despite their low energy efficiency, there is a price premium for them due to their historic charm and aesthetic value. This could lead to a price premium for inefficient homes in some sub-groups of properties. ↑
We do not consider those properties which will be exempt from the policy. ↑
While all properties are required to meet a minimum energy efficiency standard, some variations in the extent of energy efficiency could remain. This may still lead to some price premium for more energy-efficient homes (e.g., an EPC rating of A compared to C). ↑
Also, grey literature sources usually rely on the qualitative assessment of market participants (e.g. agents), while academic sources are based on quantitative methods. ↑
A more precise sample period is not mentioned in the study. ↑
The impact is only significant in the case of B and E rated properties, but insignificant for C and D. The authors explain it with statistical bias (e.g., missing variables, such as the number of listed properties or tenant mobility), and with individual over- and under-pricing. ↑
The study assessed price impacts around the time of the 2008 financial crisis (i.e. between 2008 and 2012). ↑
Local, as housing supply is strongly linked to settlements – a housing shortage in one city does not necessarily mean a shortage in another one. ↑
The study compares the price premium of different archetypes to detached houses and reports significantly higher rental price for higher EPC ratings on a scale of 0-100. ↑
Policies that facilitate green mortgage products include the Energy Efficient Mortgage Label. This was developed by the Energy Efficient Mortgages Initiative to drive the upgrade of the housing energy efficiency profile of lending institution portfolios and to act as a global benchmark for energy efficient mortgages (EEML, 2024). ↑
Defined by the Scottish Fuel Poverty Act 2019: “A household is in fuel poverty if the fuel costs necessary for the home in which members of the household live to meet reasonable fuel needs and requisite temperatures are more than 10% of the household’s adjusted net income, and if after deducting such fuel costs, benefits received for a care need or disability (if any) and the household’s childcare costs (if any), the household’s remaining adjusted net income is insufficient to maintain an acceptable standard of living for members of the household. ↑
Defined as costs of reasonable fuel needs (e.g. adequate heating; detailed definition at paragraph 4 and 3 of the Fuel Poverty Act 2019) exceeding 20% of the household’s adjusted net income. ↑
Decarbonisation of domestic heating systems is crucial for achieving the Scottish Government’s ambitious climate change targets of net zero emissions by 2045. The transition to zero direct emissions heating systems (e.g., heat pumps, district heating) will require a suite of changes to the Scottish housing stock, including preparing it to operate at lower flow temperatures than the current majority of 70-80°C. Flow temperature is the temperature a wet heating system warms water to before sending it to radiators in different areas of a building.
This study summarises the current evidence for flow temperature reduction in hot water (wet) systems and considers how this might be applied to the Scottish housing stock. Suitability is defined as a dwelling’s ability to reach thermal comfort for a range of external temperature test criteria. We assess the suitability of the present housing stock as it is today and then with two different cost levels of retrofit. The assessment method includes a literature review, stakeholder interviews and scenario modelling to test different temperature cases.
Findings
We have found that most of the Scottish housing stock is currently unsuitable for flow temperature reduction to 55°C or below on a winter peak day (see Figure 1).
Many dwellings in Scotland could reach suitability for 55°C flow temperatures after the inclusion of retrofit(s). Effective retrofit measures include efficiency measures such as wall and/or loft insulation, upgrading radiators or a combination of smaller efficiency measures such as hot water tank insulation, draughtproofing and reduced infiltration measures.
In our higher cost retrofit scenario, 76% of homes become suitable for a flow temperature of 55°C on a winter peak day (see Figure 2). This could prepare the housing stock to be ready for zero direct emissions systems without requiring gas boilers to be removed from homes immediately.
Figure 1 Absolute number of dwellings suitable to meet thermal comfort at each flow temperature (°C) on a winter peak day with no retrofits
Figure 2 Absolute number of dwellings suitable at each flow temperature (°C) on a winter peak day with more extensive, higher cost, retrofits
We find that 30% of the overall housing stock is unsuitable for a flow temperature below 75°C, and 20% require a flow temperature above 75°C. This suggests these dwellings are either running at temperatures higher than 75°C or are currently unable to reach thermal comfort during periods of peak demand.
Fuel bill savings and emissions reduction from reducing flow temperature is significant and range from £151m to £501m in the stringent external temperature test cases. The associated greenhouse gas emission savings are estimated to be 6.17–10.18 MtCO2 equivalent per year, depending on external temperature cases and retrofit scenarios. Exploring the potential for varying flow temperatures throughout the year could be one way to increase savings.
The most important factor when assessing suitability for flow temperature reduction is in setting temperature criteria that captures the needs of occupants. We used particularly stringent criteria in our assessments, requiring a dwelling to be heated to 20°C during the coldest hour of an average or 20-year winter peak. This may not reflect the reality of how heating systems should be, or are currently, expected to perform but it was selected to ensure the heating needs of the most vulnerable households were considered.
Technical Glossary
Flow temperature
The temperature at which water or another heat transfer medium in a heating system is warmed to before being sent to heating emitters such as radiators in different areas of a building.
Heating emitter
A product that sends out heat, used to distribute heat around a building, e.g. radiators.
Thermal comfort
The condition of mind that expresses satisfaction with the thermal environment and is assessed by subjective evaluation.
Building envelope
The physical separator between the conditioned and unconditioned environment, typically including the building’s floors, walls, windows, and roofing.
Draughtproofing
Measures to reduce airflow, such as applying physical fillers and sealants, around doors and windows.
Reduced infiltration measures
Measures to reduce airflow throughout the dwelling – this is like draughtproofing measures but is applied to other points of airflow throughout the dwelling.
Peak (or peak heating hour)
The calendar hour with the highest measured demand for heating in the previous calendar year, or the timespan being measured if otherwise specified.
Shoulder season
The period between typical warming seasons and cooling seasons. This typically refers to spring and autumn when lower demands for heating are observed. The November average is used in this report.
1-in-20 peak (historic cold snap)
The peak heating hour as measured over the previous 20 calendar years. This metric is often used to capture “historic” weather events such as cold snaps and heat waves.
Oversizing factor
The ratio of peak radiator capacity to peak energy demand in a building.
U-value
The U-value, also called thermal transmittance, measures how well a building element conducts heat. It quantifies the heat transfer rate, with lower values indicating better insulation. It is measured in W/(m²·K).
Specific heat loss
Specific heat loss refers to the rate of heat loss from a building at a given temperature differential between internal and external conditions. This is measured in W/m2 of building envelope and is dependent on the U-value of the building envelope.
Introduction
Domestic heating system decarbonisation is crucial for achieving the Scottish Government’s ambitious climate change targets of 75%, 90% and net zero emissions, relative to 1990, by 2030, 2040 and 2045 respectively. The transition to zero direct emissions heating (ZDEH) systems will require changes to the Scottish housing stock. This will potentially including preparing the building stock to operate at the lower flow temperatures that ZDEH options such as heat pumps operate.
Currently, the majority (approximately 85%) of dwellings in Scotland are heated by water based (wet) boiler systems, which typically operate at flow temperatures between 70-80°C. The remaining dwellings are heated by a mix of communal, heat pump, electric and off-grid systems. Flow temperature reduction has the benefit of reducing the energy required to meet the same internal room temperature, thus leading to reduced emissions and fuel bill costs in gas boiler and ZDEH systems alike.
We summarise the current evidence base for reducing flow temperature in the existing housing stock. We consider how flow temperature reduction might be applied to Scottish housing by modelling a range of lower flow temperature and assessing the potential suitability with varying degrees of retrofits.
Findings from literature review and stakeholder interviews
Range of temperatures for consideration
Evidence base for 55°C
According to the Heat Pump Association (see Appendix 8.1), 55°C is considered the “target” temperature for transitioning existing residential heating systems to lower-flow temperature systems. This is because it is an effective and relatively feasible “middle ground” between flow temperatures of current residential gas boiler currently (>70°C) and the direction of travel towards ZDEH technologies such as heat pumps (which operate optimally between 30-55°C).
At 55°C, most condensing boilers will run more efficiently (because more latent heat can be transferred from the flue gases at lower return temperatures) and there will be a reduction of wear and tear caused by cycling at current flow temperatures. Heat pumps, on the other hand, will reach the limits of their peak efficiency at approximately 55°C; at higher flow temperatures, efficiency will drop below quoted performance.
We found wide agreement in the stakeholder interviews (see Appendix 8.1 for stakeholder engagement overview) that most homes in the UK, and most homes in Scotland, will be able to run heating systems at 55°C without significant retrofitting. According to the CCC (2022), based on a report conducted by Nesta and Cambridge Architectural Research (2022), approximately 27% of homes in the UK currently are suitable for flow temperature reduction based on assumed ancillary attributes (namely radiator and pipework suitability). It is our understanding that a property assessment was not undertaken as part of the Nesta/Cambridge work. This estimate is about half of that found in previous research (Element Energy, 2021), which found that 53% of the UK stock was able to run at 55°C on a typical winter day (the percentage is reduced to 10% to reach thermal comfort on a winter peak day).
It was the opinion of our interviewed stakeholders that most homes in Scotland can successfully be run at 55°C, and that there were few attributes that would rule out this flow temperature (see Appendix 8.4).
Potential for further reduction
It is difficult to transition the housing stock to even lower flow temperatures below 55°C. The proportion of homes which are suitable without any works (or without major works) is significantly lower. Stakeholders suggested that some homes may not be suitable at all, but it is unclear if there was any tangible evidence or guidelines this was based on.
Our previous work (Element Energy, 2021) showed that the percentage of stock suitable for reduced flow temperatures reduces from 53% to 25% at 50°C, 6% at 45°C and <1% at 40°C. On a winter peak day (with an assumed external temperature almost 10°C lower) these proportions of houses suitable reduce to 3% at 50°C, 1% at 45°C and <1% at 40°C.
At lower flow temperatures, the specific heat loss of a property becomes increasingly important. Specific heat loss, in practice, is an indicator of how much heat will be required to maintain thermal comfort. Heat loss tends to have an inverse relationship with efficiency – a home with a low specific heat loss rate will be highly efficient, while homes with a high heat loss rate tend to be less efficient.
This is an important consideration when assessing the suitability of reducing flow temperature because in a home without retrofitting, a reduced flow temperature will decrease the amount of heat delivered to a room. If a room is difficult to heat because the home has a high heat loss rate, it becomes increasingly difficult to reach the desired temperature of that room because the system cannot adequately deliver or retain heat.
In this situation, one or both of the following paths can be taken to make a home suitable for a lower flow temperature:
Increase delivered heat. To do this, specific components of the heat system may need to be replaced or adjusted. The two key components are pipework, which impacts the flow rate of water through the system; and radiators, which emit heat transferred from the water. Existing pipework may need to be replaced to allow for a higher flow rate (which would help move more heat through the radiator in a given time period). Radiators could be replaced with larger units, which will allow more heat to be emitted due to an increase in absolute surface area. One or both options will increase delivered heat.
Decrease specific heat loss. To do this, a home needs to become more efficient through retrofitting to increase efficiency and airtightness. The two most important retrofits that can be undertaken are insulation (loft or wall) and window glazing. In addition, draughtproofing can be applied to windows and doors. These measures will lead to a higher rate of heat retention, meaning the absolute amount of heat that needs to be transferred to reach thermal comfort in a home is decreased.
Building envelope measures to increase suitability for flow temperature reduction
Increasing the efficiency of the building envelope decreases specific heat loss, thus supporting flow temperature reduction. Stakeholder interviews emphasised the importance of home retrofitting and maintenance, especially where homes are poorly insulated, as it also leads to heat demand reduction.
Home insulation
In general, more insulated homes will be more suitable for lower flow temperatures, due to the lower heat demand to reach thermal comfort. It is unlikely that there is a situation in which a home is “too insulated”, except if this insulation does not allow for moisture to be driven from the masonry.
Interviewed stakeholders considered insulation as one of the most influential aspects for suitability to operate at lower flow temperatures. Despite a general concern that traditionally built homes were unlikely to be suitable for a lower flow temperature, one stakeholder suggested loft and wall insulation is likely to be sufficient. It makes little difference if the loft is used as a room (CCC, 2022), as insulating in either case will decrease the home’s heat loss, but additional care should be taken due to the likely increased cost.
Window glazing
Similar to insulation, improving window glazing to double glazing or secondary glazing, is always beneficial for increasing the suitability of homes for reduced flow temperatures because they reduce the specific heat loss of a property. While triple glazing may offer benefits, it can introduce ventilation concerns and results in a lower marginal efficiency gain for flow rates compared to the adoption of double glazing.
Both double glazing and secondary glazing can effectively lower heat loss, but double glazing is a more expensive process and involves replacing entire units. Replacing existing windows with double glazed windows may be more difficult or restricted in traditional homes due to conservation/listed building status or for aesthetic reasons. Care should also be taken to balance ventilation requirements with increased glazing.
Ancillary components for the reduction of flow temperature
Ancillary components are key to effectively increasing delivered heat and/or decreasing specific heat loss. The overall efficiency of the heating system and, more generally, home energy efficiency will increase the suitability for flow temperature reduction. Some ancillary components are particularly important to a home’s suitability, and these are discussed in the following sections.
Radiators
When radiators are fitted, the size of radiator suitable for a home is determined with consideration to the flow temperature the heating system runs at, alongside flow rate, to determine an adequate size to meet thermal comfort. If all else remains constant but the flow temperature is reduced, it is possible that the heat transferred to the radiator will not be sufficient. To mitigate this, existing radiators can be replaced with larger units which can transfer more heat, but this may be more expensive than other retrofit measures.
Pipework
Pipework is likely to be a key attribute for suitability of a home to increase the flow rate of the heating system. Like radiators, piping tends to be sized for the heating distribution system. Pipework may need to be replaced to account for a lower flow temperature, but our previous work (Element Energy, 2021) and stakeholders consulted had mixed opinions as to whether increased flow rate was an effective counterbalance to reduced flow temperature, and whether it would be required.
During our engagement with Renewable Heat (see Appendix 8.1, it was suggested homes were built or had heating system replacements between the 1980s and 2002 are more likely to require pipework replacements. During this period, a copper shortage led to smaller piping instalments across the industry. Due to an update to buildings regulations in 2002 this is not an issue for newer builds.
Pipework, compared to other ancillary components, is particularly susceptible to maintenance problems leading to inefficiencies. For example, past analysis (Element Energy, 2021) found that efficiency reductions due to sludge (15%), hydraulic imbalance (10%), air (6%) and limescale (15%) can impact the ability for a heating system to reach thermal comfort.
Other considerations
The efficiency improvements possible for pipework highlight the importance of regular maintenance for heating systems. Heat distribution systems should have annual maintenance servicing, but our recent analysis (Element Energy, 2021) found that currently only 20% currently participate in this. Proper maintenance would increase overall system efficiency, thus making reaching thermal comfort at lower flow temperatures more feasible.
Key risks to reducing flow temperature
Thermal comfort (human and fabric)
Reaching adequate thermal comfort is the goal of assessing the feasibility of lowered flow temperatures. There are clear guidelines (British Gas, 2022) set by knowledgeable bodies (including the Lullaby Trust, Energy Savings Trust, World Health Organisation and Age UK) for temperatures homes should be heated to depending on the occupant, including:
Homes with new-borns should be heated between 16–20°C
Homes with healthy occupants should be heated to 18°C
Homes with occupants which are old, young or unwell should be heated to 20–21°C (some recommendations state homes can be warmed to 18°C as long as the main living space of the older occupant is heated to 21°C)
In practice, there are many instances where these temperature thresholds are not met, for technical and behavioural reasons. This complicates suitability assessments, because setting the above thresholds may require heating systems to perform to temperatures that are not used in practice. Some behavioural reasons homes are not heated to the above thresholds may include:
Turning heating on/off in bursts, instead of maintaining a constant temperature
Regularly keeping heating at a comfortable temperature below the guideline temperature (for example, 18°C instead of 21°C)
Refraining from heating despite discomfort (often associated with fuel poverty)
The disconnect between recommended thermal comfort and behavioural practice makes assigning a temperature threshold for lowered flow temperature complex, but previous reports and stakeholders generally agree a reasonably lower flow temperature will not cost consumers’ thermal comfort. It should be noted that special care may need to be taken for identified vulnerable consumers.
Nesta and The University of Salford (2022) suggests lower flow temperatures may lead to longer warming times, if flow rate and radiator size are not changed at the same time, due to the decrease in transferable heat. The acceptability of increased warming times would likely require a behavioural study.
Reduced flow temperature could also mean that room temperature cannot reach thermal comfort guidelines. It is not clear by how much and if this would cause a reduction from current practice. In the Nesta and The University of Salford (2022) study, homes with boilers and reduced flow temperature were able to reach within 0.5–2°C of thermal comfort (set at 21 °C in the living room, 22°C in the bathroom and 18°C in all other zones) on an average heating day, which is likely to be sufficient for most homes with healthy consumers.
Similarly, reduced flow temperature may make reaching thermal comfort on peak heating days more difficult. Further testing is likely to be required to better understand the impact of heating during periods of lower external temperatures. It could be the case that systems with reduced flow temperatures are within 2°C of thermal comfort on these peak days, which may be acceptable to occupants, but this is masked by the binary threshold of reaching thermal comfort.
Stakeholders agreed that buildings generally do not suffer from damp, moisture, and mould when the home is heated to human thermal comfort levels. Ensuring thermal comfort for humans is likely to provide adequate heating and avoid impacts on the building structure as well.
Unsuitable ancillary components
In many homes, reducing flow temperature without also retrofitting (e.g., adding insulation, replacing pipework, upgrading radiators) may cause the system to under-perform. The home would not reach thermal comfort due to the reduction of transferable heat and unimproved specific heat loss or system efficiency. Conversely, if the heating system is replaced before the home is retrofitted (insulation and window glazing, for example) the heating emitter could be oversized, causing increased cycling or inefficiency. To ensure this is not the case, retrofitting measures should be implemented before or in tandem with reducing flow temperature for an individual property.
Concerning the building masonry, the level of energy efficiency retrofitting should be balanced against the need to ventilate the home properly and drive moisture out of the walls to avoid deterioration of the home’s exterior. This is a particular concern in older dwellings but should be considered for all dwellings. One stakeholder suggested approximately 100mm of wall insulation would be a good balance, but previous analysis suggests this may not be adequate insulation for energy efficiency. More research may be needed to understand this balance better.
Costs incurred by significantly lower temperatures
The Heat Pump Association suggests homes which are not properly retrofitted to increase heat delivery or decrease specific heat loss could be required to heat their homes for significantly longer periods of time, and thus higher overall energy consumption. This, in turn, would lead to an increase in both energy usage and the absolute value of energy bills.
Our engagement with the Heat Pump Association suggested that lower temperatures will require increasingly airtight, well-insulated homes with larger radiators to ensure the heat loss doesn’t rise above 150W/m2. For most homes, a flow temperature reduction to 45°C should not incur significant financial costs. To reduce flow temperatures further, homes must be increasingly efficient and airtight, potentially with larger radiators. These costs are likely to be prohibitive for many without financial support.
Key benefits to reducing flow temperature
Energy savings
When combined with required retrofits, reducing flow temperatures is expected to reduce energy use significantly. Previous work suggests savings are roughly correlated to the degree of change between the baseline temperature and new flow temperature. There are continued savings to be achieved by lowering flow temperature below 55°C.
Nesta and the University of Salford (2022) found 16–23% energy savings in gas used for heating when flow temperatures as low as 48.2°C were tested. This correlates to roughly 12–17% of overall gas savings at household level (assuming heating accounts for 75% of gas use in residential buildings). At low flow temperatures, care must be taken to ensure a boiler’s intended operating regime is maintained, for example maintaining efficiency of a condensing boiler.
These energy savings will lead to savings in in fuel bill costs at the household level, due to the lowered energy required to heat the distribution system. The level of fuel bill savings will depend on a combination of flow temperature and fuel prices.
Emissions savings will also be a result of flow temperature reduction. Most homes in Scotland are heated with natural gas, so the direct reduction in natural gas use will reduce emissions. For homes heated with electricity, reducing electricity use on a grid that is not completely zero carbon will have indirect emissions reductions.
ZDEH readiness
The Salford Energy House (2022) study shows that even homes using boilers can benefit from reduced flow temperatures. The retrofits and system upgrades required for such a switch are often “no regret” decisions, no matter what future heat source the home will use (whether it be natural gas, hydrogen, electricity or district heating) because these changes improve the overall efficiency of the homes.
In general, low carbon heating systems run on lower temperatures, so all ancillary works, maintenance and upgrades will smooth the transition to a low carbon heating system across all home archetypes. There was agreement amongst stakeholders that ancillary works and reducing flow temperatures prepare houses for ZDEH systems. Systems with lower flow temperatures (including those currently using gas) use less overall energy to meet demand because the whole home system is more efficient.
Methodology for assessing flow temperature reduction
Overview
This study seeks to model the suitability for potential flow temperature reduction in heating systems in Scottish homes. The ideal methodology for an assessment of flow temperature reduction potential would include a property-specific heat loss calculation. In lieu of this, our method uses heat demand and property characteristics as a proxy for current ability to meet demand.
Property characteristics including levels of insulation, current heat distribution systems and heat demand was provided by the Home Analytics Scotland (HAS, 2022) dataset. The HAS dataset provides characteristics of the Scottish housing stock based on a compilation of datasets and modelling. This dataset is the result of whole-stock modelling conducted by the Energy Saving Trust. It should be noted that there is a discrepancy between the number of properties modelled as part of the work in this report (2,747,067 dwellings) and data in the Scottish House Condition Survey (Scottish Government, 2021) which accounts for approximately 10% less homes. We believe this is due to the modelling method used by Home Analytics Scotland.
Our assessment of suitability was led by stakeholder interviews and previous work (Element Energy 2020b, 2021). The previous work developed a suitability assessment for the UK housing stock based on dwellings’ current oversizing factor.
Retrofit options were modelled using prices for materials and labour for individual retrofits taken from previous work for the CCC (Element Energy, 2020a).
Results from suitability modelling were then translated into energy demand reduction using heat demand profiles from the National Energy Efficiency Data-Framework (NEED), Scottish weather data and heat system efficiencies. Cost and emissions savings were calculated using up-to-date fuel prices and emissions data from recent Element Energy analysis.
Modelling approach
Defining suitability
The first step in this study’s methodology was defining suitability, which considered both internal temperature and external temperature. Both sets of temperatures were based on previous work commissioned by BEIS (Element Energy, 2021).
The target internal temperature was 20°C, which is the lower end of the World Health Organisation’s (WHO) recommended internal temperature range for dwellings with vulnerable occupants. While not every home has vulnerable occupants, there is no robust way to predict what homes will be occupied by vulnerable consumers, and as such an internal temperature target was chosen which could meet the needs of any consumer at any hour of a given year. This temperature is also aligned with the Microgeneration Installation Standard (MIS) 3005 (MCS, 2019), which recommends living zones maintain a temperature of 18–22°C.
We tested a dwelling’s ability to reach thermal comfort (20°C) at various external temperature cases:
Winter peak, our central case which tests suitability during the peak heating hour of an average year.
20-year peak, which tested a dwelling’s ability to reach thermal comfort during the peak heating hour of a historic cold snap. Also referred to as a historic cold snap.
Winter average, which tested a dwelling’s ability to reach thermal comfort during an average heating hour in an average winter (as opposed to the peak heating hour in the winter peak).
November average, which tested a dwelling’s ability to reach thermal comfort during an average heating hour in an average “shoulder season” (the heating hour used in this study is taken from an average November).
Suitability at a set internal and external temperature test case was measured based on the dwelling’s oversizing factor, which is the ratio of peak radiator capacity to peak demand. See Appendix 8.2 for more information on why oversizing factors were used in lieu of specific external temperatures. Based on this oversizing factor, we know what minimum flow temperature each dwelling can operate at and still meet thermal demand. Oversizing factor ranges are set out in the BEIS study (Element Energy, 2021). Oversizing factors of between 1.00 and 1.20 suggest a dwelling’s radiator capacity is adequately sized for the dwelling, while an oversizing factor under 1.00 suggests a heat distribution system will not be able to reach thermal comfort and a factor of over 1.20 suggests a heat distribution system is larger than required for the dwelling at a given flow temperature.
Archetyping and radiator mapping
The housing stock was aggregated into seven archetypes with the aim of modelling the suitability and impact of flow temperature reduction for a set of “average” homes. These archetypes were primarily based on stakeholder insights on the key determinates of flow temperature reduction based on their experience (age and house type). These were compared to the archetype design of the BEIS study, which used similar archetypes. The seven archetypes were:
Pre – 1919 flats (approximately 10% of stock)
Pre – 1919 houses (approximately 7%)
1919 – 2002 flats (approximately 23%)
1919 – 1949 houses (approximately 6%)
1950 – 1983 houses (approximately 27%)
1984 – 2002 houses (approximately 10%)
Post – 2002 dwellings (flats and houses) (approximately 14%)
All dwellings in the HAS database were assigned an archetype, which was used for energy demand reduction, fuel bill and emissions savings calculations. We then assigned oversizing factors. Extrapolation of BEIS (Element Energy, 2021) survey data to the entire UK housing stock provided a distribution pattern across archetypes. This was used to assign oversizing factors for Scottish dwellings across the archetypes. Dwellings surveyed in the BEIS study were assigned archetypes from the above list and reassigned a proportion of the archetype stock that they represented based on extrapolation from the original study which maintained the robustness of the original study’s housing stock mapping.
The clearest relationship observed in this data was that between building footprint and radiator capacity, with larger dwellings tending to have larger capacities. Dwellings in the BEIS survey and HAS dataset were ordered by archetype and building footprint. The radiator size, building peak demand and oversizing factors were assigned to dwellings from smallest to largest building footprint, maintaining the correct proportions in the housing stock. For example, if the smallest surveyed home in the pre-1919 flats archetype was found to represent 2.7% of the stock, this dwelling’s data was assigned to the smallest 2.7% of HAS dwellings in the same archetype, and so on. This allowed the data to maintain the same oversizing factor distribution.
Suitability modelling
The suitability of the current housing stock portfolio was modelled based on the minimum flow temperatures each HAS dwelling could operate at using the oversizing factor. Retrofit packages were assigned to dwellings based on their archetype and existing levels of insulation. Two retrofit scenarios were modelled:
The Lower cost retrofit scenario, where retrofit package costs could total approximately £2000 per dwelling, and
The Higher cost retrofit scenario, where retrofit package costs could total up to 10% of the cost of a whole-home renovation. To determine this cost, the average price of a whole home renovation was taken for an “average” home, which was then scaled up or down for each archetype. This led to a range of costs between £6,000 – £12,000 (see Table 1 for these costs).
Flats
Mid Terrace
End Terrace
Semi Detached
Detached
Bungalow
Maximum cost (£/dwelling)
6,123
7,459
9,106
10,670
13,585
11,143
Table 1 Retrofit costs for dwellings in the Higher cost retrofit scenario, by dwelling type
Dwellings were assigned retrofit packages based on the specific dwelling attributes in the HAS dataset. Because these attributes are in the original dataset, retrofit packages were assigned regardless of what external temperature case or radiator sensitivity was being tested.
Each dwelling was assigned two packages, one for each retrofit scenario (see Appendix 8.3 for list of retrofits). In both scenarios, most homes are assigned standard energy efficiency measures and/or radiator upgrades (75% and 71% in the Lower and Higher cost retrofit scenarios, respectively, see Figure 3 below). For many dwellings, additional insulation measures are required based on current level of insulation modelled by HAS. In some of these cases, dwellings can be insulated within the approximately £2000 price bracket, while other homes are more expensive to insulate. In these situations, the cost to insulate falls within the more expensive retrofit scenario.
Figure 3 (Top) Retrofit packages assigned to the Scottish housing stock (Lower cost retrofit scenario); (Bottom) Retrofit packages assigned to the Scottish housing stock (Higher cost retrofit scenario)
Retrofit packages took a fabric first approach, prioritising measures with higher efficiency gains (mostly wall and loft insulation), then measures with lower-efficiency gains (increased draughtproofing, reduced infiltration measures and hot water tank insulation) and finally radiator upgrades where applicable. See Appendix 8.3 for details.
After a retrofit package was assigned to all dwellings in each retrofit scenario, the efficiency increases are applied to the dwellings assigned oversizing factors. This study assumed a direct relationship between energy efficiency increases and demand reduction, so an efficiency increase of 18% was applied by reducing the oversizing factors by 18%. These new oversizing factors were used to reassign dwellings to minimum flow temperatures. In practice, this may not reflect how efficiency increases are observed in dwellings, but an implementation-based study would be required to accurately capture this.
Fuel bill and emissions modelling
Results were aggregated at archetype level and used to find archetype-level energy demand reduction for fuel bill and emissions savings modelling. To calculate energy demand reduction at the archetype level, the average energy demand was calculated from the NEED (BEIS, 2022). Hourly energy demand profiles were calculated using the Watson method (Watson et al., 2019). We assumed all dwellings currently operate at 75°C flow temperature. The difference between 75°C flow temperature and lower temperatures (down to 50°C) was calculated based on the proportion of the stock which could support this for different external temperature case and retrofit scenarios. All dwellings suitable at temperatures below 50°C were modelled using 50°C savings, due to uncertainty over some boiler’s efficiency at lower temperatures. The cost and emissions modelling outputs were expected to be conservative estimates for fuel bill and emissions savings, due to not capturing the potential savings from 85°C to 75°C and temperatures under 50°C.
To calculate fuel bill savings, two fuel prices (representing a historic average and more recent fuel costs) were used to give a range of savings based on the energy demand reduction on national, archetype and archetypal individual dwelling levels.
To calculate emissions savings, the average natural gas emissions in Scotland were applied to the energy demand reduction on national, archetype and archetypal individual dwelling levels. In this calculation, all dwellings were modelled as gas boilers due to the overwhelming majority of boilers in the breakdown of heat distribution systems in the Scottish housing stock. Only 15% of homes do not currently use gas boiler systems, instead running on electricity or off-grid heating systems. Due to higher price per kWh for electricity, we expect these modelled results to be conservative estimates.
Method limitations
This study sets out to model flow temperature reduction suitability, for which practical research has not been conducted previously on Scottish housing stock. Our study aggregated several data sources and relied on previous research to assess suitability in lieu of property-by-property heat loss calculations and real time case studies for retrofitting and monitoring. As such, the method has several limitations that should be acknowledged when considering findings and conclusions (see Table 2 below for an overview of these limitations).
Limit
Rationale
Impact
Mapping radiator capacity, heat demand from BEIS (Element Energy 2021) study
UK/Scottish subset were reasonably aligned; allowed bigger spread of radiator capacity
This means a key element of the suitability criteria is modelled based on UK stock when ideally, we would have data from Scottish property surveys. In addition, this may predispose certain archetypes to being unfairly penalised or rewarded in the suitability modelling based on the smaller sample of dwellings surveyed as part of the BEIS study. This may be the case for the pre-1919 houses, for example, which are difficult to make suitable.
Lack of available data on ancillaries such as pipework
Data not available, so modelling would not have been robust
This factor for flow temperature reduction could not be assessed at present. Stakeholders provided useful insights and guides for further study. We confirmed that pipework was not an essential upgrade to meet the suitability levels we modelled but could be an additional factor to further increase proportions of stock that are suitable.
Thermal comfort was set at 20°C for all scenarios
We felt it was important to keep conservative estimates for internal temperature (led by WHO health standards for vulnerable occupants)
The use of a relatively high internal temperature target risks unfairly comparing dwellings with lower flow temperatures to a counterfactual that does not exist (because homes are often not heated to 20°C, and many homes are currently unsuitable for this level of heating).
Assume all current flows are 75°C in cost and emissions modelling
No reliable data to allow us to assign a proportion of the stock to higher flow temperatures
This may give a conservative estimate to fuel bill and emissions savings (because it captures the change from 75°C to X°C, so the additional savings from 85°C to 75°C are not accounted for).
All costs are set at 2022 prices (adjusted from 2019 data)
Lack of more up to date data with the same level of robustness
Does not consider inflation in future years (a retrofit package in 2024 may be pushed into a higher cost bracket by inflation or other market pressures in future years).
Table 2 Summary of method limitations and key assumptions with rationale and impact
Modelling results
Overview
We find that the majority of Scottish housing stock is currently unsuitable for flow temperature reduction to 55°C or below on a winter peak heating hour. However, more than half (60%) of the stock is suitable for a flow temperature reduction during the less stringent test case using the winter average. Both retrofit scenarios considered increase suitability for flow temperature reduction across all external temperature cases and home types. With Higher cost retrofits, between 64% (winter peak) and 97% (November average) of homes become suitable for a flow temperature of 55°C or below.
Suitability now (2022)
Suitability with lower cost retrofits
Suitability with higher cost retrofits
Winter peak
15%
55%
76%
20-year peak
7%
41%
64%
Winter average
60%
85%
94%
November average
80%
92%
97%
Table 3 Suitability for Scottish housing stock for flow temperatures of 55°C for different temperature cases
Winter peak
The winter peak temperature case measures a heat system’s ability to maintain thermal comfort during the peak heating hour in an average year.
Before Retrofit
Without retrofits, 15% of the housing stock (approximately 410,000 dwellings) in Scotland are suitable for flow temperature reduction to 55°C (See Figure 4 and Figure 5). Most of these dwellings are flats and post-2002 properties. 30% of post-1919 flats are suitable for flow temperature reduction, and 27% of post-2002 flats and houses. Combined, these two archetypes represent 75% of the suitable stock, and 11% of the overall stock. These two archetypes also capture the portions of the stock that can reduce to the lowest flow temperature without retrofits. In both archetypes, a small subset of homes is suggested to be suitable at a 40°C flow temperature without retrofits (7% of suitable post-1919 flats and 1% of suitable post-2002 flats and houses).
Figure 4 Proportion of stock suitable for 55°C, by archetype (no retrofit scenario)
Figure 5 Dwellings suitable for each flow temperature (cumulative, no retrofit scenario)
Pre-1919 houses and flats and mid/late-century houses (1919-2002) are least suitable for 55°C flow temperatures, all having less than 10% of the archetype stock suitable. The majority for each archetype would be able to reduce flow temperature below 75°C (Figure 5). For example, among pre-1919 flats, 58% of homes are suitable for flow temperatures between 60°C and 70°C.
Pre-1919 houses are not suitable for flow temperatures of 55°C. This result is directly related to the archetype’s lower proportion of adequately sized radiators from the mapping exercise and may also be related to the high heat loss rates in these dwellings. This archetype will require more significant energy demand reductions for homes to reach lower flow temperatures. Despite this, there is a proportion of the stock suitable for a more modest flow temperature reduction, with 30% of the stock being suitable to reduce to flow temperatures between 60°C and 70°C.
30% of Scottish housing stock is currently unsuitable for flow temperature below 75°C. 20% of the stock may also be unsuitable to run at 75°C. This suggests these dwellings are either running at temperatures higher than 75°C or are currently unable to reach thermal comfort during periods of peak demand.
Lower cost retrofit scenario
Figure 6 Proportion of stock suitable for 55°C, by archetype (Lower cost retrofit scenario)
Lower cost retrofit packages are effective in increasing the proportion of homes suitable at a range of lower flow temperatures. After retrofits of around £2k, the proportion of homes suitable for 55°C increases to 55%. In addition to homes being suitable for 55°C, 36% of homes are suitable for lower flow temperatures.
Figure 7 Dwellings suitable for each flow temperature (cumulative, Lower cost retrofit scenario)
Post-1919 flats and post-2002 archetypes continue to be most suitable, while the pre-1919 flats and houses and mid/late century (1919-2002) house archetypes had lower suitability, see Figure 6 and Figure 7. While the archetypes maintained the same relative standing, there are large differences in terms of proportions of the archetype stock that become suitable at lower flow temperatures.
The biggest beneficiaries of lower cost retrofits are the 1919-2002 house archetypes and the pre-1919 flat archetype. The absolute value of suitable homes increased between factors of 5x and 11x (pre-1919 flats and 1919-1949 houses, respectively).
Before retrofits are applied, older dwellings are generally less suitable for lower flow temperatures (see Figure 4). When retrofits are applied, the age of a dwelling appears to matter less than dwelling type (flat or house) with the suitability of pre-1919 flats being similar to houses built from 1950-2002.
The large proportion of the stock that becomes suitable after lower cost retrofits suggests that many dwellings in Scotland may be close (in monetary terms) to suitability for flow temperatures of 55°C. If 55°C is chosen as a “target” temperature, this suggests many homes in Scotland could achieve this target, even with stringent suitability criteria, for a relatively small amount of money. One or two larger efficiency measures (wall and/or loft insulation), an ancillary upgrade (radiators) or three smaller efficiency measures (hot water tank insulation, draughtproofing and reduced infiltration measures) would be required.
Higher cost retrofit scenario
After more extensive retrofits, 76% of the housing stock reaches suitability for reduced flow temperatures of 55°C. Similar, to the base and lower cost retrofit scenario, the post-1919 flats and post-2002 dwellings have the highest rates of suitability (see Figure 8). All archetypes other than pre-1919 houses are above 66% suitability for 55°C flow temperatures within their respective archetype stocks. The archetype with the largest change between scenarios is the pre-1919 homes, with suitability increased by a factor of over seven. In this scenario, almost half of the stock in this archetype reaches suitability (46%).
More homes in this scenario can reach even lower flow temperatures (i.e., flow temperatures between 30°C and 50°C). However, the lower cost retrofits changed the proportion of suitability for 55°C for a higher absolute number of homes than the higher cost retrofits (an additional ~1 million homes suitable, compared to an additional ~600,000 homes).
Figure 8 Proportion of stock suitable for 55°C, by archetype (Higher cost retrofit scenario)
Figure 9 Dwellings suitable for each flow temperature (cumulative, Higher cost retrofit scenario)
20-year peak (historic cold snap)
The 20-year peak temperature case is our most stringent external temperature case, testing the ability for a dwelling to meet thermal comfort in a historic cold snap (the coldest day recorded in a given postcode for the past 20 years).
Without retrofits, the proportion of homes suitable to reduce to a flow temperature of 55°C include is only 7% of the stock (see Figure 10 and Figure 11), mostly consisting of post-1919 flats (4%) and post-2002 houses and flats (2%).
Some housing remains suitable for a flow temperature reduction below 75°C. Most suitable homes are post-1919 flats (15%), 1950-1983 houses (11%) and post-2002 flats and houses (10%).
In this case, over half (52%) of dwellings cannot meet thermal comfort below 75°C. In addition, 33% of the stock is not suitable for 75°C and is either currently operating at a higher flow temperature or would be unable to meet thermal comfort during a 20-year peak/historic cold snap.
Figure 10 Proportion of stock suitable for 55°C, by archetype (no retrofit scenario)
Figure 11 Dwellings suitable for each flow temperature (cumulative, no retrofit scenario)
Lower cost retrofit scenario
The application of lower cost (~£2k) retrofits also brings a significant portion of the housing stock to suitability for 55°C flow temperatures. 40% of the total housing stock could reach suitability even during a 20-year peak/historic cold snap (see Figure 12 and Figure 13).
Post-1919 flat and post-2002 dwellings archetypes continue as most suitable archetypes, both increasing by just over a factor of four. Combined, the suitable stock in these two archetypes represents almost one quarter of the total housing stock (23%).
Figure 12 Proportion of stock suitable for 55°C, by archetype (Lower cost retrofit scenario)
Figure 13 Dwellings suitable for each flow temperature (cumulative, Higher cost retrofit scenario)
Before retrofits, a correlation between age and suitability could be observed, with newer homes having slightly higher rates of suitability. After retrofits, the 1919-1949 homes and 1984-2002 houses have similar rates of suitability (24% and 27% respectively), while 10% more houses in the 1950-1983 archetype are suitable (36%). This suggests more houses in this archetype had oversizing factors on the higher end of each range, thus the same retrofit measure could have transitioned one home to 55°C and a house from one of the other archetypes to only 60°C. It could also suggest that more houses in this archetype required wall or loft insulation, and thus benefited more than other archetypes which received smaller energy efficiency uplifts from the “standard” measures.
Higher cost retrofit scenario
The archetypes with the highest proportions of suitability continue to be the post-1919 flats and post-2002 dwellings (78% and 92% of their respective stocks, and 32% of the total stock, see Figure 14 and Figure 15). All archetypes other than pre-1919 houses improve suitability for 55°C flow temperatures to above 51% of their respective archetype stock. In total, 64% of the stock becomes suitable after more extensive retrofits.
The change in suitability across the archetypes between the lower and higher cost retrofits are larger than in the winter peak case. Therefore, if the 20-year peak was chosen as the external temperature case to assess dwelling suitability, higher cost retrofits would be required achieve a high degree of suitability for lower flow temperatures. The absolute number of stock suitable would still be lower than in the other external temperature cases considered.
Figure 14 Proportion of stock suitable at 55°C, by archetype (Higher cost retrofit scenario)
Figure 15 Dwellings suitable for each flow temperature (cumulative, Higher cost retrofit scenario)
Average external temperature cases
The two ‘average temperature’ cases (winter average and November average) were tested to gauge the suitability of dwellings under less stringent criteria. The results show that with less stringent criteria, much larger proportions of the stock are already, or can be made suitable, for 55°C and lower flow temperatures. See Appendix 8.5 for full archetype results.
The results show that 60-80% of homes are already suitable for 55°C flow temperatures for these less stringent external temperature cases. Lower cost retrofits increase this to 85-92% (for winter average and November average respectively). Higher cost retrofits result in almost all homes being suitable for 55°C (94-97%).
Importance of radiator upgrades
In half of the model runs, we investigated a reduced potential for radiator upgrades in all dwellings. The intention was to model the potential for flow temperature reduction when there were significant barriers to radiator upgrades (which could be caused by impracticalities or aesthetics).
In the winter peak cases, reducing radiator uptake decreases the suitability of the stock at every flow temperature tested. This demonstrates that upgrading radiators could be a key retrofit measure for facilitating flow temperature reduction.
Figure 16 Comparison of dwellings suitable at each flow temperature (cumulative) when reduced and recommended rates of radiator uptake are tested in peak external temperature cases, Lower cost retrofit scenario (above) and Higher cost retrofit scenario (below)
Fuel bill and emissions modelling
The final step in this study is translating energy demand reductions from lower flow temperatures into fuel bill and emissions savings estimates by archetype.
Fuel bill modelling
At a flow temperature of 55°C, dwellings can save between £50 and £300 per year depending on the archetype and fuel cost scenario. The ranges for each archetype are set by applying low and high fuel costs to the archetype’s average annual heat demand from the NEED database (BEIS, 2022). As such, this is reflective of the archetype’s average energy demand patterns as opposed to being reflective of anything tested or modelled in the suitability assessment detailed above. Based on the NEED data, the flat archetypes and 1984-2002 houses will potentially save the most in fuel bills on a per dwelling basis (see Figure 17).
Figure 17 Cost savings when moving from 75°C to 55°C (showing cost range from 4.5p/kWh and 10.3p/kWh)
When aggregated, the potential for fuel bill savings is significant (Table 4). At the lower fuel price, savings range from £151m-£249m depending on the temperature case and retrofit scenario. Higher fuel prices increase this to £345m-£624m.
Lower cost retrofits
Higher cost retrofits
Lower fuel price
Higher fuel price
Lower fuel price
Higher fuel price
Winter peak
£181m
£414m
£219m
£501m
20-year peak
£151m
£345m
£198m
£454m
Winter average
£233m
£580m
£244m
£624m
November average
£244m
£558m
£249m
£570m
Table 4 Aggregated total fuel bill savings per year for all temperature cases and retrofit scenarios (at both fuel prices)
Table 5 shows the potential savings if all dwellings’ flow temperatures are reduced as low as they are suitable higher cost retrofits are applied at archetype level. In this temperature case, highest savings come from the post-1919 flats and the 1950-1983 houses.
The winter peak temperature case results in higher savings than the 20-year peak. This is due to a higher absolute number of suitable homes at increasingly lower flow temperatures in the winter peak case, which uses less stringent suitability criteria.
Savings per year, by archetype (£m)
Winter peak
20-year peak
Lower fuel price
Higher fuel price
Lower fuel price
Higher fuel price
Pre-1919 flat
34.58
79.16
30.40
69.59
Pre-1919 house
9.19
21.03
7.16
16.39
1919-2002 flat
64.40
147.40
60.70
138.94
1919-1949 house
12.95
29.63
11.38
26.04
1950-1983 house
47.85
109.52
41.44
94.85
1984-2002 house
26.01
59.54
23.62
54.06
Post-2002
23.92
54.75
23.48
53.75
Table 5 Potential for fuel bill savings (£m/yr) in peak external temperature cases when all suitable dwellings reduce flow temperatures to 55°C, aggregated to the archetype level (Higher cost retrofit scenario)
Savings per year, by dwelling (£)
Winter peak
20-year peak
Average cost to retrofit
Lower fuel price
Higher fuel price
Lower fuel price
Higher fuel price
Pre-1919 flat
£1331
117.43
268.78
103.23
236.28
Pre-1919 house
£4831
45.27
103.62
35.29
80.78
1919-2002 flat
£754
99.76
228.35
94.04
215.24
1919-1949 house
£2354
72.09
165.00
63.35
145.00
1950-1983 house
£2600
63.35
145.01
54.87
125.59
1984-2002 house
£2404
96.39
220.63
87.52
200.31
Post-2002
£396
59.89
137.08
58.79
134.57
Average
£2096
£79.68
£182.39
£72.14
£165.13
Table 6 Potential for fuel bill savings in peak external temperature cases when all suitable dwellings reduce flow temperatures to 55°C, on a per dwelling basis (Higher cost retrofit scenario)
When assessed on a per dwelling basis (see Table 6), the archetypes with the highest fuel bill savings include the pre-1919 flats, post-1919 flats and 1984-2002 houses. These all have the highest rates of savings per dwelling as a direct result of their archetypes’ NEED data. The other archetypes have similar savings per archetype, and the pre-1919 houses have the lowest potential savings at the household level.
Table 7 shows the impact of reducing flow temperatures a further 5°C, to 50°C. Estimates for total fuel bill savings are given. Dwellings suitable for reduction beyond 55°C are assigned savings from reducing to 50°C. The range of savings is increased to £181m-£802m (from £151-£624m at 55°C) depending on the temperature case and retrofit scenario.
Savings per year
Lower cost retrofits
Higher cost retrofits
Lower fuel price
Higher fuel price
Lower fuel price
Higher fuel price
Winter peak
£227m
£519m
£291m
£666m
20-year peak
£181m
£414m
£251m
£575m
Winter average
£318m
£728m
£350m
£802m
November average
£347m
£795m
£363m
£831m
Table 7 Aggregated total fuel bill savings per year for all temperature cases and retrofit scenarios (at both fuel prices) when all suitable dwellings reduce flow temperatures to 50°C
Emissions modelling
At 55°C, dwellings can save between 2.5 kgCO2/year and 5.5 kgCO2/year depending on the archetype. The emissions saving estimate for each archetype is set by applying the archetype’s average annual heat demand to the carbon intensity of natural gas used for residential heating in Scotland. Based on this, the flat archetypes and 1984-2002 houses have the highest potential emissions savings (see Figure 18).
Figure 18 Emission savings when moving from 75°C to 55°C – showing emissions based on 0.184 kgCO2/kWh for natural gas
When aggregated to the archetype level, the potential for emissions savings ranges from 8.10 MtCO2/yr in the 20-year peak to 8.95 MtCO2/yr in the winter peak for higher cost retrofits. The November average and winter average result in higher emissions savings than the winter peak and 20-year peak temperature case (see Table 8). This is expected due to the increasingly stringent suitability criteria meaning that more homes are suitable for reduced flow temperatures in the average cases compared to peak cases. Lower cost retrofits also reduce potential emissions savings, with a range of 6.17 MtCO2/yr (in the 20-year peak temperature case) to 9.96 MtCO2/yr (November average temperature case).
Total savings per year (MtCO2/yr)
Lower cost retrofits
Higher cost retrofits
Winter peak
7.40
8.95
20-year peak
6.17
8.10
Winter average
9.54
10.00
November average
9.96
10.18
Table 8 Potential emissions savings across all temperature cases and retrofit scenarios when all suitable dwellings reduce flow temperatures to 55°C
Table 9 shows the potential savings if all dwellings’ flow temperatures are reduced as low as they are suitable after higher cost retrofits are applied. Most savings come from the post-1919 flats, followed by the 1950-1983 houses and pre-1919 flats.
Savings per year, by archetype (MtCO2/yr)
Winter peak
20-year peak
Winter average
November average
Pre-1919 flat
1.41
1.24
1.56
1.57
Pre-1919 house
0.38
0.29
0.49
0.51
1919-2002 flat
2.63
2.48
2.82
2.84
1919-1949 house
0.53
0.47
0.62
0.64
1950-1983 house
1.96
1.69
2.33
2.40
1984-2002 house
1.06
0.97
1.19
1.23
Post-2002
0.98
0.96
0.99
0.99
Table 9 Potential emissions savings in peak external temperature cases when all suitable dwellings reduce flow temperatures to 55°C, aggregated to the archetype level (Higher cost retrofit scenario)
Table 9 shows the breakdown of the emissions savings by archetype for all temperature cases with higher cost retrofits. The pre-1919 house archetype has the lowest potential savings at archetype level while post-1919 flats and 1950-83 houses provide the highest emissions savings.
Table 10 shows the impact of reducing flow temperatures a further 5°C, to 50°C. Dwellings suitable for reduction beyond 55°C are assigned savings from reducing to 50°C. This shows that emissions savings increase at the lower flow temperature.
Savings per year, by archetype (MtCO2/yr)
Lower cost retrofits
Higher cost retrofits
Winter peak
9.27
11.90
20-year peak
7.39
10.27
Winter average
13.01
14.33
November average
14.19
14.85
Table 10 Potential emissions savings in all external temperature cases and retrofit scenarios when all suitable dwellings reduce flow temperatures to 50°C
Conclusions
The evidence base for flow temperature reduction
This study finds a strong theoretical case for broad flow temperature reduction in heating systems and suggests that 55°C is a suitable temperature target, which could result in reductions in energy demand and emissions at individual dwelling level.
While previous work and stakeholders suggest many dwellings will be able to run at 55°C without significant retrofitting, we note the importance of assessing suitability with property-by-property specific heat loss calculations. Our study and others use a variety of factors including ancillary component characteristics, building insulation levels and oversizing factors as proxies for a dwelling’s suitability. However, minimum flow temperature potential should be based on a property-level assessment where possible.
Suitability of the Scottish housing stock
This study has found a lower current level of suitability than suggested through the literature review and stakeholder engagement process. We found 15% of the current housing stock would be suitable for reduced flow temperature at present in our winter peak temperature case, which decreases to 7% in the 20-year peak case.
Suitability increases significantly after retrofits, reaching 55% and 76% of the total stock in the winter peak case after lower cost and higher cost retrofits, respectively. In the 20-year peak case, overall stock suitability rises to 41% to 64% after lower cost and higher cost retrofits, respectively.
There is also potential for dwellings to lower flow temperatures below 55°C, potentially into the 30–50°C range (60% of dwellings in the winter peak, higher cost retrofit scenario), given the heat distribution system’s operating regime is properly maintained and sufficient retrofits are undertaken. This may be more straight forward in some dwelling types than others, particularly flats and recent properties.
The most important factor when assessing suitability for flow temperature reduction is setting suitability criteria that adequately captures the needs of occupants. Our two key temperature cases use particularly stringent criteria, requiring that dwellings should be heated to 20°C during the coldest hour of an average or historic year. This is an ambitious goal and not one currently being met by many heating systems operating between 70°C–80°C, as evidenced by the significant portion of homes that could not meet thermal comfort while operating at 75°C in the scenarios modelled in this study. Care should be taken to ensure that suitability is sufficiently, but not overly, stringent.
The other temperature cases tested in this study (winter average and November average) test a dwelling’s ability to meet suitability during a heating hour in average winter temperatures. Significantly larger proportions of dwellings are suitable for low flow temperatures in these cases suggesting that for most of the year, many homes are suitable to run at lower flow temperatures than in our stringent test cases. Exploring the potential for varying flow temperatures throughout the year could be one way to increase the fuel bill and emissions savings overall, only increasing the flow temperature when heat distribution systems need to meet thermal comfort in peak hours.
Varying internal temperatures may also bring more homes into suitability for lower flow temperatures but this was not modelled in this study. If the internal temperature was lowered (for example to 18°C, which is in the healthy living range for healthy, not vulnerable, occupants) during peak heating hours, more homes could be made suitable. In practice, this would imply an acceptance that domestic heating systems are not expected to meet the higher end of thermal comfort during peak heating hours, which is already the case in many dwellings.
Our study suggests some dwelling archetypes will have higher proportions of the stock already suitable at lower temperatures and that these archetypes will also likely be easier to retrofit for flow temperature reductions. These dwellings tended to include flats and post-2002 dwellings. This could be due to multiple factors, including building footprint in the case of the flats and better building regulations which mandate higher levels of efficiency in the newer dwellings.
Conversely, some dwellings are likely to be harder to prepare for flow temperature reduction and will have a smaller proportion of the stock able to transition without retrofits. This study showed the difficulty in transitioning the pre-1919 houses, which are currently unsuitable for 55°C. These are larger, built with solid walls and tend to have undersized heating systems. This means more expensive retrofits will likely be required to support these dwellings in transitioning to lower flow temperatures. Our modelling identifies that after higher cost retrofits than for other dwelling types, almost half of homes in this archetype can reach suitability for reduced flow temperatures to 55°C.
Retrofitting the housing stock
A consistent finding from this study is that across archetypes and scenarios, retrofits significantly improve the proportion of the housing stock suitable for flow temperature reduction. We have found that building envelope retrofits (insulation, window glazing) and ancillary upgrades (pipework, radiators) are complementary in the transition to ZDEH systems. This means that building retrofits could be a reliable way to increase suitability for reduced flow temperatures and, at a later date, ZDEH systems.
To prepare a dwelling for lower flow temperatures, we suggest that building envelope measures are prioritised to reduce the overall energy demand of the home. Where this is not possible (because dwellings are not adequately insulated, for example) ancillary upgrades should be implemented. Radiator upgrades could be implemented, and the same goal of flow temperature reduction could be achieved but this does not improve energy efficiency in the domestic heating system.
Increased budgets for retrofits lead to increased gains in fuel bill and emissions reductions by allowing dwellings to achieve lower flow temperatures. Even the lower cost retrofit packages resulted in significant fuel bill savings (£151m–£580m depending on temperature case and fuel cost) and potential emissions savings (6.17–9.96 MtCO2/year depending on temperature case).
Benefits to flow temperature reduction
Our findings indicate that there is potential for fuel bill and emissions savings across all archetypes. With higher cost retrofits, fuel bill savings from transitioning the stock to lower flow temperatures could total between £198m and £501m depending on the winter temperature case. Emissions savings are suggested to follow the same trends, with potential to save between 8.10 MtCO2/year and 10.18 MtCO2/year (depending on the winter temperature case).
The fuel bill savings and emissions reduction modelling undertaken in this work supports the view that any flow temperature reduction, whether around 55°C or lower, will bring benefits.
Appendices
Stakeholder engagement summary
Targeted stakeholder engagement was carried out to source further quantitative information and qualitative insights from industry experts. Stakeholders were selected due to their expertise on specific areas of interest and practical experience in this area. A summary of the relevance of the organisation and topics discussed for each stakeholder organisation is shown below.
Organisation: Historic Environment Scotland
Relevance: Knowledgeable government agency
Topics discussed:
Thermal comfort of occupants and building fabric (with an emphasis on maintaining enough ventilation in the dwelling to avoid moisture build-up, resulting in damp and mould).
Potential to reduce the flow temperature in historically built dwellings (in our study, this means the pre-1919 flats and houses) and what insulation measures might best support this aim.
Suitability for historically built dwellings to maintain lower internal temperatures than occupants can safely live in, thus suggesting internal temperature is not a concern for the health of the building envelope.
Potential difficulty in renovating historically built homes, particularly challenges around floor insulation and double/triple window glazing.
Benefits to lowering flow temperatures and heating the house more gradually.
Organisation: Heat Pump Association
Relevance: Industry organisation
Topics discussed:
Confirmation of HPA’s assertion that 55°C is the “target” flow temperature for all dwellings, and reasoning behind this (discussion around 55°C as the “compromise” between the increased efficiency of boilers at lower flow temperatures and heat pumps’ ability to operate efficiently at up to approximately this temperature).
The trade-off between benefits of reduced flow temperature and increasingly stringent requirements for air tightness and increased energy efficiency measures in the dwelling, which also played a role in HPA’s selection of a “target” flow temperature.
Discussion of risks of legionella, and components of heat pumps which will guard against legionella risk (including a broader discussion on factors causing legionella).
Organisation: Renewable Heat
Relevance: Heat pump installation specialists
Topics discussed:
Potentially for the Scottish housing stock to reduce flow temperature, based on experience and monitoring efforts by renewable heat (this include a conversation regarding how to best consider whether dwellings might be suitable for flow temperature reduction based on their type and age, then being further segmented by insulation measures and specific heat loss rates).
Discussion around credibility of HPA’s target flow temperature across homes, which Renewable Heat thought was a generally sound target.
Discussion around potential to reduce flow temperature beyond 55°C, and the difficult of preparing the housing stock for temperatures this low, including what potential considerations may need to be taken for various dwellings, particularly the historically built dwellings.
Rules of thumbs for what heat loss rates are required for reducing the flow temperature in 5°C increments, and at what point underfloor heating would be required regardless of building envelope and a low heat loss rate, based on the company’s installations.
Potential for pipework replacement required as part of ancillary upgrades to the dwelling due to pipes with smaller diameters being common in the late 20th century (this would be relevant if the flow rate of the heat distribution system needed to be increased to improve heat transfer).
Organisation: Ovo Energy
Relevance: Energy company, heat pump trial participant
Topics discussed:
Potential for boiler and heat pump systems to reach flow temperatures of 55°C or lower, and the difference in low temperature versus high temperature units.
Impact of refrigerant type on heating system performance.
Importance of prioritising building envelope retrofits to increase energy efficiency as a means of overall energy use reduction.
Potential oversizing of radiators in the housing stock today.
Importance of retrofitting the dwelling before/as the heat system or ancillary components are being replaced, to avoid an unnecessarily large oversizing factor.
Ability for homes with heat pumps and lower flow temperatures to meet thermal comfort, with discussion of case studies in cold-weather climates (i.e., Scandinavia).
Organisation: Energy Saving Trust
Relevance: Knowledgeable company
Topics discussed:
Validation of topics discussed in above stakeholder engagement.
Potential oversizing of radiators in the housing stock today.
Building envelope efficiency measures versus ancillary component (mainly radiators) upgrades for flow temperature reduction.
Importance of prioritising overall energy efficiency over ancillary upgrades as a means of overall energy use reduction (and the importance of preparing the stock for flow temperature reduction as a means of achieving other goals such as overall energy reduction, decarbonisation, etc.).
Peak external temperature cases
In this study, we used external temperature cases assigned to specific properties from previous analysis for BEIS (Element Energy, 2021) to inform oversizing factors for heating systems. Oversizing factors for properties, which included the relationship between peak external temperature and radiator capacity, were used instead of assigning specific peak external temperatures to each home. Homes are not explicitly assigned peak external temperatures because this would require granular data about the heat system capacity of individual homes, which was not available in the HAS data.
The temperatures in the original modelling (Element Energy, 2021) are more akin to Scottish central belt temperatures. The external temperatures from the original study would not be an accurate reflection of average Scottish temperatures across the whole country, so were not used in this work. Instead, we extrapolated the relationship between external temperature and the ability for heat systems to meet demand in homes.
These temperatures, and the distribution of homes they were applied to in the original BEIS modelling, were used with other factors, e.g., heat system capacity, to determine oversizing factors under different external temperature cases to determine suitability for lower flow temperatures.
Although specific external temperatures were not used directly in this work, the approximate temperatures represented by the four external temperature cases would be in the order of:
Winter peak: around 0 to -10°C
20-year peak: around -10 to -20°C
Winter average: around 1 to 3°C
November average: around 3 to 5°C
Retrofit package data
Retrofit Package
Average cost (£, flat)
Efficiency increase
Cost per marginal increase to efficiency (£/% efficiency gained)
Average cost (£, houses)
Efficiency Increase
Cost per marginal increase to efficiency (£/% efficiency gained)
Cavity wall, loft and floor insulation with radiator upgrade
–
–
–
£7633.16
24%+ Oversizing factor doubles
£318.05
Loft and floor insulation
£3495.33
29%
£120.53
£5410.75
24%
£225.45
Solid wall and loft insulation
£2979.05
37%
£80.51
£5766.00
28%
£205.93
Solid walls, loft and floor insulation
£5900.51
48%
£122.93
£8253.73
37%
£223.07
Building-envelope led method for suitability assessment
A central finding from our stakeholder engagement is the estimation of a dwelling’s suitability based on a combination of the dwelling’s building envelope (i.e., levels of various insulation) and peak heat demand. This approach is based on the following principle:
In pre-1919 dwellings (flats and houses), operating at 55°C is possible with double/triple window glazing, loft insulation of at least 100mm and draughtproofing measures.
In flats, operating at 55°C is possible with double/triple window glazing and wall insulation. These conditions are the same to operate at 50°C (only achievable in homes built after 1984) and 45°C (only achievable in homes built after 1992).
In houses, operating at 55°C is possible with double/triple window glazing, loft insulation of at least 100mm and wall insulation. To run at lower temperatures, houses must have 250mm of loft insulation and floor insulation. Temperatures below 45°C are not suitable without underfloor heating or a heat demand threshold below 45Wm2.
Based on this, dwellings could be roughly designated a minimum flow temperature based on their archetype and insulation levels. See below for an estimate of what dwellings are considered always suitable (green – always), suitable depending on insulation measures (yellow – depends) and unsuitable without underfloor heating or peak heat demand below 45W/m2 (red – unsuitable).
55°C
50°C
45°C
40°C
35°C
Pre-1919 flat
sometimes
unsuitable
unsuitable
unsuitable
unsuitable
Pre-1919 house
sometimes
unsuitable
unsuitable
unsuitable
unsuitable
’19-’02 flat
sometimes
sometimes
sometimes
unsuitable
unsuitable
’19-’49 house
sometimes
sometimes
sometimes
unsuitable
unsuitable
’50-’83 house
sometimes
sometimes
sometimes
unsuitable
unsuitable
’84-’02 house
sometimes
sometimes
sometimes
unsuitable
unsuitable
Post-‘02 flats and houses
always
always
sometimes
unsuitable
unsuitable
The results of our modelling generally agree with the finding that all dwelling types could, in theory, reach lower flow temperatures (45 – 55°C). Our study additionally finds that many dwellings in all archetypes, after some level of retrofits, could operate at even lower flow temperatures (35 – 45°C). This contrasts the stakeholders’ assumptions that for older dwelling types these low temperatures may not be attainable. It is important to note that while this approach was discussed with us by stakeholders with ample experience in home retrofitting, it is not backed by any quantitative study and as such may best be considered as “robust rules of thumbs”. In practice, dwelling suitability should be based on a quantitative assessment undertaken at the property level.
Detailed results – suitability modelling
Winter peak – suitability now (all winter peak scenarios)
Number of dwellings suitable at each flow temperature, by archetype
Pre-1919 flat
Pre-1919 house
1919-2002 flat
1919-1949 house
1950-1983 house
1984-2002 house
Post-2002
30°C
–
–
–
–
–
–
–
35°C
–
–
–
–
–
–
–
40°C
–
–
13,129
–
–
–
555
45°C
–
–
34,106
–
5,140
6,127
7,851
50°C
–
–
86,664
2,740
17,290
6,127
38,145
55°C
12,515
–
193,456
12,718
63,901
18,180
107,716
60°C
34,830
13,479
323,560
40,452
184,780
74,660
188,503
65°C
105,485
35,131
409,306
87,930
347,068
167,539
246,342
70°C
183,445
60,266
494,218
108,147
505,634
204,541
358,035
75°C
212,125
102,801
566,410
129,864
601,460
216,426
375,979
80°C
253,320
122,005
589,514
144,744
670,749
229,331
392,185
85°C
273,917
154,294
608,833
152,820
712,624
241,216
392,185
90°C
294,515
202,925
645,503
179,580
755,251
269,874
399,419
Winter peak – Lower cost retrofit scenario
Number of dwellings suitable at each flow temperature, by archetype
Pre-1919 flat
Pre-1919 house
1919-2002 flat
1919-1949 house
1950-1983 house
1984-2002 house
Post-2002
30°C
–
–
–
–
–
–
–
35°C
–
–
13,929
–
–
–
448
40°C
–
–
85,543
–
17,960
286
17,143
45°C
6,350
–
268,355
14,754
79,266
17,672
85,326
50°C
88,836
1,837
396,258
38,466
236,930
72,603
158,850
55°C
138,703
12,591
522,090
60,495
377,385
126,057
267,161
60°C
200,687
33,866
575,252
100,921
502,890
162,693
294,799
65°C
244,355
63,463
611,965
129,972
609,035
206,203
349,079
70°C
272,197
104,343
631,749
146,453
670,055
214,351
390,531
75°C
279,739
130,707
640,352
154,715
705,860
227,956
397,162
80°C
291,369
156,971
643,239
162,089
737,202
241,242
399,267
85°C
292,231
178,000
644,254
170,539
748,796
241,553
399,419
90°C
294,515
202,925
645,503
179,580
755,251
269,874
399,419
Winter peak – Higher cost retrofit scenario
Number of dwellings suitable at each flow temperature, by archetype
Climate Change Committee (CCC, 2022) Reducing energy demand in buildings in response to the energy price crisis. Climate Change Committee: London
Element Energy (2020a) Development of scenarios and trajectories to decarbonise residential homes, with a view to informing the UK’s long term targets: A study for the Committee on Climate Change
Element Energy (2020b) Technical Feasibility of Low Carbon Heating in Domestic Buildings. Scottish Government’s Directorate for Energy & Climate Change: Edinburgh
Element Energy (2021) Domestic heat distribution systems: evidence gathering, Department for Business, Energy & Industrial Strategy: London
Health and Safety Executive (HSE) Legionnaires’ disease: the control of legionella bacteria in water systems. London
Microgeneration Certification Scheme (2019) Requirements for MCS contractors undertaking the supply, design, installation, set to work, commissioning and handover of microgeneration heat pump systems – Issue 5.0. Available at: https://mcscertified.com/wp-content/uploads/2019/08/MIS-3005.pdf
Nesta & Cambridge Architectural Research (2022) Money saving boiler challenge: supporting evidence. Nesta: London
Nesta & University of Salford (2022) Salford Energy House Boiler Flow Temperature Testing: Initial Report
Veissmann (2016) Control technology: Weather compensated controls. Viessmann: Telford
Watson, Lomas and Buswell (2019) Decarbonising domestic heating: What is the peak GB demand?. Energy Policy. 126. (pp. 533 – 544). Available at: https://doi.org/10.1016/j.enpol.2018.11.001
How to cite this publication:
Martin, M; Foster, S; Dias, J; Benjamin, S. (2023) Reductions in maximum flow temperatures in Scottish domestic heating, ClimateXChange. http://dx.doi.org/10.7488/era/3385
While every effort is made to ensure the information in this report is accurate, no legal responsibility is accepted for any errors, omissions or misleading statements. The views expressed represent those of the author(s), and do not necessarily represent those of the host institutions or funders.
This work was supported by the Rural and Environment Science and Analytical Services Division of the Scottish Government (CoE – CXC).
If you require the report in an alternative format such as a Word document, please contact info@climatexchange.org.uk or 0131 651 4783.
Note “Standard efficiency measure” includes draughtproofing, reduced infiltration and hot water tank insulation. All packages except radiator upgrades in the Lower cost retrofit case include standard efficiency measures. ↑
This work was carried out in accordance with the requirements of the international quality standard for Market Research, ISO 20252.
Executive summary
This report presents findings from research exploring the role of government in public engagement and ways to improve Scottish Government’s public engagement approach on climate change. The research is part of the mid-point review of the Scottish Government’s Public Engagement Strategy for Climate Change (PES).
Aims
The research aimed to address the following questions:
What does recent thinking and research suggest are the most effective roles and practical actions a government such as the Scottish Government can take to successfully engage the public on climate change and deliver the aims of the PES?
What lessons can be learned from approaches taken by comparative governments internationally to improve delivery of the aims and activities of the PES?
What are the views of the public in Scotland on the most appropriate ways for the Scottish Government to engage them on climate issues?
The overall aim of the study was to compare findings with the principles set out in the PES and identify any lessons that could enhance the delivery of the PES going forward.
Approach
The research was carried out between September 2024 and January 2025. It involved three strands:
Stakeholder interviews exploring views from a range of practitioners and specialists involved in public engagement to complement the evidence review
A desk-based evidence review to identify public engagement activities and examples of best practice
Focus groups with members of the public to understand their views on how the Scottish Government should approach public engagement on climate change.
Findings
The research showed that there is no single best way to engage the public on climate change. Public engagement should use multiple and varied contexts, scales, activities, depths of engagement, approaches and intervention points.
A number of different examples of best practice on climate change public engagement were identified, grouped under three broad categories:
Communication and education. This includes large-scale communication campaigns, information packs, door-to-door canvassing, broadcast, social media campaigns and educational activities. Much of the best practice on communication and education is already captured in the PES. This includes the need to be inclusive and accessible, to communicate with different audiences in different ways, to use trusted messengers, and to use messaging that highlights the relevance to individuals and the practical actions they can take.
Deliberative engagement and co-design. This includes a wide range of participatory activities designed to help people to take part in decision-making processes. The PES has been developed with the good practice principles of participation in mind in line with the Scottish Government’s Participation Framework and the Open Government approach. The findings highlight best practice that aligns with many of the PES principles such as being participative, inclusive, open and transparent. The findings also highlight areas for consideration in the implementation of these types of activities as part of the PES, as outlined below.
Creative activities. This includes public engagement using art, digital tools, games, virtual reality and other creative approaches. Generally, the evidence supports the effectiveness of creative interactive engagement methods for a variety of outcomes. However, creative forms of engagement are not explored in detail in the PES and could therefore be an area for greater focus going forward.
Implications for the PES
To help identify next steps, the key lessons from this research were presented in two groups:
Areas in which the content of the PES already aligns with best practice, and which should be continued: Themes such as inclusion, transparency and evidence-based approaches are all principles for the PES and were all identified in this research as important features of public engagement. This suggests that the Scottish Government’s approach is already in line with some of the public engagement best practice happening in other places.
Areas that are not currently included or not outlined in detail in the PES. These approaches, grouped below under the three overarching objectives of the PES, should be considered for the remainder of the PES.
Understand (Communicating climate change)
On messaging, ensure that climate change is framed in a way that is relevant to the lives of individuals and communities, reflects the context (cultural, political, geographic and others) and is focussed on practical actions for individuals.
As well as using positive messaging, do not shy away from conveying the negative consequences of inaction on climate change. While there is a potential conflict between those two directions, the overall sentiment was that governments should be honest about the realities and associated risks of climate change, but also convey positive, practical actions that the public can adopt.
When conveying the message, the research has identified the characteristics of (e.g. being authentic, sincere, kind, honest, credible) and types of people (e.g. naturalists, healthcare professionals, scientists) who are considered trusted messengers, and those that are not. It also highlights the benefits of exploring different approaches such as the use of visual communication and humour.
Take measures to build collective efficacy such as using messaging that emphasise social norms, shared beliefs and a sense of community. Examples of this include sharing testimonials, photos and videos of citizens taking action, or hosting competitions, quizzes and user-generated content on social media.
In education settings, encourage and enable approaches that foster collaboration and co-design with learners. Further explore opportunities for workforce training on technical aspects of climate change.
Participate (Enabling participation in policy design)
Demonstrate that the public have been listened to and that action has been taken as a result of their participation. This was a strong theme in the general public focus groups and they considered it a high priority for future public engagement. It is important to be clear on and convey how the public are having an influence on decisions, be transparent about how those decisions are being acted upon and keep the public updated on progress towards outcomes. Take lessons from the Irish Citizens Assembly and the permanent climate assembly in Brussels which have established mechanisms for ensuring feedback for participants, helping hold decisions makers to account. Think carefully about who is involved in deliberative, co-design and other participatory processes. As part of the design of the processes, consider how best to draw on people’s local knowledge and lived experience.
Encourage active forms of participation to help engage people in different ways. This can include approaches such as citizens’ science, which involves the public directly in data collection and other research activities, and participatory budgeting, which has a clear link between the public’s involvement and the decisions being taken as a result.
Explore the use of digital and creative tools to help share findings from deliberative and co-design approaches with a wider audience.
Explore the use of creative activities. Some of these approaches, such as gaming and virtual reality, are still relatively new in the literature so would benefit from further exploration and testing before being used more widely.
Act (Encouraging action)
Making climate change relevant to people’s lives and conveying why their actions are important.
Give people autonomy by supporting co-production and co-creation processes. These approaches can help give the public a say in the way they engage and ownership over outputs or recommendations. This can foster a sense of empowerment and help legitimise the process.
Integrate public engagement into policy decision making. This includes responding meaningfully to the outputs and recommendations of public engagement and clearly communicating with the public about how their engagement links with the policy process.
Take measures that help boost collective efficacy. This includes using messaging that emphasise social norms, shared beliefs and a sense of community. Promoting a sense of ownership of engagement outcomes and recommendation can also support feelings of self and collective efficacy.
Introduction
Background
Public engagement is a central component of the Scottish Government’s commitment to reaching net zero by 2045 and delivering on the ambitions of the updated Climate Change Plan. A commitment to public engagement is also part of the Scottish Government’s National Adaptation Plan and its approach to planning for a Just Transition to net zero.
In 2021, the Scottish Government published the Public Engagement Strategy for Climate Change (PES), which underscores the importance of widespread participation and engagement in order to drive the transformational change needed to reach net zero. The PES sets out a holistic, systemic approach to public engagement with the aim of building a mandate for long term societal change. The overall vision of the PES is that: “Everyone in Scotland recognises the implications of the global climate emergency, fully understands and contributes to Scotland’s response, and embraces their role in the transition to a net zero and climate ready Scotland.”
The PES is guided by three strategic objectives:
Understand: Communicating climate change. People are aware of the action that all of Scotland is taking to tackle climate change and understand how it relates to their lives.
Participate: Enabling participation in policy design. People actively participate in shaping just, fair and inclusive policies that promote mitigation of and adaptation to climate change.
Act: Encouraging action. Taking action on climate change is normalised and encouraged in households, communities and places across Scotland.
Monitoring and evaluation of the PES is being carried out using a multi-stranded approach. As well as annual reporting against key national indicators and evaluating individual public engagement programmes, the Scottish Government committed to an interim review of the PES at the midway point of delivery in 2024. The midpoint review consists of various elements being delivered by the Scottish Government, including a stakeholder survey and evaluations of activities undertaken as part of PES delivery to date. This report presents findings from research conducted by Ipsos and the Centre for Climate Change and Social Transformations (CAST), which complements the Scottish Government’s own evaluations. Outside of Scotland, whilst there are many examples of government-led or government-supported public engagement interventions, there are few occasions where these have been evaluated. Therefore, the monitoring and evaluation aspect of the Scottish Government PES is somewhat unique.
Research aims
ClimateXChange and the Scottish Government commissioned Ipsos and CAST to conduct research into the role of government in public engagement and ways to improve Scottish Government’s engagement approach. Specifically, the research aimed to address the following questions:
What does recent thinking and research suggest are the most effective roles and practical actions a government such as the Scottish Government can take to successfully engage the public on climate change and deliver the aims of the PES?
What lessons can be learned from approaches taken by comparative governments internationally to improve delivery of the aims and activities of the PES?
What are the views of the Scottish public on the most appropriate ways for the Scottish Government to engage them on climate issues?
The overall aim of the study was to help understand how well various aspects of the strategy have been working in practice so far and identify any lessons that could enhance the delivery of the PES going forward.
Method
The research involved three strands, outlined below. A more detailed methodology can be found in Appendix A.
Desk based evidence review – assessing existing national and international evidence published between 2020-2024 of climate and environment-related public engagement activities and examples of best practice as part of answering the first two research questions. Most evidence focused on activities engaging people around broad ‘climate’ or ‘environment’ issues, although some were focused on specific topics within these areas. The range of activities identified in the evidence review fell into three main categories, which are each explored in detail in the remainder of this report: communication and education; deliberative engagement and co-design; and creative activities. Note that these categories are broad and there is a lot of overlap between them. See Appendix A for more detail on the scope and limitations of the evidence.
Six stakeholder interviews – exploring views from a range of practitioners and specialists involved in public engagement on climate change, to complement the evidence review.
Four general public focus groups – to answer the third research question and understand the public’s views on how the Scottish Government should approach public engagement on climate change in future. Focus groups were shown four case study examples of public engagement activities in different parts of the world. These included: a public health campaign on the impacts of climate change on children’s health; a carbon footprint food tracking app; a climate coalition working on plans for offshore wind in their local area; and a citizen science project measuring air quality. More detail on each of these is included in Appendix B.
Types of public engagement activities identified
The range of activities identified in the evidence review fell into three main categories, which are outlined in detail in chapters 3, 4 and 5:
Communication and education: Large-scale communication campaigns, information packs, door-to-door canvassing, e-mail campaigns, radio messages, news broadcasting, social media posts, single message testing (videos, images, pure text), menus, posters. Education included school classes, university modules/lectures, curriculum changes, challenges, gamification, inquiry-based learning (where the learners choose which questions to investigate), writing reflections, argumentation training, apps, cooking classes, nature-based workshops, community action groups, training for particular professions, farmer field schools, peer discussions.
Deliberative engagement and co-design: Climate assemblies, global assembly, mini-publics, advisory councils, climate commissions, participatory planning, participatory budgeting, participation in decision-making, stakeholder engagement workshops, stakeholder collaboration, citizen science, virtual engagement, gamification.
Creative activities: Art, interactive theatre, digital games, board games, role-play, escape rooms, virtual reality, simulations, gamified places, mobile devices/apps, social media, internet of things (IoT), artificial intelligence (AI), interactive informational exhibits, plogging, photovoice, environmental events.
How to read this report
The report brings together findings from all strands of the research (the evidence review, stakeholder interviews and focus groups). Rather than setting out the findings under each of the three research questions, they are presented thematically, reflecting the cross-cutting nature of the findings. This means that findings from the evidence reviews, stakeholder interviews and focus groups are presented together within each thematic section. Where findings are specific to just one strand of research, this is stated.
Chapters 3 to 5 focus on specific types of public engagement, grouped by theme. Chapter 6 brings together strategy-level findings that relate across different types of engagement. At the end of each chapter (or sub-section within the chapter) reference is made to how the findings relate to the PES.
Due to the volume of studies reviewed, rather than citing studies individually, these are given within the text via numerical references. Click these to view the full study details in the bibliography (for example [1], [2], [3]).
Communication and education
This section outlines findings related to public engagement that were categorised as “communication”. This included large-scale communication campaigns, information packs, door-to-door canvassing, broadcast and social media campaigns, and more. It also covers forms of engagement classed as “education”, as these had similar findings to those related to communication.
The examples and lessons covered here tend to fall under either the ‘Understand’ and ‘Act’ objectives of the PES. Climate communication campaigns are often focused on increasing knowledge, awareness and pro-climate attitudes and behaviours. There are few examples of climate messaging designed to engage people in decision-making or other participatory processes, or to communicate the outcomes of such processes. Similarly, most literature around education focuses on increasing knowledge and awareness, and there was very little evidence on the impact of education on participation or behaviour. Lessons for the ‘Participate’ objective are covered elsewhere in this report. Source: Public Engagement Strategy
Findings below are outlined in relation to the type of messaging, the means and channels of conveying the message, and the needs of the audiences. Findings related to education initiatives specifically are included at the end.
Key messages
Use multiple methods and channels, because different types of communication work for different people.
Tailor communications to the audience and test content with your target audience before rolling it out at scale.
Design communications to be personal, dynamic and engaging – content should be relevant to people’s lives and appeal to their values and emotions.
Trial the use of health frames and health professionals as trusted messengers.
Fear-based messaging can be effective, but should be paired with practical solutions-focused messaging.
For educational interventions, give learners some autonomy over the process.
Incorporate environmental education into school/university curricula.
Messaging
Appeal to people’s values and emotions
Climate inaction is often rooted in emotional responses and structural/practical barriers. Therefore providing facts and data alone is usually insufficient to inspire changes in attitudes or behaviour [1], [2], [3], [4]. This isn’t always the case – for example, information provision has been found to increase support for wind turbine developments [5] and intention to adopt pro-climate actions [6], [7], [8], [9], [10]. Supporting claims with scientific information can lend credibility. However, technical information generally works best for people already knowledgeable about and supportive of climate action [11]. Therefore, climate communications should aim to also be personal, dynamic and engaging, appealing to people’s values and emotions and fostering a sense of efficacy, hope and community [12], [13], [14]. It should also be accompanied by wider structural support to enable action.
Stakeholders echoed this finding from the literature, stressing the valuable role of messages that connect climate change with things people already care about.
“One of the few good things about climate change is that it’s so all encompassing that everybody has a direct and real stake in the outcome… If your kid has asthma, you should care about climate change. If you like chocolate, you should care about climate change. If you’re a person of faith, you should care about climate change. If you love your country and your cultural heritage, you should care about climate change. And 1001 other reasons… As communicators, our job is to figure out how to connect the dots between climate change and the people, places and things that people already love.” (Stakeholder – climate communicator).
There are a number of tactics that communicators can use to ensure climate messages resonate with people’s values and emotions, as outlined in the sections below.
Make it relevant to the audience
Making climate change relevant to audience’s lives gives them a concrete reason to care on a personal level. Climate communicators should reduce the perceived temporal and spatial distance of climate change by highlighting immediate and local climate impacts. Research shows that emphasising the ‘here and now’ of climate issues increases support for climate mitigation policies, sustainable behavioural intentions and perceptions of climate threats [3], [15], [16], [17], [18], [19], [20], [21], [22]. Although see Section 3.1.3 for more information on how communications framing could change depending on the psychological distance of the issue being discussed.
Tactics to reduce psychological distance include using real-time and historical data to illustrate the effects of climate change [12]; framing costs of climate impacts per household instead of at a national level [18], [23]; highlighting links to iconic local places such as the Great Barrier Reef in Australia [22], and local issues, such as pollution [20]; and platforming local people’s individual experiences of climate change and climate solutions [24]. Additionally, major events, like global climate summits or environmental disasters, can anchor climate change in the present day [14]. Additionally, connecting climate change to local issues, impacts and values increases relevance.
“One of the big things that we see across the developed world, including the United States, is that many people who… basically accept that climate change is real, nonetheless still think of it as distant… Distant in time – that the impacts aren’t going to be felt for a generation or more, so maybe this is a problem for their grandkids. Or distant in space – this is about polar bears or maybe some developing countries, but not my country, not my community, not my friends, not my family, not me. And as a result… it just becomes one of a hundred other issues that’s out there… people don’t understand why this needs to be a priority.” (Stakeholder interview, climate communicator).
Focus group participants also stressed the importance of communicating about climate change that was relatable and relevant to their local contexts.
“[It] makes people get more involved in it if they have a personal link and see, you know, the personal impact that it can have on people.” (Focus group participant)
Participants generally preferred messaging that focused on more “tangible” impacts of climate change that are currently impacting on communities in Scotland, compared to more abstract, hypothetical scenarios. They suggested using examples such as crop failures, food prices, extreme weather, and health impacts to convey the current relevance of climate change to them.
They also highlighted the need for communication to convey the role of the individual as part of a wider societal transformation. There was some scepticism expressed around the need for individual behaviour change relating to certain aspects of climate change. For example, participants questioned how much impact reducing their carbon footprint would have and questioned the need to save water in Scotland.
“I also feel like you would always have that thing in the back of your mind where you would think, in the whole scheme of things, like, what does me watching my food miles really do when there’s, you know, there’s airplanes going over the head every day?” (Focus group participant).
There was a sense that comprehensive, clear explanations and transparency around why people are being asked to make changes are needed to build understanding and trust.
Think about the framing
When trying to engage people on climate change, environmental arguments can be effective [7], [25], [26], [27], [28]. Discussions focusing on maintaining ‘balance with nature’ are particularly well received [14], [24], [28] and adaptation may be a less polarising topic than mitigation [24]. However, non-environmental frames that talk to other values, goals and issues can also be effective [29], [30].
Research shows that presenting climate change in terms of its impacts on health, safety and wellbeing can be effective [1], [14], [24], [26], [31], [32], [33], [34], with heat risk a possible entry point to climate conversations [24]. Equally, activating communal and societal goals such as social protection, unity, care, national security, scientific or economic development and global leadership may be a good tactic [28], [35], [36]. Other effective frames that resonate with many groups include ‘impacts on future generations’ [24], [35], [37], [38]; ‘maintaining freedom and choice’ [26], [39]; and ‘avoiding waste’ [26], [40]. That said, communicators should also clearly articulate their one takeaway message to avoid confusing audiences with multiple topics [41].
A study by Wolstenholme and colleagues tested messaging interventions with UK students. Every morning and evening for two weeks, participants received messages via an automated private chat on Facebook Messenger on the positive impacts of eating less red and processed meat. The messages either highlighted the benefits to people’s health (e.g. reducing the likelihood of developing cancer, heart disease or becoming obese), the environment (e.g. reducing excessive land use, deforestation or the release of greenhouse gases), or both, with a different benefit being highlighted each day. Participants were also reminded to try not to eat more than two portions of red and processed meat each week.
The study found that providing information about the health and/or environmental impacts of eating meat caused students to reduce their red and processed meat consumption during the intervention and one month later. In other words, pro-climate behaviour can be encouraged without talking about climate change.
Some frames work better for particular groups. For example, ‘living well locally’ resonates with rural communities [39]; ‘morality and justice’ works well with left-wing groups [1], [32]; and ‘responsibility and patriotism’ works better with conservatives [1]. Evidence around the effectiveness of economic framing is mixed [25], [27], [36]. Interestingly, frames also vary in their ability to boost behavioural intention depending on the psychological distance of the issue being discussed. When talking about impacts that are psychologically close (concrete and spatially near), communicators should use efficacy framing (highlight the feasibility of solutions). For psychologically distant impacts (abstract and spatially far away), risk framing (highlighting the negative impacts of climate change) is more effective [15]. Given that there is no one ‘best’ way to talk about climate change, communicators should use multiple different frames and recognise the need to balance tailoring messages to the audience with avoiding polarising language [34], [42].
“In general [climate change] has been framed as a scientific story. And it is… but this issue is so much bigger than that. It’s a real estate story, it’s a health story, it’s an arts and culture story. Every traditional beat of the news media should be engaged with the climate connections.” (Stakeholder – climate communicator).
The importance of framing was also clear in the focus groups. Reflecting on one of the case study examples used in the focus groups (the Make it Better campaign, described in Appendix B and shown in Figure 1 below) participants felt that associating climate change with negative impacts on children’s health was a powerful message and one which would encourage people to consider how they could mitigate those impacts.
Figure 1: Example of health-framing of climate change communication. Images of three climate-related health impacts were shown with pictures of children at risk from heat-related illnesses, along with the campaign’s tagline. Source Canadian Journal of Public Health
On framing, participants also felt that climate change discourse can be political and, at times, controversial topic and felt that care should be taken to avoid misinformation in climate change communications.
Make climate change a ‘human’ issue
Telling personal stories about climate change (involving relatable people and familiar places) enhances audiences’ emotional response, increasing engagement, climate belief and risk perceptions, and making the effects more persistent [19], [32], [41], [43], [44]. This holds true for conservative and moderate groups [43]. Communications can also make climate change feel more ‘human’ by emphasising social norms, shared beliefs and a sense of community – these can boost collective efficacy, policy acceptance and behaviour change [19], [38], [45], [46], [47], [48], [49], [50]. Tactics include sharing testimonials and photos of citizens taking action, or hosting competitions, quizzes and user-generated content on social media [51]. Importantly, norm-based messaging should be relatable and authentic – it can backfire if overly authoritative or formal [17], [22], [24], [36], [41], [44].
“The other critical element is storytelling… [our radio show plays] short first-person narratives of people who are talking about how climate change matters to them and likewise what they are doing to solve it… These stories feature the voices of people from every walk of life… And what we see in our research results is that those kinds of stories work really well, because suddenly people can realise this is not just a problem for China to solve or the UN to solve, which is so removed from people’s lives. This is about how people just like them – who dress like them, talk like them, have similar values – [are getting involved with climate change].” (Stakeholder – climate communicator).
This initiative by Bristol One City displays multiple features of good climate communication. A series of 30 short videos, produced by Bristol City Council, tells the stories of a diverse range of Bristolians doing things they enjoy which are also good for the climate. For example, two members of a boxing club share how they’re reducing plastic waste and litter in their gym, while a mother discusses the benefits of walking her children to school instead of driving them.
The videos make the issue of climate change relatable and personal by discussing local issues and including a diverse range of groups. The videos also normalise pro-climate behaviours, by showing that people are already taking (and benefitting from) climate action.
Bristol City Council and partners use these films in social media campaigns and displayed them on screens in key public spaces during COP26 and again in summer 2022. They have had lots of positive feedback on the videos from citizens, including underrepresented groups, and partner organisations.
Use positive, but honest, messaging
Fear-based messaging that highlights the risks and negative impacts of climate change can capture people’s attention and elicit emotional responses [1], [22], [34], [40], [52]. It can be useful for increasing knowledge, but over time can be disengaging and may come across as disingenuous [1], [17], [38], [53]. Positive messaging that highlights our capacity to tackle climate change is important for boosting efficacy and empowerment [1], [4], [14], [17], [19], [20], [22], [24], [29], [33], [41], [47], [51], [53], [54], [55]. Therefore, communicators should platform the opportunities that climate change presents to build a better world, the pro-climate actions already being adopted by others, and the co-benefits already being realised by climate action. But they should also acknowledge the risks and uncertainties of climate change, as well as the fact that solving climate change will require some change to life as we know it.
“We’ve done a pretty good job helping [people] understand the seriousness and the gravity of the problem, but we have not done a good job helping them understand what the solutions are… I get so frustrated with the argument I sometimes hear within the climate community: either ‘let’s scare the bejesus out of people and that’s going to motivate them’ or ‘no, no, don’t talk about all that doom and gloom stuff, only talk about solutions’. No, it’s not an either or, it’s a both.” (Stakeholder – climate communicator).
Providing practical, actionable steps that people can take to tackle climate change increases intention to undertake pro-environmental action [9], [14], [19], [27], [29], [33], [53], [56]. Which types of pro-climate behaviour are best to promote is beyond the scope of this report but some studies suggest that it could be useful to encourage ‘small’/‘easy’ actions first, to create a snowball effect that leads to political engagement [57], and to provide time-oriented goals, such as ‘can you limit your red meat intake to two portions per week in January?’ [9]. Additionally, efficacy can be fostered by using language that is communal (‘we’ rather than ‘you’) and motivational (‘start/grow/support’ rather than ‘don’t/stop’) [14], [22].
Focus group discussions also revealed a need for a balance between positive and negative messaging. On the one hand, there was a view that shocking, fear-based messaging is needed to make people pay attention and ensure the public understand the serious nature of climate-change issues. Participants referenced what they perceived to be effective messaging around the dangers of smoking or the Covid-19 pandemic. This framing was seen as an effective way to demonstrate the serious impacts of climate change, with a suggestion that people may be even more receptive to this type of messaging post-pandemic.
“For people to take stuff seriously when it comes to the news, you have to kind of scare them a little bit. With Covid that is exactly what happened.” (Focus group participant).
At the same time, there was a desire for more information around solutions and positive actions that participants could take. Participants stressed that when negative impacts of climate change were shared (for example the negative health impacts highlighted in the Make It Better campaign case study – see 5.3), specific guidance was needed around what exactly people could do.
“I know that, for a lot of young people my age, people struggle with having money for clothes and stuff. And so they always resort to SHEIN or Teemu or things like that, which are absolutely awful for the environment. So I think putting an emphasis on alternatives [is important].” (Focus group participant).
However, there was a strong feeling that public engagement on climate change issues should avoid “lecturing” people, as this causes them to feel guilty about their lifestyle choices. Rather than focusing solely on individual responsibility, participants felt that communications should also acknowledge the role of companies and governments in contributing to and combatting climate change. Highlighting the need for both individual and systemic action was also flagged as good communications practice in the literature [23], [56].
Relevance for the PES
The importance of messaging is referred to throughout the PES, including commitments to ensuring messaging is evidence-based, easy to engage with, and accessible. The PES also refers to engaging with people’s values, identities and concerns. It is part of the PES principle of ensuring an evidence-based approach.
The literature and focus groups both support these aspects of the PES and provide insights into how they can be delivered. It was clear that, ideally, future messaging would be supported by evidence, appeal to people’s personal values and emotions, and be made relevant to people’s lives. The PES also acknowledges the importance of helping people to see their individual actions within the context of the bigger picture, and that they are not tackling climate change alone. Focus groups findings in particular support this view, as participants highlighted a sense of uncertainty around how much impact their own actions would have.
The merits of both positive and negative, or fear-based, messaging were discussed in the literature and in the focus groups. While there is a potential conflict between those two directions, the overall sentiment was that governments should be honest about the risks and uncertainties of climate change, but also convey positive, pro-climate actions and practical actions that the public can adopt. These findings support the principle underlying the PES, that it will take a positive approach that outlines a vision for climate action that promotes the many benefits. This is described in the PES as a way of combatting climate distress. However, given the findings that a balance between both positive and honest messaging can be effective, this suggests that the PES should not necessarily shy away from conveying the negative consequences of climate change.
Conveying the message
Use trusted messengers
Building trust is important for climate communicators, especially when trying to reach vulnerable groups. It takes time to build trust, and it is much easier to lose it than gain it [58], [59]. In order to become a trusted messenger, communicators should be authentic, human, sincere, down to earth, kind, reliable, honest; show empathy and passion; and demonstrate their credibility [1], [20], [58].
There are certain people who are already trusted by the public. These include: naturalists and nature conservation charities [58]; healthcare professionals [1], [32], [33], [41], [42], [59]; parental groups [1]; scientists, academic experts, environmental specialists and weather presenters [11], [12], [17], [41], [42], [59]; elders [12], [53]; and people with lived experience of the issue on which they are speaking [41]. Other examples include community leaders, non-governmental organisations (NGOs), educators, experts and impartial facilitators [1], [4], [12], [19], [23], [26], [28], [30], [53], [54], [55], [60], [61], [62], [63], [64], [65], [66], [67], [68], [69]. In general, the public is less trusting of activists and elites (celebrities or prominent figures) [1], [17], [19], [58], although there are some exceptions (e.g. David Attenborough is trusted across audience groups) [70]. Again, different groups trust different messengers. People are more likely to trust and engage with local people [6], [12], [17], [21], [23], [33], [42] and in-group members. For example, one study found meat-eaters were more likely to accept a call to reduce their meat intake from other meat-eaters, versus from vegans [71].
“[Tourism workers] are one of the best messengers [to communicate about the impacts of climate change on coral reefs], because they’re the people that access and see these impacts firsthand. Their lives depend on the reef. I have a friend who [takes tourists scuba diving] in the southern Great Barrier Reef, which was the worst hit area earlier this year for the bleaching…He’s made a climate talk, with really clear calls to action.” (Stakeholder – climate campaigner and outreach organiser).
It can also be useful to have multiple messengers from a diversity of backgrounds, including experts, lay public and people from marginalised groups [1], [29].
Make it visual
Visual communication can promote learning and participation. Techniques such as images, graphs, diagrams, infographics, illustrations, interactive displays and pen portraits (fictional characters that represent different sections of the population) can make complex information more accessible, personal (see section 3.1.4 on making climate change a ‘human’ issue) and memorable [12], [32], [39], [41], [59], [63], [72], [73], [74], [75], [76]. More collaborative approaches might include partnering with local communities, architects and designers to produce visualisations of the future [77]. Videos have also been found to be highly emotionally engaging and can increase people’s knowledge, risk perception, collective efficacy and government-related efficacy [10], [41], [42], [78]. Additionally, rather than relying on technical language (such as describing increases in CO2 emissions), communicators should use figurative expressions (such as “the planet is heating up” or “the pollution produced is equivalent to that from 10 car journeys”) [17], [79].
As with written and verbal communications, visual climate communications should aim to make climate change relevant and ‘human’. For example, images should show real people (not staged scenarios) [63] and local impacts (clearly linked to climate change) [63], [72], [80]. Visuals should be emotionally salient, reflecting the severity of the topic and highlighting people’s vulnerability [24], [59], [72], [80]. For example, in one study images of people suffering from respiratory illness due to air pollution were found to be effective for communicating the health impacts of climate change, because they caused participants to feel more vulnerable and susceptible towards the issue. However, images of ‘problems’ should be paired with those of solutions, to promote action alongside urgency [63], [72], [77]. Images depicting air pollution [72] may be particularly salient. However, protest imagery can be alienating [1]. Again, as with other forms of communication, videos should be short, relatable and easy-to-understand [10], [41], [42].
Trial the use of humour
Emerging evidence suggests that humour could offer a unique way to engage audiences on climate change by catching their attention, breaking taboos, and helping people cope with the psychological weight of the topic. Methods like cartoons, memes, satirical shows and live performances can encourage people to interact with content (including online), as well as increase their belief in and understanding of environmental issues [81], [82]. That said, evidence regarding humour’s ability to stimulate behaviour change is mixed and there are concerns that taking a humorous approach to climate change may trivialise the issue [81], [82]. Communicators should therefore test humour-based approaches with their target audiences.
This initiative produces videos in which climate scientists are paired with comedians who ‘translate’ climate science into emotional, shareable and actionable formats. It’s a great example of using humour to make climate information more accessible and engaging. According to Climate Science Breakthrough’s own research, their videos make 87.5% of viewers more likely to take climate action.
Think about the medium/channel
Communications campaigns are most effective when they use multiple mediums (e.g. website, e-mails, social media, posters, flyers, community bulletins, meetings, events, word-of-mouth, TV, radio, newspaper, slogans, icons), including a mix of grassroots and top-down, formal and informal, and digital, creative and traditional methods [3], [8], [10], [12], [21], [32], [83]. This finding was echoed in focus groups, in which participants believed a variety of methods of sharing information would be required to meet the needs of different groups of people, covering both online and offline approaches. It is also advisable to communicate regularly and consistently [14], [17] and put messages where people will naturally see them, without having to seek them out – for example, in schools, supermarkets, doctor’s surgeries and on Google maps or TV shows [41].
Example: Information packs to reduce household energy consumption [7].
In a field study in Belgium, households were provided with information packs about how to reduce their energy use. Packs included information on the monetary and/or environmental consequences of saving energy; neighbourhood energy consumption data (broken down by house size); guidance on how to interpret kWh as a unit of energy use; testimonials from citizens who successfully reduced energy consumption; energy-saving advice (adapted to each season); links to further resources; and physical tools (e.g. radiator bleeder, energy saving tip stickers for household appliances and a meter reading chart).
Over the three-year study period, households who received information packs reduced their gas consumption more than households who didn’t receive the packs. The effect was particularly strong in high-consuming households. These packs follow several principles of good climate communication – the information was highly accessible (by being delivered directly to households rather than requiring people to seek it out); the packs included a variety of different types of content; and the content included practical advice and tools, rather than only highlighting the problem of climate change.
The evidence suggests that people still value communication via traditional methods, such as news media, TV and radio (especially in rural communities) [6], [62], [84]. Additionally, face-to-face and community-based communication is well received, especially by older people and rural communities [12], [21], [39], [85].
Social media can also be an effective way to reach a large audience (particularly young people) in an informal, relatable way [12], [16], [17], [18], [51], [66], [68], [83], [86], [87], [88], [89], [90], [91], [92], [93], [94]. Exposure to sustainability-related content on social media has been found to increase individuals’ sustainability-related knowledge, fear of climate change, subjective norms, pro-environmental attitudes, perceived behavioural control, behavioural intent, and actual behaviour [51]. Social media may be a particularly effective way to engage with young people [52], [68], [83], [88], [91], [93], [94]. That said, communicators should be wary not to overwhelm people with information [93] or to narrow the focus to topics that are highly (socially) contagious but less impactful regarding fighting climate change (e.g. plastic pollution) [40]. Digital communication methods (such as texts and e-mails) are less effective for deep communication but could be useful for delivering information and alerts [27], [74].
“[To reach out to youth] social media is our best friend.” (Stakeholder – Advocacy and engagement organisation).
In focus groups, participants felt that sharing information online, including on social media, can be an effective way to reach a large number of people and younger age groups in particular. Rural participants also highlighted the importance of using social media for those living in rural areas in Scotland, who may not regularly pass through towns or villages where they might see posters or leaflets. At the same time, participants thought that certain people are not able or comfortable spending time online. Therefore, more traditional communication channels were suggested such as printed materials, TV, radio or newspapers (particularly local stations/publications), and information sent by post. They felt that social media campaigns bring benefits, such as using hashtags to gain traction and providing opportunities for people to more easily engage with, share and interact with the information that is posted.
Finally, embedding climate communications in entertainment (e.g. films, TV shows, podcasts and live performances) shows promising initial results in terms of boosting climate awareness, attitudes and action [10], [51], [95], [96], [97]. It is important that the entertainment aspect takes priority, to avoid being boring or ‘preachy’ [95], [96], [97]
Relevance for the PES
As part of the ‘Understand’ objective, the PES includes a commitment to using a range of communication challenges, including both traditional and digital channels. This research supports the need for this multi-pronged approach, to help ensure the messaging is accessible and has wide appeal.
The PES acknowledges the needs to use trusted messengers and describes these messengers as individuals and organisations working to engage the public, from small local groups up to stakeholders delivering national campaigns. The evidence review has provided some further insights into who are considered trusted messengers, and their characteristics. The type of organisation, and what principles they stand for, are therefore both important considerations when partnering with these messengers on public engagement.
Some of the specific means of communication highlighted in the evidence are also referenced in the PES. This includes the use of storytelling, as part of the Scottish Government’s efforts to lead the way in developing and promoting climate conversations as a means of sharing views and improving climate literacy. The PES also refers to power of the arts to help the public to understand and visualise the potential impacts of the climate change. The findings suggest that these different channels should continue to be used to communicate and education on climate change. Humour is not specifically mentioned in the PES and is one of the more emerging strands in the evidence review. This is potentially an area for further testing and development in the next stages of the PES.
Responding to the audience
Tailor communications to the audience and context
“That’s a crucial question for any, especially national, strategy… no country has the resources to do everything. You’ve got to be strategic. This is why you start with audience analysis… You’ve got to first get very clear about exactly what it is you’re trying to accomplish. Then figure out who’s the audience… Then figure out the best way to reach them.” (Stakeholder – climate communicator).
As has been highlighted, different groups and people respond differently to climate communications materials. The evidence is emphatic that the choice of framing, language, messenger and medium must consider the audience and context. For example, responses vary according to many different factors:
Cultural context: In ‘individualistic nations like the UK (that value self-sufficiency, personal achievement and competition), emphasising the individual gains made by taking climate action is effective [47].
Religion: Linking climate change to ‘creation’ works well with Muslim, Jewish and Christian faith groups, but not as well with Hindu and Buddhist groups [1].
Political ideology: Liberals respond better to expert knowledge and participatory engagement, whereas moderates and conservatives prefer hearing from lay people with direct experience of climate change [98].
Level of engagement with climate change: Factual/scientific information and messengers are better received and more likely to boost climate beliefs and support for mitigation policies among people already knowledgeable and concerned about climate change [11], [41]. However, these people don’t need to be convinced that climate change is a problem, they mostly want to hear about the steps they can take to solve it [99]. For groups ‘in the middle’ (cautious but not fully engaged), communicators should highlight the relevance of climate change through simple, clear, repeated messages from a range of trusted sources [41], [99]. Doubtful groups are more likely to negatively appraise climate change materials, so highlighting widely accepted contributions of science to society (e.g. vaccinations) [11] and using non-climate frames [41], [99] may be effective. That said, non-climate frames can also be interpreted as ‘propaganda’ [41].
Climate attitudes and beliefs also vary with location (rural versus urban) [18], [39], [99]; income [39]; (dis)ability [39]; degree of experienced climate impacts [18]; age [1], [27], [39], [73]; and gender [73], [100].
Make it accessible
Accessibility was a common theme across the literature and the focus groups. An overarching principle in the literature is the importance of making climate communications accessible to a wide range of people [3], [13], [21], [22]. Information should be concise and easy to understand [27]. For example, communicators should focus on one key message, consistently communicated; use a limited number of statistics, ensuring those that are used are clear and memorable; avoid technical language, jargon and acronyms; and provide contextual/explanatory information for any maps and diagrams [7], [12], [17], [33], [41]. Communication materials should also be shared in multiple languages, including local languages, via a variety of media channels, and be sensitive to the cultural, social and accessibility needs of different audiences [1], [12], [17], [23], [29], [33], [59], [63].
Relevance for the PES
These findings on understanding the audience are closely in line with the content of the PES and some of its central messages. Under the action of “ensuring accessibility”, the PES states that communication should include a variety of channels to reach different audiences in ways that are most appropriate and engaging for them.
While findings align with the PES, the evidence review provides some further considerations for understanding the audience and ensuring accessibility. In particular, ensuring communication is sensitive to cultural, political, religious, geographical and other contexts is an area not explored in detail in the PES.
Education
Use a range of approaches to inform and educate
The evidence found that in some instances information provision alone can increase environmental knowledge and lead to further positive outcomes. This is most likely to happen when the information is simple and action-based. For example, providing simple guidelines about climate friendly food choices can increase people’s ability to choose climate friendly products in easy product choice situations [9].
However, generally didactic presentation of information is more effective when combined with other methods, preferably interactive ones. Such methods include: art activities [101]; challenges and competitions [102], [103]; gamification [104], [105]; inquiry-based learning [106], [107], [108], [109]; cooking classes [110], [111]; projects [112], [113]; argumentation training [114], [115], [116]; writing reflections [104]; farmer field schools [117], [118], [119], [120]; tree planting [121]; experiential learning [116], [122]; and group exercises and discussions [123], [124], [125]. One notable project took portable aquaponic pods to schools to engage pupils in food production and foster learning about sustainability, climate change and healthy eating [126]. Effective interventions often use multiple combined approaches.
Example: Interactive learning intervention in UK schools [127]
An activity-based educational intervention was embedded into the curriculum of Year 9 classes in two schools in the UK. It used a range of interactive approaches, including student-led inquiry, drawing flowcharts/maps, discussions and quizzes. As a result of engaging with the intervention, students developed a stronger understanding of the causes and effects of global warming. This supports the use of engaging, collaborative methods in climate education.
Tailor to the audience and context
As with communications campaigns, multiple studies highlighted the importance of tailoring educational interventions to the audience and local environment [117], [128], [129], [130], [131]. One way this can be accomplished is through designing interventions which focus on applying global issues to local contexts and issues [125].
Enable learners to be co-creators
Effective educational interventions that increased environmental knowledge/awareness often took a collaborative approach. This includes staff-student collaborations and student-led projects [108], [132]; training local community members or action groups to deliver non-formal education [133], [134]; and co-developing toolkits with key stakeholders [135].
“The workshop is kind of like a menu…every group has different baseline knowledge. So, if you’d like to dig into [specific topics], we can totally go into that. But if all you need to know is that [climate change is] bad and here’s what we can do, we can start there as well. And most people go for the second option… I guess you’re giving them that autonomy. You’re not just lecturing at them.” (Stakeholder – climate campaigner and outreach organiser).
Support systemic change
The literature emphasised the need for change beyond individual interventions. Several studies outlined that environmental issues could be better embedded in school and university curricula [130], [136], [137], [138], [139]. Key points to consider here include defining the aim of climate change and sustainability education; involving educators and students in developing change; incorporating sustainability education across different elements of the curriculum (and linking these up); and making education place-based and grounded in real-world contexts and issues [130], [138]. However, some schools do not have adequate resources (including funding and time) to implement initiatives that can effectively educate students [126], [140], so these are areas where the Government could lend support. Ledwell and colleagues [63] also highlight how climate change education can empower communities to be better able to adapt to environmental impacts and argue for similar programmes (that focus on developing the skills and knowledge needed for climate adaptation and resilience) among the adult workforce.
Relevance for the PES
One of the PES actions is to embed climate change within formal education. It includes a commitment to supporting climate change education, for example by implementing the Learning for Sustainability action plan and working with the Teach the Future campaign. The evidence review findings provides insights into the types of approaches that would work best, particularly in terms of the type and style of information provision and the opportunities for collaboration and co-creation.
Training is not currently part of the PES, therefore the findings suggest that further exploration of opportunities for upskilling young people and workers would be a valuable addition.
Summary
The evidence is clear that following good communications principles is essential for successful public engagement on climate change. Much of the research supports known ‘best practice’ for communicating about climate change, but there are also some emerging new areas of opportunity. A common theme is that there is no single ‘best’ way of communicating about climate change. It is therefore important to use multiple methods and test communication campaigns and messages with your audience before rolling them out at scale [12], [33], [41], [141].
Findings from the evidence review and the focus groups have highlighted that much of the best practice on communication and education is already captured within the PES. This includes the need to be inclusive and accessible, to communicate with different audiences in different ways, to use trusted messengers, and to use messaging that highlights the relevance to individuals and the practical actions they can take.
As well as endorsing various elements of the PES, the findings also provide insights into areas for further consideration for the remainder of the PES period. These include:
On messaging, ensure that climate change is framed in a way that is relevant to the lives of individuals and communities, reflects the context (cultural, political, geographic and others) and is focussed on practical actions for individuals. As well as using positive messaging, do not shy away from conveying the negative consequences of inaction on climate change.
When conveying the message, the research has identified the characteristics of (e.g. being authentic, sincere, kind, honest, credible) and types of people (e.g. naturalists, healthcare professionals, scientists) who are considered trusted messengers, and those that are not. It also highlights the benefits of exploring different approaches such as the use of visual communication and humour.
In education settings, encourage and enable approaches that foster collaboration and co-design with learners. Further explore opportunities for workforce training on technical aspects of climate change.
Take measures to build collective efficacy such as using messaging that emphasise social norms, shared beliefs and a sense of community. Examples of this include sharing testimonials, photos and videos of citizens taking action, or hosting competitions, quizzes and user-generated content on social media.
The lessons outlined in this chapter can be applied across many aspects of climate change messaging, but are particularly relevant for the following PES actions:
Develop and implement our public communications approach to ensure people understand Scotland’s climate ambitions and the policies that will be required to reach them
Collaborate with key delivery organisations to ensure information reaches key audiences, including through initiatives such as Climate Week
Working with Adaption Scotland and others to provide consistent messaging that makes clear the impact of climate change locally, nationally and globally
Support trusted messengers to promote climate literacy
Embed climate change within formal education
Use marketing and communications activity to ensure that households understand the changes needed to help Scotland get to net zero.
Deliberative engagement and co-design
This section outlines the findings related to public engagement that are categorised as “deliberative engagement” and “co-design” approaches.
The examples and lessons covered here relate to the ‘Participate’ objective of the PES. There is a wide range of activities that fall under the deliberative engagement and co-design banner and huge variation in how the same activities are delivered in different settings. Participatory activities such as these are all about getting people to take part in decision-making processes. Therefore, they mainly contribute to the ‘Participate’ objective. Source: Public Engagement Strategy
However, they also enhance climate knowledge and awareness, and promote behaviour change and support for climate solutions/actions [133], [134], [142], [143], [144]. Furthermore, they can lead to antecedents to pro-climate behaviour, including feelings of trust, community, ownership, empowerment, self-efficacy and stewardship over the local environment [92], [145], [146], [147]. Therefore, deliberative and co-design activities can also support the ‘Understand’ and ‘Act’ objectives of the PES.
For this chapter, a summary of the relevance of these findings for the PES is provided at the end of the chapter, rather than after each sub-section.
Who is involved
Be inclusive
Deliberation and co-design activities should involve a diverse range of people, including traditionally marginalised groups such as young people, ethnic minorities and those who are less physically able. Organisers could use purposive recruitment to gather an approximately representative group of participants or identify key stakeholders affected by the issue [53], [148], [149]. They could also support people facing financial, temporal, spatial or physical restrictions by providing compensation, child- or elder-care, support with logistics, a dedicated helper, and options to engage virtually [28], [150], [151]. Particular attention should be paid to the barriers faced by marginalised communities [152], [153], [154]. Additionally, internal dynamics should be well managed to ensure that all participants feel welcome and able to contribute [28], [29], [77], [150]. This includes organisers and facilitators reflecting on their own assumptions, being conscious of people’s differing values, and as getting to know participants’ motivations for engaging in a project [148], [155].
“What I think is really powerful about [citizens] assemblies is getting that diversity in one room and talking across different communities… learning together, deliberating together, crafting recommendations together… I think that’s really unusual and really hard to replicate in any other way.” (Stakeholder – climate assemblies expert).
It is also important to combine diverse sources of information, including local knowledge, indigenous knowledge, lived experience and scientific expertise [55], [156]. Local people are best positioned to monitor and solve local problems [148], [157], [158], [159] and bringing together groups that don’t usually work together can foster new perspectives and ideas [147], [159], [160], [161].
“By the time the government takes action, the divers and the fishermen have seen it. But they don’t have a channel of communication, [so they feel like] the government doesn’t listen to them… So I would advise to [listen to] the observers, the person in the forest that sees that the trees are dying are those who live in the forest.” (Stakeholder – Public engagement delivery organisation).
This finding was echoed among focus groups participants. They highlighted the need for public engagement activities to be promoted in an inclusive way so that everyone with a potential stake in the topic was aware of how they could be involved. This was particularly thought to be the case to reach people who may not actively seek out opportunities to share their views and avoid only recruiting people who are already very engaged in climate change issues or have strong views about particular subjects. One participant shared frustrations about having recently missed out on attending a climate change-related event in their local village due to not being aware of it until after it had occurred. This was despite being ‘active’ online.
Participants also stressed that it was important not to overwhelm people with too much information in advance of an engagement event, and to make sure people feel welcomed and understand that their contributions are valuable.
“It’s about making sure that people don’t feel that because it’s a climate advocate [and] they’re going to know a lot more […] it doesn’t mean that their opinion is of greater importance than the person who’s living in that community.” (Focus group participant).
Focus group participants felt that, to encourage views from a diverse range of people (beyond those already interested in the topic), public engagement practitioners should reassure the public that any lack of knowledge or prior involvement in discussions about climate change is not a barrier to taking part.
Content and format of engagement
Tailor to the audience and context
The literature emphasises that deliberative and co-design activities are not ‘off the shelf’ solutions. Organisers and facilitators should consider the local environmental issues; political, social and economic context; and participants’ demographics. For example, people in countries where citizen participation in democracy is high will likely expect a more involved approach. Power relations between the people in the room are also important, as social divisions and tensions can be barriers to participation, especially on a local scale [143], [154].
Make it accessible
In focus groups, participants felt that using a variety of different engagement methods – both online and offline – would help to make these types of engagements more accessible. For example, to ensure the accessibility of face-to-face engagement events, participants suggested holding these in places that were easy for participants to get to and in physically accessible buildings. They also noted a need for convenient timings, taking into account different schedules. Participants felt that online engagement, such as through video platforms or apps, could help encourage participation from those unable to attend an in-person activity. However, they also noted the risk of digital exclusion and that these tools are not accessible to everyone. A balance between offline and online methods was therefore seen as necessary.
Support active and innovative forms of participation
Focus group participants felt that giving the public the opportunity to get directly involved in activities would help to make the topic of climate change more engaging and impactful for them. For example, they welcomed the citizen science approach demonstrated in one of the case studies, in which volunteers helped to collect data as part of a study on air quality in Buenos Aires (see 7.3). Participants felt that taking an active part in data collection in this way would make people more interested in the findings compared to having simply been told about them.
“If you get involved with something […], you’re more interested in what the results come back than if you didn’t get involved with it in the first place.” (Focus group participant)
There was support for including a level of active engagement even in relation to information campaigns where possible. For example, in the Make It Better case study campaign (see Appendix B), the public were encouraged to sign a pledge and this was praised for being “at least [the] start of doing something”. However, concerns were raised about asking participants to do too much and the risk of “volunteer fatigue”. Similarly, others stressed the need for engagement to be easy, especially if it was taking place over a longer period of time.
Enjoyment in participatory processes has been linked to increased awareness and behaviour change [143]. Therefore, practitioners could employ creative methods of engagement, such as art, visioning exercises and even field trips, which are generally well received by participants [62], [162].
“There were a couple of juries which banned PowerPoint, which I thought was really funny, and there was one classic one where you had a climate scientist on the floor building a graph with Lego blocks to show the cumulative growth [of emissions]. And that really stuck in people’s heads.” (Stakeholder – climate assemblies expert).
Digital tools (such as mobile phone apps – see the Floop app example in Appendix D – websites and social media) are also increasingly available. These may be less effective for in-depth deliberation and discussion, but could be useful for capturing and sharing information with a large audience (for example, in citizen science or quick consultation activities) [163].
Example: People’s Plan for Nature, UK (source: expert interviewee)
This project, led by three environmental organisations (the WWF, RSPB and National Trust), used a participatory process to develop a plan of action for protecting nature in the UK. The organisations collaborated with an assembly of 100 people from across the country, who met over four weekends to discuss nature-related issues and put together recommendations for action. The approach was blended – i.e. involved meeting face to face (for the first and last weekend), as well as digitally (for the second and third weekend). This combination made the process accessible, and the timing of the in-person sessions meant that people were able to get to know each other at the start of the process and then produce recommendations collectively at the end.
Give participants autonomy
Promoting a sense of ownership and empowerment among participants supports feelings of self and collective efficacy, legitimises the process and increases acceptability of solutions [156], [164], [165], [166]. This can be achieved by giving participants control over the agenda and activities, and giving the public ownership of outputs or recommendations [144], [152], [167]. Interestingly, there may be no difference in perceived acceptability of solutions when participants are given full control or partial control (i.e. some expert input remains) [156].
“It’s about the dynamic. We ran an assembly years ago with experts…they give their presentation and then they sit at the top [of the room] and the citizens ask their questions. It looks a bit like Question Time. And that is…basically pandering to the expert status of the people at the top. So what we did in the next one was … got the citizens to think about their questions and the experts moved around the tables… [citizens] were in control of what they asked and if they wanted to move on to the next question, it was completely up to them, completely changed the dynamics.” (Stakeholder – climate assemblies expert).
Some participatory processes have divided participants into groups to cover more topics in depth, but this may mean participants don’t feel ownership over recommendations they were not involved in [167]. Another caveat to be aware of is that while bottom-up control over framing and design increases citizen input and creativity, it may also lead to less feasible policy options [69].
Example: Citizen science and co-policy design in the ClairCity Project [143]
This project engaged people across six European regions around air pollution and carbon emissions. It involved a variety of activities that gave residents a sense of ownership and control over the process. For example, participants used apps to monitor their own transport habits, emissions production and emissions exposure. A crowdsourcing process also gathered lived experiences and policy ideas. Residents involved in the project found it enjoyable and reported increased understanding of air quality. 74% of those surveyed indicated that they would make a behaviour change to improve air quality.
Create a supportive atmosphere
To ensure participants feel comfortable, activities should be conducted in informal, familiar places. For example, the literature cited locations such as coffee shops, community centres and participants’ homes [66].
“It’s very important where you meet your focus group. I don’t call everybody to the city to come to a focus group meeting. We go to the comfort zone. It’s very important to be where the people are comfortable, [so they can] express themselves.” (Stakeholder – public engagement delivery organisation).
Additionally, practitioners should explicitly communicate that participants’ contributions are valued [148], [168] and given enough time to cover topics in depth and discuss ideas fully. Participants’ privacy should be respected [153] and issues surrounding data handling and ethics should be taken seriously [148], [149]. Further, to promote credibility and legitimacy, deliberative processes should be transparent and well-communicated [169], [170].
Echoing the literature, focus group participants suggested that there should be opportunities for people to speak in small groups or with others one-to-one (to reduce anxiety around speaking in groups).
Consider practical issues
Planning ahead is crucial in ensuring the success of deliberation and co-design interventions. A clear remit and goal should be set in advance [171]; policymakers and facilitators should be sufficiently trained [77]; proper resources and funding should be provided [171]; and, ideally, tools that can be used in different contexts and at different scales should be employed [172]. Where participants act as data collectors – for example, in citizen science projects – organisers should ensure that the data collection method is congruent with the data analysis plan [148].
It is also important to enable initiatives to self-reflect and learn from each other. For example, useful actions include conducting pilots [147], [171]; gathering feedback from participants [168]; and sharing evidence, evaluations and failures with wider networks and organisations [148], [169], [173].
Impacts of the engagement
Engage meaningfully with outputs and recommendations
Alongside lessons relating to the delivery of individual deliberation and co-design activities, a common finding across the literature, interviews and focus groups was the need to respond meaningfully to outputs and recommendations. When these are ignored, engagement activities can appear tokenistic. This may call into question the legitimacy of participatory processes (in the eyes of participants and policymakers) and reinforce conflict within the involved communities [174], [175], [176].
Responding to, acting on and monitoring the implementation of recommendations should be seen as part of the participatory process and factored into the plan and budget [153], [164], [169], [177], [178], [179], [180]. Generally, integrating the outcomes of participatory activities into policy is easier when these are government-led. However, such interventions are also more likely to be perceived as ‘box-ticking exercises’ designed to give commissioners legitimacy [181].
To ensure decision-makers respond meaningfully to participatory processes, organisers should get buy in early on from actors that will be affected by the outcomes [166]. There should be a core policy team that is responsible for taking recommendations through the policy process, preferably involving officials from multiple departments and the core government, not just climate teams. Decision-makers should avoid merely assigning individual recommendations to the appropriate government departments for action, but also respond to the wider context, ethos and vision of participatory outputs. Additionally, the response process should be transparent to participants – participants should be told from the outset how their efforts will be acknowledged [148], [168], [182] and be regularly updated on how recommendations are being implemented [1], [30], [60], [61], [65], [66], [67], [169], [182].
“How are we going to follow up on [climate assemblies] in a way that does justice to what the assembly members have done? We’re so obsessed by the citizen engagement bit that we don’t focus enough on getting the structures around it right… I think we kind of go – ‘oh, that’s the participation there’. Actually, the participation is all of it… Don’t deliver an assembly unless you are sure you understand what the follow up is going to be.” (Stakeholder – climate assemblies expert).
Example: Irish Citizens Assembly (source: expert interviewee and EPA report)
In the Irish Citizens’ Assembly, 99 citizens deliberated on how Ireland can become a leader in tackling climate change. The process produced 13 recommendations which were more radical than many expected. A strength of the process was that a specific all-party parliamentary committee – the Joint Oireachtas Committee on Climate Action (JOCCA) – was set up to respond to the recommendations (via a published report). JOCCA’s report gave the recommendations momentum and ended up significantly shaping the Government’s Climate Action Plan to Tackle Climate Breakdown.
Example: Permanent climate assembly in Brussels (source: expert interviewee)
The permanent climate assembly in Brussels has a small committee of ten diverse citizens who spend a year working with the municipality after each deliberation cycle. This involves a new group of people each time and they have the right to ask for any information they want. The municipality is required to say after three months, what it’s going to do, and after a year what it’s done. While permanent assemblies will not always be possible and appropriate, this example highlights a practical approach to ensuring that engagement is built into decision making and that participants are kept close to the outputs and recommendations.
Another activity to consider is green participatory budgeting, where local people get together to decide how funds will be spent on environmental initiatives. This was flagged by one of our expert interviewees as a useful local-level participatory activity, that is less traditional than climate assemblies and garners involvement from a wide range of people.
“Participatory budgeting (PB) is one of the few participatory processes where the people who get involved can very directly see how their contribution then results in resources being mobilised to take action, to fund projects, to reform a service, to start a new initiative, or to channel resources in a new direction… It’s a more proactive and co-produced type of engagement. It’s not just led by the local authorities, it’s a partnership with a number of community organisations and third sector organisations. Green PB, I think, is a real opportunity that should play a central role in the public engagement strategy.” (Stakeholder – public policy and engagement expert).
Example: Green participatory budgeting in Lisbon, Portugal [23]
Lisbon’s green participatory budgeting programme empowers citizens to use part of the City Council’s budget each year for projects that make the city more sustainable, resilient and environmentally friendly. It is open to everyone in the municipality of Lisbon over the age of 16 and engagement is hybrid, with in-person events for discussion and debate alongside web-based platforms for voting and proposal submission. Winning projects are integrated into the City Council’s Plan of Activities and Budget and then implemented. Evidence suggests that citizens are actively engaged in Lisbon’s PB process and that this leads to the commissioning of sustainability-related projects.
Summary and relevance for the PES
Deliberation and co-design activities often lead to high levels of satisfaction among participants and can deliver benefits for the local community and those facilitating engagement [145], [183]. They are effective at engaging the public in climate change and crucial for bringing a topic onto the public stage [145], [184], [185]. However, practitioners should be aware that solutions that come out of participatory processes may not be ambitious enough to meet climate targets [171] and data gathered by citizens without expert input may be of poor quality [87].
The PES has been developed with the good practice principles of participation in mind, in line with the Scottish Government’s Participation Framework and the Open Government approach. The findings highlight some of the best practice which align with many of the PES principles such as being participative, inclusive, open and transparent. The findings also highlight areas for consideration in the implementation of these types of activities as part of the PES. These include:
When designing these engagement approaches, thinking carefully about who is there and how best to draw on local knowledge, lived experience and other types of expertise.
Encourage active forms of participation such as citizens’ science techniques, which involve the public directly in research, and approaches such as participatory budgeting which have a clear link between the public’s involvement and the decisions.
Explore the use of digital and creative tools to help share findings from deliberative and co-design approaches with a wider audience.
From the beginning, build in ways of measuring and demonstrating the impact of the engagement process. Take lessons from the Irish Citizens Assembly and the permanent climate assembly in Brussels which have established mechanisms for ensuring feedback for participants, helping hold decisions makers to account.
The lessons outlined in this chapter are particularly relevant for the following PES actions:
Build on Scotland’s Climate Assembly to develop further deliberative approaches
Continue to facilitate meaningful climate engagement conversations with people and audiences not currently engaged on the topic
Develop our approach to ensuring key climate change policies exhibit the principles of Open Government through meaningful consultation and participation
Creative activities
This chapter details the final theme identified in the literature, where “creative” approaches to public engagement have been used.
Creative engagement methods have a variety of outcomes and can be used in any of the other activity categories already explored (communication, education, deliberation and co-design). Therefore, creative interventions could contribute to all three of the PES objectives (‘Understand’, ‘Participate’ and ‘Act’).
Creating and working with art can increase environmental awareness and understanding [186]. It also facilitates reflection, critical thinking, empowerment and discussion, so is useful in participatory/deliberative processes [77], [90], [186]. Viewing climate change art – even virtually [78] – can enhance engagement, awareness, reflection and discussion [90], [187]. It also strengthens local/community identity [187] and cohesion [188], support for climate action [90] and sustainable behavioural intention [187].
Art exhibitions are particularly effective when they are collaboratively designed (by a diverse range of stakeholders), interactive, in public places and linked to local contexts, as they make people consider how climate change relates to their own lives [77], [90], [187], [189]. For example, exhibits could take place in squares, parks and streets, platform local stories and experiences, use local imagery and references, and engage local organisations.
Example:‘Floodlights’, an art exhibit in Hull, UK about sea level rise and flooding [187]
‘Floodlights’ was a multi-media, interactive exhibit that involved a range of pieces, including large projections onto iconic local landmarks, interactive activities and soundscapes. The exhibit increased attendees’ behavioural intention to take water and climate action, with engagement thought to be driven by emotional response, place-based attachment and civic pride. This highlights the potential role of interactive creative initiatives that are tailored to the local context in encouraging pro-climate behaviour.
Interactive information exhibits are stands or displays that incorporate activities such as posters, flash cards, infographics, models, digital or in-person games, live displays and sensory exercises. They are effective at increasing environmental knowledge and behaviour change intention [75], [190], [191]. They may do this by changing people’s perceptions of how their peers think, feels and act in relation to climate action, as well as increasing people’s confidence in taking action [191]. Such exhibits are interesting, engaging, memorable and enjoyable to people from a range of age-groups [189], [190]. They are also low-cost and easy to implement.
Interactive information exhibits should incorporate multiple activities which are playful, emotional, locally relevant and solutions-focused, but not present so much information that viewers feel overwhelmed. Having well-trained facilitators and communicators on hand to support discussion and answer questions is useful. Additionally, there are considerations for presenting interactive data – for example, presentation approaches that mimic the form, material and colour of biological processes are intuitively understood, as are colour scales like red-green [75].
Use digital tools, but be aware of drawbacks
As highlighted in previous sections, digital tools may be useful in achieving certain aims in certain contexts. Digital tools have the capacity to support environmental education, communication, participation, behavioural intention and real-world behaviour change [87], [192], [193], [194], [195].
Virtual platforms are a relatively quick, easy and cheap way to connect with a wide range of people, which is especially useful for collecting data (e.g. for environmental monitoring or opinion polls) and disseminating information (e.g. early warnings during disasters). Further, digital reward systems and currencies, where users accumulate points for carrying out pro-environmental behaviours – e.g. ‘Ant Forest’ [194] and ‘Greencoin’ [193] – can promote real life behaviour change. Digital platforms should be interactive, customisable and easy to use. They should not only be used to connect policymakers with the public, but also to connect publics and stakeholders with each other and encourage collaboration, information-sharing and discussion.
“Digital has this capacity of reach… It has generated participants who wouldn’t have come to face to face. There were people who, for example, had long term sickness, who would actually dial in from their beds. There were people with anxiety, who wouldn’t come to a face to face, but would do online.” (Stakeholder – climate assemblies expert).
However, there are a number of caveats to be aware of regarding digital tools [87]. First, these are complex technologies that we don’t yet fully understand – they can be unreliable and difficult to fix when things go wrong. They require practitioners and users to have technological skills, knowledge and resource, therefore aren’t accessible to everyone. They are less effective for deep engagement and may only be as good as the original data or communications content that they share [87]. Additionally, technology use comes with risks and negative consequences, such as carbon emissions, technology dependence, mental disorders, preventing people developing traditional skills, job losses and breaches of user privacy and agency [87].
“It can be a combination of both [online and offline], depending on resources and time. [Offline] is very effective because the interpersonal nature, the chemistry… That dynamic, you cannot get it online.” (Stakeholder – public engagement delivery organisation).
An app called AirRater was developed in Australia to encourage behaviours that protect health in response to environmental hazards.
The app enabled users to view information on multiple atmospheric health hazards in real time, view local environmental conditions, and track their personal symptoms.
Supporting the use of digital tools, most users valued the app’s visual features (e.g. maps and location settings) and found the information easy to understand.
In focus groups, the use of virtual tools, such as video platforms or apps, was seen as making public engagement more accessible in certain situations. The former was seen as useful for including people in group discussions where there are travel limitations, such as for those living in rural areas. Participants specifically discussed the use of apps as a means of public engagement in the context of one of the case studies (the food carbon tracking app – see Appendix D and Figure 3). Among those who were familiar with using apps, this approach was seen as an easy and convenient way to engage. However, while these approaches could increase accessibility in some ways, participants acknowledged that they were not always easy for everyone to use. Concerns were raised around digital exclusion, and the difficulties of taking part in a group discussion at home if there are other people or distractions around.
Figure 3: Floop a food carbon tracking app that was discussed in the focus groups.
Gaming, virtual reality and emerging approaches
Trial the use of games
There is promising evidence around the use of games for environmental public engagement, but there are caveats. Games have been found to support environmental risk perception [196]; reduced psychological distance [196], [197]; interest [198]; awareness and understanding [196], [198], [199], [200], [201], [202], [203], [204], [205], [206], [207], [208], [209]; efficacy and hope [196], [198], [199], [208]; emotional and affective engagement [196], [208]; feelings of urgency and responsibility [196], [208]; attitudes [210]; discussion, participation, collaboration and cooperation [77], [200], [201], [203], [209]; policy support [207]; behavioural intentions [196], [197], [207]; and sustainable behaviour change and emissions reduction [197], [199], [203], [204], [205].
Participants across a range of ages and groups have found games fun, interesting, engaging and accessible [196], [197], [198], [201], [204], [205], [206], [207], [208], [211]. Games can be used on a variety of topics and at a variety of scales (individual to community-level). Energy saving behaviours in households and offices show particular benefit from gamification [199]. Further, games may be very useful in educational settings as they foster experiential learning [77], [204], [205], which translates to real life settings [209]. Gamified places (where playful interactions are built into everyday activities) foster more active engagement and behaviour change as citizens gain a sense of ownership and community [203].
That said, research into climate change games is relatively new. The methods of evaluation are inconsistent and the results are not conclusive [212], [213], [214]. Benefits can be often short-term, with constant/repeated engagement needed for changes to be effective [199], [203], [210]. Further, games risk trivialising and commodifying the serious issue of climate change [203].
Example: Challenge-based game intervention between students [197]
Students at two universities competed on real-world behaviour change challenges, using a virtual platform to receive information, track their progress and view real-time scores. Participants enjoyed playing the game and it resulted in sustainable behaviour change and emissions reduction. The element of competition in this game was found to be particularly motivating for students.
A serious board game about sustainable drainage solutions (SuDS) increased players’ knowledge, comprehension, awareness, behavioural intention and acceptance of SuDS interventions. Providing support for the use of games in climate engagement, players found the game fun and engaging, although they also highlighted that the experience would be improved if the game was more realistic.
Initial evidence suggests that climate change games are most effective when they are realistic (in look, narrative and activities), responsive and intuitive [194], [196], [201], [207], [208], [210], [212], [213]. A challenge or competition element makes games particularly engaging [197], [199], [204], [205], [206], [210], as does giving the player some sense of autonomy and control [194], [212]. When implementing games, practitioners should encourage players to be open to scientific evidence, even if it goes against their existing beliefs [198]. And in educational settings, games should be customisable, co-designed with educators and integrated into the existing workflow/curriculum [204], [205], [206].
Trial the use of (immersive) virtual reality
Immersive virtual reality (IVR) has been used in games but also in non-game-based interventions, such as visualisations. Evidence surrounding the effects of IVR is inconclusive, with meta-analyses having found mixed results [215]. Some studies find that IVR experiences can enhance efficacy, learning, behavioural intentions and (virtual and real-life) pro-environmental behaviour [196], [215], [216], [217], [218], [219]. IVR users have also reported greater feelings of presence, immersion, usability, engagement and emotion, compared to other engagement methods [196].
However, other studies find IVR has minimal effects on behavioural intention [219] or is as effective as other modes of delivery (e.g. computer-based, text with graphics) in fostering learning and other benefits [196], [202]. IVR may be particularly useful for visualising scenarios far away in time or place, that would be difficult, dangerous, expensive or environmentally damaging to visit in real life [217], [219]. Recommendations seem to be similar to those for game design – make experiences realistic, relevant and immersive [215], [216]. IVR should be used with caution to supplement other activities.
Users travelled virtually to a national park and witnessed environmental destruction due to dietary choices. This immersive intervention was more effective than a virtual intervention which just presented information at increasing users’ pro-environmental intentions, virtual pro-environmental behaviour and real life pro-environmental behaviour around food choices, including a week after the intervention. This suggests that the availability of virtual reality to transport people to another place is particularly valuable in climate change engagement.
Be aware of other methods
The literature highlighted a few other activities which have not been extensively researched but show some promising initial evidence. These include:
Interactive theatre (‘science shows’ which are educational but also involve characters, narratives, engaging delivery, demonstrations and audience participation) can increase behavioural intention and are particularly well received by families and children [97], [220].
‘Plogging’ (picking up litter while jogging, or doing another physical activity) can increase awareness of littering and the benefits of taking environmental action [221].
Photo voice activities (where participants take photos and use these as a catalyst for discussion) can encourage environmental awareness, comprehension, sustainable behaviour change, community building, discussion and new ways of thinking [222].
Attending environmental events such as beach cleans and birdwatching events can increase people’s environmental concern, subjective norms (belief that other people are taking environmental action) and behavioural intention [86].
Summary and relevance to the PES
Generally, the evidence supports the effectiveness of creative interactive engagement methods for a variety of outcomes [68]. This may be because creative activities are intuitively understood, accessible and tap into people’s emotions. Creative methods are also often well-received by participants.
Creative forms of engagement are not explored in detail in the PES. One of the activities outlined in the PES involves engaging through culture and heritage, and highlights that the arts act as a significant communication tool. However, specific uses of art and other creative approaches are not explored in detail. Creative forms of engagement could therefore be an area for greater focus going forward.
The lessons outlined in this chapter can be applied across many aspects of climate change messaging, but are particularly relevant for the following PES actions:
Collaborate with key delivery organisations to ensure information reaches key audiences, including through initiatives such as Climate Week
Continue to facilitate meaningful climate engagement with people and audiences not currently engage on the topic
Continue to champion and fund community-led climate action
Utilise the potential of the arts, creativity and heritage to inspire and empower culture change.
Strategy-level findings
This section outlines findings that were relevant across all strands of public engagement activity, including strategy-level considerations identified in the literature. As these findings are broader that those in chapters 3 to 5, they are more closely related to the overarching principles of the PES, rather than specific actions.
Have a clear strategy linked to a vision for net zero
The evidence review was clear that having a national-level, government-led strategy on public engagement is important. Scotland is already leading the way by having a climate change public engagement strategy. The suggestions for what such a strategy should include mirror much of what is within the existing PES, however the findings serve as a reminder to ensure the strategy is support by sufficient resource, encourages cross-sector thinking, and is linked to a feasible vision for net zero.
Literature and stakeholder interviews suggest that an engagement strategy should coordinate large-scale activities and support local activities, over a sustained period of time [28], [55], [60], [66], [67], [68], [182], [223]. It should raise awareness, normalise climate action, invite people to shape decision-making and enable people to take action via structural support and behavioural approaches [4], [26], [30], [54], [57], [63], [69], [223].
“Joining of the dots into a coherent system is so important. It’s important to make effective use of public budgets and resources, to not burn people out and create more scepticism, and to demonstrate that there is a … coherent system of different spaces that are complementary… It’s not about any single public engagement process. All of them have strengths and weaknesses. It’s about their combination and their purpose.” (Stakeholder – public policy and engagement expert).
A government public engagement strategy should be embedded in the national climate change strategy [67] and be properly resourced and funded. It should include a concrete, positive, feasible vision for net zero, that has been co-produced and consistently communicated [14], [23], [26], [28], [30], [54], [60], [67], [223]. It should encourage cross-sector thinking and discussion [67], as well as including sector-specific strategies for hard-to-decarbonise areas [223].
Build on and support existing public engagement initiatives
The literature and stakeholders highlighted the importance of acknowledging and building upon any public engagement work that is already being carried out. This includes mapping, linking up and giving a platform to small-scale, bottom-up initiatives. Stakeholders suggested that a role for governments could be to provide resources, funding, legal advice and networking opportunities to grassroots and community initiatives already taking place.
“In some communities of place, there’s very little social capital left to initiate [engagement or advocacy]. What happens there? Well, that’s where the state needs to take the first step… What is needed is that kind of seed investment to get things going… The role of the state is to create the spaces where those ideas and actions can be supported and invested in.” (Stakeholder – public policy and engagement expert).
Stakeholders also pointed out that not all relevant groups may describe themselves as ‘climate’ groups (e.g., they may fall under community engagement labels) and not all will want to engage in the same way.
Show strong leadership, be trustworthy and transparent
Several sources highlighted the importance of strong government leadership in building collective efficacy and trust [4], [17], [30], [54], [63], [69]. This not only means having ambitious climate targets and strong climate policies, but also ‘leading by example’ (government actors and departments behaving in line with their climate communications and policy). Platforming and supporting others’ pro-climate behaviours is also considered part of strong leadership, as is leading international cooperation on public engagement (also referred to as Action for Climate Empowerment or ‘ACE’) [223].
Literature showed the importance of being honest about the engagement process and about the environmental issue being discussed, including the benefits, risks and areas of uncertainty [12], [53]. The importance of trusted messengers, who are referred to throughout the PES, was also clear from the literature. Building trust was also seen as important among focus group participants. They felt it was important for the information shared as part of public engagement on climate change to be balanced and evidence-based, in order for people to make informed judgements on the issues. Similarly, they felt that there should be a neutral or balanced perspective among people running or speaking at public engagement events. There was some cynicism about the motivations of those that carry out public engagement, which can diminish trust in the process.
“It depends on the answer [the commissioner] is chasing…. if they want something to go through, they’ll find the people they want to sit on that meeting. It’s very easy to buy the answer that you want.” (Focus group participant).
Some felt that public engagement can be used to endorse a pre-determined point of view and that participants can be chosen because they already have a vested interest in the outcome. They gave examples of recent consultations on topics such as local transport or farming practices which they felt had a foregone conclusion.
To help built trust in the engagement process, focus group participants felt that the organisation responsible for implementing the findings should be transparent about the actions they are taking as a result and be held accountable for doing so.
“Once we agree, or the Government agrees, a plan… they have to be accountable. So how do you make them accountable?…[Continually provide us with] an update on how [Scotland] is doing [on climate change targets] and how we’re doing against other countries. Make it real for everyone.” (Focus group participant).
This need for accountability was linked to a concern that organisations might change their minds about a decision or go back on what was agreed as part of the engagement. While this concern was largely framed in terms of private sector organisations overturning decisions due to commercial interests, it reflects a broader point about ensuring transparency about how findings from engagement activities have been acted upon.
Get the timing right
The research did not identify an optimum length or duration of public engagement, as this varies depending on the style, purpose and context of activities. However, literature did suggest that good public engagement should be conducted consistently over long periods of time. Even ‘standalone’ projects should give people the opportunity to stay involved and be updated after completion. This requires commissioners and practitioners to be proactive, organising engagement activities at the right time, for example well before legal obligations or public pressure necessitate it [1], [4], [12], [26], [28], [60], [66], [182]. People may also be particularly open to change during big life events (e.g. moving cities) and key societal moments (e.g. Covid-19) [69].
Embed public engagement in decision-making
A theme that emerged strongly in the literature and interviews was the importance of integrating public engagement within formal decision-making processes, in a co-ordinated way. Partly that means responding meaningfully to the outputs and recommendations of participatory activities and clearly communicating with the public about how engagement links with the policy process. But, broader than that, it also means viewing engagement activities not as isolated ad hoc events, but as part of an ongoing process that is systematically linked with decision-making [169]. For example, participants should be supported by permanent structures that enable them to hold decision-makers to account [179]. These could include permanent assemblies [173], invitations to government meetings and involvement in the implementation and monitoring of public engagement outputs.
“I think that’s the next frontier, making participation a way of everyday working.” (Stakeholder – climate assemblies expert).
“What we are short on is on a public engagement that is more co-productive, that puts as much emphasis on … that ongoing, more kind of co-productive relationship, I guess. And I think that’s where the public engagement agenda in Scotland needs to move.” (Stakeholder – public policy and engagement expert).
The evidence suggests that efforts should also be made to embed public engagement in the way government works, making it a ‘reflex’ for policy makers – i.e. something automatic, that happens as part of everyday operations [54], [55], [68], [182]. For example, public administrations should get a clear mandate from policy makers for using public engagement to inform policy and make public engagement an aim of new projects. Public engagement training could be provided to policy makers and their annual appraisals and promotions could consider involvement with engagement initiatives.
Demonstrate how the public’s views have been acted on
The need for demonstrable outcomes from public engagement was a strong theme in the focus groups. Participants felt that, for engagement to be worthwhile, it needs to have a clear outcome and, ideally, result in real change. They stressed the importance of ensuring that the public feel that they are being listened to, as this creates a sense of empowerment.
“It is really important to make sure that people thought their opinions were valued. So, make sure that they’re actually being listened to and take away the feeling of, like, powerlessness in the conversations…If you’re not in a position of power, it can be kind of difficult to make that happen.” (Focus group participant).
There was some cynicism, however, about whether public engagement always leads to action. This criticism was not directed at one particular type of engagement or organisation, but participants shared their own experience of local consultations or engagement activities that they felt had lacked impact. One example was a consultation about ferry services in island areas, during which participants felt concerns had not been listened to acted upon. This had created a sense of frustration and diminished trust in the organisation and the process. Another example was the hosting of COP26 in Glasgow, which was criticised for not having resulted in any meaningful change for the public.
“A lot of these things, you can go to them, but does it make a difference? I’ve been to [consultation events] about the ferries and they just spout the company line and they go away. People get annoyed. Nothing happens.” (Focus group participant)
“COP26, there was so much hype around it but really, was there enough messaging that filtered through and made people want to make change?” (Focus group participant)
Summary and relevance for the PES
These findings provide lessons for the overall direction of the PES at a strategic level. They suggest that, for the remainder of the PES, consideration should be given to:
Ensuring the PES is supported by sufficient resource, encourages cross-sector thinking, and delvers multiple approaches to engagement.
Working through existing networks of organisations delivering engagement at a local, community and regional basis. Scottish Government’s role in this respect could be as enabler and supporter of these public engagement activities, either through funding, advice, or other types of support.
Leading by example. To demonstrate credibility and ensure the public trust in delivery of the PES, the Scottish Government could be transparent about what actions are being taken and why, showcase pro-climate behaviours, and be open about the role of public engagement activities and how the findings will be used.
While there is no set guidance on when public engagement should take place, timing should be considered part of the overall approach to gaining trust and credibility. In practice this means engagement taking place early enough so that the findings can make a difference to a particular policy area.
Making clear how the public’s involvement will have an impact on decisions. Focus group participants were clear that the public should be reassured that they have been listened to and that their contributions have made a difference. Potential approaches could be to build this messaging into specific engagement activities at the beginning (i.e. making clear what has already happened as a result of previous engagements), at the end (i.e. through follow-up communications after an initial exercise) or as part of an ongoing programme of communication from government. Lessons can be learned from countries such as Ireland and Belgium where citizens’ assemblies have included formalised feedback processes.
Conclusions
The research showed that there is no single best way to engage the public on climate change. Public engagement should use multiple and varied contexts, scales, activities, depths of engagement, approaches and intervention points. Top-down approaches may be more effective at raising awareness at scale, but grassroots approaches lead to more meaningful engagement.
This research has identified a number of lessons for future public engagement on climate change that can inform future decisions related to the PES. These lessons are based on a combination of best practice examples in the evidence review and the views from focus groups with the general public. Of course, it will not be possible to do everything or to reach everyone. What can be achieved will be dependent on time, money and other resources, and choices will need to be made about what public engagement approaches to take and when. To help prioritise next steps, the key lessons from this research are presented in two groups:
Firstly, the areas that are not currently included or not outlined in detail in the PES. These “newer” lessons could be prioritised for the remainder of the PES.
Secondly, the areas in which the content of the PES already aligns with best practice, and which should be continued.
Areas for future consideration in the PES
The research has identified areas that are not referred to, or not outlined in detail, in the PES. These newer approaches could be taken into consideration for the remainder of the PES period. These are not presented in order of priority, but are grouped under the three strategic objectives of the PES to which they most closely relate.
Understand
Ensure that climate change messaging reflects the context of those it is aimed towards (including cultural, political and geographic factors) and is focussed on practical actions for individuals. Linking with other, non-climate topics can help to engage the public on climate change. Framing it in terms of impacts on health, safety and wellbeing were seen as particularly effective.
Balance both positive and negative, or fear-based, messaging. The merits of both these approaches were discussed in the literature and in the focus groups. While there is a potential conflict between those two directions, the overall sentiment was that governments should be honest about the risks and uncertainties of climate change, but also convey positive, practical actions that the public can adopt. This point was particularly relevant to communications campaigns but could also be applied to information conveyed through other communication channels and in educational settings.
When conveying the message, explore different approaches such as the use of visual communication and humour to convey information. Humour is an area not specifically mentioned in the PES and is one of the more emerging strands in the evidence review. This is potentially an area for further testing and development in the next stages of the PES.
In education settings, encourage and enable approaches that foster collaboration and co-design with learners. Examples in the literature included staff-student collaborations and student-led projects, training local community members or action groups to deliver non-formal education, and co-developing toolkits with key stakeholders.
Participate
Demonstrate that the public have been listened to and that action has been taken as a result of their participation. This was a strong theme in the general public focus groups and they considered it a high priority for future public engagement. It is important to be clear on and convey how the public are having an influence on decisions, be transparent about how those decisions are being acted upon, and keep the public updated on progress towards outcomes. Potential approaches could be to build this messaging into specific engagement activities at the beginning (i.e. making clear what has already happened as a result of previous, similar engagements), at the end (i.e. through programming in follow-up communications after an initial exercise) or as part of an ongoing programme of communication from government.
Think carefully about who is involved in deliberative, co-design and other participatory processes. As part of the design of the processes, consider how best to draw on people’s local knowledge and lived experience.
Encourage active forms of participation to help engage people in different ways. This can include approaches such as citizens’ science, which involves the public directly in data collection and other research activities, and participatory budgeting, which has a clear link between the public’s involvement and the decisions being taken as a result. These approaches can complement other, more established engagement approaches such as citizens’ assemblies.
Explore the use of creative activities. Some of these approaches, such as gaming and virtual reality, are still relatively new in the literature so would benefit from further exploration and testing before being used more widely.
Act
Make climate change relevant to people’s lives and conveying why their actions are important. The research showed that climate change can seem a distant topic for some, and there is still some scepticism amongst the public about the difference that their individual actions can make to climate change targets.
Give people autonomy by supporting co-production and co-creation processes. These approaches can help give the public a say in the way they engage and ownership over outputs or recommendations. This can foster a sense of empowerment and help legitimises the process.
Integrate public engagement into policy decision making. This includes responding meaningfully to the outputs and recommendations of public engagement and clearly communicating with the public about how their engagement links with the policy process. More broadly it means viewing engagement activities not as isolated ad hoc events, but as part of an ongoing process that is systematically linked with decision-making.
Take measures that help boost collective efficacy. Measures to build collective efficacy included using messaging that emphasise social norms, shared beliefs and a sense of community. Examples of this include sharing testimonials, photos and videos of citizens taking action, or hosting competitions, quizzes and user-generated content on social media. Promoting a sense of ownership of engagement outcomes and recommendation can also support feelings of self and collective efficacy.
Existing aspects of the PES that should continue
Overall, findings from this research support many of the principles, activities and initiatives within the PES. Themes such as inclusion, transparency, and evidence-based approaches are all principles for the PES and were all identified in this research as important features of public engagement. This suggests that the Scottish Government’s approach is already in line with some of the public engagement best practice happening in other places.
The research highlights some key areas that the Scottish Government should continue to focus on in the delivery of the PES:
Have a clear strategy with multiple engagement approaches. Scotland is already leading the way, not just in have the PES in place but also having a built-in process of monitoring and evaluation. The PES should continue to provide a clear and positive vision for the future and include multiple approaches, including co-ordinating large-scale engagement and supporting smaller local engagement. It could explore more creative innovative activities than those currently used, including strategy-level ideas such as an Open Climate Data Platform and cross-Government digital public engagement tools
Ensure communication is inclusive, wide-reaching and targeted to the audience. Much of the best practice on communication and education is already captured within the PES. This includes the need to be inclusive and accessible, to communicate with different audiences in different ways and to use messaging that highlights the relevance to individuals.
Consider what makes a “trusted” messenger and use these to help convey relevant messages. Clear and specific examples of trusted messengers were highlighted in the research (e.g. nature conservation charities, healthcare professionals, scientists, etc.). Specific groups aside, overarching characteristics that people trusted included sincerity, kindness, honesty, empathy, passion, and credibility. The type of organisation, and what principles they stand for, are therefore both important considerations when partnering with these messengers on public engagement.
Follow best practice on participatory approaches and how to remove barriers to engagement. Continuing to follow best practice and learnings from previous engagements such as Scotland’s Climate Assembly for deliberative and co-designed processes. This includes thinking carefully about who is there and how best to draw on local knowledge, lived experience and other types of expertise. In keeping with best practice engagement principles, the research highlighted the need to remove barriers to participation as much as possible. Particular attention should be paid to the barriers faced by marginalised communities and thinking carefully about how best to engage them.
Tracking and evaluating effectiveness. As well as the ongoing evaluation that is written into the PES, this should also involve testing different interventions, measuring their impact, and sharing learnings with others
Appendices
Appendix A – Research methodology additional detail
A.1. Desk-based evidence review: Approach to identifying evidence
A desk-based review of evidence was carried out to identify public engagement activities and examples of best practice. The review was designed to primarily answer the first two research questions.
A systematic search of academic literature was carried out on Scopus and Google Scholar, using pre-agreed search terms and parameters. This was supplemented with searches of relevant grey literature using Overton, OECD Library, World Cat and organisational websites. Inclusion criteria for the review were agreed in advance. All literature was written in English and published in 2020 or later (since a previous ClimateXChange study in 2020 that explored public engagement on climate change). The review included examples relevant to all three aspects of the PES objectives (‘Understand’, ‘Participate’ and ‘Act’). It focused as much as possible on sources that evaluated public engagement, to shed light on the question of “how to do good public engagement?” This included empirical studies, case studies, evidence reviews, and lessons drawn from relevant theory.
A total of 292 sources were reviewed, 236 of which were academic and 56 of which were grey literature.
A.2. Desk-based evidence review: Types of evidence reviewed
The evidence review highlighted a wide range of public engagement activities. Most of these engaged people around broad ‘climate’ or ‘environment’ issues. But some focused on more specific topics, including adaptation, consumption, waste, diet, transport, energy, justice, health, land use, nature, ocean sustainability, water management, sea level rise, geoengineering and carbon capture and storage (CCS).
The evidence had a global reach, but rich ‘Western’ regions such as the UK, Europe and North America dominated. Public engagement interventions covered a range of scales (from local to multi-country) and timeframes (from single sessions to multi-year projects). Audiences were generally citizens or residents, but some initiatives targeted particular groups (e.g. healthcare professionals, students, farmers, rural communities, young people).
Whilst there are many examples of government-led or government-supported public engagement interventions, there are few occasions where these have been evaluated. Therefore, as this review only included sources that evaluated public engagement activities, most of the interventions were academic or NGO-led rather than government-led.
A.3. Desk-based evidence review: Quality and limitations of evidence
There was a substantial amount of evidence that evaluated public engagement interventions, including those with pre- and post-measurement designs. However, evaluation was often over short periods of time, in artificial settings and involved self-report data, limiting the applicability of findings. Additionally, Scotland is one of very few countries to have a public engagement strategy on climate change. Therefore, while there is evidence regarding how to effectively conduct climate change public engagement activities, there are limited occasions where a (national) climate change engagement strategy has been evaluated. Strategy-level reflections tends to be suggestive, based on relevant theory, rather than on practice.
It is also important to point out that links between variables such as engagement, awareness, attitudes and behaviour are complex. Notably, many studies measured behavioural intention, which is an important antecedent of behaviour but does not automatically lead to behaviour change.
A.4. Desk-based evidence review: Types of public engagement
The range of activities identified in the evidence review fell into three main categories:
Communication and education: Large-scale communication campaigns, information packs, door-to-door canvassing, e-mail campaigns, radio messages, news broadcasting, social media posts, single message testing (videos, images, pure text), menus, posters. Education included school classes, university modules/lectures, curriculum changes, challenges, gamification, inquiry-based learning (where the learners choose which questions to investigate), writing reflections, argumentation training, apps, cooking classes, nature-based workshops, community action groups, training for particular professions, farmer field schools, peer discussions.
Deliberative engagement and co-design: Climate assemblies, global assembly, mini-publics, advisory councils, climate commissions, participatory planning, participatory budgeting, participation in decision-making, stakeholder engagement workshops, stakeholder collaboration, citizen science, virtual engagement, gamification.
Creative activities: Art, interactive theatre, digital games, board games, role-play, escape rooms, virtual reality, simulations, gamified places, mobile devices/apps, social media, internet of things (IoT), artificial intelligence (AI), interactive informational exhibits, plogging, photovoice, environmental events.
These categories are broad and there is a lot of overlap between them – for example, creative methods were used in educational and participatory interventions; communication principles were referenced in all activity types. There were also some sources that took a more top level (rather than activity-specific) approach, discussing general principles for doing good public engagement or ideas for developing and implementing a public engagement strategy.
Regarding the PES objectives, there was a lot of overlap across different types of activity, with many sources relating to more than one objective. There were some trends – for example, literature around deliberation and co-design activities tended to focus on ‘participate’, while education literature often focused on ‘understand’. However, overall, links between activities and PES objectives were not clear cut.
A.5. Stakeholder interviews
Interviews were conducted with six stakeholders, representing public engagement practitioners and specialists. These interviews were designed to complement the evidence review, and explored views on public engagement best practice and lessons for future public engagement for governments like the Scottish Government. Stakeholders with the following roles and from the noted locations represented different types of organisations involved the climate change public engagement space:
Climate communicator (USA)
Climate assemblies expert (Europe)
Climate campaigner and outreach organiser (Australia)
Public engagement delivery organisation (Seychelles)
Climate advocacy and engagement organisation (Europe)
Public policy and engagement expert (UK)
The stakeholders were identified by the research team at Ipsos and CAST based on the team’s existing knowledge of the sector. The mix of stakeholders was chosen to reflect different types of involvement in public engagement on climate change, different international locations and different topic specialisms. The list was agreed with ClimateXChange and the Scottish Government in advance. Interviews were conducted by phone or video, following a semi-structured discussion guide.
A.6. General public focus groups
Focus groups were carried out with members of the Scottish public to help address the third research question. The broad aim of the focus groups was to understand the public’s views on what good public engagement on climate change looked like, and how the Scottish Government should approach public engagement on climate change in future.
Four focus groups were carried out, each with seven or eight participants and each lasting 90 minutes. A mix of online and in-person focus groups were used, to help cater to different needs and accessibility requirements. Each group was designed to be broadly representative of the population (in terms of age, gender, working status, and disability or health condition) with certain groups intentionally over-represented to ensure adequate representation (those from ethnic minority groups and 16-24 year olds).
Participants were recruited by telephone via a specialist recruitment agency. A screening questionnaire was used to ensure their eligibility for the research and to meet the demographic quotas. A summary of each group is provided in Figure 1.
Figure A1 – Focus group summary
Group
Date
Format and location
No. of participants
1
15/10/24
Online, participants all from remote rural[1] locations
7
2
17/10/24
In person, Perth
8
3
22/10/24
In person, Glasgow
7
4
23/10/24
Online, participants from accessible rural locations
7
Focus groups were structured around a topic guide designed by the research team and agreed with ClimateXChange and the Scottish Government in advance. As part of the discussions, participants were shown examples of public engagement on climate change in the form of international case studies that had been identified in the evidence review. These are referred to throughout the report. Discussion guides and stimulus materials used in the focus groups are shown in Appendices C and D.
Appendix B – Case studies of public engagement
During the focus groups, participants were presented with four case study examples of previous public engagement activities from different parts of the world. While their views on each case study informs the main report, a summary of views on each is included here.
1. Make It Better campaign
The Make It Better campaign was run by the Ontario Public Health Association to raise awareness of the health impacts of climate change for children. Information was shared via social media, on a dedicated website, and through local public health professionals. People were able to sign a pledge on the website, committing to taking action.
Positives:
Topic seen as relevant – a current issue that lots of people will relate to
Subject seen as relatively uncontroversial for most people
Topic seen as serious and ’hard hitting’
Hashtag to boost reach
Concerns:
Digital exclusion
Pledges insubstantial/easily ignored
Not ‘dramatic’ enough to capture attention and ‘cut through the noise’
Would need to be more information about actions to take to be effective
“[The campaign] makes [climate change impacts] very tangible […] like, how does it affect us right now, right here? And it really joins the dots a bit.”
2. Carbon footprint food tracking app: Floop
Floop is a free app that allows people to track the carbon footprint of the food they buy. Developed by a private UK company, Floop’s features include meal logs, target setting, and suggested recipes.
Positives:
Easy and convenient to use an app
Liked that it has multiple features
Potential to compare or compete
Concerns:
Too much hassle
Digital exclusion
Needs promotion to people who wouldn’t think to look for it
Focus on individual lifestyle choices and making people feel guilty
Would make food shopping expensive
Not always a wide choice for consumers (especially in rural areas)
Preference for carbon labelling on packaging instead
Distrust of how politicians would use data from this type of app
A feeling that apps are commercial -not associated with public bodies
Wariness around in-app purchases
“It’s just too much faffing about […] I try not to buy anything that’s travelled too far […] but something like this, I just could not be bothered.”
3. Maine’s climate coalition
This was a partnership, including labour unions, climate groups and advocates, who worked together develop plans for how offshore wind energy should be put in place in Maine. They met with community groups, including those who opposed windfarms, and government officials. The plans they developed informed a new bill brough in by the government.
Positives:
A “ground up” approach
Driven by organisations without a vested interest in making a profit
Diverse stakeholders – e.g. unions will consider jobs not just the climate
Inclusion of opposing viewpoints
Created a significant impact
Concerns:
Lack of involvement of ordinary members of the public
Risk of only those with strong views being included
Climate specialists may cause public to feel underqualified to share views
Sounds like a big time commitment
“It wasn’t just, you know, one government official saying, this is what I want, or, you know, or one private company. [It] came from the ground up.”
4. Citizen’s science air quality project
A team at a university in Buenos Aires ran workshops with students to build air quality sensors. They put out an open advertisement for volunteers, who attached the sensors to their bikes for 7 weeks. The data collected was used to produce a city-level visualisation of air pollution.
Positives:
Community given the chance to get involved and make a difference
Brings people together, builds networks, could lead to further action
People would be more interested in the findings/the topic
Gets people active
Concept could work well via different mediums, e.g. data collection apps
Concerns:
Demanding – risk of volunteer fatigue
Public may not collect accurate data
Not clear what the impact would be, it’s just a data gathering exercise
Topic of air pollution – some negative associations e.g. potential for ULEZ
Bikes not suitable for all people/areas
“[People] are actually allowed to get involved more than just [sharing] thoughts […] it’ll certainly feel so much more like they are [making an impact].”
Appendix C – Discussion guides for focus groups
Introduction – 18.00 (3-5 mins)
Aim: to set expectations and cover ground rules
Thank you for joining us today. My name is …. and I work for Ipsos, an independent research company.
Today we are going to be discussing the best ways to engage the public in conversations relating to climate change.
This research has been commissioned by ClimateXChange, Scotland’s centre of expertise on climate change, on behalf of the Scottish Government. The Scottish Government is interested in finding out how people feel about the ways the public have been involved in discussions about climate change in the past, and how best to engage with the public in future. The research involves group discussions (including this one) with people across Scotland, as well as looking at other research that has already been carried out in Scotland and other countries about what works well when engaging people in climate change issues. It is looking at ways that people are informed about climate change, how they are encouraged to take part in discussions about climate change, and how they are encouraged to take action.
The findings from this research will be used by ClimateXChange and the Scottish Government to understand what might work well to engage with people about climate change in future. So your input is really valuable and we really appreciate you joining us.
Firstly- a brief overview of how the discussion will work:
Explain that the discussion will last until 7.30 pm
Cover general housekeeping, videos on, mobile phones on silent
FOR IN PERSON GROUPS: cover practicalities e.g. toilets/exits
FOR ONLINE GROUPS: if connection drops in online groups – text moderator/wait for moderator to return SHARE MOBILE [redacted]
Before we begin, I would like to…
stress that there are no right or wrong answers – we are just interested in understanding your views
reassure you about anonymity and confidentiality. Ipsos is fully compliant with the Market Research Society Code of Conduct. No information about individuals will be passed on to anyone outside the research team
note that there’s a lot to cover, so I may move you on from time to time
ask if you could respect each other’s viewpoints and speak one at a time
give you the option of writing down your thoughts on a post-it or in the chat if you would like to
request permission to record the discussions to assist with our analysis and reporting
CHECK FOR CONSENT TO RECORD
3. Warm up – 18.05 (5-7 mins)
TURN ON RECORDER
Let’s start off with some introductions. It would be great to have everybody introduce themselves and let us know what you would usually be doing this evening if you weren’t taking part in this discussion?
GO ROUND EVERYONE
4. Discussion 1: Awareness and experiences of public engagement on climate change – 18.10 (10 mins)
Aim: Get an understanding of experiences and views on public engagement generally.
As you heard, we are interested in how the Scottish Government and other organisations communicate with people about climate change.
Firstly, what kind of issues come to mind when you think about climate change?
PROMPT if needed: What sorts of words or phrases come to mind when you hear that term?
What aspect of climate change would you say you have heard most about?
PROBES (ONLY USE IF NECESSARY): How about the ways in which we might respond to climate change and how it impacts our lives day-to-day, e.g.
The way we get around?
The way we heat our homes?
The types of food we produce and eat?
Other things, such as clothes, that we buy?
The way we handle our waste?
What sorts of ways would you say the public can be involved in discussions and have their say about climate change issues?
Any examples they can think of?
Before today, have you taken part in activities where you shared your views on issues relating to climate change? (E.g. this might have been a public meeting, a consultation, attending an event)
IF NO: Have you shared your views on other topics, for example about changes in your local area, how public spaces are used, or public transport?
IF YES TO EITHER:
What did this involve?
Why did you get involved?
How did you find this? What worked well/less well?
IF NO TO BOTH: Do you think you would have liked to have taken part in something like this?
5. Discussion 2: What is ‘good’ public engagement? 18.20 (15 mins)
Aim: to develop understanding of what public engagement is, some key approaches used, and explore expectations about what would characterise a successful engagement. These principles will then be applied to their ‘review’ of detailed examples in the next section.
Getting involved in these conversations and having your say about climate change in the ways we’ve been discussing can be described as “public engagement”. This slide summarises what we mean be that:
SHARE SLIDE WITH DEFINTION OF PUBLIC ENGAGEMENT & EXAMPLES
So when we talk about public engagement, we mean a range of ways that raise our awareness and understanding of an issue, enable us to participate in decision making, and encourage people to take action.
There are lots of different examples of public engagement. Later this evening we will look at a few of this in detail, but for now I’ve shown on the slide here some of the main types. You may or may not have heard of these, but they include:
Communication campaigns raise awareness about a topic, with information shared in range of ways such as through websites, social media, advertising, other media channels and public events.
Organised group discussions, where members of the public are invited to come along (either in a room, or online like we are tonight) to discuss their views about a particular issue or topic. There is usually a limit to the number of people that are asked to attend these discussions, and they are usually on a set date and time.
Public meetings, or drop in events, where the public can come along and have their say about topic. The difference between this and organised group discussions is that in a public meeting anyone that wants to can attend, whereas with organised groups there are usually some criteria used to decide how many and what different types of people can attend.
Open online consultations, where you can submit ideas or feedback on an issue, via a website
And then the final one, you may have heard some of these terms like Citizens Assemblies or Citizens Forums. These are like the organised group discussions, but are typically bigger, so 50 to 100 people at each meeting, and usually run over several days or weekends. But we’ll say more about those later.
Why do you think organisations would choose one type of public engagement over another?
PROBE: What sorts of considerations do you think they would have in mind when deciding what approach is best?
Now that we’ve seen what public engagement is and some of the ways it can be done, I’d like you each take a few minutes and think about the following question:
What would ‘good’ public engagement look like to you? (5 MINS)
IN-PERSON GROUPS: Could you please pair up with the person next to you and do this together? Write down your thoughts on post-it notes and then we can put them all on the flipchart. [Suggest which pairings to avoid confusion, include group of 3 if odd number]
ONLINE GROUPS: Note down your thoughts, and then I’ll ask everyone to share this, and I’ll write it all d own on my [slides/screen].
FOR ALL:
Try to think about public engagement about climate change issues specifically, as that is what we are most interested in.
There are no right or wrong answers here, we just want to hear any views at all
You could think about things like:
who organises the public engagement,
what information is shared with the public,
how this information is shared and with who?
whether members of the public get involved,
how those people are selected/invited,
what people are asked to do etc.
PROBE EACH PAIR ON REASONS FOR THEIR ANSWERS.
Would good public engagement be the same no matter what the organisers of the engagement are trying to achieve?
And final question before we take a quick 5 minute break, what would ‘bad’ public engagement look like then? Would it just be the opposite of the things you have listed under ‘good’, or would it be anything else?
BREAK 18.35 – 18.40 (5 mins)
Case Study examples – 18.40 (45 mins)
Aim: to test views on different types of public engagement on climate change in more detail, by examining specific examples identified in the literature review. As well as getting views on these specific examples, the aim is to get to some of the underlying views on what they consider important in terms of future public engagement.
So far we have been talking about how and why people get involved in decisions about climate change, and what ‘good’ public engagement would look like. I’d now like us to talk about that in a bit more detail, by looking at some examples of how this has been done in the past.
There are a few examples we are going to talk through, and we’ll show some information on screen to summarise what they involved. After each one, I’ll stop and ask for your views. Really what we are interested in here is how you feel about the way the public have been engaged in each example – you might think they are good examples, you might not, but any opinions are welcome.
SHOW THE FOLLOWING 4 METHOD EXAMPLES AS IDENTIFIED IN THE EVIDENCE REVIEW. HAVE POWERPOINT SLIDES SUMMARISING EACH ONE (INCLUDING IMAGES).
SPEND 10 MINUTES ON EACH CASE STUDY. ORDER OF THE EXAMPLES WILL BE ROTATED BETWEEN FOCUS GROUP, SO THAT EACH GROUP STARTS WITH A DIFFERENT ONE.
FACILITATOR NOTE – IF ASKED, THERE ARE NO SET PLANS FOR THE SCOTTISH GOVERNMENT TO IMPLEMENT THESE ACTIVITIES IN SCOTLAND, BUT SIMILAR ACTIVITIES HAVE TAKEN PLACE HERE. STRESS THAT THE AIM OF THESE EXAMPLES IS TO UNDERSTAND IF THERE ARE ANY ELEMENTS OF THEM THAT THEY PARTICULARLY LIKE OR DISLIKE, RATHER THAN TO DECIDE WHETHER THE SCOTTISH GOVERNMENT SHOULD PUT THESE SPECIFIC IDEAS IN PLACE.
Order to show examples in each group
Group 1 (online)
Group 2 (Perth)
Group 3 (Glasgow)
Group 4 (Online)
Example 1
Example 2
Example 3
Example 4
Example 2
Example 3
Example 4
Example 1
Example 3
Example 4
Example 1
Example 2
Example 4
Example 1
Example 2
Example 3
FOR EACH EXAMPLE, PROBE ON:
Immediate thoughts/reactions?
What are the positives about this example? And negatives? (REFERRING BACK TO THEIR IDEAS FOR WHAT ‘GOOD’ ENGAGMENT LOOKED LIKE)
SPECIFIC PROBES FOR EACH EXAMPLE:
Example 1: Make It Better campaign:
How did you feel about….
The link between climate change and health?
The way information was share with the public?
How easy or difficult it would be to find out about this?
That this was targeted at parents, caregivers and health professionals?
What is missing? How could it be better?
What would you do if you saw this campaign?
What if the Scottish Government or another public agency had a similar campaign – how would you feel about that?
Would it make a difference who was delivering the campaign?
Would you do anything differently if you saw a campaign this like from the Scottish Government? Why/why not
Example 2: The food carbon app:
How did you feel about….
The link between climate change and food?
The fact that this was an app?
How easy or difficult it would be to get involved in this?
How easy or difficult it would be use?
What is missing? How could it be better?
What would you do if you saw this app?
What if the Scottish Government or another public agency had an app like this – how would you feel about that?
Would it make a difference what organisation launched the app?
Would you do anything differently if you saw something like this from the Scottish Government? Why/why not
Example 3: Main’s climate coalition
How did you feel about….
The types of groups that were involved – labour unions, environmental groups and climate advocates?
The amount of time and input they gave i.e. meetings with each other, meetings with government, working up plans?
How easy or difficult it would be for members of the public to get involved in this?
What is missing? How could it be better?
What if this sort of activity was happening in your area – would you get involved? Why/why not?
What if the Scottish Government or another public agency was encouraging groups to get together and develop plans like this – who would you feel about that?
Would it make a difference what organisation led this sort of programme?
Would you do anything differently if you saw something like this being organised by the Scottish Government? Why/why not
Example 4: Measuring air quality
How did you feel about….
The way they recruited volunteers through an open advertisement?
The number of people involved?
What people were asked to do?
The fact that the volunteers were asked to contribute to the research by going out and collecting data?
How easy or difficult it would be to get involved in this?
What is missing? How could it be better?
What if the Scottish Government or another public agency was encouraging people to take part in an activity like this – who would you feel about that?
Would it make a different what organisation led the activity?
Would you do anything differently if you saw something like this being organised by the Scottish Government? Why/why not
Feedback and wrap up – 19.25 (5 mins)
We’re getting to the end of the discussion now, so I just have a few more questions
From the examples we discussed, what are the most positive things that stand out for you?
What would ideal future public engagement on climate change look like?
If you could tell the Scottish Government one thing about how best to engage with the public in future what would be it be?
Thanks very much everyone for sharing your thoughts on these examples of public engagement, it’s been really interesting and useful to hear.
Are there any final points anyone wants to add?
Any final questions?
EXPLAIN INCENTIVES AND NEXT STEPS. THANK AND CLOSE.
Appendix D – Stimulus for focus groups
The stimulus for the focus groups took the form of six Powerpoint slides. For accessibility reasons, the content of these slides has been formatted into Word. Therefore, please note that this information looks slightly different to how it was displayed in PowerPoint, although it is as close as possible.
D.1.Content of stimulus slide 1 of 6 – Background information
Public engagement
A range of approaches that help to raise the public’s awareness and understanding of an issue, enable us to participate in decision making, and encourage us to take action. For example…
D.2.Content of stimulus slide 2 of 6 – What is good public engagement to you?
What would ‘good’ public engagement look like to you?
Figure D.3.Content of stimulus slide 3 of 6 – Make It Better Case Study
Make It Better campaign
A campaign by the Ontario Public Health Association to address the health impacts of climate change.
It aimed to inform people about the health-related risks of climate change for children (Lyme disease, asthma, heat-related illness).
It provided tools and information to help parents, caregivers, health professionals and community members take actions that would help reduce the health risks of climate change.
Information was shared by the Public Health Association over social media (using #MakeItBetter), on a dedicated website, and through local public health professionals.
People were asked to:
Sign the #MakeItBetter pledge (meaning they supported the campaign were committed to taking action)
Keep themselves informed by learning more about how children’s health is impacted by climate change
Share what they had learned with other people
Discover ways to combat climate change and its impacts and take actions.
Figure D.4.Content of stimulus slide 4 of 6 – Food carbon app case study
Food carbon app
“Floop” is a free app which tracks the carbon footprint of our food
It was founded by three individuals who formed the company, based in the UK.
It aims to bring attention to our carbon footprint and encourage people to eat more sustainable food.
Users can download the app, log their daily meals and it calculates the carbon footprint of each meal. It also allows you to set targets for how much you want to reduce your carbon footprint by, and provides recipes and meal plans.
The app includes information about the research that has been used to develop the app.
Note that a number of other apps that calculate the carbon impact of food have been tested and/or launched elsewhere.
Figure D.5.Content of stimulus slide 5 of 6 – Maine’s climate coalition case study
Maine’s climate coalition
A partnership in Maine, USA, that worked together to help inform local policies in relation to offshore wind energy.
A number of labour unions, environmental groups and climate advocates came together and formed a partnership to push for the development of offshore windfarms in their area. Their view was that offshore wind could address climate change by creating clean energy and create jobs by building a new industry in the area.
They met and worked together several times to develop plans for how offshore wind energy should be put in place. As well as meeting with each other, they met with various community groups, including those that opposed windfarms and various government officials.
The plans they developed were shared with government and helped to inform a new bill that sets out how offshore wind should be put in place.
Figure D.6.Content of stimulus slide 6 of 6 – Measuring air quality case study
Measuring air quality
A team at a university in Buenos Aires, Argentina, set out to understand the differences in air quality across different parts of the city.
They ran workshops with 80 students where they built air quality sensors and learnt about the impact of air quality on health.
They then put out an open advertisement for volunteers and recruited 20 people. These volunteers collected data on changes to air quality in the city by carrying the air quality sensors on their bikes for 7 weeks.
Each volunteer regularly uploaded their data to an open platform. The data was then used to produce a city-level visualisation of air pollution (see image on right).
Since then they launched similar air quality pilots in other cities in Argentina in partnership with local authorities.
References
Sources cited in the report
[1] Centre for Public Impact, ‘Public engagement for net zero: A literature review’, Centre for Public Impact, Apr. 2021. [Online]. Available: https://www.centreforpublicimpact.org/europe/engaging-the-public-on-climate-change
[2] C. Cherry, C. Verfuerth, and C. Demski, ‘Discourses of climate inaction undermine public support for 1.5 °C lifestyles’, Glob. Environ. Change, vol. 87, p. 102875, Jul. 2024, doi: 10.1016/j.gloenvcha.2024.102875.
[3] A. McCarron, S. Semple, C. F. Braban, V. Swanson, C. Gillespie, and H. D. Price, ‘Public engagement with air quality data: Using health behaviour change theory to support exposure-minimising behaviours’, J. Expo. Sci. Environ. Epidemiol., vol. 33, no. 3, pp. 321–331, 2023, doi: 10.1038/s41370-022-00449-2.
[4] K. Mitev, L. Player, C. Verfuerth, S. Westlake, and L. Whitmarsh, ‘The implications of behavioural science for effective climate policy: Output 1: Literature review and background report’, The Centre for Climate Change and Social Transformations (CAST), Bath, England, Sep. 2023.
[5] K. Winter, M. J. Hornsey, L. Pummerer, and K. Sassenberg, ‘Anticipating and defusing the role of conspiracy beliefs in shaping opposition to wind farms’, Nat. Energy, vol. 7, no. 12, pp. 1200–1207, 2022, doi: 10.1038/s41560-022-01164-w.
[6] E. Kwakye and Y. B. Agyeman, ‘Influence of climate change information on community-based livelihood adaptation around Lake Bosomtwe, Ghana’, Int. J. Clim. Change Impacts Responses, vol. 14, no. 2, pp. 21–34, 2022, doi: 10.18848/1835-7156/CGP/v14i02/21-34.
[7] F. Lange, R. Van Asbroeck, D. Van Baelen, and S. Dewitte, ‘For cash, the planet, or for both: Evaluating an informational intervention for energy consumption reduction’, Energy Policy, vol. 194, 2024, doi: 10.1016/j.enpol.2024.114314.
[8] H. Malan et al., ‘Increasing the selection of low-carbon-footprint entrées through the addition of new menu items and a social marketing campaign in university dining’, J. Assoc. Consum. Res., vol. 7, no. 4, pp. 461–470, 2022, doi: 10.1086/720450.
[9] K. Schmidt, ‘Behavioral effects of guideline-provision on climate-friendly food choices – A psychological perspective’, J. Clean. Prod., vol. 277, 2020, doi: 10.1016/j.jclepro.2020.123284.
[10] G. Shreedhar, A. Sabherwal, and R. Maldonado, ‘Cli-fi videos can increase charitable donations: Experimental evidence from the United Kingdom’, Front. Psychol., vol. 14, 2023, doi: 10.3389/fpsyg.2023.1176077.
[11] M. Andreotta, F. Boschetti, S. Farrell, C. Paris, I. Walker, and M. Hurlstone, ‘Evidence for three distinct climate change audience segments with varying belief-updating tendencies: Implications for climate change communication’, Clim. Change, vol. 174, no. 3–4, 2022, doi: 10.1007/s10584-022-03437-5.
[12] K. Altman, B. Yelton, D. E. Porter, R. H. Kelsey, and D. B. Friedman, ‘The role of understanding, trust, and access in public engagement with environmental activities and decision making: A qualitative study with water quality practitioners’, Environ. Manage., vol. 71, no. 6, pp. 1162–1175, 2023, doi: 10.1007/s00267-023-01803-2.
[13] H. Palm, H. Pfeffer, N. Raith, and N. Brandstetter, ‘An interdisciplinary approach for successful municipal energy transition communication’, J. Environ. Stud. Sci., Jun. 2024, doi: 10.1007/s13412-024-00960-y.
[14] C. Shaw and S. Wang, ‘After the lockdown? New lessons for building climate change engagement in the UK’, Climate Outreach and the Centre for Climate Change and Social Transformations (CAST), 2021.
[15] H. Chu and J. Z. Yang, ‘Risk or efficacy? How psychological distance influences climate change engagement’, Risk Anal., vol. 40, no. 4, pp. 758–770, 2020, doi: 10.1111/risa.13446.
[16] Y. Guo and Y. Hou, ‘COVID-19 pandemic as an opportunity or challenge: Applying psychological distance theory and the co-benefit frame to promote public support for climate change mitigation on social media’, Environ. Commun., vol. 18, no. 5, pp. 550–568, 2024, doi: 10.1080/17524032.2023.2205038.
[17] House of Lords, ‘In our hands: Behaviour change for climate and environmental goals’, Environment and Climate Change Committee, House of Lords, Oct. 2022.
[18] V. S. Limaye and B. Toff, ‘Evaluating responses to health-related messages about the financial costs of climate change’, J. Clim. Change Health, vol. 10, 2023, doi: 10.1016/j.joclim.2023.100218.
[19] D. Powell and E. James, ‘How can politicians avoid a net-zero backlash? The role of public engagement: A briefing for policy makers and communicators. CAST Briefing 20’, The Centre for Climate Change and Social Transformations (CAST), Bath, England, Nov. 2023.
[20] L. A. Selvey, M. Carpenter, M. Lazarou, and K. Cullerton, ‘Communicating about energy policy in a resource-rich jurisdiction during the climate crisis: Lessons from the people of Brisbane, Queensland, Australia’, Int. J. Environ. Res. Public. Health, vol. 19, no. 8, 2022, doi: 10.3390/ijerph19084635.
[21] L. T. H. Sen, J. Bond, N. T. Dung, H. G. Hung, N. T. H. Mai, and H. T. A. Phuong, ‘Farmers’ barriers to the access and use of climate information in the mountainous regions of Thừa Thiên Huế province, Vietnam’, Clim. Serv., vol. 24, 2021, doi: 10.1016/j.cliser.2021.100267.
[22] Y. L. Waters, K. A. Wilson, and A. J. Dean, ‘The role of iconic places, collective efficacy, and negative emotions in climate change communication’, Environ. Sci. Policy, vol. 151, 2024, doi: 10.1016/j.envsci.2023.103635.
[23] Centre for Public Impact, ‘Public engagement on climate change: A case study compendium’, Centre for Public Impact, Apr. 2021. [Online]. Available: https://www.centreforpublicimpact.org/europe/engaging-the-public-on-climate-change
[24] A. Corner, C. Demski, K. Steentjes, and N. Pidgeon, ‘Engaging the public on climate risks and adaptation: A briefing for UK communicators’, Climate Outreach, Oxford, 2020.
[25] C. Bretter, K. L. Unsworth, S. V. Russell, T. E. Quested, G. Kaptan, and A. Doriza, ‘Food waste interventions: Experimental evidence of the effectiveness of environmental messages’, J. Clean. Prod., vol. 414, 2023, doi: 10.1016/j.jclepro.2023.137596.
[26] C. Demski, ‘Net zero public engagement and participation: A research note’, Department for Business, Energy and Industrial Strategy, Mar. 2021.
[27] M. Lähdesmäki and A. Matilainen, ‘Female forest owners as a market segment? Results from a marketing experiment in the context of a small forest service enterprise’, Balt. For., vol. 27, no. 2, 2021, doi: 10.46490/BF606.
[28] C. Verfuerth, C. Demski, S. Capstick, L. Whitmarsh, and W. Poortinga, ‘A people-centred approach is needed to meet net zero goals’, J. Br. Acad., vol. 11, no. S4, pp. 97–124, 2023, doi: 10.5871/jba/011s4.097.
[29] R. J. Romsdahl, ‘Deliberative framing: Opening up discussions for local-level public engagement on climate change’, Clim. Change, vol. 162, no. 2, pp. 145–163, 2020, doi: 10.1007/s10584-020-02754-x.
[30] B. Zanin, C. Verfuerth, C. Demski, C. Cherry, L. Whitmarsh, and D. Powell, ‘Five principles for good public engagement: How to get people involved in the climate conversation. CAST Briefing 29’, The Centre for Climate Change and Social Transformations (CAST), Bath, England, Jul. 2024.
[31] C. Mullins-Jaime and J. K. Wachter, ‘Motivating personal climate action through a safety and health risk management framework’, Int. J. Environ. Res. Public. Health, vol. 20, no. 1, 2023, doi: 10.3390/ijerph20010007.
[32] E. Peters et al., ‘Evidence-based recommendations for communicating the impacts of climate change on health’, Transl. Behav. Med., vol. 12, no. 4, pp. 543–553, Apr. 2022, doi: 10.1093/tbm/ibac029.
[33] M. Sanderson, H. Doyle, and P. Walsh, ‘Developing and implementing a targeted health-focused climate communications campaign in Ontario—#MakeItBetter’, Can. J. Public Health., vol. 111, no. 6, pp. 869–875, 2020, doi: 10.17269/s41997-020-00352-z.
[34] E. Wolstenholme, W. Poortinga, and L. Whitmarsh, ‘Two birds, one stone: The effectiveness of health and environmental messages to reduce meat consumption and encourage pro-environmental behavioral spillover’, Front. Psychol., vol. 11, 2020, doi: 10.3389/fpsyg.2020.577111.
[35] S. Akehurst and L. Murphy, ‘A rising tide: Strengthening public permission for climate action’, Institute for Public Policy Research (IPPR), 2022.
[36] C. F. Nisa, J. J. Bélanger, and B. M. Scumpe, ‘Assessing the effectiveness of food waste messaging’, Environ. Sci. Policy, vol. 132, pp. 224–236, 2022, doi: 10.1016/j.envsci.2022.02.020.
[37] L. S. Svenningsen and B. J. Thorsen, ‘The effect of gain-loss framing on climate policy preferences’, Ecol. Econ., vol. 185, 2021, doi: 10.1016/j.ecolecon.2021.107009.
[38] S. Timmons, Y. Andersson, and P. Lunn, ‘Framing climate change as a generational issue: Experimental effects on youth worry, motivation and belief in collective action’, Economic and Social Research Institute, ESRI Working Paper No. 731, 2022.
[39] A. Prosser, D. Thorman, K. Mitev, L. Whitmarsh, and A. Sawas, ‘Developing an evidence-based toolkit for car reduction’, The Centre for Climate Change and Social Transformations (CAST) and Climate Outreach, 2022.
[40] D. Barrios-O’Neill, ‘Focus and social contagion of environmental organization advocacy on Twitter’, Conserv. Biol., vol. 35, no. 1, pp. 307–315, 2021, doi: 10.1111/cobi.13564.
[41] L. Cameron, R. Rocque, K. Penner, and I. Mauro, ‘Evidence-based communication on climate change and health: Testing videos, text, and maps on climate change and Lyme disease in Manitoba, Canada’, PLoS ONE, vol. 16, no. 6 June, 2021, doi: 10.1371/journal.pone.0252952.
[42] K. L. Akerlof, C. Boules, E. Ban Rohring, B. Rohring, and S. Kappalman, ‘Governmental communication of climate change risk and efficacy: Moving audiences toward “danger control”’, Environ. Manage., vol. 65, no. 5, pp. 678–688, 2020, doi: 10.1007/s00267-020-01283-8.
[43] T. Bolsen, R. Palm, and R. E. Luke, ‘Public response to solar geoengineering: How media frames about stratospheric aerosol injection affect opinions’, Clim. Change, vol. 176, no. 8, 2023, doi: 10.1007/s10584-023-03575-4.
[44] A. Gustafson, M. T. Ballew, M. H. Goldberg, M. J. Cutler, S. A. Rosenthal, and A. Leiserowitz, ‘Personal stories can shift climate change beliefs and risk perceptions: The mediating role of emotion’, Commun. Rep., vol. 33, no. 3, pp. 121–135, Sep. 2020, doi: 10.1080/08934215.2020.1799049.
[45] C. C. Anderson et al., ‘Public acceptance of nature-based solutions for natural hazard risk reduction: Survey findings from three study sites in Europe’, Front. Environ. Sci., vol. 9, 2021, doi: 10.3389/fenvs.2021.678938.
[46] O. I. Asensio, C. Z. Apablaza, M. C. Lawson, and S. E. Walsh, ‘A field experiment on workplace norms and electric vehicle charging etiquette’, J. Ind. Ecol., vol. 26, no. 1, pp. 183–196, 2022, doi: 10.1111/jiec.13116.
[47] M. N. Bechtoldt, A. Götmann, U. Moslener, and W. P. Pauw, ‘Addressing the climate change adaptation puzzle: A psychological science perspective’, Clim. Policy, vol. 21, no. 2, pp. 186–202, 2021, doi: 10.1080/14693062.2020.1807897.
[48] G. Caso, A. Annunziata, and R. Vecchio, ‘Let us go with the flow − Impact of a dynamic social norm nudge on parents’ school menu selection’, Food Qual. Prefer., vol. 121, 2024, doi: 10.1016/j.foodqual.2024.105274.
[49] S. J. Goerg, A. Pondorfer, and V. Stöhr, ‘Regional variation in social norm nudges’, Sci. Rep., vol. 14, no. 1, 2024, doi: 10.1038/s41598-024-65765-z.
[50] C. R. Schneider and S. van der Linden, ‘Social norms as a powerful lever for motivating pro-climate actions’, One Earth, vol. 6, no. 4, pp. 346–351, 2023, doi: 10.1016/j.oneear.2023.03.014.
[51] B. León, M. Bourk, W. Finkler, M. Boykoff, and L. S. Davis, ‘Strategies for climate change communication through social media: Objectives, approach, and interaction’, Media Int. Aust., vol. 188, no. 1, pp. 112–127, Aug. 2023, doi: 10.1177/1329878X211038004.
[52] Z. Shah, L. Wei, and U. Ghani, ‘The use of social networking sites and pro-environmental behaviors: A mediation and moderation model’, Int. J. Environ. Res. Public. Health, vol. 18, no. 4, pp. 1–21, 2021, doi: 10.3390/ijerph18041805.
[53] A. Randall, D. Basu Ray, G. Kaur, and D. Zayad, ‘Something to talk about – success stories of public engagement to tackle climate change’, Climate Outreach. Accessed: Sep. 19, 2024. [Online]. Available: https://climateoutreach.org/public-engagement-case-studies/
[54] S. Allan, ‘What role for government? A practical guide to the types, roles and spaces of public engagement on climate’, Involve, Sep. 2023.
[55] National Academies of Sciences, Engineering, and Medicine, ‘Public engagement to build a strong social contract for deep decarbonization’, in Accelerating decarbonization in the United States: Technology, policy, and societal dimensions, in Accelerating Decarbonization in the United States: Technology, Policy, and Societal Dimensions. , 2024, p. 806. doi: 10.17226/25931.
[56] A. Rakhimov and E. Thulin, ‘Knowing behavior matters doesn’t hurt: The effect of individual climate behavior messaging on green policy support’, Oxf. Open Clim. Change, vol. 2, no. 1, 2022, doi: 10.1093/oxfclm/kgac007.
[57] C. Wamsler et al., ‘Meaning-making in a context of climate change: Supporting agency and political engagement’, Clim. Policy, vol. 23, no. 7, pp. 829–844, Aug. 2023, doi: 10.1080/14693062.2022.2121254.
[58] Climate Outreach, ‘Beyond “trusted messengers”: New insights on trust & influence in climate communications’, Climate Outreach, Oxford, 2024.
[59] N. McLoughlin, C. Howarth, and G. Shreedhar, ‘Changing behavioral responses to heat risk in a warming world: How can communication approaches be improved?’, Wiley Interdiscip. Rev. Clim. Change, vol. 14, no. 2, 2023, doi: 10.1002/wcc.819.
[60] M. Bapna et al., ‘Decision making in a changing climate: Adaptation challenges and choices’, United Nations Environment Programme, 2020.
[61] L. Fritz, C. M. Baum, S. Low, and B. K. Sovacool, ‘Public engagement for inclusive and sustainable governance of climate interventions’, Nat. Commun., vol. 15, no. 1, p. 4168, May 2024, doi: 10.1038/s41467-024-48510-y.
[62] F. S. Khatibi, A. Dedekorkut-Howes, M. Howes, and E. Torabi, ‘Can public awareness, knowledge and engagement improve climate change adaptation policies?’, Discov. Sustain., vol. 2, no. 1, 2021, doi: 10.1007/s43621-021-00024-z.
[63] C. Ledwell, D. Basu Ray, N. Hameed, and A. Sawas, ‘Public engagement on climate change adaptation: A briefing for developing country National Adaptation Plan teams’, Climate Outreach and the International Institute for Sustainable Development, 2023.
[64] O. Marquet, L. Mojica, M.-B. Fernández-Núñez, and M. Maciejewska, ‘Pathways to 15-minute city adoption: Can our understanding of climate policies’ acceptability explain the backlash towards x-minute city programs?’, Cities, vol. 148, 2024, doi: 10.1016/j.cities.2024.104878.
[65] M. Murunga, C. Macleod, and G. Pecl, ‘Assumptions and contradictions shape public engagement on climate change’, Nat. Clim. Change, vol. 14, no. 2, pp. 126–133, Feb. 2024, doi: 10.1038/s41558-023-01904-0.
[66] P. Parmiter and R. Bell, ‘Public perception of CCS: A review of public engagement for CCS projects’, EU CCUS Projects Network, 2020.
[67] T. Sasse, S. Allan, and J. Rutter, ‘Public engagement and net zero’, Institute for Government, Sep. 2021.
[68] I. Soutar et al., ‘Constructing practices of engagement with users and communities: Comparing emergent state-led smart local energy systems’, Energy Policy, vol. 171, 2022, doi: 10.1016/j.enpol.2022.113279.
[69] C. Verfuerth et al., ‘Catalysts of change: People at the heart of climate transformations: Key messages from five years of social science research on climate change’, The Centre for Climate Change and Social Transformations (CAST), London, 2024.
[70] S. Wang, A. Corner, and J. Nicholls, ‘Britain Talks Climate: A toolkit for engaging the British public on climate change’, Climate Outreach, Oxford, 2020.
[71] J. L. Thürmer, J. Stadler, and S. M. McCrea, ‘Intergroup sensitivity and promoting sustainable consumption: Meat eaters reject vegans’ call for a plant-based diet’, Sustain. Switz., vol. 14, no. 3, 2022, doi: 10.3390/su14031741.
[72] V. Creative, ‘The air we breathe: How imagery of air pollution can communicate the health impacts of climate change’, Climate Outreach. Accessed: Sep. 19, 2024. [Online]. Available: https://climateoutreach.org/reports/the-air-we-breathe/
[73] H. Komatsu, H. Kubota, K. Asano, and Y. Nagai, ‘Effect of information provision by familial nudging on attitudes toward offshore wind power’, PLoS ONE, vol. 19, no. 1 January, 2024, doi: 10.1371/journal.pone.0297199.
[74] L. Li, X. Yuan, and J. Li, ‘Understanding visual feedback mechanism from three-dimensional of information, time and display: A meta-analysis of feedback research for household electricity conservation’, Energy Build., vol. 316, 2024, doi: 10.1016/j.enbuild.2024.114297.
[75] E. Margariti, V. Vlachokyriakos, A. C. Durrant, and D. Kirk, ‘Evaluating ActuAir: Building occupants’ experiences of a shape-changing air quality display’, presented at the Conference on Human Factors in Computing Systems – Proceedings, 2024. doi: 10.1145/3613904.3642396.
[76] T. Metze, ‘Visualization in environmental policy and planning: A systematic review and research agenda’, J. Environ. Policy Plan., vol. 22, no. 5, pp. 745–760, Sep. 2020, doi: 10.1080/1523908X.2020.1798751.
[77] A. Restrepo-Mieth, J. Perry, J. Garnick, and M. Weisberg, ‘Community-based participatory climate action’, Glob. Sustain., vol. 6, 2023, doi: 10.1017/sus.2023.12.
[78] A. Mah, C. Aragón, and E. Markowitz, ‘Visualizing hope: Investigating the effect of public art on risk perception and awareness of climate adaptation’, Weather Clim. Soc., vol. 16, no. 1, pp. 185–204, 2024, doi: 10.1175/WCAS-D-23-0081.1.
[79] T. Ye and A. S. Mattila, ‘The impact of environmental messages on consumer responses to plant-based meat: Does language style matter?’, Int. J. Hosp. Manag., vol. 107, 2022, doi: 10.1016/j.ijhm.2022.103298.
[80] B. León, S. Negredo, and M. C. Erviti, ‘Social engagement with climate change: Principles for effective visual representation on social media’, Clim. Policy, vol. 22, no. 8, pp. 976–992, 2022, doi: 10.1080/14693062.2022.2077292.
[81] M. Kaltenbacher and S. Drews, ‘An inconvenient joke? A review of humor in climate change communication’, Environ. Commun., vol. 14, no. 6, pp. 717–729, Aug. 2020, doi: 10.1080/17524032.2020.1756888.
[82] B. Zhang and J. Pinto, ‘Changing the world one meme at a time: The effects of climate change memes on civic engagement intentions’, Environ. Commun., vol. 15, no. 6, pp. 749–764, Aug. 2021, doi: 10.1080/17524032.2021.1894197.
[83] A. Varni, C. L. Thai, and S. Jamaleddine, ‘Using an Instagram campaign to influence knowledge, subjective norms, perceived behavioral control, and behavioral intentions for sustainable behaviors’, Front. Psychol., vol. 15, 2024, doi: 10.3389/fpsyg.2024.1377211.
[84] I. Willig, M. Blach-Ørsten, and R. Burkal, ‘What is “good” climate journalism? Public perceptions of climate journalism in Denmark’, Journal. Pract., vol. 16, no. 2–3, pp. 520–539, Mar. 2022, doi: 10.1080/17512786.2021.2016069.
[85] Neighbours United and MECCE, ‘Changing the climate and energy conversation’, Neighbours United and MECCE, 2023.
[86] S. I. N. W. Abdullah, F. K. Tat, T. Subramaniam, and A. A. M. Mustafa, ‘Going green: The impact of green initiative events on environmental practice intentions’, J. Sustain. Sci. Manag., vol. 18, no. 8, pp. 1–23, 2023, doi: 10.46754/jssm.2023.08.001.
[87] A.-L. Balogun et al., ‘Assessing the potentials of digitalization as a tool for climate change adaptation and sustainable development in urban centres’, Sustain. Cities Soc., vol. 53, p. 101888, Feb. 2020, doi: 10.1016/j.scs.2019.101888.
[88] R. Briandana and M. S. M. Saleh, ‘Implementing environmental communication strategy towards climate change through social media in Indonesia’, Online J. Commun. Media Technol., vol. 12, no. 4, 2022, doi: 10.30935/ojcmt/12467.
[89] C40 Cities, ‘Youth engagement playbook for cities: How to tackle the climate crisis through collaboration with youth’, C40 Cities, 2021.
[90] M. Colavito, B. Satink Wolfson, A. E. Thode, C. Haffey, and C. Kimball, ‘Integrating art and science to communicate the social and ecological complexities of wildfire and climate change in Arizona, USA’, Fire Ecol., vol. 16, no. 1, 2020, doi: 10.1186/s42408-020-00078-w.
[91] D. Giacomini, L. Rocca, P. Zola, and M. Mazzoleni, ‘Local Governments’ environmental disclosure via social networks: Organizational legitimacy and stakeholders’ interactions’, J. Clean. Prod., vol. 317, 2021, doi: 10.1016/j.jclepro.2021.128290.
[92] J. Kong, W. He, Y. Zheng, and X. Li, ‘Awareness of spontaneous urban vegetation: Significance of social media-based public psychogeography in promoting community climate-resilient construction: A technical note’, Atmosphere, vol. 14, no. 11, 2023, doi: 10.3390/atmos14111691.
[93] Y. Meng, D. Chung, and A. Zhang, ‘The effect of social media environmental information exposure on the intention to participate in pro-environmental behavior’, PLoS ONE, vol. 18, no. 11 November, 2023, doi: 10.1371/journal.pone.0294577.
[94] Q. Tong, Q. Zhang, and J. Zhang, ‘More is not always better: The role of Social Media Information in shaping individual low-carbon behavioral intention’, Int. J. Sustain. Dev. World Ecol., vol. 31, no. 6, pp. 639–652, 2024, doi: 10.1080/13504509.2024.2315553.
[95] N. S. Corser, ‘Don’t Look Up is a wonderful talking point, but will it unify people into acting on climate change?’, Climate Outreach. Accessed: Oct. 17, 2024. [Online]. Available: https://climateoutreach.org/dont-look-up/
[96] S. Sood, A. H. Riley, and L. Birkenstock, ‘Entertainment-education and climate change: Program examples, evidence, and best practices from around the World’, in Storytelling to accelerate climate solutions, Cham: Springer International Publishing, 2024, pp. 17–46.
[97] G. J. Walker, ‘Here be science show dragons: Ice, icons and metaphoric approaches to climate change communication’, in Communicating Ice through Popular Art and Aesthetics, A. Hemkendreis and A.-S. Jürgens, Eds., Cham: Springer International Publishing, 2024, pp. 63–83. doi: 10.1007/978-3-031-39787-5_4.
[98] B. Suldovsky and D. Taylor-Rodríguez, ‘Epistemic engagement: Examining personal epistemology and engagement preferences with climate change in Oregon’, Clim. Change, vol. 166, no. 3, p. 48, Jun. 2021, doi: 10.1007/s10584-021-03138-5.
[99] A. Leiserowitz, C. Roser-Renouf, J. Marlon, and E. Maibach, ‘Global warming’s Six Americas: A review and recommendations for climate change communication’, Curr. Opin. Behav. Sci., vol. 42, pp. 97–103, Dec. 2021, doi: 10.1016/j.cobeha.2021.04.007.
[100] D. C. Null, K. F. Hurst, and L. A. Duram, ‘Beyond the classroom: Influence of a sustainability intervention on university students’ environmental knowledge and behaviors’, J. Environ. Stud. Sci., vol. 14, no. 2, pp. 224–235, 2024, doi: 10.1007/s13412-023-00882-1.
[101] C. D. Trott, ‘Children’s constructive climate change engagement: Empowering awareness, agency, and action’, Environ. Educ. Res., vol. 26, no. 4, pp. 532–554, Apr. 2020, doi: 10.1080/13504622.2019.1675594.
[102] E. Duda, ‘Case study-based research on understanding app user engagement to develop environmental literacy of urban residents’, presented at the 31st International Conference on Computers in Education, ICCE 2023 – Proceedings, 2023, pp. 624–626. [Online]. Available: https://www.scopus.com/inward/record.uri?eid=2-s2.0-85181539543&partnerID=40&md5=a8fa4da1e105fe13044c70c66a6402bd
[103] Y. Li et al., ‘Effectiveness evaluation of a primary school-based intervention against heatwaves in China’, Int. J. Environ. Res. Public. Health, vol. 19, no. 5, 2022, doi: 10.3390/ijerph19052532.
[104] A. Deep, A. Pathak, and N. Chatterjee, ‘An evaluation of the online course on climate change and emotion’, presented at the 30th International Conference on Computers in Education Conference, ICCE 2022 – Proceedings, 2022, pp. 387–391. [Online]. Available: https://www.scopus.com/inward/record.uri?eid=2-s2.0-85151062737&partnerID=40&md5=2399a602326be562efaea6b59992b88d
[105] M. Stevens et al., ‘Drawing a line from CO2 emissions to health—evaluation of medical students’ knowledge and attitudes towards climate change and health following a novel serious game: A mixed-methods study’, BMC Med. Educ., vol. 24, no. 1, 2024, doi: 10.1186/s12909-024-05619-4.
[106] V. Deisenrieder, S. Kubisch, L. Keller, and J. Stötter, ‘Bridging the action gap by democratizing climate change education – The case of k.i.d.Z.21 in the context of fridays for future’, Sustain. Switz., vol. 12, no. 5, 2020, doi: 10.3390/su12051748.
[107] C. Slimings, E. Sisson, C. Larson, D. Bowles, and R. Hussain, ‘Adaptive doctors in Australia: Preparing tomorrow’s doctors for practice in a world destabilised by declining planetary health’, Environ. Educ. Res., vol. 28, no. 5, pp. 786–801, 2022, doi: 10.1080/13504622.2021.2025343.
[108] F. Stevenson and A. Kwok, ‘Mainstreaming zero carbon: Lessons for built-environment education and training’, Build. Cities, vol. 1, no. 1, pp. 687–696, 2020, doi: 10.5334/bc.84.
[109] B. Tremblay and J. Hawkins, ‘Climate and health: Impact of climate education on nursing student knowledge, confidence, and intent to act’, Nurse Educ., vol. 49, no. 2, pp. 85–90, 2024, doi: 10.1097/NNE.0000000000001524.
[110] L. Jans, N. Koudenburg, and L. Grosse, ‘Cooking a pro-veg*n social identity: The influence of vegan cooking workshops on children’s pro-veg*n social identities, attitudes, and dietary intentions’, Environ. Educ. Res., vol. 29, no. 9, pp. 1361–1376, 2023, doi: 10.1080/13504622.2023.2182750.
[111] N. Rosenau, U. Neumann, S. Hamblett, and T. Ellrott, ‘University students as change agents for health and sustainability: A pilot study on the effects of a teaching kitchen-based planetary health diet curriculum’, Nutrients, vol. 16, no. 4, 2024, doi: 10.3390/nu16040521.
[112] Z. Ahmed et al., ‘Fostering innovation and sustainable thinking in surgery: An evaluation of a surgical hackathon’, Ann. R. Coll. Surg. Engl., vol. 106, no. 6, pp. 504–508, 2024, doi: 10.1308/rcsann.2024.0010.
[113] A. Kuthe, A. Körfgen, J. Stötter, and L. Keller, ‘Strengthening their climate change literacy: A case study addressing the weaknesses in young people’s climate change awareness’, Appl. Environ. Educ. Commun., vol. 19, no. 4, pp. 375–388, Oct. 2020, doi: 10.1080/1533015X.2019.1597661.
[114] V. Dawson and K. Carson, ‘Introducing argumentation about climate change socioscientific issues in a disadvantaged school’, Res. Sci. Educ., vol. 50, no. 3, pp. 863–883, 2020, doi: 10.1007/s11165-018-9715-x.
[115] L. M. Zummo and S. J. Dozier, ‘Using epistemic instructional activities to support secondary science teachers’ social construction of knowledge of anthropogenic climate change during a professional learning experience’, J. Geosci. Educ., vol. 70, no. 4, pp. 530–545, 2022, doi: 10.1080/10899995.2021.1986785.
[116] J. M. P. Sanchez, M. T. Picardal, S. R. Fernandez, and R. R. A. Caturza, ‘Socio-scientific issues in focus: A meta-analytical review of strategies and outcomes in climate change science education’, Sci. Educ. Int., vol. 35, no. 2, pp. 119–132, 2024, doi: 10.33828/sei.v35.i2.6.
[117] D. Campbell and S. Lester, ‘Building resilience in Jamaica’s farming communities: Insights from a climate-smart intervention’, Case Stud. Environ., vol. 7, no. 1, pp. 273–286, 2023, doi: 10.1525/cse.2023.1233811.
[118] C. Gichuki, M. Osewe, and S. W. Ndiritu, ‘Dissemination of climate smart agricultural knowledge through farmer field schools (FFS): Analyzing the application CAS knowledge by smallholder farmers’, Int. J. Dev. Issues, vol. 22, no. 3, pp. 399–417, 2023, doi: 10.1108/IJDI-04-2023-0109.
[119] L. Silici, A. Rowe, N. Suppiramaniam, and J. W. Knox, ‘Building adaptive capacity of smallholder agriculture to climate change: Evidence synthesis on learning outcomes’, Environ. Res. Commun., vol. 3, no. 12, 2021, doi: 10.1088/2515-7620/AC44DF.
[120] H. van den Berg et al., ‘Monitoring, evaluation and learning (MEL) in farmer field schools on food security and adaptation to climate change: pilot testing of a framework in Malawi’, Food Secur., vol. 15, no. 6, pp. 1611–1627, 2023, doi: 10.1007/s12571-023-01386-0.
[121] B. Irawan, ‘Mangrove planting initiative within a collaborative project-based biology course to improve students’ climate literacy’, presented at the IOP Conference Series: Earth and Environmental Science, 2023. doi: 10.1088/1755-1315/1148/1/012044.
[122] B. Kligler, G. Pinto Zipp, C. Rocchetti, M. Secic, and E. S. Ihde, ‘The impact of integrating environmental health into medical school curricula: A survey-based study’, BMC Med. Educ., vol. 21, no. 1, 2021, doi: 10.1186/s12909-020-02458-x.
[123] J. Keller et al., ‘Evaluating the Public Climate School, a multi-component school-based program to promote climate awareness and action in students: A cluster-controlled pilot study’, J. Clim. Change Health, vol. 15, 2024, doi: 10.1016/j.joclim.2023.100286.
[124] University of Education, Winneba and MECCE, ‘Dry season gardening as climate action by rural women: A case study of Kuliyaa Community in Northern Ghana’, University of Education, Winneba and MECCE, 2023.
[125] K. J. Wilby, E. K. Black, A. Benetoli, and B. Paravattil, ‘Students’ conception of local responses to global problems for a more peaceful and sustainable world: A collaborative education project between Brazil, Canada, Qatar, and New Zealand’, JACCP J. Am. Coll. Clin. Pharm., vol. 5, no. 6, pp. 605–612, 2022, doi: 10.1002/jac5.1608.
[126] A. Kluczkovski et al., ‘Aquaponics in schools: Hands-on learning about healthy eating and a healthy planet’, Nutr. Bull., vol. 49, no. 3, pp. 327–344, 2024, doi: 10.1111/nbu.12689.
[127] P. M. Kurup, R. Levinson, and X. Li, ‘Informed-decision regarding global warming and climate change among high school students in the United Kingdom’, Can. J. Sci. Math. Technol. Educ., vol. 21, no. 1, pp. 166–185, 2021, doi: 10.1007/s42330-020-00123-5.
[128] B. Borde, P. Lena, and L. Lescarmontier, ‘Education as a strategy for climate change mitigation and adaptation’, in Handbook of Climate Change Mitigation and Adaptation, Cham: Springer International Publishing, 2022, pp. 3089–3113.
[129] Centre for Environment Education (CCE) and MECCE, ‘Blue flag beaches as place-based climate and sustainability education sites in India’, Centre for Environment Education (CCE) and MECCE, 2023.
[130] D. Nusche, M. F. Rabella, and S. Lauterbach, ‘Rethinking education in the context of climate change: Leverage points for transformative change’, OECD, OECD Education Working Papers 307, Feb. 2024. doi: 10.1787/f14c8a81-en.
[131] L. Rodrigues et al., ‘User engagement in community energy schemes: A case study at the Trent Basin in Nottingham, UK’, Sustain. Cities Soc., vol. 61, 2020, doi: 10.1016/j.scs.2020.102187.
[132] A. Navarrete-Welton et al., ‘A grassroots approach for greener education: An example of a medical student-driven planetary health curriculum’, Front. Public Health, vol. 10, 2022, doi: 10.3389/fpubh.2022.1013880.
[133] D. L. Coppock et al., ‘Non-formal education promotes innovation and climate change preparedness among isolated Nepalese farmers’, Clim. Dev., vol. 14, no. 4, pp. 297–310, 2022, doi: 10.1080/17565529.2021.1921685.
[134] U. Sharma, B. Brahmbhatt, and H. N. Panchal, ‘Do community-based institutions spur climate adaptation in urban informal settlements in India?’, in Climate Change and Community Resilience: Insights from South Asia, 2021, pp. 339–356. [Online]. Available: https://www.scopus.com/inward/record.uri?eid=2-s2.0-85167533916&doi=10.1007%2f978-981-16-0680-9_22&partnerID=40&md5=e156db7fb77e52ded0b0b46b981ed21a
[135] C. Torres and J. Dixon, ‘Pathways to climate health: Active learning and effective communication to optimize climate change action an evaluation of the climate change and renal health awareness and education toolkit for healthcare providers: Reducing climate-health risks in primary care’, J. Clim. Change Health, vol. 9, 2023, doi: 10.1016/j.joclim.2022.100198.
[136] K. Hampshire, N. Islam, B. Kissel, H. Chase, and K. Gundling, ‘The Planetary Health Report Card: A student-led initiative to inspire planetary health in medical schools’, Lancet Planet. Health, vol. 6, no. 5, pp. e449–e454, 2022, doi: 10.1016/S2542-5196(22)00045-6.
[137] L. Müller, M. Kühl, and S. J. Kühl, ‘Climate change and health: Changes in student environmental knowledge and awareness due to the implementation of a mandatory elective at the Medical Faculty of Ulm?’, GMS J. Med. Educ., vol. 40, no. 3, 2023, doi: 10.3205/zma001614.
[138] A. Okada and P. Gray, ‘A climate change and sustainability education movement: Networks, open schooling, and the “CARE-KNOW-DO” Framework’, Sustain. Switz., vol. 15, no. 3, 2023, doi: 10.3390/su15032356.
[139] V. A. Whitener, B. Cook, I. Spielbauer, P. K. Nguyen, and J. A. Jay, ‘Impact of a college course on the sustainability of student diets in terms of the planetary boundaries for climate change and land, water, nitrogen and phosphorus use’, Front. Sustain. Food Syst., vol. 5, 2021, doi: 10.3389/fsufs.2021.677002.
[140] O. A. Blanchard, L. M. Greenwald, and P. E. Sheffield, ‘The climate change conversation: Understanding nationwide medical education efforts’, Yale J. Biol. Med., vol. 96, no. 2, pp. 171–184, 2023, doi: 10.59249/PYIW9718.
[141] D. Greene, O. Yuheng Zhu, and S. Dolnicar, ‘Vegan burger, no thanks! Juicy American burger, yes please! The effect of restaurant meal names on affective appeal’, Food Qual. Prefer., vol. 113, 2024, doi: 10.1016/j.foodqual.2023.105042.
[142] A. Boeri, D. Longo, S. Orlandi, R. Roversi, and G. Turci, ‘Temporary transformations to access and experience sustainable city public spaces’, WIT Trans. Ecol. Environ., vol. 249, pp. 43–55, 2020, doi: 10.2495/SC200051.
[143] L. Fogg-Rogers, A. M. Sardo, E. Csobod, C. Boushel, S. Laggan, and E. Hayes, ‘Citizen-led emissions reduction: Enhancing enjoyment and understanding for diverse citizen engagement with air pollution and climate change decision making’, Environ. Sci. Policy, vol. 154, 2024, doi: 10.1016/j.envsci.2024.103692.
[144] J. Knook, V. Eory, M. Brander, and D. Moran, ‘The evaluation of a participatory extension programme focused on climate friendly farming’, J. Rural Stud., vol. 76, pp. 40–48, 2020, doi: 10.1016/j.jrurstud.2020.03.010.
[145] M. Ambani, G. A. Gbetibouo, and F. Percy, ‘Multi-Stakeholder Dialogue to co-Design Anticipatory Adaptation: Lessons from Participatory Scenario Planning in Africa’, in Handbook of Climate Change Management: Research, Leadership, Transformation, vol. 6, 2021, pp. 4819–4843. [Online]. Available: https://www.scopus.com/inward/record.uri?eid=2-s2.0-85161926175&doi=10.1007%2f978-3-030-57281-5_111&partnerID=40&md5=f7b18e4f35873e8cf9d97bc5953b3db1
[146] L. Donkers, ‘Revitalising embodied community knowledges as leverage for climate change engagement’, Clim. Change, vol. 171, no. 1, p. 2, 2022, doi: 10.1007/s10584-022-03327-w.
[147] R. Murti, S.-L. Mathez-Stiefel, and S. Rist, ‘A Methodological Orientation for Social Learning Based Adaptation Planning: Lessons from Pilot Interventions in Rural Communities of Burkina Faso, Chile and Senegal’, Syst. Pract. Action Res., vol. 33, no. 4, pp. 409–434, 2020, doi: 10.1007/s11213-019-09495-8.
[148] D. Fraisl et al., ‘Citizen science in environmental and ecological sciences’, Nat. Rev. Methods Primer, vol. 2, no. 1, pp. 1–20, Aug. 2022, doi: 10.1038/s43586-022-00144-4.
[149] K. Peach, A. Berditchevskaia, G. Mulgan, G. Lucarelli, and M. Ebelshaeuser, ‘Collective intelligence for sustainable development: Getting smarter together’, Nesta’s Centre for Collective Intelligence Design, 2021.
[150] Involve and KNOCA, ‘Innovations in subnational climate mini publics in the UK’, Involve and KNOCA, 2023.
[151] H. Solman, M. Smits, B. van Vliet, and S. Bush, ‘Co-production in the wind energy sector: A systematic literature review of public engagement beyond invited stakeholder participation’, Energy Res. Soc. Sci., vol. 72, p. 101876, Feb. 2021, doi: 10.1016/j.erss.2020.101876.
[152] G. Mullally et al., ‘A Roadmap for Local Deliberative Engagements on Transitions to Net Zero Carbon and Climate Resilience’, Environmental Protection Agency, 2022.
[153] OECD, Innovative Citizen Participation and New Democratic Institutions: Catching the Deliberative Wave. Paris: OECD Publishing, 2020. [Online]. Available: https://www.oecd-ilibrary.org/governance/innovative-citizen-participation-and-new-democratic-institutions_339306da-en
[154] R. Shunglu et al., ‘Barriers in Participative Water Governance: A Critical Analysis of Community Development Approaches’, Water Switz., vol. 14, no. 5, 2022, doi: 10.3390/w14050762.
[155] Nesta, ‘Engaging local residents in conversations about pathways to net zero’, nesta. Accessed: Sep. 19, 2024. [Online]. Available: https://www.nesta.org.uk/project-updates/engaging-local-residents-in-conversations-about-pathways-to-net-zero/
[156] L. Liu, T. Bouman, G. Perlaviciute, and L. Steg, ‘The more public influence, the better? The effects of full versus shared influence on public acceptability of energy projects in the Netherlands and China’, Energy Res. Soc. Sci., vol. 81, p. 102286, 2021, doi: 10.1016/j.erss.2021.102286.
[157] A. Boeri, D. Longo, S. Orlandi, R. Roversi, and G. Turci, ‘COMMUNITY ENGAGEMENT AND GREENING STRATEGIES AS ENABLING PRACTICES FOR INCLUSIVE AND RESILIENT CITIES’, Int. J. Environ. Impacts, vol. 5, no. 1, pp. 1–14, 2022, doi: 10.2495/EI-V5-N1-1-14.
[158] T. Dawson, J. Hambly, A. Kelley, W. Lees, and S. Miller, ‘Coastal heritage, global climate change, public engagement, and citizen science’, Proc. Natl. Acad. Sci., vol. 117, no. 15, pp. 8280–8286, 2020.
[159] C. Makate, ‘Local institutions and indigenous knowledge in adoption and scaling of climate-smart agricultural innovations among sub-Saharan smallholder farmers’, Int. J. Clim. Change Strateg. Manag., vol. 12, no. 2, pp. 270–287, 2020, doi: 10.1108/IJCCSM-07-2018-0055.
[160] L. P. Hopkins, D. J. January-Bevers, E. K. Caton, and L. A. Campos, ‘A simple tree planting framework to improve climate, air pollution, health, and urban heat in vulnerable locations using non-traditional partners’, Plants People Planet, vol. 4, no. 3, pp. 243–257, 2022, doi: 10.1002/ppp3.10245.
[161] J. Langfermann, ‘How Citizen Entrepreneurship Works’, J. Entrep. Innov. Emerg. Econ., 2024, doi: 10.1177/23939575241263677.
[162] C. Verfuerth, G. Jones, and L. Roberts, ‘Workshops to discuss the future of tree planting with Welsh farmers’, Welsh Government, 2023.
[163] A. B. Raschke, J. Davis, and A. Quiroz, ‘The Central Arizona Conservation Alliance Programs: Use of Social Media and App-Supported Community Science for Landscape-Scale Habitat Restoration, Governance Support, and Community Resilience-Building’, Land, vol. 11, no. 1, 2022, doi: 10.3390/land11010137.
[164] Global Assembly Team, ‘Report of the 2021 Global Assembly on the Climate and Ecological Crisis: Giving everyone a seat at the global governance table’, Global Assembly, 2022.
[165] S. H. Hamilton et al., ‘Affecting behavioural change through empowerment: conceptual insights from theory and agricultural case studies in South Asia’, Reg. Environ. Change, vol. 22, no. 3, 2022, doi: 10.1007/s10113-022-01939-7.
[166] R. Shammin, R. Firoz, and R. Hasan, ‘Frameworks, stories and learnings from disaster management in Bangladesh’, in Climate Change and Community Resilience: Insights from South Asia, 2021, pp. 239–256. [Online]. Available: https://www.scopus.com/inward/record.uri?eid=2-s2.0-85167529664&doi=10.1007%2f978-981-16-0680-9_16&partnerID=40&md5=ac9f2ec22fa5fcf1c579960f9e3ad4ca
[167] S. Elstub, J. Carrick, D. M. Farrell, and P. Mockler, ‘The scope of climate assemblies: Lessons from the climate assembly uk’, Sustain. Switz., vol. 13, no. 20, 2021, doi: 10.3390/su132011272.
[168] E. Teko and O. Lah, ‘Capacity Needs Assessment in Transport Innovation Living Labs: The Case of an Innovative E-Mobility Project’, Front. Future Transp., vol. 3, 2022, doi: 10.3389/ffutr.2022.799505.
[169] C. Cherry, S. Capstick, C. Demski, C. Mellier, L. Stone, and C. Verfuerth, ‘Citizens’ climate assemblies: Understanding public deliberation for climate policy’, The Centre for Climate Change and Social Transformations (CAST), Cardiff, 2021.
[170] R. Sandover, A. Moseley, and P. Devine-Wright, ‘Contrasting views of Citizens’ Assemblies: Stakeholder perceptions of public deliberation on climate change’, Polit. Gov., vol. 9, no. 2, pp. 76–86, 2021.
[171] P. Hofman, F. Wade, J. Webb, and M. Groenleer, ‘Retrofitting at scale: comparing transition experiments in Scotland and the Netherlands’, Build. Cities, vol. 2, no. 1, pp. 637–654, 2021, doi: 10.5334/bc.98.
[172] A. Berditchevskaia, A. Albert, K. Peach, G. Lucarelli, and A. Cottica, ‘Untapped: Collective Intelligence for Climate Action’, United Nations Development Programme, New York, 2024.
[173] N. Abbas and G. Smith, ‘Towards Permanent Climate Citizens’ Assemblies: Learning from the Early Adopters. KNOCA Briefing No. 10’, Knowledge Network on Climate Assemblies, 2024.
[174] M. Araos, ‘Democracy underwater: Public participation, technical expertise, and climate infrastructure planning in New York City’, Theor Soc, vol. 52, no. 1, pp. 1–34, 2023, doi: 10.1007/s11186-021-09459-9.
[175] J. Jeffers, ‘Barriers to transformation towards participatory adaptation decision-making: Lessons from the Cork flood defences dispute’, Land Use Policy, vol. 90, 2020, doi: 10.1016/j.landusepol.2019.104333.
[176] E. ter Mors and E. van Leeuwen, ‘It matters to be heard: Increasing the citizen acceptance of low-carbon technologies in the Netherlands and United Kingdom’, Energy Res. Soc. Sci., vol. 100, p. 103103, 2023, doi: 10.1016/j.erss.2023.103103.
[177] J. Ainscough and R. Willis, ‘Embedding deliberation: guiding the use of deliberative mini-publics in climate policy-making’, Clim. Policy, vol. 24, no. 6, pp. 828–842, 2024, doi: 10.1080/14693062.2024.2303337.
[178] J. Boswell, R. Dean, and G. Smith, ‘Can citizen deliberation address the climate crisis? Not if it is disconnected from politics and policymaking’, EUROPP. [Online]. Available: https://blogs.lse.ac.uk/europpblog/2022/12/07/can-citizen-deliberation-address-the-climate-crisis-not-if-it-is-disconnected-from-politics-and-policymaking/
[179] G. Smith, We Need To Talk About Climate: How Citizens’ Assemblies Can Help Us Solve The Climate Crisis. London: University of Westminster Press, 2024. [Online]. Available: https://www.uwestminsterpress.co.uk/site/books/10.16997/book73/read/?loc=002.xhtml
[180] The Scottish Parliament, ‘Scottish Parliament People’s Panel reviewing the Climate Change (Scotland) Act 2009’, The Scottish Parliament, 2024.
[181] P. Kashwan and H. Lee, ‘Beyond stakeholder consultations: Red-green coalition democratizes Maine’s offshore wind energy policymaking’, Energy Res. Soc. Sci., vol. 116, 2024, doi: 10.1016/j.erss.2024.103692.
[182] K. Peach, ‘Creating a Citizen Participation Service and other ideas: Reimagining government for better climate policy’, Nesta’s Centre for Collective Intelligence Design, 2023.
[183] K. A. McNamara, M. Kostelny, G. Kim, D. M. Keating, J. Estiandan, and J. Armbruster, ‘A novel resident outreach program improves street tree planting outcomes in Los Angeles’, Environ. Chall., vol. 9, 2022, doi: 10.1016/j.envc.2022.100596.
[184] G. Lucertini, G. Di Giustino, C. F. dall’Omo, and F. Musco, ‘An innovative climate adaptation planning process: iDEAL project’, J. Environ. Manage., vol. 317, 2022, doi: 10.1016/j.jenvman.2022.115408.
[185] D. Silveira, ‘The role of deliberative public engagement in climate policy development: A report for the Climate Change Committee’, Climate Citizens and Lancaster Unversity, 2022.
[186] J. Bentz, ‘Learning about climate change in, with and through art’, Clim. Change, vol. 162, no. 3, pp. 1595–1612, Oct. 2020, doi: 10.1007/s10584-020-02804-4.
[187] K. Smith, B. McDonagh, and E. Brookes, ‘Place-based arts engagement and learning histories: An effective tool for climate action’, Environ. Commun., 2024, doi: 10.1080/17524032.2024.2382473.
[188] K. Lee, ‘Urban public space as a didactic platform: Raising awareness of climate change through experiencing arts’, Sustain. Switz., vol. 13, no. 5, pp. 1–17, 2021, doi: 10.3390/su13052915.
[189] F. Ueberschär, ‘AI for experience: Designing with Generative Adversarial Networks to evoke climate fascination’, Master thesis, Delft University of Technology, The Netherlands, 2021.
[190] A. Kluczkovski et al., ‘Interacting with members of the public to discuss the impact of food choices on climate change-experiences from two UK public engagement events’, Sustain. Switz., vol. 12, no. 6, pp. 1–21, 2020, doi: 10.3390/su12062323.
[191] S. Syropoulos et al., ‘Changing community climate change attitudes: Evidence from a community exhibit intervention’, J. Environ. Psychol., vol. 98, 2024, doi: 10.1016/j.jenvp.2024.102369.
[192] B. Hedin, L. Grönborg, and G. Johansson, ‘Food carbon literacy: A definition and framework exemplified by designing and evaluating a digital grocery list for increasing food carbon literacy and changing behavior’, Sustain. Switz., vol. 14, no. 19, 2022, doi: 10.3390/su141912442.
[193] H. Obracht-Prondzyńska, E. Duda, H. Anacka, and J. Kowal, ‘Greencoin as an AI-based solution shaping climate awareness’, Int. J. Environ. Res. Public. Health, vol. 19, no. 18, 2022, doi: 10.3390/ijerph191811183.
[194] B. Obuobi, D. Tang, F. Awuah, E. Nketiah, and G. Adu-Gyamfi, ‘Utilizing Ant Forest technology to foster sustainable behaviors: A novel approach towards environmental conservation’, J. Environ. Manage., vol. 359, 2024, doi: 10.1016/j.jenvman.2024.121038.
[195] A. Workman et al., ‘Evaluating user preferences, comprehension, and trust in apps for environmental health hazards: Qualitative case study’, JMIR Form. Res., vol. 6, no. 12, 2022, doi: 10.2196/38471.
[196] C. Hurrell, A. Chai, H. Green, and G. Bradley, ‘Virtual reality facilitates pro-environmental behavioural intentions’, Environ. Educ. Res., 2024, doi: 10.1080/13504622.2024.2342942.
[197] V. Berger and D. Koch, ‘The climate wins! – How a gamification approach can foster sustainable consumption on university campuses and beyond’, Int. J. Sustain. High. Educ., 2024, doi: 10.1108/IJSHE-08-2022-0269.
[198] I. Thacker, ‘Supporting secondary students’ climate change learning and motivation using novel data and data visualizations’, Contemp. Educ. Psychol., vol. 78, 2024, doi: 10.1016/j.cedpsych.2024.102285.
[199] Ș. Boncu, O.-S. Candel, and N. L. Popa, ‘Gameful green: A systematic review on the use of serious computer games and gamified mobile apps to foster pro-environmental information, attitudes and behaviors’, Sustain. Switz., vol. 14, no. 16, 2022, doi: 10.3390/su141610400.
[200] D. Carrillo-Nieves, E. Clarke-Crespo, P. Cervantes-Avilés, M. Cuevas-Cancino, and A. Y. Vanoye-García, ‘Designing learning experiences on climate change for undergraduate students of different majors’, Front. Educ., vol. 9, 2024, doi: 10.3389/feduc.2024.1284593.
[201] I. De Sena, C. Cocco, V. Brůža, P. Lenicolais, S. Crowley, and F. Pilla, ‘EbAcraft: Engaging local communities in learning about ecosystem-based adaptation for coastal cities in Europe’, presented at the Proceedings 2023 IEEE 19th International Conference on e-Science, e-Science 2023, 2023. doi: 10.1109/e-Science58273.2023.10254941.
[202] D. Fernández Galeote, N.-Z. Legaki, and J. Hamari, ‘From traditional to game-based learning of climate change: A media comparison experiment’, Proc. ACM Hum.-Comput. Interact., vol. 7, pp. 503–525, 2023, doi: 10.1145/3611039.
[203] N. Mohammadpourlima, M. Nygård, and M. P. Heris, ‘Gamification: A catalyst to achieve carbon-neutral cities’, presented at the Lecture Notes in Computer Science (including subseries Lecture Notes in Artificial Intelligence and Lecture Notes in Bioinformatics), 2024, pp. 226–243. doi: 10.1007/978-3-031-65285-1_15.
[204] G. Mylonas, J. Hofstaetter, A. Friedl, and M. Giannakos, ‘Designing effective playful experiences for sustainability awareness in schools and makerspaces’, presented at the ACM International Conference Proceeding Series, 2021. doi: 10.1145/3466725.3466755.
[205] G. Mylonas, J. Hofstaetter, M. Giannakos, A. Friedl, and P. Koulouris, ‘Playful interventions for sustainability awareness in educational environments: A longitudinal, large-scale study in three countries’, Int. J. Child-Comput. Interact., vol. 35, 2023, doi: 10.1016/j.ijcci.2022.100562.
[206] G. Mylonas, F. Paganelli, G. Cuffaro, I. Nesi, and D. Karantzis, ‘Using gamification and IoT-based educational tools towards energy savings – some experiences from two schools in Italy and Greece’, J. Ambient Intell. Humaniz. Comput., vol. 14, no. 12, pp. 15725–15744, 2023, doi: 10.1007/s12652-020-02838-7.
[207] J. Nguyen, A. Mittal, Z. Kapelan, and L. Scholten, ‘SuDSbury: A serious game to support the adoption of sustainable drainage solutions’, Urban Water J., vol. 21, no. 2, pp. 204–218, 2024, doi: 10.1080/1573062X.2023.2284958.
[208] J. N. Rooney-Varga, F. Kapmeier, J. D. Sterman, A. P. Jones, M. Putko, and K. Rath, ‘The Climate Action Simulation’, Simul. Gaming, vol. 51, no. 2, pp. 114–140, 2020, doi: 10.1177/1046878119890643.
[209] F. van Schaik, ‘In-game uncertainties and climate change challenges as identified by pre-service teachers’, Simul. Gaming, vol. 54, no. 6, pp. 680–707, 2023, doi: 10.1177/10468781231199262.
[210] M. Daiiani, P. Sweetser, S. Stanley, S. Caldwell, and D. Van Rooy, ‘Evaluating the impact of gameful design on pro-environmental attitudes: Beyond Blue as intervention’, presented at the ACM International Conference Proceeding Series, 2024. doi: 10.1145/3649921.3649933.
[211] B. Orlove et al., ‘FutureCoast: A playful way to assess public perceptions for better climate change communication’, Environ. Commun., 2024, doi: 10.1080/17524032.2024.2341926.
[212] D. Fernández Galeote et al., ‘The good, the bad, and the divergent in game-based learning: Player experiences of a serious game for climate change engagement’, presented at the ACM International Conference Proceeding Series, 2022, pp. 256–267. doi: 10.1145/3569219.3569414.
[213] D. Fernández Galeote, M. Rajanen, D. Rajanen, N.-Z. Legaki, D. J. Langley, and J. Hamari, ‘Gamification for climate change engagement: A user-centered design agenda’, presented at the ACM International Conference Proceeding Series, 2023, pp. 45–56. doi: 10.1145/3616961.3616968.
[214] Z. Song, Y. Sun, V. Ruijters, and R. Lc, ‘Climate influence: Implicit game-based interactive storytelling for climate action purpose’, in Interactive Storytelling, A. Mitchell and M. Vosmeer, Eds., Cham: Springer International Publishing, 2021, pp. 425–429. doi: 10.1007/978-3-030-92300-6_42.
[215] V. Aksel Stenberdt and G. Makransky, ‘Mastery experiences in immersive virtual reality promote pro-environmental waste-sorting behavior’, Comput. Educ., vol. 198, 2023, doi: 10.1016/j.compedu.2023.104760.
[216] G. Fauville, C. C. M. Queiroz, and J. N. Bailenson, ‘Virtual reality as a promising tool to promote climate change awareness’, in Technology and Health: Promoting attitude and behaviour change, Elsevier, 2020, pp. 91–108. doi: 10.1016/B978-0-12-816958-2.00005-8.
[217] G. B. Petersen, S. Klingenberg, R. E. Mayer, and G. Makransky, ‘The virtual field trip: Investigating how to optimize immersive virtual learning in climate change education’, Br. J. Educ. Technol., vol. 51, no. 6, pp. 2099–2115, 2020, doi: 10.1111/bjet.12991.
[218] A. Plechatá, M. H. Hielkema, L.-M. Merkl, G. Makransky, and M. B. Frøst, ‘Shifting from information- to experience-based climate change communication increases pro-environmental behavior via efficacy beliefs’, Environ. Commun., vol. 18, no. 5, pp. 589–609, 2024, doi: 10.1080/17524032.2024.2334727.
[219] C. Wienrich, S. Vogt, N. Döllinger, and D. Obremski, ‘Promoting eco-friendly behavior through virtual reality – Implementation and evaluation of immersive feedback conditions of a virtual CO2 calculator’, presented at the Conference on Human Factors in Computing Systems – Proceedings, 2024. doi: 10.1145/3613904.3642957.
[220] D. Davidson, ‘“Can we talk?” Forum theatre as rehearsal for climate change interventions’, in Theatre Pedagogy in the Era of Climate Crisis, 2021, pp. 115–129. doi: 10.4324/9781003087823-11.
[221] C. Martínez-Mirambell, S. Boned-Gómez, M. Urrea-Solano, and S. Baena-Morales, ‘Step by step towards a greener future: The role of plogging in educating tomorrow’s citizens’, Sustain. Switz., vol. 15, no. 18, 2023, doi: 10.3390/su151813558.
[222] M. Reamer, G. Maranto, T. Harrison, and A. Clement, ‘Photovoice in the interdisciplinary climate classroom: A case study in climate adaptation pedagogy from a hybrid university course’, Appl. Environ. Educ. Commun., vol. 23, no. 1–2, pp. 1–23, 2024, doi: 10.1080/1533015X.2023.2275252.
[223] R. Orr and D. Powell, ‘Towards a UK public engagement strategy on climate change’, Climate Outreach, Oxford, Sep. 2023.
Sources that informed the evidence review but are not cited in the report
D. Rousell and A. Cutter-Mackenzie-Knowles, ‘A systematic review of climate change education: Giving children and young people a “voice” and a “hand” in redressing climate change’, Children’s Geographies, vol. 18, no. 2, pp. 191–208, Mar. 2020.
E. André, P. E. Colombo, L. Schäfer Elinder, J. Larsson, and M. Hunsberger, ‘Acceptance of low-carbon school meals with and without information — A controlled intervention study’, Journal of Consumer Policy, vol. 47, no. 1, pp. 109–125, 2024.
A. Simic, ‘C-change project in the “Juraj Sizgoric” Sibenik public library: Arts and culture activities for raising awareness on climate change’, Vjesnik Bibliotekara Hrvatske, vol. 64, no. 2, pp. 469–494, 2021.
D. Munshi, P. Kurian, S. Morrison, L. Kathlene, and R. Cretney, ‘Centring culture in public engagement on climate change adaptation: Re-shaping the future of the NZ tourism sector project team’, University of Waikato and the Deep South National Science Challenge, 2020. [Online]. Available: http://rgdoi.net/10.13140/RG.2.2.29922.35527.
G. Smith, ‘Climate assemblies: Emerging trends, challenges and opportunities’, Knowledge Network on Climate Assemblies, Jun. 2024.
M. A. Ranney and L. Velautham, ‘Climate change cognition and education: Given no silver bullet for denial, diverse information-hunks increase global warming acceptance’, Current Opinion in Behavioral Sciences, vol. 42, pp. 139–146, 2021.
L. Muradova, H. Walker, and F. Colli, ‘Climate change communication and public engagement in interpersonal deliberative settings: Evidence from the Irish citizens’ assembly’, Climate Policy, vol. 20, no. 10, pp. 1322–1335, 2020.
A. Berditchevskaia, K. Peach, G. Lucarelli, and M. Ebelshaeuser, ‘Collective intelligence for sustainable development: 13 stories from the UNDP Accelerator Labs’, Nesta’s Centre for Collective Intelligence Design, 2021.
H. Al-Amin, R. Webster, D. Kaoukji, and A. Sawas, ‘Communicating climate justice with young adults in Europe: A messaging guide’, Oxford: Climate Outreach, 2023.
P. Alarcón, J. L. Fernández-Martínez, and J. Font, ‘Comparing environmental advisory councils: How they work and why it matters’, Sustainability, vol. 12, no. 10, p. 4286, Jan. 2020.
Y. Tao, C. Wang, T. C. Zhang, L. Zhai, Y. Gao, and J. Liu, ‘CSR communication in hospitality: Fostering hotel guests’ climate (change) engagement’, Journal of Hospitality and Tourism Management, vol. 60, pp. 264–276, 2024.
T. Dölker et al., ‘Easy-to-implement educational interventions to bring climate-smart actions to daily anesthesiologic practice: A cross-sectional before and after study’, Minerva Anestesiologica, vol. 90, no. 3, pp. 126–134, 2024.
L. Mu, Y. Liu, C. Wang, X. Qu, and Y. Yu, ‘Enhancing capacity building to climate adaptation and water conservation among Chinese young people’, Environmental Science and Pollution Research, vol. 28, no. 22, pp. 27614–27628, 2021.
E. Griffin, S. Duncan, and P. Manners, ‘Enhancing place-based public engagement: Lessons learned’, National Co-ordinating Centre for Public Engagement, 2022.
C. G. Staub and G. Clarkson, ‘Farmer-led participatory extension leads Haitian farmers to anticipate climate-related risks and adjust livelihood strategies’, Journal of Rural Studies, vol. 81, pp. 235–245, 2021.
E. Feldbacher, M. Waberer, L. Campostrini, and G. Weigelhofer, ‘Identifying gaps in climate change education – a case study in Austrian schools’, International Research in Geographical and Environmental Education, vol. 33, no. 2, pp. 109–124, Apr. 2024.
K. Vidou and D. Latinopoulos, ‘Implementation of a Place Game tool in the city of Rotterdam to enhance urban resilience to climate change through placemaking’, Journal of Urbanism, vol. 16, no. 3, pp. 286–309, 2023.
L. Wu, T. Ma, Y. Bian, S. Li, and Z. Yi, ‘Improvement of regional environmental quality: Government environmental governance and public participation’, Science of The Total Environment, vol. 717, p. 137265, May 2020.
J. Boswell, R. Dean, and G. Smith, ‘Integrating citizen deliberation into climate governance: Lessons on robust design from six climate assemblies’, Public Administration, vol. 101, no. 1, pp. 182–200, 2023.
V. Dany and L. Lebel, ‘Integrating concerns with climate change into local development planning in Cambodia’, Review of Policy Research, vol. 37, no. 2, pp. 221–243, 2020.
M. S. Moustafa Saleh and H. E. S. Elsabahy, ‘Integrating sustainability development education program in nursing to challenge practice among nursing interns in health care’, Journal of Nursing Management, vol. 30, no. 8, pp. 4419–4429, 2022.
D. Rajanen, ‘Interactive and participatory media for public engagement with climate change: A systematic literature review and an integrative model’, INTERACT Research Unit, University of Oulu, 2021.
N. M. Wadi, K. Cheikh, Y. W. Keung, and R. Green, ‘Investigating intervention components and their effectiveness in promoting environmentally sustainable diets: A systematic review’, The Lancet Planetary Health, vol. 8, no. 6, pp. e410–e422, 2024.
M. Zandlová, H. Skokanová, and M. Trnka, ‘Landscape change scenarios: Developing participatory tools for enhancing resilience to climate change’, Environmental Management, vol. 72, no. 3, pp. 631–656, 2023.
P. Newell, R. Price, and F. Daley, ‘Landscapes of (in)justice: Reflecting on voices, spaces and alliances for just transitions’, Energy Research and Social Science, vol. 116, 2024. [Online]. Available: https://www.scopus.com/inward/record.uri?eid=2-s2.0-85200539503&doi=10.1016%2fj.erss.2024.103701&partnerID=40&md5=eb6575cf56008e506226793804a80b04
A. J. Jalil, J. Tasoff, and A. V. Bustamante, ‘Low-cost climate-change informational intervention reduces meat consumption among students for 3 years’, Nature Food, vol. 4, no. 3, pp. 218–222, 2023.
J. F. Davies et al., ‘Operation clean up: A model for eco-leadership and sustainability implementation’, Anaesthesia and Intensive Care, vol. 51, no. 2, pp. 88–95, 2023.
L. Liu, G. Perlaviciute, and L. Squintani, ‘Opposing out loud versus supporting in silence: Who wants to participate in decision-making about energy projects?’, Environmental Research Letters, vol. 17, no. 11, p. 114053, 2022.
S. Theminimulle et al., ‘Our journey to net zero: Understanding household and community participation in the UK’s transition to a greener future’, Nuffield Foundation and the Institute for Community Studies, 2024.
S. Sereenonchai and N. Arunrat, ‘Practical agricultural communication: Incorporating scientific and indigenous knowledge for climate mitigation’, Kasetsart Journal of Social Sciences, vol. 41, no. 1, pp. 60–67, 2020.
E. M. Schwienhorst-Stich et al., ‘Pre-post evaluation of the emotions and motivations for transformative action of medical students in Germany after two different planetary health educational interventions’, The Lancet Planetary Health, vol. 8, p. S9, 2024.
K. McBride, ‘Preparing for a climate assembly’, Knowledge Network on Climate Assemblies, 2022.
D. Bidwell and P. J. Schweizer, ‘Public values and goals for public participation’, Environmental Policy and Governance, vol. 31, no. 4, pp. 257–269, 2021.
A. Thaller et al., ‘Pushing low-carbon mobility: A survey experiment on the public acceptance of disruptive policy packages’, Climate Policy, vol. 24, no. 7, pp. 949–962, 2024.
N. Andrews, S. Elstub, S. McVean, and G. Sandie, ‘Scotland’s Climate Assembly Research Report: Process, impact and Assembly member experience’, Scottish Government Research, Edinburgh, 2022.
S. J. Mostacedo-Marasovic, A. A. Olsen, and C. T. Forbes, ‘Supporting secondary students’ understanding of Earth’s climate system and global climate change using EzGCM: A cross-sectional study’, Journal of Science Education and Technology, vol. 33, no. 2, pp. 178–94, 2024.
C. Álvarez-Nieto, L. Parra-Anguita, C. Álvarez-García, E. M. Montoro Ramirez, M. D. López-Franco, S. Sanz-Martos, et al., ‘Sustainability education in nursing degree for climate-smart healthcare: A quasi-experimental study’, International Journal of Sustainability in Higher Education, vol. 25, no. 9, pp. 278–92, 2024.
M. Shoina, I. Voukkali, A. Anagnostopoulos, I. Papamichael, M. Stylianou, and A. A. Zorpas, ‘The 15-minute city concept: The case study within a neighbourhood of Thessaloniki’, Waste Management and Research, vol. 42, no. 8, pp. 694–710, 2024.
J. B. da Silva, D. Silva, M. Barbosa, and M. Rodrigues, ‘The Healthy Waters science-based educational intervention programme: The potential of participatory approaches for developing and promoting students’ environmental citizenship’, Journal of Social Science Education, vol. 23, no. 1, pp. 1–24, 2024.
K. Mitev, L. Player, C. Verfuerth, S. Westlake, and L. Whitmarsh, ‘The implications of behavioural science for effective climate policy: Output 2: Policy recommendations’, Bath, England: The Centre for Climate Change and Social Transformations (CAST), Sep. 2023.
A. Singer, C. Kirby, and E. Rappolee, ‘Using fiction and nonfiction readings in climate change education’, Journal of College Science Teaching, vol. 52, no. 7, pp. 103–10, 2023.
M. Murunga, E. Ogier, C. Macleod, and G. Pecl, ‘What drives public engagement by scientists? An Australian perspective’, Global Environmental Change, vol. 87, p. 102889, Jul. 2024.
Millar, C., Mulholland, C., Zanin, B., Whitmarsh, L., Gibson, R., Meyer J., Demski, C. (2024) A review of effective public engagement on climate and implications for Scotland, ClimateXChange.
While every effort is made to ensure the information in this report is accurate, no legal responsibility is accepted for any errors, omissions or misleading statements. The views expressed represent those of the author(s), and do not necessarily represent those of the host institutions or funders.
This work was supported by the Rural and Environment Science and Analytical Services Division of the Scottish Government (CoE – CXC).
ClimateXChange Edinburgh Climate Change Institute High School Yards Edinburgh EH1 1LZ +44 (0) 131 651 4783
The planning system in Scotland is used to make decisions about future developments and use of land in towns, cities and countryside. Planning authorities are required to prepare evidence reports as part of the local development plan (LDP) process. These provide a summary of the baseline data used and explain the implications of the LDP.
Supported by National Planning Framework 4 (NPF4), planning LDPs should account for and address current and future climate risks, and enable places to adapt accordingly. Accurate, sub-national spatial data, which identifies geographic features such as rivers and utilities, is vital to create effective plans with a sound evidence base to evaluate climate risks. Fully evidencing climate risk requires an understanding of hazards, but also exposure and vulnerability, typically requiring interpretation of multiple datasets at once.
This report explores the geospatial resources that are available to support the evidence gathering stage with a view to improving access to geospatial data on climate risk. It identifies existing data, data gaps, barriers, and resources needed for evidence-based planning and delivery.
Key findings
Through engagement with a selection of Scottish Planning Authorities, we found:
Data for evidence reports
A wide range of data is required to assess climate vulnerabilities and impacts, some of which require substantial climate and data expertise to interpret.
Most required data is free for planning authorities.
Planning authorities tend to rely on datasets familiar to them – such as Flood Maps (SEPA), Dynamic Coast, Scottish Index of Multiple Deprivation (SIMD), and OS MasterMap to assess climate risks like flooding, coastal erosion, and social vulnerability. These datasets are highly usable, with consistent coverage and quality across Scotland, but sometimes require geospatial expertise for analysis.
There are additional datasets and tools which would benefit from further adoption by Planning Authorities, especially the Local Authority Climate Service. Additional datasets related to wildfire risk, air quality and land use may offer value, but would require some transformation, processing and interpretation to the climate context.
Significant data gaps exist for urban heat islands, storm damage, health, water, infrastructure and landslides. Proxies (e.g. combining urban form, green space, and housing quality data) are suggested for urban heat island assessments. However, these must be approached in a considered way, which balances the potential effort to develop the interpretation against the likely risk.
Planning authorities’ approach
There is a knowledge gap on how climate risk impacts planning. Some planning authorities have limited prior experience on climate risk, fewer technical data skills within their teams and no dedicated climate change professional. This leads to planning authorities mainly focusing on flood risk, where they have more familiarity.
Planning authority use of spatial data is limited, despite support for it in the Local Development Planning Guidance. This underuse may result from limited awareness of the guidance and expectations of evidence reports, and a lack of capacity and skills to interpret geospatial data.
Planners expressed a wish for a simplified approach to incorporate climate adaptation considerations into their plans.
Planning authorities find it challenging and time-consuming to gather data from multiple providers.
There is value in carrying out Climate Risk and Vulnerability Assessments (CRVAs) to better direct the use of data but there is no consistent approach or simple tool available for planning authorities to use.
Collaboration across planning authorities allows knowledge and resources sharing, which leads to more consistent and effective outcomes.
Given the wide range of potential data and analysis, planning authorities benefit from instances where work had been undertaken ahead of the LDP process to provide a view of which risks are most impactful, allowing a more focused approach to data.
Briefing note for planning authorities
Many planning authorities lack clarity on which data should be used for assessing climate risks and vulnerabilities, and how to interpret it. We have created an accompanying briefing note (Section 9.5), which should help by providing guidance on more usable and interpretable data.
Glossary / Abbreviations table
ADMS
Atmospheric Dispersion Modelling System
BGS
British Geological Survey
CC BY
Creative Commons Attribution License (further detail in 9.1.2)
CLIMADA
CLIMate ADAptation, Economics of Climate Adaptation
CRVA
Climate Risk and Vulnerability Assessment
CCRA
Climate Change Risk Assessment
DSM
Digital Surface Model
DTM
Digital Terrain Mode
EFFIS
European Forest Fire Information System
GIS
Geographic Information System
HabMoS
Habitat Map of Scotland
LA
Local Authority
LACS
Local Authority Climate Service
LDP
Local Development Plan
LiDAR
Light Detection and Ranging
LPA
Local Planning Authority
LSOA
Lower Super Output Area
NGD
National Geographic Database
NPF4
National Planning Framework 4
OGL
Open Government Licence (further detail in 9.1.2)
OpenCLIM
Open Climate Impacts Modelling framework
OS
Ordnance Survey
SNAP3
(Third) Scottish National Adaptation Plan
SEPA
Scottish Environmental Protection Agency
SIMD
Scottish Index of Multiple Deprivation
Sniffer
Independent charity – knowledge brokers for a resilient Scotland
PSGA
Public Sector Geospatial Agreement (further detail in 9.1.2)
UHI
Urban Heat Island
UKCCRA3
(Third) UK Climate Change Risk Assessment
UKCP18
UK Climate Projections 2018
UK-CRI
UK Climate Risk Indicators
Context and approach
Context
The reduction of emissions and adaptation to current and future risks of climate change is a challenge which is vital to be addressed via the planning system. The planning system provides opportunities to adapt to both current and future risks of climate change, as well as the potential to promote nature recovery and restoration in the area.
As part of the effort to modernise and update the planning system, the Scottish Government aims to align land-use planning with an outcomes-based approach to deliver sustainable development. This approach supports the National Performance Framework National Outcomes (Scottish Government, 2015) and supports the United Nations Sustainable Development Goals (United Nations, 2015).
Development planning, which outlines how places should change and where development should and should not happen, requires planning authorities to prepare and publish a local development plan (LDP)[1], updating on a 5 yearly basis.
The National Planning Framework 4 (NPF4) (Scottish Government, 2023c),puts climate change adaptation and resilience front and centre. A clear understanding of the impact of hazards and risks related to climate is required for an effective plan, and this must be underpinned by the effective use of climate risk data.
Defining climate risk
In this report, we refer climate risk in line with existing climate literature. Risk is defined as a combination of hazard, exposure and vulnerability (IPCC 2014).
Hazards are physical events which may have adverse effects, such as sea level rise & increased heat.
Exposure indicates the presence of people, resources, infrastructure which could be impacted by the hazard, and the extent to which they can be reached by the hazard. Physical proximity is one key consideration in understanding degree of exposure.
Vulnerability indicates to which extent people, resources or infrastructure could be more or less impacted by a hazard
Crucially, data can indicate hazard, exposure, vulnerability, or potentially a combination of the factors if indicating risk. However, if a dataset was not designed with the above in mind, it would need to be reinterpreted to a climate risk context. As an example, Ordnance Survey provides extensive data on the location of buildings, infrastructure and natural features, but geospatial analysis would be required to derive metrics such location to flood zones to indicate risk of flooding.
There is a substantial range of potential hazards associated with climate change in Scotland (Grace et. Al 2025). For this report, our engagement with the planning authorities focussed on the applicability of data, therefore a simplified grouping of hazards and risks was used (Table 1). In instances where datasets were particularly applicable to vulnerability and exposure, this is discussed in detail in Section 4.
Table 1 – Hazards and risks, as summarised in this report
Hazard Groups
Rainfall & Storms
Temperature & Water Scarcity
Sea Level Rise
Well Represented Hazards and Risks
Flooding
Costal Erosion
Health risks
Air pollution
Loss of land
Flood risk
Potentially Under Represented Hazards and Risks
Storm damage
Landslides
Water pollution
Agricultural changes
Habitat changes
Urban Heat Islands
Habitat Loss
Infrastructure damage
Local development plan evidence reports
Evidence reports are an early, statutory step in the development of a local plan. It provides a summary of the baseline data and other information which will form the basis of the plan.
This research focuses on the evidence gathering stage for climate risk – specifically, the tasks of early engagement and data collection, preparation of the evidence reports and a gate check by the Planning and Environmental Appeals Division (DPEA).
Evidence reports should be proportionate, with planning authorities having the discretion to tailor them to local characteristics and conditions. The Local Development Planning Guidance (Scottish Government, 2023b) provides guidance to support planning authorities in preparing evidence reports, including potential datasets relevant to NPF4 policies for climate change adaptation planning.
In addition to data access, there is a need to draw out implications of the data for the plan. It is not just about accessing the geospatial climate risk dataset but also ensuring its usability to accurately inform local development plans.
Rationale for this research
The lack of easily accessible spatial data on climate risk at a sub-national resolution has been identified as a key barrier to localised understanding of climate change adaptation by local authority planning officers.
Data gaps and accessibility issues create barriers to planning authorities producing proportionate, evidence-based plans. The aim of this research is to establish options for improved, simplified access by Scottish planning authorities to geospatial data that enables consistent, collaborative climate adaptation in local planning.
The intended audience for this research includes the Scottish Government and planning authorities. The work was commissioned on behalf of the Scottish Government, with particular interest for colleagues from the Climate Change Division and Planning, Architecture and Regeneration Directorate. A standalone briefing note and data catalogue (see Section 9.5) has also been produced specifically for planning authorities to showcase the available datasets.
Research methodology
The research involved an evidence review including a review of relevant literature, planning requirements and an in-depth data analysis of available risk data and its characteristics. Stakeholder engagement was conducted with planning authorities which were at various stages of evidence report development (see Figure 1) from early planning to successful completion. The engagement included interviews, as well as a wider workshop (See 9.3). Findings from these activities were the analysed to understand current needs, challenges and possible solutions to improve the process.
Figure 1 – Planning authorities engaged with in this study included Western Isles, Moray, West Dumbarton, Glasgow City, the Lothians, the Borders and Fife
Climate risk data
Effective data is central to the local development plan, and it is key that the right data is used and referenced for the evidence report. Additionally, the evidence report is expected to rely on spatial data, for which baseline evidence sources should be accessible.
There is a large range of data potentially available for use in evidence reports. This section provides a consolidated assessment of key datasets.
Our engagement with planning authorities identified:
Five climate-related datasets that were familiar to planning authorities and were – or were intended to be – used to produce the evidence report.
Eight datasets which would be valuable if used more extensively by planning authorities in the preparation of evidence reports.
Five areas of concern to planning authorities in relation to the evidence report which did not have a dataset available, or a clear methodology, documented below as data gaps.
In this section, key aspects of the data are provided, such as name, the organisation providing the data. The data license under which the data is made available is provided, the full implications of the license to usage by planning authorities is detailed in Section 9.1.2.
The majority of datasets reviewed are updated and published at a rate sufficient for their purpose, though we have noted instances where there may not be a clear long term plan for the maintenance of the data.
Several other datasets were identified as having potential value. For the full list of all data sources reviewed please see the accompanying data catalogue (Section 9.5)., which catalogue includes details of the metadata and access links.
Key datasets already in use
Through the interviews and workshop, there were multiple datasets already in use by planning authorities in the production of the evidence reports, though not consistently in all cases. The most popular datasets are discussed in this section, along with a narrative of how the datasets were applied and if any issues were faced.
Table 4.1 – Key datasets already in use by planning authorities
The consensus among most participants was that the Flood Maps from the Scottish Environment Protection Agency (SEPA) were a useful source for assessing increased flooding risks, which could be an outcome of both increased magnitude and frequency of rainfall, storms and sea level rise. The SEPA data is presented using a simple index (high, medium and low risk) down to ‘street’ level, which lends to easy interpretation by all stakeholders. The SEPA data also distinguishes between current flood risk, and future flood risk up to the 2080s, in the ‘Future Flood Maps’ layer. One participant also commented that the support provided by SEPA is also incredibly useful. Given the flood data also overlaps with other planning use cases out with the evidence report, there is a lot of familiarity with the data.
Dynamic Coast
Provider
License
Hazard Applicability
Usability
NatureScot
OGL and PGSA
Rainfall, Storms, Sea Level rise
High
Data from Dynamic Coast is used by multiple planning authorities. This project undertook a wide range of analyses, from coastal change due to sea level rise to the social disadvantage of the population exposed to coastal erosion. The output is a series of datasets on coastal erosion, intended as a broad planning tool for ‘street’ to ‘regional scale’ mitigation. The data also includes social vulnerability as an indicator. For coastal planning authorities, the data was seen as valuable and usable, though may not be as accurate or applicable in estuarine areas. The outputs include a mixture of OGL and PSGA data, so while most of the data is fully open, not all layers can be supplied to all stakeholders.
Scottish Index of Multiple Deprivation
Provider
License
Hazard Applicability
Usability
Scottish Government
OGL
All hazards/ vulnerability
High
The Scottish Index of Multiple Deprivation (SIMD) dataset provides a range of indices which can be used to highlight areas of high deprivation that may face a higher impact from climate risks. The data is presented at Lower Layer Super Output Area (LSOA) level (e.g. ‘neighbourhood’ level) and summarises social issues in simple to interpret indices. The housing index specifically accounts for houses which are overcrowded, and those which do not have central heating – key factors to consider when assessing risks related to several climate hazards.
OS MasterMap
Provider
License
Hazard Applicability
Usability
Ordnance Survey
OGL/ PSGA
All hazards
Medium
There is a large range of data available from the Ordnance Survey (OS), which can cover a range of topics from housing, infrastructure to green space and biodiversity. OS also provides products which can be used as backdrop maps to improve the accessibility of data when shared with stakeholders. The OS MasterMap range of datasets has been used in local government for various purposes since its launch in 2001, so there is likely to be organisational familiarity, especially in GIS teams. OS has been in the process of refreshing its key products with the introduction of the National Geographic Database (NGD). This is intended to add additional data to OS’s products to serve further analytical use cases and adds data such as the presence of green roofs and solar panels on buildings (coming in future release), habitat classifications and building ages. OS data is largely licensed under PSGA or OGL, and access is provided via the OS Datahub. OS also has products which identify areas of greenspace, namely MasterMap Greenspace and OS Open Greenspace. OS data is all high resolution, ‘street’ level data.
OS data is of high quality and coverage, providing street level data across Great Britain, which is updated frequently. Indicators for climate hazards, however would need to be derived through analysis. This would generally require geospatial skills and tools, but additionally, OS datasets tend to be large and complex. OS has made some efforts to address the complexity of accessing large data, including ‘Select+Build’ features, and API access. All planning authorities, as PSGA members, can access direct technical support from OS.
Light Detection and Ranging (LiDAR)
Provider
License
Hazard Applicability
Usability
Scottish Government
OGL
All hazards
Low
LiDAR data from the Scottish Remote Sensing portal is valuable for assessing risks related to flooding. Digital Surface Model (DSM)/Digital Terrain Model (DTM) data from LiDAR can be easily interpreted and integrated with other steps in the analysis. The Scottish Remote Sensing portal has OGL licensed LiDAR data in a relatively easily accessible form – however, the coverage of the data is mostly focussed on the Central Belt, limiting the ability for some planning authorities to use. Additional coverage for the data was announced as part of the Future Farming Investment Scheme[5], which should improve the usability of this data in the future. The data is high resolution, supporting analysis at ‘street’ level.
Suggested datasets for future wider use
The following datasets were discussed in interviews and workshops, but we found that not all planning authorities sampled were using them. For some datasets, the low uptake by planning authorities was due to difficulty in the use, or accessing of the dataset, whereas for others low uptake was down to a lack of familiarity.
In this section we have provided a narrative for these datasets to indicate where they may be of value for planning authorities to use going forward.
Table 4.2 – Suggested datasets which could be used by Planning authorities for further value
Neighbourhood Flood Vulnerability Index (NFVI) and Social Flood Risk Index (SFRI)
Climate Just
OGL
Rainfall & Storms
High
4.2.7
UK Climate Projections 2018 (UKCP18)
Met Office
OGL
All Hazards
Low
4.2.8
GeoSure, GeoCoast and GeoClimate
British Geological Survey
OGL and Licensed
Rainfall & storms, sea level rise
Low
Local Authority Climate Service
Provider
License
Hazard Applicability
Usability
Met Office
OGL
All hazards
High
The newly launched Local Authority Climate Service (LACS) from the Met Office aims to provide planning authorities across the UK with crucial information on climate change to support decision-making. The LACS provides a simple interface for analysing changes related to key hazards and includes climate averages and climate indicators. A Climate Report can be generated through the Climate Explorer. Planning authorities can add data and then use it in other applications such as Excel and Power BI. It is built using geospatial technology from Esri UK and is part of the Climate Data Portal (Met Office, 2024b) which hosts the information within the Local Authority Climate Projections Explorer. The LACS also includes guidance on the process of assessing climate risk with ‘regional’ level data. The Met Office launched the new beta service on 9 October, so as a new service has not yet seen widespread adoption in planning authorities. The Met Office are inviting feedback to help drive improvements of the LACS – the conclusions of which could be used as the basis to feed into this improvement process. Additionally, it could increase the number of Scottish planning authorities involved, increasing their awareness and knowledge of the system, and also make sure the LACS delivers the service that Scottish planners need. The LACS is not currently configured to provide reports for National Park planning authorities, but does cover all Scottish local authorities.
Habitat Map of Scotland
Provider
License
Hazard Applicability
Usability
NatureScot
OGL
All hazards
Medium
The Habitat Map of Scotland (HabMoS) is a composite dataset including different layers of detailed habitat data. All have been given a common Habitat Coding from the European Nature Information System (EUNIS). Using this data, a mapping of the existing habitats in a planning authority can be created. High value, or at risk habitats can then be identified, and habitat loss due to hazards such as sea level rise can be accounted for . The data is OGL licensed, with ‘street’ level resolution. HabMoS brings together habitat and land use data from multiple sources into one map, but the data is not interpreted in the context of climate hazards, so further interpretation and combination with additional datasets would be required to draw conclusions.
European Local Climate Zones
Provider
License
Hazard Applicability
Usability
Demuzere et. al. (2022)
CC BY 4.0
All hazards
High
The European Local Climate Zone (LCZ) data creates a simple typology for the built environment and landcover which is intended to support decision-making around climate risks. The data aims to characterise the urban landscape into broad categories (such as low-rise and high-rise housing) so that interactions between urban form and risks such as poor air quality, flooding and heatwaves can be modelled. Data is provided at ‘neighbourhood’ level resolution. One workshop participant reported that they had undertaken a ground truthing exercise in their local authority and confirmed that the data was broadly valid. As the data was recently, in 2022 and was aimed at the climate academic community, this dataset has not yet found widespread use in planning authorities. There are not currently any regular updates or revisions published for the LCZ data. Given the data is at ‘neighbourhood’ resolution, there is less need for it to be updated frequently, as only large changes to the urban landscape would be detected. As well as the detailed methodology being public, an LCZ Generator tool is provided by Ruhr University Bochum[9] which provides potential opportunities for updated datasets to be created for Scotland in the future.
UK Climate Risk Indicators (UK-CRI)
Provider
License
Hazard Applicability
Usability
UK Climate Resilience Programme
CC BY 4.0
All hazards
High
UK-CRI data simplifies analysis of many risks into indices. For temperature related risks, the data includes an estimation of days (or events) per year of events including heat waves, amber heat-health alerts, tropical nights (nights with a minimum temp of 20 °C). This extends to heat related impacts on infrastructure, such as road melting and high temperatures on rail. The impact of hazards on agriculture such as growing season and heat stress are also reported. Rather than creating new climate data, the UK-CRI is an interface on existing datasets (primarily Met Office) which simplifies complex data into more easily interpreted indices. The Met Office publishes annual updates to its climate data, though the UK-CRI tool does not receive updates as frequently. At ‘regional’ scale, it is less critical that the data is frequently updated, though after 5-10 years if the tool does not receive data updates, it may become far less appropriate to use.
River Basin Management Plans
Provider
License
Hazard Applicability
Usability
SEPA
OGL
All hazards
Medium
River basin management plans set out actions to address current issues affecting water quality, water resources and fish. The management plans can be used in context with other data sources to understand risks which impact river health. River basin management plans are not explicitly geospatial datasets but relate to river basins which can be represented geospatially. The issues faced using this data mainly lie in the river basin boundaries not aligning with local authority boundaries, so requires some analysis. In addition, the key use case of the dataset is not climate risk or hazard related, so will require reinterpreting to the climate context.
Neighbourhood Flood Vulnerability Index (NFVI) and Social Flood Risk Index (SFRI)
Provider
License
Hazard Applicability
Usability
Climate Just
OGL
Rainfall & Storms
High
A national flood vulnerability dataset was created by the Joseph Rowntree Foundation and is publicly available via the ClimateJust Maps tool. This dataset provides and easily to use, ready-made index describing flood vulnerability by combing physical flood risk with several factors which represent socio-economic vulnerability to flooding. However, it is based on ‘street level’ data published in 2011, which at this scale becomes quickly outdated. England and Wales had their index updated in 2022. An updated Scottish equivalent would be a useful tool for planning authorities to explore the vulnerability to this specific and pressing hazard.
UK Climate Projections 2018 (UKCP18)
Provider
License
Hazard Applicability
Usability
Met Office
OGL
All Hazards
Low
The Met Office is the authoritative source for key climate projection data for the UK. UKCP18 products are commonly used for temperature and precipitation projections, but it can also provide data on humidity, wind and sea level rise. The climate projections generally support analysis at a ‘neighbourhood’ to ‘regional’ level, dependent on the specific data UKCP18 product.
The Met Office provides a UKCP18 User Interface for querying and extracting the data, graphs and pre-paired maps (plus access to the full data catalogue for those experienced in handling large datasets), but this does require some expertise in the underlying data to navigate, limiting its usability to planning authorities that have GIS teams or capability. This was reflected in the workshops, as some participants expressed concern that the climate data accessed from the UKCP18 portal was sometimes difficult to use. In addition, there is further interpretation work required to convert a numerical value from the data into a clear indicator which can be used to influence a decision. This interpretation of the climate data and translation into implications for the LDP was also found challenging , with some planning authorities being unable to fully explore what the data means for their plan.
The UKCP18 data is a crucial underpinning to climate analysis and has been used by some planning authorities. More recently the data has been made more usable with a set of pre-prepared indicators by tools such as the Met Office Local Authority Climate Service (where GIS users can also visualise the mapped data and also add their own geospatial data), and UK Climate Risk Indicators.
GeoSure, GeoCoast and GeoClimate
Provider
License
Hazard Applicability
Usability
British Geological Survey (BGS)
OGL and Licensed
Rainfall & storms, sea level rise
Low
Participants expressed an interest in data from the British Geological Survey, which has the potential to address risks such as coastal erosion and landslides. The BGS GeoSure, GeoCoast and GeoClimate datasets indicate risks arising from multiple hazards, with a range of open and licensed datasets. The use of BGS data was not widespread among participants, partly due to the licensing cost associated with the premium datasets.
There may be more value to be gained from these datasets, but it would likely require the supporting geotechnical knowledge and interpretation, unless a simpler way of indicating future risks is provided.
Perceived gaps and ways to address gaps
When discussing risks, participants expressed several areas where they felt there was insufficient data available to meet their needs. This was due more to the limited understanding of what data was required to support the analysis, rather than specific datasets lacking appropriate spatial and temporal resolution or having gaps in coverage.
It should also be considered that if these data gaps were closed, what value would they provide to the evidence reports in each planning authority, and to what extent would the planning process be able to take useful action on the data. Urban heat islands serve as a useful example – while it would be possible to carry out a detailed analysis in each planning authority, for rural, or northerly authorities, the risk could be understood to be minimal by using an understanding of the local context and long term heat risk from tools like the Local Authority Climate Data Service (see 4.2.1).
In this section, we list the key gaps and explore some datasets and approaches which could be used to address those gaps.
Urban heat islands
Participants generally expressed a lack of data to understand the risks associated with the urban heat island (UHI) effect. The overheating risk methodology can be derived from both UKCCRA3 (Built Environment chapter) and the previous Environmental Audit Committee evidence reviews (e.g. 2018). Determining the extent of the effect of UHIs in urban areas can be done using a temperature sensor network (at high spatial resolution), modelling (e.g. using dedicated products such as Envi-MET, adapting more commonly used modelling approaches, e.g. atmospheric dispersion modelling systems (ADMS) (Zhong et al., 2024), or analysis of high-resolution satellite data products. However, these approaches may not be suitable for all planning authorities due to resource or lack of specialist knowledge. Overheating risk is likely to be greater in areas where urban form is compact, where there is less green and open space, and where the housing quality is poor. As such, combining datasets on Local Climate Zones (to give urban form), green space, and Scottish Index of Multiple Deprivation may act as a proxy for estimating urban heat island magnitude (e.g. Ferranti et al., 2023). Housing quality can also be indicated in further detail by Home Analytics data from the Energy Savings Trust which provides specific attributes on building fabric. This is a simpler approach using GIS datasets that planning authorities may be able to use for their evidence reports.
Storm and wind damage
While there are multiple datasets for inundation and coastal erosion, we did not find much work done to understand wind damage to buildings, or from trees. Tree fall risk is a statutory responsibility so it may be that planning authorities have some of this data held within parks or urban forestry teams. There are datasets which use remote sensing techniques to identify trees. One such dataset is National Tree Map from BlueSky – however, as this is a proprietary, licensed dataset it is unclear if the cost of this dataset outweighs the value which can be gained.
Landslides
While participants did discuss landslide risk, there was no broad consensus on the approach, nor most appropriate data. The open data published by the BGS could serve as a potential baseline assessment of current risk which, if found to be sufficiently high, further research could be carried out incorporating premium data, or input from specialists.
Health infrastructure
Data on the locations of key health infrastructure are available from NHS Scotland and accessible via the Spatial Hub. However, the use of these datasets in the context of the evidence reports would require further interpretation in order to drive decision making in the climate context. Whilst it would be possible to interpret which areas could be exposed to hazards such flooding and coastal erosion, understanding the magnitude of the risk on health infrastructure from hazards such as heating would require additional data to determine vulnerability such as building age and fabric. In the workshops, these aspects were not raised by participants, suggesting that this has not been a focus for planning authorities thus far.
Water infrastructure
Relevant data on water infrastructure, from Scottish Water for example, for the climate context is either available piecemeal, or not published. To understand which data would be required, planning authorities would need more knowledge as to which risks are likely to require water infrastructure data to assess.
Further observations
Wildfire risk was one aspect investigated by some planning authorities. Seasonal risk forecasts, as well as real-time monitoring is published by the European Forest Fire Information System[10] (EFFIS). This is a valuable resource for assessing the current risk landscape for fires, but additional context would be required for evaluating future risk (see UK-CRI in Section 4.3 above).
Datasets such as the Scottish Air Quality Database[11] provide information on air quality monitoring, analysis and interpretation of data, and pollutant trends at national and local levels. Historical data can also be accessed via the Met Office. Since these are observational datasets, they can be used for assessing current risk, but additional context would be required for evaluating future risk.
For more rural or agricultural planning authorities, there was also value in land use and land cover data from NatureScot, which allows risk to peatlands and croplands to be assessed. For coastal areas this data could also be analysed alongside Dynamic Coast data.
Based on the interviews and workshop discussions, participants expressed several areas where they had difficulty using data for specific outcomes or were not sure what to use.
Most of the datasets which were found to be of value for the evidence report were not hosted by a single source such as the Improvement Service Spatial Hub. The overhead effort of data acquisition for the planning authorities could be improved by more of the data providers providing a copy of their data to the Spatial Hub. However, this approach would not be straightforward with all datasets, such as those which are licensed (e.g. BGS), or those were the provider includes an analytical interface for extracting key indicators (Met Office LACS or UK-CRI).
Analytical tools
We reviewed several different analytical tools, such as CLIMADA[12] and OpenCLIM[13] which are designed to support users in analysing climate datasets and produce new data outputs indicating risk. These tools are open source, adaptable and suitable for academic use cases. In our interviews and workshops, we did not receive any feedback from planning authorities on these tools, suggesting they do not use them. As they require a high degree of specific technical proficiency (e.g. running python code), they may not be particularly suited to the planning authority teams who are producing evidence reports.
Current Approach
Climate Risk and Vulnerability Assessments
Climate Risk and Vulnerability Assessments (CRVAs) or Climate Change Risk Assessments (CCRAs) are available for some planning authorities and some regions of Scotland. These include the Clyde area, and one in preparation for south east Scotland.
Nationally, there is the UK CCRA Independent Assessment (Climate Change Committee, 2021a) and the National Summary for Scotland (Sniffer, 2021). These documents are long, difficult to navigate, and have a comprehensive list of wide-ranging risks. For anyone with limited familiarity with climate science and/or individual sectors, it is hard to understand which risks are most relevant to their planning authority or which risks are most important to planning. Risks in these documents are categorised with urgency and magnitude scores, and there is no scoring of impact or likelihood (apart from flooding likelihood) at a national, regional or local scale. Planning authorities need this information for their evidence report requirements, but it is not provided in the national CCRA3.
National documentation on adaptation (i.e. Scottish Climate Change Adaptation Programme: progress report 2023 to 2024) does not directly relate to local planning process and/or is difficult for the untrained person to see the links. The wider list of literature reviewed is given in Section 9.4.1.
Local climate risk assessment barriers and challenges – findings from the academic literature
Research related to mapping climate risk has increased rapidly in recent years. Studies are usually area- and problem-specific, which means that there is no standardised approach. Some maps focus on the local level, such as a city scale, but some have also looked nationally. Some also consider both spatial scales. Similarly, maps that assess climate risk can vary in perspective, such as focusing on one climate hazard because it disproportionately affects the study area the map is produced for. While many do take a multi-hazard approach, some focus on specific challenges such as heat, flooding, and drought.
Methodological process can also vary greatly across such assessments which may affect results so, for decision-makers, it can be challenging to decide which method is most appropriate to use. One key feature of many CRVA maps is the weighting of variables, which affects the extent of which specific variables may influence overall scoring. The SIMD dataset from the Scottish Government, as an example, weights income and employment indicators more heavily than housing in its determination of the deprivation index. However, in a climate risk context, a different weighting may be more appropriate. From a local perspective, weighting variables may be beneficial as they can provide more accurate results for decision-makers. However, in some cases it is difficult to achieve and an unweighted approach is preferred. Reasons can include
a lack of data or local studies
the risk of politicisation that may underpin the decisions upon weighting which links to subjectivity and
complexities around how different climate hazards may weight other variables differently.
Ultimately, adaptation to climate change should be a process that is iterative and embedded into organisational practices. Knowledge underpinning decisions may be imperfect, incomplete, or comprise other challenges such as those outlined above. It is important nevertheless that the process is started with the best knowledge and data available at the time. In repeating the process, more experience is gained, and the challenges can begin to be addressed (Greenham et al., 2024b).
Approach to the evidence report
Current position
In both the interviews and workshop, the planning authorities were at different stages of preparing their evidence reports. This ranged from those at very early stages of preparation through to authorities who have drafted their evidence report and received feedback from the Gate Check[14]. It is important to note that the small number of authorities having received the Gate Check at the point of the interviews and workshop, meaning a small sample may have impacted some of the feedback, alongside the relatively small sample of planning authorities that could be engaged during this short project.
The participants’ attitudes towards producing the evidence report were slightly more positive than their understanding of climate risks in general, with a generally positive sentiment (Figure 2)
Figure 2 – Sentiment captured during the workshop from the participants
Different approaches
The approaches used by planning authorities varied significantly, with different methods to identify data including policy review, evidence audits and workshops.
The teams undertaking evidence reports ranged in number of staff from 1-2 to 4-5 people. The use of specialist data or climate specialist colleagues in other departments within the planning authorities varied.
There appears to be a disparity on the anticipated timescales and resources required to undertake the evidence report. This depends on the extent to which planning authorities have already undertaken a climate change risk or vulnerability assessment and could be more reflective of local authority capabilities to conduct and deliver the output.
Some authorities have access to pre-prepared local or regional climate risk assessments or are part of existing climate ready projects (see Section 5.6). Others have access to climate change profiles, which provided an overview of expected future climate change. We also found some authorities had not explored climate risk and therefore had little existing evidence or experience to work from.
However, it was noted that even those planning authorities which had undertaken previous assessments found it difficult to access primary data. They were mainly using the conclusions of the past risk assessments to inform their evidence reports.
The implications of interpreting the data in a climate context and what the evidence actual means for informing or changing the local development plans was not always clear.
Using data to produce the reports
Concerns were raised by participants over the dynamic nature of the data, new data being published, and old data being updated. Not only did this make it hard to identify the latest datasets, but it also gave rise to concerns about evidence becoming out of date soon after reports were developed[15].
Concerns were also raised about the complex array of caveats and limitations that are inherent in much of the data. This included concerns about their own understanding and interpretation, and how these limitations should be portrayed in the reports in a non-technical manner.
Another issue raised was an inability to find locally specific data at a sub-local authority resolution; one local authority wanted to take a ‘neighbourhood’-level approach but felt that data did not exist to support this.
Data accessibility challenges
Challenges in accessing and fully utilising data exist at several points, and in ways which varied across planning authorities.
Firstly, a very broad set of potential datasets which could be used exists. The planning authorities had to locate many different data sources to compile the data they needed.
Next, the data needed to be downloaded and formatted from the different data sources and while most of the data required is licensable freely to planning authorities, we found a subset where the licensing implications and restrictions were unclear. In the case where the work was being carried out by organisations external to the planning authorities (e.g. Sniffer), additional barriers were faced as access to PSGA licensed data is not immediately granted, and additional contractor licenses need to be provided. PSGA contractor licenses are free, and they limit the scope of external use of the data to specifically the contracted work.
Once the data is obtained, its application to understanding climate risks and hazards is not always straightforward. Some information is in a readily usable format, while others require expert input before analysis is possible. In the case of datasets such as Dynamic Coast, or data presented via the Met Office Local Authority Climate Service, data is pre-transformed and interpreted in a climate context. As an example, the Met Office LACS provides simple indices such as “Average Number of Extreme Summer Days”. This contrasts with datasets such as UKCP18, where a user will need to download the dataset, isolate the area of interest, extract the climate values, and determine what metric to rate them against. This is a time-consuming process, requiring both geospatial and climate expertise.
Understanding how to link the data back to the guidance and the requirements of the evidence report is a key required outcome, and the extent to which accessing this insight from the data can be achieved varies widely across the datasets used.
Understanding climate risks
Concerns were expressed in the workshop by participants from smaller planning and development teams about resourcing, where there was little or no dedicated resource within the team, or even access to a dedicated individual with climate change knowledge. This makes the process more difficult and time consuming for these planning authorities.
Risks vary from area to area, but additionally will vary over time as the climate changes. We found that many workshop participants were focused on a current view of risk, rather than being informed on how risks might change based on future projections. Risks across different hazard areas discussed, and whether they seemed well represented or potentially underrepresented in the workshops are outlined in Table 1. Additionally, not all planning authorities had fully defined which hazards were most appropriate for their region.
Given many planning authorities already have a track record in modelling flood risk, and have a greater understanding of flood risks specifically, there is a heavy focus on flooding. There is less awareness of other climate risks, specifically future climate risks, and how they may relate to development planning. In some cases, there is confusion between climate mitigation (through reduction of greenhouse gas emissions) and adaption to reduce climate risk.
The value of pre-existing work
In some instances, planning authorities were (or will be) able to build upon pre-existing work. Of particular value is work focused on climate risk, and the production of data layers specifically to allow easy interpretation from a wide range of users.
The data and findings from examples like Climate Ready Clyde and Climate Ready South East Scotland can be re-used and built upon for consistency, as well as reducing the effort required for an evidence report specifically. However, planning authorities who have not benefited from these will be at a relative disadvantage.
Climate Ready Clyde
Climate Ready Clyde (CRC)[16] is a leading cross-sector initiative funded by 12 member organisations and supported by Scottish Government to create and deliver a shared vision, strategy and action plan for an adapting Glasgow City Region. CRC have produced Glasgow City Region’s Adaptation Strategy and Action Plan (Sniffer, 2024a) which includes a webmap (created by Clydeplan) that shows the location of postcodes most vulnerable to the impacts of climate change (Clydeplan, 2022). This includes heat risk (derived from the 4EI Heat Hazard Index[17]) and a layer highlighting postcodes within the top two heat risk bands. The work from CRC on the Climate Risk and Opportunity Assessment and data layers in the vulnerability map directly informed Glasgow City Council’s Evidence report.
Figure 3 – Glasgow City Region Climate Vulnerability Map
Climate Ready South East Scotland
A new project to support collaborative climate action in the Edinburgh and south east Scotland City Region. Climate Ready South East Scotland[18] is led by Sniffer, working in partnership with the region’s six local authorities: City of Edinburgh, East Lothian, Fife, Midlothian, Scottish Borders and West Lothian.
Climate Ready South East Scotland plans to:
Identify and prioritise the risks and opportunities from climate change to Edinburgh and south east Scotland’s society, economy and environment between now and 2080.
Lay the foundation for a transformational approach to climate adaptation and resilience for the city region.
Support a just transition to a net zero and climate resilient economy, in a way that delivers fairness and tackles inequality and injustice.
A detailed assessment of the climate risks and opportunities faced by the Edinburgh and south east Scotland City Region will be carried out, and is intended to be published by March 2025. This assessment will both draw on the best available scientific evidence, and work with communities across the region to gather and share their experiences of climate change. It will inform decision-making across the region, laying the foundation for collaborative climate adaptation action (Sniffer, 2024b).
We collated six overall observations, looking across the literature review, interviews and workshop.
A focus on flooding and a lack of awareness of available non-flood data
Knowledge and understanding of flood risk and applicable datasets is much more established with planning authorities. While this experience is valuable, it does lead to a focus on flooding to the detriment of the consideration of other risks.
In general, the participants revealed a lack of awareness around climate change projection data, including where to source it and how to use it. As an example, whilst some participants with backgrounds and expertise in climate had knowledge of the data, planners in general were far less familiar with UKCP18 data, when asked about data they used. Most questions on data were directed back to flood information. In one interview, when questioned more on UKCP18 there appeared to be no knowledge of where this data can be located and how to access it. Some statements suggested a lack of understanding of what climate projections are and different scenarios used, however this was not fully probed in the interviews. This data is key in understanding the risks that planning authorities will face in the future and the degree of potential impact.
Spatial data not always used
The use of spatial data appears limited even though the use of it in evidence reports is supported by the Local Development Planning Guidance (Scottish Government, 2023b). Whilst some spatial datasets are well known by planning authorities (e.g. SEPA flood maps) the use of further datasets is not extensive due to poor understanding of the geospatial data required and/or ability and access to staff with the right skills to use and interpret geospatial data.
Simple indices support interpretation
Interviewees generally favoured datasets which provide simple indices tailored to the climate risk context, such as SEPA flood maps and Dynamic Coast. These datasets allow interpretation by users without specific climate or data expertise. This contrasts with the UKCP18 data, as an example, which provides users with hazard data like temperature and rainfall values over time. Considerable interpretation would need to be done to translate this data into a measure of risk which can be interpreted. Users without climate or geospatial data experience can be supported in understanding the implications if the data is pre-prepared, and presented with relatively simple indicators.
Section 9.2 provides examples of tools and datasets which have been developed outwith Scotland, used to support users without climate expertise in understanding risks.
Simplification of the approach is needed
There is a need to simplify the approach that planners adopt, to enable them to incorporate climate adaptation into their plans. The evidence report is an important part of this process to help development of a baseline and support understanding of the climate risks faced by planning authorities now and in the future. To do this, a Climate Risk and Vulnerability Assessment (CRVA), which considers key hazard, vulnerability and exposure data, is a valuable prerequisite to identify those risks which can be mitigated by planning. Spatial data is key to undertaking an accurate and specific assessment, although there is currently no simple tool to support it. An example of this would be the methods and approach taken by the University of Birmingham for work done for one local authority (Birmingham) and one regional authority (West Midlands) in England (see Section 9.2). Aside from a tool, authorities would benefit from greater understanding of the key datasets which provide the best outcomes. This mirrors findings from the evidence report gate checks completed to date.
Prior work and climate data skills are advantageous
There was a general observation (which was also identified by several stakeholders) that some planning authorities faced greater challenges in the evidence report process. This is because they have little prior work on climate risk, less technical data skills within the team and no dedicated climate change professional within the Council.
Planning support and guidance is not specific on the application of data
The literature review illustrates that there is little information on climate risks and resilience that is written to support either local authority planners or the evidence report process. There is a wide range of data available, which could be used in many different approaches to be applied to understanding climate risk and appropriate adaptations. Furthermore, there is a gap in knowledge on how climate risk impacts planning and how planners can enhance climate resilience through planning requirements and the local development plan. Such information contextualised for Scottish planners would be invaluable to support the evidence report process and would allow adaptation to become business as usual within planning processes.
Conclusions
The following conclusions drawn from this research project to improve the evidence base for climate resilient planning policy are:
Accessibility and usability of data
There are numerous and varied datasets required to consider the range of vulnerabilities to, and impacts from, climate risks. There are several key datasets which are underutilised by planning authorities currently.
Many planning authorities do not have a clear and specific understanding of what data is needed to assess climate risk and vulnerabilities. The accompanying Briefing Note for Scottish Planning authorities to this research report (see Section 9.5) should provide support in providing signposted usable data.
Significant data gaps exist for urban heat islands, storm damage, health, water infrastructure and landslides. Proxies can be used, e.g. combining urban form, green space, and housing quality to assess urban heat island risk. However, consideration should be taken to ensure a consistent methodology, and a proportional amount of effort given potential risk.
The most useable and accessible data sources, such SEPA, Dynamic Coast, and Met Office LACS provide pre-determined, simple indices which provide a clear indication of climate risk. These allow planners to make clear decisions, without having to apply climate or data expertise to determine risk themselves.
Not all datasets provide simple indices, however, there are several datasets which could be used by planning authorities in the evidence reports which are not widely used currently. A consistent methodology for planners on how the indicators can be derived and used to incorporate adaptation and resilience into local planning would be advantageous.
Longer term, a single entry-point to these datasets would make this process easier for the planners and ensure that all Planning authorities have similar data to undertake the assessments
The data required is also mostly free for planning authorities, however, there are some licensing differences to be aware of when publishing to the public. See 9.1.2 – Data Licensing for further detail.
Accessibility could also be improved with further guidance on certain requirements mean and how they can be achieved. For example, the requirements ask planning authorities to assess the likelihood of risks occurring. This is a complex task, requiring knowledge of the climate hazards, how they will change, uncertainties, the ranges of climate outcomes depending on scenarios. Guidance on how to define likelihood and how to use data to evaluate likelihood is important, and can be paired with a specific indication of which dataset can be used for that purpose.
Understanding and capacity
Planning authorities find it time-consuming and difficult to get the required data from all the different providers.
Undertaking climate change risk assessments prior to the evidence report would provide a better understanding of which risks and hazards are most impactful.
However, planning authorities may need help doing this (especially the smaller planning authorities and/or those without climate and GIS and data experts), including:
Direct funding to outsource.
Support to identify partners and apply for funding.
Sharing or secondment of staff with climate resilience/climate science and GIS and data skills.
Collaboration and co-funding with neighbouring/regional planning authorities, like the ‘Climate Ready’ regional projects.
As an example, Sniffer is an independent charity that supports and coordinates the climate ready programmes in Scotland, including work such as webinars which discuss the use of different datasets. Sniffer currently hold a Scottish Government funded contract (Adaptation Scotland) to provide some capacity building support to planning authorities. This could be expanded to provide wider support for the climate change risk assessment process and support planners in translating the findings into the evidence report and the local development plans.
It should also be noted that the assessment of likelihood of risks occurring, beyond flood risk, is not undertaken in the UKCCRA3 or Scotland’s national summary.
It is useful to understand and address vulnerability at the evidence report stage, although stakeholders did not seem familiar with this as a concept or how it might be assessed.
Potential for action
Based on the findings from this research, the following actions could be explored in the short term to enhance and improve the coverage and usefulness of evidence reports:
Engage with the Met Office for a review of planner-specific user experience when accessing the latest UK Climate Projections (UKCP18)
The impression from most stakeholders was that UKCP18 projections are daunting and avoided by planners. The Met Office Local Authority Climate Service (LACS) (Met Office, 2024a) is still in beta, and feedback should be provided on how it could further meet the needs of Scottish planners.
Explore whether non-flood related climate data could be sourced directly via an existing data service for the creation of bespoke Climate Risk and Vulnerability Assessment indices and geospatial data portal relevant to planning in Scotland.
Explore the inclusion of features to support the National Park planning authorities in the LACS.
Engage with the British Geological Survey (BGS) to explore expansion of access for the assessment of landslide risk – and potential inclusion of licensed data.
Provide planners with further detail on which aspects of various datasets are valuable for their local plans, including the climate risks which planning should address (e.g. overheating, surface water flooding).
Encourage cross-authority engagement and collaboration. Given the inconsistent availability of knowledge, skills and capacity, peer learning and support can potentially provide a valuable approach to improving quality and consistency.
Share and promote the list of data (from this research) as a standalone resource, cross referenced with the relevant climate risks. See accompanying data catalogue (Section 9.5).
This research also clarifies which data licences may be required to support evidence report production, and further guidance on the impacts of the different license types.
Investigate funding options for regional Climate Risk and Vulnerability Assessments. As a first step, a CRVA provides a clear steer on what the key risks are, therefore allowing a more targeted approach to the Evidence reports.
Scope out the requirements for a Climate Risk and Vulnerability Assessment data platform for centralising the hosting of key datasets. In addition, this should include the development of new datasets and indicators which allow interpretation to non-climate, or non-geospatial users more easily. This could be delivered as a new tool or an extension to an existing one.
There is potential in the longer term to make the key national datasets available, with pre-interpreted indices available in one location. The data could have simple (e.g. high, medium, low) indices with user friendly guidance on what the data is, what it means and caveats (this could be 4-5 key hazards, with a climate vulnerability index). It could link directly to the datasets that have been identified in this report and could also potentially use some of the data from the analytics tools. This would require further research and dialogue with potential providers.
Ferranti, E., Cook, S., Greenham, S.V., Grayson, N., Futcher, J. and Salter, K., (2023) Incorporating Heat Vulnerability into Local Authority Decision Making: An Open Access Approach. Sustainability, 15(18), p.13501. https://doi.org/10.3390/su151813501
Grace, E., Marcinko, C., Paterson, C., & Stobbs, W. (2025). Using future climate scenarios to support today’s decision making. CXC/Government Actuary’s Department.
Greenham, SV., Jones, SA., Ferranti, EJS., Zhong, J., Acton, WJF., MacKenzie, AR., Grayson, N., (2023) Mapping climate risk and vulnerability with publicly available data. A guidance document produced by the WM-Air project, University of Birmingham. Available online: https://doi.org/10.25500/epapers.bham.00004259 [last accessed October 2024]
Greenham, S, Ferranti, E, Jones, S, Zhong, J, Grayson, N, Needle, S, Acton, J, MacKenzie, AR & Bloss, W. (2024a) An open access approach to mapping climate risk and vulnerability for decision-making: A case study of Birmingham, United Kingdom, Climate Services, vol. 36, 100521. https://doi.org/10.1016/j.cliser.2024.100521
Greenham, SV., Ferranti, EJS., Cork, NA., Jones, SA., Zhong, J., Haskins, B., Grayson, N., Needle, S., Acton, WJF., MacKenzie, AR., Bloss, WJ. (2024b). Mapping climate risk and vulnerability in the West Midlands. A guidance document produced by the WM-Air project, University of Birmingham. https://doi.org/10.25500/epapers.bham.00004371
IPCC (2014a). Summary for policymakers. In: Climate Change 2014: Impacts, Adaptation, and Vulnerability. Part A: Global and Sectoral Aspects. Contribution of Working Group II to the Fifth Assessment Report of the Intergovernmental Panel on Climate Change. Cambridge University Press, Cambridge, United Kingdom and New York, NY, USA, pp. 1-32. Available at https://www.ipcc.ch/report/ar5/wg2/.
Scottish Government (2023a) The Town and Country Planning (Development Planning) (Scotland) Regulations 2023. Available online at: https://www.legislation.gov.uk/ukpga/1997/8/contents [last accessed October 2024].
Sniffer (2024a) Climate Ready Clyde, Building a more resilient, prosperous and fairer Glasgow City Region. Available online: https://climatereadyclyde.org.uk/ [last accessed October 2024].
Sniffer (2024b) Climate Ready South East Scotland, Supporting regional climate action in the Edinburgh and South East Scotland City Region. Available online: https://climatereadyses.org.uk/about/ [last accessed October 2024]
UK Climate Change Committee (2021a) Independent Assessment of UK Climate Risk
Zhong, J, Lu, Y, Stocker, J, Hamilton, V & Johnson, K. (2024) Modelling the urban heat island in Birmingham, UK at the neighbourhood scale. In EGU General Assembly 2024., EGU24-19930, EGU General Assembly 2024, Vienna, Austria, 14/04/24. https://doi.org/10.5194/egusphere-egu24-19930
Appendices
Definition of Terms
Usability
Usability is summarised as follows:
‘High’ – a dataset which provides simple indices in a climate hazard and risk context and access and can be interpreted easily. Users will not need specific GIS or climate expertise to understand planning outcomes from these datasets.
‘Medium’ – data is relatively accessible but requires expertise to interpret or transform. To understand the data in a climate hazard and risk context, as well as planning outcomes, specific expertise in either climate, or GIS will be required.
‘Low’ – a dataset which requires specialist knowledge, expertise or skills. Extensive expertise, as well as time and effort will need to be applied to this data in order to arrive at indicators that can be used to make planning decisions.
Data Licensing
The information is provided as guidance on the description and general consequences of the common license types encountered for data. However, care should always be taken to ensure that if any data is used, the license and its limits should be validated before use or distribution.
Table 9.1 – Relevant data licences and their impact on planning authorities
License Name
Description
Outcomes for planning authorities
Link
OGL – Open Government License
A UK government defined license that encourages the public sharing of government created data
OGL generally supports data being used for most purposes internally at a local authority, and shared publicly in full
The license under which premium Ordnance Survey data is licensed to UK central and local governments
The PSGA license generally supports planning authorities in using data internally for all government functions. However, the data cannot be published and shared publicly in full. OS provides details on the full obligations.[19]
A permissive public copyright license that enables the free distribution of copyrighted work
CC-BY generally supports data being used for most purposes internally at a local authority, and shared publicly in full, so long as attribution is given.
There are many sub types of Creative Commons licenses, so refer to the Creative Commons site for more details
BSD is licenses are generally for software rather than data, but it is a very permissive license that imposes few limits on what can be done – a local authority could use BSD licensed software for any use internally, and then publish publicly in full
Climate Risk Vulnerability Assessment methods – the University of Birmingham
A Climate Risk and Vulnerability Assessment (CRVA) map is a method co-developed by the WM-Air project team at the University of Birmingham with local and regional stakeholders across Birmingham and the West Midlands. A CRVA map shows how geospatial climate risk data may be used by local planning authorities. It is pulled together using different environmental, physical, and socio-economic datasets to understand how climate risk varies across an area. The mapping approach prioritises using publicly accessible data and can be replicated by other planning authorities to improve climate resilience (Greenham et al., 2023).
Figure 4 – Birmingham City Council Climate Risk and Vulnerability Assessment map
Birmingham City Council recently published their CRVA (Greenham et al., 2023) on the city’s website (Birmingham City Council, 2024). The CRVA map scores areas of Birmingham based on compiling the presence and extent of 11 different factors that may influence the impact of climate change, where the higher the score, the more at-risk and vulnerable an area and its citizens are likely to be to climate change. The approach is considered a Minimum Viable Product (MVP), i.e. it works, and refinements can be made through use.
West Midlands Climate Risk and Vulnerability Assessment (WM-CRVA) Map
Figure 5 – West Midlands Combined Authority Climate Risk and Vulnerability Assessment Map
The University of Birmingham also collaborated with the West Midlands Combined Authority (WMCA); co-developing a CRVA map for the wider West Midlands (Greenham et al., 2024a). It takes forward the Birmingham MVP approach by including greater consideration of vulnerability. The overall CRVA map scores are based on 24 different factors, each of which is considered one of either a hazard, vulnerability, or exposure factor influencing climate risk.
Methodology
Our approach included two key phases the Discovery phase and the Analysis phase. The discovery phase involved a continuation of planning and refining the scope, and identifying the key tasks needed to ensure we had the full background and context to successfully undertake the research. The Analysis phase involved the main research tasks, including stakeholder engagement and a deep dive analysis of currently available climate risk and hazard data. Both are described in more detail below.
Discovery Phase
A desktop literature review was conducted (August 2024). The literature included covered information on climate change methods, past climate risk or vulnerability studies (where spatial data was used), and information relevant to climate risk in Scotland as well as the latest policy documents around climate adaptation for Scotland. Here we identified which risks were commonly highlighted within Scotland and what data has been used by others to represent those risks. As well as summarising the key policies relevant to the topic climate change risk and adaptation for the Evidence reports. The literature review findings were summarised in an excel spreadsheet. The full references to the literature are included in Appendix Literature review (Section 9.4.1).
Three of the currently available evidence reports were also reviewed, this allowed us to understand the current work by planning authorities and what approaches they took. We also began to identify gaps between the produced Evidence reports and the requirements.
A long list of potential workshop invitees was developed, this was to be refined within the analysis phase.
Identified a proposed list of relevant data with key search parameters for deep dive assessment. Research partners the University of Birmingham shared the data lists for both their CRVA mapping projects for Birmingham City Council and the West Midlands Combined Authority for review in the context of identifying the same UK wide datasets of their Scottish equivalents.
Set out an initial stakeholder engagement plan for the approach to both the interviews and a workshop, which was reviewed by and agreed with CXC.
Analysis Phase
Undertook the dataset deep dive and identified key practical characteristics including cost, availability, and accessibility
In the stakeholder engagement plan the approach for both the interviews and workshops were also set out. For the interviews we identified a list of stakeholders, this included three planning authorities that had or were in the process of undertaking the Evidence reports. We asked to speak to relevant individuals who had written the reports or who would be or were significantly involved in gathering climate evidence. Here, knowledge gained from the literature review was used to develop appropriate questions to help us better understand the local authority’s approach to gathering evidence, their understanding of the requirements and any difficulties they had faced or anticipated facing, and confidence with the topic (a full list of the interview questions can be found in Appendix Interview responses, Section 9.4.2).
When selecting stakeholders for both interviews and workshops we aimed to get a mix of stages within the development report process. We also ensured we had a good geographic spread of participants representing the wide range of planning authorities in Scotland. This included, coastal, city based, and Island based planning authorities.
During this analysis phase we held three interviews with representatives of Fife Council (21st August 2024), Comhairle Nan Eilean Siar (28th August 2024) and Glasgow City Council (3rd September 2024). Interviews included multiple members of the Arup team representing planning, Climate and data expertise as well as a note taker. All interviews were recorded with the permission of the participants. Interview findings were summarised in Appendix Interview responses (Section 9.4.2).
After the initial interviews a virtual ‘Prioritisation Workshop’ (17th September 2024) which included representatives from the planning authorities we interviewed, other planning authorities (across a geographic spread and at differing stages in their LDP) and other relevant wider stakeholders (such as representative from Sniffer). The workshop was developed using the findings of the interviews, so that the activities probed at areas of interest and or areas not fully covered by the interviews. The aim of this workshop was to further discuss how planning authorities can improve their access to geospatial data for climate adaptation.
Underlying assumptions
CXC facilitated introductions to key stakeholders for engagement. Engagements were virtual, via Microsoft Teams.
The sample of planning authorities involved was not aiming to be extensive or include all Scottish LPAs, given the scope, size and duration of this research project, but aimed to have good representation across geography, size and stage of progress with the Evidence report.
Literature review and stakeholder engagement
Literature review
A desktop literature review was conducted during the discovery phase, and a full list of references is provided here.
Table 9.3: Full list of references for literature review
Full reference
Link
Birmingham City Council (2024) Climate Risk and Vulnerability Assessment map.
Centre for Sustainable Energy and the Town and Country Planning Association (2023) Spatial planning for Climate resilience and Net Zero (CSE&TCPA). UK Climate Change Committee
Greenham, SV., Ferranti, EJS., Cork, NA., Jones, SA., Zhong, J., Haskins, B., Grayson, N., Needle, S., Acton, WJF., MacKenzie, AR., Bloss, WJ. (2024b). Mapping climate risk and vulnerability in the West Midlands. A guidance document produced by the WM-Air project, University of Birmingham
Greenham, SV., Jones, SA., Ferranti, EJS., Zhong, J., Acton, WJF., MacKenzie, AR., Grayson, N., 2023. Mapping climate risk and vulnerability with publicly available data. A guidance document produced by the WM-Air project, University of Birmingham.
Scottish Government / Riaghaltas an h-Alba (2024) Draft Scottish National Adaptation Plan (2024-2029): Actions today, for a climate resilient future. 31 January 2024.
This section provides the interview questions and a summary of the answer given by all three planning authorities interviewed.
Q1: What is your role in preparing the Evidence report?
Most stakeholders interviewed were planning officers based in planning services or equivalent.
Teams working on this topic of the Evidence report ranged from 1-2 to 4-5 members of staff as the core team. Though generally one or two key individuals took responsibility or a key co-ordination role.
Use of expertise outside of teams also varied including some drawing on data individuals or climate and sustainability officers.
Q2: What is the status of your Evidence report? And what are the next steps?
Ranged from early stages of prep to just complete and complete and addressing feedback.
Q3: How clear to you were the requirements / guidance for assessing climate risk through the Evidence report?
Responses to this question were mixed, some stated the guidance “left a lot open to interpretation”, feeling it was hard to understand what they actually needed to do.
One Local Authority said the guidance was clear in answer to this question but after further probing it appeared they were not sure on several of the elements within the requirements.
One response stated that requirements were easier to interpret due to knowledge of other resources.
Q4: How did you assess climate risk/climate change within your Evidence report?
In one interview the approach had not been developed and it was too early to discuss.
The other two planning authorities relied heavily on information that had been previously produced for the area, such as past climate profiles or regional risk assessments. Using this information and interpreting it rather than new information or raw data designed specifically for the Evidence report.
One Local Authority took a place-based approach but struggled with assessing climate risk on this level.
Q5: How have you assessed vulnerability to climate change and inequalities?
This question was generally not well answered indicating that there was a lack of understanding on the requirements around assessing vulnerability.
One Local Authority alluded to have a copy of a vulnerability index, but not sure where it was sourced from (potentially from SEPA).
Q6: Do you know what datasets were required to undertake climate risk assessment?
One Council in the early stages indicated that they did not yet know what datasets would be required to complete assessments but were aware of the recommended data sets.
Another realised on using report summarising previous regional risk assessments and interpreted screenshots from these reports. They had tried to get the data but had difficulty locating/accessing it.
Generally, when talking about data the focus was flood data. No participant mentioned raw climate projection data. Heat hazard data was mentioned by a single Local Authority but in the context of difficulties getting the data.
Q7: Do you know how to/have the ability to access them (within the team)?
Answers for this question were mixed some had dedicated contacts they could reach out too for data others stated they struggled knowing which data was relevant.
When probed there generally seemed to be a lack of knowledge on what data was out there, without even thinking about how to access, use and interpret the data.
General staff resources were flagged as an issue and time needed to use datasets.
One Local Authority had external GIS support for these kind of tasks from a cross local authority collaboration to share resource, with a 2-year secondment, though this was a resource with a limited timescale.
Q8: Is there anything else you would like to share about the process?
One set of interviews mentioned that they were beginning to realise the size and scope of the task of gathering and analysing climate risk data as they begin process of evidence gathering.
One Local Authority mentioned concern about understanding how all of this actually linked into to planning and how in general the evidence would be used to influence planning.
One also mentioned they had a lot of support from their climate team and could sense check and problem solve with their guidance. This was an invaluable resource.
Workshop
Arup and the University of Birmingham undertook a stakeholder workshop on 17 September 2024 for ClimateXChange Scotland and the Scottish Government on Improving access to geospatial climate risk data. The purpose of this workshop was to discuss together how planning authorities can improve their access to geospatial data for climate adaptation in the context of development planning.
The online workshop brought together planning authorities (across a geographic spread and at differing stages in their LDP) to better understand their needs as a local planning authority and/or climate policy team:
to prepare Evidence reports,
as users of this geospatial climate risk data and;
understand any current challenges or gaps that need addressing
The workshop provided information on key hazards and risks the planning authorities had been or anticipated focussing on and what data would or had been used. The workshop built on the interviews by delving deeper into the data and methods of analysis. Providing further insight on data gaps, ease of use and challenges faced by the planning authorities.
Additional Resources
Data catalogue
The data catalogue spreadsheet is available online:
While every effort is made to ensure the information in this report is accurate, no legal responsibility is accepted for any errors, omissions or misleading statements. The views expressed represent those of the author(s), and do not necessarily represent those of the host institutions or funders.
This work was supported by the Rural and Environment Science and Analytical Services Division of the Scottish Government (CoE – CXC).
The LDP is required under The Town and Country Planning (Scotland) Act 1997 (Scottish Government, 1997), as amended by the Planning (Scotland) Act 2019 (Scottish Government, 2019). Relevant secondary legislation and published guidance includes The Town and Country Planning (Development Planning) (Scotland) Regulations 2023 (Scottish Government, 2023a) as well as Local Development Planning Guidance (Scottish Government, 2023b). ↑
A detailed description of licensing terms and their implication, such as OGL, PSGA, BSD and CC-BY are provided in 9.1.2 – Data Licensing ↑
The relevance of the dataset to the hazard groups as discussed with participants. Definitions are shown in Table 1 ↑
Captures ease of use by local authority officials. See 9.1.1 – Usability for more detail ↑
Administered by the Planning and Environmental Appeals Division, the Gate Check is a process through which the sufficiency of the evidence report is assessed, to confirm there is a sound evidence base on which to prepare a Local Development Plan ↑
From an LDP guidance perspective the evidence available at the time of writing the report is proportionate and sufficient. ↑
Heat loss from domestic buildings has been identified as a major source of carbon emissions. Energy Performance Certificates (EPCs) present energy efficiency ratings for buildings. They will become an increasingly important tool in quantifying energy loss for individual properties in Scotland, as outlined in the proposed Heat in Buildings Bill.
This study reviews the approaches taken in European Union (EU) member states on operational governance of EPCs, through a desk-based literature review, expert interviews and in-depth case studies of three countries of interest.
We identify opportunities for Scotland to learn from examples of best practice in other countries. We also present a series of options that could be implemented as part of a potential reform of the operational framework for EPC governance in Scotland.
Key findings
Governance models
Member states allocate responsibility for EPC implementation and quality assurance of their EPC regimes in different ways. Some member states utilise a central government body, and others use a publicly funded arms-length body. A few member states use an external private organisation or allocate this responsibility at a regional level.
Minimum qualifications, training and accreditation for EPC assessors
Member states must ensure that EPC assessors are suitably qualified and certified. They do this by setting requirements for assessors, such as a higher education degree, and/or professional experience in a related field. Most member states also have approved training courses and/or examinations, which might be voluntary or mandatory. Some countries also require mandatory recertification or retraining after a set period of time or require programmes of continuous professional development.
Auditing and quality assurance in the production of EPCs
Member states must ensure that quality standards are upheld in the production of EPCs. They are required to carry out random sampling of EPCs, although some member states conduct random sampling of total EPCs issues, and others sample a percentage of EPCs per assessor. Some member states also choose to conduct additional targeted audits, which can be desk-based or on-site and are triggered by specific risk factors. Some member states also use digital screening systems, which automatically screen input data to identify incorrect or inconsistent data.
All member states implement some sort of penalty system for assessor errors to uphold quality standards. These usually depend on the severity of the infraction, but include reissuing the EPC, additional targeted training, or monetary fines. For severe or repeat offences, assessors in some member states can also have their assessor license suspended or withdrawn.
Enforcement mechanisms
Most member states can issue fines for failing to present a valid EPC at the point of sale or rental. However, many do not enforce this requirement or issue fines in practice and there are data gaps in how well the requirement is enforced. Analysis by the European Commission found that only a small number of member states have a robust system for enforcing the requirement to present an EPCs at the point of sale. Those that do require legal professionals to check that an EPC is present as part of the sale. However, rental agreements often do not involve a legal professional in the process, so they cannot be targeted in the same way as sales are more difficult to enforce.
Options for Scotland
We have established a list of potential options which could improve the operational governance of EPCs in Scotland.
Option 1 – Including standard training requirements for EPC assessors in the Operational framework
This could include introducing standard education and qualification requirements into the operational framework, approving a standardised mandatory training programme for EPC assessors, and/or requirements for assessors to attend mandatory annual re-training.
Option 2 – Develop standardised quality assurance procedures for approved organisations in the operational framework
This could include developing a digital quality assurance system to screen EPC input data, establishing a ‘Helpdesk’ function to receive complaints about EPCs, implementing targeted audits of EPCs based on specific risk factors and/or outlining a clear penalty system for assessor infractions.
Option 3 – Engage wider stakeholders in the rental/sales process to support enforcement of the requirement to present an EPC
Formalising the requirement for solicitors to check EPC documentation at the point of sale could help enforce this requirement in practice. Engaging stakeholders involved in the rental market, such as estate agents, could help encourage checking of EPC documentation for lettings.
Glossary and abbreviations table
ADENE
The Portuguese Energy Agency
AO
Approved organisations – whose members are approved to deliver EPCs in Scotland
APEL
Approved Prior Experiential Learning
BER
Building Energy Rating – energy efficiency ratings used for buildings in Ireland
CPD
Continuous professional development
CzK
Czech Koruna
EU
European Union
EPBD
Energy Performance of Buildings Directive
EPC
Energy Performance Certificate
HRK
Hrvatska Kuna (Croatian Kuna)
ICS
Independent Control System – EPBD requirement that member states must allocate responsibility for upholding the quality of EPCs and their associated QA procedures. This can be allocated to a government department or to an external organisation.
NVQ
National Vocational Qualification
Operational framework
The document which governs approved organisations in Scotland and outlines key processes to ensure that EPCs are prepared by sufficiently qualified persons
QQI
Quality and Qualifications Ireland
QA
Quality assurance
SEAI
Sustainable Energy Authority of Ireland
VEKA
Flemish Energy and Climate Agency
Introduction
Context
Energy Performance Certificates in Scotland
The Energy Performance of Buildings Directive (EPBD) is the primary legislative instrument used to promote energy efficiency in buildings in the European Union (EU). First published in 2002, it was recast in 2010, 2018 and most recently in May 2024 to align with the higher energy efficiency ambition in the European Green Deal (European Union, 2024).
The Energy Performance of Buildings (Scotland) Regulations 2008 transposed the original EU’s EPBD into Scottish statute. The Regulations dictate how Energy Performance Certificates (EPC) are implemented in Scotland, and outline that an EPC must be produced when a new building is constructed and when a building is sold or rented. This applies both to homes and to non-domestic buildings. EPCs contain an energy efficiency rating, as well as recommendations on how to improve a building’s energy efficiency. Therefore, they are widely considered to be useful tools for helping to drive emission reductions from buildings.
However, using EPCs as a basis upon which to set standards can be problematic, as a result of issues including:
Poor quality or low robustness of assessments
Infrequently updated assessments
Use of modelled data rather than actual energy performance data
A lack of incentives for decarbonising heat
To ensure that EPCs are fit for purpose in the context of Scotland’s leading net zero objectives, the Scottish Government is planning to revise the role of EPCs in line with the proposed Heat in Buildings Bill. There could be a more prominent role for EPCs, particularly as a tool for demonstrating compliance.
Operational governance of EPCs in Scotland and reform
In Scotland, an EPC must be produced by members of six “Approved Organisations” (AOs). Regulation 8(3) of the Energy Performance of Buildings Regulations (Scotland) 2008 requires that AOs “ensure that members are fit and proper persons who are qualified by their education, training and experience to carry out the preparation and issuing of energy performance certificates”. AOs therefore hold primary responsibility for training and accrediting EPC assessors in Scotland. An operational framework outlines key processes that ensure EPCs are prepared and issued by sufficiently qualified persons, including (Scottish Government, 2012):
Ensuring integrity and operational resilience
Accreditation of energy assessor members
Administering the operation of energy assessor members
Maintaining records to facilitate effective operation of the scheme and periodic audit by the Scottish Government
A report by Alembic Research Ltd et al, (2019) and commissioned by the Scottish Government, made recommendations on minimum standard qualifications for EPC assessors, auditors, and AOs. It also suggested an independent redress avenue for EPC consumers. In line with this, the Scottish Government are looking to assess and potentially review the Operating Framework and its role in upholding the quality and robustness of EPCs. This will ensure EPCs are fit for purpose in their potentially enhanced role in the upcoming Heat and Buildings Bill.
Objectives and scope
In this study, we investigate how the operational governance provisions of the EPBD have been implemented in the EU member states. This will enable us to identify opportunities for Scotland to learn from examples of best practice in other countries. The key objectives of this study are therefore to:
Review the approaches taken to operational governance of EPCs in EU member states
Identify different methods of implementation and areas of interest for Scotland
Develop options for potential reform of the operational framework for EPC governance in Scotland.
We only consider approaches taken in EU member states in this review. In addition, we do not consider aspects related to EPC methodologies. The focus is on the operational aspects of EPC governance. These include:
Governance model – whether central government or arms-length bodies hold responsibility for EPC governance, or if this is delegated to external organisations.
Training for EPC assessors – including coverage of any education prerequisites to apply for certification, training courses or examinations that assessors must complete, and any requirements for re-certification or retraining after a set period.
Auditing, verification and quality assurance (QA) procedures – the systems and processes in place to guarantee the quality of EPC production, how the requirement for an independent control system (ICS) is met, including who holds QA responsibilities and any penalties issued for assessor infractions.
Enforcement mechanisms – how member states enforce the requirement to present an EPC at the point of construction, sale or rental of a property, and any associated penalties
Affordability – any information identified on how member states ensure the affordability of EPCs, in line with Article 16 of the EPBD.
Methodology
We collected data for this study primarily through a desk-based literature review. This was supplemented with a series of interviews with EPC experts,[1] which we used to triangulate findings from the literature review and to fill any identified gaps in the evidence. We then selected three countries of interest for Scotland (Belgium, Croatia and Ireland) and developed an in-depth case study for each. The collected data was used to derive policy options for improving the operational governance of EPCs in Scotland. Full methodological detail, including relevant limitations, is presented in Appendix A.
Operational governance of EPCs in the EU member states
Governance models
This section explores the governance models that member states use to implement Energy Performance Certificate regimes, including how they delegate the responsibility for the Independent Control System required in the Energy Performance of Buildings Directive.
EPBD requirements
member states can delegate the responsibility for implementing the ICS for EPCs as they deem fit under Annex VI of the EPBD. This system aims to ensure the quality of EPCs and their associated QA procedures. (European Commission, 2021a). Amongst other requirements, the ICS should:
Provide a clear definition of a valid EPC, which should include requirements to check the validity of input data and calculations used to generate the EPC
Clearly outline the quality objectives and level of statistical confidence that the EPC framework should achieve (these are further explained in Section 4.3.1)
Ensure that EPCs are available to prospective buyers and tenants so that informed decisions can be made on their decision to buy or rent a property
Account for different building typologies, such as single residential, multi-residential, offices or retail
Regularly publish information on the ICS, through the national database of EPCs.
Member state approaches
Scottish approach
Scotland follows the approach agreed in the UK when the EPBD was transposed into domestic regulation in 2008, when the UK was an EU Member State.
The Scottish Government implements EPCs, including the ICS, through six external private organisations, called Approved Organisations. The Scottish Government has an agreement with these AOs, who are governed by an operational framework, which was published in 2012. Members of AOs are often self-employed energy assessors, whom the AOs contract to produce EPCs in line with government-approved methodologies and tools (Delorme and Hughes, 2016). However, the role of the AOs is to ensure that their members have the skills and expertise necessary to prepare and issue EPCs. They are also responsible for upholding QA protocols and for issuing penalties for incorrect EPCs.
A similar approach is adopted in England and Wales, where six independent accreditation schemes are responsible for managing energy assessors and for ensuring they possess the appropriate skills for the role.
Table 1 gives an overview of the governance models adopted in the member states. The majority place the responsibility of implementing the ICS for EPCs on a Central Government body. This approach is adopted in Greece for example, where the Department of Energy Inspection hold QA responsibilities (CRES, 2020). Some member states have allocated the responsibility of implementing the ICS on government-funded, arms-length bodies. For example, this is the approach adopted in Ireland, where the Sustainable Energy Authority of Ireland (SEAI) is responsible, and in Slovakia, where this falls to the Slovak Trade Inspection. Both bodies are publicly funded, non-profit organisations separate to the central government Ministries and Departments responsible for overall EPC policy (SEAI, 2017b) (Slovak Trade Inspection, n.d.).
Governance model
Description
Examples of Member State adoption
Government body (Central Government Ministry or Department)
Most common model of governance adopted – the Government Ministry or Department made responsible for implementing the ICS
Cyprus, Czechia, Estonia, Finland, France, Greece, Croatia, Lithuania, Luxembourg, Latvia, the Netherlands, Poland, Romania, Slovenia
Government body (arms-length bodies)
Responsibility of implementing the ICS lies with government-funded, arms-length organisations that are separate from the Government
Bulgaria, Denmark, Ireland, Hungary, Malta, Slovakia and Sweden
External body
Responsibility of the ICS lies with an external private organisation
ICS responsibilities are allocated differently at regional level
Austria, Belgium (Flanders, Brussels and Wallonia), Germany, Italy and Spain
Table 1: Overview of different governance models employed by MS.
Portugal has allocated the responsibility of implementing the EPBD and the ICS to an external body. The Portuguese Energy Agency (ADENE) oversees the central register and assessor accreditation. An EU-level EPC expert interviewed for this project perceived that this approach was adopted to separate EPC governance from changing political governments, instilling stability and allowing for a long-term vision for the system to be implemented.
Five member states implement the ICS at regional level. Each of the Belgian regions govern EPCs independently. In Austria, some regions have allocated responsibility of conducting QA on EPC data to the municipalities (OIB, 2020), whereas energy agencies oversee the QA in others (TU Wien, 2021). Italian regions and autonomous provinces had autonomy over energy topics until 2015, resulting in a complex regulatory framework. Guidelines for regulating EPCs were released in 2015 that implemented a new standardised EPC system at national level (Azzolini et al., 2020).
Minimum qualifications, training and accreditation for EPC assessors
This section outlines the training and certification schemes member states have adopted to ensure that EPC assessors are suitably qualified independent experts.
EPBD requirements
Article 25 of the EPBD sets out a requirement for member states to ensure that EPCs are carried out by ‘independent experts’. It outlines that:
Experts must be suitably qualified and certified, but can be self-employed, employed by public bodies or by private enterprises
Information on the training and certification process should be made available to the public
A list of certified experts or companies that offer the services of experts must be regularly updated and made available to the public.
Member state approaches
Scottish approach
The Operating Framework mandates that AOs reference the UK National Occupational Standards for Energy Assessors. These have been developed to ensure energy assessors are competent and possess the right skills to conduct energy assessments. A Level 3 NVQ qualification for assessors exists in Scotland, as well and in England and Wales. However, AOs are ultimately responsible for ensuring EPC assessors are suitably qualified in Scotland. Although some assessors obtain this NVQ, it is not mandatory and AOs use Approved Prior Experiential Learning (APEL), which considers relevant experience, skills, and training of a potential assessor.
EPC experts must complete a 3-5 day training course, designed and delivered by AOs. These can cost between £700 and £1250 (Kanzyl, 2020a). The type of accreditation depends on the building type to be assessed – with separate accreditations for:
Domestic EPCs (existing buildings).
Domestic EPCs (new buildings).
Non-domestic EPCs (existing buildings).
Non-domestic EPCs (new buildings).
Continuous professional development (CPD) is required, although the minimum level of CPD is specified by each AO (Delorme and Hughes, 2016). As AOs in Scotland are responsible for ensuring assessors are suitably qualified, and there are no minimum national standards for qualifications, training, or continuous professional development. Therefore, there may be a variation in standards across the country. The approach taken in England and Wales is similar, where accreditation schemes have discretion over whether assessors hold the necessary skills to become an assessor. However, energy assessors can satisfy requirements through training and examinations, or by demonstrating suitable qualifications and experience (Delorme & Higley, 2020).
Pre-Requisites for independent experts
Table 2 outlines the approaches member states have taken to setting pre-requisites for independent experts. Thirteen member states have set subject-specific educational requirements. These are all higher education requirements (either Bachelors or Masters) in subjects such as engineering and architecture. Sweden, Romania and the Netherlands are the only member states only requiring professional experience as a pre-requisite for accreditation. In Sweden for example, applicants must first have 5 years of professional experience to undergo the training for assessor accreditation (Hjorth et al., 2020).
Higher education (Bachelors or Masters) degree required. These are always in subjects such as engineering or architecture.
Austria, Bulgaria, Cyprus, Czechia, Denmark, Finland, France, Greece, Croatia, Hungary, Italy, Luxembourg, Malta, Poland, Slovenia
Professional
Professional experience in a related field (such as construction)
Sweden, Romania and the Netherlands
Both education and professional
Combination of both educational and professional experience required
Estonia, Germany, Lithuania and Portugal
Flexible approach
Multiple pathways available to assessors (either education, or prior professional experience)
Belgium (Flanders, Brussels, Wallonia), Ireland, Scotland, England and Wales
Table 2: Overview of different pre-requisites for independent experts.
Some member states have more flexible requirements and recognise either professional or educational experience. Others, however, require both specific higher education degrees and professional experience. For example, in Lithuania applicants must have an engineering degree and three years’ experience in the construction sector (Kranzl, 2020a).
Training courses for independent experts
Table 3 outlines the approaches to training independent experts adopted by member states for assessor accreditation.
Mandatory accreditation training administered either by external certified organisations or government bodies
Germany, Estonia, Croatia, Luxembourg, Slovenia, Sweden and Scotland
Mandatory training and exam
Mandatory accreditation training and examination administered either by external certified organisations or government bodies
Belgium (Flanders, Brussels and Wallonia), Bulgaria, Cyprus, Denmark, Finland, France, Greece, Ireland, Italy, Lithuania, Malta, The Netherlands, Poland, Portugal, Romania, England and Wales[5]
Voluntary training only
Voluntary training for assessor accreditation, accreditation authority responsible for granting accreditation
Austria and Germany
Voluntary training and exam
Voluntary training for assessor accreditation, accreditation authority responsible for granting accreditation. Mandatory examination also required.
Cyprus and Hungary
Table 3: Overview of the different training requirements for independent experts.
Most member states have implemented a mandatory training programme for EPC assessor accreditation. The majority of member states (including Bulgaria, Denmark, Greece and Ireland) have also implemented a mandatory written examination as a requirement for accreditation. Malta requires both written and oral examinations (BPIE, 2014). Six member states (Austria, Germany, Estonia, Croatia, Luxembourg and Slovenia) do not have a mandatory exam for prospective assessors.
Some member states have only introduced a voluntary training scheme for assessor accreditation. In these member states (Austria and Germany), the authority responsible for assessor accreditation certifies experts based on professional experience or education achievements, without the adoption of mandatory training (Kranzl, 2020a) (BPIE, 2014). In Cyprus and Hungary, despite the adoption of voluntary training, completion of a mandatory exam is required for accreditation (BPIE, 2014). The training requirements for member states do not appear to be linked to the stringency of pre-requisites, for example, the countries who implement a voluntary training programme only do not necessarily have more stringent pre-requisites (and vice versa).
Training course administration
In most cases, training is administered by external, private organisations that have been approved by the Government. In Ireland for example, the national agency for qualifications, ‘Quality and Qualifications Ireland’ oversees the accreditation of training course providers. Only courses administered by these organisations are accepted (SEAI, 2017a). Similarly, in member states such as Denmark and Greece, a singular accreditation body has been appointed (National Energy Agency in Sweden and the Ministry of Environment, Energy and Climate Change in Denmark) (Ruggieri et al., 2023). An interview with an EPC expert in the Belgium (Flanders) highlighted that whilst the Flemish Government had outsourced the delivery of training and examinations to external providers, they are now in the process of re-instating the administration of the accreditation internally. No further clarification on why this was the case was provided.
Recertification or retraining for independent experts
Table 4 outlines the approaches to recertification and retraining adopted in EU member states.
Requirement for independent experts to recertify or retrain after a set period of time
Estonia, Finland, France, Ireland, Lithuania, Luxembourg
Continuous professional development requirements
Requirement that independent experts complete programmes of Continuous Professional Development
Austria, Belgium (Flanders, Wallonia and Brussels), Bulgaria, Czechia, Germany, Denmark, Croatia, Slovenia, Scotland, England and Wales
Voluntary refresher training
No requirements for recertification, retraining or continuous professional development
Romania and Portugal
Table 4: Overview of the different recertification or retraining requirements for independent experts.
Some member states require independent experts to recertify or retrain after a set period of time. This is achieved either by re-sitting the accreditation examination, taking refresher training or through proof of experience. Eight member states have a requirement that independent experts complete programmes of CPD. In Belgium (Flanders), for example, all independent experts must undergo training and sit an examination annually. This training is used to either introduce new concepts or developments (ensuring continuous improvement) or to provide targeted refresher training for specific areas where errors have been identified by a significant number of assessors. The annual training is administered by the Flemish Energy and Climate agency (VEKA) and is tailored each year.[7]In Germany however, no official continuous development or recertification procedures have been adopted but experts are required to take personal responsibility for the quality of certification and ensure they are up to date with developments in the field (BPIE, 2014). ADENE in Portugal administers regular refresher training for experts in Portugal who wish to improve their skills (Kranzl, 2020a).
Auditing and quality assurance in the production of EPCs
This section discusses the various approaches that member states take to ensure that the quality of EPCs and their associated quality assurance procedures are upheld.
EPBD requirements
Annex VI of the recast EPBD (European Commission, 2024) outlines provisions related to QA of EPCs that the ICS should implement. These include requiring member states to:
Provide a clear definition of quality objectives, including the level of statistical confidence that the EPC framework should achieve – at a minimum the ICS should ensure that at least 90% of all valid EPCs issued are evaluated with 95% statistical confidence over a period that cannot exceed one year.
Carry out random sampling of EPCs to assess the level of quality and confidence in the ICS for EPCs.
Use a third party to verify at least 25% of the random sample when the ICS has been delegated to non-governmental bodies.
Ensure the validity of the input data through an on-site visit for at least 10% of EPCs that are part of the random sampling (this is a new requirement of the 2024 recast of the EPBD).
Employ pre-emptive and reactive measures to ensure the quality of the overall EPC regime, including but not limited to:
Additional training for independent experts.
Targeted sampling (in addition to random sampling) to specifically detect and target poor-quality EPCs.
Obligations to resubmit EPCs.
Monetary fines.
Temporary or permanent bans for independent experts.
Article 24 of the EPBD states that member states should implement penalties with regards to infringements of aspects of EPBD implementation, including EPCs. These penalties are not prescribed, however must be “effective, proportionate and dissuasive”.
Scottish approach
AOs hold responsibility for QA in Scotland. They must check a representative sample of EPCs, with a minimum of 2% of all EPCs produced being checked. In 2016, 260,206 EPCs were produced, and 6,604 (2.53%) were checked (Delorme and Hughes, 2016). The checks repeat the EPC calculations using data on the register, most checks are desk-based. Assessors’ outputs are checked every six months. Poor performance can lead to targeted auditing, retraining, suspension, or being struck off (Delorme and Hughes, 2016).
The Scottish Government audits AOs on a 3-yearly basis to ensure compliance with the Operating Framework. In addition, AOs are obliged to complete and return annual reports to the Scottish Government, which were recently reviewed to include more detailed QA information in an effort to better understand the nature of audit failures, complaints, and other important information. Organisations failing to meet the terms of the Framework are subject to corrective action and may have their agreement terminated (Delorme and Hughes, 2016).
A similar approach is taken in England and Wales, where Accreditation Schemes hold responsibility for assuring the outputs produced by their accredited energy assessors. The government then audits the Accreditation Schemes to ensure quality standards are upheld (Delorme & Higley, 2020).
Random sampling of a percentage of total EPCs issued
Conducting digital audits on a statistically significant number of the total EPCs issued within a given timeframe (maximum one year)
Austria, Belgium (Brussels), Bulgaria, Czechia, Estonia, Malta, Romania, Scotland, England and Wales
Random sampling of a percentage of EPCs per assessor
Conducting digital audits on a statistically significant number EPCs issued per assessors issued within a given timeframe (maximum the last year)
The Netherlands
Random sampling – per assessor and per total of EPCs issued
Conducting both audits on a random sample of a percentage of total EPCs issued and a random sample of a percentage of EPCs per assessor
France
Two-tiered approach to digital QA
Additional targeted audits conducted. These are identified either by errors flagged during the random sampling or by specific citizen complaints of non-compliance
Belgium (Flanders and Wallonia), Germany, Denmark, Spain, Finland, Greece, Croatia, Cyprus, Hungary, Luxembourg, Lithuania, Latvia, Ireland, Poland, Portugal and Sweden
Table 5: Overview of the approaches to QA audits in EU MS.
Digital screening systems
Some member states have adopted a digital system that automatically screens EPC input data before an EPC is issued. The Portuguese EPC database does this, and flags inconsistencies detected to prevent the input of incorrect or inconsistent data. An EU-level interviewee stated that implementing a mechanism like this limits the amount of QA that is required at later stages of the process.
This study found that all member states are conducting a statistically significant number of random sampling audits as per the requirements of the EPBD. Some member states collate a random sample by sampling a percentage of the total number of EPCs, which is the approach taken in Scotland. Others collate a sample of EPCs by sampling a percentage of EPCs per assessor. France reported conducting a two-tiered random sampling QA approach, conducting audits on both a random sample of total EPCs issues and on a percentage of EPCs per assessor.
Several member states reported that a second phase of targeted audits forms part of their QA procedures. These audits are carried out on EPCs whereby inconsistencies are identified during the random sampling auditing phase. Moreover, targeted audits are conducted in some member states where instances of non-compliance are reported. An interview with an EPC expert in Belgium (Flanders) highlighted that a system has been implemented, whereby citizens can notify complaints of non-compliance which can also lead to targeted audits.
It is understood that Slovakia is also conducting random sampling audits, although the nature of these audits is unknown. Moreover, Italy has reported that the approach to QA is implemented at regional level, resulting in variation. The literature review did not identify QA approaches for Slovenia.
A compliance study published by the European Commission in 2015 conducted analysis on the strength of the compliance checking systems implemented in EU member states. The analysis found that Belgium (Wallonia), Cyprus, Denmark, France, Italy and Lithuania had very robust compliance checking systems. Estonia, Latvia, Malta, Poland, Slovakia and Spain were found to have the lowest strength of EPC compliance checking systems (European Commission, 2015).
Public awareness and compliance
A Danish EPC expert we interviewed reported that the high strength and quality of EPCs in Denmark could be linked to high levels of public awareness and acceptance of EPCs and their benefits. It is believed that Danish homeowners have a strong understanding of EPCs and the benefits they can bring in raising property sale prices. This has resulted in higher levels of compliance and a desire to have high-rating EPC certificates.
On-site quality assurance audits
Mandatory on-site inspections were introduced in the 2024 recast version of the EPBD. Therefore, the data collected as part of this literature review may not reflect these most recent requirements and any subsequent changes to Member State QA regimes.
Approved organisations are responsible for carrying out QA checks in Scotland, and the majority of checks are desk-based. This is similar to the approach taken in England and Wales, where Accreditation Schemes are responsible for QA checks. However, Some member states (such as Belgium, Bulgaria, Cyprus, Denmark, Hungary and Ireland) conduct on-site audits alongside digital audits. In the majority of member states, these are carried out where inconsistencies are identified during the digital random sampling audits (as in Denmark[9]) or where specific citizen complaints or reports of non-compliance are received (as in Belgium (Flanders)9). Moreover, as in Ireland9, specific risk factors such as multiple infractions per assessor or an assessor publishing an abnormally high level of EPCs result in on-site audits being conducted. This is because on-site audits can provide a more detailed understanding of the accuracy of the data reported. Auditors can see the properties of the building in person, allowing for an extra level of QA[10]. In a few cases however (as in Cyprus), experts do on-site sample checks to verify data (MECI, 2020).
Approach to assessor infractions
In Scotland, poor performance by assessors can lead to targeted auditing, retraining, suspension, or being struck off. However, this is at the discretion of Approved Organisations. Accreditation Schemes hold similar responsibilities in England and Wales. All member states implement some kind of penalty system for assessors to minimise the risk of producing incorrect or invalid EPCs. member states have different levels of penalties for assessors, which are dependent on the severity of their infraction. For some, including Ireland and Latvia, this is quantified using a penalty points system (BPIE, 2014). In both member states, the penalties range from requiring the assessor to undertake corrective training to a temporarily or permanently suspended licence (BPIE, 2014). In Ireland, points on an assessor’s portfolio last for 2 years before they are removed from the record (SEAI, 2016). In other member states, the level of penalty appears to be linked to the severity or number of errors. Common approaches to assessor infractions are detailed below.
Reissue of an EPC – Assessors may be required to reissue a correct EPC at their own cost, usually within a certain timeframe. This is one of the most common practices amongst member states. This occurs in member states including Austria, Belgium (Wallonia), Bulgaria, Cyprus, Czechia, Denmark, Spain, Finland, Croatia, Lithuania, Malta, Portugal and Slovenia. In Finland, the penalty sometimes requires the original assessor to pay for a different assessor to carry out the re-certification (TU Wien, 2021).
Training – Assessors may be required to undergo corrective training. For example, this approach is used in Belgium (Wallonia), Ireland, and Latvia. In the case of Belgium (Wallonia), the assessor must also pass an exam in order to continue carrying out EPC assessments (Fourez et al., 2020).
Monetary fines – The majority of member states have monetary fines in place, the value of which is usually dependent on the perceived severity of the error. The value of monetary fines can vary greatly within and between member states. Examples of values are shown in Table 6.
Member state
Value of fines for assessors
Belgium (Flanders)
€250 – €5000 (TU Wien, 2021)
Germany
Up to €15,000 (TU Wien, 2021)
Estonia
Up to €6,400 for an individual or €64,000 for an organisation (Ministry of Economic Affairs and Communications et al., 2020)
France
Up to €1500 (Deslot et al., 2020)
Greece
€200 – €10,000 (CRES, 2020)
Italy
€300 – €10,000 (Azzolini et al., 2020)
Portugal
€500 – €700 (Kranzl, 2020a)
Romania
€250 – €2000 (Kranzl, 2020a)
Table 6: Table showing the value of fines imposed on EPC assessors when errors are found in certain EU MS.
In some member states, monetary fines are technically possible but not imposed in practice. This includes Bulgaria (SEDA, 2020), Czechia (BPIE, 2014), and Estonia (Ministry of Economic Affairs and Communications et al., 2020). Monetary fines are very rarely used in Germany (BfEE, 2020). In Cyprus and Portugal, monetary fines are only possible if the EPC assessor does not reissue the EPC in the required period (MECI, 2020; Fragoso and Baptista, 2016). In other member states, monetary fines are only imposed if the errors surpass a certain threshold. For example, in Croatia an assessor must have produced more than three incorrect EPCs to face a monetary fine (MCPP, 2020), and in Hungary the energy class must be wrong by at least two classes for the assessor to face a monetary fine (Jenei et al., 2020). In Poland, assessors only face monetary fines if the error is quantified at more than 10%, or if they use incorrect technical assumptions in their methodology (Kranzl, 2020a; Bekierski et al., 2016).
No evidence was found that Austria, Denmark (Energistyrelsen et al., 2020), Ireland (BPIE, 2014), Lithuania (Encius, 2016), Luxembourg (Worré et al., 2020), Latvia (BPIE, 2014), Malta (Degiorgio and Barbara 2016), Sweden, and Slovakia impose monetary fines on assessors.
Suspension or withdrawal of accreditation – In Scotland, poor performance by assessors can lead to penalties including suspension or withdrawal of accreditation at the discretion of Approved Organisations. Accreditation Schemes in England and Wales also have discretion over applying such penalties to assessors. In many member states, assessors can face temporary or permanent loss of accreditation to carry out EPC assessments as a result of infractions. This is the case in Belgium (Flanders) (TU, Wien, 2020; Kranzl, 2020a), Belgium (Wallonia) (Fourez et al., 2020), Cyprus (BPIE, 2014), Czechia (BPIE, 2014), Finland (TU Wien, 2021), France (BPIE, 2014), Greece (TU Wien, 2021), Croatia (Mardetko-Škoro, 2015), Hungary (Jenei et al., 2020), Ireland (BPIE, 2014), Lithuania (Encius, 2016), Luxembourg (Worré et al., 2020), Latvia (BPIE, 2014), and Poland (BPIE, 2014).
In a number of member states, the length of the suspension is dependent on the severity of the infraction. For example, in Greece assessors can face suspensions of between one and three years, depending on the severity of the mistake (TU Wien, 2021). In Croatia, assessors can lose their accreditation if they submit more than three invalid EPCs (Mardetko-Škoro, 2015). In Hungary, assessors can lose their license for three years if errors result in EPCs changing by more than 2 energy classes (Jenei et al., 2020).
In other member states, suspension or withdrawal of a license is only imposed if a threshold is passed. For example, in Ireland, if an assessor submits more than 10 incorrect EPCs in two years, they can be suspended for between 3-12 months (BPIE, 2014). In Latvia, if an assessor has more than seven points on their portfolio they face suspension of six months, and if they have more than 10 points on their portfolio, they face suspension of 12 months (BPIE, 2014). In Denmark, EPC assessors are employed by certified organisations, and the organisations can lose their accreditation in the case of repeated errors from their assessors (Energistyrelsen et al., 2020).
Use of administrative fees and levies
This section explores fees and levies implemented by Member States charged to assessors for the registration or lodgement of EPCs. It does not include fines implemented for assessor registration or fines associated with assessor infractions.
EPBD requirements
There is no requirement in the EPBD for what administrative fees or levies Member States can charge to assessors for EPC lodgement or registration. Therefore, Member States have taken different approaches in whether they choose to implement such a fee or its value.
Member state approaches
Scottish approach
Scotland has implemented a fee for the lodgement of EPCs of Existing Domestic Buildings and Non-Domestic Buildings in Scotland. The value of the fees varies based on the nature of the building. The Energy Performance of Buildings (Scotland) Regulations 2008 outline that the fee associated with a domestic EPC is £2.60, whereas the fee associated with a non-domestic EPC is £12.60. The revenue generated from these fees is ring-fenced to support the effective operation and maintenance of register systems. (Scottish Government, 2017).
Country
Description
Examples of Member State adoption
No administrative fee
Member State does not charge an administrative fee to assessors
Austria, Belgium, Bulgaria, Croatia, Czechia, Cyprus, Estonia, France, Finland, Greece, Hungary, Italy, Luxembourg, Latvia, The Netherlands, Poland, Romania, Slovenia, Slovakia, Spain, Sweden
Administrative fee in place with no ringfencing
Member State does not ring fence revenue for specific purpose
Malta
Administrative fee in place with ringfencing of revenue
Member State ring fences revenue for EPC-related purposes, which can include maintaining the EPC registry or QA procedures, for example
Ireland, Portugal, England and Wales, Germany, Lithuania, Denmark
Table 7: Table showing the approaches taken to charging administrative fees and levies to assessors
Member state EPC regimes can be partly or fully financed through their lodgement or registration fees, in combination with other fees such as annual assessor registration fees. For example, the EPC system in Ireland was intentionally designed to be cost-neutral (BPIE, 2014). In countries that don’t charge specific administration costs, Borragán and Legon, (2021) report that this fee can also be indirectly covered by the overall EPC assessment price. However, in most cases, Member States rely partly or fully on public funds to support their EPC systems. The amount of public funds used to finance EPC systems can amount to as much as several million euros every year in some Member States (Loncour and Heijmans, 2018).
Lodgement fee value
Whilst the majority of Member States have not implemented fees or levies for issuing or publishing individual EPCs, Ireland, Malta, Lithuania, Portugal, Germany and Denmark have, as have England and Wales (BPIE, 2014). The value of these fees varies between the Member States. Although Malta has the highest fee for domestic EPCs at €75, it doesn’t appear for the other Member States that the size of the Member State or the number of EPCs they issue directly correlates with the value of the fee.
Germany, Lithuania and Malta charge one fee for all EPCs, whereas Denmark, England and Wales, Ireland and Portugal outline different fees for domestic and non-domestic EPCs. In all cases where a different fee is charged, the fee associated with a non-domestic EPC is higher than the fee for a domestic EPC. In England and Wales, the difference is very small, but in Denmark, Ireland and Portugal, the fee associated with a non-domestic EPC is at least double the value of the fee for a domestic EPC.
Table 8: Table showing the fees associated with lodgement of domestic and non-domestic EPCs in the Member States and England and Wales
Use of revenue generated
In the following Member States that have adopted a fee for registering and publishing EPCs, the revenue generated is ring-fenced and used for EPC-related purposes.
Ireland – the SEAI uses the revenue to make investments back into the EPC programme, such as by developing, upgrading or replacing the systems and increasing the resources to support assessors, industry, and the wider public through the EPC Helpdesk and quality assurance system[15].
Portugal – the revenue generated from the fees is used to support daily technical support to the experts, IT infrastructure and developments, quality assessment and enforcement, awareness and communication.[16]
Germany – the registry budget is supported through the fees for lodging EPCs (BPIE, 2014)
Lithuania – part of the revenue raised from the EPC lodgement fee is used to finance quality assurance of EPCs (Encius and Baranauskas, 2016).
Denmark – the fee charged by DEA in covers work carried out by DEA concerning the necessary supervision of the scheme. It involves taking EPCs out for quality control, handling complaints, but also answering general questions about the EPC scheme, developing and maintaining the IT systems (the EPC database, etc.), and the contact with the educational institutions for the training of EPC assessors[17].
England and Wales – the revenue generated from these fees is ring-fenced to pay for the technical team that run the register for the fees, as well as policy and operations salaries. Moreover, the revenue generated funds any technical running costs associated with the lodgement of EPCs as well as any opportunities identified for “register improvement”[18].
In Malta however, the money generated from the lodgement fee is not ring-fenced for any specific purpose. It joins other sources of revenue and then funding is allocated where and as necessary[19].
Enforcement mechanisms
This section investigates how member states ensure that the requirement to present an EPC for a building at the point of sale/rental is enforced.
EPBD requirements
Article 20 of the recast EPBD (European Commission, 2024) mandates that digital EPCs must be issued for buildings or building units when they are:
Newly constructed or have undergone major renovation.
Sold to a new owner.
Rented to a tenant (or a rental contract is renewed).
An existing building owned or occupied by public bodies.
It also requires that the EPC must be shown and handed over to prospective tenants or buyers at point of sale or rental. There are some exceptions to this, for example, when the building is only intended to be used for less than four months of the year or has an actual energy consumption of less than 25% of the expected annual energy consumption.
Member state approaches
Scottish approach
Failing to issue EPCs when marketing a property for sale or for rent can result in enforcement actions. Penalties, outlined in the Energy Performance of Buildings Regulations (Scotland) 2008, are £500 for residential dwellings and £1000 for other cases. Local Authorities are the nominated Enforcement Authorities and hold the duty to uphold EPC regulations within their jurisdictions, so are therefore responsible for issuing fines. Local Authorities can also consider criminal action (Delorme and Hughes, 2016).
The Scottish Government does not have a clear picture of the scale of enforcement activity undertaken by the Local Authorities and are currently engaging with all 32 local authorities to gain more detailed information on enforcement in practice.
In England and Wales, local authorities are responsible for enforcement and hold powers to request that copies of an EPC are produced for inspection. They also hold powers to decide the appropriate course of action to enforce compliance, which can include a range of actions from providing compliance advice to issuing a penalty (Delorme & Higley, 2020).
Only a small number of member states have a vigorous mechanism for ensuring EPCs are available at the point of rental or sale (European Commission, 2015) and availability of enforcement rate data is often low. In most of these member states, checks are made by notaries during the sale transaction, which is thought to be an effective system (European Commission, 2015). However, as rental agreements are often less formal, ensuring EPCs are made available here is more challenging. It is thought that ensuring the EPC is signed off by a lawyer in the rental agreement is a good way to address this problem (European Commission, 2015). However, rental agreements are often less formal and do not always involve a legal professional, meaning that the systems in place for enforcement can be less developed in the rental sector than they are for sales. This often results in lower compliance rates or poor data availability in the rental sector. However, in Hungary for example, it is a requirement that a legal professional signs off on rental agreements. They are then responsible for checking the presence of EPC documentation.
The member states found to have the highest level of compliance rates with requirements for new, sold and rented buildings, as well as the highest strength of EPC compliance checking systems, are Belgium (Wallonia), Cyprus, France, Italy, Lithuania and the UK (this study was conducted when the UK was an EU Member State). Latvia and Poland were found to have the lowest compliance rates, coupled with the lowest strength of EPC compliance checking system (European Commission, 2015).
Monetary fines
The majority of member states impose monetary fines on building owners if they fail to present a valid EPC at the point of sale or rental. The cost of fines vary within and between member states, as shown in Table 9.
Member state
Value of fines for building owners
Austria
Up to €1450 (OIB, 2020; Arbeiterkammer Oberösterreich, 2024)
Belgium (Flanders)
€500 – €5000 (Kranzl, 2020a)
Belgium (Wallonia)
€500 – €1000, which can double if the same individual or organisation reoffends within three years (TU Wien, 2021; Fourez et al., 2020)
Czechia
100,000 Czech Koruna (CZK) (€3979), up to 200,000 CZK (€7958) for apartment buildings (Mečíccrová, 2021)
Germany
Up to €10,000 (Olschner, 2024)
Spain
€300 – €6000 (TU Wien)
Greece
€200 – €2000 (TU Wien, 2020)
Croatia
5000 Hrvatska Kuna (Croatian Kuna) (HRK) – 30,000 HRK (€662 – €3976) (StanGRAD, n.d.),
Italy
€3000 – €18,000 (Azzolini et al., 2020)
Lithuania
Up to €289 (Encius, 2016)
Portugal
€750 – €7500 (Kranzl, 2020a)
Table 9: Table showing the value of fines imposed on building owners when EPCs are not presented at required times in certain EU member states.
In most member states, it is unclear what type of infraction results in a higher level of fine for building owners. However, in Spain there are clear guidelines: simple faults result in fines of €300 – €1000, while serious faults can result in fines of up to €6000 (TU Wien, 2021). Serious faults include knowingly falsifying data or having an EPC assessment performed by a non-accredited assessor (TU Wien, 2021). In Finland, the level of fine is dependent on the type of building for which an EPC was not presented, or for the size of the municipality in the case of public buildings (Ministry of the Environment of Finland & Motiva Oy, 2020).
Use of notaries in enforcement
In some member states, notaries or lawyers involved in the sale or rental process are liable for ensuring EPCs are presented when necessary and are also liable for monetary fines if EPCs are not presented. This is the case for lawyers in Hungary, who are required to sign-off the EPC included in a rental agreement (European Commission, 2015). Similarly, notaries in Portugal are required to notify the relevant authorities if an EPC is not presented at the point of sale and can be fined between €250 – €3500 for failing to do so (Kranzl, 2020a). Notaries may also be fined in Belgium (Wallonia), for failing to notify the authorities of an absent EPC at point of sale or rental (TU Wien, 2021).
Affordability of EPCs
This section discusses any action that member states take to ensure that EPCs are affordable.
EPBD requirements
Article 19 of the EPBD requires that member states “take measures to ensure that EPCs are affordable and shall consider whether to provide financial support for vulnerable households.” The EPBD does not require member states to provide any price caps or subsidies, although some member states have chosen to do so.
Little information was found on interventions taken by member states to provide financial support for households requiring EPCs, nor the ability of citizens in member states to pay for EPCs assessments. Therefore, the following discussion focuses on EPC pricing and price controls in member states.
Member state approaches
Scottish approach
The price of EPCs in Scotland is controlled by the market. Research in 2016 showed that indicative starting costs were £35 to £60 (€40 – €70) for residential EPCs and £129 to £150 (€150-€175) for non-residential EPCs. This includes the registration fee payable each time an EPC is recorded on the register (Delorme and Hughes, 2016). There is no cap on EPC prices, and affordability is not actively managed by the Scottish Government.
Price-caps
The majority of member states have not imposed any price limitations on the cost of EPCs and rely on the market to control the affordability of EPCs. However, three member states have imposed price regulations, as detailed in Table 10:
Member state
Details of price cap on EPC cost
Slovenia
€1.5 / m2 for residential buildings up to 220m2, €2 / m2 for residential buildings over 220 m2, and €1 – €4 /m2 for apartment buildings (between 5 and 51 dwellings) (BPIE, 2014). The total cost is also capped at €170 for one and two-dwelling buildings (Kranzl, 2020a).
Hungary
An EPC for apartments and single-family homes is capped at €40 (+VAT) (Kranzl, 2020a; Jenei et al., 2020). There is no legally defined price for an EPC in non-residential or public buildings (Jenei et al., 2020).
Denmark
EPCs in 2024 are capped at €1,067 for a single family house. For larger buildings, the price for EPCs is subject to the market[20].
Table 10: Table showing the price caps on the cost of an EPC assessment in various MS.
Greece and Croatia used to have price caps which have since been abolished (TU Wien, 2021). In Croatia, the price cap was introduced when there were few EPC assessors in the market which caused prices to increase. When more EPC assessors were accredited, the price cap was removed, and EPC prices are now effectively controlled by the market[21].
While the price caps imposed generally have a positive impact on building owners who face the costs of EPCs, the price caps are commonly criticised for being too low and having resulting impacts on the quality of the certificate produced. For example, in Hungary, there are concerns that the price cap is set unrealistically low which results in lower quality EPCs (Jenei et al., 2020). Similarly, in Croatia, it is thought that the low price cap resulted in the recommendations of energy efficiency measures included in the certificate being of poor quality (Sayfikar & Jenkins, 2024). In Demark, it is thought that competition within the market keeps EPC prices much lower than the price cap, as average prices for single family houses is reported to be around €66720,suggesting the price cap is not necessary here.
Member states which have not imposed price caps have been criticised for average EPC costs being too high. For example, in Bulgaria the average price of an EPC is estimated at €0.2–€1/m2, which is thought to be relatively high for the average EPC consumer in Bulgaria (Sayfikar & Jenkins, 2024). This, alongside low public awareness of EPCs, is thought to be a reason why only around 1% of residential buildings in Bulgaria have an EPC (BPIE, 2018). Appendix F shows a summary of estimated EPC costs across member states, however it is important to note that this data comes from a variety of sources with different publication dates. Some figures have also been subject to exchange rates from local currencies. As a result, price data between member states is not necessarily comparable.
Other measures to ensure affordability
Member states who have not imposed price caps have often not done so to reflect the true cost of an EPC calculation. The cost can vary greatly according to various factors, including the type and complexity of a building and the quality of existing data (TU Wien, 2021). For example, in Czechia the average cost of a standard EPC is thought to be between 3000 – 7000 CZK (€119 – €278). This is because many buildings in the country are old and do not have much existing documentation or data (Mečíccrová, 2021). These buildings require an on-site visit from a specialist assessor, which can increase the cost of an EPC to tens of thousands of CZK (Mečíccrová, 2021).
While no other member states actively control the price of their EPCs, some have introduced other methods of promoting affordability. For example, in Belgium (Wallonia) the EPC methodology is kept as efficient as possible to keep costs down (Fourez et al., 2020). In the Netherlands, the government imposed a system to minimise costs in which building owners first receive a temporary EPC, which is calculated using existing data on a property (e.g. building type, data of construction, insulation, and heating and energy systems). The building owner can then change or add information (alongside proof such as photographs), which is then approved by an assessor. The assessor then recalculates the EPC and uploads it to the national database (Kranzl, 2020a). This process is thought to minimise on-site visits and time spent by assessors, and minimise the final cost of an EPC.
Case studies
After we conducted our review of the approaches taken to operational governance of EPCs in the EU member states, we selected three countries of interest to the Scottish Government. These were countries with approaches which could have the potential to improve the current operational governance procedures in Scotland. The countries we selected were Belgium, Croatia and Ireland.
Full case studies are presented in Annexes B-D, however, an overview of the main findings from each case study is presented in Table 11 – Table 15.
Country
Overview of governance model
Belgium
EPCs are governed by authorities at the regional level. This is the Flemish Energy and Climate Energy Agency (VEKA) in Flanders, the Department of Energy and Sustainable Buildings in Wallonia and The Brussels Environment Office in Brussels.
Croatia
The Ministry of Physical Planning, Construction and State Assets (MPGI) is responsible for the implementation of the EPBD including EPCs, the ICS and accrediting independent experts. The Ministry of Economy, Market Inspectorate is responsible for ensuring EPCs are correctly advertised during the sale or lease of a building.
Ireland
The EPBD Implementation in Ireland is coordinated by senior officials of the following bodies with sufficient authority to make decisions and allocate resources: Department of Environment, Climate and Communications, Department of Housing, Local Government and Heritage, and the Sustainable Energy Authority of Ireland (SEAI). The SEAI is responsible for administering the EPC scheme, which is called a Building Energy Rating (BER) scheme in Ireland. SEAI also govern the registration and performance of BER assessors.
Table 11: Overview of the main findings from each case study: Overview of Governance Model
Country
Affordability
Belgium
In Wallonia, EPC prices have been actively controlled by designing a short certification process to reduce costs. This reduced costs from €480 to €240 for single-family houses from the early stages of the scheme to 2020. In Flanders, the price of EPCs is regulated by the market. Prices range from €195 for a small apartment to €345 for a 5-bedroom house. No evidence was identified for Brussels.
Croatia
The price of EPCs was capped at €1.5 / m2, but this requirement was removed in 2014 and the price is now controlled by the market. The average price for an EPC is reported at around 200.00 EUR for an apartment and 380.00 EUR for a house.
Ireland
The price of a BER assessment is controlled by the market, meaning it can vary based on the supplier and size of a building. Prices are approximately €150 in apartments, while the cost for a standard house is between €200 and €300. Moreover, a levy of €30 is in place for the publication of a Domestic BER Certificate.
Table 12: Overview of the main findings from each case study: Affordability
Country
Minimum qualifications, training and accreditation for EPC assessors
Belgium
In Flanders, education pre-requisites are needed to assess certain building types. All assessors undergo training which varies based on the type of buildings they will assess. Assessors sit a central exam, and annual re-training is mandatory.
Wallonia has a flexible pathway to eligibility and accept either education or professional experience. Assessors attend a five and a half day training course and complete both an oral and written exam. There are no requirements for continuous professional development.
Brussels has subject-specific education requirements for all assessors, who must also sit a 5-day training course and complete an exam. There are no requirements for continuous professional development.
Croatia
Assessors must have both specific higher education qualifications and at least five years of work experience in the profession or two years of work experience in design and/or expert construction supervision.
They must then complete a two-week course, followed by a written and practical examination. Every year, assessors must attend eight-hours of training to upgrade their skills.
Ireland
Assessors are required to either hold an NFQ level 6 certificate in a construction-related disciplines or equivalent (demonstrated by a combination of appropriate construction-related qualifications or relevant experience). Assessors must also complete an accredited Domestic BER Training Course and achieve a minimum of 70%. Continuous professional development is obligatory for all BER assessors.
Table 13: Overview of the main findings from each case study: Qualifications, training and accreditation
Country
Auditing, verification and QA
Belgium
Flanders use a combination of random sampling and targeted audits, which include on-site audits on a less frequent basis. A citizen complaints system can trigger a targeted review.
Wallonia has a digital ‘control web’ which automatically screens all EPCs submitted and flags inconsistent data or values. Audits are conducted on a randomly selected statistically significant sample of the total number of EPCs submitted.
Brussels conducts audits on a yearly basis and reviews 1.5% of total EPCs issued. Refresher training is mandatory for accredited experts who make frequent mistakes.
Croatia
As of October 1, 2017, EPCs can only be issued using the Information System of Energy Certificates (lEC).
All EPCs go through administrative checks when uploaded to the EPC database. A random sample undergo more detailed checks, as well as EPCs which have received a complaint. Detailed checks are performed on the contents and accuracy of the EPC report, the input data, and the recommended energy efficiency measures.
Assessors are penalised when EPCs are found to be invalid. Penalties include warnings, re-issue of the EPC at their own cost, and having accreditation revoked. Monetary fines are possible but are rarely used in practice.
Ireland
Ireland conducts audits on both a targeted and random basis. Targeted audits are mostly desk-based reviews, but on-site audits are also conducted when certain risk factors are met. Training audits are also carried out for newly qualified assessors.
The SEAI have implemented a penalty point system, whereby the level of penalty imposed on assessors depends on the severity of the assessor infraction. The nature of these penalties ranges from corrective training to the permanent suspension of the license.
Table 14: Overview of the main findings from each case study: Auditing, verification and QA
Country
Enforcement
Belgium
In Flanders, the responsibility for enforcing the requirement to display an EPC at the point of sale lies with VEKA, although notaries are required to check the existence of an EPC. An administrative fine exists for notaries is possible in the case that a sale or rental is made without the existence of an EPC, but these have not been administered to date. A fine of minimum €500 can be administered to building owners for not displaying an EPC at the point of sale.
In Wallonia, minimum fines of €500 can be issued to building owners who do not present an EPC at the point of rent or sale.
In Brussels, the BEO are responsible for enforcement. Estate agencies repeatedly reported as non-compliant face fines or potential imprisonment.
Croatia
If building owners fail to produce an EPC at the point of sale or rental, they can receive fines between 662 – 3,976 EUR.
Ireland
The solicitor managing the sale of the property is responsible for checking the presence of an EPC at the point of sale. Failure to present a BER certificate at the time of rental or sale can result in financial or judicial penalties, with fines ranging from €500 to €5,000. Criminal records and prison sentences are also a possibility. Compliance with the requirement is higher with property sales than with property rentals.
Table 15: Overview of the main findings from each case study: Enforcement
Conclusions and options for Scotland
Our research has shown that a range of different approaches are applied in the EU member states to enable effective EPC governance. There is limited data available to evidence the effectiveness of the various approaches taken, making it difficult to determine the impact that each approach has on the overall quality of EPCs in each Member State.
To address this gap, we conducted interviews with EPC professionals in member states of interest to understand their opinions on the perceived effectiveness of the approaches they have adopted. We have established a list of potential options which could improve the operational governance of EPCs in Scotland based on evidence collected in the review of approaches taken in the EU member states, targeted interviews and case studies. The options are presented in Table 16.
Option
Rationale
1
Include standardised training requirements for independent experts in the operational framework
Many member states have standard requirements at a national level to ensure that independent experts have the necessary skills and training. As the Scottish Government currently delegates responsibility for training and certifying assessors to the AOs, there may be variations in the standards across the country.
2
Develop standardised QA procedures for AOs in the operational framework
QA procedures in Scotland are the responsibility of AOs, who are responsible for checking a representative sample of EPCs. However, many member states go beyond the random sampling approach to guarantee the quality of EPCs. A more stringent QA approach could be standardised in the Operating Framework to ensure higher quality EPCs across Scotland. For example, a digital system that screens EPC data or targeted audits based on certain risk factors.
3
Establish requirements for stakeholders involved in the rental and sales processes to support enforcement of the requirement to present an EPC
Enforcing the requirement to present an EPC at the point of sale/rental is difficult for the majority of member states. Those that are enforcing this successfully rely on notaries to check the presence of an EPC as part of the sales process. Although notaries are not generally involved in house sales in Scotland, considering different options for encouraging stakeholders to check the presence of an EPC at the point of sale could result in higher compliance rates in Scotland: for example, formalising the requirement for solicitors involved in sales processes to check whether EPC documents have been presented. For rentals, various options could be explored further to encourage stakeholders to check for compliance.
Table 16: Options for Scotland to improve their operational governance of EPCs
Options have not been assessed for feasibility of implementation in Scotland, or for potential long-term impacts. There is an opportunity for additional research, if the Scottish Government wish to explore any of these options in further detail.
Each of these options are outlined below, with a series of sub-options which outline how each overarching option could be operationalised in practice. These options are not mutually exclusive and could be implemented in conjunction with each other.
Including standardised training requirements for independent experts in the operational framework
Sub-option 1a – Introduce standard education and qualification requirements into the operational framework
This could include requirements for higher education and/or relevant professional experience. However, the flexible approach adopted in Bulgaria, Denmark, Estonia and Ireland ensures that independent experts can access via multiple routes. In Scotland, this could mean that experts must either:
Hold a National Vocational Qualification (NVQ) Level 3 or other similar (as required in England and Wales) or,
Demonstrate they hold an equivalent level of experience, which could be in the form of another qualification alongside proof of significant industry experience.
Requirements could also be tailored by assessor type. For example, higher education is only required for EPC assessors who conduct EPCs for new buildings in Belgium (Flanders).
Although AOs in Scotland may be using similar pre-requisites for independent experts, these are not standardised and may vary by AO. Ensuring that requirements are clearly defined in the operational framework will reduce ambiguity in requirements and ensure standardisation across the country.
Sub-option 1b – Approve a standardised mandatory training programme for independent experts
This can be delivered by AOs, but the content should be regularly updated and approved by the Scottish Government to ensure independent experts have skills which are aligned with the most recent developments in the sector.
This could be combined with an examination and, on passing, certification proving the independent expert has attended and taken on board the content of the training modules.
Sub-option 1c – Introduce requirements to attend mandatory annual re-training
In addition to a Scottish Government-approved training module for assessors, the Scottish Government could approve an annual retraining course for assessors. Mandatory retraining for assessors to keep their license would ensure assessors are up to date with the latest developments in the field and present an opportunity to learn from and correct mistakes. The approach taken in Belgium (Flanders) could be adopted, where retraining includes both mandatory modules (which cover common errors or new developments in the field) and optional modules, tailored to the assessor type and/or any infractions identified for that assessor in the previous year.
Develop standardised QA procedures for AOs in the operational framework
Sub-option 2a – Develop a digital QA system and screening of EPC input data
To streamline current QA procedures, a central digital system could be developed that screens and sense-checks EPC input data for errors. For example, when an independent expert conducts an assessment, they can input data into a digital system which will flag when they have input data which falls outside an expected range. An example of this approach is the digital ‘control web’ in Belgium (Wallonia), which screens all submitted EPCs to flag inconsistent values or data.
Sub-option 2b – Establish a ‘Helpdesk’ function to receive complaints about EPCs
Some member states, including Croatia and Belgium (Flanders) operate a helpdesk function, which customers can use to submit complaints or report suspected non-compliance. This could be introduced in Scotland and co-ordinated by central government at a national level, with complaints being redirected to the relevant AO for further investigation.
Sub-option 2c – Targeted audits of EPCs based on specific risk factors
In addition to the minimum random sampling required by the EPBD, best practice among member states is to combine this sampling with more targeted audits in a two-tiered QA approach. The approach taken in Ireland and Belgium (Flanders) is that certain risk factors, such as assessors issuing a large number of EPCs, or a complaint from a customer, trigger a targeted audit. These can be desk-based or on-site, but the Operating Framework could clearly outline what risk factors trigger a particular follow-up audit.
Sub-option 2d – Outline a clear penalty system for assessor infractions
A penalty points system, which clearly outlines what infractions result in what penalties, could be outlined in the operational framework to ensure that all assessors and AOs are clear about the penalties which will be issued in identified cases of non-compliance. Linking infractions to points and setting a maximum number of points would result in the suspension of their accreditation.
Penalties for assessors should be developed alongside a standardised and regular training schedule. Working with assessors, by providing regular and up-to-date training opportunities, gives them the opportunity to refresh their training. It also allows repeat issues to be targeted in dedicated training sessions and would ensure assessors remain engaged and interested in the process.
Engage wider stakeholders in the rental/sales process to support enforcement of the requirement to present an EPC
Sub-option 3a – Formalising the requirement for solicitors to check EPC documentation at the point of sale
The European Commission’s 2015 compliance study reported that member states generally struggle to enforce the requirement to make EPCs available at the point of sale or rent and data availability on compliance rates is often low. member states that are enforcing this in a robust manner rely on notaries to conduct checks during the sale transaction (European Commission, 2015).
Solicitors are responsible for checking documentation during a property sale in Scotland. Formalising the requirement to check the presence of an EPC at the point of sale as part of a legal checklist could result in greater enforcement of this requirement in Scotland.
Sub-option 3b – Requirements for stakeholders in the rental market to check EPC documentation
Rental agreements often do not involve a legal professional in the process, so they cannot be targeted in the same way as sales (European Commission, 2015). Hungary was the only country we identified that required a legal professional to sign-off on all rental agreements. Generally, this means that the systems in place to enforce these requirements are less developed in the rental sector, resulting in lower compliance or limited data availability on compliance rates.
Various options could be explored as to how this requirement could be enforced in the rental market. These could include:
Requiring that a legal professional signs off on all rental agreements in Scotland
Formalising the requirement to present an EPC when registering on the Scottish Landlord Register
Introducing compliance measures for estate agents, such as legal obligations or linking compliance to incentives such as green financing
Encouraging estate agents to use the Helpdesk function to report instances of non-compliance
References
Alembic Research, Energy Action Scotland and Dr Patrick Waterfield (2019) A review of domestic and non-domestic energy performance certificates in Scotland. Available at: A Review of Domestic and Non-Domestic Energy Performance Certificates in Scotland: Research report for the Scottish Government, Heat, Energy Efficiency and Consumers Unit – Final Report (www.gov.scot)
Ministry of Construction and Physical Planning [MCPP] (2020). Implementation of the EPBD Croatia, Status in 2020. Available at: http://bpes.ypeka.gr/?page_id=21
Schoenherr (n.d.). Slovenia: Energy Performance Certificate (EPC) – Additional Burden on Real Properties’ Owners or Welcomed Measure? Available at: https://www.schoenherr.rs/uploads/tx_news/schoenherr_Slovenia_Energy_Performance_Certificate__EPC_.pdf
We conducted a literature review using key search terms and Boolean operators where relevant, to maximise the search outputs and refine results. We used key search terms including: ‘Energy efficiency in buildings’, ‘EPC’, ‘Implementation’, ‘[Name of Member State], in combination with each of the following terms ‘Legislation’, ‘Governance’, ‘Independent Control System’, ‘Assessors’, ‘Accreditation’, ‘Audit’, ‘Verification’, ‘Assurance’, ‘Enforcement body’, ‘Enforcement mechanism’, ‘Affordability’.
We conducted searches in English and in the official language of the MS in question, using machine translation software DeepL. We used Google and Google Scholar to conduct searches.
Data extraction into summary database
When we identified relevant data sources, we reviewed them in full and extracted relevant information into a summary database (Annex A). The summary database was structured with a row for each MS and Scotland (28 total) and columns representing an area of interest for the research. These included:
Key data sources used for the country in question.
Governance model.
Qualifications and training for EPC assessors.
Auditing, verification and QA of EPCs.
Enforcement of EPC requirements.
How affordability of EPCs is ensured.
Case studies
Based on the outputs of the literature review, we selected three case studies of interest, which adopted different approaches to that currently taken in Scotland for the operational governance of EPCs. These were jointly selected with the Scottish Government. The three final case studies selected were:
Belgium
Croatia
Ireland
We first drafted each case study from the outputs of the literature review, and the enhanced them with targeted consultation with experts from the MS in question.
Targeted interviews
We held eight interviews with key stakeholders to supplement this research, as well as an additional interview with a Scottish Government representative to better understand the operational governance. These consisted of:
Two interviews with overarching EU-level EPC experts.
One email-based interview with a Danish EPC expert.
Two interviews with Irish EPC experts.
One interview with a Belgian EPC expert from Belgium (Flanders), and one email-based interview with an expert from the Walloon region (representatives from Brussels were contacted, but either did not respond or were unavailable to participate in this research).
One interview with a Croatian EPC expert (additional interviewees from Croatia were contacted, but either did not respond or were unavailable to participate in this research).
One interview with a Scottish EPC expert.
In most cases, the country-level EPC experts worked on EPC regimes within national governments.
Case study limitations
We conducted this research on a relatively short timescale (between April and July 2024). The collected data was used to derive policy options for improving the operational governance of EPCs in Scotland. A detailed assessment of the long-term impacts of these policy options, including analysis of uncertainties associated with future scenarios and feasibility constraints, was not within scope of this project.
Appendix F Table of estimated EPC costs in member states
Member state
Estimate EPC cost
Austria
Average of €400 (Netherlands Enterprise Agency, 2021)
Belgium (Brussels)
Gap
Belgium (Flanders)
Prices range from €195 for a small apartment to €345 for a 5-bedroom house (Certinergie, n.d.b).
Belgium (Wallonia)
Single family house average of €480
Apartment average €165 (Fourez et al, 2020)
Bulgaria
€0.2 – €1 per m2 (BPIE, 2014)
Cyprus
Gap
Czechia
3000-7000 crowns, tens of thousands of crowns if an energy specialist is required to visit (Mečíccrová, 2021)
Germany
Single family home average of less than €100
If an on-site inspection is required, this is €300 – €500 (Olschner, 2024)
Denmark
EPCs in 2024 are capped at €1,067 for a single family house. However, competition makes the price lower – currently around €667. For larger buildings the price for EPCs is subject to a free market. For larger buildings the price for EPCs is subject to a free market[22].
Estonia
Average for existing house of €100 – €300 (Hang.ee, 2022)
Spain
Average price of €60 – €130 for a 50-100m2 building (Arroyo, 2024)
Finland
Small houses average of €300 – 400 (existing) and €200 – €300 (new)
Terraced houses and apartments average of €510 (existing) and €450 (new) (Motiva, 2024)
France
Average of €100 – €250 (Berard, 2023)
Greece
Gap
Croatia
Capped at €1.5 / m2 (BPIE, 2014)
Hungary
Price is regulated for apartments and single family homes at €40 + VAT (Jenei et al, 2020; Kranzl, 2020a)
Ireland
Apartments average of €150
Standard house average of €200 – €300 (Citizens Information, 2024)
Italy
Average of €150
Lithuania
Between €100 – €500 (Encius, 2016)
Luxembourg
Between €500 – €1000 (RTL Today, 2014)
Latvia
Gap
Malta
Gap
The Netherlands
Average of €255 (Netherlands Enterprise Agency, 2021)
Poland
Between €40 – €1300 (Bekierski et al., 2016)
Portugal
Average of €200 (Netherlands Enterprise Agency, 2021)
Romania
Gap
Sweden
Average for a single family house of €500 (BPIE, 2014)
Slovenia
Price is regulated at €1.5 / m2 for residential buildings up to 220m2 and €2 / m2 for over 220 m2, and €1 – €4 / m2 for apartment buildings (depending on number of dwellings) (BPIE, 2014)
There’s also a cap of €170 for one-dwelling and two-dwelling buildings (Kranzl, 2020a)
Slovakia
Average of an apartment (60m2) of €200
Average of a single family house (220m2) of €250
Average of small apartment building of €1000 (Schoenherr, n.d.)
While every effort is made to ensure the information in this report is accurate, no legal responsibility is accepted for any errors, omissions or misleading statements. The views expressed represent those of the author(s), and do not necessarily represent those of the host institutions or funders.
In most cases, the EPC experts consulted work on EPC regimes within national governments. ↑
The UK devolved governments follow the approach agreed in the UK when the EPBD was transposed into domestic regulation in 2008, when the UK was an EU Member State. ↑
The literature review did not identify pre-requisite requirements for Spain, Latvia and Slovakia ↑
The literature review did not identify training requirements for Czechia, Spain, Latvia and Slovakia. ↑
Although Accreditation Schemes can ensure that energy assessors hold the right skills by requiring them to attend a training course and to sit an examination, it appears that assessors can also demonstrate suitable qualifications and experience in place of sitting this exam, so it may not be mandatory in all cases. ↑
The literature review did not identify re-certification requirements for Cyprus, Spain, Greece, Hungary, Italy, Latvia, Malta, The Netherlands, Poland, Sweden, Slovakia and Scotland ↑
We did not identify approaches to QA of EPCs for Slovenia. Italy has adopted a region approach to QA and Slovakia has adopted random sampling, but we did not identify a sampling approach. ↑
Information obtained during an interview with an EPC expert ↑
Information obtained during an interview with an EPC expert ↑
Information obtained during stakeholder consultation with a Danish EPC expert ↑
Information obtained during stakeholder consultation with a German EPC expert ↑
Information obtained during stakeholder consultation with a Maltese EPC expert ↑
Information obtained during stakeholder consultation with a Portuguese EPC expert ↑
Information obtained during stakeholder engagement with an Irish EPC expert ↑
Information obtained during stakeholder consultation with a Portuguese EPC expert ↑
Information obtained during stakeholder consultation with a Danish EPC expert ↑
Information obtained during stakeholder consultation with an EPC expert in England and Wales ↑
Information obtained during stakeholder consultation with a Maltese EPC expert ↑
Information obtained during an interview with an EPC expert in Denmark ↑
Information obtained during an interview with EPC experts from Croatia ↑
Information obtained during interview with Danish EPC Expert ↑
The agriculture policies outlined in the Update to the Climate Change Plan (CCP) provide a route map for agricultural transformation, to reduce greenhouse gas emissions. They take a co-development approach and work with stakeholders and farmer-led groups to secure increased uptake of low-emission farming measures through new schemes and approaches.
This project examined the potential reductions in livestock methane emissions through breeding, and the policy levers that could motivate these changes.
We began by exploring the technologies that detect and measure methane, manage data and are used in the breeding process. This included considering the availability of these technologies in Scotland in 2030 and 2045, with practical considerations for a Scottish context, and identifying the breeding traits that can lead to lower methane emissions.
We then identified the relevant policy levers and behaviour changes and considered what Government, the post-farm market, pre-farm gate actors and farmers can do differently to encourage methane reductions through breeding.
Key findings
By 2045, breeding could reduce methane emissions from the digestive process in livestock, known as enteric methane, by up to 9.5% (382.2 kt CO2 equivalent). This is under the “Policy changes” scenario, where legislation will require farmers to introduce methane reducing breeding techniques to their herds (with uptake rates of 100% in dairy, 80% in beef, and 60% in sheep).
This includes a 6.8% reduction in emissions from beef, 6% from dairy and 17.5% from sheep.
This reduction is achieved by selecting traits for methane efficiency (methane production, intensity and yield), feed efficiency, offspring carcass weight, milk yield and milk fat and protein when choosing breeding stock.
Our research highlighted selective breeding for feed efficiency as a promising option. This is because, despite its lower methane reduction potential, it builds on a practice that is already well understood by farmers.
To achieve emission reductions, actions and behaviour changes will be required of Government policymakers, pre- and post-farm gate actors and farmers. We found key barriers were lack of knowledge and perceived cost.
Scotland has a well-developed research base around breeding livestock for reduced emissions, placing it in good stead to develop further work in this area. Funding could be targeted towards building on this research, with more data points to support innovation and enhance the robustness of results. Further research could include the potential for a specific methane reduction target to increase clarity and focus action. Funding would be useful if targeted to better communication of the research findings to inform farm advisers, pre- and post-farm actors and supporting farmer peer-to-peer learning. Collaboration between stakeholder groups will achieve greater progress.
Relevant technologies include methods to detect and measure enteric methane in animals, data management, reproductive technologies and genomics. Those that could be mainstream in Scotland by 2030 include a national breeding programme, sexed semen and the breeding potential of an animal for a specific trait, known as estimated breeding values. The interaction between technologies is key to success. For instance, the wide use of data management tools will depend on the wide use of genomics to collect data.
We found very few instances of methane detection methods being used on farm in the UK. We therefore believe it is unlikely these will be used beyond research and innovators by 2045. As such, we recommend encouraging the use of proxies such as mid-infrared (MIR) spectra in milk to determine methane emissions.
Many reproductive technologies are already in use, particularly in the dairy industry, so we estimate these to be mainstream across the cattle sector by 2045. We estimate lower uptake in the sheep sector due to artificial insemination being a complex procedure. However, as sheep start breeding at an early age and often have multiple births per animal, there is greater potential for emission reductions if low-emitting traits are introduced into the herd such as through a ram.
On this basis, we think there is a strong foundation for breeding for reduced methane emissions to contribute to Scottish Government’s methane and climate commitments and to support Scottish livestock farmers’ future resilience.
Glossary / Abbreviations
AI
Artificial insemination
DNA
Deoxyribonucleic acid is an organic chemical that contains genetic information and instructions for protein synthesis
EBVs
Estimated breeding values
DMI
Dry Matter Intake
FAO
Food and Agriculture Organisation
Gene
A genetic sequence that contains information on specific traits.
Genetic modification
Any process by which genes are changed or deleted in order to adjust a certain characteristic of an organism. It is the manipulation of traits at the cellular level.
Genetic selection
Selecting for specific genes that carry desirable traits.
Genetics
The study of how genes are passed down from one generation to the next.
GHG
Greenhouse gas
CO2
Carbon dioxide
ICBF
Irish Cattle Breeding Federation
Methane
A powerful greenhouse gas, a chemical compound with the chemical formula CH4.
Microbes
Microscopic organisms
Microbiome
A collection of microbes (e.g. bacteria) that occur in the rumen.
NERC
Natural Environment Research Council
PAC
Portable Accumulation Chambers
Precision breeding
Amends sections of DNA by adding or moving genetic material
Proxy
An object/thing that is being used in the place of something else
REA
Rapid evidence assessment
Rumen
The specialised stomach of a ruminant (e.g. cow) that digests feed by microbial fermentation.
Ruminant
Animals, including cattle and sheep, that have more than one stomach and have the ability to bring food up from their stomach and chew it again.
Selective breeding
Choosing animals that carry desirable traits to be bred so that the traits are passed on to their offspring.
Traits
Specific characteristics that are genetically determined.
Introduction
Methane is a powerful greenhouse gas (GHG), 28 times more potent than CO2, produced as a by-product of the ruminant digestive process called enteric fermentation. During enteric fermentation, microbes digest feed in a specialised stomach, known as the rumen, subsequently releasing enteric methane. In 2021, enteric fermentation from ruminant livestock, such as cattle and sheep, was responsible for 48% of GHG emissions from agriculture in Scotland.
The UK signed the Paris Agreement, committing to limit global warming to 1.5°C and is a signatory of the Global Methane Pledge, aiming to reduce global methane emissions by at least 30% from 2020 levels by 2030. The Climate Change (Emissions Reduction Targets) (Scotland) Act 2019 outlines a net zero target for Scotland by 2045, with a 75% reduction in emissions by 2030. The strategy to meet these targets is laid out in Scotland’s Climate Change Plan (CCP) 2018-2032 and Climate Change Plan Update (CCPU).
One potential way to reduce emissions from the livestock sector is to select breeding traits in livestock that lead to lower methane emissions.
Traditional breeding programmes select cows or ewes producing offspring with desirable characteristics to either produce meat, milk or fibre, or to continue in the breeding herd. This method relies on waiting for the offspring to mature before the desired traits can be identified. The use of genetic technologies allows desired traits to be chosen at the point of breeding, giving a more assured outcome at an earlier stage.
Genetics are already used to facilitate precision breeding to improve livestock performance. As genetic changes are permanent and cumulative, it is an attractive option for targeting and reducing GHG emissions from ruminants (González-Recio et al., 2020; Manzanilla-Pech et al., 2021; Rowe et al., 2021).
Scottish research is at the forefront in breeding livestock for reduced methane. A recent project by the Roslin Institute highlighted the strong relationship between the rumen microbiome and methane emissions; SRUC has several relevant research studies (published and ongoing), with research facilities such as GreenCow measuring GHG emissions, and Moredun has researched the impact of livestock health and welfare on methane emissions. In 2023, Defra awarded £2.9 million to the sheep sector to launch ‘Breed for Ch4nge’ which aims to measure methane from 13,500 sheep to improve the efficiency of the UK flock; some of the research is taking place on Scottish farms.
The issue is of interest internationally. New Zealand research has shown that breeding for reduced emissions in sheep does not impact productivity and health; Canadian traders are marketing dairy semen with methane efficiency traits, and beef farmers in Ireland are being paid to take part in genomic programmes.
Please note, reducing methane through dietary amendments (such as feed additives) is out of scope for this project.
Project aims
This research project has two key aims:
To understand the methane emission reductions that could be achieved in Scotland through breeding. We do this by identifying technologies that detect and measure methane, manage data and are involved in the breeding process. We look at the likely availability of these technologies in Scotland in 2030 and 2045, with practical considerations. Finally, we identify the breeding traits that can lead to lower methane emissions and quantify these.
To identify what is needed to support this through policy levers and behaviour change. Using the findings of our literature review and stakeholder consultation, we suggest behaviour changes and discuss their impacts.
Identifying the evidence
To better understand where and how methane emissions could be reduced for project aim 1, we performed a Rapid Evidence Assessment (REA) and a series of stakeholder interviews[1] (now on referred to as our review) to understand:
The technologies involved in reduced emission breeding;
The important traits to select for reduced emissions;
Emission reduction values;
The benefits and challenges of breeding for reduced emissions;
The review also sought evidence on what is needed to support further uptake of these technologies in Scotland, for project aim 2.
The technologies involved in breeding for reduced emissions
We grouped the technologies used to identify livestock with low methane emissions into four categories: detection methods, data management, reproductive technologies and animal genomics.
We found little information regarding the timeline of availability for the technologies on farms in Scotland. In the stakeholder interviews, many were not aware of specific technologies being used unless they were directly involved in research. Our research did find international evidence, for example, portable accumulation chambers (PAC) in New Zealand support The Cool Sheep™ Programme. Due to this limited data on timing, we categorised the availability of the technology in Scotland in 2030 and 2045 under the following headings:
Experimental (E): used in research only, with no use on Scottish farms.
Innovative (I): used in trials on Scottish farms by a few innovators.
Mainstream (M): considered mainstream and being used on Scottish farms.
Future possibility (FP): unlikely the technology will be used by 2030 or 2045, however not ruling out its availability in the future.
Not applicable (NA): not relevant to the sector.
The rate of technology uptake will differ between and within sectors. For instance, dairy cattle are milked multiple times a day, providing an opportunity to closely assess individuals interacting with the technology. For the same assessment in the beef and sheep sectors, the grazing nature of the system may require cultural and habitual change for widespread uptake (Jones and Haresign, 2020). Farmers also have different interests, business structures, cash flow etc which impacts their decisions on changing farm practices.
Cost was excluded from our review due to the complexities in estimation. The cost of a technology is likely to depend on the individual farm situation, for example, the number of livestock or proximity to infrastructure or manufacturers. Technologies requiring installation may vary depending on whether adjustments are required to an existing building.
We understand the technologies presented below have the potential to be used in Scotland. The full list of technologies discovered in our research can be found in Appendix A, section 9.1.
Detection methods
Detection methods are used to detect and measure enteric methane to identify which animals emit less. Examples include a respiration chamber which measures the difference in methane emissions with and without the animal, while spot sampling uses head chamber systems or hand-held lasers to take short-term measurements from the animal’s breath (Tedeschi et al., 2022). Further examples can be seen in Table 1.
We found very few instances of detection methods being used in UK research, but we estimate that some will be available in 2030 and more by 2045 (see Table 1). However, as detection methods are primarily a research tool, it is unlikely they will be used beyond innovators by 2045. Practical constraints such as large technological components and measuring a few animals at a time make it challenging to introduce respiration chambers (which are considered the ‘gold standard’ of measurements) on a large scale (Manzanilla-Pech et al., 2021; Rowe et al., 2020). As such, we recommend encouraging use of proxies such as mid-infrared (MIR) spectra in milk to determine methane emissions.
Portable Accumulation Chambers (PACs) have been launched recently by scientists at Scotland’s Rural College (SRUC) for use across the UK. The two units (of 12 trailers) are currently only being used for research purposes. Each trailer holds 12 chambers and is capable of measuring between 60 – 80 sheep per day providing breeding values for methane emissions for representative samples of sheep within a breeding programme (Duthie et al., 2024)
New Zealand currently incorporates the use of PACs in breeding programmes through The Cool Sheep™ Programme, where breeders use PACs to measure and select for low-emitting rams available for breeding. Research trials are underway in countries such as Australia, Norway and Uruguay and now the UK. This technology provides a promising option for Scotland as it is transportable between farms and has a short measurement period which limits stress in livestock. However, current research trials on UK sheep systems need to be completed before PACs can be used widely (Duthie et al., 2024).
Data management
Data management technologies are essential to store, share and analyse data, while also tracking individuals and breeding lines with desired traits to improve target outcomes (including emissions reductions).
The dairy sector is advanced in this area compared to beef and sheep sectors, with established tools for monitoring and measuring production characteristics. Stakeholders discussed the possibility to enhance or repackage these tools and platforms, such as ScotEID, to incorporate methane traits. Using a tool that is familiar for farmers might reduce resistance for adoption.
Case study: New Zealand
N-Prove is a free website tool for New Zealand farmers to find the best rams for breeding. Using a series of buttons and slider scales, farmers can customise what traits they are looking for in a ram. NProve then generates a list of breeders with rams that best fit. Farmers can select terminal or maternal traits, as well as breeders based on location, breed and exclude certain flocks from results. Methane production is an option to select from the maternal traits. The tool is free to use and registration is not required. The tools anonymity means farmers can gather their options for the best breeder for their farm. NProve sources data from a central database and genetic evaluation service (SIL database) that holds information for more than 600 flocks, making it one of the largest genetic evaluations of sheep in the world. This tool could be used in a similar fashion for other species in other geographies as long as an appropriate database was available or was developed to source information.
Data technologies rely on wider infrastructure, such as website portals or cross-country collaboration, making it challenging to estimate the availability for 2030 and 2045. However, there is high potential. Stakeholders discussed that a risk for these technologies is the lack of interest and uptake from farmers, so it is important to inform and engage the industry regarding their benefits.
These technologies offer benefits for farmers by improving the understanding of the genetic qualities of their livestock and having a head-start on understanding the genetics and traits being brought into the herd. See Table 2 for the relevant data management technologies.
Table 1. Examples of the detection methods involved in breeding livestock for reduced methane emissions. Please see Appendix A, section 9.1 for the full list of the technologies found in our review.
Description
Livestock Sector
Data collected
Benefits
Risks
Timeline of availability in Scotland: Experimental (E), Innovators (I), Mainstream (M),
Future possibility (FP), Not applicable (NA)
Practical considerations in Scotland
Beef
Dairy
Sheep
Automated head chamber system (e.g. GreenFeed)
A head chamber unit that can be positioned in housing or pasture. Feed is used to attract livestock to the unit (van Breukelen, 2023; Zaman et al., 2021).
All
Methane and CO2 concentrations
Non-invasive.
Can be set up in grazing fields or in housing.
Portable
High purchase and running costs.
A spot measurement, not a true reflection of emissions per day.
Feed to attract livestock increases costs.
2030: E
2045: I
2030: E
2045: I
2030: E
2045: I
No evidence was found for use in the UK. It could be a feasible option for Scotland due to the benefits of transportability and ability to measure grazing livestock.
Mid-Infrared (MIR) data
MIR spectroscopy is used to predict the fat and protein content of milk. As methane is linked to milk composition, the latter can be used as a proxy to predict methane emissions (Dehareng et al., 2012; Semex, 2023).
Dairy
Milk components such as lactose, protein and fat
MIR technology is already used routinely in milk recording. Therefore providing an existing infrastructure to integrate methane reporting to.
Because it is a proxy, validation of results (for example with a respiration chamber) is required (Denninger et al., 2020).
NA
2030: I
2045: I
NA
No evidence found of MIR in the UK to estimate methane, but European examples were found. The data could become available through existing milk recording schemes, so it could be introduced by innovators by 2030. If the need for verifying results via detection methods is removed, this could be mainstream by 2045.
Portable accumulation chambers (PAC)
A portable respiration chamber which takes measurements over a short period of time (e.g. 1 hour) (Cummins et al., 2022).
All
Methane and CO2 concentrations
Quick measurement period reduces animal stress (Cummins et al., 2022).
Transportable (NZHerald, 2023).
Feeding and management protocols must be followed prior to measurements (Duthie et al., 2024).
Not suitable for long-term measurements (Cummins et al., 2022).
2030: E
2045: I
2030: E
2045: I
2030: E
2045: I
A promising option for Scotland as it is transportable between farms. SRUC recently acquired a PAC for sheep. However, current research needs to be completed before they can be used widely (Duthie et al., 2024).
Handheld lasers
A handheld device originally developed to detect gas leaks can measure concentrations of methane in livestock breath (Sorg, 2021).
All
Methane concentration
Non-invasive and portable.
Can take measurements from grazing livestock.
Can take measurements from several animals in one day.
Results can be sent to a smart phone (Sorg, 2021).
Has a lower accuracy, measurements are highly affected by environmental conditions (de Haas et al., 2021; Sorg, 2021).
2030: E
2045: I
2030: E
2045: I
2030: E
2045: I
No evidence found for use in UK research. However, the benefit of taking measurements from several animals in the same day may make it an attractive option for Scotland. Its widespread use may depend on supporting infrastructure such as reporting systems.
Table 2. Examples of data management tools involved in the process of breeding livestock for reduced methane emissions. Please see Appendix A, section 9.1 for the full list of the technologies found in our review.
Description
Sector
Data collected
Benefits
Risks
Timeline of availability in Scotland: Experimental (E), Innovators (I), Mainstream (M),
Future possibility (FP), Not applicable (NA)
Practical considerations in Scotland
Beef
Dairy
Sheep
nProve
A free tool for New Zealand farmers to use to choose rams for breeding. They can choose the terminal or maternal traits that fit their breeding goals. When choosing maternal traits, methane production is an option.
Sheep
Reproduction, lamb growth, size, meat, wool, health indices, methane production.
User friendly.
Farmers can choose rams based on location, breed and exclude certain flocks from results.
NA
NA
2030: FP
2045: I
Success requires genetic evaluation and measuring methane (via PAC) to be common practice. Existing tools such as ScotEID (records births, deaths, and movements), and RamCompare (presents performance recorded ram data), could be repackaged to incorporate methane production.
National breeding programme
A programme which plans and identifies breeding objectives, traits and information on selection criteria
All
Methane emissions
UK wide
To be successful at a national scale, significant data, cooperation and initial funding is required.
2030: M
2045: M
2030: M
2045: M
2030: M
2045: M
In 2023, The National Sheep Association began a 3-year initiative to measure methane from 13,500 sheep to incorporate production traits into breeding programmes. With progress like this, it is possible that national breeding programmes will be mainstream by 2030.
Multi-country database
An international database that contains data from many livestock (Manzanilla-Pech et al., 2021).
All
performance/ production (trait-related) records
A larger dataset
improves robustness (Manzanilla-Pech et al., 2021).
Combining data from different countries can be challenging due to differences in reporting, recording, technology, favoured breeds and management style (Van Staaveren e al., 2023).
Sharing genetic information between countries requires compliance with the Nagoya Protocol.
2030: FP
2045: FP
2030: E
2045: I
2030: FP
2045: FP
Due to data sharing challenges, it is unlikely this will be available by 2045 in this context. There may be progress in the dairy sector due to the use of methane indexes, e.g. in Canada and the international scope of many dairy processors.
Bull catalogues (e.g. Genus Bull search)
This index allows farmers to see the scores of certain traits in bulls.
Dairy, beef
One of these traits is called Feed Advantage which can identify bulls with the greatest feed conversion (ABS, 2023).
Farmers can choose bulls with the desired characteristics to use in breeding.
2030: M
2024: M
2030: M
2024: M
NA
These are already available for farmers to use, so we would estimate them to be mainstream by 2030.
Reproductive technologies
Reproductive technologies are directly used for breeding. With many already in use on Scottish dairy farms, we estimate that it is likely most will be mainstream in the cattle sectors by 2045. We estimate lower progress in the sheep sector reflecting the current low uptake. Stakeholders discussed the reasons for low uptake in the sheep sector are due to the extensive nature of sheep farming in Scotland and less infrastructure for sheep in this area, such as semen collection and storage, the availability of which determines uptake. In addition to this, artificial insemination (AI) in sheep requires a vet to perform a surgical procedure (in cattle it can be done by a qualified farmer), adding a practical and financial hurdle.
Table 3. Examples of reproductive technologies involved in the process of breeding livestock for reduced methane emissions. Please see Appendix A, section 9.1 for the full list of the technologies found in our review.
Description
Sector
Benefits
Risks
Timeline of availability in Scotland: Experimental (E), Innovators (I), Mainstream (M),Future possibility (FP), Not applicable (NA)
Practical considerations in Scotland
Beef
Dairy
Sheep
Artificial insemination (AI)
A technique to inseminate females, using fresh or frozen semen.
All
High success rate for cattle.
No requirement for a bull to be on the farm.
Better guarantee of uniform calving.
AI in sheep is often done by laparoscopic artificial insemination which is a surgical procedure done by a vet. Due to the scale and extensive nature of sheep farming, this brings practical challenges.
Relies on sufficient infrastructure to collect and store semen (Stakeholder comment, 2023).
2030: M
2045: M
2030: M
2045: M
2030: I
2045: I
AI is common practice in the dairy sector, with some use in the beef sector. It’s likely this will be mainstream by 2030 for cattle. Due to the practical challenges in sheep, it may still only apply to innovators.
Sexed semen
A method which allows control over the sex of the offspring by separating sperm cells based on their X or Y chromosome content. By focusing on females for example, there is the potential to reduce methane emissions by reducing the number of unwanted males (Duthie et al., 2024).
All
Increasing selection of females in the dairy sector improves productivity.
Success relies on the uptake of AI.
2030: M
2045: M
2030: M
2045: M
2030: I
2045: I
This is widely done in the dairy sector. Use in the beef sector is currently lower, however by 2030 there is the potential for this to be mainstream. Progress is determined by the uptake of AI in the sector. Due to the practical challenges associated with AI, it will likely remain an innovative practice in the sheep sector.
Conventional breeding
The use of bull/ram to cow/ewe breeding. Selecting cows or ewes producing offspring with desirable characteristics to remain in the breeding herd.
All
Minimal technical input.
Familiar practice for farmers.
Little control over selecting desirable traits.
Time intensive as it requires offspring maturity before seeing if they have the desired traits.
2030: M
2045: M
2030: M
2045: M
2030: M
2045: M
Already common practice for general breeding, so breeding for methane reduction could be mainstream by 2030.
Animal Genomics
Genomics is the study of the genome, a complete set of an organism’s DNA[2]. Genomics provides the opportunity to better understand how well an animal will perform based on its DNA profile. DNA and management both determine performance qualities, such as milk yield. Precision breeding (which is not genetic modification) amends sections of DNA by adding or moving genetic material. This has been used in the cropping sector to improve yields and/or disease resistance. In the livestock sector, research focusses on increased resilience to bovine tuberculosis and mastitis. In 2023, England introduced The Precision Breeding Act, outlining classifications for using precision breeding on crops and livestock, including how the products from them should be regulated, “Neither the Scottish nor Welsh Parliaments have granted legislative consent to the Bill.”.
Table 4. Examples of animal genomic technologies involved in the process of breeding livestock for reduced methane emissions. Please see Appendix A, section 9.1 for the full list of the technologies found in our review.
Description
Sector
Data collected
Benefits
Risks
Timeline of availability in Scotland: Experimental (E), Innovators (I), Mainstream (M), Future possibility (FP), Not applicable (NA)
Practical considerations in Scotland
Beef
Dairy
Sheep
Microbiome-driven breeding
Emphasis is on selecting livestock with a rumen microbiome composition which is more efficient at fermenting feed so producing less methane.
All
Rumen fluid samples – sequencing of microbial DNA.
Potential method for improving animal health and reducing environmental impact.
This is a relatively new field and much is unknown about how the gut microbiome develops and is maintained over time.
It is unclear how much influence the animal may have over those processes.
2030: E
2045: E
2030: E
2045: E
2030: E
2045: E
Good early signs but still at research stage.
Genomic breeding values (GEBVs)
Values that are based on information from livestock DNA and measured performance. Can be used with EBVs to improve accuracy of breeding programmes. (Meat Promotion Wales. 2013).
All
DNA and performance records.
Can be used to identify traits that
are difficult to record.
Beneficial for traits measured in only one sex.
Useful for accurately measuring traits that occur later in life (Scholtens et al., 2020).
Accuracy of the estimate is dependent on the number of animals included in the reference population (Scholtens et al., 2020).
2030: I
2045: M
2030: M
2045: M
2030: I
2045: M
GEBVs are currently available for a number of carcass traits in Limousin cattle in the UK (Business Wales, 2016) and offered by the genetic company Genus.
Estimated Breeding values (EBVs)
Calculated from the performance data of recorded animals. Environmental factors (e.g. feeding) are filtered out to provide a genetic value for each trait (Stout, D. 2021).
All
Performance records – parentage and traits of interest (e.g. weight traits).
Provides a more objective (data driven approach) towards selection.
Genetic selection based on EBVs leads to faster rates of genetic gain and flock improvement (compared to selection based on raw data or basic observation).
Allows comparisons within breeds, not between breeds.
2030: M
2045: M
2030: M
2045: M
2030: M
2045: M
Use as a tool to aid in the selection of healthy and structurally sound animals.
Traits
Traits are specific characteristics of an individual (physical or behavioural) that are influenced by genes and environmental factors. Understanding the traits that lead to lower methane emissions is key to a successful breeding programme for methane emissions reduction.
It should be noted that the breeding focus, and therefore traits selected, depends on the farmer’s goals. For example, breeding for breeding stock would focus on selecting offspring traits, such as calving or lambing ease, while farms producing fat or store stock would focus on product traits, such as increased liveweight gain (Stakeholder comment, 2023). Currently, most traits are associated with productivity, such as increasing milk yield in the dairy sector. Progress in the beef and sheep sectors has been much slower, with fewer examples found of genetics used in breeding programmes.
The traits in Table 5 are used for breeding in global research to reduce methane emissions directly and indirectly. We have categorised these traits into the following groups:
Production – offspring: Traits associated with reproduction.
Production – product: Traits associated with products from the animal.
Functional: Traits that underpin the function of the animal and are not specific to production or emissions improvements.
Climate: Traits directly linked to reducing methane emissions.
Stakeholders and the literature emphasised that selection for methane reduction traits should ensure production traits, such as health, are not compromised (Stakeholder comment, 2023; Llonch et al., 2017). To look into this further, we examined performance and methane efficiency data from SEMEX. For their Holstein bulls with above average methane efficiency scores, we could not identify any clear relationship between this trait and the other traits. However, this is only for one breed of cattle from one company.
Case study: New Zealand
Research in New Zealand genotyped low emitting sheep which identified traits that lead to reduced methane emission. The research found no negative impacts on physiology, productivity and health when selecting for reduced emissions.
Our research highlighted the importance of selecting for feed efficiency. Despite this trait having a lower methane reduction potential than others, it will benefit farmers through more efficient use of feed through better feed conversion (Stakeholder comment, 2023).
Table 6 presents the traits that were selected for further analysis, including quantification and the technologies used to detect or select them. Only a few of the traits found in our review were taken forward because some of the traits did not have robust emission reduction values, so were therefore excluded from our calculations.
Table 5. Traits included in breeding indexes around the world, split by sector and type.
Table 6. The quantifiable traits in each sector, with the technologies which can be used to detect or select them.
Technologies used to detect or select traits
Quantifiable traits in each sector
Beef
Dairy
Sheep
Feed efficiency
Offspring carcass weight
Methane production
Feed efficiency
Milk fat and protein
Milk yield
Methane intensity
Feed efficiency
Methane yield
Detection methods
Respiration chambers
X
X
X
Sniffers
X
X
X
SF6 tracer gas
X
X
X
Automated head chamber system
X
X
X
Mid-Infrared (MIR) data (proxy)
X
X
X
X
PAC
X
X
X
Handheld lasers
X
X
X
Rumen microbial composition
X
X
X
Feed efficiency index
X
X
X
Data management
Selection index theory
X
X
X
X
X
X
X
X
X
National breeding programmes
X
X
X
X
X
X
X
X
X
Multi-country database
X
X
X
X
X
X
X
X
X
Efficient Dairy Genome Project
X
X
X
X
Ram Compare
X
X
Bull catalogues
X
X
X
X
X
X
X
Reproductive technologies
Artificial Insemination (AI)
X
X
X
X
X
X
X
Conventional breeding
X
X
X
Animal genomics
Microbiome-driven breeding
X
X
X
X
X
X
Genomic breeding values (GEBVs)
X
X
X
X
X
X
X
X
X
Estimated Breeding values (EBVs)
X
X
X
X
X
X
X
X
X
Genotyping
X
X
X
X
X
X
X
X
X
Genetic markers
X
X
X
X
X
X
X
X
X
Quantifying the potential emission savings
We calculated the potential methane emission reductions under different traits for dairy, beef and sheep. Further information can be found in Appendix E.
The traits identified in our review (see Section 4.2) were further evaluated to assess their applicability to emission reduction calculations, based on requirements for defined quantification of methane emission values (either absolute or relative) and values to have a comparative emission baseline. A summary of the applicable traits used in the quantification calculations are presented in Table 7 below, with further information presented in Appendix E, Section 10.6.4.
Table 7. Traits used in the calculations of emissions savings
Sector
Trait Category
Trait Name
Unit of baseline
Value of methane reduction from baseline
Beef
Production
Feed efficiency
kg CO2e/kg product
7%
Offspring carcass weight
kgCO2e/per kg meat per breeding cow per year
1.3%
Climate
Methane yield
gCH4/kgDMI per generation
12%
Dairy
Production
Feed efficiency
kg CO2e/kg product
5%
Milk fat + protein
MJ CH4/kg milk
12%
Milk yield
kg CH4/kg milk
15%
Climate
Methane intensity
kg CH4/kg milk
24%
Sheep
Production
Feed efficiency
kg CO2e/kg product
7%
Climate
Methane yield
g CH4/kg DMI
35%
The current uptake of genetic traits focused on methane emissions is estimated based on our review and discussions with Scottish Government. This was based on an understanding on the currently uptake of AI and breeding technologies used within the sector from expert knowledge and limited research able to be found online. This rate provides a baseline for the quantification of additional uptake in 2030 and 2045 under four scenarios (further described in Appendix E, Section 10.6.4). The scenarios include: no additional intervention, voluntary uptake, supplier demand and policy changes. Scenario uptake percentages are presented with the current baselines in Table 8 below. These values were developed based on technical expertise and discussion with both stakeholders and Scottish Government, as well as published research. The impact of other traits (such as functional, health related traits) could not be estimated in this work as relevant values for methane reduction potential could not be identified in the literature. Further information in the calculation methodology, including additional detail on the selected scenarios, traits selected and limitations to the data is presented in Appendix E, Section 10.6.
Table 8. Scenario implementation values for dairy, beef and sheep
Type
Scenario
Current baseline
2030 uptake
2045 uptake
Dairy
1. No intervention
75%
80%
80%
2. Voluntary uptake
75%
80%
85%
3. Supplier demand
75%
82.5%
92.5%
4. Policy changes
75%
85%
100%
Beef
1. No intervention
40%
45%
45%
2. Voluntary uptake
40%
45%
50%
3. Supplier demand
40%
47.5%
65%
4. Policy changes
40%
50%
80%
Sheep
1. No intervention
10%
15%
15%
2. Voluntary uptake
10%
15%
20%
3. Supplier demand
10%
17.5%
40%
4. Policy changes
10%
20%
60%
Baseline enteric fermentation methane emissions for beef, dairy cattle and sheep in Scotland in 2021 (totalling 4,020 kt CO2e ), show beef cattle emitted the most at 59% (2,370 kt CO2e ), sheep emitted 26% (1,061 kt CO2e ), and dairy cattle 15% of (590 kt CO2e).
Our calculations found that methane focused traits (methane production/intensity/yield) presented the highest emission reductions for all livestock categories. As the impact of the interaction between traits are unknown, reductions from traits focused on feed efficiency, offspring carcass weight (beef specific) and milk yield, milk fat and protein (dairy specific) are not presented in the maximum reduction potential. However, we acknowledge that reductions for these traits were found within the three livestock categories. Results are presented in Figure 1, Figure 2 and Figure 3 below. These figures show that in each sector, up to 2030, the reductions are relatively steady, but there is a greater reduction at 2045, influenced by the proposed increase in uptake. Due to the proposed uptake percentages the policy change scenario presents the greatest reduction under all traits, with the no intervention scenario showing the smallest reduction due to a 5% increase in uptake in 2030 and no further uptake in 2045.
In the policy change scenario, choosing climate traits, we estimate that emissions would reduce in 2045 up to 382.2 kt CO2e or 9.5% of enteric methane emissions. This includes a 6.8% reduction from beef cattle (161.1 kt CO2e), 6% in dairy cattle (35.4 kt CO2e) and 17.5% in sheep (185.6 kt CO2e). Smaller reductions are feasible from traits focused on feed efficiency, offspring carcass weight (beef specific) and milk yield, milk fat and protein (dairy specific). Further details presented in Appendix E.
Figure 1. Methane emissions for beef cattle traits against the 2021 baseline enteric methane emissions of beef cattle in Scotland. Please note the y-axes do not start at zero to allow for greater visibility of results.
Figure 2. Methane emissions for dairy traits against the 2021 baseline enteric emissions of dairy cattle in Scotland. Please note the y-axes do not start at zero to allow for greater visibility of results.
Figure 3. Methane emissions for sheep traits against the 2021 baseline enteric emissions of sheep in Scotland. Please note the y-axes do not start at zero to allow for greater visibility of results.
Identifying policy drivers and behaviour change needs
This section examines actions to encourage behaviour change. We understand that behaviour change is needed by four stakeholder groups:
Government, which would be policy drivers
Post-farm gate market, such as supermarkets, wholesalers, caterers, hospitality etc
Pre-farm gate, such as livestock markets, breed societies
Farmers
We explored how actions taken by each stakeholder group can enable further behaviour change in the other groups, and present three national level case studies to show actions that promote breeding practices to reduce methane emissions. Examples from these case studies are dispersed through the report in text boxes where the surrounding information was relevant. The countries are as follows:
Ireland, which has incentivised and subsidised breeding practices.
Canada, which has incentivised and subsidised breeding practices.
New Zealand, which has started to take a regulatory approach and has incentivised breeding practices.
All three countries have strong research programmes supporting their policies.
Government action
Scottish Government have an important role in supporting uptake of new breeding techniques through policy. Below are policy drivers that can influence behaviour changes across the other stakeholder groups (post-farm gate market, pre-farm gate actors and farmers).
Legislation and targets
Setting a legal target for methane reduction in Scotland can help to shift the focus of the agricultural industry to methane emissions and align with climate commitments that have been made, such as the Global Methane Pledge at COP26. Other countries have set separate targets for biogenic methane, nitrous oxide, and carbon dioxide, such as New Zealand.
Case study: New Zealand
New Zealand aims to achieve net-zero emissions by 2050 and has a target to reduce biogenic methane by 10% relative to 2017 levels by 2030 and 24 – 47% by 2050. This ‘split-gas’ approach helped focus policy development and action, informed by strong research programmes and stakeholder dialogue. A split-gas approach can also give farmers flexibility to determine the most efficient, cost-effective mitigation practices for their farms (Stakeholder comment, 2023).
A methane target for Scotland could encourage constructive conversations among stakeholders about how to reduce emissions, leading to a higher uptake of relevant practices.
Financial incentives
The concept of breeding livestock for reduced methane emissions may be new for many farmers in Scotland. Methane emissions from ruminant livestock are viewed by many as a natural part of livestock farming, particularly in upland farming systems (Bruce, 2013). Therefore, the economic benefits of breeding for reduced methane emissions will need to be clearly demonstrated to farmers.
Cost was mentioned by some stakeholders as a barrier to selecting livestock based on lower emissions. However, there was little understanding of what the specific costs are. Given this, the perceived cost of adopting new breeding techniques might become just as significant as the barrier of cost itself. However, measuring methane from individual animals in a herd using the technologies in Table 1 is labour intensive and not widely available, which creates financial and labour bottlenecks (CIEL, 2023).
6.1.2.1 Subsidies
Some stakeholders believe that new policies could drive financial incentives (Stakeholder comment, 2023). For example, payments for using the technologies presented in section 4.1.
6.1.2.2. Specific funds incentivising measuring emissions
New Zealand supported a programme via funding to enable every stud ram breeder to use PAC chambers to measure emissions. This service was oversubscribed in 2023, indicating that the adoption of measurement techniques could be encouraged by government funding.
Case study: New Zealand
The Cool Sheep™ Programme, launched in 2022, is a three-year programme aiming to offer genetic selection to every sheep farmer in New Zealand to reduce GHG emissions. It gathers phenotype data to provide a methane breeding value which will be available on NProve. Breeders wanting to produce low-methane rams can measure a proportion of their flock using a PAC.
6.1.2.3. Research
All three case study countries have strong Government funded research programmes. The outputs from these informs the policies and actions designed to reduce emissions. Scotland is at the forefront of research on breeding livestock for reduced methane, so this just emphasises the importance of focussing research in this area.
Case study: Canada
Canada’s Agricultural Methane Reduction Challenge will award up to $12 million CD$ to innovators designing practices, processes, and technologies to reduce enteric methane emissions.
Education and advice
Effective communication around breeding for reduced methane and the climate benefits for reducing methane are essential to support uptake. Farmers are crucial stakeholders and while some may be confident in trialling new approaches, advice must be available to help all understand why and how to implement innovative techniques on their farm, manage their farm in a new system and where to ask for help (Stakeholder comment, 2023). Training could also be provided by the private sector.
Peer to peer learning is very successful as it provides an informal opportunity to ask practical questions of farmers who have already tried and hopefully succeeded.
Example: Northern Ireland farmers visit Scotland
As part of the Farm Innovation Visits, a group of dairy farmers from Northern Ireland visited farms in Scotland to see breeding technologies in practice, such as genetic reports and use of sexed semen.
Farm advisers would be essential to ensure consistent and clear messaging to farmers. Training and communication material could be provided for advisers through existing Government schemes such as the Scottish Farm Advisory Service.
Consumers should be made aware of the importance of reducing methane emissions and of the industry’s associated actions .
Behaviour change
Table 10 shows the outcome of our review on possible Government actions that could lead to behaviour change among farmers, the post-farm gate market and pre-farm gate actors. The three key actions we identified are 1) legislative targets for methane reductions, 2) financial incentives and 3) education and advice programmes.
Table 107: Behaviour changes caused by actions taken by Government
Government actions
Behaviour changes due to Government actions
Farmers
Pre-farm gate actors
Post-farm gate market
Legislative targets for methane emissions reductions
Provides a legislative backstop that must be met. Increased awareness of emissions helps farmers to visualise their emissions and select practices for adoption.
Provides a legislative backstop that must be met. Livestock markets and breed societies prompted to support farmers by providing information on emissions from animals.
Provides a legislative backstop, therefore retailers may encourage suppliers to take on low-emission breeding practices.
Financial incentives
Farmers are more likely to invest time and money in adopting breeding practices if they receive payments for their efforts or if (real and perceived) financial barriers are reduced.
Stronger demand from farmers to understand emissions from livestock will drive breed societies and markets to provide information about emissions.
If breed societies provide advice on reducing emissions from a herd, they could gain a competitive and possibly over time cultural advantage.
Reduced emission livestock products could be marketed for a higher price, aimed at more environmentally conscious consumers.
Risk: if government subsidies were already supporting farmers adopting emission reduction practices, retailers may be less incentivised to pay a premium price.
Education and advice programmes
Increased awareness and clarity on breeding practices to reduce emissions may encourage increased uptake.
Advisers will be able to influence farmers.
Increased awareness of low emissions products may influence consumers to buy food produced using low emission breeding strategies.
Risk: consumers will ask for one thing but often pay for something different
Post-farm gate market
The post-farm gate market includes supermarkets, farm shops, other retailers, consumers and food chain assurance schemes. It has an important role in supporting uptake of new breeding techniques through demonstrating demand and providing price signals. Using our review, we explored actions where the market can influence behaviour change across the other stakeholder groups.
Price signals
Stakeholders discussed the important role of supermarkets, retailers, hospitality businesses, and their suppliers and consumers as these groups can set standards for better prices or to meet customer/societal demands. For example, Tesco aims to be net zero from farm to fork by 2050 , Waitrose has committed to source only from net zero carbon farms in the UK by 2035, and Morrisons aim to be supplied by ‘Net Zero’ carbon British farms as a whole by 2030. Others along the supply chain may need to start to provide evidence of emission reductions as these different retailers and suppliers reduce their Scope 3 emissions, for example as outlined in the British Retail Consortium’s Net Zero Roadmap for the Retail Industry.
Validation of the claims through assurance schemes are important to ensure trust in the food chain. A stakeholder said, “if you take an animal to a ‘normal’ livestock market and claim it has reduced methane emissions, you’ll probably get the same price as any other animal regardless of the additional effort”.
Consumer demand
Consumers paying a premium price are likely to drive new practice adoption. Transparent communication about low emission breeding practices, supply chains and actions on farm is important to demonstrate to consumers the benefits of their choices and reduce the risk of ‘greenwashing’.
International example: Sweden
In 2022, methane-reduced beef was sold in Sweden. It was well received by consumers, selling out in less than a week. There was however backlash in the media with claims of greenwashing. This example emphasises consumers’ interests in climate-friendly options. while ensuring transparency.
Behaviour change
How the market influences other stakeholders is explored in more detail in Table 10. The key actions are 1) improved price signals from retailers and 2) increased consumer demand which is realised at the sales point.
Table 11: Behaviour changes caused by post-farm gate market actions
Post-farm gate actions
Behaviour changes as a result of post-farm gate actions
Government
Farmers
Pre-farm gate industry
Post-farm gate market retailers
Price signals from retailers
Similar to government financial incentives, farmers are more likely to invest time and money in adopting breeding practices if they receive payments for their efforts.
Risk: uptake by farmers could be inconsistent depending on which retailers adopt this action first.
Livestock markets or breed societies could display methane scores if they know this is something that farmers are looking for.
Retailers offering a premium for low-emitting products will encourage uptake of practices.
Marketing low-emitting products will raise awareness among consumers, possibly increasing demand for low-emission products.
Post farm gate actors own emission reduction targets to meet societal demand for low emission products will require farms to reduce emissions
Increased consumer demand for low emissions livestock products
Government may be encouraged to support low methane emissions breeding practices due to a higher demand.
Procurement guidelines for catering in Government funded facilities could include low methane emitting meat.
Increased demand for low emissions products may prompt adoption of practices.
Due to farming in Scotland not being solely driven by the market, consumer demand alone may not influence the pre-farm gate industry. Yet it may lead to actions that prompt further actions related to emission savings.
Increased demand for low-emission products will incentivise retailers and hospitality to provide these, possibly paying a premium to farmers.
Pre-farm gate actors
Pre-farm gate actors refers to industry representatives, levy groups, research institutions, breed societies, and livestock markets. They have an important role in supporting uptake of new techniques through increasing understanding and supporting data collection. Below are actions that can influence behaviour change.
Improving data and data sharing
A key infrastructure need is an accessible database of genetic information, including methane emissions, to enable benchmarking (Stakeholder comment, 2023). Stakeholders noted that farmers may struggle to envision new practices on their farms, and a database can help to conceptualise the traits.
Case study: New Zealand
The ram selection tool nProve provides a user-friendly platform to select required traits in a ram, including methane production.
Existing platforms already used by farmers, such as ScotEID, the Beef Efficiency Scheme (BES), and SRUC’s genetic tool EGENES could add new elements around methane (Stakeholder comment, 2023). For example, Nprove allows farmers to assess methane elements in a user-friendly way.
The Beef Efficiency Scheme (BES) required farmers and land managers to submit tissue samples and other metrics of their beef herd to develop an understanding of the genes within the herd to improve efficiency. Uptake from the industry was low, with only 30% of the national breeding herd participating in the scheme. It currently remains unclear in the literature if the captured data has been incorporated into any local breeding schemes or progressed following the end of the scheme. This scheme could provide valuable learning on the integration of positive genetic traits across the herd in Scotland.
In our review, a stakeholder commented that as only a handful of breeds make up most of the livestock sector in Scotland, the establishment of a database would not take long to create (Stakeholder comment, 2023). This comment however shows the lack of understanding that the genetic material for breeding for methane is independent of breed and based on individual animals.
Case study: Ireland
The Irish Cattle Breeding Federation (ICBF) launched the National Genotyping Programme (NGP) in 2023 to achieve a fully genotyped cattle herd in Ireland. The programme offers beef and dairy farmers a low-cost option to collect DNA samples from calves at birth. The collected information is used to identify specific traits which contribute to national genetic indexes, including methane traits. It also allows farmers to optimise the health and productivity of their herd, while reducing the emissions intensity. The ICBF further publish methane evaluations for AI sires when methane data has been recorded.
Ireland’s NGP and New Zealand’s N Prove provide examples of the development of national databases. In Ireland, the use of metrics like Residual Methane Emissions (RME) index and predicted transmitting ability (PTA) aim to provide an easy way of comparing livestock to the average and to other farmers. Stakeholders noted that a challenge in the Scottish context could be a reluctance by stakeholders to pool data. However this has been successfully achieved in the Scottish pig industry with a number of health and productivity benefits to the individual farmers and to the sector. The NGP also allowed for subsidising DNA sampling of calves which helps to genotype the national herd
Stakeholders discussed the potential for livestock markets to display information on methane emissions. In many markets, a screen displays the weight of the animal and the name of the seller; it could be possible to add the expected or benchmarked methane emissions.
Case study: New Zealand
A methane breeding value was launched in 2019 by Beef and Lamb New Zealand, giving the sector a practical decision making tool. This led to the development of The Cool Sheep™ Programme (see section 6.1.2).
Metrics for methane emissions
Stakeholders recommend adding methane as an estimated breeding value (EBV) as this would allow farmers to benchmark. Stakeholders emphasised that metrics would only be used if they are adopted consistently across Scotland (and perhaps the UK) with cross sector collaboration and there was some incentive for farmers to reduce methane emissions from their livestock. Similarly, to the adoption of RME and PTA figures in Ireland, regulation and guidance from Scottish Government would be advisable to make sure the most sensible metric was adopted.
Case study: Ireland
Residual methane emissions (RME) index is a metric to understanding the difference between the expected methane emissions based on feed intake and the actual emissions. High RME is undesirable and low RME is desirable.
ICBF methane predicted transmitting ability (PTA) values have been produced by recording methane emissions from over 1,500 animals from 19 breeds. These are publicly available for AI beef and dairy bulls. Bulls are classed as favourable or unfavourable compared with the average sire.
Behaviour change
The two key take-aways from our review are 1) improved data and data sharing amongst farmers, researchers and across stakeholders and 2) developing metrics for methane emissions to enable benchmarking between farmers and products. Table 12 describes how actions by pre-farm gate actors could support behaviour change among other stakeholders.
Table 12: Behaviour change due to actions taken by the pre-farm gate actors
Pre-farm gate action
Behaviour change due to pre-farm gate action
Government
Farmers
Pre-farm gate actors
Post-farm gate market
Improved data and data sharing
A database can inform policy.
Enables farmers to understand the emission reduction potential of their animals.
Displaying methane information at markets can help choose livestock based on emissions.
More data would support more robust research, thereby increasing the output of Scotland-specific research.
Markets around Scotland displaying methane data would raise awareness among farmers.
Better data would enable retailers to communicate sustainability data to customers, increasing trust in the food system.
Metrics for methane emissions
Scottish Government could ensure all relevant stakeholders are involved in developing a metric.
Metrics would enable farmers to make comparisons against individual animals when deciding which ones to breed or purchase.
Breed societies and livestock markets would be able to display methane emissions.
Breed society representatives can discuss options for reducing emissions.
Retailers have a consistent metric they can use to communicate the methane emissions of products to consumers.
Farmers
Farmer behaviour change in this context relates to choosing animals with low methane traits to breed, and implementing systems on farm that support this. Some farmers could measure emissions from their livestock to verify the effectiveness of breeding for reduced emissions. Uptake of technologies outlined in section 4 provides the opportunity to better track genetics and traits in their herd.
Farmers will need support to make these changes and to enable behaviour change from the pre-market, post-market and government stakeholder groups identified in the sections above. In addition, the adoption of new practices will likely vary between dairy, beef and sheep producers, and the challenges they face will be different. Farmers who are already using reproductive technologies, such as sexed semen and AI, are expected to progress fastest in this area, given their familiarity with the processes. It is likely that the dairy sector will lead the way, and to a smaller extent, the beef sector. Rapid uptake of AI (and therefore sexed semen) in the sheep sector faces practical challenges, therefore it may be best to prioritise low-emitting traits in rams.
The financial benefit of farmers selecting methane traits is currently unclear. It is likely that the primary motivation will come from the supply chain; it will be important to have specific supply chain indicators. For example, if a milk buyer sets methane reduction goals, suppliers will need to respond. Behaviour change is also influenced by seeing neighbours or peers taking on new practices for example. Below are some points for each of the different livestock sectors groups that should be considered to enable the behaviour change actions identified in the previous sections.
Cummins et al (2022) advise that further research is needed on how breeding for low methane emissions affects the productive and profitable genes that make an animal appealing to farmers. However, research in New Zealand on genotyped low emitting sheep showed no negative impacts on physiology, productivity and health when selecting for reduced emissions and preliminary economic analysis shows that low-emitting sheep could lead to higher profits, primarily due to higher growth rates, a greater proportion of meat, and increased wool production. This section also briefly covers some actions that could be undertaken on farm to support farmers to shift to breeding lower methane emitting livestock.
Sheep farmers
Sheep farmers deal with a large number of animals which tend to be farmed extensively in Scotland, so using methane detecting technologies is potentially more difficult than for other livestock sectors. Despite this challenge, the shorter time to slaughter means that low-emitting traits can be introduced regularly and methane reductions can accumulate quickly (Stakeholder comment, 2023). In addition, other countries such as New Zealand have implemented programmes to begin to measure the national flock such as The Cool Sheep Programme (see section 6.1.2). Stakeholders discussed how the sheep sector produces a lower-value product compared to the cattle sector, so cash flow may be a prohibiting factor in taking on new practices.
Beef farmers
Stakeholders asserted that the beef sector is complicated by several commercial interests in the market which influence genetic improvement. Unlike the dairy sector, AI is not widely used in the beef sector (Stakeholder comment, 2023). However, there are opportunities to influence the genetics of the herd by encouraging bull breeders or bull stud farms to take on practices to support low-emitting traits.
As it is common for dairy cow offspring to enter the beef system, there is the opportunity to use lower emitting dairy animals to feed into emissions reductions in the beef sector (Stakeholder comment, 2023).
Dairy farmers
The dairy sector is the most advanced ruminant sector in using genetic technology and tools for selective breeding. For example, AI is fairly common practice, currently with the objective of increasing productivity rather than targeting emissions. Progress in the sheep and beef sectors is much slower due to challenges around practicalities, sufficient data and uptake of technologies in these sectors. The dairy industry also has a steadier cashflow than beef and sheep (Stakeholder comment, 2023), and is more progressive when it comes to real-time data collection and data management. This puts the dairy sector in a good position to advance breeding for reduced methane emissions.
Cross-farm actions to support breeding lower methane livestock
Strong and structured communication, sharing of ideas and engagement locally are important drivers to enable behaviour change in farming communities. Peer to peer support, for example through breeding groups, to share ideas, showcase technologies and discuss successful and disappointing technologies will enable neighbours and other local farmers to progress faster. Organising local workshops, either by Government supported advisers or leading farmers, would help to spread the word about the importance of breeding for reduced emissions and provide practical examples. The more discussion about the overall aim, the need to reduce emissions, the potential actions, outcomes and successes, the more likely that breeding for reduced methane emissions will become mainstream.
Gaps in the research
We identified the following gaps in research:
Timeline of availability for the technologies. Due to a lack of robust information in many cases, we made an expert judgement on the availability of the technologies in Scotland up to 2030 and 2045.
Quantified impact of introducing methane traits in case study countries. We did not find evidence for the actions and policies introduced in the case study countries reducing overall country emissions. A reason for this is that many of the examples presented in the case studies in the appendices are very recent, therefore there has not been enough time to quantify the emission savings. In addition, it could be challenging to see whether these actions had a specific impact emissions due to other surrounding factors, for example changes in stocking rate, or outbreak in disease.
Evidence for current level of uptake in Scotland and the UK. The review did not find much evidence for current levels of uptake of breeding livestock for reduced emissions.
Mitigation potentials of some traits. Many sources did not present methane emission values, but instead covered genetic correlations between traits. This meant that due to a lack of data many of the traits identified in the REA (see Table 5) were excluded from quantification. In other cases, some mitigation potentials were not comparative to the baseline used in our study because it presented changes from an entire lifecycle or system.
The interaction between traits. Emission calculations were quantified for individual traits, rather than combining the mitigation potential for all traits because the relationship and interaction between traits is unknown.
Due to the smaller quantity of literature available on methane efficiency focused traits, the reduction potential values may be less robust. Greater consistency in measurement, modelling, and presentation and their impacts on emissions savings and animal production would fill this knowledge gap.
Conclusions
We estimate that, by 2045, breeding for reduced methane emissions could achieve a reduction in enteric methane emissions of 9.5% from the baseline, including 6.8% reduction from beef, 6% from dairy and 17.5% from sheep assuming livestock numbers remain constant. This would be achieved by selecting breeding traits for methane efficiency (methane production, intensity and yield), feed efficiency, offspring carcass weight, milk yield and milk fat and protein. Selecting for these traits brings cumulative and permanent emission savings. A limited number of studies researched the impacts of selecting low-methane traits on productivity and health and found that these qualities were not compromised.
Scotland has a well-developed research base around breeding livestock for reduced methane emissions, placing it in good stead in developing further work and providing validation and trust. Research programmes in New Zealand, Canada and Ireland have successfully interacted with farmers, for example, by the development of user-friendly, accessible tools. Our stakeholder comments implies that a comparable interaction between research and on-farm activities and innovation is currently lacking in Scotland.
To achieve the emissions reductions, actions and behaviour change will be required by four stakeholder groups: Scottish Government, pre- and post-farm gate industry and markets, and farmers. Change will need to be co-created across the stakeholder groups.
The financial benefit of farmers selecting methane traits remains uncertain. Therefore, it is likely that the primary motivation will be the supply chain which will need supply chain indicators. For example, if a milk buyer sets methane reduction goals, suppliers will need to respond. Behaviour change is also influenced by neighbours or peers taking on new practices.
The key barriers to uptake are around knowledge and perceived cost. To alleviate these, Government funding could be targeted towards more data collection and research with farmer involvement to improves robustness. Investment in adviser training and farmer peer-to-peer will enable local farmers to progress faster. Organising local workshops, either by Government supported advisers or leading farmers, would help to spread the word about the importance of breeding for reduced emissions and provide practical examples. The more discussion about the overall aim, the actions, outcomes and successes, the more likely it is that breeding for reduced methane emissions will become mainstream.
The technologies we estimate could be mainstream by 2030 include a national breeding programme, sexed semen, artificial insemination (AI) and estimated breeding values (EBVs). However, their success will be about but the interactions between them. For example, data will inform EVBs, which in turn will inform a national breeding programme. If the constant use of methane detecting technologies is required, this may be difficult to implement in extensive farming systems. However, if a proxy measurement was used or the breeding stock was known to provide the necessary traits, this would allow existing systems to continue.
On this basis, we think there is a strong foundation for breeding for reduced emissions to become part of Scottish Government’s commitments.
Alford, A.R., Hegarty, R.S., Parnell, P.F., Cacho, O.J., Herd, R.M. and Griffith, G.R., 2006. The impact of breeding to reduce residual feed intake on enteric methane emissions from the Australian beef industry. Australian Journal of Experimental Agriculture, 46(7), pp.813-820.
B+LNZ Genetics, 2023. Reducing methane emissions in New Zealand’s national sheep flock through genetic selection – The Cool Sheep™ Programme. Available from: https://www.blnzgenetics.com/cool-sheep-programme
Bell, M.J., Wall, E., Russell, G., Morgan, C. and Simm, G., 2010. Effect of breeding for milk yield, diet and management on enteric methane emissions from dairy cows. Animal Production Science, 50(8), pp.817-826.
Bruce, A., 2013. The lore of low methane livestock: co-producing technology and animals for reduced climate change impact. Life Sciences, Society and Policy, 9(1), pp.1-21.
De Haas, Y., Veerkamp, R.F., De Jong, G. and Aldridge, M.N., 2021. Selective breeding as a mitigation tool for methane emissions from dairy cattle. Animal, 15, p.100294.
Dehareng, F., Delfosse, C., Froidmont, E., Soyeurt, H., Martin, C., Gengler, N., Vanlierde, A. and Dardenne, P., 2012. Potential use of milk mid-infrared spectra to predict individual methane emission of dairy cows. Animal, 6(10), pp.1694-1701.
Denninger, T.M., Schwarm, A., Dohme-Meier, F., Münger, A., Bapst, B., Wegmann, S., Grandl, F., Vanlierde, A., Sorg, D., Ortmann, S. and Clauss, M., 2020. Accuracy of methane emissions predicted from milk mid-infrared spectra and measured by laser methane detectors in Brown Swiss dairy cows. Journal of dairy science, 103(2), pp.2024-2039.
Esrafili Taze Kand Mohammaddiyeh, M., Rafat, S.A., Shodja, J., Javanmard, A. and Esfandyari, H., 2023. Selective genotyping to implement genomic selection in beef cattle breeding. Frontiers in Genetics, 14, p.1083106.
González-Recio, O., López-Paredes, J., Ouatahar, L., Charfeddine, N., Ugarte, E., Alenda, R. and Jiménez-Montero, J.A., 2020. Mitigation of greenhouse gases in dairy cattle via genetic selection: 2. Incorporating methane emissions into the breeding goal. Journal of Dairy Science, 103(8), pp.7210-7221.
Hayes, B.J., Lewin, H.A. and Goddard, M.E., 2013. The future of livestock breeding: genomic selection for efficiency, reduced emissions intensity, and adaptation. Trends in genetics, 29(4), pp.206-214.
Hybu Cig Cymru – Meat Promotion Wales, 2013. Genetic markers in beef and sheep breeding programmes. Available from: https://meatpromotion.wales/en
Jones, H., Haresign, W. 2020. A review of current and new technologies for both genetic improvement and breed conservation of UK farm animal genetic resources. Produced by members of the Defra expert committee on Farm Animal Genetic Resources (FAnGR).
Jonker, A., Hickey, S.M., Rowe, S.J., Janssen, P.H., Shackell, G.H., Elmes, S., Bain, W.E., Wing, J., Greer, G.J., Bryson, B. and MacLean, S., 2018. Genetic parameters of methane emissions determined using portable accumulation chambers in lambs and ewes grazing pasture and genetic correlations with emissions determined in respiration chambers. Journal of Animal Science, 96(8), pp.3031-3042.
Llonch, P., Haskell, M.J., Dewhurst, R.J. and Turner, S.P., 2017. Current available strategies to mitigate greenhouse gas emissions in livestock systems: an animal welfare perspective. Animal, 11(2), pp.274-284.
Manzanilla-Pech, C.I.V., Gordo, D.M., Difford, G.F., Pryce, J.E., Schenkel, F., Wegmann, S., Miglior, F., Chud, T.C., Moate, P.J., Williams, S.R.O. and Richardson, C.M., 2021. Breeding for reduced methane emission and feed-efficient Holstein cows: An international response. Journal of Dairy Science, 104(8), pp.8983-9001.
Manzanilla-Pech, C.I.V., Stephansen, R.B., Difford, G.F., Løvendahl, P. and Lassen, J., 2022. Selecting for feed efficient cows will help to reduce methane gas emissions. Frontiers in Genetics, 13, p.885932.
Martínez-Álvaro, M., J. Mattock, Z. Weng, R. J. Dewhurst, M. A. Cleveland, M. Watson, and R. Roehe. 2022. “Part of the functional rumen core microbiome is influenced by the bovine host genome and associated with feed efficiency.” In Proceedings of 12th World Congress on Genetics Applied to Livestock Production (WCGALP) Technical and species orientated innovations in animal breeding, and contribution of genetics to solving societal challenges, pp. 324-327. Wageningen Academic Publishers, 2022.
Miller, G.A., Auffret, M.D., Roehe, R., Nisbet, H. and Martínez-Álvaro, M., 2023. Different microbial genera drive methane emissions in beef cattle fed with two extreme diets. Frontiers in Microbiology, 14, p.1102400.
Quinton, C.D., Hely, F.S., Amer, P.R., Byrne, T.J. and Cromie, A.R., 2018. Prediction of effects of beef selection indexes on greenhouse gas emissions. Animal, 12(5), pp.889-897.
Reid, A. and Wainwright, W., 2018. Climate Change and Agriculture: How Can Scottish Agriculture Contribute to Climate Change Targets.
Rowe, S.J., Hickey, S.M., Johnson, P.L., Bilton, T.P., Jonker, A., Bain, W., Veenvliet, B., Pilel, G., Bryson, B. and Knowler, K., 2021. The contribution animal breeding can make to industry carbon neutrality goals. In Proc. Assoc. Advmt. Anim. Breed. Genet (Vol. 24, pp. 15-18).
Rowe, S.J., Hess, M., Zetouni, L., Hickey, S., Brauning, R., Henry, H., Flay, H., Budel, J., Bryson, B., Janssen, P. and Jonker, A., 2020. Breeding low emitting ruminants: predicting methane from microbes. Multidisciplinary Digital Publishing Institute Proceedings, 36(1), p.177.
Scholtens, M., Lopez-Villalobos, N., Lehnert, K., Snell, R., Garrick, D. and Blair, H.T., 2020. Advantage of including genomic information to predict breeding values for lactation yields of milk, fat, and protein or somatic cell score in a New Zealand dairy goat herd. Animals, 11(1), p.24.
Tedeschi, L.O., Abdalla, A.L., Álvarez, C., Anuga, S.W., Arango, J., Beauchemin, K.A., Becquet, P., Berndt, A., Burns, R., De Camillis, C. and Chará, J., 2022. Quantification of methane emitted by ruminants: a review of methods. Journal of Animal Science, 100(7), p.skac197.
van Breukelen, A.E., Aldridge, M.N., Veerkamp, R.F., Koning, L., Sebek, L.B. and de Haas, Y., 2023. Heritability and genetic correlations between enteric methane production and concentration recorded by GreenFeed and sniffers on dairy cows. Journal of Dairy Science, 106(6), pp.4121-4132.
van Staaveren, N., Oliveira, H.R., Houlahan, K., Chud, T.C., Oliveira Jr, G.A., Hailemariam, D., Kistemaker, G., Miglior, F., Plastow, G., Schenkel, F.S. and Cerri, R., 2023. The Resilient Dairy Genome Project–a general overview of methods and objectives related to feed efficiency and methane emissions. Journal of dairy science.
Wellmann, R., 2023. Selection index theory for populations under directional and stabilizing selection. Genetics Selection Evolution, 55(1), p.10.
Worden, D. and Hailu, G., 2020. Do genomic innovations enable an economic and environmental win-win in dairy production?. Agricultural Systems, 181, p.102807.
Appendix / Appendices
Technologies involved in breeding for reduced methane, full tables
Table 13. Examples of the detection methods involved in the process of breeding livestock for reduced methane emissions.
Description
Sector
Data collected
Benefits
Risks
Timeline of availability in Scotland: Experimental (E), Innovators (I), Mainstream (M),
Future possibility (FP), Not applicable (NA)
Practical considerations in Scotland
Beef
Dairy
Sheep
Respiration chamber
A sealed chamber taking samples from an animal in a controlled environment. The animal is typically kept in the measurement chamber for a couple of days and is provided with food and water (Zaman et al., 2021).
All
Methane concentration
Believed to be the most accurate way to measure methane from livestock (Zaman et al., 2021).
Measurements taken over several days increases robustness (Manzanilla-Pech et al., 2021).
Restricts normal animal behaviour and movement (Zaman et al., 2021; Manzanilla-Pech et al., 2021).
High capital cost.
Limited to a few or one animal per chamber (Manzanilla-Pech et al., 2021).
2030: E
2045: E
2030: E
2045: E
2030: E
2045: E
Used in research facilities in Scotland, however there is limited scope to use them on farms due to the high cost (Stakeholder comment, 2023).
Sniffers
Non-dispersive infrared unit that can be installed in feeding areas or milking parlours (van Breukelen, 2023; de Haas et al., 2021).
All
Methane and CO2 concentration
Non-invasive, can be incorporated into existing milking technologies (de Haas et al., 2021).
Offers large scale recording (de Haas et al., 2021).
A spot measurement, not a true reflection of emissions per day.
Limited to indoor measuring (Cummins et al., 2022).
More difficult to introduce in beef and sheep sectors compared to dairy due to frequent milking.
2030: FP
2045: FP
2030: E
2045: E
2030: FP
2045: FP
In 2021 ‘the first’ was installed at a Dutch dairy farm for research (CRV, 2021). No evidence found for use on farms in the UK.
SF6 tracer gas
A tube containing sulfur hexafluoride (SF6) tracer gas is placed inside the rumen and collection lines are used to collect breath samples (Cummins etal., 2022).
All
Methane concentrations
Measurements can be taken from confined, free range, and grazing animals (Manzanilla-Pech et al., 2021).
Invasive measure which has animal welfare concerns (de Haas et al., 2021).
SF6 is a greenhouse gas itself (Tedeschi et al., 2022).
Daily canister collection means high labour (Cummins etal., 2022).
2030: E
2045: E
2030: E
2045: E
2030: E
2045: E
No evidence was found for use in UK trials and research, but it used widely in globally. It would be beneficial in Scottish research due to measuring livestock while grazing.
Automated head chamber system (e.g. GreenFeed)
A transportable head chamber unit that can be positioned in housing or pasture. Feed is used to attract livestock to the unit (van Breukelen, 2023; Zaman et al., 2021).
All
Methane and CO2 concentrations
Non-invasive.
It can be set up in grazing fields or in housing.
High purchase and running costs.
A spot measurement, not a true reflection of emissions per day.
Feed to attract livestock increases costs.
2030: E
2045: I
2030: E
2045: I
2030: E
2045: I
No evidence was found for use in UK trials and research. However it is potentially a feasible option for Scotland due to the benefits of transportability and measuring grazing livestock.
Mid-Infrared (MIR) data
MIR spectroscopy is used to predict the fat and protein content of milk. As methane is linked to milk composition, it can be used as a proxy to predict methane emissions (Dehareng et al., 2012; Semex, 2023)
Dairy
Milk component such as lactose, protein and fat
MIR technology is already used in milk recording, so could provide an existing infrastructure to integrate methane reporting into.
Because it is a proxy, validation of results (for example with a respiration chamber) is required (Denninger et al., 2020).
NA
2030: I
2045: I
NA
No evidence found of MIR being used in the UK to estimate methane, but European examples were found. As data could become available through existing milk recording schemes, it could be introduced by innovators by 2030. If the need for verifying results via detection methods is removed, this could be mainstream by 2045.
Portable accumulation chambers (PAC)
A portable respiration chamber which takes measurements over a short period of time (e.g. 1 hour) (Cummins et al., 2022).
All
Methane and CO2 concentrations
Quick measurement period reduces animal stress (Cummins et al., 2022).
Transportable (NZHerald, 2023).
Feeding and management protocols must be followed prior to measurements (Duthie et al., 2024).
Not suitable for long-term measurements (Cummins et al., 2022).
2030: E
2045: I
2030: E
2045: I
2030: E
2045: I
A promising option for Scotland, given its transportable between farms. SRUC recently acquired a PAC for sheep in the UK. However current research needs to be completed before they can be used widely (Duthie et al., 2024).
Handheld lasers
A handheld device originally developed to detect gas leaks can measure concentrations of methane in livestock breath (Sorg, 2021).
All
Methane concentrations
Non-invasive and portable.
Can take measurements from grazing livestock.
Can take measurements from several animals in one day.
Results can be sent to a smart phone (Sorg, 2021)
Has a lower accuracy, measurements are highly affected by environmental conditions (de Haas et al., 2021; Sorg, 2021)
2030: E
2045: I
2030: E
2045: I
2030: E
2045: I
No evidence found for use in UK research. However, the benefit of taking measurements from several animals in the same day may make it an attractive option for Scotland. Its widespread use may depend on supporting infrastructure such as reporting systems.
Rumen microbial composition
The rumen holds a variety of microorganisms that aid in the digestion of feed. By studying the microbes present in the rumen, those influencing the production of methane can be identified and used as a proxy to identify animals with the microbiome composition which emits lower methane (Miller et al., 2023).
All
Dry matter intake and methane concentrations
It can also be used to improve feed conversion and disease resistance (Duthie et al., 2024).
The composition of the microbiome is largely influenced by the ratio of feed (i.e. forage vs concentrate) so accuracy of results may be influenced by diet (Miller et al., 2023).
2030: E
2045: I
2030: E
2045: I
2030: E
2045: I
A technique being used in Scottish research in all sectors. Likely to remain an experimental technology, with future trials on some farms in the future.
Feed efficiency index
An indicator showing how efficient a cow is at converting feed into product, for example, into milk. Research shows that selecting for feed efficiency reduces methane emissions (Manzanilla-Pech et al., 2022).
Helps to reduce the amount of feed required and therefore associated costs.
It’s important that selecting for feed-efficiency does not compromise growth.
2030: M
2045: M
2030: M
2045: M
2030: M
2045: M
No evidence found of this being done with the aim of reducing methane emissions in the UK, but it is used in the UK to improve efficiency in dairy.
Table 14. Examples of data management tools involved in the process of breeding livestock for reduced methane emissions.
Description
Sector
Data collected
Benefits
Risks
Timeline of availability in Scotland: Experimental (E), Innovators (I), Mainstream (M), Future possibility (FP),
Not applicable (NA)
Practical considerations related to the feasibility in Scotland
Beef
Dairy
Sheep
ScotEID
A multispecies database which records and tracks livestock information. It may be possible to build on this in the future to introduce information relevant to methane.
All
Births, deaths and movements.
A familiar platform for farmers in Scotland.
2030: E
2045: I
2030: E
2045: I
2030: E
2045: I
An established infrastructure exists and is familiar to the industry, therefore a promising option to repurpose to include methane traits.
nProve
A free tool for New Zealand farmers to use to choose rams for breeding. They can choose the terminal or maternal traits that fit their breeding goals. When choosing maternal traits, methane production is an option.
Sheep
Reproduction, lamb growth, size, meat, wool, health indices
Very user friendly, guides the user through the selection process. Contact details are provided for breeders that meet chosen criteria.
Farmers can choose rams based on location, breed and exclude certain flocks from results.
NA
NA
2030: FP
2045: I
To be successful in Scotland, genetic evaluation and measuring methane from sheep would need to be common practice. There are existing tools such as ScotEID which records births, deaths and movements, and RamCompare which presents data from performance recorded rams i.e. carcass weight, that could be repackaged to incorporate methane production. But success would also depend on wide use of PAC (as done in New Zealand).
Selection index
Combines information to predict an animals estimated breeding value (EBV). It can be used to select traits for breeding goals, for example, milk production, feed efficiency and health to maximise future profit (Wellmann, 2023; de Haas et al., 2021).
All
It is possible to apply weightings to traits in relation to its importance in the breeding goals
Before a trait can be added to a selection index, it needs to be “clearly defined, recordable, affordable, have phenotypic variation, be heritable, and the genetic correlations between other traits in the index need to be known” (de Haas et al., 2021).
2030: E
2045: I
2030: E
2045: I
2030: E
2045: I
In 2023, Semex introduced a methane index for Holsteins in Canada. Availability in Scotland depends on the progress of measuring methane.
National breeding programme
A programme which plans and identifies breeding objectives, traits and information on selection criteria.
All
It can optimise gains and trait changes (De Haas et al., 2021).
To be successful at a national scale, significant data and cooperation is required.
For a trait to be included in a programme it must be environmentally important, express genetic variation and be measurable (Teagasc, 2012).
2030: M
2045: M
2030: M
2045: M
2030: M
2045: M
In 2023, The National Sheep Association began a 3-year initiative to measure methane from 13,500 sheep. The aim of this is to measure production traits to incorporate into breeding programmes. With progress like this, it is possible that national breeding programmes will be mainstream by 2030.
Multi-country database
An international database that contains performance/production (trait-related) records from a large number of livestock (Manzanilla-Pech et al., 2021).
All
An increased dataset
Improves robustness (Manzanilla-Pech et al., 2021)
Combining data from different countries can be challenging due to differences in reporting and recording, technology, favoured breeds and management style (Van Staaveren e al., 2023).
2030: FP
2045: FP
2030: E
2045: I
2030: FP
2045: FP
A significant amount of collaboration is required to make this effective. Due to having to overcome the data sharing challenges, it is possibly unlikely this will be available with the aim of reducing methane emissions by 2045. There may be some progress in the dairy sector however due to the introduction of the methane index in Canada.
Efficient Dairy Genome Project
An international initiative that combines data from 6 countries (Australia, Canada, Denmark, United Kingdom, United States, and Switzerland) aiming to build one genomic reference population and a unique database of DMI records.
Dairy
DMI, milk, methane was measured in 4 of the 6 countries participating in the initiative
The overall objective is to potentially improve feed efficiency (cost benefit) and reduce methane emissions (environmental benefit).
Combining data from different countries can be challenging due to differences in areas such as reporting and recording, technology, favoured breeds and management style (Van Staaveren e al., 2023).
NA
2030: I
2045: I
NA
Bull catalogues (such as Genus Bull search)
This index allows farmers to see the scores of certain traits in bulls. One of these traits is called Feed Advantage which can identify bulls with the greatest feed conversion (ABS, 2023).
Dairy, beef
Farmers can choose bulls with the desired characteristics to use in breeding.
2030: M
2024: M
2030: M
2024: M
NA
These are already available for farmers to use, so we would estimate them to be mainstream by 2030.
Beef Efficiency Scheme
A 5-year scheme funded by Scottish Government to help improve the efficiency, sustainability and quality of beef herds – helping to increase genetic value and reduce GHG emissions. The scheme focused on cattle genetics and management practices on-farm.
Beef
Tissue samples – genotyping
blood samples,
calving data,
culling/death reasons, dam data (docility)
Funding was provided to farmers for data collection and entry.
A free advisory service was also provided to assist farmers in developing their beef herd.
2030: FP
2045: FP
NA
NA
This scheme ended in 2021. It may be possible to build on and repackage the scheme to consider methane traits in the future.
Table 15. Examples of reproductive technologies involved in the process of breeding livestock for reduced methane emissions.
Description
Sector
Benefits
Risks
Timeline of availability in Scotland: Experimental (E), Innovators (I), Mainstream (M)
Future possibility (FP) Not applicable (NA)Practical considerations related to the feasibility in Scotland
Beef
Dairy
Sheep
Semen freezing
A technique to preserve semen.
All
Provides security in an instance that could risk a breed’s survival (Jones et al., 2020)
Variable success rate using thawed semen.
2030: M
2045: M
2030: M
2045: M
2030: I
2045: I
Artificial insemination (AI)
A technique to inseminate females, using fresh or frozen semen.
All
High success rate for cattle.
Not required to have a bull on the farm.
Better guarantee of uniform calving.
To be most efficient, livestock are required to come into heat at the same time as AI takes place. This is done artificially by the farmer, adding additional labour.
AI in sheep is often done laparoscopically, which is a surgical procedure performed by a vet. Due to the scale and extensive nature of sheep farming, this brings practical challenges.
Relies on sufficient infrastructure to collect and store semen of which there are limited facilities in Scotland (in particular for the sheep sector) (Stakeholder comment, 2023).
2030: M
2045: M
2030: M
2045: M
2030: I
2045: I
AI is already common practice in the dairy sector, with some use in the beef sector too. It’s likely this will be mainstream by 2030 for cattle. However, due to the practical challenges in sheep, it may still only apply to innovators.
Sexed semen
A method which allows control over the sex of the offspring by separating sperm cells based on their X or Y chromosome content. By focusing on females for example, there is the potential to reduce methane by reducing the number of unwanted males (Duthie et al., 2024).
All
Increases the selection of females in the dairy sector.
Improves productivity.
Success relies on the uptake of AI.
2030: M
2045: M
2030: M
2045: M
2030: I
2045: I
This is widely practiced in the dairy sector. Use in the beef sector is currently lower, however by 2030 there is the potential for this to be mainstream. Progress is determined by the uptake of AI in the sector. Due to the practical challenges associated with AI, it will likely remain an innovative practice.
In-vitro fertilisation (IVF)
Harvested oocytes are taken from donor cows and fertilised in a petri dish with semen to create an embryo.
Beef, dairy
Less semen required
Nutrition and diet need to be consistent in the lead up to extracting oocytes.
2030: I
M
NA
Process is conducted in a lab under sterile conditions.
Embryo freezing
A method for cryopreservation of embryos for long-term storage or transport. This tends to occur in conjunction with MOET.
All
I?
I?
I?
Lack of suitable laboratories
Conventional breeding
The use of bull/ram to cow/ewe breeding. Enhanced tools to select lower than average emitting bulls or rams.
All
Minimal technical input.
Familiar management practice for farmers.
Little control over selecting desirable traits.
It requires waiting for offspring to become fully grown before seeing if they have taken on the desired traits.
M
M
M
Table 16. Examples of animal genomics involved in the process of breeding livestock for reduced methane emissions.
Description
Sector
Data collected
Benefits
Risks
Timeline of availability in Scotland: Experimental (E), Innovators (I), Mainstream (M), Future possibility (FP), Not applicable (NA)
Practical considerations in Scotland
Beef
Dairy
Sheep
Microbiome-driven breeding
Emphasis is on selecting livestock with a rumen microbiome composition which is more efficient at fermenting of feed so that less excess hydrogen and thus less methane is produced.
Livestock genetics and therefore breeding influences the composition of the microbiome which therefore affects the amount of methane released.
All
Rumen fluid samples – sequencing of microbial DNA
There is a growing demand for livestock that emit less methane.
Potential method for improving animal health and reduce environmental impact.
This is a relatively new field, and much is unknown about how the gut microbiome develops and is maintained over time.
It is unclear how much influence the animal may have over those processes.
2030: E
2045: E
2030: E
2045: E
2030: E
2045: E
Good early signs but still at research stage.
Genomic breeding values (GEBVs)
Values that are based on information from livestock DNA and measured performance. Can be used with EBVs to improve accuracy of breeding programmes. (Meat Promotion Wales. 2013).
All
DNA and performance records
Can be used to identify traits that are difficult to record
Beneficial for traits measured in only one sex
Useful for accurately measuring traits that occur later in life (Scholtens et al., 2020).
Accuracy of the estimate is dependent on the number of animals included in the reference population (Scholtens et al., 2020).
2030: E
2045: I
2030: E
2045: I
2030: E
2045: E
For the UK beef industry, GEBVs are currently available for a number of carcass traits in Limousin cattle (Business Wales, 2016)
Estimated Breeding values (EBVs)
Calculated from the performance data of recorded animals. Environmental factors (e.g. feeding) are filtered out to provide a genetic value for each trait (Stout, D. 2021).
All
Performance records – parentage and traits of interest (e.g. weight traits).
Provides a more objective (data driven approach) towards selection.
Genetic selection based on EBVs leads to faster rates of genetic gain and flock improvement (compared to selection based on raw data or basic observation)
Allows comparisons within breeds, not between breeds.
2030: M
2045: M
2030: M
2045: M
2030: M
2045: M
Use as a tool to aid in the selection of healthy and structurally sound animals.
Genotyping
The process of determining/comparing the genetic variation of DNA sequences (or whole genomes) amongst individuals or populations.
All
Aids in genomic selection of both desirable (and harmful) traits.
Prediction accuracy of genomic selection is influenced by the type (male/female, previous generations) and number of animals that are genotyped (Mohammaddiyeh et al., 2023)
NA
NA
NA
Farmers cannot use this method themselves and therefore require the use of external service providers.
Genetic markers
Genetic markers identify desirable traits in animals which can then be selected for breeding (Meat Promotion Wales. 2013).
All
DNA marker information can be obtained from animals at birth (Hayes et al., 2013).
Can be used to select for traits that are difficult to record.
Genetic progress in slow given the relatively long generation interval in cattle and sheep
NA
NA
NA
Farmers cannot use this method themselves and therefore require the use of external service providers.
Gene editing
A method for editing individual genes within the genome of a cell, embryo or ovum to bring about a desired genetic change.
All
The ability to eliminate undesirable traits.
Accelerates rate of genetic improvement.
Introduces variation into a population e.g. disease resistance
Identifying the appropriate genes/ genomic site can be challenging, time consuming and expensive.
Appendix A: REA and stakeholder interviews methodology
REA methodology
The REA methodology used for this project aligned with NERC methodology (Collins et al., 2015) and comprised of the following steps.
Define the search strategy protocol, identify key search words or terms, define inclusion/exclusion criteria. This step helped to focus the review on the most relevant sources. Inclusion and exclusion criteria were also defined. For example, studies related to reducing emissions through feed additives were excluded.
Searching for evidence and recording findings. Due to the short timescales of this REA, we searched for literature using Google Scholar, utilising our accounts with Science Direct and Research Gate to access restricted pdfs where required. For each search, we recorded the date, search string and number of results found, each search string was assigned a reference number. Examples of search strings include:
breeding for reduced methane emissions
policy drivers for reduced methane emissions in livestock “breeding”
breeding for reduced methane emissions in livestock “Scotland”
Screening. Evidence was then screened, initially by title and a selection of sources were screened by the abstract, applying the criteria developed in step 1. This step ensures the relevance and robustness of the evidence that was included in the study.
Extract and appraise the evidence. Evidence was then extracted from the papers after screening, this included methane reduction values, traits that lead to reduced emissions and the technologies involved in the process.
Stakeholder interview methodology
Stakeholder interviews were used to collect information that may have been absent from the literature, for example on trials currently taking place that will not yet be included in publications. The stakeholders included researchers and individuals from farmer representative groups. We invited farmers for interview, however, only confirmed one farmer for an interview.
The semi-structured interviews took place over Microsoft Teams, with questions covering all parts of the study. For instance, asking for views on the key traits to select for, any examples of farmers choosing livestock based on emissions and the benefits and risks.
We did seven one-to-one interviews (with four stakeholders based in Scotland) and a group interview with nine stakeholders, all located in Scotland. The group interview was done to allow space for conversation and discussion between stakeholders. During this meeting, we presented the key themes raised in the one-to-one interviews. This included the barriers and drivers to uptake, the availability of technologies and the structural needs to support uptake.
Appendix B: New Zealand sheep case study
Country information
New Zealand is an island nation in the South Pacific and has many similarities to Scotland in terms of its geography and climate. Agriculture is integral to the New Zealand economy with the sector accounting for 10% of gross domestic product (GDP), over 65% of export revenue and almost 12% of the workforce. In 2023 there were 26,821,846 sheep in New Zealand, down from approximately 70,000,000 in the 1980s.
Around half of GHG emissions in New Zealand (49% in 2021) and 91% of biogenic methane emissions stem from agriculture, with sheep farming a key contributor.
New Zealand has relevant international and domestic emissiontargets, including the Global Methane Pledge, and the Climate Change Response (Zero Carbon) Amendment Act 2019, which sets a net zero target by 2050. There is a specific reduction target for biogenic methane of 10% relative to 2017 levels by 2030, and 24 – 47% by 2050. New Zealand also has emissions’ budgets and emissions’ reduction plans which sets out policies and strategies for meeting the budgets.
Accelerating new mitigations such as breeding for low-methane sheep is seen as an important way to reduce emissions alongside the pricing of agriculture emissions, as well as support initiatives.
Relevant research, programmes and technologies
The New Zealand Agricultural Greenhouse Gas Research Centre (NZAGRC) and the Pastoral Greenhouse Gas Research Consortium (PGgRc) are key leaders in the robust and comprehensive programme of research in New Zealand.
The NZAGRC is a Government funded centre which invests and coordinates research for practical and cost-effective reductions of agricultural GHG. One of its main targets of reducing enteric methane emissions.
The PGgRc is a joint initiative of the New Zealand Government and the agricultural sector which funds research into ways to reduce methane emissions, including from sheep, such as breeding. It also provides knowledge and tools for farmers to help mitigate GHG, for instance research reports (‘Sheep farmers now able to breed “low methane” sheep’), and fact sheets, with the aim of increasing understanding around the research.
The NZAGRC and PGgRc led the following research programmes related to breeding for reduced methane emissions:
Low emitting sheep were genotyped and markers were used to identify low emitting traits which confirmed a genetic basis for the variation in methane emissions. After 13 years of selecting for low emitting traits, a 16% difference in methane emissions was found between low and high emitting sheep. Other key findings include no negative impacts on physiology, productivity and health when selecting for reduced emissions. Predications have also been made that with the low emitting flock a 1% decrease in methane emissions per year is achievable The low emitting flock has been producing more wool and leaner meat and the emissions savings are both permanent and cumulative. This programme is ongoing and has produced one of the most comprehensive datasets in the world.
A methane breeding value was launched in 2019 from research undertaken by NZAGRC and PGRC. This was made available to selected ram breeders through Beef + Lamb Genetics and gives the sector a practical tool to make decisions with. This has then led to the development of the Cool Sheep Programme.
The Cool Sheep™ Programme was launched in 2022. This three-year programme aims to provide every sheep farmer in New Zealand the chance to use genetic selection to reduce GHG emissions. As well as supporting farmers, this programme gathers phenotype data which feeds back into research. This is available to farmers who are reviewing rams for selection on N Prove. Breeders wanting to produce low-methane rams do so by measuring a proportion of their flock using PAC. When combined with other information and sheep genotyping, this is used to provide a methane breeding value. In November 2023, bookings for use of the PAC chambers by stud breeders were fully subscribed, indicating uptake is high. They note that progress is slow in terms of methane emissions reduction around 2-3% per year, with single trait selection, although this is cumulative.
The four workstreams of the project are:
Ram supply: Measuring rams with PAC to make low-emitting rams available for breeding.
National Impact: using GHG calculators on farms to show methane reductions, rewarding farmers for their efforts.
Awareness and outreach: increasing knowledge for farmers, improving public awareness of efforts to reduce emissions while improving national productivity.
Key policies
There is no government policy legislating livestock breeding for reduced methane emissions in New Zealand. However, there are policies that that may contribute to introducing this in the future.
The Emissions Trading Scheme (ETS) is a key tool in New Zealand to help reduce emissions. Under the ETS, businesses must measure and report on their GHG emissions, and surrender one ‘emissions unit’ (an NZU) to the Government for each tonne of emissions emitted. They do this by purchasing NZU. The Government sets and reduces the number of NZU supplied into the scheme over time. This limits the quantity that emitters can emit, in line with emission reduction targets. Businesses who participate in the ETS can also buy and sell units from each other i.e. emitters can buy NZU from forestry companies or farmers to offset emissions. The price for units reflects supply and demand in the scheme. All sectors of New Zealand’s economy, apart from agriculture, pay for their emissions through their ETS surrender obligations. The agriculture sector must report its emissions but does not have surrender obligations.
Currently, no major incentive exists for agricultural producers to reduce their emissions. The ETS was not seen as the right mechanism to price agricultural emissions.
Instead, Government, industry representatives and Māori formed the He Waka Eke Noa – Primary Sector Climate Action Partnership (the Partnership) to reduce agricultural emissions. It is committed to designing an on-farm pricing system that ensures New Zealand’s agricultural products remain internationally competitive while reducing emissions.
Key Stakeholders
Key stakeholders involved in the research, technologies, programmes and policies include:
Agricultural Greenhouse Gas Research Centre, Government-funded centre which invests and coordinates research for reductions of agricultural GHG.
Crown Research Institutes, Crown-owned companies that carry out scientific research.
Beef + Lamb New Zealand, a farmer-owned, industry organisation representing New Zealand’s sheep and beef farmers.
Dairy Companies Association of New Zealand, representing dairy manufacturing and exporting companies.
Dairy NZ, industry organisation that represents all dairy farmers.
Farmers.
He Pou a Rangi – Climate Change Commission, an independent Crown entity that provides advice to government on climate issues
Iwi Māori, tribal entities and largest social units in Māori society that represent a group of people and land area
Māori Landowner groups, groups that represent Māori land that is governed and protected under specific statutes
Meat Industry Association, voluntary trade association representing red meat processors, marketers and exporters
Ministry for the Environment, New Zealand Government’s primary adviser on environmental matters
Pastoral Greenhouse Gas Research Consortium, provides knowledge and tools for farmers, to mitigate GHG
Public
Scientists and academics
Successes of research, technologies, programmes and policies
There are many successes in New Zealand for identifying emissions savings, policy drivers and behaviour change which would lead to improved breeding for reduced emissions.
Full subscription of the Cool Sheep programme to use genetic selection to reduce GHG emissions highlights the keen interest in this programme from farmers
Within the proposal for emission pricing, there have been the following successes that are likely to help drive behaviour change to uptake methane emission reduction breeding selection:
A farm level, split-gas levy gives farmers flexibility to determine the most efficient, cost-effective mitigation practices for their farms (Stakeholder comment, 2023).
The He Waka Eke Noa partnership involved key stakeholders discussing practical solutions to reducing emissions (Stakeholder comment, 2023).
While a policy for pricing agricultural emissions has not yet been legislated and implemented, discussions about a policy helped make New Zealand farmers more aware of their emissions and how to manage them.
Challenges of research, technologies, programmes and policies
There are some challenges with the New Zealand scenario that are relevant for identifying emissions savings, policy drivers and behaviour change which would lead to improved breeding for reduced emissions.
The fully prescribed uptake of the Cool Sheep programme in 2023 may highlight potential challenges with sourcing enough infrastructure to support all farmers interested in the programme.
In particular, there are challenges related to the agriculture emissions pricing:
Mitigation options under proposed policies are more currently more suited to dairy farmers than sheep and beef farmers.
The sheep and beef sectors are expected to be impacted by the pricing of emissions more than other farming sectors. There are likely to be disproportionate impacts on Māori due to the large proportion of Māori ownership in the sheep and beef sectors and historical context.
Potentially ancillary challenges and unforeseen challenges from the proposal such as environmental and social challenges due to land use changes due to the need to reduce emissions i.e. increased planting of forest may lead to landscapes changes etc.
The recent change in Government has posed a challenge. The 2025 implementation target for implementing the pricing of emissions is expected to be pushed back until 2030 (Stakeholder comment, 2023) and uptake of other methane related programmes could waver too.
Relevance in Scotland
There are some key learnings from the New Zealand scenario that are relevant for identifying emissions savings, policy drivers and behaviour change which would lead to improved breeding for reduced emissions.
At this stage, it is hard to determine exactly what has encouraged uptake of the Cool Sheep Programme and PAC measurements by sheep farmers. However it is assumed that discussions around agriculture emissions pricing and increased awareness, as well as financial assistance, has no doubt contributed to uptake.
The He Waka Eke Noa partnership highlighted that each livestock sector has different requirements. In Scotland, for example, stakeholders interviewed for this project suggested that it may be difficult to introduce breeding practices in the sheep sector due to its extensive nature. In addition, there is less frequent cashflow in the sheep and beef sectors compared to dairy, making it more difficult to introduce new practices. In New Zealand suggestions have been made that the dairy industry has had a better lobbying influence in the development of the policy than the sheep and beef industry and have been more successful at influencing a policy that better suits their needs (Stakeholder comment, 2023). Therefore, any consultations or partnerships must include different livestock types and stakeholders, and consider the differences between upland or lowland systems.
New Zealand is one of the first countries in the world to attempt to price agriculture emissions therefore can provide a huge amount of learning that should be considered by Scotland in developing policy around methane reduction.
Having an emissions number to reduce from makes it easier to see how actions will impact. This will encourage the consideration of emission reductions as part of general on-farm decision making, on-farm investment decisions and other considerations.
The policy impacts on certain farmers and Māori may be of relevance to island farmers and crofters with unique challenges, who may be disproportionately impacted by any climate policies in Scotland.
Research from the NZAGRC and the PGgRc has produced schemes like the Cool Sheep Programme.
The ram selection tool nProve provides a user-friendly platform for farmers to select the traits they want from a ram, including methane production. It gives farmers a tool to compare emissions between different animals before purchasing a ram, bull or semen. Because of the Cool Sheep programme and because there are planned policies to reduce emissions, there may be an incentive to use this metric. It may be possible to build on existing tools such as ScotEID and RamCompare in the future to create a similar platform (not only for sheep).
A policy for pricing agricultural emissions has not yet been legislated and therefore whether it has/will contribute to reduced emissions is yet to be realised. However government modelling suggests that the levy could achieve sufficient emissions reductions to meet or exceed methane targets. Discussions about a policy helped make New Zealand farmers more aware of their emissions and how to manage them.
Appendix C: Canada dairy case study
Country information
Canada has similarities in climate and geography to Scotland. Agriculture is a key aspect of the Canadian economy with agriculture and the agri-food system generating $143.8 billion Canadian Dollars (CD$) (around 7%) of Canada’s GDP. Canada is also the fifth-largest exporter of agri-food and seafood in the world. Dairy is a key part of the sector and is a top commodity in five of Canada’s provinces/territories.
Description of relevant research, programmes and technologies
Canada is undertaking research and programmes focused on breeding and new genomic technologies for reduced methane emissions in dairy production systems:
The Efficient Dairy Genome Project (EDGP) developed genomic-based methods for selecting dairy cattle with reduced methane emissions and improved feed efficiency. The project was underpinned by an extensive database used for genomic analysis. For example, correlating MIR with reduced methane emissions. The project also recognised the necessity of featuring the economic, environmental and social benefits of selecting for reduced methane emissions.
The Resilient Dairy Genome Project (RDGP) aims to integrate genomic approaches to improve dairy cattle resilience and industry sustainability. The project builds on the EDGP, with a focus on additional data collection, management and visualisation to support genomic analyses. Researchers noted an essential component is understanding the interaction between enteric methane emissions and specific farm conditions. For example, predicting methane emissions of individual animals and whole herds using milk MIR spectroscopy. By acknowledging the crucialness of collaboration with industry partners, the project will ensure results will render user-friendly products to enable technological uptake.
An ongoing commercial endeavour between genetic evaluation provider, Lactanet Canada and genetics supplier, Semex Alliance aims to develop a reliable methane efficiency index that can be easily integrated with common selection indices such as fertility, disease resistance and lifetime profitability.
Description of key policies related to reducing methane emissions through breeding
There are currently no government policies legislating livestock breeding for reduced methane emissions in Canada, however there are some policies that are likely to eventually incentivise it.
Agricultural Methane Reduction Challenge provided funding awarding up to $12 million CD$ to innovators designing practices, processes, and technologies to reduce enteric methane emissions.
Key Stakeholders
Key stakeholders involved in the research, technologies, programmes and policies include:
University of Guelph, and University of Alberta, orchestrate EDGP and RDGP
Successes of research, technologies, programmes and policies
There are many successes in the Canadian scenario that are relevant to identifying potential emissions savings, and in identifying policy drivers and behaviour change which would lead to improved breeding for reduced emissions.
Public-Private Partnerships (PPP) between research and industry can be accredited for the establishment of Canada’s major EDGP and RDGP, and were paramount in the development of the sophisticated database. Stakeholders Lactanet Canada and Semex Alliance effectively utilised this database, and in April 2023, Canada became the first country in the world to commercially market dairy semen containing methane efficiency as a relative breeding value (RBV). Their database and AI catalogue now includes 26 Holstein bulls with proven methane reduction capabilities, and a further 165 predicted. Semex Alliance also estimate widespread adoption of the low-methane trait could reduce methane emissions from Canada’s dairy herd by 1.5% annually, and up to 20-30% by 2050. The collective effort of all members of the Canadian dairy industry has enabled significant progression, to which the inclusion of a methane efficiency genetic valuation can be traced to.
A GHG Offset Credit System can incentivise farmers to undertake innovative projects that reduce GHGs for financial reward.
Challenges of research, technologies, programmes and policies
There are some challenges with the Canadian scenario that are relevant to identifying potential emissions savings, and in identifying policy drivers and behaviour change for improved breeding for reduced emissions.
There are some key learnings from the Canadian scenario that are relevant for Scotland in terms of identifying potential emissions savings, and in identifying policy drivers and behaviour change for improved breeding for reduced emissions.
When compared to other livestock sectors, the data gathering process in the dairy industry is unique as daily milking and feeding activities provide a non-invasive opportunity to measure individual animals without major management changes. Coupling the simplistic nature of data collection with advanced existing genetic databases and the widespread use of artificial insemination (AI), the Scottish dairy industry is capable of reducing enteric methane emissions efficiently. Applying knowledge or making predictions from existing information has great potential to eliminate and/or significantly reduce cost, data collection periods and the requirement of on-farm experimentation.
Genetic change is a simple and low-cost approach to reduce enteric methane emissions in dairy production systems. Owing to modern technologies and transport capabilities, the methane efficiency RBV developed in Canada is compatible with the Scottish dairy herd and can be purchased and administered via AI to help begin reducing enteric methane emissions.
Canada has precedented instigating good working relationships with farmers, a goal achieved by highlighting the primary objective of research is to enhance industry sustainability. In response, many Canadian dairy farmers have also recognised constructive engagement with research and industry is fundamental. The establishment of a comprehensive and transparent database has provided assurance and confidence to adopt new best management practices.
Scotland could consider monitoring the effectiveness of the Offset Credit System currently being considered in Ottawa to see if it incentivises behaviour change or changes finances and markets.
Canada does not currently offer incentives for low-methane cattle breeding, and livestock breeders do not charge a premium for methane efficiency traits. However, discussions on this topic are ongoing between stakeholders and policy makers and it is looking likely a financial benefit will be introduced in the future.
Appendix D: Ireland beef case study
Country information
Ireland has a similar climate and geography to Scotland. Agriculture is key aspect of the Irish economy with the agriculture, forestry and fishing GDP valued at €3,672m in 2020. In 2020, 55% of farms were specialist beef, with many others including cattle as part of a mixed farm.
In 2022, agriculture was responsible for 38.4% of GHG emissions, making it the sector with the biggest share of emissions. 62.6% was caused by enteric fermentation.
Ireland is part of the Global Methane pledge and legally obliged as an EU Member State to reduce emissions under the EU’s Effort Sharing Regulation, including in agriculture. Ireland’s 2030 target is to deliver at least a 42% reduction by 2030 compared to 2005 levels.
Ireland has developed the Food Vision 2030 Strategy for the Irish agri-food sector which commits to reducing biogenic methane. This includes the ‘Ag Climatise’ Roadmap, covering animal breeding, with an aim to genotype the entire national herd by 2030 to develop and enhance dairy and beef breeding programmes.
Description of relevant research, programmes and technologies
The Irish Cattle Breeding Federation (ICBF) launched the National Genotyping Programme (NGP) for cattle in 2023. This offers beef and dairy farmers a low-cost option to collect DNA samples from calves at birth which can be used for genotyping to identify specific traits or characteristics. The aim of the programme is to achieve a fully genotyped herd in Ireland. This has made national genetic indexes available to farmers, including methane traits. It also allows farmers to optimise the health and productivity of their herd, reducing its emissions intensity. The ICBF also publish methane evaluations for AI sires that have had methane data recorded.
Teagasc has an important role in the research in Ireland. Animal breeding is one of the four solutions from Teagasc to reduce methane emissions from livestock. Current research projects include:
GREENBREED: Measured methane at the Tully Progeny Test centre using a GreenFeed automated head chamber system. This research led to the publication of genomic evaluations for methane emissions in Irish beef cattle and sheep. It found notable differences in methane emissions from livestock being fed the same diet, 11% of these in cattle were found to be due to genetic differences. This indicates that breeding programmes to reduce methane will be effective in Ireland.
Collaborative research by Teagasc and ICBF found a 30% difference in methane emissions from beef cattle of a similar size. This lead to the residual methane emissions (RME)[10] index being identified as a metric to rank animals.
Description of key policies
There is no legislation on livestock breeding for reduced methane emissions in Ireland, but the following policies related to GHGs may support this.
The Beef Data and Genomics Programme (BDGP) paid suckler farmers to improve the genetic merit of their herd through data collection and genotyping, with the aim of lowering GHG emissions by improving quality and efficiency.
Payments were made of €142.50/ha for the first 6.66 ha and €120/ha for the remaining eligible hectares (the equivalent of €95 for the first 10 cows and €80 for the remaining cows), farmers have to undertake specific requirements.
These requirements include calf registration, detailed surveys of animal characteristics, genotyping and tissue tag sampling, and implementing a replacement strategy based on high genetic merit animals.
Additional support in the form of the carbon navigator decision making tool and training courses for farmers are also provided.
Participants of the programme were found to be achieving improvements at a faster rate compared to farms not taking part. The impact of the programme can help to promote smaller, more efficient suckler cows to produce more efficient beef.
The Suckler Carbon Efficiency Programme:
As part of its Common Agriculture Policy Strategic Plan (CSP), Ireland developed ENVCLIM (70) 53SCEP as a follow-on from the BDGP, providing support to beef farmers who implement breeding actions that aim to lower the overall GHG emissions. The BDGP was shown to deliver on both environmental and productive efficiency and emissions per suckler cow are being reduced through breeding strategies. Another measure in the CSP, 53SCT, targets training to complement the Suckler Carbon Efficiency Programme.
Key Stakeholders
Key stakeholders involved in the research, technologies, programmes and policies include:
Teagasc, Agriculture and Food Development Authority providing research, advisory and training to the agriculture and food industry and rural communities.
Department of Agriculture, Food and the Marine, Irish government department leading, developing and regulating the agri-food sector, protecting public health and optimising social, economic and environmental benefits.
Irish Cattle Breeding Federation (ICBF), non-profit organisation charged with providing cattle breeding information services.
Irish Environmental Protection Agency, independent public body to protect, improve and restore the environment through regulation, scientific knowledge and working with others.
Irish Farmers Association, Ireland’s largest farming representative organisation.
Farmers.
Food Vision Sheep and Beef Group, group of stakeholders established by the Minister for Agriculture Food and the Marine to identify measures that the sector can take to contribute to reducing emissions from the agricultural sector
Successes of research, technologies, programmes and policies
There are many successes in the Irish scenario that are relevant to identifying potential emissions savings, and in identifying policy drivers and behaviour change which would lead to improved breeding for reduced emissions.
The NGP is a useable database of genotyped methane information available for farmers to use. This is the result of comprehensive research programmes, collaboration between breed societies, and creating useful systems for farmers to benefit from. Making this data easily available to all farmers across Ireland can encourage behaviour change and is a successful programme that could be considered in Scotland. The creation of the ICBF has been essential for this, as it means there is one body overseeing all genotyping and data storage.
The BDGP is an example of how payments to farmers can be used to gather data and reward farmers for adopting positive practices.
Research from GREENBREED indicates that breeding programs to reduce methane emissions will be effective for selecting low-emitting livestock, especially combined with the national genomic evaluations, and will have no negative impact on performance and profitability.
Ireland has produced methane evaluations to enable farmers to identify opportunities to reduce emissions and improve the sustainability of their enterprise.
Overall, the authors did not find evidence of a quantifiable impact from introducing methane related actions and policies. This may be because the relevant research, programmes and technologies as mentioned above are still relatively new and it is too early to quantify. For example, the NGP is to only be completed by 2027, whereas following on from data collected from methane evaluations, methods are still being developed on how best to incorporate methane traits into beef and dairy production.
Challenges of research, technologies, programmes and policies
Additional research would be required to understand how the policies and programmes were received by farmers and how successful the agricultural community views them to be. We contacted Ireland representatives for involvement in stakeholder interviews however we did not get a response.
Relevance to Scotland
There are some key learnings from Ireland that are relevant for Scotland in terms of identifying potential emissions savings, and in identifying policy drivers and behaviour change for improved breeding for reduced emissions.
A national database was suggested by Scottish stakeholders (Stakeholder comment, 2023). Therefore, Ireland’s NGP provides an example for Scotland if this was to develop. In particular:
predicted transmitting ability (PTA) could give Scottish farmers and crofters an easy way of comparing their livestock to other farmers and understanding where they are compared to the average.
Challenges in the Scottish context could include reluctance on the part of different breed societies to pool data.
Ireland have shown that emissions for cattle can be reduced through appropriate breeding strategies and incentives for farmers. Such as subsidising DNA sampling of calves which helps to genotype the national herd.
The creation of the Food Vision Beef and Sheep Group to chart a path for the sector to meet the emissions emission targets is a potential model for ways that Scotland might bring key stakeholders into the development of key policies to reduce emissions.
The main ways behaviour change has been encouraged is by making the programmes and policies mentioned above easy to access, for example, the ICBF also provides information to help farmers make decisions about their herd through HerdPlus.
The BDGP and CSP provides training to farmers who are using the scheme, for which funding is provided.
Appendix E: Methodology and results for the quantification of potential emission savings
Methane emission savings are achievable through breeding and new genomic technologies. The main sources of methane from cattle and sheep in Scotland are enteric fermentation and managed manures. We have chosen to focus our calculations on emissions from enteric fermentation for two reasons:
Methane emissions from managed manures are much smaller.
Changes to livestock by selecting traits which lead to lower methane emissions will have a greater impact on the emissions from enteric fermentation rather than the emissions produced from livestock manures.
To align with the CCP’s targets, of achieving net zero in Scotland by 2045 and a 75% reduction in emissions by 2030, we present data for potential emission reductions for 2030 and 2045. The following data were used to quantify the potential emission savings:
Key traits leading to reduced methane emissions, from the REA.
Methane reduction values associated with traits, from the REA.
Note: A particular challenge was identifying emission reduction values that were associated with specific traits, that we could use in our calculations. We have used the data available to draw conclusions.
Baseline emissions data for Scotland from the National Atmospheric Emissions Inventory (NAEI, 2023).
Uptake values (sector specific) for adoption of chosen traits through breeding, based on findings in the REA, stakeholder interviews and expert judgement.
Baseline methane emissions
To calculate the baseline methane emissions for dairy, beef and sheep, the enteric fermentation emissions of the livestock types for Scotland in 2021 were extracted from the NAEI (2023)[11].
Current uptake rate for adoption of traits
The current uptake rate is an estimated current baseline based on evidence gathered in the REA review of evidence and technical knowledge. This provides a baseline for additional uptake under the scenarios presented below.
Current uptake is set at 75% for dairy cattle, due to the high usage of reproductive technologies (see Section 4.1.3), in particular use of sexed semen and artificial insemination (AI) using Holstein Friesian semen, a key breed which already has proven methane efficiency ratings published as part of the breeding profile. It is understood that methane efficiency ratings are also being developed for other key dairy breeds as observed on UK dairy and beef cattle semen sales websites.
Beef cattle uptake has been set at a 40% baseline as findings show that methane efficiency ratings are less regularly published as part of the beef breed profile on UK semen sales websites. However, artificial insemination of beef cattle is relatively common, although it is not a standard practice as in the dairy industry. It is understood adoption of breeding for reduced emissions is developing and evidence is being gathered (see Section 4).
The current baseline for sheep has been set at 10% based on a comparison with New Zealand where there is an uptake rate of 30% (Rowe et al. in 2020). Following discussions with Scottish Government it is acknowledged that there is some technology usage around the world, but that adoption in Scotland is not yet as high as in New Zealand. Therefore, 10% has been chosen as the baseline. This links to understanding of technology uptake in Section 4.
Scenarios
The quantification of emissions savings was based on four different scenarios to reflect various levels of uptake:
The no interventionscenario reflects an increase in uptake of 5% from the current baseline by 2030 and remains at the same level until 2045 for all livestock types.
The voluntary uptake scenario is designed to reflect levels of uptake expected with no other push such as a financial incentive or a relevant policy. This scenario reflects a 5% increase in uptake from the current baseline by 2030, and an additional 5% increase in uptake by 2045 for all livestock types.
The supplier demand scenario is based on companies along the supply chain offering financial incentives to farmers that implement breeding techniques to reduce methane emissions. This value is set at a mid-point between the voluntary uptake and the regulatory scenario.
The policy changes scenario represents the uptake where legislation has been introduced that will require farmers to introduce methane reducing breeding techniques to their herds. This scenario reflects a 10% increase in uptake from the current baseline by 2030. By 2045 it is assumed there would be 100% uptake for dairy cattle due to the large-scale usage of AI within the industry and progress seen on methane efficiency profiling already published within the key breed profile. It is assumed that beef cattle could reach 80% uptake by 2045, and sheep could reach a 60% uptake by 2045 under a regulatory scenario.
Scenario uptake values are presented for dairy, beef and sheep in Table 17.
Table 17. Scenario implementation values for dairy, beef and sheep
Type
Scenario
Current baseline
Change from current baseline to 2030
2030 uptake
Change from current baseline to 2045
2045 uptake
Dairy
1. No intervention
75%
5%
80%
5%
80%
2. Voluntary uptake
75%
5%
80%
10%
85%
3. Supplier demand
75%
7.5%
82.5%
17.5%
92.5%
4. Policy changes
75%
10%
85%
25%
100%
Beef
1. No intervention
40%
5%
45%
5%
45%
2. Voluntary uptake
40%
5%
45%
10%
50%
3. Supplier demand
40%
7.5%
47.5%
25%
65%
4. Policy changes
40%
10%
50%
40%
80%
Sheep
1. No intervention
10%
5%
15%
5%
15%
2. Voluntary uptake
10%
5%
15%
10%
20%
3. Supplier demand
10%
7.5%
17.5%
30%
40%
4. Policy changes
10%
10%
20%
50%
60%
Traits
Traits and technologies with a possible relationship with methane emissions and emission reductions were identified through a REA of relevant literature (see Section 4).
Traits identified were further reviewed to assess their applicability to emission reduction calculations. When assessing each trait to quantify the emissions savings, appropriate values were found to be scarce in the literature. There were two key reasons that led to studies and/or traits being excluded from use in this task:
A significant portion of the literature did not present methane emission values and was instead looking at genetic correlations between traits. Therefore, literature that did not present methane emission values or change in methane emissions, either as absolute or relative values, were excluded.
Often the changes in methane emission were comparative to a baseline that was not appropriate for our calculations focusing on methane emission from enteric fermentation. For example, papers excluded in our review presented changes to emissions from the entire lifecycle or system.
A summary of the traits, where appropriate values were obtained, are presented in Table 17 below.
Table 18. Traits identified with appropriate methane reduction values used in the calculations of emissions savings
Sector
Trait Category
Trait Name
Unit of baseline
Value of methane reduction from baseline
Beef
Production
Feed efficiency
kg CO2e/kg product
7%
Offspring carcass weight
kgCO2e/per kg meat per breeding cow per year
1.3%
Climate
Methane yield
gCH4/kgDMI per generation
12%
Dairy
Production
Feed efficiency
kg CO2e/kg product
5%
Milk fat + protein
MJ CH4/kg milk
12%
Milk yield
kg CH4/kg milk
15%
Climate
Methane intensity
kg CH4/kg milk
24%
Sheep
Production
Feed efficiency
kg CO2e/kg product
7%
Climate
Methane yield
g CH4/kg DMI
35%
Feed efficiency
References: (Alford, A.R. et al. 2006; Worden, D. et al. 2020; Rowe, S.J. et al. 2021)
The ability of animals to optimally convert feed into liveweight with minimal losses of energy, meaning that animals with high feed efficiency consume less than their peers with equivalent liveweight and weight gain. This trait was identified across all three livestock types and has been highlighted by the stakeholders and the literature as a key trait for emission reductions (see Section 4).
Methane focused climate traits
References: (Quinton, C.D. et al. 2018; De Haas, Y. et al. 2021; Jonker, A. et al. 2018)
Methane traits are likely to have the greatest impact on methane emissions. Here the methane related traits were focused on manipulating the gut microbiome and selecting for animals with certain microbial populations that led to lower methane emissions. While methane traits were identified for all three livestock types, they were presented differently across the literature.
Offspring carcass weight – Specific to beef cattle
References: (Martínez-Álvaro, M. et al., 2022)
Focus on offspring carcass weight in beef cattle reduces methane emissions through increased quantity of product per animal, therefore reducing the number of animals required to produce the same amount of beef product.
Milk yield and Milk fat and protein – Specific to dairy cattle
References: (Bell, M.J. et al. 2010)
Traits reduce methane emissions per kg of milk while maintaining production levels and quality.
Emissions reduction
To calculate the emission reduction of different traits under the different scenarios the following formula is used:
Where:
= Emissions savings (kt CH4 for the livestock type)
= Baseline emissions (kt CH4 for the livestock type)
= Uptake (U) for the projected year (y)
= Emission reduction coefficient (%)
This formula calculates a percentage of emissions based on emissions reduction potential and uptake rate and subtracts this portion from baseline emissions. The result is an estimate of methane emissions if the reduction potential and uptake for the trait is achieved. The savings were then calculated by subtracting the estimated emissions from the baseline emissions, and both were calculated in units of percentage of baseline and absolute values (kt CO2e). This calculation was completed for each trait found in beef, dairy, and sheep sectors, for the years 2030 and 2045.
Limitations in the data:
All traits have been presented separately as the interaction between traits and the impact this would have on emission reductions is unknown.
It is acknowledged that traits found within the literature are presented in different units (see Table 7). Traits selected from the literature also presented a percentage change which was used within the change calculations. The percentage change has been applied to total emissions from the relevant livestock sector due to limited data on specific emissions related to more specific production categories such as CH4 emissions per kg milk produced.
Methane efficiency focused traits have shown to have the greatest methane reduction potential for all three livestock types. However, it is noted that there was less literature available on this subject compared to feed efficiency. Due to the smaller quantity of literature available the reduction potential values selected for methane efficiency could be less robust. Greater consistency in measurement, modelling, and presentation of methane efficiency traits and their impacts on emissions savings and animal performance production could be useful research to fill this knowledge gap.
Traits reduction factors compiled within the review were presented in different units, however, all presented a percentage reduction. It has been assumed that the percentage reduction would be applicable to be used as a reduction factor as this would have a direct impact on methane reductions independent of the unit the factor was recorded in.
Limited data was provided within the literature reviewed on the length of time until each trait reaches maximum potential within the population. However, it is assumed that once the trait has been bred into the total population there will be no additional improvements unless new breeding traits are selected. Within the calculations we have assumed that traits will account for their maximum potential to the selected population at the assessment point (i.e., in 2030 100% of the trait will apply to the current baseline uptake with the additional percentage uptake).
There is the possibility that, due to the nature of genetics, when selecting for certain traits, that they will not fully spread throughout the entire population where the trait is applied. This is a complicated process, and it has been assumed that at each assessment point (2030 and 2045) each trait has reached maximum spread in the portion of the population that has taken up the measure (i.e., in 2030 100% of the trait will apply to the current baseline uptake with the additional percentage uptake).
Results
Figures 4-7 show that in each sector, up to 2030, the reductions are relatively steady, but there is a greater reduction at 2045, influenced by the proposed increase in uptake. Due to the proposed uptake percentages the policy change scenario presents the greatest reduction under all traits, with the no intervention scenario showing the smallest reduction due to a 5% increase in uptake in 2030 and no further uptake in 2045.
Figure 4 presents the methane emissions under the four scenarios for the three traits selected for beef cattle: feed efficiency, offspring carcass weight and methane production. The methane production focused trait has the largest emission reduction (reduction of 161.1 kt CO2e in 2045 under the policy changes scenario), whereas the offspring carcass weight focused trait has the smallest impact at less than 12.4 kt CO2e reduced by 2045 under the maximum reduction scenario.
In correlation with beef trait reductions, methane intensity traits have the largest reduction to methane emissions in dairy cattle, with a reduction of 35.4 kt CO2e observed under the policy change scenario by 2045, as presented in Figure 5. While breeding for methane reductions through feed efficiency has the least change at 7.4 kt CO2e reduced by 2045, this could be due to the work already completed on feed efficiency breeding within dairy. Traits focused on milk fat and protein and milk yield provide similar reduction level levels, however there is the potential for overlapping improvements with feed efficiency as breeding focused on improvements to milk production traits could also link to improvements to feed efficiency.
Reduction potential for sheep is presented in Figure 6 for the two selected traits: feed efficiency and methane yield. As with the cattle categories, the trait focused on methane improvements (methane yield) had the largest potential reduction at 185.6 kt CO2e reduced by 2045 under the policy change scenario, whilst feed efficiency traits saw a smaller reduction of 37.1 kt CO2e by 2045 under the policy change scenario.
Figure 4. Methane emissions for beef cattle traits against the 2021 baseline enteric methane emissions of beef cattle in Scotland. Please note the y-axes do not start at zero to allow for greater visibility of results.
Figure 5. Methane emissions for dairy traits against the 2021 baseline enteric emissions of dairy cattle in Scotland. Please note the y-axes do not start at zero to allow for greater visibility of results.
Figure 6. Methane emissions for sheep traits against the 2021 baseline enteric emissions of sheep in Scotland. Please note the y-axes do not start at zero to allow for greater visibility of results.
Figure 7 presents the methane emissions by 2045 under all scenarios for all traits for each livestock type. The difference in total enteric fermentation emissions for each livestock type can be seen by the dotted baseline line. Beef cattle emitted the majority of the methane from enteric fermentation in Scotland in 2021, with sheep emissions being less than half those of beef cattle, and dairy under a quarter those of beef cattle.
Figure 7. Methane emissions for all livestock for all traits presented against baseline enteric emissions of beef, dairy and sheep in Scotland.
How to cite this publication:
Jenkins, B., Herold, L., de Mendonça, M., Loughnan, H., Willcocks, J., David, T., Ginns, B., Rock, L., Wilshire, J., Avis, K (2024) ‘Breeding for reduced methane emissions in livestock’, ClimateXChange. http://dx.doi.org/10.7488/era/5569
While every effort is made to ensure the information in this report is accurate, no legal responsibility is accepted for any errors, omissions or misleading statements. The views expressed represent those of the author(s), and do not necessarily represent those of the host institutions or funders.
DNA contains the information required to create the entire organism, a unit of DNA containing specific information to create a protein or set of proteins is referred to as a gene. It is these proteins which make up the body and control chemical reactions between cells. the study of genes is referred to as genetics. ↑
The productive lifespan of livestock. For beef and dairy – a longer productive lifetime would reduce the number of replacement heifers needed to maintain a constant herd size. For sheep – the longer ewes can produce lambs, production efficiency improves. ↑
The number of lambs born per number of ewes mated, expressed as a percentage. ↑
For beef and dairy – less feed is used for the same output of product and less loss of energy to methane (kg CO2e/kg product). For sheep – this is CO2e but as far as can be told it is only methane in this value. Less feed is used for the same output of product and less loss of energy to methane (kg CO2e/kg product). ↑
The number of kilograms gained by the animal per day, measured in kg/day. ↑
Overall production of the animal (including feed efficiency), supporting the animal to reach its full genetic potential and ensuring it reaches the highest possible level of performance. ↑
ME is expressed as a Relative Breeding Value (RBV) with a mean score of 100 and a standard deviation (how much a point differs from the average), of five. A score below 100 indicates below average and a score above 100 indicates above average. A higher RBV indicates a higher methane reduction potential. ↑
The amount of methane produced per unit of milk or sheepmeat produced (kg CH4/kg milk/sheepmeat). ↑
RME is the difference between the expected methane emissions from an animal based on its size and feed intake, compared to what it actually produces. High RME is undesirable and low RME is desirable. ↑
Achieving Scotland’s net zero goals by 2045 will require significant expansion of the renewable energy workforce. This is especially true in the rapidly growing onshore wind and solar energy sectors. Forecasts indicate a dramatic increase in workforce demands by 2030. This emphasises the need for enhanced, well-aligned training programmes to develop a skilled labour pool.
This study assesses the current training provision for the onshore wind and solar energy sectors in Scotland, identifying gaps, barriers and opportunities for improvement. It analyses existing programmes and their alignment with industry needs, exploring future workforce demands and strategies to address skills shortages.
Findings
We conducted desk research, data analysis and stakeholder consultations. The skills needed in the solar and onshore wind sectors can be divided into sector-specific, allied STEM (from broader disciplines such as mechanical and electrical engineering) and other skills (Figure 2). Although some critical training provision is needed for solar and onshore wind separately, the majority of roles are shared by the sectors requiring allied STEM and other skills. Siloed approaches for skills governance in solar and onshore wind could be counterproductive as the sectors compete for many of the same skillsets.
Figure 1. Conceptual framework of skill types relevant to solar and onshore wind industries.
We found that:
There is a strong breadth of allied STEM training provision in Scotland, with skills that are highly sought across multiple sectors. A siloed approach to STEM workforce planning is a threat, as several industries draw from the same talent pool. Stakeholders highlighted poor visibility of careers, as well as low job attractiveness, as major barriers to the development of solar and onshore wind sectors at the accelerated pace required.
There is a shortage of specialised training provision providing essential skills for the construction and operational phases of solar and onshore wind projects. The solar sector, in particular, suffers from a lack of training specific to large-scale or ground-mounted solar installations.
The majority of targeted training provision relevant to solar and onshore wind sectors is largely theory-based, with insufficient emphasis on practical, hands-on experience. Industry leaders are concerned that graduates often lack real-world skills and are not “work-ready” upon entering the workforce. Practical training opportunities, such as industry partnerships and on-site apprenticeships, are limited.
Funding constraints are a significant barrier to the expansion and modernisation of training programmes. High-cost courses, such as those involving high-voltage systems and specialised certifications, require substantial investment in equipment and facilities. Many colleges and training providers struggle to secure adequate resources to enhance the training delivery.
Industry uncertainty, driven by a lack of clear and stable policy directives, complicates long-term planning for workforce development. Industry is hesitant to invest in apprenticeships and workforce training without concrete indications of project pipelines and future market stability.
The competition for technically skilled workers is fierce across various industries. Renewable energy companies compete among themselves and with other sectors for these workers. This high level of competition complicates talent acquisition and retention.
Lessons learnt
The content and delivery principles of training programmes needs to be updated to better equip trainees with practical, hands-on experience. Deeper collaborations between industry stakeholders and educational institutions would ensure curricula content is relevant and meets current and future sector needs. Educational institutions and training providers should integrate work-based learning modules, internships and apprenticeship opportunities into their curricula. Modular and more flexible courses as a core mechanism for training delivery would facilitate targeted, intensive upskilling or reskilling. Such flexibility would enable faster and more efficient transitions into the workforce.
There is a pressing need for increased and targeted funding to support technical training programmes to enable these updates.
To attract and retain a skilled workforce, the onshore wind and solar sectors must become more visible and appealing to job seekers. Development of career pathway maps would illustrate how individuals can progress from entry-level roles to senior positions. This would provide a clearer picture of the long-term opportunities available in the sector, making it more attractive to potential recruits.
An integrated perspective is necessary to consider the requirement for a STEM workforce across all infrastructure projects of national importance and overall installed capacity ambitions. A comprehensive map that details the scale, timelines and workforce demands of major infrastructure projects has the potential to inform the total scale of skilled workforce needs, including for the onshore wind and solar sectors.
Next steps
Effective workforce development will require close collaboration between government, industry and educational institutions, and workforce representative groups. A coordinated approach will ensure that training programmes are aligned with sector demands. To address the workforce and training challenges outlined in this report, a detailed, comprehensive action plan should be developed. This plan should include timelines, assigned responsibilities, and measurable outcomes to ensure progress is tracked and accountability is maintained.
With workforce demand projected to peak by 2027, the action plan must be implemented swiftly. Initiatives should be launched before the start of the 2025/2026 academic year to allow training providers time to adapt and scale. This proactive approach will enable the industry to meet pressing needs and support for the Scottish Government to deliver its renewable energy commitments.
Glossary / Abbreviations table
CESAP
Climate Emergency Skills Action Plan
ESP
Energy Skills Partnership
FPE
Full person equivalents – a standardised unit that quantifies the number of people enrolled in a course
FTE
Full time equivalents – a standardised unit that quantifies workload equivalence to full-time hours
GWO
Global Wind Organisation
NESA
National Energy Skills Accelerator
NESCoL
North-East Scotland College
NOS
National Occupational Standards
OPITO
Offshore Petroleum Industry Training Organisation
SCGJ
Skills Council for Green Jobs
STEM
Science, technology, engineering, and mathematics
UHI
University of Highlands and Islands
Introduction
Scale of skills demands in solar and onshore wind
The achievement of Scotland’s net-zero commitment by 2045 relies heavily on expanding the renewable energy sector, including the onshore wind and solar energy sectors. Both the wind and solar sectors are expanding rapidly, creating an urgent need to train a larger skilled workforce. Two recent studies published by the ClimateXChange have estimated the workforce needs for both these sectors.
In the onshore wind sector, the workforce could need to increase from around 6,900 full-time equivalent (FTE) jobs in 2024 to an estimated around 20,500 FTEs by 2027 (Morrison, et al., 2024). Most of these new jobs will focus on constructing and installing wind farms. Key areas such as the Highlands and Dumfries and Galloway will need a large share of the workforce, but recruitment challenges already exist in these regions. Critical skills shortages include high-voltage engineers and wind turbine technicians. If these gaps are not filled, it could slow down the sector’s growth and reduce its economic and environmental benefits.
The solar sector faces similar challenges. Its workforce could need to grow from around 800 FTEs in 2023 to an estimated over 11,000 by 2030, with over 80% of these roles estimated to be related to construction, especially for large ground-mounted solar projects (Creamer et al, 2024). Solar projects will require key tradespeople, such as electricians, grid connection engineers, and high-voltage technicians. Many of the large solar installations will be in rural parts of Scotland, which makes workforce distribution a challenge.
Both sectors already have skilled workers, but they must attract and train more people to meet their installed capacity ambitions. While current training programmes can address some of these needs, there is a clear requirement to upskill and reskill workers from other sectors. Previous research (Morrison et al, 2024; Creamer et al, 2024) has shown that a large part of the additional workforce required for solar and onshore wind sectors will require education at Higher National Certificate, Higher National Diploma and degree levels. Furthermore, the industry strongly prefers trainees who have real-world experience in these sectors. As such, apprenticeships are expected to play a significant role in the delivery of the future skilled workforce.
Based on the findings of these studies, we argue that the timelines for intervention towards increased training provision are urgent. To illustrate, the onshore wind sector forecasts a peak of workforce demand as early as 2027, leaving only two academic years for intervention and subsequent training to be delivered.
This follow-on study focuses on the analysis of the existing and planned training provision, profiling its alignment with the industry needs, and exploring potential avenues for optimisation of training provision based on insights from sector stakeholders.
Conceptualisation of relevant training provision
The skills needed in the solar and onshore wind sectors can be divided into sector-specific, allied STEM, and otherskills (Figure 2).
Sector-specific skills focus on the installation, maintenance, and safe operation of the unique infrastructure in each sector. For example, solar projects require expertise in setting up and maintaining solar panels, while wind projects demand skills in handling large wind turbines, often in challenging environments such as working at heights. Health and safety knowledge is critical in both sectors, as they each present different risks—solar work involves concerns like heat stress, while wind energy can involve working at height and operation of heavy equipment. Additionally, site design in both sectors requires highly specialised skills. Wind projects, for example, need knowledge of geology and land use to optimise turbine placement, whereas solar projects focus on efficient land use for arrays.
More detail on sector-specific skills and job roles can be found in the ClimateXChange publications by Creamer et al (2024) and Morrison et al (2024) (solar and onshore wind, respectively). These skills are often acquired through the apprenticeship routes, as well as first degrees and private training provision programmes.
Allied STEM skills include those adapted from broader disciplines such as civil, structural, mechanical and electrical engineering. These disciplines are essential for building and connecting renewable energy infrastructure to the grid. Engineers play a vital role in constructing foundations for wind turbines or solar supports and managing and balancing electrical systems. Further, skills from environmental sciences and logistics help ensure that projects comply with environmental regulations and manage supply chains effectively. Similar to sector-specific skills, allied STEM skills are acquired through apprenticeships, as well as first degrees and postgraduate training.
In addition to technical skills, other skills, such as finance, planning, and management expertise are critical for the success of renewable energy projects. These professionals may not have hands-on involvement in infrastructure development but are key in overseeing projects, securing funding, navigating regulations, and managing teams. Understanding the specifics of solar and wind energy is essential in these roles, as managers and leaders must handle complex projects, from permitting and financing to project delivery. These skills are a combination of theoretical sector understanding that could be achieved, for example, through first degree or postgraduate specialisation, in addition to extensive work experience in the sector. Albeit these skills are not the main focus of the current study, it is important to acknowledge their involvement in the sectoral skills ecosystem, and in particular in context of their position in career pathways for mid-career and senior professionals.
This report uses the framework outlined in Figure 2 for a comprehensive discussion of training provision that enables solar and onshore wind industries. This is in alignment with the precursor studies, which identified that the highest skilled workforce demands are likely to be within the allied sectors. This report discusses solar, onshore wind, and allied STEM skills training provision in parallel, as the skills needs across solar and onshore wind sectors have high levels of convergence. Any differences between the sectors are highlighted in the text and summarised in the Conclusions.
Figure 2. Conceptual framework of skill types relevant to solar and onshore wind industries.
Methodology
We carried out extensive desk based research, reviewing national and international policies and initiatives related to training provision for solar and onshore wind sectors and the renewable energy sector overall. This included the review of the precursor studies, literature regarding the EU Pact of Skills, International Energy Agency reports, and others.
Following this, we conducted a comprehensive landscape analysis of training provision in Scotland for solar, onshore wind, and other relevant STEM sectors. This process included profiling all training providers in Scotland’s higher and further education institutions, gathering course names and qualifications offered, and analysing course content to understand the themes and topics. We also mapped the geographic distribution of training provision sites to visualise the regional availability of skills provision.
To understand how the training provision aligns with industry needs, we reviewed national occupational standards (NOS) and explored future training initiatives. Additionally, we extracted and analysed student enrolment data from the Scottish Funding Council (SFC) to assess the number of students enrolled in relevant STEM disciplines and compared this with solar and onshore wind workforce demand forecasts from previous studies.
Our stakeholder engagement programme involved consulting a broad range of participants, including those from policy, training providers, supporting organisations, industry, and the supply chain (21 participants) between July and September 2024. Through semi-structured one-to-one interviews via Microsoft Teams, we gathered insights on how current policies affect training provision, the competition for talent, and talent retention. We also explored stakeholders’ views on the barriers and motivations individuals face when pursuing careers in solar and onshore wind sectors. These discussions helped us identify potential actions to address current and future skills gaps, as well as suggestions for improving the targeting, timing, and enhancement of training provisions. A complete list of the organisations we consulted is included in Appendix A.
Key relevant training provision policy and initiatives
Scotland
Policy activity
In Scottish national policy, onshore wind and solar sectors are covered under the umbrella of green jobs / skills and renewables. Scotland’s National Strategy for Economic Transformation (The Scottish Government, 2022) places significant emphasis on building a skilled workforce to drive future economic prosperity. This publication outlines, in general terms, that the skills related to the net zero transition, including renewable energy, will be critical. It emphasises lifelong learning mechanisms such as continuous reskilling and upskilling as key to adapting to fast-paced technological changes. The Climate Emergency Skills Action Plan (CESAP) (Skills Development Scotland, 2020) is a document that outlines key initiatives to equip Scotland’s workforce for the transition to a net zero economy. The Green Jobs Workforce Academy was launched as a service aimed to help the workforce with training, upskilling, and job seeking in the emerging green sectors. The National Transition Training Fund (NTTF) was introduced in 2020 as a direct response to the economic impact of the Covid-19 pandemic. In its second and final year, the fund’s scope expanded and included a more significant emphasis on supporting individuals and employers in the transition to net zero. This followed a commitment within CESAP. Further, CESAP’s original publication indicated the ambition to launch the Green Jobs Skills Hub to provide insights into the skills needed over the next 25 years, working with businesses and educational institutions to ensure training aligns with the demand for green jobs
Additionally, CESAP indicates that sector-specific initiatives, such as the Energy Skills Alliance (now led by the Offshore Petroleum Industry Training Organisation OPITO) and Offshore Wind Skills Group, will map out skills requirements in renewable energy, such as hydrogen production and carbon capture. At a policy level, there is no equivalent regionally targeted working group aimed at solar or onshore wind.
CESAP set an ambition to work with educational institutions to realign curricula with industry needs and offer work-based learning to ensure individuals acquire the skills needed for Scotland’s green economy. Much of this work was carried out through Pathfinder activity under the remit of the Skills Alignment Assurance Group, now Shared Outcomes Assurance Group of the Scottish Government. Lastly, CESAP indicates that a place-based approach will target regional needs, with agencies like Highlands and Islands Enterprise leading efforts in rural areas to promote green job opportunities.
The CESAP Pathfinder Work Package 1 (Skills Development Scotland, 2023) aimed to understand the demand for skills driven by the transition to net zero and to map existing skills provision across apprenticeships, further education, higher education, upskilling, and reskilling. The report revealed that 27% (32,300) of college enrolments are in courses aligned with CESAP sectors. Additionally, around 16% of Scottish university graduates were working in a CESAP sector 15 months after graduation. In terms of apprenticeships, 29% (7,400) of Modern Apprenticeship (MA) starts and 38% (400) of Graduate Apprenticeship (GA) starts were in sectors aligned with CESAP. However, CESAP WP1 report indicates that there is evidence of leakage from this potential skills supply pipeline. Of the university graduates who entered a CESAP sector as their first destination, about 40% took jobs outside of Scotland. CESAP WP1 also highlighted the gap in knowledge of the future destinations of college students.
Future training provision initiatives in Scotland
Stakeholders across Scotland are engaging in a range of initiatives towards optimising future training provision for the whole renewables sector, many of which are targeted at offshore wind. We note that offshore wind skills are often directly applicable to onshore wind, and these are reviewed below. The Scottish Government, as part of its NSET strategy, prioritises a “Skilled Workforce” with a focus on future skills needs, including the net zero transition.
OPITO has introduced credit-rated qualifications in Hydrogen, Oil and Gas, and Wind Power to enhance workforce mobility across sectors. The Energy Skills Partnership (funded by Scottish Funding Council) supports key technical skills across Scotland’s colleges through various Training Networks. National Energy Skills Accelerator (NESA) has secured £1 million from the Just Transition Fund to pilot training programmes, including Performing Engineering Operations – Renewables, Electrical Systems for Renewable Energy, Project Management Fundamentals, and Energy Data Management.
Hosted by the North East Scotland College (NESCol) and funded by the Just Transition Fund, Energy Transition Zone/NESA is also developing an Energy Transition Skills Hub, which will include demonstration and teaching facilities for energy transition technologies and a state-of-the-art welding and fabrication academy. The Engineering Construction Industry Training Board has launched Energy Scholarships to address workforce shortages in roles such as Wind Transfer Technician and Energy Transfer Technician, with trainees receiving training in core engineering skills, new technologies, and digital competencies. RenewableUK and Energy & Utility Skills have partnered to create training and assessment standards for the UK’s renewable energy workforce, including national occupational standards (discussed below) and apprenticeship frameworks.
UK
In July 2024, the UK Government announced a mission to increase onshore wind development. This was marked by the launch of the Onshore Wind Industry Taskforce (UK Government, 2024). One of their key working groups is specifically focused on supply chains, skills and the workforce. The Taskforce will run for up to 6 months and culminate in the publication of a final report, setting out their commitments, and transition into the delivery body.
In May 2023, the UK Government launched the Solar Taskforce (UK Government, 2023) with terms of reference including skills governance for the solar sector. A ‘Draft Solar Roadmap’ was last discussed in the taskforce meeting in March 2024, and the final publication is pending.
European Union
In the European Union (EU), achieving the REPowerEU targets across all renewables sectors is predicted to create over 3.5 million jobs by 2030. In response to this rapid increase in STEM workforce demands, the EU has launched several initiatives to develop a skilled workforce for the renewable energy sector.
One of the flagship efforts as a part of the European Skills Agenda is the Pact for Skills (European Commission, 2020), aimed at upskilling and reskilling the workforce in various industries. One of the themes of the Pact of Skills is the Renewable Energy Ecosystem. This ecosystem is a series of strategic partnerships between the industry and policymakers to ensure sectoral cooperation for the development of skilled workforce in sufficient numbers. Examples of partnerships include Renewable Energy Skills Partnership, Large-Scale Partnership on the Digitalisation of the Energy Value Chain, and Skills Partnership for Offshore Renewable Energy. These initiatives are supported through consistent and sustained funding mechanisms such as Horizon Europe and Erasmus+ funding programmes. This capacity building is strengthened through international cooperation, facilitating the exchange of best practices and expertise, and harmonisation activities in training content.
Another relevant EU policy initiative is the BUILD UP Skills programme (European Climate Infrastructure and Environment Executive Agency, 2011), which has been active since 2011 and focuses on increasing skills in the construction sector, particularly for energy efficiency and renewable technologies. It provides national roadmaps to tackle skills shortages and works through EU funding programmes like Horizon 2020 and LIFE CET to support training for green energy jobs. This highlights that the EU is taking a broad approach to renewable energy workforce development and recognises the allied STEM skills role in it.
Overall, while these strategies aim to effectively transition workers and communities to renewable energy sectors, their success can be difficult to measure as the energy transition is ongoing. The long-term impact of workforce transition and reskilling is yet to be seen.
In addition to the skills governance, broader economic conditions, like market fluctuations and supply chain disruptions, also affect outcomes. The transition’s success ultimately relies on sustained political will, consistent funding, and strong collaboration among governments, industry, and communities.
Review of existing training provision
Targeted training programmes
List of targeted training provision
To identify targeted training provision that is relevant to solar and onshore wind sectors, we profiled course lists available on the websites of training providers (Scotland-based universities and colleges) and collated a list of courses that include renewable energy (general), wind, or solar in their title or public description. For private training provision, we carried out a Google search using keywords such as “Scotland solar PV training courses” and “Scotland onshore wind training courses” and profiled course lists available through private providers (remote training options were excluded from the analysis).
Our analysis of training provision identified a total of 57 courses relevant to solar and onshore wind sectors in Scottish colleges and universities being delivered in 2024/2025. We analysed the course content available in the public description on training providers’ websites and found:
23 courses that include content on renewable energy and energy systems (without specifying wind (onshore and offshore) or solar in the public description)
11 courses that include wind (onshore and offshore)- and solar-themed modules
5 courses that include solar-specific modules
18 courses that include wind-specific modules (onshore and offshore).
Figure 3 illustrates the levels of qualifications offered by the identified relevant courses. This data shows that most solar and wind sector courses are at postgraduate level specialism (25 total). This is in comparison to only 8 courses at the first-degree level, and two courses at SCQF L4. The highest number of targeted skills provision courses were hosted at the University of Strathclyde (10) and NESCol (7). The full list of courses identified as directly relevant to solar and onshore wind sectors is included in Appendix B.
Figure 3. Levels of qualifications of courses targeted to solar and onshore wind sectors available through Scottish public education providers.
We note that the numbers outlined above are a high-level estimation of training provision for solar and wind. Other courses, particularly at BEng and BSc levels in electrical engineering and other allied sectors, might include further content relevant to solar and onshore wind. This analysis, therefore, focuses on courses where solar and/or onshore wind forms the major component of the course content.
In addition to training provision available through Scottish colleges and universities, we identified 110 short courses available through private training providers:
Solar: 5
Wind: 105 (specialist skill training, Global Wind Organisation (GWO) basic safety courses and other safety certifications).
These short courses are typically 1-6 days in duration and include certifications that are critical for safe working on solar and wind sites, as well as highly specialist technical skills and use of highly specialised equipment. The full list of identified relevant course private provision is included in Appendix B, Table 2.
Thematic analysis of course content
We reviewed publicly available information on the contents of college and university courses identified as directly relevant to onshore wind and solar sectors and identified nine key thematic trends. All module names and themes are extracted from STEM course descriptions.
Theme 1: Fundamental engineering and electrical principles.
Description: These modules provide the foundational engineering knowledge crucial for understanding and applying more advanced concepts in renewable energy. Mastery of these basic principles is essential for anyone entering the energy sector, as they underpin much of the work in system design, operation, and maintenance.
Theme 2: Renewable energy technologies and systems.
Module titles: Wind Turbine Technology; Solar Energy Systems; Marine and Wind Energy; Energy Conversion and Storage; Renewable Energy Integration to Grid; Wind, Solar, Hydro, and Marine Electricity Generation; Future Energy; Renewable Energy Technologies.
Description: This theme includes modules that focus on specific renewable energy technologies and systems. Students learn the principles, operations, and applications of various renewable energy sources, including wind and solar, as well as hydro, geothermal, and marine energy. These courses are most directly applicable to the onshore wind and solar sectors.
Theme 3: Power systems and grid integration.
Module titles: Electrical Power Systems; Power Electronics for Energy & Drive Control; High Voltage Technology & Electromagnetic Compatibility; Distributed Energy Resources and Smart Grids; Renewable Energy Integration to Grid; Power Systems Engineering and Economics; Power System Design, Operation & Protection.
Description: Modules under this theme cover the complexities of integrating renewable energy sources into existing power grids. Students are taught the technical and economic aspects of power systems, including high-voltage technology, power electronics, and grid management. This knowledge is essential for ensuring that renewable energy can be effectively and efficiently incorporated into the larger energy infrastructure.
Theme 4: Practical skills and hands-on experience.
Module titles: Assembling and Testing Fluid Power Systems; Operation and Maintenance of Wind Turbine Systems; Basic Hydraulics.
Description: Practical experience is a critical aspect of training in the renewable energy sector. These modules focus on hands-on learning, where students gain direct experience with the operation, maintenance, and troubleshooting of renewable energy systems. This practical knowledge is crucial for developing the skills needed to work effectively in the field.
Theme 5: Health, safety, and industry-specific certifications and standards.
Module titles: Health and Safety Passport (CCNSG); GWO BTT Course (Electrical, Mechanical, Hydraulics); ECITB Mechanical Joint Integrity Training; Solar and energy storage system design and installation modules recognised by Microgeneration Certification Scheme (MCS).
Description: Industry-specific certifications and skills are vital for professionals in the renewable energy sector. This theme includes modules that provide the necessary certifications and specialized training required by the industry. These qualifications are crucial for meeting industry standards and ensuring that professionals are fully prepared for their roles.
Theme 6: Sustainable energy and environmental impact.
Module titles: Basic Evaluation of the Impact of Energy Generation on the Environment; Sustainable Energy Management; Environmental Impact Assessment.
Description: Modules in this theme explore the environmental aspects of energy production and the importance of sustainability. Students learn about the environmental impacts of different energy sources, strategies for sustainable energy management, and how to reduce emissions and pollution. These modules are critical for understanding the broader environmental implications of energy projects.
Theme 7: Project management and strategic planning.
Description: Effective management and strategic planning are crucial for the successful execution of renewable energy projects. These modules equip students in STEM courses with the skills needed to manage complex projects, plan strategically, and navigate the economic and regulatory landscapes. This theme prepares students for leadership roles within the industry.
Theme 8: Innovation and advanced technologies.
Module titles: Data Analytics & AI for Energy Systems; 3D Printing and Inventor Programmable Logic Controllers (PLCs); Advanced Control Engineering; Digital Signal Processing Principles; Renewable Technology Commercialisation
Description: Innovation drives progress in renewable energy, and this theme covers the latest technologies and methodologies that are transforming the industry. Courses in this category focus on advanced technologies like AI, IoT, and programmable logic controllers, which are crucial for developing new solutions and improving existing systems in the renewable energy sector.
Theme 9: Energy economics and sustainability policy.
Module titles: The Economics of Community Wealth Building; Net Zero Society; Transition to Net Zero; Understanding Sustainability Discourses; Energy Resources & Policy
Description: This theme covers the economic, policy, and sustainability aspects of the energy sector. Modules in this category focus on the financial and regulatory frameworks that influence renewable energy projects, as well as the broader societal impacts of transitioning to a net-zero economy. Understanding these factors is essential for anyone involved in the strategic planning and implementation of renewable energy projects.
Based on these desk research findings, we conclude that the overall scope of current training courses has the potential to equip trainees with a wide range of skills suitable for various roles in the solar and onshore wind sectors, from technical and practical positions to environmental and project management. The courses also cover important areas like health and safety, policy, economics, and innovation, providing a solid foundation of knowledge for these industries. Stakeholders expressed a difference in opinion on the suitability of the content of current training provision for the industry. This is discussed in detail in Section 8.1.
Training provision alignment with industry needs
National Occupational Standards
National Occupational Standards (NOS) describe the skills, knowledge and understanding required to undertake a particular job to a nationally (UK-wide) recognised level of competence. NOS are proposed, developed and updated in response to industry needs. The process is usually led by the relevant industry skills association, that works with employers and sector experts to collectively refine NOS through a process of consultation. The NOS are then approved by UK government regulators to ensure that they meet industry requirements. NOS are the foundation for vocational qualifications, including apprenticeships. Learners are assessed against NOS to ensure that they have achieved the necessary competencies to be employed in that occupational role.
NOS are grouped into business sectors. There are 22 NOS that are grouped in the wind turbine sector, although only two are specific to wind turbines. There are 16 that are grouped in the solar PV sector, all but two of which are specific to solar PV. These NOS are listed in Appendix C, Table 3. As of the time of the creation of this report, a review of the NOS is ongoing (Energy and Utility Skills, 2024).
Activity towards aligning curricula and industry needs
Based on intelligence received from industry, ESP previously created a Wind Training Network for the College sector. The Colleges were strategically located in areas where there was a demand for onshore wind turbine technicians. The network has grown from the original 3 colleges and now consists of 11 throughout Scotland to meet forecasted demands.
The curriculum content is co-created by colleges and industry and continues to evolve with direct industry input from companies such as Natural Power, that have sponsored wind turbine technician courses at Dumfries & Galloway College with direct routes to employment offered. This model is forecast to be rolled out to other areas where demand exists and can be duplicated and adapted by additional industry partners.
Colleges are collaborating with industry partners to deliver short technical courses for wind turbine technicians that include GWO BTT qualifications. The teaching materials are shared resources within the network and a collaborative approach to delivery is used. To date, the solar sector has not had the same level of interest, but as demand increases a similar college training network model can be implemented to increase capability and capacity to meet this growing demand, both strategically and sustainability. We note that there is minimal activity towards future training provision for the solar sector, especially in the context of large ground-mounted projects. One stakeholder noted that the minimal activity of ground-mounted projects in the planning pipeline has led to a lack of clear indication from the industry about its skills needs for these projects, making it challenging for training providers to respond.
Allied sector STEM skills provision
Overview
As illustrated in Figure 2, both onshore wind and solar sectors are further enabled by a skills base drawn from allied sectors. These skills are fundamentally rooted in non-energy-focused disciplines such as engineering (electrical, mechanical, civil, and structural), and applied disciplines such as construction, welding, electrical installation and others.
We have identified a total of 389 courses available through Scottish universities and colleges that are aligned with these topics (Figure 4). These courses are distinct from the courses identified in the section above. In this STEM training provision, we identified 10 Foundational Apprenticeships, 16 Modern Apprenticeships, 8 Graduate Apprenticeships and 14 pre-apprenticeship courses. Many of these apprenticeships are provided via the apprenticeship frameworks (listed in Appendix D). Additionally, apprenticeships are also available through private companies, and typically these would not be advertised through training providers’ course lists and websites.
Figure 4. The number of courses in the allied sectors relevant to solar and onshore wind per provider.
Thematic analysis
A thematic analysis of the course content reveals broad provision across core engineering disciplines, particularly in structural, mechanical, civil, and electrical engineering. Key areas such as structural mechanics, geotechnical engineering, fluid mechanics, thermodynamics, and power electronics demonstrate comprehensive training in fundamental engineering topics. The curricula also place significant emphasis on computational techniques, with modules such as computer-aided engineering design, mathematical modelling, and finite element analysis providing students with essential design and analysis skills.
Environmental and sustainability topics are well-represented, with courses such as environmental engineering, water resource management, and sustainability, reflecting the growing importance of sustainable practices in engineering. Some of the curricula further include emerging technologies, such as artificial intelligence, machine learning, and Internet-of-Things as interdisciplinary data science fields. Additionally, modules in project management, risk management, and engineering innovation and management offer robust professional skills development, preparing students for leadership roles in managing engineering projects.
However, there are potential gaps. Emerging technologies, such as artificial intelligence, machine learning, and Internet-of-Things generally remain under-represented. The curricula could also benefit from expanded coverage of specific renewable energy subsectors, including solar and onshore wind; the current course content only mentions “wind” three times and “solar” two times.
In summary, while the course content provides a strong foundation in traditional and modern engineering disciplines, there is room to enhance the curricula by incorporating more emerging technologies and renewable energy topics. This would better prepare students for the evolving challenges of the engineering profession. It would also encourage students from engineering backgrounds to further specialise in solar and onshore wind sectors, particularly considering the lack of targeted solar and onshore wind coverage at undergraduate levels.
Geographic distribution of training provision
Locations of training provision
Research shows that future onshore wind farm developments will be in remote and rural areas of Scotland such as the Highland and parts of Dumfries and Galloway, resulting in a sharp increase in skills requirements in these geographies (Morrison et al, 2024). In comparison, commercial rooftop solar projects in Scotland are mainly based around densely populated areas, including the central belt, Borders, Dumfries and Galloway, the east, north-east, and Inverness. Ground-mounted solar projects will be primarily situated in rural areas like Aberdeenshire, Angus, Fife, and Tayside (Creamer et al, 2024), where there is ample land for larger systems.
We have created a map that shows where the targeted training provision is available (Figure 5). Most of these locations are aligned with the locations of higher and further education institutions, and it has been supplemented with locations of the private training provision company sites. It shows that the training provision is located within the central belt of Scotland, as well as Aberdeen and Inverness. There is an obvious disparity between the locations of training providers and the geographic regions where the solar and onshore wind workforce will be in the highest demand.
Figure 5. Geographic locations of Scottish training providers (colleges, universities, and private companies) offering courses relevant to solar and onshore wind sectors.
Stakeholder commentary on the development of local talent
Attraction, development, and retention of local talent pools in remote and rural areas was highlighted as an area of high concern by 9 of 21 stakeholders. The Highlands, in particular, faces substantial challenges in attracting and retaining local talent and developing a skilled regional workforce. Two regional stakeholders expressed an opinion that the Highlands is an emerging industrial cluster and predicted a sharp increase in demand for technical talent. This is an area of concern because the region has a rapidly ageing population (Highlands and Islands Enterprise, 2019).
“We don’t actually have enough (…) people for all the jobs that are going to be available.”
The temporary nature of jobs in the construction stages of solar and onshore wind projects further exacerbates the issue with the development of local talent. Construction and commissioning stages of projects in solar and onshore wind industries are marked by a sharp increase in workforce requirement. However, this demand is temporary as the construction stage of project development takes 2-3 years and is seasonal. As such, the industry is heavily dependent on a mobile skilled workforce. One stakeholder highlighted that the current reliance on bringing an external workforce to the region is, in effect, a barrier to the development of a stable, local talent pool for solar and onshore wind sectors. This is due to the fact that, from an industry perspective, skilled regional workforce development takes a significant investment of time that is not aligned with timelines of a typical project. From the workforce perspective, these temporary job roles might not serve as a basis for a life-long career and, therefore, make the sectors less attractive to new entrants.
“The reliance on transient workforce [means] there’s no real demand from developers to try and develop a workforce locally.”
In addition, two stakeholders indicated that the planned acceleration in onshore wind activity in England is a potential threat to maintaining a stable technical talent pool in Scotland. They explained that this acceleration is likely to drive a rapid increase in demand for skilled workers in England, where there is an anecdotal shortage of talent, prompting the industry to potentially draw from the Scottish workforce. Additionally, remuneration in England is perceived as higher, which could further incentivise talent migration.
“There is a concern that Scotland could lose a significant chunk of its skilled workforce to England.”
Addressing the future skilled workforce demands
Analysis of SFC data
To understand analyse the scale of skills being delivered against the projected future skilled workforce demands, we extracted data in relation to the total number of enrolments in all STEM-related courses identified as relevant to onshore wind and solar sectors. This was done in collaboration with the Scottish Funding Council.
The analysis of enrolment numbers on a course level was not possible as the data request could not be fulfilled in the timelines of this study. Therefore, the datasets discussed below are assessing combined annual enrolment numbers in both targeted and broader STEM training provision courses.
In the most recent available dataset (2021/2022), the total full person equivalent (FPE) enrolment in first degree, postgraduate taught and postgraduate research courses broadly identified as relevant to the sectors was 53,585 (Figure 6). The transferability of skills from these courses into solar and onshore wind is illustrated in Appendix D, Table 5.
Figure 6. Number of enrolments (full person equivalents) in courses relevant to solar and onshore wind sectors in Scottish higher education institutions (2021/2022).
In the most recent available dataset (2022/2023) the total FPE enrolment in Scottish college courses that are engineering-focused and identified as relevant to solar and onshore wind and allied sectors was 14,890 (Figure 7).
Figure 7. Number of FPE enrolments in engineering courses identified as relevant to solar and onshore wind sectors in Scottish colleges (2022/2023).
To reiterate, previous studies have estimated the peak total workforce requirement for solar and onshore wind sectors as 11,000 and 20,500 respectively. The FPE numbers of the current training provision have been provided as an illustration of the training capacity of further and higher education institutions in Scotland in courses relevant to solar and onshore wind. However, it is critically important to note that the total FPE numbers illustrated in Figure 6 and Figure 7 above do not imply that Scotland’s skilled workforce needs are being addressed by the existing training provision. People from these courses enter a range of different industries, and this is explored further in Section 7.2. Additionally, annual FPE enrolments in the relevant courses do not equal the number of individuals completing the training, or the number of graduates that are entering the workforce. For example, the number of graduates in a four-year training programme could be 25% of the total FPE number (the 4th year trainees).
Further, the data on the future destinations of students undergoing the training is fragmented, and this has already been flagged by CESAP Work Package 1 report (Skills Development Scotland, 2023). The recent SDS Apprentice Voice publication states that 71% of modern apprentices are still working for the employer with which they completed their modern apprenticeship 15 months after completion (SDS, 2024). Further research could explore the demographics, interests, and future career pathways of students in training to clarify the true number of entrants into the renewables sector and identify their subsector preferences.
Competition for talent
Due to the short timeline for meeting the 2030 installed capacity ambitions, addressing future skilled workforce demands in solar and onshore wind sectors will rely on cross-sector skills transfer. Interviews highlighted that one dominant sector that provides technically skilled talent to renewables, in particular onshore and offshore wind, is ex-service personnel (6 of 21 stakeholders).
Technically skilled talent is in high demand across many sectors, including other renewables (hydrogen and offshore wind), manufacturing, construction, the utility companies, and others. The competition for talent within the onshore wind and solar sectors is also fierce. As a consequence, workforce retention is an issue. This was highlighted as a critical challenge by 14 of 21 stakeholders consulted. Stakeholders highlight that a siloed approach to skilled workforce planning is a potential threat to the renewables sector as a whole.
“We’re competing with so many other sectors for the same skill sets… it’s a very competitive marketplace.”
In addition to problems in attracting talent from other industries, solar and onshore wind sectors face significant challenges in retaining skilled workers within their roles (14 of 21 stakeholders).
“We did go through a period… where there was very high turnover and lots of people leaving.”
Talent mobility is high, with workers often moving on to more lucrative or appealing opportunities after a short period. This disincentivises the industry to invest in workforce development via traditional pathways.
“The investment of spending three years training them [apprentices] [is significant]. At the end of it, a lot of them were literally staying in the role for six months, then looking to the next thing.”
The ageing workforce in parts of the solar and onshore wind sectors represents an additional challenge in training and developing talent.
“We’re losing a lot of our real experienced people that would normally mentor those coming in straight from uni… that’s where the struggle is.”
“The ageing workforce and impending retirements are exacerbating these challenges, as there are not enough experienced workers to mentor new entrants.”
The limited talent pool can result in solar and onshore wind companies headhunting suitably trained technical talent within their supply chains, with potentially detrimental consequences to these suppliers.
“When we’ve got good people… the developers come and use us as a recruitment location (..) clearly you can’t restrict people’s careers but (..) that’s a challenging area for us.”
The industry indicates that more innovative training mechanisms will be required to address the issues with training and retention, and these are discussed in Section 8.
Sector visibility and attractiveness
Due to the overall high demand for a technically skilled workforce, stakeholders highlighted that improving the visibility and attractiveness of the sector is a key element in ensuring that the future skills demands are met (11 of 21 stakeholders). They suggest that one strategy for ensuring optimal communication of sector attractiveness is by clearly describing the opportunities for life-long, diverse careers in these sectors. This can be achieved, for example, through the development of clear career pathway maps by building on the sectoral overlap matrix conceptualised in Figure 2, for example by illustrating career paths from technical roles into leadership, management, and planning (other skills).
“People want to see, okay, where can I go next? They want to see that career path… that’s where we need to be to attract people.”
“We need visibility of career pathways… there will be a lot more interest if there’s more visibility of how they can go about obtaining those roles.”
“The biggest challenge is that they don’t know how to progress within the sector.”
One stakeholder indicated that some companies in the onshore wind sector use career mapping internally as a tool for increasing employee retention within the organisation.
“We’re doing a lot of that internally now… developing a career path map so people can see the visibility of where they can go.”
One stakeholder, actively engaged with skilled individuals looking to transition to onshore renewable energy, indicated that the overall levels of visibility and clarity about the requirements and opportunities in solar and onshore wind are relatively low.
“They [skilled individuals seeking to transfer to renewables] need to understand the route to becoming a fully qualified electrician to get into solar installation.
For solar, we’re not seeing the volume of opportunities.
We’re talking a lot about the opportunities but they’re just not visible… we don’t see the wind turbine technician roles coming up that often.
Training provision gaps, barriers, and opportunities for improvement
Gaps and barriers
Gaps in training provision and alignment with industry needs
Stakeholders (16 of 21) consistently highlighted a significant gap between the content and capacity of existing training programs and the specific needs of the solar and onshore wind sectors. This gap is particularly evident in specialised, role-specific training, such as for wind turbine technicians and ground-mounted solar project development specialists. This is in contrast to the findings outlined in the Section 6 above, suggesting suboptimal levels of communication between the education providers and the industry in tailoring course content to the industry’s specific needs.
“We have generic degree courses in electrical engineering… it’s probably more the specialisms that we’re lacking just now.”
“There is no single qualification in solar. Generally, qualifications are part of a wider training provision.”
“I’ve got engineers at the moment that I need to get up-skilled in solar… the closest training course I can find is in the south of England.”
The mismatch between academic offerings and industry requirements creates challenges in producing a workforce that is ready to contribute effectively from day one. Stakeholders highlighted that training provision is reactive rather than proactive and does not anticipate the industry’s needs to meet the 2030 installed capacity ambitions.
“The qualifications available in Scotland are very generic… we need a much more work-ready solution so that when people come out of training, they have a much better insight into the specifics.”
“Most training providers at the moment are looking to provide training for current demand. And there’s no foresight as to what that’s going to look like in the next two, three years.”
A few stakeholders (3/21) indicated that skills provision for solar sector, and especially large-scale commercial rooftop and ground mounted solar, is limited in Scotland. This opinion is supported by the desk based research findings that showed that most solar-targeted training provision is specialised on domestic rooftop installations. There is a clear deficit in targeted training for the more complex and technically demanding aspects of large solar projects.
“Solar is lagging behind – all on awareness level, not competence-based… solar farms are less catered for.”
“There is very limited experience on these types of projects [large commercial and ground-mounted projects]”.
Barriers to increased training provision
A recurring theme that was highlighted by 15 of 21 stakeholders as a critical issue is the lack of targeted funding for training provision, which has become a significant barrier to expanding and adapting training programmes.
“Funding is the main issue… the absolute allocation to individual Modern Apprenticeships has not increased for 10 years.”
“Colleges are struggling to provide [relevant training provision] without external support.”
The financial constraints are compounded by the high costs of the necessary infrastructure and materials, leaving institutions to rely on limited general budgets.
“These are very expensive courses to cover in comparison with other courses.”
“My understanding is that there’s only one college right now that has the equipment to deliver high-voltage training.”
Stakeholders indicated the need for ring-fenced funding to support the development and delivery of courses that are specific to solar and onshore wind sectors. This has become particularly important after the termination of the National Transition Training Fund in 2022. One stakeholder further indicated the need for ringfenced funding for safety certifications to ensure that the skilled workforce is certified to work in solar and onshore wind environments.
“We have nothing… all of that ring-fenced funding is now gone.”
“The funding available is often for higher-level qualifications, but it doesn’t apply to safety tickets or other certifications, which can be a barrier.”
Stakeholder commentary on policy
Stakeholders (10 of the 21 consulted) highlighted that policy has a central role in market certainty and, therefore, future skills needs planning and training provision. Uncertainty, particularly concerning the future pipeline of projects, complicates long-term workforce planning. Companies are hesitant to invest in long-term workforce development initiatives without clearly understanding future project demand. At the conclusion of this study, the upcoming Energy Strategy and Just Transition Plan had not been published. Stakeholders highlighted that industry has interpreted this as a signal of market uncertainty, which by extension complicates their future workforce planning.
“We need confidence that there’s a long-term pipeline of projects… that gives us the green light to look at investment and ramping up the workforce.”
“If you’re recruiting an apprentice, you’re planning three or four years out… that’s challenging to do without certainty.”
Stakeholders also indicate that the skills governance and policy for solar and onshore wind currently lack certainty and strategic direction. This is in contrast to offshore wind skills governance, which was seen as substantially more mature, despite the lower levels of sector maturity compared to onshore wind. In addition, it was highlighted that the ongoing post-school education reform complicates future workforce development planning. In this context it is challenging for education providers to allocate resources to critical skills areas and delays the alignment of curricula with emerging industry needs, affecting the preparedness of trainees.
“The problem within my space at the moment is all our policy is up in the air… we’re waiting for (…) the funding review.”
“Without a clear directive from the government, the training provision will continue to be reactive rather than strategic.”
Overall, stakeholders called for a more strategic, top-level intervention from a policy perspective that would involve industry, training providers, and funding bodies.
Opportunities for enhancement
Modular and flexible training programs
The need for modular, flexible training programs that can quickly upskill individuals with relevant but incomplete experience is a recurring theme that was highlighted as the opportunity for training enhancement (14 of 21 stakeholders). These programs should be designed to provide targeted, condensed training that aligns with industry needs, allowing workers to become productive more quickly.
“They have the base skills and they just need a little top-up to actually enable them to move into the sector. We need to condense [training provision] into something intense, something that people can do in short courses.”
“If we [the industry] could fund modular type activities… that would really suit us.”
“We could take a more modular approach… train you to do [a certain task] and then upskill you as needed, but in the meantime, you’re productive much more quickly.”
The main idea behind modular training provision is to identify areas where a worker requires additional support while using their existing skills within the workforce. Two stakeholders described this process as skills “top-up”, as opposed to full retraining of already skilled workers that would remove them from the workforce for an extended period. This could be integrated into the existing training provision, with apprenticeships highlighted as one of the most important mechanisms for the delivery of a skilled workforce to the solar and onshore wind sectors.
“The perfect mix is where you have [modular training within] degree apprenticeships. They’re learning the fundamentals while getting operational experience.”
In addition, one stakeholder indicated that modular training provision could also support increased levels of training of trainers, expanding the skillset that can be passed on through existing training provision mechanisms. This highlights that the modular training provision could benefit different stakeholder groups and be synergistic for the development of skilled workforce.
Strategic collaboration between stakeholders
Effective workforce development in the renewable energy sector requires a coordinated effort between industry, government, educational institutions, and training providers. Stakeholders (18 of 21) consistently highlighted the need for improved communication and partnership that can lead to more effective training and recruitment efforts. This collaboration should focus on not only bringing together stakeholders from solar and onshore wind but also other relevant sectors.
“Employers need to work with training providers… to put together a training piece that’s going to assist [workforce that is looking to transfer] based on topping up their skills.”
“We just need to get that communication from industry… they [training providers] will absolutely ramp up and align their courses with it and we [a networking organisation] can support them to flex what they offer as well.”
“Government, industry, and training providers should be working more closely to develop a much more modular approach to the delivery of training.”
One stakeholder highlighted that, whilst the relevant people are “often in the same room…” they are “…speaking different languages”. This comment relates to the fact that policymakers, industry, education providers, and other stakeholders often tend to have different and occasionally conflicting priorities. As such, the solar and onshore wind sectors could benefit from more strategic and mediated conversations and relationship-building activities to ensure synergy between stakeholders.
Importance of practical training and on-the-job experience
There is a strong emphasis on the need for practical, hands-on experience in training programs. Many stakeholders (12 of 21) believe that current training programs are too theoretical and do not provide the real-world skills needed for success in the solar and onshore wind sectors.
“The practical element… is fairly limited, so we’re going to do more of that in-house now to meet the needs.”
“We’re still going to need months, if not years, of training them on our products… they have good general electrical engineering knowledge, but not the specifics.”
Two stakeholders indicated that, currently, qualifications alone do not guarantee competency to work in the sector.
“Just because someone is a qualified electrician, it doesn’t make them competent.”
Stakeholders also noted that the academic environment cannot prepare the future workforce for all required job roles in the industry, especially in mid-management. This relates to the previous insights associated with the ageing workforce; as the sector relies heavily on existing career professionals to upskill newcomers, mentorship and guidance must remain available to those entering the sector. This also applies to skilled workers transferring from other sectors to solar and onshore wind.
“The academic environment… doesn’t equip them as project managers. A lot of it realistically… where you get the real training is on the job.”
“We’ve been much more focused on… are they the right person culturally to fit the organisation… then we can train them from an experience point of view.”
Lessons learnt
The findings of our study suggest a series of key themes that could be used for future consideration in developing training provision for the onshore wind and solar sectors.
Although our analysis of current solar and wind sector courses found a theme of ‘practical skills and hands-on experience’ in the descriptions, industry stakeholders did not feel that this is sufficiently represented in the training available. Training providers need to ensure that the course content is relevant to industry needs, in particular regarding hands-on training and close collaboration with industry partners, including through apprenticeships. Access to internationally recognised, accredited training, such as GWO Health & Safety, should be prioritised to ensure that workers receive industry-standard qualifications.
Currently, most solar and wind sector courses are at postgraduate level of specialism. A shift towards a more flexible, modular approach to upskilling and reskilling the workforce is needed. This would allow individuals to tailor their training to specific needs rather than undergoing full retraining programmes. This has the potential to enable faster movement of individuals from training into the workforce which would benefit the industry.
Improved collaboration and communication between stakeholders is another critical lesson. The important role of government in creating clear market signals and strategic skills governance has been highlighted. Establishing more formal partnerships and regular cross-industry and education forums could help foster greater coordination and break down the siloed approach to workforce development. It would also benefit the SMEs in the solar and onshore wind sectors that cannot carry out substantial skills development programmes on their own.
To support the above points, there is a need to enhance and modernise existing funding mechanisms. This includes re-establishing targeted funding streams, encouraging industry investment in training, and exploring new funding models to support specialised programmes such as modular training options. In particular, there needs to be significant investment in practical infrastructure to support hands-on training.
This research highlights the centrality of allied STEM and other roles shared by both onshore wind and solar skills development. A siloed approach to STEM workforce planning is a threat as several industries are drawing from the same talent pool, resulting in competition with their vital supply chains. A more integrated perspective would consider the requirement for a STEM workforce across all infrastructure projects of national importance and overall installed capacity ambitions. A comprehensive map that details the scale, timelines, and workforce demands of major infrastructure projects has the potential to inform the total scale of skilled workforce needs and alleviate some concerns regarding the temporary nature of some job roles at times of peak demand. Such a map could be used as a signal of the availability of lifelong careers in these diverse sectors. Understanding the flow of skilled workforce amongst solar and onshore wind sectors and between other sectors will be vital to maximising skills and workforce potential.
Another suggestion for policy and the broader stakeholder ecosystem is the need to develop robust and compelling career pathways through comprehensive career mapping. Research is needed to outline career progression within the solar and onshore wind, as well as the broader renewable energy sector, and compare it with other major industries to create a comprehensive transferability framework. Identifying key roles, required skills, and potential career progression routes can provide clarity for professionals entering or transitioning within the sector, making it more attractive and accessible. This approach will be essential for addressing both recruitment and retention challenges.
Conclusions
In summary, current training provision has the potential to deliver the skilled workforce required for the solar and onshore wind sectors if it is strategically supported through policy certainty, targeted funding and changes in modes of training delivery. The need for intervention is urgent, as research indicates a peak in workforce demand as early as 2027 (Morrison, et al., 2024).
We have conceptualised the sectoral overlap of skills for the onshore wind and solar sectors (Figure 2). This demonstrates that although critical, specialised skills training provision is needed for solar and onshore wind separately, the majority of roles are shared by the sectors requiring allied STEM and other skills. We found that there are gaps for both sectors in specialised, role-specific training aligning to industry needs. However, siloed approaches for skills governance in solar and onshore wind could be counterproductive as the sectors compete for many of the same skillsets.
Allied STEM skills training provision in Scotland is extensive, with a significant number of students enrolling in relevant and transferable courses each year. These programmes equip trainees with foundational skills that can be applied across various sectors, including renewable energy. However, there is a lack of clarity regarding student destinations after completing these courses, making it difficult to track how many trainees are entering the solar and onshore wind sectors in Scotland. Stakeholder engagement highlighted that the onshore wind and solar sectors need to increase their job attractiveness in a highly competitive skills marketplace, including through increased visibility and clear career pathways.
Throughout this report, we have demonstrated the value of an integrated perspective, with the above conclusions being applicable to both sectors. However, our findings also suggest conclusions for the specific sectors, as set out below.
Sector specific conclusions: Onshore wind
Training provision for the onshore wind industry is available in Scotland but needs better alignment with the sector’s specific operational demands, especially with a stronger emphasis on practical, hands-on skills like wind turbine maintenance and site management. While there are few significant barriers preventing individuals from entering the industry, poor sector visibility is an issue. Industry leaders are keen to see training programmes that allow workers to quickly transition into the workforce, building on their existing knowledge while providing opportunities for continued upskilling. Modular training and “topping up” skills are considered vital to ensuring that workers can effectively meet the evolving needs of onshore wind projects and contribute to the industry’s success.
Sector specific conclusions: Solar
The solar industry in Scotland faces several challenges related to training and skills development. Currently, training provision is limited to domestic rooftop installations, which already require an electrical qualification. A major concern is Scotland’s lack of expertise in ground-mounted solar, which poses a potential threat to the sector’s development. There are no specialist courses available or training providers equipped to deliver the necessary skills. Skills governance for the solar sector is also lagging behind that of other renewable sectors, which further hinders the industry’s growth.
Like the onshore wind sector, the solar sector would greatly benefit from increased modular training provision to upskill workers quickly. However, training providers require a clear signal from the industry indicating a need for such courses. Addressing these gaps is essential for ensuring that the solar industry has a skilled workforce capable of supporting its growth.
Next steps
This study has identified the key barriers, opportunities and needs for intervention to increase training provision for solar and onshore wind sectors in Scotland. The next critical step is to develop a detailed, fast-paced action plan that engages all key stakeholders, including policymakers, industry representatives, training providers and potential talent pool representatives. Given the urgency of workforce demands and a projected peak of skills need as early as 2027, this action plan must establish clear and fast-paced timelines for intervention, with an aim to launch initiatives before the start of the next academic year (2025/2026). Coordinating this effort will be crucial to ensuring that Scotland can support the sectors’ rapid growth and deliver its renewable energy commitments.
Creamer, D., Beinarovica, J., Weir, I., Stodart, J., Romero, I. (2024) ‘Workforce and skills requirements in Scotland’s solar industry.’ Available at: https://www.climatexchange.org.uk/projects/workforce-and-skills-requirements-in-scotlands-solar-industry/ (Accessed: 25/09/2024).
Engineering and Construction Industry Training Board
ITPEnergised
Scotland’s Electrical Trade Association (SELECT)
Career Transition Partnership
EVO Energy
Dumfries and Galloway College
Ayrshire College
NMIS/University of Strathclyde
NESCol/Energy Transition Skills Hub
NESCol/National Energy Skills Accelerator
Hitachi Energy
SSE Renewables
Scottish Power Renewables
Highland Council
Energy Skills Partnership (ESP)
Institution
Level
Course name
Ayrshire College
L5 (school)
Skills for Work Introduction to Renewable Energy
Ayrshire College
L5 (pre-apprenticeship)
Electrical Engineering and Renewables
Ayrshire College
SCQF L6
Wind Turbine Systems
Borders College
No formal qualification
Introduction to Renewables Technology SPF
Dumfries & Galloway
NC (SCQF L6)
Natural Power Wind Turbine Technician Trainee
Dumfries & Galloway
NQ (SCQF L4)
Introduction to Engineering and Renewable Energy
Dumfries & Galloway
GWO
Basic Technical Training (BTT)
Dumfries & Galloway
SCQF L5
Renewable Energy Practical Skills
Edinburgh
BEng
Energy and Environmental Engineering
Edinburgh Napier University
BEng
Energy & Environmental Engineering
Fife
GWO
Basic Technician Training
Forth Valley
BPEC (NOS Mapped)
Solar Photovoltaic Systems
Glasgow Caledonian University
BEng / MEng
Electrical Power Engineering
Glasgow Clyde
BPEC
Electrical Energy (Battery) Storage Systems (EESS)
Glasgow Clyde
BPEC
Solar Photovoltaic (PV) Systems
Heriot Watt
MSc
Renewable and Sustainable Energy Transition
Heriot Watt
MSc
Renewable Energy Engineering
Inverness (UHI)
BEng (Hons)
Energy Engineering
Inverness (UHI)
MBA
Renewable Energy
Moray (UHI)
MBA
Renewable Energy
Moray (UHI)
BEng (Hons)
Energy Engineering
NESCoL
SCQF 4/5
Automation & Renewables
NESCoL
NC (SCQF L5)
Engineering Systems: Renewables
NESCoL
NC (SCQF L5)
Engineering Systems: Renewables
NESCoL
Skills for Work (SCQF Level 5)
Engineering: Sustainability & Renewables
NESCoL
ECITB (SCQF Level 6)
Engineering: Wind Turbine Technician (WT) Pathway
NESCoL
SCQF Level 5
Girls in Energy
NESCoL
SCQF Level 5
Performing Engineering Operations: Renewables
NESCoL
Online certificate
Principles of Sustainable Energy Management
North West & Hebrides (UHI)
BEng (Hons)
Energy Engineering
North West & Hebrides (UHI)
PDA
Renewable Energy Systems
North West & Hebrides (UHI)
MSc
Sustainable Energy Solutions
North West & Hebrides (UHI)
CPD (SCQF L9)
Sustainable Resource Management
North West & Hebrides (UHI)
MBA
Renewable Energy
Perth (UHI)
BEng (Hons)
Energy Engineering
Perth (UHI)
MBA
Renewable Energy
Robert Gordon University
BEng / MEng
Renewable Energy Engineering
SLC
BPEC
Solar PV
University of Aberdeen
MEng
Electrical and Electronic Engineering with Renewable Energy
University of Aberdeen
MEng
Energy Transition Systems and Technologies
University of Aberdeen
MSc
Renewable Energy Engineering
University of Edinburgh
MSc
Advanced Power Engineering
University of Edinburgh
MSc
Electrical Power Engineering
University of Edinburgh
MSc
Sustainable Energy Systems
University of Glasgow
MSc
Sustainable Energy
University of Strathclyde
MSc
Offshore Wind Energy
University of Strathclyde
MEng
Electrical Energy Systems
University of Strathclyde
MSc
Advanced Electrical Power & Energy Systems
University of Strathclyde
MSc
Advanced Mechanical Engineering with Energy Systems
University of Strathclyde
MSc
Electrical Power and Energy Systems
University of Strathclyde
MSc
Energy Systems Innovation
University of Strathclyde
MSc
Renewable Energy & Decarbonisation Technologies
University of Strathclyde
MSc
Sustainable Engineering: Offshore Renewable Energy
University of Strathclyde
MSc
Sustainable Engineering: Renewable Energy Systems & the Environment
University of Strathclyde
MSc
Wind Energy Systems
University of the West of Scotland
MSc
Sustainable Technology and Energy
West Lothian
SCQF Level 5
Electrical Sustainability Through Renewable Technology
Table 1. Training provision relevant to solar and onshore wind sectors available through Scottish colleges and universities in the academic year 2024/2025.
Organisation
Course name
Skills Training Group
Solar PV Installation Course With Battery Storage
BPEC
BPEC Solar Photovoltaic Systems NOS Mapped
TotalSkills
Level 3 Solar PV & Battery Storage Systems EESS – 4 Day course
Energy Technical Academy Group
Solar PV Installer Training (Solar PV & Battery Storage)
IRT Scotland
Roof Safety for Solar Installers
Clyde Training Solutions
GWO Advanced Rescue
Clyde Training Solutions
GWO Wind Basic Technical Straining
Clyde Training Solutions
GWO Enhanced First Aid
Clyde Training Solutions
GWO Sea Survival Training
Clyde Training Solutions
GWO First Aid Training
Clyde Training Solutions
GWO Manual Handling
Clyde Training Solutions
GWO Working at height
Clyde Training Solutions
GWO Basic Safety Training (BST) Package – Offshore
dwpa
Wind Turbine Technology Essentials
dwpa
Advanced Platform Theory
dwpa
Wind Turbine Maintenance
dwpa
Wind Turbine Troubleshooting
dwpa
Maintenance Quality Inspection (MQI)
dwpa
Asset Integrity Inspection (AII)
dwpa
Turbine Operation & Maintenance
dwpa
Gearbox Maintenance & Inspection (GMI)
dwpa
Remote Operations Awareness
dwpa
Operation & Maintenance Awareness
Aurora Energy
GWO Working at Height
Aurora Energy
GWO Manual Handling
Aurora Energy
GWO First Aid
Aurora Energy
GWO Fire Awareness
Aurora Energy
IRATA Rope Access
Aurora Energy
Mechanical Joint Integrity (MJI)
Aurora Energy
Confined Space Entry
Aurora Energy
Working at Height
Aurora Energy
CCNSG Safety Passport
Aurora Energy
ECITB CCNSG LaTS (Leading a Team Safely)
Aset Training
ECITB MJI 10, 18, 19: Mechanical Joint Integrity
Aset Training
ECITB MJI 33: Torque and Tension Wind Turbine Bolted Connections
Aset Training
Flange Make Up and Bolting for Integrity: SCQF Level 6
Aset Training
GWO Basic Technical Training (BTT) Bolt Tightening Module
Aset Training
GWO Basic Technical Training (BTT) Combined
Aset Training
GWO Basic Technical Training (BTT) Electrical Module
Aset Training
GWO Basic Technical Training (BTT) Hydraulics Module
Aset Training
GWO Basic Technical Training (BTT) Mechanical Module
Aset Training
GWO Control of Hazardous Energies (COHE) Basic Safety Module
Aset Training
GWO Control of Hazardous Energies (COHE) Combined
Aset Training
GWO Control of Hazardous Energies (COHE) Combined Refresher
Aset Training
GWO Control of Hazardous Energies (COHE) Electrical Safety Module
Aset Training
GWO Control of Hazardous Energies (COHE) Pressure Fluid Safety Module
Aset Training
GWO Fire Awareness
Aset Training
GWO Fire Awareness Refresher
Aset Training
GWO Manual Handling
Aset Training
GWO Manual Handling Refresher
Aset Training
GWO Working at Heights
Aset Training
GWO Working at Heights Refresher
Aset Training
HV Switching and System Control (City & Guilds 0672)
Power Climber SD4 Service Lift User Training TICCCS
360 training
Power Climber RD3 Service Lift User Training TICCCS
360 training
Equipamientos Eolicos Service Lift User Training TICCCS
360 training
GWO Advanced Rescue Training
360 training
GWO Basic Safety Training
360 training
GWO Basic Technical Training
360 training
GWO Basic Technical Training – Electrical
360 training
GWO Basic Technical Training – Hydraulic
360 training
GWO Basic Technical Training – Mechanical
360 training
GWO Fire Awareness
360 training
GWO Manual Handling
360 training
GWO Working at Height
GWT
GWO Five Module Package
Steam Marine Training
GWO Five Module Package
Synergie Training
Wind Turbine Safety Rules+A1:B110 (WTSR)
Table 2. Training provision relevant to solar and onshore wind sectors available through private providers.
NOS
Description
Sector relevance
EUSWT01*
Pre-Assemble Wind Turbine Components
Onshore wind
EUSWT03
Remove plant and apparatus in the electricity power utilities environment
Onshore wind
EUSWT04
Maintain plant and apparatus in the electricity power utilities environment
Onshore wind
EUSWT05
Inspect plant and apparatus in the electricity power utilities environment
Onshore wind
EUSWT06
Configure plant and apparatus in the electricity power utilities environment
Onshore wind
EUSWT07
Diagnose faults on plant and apparatus in the electricity power utilities environment
Onshore wind
EUSWT08
Develop yourself in the work role
Onshore wind
EUSWT09
Work with other people
Onshore wind
EUSWT10
Minimise risks to life, property and the environment in electricity power utilities
Onshore wind
EUSWT11*
Install and maintain hydraulic systems on wind turbines
Onshore wind
EUSWT12
Replace plant and apparatus in the electricity power utilities environment
Onshore wind
SEMETS347
Producing technical information for engineering activities
Onshore wind
SEMENG305
Obtain resources for engineering activities
Onshore wind
SEMMAN2302
Using and interpreting engineering data and documentation
Onshore wind
SEMMAN2303
Working efficiently and effectively in engineering
Onshore wind
INSML002
Develop your knowledge, skills and competence to meet the requirements of your work
Onshore wind
INSML024
Build teams and allocate work to team members
Onshore wind
INSML025
Manage and quality assure work in your team
Onshore wind
INSML031
Develop and sustain working relationships with colleagues and stakeholders
Onshore wind
EUSEPUS014
Fault location and diagnosis on plant and apparatus in the electricity power utilities
Onshore wind
EUSEPUS044
Location and identification of underground utility services in the electricity power utilities
Onshore wind
INSEA5
Promote low and zero carbon energy technologies
Onshore wind & solar PV
PROST01*
Prepare the structure for photovoltaic/solar thermal panel installation – existing structure
Solar PV
PROST02*
Fix solar thermal/photovoltaic panels onto a roof structure
Solar PV
PROST03*
Fix solar thermal/photovoltaic panels into a roof structure
Solar PV
PROST04*
Fix solar thermal/photovoltaic panels onto a non-roof structure
Solar PV
PROST05*
Solar thermal/photovoltaic panels post installation activities
Solar PV
PROST06*
Identify solar thermal/photovoltaic installation requirements
Solar PV
PROST07*
Produce specifications for solar thermal/photovoltaic installations
Solar PV
BSESPV02*
Install and connect Solar PV and EESS systems
Solar PV
BSESPV03*
Inspect and test Solar PV and EESS Systems
Solar PV
BSESPV04*
Commission Solar PV and EESS systems
Solar PV
BSESPV05*
Identify and rectify faults in Solar PV and EESS systems
Solar PV
BSESPV06*
Maintain Solar PV and EESS systems
Solar PV
BSESPV07*
Develop and agree project designs for Solar PV
Solar PV
BSESPV08
Develop, test and agree project designs for EESS
Solar PV
BSESPV01*
Install assemblies and enclosures for Solar PV and EESS systems
Solar PV
Table 3: National Occupational Standards (NOS) that are relevant to onshore wind and solar PV.
* denotes NOS that are specific to onshore wind and/or solar PV. All others are more general, but still of relevance.
Apprenticeship Type
Framework
Foundation
Civil Engineering
Engineering
IT: Hardware and System Support
IT: Software Development
Scientific Technologies
Construction L4/5
Graduate
Civil Engineering
Civil Engineering: Higher Apprenticeship at SCQF Level 8
Construction and the Built Environment
Cyber Security
Data Science
Business Management: Project Management
Engineering: Design and Manufacture
Engineering: Instrumentation, Measurement and Control
IT: Software Development
IT: Management for Business
Modern
Life Sciences and Related Science Industries
Life Sciences and Related Science Industries Technical
Maritime Occupations
Power Distribution
Industrial Applications
Process Manufacturing
Rural Skills: Environmental Conservation
Construction Technical Apprenticeship: Built Environment,
Construction Technical Apprenticeship: Contracting Operations
Construction: Building
Construction: Civil Engineering
Construction: Specialist
Construction: Technical
Data Analytics: Technical
Digital Technology
Electrical Installation
Engineering: Asset Lifecycle and Maintenance
Engineering: Manufacturing and Fabrication
Engineering: Technical Support
Engineering Construction
Engineering and Digital Manufacturing Technical Apprenticeship
Management
Project Management
Digital Technology Technical Apprenticeship
Sustainable Resource Management
Supply Chain Management
Table . List of Apprenticeship Frameworks identified as relevant for the broader STEM skills provision.
University courses
Transferability
Full person equivalents (2021/2022)
Aeronautical and aerospace engineering
980
Agricultural sciences
170
Agriculture
1445
Artificial intelligence
1130
Biology (non-specific)
1070
Biosciences (non-specific)
1820
Biotechnology
460
Building
3470
Chemical, process and energy engineering
2760
Civil engineering
3755
Earth sciences
1750
Ecology and environmental biology
1480
Electrical and electronic engineering
4095
Engineering (non-specific)
3170
Environmental and public health
1055
Environmental sciences
1630
Forestry and arboriculture
150
Geography (non-specific)
220
Information systems
1950
Information technology
2755
Landscape design
255
Maritime technology
40
Materials science
10
Materials technology
10
Mechanical engineering
4720
Microbiology and cell science
1325
Naval architecture
315
Others in engineering
225
Physical and geographical sciences
1865
Physical sciences (non-specific)
150
Planning (urban, rural and regional)
815
Plant sciences
110
Production and manufacturing engineering
1060
Rural estate management
245
Sciences (non-specific)
815
Software engineering
3335
Zoology
1050
Others
1925
Table 5. Scottish university courses and their relative transferability to solar and onshore wind sector. This list is derived from SFC records where courses are ranked in red, amber, and green for their relative transferability to onshore wind and solar sector skills needs. The RAG rating was assigned through qualitative reasoning of the consultants following in-depth thematic analysis of the course content as discussed in Section 6.1.2. The full person equivalent data was provided by the Scottish Funding Council.
How to cite this publication: Beinaroviča, J., Creamer, D., Morrison, M., Brown, J., Knox, D. (2025) Training provision in Scotland’s onshore wind and solar industries, ClimateXChange. http://dx.doi.org/10.7488/era/5399
While every effort is made to ensure the information in this report is accurate, no legal responsibility is accepted for any errors, omissions or misleading statements. The views expressed represent those of the author(s), and do not necessarily represent those of the host institutions or funders.
This work was supported by the Rural and Environment Science and Analytical Services Division of the Scottish Government (CoE – CXC).
Erratum: Please note that this report was updated on 16 May 2025 to refer in three instances to Climate Ready HES: Adaptation Plan (2021) instead of Historic Environment Scotland Climate Action Plan (2020). Row 74 in the accompanying database has also been updated.
Executive summary
Introduction
Public bodies in Scotland are key players at the forefront of responding to climate change impacts in Scotland, given their roles as health, education, housing and social care providers, and emergency and risk management agencies. This study reviews the state of play of public body climate adaptation planning in Scotland. The report highlights approaches for delivering climate adaptation, common themes, similarities and differences between public bodies. It summarises available information on costs and benefits, to help inform a collective understanding among stakeholders and highlight knowledge gaps.
Summary of key findings
Overview of public body adaptation plans
The adaptation planning landscape is complex. In many public bodies, there is no single, dedicated climate adaptation plan; more often, adaptation is integrated into one or more documents. Public body adaptation plans vary widely in their scope, content and levels of maturity. Because of this variability it is difficult to evaluate progress on a like-for-like basis.
Affirming previous findings by the Sustainable Scotland Network (Sustainable Scotland Network, 2023), this study found multiple examples of confusion between climate change adaptation (i.e. responding to the impacts of climate change) and climate change mitigation (i.e. reducing greenhouse gas emissions). Public Bodies Climate Change Duties Reports (PBCCDRs) also frequently signposted to documents such as flood risk assessments that they are required to produce but do not constitute dedicated climate adaptation plans. Therefore, public bodies’ self-reported levels of adaptation planning is not always accurate.
Local authorities are not explicitly required by law to produce adaptation plans. We found that fewer than one-third of local authorities have a dedicated adaptation plan. The remainder have undertaken at least some planning relevant to climate adaptation, in line with their statutory duties on adaptation. Adaptation plans are generally area-wide in scope. These plans frequently made use of guidance, tools and resources made available through the Adaptation Scotland programme. There are several regional plans that have been produced via consortia, which are supported by additional evidence and are comparatively more mature.
As of October 2024, all 22 NHS Boards (including the 14 regional NHS Boards and 8 special NHS boards) have produced a climate change risk assessment (CCRA) and 18 have produced an adaptation plan. There is a requirement for NHS Boards to produce these in a standard Excel-based format, which prompts them to list actions against each risk. These plans generally focused on the organisation’s own operations, assets and supply chain.
The adaptation plans for Historic Environment Scotland, Scottish Water and Transport Scotland were sector-specific and took different approaches to adaptation planning overall. We observed some key differences between local authorities, NHS boards and the other organisations we reviewed, which likely reflect the different remits, the sectors and geographic areas they cover. Key differences include: the scope of their adaptation planning, the themes and content of their adaptation actions, whether they focused solely on the organisation or on the wider area, and whether they were underpinned by a CCRA.
Information on costs and benefits in adaptation plans
We found that the adaptation plans we reviewed contained minimal quantitative information on either costs or benefits. The latter are considered qualitatively in varying levels of detail.
For local authorities, the majority of quantitative information that is available comes from two regional economic impacts reports on climate risks produced by Paul Watkiss Associates. East Dunbartonshire Council was the only example we found of a local authority that had attempted to downscale this information to a local level. Otherwise, there was minimal cost information aside from a handful of local authorities who cited high-level costs, usually in relation to flood infrastructure or associated damage.
NHS boards are prompted to indicate the cost of adaptation measures in relation to each risk they identify. However, not all of them utilised this part of the form; some fields were left blank and it was not clear why. Where costs were indicated, it was not always clear what they referred to.
Of the other organisations reviewed, only Scottish Water cited costs in its adaptation plan, referring to the level of investment required in future years.
It is likely that more quantitative information on costs and benefits is held by public bodies but not necessarily incorporated into their adaptation plans.
Recommendations
Recommendations for policy are set out below. Further details are in Section 8.2
Engage with public bodies and undertake further research to understand the barriers they face to identify the specifics of the support they need for adaptation planning. Suggested topics for further study are provided in Section 8.2.
Require local authorities to produce climate change risk assessments that consider topics additional to flooding. Use these to develop climate change adaptation plans, in line with guidance from the Adaptation Scotland programme.
Provide public bodies with advice on how the regional economic impact assessments (see Section 6.2.2) and other national evidence relating to costs and benefits can be downscaled to support the case for local adaptation planning and investment.
Align the Sustainable Scotland Network’s (SSN) system for rating the maturity of adaptation planning with the Adaptation Capability Framework. This would likely require organisations to assess and self-report their scores, which links to Recommendation 2. See Section 7.1 for more information.
Explore ways to support public bodies with limited resources to produce adaptation plans or CCRAs. This could involve signposting to information provided by the Adaptation Scotland programme on easy wins, low-regret actions, no- or low-cost actions and partnership arrangements to share skills, knowledge and budgets.
Clarify what information on adaptation should be reported within Public Bodies Climate Change Duties Reports and what information is unnecessary in terms of key performance indicators. See Section 7.4 for more information.
In future, where mitigation programmes are undertaken or funded by the Scottish Government and public bodies would be involved in their delivery, signpost links between mitigation and adaptation.
Glossary / Abbreviations table
Adaptation
In human systems: The process of adjustment to actual or expected climate and its effects, to moderate harm or exploit beneficial opportunities.
In natural systems: The process of adjustment to actual climate and its effects; human intervention may facilitate adjustment to expected climate and its effects. (IPCC)
Mitigation
A human intervention to reduce emissions or enhance the sinks of greenhouse gases (IPCC).
CCC
Climate Change Committee
CCRA
Climate Change Risk Assessment
GHG
Greenhouse Gas
GCoM
Global Covenant of Mayors
GCR
Glasgow City Region
LA
Local Authority
LCLIP
Local Climate Impacts Profile
NHS
National Health Service
PBCCDR
Public Bodies Climate Change Duties Report
PSCAN
Public Sector Climate Adaptation Network
SECAP
Sustainable Energy and Climate Action Plan
SDaC
Sustainable Design and Construction Guide
SNAP
Scottish National Adaptation Plan
Sniffer
Scotland and Northern Ireland Foundation for Environmental Research
SSN
Sustainable Scotland Network
Introduction
Context
Public bodies are at the forefront of responding to climate change, given their roles as health, education, housing and social care providers, emergency and risk management agencies, and more. Under the Climate Change (Duties of Public Bodies: Reporting Requirements) (Scotland) Order 2015, public bodies in Scotland are required to produce annual reports on their compliance with their statutory climate change duties, covering mitigation, adaptation and sustainability. These are known as Public Bodies Climate Change Duties Reports (PBCCDRs).
Although public bodies are required to report how they are contributing to help deliver the national adaptation plan and whether they have their own climate adaptation plans, some organisations do not have them; it is not a statutory requirement. The plans that do exist demonstrate varying levels of maturity and detail.
The Scottish Government has identified that a particular gap exists regarding costs and benefits of adaptation measures. This presents a barrier to action in several ways, e.g. making it difficult to:
Determine the required levels of resilience
Identify the best use of public sector resources and which projects to prioritise
Understand who will be affected and how, as well as who bears the cost, which is important in the context of a just transition
Engage with stakeholders and generate buy-in
Develop business cases and obtain funding
This research study reviews the current ‘state of play’ of adaptation planning in Scotland, highlighting common themes, similarities, and differences among public bodies. It summarises available information on costs and benefits, to help inform a collective understanding among stakeholders and highlight knowledge gaps.
Climate change terminology
Adaptation vs. mitigation
This study focuses on climate change adaptation plans. Adaptation in this context refers to actions that are taken to manage and respond to the effects of climate change. This is distinct from climate change mitigation, which refers to actions that are intended to reduce greenhouse gas (GHG) emissions, and thereby limit how much climate change occurs in the future.
In some cases, adaptation actions help to mitigate emissions, and vice-versa. For example, planting trees can help to provide cooling and shade in a warming climate (adaptation) while also removing carbon dioxide from the atmosphere (mitigation). In other cases, actions may contradict or subvert each other.
This review found several examples of climate change plans that confused adaptation and mitigation (for more information, see Sections 5.5 and 5.6). It also found examples where the linkages were either ignored or not fully acknowledged. There is a particular risk of confusion because climate change adaptation actions may be described as ‘mitigating climate risks’ in the standard language of risk management. This is distinct to climate mitigation actions that mitigate greenhouse gas emissions.
Risks: The interaction between hazard, vulnerability and exposure
The IPCC defines risk as, ‘The potential for adverse consequences for human or ecological systems, recognising the diversity of values and objectives associated with such systems […] In the context of climate change impacts, risks result from dynamic interactions between climate-related hazards with the exposure and vulnerability of the affected human or ecological system to the hazards.’ (IPCC, 2019)
Climate hazards include phenomena like heatwaves and floods, exposure refers to the presence of people, assets or services in places that could be affected by hazards and vulnerability is the predisposition to be adversely affected.
Methodology
Scope of the study
This study primarily focused on the climate change adaptation plans or strategies produced by Local Authorities and NHS Boards. This included consortium studies by three regional adaptation partnerships: Climate Ready Clyde, Climate Ready South East Scotland (SES) and Highland Adapts. At the request of the Scottish Government, the study was expanded to include Historic Environment Scotland, Scottish Water and Transport Scotland.
The study prioritised documents using a tiered approach:
Tier 1: Climate change plans or strategies that focus on adaptation and include ‘adaptation’ in the title.
Tier 2: Other climate change strategies or action plans with adaptation-related content (even if the primary focus is on mitigation)
Tier 3: Supporting documents and other evidence, such as climate change risk assessments (CCRAs), which contain information relevant to adaptation planning within Tier 1 and 2 documents.
Unless otherwise specified, the study did not examine other plans, strategies and documents where climate change was not the primary topic. Examples would include Local Development Plans, Flood Risk Assessments and Corporate Strategies.
Adaptation is often incorporated into multiple documents, to varying levels of detail. For simplicity, this report refers to all Tier 1 and Tier 2 documents as ‘adaptation plans’; however, readers should be mindful that the term is being used in a broad sense. Note, this tier system has been developed solely for the purpose of this study, to differentiate between various types of documents that were reviewed.
Research approach
This study comprised a desk review of climate adaptation plans and related documents as described in the previous section. The review was carried out from July to December 2024.
The initial task was to create a data collection template, ensuring consistent information recording. PBCCDRs for relevant public bodies were identified through the SSN website. Documents that were not publicly available were requested from the relevant public bodies.
Each document was then reviewed and evidence collated within the data template. The templates were collated into summary sheets to enable thematic analysis. An overview of these data can be found in the accompanying spreadsheet.
Limitations of the approach
This project is based on a desk review only. The results have not been informed by additional stakeholder consultation.
As stated previously, the scope of this review focused on dedicated climate adaptation plans/strategies. Climate adaptation measures that are integrated into other documents, such as Local Development Plans, may not be captured if they are not included in the organisation’s main climate change plan(s).
Public bodies may hold additional information or evidence relevant to climate adaptation, including quantified costs and benefits, that was not captured by this review. For example, the costs of additional flood protection infrastructure may have been assessed as part of individual business cases.
If an organisation has carried out further work on climate adaptation since its 2023/24 PBCCDR was published, it may not be included in this review. The same applies to any ongoing work or documents that are not yet finalised.
It is possible, although unlikely, that this review omitted some Tier 1 and 2 documents that are available online. This might be the case if they are not included in PBCCDRs, cross-referenced in other documents, or clearly signposted on the relevant public body’s website.
Overview of public body adaptation plans
This section summarises the overall landscape in regard to climate adaptation planning, for the Scottish public bodies that were reviewed.
How many public bodies have climate adaptation plans?
As noted within Section 4.1, adaptation planning is often incorporated into a wide variety of plans, strategies and other documents. As a result, simple metrics – such as the number of adaptation plans or how many actions they contain – are difficult to calculate. They also do not convey the overall level of maturity of public bodies’ climate adaptation planning.
To highlight the overall complexity of the landscape, consider the following example. West Dunbartonshire Council has produced a Climate Change Strategy that addresses both adaptation and mitigation but primarily focuses on the latter (West Dunbartonshire Council, 2021). The Strategy is supported by a Climate Change Action Plan. Both documents are structured around nine themes, of which ‘Climate Impacts, Risk and Adaptation’ is one. The adaptation section contains three actions: (1) to deliver relevant actions set out in the Glasgow City Region (GCR) Climate Adaptation Strategy, (2) to undertake a local CCRA and (3) to use the Adaptation Capability Framework to identify areas for further improvement. The reference to Glasgow City Region acknowledges a separate piece of work, underpinned by a regional CCRA and economic impact assessment, that has been produced by Climate Ready Clyde (Climate Ready Clyde, 2021). This relationship is illustrated in Figure 1.
Figure 1. West Dunbartonshire’s adaptation planning landscape
Based on this review, among the 32 Local Authorities that were assessed:
Nearly all Local Authorities have either a Tier 1 and/or Tier 2 document, indicating that some level of climate adaptation planning has been carried out, either individually or as part of a regional consortium. Note that the level of maturity and detail varies widely, as will be discussed in various sections of this report.
Approximately 2/3rds of Local Authorities have access to a CCRA, either for their council area and/or as part of a regional consortium.
Fewer than 1/3rd of Local Authorities have a specific, dedicated climate adaptation plan (a Tier 1 document as defined in Section 4.1).
A small number of Local Authorities (up to 3) appear not to have undertaken any climate adaptation planning. It is acknowledged that adaptation might be addressed in wider documents and strategies which were excluded from this review.
Among the 14 regional NHS Boards and 8 special NHS boards:
All 22 have undertaken a CCRA using a standard template.
18 of them have produced adaptation plans by listing actions against risks within their CCRAs. These combined CCRA/action plans have been counted as Tier 1 documents. Of those, 3 have also produced separate climate change strategies and/or action plans (Tier 2 documents).
One NHS Board which does not have a Tier 1 adaptation plan has produced a separate climate change strategy (Tier 2) which discusses adaptation at a high level.
An additional challenge was understanding how the adaptation plans and related documents (such as wider climate change strategies) produced by each public body interrelate. The research found several instances of organisations that had produced a form of adaptation-related documentation that was not referenced in their PBCCDR. There were also examples where key documents, such as regional adaptation plans with supporting evidence bases, were mentioned in passing but not highlighted as being particularly significant within the wider context of the public body’s adaptation planning or governance approach. These issues could indicate a lack of internal awareness of what planning has been undertaken and/or confusion about what to include in the PBCCDR. On the latter point, it may be useful to provide organisations with further clarity (see recommendations in Section 8.3).
Authorship of climate adaptation plans and other documents
Based on this review, the Tier 1 adaptation plans for most of the NHS boards, Scottish Water, Transport Scotland and HES appear to have been undertaken in-house, i.e. there are no other authors listed within the documents that were reviewed. However, correspondence with NHS NSS has confirmed that some NHS Boards had funding for external consultancy support to produce their combined CCRA/adaptation plans.
For Local Authorities, there are fewer Tier 1 climate adaptation plans. With the exception of the 2012 adaptation strategy by Highland Council, all of these appear to have either been produced in collaboration with other regional stakeholders or some other form of external support. The majority of Local Authority Tier 2 documents appear to be produced in-house, but as in the case of NHS Boards, some of these are known to have had input from external consultancies. Local Authority Tier 3 documents were more likely to have consultancy firms listed as the main authors, often being commissioned by a consortium. Although the sample size is small, the difference in authorship between Tier 1 and Tier 2 documents is notable. It might suggest that Local Authorities have higher in-house skills and capacity to develop mitigation plans compared with adaptation plans. It could also signify a preference for partnership working on adaptation. The two are not mutually exclusive.
Varying levels of additional support were provided by the Adaptation Scotland. Adaptation Scotland is a programme funded by the Scottish Government, which provides advice and support to businesses, communities and public sector organisations seeking to become more resilient to the effects of climate change. In this advisory capacity, Adaptation Scotland offer tools and guidance for public bodies undertaking adaptation reporting (see Table 1 below).
Joint plans have been developed at the regional scale to promote collaborative climate adaptation action, sharing guidance and resources between public bodies. These include Climate Ready Clyde (CRC), Climate Ready South East Scotland (SES) and Highland Adapts. Appendix A contains a list of the organisations that are involved in each of these consortia.
It is understood that Perth and Kinross, Angus and Dundee Councils are also currently exploring opportunities to create a Tayside Regional Adaptation Partnership. A list of regional and place-based adaptation partnerships is available on the Adaptation Scotland programme’s website (Adaptation Scotland, n.d.).
What standards, guidance and tools do they use?
Public bodies use a range of guidance and tools to inform their adaptation planning.
For Local Authorities, 14 of the 32 councils’ PBCCDRs referred to the Adaptation Scotland programme, although not all have used these resources and the outputs show considerable variation.
NHS boards are required to carry out CCRAs in a standard format using templates provided by NHS National Services Scotland (NSS), and then use these to inform adaptation plans.
Historic Environment Scotland and Transport Scotland also state in their PBCCDRs that they have used Adaptation Scotland’s Capability Framework (Adaptation Scotland, 2019). Scottish Water is also understood to have utilised this framework although this is not specifically mentioned in the documents that were reviewed.
The table provides more information on the standards, guidance and tools that were referred to in the documents that our team reviewed.
Name
Description
Comments
Adaptation Scotland
Adaptation Scotland is a programme funded by the Scottish Government and currently delivered by sustainability charity Sniffer. Adaptation Scotland provides a range of support and resources, including:
Adaptation Capability Framework
Adaptation Benchmarking Tool
Public Sector Climate Adaptation Network
Connecting climate risk and strategic priorities: Guide to strategic climate change risk assessments
If following the Adaptation Capability Framework, public bodies are expected to undertake a self-assessment of their progress on adaptation planning using the Benchmarking Tool. For more information, see Appendix C.
17 of 32 Local Authorities specifically mentioned having engaged with one or more of these resources, as did Historic Environment Scotland and Transport Scotland. Out of 32 Local Authorities, 24 are members of the Public Sector Climate Adaptation Network (PSCAN).
Based solely on a desk review, this study was unable to determine the extent to which NHS Boards have engaged with the Adaptation Scotland programme.
NHS NSS tools
NHS National Services Scotland (NSS) have collaborated with Health Facilities Scotland and JBA Consulting to provide a range of climate change resources for health boards in Scotland. These are intended to help assess climate change risks and develop adaptation plans, focusing on assets and physical infrastructure. Tools include:
CCRA and Planning Tool
NHS Scotland Climate Change Mapping Tool
NHS Scotland Sustainability Assessment Tool
Sustainable Design and Construction Guide (SDaC)
NHS Boards are required to carry out CCRAs using the template provided, and then use this to inform an adaptation plan.
Aether was provided with a summary of NHS adaptation plans (not publicly available). According to that review, 22 NHS boards have completed CCRAs and 18 have produced adaptation plans using NHS NSS tools.
Many of these also referred to the SDaC when discussing future planning for their buildings.
LCLIP
The Local Climate Impacts Profile (LCLIP) tool has been developed by the UK Climate Impacts Programme (UKCIP). The simple tool helps organisations assess their exposure and vulnerability to weather and climate. Note that UKCIP has been discontinued.
Three Local Authorities made reference to this tool in the documents we reviewed.
SECAP
Signatories to the Global Covenant of Mayors (GCoM) commit to producing a Sustainable Energy and Climate Action Plan (SECAP). This includes a climate risk and vulnerability assessment which are entered into in an Excel-based template, following GCoM’s methodology.
At least three Local Authorities (Angus, Fife and Dundee Councils) have produced a SECAP.
Table 1: Standards, guidance and tools referenced in public bodies’ climate adaptation plans
It is likely that other standards, guidance and tools (particularly ones from the UK Climate Impacts Programme) have been used even if they were not captured by this review. This review did not record any specific references to the internationally-recognised ISO 14090:2019 standard, although it underpins the NHS NSS requirements.
Even among public bodies that referenced the same guidance, the outputs still varied in scope, content, themes, structure, and level of detail. This could be due, in part, to the fact that the Adaptation Scotland Capability Framework allows flexibility for organisations that are at different stages of maturity in planning for climate change adaptation, and the Adaptation Scotland website offers a wide range of tools and resources which public bodies can choose to adopt. The guidance is non-prescriptive and is designed to be tailored to the organisation’s needs.
Tools were also used differently by different organisations. For example, not all NHS boards responded to all of the prompts in the CCRA template. These differences in overall scope and content are explored more in the next section.
Overall scope and content of adaptation plans
Local Authorities
Although some Local Authority’s adaptation plans focus on risks to their own organisation’s assets and services, most are area-wide and cross-sectoral in their approach. In other words, they address issues that the council can influence directly, as well as those that are relevant to the geographic area as a whole where the council may have indirect influence.
There is wide variation in the level of detail and complexity in adaptation planning for Local Authorities. For example, Edinburgh City Council produced an adaptation plan in 2016 (Edinburgh City Council, 2016) which has already been updated with a new one (Edinburgh City Council, 2024). Whereas, for some Local Authorities, adaptation planning includes only a brief reference to adaptation within a document that is primarily mitigation-focused.
Regarding the specific climate hazards that the plans consider, the most common are flooding and severe weather. Many of the plans also discuss the impacts of climate change on the natural environment, green spaces or green infrastructure, and biodiversity. Overheating is mentioned in some of the plans but overall is not a key focus. This may reflect the types of climate hazards that have historically been more common in Scotland (flooding) and those that are more visible (the natural environment and green spaces).
Unlike NHS board plans (see next section), not all of the Local Authority plans were supported by a CCRA. Those that had undertaken a CCRA tended to address climate hazards, but did not necessarily assess exposure or vulnerability (see definitions in Section 3.2).
There was not a clear link between the level of detail of the adaptation plans and whether or not the Local Authority had a CCRA as part of their evidence base. There were some that had access to regional CCRAs (e.g. via Climate Ready Clyde) but the extent to which those findings had been incorporated into locally-specific climate adaptation plans or strategies was unclear based on this desk review. In other cases, organisations may have undertaken a CCRA as a first step but not yet produced an adaptation plan. Those organisations might be expected to have more detailed adaptation plans but it is not yet possible to say.
In terms of other commonalities and themes, there did not appear to be a clear correlation between the level of adaptation planning a Local Authority had undertaken, and its budget or number of employees. This is linked to the fact that some local authorities have joined together to produce regional risk assessments or strategies (see Appendix A).
Similarly, to the extent that there were regional differences in overall levels of adaptation planning, these were related to whether or not organisations were part of those joint strategies.
NHS Boards
NHS boards’ adaptation plans are targeted at the level of their own organisation, healthcare assets and services, and supply chains. Mostly, the focus is on physical assets. Based on information provided by the project steering group, it is understood that this focus was intentional, due to a need to narrow scope in line with budget and resourcing constraints.
As part of NHS NSS requirements, NHS boards are required to undertake a CCRA and develop adaptation plans using a standard Excel-based template. It includes the following headings, which are presented sequentially in the order that they appear.
Risk type;
Asset group;
Relevant climate hazard;
Assets at risk;
Potential impact category;
Risk exposure score;
Existing [risk] mitigation measures;
Recommended adaptation measures;
Residual risk exposure score;
Risk owner;
Delivery partners;
Timeline;
Financial costs;
Monitoring approach.
In general, there tends to be less variance in scope between NHS Boards plans, compared to Local Authority plans. Notably, although the template is framed as a risk assessment, many of the actions proposed in response to specific hazards are to undertake more detailed assessments of the risk. For more information on actions, see Section 5.6.
In addition, at least six NHS Boards have produced broader climate change strategies (or similarly titled documents) and most of these discuss adaptation at a high level.
NHS Boards plans are generally focused on hazards such as flooding, overheating, structural damage from severe weather, and general risks to the estate and services. For example, in the NHS Greater Glasgow and Clyde Climate Change and Sustainability Strategy, one adaptation action focuses on utilising the existing outdoor estate to retrofit green infrastructure and combat increased flooding (NHS Greater Glasgow and Clyde, 2023). NHS Greater Glasgow and Clyde was a stakeholder within the Climate Ready Clyde group until 2024, demonstrating that some NHS Bodies, like some Local Authorities, are benefitting from shared regional learnings.
Other organisations
Historic Environment Scotland’s (HES) adaptation plan focuses on sector-specific climate risks (Historic Environment Scotland, 2021). The adaptation plan is accompanied by a detailed project methodology and results report, including results of the CCRA. A risk management strategy and severe weather policy has also been created to support the Climate Ready HES approach. The Adaptation Scotland Capability Framework was used to inform the organisation’s action plan. The plan groups risks into 5 broad categories: physical climate risks to physical assets, natural capital, operations, people and transition risks. For more detail on transition risks, see Appendix D.
Transport Scotland’s adaptation plan covers its area of operation, which covers all of Scotland (Transport Scotland, 2021). It outlines seven transport related climate risks and prioritises four high level strategic outcomes to help achieve the vision of a well-adapted transport system in Scotland. Transport Scotland used resources from the Adaptation Scotland programme to develop its plans. The risks are evidenced using the UK CCRA and a separate CCRA has not been undertaken for the organisation. The strategic outcomes relate to trunk roads, rail network, aviation network and maritime network. Each strategic outcome includes sub-outcomes which provide a much narrower scope for action. For example, for the strategic outcome relating to trunk roads, one sub-outcome is to deliver a programme of proactive scour schemes across the network.
Like Transport Scotland, Scottish Water’s adaptation plan is focused on its own assets and operations nationally (Scottish Water, 2024). The plan is embedded within their overall risk management process. It covers eight main themes, which include: impact on services, drought, deteriorating water quality, customer flooding and environmental pollution, waste water and environmental quality, asset flooding and coastal erosion, interdependent risks and enablers. Outcomes and outputs for each adaptation action are clearly defined along with timelines for adoption and enabling actions. The plan is based on a CCRA that contains two climate scenarios, in line with CCC recommendation to plan for a 2°C increase in global temperatures but assess for a 4°C increase.
Themes and structure of adaptation plans
Most of the adaptation plans reviewed in this study were structured around multiple thematic areas. However, there was little consistency in what these themes were and the scope of what they covered within different plans. This was true when comparing different types of organisation (e.g. NHS board vs. local authority) as well as when comparing across organisations of the same type (e.g. NHS board with NHS board). The thematic groupings used can be broadly categorised as:
Broad sectoral themes such as buildings, infrastructure and biodiversity – This is the most common way of defining themes. It is similar to the outcomes used to structure the third Scottish National Adaptation Plan (SNAP3). The thematic areas are not uniform across plans that use this approach and often different language is used to describe similar themes, for example ‘property assets and housing’ and ‘buildings’. A theme relating to nature, the environment and/or biodiversity was common to almost all plans that used this approach, and the built environment was also a common theme. Of the outcomes in SNAP3, the ‘economy, business and industry’ theme was least prominent across plans.
Sector-specific themes – For non-local authority organisations, including NHS boards, an approach similar to the sectoral themes above may be used but with specific themes more closely aligned to their delivery functions. For example, the Transport Scotland plan is structured around themes including trunk roads, rail, aviation and maritime.
Themes based on climate hazards – Some of the adaptation plans are structured around themes such as ‘flooding’, ‘heat’, ‘drought’ and ‘coastal adaptation’. This was most common among NHS Boards, as the CCRA template prompts the user to list actions against each risk (although some NHS Boards had also produced separate climate change strategies that addressed adaptation at a high level and did not follow the same structure). Overall, the plans generally have a stronger focus on flooding than other hazards, likely reflecting the current risk profile in Scotland.
Enablers – Many of the plans also contain at least one theme based around enablers for adaptation action, including governance, building understanding and knowledge, working in partnership and monitoring and evaluation.
Climate adaptation as one theme in a wider strategy – Some organisations have mitigation and adaptation combined into a single strategy document. Those tended to include a number of chapters of mitigation themes (transport, waste, land use etc.) and one or two additional chapters on adaptation and/or resilience. Having a single strategy could theoretically help with integrating adaptation and mitigation actions but in many cases this opportunity has been missed (see Section 5.6).
Some plans apply a mix of the above approaches, for example, using primarily sectoral themes with an additional chapter on a topic such as flooding or governance.
The wide variety of themes identified in the adaptation plans likely reflects the local and function specific nature of risk and adaptation to different organisations, as well as differing organisation priorities. However, this diversity of themes does make it difficult to compare plans and establish whether individual plans contain comprehensive coverage of the relevant risks and necessary actions.
Not all plans explicitly acknowledge interactions between themes. This creates a risk of siloed working and missed opportunities for join-up.
Inclusion of specific actions and policies in adaptation plans
Most of the plans include relatively high-level actions with a focus on planning and policy making rather than delivery and implementation. This suggests that the organisations may not yet be at a sufficiently mature stage of adaptation planning to have a delivery focus. For example, many plans include actions like ‘Set out a proactive approach to climate change adaptation within our Asset Management Plan’ and ‘Develop policies to strengthen the resilience of the transport network to the impacts of climate change’. In some cases, actions like ‘maximise partnership approaches’ are suggested, without outlining clear mechanisms for how partnerships will be built or who needs to be involved. As a result, implementation and monitoring progress against the action may be difficult (see Section 5.7 for further information).
Mirroring the diversity of themes within public bodies’ adaptation planning, a wide variety of adaptation policies and actions have been proposed. Some actions were common across many plans. For example, many included adaptation actions aiming to expand and protect green space and actions to improve governance such as incorporating climate risk into corporate risk registers; note, this is a specific capability and range of tasks within the ACF. Fewer plans included actions to reduce risks due to high temperatures. Actions aiming to address the higher exposure of rural and island communities were limited, even amongst local authorities with significant rural populations. In some cases, including the plans for Transport Scotland, Angus Council and Shetland Council, vulnerability due to the greater reliance of remote communities on specific transport links such as ferries and other infrastructure was acknowledged but specific, targeted actions to address this were not included or have not yet been developed. One exception was the Highland Council, which included an action to map vulnerable communities and sectors in their 2012 plan (Highland Council, 2012).
Overall, there is limited information on how actions have been prioritised, including a lack of direct use of information from risk assessments to ensure the most significant risks are acted upon. Historic Environment Scotland’s plan was an exception in that a relatively detailed methodology document accompanies their adaptation plan.
In many cases, it was not clear from reviewing the documents in this study how many plans commit to new or strengthened actions, rather than reiterating actions that would take place anyway. For example, many actions relating to flooding may be covered under existing local flood risk management work. This is a challenge when it comes to costing adaptation specifically.
Adaptation and mitigation actions are sometimes mis-categorised. SSN found, in their analysis of PBCCDRs for the year 2022/23, that 10% of NHS boards and 6% of local authorities listed mitigation measures in response to questions on adaptation (Sustainable Scotland Network, 2023). Examples of this confusion have been found within a number of plans. For example, the resilience section of one Local Authority plan refers to ‘milestones for our resilience journey to reduce GHG emissions’. There is an opportunity here for further training and knowledge dissemination.
Opportunities to join up adaptation and mitigation action, particularly where a single climate strategy covers both areas of work, have often been missed. For example, a number of plans contain actions to improve insulation of buildings to reduce emissions without explicitly considering the potential synergies with adaptation, such as the potential to reduce costs by retrofitting adaptation and mitigation measures to buildings at the same time, or the increased risks of overheating in insulated but poorly ventilated buildings. However, there are examples of plans that do acknowledge the synergies even if this is not a major focus. For example, NHS Greater Glasgow and Clyde have an action to ‘Ensure energy models take account of future weather trends and models to be monitored in use with systems adjusted as required’ (NHS Greater Glasgow and Clyde, 2023) and East Ayrshire acknowledges the benefits of green infrastructure for reducing flooding, improving biodiversity and sequestering carbon (East Ayrshire Council, 2021).
Approach to monitoring, evaluation and learning
Monitoring, evaluation and learning is a key part of the adaptation policy cycle which allows progress and performance to be understood and learned from to inform future policy development and implementation. It also allows decision makers flexibility to evolve their approaches as new information becomes available. At the national level, the Scottish Government have developed a monitoring and evaluation framework as part of SNAP3.
Of the NHS boards and Local Authorities that have specific, dedicated adaptation plans, or broader climate strategies that include adaptation, just under two thirds explicitly mention some kind of monitoring and evaluation arrangements. A similar number have plans to review and update these, many on an annual timescale but all within the next five years.
The reason for some plans not including monitoring and evaluation plans is not known but could be due to a lack of resource or a lack of skills or knowledge. Some of those not including monitoring plans have used standards or guidance in the development of their plans, such as the Adaptation Scotland Capability Framework.
The mechanisms proposed for monitoring and evaluation vary across different organisations. In some cases, plans acknowledge the need for monitoring and evaluation but do not include designs of specific frameworks, relying instead upon reporting through the PBCCD or setting up a steering group to review on an ongoing basis.
For the most mature plans, more detailed frameworks of governance and internal reporting, including performance indicators for actions and themes, have been developed. However, indicators are not comparable across different plans, meaning comparison or aggregation across different organisations would not be straightforward. For example, both the Aberdeen City Council and Dundee Council action plans contain actions relating to raising awareness of the health impacts of climate change. Aberdeen suggest measuring progress as the number of people reached by the campaigns for raising awareness (Aberdeen City Council, 2022) whereas Dundee proposes indicators relating to the number of people affected by illness (Sustainable Dundee and the Dundee Partnership, 2019)
Variations in key performance indicators across the public sector is likely to make it harder to consistently track progress at a national level.
Information on costs and benefits in the public body adaptation plans
Introduction
How have we defined costs and benefits?
This was interpreted broadly to include both monetary and non-monetised costs, as opposed to only costs associated with financial spend, and benefits associated with adaptation actions. To holistically appraise the costs and benefits of adaptation, three types of information need to be considered:
The cost of inaction – costs incurred due to the impacts of climate change in the absence of further adaptation
The cost of adaptation measures – the spend and investment required to implement adaptation measures
Ancillary costs and benefits – the wider impacts of adaptation action on the economy, society and the environment that go beyond avoided losses. For example, adaptation actions that enhance green space could result in benefits to human health and wellbeing.
The IPCC’s view on cost-benefit analysis
In ‘Economics of Adaptation’, the IPCC acknowledges that conventional cost-benefit analysis may not be the most suitable approach when it comes to adaptation measures (IPCC, 2018). The report cites several reasons for this, such as the inherent uncertainty associated with different climate futures, and the difficulty of ascribing a monetary value to non-market impacts on public health, heritage, ecosystem services, etc.
According to the IPCC, ‘A narrow focus on quantifiable costs and benefits can bias decisions against the poor and against ecosystems and those in the future whose values can be excluded or are understated.’ On this basis, the IPCC suggests that, in some cases, it may be more appropriate to use multi-metric decision making techniques. These might better enable decision-makers to weigh competing objectives.
In the UK context, research has recently been conducted into the latest methods for valuing the costs and benefits of climate risk and adaptation policy (Cambridge Econometrics, 2023) and the economics of adaptation (Advisory Group on the Economics of Climate Change Risk and Adaptation, 2024) in preparation for the fourth UK Climate Change Risk Assessment (CCRA4). Other relevant recent work includes The Costs of Adaptation, and the Economic Costs and Benefits of Adaptation in the UK (Paul Watkiss Associates, 2022), Barriers to financing adaptation actions in the UK (Frontier Economics & Paul Watkiss Associates, 2022) and Investment for a Well Adapted UK (Climate Change Committee, 2023).
Local authorities
Overview
The majority of quantitative cost-benefit information comes from two regional economic impact assessments produced on behalf of Climate Ready Clyde and Highland Adapts. More information on these is provided in the next section.
Several Local Authorities described quantitative costs or benefits in a more light-touch way, making a small number of references to these without providing more detail. Usually this referred to flood damages or infrastructure. For example, the City of Edinburgh’s adaptation plan (Edinburgh City Council, 2016) refers to the cost of maintaining and repairing coastal defences between 2008-2011 (£740,000). Aberdeen City Council and Dundee City Council both describe the cost of damage due to unmitigated flooding. The cost of flooding to Aberdeen without intervention is estimated to be £12.5m (Aberdeen Adapts, 2022) and the cost to residents, businesses and infrastructure in Broughty Ferry in Dundee of a 1 in 200 year flood is estimated to be in the region of £97m. (Sustainable Dundee and the Dundee Partnership, 2019).
It is considered likely that Local Authorities have a more detailed understanding of the costs and benefits of flood prevention measures because they have statutory duties in relation to flooding. There may be other topic areas where the cost of interventions has been or could be estimated by different departments, even if it is not captured within their climate adaptation plans. An example might be the cost of repairing potholes, which could increase due to climate change because of increased temperatures, rainfall and freeze-thaw cycles.
Some adaptation plans referred to the cost of inaction. This was framed as part of the overall rationale for taking steps to address climate change, rather than being used as a counterfactual to support specific adaptation measures. For example, Aberdeen City Council refers to the Stern Review (Stern, 2006) when explaining that the benefits of early action outweigh the costs of action. It also mentions the potential impact on gross domestic product (GDP). Perth and Kinross state that, ‘In general, each £1 spent on resilience measures has been demonstrated to generate between £2-£10 pounds in savings’ although no citation was provided (Perth and Kinross Council, 2021).
Several Local Authorities acknowledge the lack of information on costs and benefits, e.g.:
The LCLIP for Aberdeenshire (Aberdeenshire Council, 2019) recommends introducing a ‘cost code to capture costs from all extreme weather events’ and indicates that the Council may investigate setting up a central fund for climate adaptation.
One of the City of Edinburgh’s stated objectives in the draft Climate Ready Edinburgh Plan 202-2030 (Edinburgh City Council, 2023) is to ‘Carry out further research to enable options appraisals and cost benefit analysis of different adaptation responses in Edinburgh to improve decision making.’
The regional economic impact assessments (see Section 6.2.2) demonstrate that Local Authorities have been working together to address this gap, and there is evidence that there is an appetite for further collaboration. It is understood that Climate Ready Clyde has been exploring options to develop an Adaptation Finance Lab to help ‘support alternative financing models for adaptation action within Glasgow City Region’ (Climate Ready Clyde, 2021).
Regional reports
Two regional economic assessments have been produced by Paul Watkiss Associates on behalf of Climate Ready Clyde and Highland Adapts. These reports consider the overall economic impacts of climate change on these regions and key sectors, providing a monetary valuation of ‘relevant costs and benefits to Government and society’. Together, these reports provide an evidence base for nine out of 32 Local Authority areas.
It should be noted that the costs set out in these reports relate to climate risks, i.e. the potential cost of inaction, as opposed to adaptation actions.
The methodology of both reports is informed by guidance set out in the UK Government HM Treasury Green Book, which is the guidance the government provides for appraising, monitoring and evaluating programmes, projects and policies. This mirrors the approach taken to quantify costs as part of the first, second and third UK CCRAs (although CCRA4 is expected to use a different approach).
The data sources used in these analyses come from a range of studies, with estimates of future cost based on different socio-economic and climate change scenarios. Therefore, the authors acknowledge that they do not necessarily provide a like-for-like comparison across different risks. They also state that the values would need to be adjusted for use in a cost-benefit analysis.
For Climate Ready Clyde, the regional analysis (Paul Watkiss Associates, 2019) includes:
Current economic costs of extreme weather events, based on four recent examples in the Glasgow City region (the report notes that these costs are likely to be significant underestimates due to data gaps):
December 2015 river floods (£4m – £10m)
July 2012 surface water floods (£1m – £2m)
October 2017 wind storm (>£20m)
2013 warm and dry summer (£20m)
Potential economic costs (and benefits) associated with all risks identified in the regional CCRA
Total economic costs, expressed as indicative order of magnitude estimates for the 2020s, 2050s and 2080s.
For Highland Adapts (Paul Watkiss Associates, 2024), it includes:
Economic costs of flooding and wildfires
Potential health costs of higher temperatures
Impacts of reduced heating degree days
Macro-economic or economy-wide costs
As part of the Highland Adapts project, additional sector reports were provided for (1) Energy (2) Forestry and Timber (3) Food and Drink.
We found one example of an organisation that had attempted to downscale these costs to a more local level. East Dunbartonshire Council has produced an evidence report to inform its forthcoming climate adaptation plan and this contains indicative costs against each of the adaptation actions that are proposed (East Dunbartonshire Council, 2019). However, in general, it is not clear how a Local Authority would be expected to downscale these estimates to support a business case for a specific, local project. Therefore, in addition to this type of regional assessment, additional forms of evidence may be needed.
Reflecting on the quantitative information available to Local Authorities, at present the majority comes from these two reports by a single consultancy firm. While we do not suggest that there is any issue with the methodology, there would be higher confidence in the results if they could be validated using different approaches.
NHS boards
All NHS Boards are required to undertake a CCRA using a standard template. The intention is that the information is then turned into a climate adaptation plan. The form prompts the user to indicate the financial cost of responding to each of the hazards that are identified.
In the CCRA template, costs are represented as a range which users can select from a drop-down menu. It is possible that the responses are simply estimates based on the user’s judgment rather than drawing from more detailed analysis.
This study reviewed CCRAs for 20 out of 22 NHS Boards. Of those that were reviewed:
Two only included a risk assessment, with no adaptation actions or cost information.
Two included adaptation actions, but left the cost section blank.
The remaining 16 provided costs for some or most of the adaptation actions. However:
In three cases, the same costs were listed in each row, which may indicate an error or oversight.
In one case, the NHS Board only included costs for 3 out of 32 actions; however, rather than indicating a range using the drop-down menu, those costs appear to be specific quotes for building repair/upgrade work.
The guidance provided within the spreadsheet specifies that the financial costs relate to the cost to implement the proposed adaptation measure. However, it appears that some users have interpreted this in different ways, with some appearing to describe the cost of repairing damage, i.e. the cost of inaction.
Note the following:
Aside from NHS Dumfries and Galloway, which included an extract of its risk assessment in its PBCCDR, none of the CCRAs are publicly available. This means that some of the cost information cannot be shared.
Aether did not have access to any information about the methodology used to calculate the costs. Therefore, we cannot comment on the details of what the estimates include. For example, in several CCRAs, costs were indicated against a specific risk, but the proposed response was to undertake a further assessment of that risk. It is not clear whether the cost refers to the price of the assessment, or the potential cost of repairing damage.
Other organisations reviewed
The 2024 Adaptation Plan for Scottish Water (Scottish Water, 2024) describes the level of investment needed to respond to climate change impacts as being ‘in the range of £2-5 billion over the next 25 years.’ This was notable because it refers to costs as an ‘investment’, a term which acknowledges the long-term benefits and payback. However, the report does not explain how this figure was obtained. There are a few other similar costs cited, including £1.5bn having been invested in flooding/environmental projects in Glasgow, and £500m further investment needed for combined sewer overflows.
Transport Scotland’s adaptation plan (Transport Scotland, 2021) does not contain any quantitative information on costs or benefits. However, it contains information which suggests that these will be considered separately. For instance, a Vulnerable Locations Group has been established, which is expected to ‘deliver cost effective actions in the short term whilst developing a move to a long-term proactive approach, including a dedicated budget for climate adaptation.’
Historic Environment Scotland’s adaptation plan (Historic Environment Scotland, 2021) references the ‘triple dividend of adaptation, which is discussed qualitatively. This includes: (1) avoided losses (2) economic gains and (3) social, environmental and cultural benefits.
Key points regarding quantitative costs and benefits
Local Authorities: Overall, there is very little quantitative information on costs and benefits within Local Authority adaptation plans. Costs and benefits are addressed qualitatively to varying levels of detail. Two regional economic impact assessments have been produced, for Climate Ready Clyde and Highland Adapts, which together cover nine out of 32 Local Authorities. A small number of other adaptation plans cite costs for specific measures, mostly linked to flood damage and flood infrastructure.
NHS Boards: Those that undertake a CCRA using the standard template are prompted to record costs against individual risks, but not all have done so. In many cases it is not clear what the costs refer to. The costs primarily relate to the cost of upgrading infrastructure or repairing damage to assets (e.g. due to flooding).
Other organisations: Scottish Water referred to total investment costs at a high level in its adaptation plan. Transport Scotland and Climate Ready HES both address costs and benefits from a qualitative standpoint.
Reflections on the adaptation planning landscape
Maturity of adaptation plans
This section describes the overall maturity of adaptation plans, which can be assessed in different ways.
SSN measures the extent of adaptation action reported by organisations in their PBCCDs on a scale from ‘none’ to ‘advanced’, where advanced is defined as a ‘strategy or adaptation pathway with targets to assess progress on risk management and actions to address shortfalls.’
The Adaptation Scotland Capability Framework (Adaptation Scotland, 2019) rates organisations’ adaptive capacity as starting, intermediate, advanced or mature along four different axes relating to culture and resources, understanding, planning and implementation and working together. A benchmarking tool is provided for organisations to assess their own maturity. As there is no overall rating, an organisation can be ‘mature’ in one of the capabilities, but ‘starting’ in another. For more information, see Appendix C.
Within this report we have not formally defined a scale for how the maturity of an adaptation plan should be assessed. However, we have looked beyond reported action in the PBCCDRs to consider dimensions that influence the maturity of specific, dedicated climate adaptation plans where they exist. Dimensions that contribute to a mature plan, that have been discussed throughout this report, include:
Clear objectives and a vision for adaptation are defined.
A range of hazards and future scenarios are considered in a risk assessment that provides an evidence-based plan.
Individual actions are specific, have ownership, timescales, resourcing and relevance.
Monitoring and evaluation is in place.
The plan has been co-developed with stakeholders.
Synergies with mitigation actions are understood and exploited but adaptation and mitigation are not conflated.
SSN’s most recent summary analysis of PBCCDRs (Sustainable Scotland Network, 2023) assessed the extent of adaptation action reported, finding that 28% of local authorities and 65% of NHS boards reported limited adaptation planning, with 15% of NHS boards reporting no action at all.
There are some examples of more mature plans adhering to the principles outlined above, particularly amongst local authorities and the ‘other’ organisations reviewed here. For example, the City of Edinburgh Council updated its previous adaptation plan this year and the new plan contains numerous features of a more mature approach, including undergoing a consultation process during its development, setting out a high-level vision for adaptation and including timescales and ownership of specific actions. Conversely, there are also local authorities without consolidated adaptation planning and those that have confused adaptation and mitigation, so overall there is a wide range of capacity and maturity of planning in Scotland.
Unlike Local Authorities, all of the NHS plans were underpinned by a CCRA. They could be considered more mature than Local Authority plans by that metric. However, they generally focused on a narrower range of risks. It is therefore difficult to compare their maturity on a like-for-like basis.
This range of maturity and understanding across public bodies should be taken into account as further adaptation guidance is developed. Further work to understand the barriers for organisations to reach a greater level of maturity would be useful. It is acknowledged that organisations such as Sniffer may already have explored this topic and that Adaptation Scotland’s PSCAN offers an opportunity for organisations with less mature planning learn from those at a more advanced stage.
Finally, although this study did not specifically seek to compare adaptation plans against mitigation plans, it appears that adaptation plans are less mature overall.
Gaps and omissions in the adaptation plans reviewed
When taking a broad view of the documents that have been reviewed as part of this study, there are several notable gaps and omissions. The missing information may be recorded by public bodies in another form, or answers may be known internally by the organisation. Nevertheless, these gaps and omissions may have policy implications and could be investigated further to identify barriers to effective public body adaptation planning. These are presented in no particular order.
With the exception of flooding, the implications for emergency planning and risk management were generally omitted from Local Authorities’ plans. For example, the potential need to revise major incident plans to reflect more severe weather events.
Few organisations made an explicit link between adaptation and mitigation actions. Some of them mentioned potential co-benefits or the risk of unintended consequences. However, our team found various instances where there were linkages that had not been explored. This was not limited to mitigation but also applies to policies on health, biodiversity/nature, etc.
Some public bodies provided evidence of engaging with stakeholders such as business groups or utility companies. However, the adaptation plans that were reviewed in this study contained relatively limited information about how the public bodies engaged with, and sought input from, affected communities. A few (e.g. Shetland, Aberdeen) did refer to having held public events. It is acknowledged that various forms of community engagement have been undertaken (examples include, but are not limited to, the Highland Adapts/Outer Hebrides Climate Story Maps and work undertaken as part of Climate Ready Clyde) which may not be referenced in published adaptation plans.
Where organisations had produced their own adaptation plans, these generally did not appear to be coordinated with other public bodies operating in the same area except where regional partnerships exist. Several plans mentioned the need to consult with stakeholders, or cross-referenced regional studies that have been carried out. There was one example of an NHS board acknowledging that its adaptation response would rely in part on action taken by the Local Authority. However, that Council has not yet produced an adaptation plan so this desk review was unable determine the extent to which collaborative working may be taking place.
Where climate risk assessments were carried out, hazards were usually considered, but vulnerability and exposure were frequently not addressed. It is therefore difficult to state whether organisations have targeted their adaptation actions appropriately.
NHS boards that followed the CCRA template generally assessed the impacts of climate change on particular assets (e.g. flooding to car parks). They generally did not consider how climate change would affect the types of services they provide (e.g. having to treat different diseases).
Potential barriers
The scope of this study did not include an assessment of what barriers public bodies face when trying to develop more mature adaptation plans. However, our team identified a variety of potential contributing factors that could be explored in future:
Adaptation might be considered a lower priority than other issues, given that public bodies face competing demands on their resources.
For Local Authorities, the lack of dedicated climate adaptation plans may simply reflect the fact that they are not explicitly required to produce them.
Public bodies may have insufficient in-house capacity to develop more detailed plans. This could be due to a lack of time and/or budget to produce a plan or (where necessary) upskill personnel to complete them. Where there is insufficient in-house capacity, the bodies may also lack the financial resources to commission the work externally. If public bodies have received training or guidance, factors such as staff turnover could prevent this knowledge from becoming part of the institutional memory.
Although there is a variety of guidance available for public bodies to use for adaptation planning in general, some may be unaware of it, unsure how to access it, or not understand how to use it in the context of all the guidance that is available.
As discussed in Section 6.1, it may be challenging to apply conventional cost-benefit analysis to adaptation measures. Although methodologies for doing this do exist, they may not be accessible for public bodies to use.
Some organisations provide a wider range of services than others, or operate within a larger/more diverse geographic area. One reason their adaptation plans might contain less detail could be because they have to ensure that actions are relevant across all of their operations. A public body with a narrower remit might find it easier to develop specific adaptation actions.
It is important to gain a better understanding of what barriers public bodies face, because they may require different support and interventions.
Potential modifications to PBCCDRs
This review found that the responses to PBCCDRs that were intended to address climate change adaptation often included information that was not directly relevant. As a result, it was difficult to interpret the public bodies’ overall level of adaptation planning based on their PBCCDRs.
Below is a list of clarifications and questions that could be incorporated into the PBCCDR form or practical guidance to help address this issue. These are intended solely as examples for consideration.
At the start of the adaptation tab, add wording to the effect of: ‘This section requests information about your organisation’s climate change adaptation plans. Adaptation in this context refers to actions that are taken to manage and respond to the effects of climate change. This is distinct from climate change mitigation, which refers to actions that are intended to reduce greenhouse gas (GHG) emissions, and thereby limit how much climate change occurs.’
On Question 4a, clarify that a comprehensive CCRA would consider a range of topics, not just flooding. Alternatively, state that Local Authorities do not have to describe their Flood Risk Assessments unless these have been incorporated into wider climate adaptation planning or CCRAs.
Add a new question or adjust Question 4b to ask, ‘Does your organisation have a dedicated climate change strategy and/or action plan that specifically addresses climate change adaptation?’
‘Have you assessed your progress against the ACF? If so, please provide your scores.’
[Local Authorities only] ‘If providing information about your Local Development Plan, please focus on specific ways that climate adaptation has been considered. If the plan only addresses climate adaptation as an overarching theme, without requiring any specific assessments or actions to be taken, this information can be excluded.’
Conclusion
This work has provided an overview of the adaptation planning landscape among Scottish public bodies, focusing on local authorities and NHS boards. It has described the information on costs and benefits of adaptation that is contained in public bodies’ climate adaptation plans. It has also presented reflections on the overall maturity and level of progress among different types of organisations. In doing so, it will help inform a collective understanding among stakeholders and identify knowledge gaps.
Key findings, topics for further study and recommendations are provided below.
Summary of key findings
The study reviewed a wide range of plans, strategies and other documents that are relevant to adaptation planning. It was clear that many organisations have utilised guidance, tools and resources made available through Adaptation Scotland. Nonetheless, we have identified that public body adaptation plans vary widely in their scope, content and levels of maturity.
There were some key differences observed between local authorities, NHS boards and other organisations (Scottish Water, Historic Environment Scotland and Transport Scotland), which likely reflect these organisations’ different remits, sectors and the geographic areas that they cover. Notably, NHS boards are required to produce CCRAs and adaptation plans in a standard format whereas local authorities are not.
Affirming earlier findings by SSN, this study found multiple examples of confusion between climate change adaptation and mitigation. Therefore, public bodies’ self-reported levels of adaptation planning is not always accurate.
The adaptation plans reviewed in this study were found to contain minimal quantitative information on costs and benefits.
For local authorities, the majority of quantitative information that is available relates to the regional economic impacts of climate risks (i.e. the cost of inaction). This is set out in two reports, both undertaken by Paul Watkiss Associates. We found one example of a local authority that had attempted to downscale this information in order to indicate costs against local adaptation measures. Overall, however, the regional assessments may not be suitable for the purpose of developing a business case.
NHS boards, when carrying out CCRAs, are prompted to indicate the cost of adaptation measures in relation to each risk that they identify. However, in most cases these sections were left blank. Where costs were indicated, it was not always clear what they referred to. Our team did not have any information on the methodology used to estimate those costs.
Flooding is the one topic area where organisations clearly showed a more mature understanding of the risks, historic impacts/damages, and the costs and benefits of adaptation measures.
Some adaptation plans specifically acknowledge the lack of information on costs and benefits, citing this as an area where further study is needed. There is evidence that public bodies have an appetite for collaborative working to address these gaps, as demonstrated by the existing partnerships such as Climate Ready Clyde and Climate Ready SES.
Although not the focus of this study, our team has proposed some potential barriers to adaptation planning that merit further exploration. In our view, gaining a better understanding of those barriers is a prerequisite to identifying a suitable policy response.
Topics for further study
There were several questions that arose from this review which could be considered for further study:
Barriers: Given the resources available to local authorities, what is preventing them from producing more detailed plans? A list of initial suggestions is in Section 7.3.
Guidance: There is already a broad range of public sector and international standards that define the approach to adaptation planning. Would more targeted guidance on how to utilise available resources be useful, e.g. more clarity on how to fill out the PBCCDR and NHS CCRA templates to help standardise the outcomes? Should there be sectoral or regional guidance, e.g. targeted at island communities? Or is guidance not one of the key barriers that public bodies face? Note, any new guidance should consider opportunities to address the gaps described in Section 7.2.
Missing information: Potentially, there could be more evidence on costs and benefits that is not reflected in the action plans or PBCCDRs.
Governance: To what extent have organisations actually embedded adaptation into their other plans, strategies and operations? From the PBCCDRs, it was not always clear whether the public bodies were carrying out dedicated adaptation planning or simply reiterating work that would happen anyway e.g. flood risk assessments.
Recommendations
The table below presents recommendations for policy, based on this review.
Ref.
Recommendation
Rationale
1
Engage with public bodies and undertake further research to understand the barriers they face to identify the specifics of the support they need for adaptation planning. Suggested topics for further study are provided in Section 8.2.
Establishing the details and actions on the support that is needed will allow budgeting for targeting resources effectively.
2
Require local authorities to produce climate change risk assessments that consider topics additional to flooding, and use these to develop climate change adaptation plans, in line with guidance from the Adaptation Scotland Programme.
Local authorities are not currently required to produce adaptation plans. New statutory guidance is being developed. This could be used to encourage public bodies to have an adequate level of adaptation planning in place, with recognition of scope, remit and budget differences.
3
Provide public bodies with advice on how the regional economic impact assessments (see Section 6.2.2) and other national evidence relating to costs and benefits can be downscaled to support the case for local adaptation planning and investment.
This would make use of the existing evidence base. The authors of the regional reports acknowledge that the information would need to be adapted for use in a cost-benefit analysis as part of an outline business case.
4
Align SSN’s system for rating the maturity of adaptation planning with the Adaptation Capability Framework. This would likely require organisations to assess and self-report their scores, which links to Recommendation 2. See Section 7.1 for more information.
Currently these do not align, which makes it difficult to track progress.
5
Explore ways to support public bodies with limited resources to produce adaptation plans or CCRAs. This could involve signposting to information provided by the Adaptation Scotland programme on easy wins, low-regret actions, no- or low-cost actions and partnership arrangements to share skills, knowledge and budgets.
All local authorities could benefit from this information. For some, there may be instances where it would be better to focus on a small number of key actions instead of using limited resources to produce an adaptation plan that lacks detail or substance.
6
Clarify what information on adaptation should be reported within PBCCDRs and what information is unnecessary in terms of key performance indicators. In particular, PBCCDR guidance should include clarity on the difference between mitigation and adaptation. See Section 7.4 for more information.
Responses were inconsistent and often appeared to signpost to workstreams or documents that would have happened anyway.
Some responses signposted to information that relates to mitigation, not adaptation. This has also been observed by SSN.
8
In future, where mitigation programmes are undertaken or funded by the Scottish Government and public bodies would be involved in their delivery, signpost links between mitigation and adaptation.
Considering mitigation and adaptation in parallel is important to maximise co-benefits and avoid unintended consequences.
Table 2: List of recommendations and description of the rationale
References
Aberdeen City Council, 2019. Aberdeen Adapts: Climate Adaptation Framework, Appendix 1 – Consultation Summary. [Online] Available at: https://committees.aberdeencity.gov.uk/documents/s105310/PLA.19.407%20-%20Appendix1%20ConsultationSummary.pdf
Aberdeen City Council, 2022. Aberdeen Adapts: Climate Adaptation Framework. [Online] Available at: https://www.aberdeencity.gov.uk/sites/default/files/2022-11/Aberdeen%20Adapts_Nov1_proof.pdf
Aberdeenshire Council, 2019. Local Clmate Impact Profile. [Online] Available at: https://aberdeenshirestorage.blob.core.windows.net/acblobstorage/b70a7fc3-42f6-4766-8d05-44642f2a010f/lclip-2019-high-res.pdf
Adaptation Scotland, n.d. NHS Lanarkshire – Place-based and site specific action. [Online] Available at: https://adaptation.scot/take-action/nhs-lanarkshire/
Advisory Group on the Economics of Climate Change Risk and Adaptation, 2024. Interim Report to the CCC – Advisory Group on the Economics of Climate Risk and Adaptation, s.l.: UK Climate Risk.
Cambridge Econometrics, 2023. Valuing the costs and benefits of climate change risk and adaptation policy, s.l.: UK Climate Risk.
Climate Change Committee, 2023. Investment for a well-adapted UK. [Online] Available at: https://www.theccc.org.uk/publication/investment-for-a-well-adapted-uk/
Climate Ready Clyde, 2019. Glasgow City Region Climate Adaptation Strategy and Action Plan, Annex 1: Economic and Financial Assessment. [Online] Available at: https://climatereadyclyde.org.uk/wp-content/uploads/2021/06/08-Annex-1-Economic-Case-and-Finanacial-Assessment.pdf
Climate Ready Clyde, 2021. Climate Change Adaptation Strategy and Action Plan. [Online] Available at: https://climatereadyclyde.org.uk/climate-change-adaptation-strategy-and-action-plan/
Comhairle nan Eilean Siar Council, 2022. Outer Hebrides Climate Rationale: An overview of our changing climate and impacts for the islands. [Online] Available at: https://adaptation.scot/app/uploads/2024/08/ohcpp-climate-rationale-final.pdf
Dundee City Council, 2019. Dundee Climate Action Plan. [Online] Available at: https://www.dundeecity.gov.uk/sites/default/files/publications/climateactionplan.pdf
East Ayrshire Council, 2021. Clean Green East Ayrshire: Climate Change Strategy. [Online] Available at: https://www.east-ayrshire.gov.uk/Resources/PDF/C/Climate-Change-Strategy.pdf
East Dunbartonshire Council, 2019. Adaptation and Nature-Based Solutions Options Assessment Report:. [Online] Available at: https://eastdunbarton.moderngov.co.uk/documents/s4704/Appendix%204%20-%20ANBS%20Options%20Assessment%20Report%2019-09-23.pdf
East Dunbartonshire Council, 2019. Adaptation and NBS Options Assessment Report. [Online] Available at: https://eastdunbarton.moderngov.co.uk/documents/s4704/Appendix%204%20-%20ANBS%20Options%20Assessment%20Report%2019-09-23.pdf
Edinburgh City Council, 2016. Edinburgh Adapts: Climate Change Adaptation Plan 2016-2020, s.l.: s.n.
Edinburgh City Council, 2023. Draft Climate Ready Edinburgh Plan 2024-2030. [Online] Available at: https://consultationhub.edinburgh.gov.uk/bi/climate-ready-edinburgh/user_uploads/draft-climate-ready-plan-for-consultation–22-jan-24-.pdf
Edinburgh City Council, 2024. Climate Ready Edinburgh Plan 2024-2030. [Online] Available at: https://www.edinburgh.gov.uk/downloads/file/35638/climate-ready-edinburgh
Frontier Economics & Paul Watkiss Associates, 2022. Barriers to financing adaptation actions in the UK. [Online] Available at: https://www.theccc.org.uk/publication/barriers-to-financing-adaptation-actions-in-the-uk-frontier-economics-paul-watkiss-associates/
Highland Council, 2012. Adapting to the Impacts of Climate Change in Highland. [Online] Available at: https://www.highland.gov.uk/download/downloads/id/3584/adapting_to_climate_change.pdf
Historic Environment Scotland, 2020. Historic Environment Scotland Climate Action Plan 2020-2025. [Online] Available at: https://www.historicenvironment.scot/archives-and-research/publications/publication/?publicationId=94dd22c9-5d32-4e91-9a46-ab6600b6c1dd
IPCC, 2018. Fifth Assessment Report (AR5), Chapter 17: Economics of Adaptation. [Online] Available at: https://www.ipcc.ch/site/assets/uploads/2018/02/WGIIAR5-Chap17_FINAL.pdf
IPCC, 2019. Special Report on the Ocean and Cryosphere in a Changing Climate Glossary , s.l.: s.n.
NHS Greater Glasgow and Clyde, 2023. NHSGGC Climate Change and Sustainability Strategy 2023-2028. [Online] Available at: https://www.nhsggc.scot/downloads/climate-change-and-sustainability-strategy-2023-2028/
Paul Watkiss Associates, 2019. Towards a Climate Ready Clyde: Climate Risks and Opportunities for the Glasgow City Region – Economic Assessment. [Online] Available at: https://static1.squarespace.com/static/5ba0fb199f8770be65438008/t/5c70173ce4966bc8cf635bca/1550849870187/25+CRC+Climate+Risk+-+economic+impact+report.pdf
Paul Watkiss Associates, 2022. The Costs of Adaptation, and the Economic Costs and Benefits of Adaptation in the UK. [Online] Available at: https://www.theccc.org.uk/publication/the-costs-of-adaptation-and-the-economic-costs-and-benefits-of-adaptation-in-the-uk-paul-watkiss/
Paul Watkiss Associates, 2024. Regional Report: Highland Climate Risk & Opportunity Assessment – Economic Analysis. [Online] Available at: https://highlandadapts.scot/wp-content/uploads/2022/02/Regional-Report-HCROA.pdf
Perth and Kinross Council, 2021. Climate Change Strategy and Action Plan. [Online] Available at: https://www.pkclimateaction.co.uk/climate-resilience
Transport Scotland, 2021. Transport Scotland’s Approach to Climate Change Adaptation and Resilience. [Online] Available at: https://www.transport.gov.scot/media/53779/ts-approach-to-climate-change-adaptation-and-resilience-accar.pdf
West Dunbartonshire Council, 2021. Climate Change Action Plan: Taking Action for a Net Zero Future. [Online] Available at: https://www.west-dunbarton.gov.uk/media/4320717/climate-change-action-plan.pdf
West Dunbartonshire Council, 2021. Climate Change Strategy: A Route Map for a Net Zero Future. [Online] Available at: https://www.west-dunbarton.gov.uk/media/4319776/climate-change-strategy.pdf
Appendices
Appendix A – Organisations involved in joint adaptation plans
The table below sets out a list of organisations that have joined together to produce climate adaptation plans or evidence base documents. This is based on our team’s understanding at the time of writing (October 2024) and may not be an exhaustive list.
Name
Organisations involved
Climate Ready Clyde
Members:
North Lanarkshire
Inverclyde Council
Glasgow City Council
East Renfrewshire Council
East Dunbartonshire Council
West Dunbartonshire Council
Renfrewshire Council
South Lanarkshire Council
University of Strathclyde
Scottish Government
Strathclyde Partnership for Transport
University of Glasgow
Scottish Environment Protection Agency
Climate Ready South East Scotland
Members:
City of Edinburgh
East Lothian
Fife
Midlothian
Scottish Borders
West Lothian
Other collaborators: 6 community climate action hubs, CAG Consultants, Paul Watkiss Associates
Highland Adapts
Members:
NatureScot
ChangeWorks
Sniffer
Highlands & Islands Climate Hub
Zero Waste Scotland
NHS Highland
Forestry and Land Scotland
The Highland Council
Highlands and Islands Enterprise
Table 3: Organisations involved in joint adaptation plans
Appendix B – Recent and upcoming work
There are several recent and upcoming developments that will provide further evidence relating to adaptation in Scotland generally, and costs and benefits in particular. These include, but are not limited to, the following:
SNAP3, which was published in September 2024. This will influence adaptation planning among public bodies because they have a duty to help deliver against its objectives.
A Local Authority Climate Service, recently launched by the Met Office. This should make it easier for Local Authorities to access relevant data on climate projections.
Updated versions of the Adaptation Scotland Public Sector Adaptation Capability Framework, Further Guidance, Starter Pack, and Benchmarking Tool will be published in early-2025.
The fourth UK climate change risk assessment (CCRA4). The independent evidence base supporting this will be published in 2026.
A regional CCRA is being commissioned by Climate Ready South East Scotland. It is expected to be released in 2025.
Perth and Kinross, Angus and Dundee Councils are currently exploring opportunities to create a Tayside Regional Adaptation Partnership and have released a tender to commission a regional analysis of the combined climate risk and opportunity assessments of the three member organisations .
NHS NSS has carried out a review of NHS boards’ adaptation plans and CCRAs. At the time of writing (October 2024) this is not publicly available, but it is understood that the work will provide a more detailed look at the content of those plans.
All of these programmes could help contribute to a better understanding of adaptation among Scottish public bodies, and facilitate planning.
Appendix C – Adaptation Scotland Capability Framework
The Capability-Maturity Approach identifies four capabilities to be developed in the context of adaptation and recommends tasks to support progress. These capabilities are: (1) organisational culture and resources (2) understanding the challenge (3) planning and implementation and (4) working together.
Figure 2. Infographic showing two stages in the Adaptation Scotland Capability Framework
To benchmark, the public body scores themselves against the criteria for each capability using a score between 0 and 3, in relation to how accurately the description describes the organisation. The public body must record evidence to justify the current activity against each task.
As the criteria are open to interpretation, this allows public bodies to apply the guidance based on their understanding, priorities and strategic outcomes. This has led to very diverse outputs across the Local Authority adaptation plan landscape.
For the capability, organisational culture and resources; the ‘starting’ and ‘intermediate’ steps focus on resource availability and allocation, whereas the ‘advanced’ and ‘mature’ steps focus on identifying internal plans, policies and procedures to include adaptation within.
Appendix D – Case studies
There are many examples of public bodies whose work on adaptation shows unique features and demonstrates good practice. A selection of case studies is below.
These have been selected to illustrate nuances in public bodies’ approaches to adaptation planning. These nuances may not be captured in the database summary, and can be used to contextualise recommendations in the report.
Note, inclusion in this list does not suggest that the case study is the best or only example of a given approach.
Considering the impacts of risks on different cross-cutting themes: Highland Council
In its 2012 climate adaptation report (Highland Council, 2012), the Highland Council employed a multi-criteria assessment approach to evaluate risks in relation to cross-cutting themes, rather than looking at them in isolation. Whilst this example is more than a decade old, and will be superseded by the forthcoming risk assessment produced by Highland Adapts, this is an example of holistic thinking. An excerpt is shown below.
Figure 3. Excerpt from the Highland Council’s assessment of climate risks in relation to cross-cutting themes
To assess the risk posed by identified threats such as severe weather events, a multi-criteria analysis approach was adopted. Each threat was assessed in relation to cross-cutting themes, drawing out potential further threats, and opportunities, following the framework of 12 sectors set out by the Scottish Government. For example, for the threat to water resource management, a risk is identified that ‘drought could lead to mandatory water conservation measures being enforced’.
This approach would have helped Highland Council consider its wider remit and identify opportunities to maximise co-benefits and optimise use of resources in adaptation action planning.
Linking climate change impacts to other corporate priorities: Comhairle nan Eilean Siar Council
As part of its Climate Rationale (Comhairle nan Eilean Siar Council, 2022), Comhairle nan Eilean Siar Council undertook an exercise to map climate change impacts against priority areas within its Local Outcome Improvement Plan (LOIP). It acknowledges that, ‘To respond to the climate challenge and realise the LOIP vision, climate adaptation and resilience must be linked to societal issues, moving beyond sectoral responses and acknowledging the environment as the support network underpinning everything, to enable a safer, healthier and more prosperous Outer Hebrides.’
This is a good example of an organisation firstly acknowledging that their wider corporate priorities are dependent on climate change action, and then seeking to align the two. In principle, this would help to achieve a more integrated response to both issues. It could also help to generate stakeholder buy-in by highlighting how climate adaptation planning is crucial for achieving success against a range of other metrics, whether those are social or economic.
Figure 4. Excerpt from the Comhairle nan Eilean Siar Council’s Climate Rationale, showing how climate hazards relate to policy priority areas
Using stakeholder engagement to inform adaptation plans: Aberdeen City Council
This is an example of a public body that has used extensive stakeholder engagement to inform its adaptation plans. Aberdeen City Council, as part of their Aberdeen Adapts programme, set up 5 stakeholder workshops, in which 41 local organisations participated. These workshops looked at: the impacts of climate change for Aberdeen; collected ideas for vision and strategy; shared information about actions that are already underway or are planned to support adaptation, and examined opportunities for increasing resilience. The arts were used in these engagement activities, and young people were also included.
In the consultation summary report (Aberdeen City Council, 2019), for each theme or question discussed, the report details the number of respondents, the percentage who agreed, disagreed or were unsure and key comments. An example is shown below.
Figure 5. Excerpt from Aberdeen City Council’s consultation summary report, showing the responses received in relation to a question about adaptation priorities
Notably, a need for stronger links between emission reduction actions and policies and plans was identified by stakeholders. This focus appears to have translated into the adaptation strategy that was subsequently produced (Aberdeen Adapts, 2022), which makes a point of highlighting the need to align with actions on decarbonisation.
Acknowledging different types of benefits and risks: Historic Environment Scotland
In Historic Environment Scotland’s Climate Action Plan (Historic Environment Scotland, 2020), a distinction is made between the ‘internal benefit’ and ‘wider benefit’ of adaptation actions. This encourages the adaptation planning team to consider types of benefits, and where benefits might be multiple or could be enhanced. For identifying co-benefits, this aids the process of decision-making in terms of financing initiatives and actions, as public bodies could contextualise financial costs for adaptation actions in relation to costs that may be saved, internally, and in terms of other sectors or competing priorities.
Figure 6. Example of some of the internal and external benefits associated with adaptation actions, as identified within Historic Environment Scotland’s Climate Action Plan
HHistoric Environment Scotland’s dedicated Adaptation Plan (Historic Environment Scotland, 2021), which was published the following year, was also the only adaptation plan identified in this study which included transition climate risks for their organisation. Transition climate risks are the risks introduced when regulators, legislators, consumers and companies start to take action on climate change, and transition to a low-carbon economy.
By identifying transition risks, public bodies can gain a better understanding of the potential unintended consequences of taking action on climate change, and seek to address these. Additionally, considering transition risks may help strengthen the business case for more funding or resourcing, if they can identify upfront multiple risks that could be compounded due to inaction.
Figure 7. Examples of transition risks, as identified within Historic Environment Scotland’s Climate Action Plan
Assessing local vulnerability to climate impacts: Climate Ready Clyde
Many of the adaptation plans reviewed in this study consider the hazards that may arise due to climate change, but not many address how vulnerable key receptors are to those hazards. As part of the Climate Ready Clyde project, an interactive map (Climate Ready Clyde, n.d.) has been produced, which shows different neighbourhoods’ comparative level of vulnerability to both flooding and overheating – see an excerpt in Figure 8. This is focused on social and community vulnerability and is based on the Scottish Index of Multiple Deprivation. It also shows contextual information such as woodland coverage and areas of vacant or derelict land.
The information could be used to target different stakeholder engagement approaches and/or adaptation actions at a postcode level, although the map authors acknowledge that a specific household or individual’s vulnerability will differ within any given area.
Figure 8. Excerpt from the Climate Ready Clyde map of neighbourhood-level climate change vulnerability
Using regional information to support local action: East Dunbartonshire Council
As explained previously, for Local Authorities, the majority of quantitative information that is available comes from two regional economic impacts reports on climate risks. This review found one example of a Local Authority (East Dunbartonshire) that had attempted to downscale information from the Climate Ready Clyde (CRC) Economic and Financial Assessment (Climate Ready Clyde, 2019), along with some other sources, to a local level within its adaptation options report (East Dunbartonshire Council, 2019).
This appears to have been done in a few different ways, depending on the action:
Citing overall costs for the Glasgow City Region
Referring to the cost-benefit ratio set out in, or derived from, the CRC Economic and Financial Assessment
Providing an indicative range of costs specific to East Dunbartonshire, some of which appear to be based on internal advice from Roads & Environment or other Council departments
The cost-benefit ratio was one of the most common metrics cited, which suggests that this was considered useful for the purpose of developing a case for local action.
Developing indicators and targets for adaptation: Dundee City Council
This example highlights an instance where proposed performance indicators and targets were given for adaptation actions. In the Dundee Climate Action plan (Sustainable Dundee and the Dundee Partnership, 2019), for some actions, detail is given to help make monitoring and tracking of progress against the suggested actions, feasible and achievable. By labelling them as proposed indicators, the plan leaves space for discussion and refinement, making sure the most appropriate indicators are decided upon. Along with detail on the lead responsible agency for the actions, they support accountability for achieving the actions.
The image below shows an extract from Annex 1 of the Dundee Action Plan.
Figure 9: Presentation of the actions within the Dundee climate action plan, including performance indicators and targets where applicable
In addition to the overarching CCRA that it is required to produce, NHS Lanarkshire has undertaken site-based CCRAs for its major sites. This recognises that its assets are diverse and therefore may require different adaptation responses. Although the documents are not publicly available, according to the Adaptation Scotland website (Adaptation Scotland, n.d.), the risk assessments also contain information on the costs that NHS Lanarkshire has incurred as a result of extreme weather events.
Although not necessarily feasible for all public bodies, this approach would allow more tailored actions to be taken for specific properties.
Transparency regarding stakeholder input to the adaptation plan: Edinburgh Adapts
The Edinburgh Adapts: Climate Change Adaptation Action Plan 2016-2020 (Edinburgh City Council, 2016) clearly describes what input was sought from different stakeholders when developing the adaptation plan. This addresses input from local business and communities as well as the support received from the Adaptation Scotland programme. It also sets out what stakeholders will have responsibility for long-term governance arrangements. It is also clear about the overall guidance that was followed. This is important from a transparency perspective.
Figure 10. Description of stakeholder input within the Edinburgh Adapts Climate Change Action Plan
While every effort is made to ensure the information in this report is accurate, no legal responsibility is accepted for any errors, omissions or misleading statements. The views expressed represent those of the author(s), and do not necessarily represent those of the host institutions or funders.


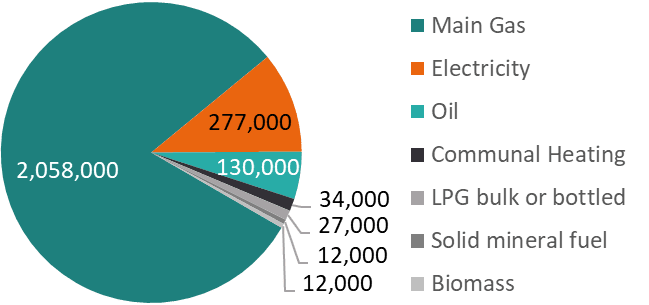
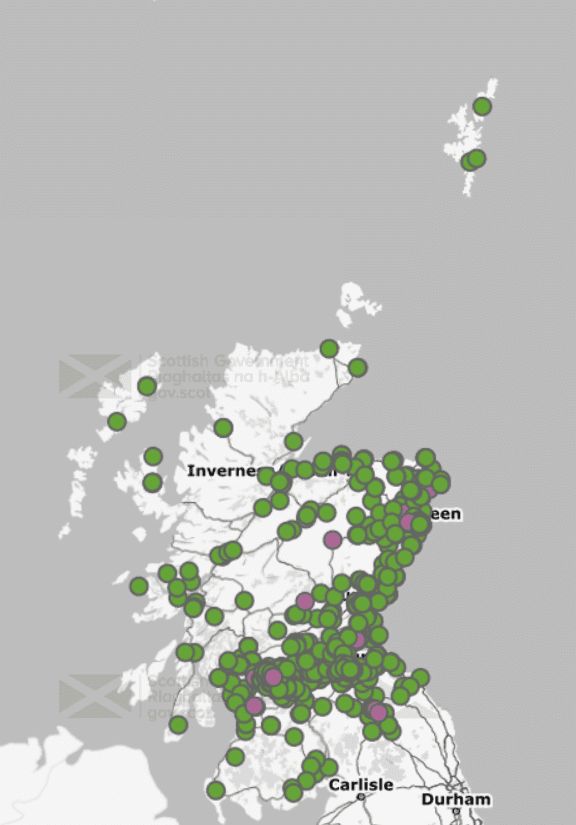
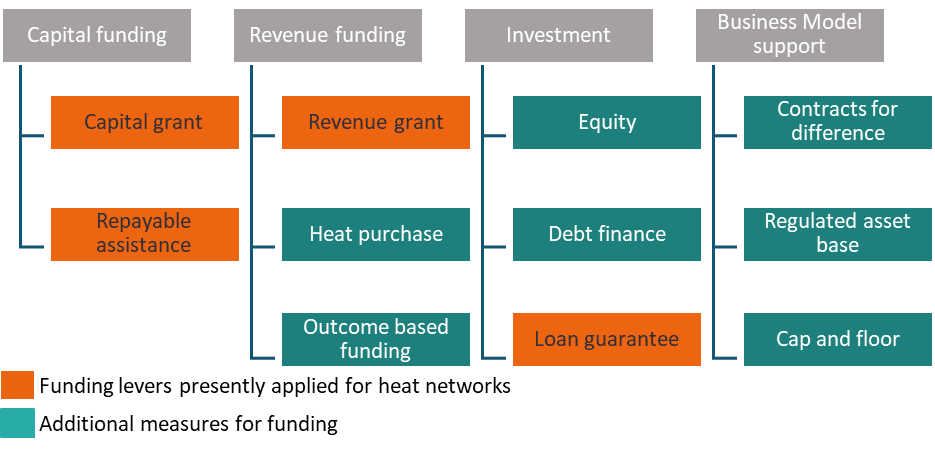

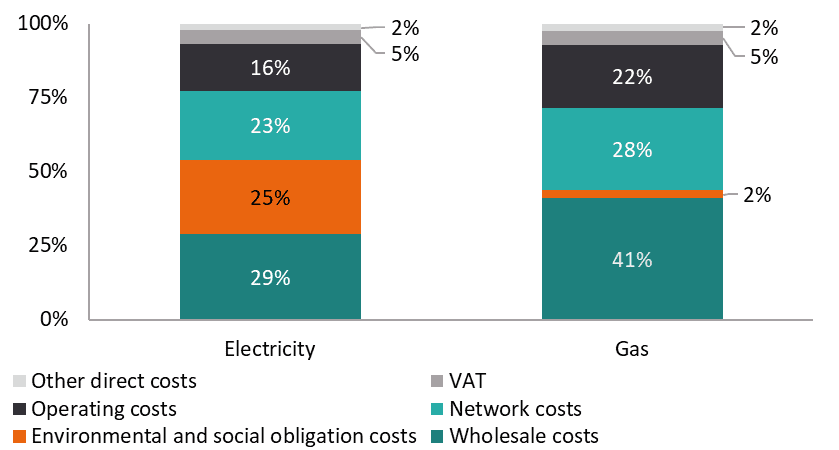
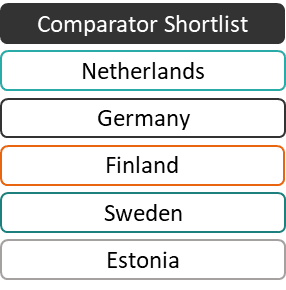
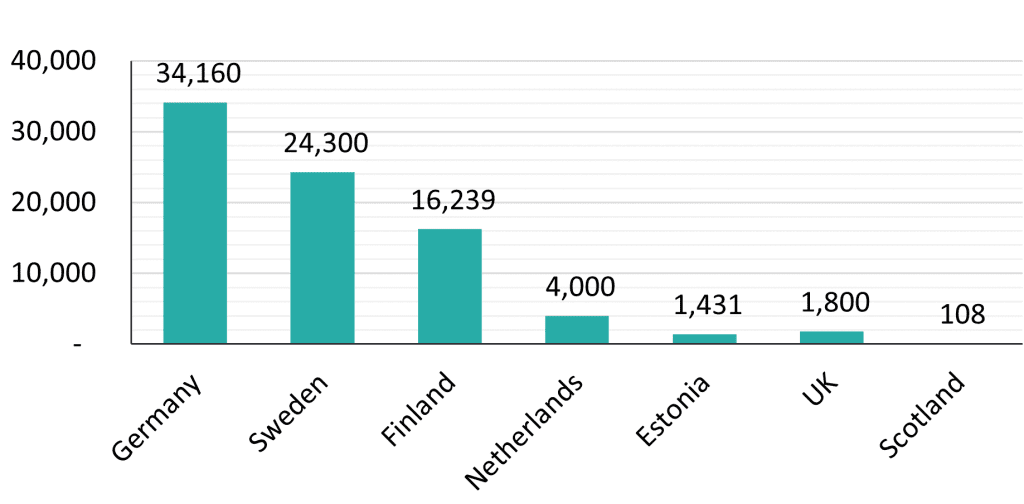
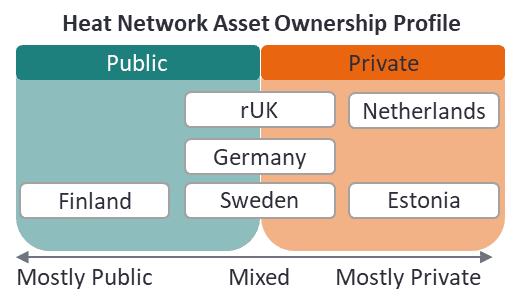
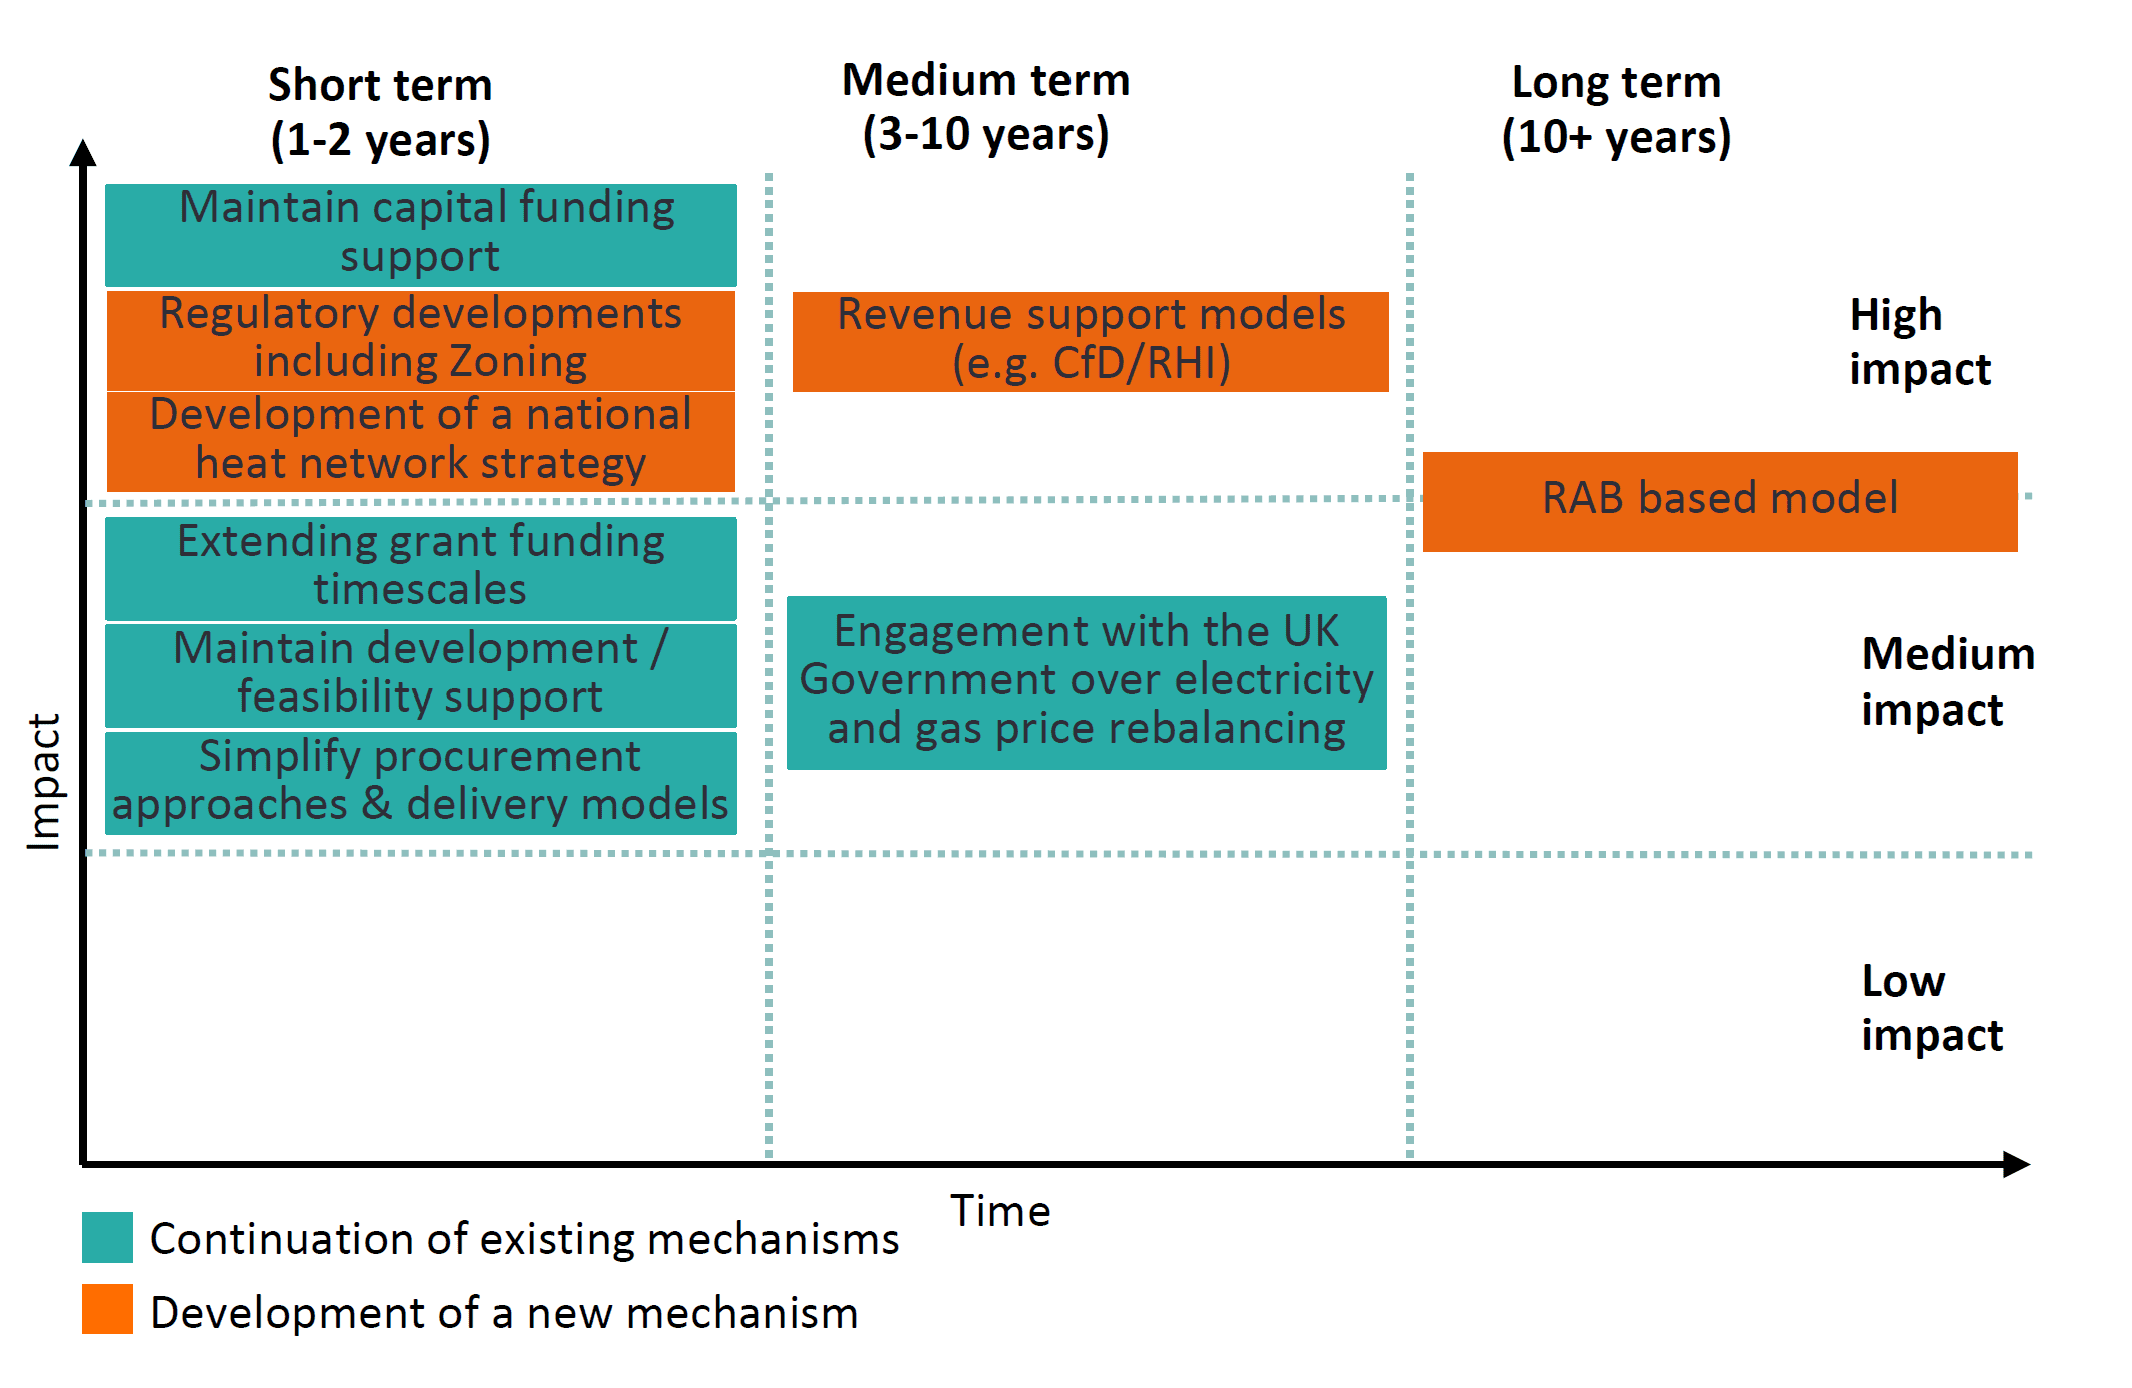
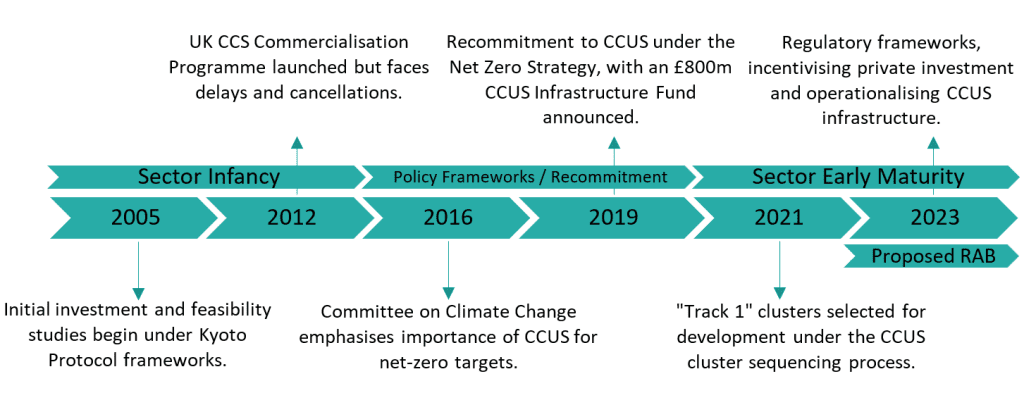
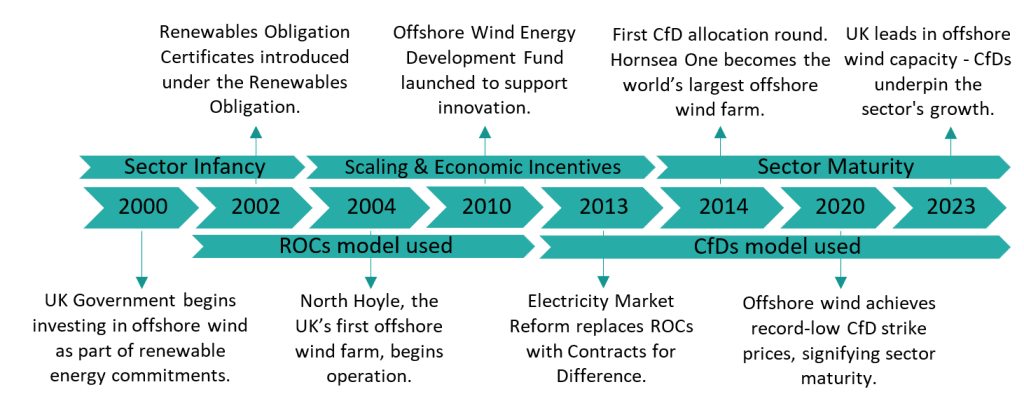
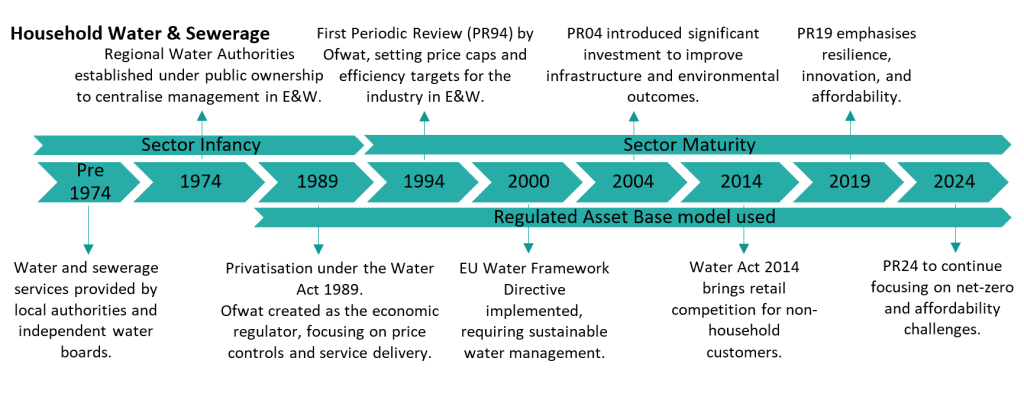
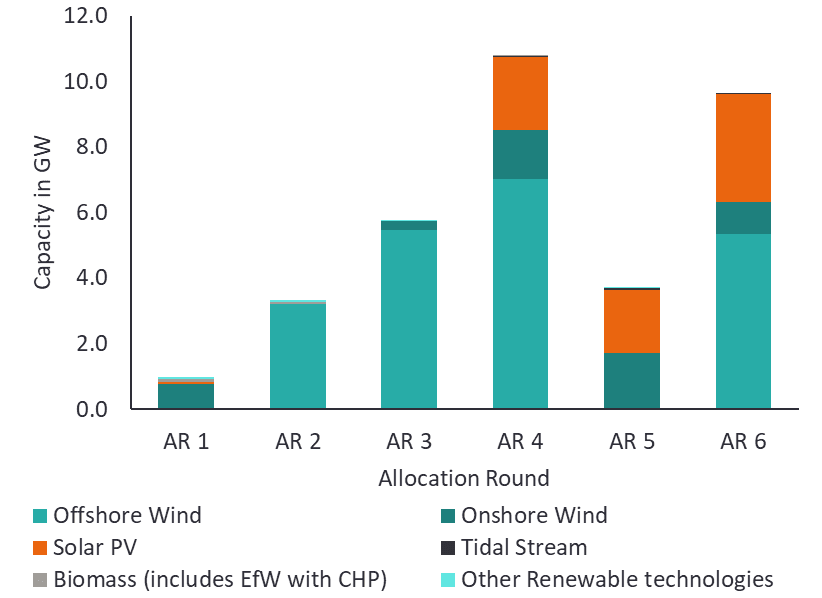


 Figure 1 Absolute number of dwellings suitable to meet thermal comfort at each flow temperature (°C) on a winter peak day with no retrofits
 Figure 2 Absolute number of dwellings suitable at each flow temperature (°C) on a winter peak day with more extensive, higher cost, retrofits


 Figure 5 Dwellings suitable for each flow temperature (cumulative, no retrofit scenario)
 Figure 7 Dwellings suitable for each flow temperature (cumulative, Lower cost retrofit scenario)
 Figure 8 Proportion of stock suitable for 55°C, by archetype (Higher cost retrofit scenario)
 Figure 9 Dwellings suitable for each flow temperature (cumulative, Higher cost retrofit scenario)


 Figure 13 Dwellings suitable for each flow temperature (cumulative, Higher cost retrofit scenario)
 Figure 14 Proportion of stock suitable at 55°C, by archetype (Higher cost retrofit scenario)
 Figure 15 Dwellings suitable for each flow temperature (cumulative, Higher cost retrofit scenario)
 Figure 16 Comparison of dwellings suitable at each flow temperature (cumulative) when reduced and recommended rates of radiator uptake are tested in peak external temperature cases, Lower cost retrofit scenario (above) and Higher cost retrofit scenario (below)
 Figure 18 Emission savings when moving from 75°C to 55°C – showing emissions based on 0.184 kgCO2/kWh for natural gas


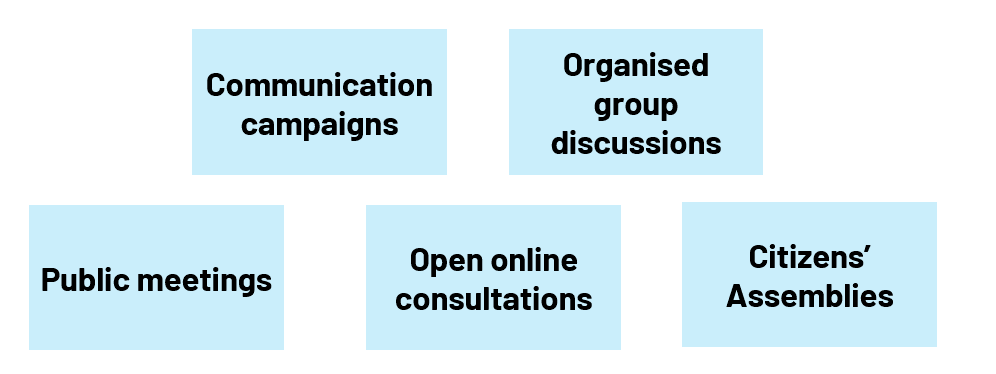


 Climate Ready Clyde (CRC)[16] is a leading cross-sector initiative funded by 12 member organisations and supported by Scottish Government to create and deliver a shared vision, strategy and action plan for an adapting Glasgow City Region. CRC have produced Glasgow City Region’s Adaptation Strategy and Action Plan (Sniffer, 2024a) which includes a webmap (created by Clydeplan) that shows the location of postcodes most vulnerable to the impacts of climate change (Clydeplan, 2022). This includes heat risk (derived from the 4EI Heat Hazard Index[17]) and a layer highlighting postcodes within the top two heat risk bands. The work from CRC on the Climate Risk and Opportunity Assessment and data layers in the vulnerability map directly informed Glasgow City Council’s Evidence report.


 A Climate Risk and Vulnerability Assessment (CRVA) map is a method co-developed by the WM-Air project team at the University of Birmingham with local and regional stakeholders across Birmingham and the West Midlands. A CRVA map shows how geospatial climate risk data may be used by local planning authorities. It is pulled together using different environmental, physical, and socio-economic datasets to understand how climate risk varies across an area. The mapping approach prioritises using publicly accessible data and can be replicated by other planning authorities to improve climate resilience (Greenham et al., 2023).


![A screenshot of a table which lists the potential benefits associated with an action to "undertake [...] research to better increase knowledge of the physical, social and economic impacts of climate change on the historic environment". Internal benefits could include better-informed decision-making. Wider benefits could accrue to the heritage and museum sectors once they disseminate the research.](https://www.climatexchange.org.uk/wp-content/uploads/2025/01/a-screenshot-of-a-table-which-lists-the-potential.png)


