
Research completed: May 2024
DOI: http://dx.doi.org/10.7488/era/5569
Executive summary
The agriculture policies outlined in the Update to the Climate Change Plan (CCP) provide a route map for agricultural transformation, to reduce greenhouse gas emissions. They take a co-development approach and work with stakeholders and farmer-led groups to secure increased uptake of low-emission farming measures through new schemes and approaches.
This project examined the potential reductions in livestock methane emissions through breeding, and the policy levers that could motivate these changes.
We began by exploring the technologies that detect and measure methane, manage data and are used in the breeding process. This included considering the availability of these technologies in Scotland in 2030 and 2045, with practical considerations for a Scottish context, and identifying the breeding traits that can lead to lower methane emissions.
We then identified the relevant policy levers and behaviour changes and considered what Government, the post-farm market, pre-farm gate actors and farmers can do differently to encourage methane reductions through breeding.
Key findings
- By 2045, breeding could reduce methane emissions from the digestive process in livestock, known as enteric methane, by up to 9.5% (382.2 kt CO2 equivalent). This is under the “Policy changes” scenario, where legislation will require farmers to introduce methane reducing breeding techniques to their herds (with uptake rates of 100% in dairy, 80% in beef, and 60% in sheep).
- This includes a 6.8% reduction in emissions from beef, 6% from dairy and 17.5% from sheep.
- This reduction is achieved by selecting traits for methane efficiency (methane production, intensity and yield), feed efficiency, offspring carcass weight, milk yield and milk fat and protein when choosing breeding stock.
- Our research highlighted selective breeding for feed efficiency as a promising option. This is because, despite its lower methane reduction potential, it builds on a practice that is already well understood by farmers.
- To achieve emission reductions, actions and behaviour changes will be required of Government policymakers, pre- and post-farm gate actors and farmers. We found key barriers were lack of knowledge and perceived cost.
- Scotland has a well-developed research base around breeding livestock for reduced emissions, placing it in good stead to develop further work in this area. Funding could be targeted towards building on this research, with more data points to support innovation and enhance the robustness of results. Further research could include the potential for a specific methane reduction target to increase clarity and focus action. Funding would be useful if targeted to better communication of the research findings to inform farm advisers, pre- and post-farm actors and supporting farmer peer-to-peer learning. Collaboration between stakeholder groups will achieve greater progress.
- Relevant technologies include methods to detect and measure enteric methane in animals, data management, reproductive technologies and genomics. Those that could be mainstream in Scotland by 2030 include a national breeding programme, sexed semen and the breeding potential of an animal for a specific trait, known as estimated breeding values. The interaction between technologies is key to success. For instance, the wide use of data management tools will depend on the wide use of genomics to collect data.
- We found very few instances of methane detection methods being used on farm in the UK. We therefore believe it is unlikely these will be used beyond research and innovators by 2045. As such, we recommend encouraging the use of proxies such as mid-infrared (MIR) spectra in milk to determine methane emissions.
- Many reproductive technologies are already in use, particularly in the dairy industry, so we estimate these to be mainstream across the cattle sector by 2045. We estimate lower uptake in the sheep sector due to artificial insemination being a complex procedure. However, as sheep start breeding at an early age and often have multiple births per animal, there is greater potential for emission reductions if low-emitting traits are introduced into the herd such as through a ram.
On this basis, we think there is a strong foundation for breeding for reduced methane emissions to contribute to Scottish Government’s methane and climate commitments and to support Scottish livestock farmers’ future resilience.
Glossary / Abbreviations
|
AI |
Artificial insemination |
|
DNA |
Deoxyribonucleic acid is an organic chemical that contains genetic information and instructions for protein synthesis |
|
EBVs |
Estimated breeding values |
|
DMI |
Dry Matter Intake |
|
FAO |
Food and Agriculture Organisation |
|
Gene |
A genetic sequence that contains information on specific traits. |
|
Genetic modification |
Any process by which genes are changed or deleted in order to adjust a certain characteristic of an organism. It is the manipulation of traits at the cellular level. |
|
Genetic selection |
Selecting for specific genes that carry desirable traits. |
|
Genetics |
The study of how genes are passed down from one generation to the next. |
|
GHG |
Greenhouse gas |
|
CO2 |
Carbon dioxide |
|
ICBF |
Irish Cattle Breeding Federation |
|
Methane |
A powerful greenhouse gas, a chemical compound with the chemical formula CH4. |
|
Microbes |
Microscopic organisms |
|
Microbiome |
A collection of microbes (e.g. bacteria) that occur in the rumen. |
|
NERC |
Natural Environment Research Council |
|
PAC |
Portable Accumulation Chambers |
|
Precision breeding |
Amends sections of DNA by adding or moving genetic material |
|
Proxy |
An object/thing that is being used in the place of something else |
|
REA |
Rapid evidence assessment |
|
Rumen |
The specialised stomach of a ruminant (e.g. cow) that digests feed by microbial fermentation. |
|
Ruminant |
Animals, including cattle and sheep, that have more than one stomach and have the ability to bring food up from their stomach and chew it again. |
|
Selective breeding |
Choosing animals that carry desirable traits to be bred so that the traits are passed on to their offspring. |
|
Traits |
Specific characteristics that are genetically determined. |
Introduction
Methane is a powerful greenhouse gas (GHG), 28 times more potent than CO2, produced as a by-product of the ruminant digestive process called enteric fermentation. During enteric fermentation, microbes digest feed in a specialised stomach, known as the rumen, subsequently releasing enteric methane. In 2021, enteric fermentation from ruminant livestock, such as cattle and sheep, was responsible for 48% of GHG emissions from agriculture in Scotland.
The UK signed the Paris Agreement, committing to limit global warming to 1.5°C and is a signatory of the Global Methane Pledge, aiming to reduce global methane emissions by at least 30% from 2020 levels by 2030. The Climate Change (Emissions Reduction Targets) (Scotland) Act 2019 outlines a net zero target for Scotland by 2045, with a 75% reduction in emissions by 2030. The strategy to meet these targets is laid out in Scotland’s Climate Change Plan (CCP) 2018-2032 and Climate Change Plan Update (CCPU).
One potential way to reduce emissions from the livestock sector is to select breeding traits in livestock that lead to lower methane emissions.
Traditional breeding programmes select cows or ewes producing offspring with desirable characteristics to either produce meat, milk or fibre, or to continue in the breeding herd. This method relies on waiting for the offspring to mature before the desired traits can be identified. The use of genetic technologies allows desired traits to be chosen at the point of breeding, giving a more assured outcome at an earlier stage.
Genetics are already used to facilitate precision breeding to improve livestock performance. As genetic changes are permanent and cumulative, it is an attractive option for targeting and reducing GHG emissions from ruminants (González-Recio et al., 2020; Manzanilla-Pech et al., 2021; Rowe et al., 2021).
Scottish research is at the forefront in breeding livestock for reduced methane. A recent project by the Roslin Institute highlighted the strong relationship between the rumen microbiome and methane emissions; SRUC has several relevant research studies (published and ongoing), with research facilities such as GreenCow measuring GHG emissions, and Moredun has researched the impact of livestock health and welfare on methane emissions. In 2023, Defra awarded £2.9 million to the sheep sector to launch ‘Breed for Ch4nge’ which aims to measure methane from 13,500 sheep to improve the efficiency of the UK flock; some of the research is taking place on Scottish farms.
The issue is of interest internationally. New Zealand research has shown that breeding for reduced emissions in sheep does not impact productivity and health; Canadian traders are marketing dairy semen with methane efficiency traits, and beef farmers in Ireland are being paid to take part in genomic programmes.
Please note, reducing methane through dietary amendments (such as feed additives) is out of scope for this project.
Project aims
This research project has two key aims:
- To understand the methane emission reductions that could be achieved in Scotland through breeding. We do this by identifying technologies that detect and measure methane, manage data and are involved in the breeding process. We look at the likely availability of these technologies in Scotland in 2030 and 2045, with practical considerations. Finally, we identify the breeding traits that can lead to lower methane emissions and quantify these.
- To identify what is needed to support this through policy levers and behaviour change. Using the findings of our literature review and stakeholder consultation, we suggest behaviour changes and discuss their impacts.
Identifying the evidence
To better understand where and how methane emissions could be reduced for project aim 1, we performed a Rapid Evidence Assessment (REA) and a series of stakeholder interviews[1] (now on referred to as our review) to understand:
- The technologies involved in reduced emission breeding;
- The important traits to select for reduced emissions;
- Emission reduction values;
- The benefits and challenges of breeding for reduced emissions;
The review also sought evidence on what is needed to support further uptake of these technologies in Scotland, for project aim 2.
The technologies involved in breeding for reduced emissions
We grouped the technologies used to identify livestock with low methane emissions into four categories: detection methods, data management, reproductive technologies and animal genomics.
We found little information regarding the timeline of availability for the technologies on farms in Scotland. In the stakeholder interviews, many were not aware of specific technologies being used unless they were directly involved in research. Our research did find international evidence, for example, portable accumulation chambers (PAC) in New Zealand support The Cool Sheep™ Programme. Due to this limited data on timing, we categorised the availability of the technology in Scotland in 2030 and 2045 under the following headings:
Experimental (E): used in research only, with no use on Scottish farms.
Innovative (I): used in trials on Scottish farms by a few innovators.
Mainstream (M): considered mainstream and being used on Scottish farms.
Future possibility (FP): unlikely the technology will be used by 2030 or 2045, however not ruling out its availability in the future.
Not applicable (NA): not relevant to the sector.
The rate of technology uptake will differ between and within sectors. For instance, dairy cattle are milked multiple times a day, providing an opportunity to closely assess individuals interacting with the technology. For the same assessment in the beef and sheep sectors, the grazing nature of the system may require cultural and habitual change for widespread uptake (Jones and Haresign, 2020). Farmers also have different interests, business structures, cash flow etc which impacts their decisions on changing farm practices.
Cost was excluded from our review due to the complexities in estimation. The cost of a technology is likely to depend on the individual farm situation, for example, the number of livestock or proximity to infrastructure or manufacturers. Technologies requiring installation may vary depending on whether adjustments are required to an existing building.
We understand the technologies presented below have the potential to be used in Scotland. The full list of technologies discovered in our research can be found in Appendix A, section 9.1.
Detection methods
Detection methods are used to detect and measure enteric methane to identify which animals emit less. Examples include a respiration chamber which measures the difference in methane emissions with and without the animal, while spot sampling uses head chamber systems or hand-held lasers to take short-term measurements from the animal’s breath (Tedeschi et al., 2022). Further examples can be seen in Table 1.
We found very few instances of detection methods being used in UK research, but we estimate that some will be available in 2030 and more by 2045 (see Table 1). However, as detection methods are primarily a research tool, it is unlikely they will be used beyond innovators by 2045. Practical constraints such as large technological components and measuring a few animals at a time make it challenging to introduce respiration chambers (which are considered the ‘gold standard’ of measurements) on a large scale (Manzanilla-Pech et al., 2021; Rowe et al., 2020). As such, we recommend encouraging use of proxies such as mid-infrared (MIR) spectra in milk to determine methane emissions.
Portable Accumulation Chambers (PACs) have been launched recently by scientists at Scotland’s Rural College (SRUC) for use across the UK. The two units (of 12 trailers) are currently only being used for research purposes. Each trailer holds 12 chambers and is capable of measuring between 60 – 80 sheep per day providing breeding values for methane emissions for representative samples of sheep within a breeding programme (Duthie et al., 2024)
New Zealand currently incorporates the use of PACs in breeding programmes through The Cool Sheep™ Programme, where breeders use PACs to measure and select for low-emitting rams available for breeding. Research trials are underway in countries such as Australia, Norway and Uruguay and now the UK. This technology provides a promising option for Scotland as it is transportable between farms and has a short measurement period which limits stress in livestock. However, current research trials on UK sheep systems need to be completed before PACs can be used widely (Duthie et al., 2024).
Data management
Data management technologies are essential to store, share and analyse data, while also tracking individuals and breeding lines with desired traits to improve target outcomes (including emissions reductions).
The dairy sector is advanced in this area compared to beef and sheep sectors, with established tools for monitoring and measuring production characteristics. Stakeholders discussed the possibility to enhance or repackage these tools and platforms, such as ScotEID, to incorporate methane traits. Using a tool that is familiar for farmers might reduce resistance for adoption.
- Case study: New Zealand
N-Prove is a free website tool for New Zealand farmers to find the best rams for breeding. Using a series of buttons and slider scales, farmers can customise what traits they are looking for in a ram. NProve then generates a list of breeders with rams that best fit. Farmers can select terminal or maternal traits, as well as breeders based on location, breed and exclude certain flocks from results. Methane production is an option to select from the maternal traits. The tool is free to use and registration is not required. The tools anonymity means farmers can gather their options for the best breeder for their farm. NProve sources data from a central database and genetic evaluation service (SIL database) that holds information for more than 600 flocks, making it one of the largest genetic evaluations of sheep in the world. This tool could be used in a similar fashion for other species in other geographies as long as an appropriate database was available or was developed to source information.
Data technologies rely on wider infrastructure, such as website portals or cross-country collaboration, making it challenging to estimate the availability for 2030 and 2045. However, there is high potential. Stakeholders discussed that a risk for these technologies is the lack of interest and uptake from farmers, so it is important to inform and engage the industry regarding their benefits.
These technologies offer benefits for farmers by improving the understanding of the genetic qualities of their livestock and having a head-start on understanding the genetics and traits being brought into the herd. See Table 2 for the relevant data management technologies.
Table 1. Examples of the detection methods involved in breeding livestock for reduced methane emissions. Please see Appendix A, section 9.1 for the full list of the technologies found in our review.
|
Description |
Livestock Sector |
Data collected |
Benefits |
Risks |
Timeline of availability in Scotland: Experimental (E), Innovators (I), Mainstream (M), Future possibility (FP), Not applicable (NA) |
Practical considerations in Scotland | |||
|---|---|---|---|---|---|---|---|---|---|
|
Beef |
Dairy |
Sheep | |||||||
|
Automated head chamber system (e.g. GreenFeed) |
A head chamber unit that can be positioned in housing or pasture. Feed is used to attract livestock to the unit (van Breukelen, 2023; Zaman et al., 2021). |
All |
Methane and CO2 concentrations |
Non-invasive. Can be set up in grazing fields or in housing. Portable |
High purchase and running costs. A spot measurement, not a true reflection of emissions per day. Feed to attract livestock increases costs. |
2030: E 2045: I |
2030: E 2045: I |
2030: E 2045: I |
No evidence was found for use in the UK. It could be a feasible option for Scotland due to the benefits of transportability and ability to measure grazing livestock. |
|
Mid-Infrared (MIR) data |
MIR spectroscopy is used to predict the fat and protein content of milk. As methane is linked to milk composition, the latter can be used as a proxy to predict methane emissions (Dehareng et al., 2012; Semex, 2023). |
Dairy |
Milk components such as lactose, protein and fat |
MIR technology is already used routinely in milk recording. Therefore providing an existing infrastructure to integrate methane reporting to. |
Because it is a proxy, validation of results (for example with a respiration chamber) is required (Denninger et al., 2020). |
NA |
2030: I 2045: I |
NA |
No evidence found of MIR in the UK to estimate methane, but European examples were found. The data could become available through existing milk recording schemes, so it could be introduced by innovators by 2030. If the need for verifying results via detection methods is removed, this could be mainstream by 2045. |
|
Portable accumulation chambers (PAC) |
A portable respiration chamber which takes measurements over a short period of time (e.g. 1 hour) (Cummins et al., 2022). |
All |
Methane and CO2 concentrations |
Quick measurement period reduces animal stress (Cummins et al., 2022). Transportable (NZHerald, 2023). |
Feeding and management protocols must be followed prior to measurements (Duthie et al., 2024). Not suitable for long-term measurements (Cummins et al., 2022). |
2030: E 2045: I |
2030: E 2045: I |
2030: E 2045: I |
A promising option for Scotland as it is transportable between farms. SRUC recently acquired a PAC for sheep. However, current research needs to be completed before they can be used widely (Duthie et al., 2024). |
|
Handheld lasers |
A handheld device originally developed to detect gas leaks can measure concentrations of methane in livestock breath (Sorg, 2021). |
All |
Methane concentration |
Non-invasive and portable. Can take measurements from grazing livestock. Can take measurements from several animals in one day. Results can be sent to a smart phone (Sorg, 2021). |
Has a lower accuracy, measurements are highly affected by environmental conditions (de Haas et al., 2021; Sorg, 2021). |
2030: E 2045: I |
2030: E 2045: I |
2030: E 2045: I |
No evidence found for use in UK research. However, the benefit of taking measurements from several animals in the same day may make it an attractive option for Scotland. Its widespread use may depend on supporting infrastructure such as reporting systems. |
Table 2. Examples of data management tools involved in the process of breeding livestock for reduced methane emissions. Please see Appendix A, section 9.1 for the full list of the technologies found in our review.
|
Description |
Sector |
Data collected |
Benefits |
Risks |
Timeline of availability in Scotland: Experimental (E), Innovators (I), Mainstream (M), Future possibility (FP), Not applicable (NA) |
Practical considerations in Scotland | |||
|---|---|---|---|---|---|---|---|---|---|
|
Beef |
Dairy |
Sheep | |||||||
|
A free tool for New Zealand farmers to use to choose rams for breeding. They can choose the terminal or maternal traits that fit their breeding goals. When choosing maternal traits, methane production is an option. |
Sheep |
Reproduction, lamb growth, size, meat, wool, health indices, methane production. |
User friendly. Farmers can choose rams based on location, breed and exclude certain flocks from results. |
NA |
NA |
2030: FP 2045: I |
Success requires genetic evaluation and measuring methane (via PAC) to be common practice. Existing tools such as ScotEID (records births, deaths, and movements), and RamCompare (presents performance recorded ram data), could be repackaged to incorporate methane production. | ||
|
National breeding programme |
A programme which plans and identifies breeding objectives, traits and information on selection criteria |
All |
Methane emissions |
UK wide |
To be successful at a national scale, significant data, cooperation and initial funding is required. |
2030: M 2045: M |
2030: M 2045: M |
2030: M 2045: M |
In 2023, The National Sheep Association began a 3-year initiative to measure methane from 13,500 sheep to incorporate production traits into breeding programmes. With progress like this, it is possible that national breeding programmes will be mainstream by 2030. |
|
Multi-country database |
An international database that contains data from many livestock (Manzanilla-Pech et al., 2021). |
All |
performance/ production (trait-related) records |
A larger dataset improves robustness (Manzanilla-Pech et al., 2021). |
Combining data from different countries can be challenging due to differences in reporting, recording, technology, favoured breeds and management style (Van Staaveren e al., 2023). Sharing genetic information between countries requires compliance with the Nagoya Protocol. |
2030: FP 2045: FP |
2030: E 2045: I |
2030: FP 2045: FP |
Due to data sharing challenges, it is unlikely this will be available by 2045 in this context. There may be progress in the dairy sector due to the use of methane indexes, e.g. in Canada and the international scope of many dairy processors. |
|
Bull catalogues (e.g. Genus Bull search) |
This index allows farmers to see the scores of certain traits in bulls. |
Dairy, beef |
One of these traits is called Feed Advantage which can identify bulls with the greatest feed conversion (ABS, 2023). |
Farmers can choose bulls with the desired characteristics to use in breeding. |
2030: M 2024: M |
2030: M 2024: M |
NA |
These are already available for farmers to use, so we would estimate them to be mainstream by 2030. | |
Reproductive technologies
Reproductive technologies are directly used for breeding. With many already in use on Scottish dairy farms, we estimate that it is likely most will be mainstream in the cattle sectors by 2045. We estimate lower progress in the sheep sector reflecting the current low uptake. Stakeholders discussed the reasons for low uptake in the sheep sector are due to the extensive nature of sheep farming in Scotland and less infrastructure for sheep in this area, such as semen collection and storage, the availability of which determines uptake. In addition to this, artificial insemination (AI) in sheep requires a vet to perform a surgical procedure (in cattle it can be done by a qualified farmer), adding a practical and financial hurdle.
Table 3. Examples of reproductive technologies involved in the process of breeding livestock for reduced methane emissions. Please see Appendix A, section 9.1 for the full list of the technologies found in our review.
|
Description |
Sector |
Benefits |
Risks |
Timeline of availability in Scotland: Experimental (E), Innovators (I), Mainstream (M),Future possibility (FP), Not applicable (NA) |
Practical considerations in Scotland | |||
|---|---|---|---|---|---|---|---|---|
|
Beef |
Dairy |
Sheep | ||||||
|
Artificial insemination (AI) |
A technique to inseminate females, using fresh or frozen semen. |
All |
High success rate for cattle. No requirement for a bull to be on the farm. Better guarantee of uniform calving. |
AI in sheep is often done by laparoscopic artificial insemination which is a surgical procedure done by a vet. Due to the scale and extensive nature of sheep farming, this brings practical challenges. Relies on sufficient infrastructure to collect and store semen (Stakeholder comment, 2023). |
2030: M 2045: M |
2030: M 2045: M |
2030: I 2045: I |
AI is common practice in the dairy sector, with some use in the beef sector. It’s likely this will be mainstream by 2030 for cattle. Due to the practical challenges in sheep, it may still only apply to innovators. |
|
Sexed semen |
A method which allows control over the sex of the offspring by separating sperm cells based on their X or Y chromosome content. By focusing on females for example, there is the potential to reduce methane emissions by reducing the number of unwanted males (Duthie et al., 2024). |
All |
Increasing selection of females in the dairy sector improves productivity. |
Success relies on the uptake of AI. |
2030: M 2045: M |
2030: M 2045: M |
2030: I 2045: I |
This is widely done in the dairy sector. Use in the beef sector is currently lower, however by 2030 there is the potential for this to be mainstream. Progress is determined by the uptake of AI in the sector. Due to the practical challenges associated with AI, it will likely remain an innovative practice in the sheep sector. |
|
Conventional breeding |
The use of bull/ram to cow/ewe breeding. Selecting cows or ewes producing offspring with desirable characteristics to remain in the breeding herd. |
All |
Minimal technical input. Familiar practice for farmers. |
Little control over selecting desirable traits. Time intensive as it requires offspring maturity before seeing if they have the desired traits. |
2030: M 2045: M |
2030: M 2045: M |
2030: M 2045: M |
Already common practice for general breeding, so breeding for methane reduction could be mainstream by 2030. |
Animal Genomics
Genomics is the study of the genome, a complete set of an organism’s DNA[2]. Genomics provides the opportunity to better understand how well an animal will perform based on its DNA profile. DNA and management both determine performance qualities, such as milk yield. Precision breeding (which is not genetic modification) amends sections of DNA by adding or moving genetic material. This has been used in the cropping sector to improve yields and/or disease resistance. In the livestock sector, research focusses on increased resilience to bovine tuberculosis and mastitis. In 2023, England introduced The Precision Breeding Act, outlining classifications for using precision breeding on crops and livestock, including how the products from them should be regulated, “Neither the Scottish nor Welsh Parliaments have granted legislative consent to the Bill.”.
Table 4. Examples of animal genomic technologies involved in the process of breeding livestock for reduced methane emissions. Please see Appendix A, section 9.1 for the full list of the technologies found in our review.
|
Description |
Sector |
Data collected |
Benefits |
Risks |
Timeline of availability in Scotland: Experimental (E), Innovators (I), Mainstream (M), Future possibility (FP), Not applicable (NA) |
Practical considerations in Scotland | |||
|---|---|---|---|---|---|---|---|---|---|
|
Beef |
Dairy |
Sheep | |||||||
|
Microbiome-driven breeding |
Emphasis is on selecting livestock with a rumen microbiome composition which is more efficient at fermenting feed so producing less methane. |
All |
Rumen fluid samples – sequencing of microbial DNA. |
Potential method for improving animal health and reducing environmental impact. |
This is a relatively new field and much is unknown about how the gut microbiome develops and is maintained over time. It is unclear how much influence the animal may have over those processes. |
2030: E 2045: E |
2030: E 2045: E |
2030: E 2045: E |
Good early signs but still at research stage. |
|
Genomic breeding values (GEBVs) |
Values that are based on information from livestock DNA and measured performance. Can be used with EBVs to improve accuracy of breeding programmes. (Meat Promotion Wales. 2013). |
All |
DNA and performance records. |
Can be used to identify traits that are difficult to record. Beneficial for traits measured in only one sex. Useful for accurately measuring traits that occur later in life (Scholtens et al., 2020). |
Accuracy of the estimate is dependent on the number of animals included in the reference population (Scholtens et al., 2020). |
2030: I 2045: M |
2030: M 2045: M |
2030: I 2045: M |
GEBVs are currently available for a number of carcass traits in Limousin cattle in the UK (Business Wales, 2016) and offered by the genetic company Genus. |
|
Estimated Breeding values (EBVs) |
Calculated from the performance data of recorded animals. Environmental factors (e.g. feeding) are filtered out to provide a genetic value for each trait (Stout, D. 2021). |
All |
Performance records – parentage and traits of interest (e.g. weight traits). |
Provides a more objective (data driven approach) towards selection. Genetic selection based on EBVs leads to faster rates of genetic gain and flock improvement (compared to selection based on raw data or basic observation). |
Allows comparisons within breeds, not between breeds. |
2030: M 2045: M |
2030: M 2045: M |
2030: M 2045: M |
Use as a tool to aid in the selection of healthy and structurally sound animals. |
Traits
Traits are specific characteristics of an individual (physical or behavioural) that are influenced by genes and environmental factors. Understanding the traits that lead to lower methane emissions is key to a successful breeding programme for methane emissions reduction.
It should be noted that the breeding focus, and therefore traits selected, depends on the farmer’s goals. For example, breeding for breeding stock would focus on selecting offspring traits, such as calving or lambing ease, while farms producing fat or store stock would focus on product traits, such as increased liveweight gain (Stakeholder comment, 2023). Currently, most traits are associated with productivity, such as increasing milk yield in the dairy sector. Progress in the beef and sheep sectors has been much slower, with fewer examples found of genetics used in breeding programmes.
The traits in Table 5 are used for breeding in global research to reduce methane emissions directly and indirectly. We have categorised these traits into the following groups:
Production – offspring: Traits associated with reproduction.
Production – product: Traits associated with products from the animal.
Functional: Traits that underpin the function of the animal and are not specific to production or emissions improvements.
Climate: Traits directly linked to reducing methane emissions.
Stakeholders and the literature emphasised that selection for methane reduction traits should ensure production traits, such as health, are not compromised (Stakeholder comment, 2023; Llonch et al., 2017). To look into this further, we examined performance and methane efficiency data from SEMEX. For their Holstein bulls with above average methane efficiency scores, we could not identify any clear relationship between this trait and the other traits. However, this is only for one breed of cattle from one company.
- Case study: New Zealand
- Research in New Zealand genotyped low emitting sheep which identified traits that lead to reduced methane emission. The research found no negative impacts on physiology, productivity and health when selecting for reduced emissions.
Our research highlighted the importance of selecting for feed efficiency. Despite this trait having a lower methane reduction potential than others, it will benefit farmers through more efficient use of feed through better feed conversion (Stakeholder comment, 2023).
Table 6 presents the traits that were selected for further analysis, including quantification and the technologies used to detect or select them. Only a few of the traits found in our review were taken forward because some of the traits did not have robust emission reduction values, so were therefore excluded from our calculations.
Table 5. Traits included in breeding indexes around the world, split by sector and type.
|
Production – offspring |
|
|
|
|
|
|
|
|
|
|
|
|
| |||||||||||||
|
Calving ease |
Carcass conformation |
Carcass weight (kg) |
Cow calving interval |
Fertility |
Longevity (years)[3] |
Maternal weaning weight |
Offspring carcass conformation |
Offspring carcass fat |
Offspring carcass weight |
Offspring feed intake |
Offspring survival |
Energy corrected milk |
Lambing percentage[4] |
Maternal instinct | ||||||||||||
|
Beef |
x |
x |
x |
x |
x |
x |
x |
x |
x |
x |
x |
x | ||||||||||||||
|
Dairy |
x |
x |
x |
x |
x |
x |
x |
x |
x |
x |
x |
x |
x | |||||||||||||
|
Sheep |
x |
x |
x |
x | ||||||||||||||||||||||
|
Production – product |
|
|
|
|
|
|
|
|
| |||||||||||||||||
|
Mature weight |
Feed efficiency[5] |
Growth rate[6] |
Heifer live weight |
Body condition score |
Heat tolerance |
Milk fat + protein |
Milk yield |
Production efficiency[7] |
Residual feed intake |
Fleece weight | ||||||||||||||||
|
Beef |
x |
x |
x |
x | ||||||||||||||||||||||
|
Dairy |
x |
x |
x |
x |
x |
x |
x | |||||||||||||||||||
|
Sheep |
x |
x |
x |
x |
x | |||||||||||||||||||||
|
Functional | ||||||||||||||||||||||||||
|
|
Cow health |
Disease resistance |
Microbiome | |||||||||||||||||||||||
|
Beef |
x |
x |
x | |||||||||||||||||||||||
|
Dairy |
x |
x |
x | |||||||||||||||||||||||
|
Sheep |
|
|
| |||||||||||||||||||||||
|
Climate |
|
| ||||||||||||||||||||||||
|
Methane efficiency2,[8] |
Methane intensity[9] |
Methane production | ||||||||||||||||||||||||
|
Beef |
|
|
| |||||||||||||||||||||||
|
Dairy |
x |
x |
x | |||||||||||||||||||||||
|
Sheep |
x |
x | ||||||||||||||||||||||||
Table 6. The quantifiable traits in each sector, with the technologies which can be used to detect or select them.
|
Technologies used to detect or select traits
|
Quantifiable traits in each sector | |||||||||
|
Beef |
Dairy |
Sheep | ||||||||
|
Feed efficiency |
Offspring carcass weight |
Methane production |
Feed efficiency |
Milk fat and protein |
Milk yield |
Methane intensity |
Feed efficiency |
Methane yield | ||
|
Detection methods |
Respiration chambers |
X |
X |
X | ||||||
|
Sniffers |
X |
X |
X | |||||||
|
SF6 tracer gas |
X |
X |
X | |||||||
|
Automated head chamber system |
X |
X |
X | |||||||
|
Mid-Infrared (MIR) data (proxy) |
X |
X |
X |
X | ||||||
|
PAC |
X |
X |
X | |||||||
|
Handheld lasers |
X |
X |
X | |||||||
|
Rumen microbial composition |
X |
X |
X | |||||||
|
Feed efficiency index |
X |
X |
X | |||||||
|
Data management |
Selection index theory |
X |
X |
X |
X |
X |
X |
X |
X |
X |
|
National breeding programmes |
X |
X |
X |
X |
X |
X |
X |
X |
X | |
|
Multi-country database |
X |
X |
X |
X |
X |
X |
X |
X |
X | |
|
Efficient Dairy Genome Project |
X |
X |
X |
X | ||||||
|
Ram Compare |
X |
X | ||||||||
|
Bull catalogues |
X |
X |
X |
X |
X |
X |
X | |||
|
Reproductive technologies |
Artificial Insemination (AI) |
X |
X |
X |
X |
X |
X |
X | ||
|
Conventional breeding |
X |
X |
X | |||||||
|
Animal genomics |
Microbiome-driven breeding |
X |
X |
X |
X |
X |
X | |||
|
Genomic breeding values (GEBVs) |
X |
X |
X |
X |
X |
X |
X |
X |
X | |
|
Estimated Breeding values (EBVs) |
X |
X |
X |
X |
X |
X |
X |
X |
X | |
|
Genotyping |
X |
X |
X |
X |
X |
X |
X |
X |
X | |
|
Genetic markers |
X |
X |
X |
X |
X |
X |
X |
X |
X | |
Quantifying the potential emission savings
We calculated the potential methane emission reductions under different traits for dairy, beef and sheep. Further information can be found in Appendix E.
The traits identified in our review (see Section 4.2) were further evaluated to assess their applicability to emission reduction calculations, based on requirements for defined quantification of methane emission values (either absolute or relative) and values to have a comparative emission baseline. A summary of the applicable traits used in the quantification calculations are presented in Table 7 below, with further information presented in Appendix E, Section 10.6.4.
Table 7. Traits used in the calculations of emissions savings
|
Sector |
Trait Category |
Trait Name |
Unit of baseline |
Value of methane reduction from baseline |
|
Beef |
Production |
Feed efficiency |
kg CO2e/kg product |
7% |
|
Offspring carcass weight |
kgCO2e/per kg meat per breeding cow per year |
1.3% | ||
|
Climate |
Methane yield |
gCH4/kgDMI per generation |
12% | |
|
Dairy |
Production |
Feed efficiency |
kg CO2e/kg product |
5% |
|
Milk fat + protein |
MJ CH4/kg milk |
12% | ||
|
Milk yield |
kg CH4/kg milk |
15% | ||
|
Climate |
Methane intensity |
kg CH4/kg milk |
24% | |
|
Sheep |
Production |
Feed efficiency |
kg CO2e/kg product |
7% |
|
Climate |
Methane yield |
g CH4/kg DMI |
35% |
The current uptake of genetic traits focused on methane emissions is estimated based on our review and discussions with Scottish Government. This was based on an understanding on the currently uptake of AI and breeding technologies used within the sector from expert knowledge and limited research able to be found online. This rate provides a baseline for the quantification of additional uptake in 2030 and 2045 under four scenarios (further described in Appendix E, Section 10.6.4). The scenarios include: no additional intervention, voluntary uptake, supplier demand and policy changes. Scenario uptake percentages are presented with the current baselines in Table 8 below. These values were developed based on technical expertise and discussion with both stakeholders and Scottish Government, as well as published research. The impact of other traits (such as functional, health related traits) could not be estimated in this work as relevant values for methane reduction potential could not be identified in the literature. Further information in the calculation methodology, including additional detail on the selected scenarios, traits selected and limitations to the data is presented in Appendix E, Section 10.6.
Table 8. Scenario implementation values for dairy, beef and sheep
|
Type |
Scenario |
Current baseline |
2030 uptake |
2045 uptake |
|---|---|---|---|---|
|
Dairy |
1. No intervention |
75% |
80% |
80% |
|
2. Voluntary uptake |
75% |
80% |
85% | |
|
3. Supplier demand |
75% |
82.5% |
92.5% | |
|
4. Policy changes |
75% |
85% |
100% | |
|
Beef |
1. No intervention |
40% |
45% |
45% |
|
2. Voluntary uptake |
40% |
45% |
50% | |
|
3. Supplier demand |
40% |
47.5% |
65% | |
|
4. Policy changes |
40% |
50% |
80% | |
|
Sheep |
1. No intervention |
10% |
15% |
15% |
|
2. Voluntary uptake |
10% |
15% |
20% | |
|
3. Supplier demand |
10% |
17.5% |
40% | |
|
4. Policy changes |
10% |
20% |
60% |
Baseline enteric fermentation methane emissions for beef, dairy cattle and sheep in Scotland in 2021 (totalling 4,020 kt CO2e ), show beef cattle emitted the most at 59% (2,370 kt CO2e ), sheep emitted 26% (1,061 kt CO2e ), and dairy cattle 15% of (590 kt CO2e).
Our calculations found that methane focused traits (methane production/intensity/yield) presented the highest emission reductions for all livestock categories. As the impact of the interaction between traits are unknown, reductions from traits focused on feed efficiency, offspring carcass weight (beef specific) and milk yield, milk fat and protein (dairy specific) are not presented in the maximum reduction potential. However, we acknowledge that reductions for these traits were found within the three livestock categories. Results are presented in Figure 1, Figure 2 and Figure 3 below. These figures show that in each sector, up to 2030, the reductions are relatively steady, but there is a greater reduction at 2045, influenced by the proposed increase in uptake. Due to the proposed uptake percentages the policy change scenario presents the greatest reduction under all traits, with the no intervention scenario showing the smallest reduction due to a 5% increase in uptake in 2030 and no further uptake in 2045.
In the policy change scenario, choosing climate traits, we estimate that emissions would reduce in 2045 up to 382.2 kt CO2e or 9.5% of enteric methane emissions. This includes a 6.8% reduction from beef cattle (161.1 kt CO2e), 6% in dairy cattle (35.4 kt CO2e) and 17.5% in sheep (185.6 kt CO2e). Smaller reductions are feasible from traits focused on feed efficiency, offspring carcass weight (beef specific) and milk yield, milk fat and protein (dairy specific). Further details presented in Appendix E.
Figure 1. Methane emissions for beef cattle traits against the 2021 baseline enteric methane emissions of beef cattle in Scotland. Please note the y-axes do not start at zero to allow for greater visibility of results.

Figure 2. Methane emissions for dairy traits against the 2021 baseline enteric emissions of dairy cattle in Scotland. Please note the y-axes do not start at zero to allow for greater visibility of results.

Figure 3. Methane emissions for sheep traits against the 2021 baseline enteric emissions of sheep in Scotland. Please note the y-axes do not start at zero to allow for greater visibility of results.

Identifying policy drivers and behaviour change needs
This section examines actions to encourage behaviour change. We understand that behaviour change is needed by four stakeholder groups:
- Government, which would be policy drivers
- Post-farm gate market, such as supermarkets, wholesalers, caterers, hospitality etc
- Pre-farm gate, such as livestock markets, breed societies
- Farmers
We explored how actions taken by each stakeholder group can enable further behaviour change in the other groups, and present three national level case studies to show actions that promote breeding practices to reduce methane emissions. Examples from these case studies are dispersed through the report in text boxes where the surrounding information was relevant. The countries are as follows:
- Ireland, which has incentivised and subsidised breeding practices.
- Canada, which has incentivised and subsidised breeding practices.
- New Zealand, which has started to take a regulatory approach and has incentivised breeding practices.
All three countries have strong research programmes supporting their policies.
Government action
Scottish Government have an important role in supporting uptake of new breeding techniques through policy. Below are policy drivers that can influence behaviour changes across the other stakeholder groups (post-farm gate market, pre-farm gate actors and farmers).
Legislation and targets
- Setting a legal target for methane reduction in Scotland can help to shift the focus of the agricultural industry to methane emissions and align with climate commitments that have been made, such as the Global Methane Pledge at COP26. Other countries have set separate targets for biogenic methane, nitrous oxide, and carbon dioxide, such as New Zealand.
- Case study: New Zealand
- New Zealand aims to achieve net-zero emissions by 2050 and has a target to reduce biogenic methane by 10% relative to 2017 levels by 2030 and 24 – 47% by 2050. This ‘split-gas’ approach helped focus policy development and action, informed by strong research programmes and stakeholder dialogue. A split-gas approach can also give farmers flexibility to determine the most efficient, cost-effective mitigation practices for their farms (Stakeholder comment, 2023).
- A methane target for Scotland could encourage constructive conversations among stakeholders about how to reduce emissions, leading to a higher uptake of relevant practices.
Financial incentives
The concept of breeding livestock for reduced methane emissions may be new for many farmers in Scotland. Methane emissions from ruminant livestock are viewed by many as a natural part of livestock farming, particularly in upland farming systems (Bruce, 2013). Therefore, the economic benefits of breeding for reduced methane emissions will need to be clearly demonstrated to farmers.
Cost was mentioned by some stakeholders as a barrier to selecting livestock based on lower emissions. However, there was little understanding of what the specific costs are. Given this, the perceived cost of adopting new breeding techniques might become just as significant as the barrier of cost itself. However, measuring methane from individual animals in a herd using the technologies in Table 1 is labour intensive and not widely available, which creates financial and labour bottlenecks (CIEL, 2023).
6.1.2.1 Subsidies
Some stakeholders believe that new policies could drive financial incentives (Stakeholder comment, 2023). For example, payments for using the technologies presented in section 4.1.
- Case study: Ireland
- In Ireland, the Beef Data and Genomics Programme (BDGP) provided payments to suckler beef farmers to improve the genetic merit and GHG emissions of their herd through data collection and genotyping. It was succeeded by the Suckler Carbon Efficiency Programme.
6.1.2.2. Specific funds incentivising measuring emissions
New Zealand supported a programme via funding to enable every stud ram breeder to use PAC chambers to measure emissions. This service was oversubscribed in 2023, indicating that the adoption of measurement techniques could be encouraged by government funding.
- Case study: New Zealand
The Cool Sheep™ Programme, launched in 2022, is a three-year programme aiming to offer genetic selection to every sheep farmer in New Zealand to reduce GHG emissions. It gathers phenotype data to provide a methane breeding value which will be available on NProve. Breeders wanting to produce low-methane rams can measure a proportion of their flock using a PAC.
6.1.2.3. Research
All three case study countries have strong Government funded research programmes. The outputs from these informs the policies and actions designed to reduce emissions. Scotland is at the forefront of research on breeding livestock for reduced methane, so this just emphasises the importance of focussing research in this area.
- Case study: Canada
- Canada’s Agricultural Methane Reduction Challenge will award up to $12 million CD$ to innovators designing practices, processes, and technologies to reduce enteric methane emissions.
Education and advice
Effective communication around breeding for reduced methane and the climate benefits for reducing methane are essential to support uptake. Farmers are crucial stakeholders and while some may be confident in trialling new approaches, advice must be available to help all understand why and how to implement innovative techniques on their farm, manage their farm in a new system and where to ask for help (Stakeholder comment, 2023). Training could also be provided by the private sector.
- Case study: New Zealand
- The Pastoral Greenhouse Gas Research Consortium (PGgRc) published a series of factsheets to increase understanding of methane research.
Peer to peer learning is very successful as it provides an informal opportunity to ask practical questions of farmers who have already tried and hopefully succeeded.
- Example: Northern Ireland farmers visit Scotland
As part of the Farm Innovation Visits, a group of dairy farmers from Northern Ireland visited farms in Scotland to see breeding technologies in practice, such as genetic reports and use of sexed semen.
Farm advisers would be essential to ensure consistent and clear messaging to farmers. Training and communication material could be provided for advisers through existing Government schemes such as the Scottish Farm Advisory Service.
Consumers should be made aware of the importance of reducing methane emissions and of the industry’s associated actions .
Behaviour change
Table 10 shows the outcome of our review on possible Government actions that could lead to behaviour change among farmers, the post-farm gate market and pre-farm gate actors. The three key actions we identified are 1) legislative targets for methane reductions, 2) financial incentives and 3) education and advice programmes.
Table 107: Behaviour changes caused by actions taken by Government
|
Government actions |
Behaviour changes due to Government actions | ||
|
Farmers |
Pre-farm gate actors |
Post-farm gate market | |
|
Legislative targets for methane emissions reductions |
Provides a legislative backstop that must be met. Increased awareness of emissions helps farmers to visualise their emissions and select practices for adoption. |
Provides a legislative backstop that must be met. Livestock markets and breed societies prompted to support farmers by providing information on emissions from animals. |
Provides a legislative backstop, therefore retailers may encourage suppliers to take on low-emission breeding practices. |
|
Financial incentives |
Farmers are more likely to invest time and money in adopting breeding practices if they receive payments for their efforts or if (real and perceived) financial barriers are reduced. |
Stronger demand from farmers to understand emissions from livestock will drive breed societies and markets to provide information about emissions. If breed societies provide advice on reducing emissions from a herd, they could gain a competitive and possibly over time cultural advantage. |
Reduced emission livestock products could be marketed for a higher price, aimed at more environmentally conscious consumers. Risk: if government subsidies were already supporting farmers adopting emission reduction practices, retailers may be less incentivised to pay a premium price. |
|
Education and advice programmes |
Increased awareness and clarity on breeding practices to reduce emissions may encourage increased uptake. |
Advisers will be able to influence farmers. |
Increased awareness of low emissions products may influence consumers to buy food produced using low emission breeding strategies. Risk: consumers will ask for one thing but often pay for something different |
Post-farm gate market
The post-farm gate market includes supermarkets, farm shops, other retailers, consumers and food chain assurance schemes. It has an important role in supporting uptake of new breeding techniques through demonstrating demand and providing price signals. Using our review, we explored actions where the market can influence behaviour change across the other stakeholder groups.
Price signals
Stakeholders discussed the important role of supermarkets, retailers, hospitality businesses, and their suppliers and consumers as these groups can set standards for better prices or to meet customer/societal demands. For example, Tesco aims to be net zero from farm to fork by 2050 , Waitrose has committed to source only from net zero carbon farms in the UK by 2035, and Morrisons aim to be supplied by ‘Net Zero’ carbon British farms as a whole by 2030. Others along the supply chain may need to start to provide evidence of emission reductions as these different retailers and suppliers reduce their Scope 3 emissions, for example as outlined in the British Retail Consortium’s Net Zero Roadmap for the Retail Industry.
Validation of the claims through assurance schemes are important to ensure trust in the food chain. A stakeholder said, “if you take an animal to a ‘normal’ livestock market and claim it has reduced methane emissions, you’ll probably get the same price as any other animal regardless of the additional effort”.
Consumer demand
Consumers paying a premium price are likely to drive new practice adoption. Transparent communication about low emission breeding practices, supply chains and actions on farm is important to demonstrate to consumers the benefits of their choices and reduce the risk of ‘greenwashing’.
- International example: Sweden
- In 2022, methane-reduced beef was sold in Sweden. It was well received by consumers, selling out in less than a week. There was however backlash in the media with claims of greenwashing. This example emphasises consumers’ interests in climate-friendly options. while ensuring transparency.
Behaviour change
How the market influences other stakeholders is explored in more detail in Table 10. The key actions are 1) improved price signals from retailers and 2) increased consumer demand which is realised at the sales point.
Table 11: Behaviour changes caused by post-farm gate market actions
|
Post-farm gate actions |
Behaviour changes as a result of post-farm gate actions | |||
|
Government |
Farmers |
Pre-farm gate industry |
Post-farm gate market retailers | |
|
Price signals from retailers |
Similar to government financial incentives, farmers are more likely to invest time and money in adopting breeding practices if they receive payments for their efforts. Risk: uptake by farmers could be inconsistent depending on which retailers adopt this action first. |
Livestock markets or breed societies could display methane scores if they know this is something that farmers are looking for. |
Retailers offering a premium for low-emitting products will encourage uptake of practices. Marketing low-emitting products will raise awareness among consumers, possibly increasing demand for low-emission products. Post farm gate actors own emission reduction targets to meet societal demand for low emission products will require farms to reduce emissions | |
|
Increased consumer demand for low emissions livestock products |
Government may be encouraged to support low methane emissions breeding practices due to a higher demand. Procurement guidelines for catering in Government funded facilities could include low methane emitting meat. |
Increased demand for low emissions products may prompt adoption of practices. |
Due to farming in Scotland not being solely driven by the market, consumer demand alone may not influence the pre-farm gate industry. Yet it may lead to actions that prompt further actions related to emission savings. |
Increased demand for low-emission products will incentivise retailers and hospitality to provide these, possibly paying a premium to farmers. |
Pre-farm gate actors
Pre-farm gate actors refers to industry representatives, levy groups, research institutions, breed societies, and livestock markets. They have an important role in supporting uptake of new techniques through increasing understanding and supporting data collection. Below are actions that can influence behaviour change.
Improving data and data sharing
A key infrastructure need is an accessible database of genetic information, including methane emissions, to enable benchmarking (Stakeholder comment, 2023). Stakeholders noted that farmers may struggle to envision new practices on their farms, and a database can help to conceptualise the traits.
Case study: New Zealand
The ram selection tool nProve provides a user-friendly platform to select required traits in a ram, including methane production.
Existing platforms already used by farmers, such as ScotEID, the Beef Efficiency Scheme (BES), and SRUC’s genetic tool EGENES could add new elements around methane (Stakeholder comment, 2023). For example, Nprove allows farmers to assess methane elements in a user-friendly way.
The Beef Efficiency Scheme (BES) required farmers and land managers to submit tissue samples and other metrics of their beef herd to develop an understanding of the genes within the herd to improve efficiency. Uptake from the industry was low, with only 30% of the national breeding herd participating in the scheme. It currently remains unclear in the literature if the captured data has been incorporated into any local breeding schemes or progressed following the end of the scheme. This scheme could provide valuable learning on the integration of positive genetic traits across the herd in Scotland.
In our review, a stakeholder commented that as only a handful of breeds make up most of the livestock sector in Scotland, the establishment of a database would not take long to create (Stakeholder comment, 2023). This comment however shows the lack of understanding that the genetic material for breeding for methane is independent of breed and based on individual animals.
Case study: Ireland
The Irish Cattle Breeding Federation (ICBF) launched the National Genotyping Programme (NGP) in 2023 to achieve a fully genotyped cattle herd in Ireland. The programme offers beef and dairy farmers a low-cost option to collect DNA samples from calves at birth. The collected information is used to identify specific traits which contribute to national genetic indexes, including methane traits. It also allows farmers to optimise the health and productivity of their herd, while reducing the emissions intensity. The ICBF further publish methane evaluations for AI sires when methane data has been recorded.
Ireland’s NGP and New Zealand’s N Prove provide examples of the development of national databases. In Ireland, the use of metrics like Residual Methane Emissions (RME) index and predicted transmitting ability (PTA) aim to provide an easy way of comparing livestock to the average and to other farmers. Stakeholders noted that a challenge in the Scottish context could be a reluctance by stakeholders to pool data. However this has been successfully achieved in the Scottish pig industry with a number of health and productivity benefits to the individual farmers and to the sector. The NGP also allowed for subsidising DNA sampling of calves which helps to genotype the national herd
Stakeholders discussed the potential for livestock markets to display information on methane emissions. In many markets, a screen displays the weight of the animal and the name of the seller; it could be possible to add the expected or benchmarked methane emissions.
Case study: New Zealand
A methane breeding value was launched in 2019 by Beef and Lamb New Zealand, giving the sector a practical decision making tool. This led to the development of The Cool Sheep™ Programme (see section 6.1.2).
Metrics for methane emissions
Stakeholders recommend adding methane as an estimated breeding value (EBV) as this would allow farmers to benchmark. Stakeholders emphasised that metrics would only be used if they are adopted consistently across Scotland (and perhaps the UK) with cross sector collaboration and there was some incentive for farmers to reduce methane emissions from their livestock. Similarly, to the adoption of RME and PTA figures in Ireland, regulation and guidance from Scottish Government would be advisable to make sure the most sensible metric was adopted.
Case study: Ireland
Residual methane emissions (RME) index is a metric to understanding the difference between the expected methane emissions based on feed intake and the actual emissions. High RME is undesirable and low RME is desirable.
ICBF methane predicted transmitting ability (PTA) values have been produced by recording methane emissions from over 1,500 animals from 19 breeds. These are publicly available for AI beef and dairy bulls. Bulls are classed as favourable or unfavourable compared with the average sire.
Behaviour change
- The two key take-aways from our review are 1) improved data and data sharing amongst farmers, researchers and across stakeholders and 2) developing metrics for methane emissions to enable benchmarking between farmers and products. Table 12 describes how actions by pre-farm gate actors could support behaviour change among other stakeholders.
Table 12: Behaviour change due to actions taken by the pre-farm gate actors
|
Pre-farm gate action |
Behaviour change due to pre-farm gate action | |||
|
Government |
Farmers |
Pre-farm gate actors |
Post-farm gate market | |
|
Improved data and data sharing |
A database can inform policy. |
Enables farmers to understand the emission reduction potential of their animals. Displaying methane information at markets can help choose livestock based on emissions. |
More data would support more robust research, thereby increasing the output of Scotland-specific research. Markets around Scotland displaying methane data would raise awareness among farmers. |
Better data would enable retailers to communicate sustainability data to customers, increasing trust in the food system.
|
|
Metrics for methane emissions |
Scottish Government could ensure all relevant stakeholders are involved in developing a metric. |
Metrics would enable farmers to make comparisons against individual animals when deciding which ones to breed or purchase. |
Breed societies and livestock markets would be able to display methane emissions. Breed society representatives can discuss options for reducing emissions. |
Retailers have a consistent metric they can use to communicate the methane emissions of products to consumers. |
Farmers
Farmer behaviour change in this context relates to choosing animals with low methane traits to breed, and implementing systems on farm that support this. Some farmers could measure emissions from their livestock to verify the effectiveness of breeding for reduced emissions. Uptake of technologies outlined in section 4 provides the opportunity to better track genetics and traits in their herd.
Farmers will need support to make these changes and to enable behaviour change from the pre-market, post-market and government stakeholder groups identified in the sections above. In addition, the adoption of new practices will likely vary between dairy, beef and sheep producers, and the challenges they face will be different. Farmers who are already using reproductive technologies, such as sexed semen and AI, are expected to progress fastest in this area, given their familiarity with the processes. It is likely that the dairy sector will lead the way, and to a smaller extent, the beef sector. Rapid uptake of AI (and therefore sexed semen) in the sheep sector faces practical challenges, therefore it may be best to prioritise low-emitting traits in rams.
The financial benefit of farmers selecting methane traits is currently unclear. It is likely that the primary motivation will come from the supply chain; it will be important to have specific supply chain indicators. For example, if a milk buyer sets methane reduction goals, suppliers will need to respond. Behaviour change is also influenced by seeing neighbours or peers taking on new practices for example. Below are some points for each of the different livestock sectors groups that should be considered to enable the behaviour change actions identified in the previous sections.
Cummins et al (2022) advise that further research is needed on how breeding for low methane emissions affects the productive and profitable genes that make an animal appealing to farmers. However, research in New Zealand on genotyped low emitting sheep showed no negative impacts on physiology, productivity and health when selecting for reduced emissions and preliminary economic analysis shows that low-emitting sheep could lead to higher profits, primarily due to higher growth rates, a greater proportion of meat, and increased wool production. This section also briefly covers some actions that could be undertaken on farm to support farmers to shift to breeding lower methane emitting livestock.
Sheep farmers
Sheep farmers deal with a large number of animals which tend to be farmed extensively in Scotland, so using methane detecting technologies is potentially more difficult than for other livestock sectors. Despite this challenge, the shorter time to slaughter means that low-emitting traits can be introduced regularly and methane reductions can accumulate quickly (Stakeholder comment, 2023). In addition, other countries such as New Zealand have implemented programmes to begin to measure the national flock such as The Cool Sheep Programme (see section 6.1.2). Stakeholders discussed how the sheep sector produces a lower-value product compared to the cattle sector, so cash flow may be a prohibiting factor in taking on new practices.
Beef farmers
Stakeholders asserted that the beef sector is complicated by several commercial interests in the market which influence genetic improvement. Unlike the dairy sector, AI is not widely used in the beef sector (Stakeholder comment, 2023). However, there are opportunities to influence the genetics of the herd by encouraging bull breeders or bull stud farms to take on practices to support low-emitting traits.
As it is common for dairy cow offspring to enter the beef system, there is the opportunity to use lower emitting dairy animals to feed into emissions reductions in the beef sector (Stakeholder comment, 2023).
Dairy farmers
The dairy sector is the most advanced ruminant sector in using genetic technology and tools for selective breeding. For example, AI is fairly common practice, currently with the objective of increasing productivity rather than targeting emissions. Progress in the sheep and beef sectors is much slower due to challenges around practicalities, sufficient data and uptake of technologies in these sectors. The dairy industry also has a steadier cashflow than beef and sheep (Stakeholder comment, 2023), and is more progressive when it comes to real-time data collection and data management. This puts the dairy sector in a good position to advance breeding for reduced methane emissions.
Cross-farm actions to support breeding lower methane livestock
Strong and structured communication, sharing of ideas and engagement locally are important drivers to enable behaviour change in farming communities. Peer to peer support, for example through breeding groups, to share ideas, showcase technologies and discuss successful and disappointing technologies will enable neighbours and other local farmers to progress faster. Organising local workshops, either by Government supported advisers or leading farmers, would help to spread the word about the importance of breeding for reduced emissions and provide practical examples. The more discussion about the overall aim, the need to reduce emissions, the potential actions, outcomes and successes, the more likely that breeding for reduced methane emissions will become mainstream.
Gaps in the research
We identified the following gaps in research:
- Timeline of availability for the technologies. Due to a lack of robust information in many cases, we made an expert judgement on the availability of the technologies in Scotland up to 2030 and 2045.
- Quantified impact of introducing methane traits in case study countries. We did not find evidence for the actions and policies introduced in the case study countries reducing overall country emissions. A reason for this is that many of the examples presented in the case studies in the appendices are very recent, therefore there has not been enough time to quantify the emission savings. In addition, it could be challenging to see whether these actions had a specific impact emissions due to other surrounding factors, for example changes in stocking rate, or outbreak in disease.
- Evidence for current level of uptake in Scotland and the UK. The review did not find much evidence for current levels of uptake of breeding livestock for reduced emissions.
- Mitigation potentials of some traits. Many sources did not present methane emission values, but instead covered genetic correlations between traits. This meant that due to a lack of data many of the traits identified in the REA (see Table 5) were excluded from quantification. In other cases, some mitigation potentials were not comparative to the baseline used in our study because it presented changes from an entire lifecycle or system.
- The interaction between traits. Emission calculations were quantified for individual traits, rather than combining the mitigation potential for all traits because the relationship and interaction between traits is unknown.
- Due to the smaller quantity of literature available on methane efficiency focused traits, the reduction potential values may be less robust. Greater consistency in measurement, modelling, and presentation and their impacts on emissions savings and animal production would fill this knowledge gap.
Conclusions
We estimate that, by 2045, breeding for reduced methane emissions could achieve a reduction in enteric methane emissions of 9.5% from the baseline, including 6.8% reduction from beef, 6% from dairy and 17.5% from sheep assuming livestock numbers remain constant. This would be achieved by selecting breeding traits for methane efficiency (methane production, intensity and yield), feed efficiency, offspring carcass weight, milk yield and milk fat and protein. Selecting for these traits brings cumulative and permanent emission savings. A limited number of studies researched the impacts of selecting low-methane traits on productivity and health and found that these qualities were not compromised.
Scotland has a well-developed research base around breeding livestock for reduced methane emissions, placing it in good stead in developing further work and providing validation and trust. Research programmes in New Zealand, Canada and Ireland have successfully interacted with farmers, for example, by the development of user-friendly, accessible tools. Our stakeholder comments implies that a comparable interaction between research and on-farm activities and innovation is currently lacking in Scotland.
To achieve the emissions reductions, actions and behaviour change will be required by four stakeholder groups: Scottish Government, pre- and post-farm gate industry and markets, and farmers. Change will need to be co-created across the stakeholder groups.
The financial benefit of farmers selecting methane traits remains uncertain. Therefore, it is likely that the primary motivation will be the supply chain which will need supply chain indicators. For example, if a milk buyer sets methane reduction goals, suppliers will need to respond. Behaviour change is also influenced by neighbours or peers taking on new practices.
The key barriers to uptake are around knowledge and perceived cost. To alleviate these, Government funding could be targeted towards more data collection and research with farmer involvement to improves robustness. Investment in adviser training and farmer peer-to-peer will enable local farmers to progress faster. Organising local workshops, either by Government supported advisers or leading farmers, would help to spread the word about the importance of breeding for reduced emissions and provide practical examples. The more discussion about the overall aim, the actions, outcomes and successes, the more likely it is that breeding for reduced methane emissions will become mainstream.
The technologies we estimate could be mainstream by 2030 include a national breeding programme, sexed semen, artificial insemination (AI) and estimated breeding values (EBVs). However, their success will be about but the interactions between them. For example, data will inform EVBs, which in turn will inform a national breeding programme. If the constant use of methane detecting technologies is required, this may be difficult to implement in extensive farming systems. However, if a proxy measurement was used or the breeding stock was known to provide the necessary traits, this would allow existing systems to continue.
On this basis, we think there is a strong foundation for breeding for reduced emissions to become part of Scottish Government’s commitments.
References
ABS, 2023. Bull Search. Available from: https://absbullsearch.absglobal.com/
Agriculture and Agri-Food Canada, 2023. Agriculture and Agri-Food Canada launches new Agricultural Methane Reduction Challenge. Available from: https://www.canada.ca/en/agriculture-agri-food/news/2023/11/agriculture-and-agri-food-canada-launches-new-agricultural-methane-reduction-challenge.html
AHDB, 2022. RamCompare. Available from: https://ahdb.org.uk/ramcompare-phase-iii
Alford, A.R., Hegarty, R.S., Parnell, P.F., Cacho, O.J., Herd, R.M. and Griffith, G.R., 2006. The impact of breeding to reduce residual feed intake on enteric methane emissions from the Australian beef industry. Australian Journal of Experimental Agriculture, 46(7), pp.813-820.
B+LNZ Genetics, 2023. Sheep Methane Measurement. Available from: https://www.cognitoforms.com/BLNZGenetics/SheepMethaneMeasurement
B+LNZ Genetics, 2023. Stud flocks: Measuring Methane in your animals. Available from: https://www.blnzgenetics.com/cool-sheep-programme/opportunities-for-farmers-2
B+LNZ Genetics, 2023. Reducing methane emissions in New Zealand’s national sheep flock through genetic selection – The Cool Sheep™ Programme. Available from: https://www.blnzgenetics.com/cool-sheep-programme
Bell, M.J., Wall, E., Russell, G., Morgan, C. and Simm, G., 2010. Effect of breeding for milk yield, diet and management on enteric methane emissions from dairy cows. Animal Production Science, 50(8), pp.817-826.
British Retail Consutium, n.d. Climate Action Roadmap. Available from Climate Roadmap (brc.org.uk)
Bruce, A., 2013. The lore of low methane livestock: co-producing technology and animals for reduced climate change impact. Life Sciences, Society and Policy, 9(1), pp.1-21.
Business Wales, 2016. Genomic Breeding Values. Available from: https://businesswales.gov.wales/farmingconnect/news-and-events/technical-articles/genomic-breeding-values
CIEL, 2023. Net Zero & Livestock: Bridging the gap. Available from: https://cielivestock.co.uk/
Collins, A., Coughlin, D., Miller, J. and Kirk, S., 2015. The production of quick scoping reviews and rapid evidence assessments: A how to guide.
CRV, 2021. First ‘sniffer’ for extensive methane research installed. Available from: https://crv4all.com/en/news/first-sniffer-for-extensive-methane-research-installed
Cummins, S., Lanigan, G.J., Richards, K.G., Boland, T.M., Kirwan, S.F., Smith, P.E. and Waters, S.M., 2022. Solutions to enteric methane abatement in Ireland.
Department for Environment, Food & Rural Affairs, 2022. Approved breeding programmes: standards for breed societies and organisations. Available from: https://www.gov.uk/guidance/approved-breeding-programmes-standards-for-breed-societies-and-organisations
Department for Environment, Food & Rural Affairs, 2023. Dairy farmers visit farms in Scotland to see breeding technologies in practice. Available from: https://www.daera-ni.gov.uk/news/dairy-farmers-visit-farms-scotland-see-breeding-technologies-practice
Department of Agriculture, Food and the Marine, 2023. The CAP Strategic Plan 2023 -2027. Available from: https://www.gov.ie/en/publication/76026-common-agricultural-policy-cap-post-2020/#irelands-cap-strategic-plan-2023-2027
De Haas, Y., Veerkamp, R.F., De Jong, G. and Aldridge, M.N., 2021. Selective breeding as a mitigation tool for methane emissions from dairy cattle. Animal, 15, p.100294.
Dehareng, F., Delfosse, C., Froidmont, E., Soyeurt, H., Martin, C., Gengler, N., Vanlierde, A. and Dardenne, P., 2012. Potential use of milk mid-infrared spectra to predict individual methane emission of dairy cows. Animal, 6(10), pp.1694-1701.
Denninger, T.M., Schwarm, A., Dohme-Meier, F., Münger, A., Bapst, B., Wegmann, S., Grandl, F., Vanlierde, A., Sorg, D., Ortmann, S. and Clauss, M., 2020. Accuracy of methane emissions predicted from milk mid-infrared spectra and measured by laser methane detectors in Brown Swiss dairy cows. Journal of dairy science, 103(2), pp.2024-2039.
Duthie, C.A., Wall, E., Roehe, R., Miller, G., Lambe, N., Newbold, J., 2024. Routes to Reduce Methane Emissions from Livestock Systems. SRUC report. Available from: https://sefari.scot/document/routes-to-reduce-methane-emissions-from-livestock-systems
Esrafili Taze Kand Mohammaddiyeh, M., Rafat, S.A., Shodja, J., Javanmard, A. and Esfandyari, H., 2023. Selective genotyping to implement genomic selection in beef cattle breeding. Frontiers in Genetics, 14, p.1083106.
FAO, 2023. Animal genetics. Available from: https://www.fao.org/animal-genetics/en
Food Navigator Europe, 2022. ‘We plan to sharply increase production in 2023 – 24’: Methane-reduced beef trial in Sweden ‘sold out in less than a week’. Available from: https://www.foodnavigator.com/Article/2022/07/11/methane-reduced-beef-trial-in-sweden-sold-out-in-less-than-a-week
Global Methane Pledge, 2023. About the Global Methane Pledge. Available from: https://www.globalmethanepledge.org/
González-Recio, O., López-Paredes, J., Ouatahar, L., Charfeddine, N., Ugarte, E., Alenda, R. and Jiménez-Montero, J.A., 2020. Mitigation of greenhouse gases in dairy cattle via genetic selection: 2. Incorporating methane emissions into the breeding goal. Journal of Dairy Science, 103(8), pp.7210-7221.
Hayes, B.J., Lewin, H.A. and Goddard, M.E., 2013. The future of livestock breeding: genomic selection for efficiency, reduced emissions intensity, and adaptation. Trends in genetics, 29(4), pp.206-214.
Hybu Cig Cymru – Meat Promotion Wales, 2013. Genetic markers in beef and sheep breeding programmes. Available from: https://meatpromotion.wales/en
ICFB, 2023. Genomics. Available from: https://www.icbf.com/what-is-genomics/
ICFB,2023. National Genotyping Programme. Available from: https://www.icbf.com/national-genotyping-programme/
IFA, 2023. Beef Data & Genomics Programme (BDGP). Available from: https://www.ifa.ie/beef-data-genomics-programme-bdgp/
Innovis, 2023. Defra announces £2.9m funding to breed low methane sheep. Available from: https://www.innovis.org.uk/defra-announces-2-9m-funding-to-breed-low-methane-sheep/
IPCC, 2021. The Physical Science Basis In: Climate Change 2021: Assessment Report of the Intergovernmental Panel on Climate Change. Available from: https://www.ipcc.ch/site/assets/uploads/2018/02/WG1AR5_Chapter08_FINAL.pdf
IPCC, 2006. IPCC Guidelines for National Greenhouse Gas Inventories. Chapter 10: Emissions from livestock and manure management. Available from: https://www.ipcc-nggip.iges.or.jp/public/2006gl/pdf/4_Volume4/V4_10_Ch10_Livestock.pdf
John Lewis Partnership, n.d. Our Future. Available from: John Lewis Partnership – Our future
Jones, H., Haresign, W. 2020. A review of current and new technologies for both genetic improvement and breed conservation of UK farm animal genetic resources. Produced by members of the Defra expert committee on Farm Animal Genetic Resources (FAnGR).
Jonker, A., Hickey, S.M., Rowe, S.J., Janssen, P.H., Shackell, G.H., Elmes, S., Bain, W.E., Wing, J., Greer, G.J., Bryson, B. and MacLean, S., 2018. Genetic parameters of methane emissions determined using portable accumulation chambers in lambs and ewes grazing pasture and genetic correlations with emissions determined in respiration chambers. Journal of Animal Science, 96(8), pp.3031-3042.
Llonch, P., Haskell, M.J., Dewhurst, R.J. and Turner, S.P., 2017. Current available strategies to mitigate greenhouse gas emissions in livestock systems: an animal welfare perspective. Animal, 11(2), pp.274-284.
Manzanilla-Pech, C.I.V., Gordo, D.M., Difford, G.F., Pryce, J.E., Schenkel, F., Wegmann, S., Miglior, F., Chud, T.C., Moate, P.J., Williams, S.R.O. and Richardson, C.M., 2021. Breeding for reduced methane emission and feed-efficient Holstein cows: An international response. Journal of Dairy Science, 104(8), pp.8983-9001.
Manzanilla-Pech, C.I.V., Stephansen, R.B., Difford, G.F., Løvendahl, P. and Lassen, J., 2022. Selecting for feed efficient cows will help to reduce methane gas emissions. Frontiers in Genetics, 13, p.885932.
Martínez-Álvaro, M., J. Mattock, Z. Weng, R. J. Dewhurst, M. A. Cleveland, M. Watson, and R. Roehe. 2022. “Part of the functional rumen core microbiome is influenced by the bovine host genome and associated with feed efficiency.” In Proceedings of 12th World Congress on Genetics Applied to Livestock Production (WCGALP) Technical and species orientated innovations in animal breeding, and contribution of genetics to solving societal challenges, pp. 324-327. Wageningen Academic Publishers, 2022.
Miller, G.A., Auffret, M.D., Roehe, R., Nisbet, H. and Martínez-Álvaro, M., 2023. Different microbial genera drive methane emissions in beef cattle fed with two extreme diets. Frontiers in Microbiology, 14, p.1102400.
Ministry for the Environment, New Zealand Government, 2022. Te tātai utu o ngā tukunga ahuwhenua: Pricing Agricultural Emissions: Consultation Document. Available from: Pricing-agricultural-emissions-consultation-document.pdf (environment.govt.nz)
Morrisons Farming, n.d. Our Plans and Progress. Available from: Our Plans and Progress (morrisons-farming.com)
NAEI, 2023. GHG inventories for Scotland 1990-2021. Available from: https://naei.beis.gov.uk/data/. Copyright © Crown 2024 copyright Defra & BEIS via naei.beis.gov.uk, licenced under the Open Government Licence (OGL).
Nason, James., 2022. Ireland confident genetics and breeding can help meet 25pc methane reduction target. Beef Central. Available from: https://www.beefcentral.com/news/ireland-confident-genetics-and-breeding-can-help-meet-25pc-methane-reduction-target/
National Human Genome Research Institute, 2024. Glossary: Trait. Available from: https://www.genome.gov/genetics-glossary/Trait
National Sheep Association, 2023. The sheep sector’s path to net zero begins with new innovative project. Available from: https://www.nationalsheep.org.uk/our-work/news/245899/the-sheep-sector-s-path-to-net-zero-begins-with-new-innovative-project/
New Zealand Agricultural Greenhouse Gas Research Centre (NZAGRC), 2023. Breeding low-emitting sheep. Available from: https://www.nzagrc.org.nz/domestic/methane-research-programme/breeding-low-emitting-sheep/
New Zealand Herald, 2023. Portable accumulation chambers bring cattle emissions testing to the farm. Available from: https://www.nzherald.co.nz/the-country/news/portable-accumulation-chambers-bring-cattle-emissions-testing-to-the-farm/PAP47SYAYFD43C6U7SD6YSHN6U/
NFU, 2024. What you need to know about gene editing in agriculture. Available from: https://www.nfuonline.com/updates-and-information/what-you-need-to-know-about-gene-editing-in-agriculture/
NIH, 2022. A Brief Guide to Genomics. Available from: https://www.genome.gov/about-genomics/fact-sheets/A-Brief-Guide-to-Genomics
nProve, 2023. Available from: https://nprove.nz/#/home
PGgRC, 2023. Fact Sheets. Available from: https://www.pggrc.co.nz/
Quality Meat Scotland, 2023. Available from: https://qmscotland.co.uk/about-qms
Quinton, C.D., Hely, F.S., Amer, P.R., Byrne, T.J. and Cromie, A.R., 2018. Prediction of effects of beef selection indexes on greenhouse gas emissions. Animal, 12(5), pp.889-897.
Reid, A. and Wainwright, W., 2018. Climate Change and Agriculture: How Can Scottish Agriculture Contribute to Climate Change Targets.
Rowe, S.J., Hickey, S.M., Johnson, P.L., Bilton, T.P., Jonker, A., Bain, W., Veenvliet, B., Pilel, G., Bryson, B. and Knowler, K., 2021. The contribution animal breeding can make to industry carbon neutrality goals. In Proc. Assoc. Advmt. Anim. Breed. Genet (Vol. 24, pp. 15-18).
Rowe, S.J., Hess, M., Zetouni, L., Hickey, S., Brauning, R., Henry, H., Flay, H., Budel, J., Bryson, B., Janssen, P. and Jonker, A., 2020. Breeding low emitting ruminants: predicting methane from microbes. Multidisciplinary Digital Publishing Institute Proceedings, 36(1), p.177.
Scholtens, M., Lopez-Villalobos, N., Lehnert, K., Snell, R., Garrick, D. and Blair, H.T., 2020. Advantage of including genomic information to predict breeding values for lactation yields of milk, fat, and protein or somatic cell score in a New Zealand dairy goat herd. Animals, 11(1), p.24.
ScotEID, n.d. Beef Efficiency Scheme. Available from: https://www.scoteid.com/bes
Scottish Government, 2023. Climate Change. Available from: https://www.gov.scot/policies/climate-change/reducing-emissions/
Scottish Government, 2022. Gene editing. Available from: https://www.gov.scot/binaries/content/documents/govscot/publications/foi-eir-release/2023/12/national-farmers-union-of-scotland-and-gene-editing-eir-release/documents/202200280877—item-01—feb-2022/202200280877—item-01—feb-2022/govscot%3Adocument/202200280877%2B-%2BItem%2B01%2B-%2BFeb%2B2022.pdf
Scottish Government, 2020. Securing a green recovery on a path to net zero: climate change plan 2018–2032 – update. Available from: https://www.gov.scot/publications/securing-green-recovery-path-net-zero-update-climate-change-plan-20182032/pages/13/
Semex, 2023. Semex & methane efficiency. Available from: https://www.semex.com/fi/i?lang=en&page=methane
Semex, 2023. Catalogue. Available from: https://www.semex.com/uk/i?lang=en&view=list&breed=HO&data=tpi
Sorg, D., 2021. Measuring livestock CH4 emissions with the laser methane detector: A review. Methane, 1(1), pp.38-57.
SRUC, 2020. GreenCow. Available from: https://www.sruc.ac.uk/research/research-facilities/beef-sheep-research-facility/beef-sheep-research-projects/greencow/
SRUC, 2023. EGENES. Available from: https://www.sruc.ac.uk/research/research-areas/genetics-genomics/#EGENES
Stout, D. 2021. Using Estimated Breeding Values (EBVs) in Sheep – TECHNICAL NOTE TN755. SAC Consulting.
TEAGASC, 2022. Strategies to reduce methane emissions from Irish beef production. Available from: https://www.teagasc.ie/animals/beef/grange/beef2022-open-day/strategies-to-reduce-methane-emissions-/
Tedeschi, L.O., Abdalla, A.L., Álvarez, C., Anuga, S.W., Arango, J., Beauchemin, K.A., Becquet, P., Berndt, A., Burns, R., De Camillis, C. and Chará, J., 2022. Quantification of methane emitted by ruminants: a review of methods. Journal of Animal Science, 100(7), p.skac197.
Tesco, 2021. Certifications. Available from: https://www.tescoplc.com/sustainability/certifications
Tesco, 2023. Sustainability. Available from: https://www.tescoplc.com/sustainability/
UK Parliament, 2023. Genetic Technology (Precision Breeding) Bill 2022-23. Available from: https://commonslibrary.parliament.uk/research-briefings/cbp-9557/
UK Research and Innovation, 2022. Where livestock agriculture fits in a net zero future. Available from: https://www.ukri.org/who-we-are/how-we-are-doing/research-outcomes-and-impact/bbsrc/where-livestock-agriculture-fits-in-a-net-zero-future/#:~:text=Cattle%20breeders%20can%20now%20use,immediate%20fall%20in%20methane%20emissions.
van Breukelen, A.E., Aldridge, M.N., Veerkamp, R.F., Koning, L., Sebek, L.B. and de Haas, Y., 2023. Heritability and genetic correlations between enteric methane production and concentration recorded by GreenFeed and sniffers on dairy cows. Journal of Dairy Science, 106(6), pp.4121-4132.
van Staaveren, N., Oliveira, H.R., Houlahan, K., Chud, T.C., Oliveira Jr, G.A., Hailemariam, D., Kistemaker, G., Miglior, F., Plastow, G., Schenkel, F.S. and Cerri, R., 2023. The Resilient Dairy Genome Project–a general overview of methods and objectives related to feed efficiency and methane emissions. Journal of dairy science.
Wellmann, R., 2023. Selection index theory for populations under directional and stabilizing selection. Genetics Selection Evolution, 55(1), p.10.
Worden, D. and Hailu, G., 2020. Do genomic innovations enable an economic and environmental win-win in dairy production?. Agricultural Systems, 181, p.102807.
Appendix / Appendices
Technologies involved in breeding for reduced methane, full tables
Table 13. Examples of the detection methods involved in the process of breeding livestock for reduced methane emissions.
|
Description |
Sector |
Data collected |
Benefits |
Risks |
Timeline of availability in Scotland: Experimental (E), Innovators (I), Mainstream (M), Future possibility (FP), Not applicable (NA) |
Practical considerations in Scotland | ||||
|---|---|---|---|---|---|---|---|---|---|---|
|
Beef |
Dairy |
Sheep | ||||||||
|
Respiration chamber |
A sealed chamber taking samples from an animal in a controlled environment. The animal is typically kept in the measurement chamber for a couple of days and is provided with food and water (Zaman et al., 2021). |
All |
Methane concentration |
Believed to be the most accurate way to measure methane from livestock (Zaman et al., 2021). Measurements taken over several days increases robustness (Manzanilla-Pech et al., 2021). |
Restricts normal animal behaviour and movement (Zaman et al., 2021; Manzanilla-Pech et al., 2021). High capital cost. Limited to a few or one animal per chamber (Manzanilla-Pech et al., 2021). |
2030: E 2045: E |
2030: E 2045: E |
2030: E 2045: E |
Used in research facilities in Scotland, however there is limited scope to use them on farms due to the high cost (Stakeholder comment, 2023). | |
|
Sniffers |
Non-dispersive infrared unit that can be installed in feeding areas or milking parlours (van Breukelen, 2023; de Haas et al., 2021). |
All |
Methane and CO2 concentration |
Non-invasive, can be incorporated into existing milking technologies (de Haas et al., 2021). Offers large scale recording (de Haas et al., 2021). |
A spot measurement, not a true reflection of emissions per day. Limited to indoor measuring (Cummins et al., 2022). More difficult to introduce in beef and sheep sectors compared to dairy due to frequent milking. |
2030: FP 2045: FP |
2030: E 2045: E |
2030: FP 2045: FP |
In 2021 ‘the first’ was installed at a Dutch dairy farm for research (CRV, 2021). No evidence found for use on farms in the UK. | |
|
SF6 tracer gas |
A tube containing sulfur hexafluoride (SF6) tracer gas is placed inside the rumen and collection lines are used to collect breath samples (Cummins etal., 2022). |
All |
Methane concentrations |
Measurements can be taken from confined, free range, and grazing animals (Manzanilla-Pech et al., 2021). |
Invasive measure which has animal welfare concerns (de Haas et al., 2021). SF6 is a greenhouse gas itself (Tedeschi et al., 2022). Daily canister collection means high labour (Cummins etal., 2022). |
2030: E 2045: E |
2030: E 2045: E |
2030: E 2045: E |
No evidence was found for use in UK trials and research, but it used widely in globally. It would be beneficial in Scottish research due to measuring livestock while grazing. | |
|
Automated head chamber system (e.g. GreenFeed) |
A transportable head chamber unit that can be positioned in housing or pasture. Feed is used to attract livestock to the unit (van Breukelen, 2023; Zaman et al., 2021). |
All |
Methane and CO2 concentrations |
Non-invasive. It can be set up in grazing fields or in housing. |
High purchase and running costs. A spot measurement, not a true reflection of emissions per day. Feed to attract livestock increases costs. |
2030: E 2045: I |
2030: E 2045: I |
2030: E 2045: I |
No evidence was found for use in UK trials and research. However it is potentially a feasible option for Scotland due to the benefits of transportability and measuring grazing livestock. | |
|
Mid-Infrared (MIR) data |
MIR spectroscopy is used to predict the fat and protein content of milk. As methane is linked to milk composition, it can be used as a proxy to predict methane emissions (Dehareng et al., 2012; Semex, 2023) |
Dairy |
Milk component such as lactose, protein and fat |
MIR technology is already used in milk recording, so could provide an existing infrastructure to integrate methane reporting into. |
Because it is a proxy, validation of results (for example with a respiration chamber) is required (Denninger et al., 2020). |
NA |
2030: I 2045: I |
NA |
No evidence found of MIR being used in the UK to estimate methane, but European examples were found. As data could become available through existing milk recording schemes, it could be introduced by innovators by 2030. If the need for verifying results via detection methods is removed, this could be mainstream by 2045. | |
|
Portable accumulation chambers (PAC) |
A portable respiration chamber which takes measurements over a short period of time (e.g. 1 hour) (Cummins et al., 2022). |
All |
Methane and CO2 concentrations |
Quick measurement period reduces animal stress (Cummins et al., 2022). Transportable (NZHerald, 2023). |
Feeding and management protocols must be followed prior to measurements (Duthie et al., 2024). Not suitable for long-term measurements (Cummins et al., 2022). |
2030: E 2045: I |
2030: E 2045: I |
2030: E 2045: I |
A promising option for Scotland, given its transportable between farms. SRUC recently acquired a PAC for sheep in the UK. However current research needs to be completed before they can be used widely (Duthie et al., 2024). | |
|
Handheld lasers |
A handheld device originally developed to detect gas leaks can measure concentrations of methane in livestock breath (Sorg, 2021). |
All |
Methane concentrations |
Non-invasive and portable. Can take measurements from grazing livestock. Can take measurements from several animals in one day. Results can be sent to a smart phone (Sorg, 2021) |
Has a lower accuracy, measurements are highly affected by environmental conditions (de Haas et al., 2021; Sorg, 2021) |
2030: E 2045: I |
2030: E 2045: I |
2030: E 2045: I |
No evidence found for use in UK research. However, the benefit of taking measurements from several animals in the same day may make it an attractive option for Scotland. Its widespread use may depend on supporting infrastructure such as reporting systems. | |
|
Rumen microbial composition |
The rumen holds a variety of microorganisms that aid in the digestion of feed. By studying the microbes present in the rumen, those influencing the production of methane can be identified and used as a proxy to identify animals with the microbiome composition which emits lower methane (Miller et al., 2023). |
All |
Dry matter intake and methane concentrations |
It can also be used to improve feed conversion and disease resistance (Duthie et al., 2024). |
The composition of the microbiome is largely influenced by the ratio of feed (i.e. forage vs concentrate) so accuracy of results may be influenced by diet (Miller et al., 2023). |
2030: E 2045: I |
2030: E 2045: I |
2030: E 2045: I |
A technique being used in Scottish research in all sectors. Likely to remain an experimental technology, with future trials on some farms in the future. | |
|
Feed efficiency index |
An indicator showing how efficient a cow is at converting feed into product, for example, into milk. Research shows that selecting for feed efficiency reduces methane emissions (Manzanilla-Pech et al., 2022). |
Dairy, beef |
Feed efficiency, feed intake + milk yield (dairy) / meat quality (beef) |
Helps to reduce the amount of feed required and therefore associated costs. |
It’s important that selecting for feed-efficiency does not compromise growth. |
2030: M 2045: M |
2030: M 2045: M |
2030: M 2045: M |
No evidence found of this being done with the aim of reducing methane emissions in the UK, but it is used in the UK to improve efficiency in dairy. | |
Table 14. Examples of data management tools involved in the process of breeding livestock for reduced methane emissions.
|
Description |
Sector |
Data collected |
Benefits |
Risks |
Timeline of availability in Scotland: Experimental (E), Innovators (I), Mainstream (M), Future possibility (FP), Not applicable (NA) |
Practical considerations related to the feasibility in Scotland | |||
|---|---|---|---|---|---|---|---|---|---|
|
Beef |
Dairy |
Sheep | |||||||
|
ScotEID |
A multispecies database which records and tracks livestock information. It may be possible to build on this in the future to introduce information relevant to methane. |
All |
Births, deaths and movements. |
A familiar platform for farmers in Scotland. |
2030: E 2045: I |
2030: E 2045: I |
2030: E 2045: I |
An established infrastructure exists and is familiar to the industry, therefore a promising option to repurpose to include methane traits. | |
|
nProve |
A free tool for New Zealand farmers to use to choose rams for breeding. They can choose the terminal or maternal traits that fit their breeding goals. When choosing maternal traits, methane production is an option. |
Sheep |
Reproduction, lamb growth, size, meat, wool, health indices |
Very user friendly, guides the user through the selection process. Contact details are provided for breeders that meet chosen criteria. Farmers can choose rams based on location, breed and exclude certain flocks from results. |
NA |
NA |
2030: FP 2045: I |
To be successful in Scotland, genetic evaluation and measuring methane from sheep would need to be common practice. There are existing tools such as ScotEID which records births, deaths and movements, and RamCompare which presents data from performance recorded rams i.e. carcass weight, that could be repackaged to incorporate methane production. But success would also depend on wide use of PAC (as done in New Zealand). | |
|
Selection index |
Combines information to predict an animals estimated breeding value (EBV). It can be used to select traits for breeding goals, for example, milk production, feed efficiency and health to maximise future profit (Wellmann, 2023; de Haas et al., 2021). |
All |
It is possible to apply weightings to traits in relation to its importance in the breeding goals |
Before a trait can be added to a selection index, it needs to be “clearly defined, recordable, affordable, have phenotypic variation, be heritable, and the genetic correlations between other traits in the index need to be known” (de Haas et al., 2021). |
2030: E 2045: I |
2030: E 2045: I |
2030: E 2045: I |
In 2023, Semex introduced a methane index for Holsteins in Canada. Availability in Scotland depends on the progress of measuring methane. | |
|
National breeding programme |
A programme which plans and identifies breeding objectives, traits and information on selection criteria. |
All |
It can optimise gains and trait changes (De Haas et al., 2021). |
To be successful at a national scale, significant data and cooperation is required. For a trait to be included in a programme it must be environmentally important, express genetic variation and be measurable (Teagasc, 2012). |
2030: M 2045: M |
2030: M 2045: M |
2030: M 2045: M |
In 2023, The National Sheep Association began a 3-year initiative to measure methane from 13,500 sheep. The aim of this is to measure production traits to incorporate into breeding programmes. With progress like this, it is possible that national breeding programmes will be mainstream by 2030. | |
|
Multi-country database |
An international database that contains performance/production (trait-related) records from a large number of livestock (Manzanilla-Pech et al., 2021). |
All |
An increased dataset Improves robustness (Manzanilla-Pech et al., 2021) |
Combining data from different countries can be challenging due to differences in reporting and recording, technology, favoured breeds and management style (Van Staaveren e al., 2023). |
2030: FP 2045: FP |
2030: E 2045: I |
2030: FP 2045: FP |
A significant amount of collaboration is required to make this effective. Due to having to overcome the data sharing challenges, it is possibly unlikely this will be available with the aim of reducing methane emissions by 2045. There may be some progress in the dairy sector however due to the introduction of the methane index in Canada. | |
|
Efficient Dairy Genome Project |
An international initiative that combines data from 6 countries (Australia, Canada, Denmark, United Kingdom, United States, and Switzerland) aiming to build one genomic reference population and a unique database of DMI records. |
Dairy |
DMI, milk, methane was measured in 4 of the 6 countries participating in the initiative |
The overall objective is to potentially improve feed efficiency (cost benefit) and reduce methane emissions (environmental benefit). |
Combining data from different countries can be challenging due to differences in areas such as reporting and recording, technology, favoured breeds and management style (Van Staaveren e al., 2023). |
NA |
2030: I 2045: I |
NA | |
|
Bull catalogues (such as Genus Bull search) |
This index allows farmers to see the scores of certain traits in bulls. One of these traits is called Feed Advantage which can identify bulls with the greatest feed conversion (ABS, 2023). |
Dairy, beef |
Farmers can choose bulls with the desired characteristics to use in breeding. |
2030: M 2024: M |
2030: M 2024: M |
NA |
These are already available for farmers to use, so we would estimate them to be mainstream by 2030. | ||
|
Beef Efficiency Scheme |
A 5-year scheme funded by Scottish Government to help improve the efficiency, sustainability and quality of beef herds – helping to increase genetic value and reduce GHG emissions. The scheme focused on cattle genetics and management practices on-farm. |
Beef |
Tissue samples – genotyping blood samples, calving data, culling/death reasons, dam data (docility) |
Funding was provided to farmers for data collection and entry. A free advisory service was also provided to assist farmers in developing their beef herd. |
2030: FP 2045: FP |
NA |
NA |
This scheme ended in 2021. It may be possible to build on and repackage the scheme to consider methane traits in the future. | |
Table 15. Examples of reproductive technologies involved in the process of breeding livestock for reduced methane emissions.
|
Description |
Sector |
Benefits |
Risks |
Timeline of availability in Scotland: Experimental (E), Innovators (I), Mainstream (M) |
Future possibility (FP) Not applicable (NA)Practical considerations related to the feasibility in Scotland | ||||
|---|---|---|---|---|---|---|---|---|---|
|
Beef |
Dairy |
Sheep | |||||||
|
Semen freezing |
A technique to preserve semen. |
All |
Provides security in an instance that could risk a breed’s survival (Jones et al., 2020) |
Variable success rate using thawed semen. |
2030: M 2045: M |
2030: M 2045: M |
2030: I 2045: I | ||
|
Artificial insemination (AI) |
A technique to inseminate females, using fresh or frozen semen. |
All |
High success rate for cattle. Not required to have a bull on the farm. Better guarantee of uniform calving. |
To be most efficient, livestock are required to come into heat at the same time as AI takes place. This is done artificially by the farmer, adding additional labour. AI in sheep is often done laparoscopically, which is a surgical procedure performed by a vet. Due to the scale and extensive nature of sheep farming, this brings practical challenges. Relies on sufficient infrastructure to collect and store semen of which there are limited facilities in Scotland (in particular for the sheep sector) (Stakeholder comment, 2023). |
2030: M 2045: M |
2030: M 2045: M |
2030: I 2045: I |
AI is already common practice in the dairy sector, with some use in the beef sector too. It’s likely this will be mainstream by 2030 for cattle. However, due to the practical challenges in sheep, it may still only apply to innovators. | |
|
Sexed semen |
A method which allows control over the sex of the offspring by separating sperm cells based on their X or Y chromosome content. By focusing on females for example, there is the potential to reduce methane by reducing the number of unwanted males (Duthie et al., 2024). |
All |
Increases the selection of females in the dairy sector. Improves productivity. |
Success relies on the uptake of AI. |
2030: M 2045: M |
2030: M 2045: M |
2030: I 2045: I |
This is widely practiced in the dairy sector. Use in the beef sector is currently lower, however by 2030 there is the potential for this to be mainstream. Progress is determined by the uptake of AI in the sector. Due to the practical challenges associated with AI, it will likely remain an innovative practice. | |
|
In-vitro fertilisation (IVF) |
Harvested oocytes are taken from donor cows and fertilised in a petri dish with semen to create an embryo. |
Beef, dairy |
Less semen required |
Nutrition and diet need to be consistent in the lead up to extracting oocytes. |
2030: I |
M |
NA |
Process is conducted in a lab under sterile conditions. | |
|
Embryo freezing |
A method for cryopreservation of embryos for long-term storage or transport. This tends to occur in conjunction with MOET. |
All |
I? |
I? |
I? |
Lack of suitable laboratories | |||
|
Conventional breeding |
The use of bull/ram to cow/ewe breeding. Enhanced tools to select lower than average emitting bulls or rams. |
All |
Minimal technical input. Familiar management practice for farmers. |
Little control over selecting desirable traits. It requires waiting for offspring to become fully grown before seeing if they have taken on the desired traits. |
M |
M |
M | ||
Table 16. Examples of animal genomics involved in the process of breeding livestock for reduced methane emissions.
|
Description |
Sector |
Data collected |
Benefits |
Risks |
Timeline of availability in Scotland: Experimental (E), Innovators (I), Mainstream (M), Future possibility (FP), Not applicable (NA) |
Practical considerations in Scotland | |||
|---|---|---|---|---|---|---|---|---|---|
|
Beef |
Dairy |
Sheep | |||||||
|
Microbiome-driven breeding |
Emphasis is on selecting livestock with a rumen microbiome composition which is more efficient at fermenting of feed so that less excess hydrogen and thus less methane is produced. Livestock genetics and therefore breeding influences the composition of the microbiome which therefore affects the amount of methane released. |
All |
Rumen fluid samples – sequencing of microbial DNA |
There is a growing demand for livestock that emit less methane. Potential method for improving animal health and reduce environmental impact. |
This is a relatively new field, and much is unknown about how the gut microbiome develops and is maintained over time. It is unclear how much influence the animal may have over those processes. |
2030: E 2045: E |
2030: E 2045: E |
2030: E 2045: E |
Good early signs but still at research stage. |
|
Genomic breeding values (GEBVs) |
Values that are based on information from livestock DNA and measured performance. Can be used with EBVs to improve accuracy of breeding programmes. (Meat Promotion Wales. 2013). |
All |
DNA and performance records |
Can be used to identify traits that are difficult to record Beneficial for traits measured in only one sex Useful for accurately measuring traits that occur later in life (Scholtens et al., 2020). |
Accuracy of the estimate is dependent on the number of animals included in the reference population (Scholtens et al., 2020). |
2030: E 2045: I |
2030: E 2045: I |
2030: E 2045: E |
For the UK beef industry, GEBVs are currently available for a number of carcass traits in Limousin cattle (Business Wales, 2016) |
|
Estimated Breeding values (EBVs) |
Calculated from the performance data of recorded animals. Environmental factors (e.g. feeding) are filtered out to provide a genetic value for each trait (Stout, D. 2021). |
All |
Performance records – parentage and traits of interest (e.g. weight traits). |
Provides a more objective (data driven approach) towards selection. Genetic selection based on EBVs leads to faster rates of genetic gain and flock improvement (compared to selection based on raw data or basic observation) |
Allows comparisons within breeds, not between breeds. |
2030: M 2045: M |
2030: M 2045: M |
2030: M 2045: M |
Use as a tool to aid in the selection of healthy and structurally sound animals. |
|
Genotyping |
The process of determining/comparing the genetic variation of DNA sequences (or whole genomes) amongst individuals or populations. |
All |
Aids in genomic selection of both desirable (and harmful) traits. |
Prediction accuracy of genomic selection is influenced by the type (male/female, previous generations) and number of animals that are genotyped (Mohammaddiyeh et al., 2023) |
NA |
NA |
NA |
Farmers cannot use this method themselves and therefore require the use of external service providers. | |
|
Genetic markers |
Genetic markers identify desirable traits in animals which can then be selected for breeding (Meat Promotion Wales. 2013). |
All |
DNA marker information can be obtained from animals at birth (Hayes et al., 2013). Can be used to select for traits that are difficult to record. |
Genetic progress in slow given the relatively long generation interval in cattle and sheep |
NA |
NA |
NA |
Farmers cannot use this method themselves and therefore require the use of external service providers. | |
|
Gene editing |
A method for editing individual genes within the genome of a cell, embryo or ovum to bring about a desired genetic change. |
All |
The ability to eliminate undesirable traits. Accelerates rate of genetic improvement. Introduces variation into a population e.g. disease resistance |
Identifying the appropriate genes/ genomic site can be challenging, time consuming and expensive. |
FP (provided a change in policy) |
FP (provided a change in policy) |
FP (provided a change in policy) |
Gene editing is not legal in the UK and the Scottish Government is opposed to the use of GM in farming. | |
Appendix A: REA and stakeholder interviews methodology
REA methodology
The REA methodology used for this project aligned with NERC methodology (Collins et al., 2015) and comprised of the following steps.
- Define the search strategy protocol, identify key search words or terms, define inclusion/exclusion criteria. This step helped to focus the review on the most relevant sources. Inclusion and exclusion criteria were also defined. For example, studies related to reducing emissions through feed additives were excluded.
- Searching for evidence and recording findings. Due to the short timescales of this REA, we searched for literature using Google Scholar, utilising our accounts with Science Direct and Research Gate to access restricted pdfs where required. For each search, we recorded the date, search string and number of results found, each search string was assigned a reference number. Examples of search strings include:
- breeding for reduced methane emissions
- policy drivers for reduced methane emissions in livestock “breeding”
- breeding for reduced methane emissions in livestock “Scotland”
- Screening. Evidence was then screened, initially by title and a selection of sources were screened by the abstract, applying the criteria developed in step 1. This step ensures the relevance and robustness of the evidence that was included in the study.
- Extract and appraise the evidence. Evidence was then extracted from the papers after screening, this included methane reduction values, traits that lead to reduced emissions and the technologies involved in the process.
Stakeholder interview methodology
Stakeholder interviews were used to collect information that may have been absent from the literature, for example on trials currently taking place that will not yet be included in publications. The stakeholders included researchers and individuals from farmer representative groups. We invited farmers for interview, however, only confirmed one farmer for an interview.
The semi-structured interviews took place over Microsoft Teams, with questions covering all parts of the study. For instance, asking for views on the key traits to select for, any examples of farmers choosing livestock based on emissions and the benefits and risks.
We did seven one-to-one interviews (with four stakeholders based in Scotland) and a group interview with nine stakeholders, all located in Scotland. The group interview was done to allow space for conversation and discussion between stakeholders. During this meeting, we presented the key themes raised in the one-to-one interviews. This included the barriers and drivers to uptake, the availability of technologies and the structural needs to support uptake.
Appendix B: New Zealand sheep case study
Country information
New Zealand is an island nation in the South Pacific and has many similarities to Scotland in terms of its geography and climate. Agriculture is integral to the New Zealand economy with the sector accounting for 10% of gross domestic product (GDP), over 65% of export revenue and almost 12% of the workforce. In 2023 there were 26,821,846 sheep in New Zealand, down from approximately 70,000,000 in the 1980s.
Around half of GHG emissions in New Zealand (49% in 2021) and 91% of biogenic methane emissions stem from agriculture, with sheep farming a key contributor.
New Zealand has relevant international and domestic emissiontargets, including the Global Methane Pledge, and the Climate Change Response (Zero Carbon) Amendment Act 2019, which sets a net zero target by 2050. There is a specific reduction target for biogenic methane of 10% relative to 2017 levels by 2030, and 24 – 47% by 2050. New Zealand also has emissions’ budgets and emissions’ reduction plans which sets out policies and strategies for meeting the budgets.
Accelerating new mitigations such as breeding for low-methane sheep is seen as an important way to reduce emissions alongside the pricing of agriculture emissions, as well as support initiatives.
Relevant research, programmes and technologies
The New Zealand Agricultural Greenhouse Gas Research Centre (NZAGRC) and the Pastoral Greenhouse Gas Research Consortium (PGgRc) are key leaders in the robust and comprehensive programme of research in New Zealand.
- The NZAGRC is a Government funded centre which invests and coordinates research for practical and cost-effective reductions of agricultural GHG. One of its main targets of reducing enteric methane emissions.
- The PGgRc is a joint initiative of the New Zealand Government and the agricultural sector which funds research into ways to reduce methane emissions, including from sheep, such as breeding. It also provides knowledge and tools for farmers to help mitigate GHG, for instance research reports (‘Sheep farmers now able to breed “low methane” sheep’), and fact sheets, with the aim of increasing understanding around the research.
The NZAGRC and PGgRc led the following research programmes related to breeding for reduced methane emissions:
- Low emitting sheep were genotyped and markers were used to identify low emitting traits which confirmed a genetic basis for the variation in methane emissions. After 13 years of selecting for low emitting traits, a 16% difference in methane emissions was found between low and high emitting sheep. Other key findings include no negative impacts on physiology, productivity and health when selecting for reduced emissions. Predications have also been made that with the low emitting flock a 1% decrease in methane emissions per year is achievable The low emitting flock has been producing more wool and leaner meat and the emissions savings are both permanent and cumulative. This programme is ongoing and has produced one of the most comprehensive datasets in the world.
- A methane breeding value was launched in 2019 from research undertaken by NZAGRC and PGRC. This was made available to selected ram breeders through Beef + Lamb Genetics and gives the sector a practical tool to make decisions with. This has then led to the development of the Cool Sheep Programme.
- The Cool Sheep™ Programme was launched in 2022. This three-year programme aims to provide every sheep farmer in New Zealand the chance to use genetic selection to reduce GHG emissions. As well as supporting farmers, this programme gathers phenotype data which feeds back into research. This is available to farmers who are reviewing rams for selection on N Prove. Breeders wanting to produce low-methane rams do so by measuring a proportion of their flock using PAC. When combined with other information and sheep genotyping, this is used to provide a methane breeding value. In November 2023, bookings for use of the PAC chambers by stud breeders were fully subscribed, indicating uptake is high. They note that progress is slow in terms of methane emissions reduction around 2-3% per year, with single trait selection, although this is cumulative.
The four workstreams of the project are:
- Ram supply: Measuring rams with PAC to make low-emitting rams available for breeding.
- nProve enhancement: adding methane to nProve.nz.
- National Impact: using GHG calculators on farms to show methane reductions, rewarding farmers for their efforts.
- Awareness and outreach: increasing knowledge for farmers, improving public awareness of efforts to reduce emissions while improving national productivity.
Key policies
There is no government policy legislating livestock breeding for reduced methane emissions in New Zealand. However, there are policies that that may contribute to introducing this in the future.
The Emissions Trading Scheme (ETS) is a key tool in New Zealand to help reduce emissions. Under the ETS, businesses must measure and report on their GHG emissions, and surrender one ‘emissions unit’ (an NZU) to the Government for each tonne of emissions emitted. They do this by purchasing NZU. The Government sets and reduces the number of NZU supplied into the scheme over time. This limits the quantity that emitters can emit, in line with emission reduction targets. Businesses who participate in the ETS can also buy and sell units from each other i.e. emitters can buy NZU from forestry companies or farmers to offset emissions. The price for units reflects supply and demand in the scheme. All sectors of New Zealand’s economy, apart from agriculture, pay for their emissions through their ETS surrender obligations. The agriculture sector must report its emissions but does not have surrender obligations.
Currently, no major incentive exists for agricultural producers to reduce their emissions. The ETS was not seen as the right mechanism to price agricultural emissions.
Instead, Government, industry representatives and Māori formed the He Waka Eke Noa – Primary Sector Climate Action Partnership (the Partnership) to reduce agricultural emissions. It is committed to designing an on-farm pricing system that ensures New Zealand’s agricultural products remain internationally competitive while reducing emissions.
Key Stakeholders
Key stakeholders involved in the research, technologies, programmes and policies include:
- Agricultural Greenhouse Gas Research Centre, Government-funded centre which invests and coordinates research for reductions of agricultural GHG.
- Crown Research Institutes, Crown-owned companies that carry out scientific research.
- Beef + Lamb New Zealand, a farmer-owned, industry organisation representing New Zealand’s sheep and beef farmers.
- Dairy Companies Association of New Zealand, representing dairy manufacturing and exporting companies.
- Dairy NZ, industry organisation that represents all dairy farmers.
- Farmers.
- He Pou a Rangi – Climate Change Commission, an independent Crown entity that provides advice to government on climate issues
- Iwi Māori, tribal entities and largest social units in Māori society that represent a group of people and land area
- Māori Landowner groups, groups that represent Māori land that is governed and protected under specific statutes
- Meat Industry Association, voluntary trade association representing red meat processors, marketers and exporters
- Ministry for the Environment, New Zealand Government’s primary adviser on environmental matters
- Pastoral Greenhouse Gas Research Consortium, provides knowledge and tools for farmers, to mitigate GHG
- Public
- Scientists and academics
Successes of research, technologies, programmes and policies
There are many successes in New Zealand for identifying emissions savings, policy drivers and behaviour change which would lead to improved breeding for reduced emissions.
- Full subscription of the Cool Sheep programme to use genetic selection to reduce GHG emissions highlights the keen interest in this programme from farmers
Research indicated that sheep can be bred to produce less methane without sacrificing productivity.
Within the proposal for emission pricing, there have been the following successes that are likely to help drive behaviour change to uptake methane emission reduction breeding selection:
- A farm level, split-gas levy gives farmers flexibility to determine the most efficient, cost-effective mitigation practices for their farms (Stakeholder comment, 2023).
- The He Waka Eke Noa partnership involved key stakeholders discussing practical solutions to reducing emissions (Stakeholder comment, 2023).
- While a policy for pricing agricultural emissions has not yet been legislated and implemented, discussions about a policy helped make New Zealand farmers more aware of their emissions and how to manage them.
Challenges of research, technologies, programmes and policies
There are some challenges with the New Zealand scenario that are relevant for identifying emissions savings, policy drivers and behaviour change which would lead to improved breeding for reduced emissions.
- The fully prescribed uptake of the Cool Sheep programme in 2023 may highlight potential challenges with sourcing enough infrastructure to support all farmers interested in the programme.
In particular, there are challenges related to the agriculture emissions pricing:
Mitigation options under proposed policies are more currently more suited to dairy farmers than sheep and beef farmers.
The sheep and beef sectors are expected to be impacted by the pricing of emissions more than other farming sectors. There are likely to be disproportionate impacts on Māori due to the large proportion of Māori ownership in the sheep and beef sectors and historical context.
Potentially ancillary challenges and unforeseen challenges from the proposal such as environmental and social challenges due to land use changes due to the need to reduce emissions i.e. increased planting of forest may lead to landscapes changes etc.
The recent change in Government has posed a challenge. The 2025 implementation target for implementing the pricing of emissions is expected to be pushed back until 2030 (Stakeholder comment, 2023) and uptake of other methane related programmes could waver too.
Relevance in Scotland
There are some key learnings from the New Zealand scenario that are relevant for identifying emissions savings, policy drivers and behaviour change which would lead to improved breeding for reduced emissions.
- At this stage, it is hard to determine exactly what has encouraged uptake of the Cool Sheep Programme and PAC measurements by sheep farmers. However it is assumed that discussions around agriculture emissions pricing and increased awareness, as well as financial assistance, has no doubt contributed to uptake.
- The He Waka Eke Noa partnership highlighted that each livestock sector has different requirements. In Scotland, for example, stakeholders interviewed for this project suggested that it may be difficult to introduce breeding practices in the sheep sector due to its extensive nature. In addition, there is less frequent cashflow in the sheep and beef sectors compared to dairy, making it more difficult to introduce new practices. In New Zealand suggestions have been made that the dairy industry has had a better lobbying influence in the development of the policy than the sheep and beef industry and have been more successful at influencing a policy that better suits their needs (Stakeholder comment, 2023). Therefore, any consultations or partnerships must include different livestock types and stakeholders, and consider the differences between upland or lowland systems.
New Zealand is one of the first countries in the world to attempt to price agriculture emissions therefore can provide a huge amount of learning that should be considered by Scotland in developing policy around methane reduction.
Having an emissions number to reduce from makes it easier to see how actions will impact. This will encourage the consideration of emission reductions as part of general on-farm decision making, on-farm investment decisions and other considerations.
- The policy impacts on certain farmers and Māori may be of relevance to island farmers and crofters with unique challenges, who may be disproportionately impacted by any climate policies in Scotland.
- Research from the NZAGRC and the PGgRc has produced schemes like the Cool Sheep Programme.
- The ram selection tool nProve provides a user-friendly platform for farmers to select the traits they want from a ram, including methane production. It gives farmers a tool to compare emissions between different animals before purchasing a ram, bull or semen. Because of the Cool Sheep programme and because there are planned policies to reduce emissions, there may be an incentive to use this metric. It may be possible to build on existing tools such as ScotEID and RamCompare in the future to create a similar platform (not only for sheep).
A policy for pricing agricultural emissions has not yet been legislated and therefore whether it has/will contribute to reduced emissions is yet to be realised. However government modelling suggests that the levy could achieve sufficient emissions reductions to meet or exceed methane targets. Discussions about a policy helped make New Zealand farmers more aware of their emissions and how to manage them.
Appendix C: Canada dairy case study
Country information
Canada has similarities in climate and geography to Scotland. Agriculture is a key aspect of the Canadian economy with agriculture and the agri-food system generating $143.8 billion Canadian Dollars (CD$) (around 7%) of Canada’s GDP. Canada is also the fifth-largest exporter of agri-food and seafood in the world. Dairy is a key part of the sector and is a top commodity in five of Canada’s provinces/territories.
In 2020, agriculture was responsible for 30% of Canada’s total methane emissions, with 86% of that being attributed to enteric fermentation. Canada has an emissions reduction target of 40% below 2005 levels by 2030 and to be net-zero by 2050 and joined the Global Methane Pledge. The advocacy group, Dairy Farmers of Canada, have voluntarily set a goal to reach net-zero by 2050.
Description of relevant research, programmes and technologies
Canada is undertaking research and programmes focused on breeding and new genomic technologies for reduced methane emissions in dairy production systems:
- The Efficient Dairy Genome Project (EDGP) developed genomic-based methods for selecting dairy cattle with reduced methane emissions and improved feed efficiency. The project was underpinned by an extensive database used for genomic analysis. For example, correlating MIR with reduced methane emissions. The project also recognised the necessity of featuring the economic, environmental and social benefits of selecting for reduced methane emissions.
- The Resilient Dairy Genome Project (RDGP) aims to integrate genomic approaches to improve dairy cattle resilience and industry sustainability. The project builds on the EDGP, with a focus on additional data collection, management and visualisation to support genomic analyses. Researchers noted an essential component is understanding the interaction between enteric methane emissions and specific farm conditions. For example, predicting methane emissions of individual animals and whole herds using milk MIR spectroscopy. By acknowledging the crucialness of collaboration with industry partners, the project will ensure results will render user-friendly products to enable technological uptake.
- An ongoing commercial endeavour between genetic evaluation provider, Lactanet Canada and genetics supplier, Semex Alliance aims to develop a reliable methane efficiency index that can be easily integrated with common selection indices such as fertility, disease resistance and lifetime profitability.
Description of key policies related to reducing methane emissions through breeding
There are currently no government policies legislating livestock breeding for reduced methane emissions in Canada, however there are some policies that are likely to eventually incentivise it.
- Agricultural Methane Reduction Challenge provided funding awarding up to $12 million CD$ to innovators designing practices, processes, and technologies to reduce enteric methane emissions.
Key Stakeholders
Key stakeholders involved in the research, technologies, programmes and policies include:
- Dairy Farmers of Canada, an advocacy group represent over 10,000 dairy farms, and have set a goal to reach net-zero by 2050
- National Farmers Union, representing Canadian farmers to achieve policy and reform
- Semex the world’s largest provider of cattle genetics
- Genome Canada, a non-profit organisation funding EDGP and RDGP
- University of Guelph, and University of Alberta, orchestrate EDGP and RDGP
Successes of research, technologies, programmes and policies
There are many successes in the Canadian scenario that are relevant to identifying potential emissions savings, and in identifying policy drivers and behaviour change which would lead to improved breeding for reduced emissions.
- Researchers from the EDGP and RDGP recorded enteric methane emissions of reference populations predominantly via a GreenFeed system, a device measuring air composition exhaled by each cow during feeding. Exploiting the correlation between milk composition and emissions instigated the proposal of a genomic evaluation of methane efficiency without sacrificing other production traits. The projects demonstrated a 30% difference either side of average in enteric methane emissions between Holstein cows. This result highlights the importance of genetic selection if breeding for reduced methane emissions is to be an effective option.
- Public-Private Partnerships (PPP) between research and industry can be accredited for the establishment of Canada’s major EDGP and RDGP, and were paramount in the development of the sophisticated database. Stakeholders Lactanet Canada and Semex Alliance effectively utilised this database, and in April 2023, Canada became the first country in the world to commercially market dairy semen containing methane efficiency as a relative breeding value (RBV). Their database and AI catalogue now includes 26 Holstein bulls with proven methane reduction capabilities, and a further 165 predicted. Semex Alliance also estimate widespread adoption of the low-methane trait could reduce methane emissions from Canada’s dairy herd by 1.5% annually, and up to 20-30% by 2050. The collective effort of all members of the Canadian dairy industry has enabled significant progression, to which the inclusion of a methane efficiency genetic valuation can be traced to.
- A GHG Offset Credit System can incentivise farmers to undertake innovative projects that reduce GHGs for financial reward.
Challenges of research, technologies, programmes and policies
There are some challenges with the Canadian scenario that are relevant to identifying potential emissions savings, and in identifying policy drivers and behaviour change for improved breeding for reduced emissions.
- Scottish dairy farmers will likely question the validity of the two major Canadian research projects, as the methane efficiency RBV derives from controlled experimental environments. While this research does account for breed type, it does not reflect Scottish production systems including specific types of feed, pasture type and composition, etc, which may lead to lack of assurance. Furthermore, some Canadian dairy industry officials believe that cattle selected for reduced enteric CH4 emissions may develop digestion problems, an allegation which generates considerable doubt of widespread adoption success.
Relevance in Scotland
There are some key learnings from the Canadian scenario that are relevant for Scotland in terms of identifying potential emissions savings, and in identifying policy drivers and behaviour change for improved breeding for reduced emissions.
- When compared to other livestock sectors, the data gathering process in the dairy industry is unique as daily milking and feeding activities provide a non-invasive opportunity to measure individual animals without major management changes. Coupling the simplistic nature of data collection with advanced existing genetic databases and the widespread use of artificial insemination (AI), the Scottish dairy industry is capable of reducing enteric methane emissions efficiently. Applying knowledge or making predictions from existing information has great potential to eliminate and/or significantly reduce cost, data collection periods and the requirement of on-farm experimentation.
- Genetic change is a simple and low-cost approach to reduce enteric methane emissions in dairy production systems. Owing to modern technologies and transport capabilities, the methane efficiency RBV developed in Canada is compatible with the Scottish dairy herd and can be purchased and administered via AI to help begin reducing enteric methane emissions.
- Canada has precedented instigating good working relationships with farmers, a goal achieved by highlighting the primary objective of research is to enhance industry sustainability. In response, many Canadian dairy farmers have also recognised constructive engagement with research and industry is fundamental. The establishment of a comprehensive and transparent database has provided assurance and confidence to adopt new best management practices.
- Scotland could consider monitoring the effectiveness of the Offset Credit System currently being considered in Ottawa to see if it incentivises behaviour change or changes finances and markets.
- Canada does not currently offer incentives for low-methane cattle breeding, and livestock breeders do not charge a premium for methane efficiency traits. However, discussions on this topic are ongoing between stakeholders and policy makers and it is looking likely a financial benefit will be introduced in the future.
Appendix D: Ireland beef case study
Country information
Ireland has a similar climate and geography to Scotland. Agriculture is key aspect of the Irish economy with the agriculture, forestry and fishing GDP valued at €3,672m in 2020. In 2020, 55% of farms were specialist beef, with many others including cattle as part of a mixed farm.
In 2022, agriculture was responsible for 38.4% of GHG emissions, making it the sector with the biggest share of emissions. 62.6% was caused by enteric fermentation.
Ireland is part of the Global Methane pledge and legally obliged as an EU Member State to reduce emissions under the EU’s Effort Sharing Regulation, including in agriculture. Ireland’s 2030 target is to deliver at least a 42% reduction by 2030 compared to 2005 levels.
Ireland has developed the Food Vision 2030 Strategy for the Irish agri-food sector which commits to reducing biogenic methane. This includes the ‘Ag Climatise’ Roadmap, covering animal breeding, with an aim to genotype the entire national herd by 2030 to develop and enhance dairy and beef breeding programmes.
Description of relevant research, programmes and technologies
The Irish Cattle Breeding Federation (ICBF) launched the National Genotyping Programme (NGP) for cattle in 2023. This offers beef and dairy farmers a low-cost option to collect DNA samples from calves at birth which can be used for genotyping to identify specific traits or characteristics. The aim of the programme is to achieve a fully genotyped herd in Ireland. This has made national genetic indexes available to farmers, including methane traits. It also allows farmers to optimise the health and productivity of their herd, reducing its emissions intensity. The ICBF also publish methane evaluations for AI sires that have had methane data recorded.
Teagasc has an important role in the research in Ireland. Animal breeding is one of the four solutions from Teagasc to reduce methane emissions from livestock. Current research projects include:
- GREENBREED: Measured methane at the Tully Progeny Test centre using a GreenFeed automated head chamber system. This research led to the publication of genomic evaluations for methane emissions in Irish beef cattle and sheep. It found notable differences in methane emissions from livestock being fed the same diet, 11% of these in cattle were found to be due to genetic differences. This indicates that breeding programmes to reduce methane will be effective in Ireland.
- Collaborative research by Teagasc and ICBF found a 30% difference in methane emissions from beef cattle of a similar size. This lead to the residual methane emissions (RME)[10] index being identified as a metric to rank animals.
Description of key policies
There is no legislation on livestock breeding for reduced methane emissions in Ireland, but the following policies related to GHGs may support this.
- The Beef Data and Genomics Programme (BDGP) paid suckler farmers to improve the genetic merit of their herd through data collection and genotyping, with the aim of lowering GHG emissions by improving quality and efficiency.
- Payments were made of €142.50/ha for the first 6.66 ha and €120/ha for the remaining eligible hectares (the equivalent of €95 for the first 10 cows and €80 for the remaining cows), farmers have to undertake specific requirements.
- These requirements include calf registration, detailed surveys of animal characteristics, genotyping and tissue tag sampling, and implementing a replacement strategy based on high genetic merit animals.
- Additional support in the form of the carbon navigator decision making tool and training courses for farmers are also provided.
- Participants of the programme were found to be achieving improvements at a faster rate compared to farms not taking part. The impact of the programme can help to promote smaller, more efficient suckler cows to produce more efficient beef.
- The Suckler Carbon Efficiency Programme:
As part of its Common Agriculture Policy Strategic Plan (CSP), Ireland developed ENVCLIM (70) 53SCEP as a follow-on from the BDGP, providing support to beef farmers who implement breeding actions that aim to lower the overall GHG emissions. The BDGP was shown to deliver on both environmental and productive efficiency and emissions per suckler cow are being reduced through breeding strategies. Another measure in the CSP, 53SCT, targets training to complement the Suckler Carbon Efficiency Programme.
Key Stakeholders
Key stakeholders involved in the research, technologies, programmes and policies include:
- Teagasc, Agriculture and Food Development Authority providing research, advisory and training to the agriculture and food industry and rural communities.
- Department of Agriculture, Food and the Marine, Irish government department leading, developing and regulating the agri-food sector, protecting public health and optimising social, economic and environmental benefits.
- Irish Cattle Breeding Federation (ICBF), non-profit organisation charged with providing cattle breeding information services.
- Irish Environmental Protection Agency, independent public body to protect, improve and restore the environment through regulation, scientific knowledge and working with others.
- Irish Farmers Association, Ireland’s largest farming representative organisation.
- Farmers.
- Food Vision Sheep and Beef Group, group of stakeholders established by the Minister for Agriculture Food and the Marine to identify measures that the sector can take to contribute to reducing emissions from the agricultural sector
Successes of research, technologies, programmes and policies
There are many successes in the Irish scenario that are relevant to identifying potential emissions savings, and in identifying policy drivers and behaviour change which would lead to improved breeding for reduced emissions.
- The NGP is a useable database of genotyped methane information available for farmers to use. This is the result of comprehensive research programmes, collaboration between breed societies, and creating useful systems for farmers to benefit from. Making this data easily available to all farmers across Ireland can encourage behaviour change and is a successful programme that could be considered in Scotland. The creation of the ICBF has been essential for this, as it means there is one body overseeing all genotyping and data storage.
- The BDGP is an example of how payments to farmers can be used to gather data and reward farmers for adopting positive practices.
- Research from GREENBREED indicates that breeding programs to reduce methane emissions will be effective for selecting low-emitting livestock, especially combined with the national genomic evaluations, and will have no negative impact on performance and profitability.
- Ireland has produced methane evaluations to enable farmers to identify opportunities to reduce emissions and improve the sustainability of their enterprise.
- Overall, the authors did not find evidence of a quantifiable impact from introducing methane related actions and policies. This may be because the relevant research, programmes and technologies as mentioned above are still relatively new and it is too early to quantify. For example, the NGP is to only be completed by 2027, whereas following on from data collected from methane evaluations, methods are still being developed on how best to incorporate methane traits into beef and dairy production.
Challenges of research, technologies, programmes and policies
Additional research would be required to understand how the policies and programmes were received by farmers and how successful the agricultural community views them to be. We contacted Ireland representatives for involvement in stakeholder interviews however we did not get a response.
Relevance to Scotland
There are some key learnings from Ireland that are relevant for Scotland in terms of identifying potential emissions savings, and in identifying policy drivers and behaviour change for improved breeding for reduced emissions.
- A national database was suggested by Scottish stakeholders (Stakeholder comment, 2023). Therefore, Ireland’s NGP provides an example for Scotland if this was to develop. In particular:
- The use of metrics like Residual methane emissions (RME) index and
predicted transmitting ability (PTA) could give Scottish farmers and crofters an easy way of comparing their livestock to other farmers and understanding where they are compared to the average.
- Challenges in the Scottish context could include reluctance on the part of different breed societies to pool data.
- Ireland have shown that emissions for cattle can be reduced through appropriate breeding strategies and incentives for farmers. Such as subsidising DNA sampling of calves which helps to genotype the national herd.
- The creation of the Food Vision Beef and Sheep Group to chart a path for the sector to meet the emissions emission targets is a potential model for ways that Scotland might bring key stakeholders into the development of key policies to reduce emissions.
- The main ways behaviour change has been encouraged is by making the programmes and policies mentioned above easy to access, for example, the ICBF also provides information to help farmers make decisions about their herd through HerdPlus.
- The BDGP and CSP provides training to farmers who are using the scheme, for which funding is provided.
Appendix E: Methodology and results for the quantification of potential emission savings
Methane emission savings are achievable through breeding and new genomic technologies. The main sources of methane from cattle and sheep in Scotland are enteric fermentation and managed manures. We have chosen to focus our calculations on emissions from enteric fermentation for two reasons:
- Methane emissions from managed manures are much smaller.
- Changes to livestock by selecting traits which lead to lower methane emissions will have a greater impact on the emissions from enteric fermentation rather than the emissions produced from livestock manures.
To align with the CCP’s targets, of achieving net zero in Scotland by 2045 and a 75% reduction in emissions by 2030, we present data for potential emission reductions for 2030 and 2045. The following data were used to quantify the potential emission savings:
- Key traits leading to reduced methane emissions, from the REA.
- Methane reduction values associated with traits, from the REA.
- Note: A particular challenge was identifying emission reduction values that were associated with specific traits, that we could use in our calculations. We have used the data available to draw conclusions.
- Baseline emissions data for Scotland from the National Atmospheric Emissions Inventory (NAEI, 2023).
- Uptake values (sector specific) for adoption of chosen traits through breeding, based on findings in the REA, stakeholder interviews and expert judgement.
Baseline methane emissions
To calculate the baseline methane emissions for dairy, beef and sheep, the enteric fermentation emissions of the livestock types for Scotland in 2021 were extracted from the NAEI (2023)[11].
Current uptake rate for adoption of traits
The current uptake rate is an estimated current baseline based on evidence gathered in the REA review of evidence and technical knowledge. This provides a baseline for additional uptake under the scenarios presented below.
Current uptake is set at 75% for dairy cattle, due to the high usage of reproductive technologies (see Section 4.1.3), in particular use of sexed semen and artificial insemination (AI) using Holstein Friesian semen, a key breed which already has proven methane efficiency ratings published as part of the breeding profile. It is understood that methane efficiency ratings are also being developed for other key dairy breeds as observed on UK dairy and beef cattle semen sales websites.
Beef cattle uptake has been set at a 40% baseline as findings show that methane efficiency ratings are less regularly published as part of the beef breed profile on UK semen sales websites. However, artificial insemination of beef cattle is relatively common, although it is not a standard practice as in the dairy industry. It is understood adoption of breeding for reduced emissions is developing and evidence is being gathered (see Section 4).
The current baseline for sheep has been set at 10% based on a comparison with New Zealand where there is an uptake rate of 30% (Rowe et al. in 2020). Following discussions with Scottish Government it is acknowledged that there is some technology usage around the world, but that adoption in Scotland is not yet as high as in New Zealand. Therefore, 10% has been chosen as the baseline. This links to understanding of technology uptake in Section 4.
Scenarios
The quantification of emissions savings was based on four different scenarios to reflect various levels of uptake:
- The no intervention scenario reflects an increase in uptake of 5% from the current baseline by 2030 and remains at the same level until 2045 for all livestock types.
- The voluntary uptake scenario is designed to reflect levels of uptake expected with no other push such as a financial incentive or a relevant policy. This scenario reflects a 5% increase in uptake from the current baseline by 2030, and an additional 5% increase in uptake by 2045 for all livestock types.
- The supplier demand scenario is based on companies along the supply chain offering financial incentives to farmers that implement breeding techniques to reduce methane emissions. This value is set at a mid-point between the voluntary uptake and the regulatory scenario.
- The policy changes scenario represents the uptake where legislation has been introduced that will require farmers to introduce methane reducing breeding techniques to their herds. This scenario reflects a 10% increase in uptake from the current baseline by 2030. By 2045 it is assumed there would be 100% uptake for dairy cattle due to the large-scale usage of AI within the industry and progress seen on methane efficiency profiling already published within the key breed profile. It is assumed that beef cattle could reach 80% uptake by 2045, and sheep could reach a 60% uptake by 2045 under a regulatory scenario.
Scenario uptake values are presented for dairy, beef and sheep in Table 17.
Table 17. Scenario implementation values for dairy, beef and sheep
|
Type |
Scenario |
Current baseline |
Change from current baseline to 2030 |
2030 uptake |
Change from current baseline to 2045 |
2045 uptake |
|---|---|---|---|---|---|---|
|
Dairy |
1. No intervention |
75% |
5% |
80% |
5% |
80% |
|
2. Voluntary uptake |
75% |
5% |
80% |
10% |
85% | |
|
3. Supplier demand |
75% |
7.5% |
82.5% |
17.5% |
92.5% | |
|
4. Policy changes |
75% |
10% |
85% |
25% |
100% | |
|
Beef |
1. No intervention |
40% |
5% |
45% |
5% |
45% |
|
2. Voluntary uptake |
40% |
5% |
45% |
10% |
50% | |
|
3. Supplier demand |
40% |
7.5% |
47.5% |
25% |
65% | |
|
4. Policy changes |
40% |
10% |
50% |
40% |
80% | |
|
Sheep |
1. No intervention |
10% |
5% |
15% |
5% |
15% |
|
2. Voluntary uptake |
10% |
5% |
15% |
10% |
20% | |
|
3. Supplier demand |
10% |
7.5% |
17.5% |
30% |
40% | |
|
4. Policy changes |
10% |
10% |
20% |
50% |
60% |
Traits
Traits and technologies with a possible relationship with methane emissions and emission reductions were identified through a REA of relevant literature (see Section 4).
Traits identified were further reviewed to assess their applicability to emission reduction calculations. When assessing each trait to quantify the emissions savings, appropriate values were found to be scarce in the literature. There were two key reasons that led to studies and/or traits being excluded from use in this task:
- A significant portion of the literature did not present methane emission values and was instead looking at genetic correlations between traits. Therefore, literature that did not present methane emission values or change in methane emissions, either as absolute or relative values, were excluded.
- Often the changes in methane emission were comparative to a baseline that was not appropriate for our calculations focusing on methane emission from enteric fermentation. For example, papers excluded in our review presented changes to emissions from the entire lifecycle or system.
A summary of the traits, where appropriate values were obtained, are presented in Table 17 below.
Table 18. Traits identified with appropriate methane reduction values used in the calculations of emissions savings
|
Sector |
Trait Category |
Trait Name |
Unit of baseline |
Value of methane reduction from baseline |
|
Beef |
Production |
Feed efficiency |
kg CO2e/kg product |
7% |
|
Offspring carcass weight |
kgCO2e/per kg meat per breeding cow per year |
1.3% | ||
|
Climate |
Methane yield |
gCH4/kgDMI per generation |
12% | |
|
Dairy |
Production |
Feed efficiency |
kg CO2e/kg product |
5% |
|
Milk fat + protein |
MJ CH4/kg milk |
12% | ||
|
Milk yield |
kg CH4/kg milk |
15% | ||
|
Climate |
Methane intensity |
kg CH4/kg milk |
24% | |
|
Sheep |
Production |
Feed efficiency |
kg CO2e/kg product |
7% |
|
Climate |
Methane yield |
g CH4/kg DMI |
35% |
Feed efficiency
References: (Alford, A.R. et al. 2006; Worden, D. et al. 2020; Rowe, S.J. et al. 2021)
The ability of animals to optimally convert feed into liveweight with minimal losses of energy, meaning that animals with high feed efficiency consume less than their peers with equivalent liveweight and weight gain. This trait was identified across all three livestock types and has been highlighted by the stakeholders and the literature as a key trait for emission reductions (see Section 4).
Methane focused climate traits
References: (Quinton, C.D. et al. 2018; De Haas, Y. et al. 2021; Jonker, A. et al. 2018)
Methane traits are likely to have the greatest impact on methane emissions. Here the methane related traits were focused on manipulating the gut microbiome and selecting for animals with certain microbial populations that led to lower methane emissions. While methane traits were identified for all three livestock types, they were presented differently across the literature.
Offspring carcass weight – Specific to beef cattle
References: (Martínez-Álvaro, M. et al., 2022)
Focus on offspring carcass weight in beef cattle reduces methane emissions through increased quantity of product per animal, therefore reducing the number of animals required to produce the same amount of beef product.
Milk yield and Milk fat and protein – Specific to dairy cattle
References: (Bell, M.J. et al. 2010)
Traits reduce methane emissions per kg of milk while maintaining production levels and quality.
Emissions reduction
To calculate the emission reduction of different traits under the different scenarios the following formula is used:
Where:
= Emissions savings (kt CH4 for the livestock type)
= Baseline emissions (kt CH4 for the livestock type)
= Uptake (U) for the projected year (y)
= Emission reduction coefficient (%)
This formula calculates a percentage of emissions based on emissions reduction potential and uptake rate and subtracts this portion from baseline emissions. The result is an estimate of methane emissions if the reduction potential and uptake for the trait is achieved. The savings were then calculated by subtracting the estimated emissions from the baseline emissions, and both were calculated in units of percentage of baseline and absolute values (kt CO2e). This calculation was completed for each trait found in beef, dairy, and sheep sectors, for the years 2030 and 2045.
Limitations in the data:
- All traits have been presented separately as the interaction between traits and the impact this would have on emission reductions is unknown.
- It is acknowledged that traits found within the literature are presented in different units (see Table 7). Traits selected from the literature also presented a percentage change which was used within the change calculations. The percentage change has been applied to total emissions from the relevant livestock sector due to limited data on specific emissions related to more specific production categories such as CH4 emissions per kg milk produced.
- Methane efficiency focused traits have shown to have the greatest methane reduction potential for all three livestock types. However, it is noted that there was less literature available on this subject compared to feed efficiency. Due to the smaller quantity of literature available the reduction potential values selected for methane efficiency could be less robust. Greater consistency in measurement, modelling, and presentation of methane efficiency traits and their impacts on emissions savings and animal performance production could be useful research to fill this knowledge gap.
- Traits reduction factors compiled within the review were presented in different units, however, all presented a percentage reduction. It has been assumed that the percentage reduction would be applicable to be used as a reduction factor as this would have a direct impact on methane reductions independent of the unit the factor was recorded in.
- Limited data was provided within the literature reviewed on the length of time until each trait reaches maximum potential within the population. However, it is assumed that once the trait has been bred into the total population there will be no additional improvements unless new breeding traits are selected. Within the calculations we have assumed that traits will account for their maximum potential to the selected population at the assessment point (i.e., in 2030 100% of the trait will apply to the current baseline uptake with the additional percentage uptake).
- There is the possibility that, due to the nature of genetics, when selecting for certain traits, that they will not fully spread throughout the entire population where the trait is applied. This is a complicated process, and it has been assumed that at each assessment point (2030 and 2045) each trait has reached maximum spread in the portion of the population that has taken up the measure (i.e., in 2030 100% of the trait will apply to the current baseline uptake with the additional percentage uptake).
Results
Figures 4-7 show that in each sector, up to 2030, the reductions are relatively steady, but there is a greater reduction at 2045, influenced by the proposed increase in uptake. Due to the proposed uptake percentages the policy change scenario presents the greatest reduction under all traits, with the no intervention scenario showing the smallest reduction due to a 5% increase in uptake in 2030 and no further uptake in 2045.
Figure 4 presents the methane emissions under the four scenarios for the three traits selected for beef cattle: feed efficiency, offspring carcass weight and methane production. The methane production focused trait has the largest emission reduction (reduction of 161.1 kt CO2e in 2045 under the policy changes scenario), whereas the offspring carcass weight focused trait has the smallest impact at less than 12.4 kt CO2e reduced by 2045 under the maximum reduction scenario.
In correlation with beef trait reductions, methane intensity traits have the largest reduction to methane emissions in dairy cattle, with a reduction of 35.4 kt CO2e observed under the policy change scenario by 2045, as presented in Figure 5. While breeding for methane reductions through feed efficiency has the least change at 7.4 kt CO2e reduced by 2045, this could be due to the work already completed on feed efficiency breeding within dairy. Traits focused on milk fat and protein and milk yield provide similar reduction level levels, however there is the potential for overlapping improvements with feed efficiency as breeding focused on improvements to milk production traits could also link to improvements to feed efficiency.
Reduction potential for sheep is presented in Figure 6 for the two selected traits: feed efficiency and methane yield. As with the cattle categories, the trait focused on methane improvements (methane yield) had the largest potential reduction at 185.6 kt CO2e reduced by 2045 under the policy change scenario, whilst feed efficiency traits saw a smaller reduction of 37.1 kt CO2e by 2045 under the policy change scenario.
Figure 4. Methane emissions for beef cattle traits against the 2021 baseline enteric methane emissions of beef cattle in Scotland. Please note the y-axes do not start at zero to allow for greater visibility of results.

Figure 5. Methane emissions for dairy traits against the 2021 baseline enteric emissions of dairy cattle in Scotland. Please note the y-axes do not start at zero to allow for greater visibility of results.

Figure 6. Methane emissions for sheep traits against the 2021 baseline enteric emissions of sheep in Scotland. Please note the y-axes do not start at zero to allow for greater visibility of results.

Figure 7 presents the methane emissions by 2045 under all scenarios for all traits for each livestock type. The difference in total enteric fermentation emissions for each livestock type can be seen by the dotted baseline line. Beef cattle emitted the majority of the methane from enteric fermentation in Scotland in 2021, with sheep emissions being less than half those of beef cattle, and dairy under a quarter those of beef cattle.
Figure 7. Methane emissions for all livestock for all traits presented against baseline enteric emissions of beef, dairy and sheep in Scotland.

How to cite this publication:
Jenkins, B., Herold, L., de Mendonça, M., Loughnan, H., Willcocks, J., David, T., Ginns, B., Rock, L., Wilshire, J., Avis, K (2024) ‘Breeding for reduced methane emissions in livestock’, ClimateXChange. http://dx.doi.org/10.7488/era/5569
© The University of Edinburgh, 2024
Prepared by Ricardo PLC on behalf of ClimateXChange, The University of Edinburgh. All rights reserved.
While every effort is made to ensure the information in this report is accurate, no legal responsibility is accepted for any errors, omissions or misleading statements. The views expressed represent those of the author(s), and do not necessarily represent those of the host institutions or funders.
ClimateXChange
Edinburgh Climate Change Institute
High School Yards
Edinburgh EH1 1LZ
+44 (0) 131 651 4783
See methodology in Appendix A, section 9.1 ↑
DNA contains the information required to create the entire organism, a unit of DNA containing specific information to create a protein or set of proteins is referred to as a gene. It is these proteins which make up the body and control chemical reactions between cells. the study of genes is referred to as genetics. ↑
The productive lifespan of livestock. For beef and dairy – a longer productive lifetime would reduce the number of replacement heifers needed to maintain a constant herd size. For sheep – the longer ewes can produce lambs, production efficiency improves. ↑
The number of lambs born per number of ewes mated, expressed as a percentage. ↑
For beef and dairy – less feed is used for the same output of product and less loss of energy to methane (kg CO2e/kg product). For sheep – this is CO2e but as far as can be told it is only methane in this value. Less feed is used for the same output of product and less loss of energy to methane (kg CO2e/kg product). ↑
The number of kilograms gained by the animal per day, measured in kg/day. ↑
Overall production of the animal (including feed efficiency), supporting the animal to reach its full genetic potential and ensuring it reaches the highest possible level of performance. ↑
ME is expressed as a Relative Breeding Value (RBV) with a mean score of 100 and a standard deviation (how much a point differs from the average), of five. A score below 100 indicates below average and a score above 100 indicates above average. A higher RBV indicates a higher methane reduction potential. ↑
The amount of methane produced per unit of milk or sheepmeat produced (kg CH4/kg milk/sheepmeat). ↑
RME is the difference between the expected methane emissions from an animal based on its size and feed intake, compared to what it actually produces. High RME is undesirable and low RME is desirable. ↑
© Crown 2024 copyright Defra & BEIS via naei.beis.gov.uk, licenced under the Open Government Licence (OGL). ↑
Research completed: January 2025
DOI: http://dx.doi.org/10.7488/era/5399
Executive summary
Aims
Achieving Scotland’s net zero goals by 2045 will require significant expansion of the renewable energy workforce. This is especially true in the rapidly growing onshore wind and solar energy sectors. Forecasts indicate a dramatic increase in workforce demands by 2030. This emphasises the need for enhanced, well-aligned training programmes to develop a skilled labour pool.
This study assesses the current training provision for the onshore wind and solar energy sectors in Scotland, identifying gaps, barriers and opportunities for improvement. It analyses existing programmes and their alignment with industry needs, exploring future workforce demands and strategies to address skills shortages.
Findings
We conducted desk research, data analysis and stakeholder consultations. The skills needed in the solar and onshore wind sectors can be divided into sector-specific, allied STEM (from broader disciplines such as mechanical and electrical engineering) and other skills (Figure 2). Although some critical training provision is needed for solar and onshore wind separately, the majority of roles are shared by the sectors requiring allied STEM and other skills. Siloed approaches for skills governance in solar and onshore wind could be counterproductive as the sectors compete for many of the same skillsets.

Figure 1. Conceptual framework of skill types relevant to solar and onshore wind industries.
We found that:
- There is a strong breadth of allied STEM training provision in Scotland, with skills that are highly sought across multiple sectors. A siloed approach to STEM workforce planning is a threat, as several industries draw from the same talent pool. Stakeholders highlighted poor visibility of careers, as well as low job attractiveness, as major barriers to the development of solar and onshore wind sectors at the accelerated pace required.
- There is a shortage of specialised training provision providing essential skills for the construction and operational phases of solar and onshore wind projects. The solar sector, in particular, suffers from a lack of training specific to large-scale or ground-mounted solar installations.
- The majority of targeted training provision relevant to solar and onshore wind sectors is largely theory-based, with insufficient emphasis on practical, hands-on experience. Industry leaders are concerned that graduates often lack real-world skills and are not “work-ready” upon entering the workforce. Practical training opportunities, such as industry partnerships and on-site apprenticeships, are limited.
- Funding constraints are a significant barrier to the expansion and modernisation of training programmes. High-cost courses, such as those involving high-voltage systems and specialised certifications, require substantial investment in equipment and facilities. Many colleges and training providers struggle to secure adequate resources to enhance the training delivery.
- Industry uncertainty, driven by a lack of clear and stable policy directives, complicates long-term planning for workforce development. Industry is hesitant to invest in apprenticeships and workforce training without concrete indications of project pipelines and future market stability.
- The competition for technically skilled workers is fierce across various industries. Renewable energy companies compete among themselves and with other sectors for these workers. This high level of competition complicates talent acquisition and retention.
Lessons learnt
The content and delivery principles of training programmes needs to be updated to better equip trainees with practical, hands-on experience. Deeper collaborations between industry stakeholders and educational institutions would ensure curricula content is relevant and meets current and future sector needs. Educational institutions and training providers should integrate work-based learning modules, internships and apprenticeship opportunities into their curricula. Modular and more flexible courses as a core mechanism for training delivery would facilitate targeted, intensive upskilling or reskilling. Such flexibility would enable faster and more efficient transitions into the workforce.
There is a pressing need for increased and targeted funding to support technical training programmes to enable these updates.
To attract and retain a skilled workforce, the onshore wind and solar sectors must become more visible and appealing to job seekers. Development of career pathway maps would illustrate how individuals can progress from entry-level roles to senior positions. This would provide a clearer picture of the long-term opportunities available in the sector, making it more attractive to potential recruits.
An integrated perspective is necessary to consider the requirement for a STEM workforce across all infrastructure projects of national importance and overall installed capacity ambitions. A comprehensive map that details the scale, timelines and workforce demands of major infrastructure projects has the potential to inform the total scale of skilled workforce needs, including for the onshore wind and solar sectors.
Next steps
Effective workforce development will require close collaboration between government, industry and educational institutions, and workforce representative groups. A coordinated approach will ensure that training programmes are aligned with sector demands. To address the workforce and training challenges outlined in this report, a detailed, comprehensive action plan should be developed. This plan should include timelines, assigned responsibilities, and measurable outcomes to ensure progress is tracked and accountability is maintained.
With workforce demand projected to peak by 2027, the action plan must be implemented swiftly. Initiatives should be launched before the start of the 2025/2026 academic year to allow training providers time to adapt and scale. This proactive approach will enable the industry to meet pressing needs and support for the Scottish Government to deliver its renewable energy commitments.
Glossary / Abbreviations table
|
CESAP |
Climate Emergency Skills Action Plan |
|
ESP |
Energy Skills Partnership |
|
FPE |
Full person equivalents – a standardised unit that quantifies the number of people enrolled in a course |
|
FTE |
Full time equivalents – a standardised unit that quantifies workload equivalence to full-time hours |
|
GWO |
Global Wind Organisation |
|
NESA |
National Energy Skills Accelerator |
|
NESCoL |
North-East Scotland College |
|
NOS |
National Occupational Standards |
|
OPITO |
Offshore Petroleum Industry Training Organisation |
|
SCGJ |
Skills Council for Green Jobs |
|
STEM |
Science, technology, engineering, and mathematics |
|
UHI |
University of Highlands and Islands |
Introduction
Scale of skills demands in solar and onshore wind
The achievement of Scotland’s net-zero commitment by 2045 relies heavily on expanding the renewable energy sector, including the onshore wind and solar energy sectors. Both the wind and solar sectors are expanding rapidly, creating an urgent need to train a larger skilled workforce. Two recent studies published by the ClimateXChange have estimated the workforce needs for both these sectors.
In the onshore wind sector, the workforce could need to increase from around 6,900 full-time equivalent (FTE) jobs in 2024 to an estimated around 20,500 FTEs by 2027 (Morrison, et al., 2024). Most of these new jobs will focus on constructing and installing wind farms. Key areas such as the Highlands and Dumfries and Galloway will need a large share of the workforce, but recruitment challenges already exist in these regions. Critical skills shortages include high-voltage engineers and wind turbine technicians. If these gaps are not filled, it could slow down the sector’s growth and reduce its economic and environmental benefits.
The solar sector faces similar challenges. Its workforce could need to grow from around 800 FTEs in 2023 to an estimated over 11,000 by 2030, with over 80% of these roles estimated to be related to construction, especially for large ground-mounted solar projects (Creamer et al, 2024). Solar projects will require key tradespeople, such as electricians, grid connection engineers, and high-voltage technicians. Many of the large solar installations will be in rural parts of Scotland, which makes workforce distribution a challenge.
Both sectors already have skilled workers, but they must attract and train more people to meet their installed capacity ambitions. While current training programmes can address some of these needs, there is a clear requirement to upskill and reskill workers from other sectors. Previous research (Morrison et al, 2024; Creamer et al, 2024) has shown that a large part of the additional workforce required for solar and onshore wind sectors will require education at Higher National Certificate, Higher National Diploma and degree levels. Furthermore, the industry strongly prefers trainees who have real-world experience in these sectors. As such, apprenticeships are expected to play a significant role in the delivery of the future skilled workforce.
Based on the findings of these studies, we argue that the timelines for intervention towards increased training provision are urgent. To illustrate, the onshore wind sector forecasts a peak of workforce demand as early as 2027, leaving only two academic years for intervention and subsequent training to be delivered.
This follow-on study focuses on the analysis of the existing and planned training provision, profiling its alignment with the industry needs, and exploring potential avenues for optimisation of training provision based on insights from sector stakeholders.
Conceptualisation of relevant training provision
The skills needed in the solar and onshore wind sectors can be divided into sector-specific, allied STEM, and other skills (Figure 2).
Sector-specific skills focus on the installation, maintenance, and safe operation of the unique infrastructure in each sector. For example, solar projects require expertise in setting up and maintaining solar panels, while wind projects demand skills in handling large wind turbines, often in challenging environments such as working at heights. Health and safety knowledge is critical in both sectors, as they each present different risks—solar work involves concerns like heat stress, while wind energy can involve working at height and operation of heavy equipment. Additionally, site design in both sectors requires highly specialised skills. Wind projects, for example, need knowledge of geology and land use to optimise turbine placement, whereas solar projects focus on efficient land use for arrays.
More detail on sector-specific skills and job roles can be found in the ClimateXChange publications by Creamer et al (2024) and Morrison et al (2024) (solar and onshore wind, respectively). These skills are often acquired through the apprenticeship routes, as well as first degrees and private training provision programmes.
Allied STEM skills include those adapted from broader disciplines such as civil, structural, mechanical and electrical engineering. These disciplines are essential for building and connecting renewable energy infrastructure to the grid. Engineers play a vital role in constructing foundations for wind turbines or solar supports and managing and balancing electrical systems. Further, skills from environmental sciences and logistics help ensure that projects comply with environmental regulations and manage supply chains effectively. Similar to sector-specific skills, allied STEM skills are acquired through apprenticeships, as well as first degrees and postgraduate training.
In addition to technical skills, other skills, such as finance, planning, and management expertise are critical for the success of renewable energy projects. These professionals may not have hands-on involvement in infrastructure development but are key in overseeing projects, securing funding, navigating regulations, and managing teams. Understanding the specifics of solar and wind energy is essential in these roles, as managers and leaders must handle complex projects, from permitting and financing to project delivery. These skills are a combination of theoretical sector understanding that could be achieved, for example, through first degree or postgraduate specialisation, in addition to extensive work experience in the sector. Albeit these skills are not the main focus of the current study, it is important to acknowledge their involvement in the sectoral skills ecosystem, and in particular in context of their position in career pathways for mid-career and senior professionals.
This report uses the framework outlined in Figure 2 for a comprehensive discussion of training provision that enables solar and onshore wind industries. This is in alignment with the precursor studies, which identified that the highest skilled workforce demands are likely to be within the allied sectors. This report discusses solar, onshore wind, and allied STEM skills training provision in parallel, as the skills needs across solar and onshore wind sectors have high levels of convergence. Any differences between the sectors are highlighted in the text and summarised in the Conclusions.

Figure 2. Conceptual framework of skill types relevant to solar and onshore wind industries.
Methodology
We carried out extensive desk based research, reviewing national and international policies and initiatives related to training provision for solar and onshore wind sectors and the renewable energy sector overall. This included the review of the precursor studies, literature regarding the EU Pact of Skills, International Energy Agency reports, and others.
Following this, we conducted a comprehensive landscape analysis of training provision in Scotland for solar, onshore wind, and other relevant STEM sectors. This process included profiling all training providers in Scotland’s higher and further education institutions, gathering course names and qualifications offered, and analysing course content to understand the themes and topics. We also mapped the geographic distribution of training provision sites to visualise the regional availability of skills provision.
To understand how the training provision aligns with industry needs, we reviewed national occupational standards (NOS) and explored future training initiatives. Additionally, we extracted and analysed student enrolment data from the Scottish Funding Council (SFC) to assess the number of students enrolled in relevant STEM disciplines and compared this with solar and onshore wind workforce demand forecasts from previous studies.
Our stakeholder engagement programme involved consulting a broad range of participants, including those from policy, training providers, supporting organisations, industry, and the supply chain (21 participants) between July and September 2024. Through semi-structured one-to-one interviews via Microsoft Teams, we gathered insights on how current policies affect training provision, the competition for talent, and talent retention. We also explored stakeholders’ views on the barriers and motivations individuals face when pursuing careers in solar and onshore wind sectors. These discussions helped us identify potential actions to address current and future skills gaps, as well as suggestions for improving the targeting, timing, and enhancement of training provisions. A complete list of the organisations we consulted is included in Appendix A.
Key relevant training provision policy and initiatives
Scotland
Policy activity
In Scottish national policy, onshore wind and solar sectors are covered under the umbrella of green jobs / skills and renewables. Scotland’s National Strategy for Economic Transformation (The Scottish Government, 2022) places significant emphasis on building a skilled workforce to drive future economic prosperity. This publication outlines, in general terms, that the skills related to the net zero transition, including renewable energy, will be critical. It emphasises lifelong learning mechanisms such as continuous reskilling and upskilling as key to adapting to fast-paced technological changes. The Climate Emergency Skills Action Plan (CESAP) (Skills Development Scotland, 2020) is a document that outlines key initiatives to equip Scotland’s workforce for the transition to a net zero economy. The Green Jobs Workforce Academy was launched as a service aimed to help the workforce with training, upskilling, and job seeking in the emerging green sectors. The National Transition Training Fund (NTTF) was introduced in 2020 as a direct response to the economic impact of the Covid-19 pandemic. In its second and final year, the fund’s scope expanded and included a more significant emphasis on supporting individuals and employers in the transition to net zero. This followed a commitment within CESAP. Further, CESAP’s original publication indicated the ambition to launch the Green Jobs Skills Hub to provide insights into the skills needed over the next 25 years, working with businesses and educational institutions to ensure training aligns with the demand for green jobs
Additionally, CESAP indicates that sector-specific initiatives, such as the Energy Skills Alliance (now led by the Offshore Petroleum Industry Training Organisation OPITO) and Offshore Wind Skills Group, will map out skills requirements in renewable energy, such as hydrogen production and carbon capture. At a policy level, there is no equivalent regionally targeted working group aimed at solar or onshore wind.
CESAP set an ambition to work with educational institutions to realign curricula with industry needs and offer work-based learning to ensure individuals acquire the skills needed for Scotland’s green economy. Much of this work was carried out through Pathfinder activity under the remit of the Skills Alignment Assurance Group, now Shared Outcomes Assurance Group of the Scottish Government. Lastly, CESAP indicates that a place-based approach will target regional needs, with agencies like Highlands and Islands Enterprise leading efforts in rural areas to promote green job opportunities.
The CESAP Pathfinder Work Package 1 (Skills Development Scotland, 2023) aimed to understand the demand for skills driven by the transition to net zero and to map existing skills provision across apprenticeships, further education, higher education, upskilling, and reskilling. The report revealed that 27% (32,300) of college enrolments are in courses aligned with CESAP sectors. Additionally, around 16% of Scottish university graduates were working in a CESAP sector 15 months after graduation. In terms of apprenticeships, 29% (7,400) of Modern Apprenticeship (MA) starts and 38% (400) of Graduate Apprenticeship (GA) starts were in sectors aligned with CESAP. However, CESAP WP1 report indicates that there is evidence of leakage from this potential skills supply pipeline. Of the university graduates who entered a CESAP sector as their first destination, about 40% took jobs outside of Scotland. CESAP WP1 also highlighted the gap in knowledge of the future destinations of college students.
Future training provision initiatives in Scotland
Stakeholders across Scotland are engaging in a range of initiatives towards optimising future training provision for the whole renewables sector, many of which are targeted at offshore wind. We note that offshore wind skills are often directly applicable to onshore wind, and these are reviewed below. The Scottish Government, as part of its NSET strategy, prioritises a “Skilled Workforce” with a focus on future skills needs, including the net zero transition.
OPITO has introduced credit-rated qualifications in Hydrogen, Oil and Gas, and Wind Power to enhance workforce mobility across sectors. The Energy Skills Partnership (funded by Scottish Funding Council) supports key technical skills across Scotland’s colleges through various Training Networks. National Energy Skills Accelerator (NESA) has secured £1 million from the Just Transition Fund to pilot training programmes, including Performing Engineering Operations – Renewables, Electrical Systems for Renewable Energy, Project Management Fundamentals, and Energy Data Management.
Hosted by the North East Scotland College (NESCol) and funded by the Just Transition Fund, Energy Transition Zone/NESA is also developing an Energy Transition Skills Hub, which will include demonstration and teaching facilities for energy transition technologies and a state-of-the-art welding and fabrication academy. The Engineering Construction Industry Training Board has launched Energy Scholarships to address workforce shortages in roles such as Wind Transfer Technician and Energy Transfer Technician, with trainees receiving training in core engineering skills, new technologies, and digital competencies. RenewableUK and Energy & Utility Skills have partnered to create training and assessment standards for the UK’s renewable energy workforce, including national occupational standards (discussed below) and apprenticeship frameworks.
UK
In July 2024, the UK Government announced a mission to increase onshore wind development. This was marked by the launch of the Onshore Wind Industry Taskforce (UK Government, 2024). One of their key working groups is specifically focused on supply chains, skills and the workforce. The Taskforce will run for up to 6 months and culminate in the publication of a final report, setting out their commitments, and transition into the delivery body.
In May 2023, the UK Government launched the Solar Taskforce (UK Government, 2023) with terms of reference including skills governance for the solar sector. A ‘Draft Solar Roadmap’ was last discussed in the taskforce meeting in March 2024, and the final publication is pending.
European Union
In the European Union (EU), achieving the REPowerEU targets across all renewables sectors is predicted to create over 3.5 million jobs by 2030. In response to this rapid increase in STEM workforce demands, the EU has launched several initiatives to develop a skilled workforce for the renewable energy sector.
One of the flagship efforts as a part of the European Skills Agenda is the Pact for Skills (European Commission, 2020), aimed at upskilling and reskilling the workforce in various industries. One of the themes of the Pact of Skills is the Renewable Energy Ecosystem. This ecosystem is a series of strategic partnerships between the industry and policymakers to ensure sectoral cooperation for the development of skilled workforce in sufficient numbers. Examples of partnerships include Renewable Energy Skills Partnership, Large-Scale Partnership on the Digitalisation of the Energy Value Chain, and Skills Partnership for Offshore Renewable Energy. These initiatives are supported through consistent and sustained funding mechanisms such as Horizon Europe and Erasmus+ funding programmes. This capacity building is strengthened through international cooperation, facilitating the exchange of best practices and expertise, and harmonisation activities in training content.
Another relevant EU policy initiative is the BUILD UP Skills programme (European Climate Infrastructure and Environment Executive Agency, 2011), which has been active since 2011 and focuses on increasing skills in the construction sector, particularly for energy efficiency and renewable technologies. It provides national roadmaps to tackle skills shortages and works through EU funding programmes like Horizon 2020 and LIFE CET to support training for green energy jobs. This highlights that the EU is taking a broad approach to renewable energy workforce development and recognises the allied STEM skills role in it.
Overall, while these strategies aim to effectively transition workers and communities to renewable energy sectors, their success can be difficult to measure as the energy transition is ongoing. The long-term impact of workforce transition and reskilling is yet to be seen.
In addition to the skills governance, broader economic conditions, like market fluctuations and supply chain disruptions, also affect outcomes. The transition’s success ultimately relies on sustained political will, consistent funding, and strong collaboration among governments, industry, and communities.
Review of existing training provision
Targeted training programmes
List of targeted training provision
To identify targeted training provision that is relevant to solar and onshore wind sectors, we profiled course lists available on the websites of training providers (Scotland-based universities and colleges) and collated a list of courses that include renewable energy (general), wind, or solar in their title or public description. For private training provision, we carried out a Google search using keywords such as “Scotland solar PV training courses” and “Scotland onshore wind training courses” and profiled course lists available through private providers (remote training options were excluded from the analysis).
Our analysis of training provision identified a total of 57 courses relevant to solar and onshore wind sectors in Scottish colleges and universities being delivered in 2024/2025. We analysed the course content available in the public description on training providers’ websites and found:
- 23 courses that include content on renewable energy and energy systems (without specifying wind (onshore and offshore) or solar in the public description)
- 11 courses that include wind (onshore and offshore)- and solar-themed modules
- 5 courses that include solar-specific modules
- 18 courses that include wind-specific modules (onshore and offshore).
Figure 3 illustrates the levels of qualifications offered by the identified relevant courses. This data shows that most solar and wind sector courses are at postgraduate level specialism (25 total). This is in comparison to only 8 courses at the first-degree level, and two courses at SCQF L4. The highest number of targeted skills provision courses were hosted at the University of Strathclyde (10) and NESCol (7). The full list of courses identified as directly relevant to solar and onshore wind sectors is included in Appendix B.
Figure 3. Levels of qualifications of courses targeted to solar and onshore wind sectors available through Scottish public education providers.
We note that the numbers outlined above are a high-level estimation of training provision for solar and wind. Other courses, particularly at BEng and BSc levels in electrical engineering and other allied sectors, might include further content relevant to solar and onshore wind. This analysis, therefore, focuses on courses where solar and/or onshore wind forms the major component of the course content.
In addition to training provision available through Scottish colleges and universities, we identified 110 short courses available through private training providers:
- Solar: 5
- Wind: 105 (specialist skill training, Global Wind Organisation (GWO) basic safety courses and other safety certifications).
These short courses are typically 1-6 days in duration and include certifications that are critical for safe working on solar and wind sites, as well as highly specialist technical skills and use of highly specialised equipment. The full list of identified relevant course private provision is included in Appendix B, Table 2.
Thematic analysis of course content
We reviewed publicly available information on the contents of college and university courses identified as directly relevant to onshore wind and solar sectors and identified nine key thematic trends. All module names and themes are extracted from STEM course descriptions.
Theme 1: Fundamental engineering and electrical principles.
Module titles: Engineering Mathematics; Electrical & Mechanical Systems; Thermodynamics and Fluids; Electrical Engineering Principles; Core Maths; Electrical Systems; Fluid Mechanics & Thermodynamics.
Description: These modules provide the foundational engineering knowledge crucial for understanding and applying more advanced concepts in renewable energy. Mastery of these basic principles is essential for anyone entering the energy sector, as they underpin much of the work in system design, operation, and maintenance.
Theme 2: Renewable energy technologies and systems.
Module titles: Wind Turbine Technology; Solar Energy Systems; Marine and Wind Energy; Energy Conversion and Storage; Renewable Energy Integration to Grid; Wind, Solar, Hydro, and Marine Electricity Generation; Future Energy; Renewable Energy Technologies.
Description: This theme includes modules that focus on specific renewable energy technologies and systems. Students learn the principles, operations, and applications of various renewable energy sources, including wind and solar, as well as hydro, geothermal, and marine energy. These courses are most directly applicable to the onshore wind and solar sectors.
Theme 3: Power systems and grid integration.
Module titles: Electrical Power Systems; Power Electronics for Energy & Drive Control; High Voltage Technology & Electromagnetic Compatibility; Distributed Energy Resources and Smart Grids; Renewable Energy Integration to Grid; Power Systems Engineering and Economics; Power System Design, Operation & Protection.
Description: Modules under this theme cover the complexities of integrating renewable energy sources into existing power grids. Students are taught the technical and economic aspects of power systems, including high-voltage technology, power electronics, and grid management. This knowledge is essential for ensuring that renewable energy can be effectively and efficiently incorporated into the larger energy infrastructure.
Theme 4: Practical skills and hands-on experience.
Module titles: Assembling and Testing Fluid Power Systems; Operation and Maintenance of Wind Turbine Systems; Basic Hydraulics.
Description: Practical experience is a critical aspect of training in the renewable energy sector. These modules focus on hands-on learning, where students gain direct experience with the operation, maintenance, and troubleshooting of renewable energy systems. This practical knowledge is crucial for developing the skills needed to work effectively in the field.
Theme 5: Health, safety, and industry-specific certifications and standards.
Module titles: Health and Safety Passport (CCNSG); GWO BTT Course (Electrical, Mechanical, Hydraulics); ECITB Mechanical Joint Integrity Training; Solar and energy storage system design and installation modules recognised by Microgeneration Certification Scheme (MCS).
Description: Industry-specific certifications and skills are vital for professionals in the renewable energy sector. This theme includes modules that provide the necessary certifications and specialized training required by the industry. These qualifications are crucial for meeting industry standards and ensuring that professionals are fully prepared for their roles.
Theme 6: Sustainable energy and environmental impact.
Module titles: Basic Evaluation of the Impact of Energy Generation on the Environment; Sustainable Energy Management; Environmental Impact Assessment.
Description: Modules in this theme explore the environmental aspects of energy production and the importance of sustainability. Students learn about the environmental impacts of different energy sources, strategies for sustainable energy management, and how to reduce emissions and pollution. These modules are critical for understanding the broader environmental implications of energy projects.
Theme 7: Project management and strategic planning.
Module titles: Strategic Technology Management; Stakeholder Management and Governance; Project Management.
Description: Effective management and strategic planning are crucial for the successful execution of renewable energy projects. These modules equip students in STEM courses with the skills needed to manage complex projects, plan strategically, and navigate the economic and regulatory landscapes. This theme prepares students for leadership roles within the industry.
Theme 8: Innovation and advanced technologies.
Module titles: Data Analytics & AI for Energy Systems; 3D Printing and Inventor Programmable Logic Controllers (PLCs); Advanced Control Engineering; Digital Signal Processing Principles; Renewable Technology Commercialisation
Description: Innovation drives progress in renewable energy, and this theme covers the latest technologies and methodologies that are transforming the industry. Courses in this category focus on advanced technologies like AI, IoT, and programmable logic controllers, which are crucial for developing new solutions and improving existing systems in the renewable energy sector.
Theme 9: Energy economics and sustainability policy.
Module titles: The Economics of Community Wealth Building; Net Zero Society; Transition to Net Zero; Understanding Sustainability Discourses; Energy Resources & Policy
Description: This theme covers the economic, policy, and sustainability aspects of the energy sector. Modules in this category focus on the financial and regulatory frameworks that influence renewable energy projects, as well as the broader societal impacts of transitioning to a net-zero economy. Understanding these factors is essential for anyone involved in the strategic planning and implementation of renewable energy projects.
Based on these desk research findings, we conclude that the overall scope of current training courses has the potential to equip trainees with a wide range of skills suitable for various roles in the solar and onshore wind sectors, from technical and practical positions to environmental and project management. The courses also cover important areas like health and safety, policy, economics, and innovation, providing a solid foundation of knowledge for these industries. Stakeholders expressed a difference in opinion on the suitability of the content of current training provision for the industry. This is discussed in detail in Section 8.1.
Training provision alignment with industry needs
National Occupational Standards
National Occupational Standards (NOS) describe the skills, knowledge and understanding required to undertake a particular job to a nationally (UK-wide) recognised level of competence. NOS are proposed, developed and updated in response to industry needs. The process is usually led by the relevant industry skills association, that works with employers and sector experts to collectively refine NOS through a process of consultation. The NOS are then approved by UK government regulators to ensure that they meet industry requirements. NOS are the foundation for vocational qualifications, including apprenticeships. Learners are assessed against NOS to ensure that they have achieved the necessary competencies to be employed in that occupational role.
NOS are grouped into business sectors. There are 22 NOS that are grouped in the wind turbine sector, although only two are specific to wind turbines. There are 16 that are grouped in the solar PV sector, all but two of which are specific to solar PV. These NOS are listed in Appendix C, Table 3. As of the time of the creation of this report, a review of the NOS is ongoing (Energy and Utility Skills, 2024).
Activity towards aligning curricula and industry needs
Based on intelligence received from industry, ESP previously created a Wind Training Network for the College sector. The Colleges were strategically located in areas where there was a demand for onshore wind turbine technicians. The network has grown from the original 3 colleges and now consists of 11 throughout Scotland to meet forecasted demands.
The curriculum content is co-created by colleges and industry and continues to evolve with direct industry input from companies such as Natural Power, that have sponsored wind turbine technician courses at Dumfries & Galloway College with direct routes to employment offered. This model is forecast to be rolled out to other areas where demand exists and can be duplicated and adapted by additional industry partners.
Colleges are collaborating with industry partners to deliver short technical courses for wind turbine technicians that include GWO BTT qualifications. The teaching materials are shared resources within the network and a collaborative approach to delivery is used. To date, the solar sector has not had the same level of interest, but as demand increases a similar college training network model can be implemented to increase capability and capacity to meet this growing demand, both strategically and sustainability. We note that there is minimal activity towards future training provision for the solar sector, especially in the context of large ground-mounted projects. One stakeholder noted that the minimal activity of ground-mounted projects in the planning pipeline has led to a lack of clear indication from the industry about its skills needs for these projects, making it challenging for training providers to respond.
Allied sector STEM skills provision
Overview
As illustrated in Figure 2, both onshore wind and solar sectors are further enabled by a skills base drawn from allied sectors. These skills are fundamentally rooted in non-energy-focused disciplines such as engineering (electrical, mechanical, civil, and structural), and applied disciplines such as construction, welding, electrical installation and others.
We have identified a total of 389 courses available through Scottish universities and colleges that are aligned with these topics (Figure 4). These courses are distinct from the courses identified in the section above. In this STEM training provision, we identified 10 Foundational Apprenticeships, 16 Modern Apprenticeships, 8 Graduate Apprenticeships and 14 pre-apprenticeship courses. Many of these apprenticeships are provided via the apprenticeship frameworks (listed in Appendix D). Additionally, apprenticeships are also available through private companies, and typically these would not be advertised through training providers’ course lists and websites.
Figure 4. The number of courses in the allied sectors relevant to solar and onshore wind per provider.
Thematic analysis
A thematic analysis of the course content reveals broad provision across core engineering disciplines, particularly in structural, mechanical, civil, and electrical engineering. Key areas such as structural mechanics, geotechnical engineering, fluid mechanics, thermodynamics, and power electronics demonstrate comprehensive training in fundamental engineering topics. The curricula also place significant emphasis on computational techniques, with modules such as computer-aided engineering design, mathematical modelling, and finite element analysis providing students with essential design and analysis skills.
Environmental and sustainability topics are well-represented, with courses such as environmental engineering, water resource management, and sustainability, reflecting the growing importance of sustainable practices in engineering. Some of the curricula further include emerging technologies, such as artificial intelligence, machine learning, and Internet-of-Things as interdisciplinary data science fields. Additionally, modules in project management, risk management, and engineering innovation and management offer robust professional skills development, preparing students for leadership roles in managing engineering projects.
However, there are potential gaps. Emerging technologies, such as artificial intelligence, machine learning, and Internet-of-Things generally remain under-represented. The curricula could also benefit from expanded coverage of specific renewable energy subsectors, including solar and onshore wind; the current course content only mentions “wind” three times and “solar” two times.
In summary, while the course content provides a strong foundation in traditional and modern engineering disciplines, there is room to enhance the curricula by incorporating more emerging technologies and renewable energy topics. This would better prepare students for the evolving challenges of the engineering profession. It would also encourage students from engineering backgrounds to further specialise in solar and onshore wind sectors, particularly considering the lack of targeted solar and onshore wind coverage at undergraduate levels.
Geographic distribution of training provision
Locations of training provision
Research shows that future onshore wind farm developments will be in remote and rural areas of Scotland such as the Highland and parts of Dumfries and Galloway, resulting in a sharp increase in skills requirements in these geographies (Morrison et al, 2024). In comparison, commercial rooftop solar projects in Scotland are mainly based around densely populated areas, including the central belt, Borders, Dumfries and Galloway, the east, north-east, and Inverness. Ground-mounted solar projects will be primarily situated in rural areas like Aberdeenshire, Angus, Fife, and Tayside (Creamer et al, 2024), where there is ample land for larger systems.
We have created a map that shows where the targeted training provision is available (Figure 5). Most of these locations are aligned with the locations of higher and further education institutions, and it has been supplemented with locations of the private training provision company sites. It shows that the training provision is located within the central belt of Scotland, as well as Aberdeen and Inverness. There is an obvious disparity between the locations of training providers and the geographic regions where the solar and onshore wind workforce will be in the highest demand.

Figure 5. Geographic locations of Scottish training providers (colleges, universities, and private companies) offering courses relevant to solar and onshore wind sectors.
Stakeholder commentary on the development of local talent
Attraction, development, and retention of local talent pools in remote and rural areas was highlighted as an area of high concern by 9 of 21 stakeholders. The Highlands, in particular, faces substantial challenges in attracting and retaining local talent and developing a skilled regional workforce. Two regional stakeholders expressed an opinion that the Highlands is an emerging industrial cluster and predicted a sharp increase in demand for technical talent. This is an area of concern because the region has a rapidly ageing population (Highlands and Islands Enterprise, 2019).
“We don’t actually have enough (…) people for all the jobs that are going to be available.”
The temporary nature of jobs in the construction stages of solar and onshore wind projects further exacerbates the issue with the development of local talent. Construction and commissioning stages of projects in solar and onshore wind industries are marked by a sharp increase in workforce requirement. However, this demand is temporary as the construction stage of project development takes 2-3 years and is seasonal. As such, the industry is heavily dependent on a mobile skilled workforce. One stakeholder highlighted that the current reliance on bringing an external workforce to the region is, in effect, a barrier to the development of a stable, local talent pool for solar and onshore wind sectors. This is due to the fact that, from an industry perspective, skilled regional workforce development takes a significant investment of time that is not aligned with timelines of a typical project. From the workforce perspective, these temporary job roles might not serve as a basis for a life-long career and, therefore, make the sectors less attractive to new entrants.
“The reliance on transient workforce [means] there’s no real demand from developers to try and develop a workforce locally.”
In addition, two stakeholders indicated that the planned acceleration in onshore wind activity in England is a potential threat to maintaining a stable technical talent pool in Scotland. They explained that this acceleration is likely to drive a rapid increase in demand for skilled workers in England, where there is an anecdotal shortage of talent, prompting the industry to potentially draw from the Scottish workforce. Additionally, remuneration in England is perceived as higher, which could further incentivise talent migration.
“There is a concern that Scotland could lose a significant chunk of its skilled workforce to England.”
Addressing the future skilled workforce demands
Analysis of SFC data
To understand analyse the scale of skills being delivered against the projected future skilled workforce demands, we extracted data in relation to the total number of enrolments in all STEM-related courses identified as relevant to onshore wind and solar sectors. This was done in collaboration with the Scottish Funding Council.
The analysis of enrolment numbers on a course level was not possible as the data request could not be fulfilled in the timelines of this study. Therefore, the datasets discussed below are assessing combined annual enrolment numbers in both targeted and broader STEM training provision courses.
In the most recent available dataset (2021/2022), the total full person equivalent (FPE) enrolment in first degree, postgraduate taught and postgraduate research courses broadly identified as relevant to the sectors was 53,585 (Figure 6). The transferability of skills from these courses into solar and onshore wind is illustrated in Appendix D, Table 5.
Figure 6. Number of enrolments (full person equivalents) in courses relevant to solar and onshore wind sectors in Scottish higher education institutions (2021/2022).
In the most recent available dataset (2022/2023) the total FPE enrolment in Scottish college courses that are engineering-focused and identified as relevant to solar and onshore wind and allied sectors was 14,890 (Figure 7).
Figure 7. Number of FPE enrolments in engineering courses identified as relevant to solar and onshore wind sectors in Scottish colleges (2022/2023).
To reiterate, previous studies have estimated the peak total workforce requirement for solar and onshore wind sectors as 11,000 and 20,500 respectively. The FPE numbers of the current training provision have been provided as an illustration of the training capacity of further and higher education institutions in Scotland in courses relevant to solar and onshore wind. However, it is critically important to note that the total FPE numbers illustrated in Figure 6 and Figure 7 above do not imply that Scotland’s skilled workforce needs are being addressed by the existing training provision. People from these courses enter a range of different industries, and this is explored further in Section 7.2. Additionally, annual FPE enrolments in the relevant courses do not equal the number of individuals completing the training, or the number of graduates that are entering the workforce. For example, the number of graduates in a four-year training programme could be 25% of the total FPE number (the 4th year trainees).
Further, the data on the future destinations of students undergoing the training is fragmented, and this has already been flagged by CESAP Work Package 1 report (Skills Development Scotland, 2023). The recent SDS Apprentice Voice publication states that 71% of modern apprentices are still working for the employer with which they completed their modern apprenticeship 15 months after completion (SDS, 2024). Further research could explore the demographics, interests, and future career pathways of students in training to clarify the true number of entrants into the renewables sector and identify their subsector preferences.
Competition for talent
Due to the short timeline for meeting the 2030 installed capacity ambitions, addressing future skilled workforce demands in solar and onshore wind sectors will rely on cross-sector skills transfer. Interviews highlighted that one dominant sector that provides technically skilled talent to renewables, in particular onshore and offshore wind, is ex-service personnel (6 of 21 stakeholders).
Technically skilled talent is in high demand across many sectors, including other renewables (hydrogen and offshore wind), manufacturing, construction, the utility companies, and others. The competition for talent within the onshore wind and solar sectors is also fierce. As a consequence, workforce retention is an issue. This was highlighted as a critical challenge by 14 of 21 stakeholders consulted. Stakeholders highlight that a siloed approach to skilled workforce planning is a potential threat to the renewables sector as a whole.
“We’re competing with so many other sectors for the same skill sets… it’s a very competitive marketplace.”
In addition to problems in attracting talent from other industries, solar and onshore wind sectors face significant challenges in retaining skilled workers within their roles (14 of 21 stakeholders).
“We did go through a period… where there was very high turnover and lots of people leaving.”
Talent mobility is high, with workers often moving on to more lucrative or appealing opportunities after a short period. This disincentivises the industry to invest in workforce development via traditional pathways.
“The investment of spending three years training them [apprentices] [is significant]. At the end of it, a lot of them were literally staying in the role for six months, then looking to the next thing.”
The ageing workforce in parts of the solar and onshore wind sectors represents an additional challenge in training and developing talent.
“We’re losing a lot of our real experienced people that would normally mentor those coming in straight from uni… that’s where the struggle is.”
“The ageing workforce and impending retirements are exacerbating these challenges, as there are not enough experienced workers to mentor new entrants.”
The limited talent pool can result in solar and onshore wind companies headhunting suitably trained technical talent within their supply chains, with potentially detrimental consequences to these suppliers.
“When we’ve got good people… the developers come and use us as a recruitment location (..) clearly you can’t restrict people’s careers but (..) that’s a challenging area for us.”
The industry indicates that more innovative training mechanisms will be required to address the issues with training and retention, and these are discussed in Section 8.
Sector visibility and attractiveness
Due to the overall high demand for a technically skilled workforce, stakeholders highlighted that improving the visibility and attractiveness of the sector is a key element in ensuring that the future skills demands are met (11 of 21 stakeholders). They suggest that one strategy for ensuring optimal communication of sector attractiveness is by clearly describing the opportunities for life-long, diverse careers in these sectors. This can be achieved, for example, through the development of clear career pathway maps by building on the sectoral overlap matrix conceptualised in Figure 2, for example by illustrating career paths from technical roles into leadership, management, and planning (other skills).
“People want to see, okay, where can I go next? They want to see that career path… that’s where we need to be to attract people.”
“We need visibility of career pathways… there will be a lot more interest if there’s more visibility of how they can go about obtaining those roles.”
“The biggest challenge is that they don’t know how to progress within the sector.”
One stakeholder indicated that some companies in the onshore wind sector use career mapping internally as a tool for increasing employee retention within the organisation.
“We’re doing a lot of that internally now… developing a career path map so people can see the visibility of where they can go.”
One stakeholder, actively engaged with skilled individuals looking to transition to onshore renewable energy, indicated that the overall levels of visibility and clarity about the requirements and opportunities in solar and onshore wind are relatively low.
“They [skilled individuals seeking to transfer to renewables] need to understand the route to becoming a fully qualified electrician to get into solar installation.
For solar, we’re not seeing the volume of opportunities.
We’re talking a lot about the opportunities but they’re just not visible… we don’t see the wind turbine technician roles coming up that often.
Training provision gaps, barriers, and opportunities for improvement
Gaps and barriers
Gaps in training provision and alignment with industry needs
Stakeholders (16 of 21) consistently highlighted a significant gap between the content and capacity of existing training programs and the specific needs of the solar and onshore wind sectors. This gap is particularly evident in specialised, role-specific training, such as for wind turbine technicians and ground-mounted solar project development specialists. This is in contrast to the findings outlined in the Section 6 above, suggesting suboptimal levels of communication between the education providers and the industry in tailoring course content to the industry’s specific needs.
“We have generic degree courses in electrical engineering… it’s probably more the specialisms that we’re lacking just now.”
“There is no single qualification in solar. Generally, qualifications are part of a wider training provision.”
“I’ve got engineers at the moment that I need to get up-skilled in solar… the closest training course I can find is in the south of England.”
The mismatch between academic offerings and industry requirements creates challenges in producing a workforce that is ready to contribute effectively from day one. Stakeholders highlighted that training provision is reactive rather than proactive and does not anticipate the industry’s needs to meet the 2030 installed capacity ambitions.
“The qualifications available in Scotland are very generic… we need a much more work-ready solution so that when people come out of training, they have a much better insight into the specifics.”
“Most training providers at the moment are looking to provide training for current demand. And there’s no foresight as to what that’s going to look like in the next two, three years.”
A few stakeholders (3/21) indicated that skills provision for solar sector, and especially large-scale commercial rooftop and ground mounted solar, is limited in Scotland. This opinion is supported by the desk based research findings that showed that most solar-targeted training provision is specialised on domestic rooftop installations. There is a clear deficit in targeted training for the more complex and technically demanding aspects of large solar projects.
“Solar is lagging behind – all on awareness level, not competence-based… solar farms are less catered for.”
“There is very limited experience on these types of projects [large commercial and ground-mounted projects]”.
Barriers to increased training provision
A recurring theme that was highlighted by 15 of 21 stakeholders as a critical issue is the lack of targeted funding for training provision, which has become a significant barrier to expanding and adapting training programmes.
“Funding is the main issue… the absolute allocation to individual Modern Apprenticeships has not increased for 10 years.”
“Colleges are struggling to provide [relevant training provision] without external support.”
The financial constraints are compounded by the high costs of the necessary infrastructure and materials, leaving institutions to rely on limited general budgets.
“These are very expensive courses to cover in comparison with other courses.”
“My understanding is that there’s only one college right now that has the equipment to deliver high-voltage training.”
Stakeholders indicated the need for ring-fenced funding to support the development and delivery of courses that are specific to solar and onshore wind sectors. This has become particularly important after the termination of the National Transition Training Fund in 2022. One stakeholder further indicated the need for ringfenced funding for safety certifications to ensure that the skilled workforce is certified to work in solar and onshore wind environments.
“We have nothing… all of that ring-fenced funding is now gone.”
“The funding available is often for higher-level qualifications, but it doesn’t apply to safety tickets or other certifications, which can be a barrier.”
Stakeholder commentary on policy
Stakeholders (10 of the 21 consulted) highlighted that policy has a central role in market certainty and, therefore, future skills needs planning and training provision. Uncertainty, particularly concerning the future pipeline of projects, complicates long-term workforce planning. Companies are hesitant to invest in long-term workforce development initiatives without clearly understanding future project demand. At the conclusion of this study, the upcoming Energy Strategy and Just Transition Plan had not been published. Stakeholders highlighted that industry has interpreted this as a signal of market uncertainty, which by extension complicates their future workforce planning.
“We need confidence that there’s a long-term pipeline of projects… that gives us the green light to look at investment and ramping up the workforce.”
“If you’re recruiting an apprentice, you’re planning three or four years out… that’s challenging to do without certainty.”
Stakeholders also indicate that the skills governance and policy for solar and onshore wind currently lack certainty and strategic direction. This is in contrast to offshore wind skills governance, which was seen as substantially more mature, despite the lower levels of sector maturity compared to onshore wind. In addition, it was highlighted that the ongoing post-school education reform complicates future workforce development planning. In this context it is challenging for education providers to allocate resources to critical skills areas and delays the alignment of curricula with emerging industry needs, affecting the preparedness of trainees.
“The problem within my space at the moment is all our policy is up in the air… we’re waiting for (…) the funding review.”
“Without a clear directive from the government, the training provision will continue to be reactive rather than strategic.”
Overall, stakeholders called for a more strategic, top-level intervention from a policy perspective that would involve industry, training providers, and funding bodies.
Opportunities for enhancement
Modular and flexible training programs
The need for modular, flexible training programs that can quickly upskill individuals with relevant but incomplete experience is a recurring theme that was highlighted as the opportunity for training enhancement (14 of 21 stakeholders). These programs should be designed to provide targeted, condensed training that aligns with industry needs, allowing workers to become productive more quickly.
“They have the base skills and they just need a little top-up to actually enable them to move into the sector. We need to condense [training provision] into something intense, something that people can do in short courses.”
“If we [the industry] could fund modular type activities… that would really suit us.”
“We could take a more modular approach… train you to do [a certain task] and then upskill you as needed, but in the meantime, you’re productive much more quickly.”
The main idea behind modular training provision is to identify areas where a worker requires additional support while using their existing skills within the workforce. Two stakeholders described this process as skills “top-up”, as opposed to full retraining of already skilled workers that would remove them from the workforce for an extended period. This could be integrated into the existing training provision, with apprenticeships highlighted as one of the most important mechanisms for the delivery of a skilled workforce to the solar and onshore wind sectors.
“The perfect mix is where you have [modular training within] degree apprenticeships. They’re learning the fundamentals while getting operational experience.”
In addition, one stakeholder indicated that modular training provision could also support increased levels of training of trainers, expanding the skillset that can be passed on through existing training provision mechanisms. This highlights that the modular training provision could benefit different stakeholder groups and be synergistic for the development of skilled workforce.
Strategic collaboration between stakeholders
Effective workforce development in the renewable energy sector requires a coordinated effort between industry, government, educational institutions, and training providers. Stakeholders (18 of 21) consistently highlighted the need for improved communication and partnership that can lead to more effective training and recruitment efforts. This collaboration should focus on not only bringing together stakeholders from solar and onshore wind but also other relevant sectors.
“Employers need to work with training providers… to put together a training piece that’s going to assist [workforce that is looking to transfer] based on topping up their skills.”
“We just need to get that communication from industry… they [training providers] will absolutely ramp up and align their courses with it and we [a networking organisation] can support them to flex what they offer as well.”
“Government, industry, and training providers should be working more closely to develop a much more modular approach to the delivery of training.”
One stakeholder highlighted that, whilst the relevant people are “often in the same room…” they are “…speaking different languages”. This comment relates to the fact that policymakers, industry, education providers, and other stakeholders often tend to have different and occasionally conflicting priorities. As such, the solar and onshore wind sectors could benefit from more strategic and mediated conversations and relationship-building activities to ensure synergy between stakeholders.
Importance of practical training and on-the-job experience
There is a strong emphasis on the need for practical, hands-on experience in training programs. Many stakeholders (12 of 21) believe that current training programs are too theoretical and do not provide the real-world skills needed for success in the solar and onshore wind sectors.
“The practical element… is fairly limited, so we’re going to do more of that in-house now to meet the needs.”
“We’re still going to need months, if not years, of training them on our products… they have good general electrical engineering knowledge, but not the specifics.”
Two stakeholders indicated that, currently, qualifications alone do not guarantee competency to work in the sector.
“Just because someone is a qualified electrician, it doesn’t make them competent.”
Stakeholders also noted that the academic environment cannot prepare the future workforce for all required job roles in the industry, especially in mid-management. This relates to the previous insights associated with the ageing workforce; as the sector relies heavily on existing career professionals to upskill newcomers, mentorship and guidance must remain available to those entering the sector. This also applies to skilled workers transferring from other sectors to solar and onshore wind.
“The academic environment… doesn’t equip them as project managers. A lot of it realistically… where you get the real training is on the job.”
“We’ve been much more focused on… are they the right person culturally to fit the organisation… then we can train them from an experience point of view.”
Lessons learnt
The findings of our study suggest a series of key themes that could be used for future consideration in developing training provision for the onshore wind and solar sectors.
Although our analysis of current solar and wind sector courses found a theme of ‘practical skills and hands-on experience’ in the descriptions, industry stakeholders did not feel that this is sufficiently represented in the training available. Training providers need to ensure that the course content is relevant to industry needs, in particular regarding hands-on training and close collaboration with industry partners, including through apprenticeships. Access to internationally recognised, accredited training, such as GWO Health & Safety, should be prioritised to ensure that workers receive industry-standard qualifications.
Currently, most solar and wind sector courses are at postgraduate level of specialism. A shift towards a more flexible, modular approach to upskilling and reskilling the workforce is needed. This would allow individuals to tailor their training to specific needs rather than undergoing full retraining programmes. This has the potential to enable faster movement of individuals from training into the workforce which would benefit the industry.
Improved collaboration and communication between stakeholders is another critical lesson. The important role of government in creating clear market signals and strategic skills governance has been highlighted. Establishing more formal partnerships and regular cross-industry and education forums could help foster greater coordination and break down the siloed approach to workforce development. It would also benefit the SMEs in the solar and onshore wind sectors that cannot carry out substantial skills development programmes on their own.
To support the above points, there is a need to enhance and modernise existing funding mechanisms. This includes re-establishing targeted funding streams, encouraging industry investment in training, and exploring new funding models to support specialised programmes such as modular training options. In particular, there needs to be significant investment in practical infrastructure to support hands-on training.
This research highlights the centrality of allied STEM and other roles shared by both onshore wind and solar skills development. A siloed approach to STEM workforce planning is a threat as several industries are drawing from the same talent pool, resulting in competition with their vital supply chains. A more integrated perspective would consider the requirement for a STEM workforce across all infrastructure projects of national importance and overall installed capacity ambitions. A comprehensive map that details the scale, timelines, and workforce demands of major infrastructure projects has the potential to inform the total scale of skilled workforce needs and alleviate some concerns regarding the temporary nature of some job roles at times of peak demand. Such a map could be used as a signal of the availability of lifelong careers in these diverse sectors. Understanding the flow of skilled workforce amongst solar and onshore wind sectors and between other sectors will be vital to maximising skills and workforce potential.
Another suggestion for policy and the broader stakeholder ecosystem is the need to develop robust and compelling career pathways through comprehensive career mapping. Research is needed to outline career progression within the solar and onshore wind, as well as the broader renewable energy sector, and compare it with other major industries to create a comprehensive transferability framework. Identifying key roles, required skills, and potential career progression routes can provide clarity for professionals entering or transitioning within the sector, making it more attractive and accessible. This approach will be essential for addressing both recruitment and retention challenges.
Conclusions
In summary, current training provision has the potential to deliver the skilled workforce required for the solar and onshore wind sectors if it is strategically supported through policy certainty, targeted funding and changes in modes of training delivery. The need for intervention is urgent, as research indicates a peak in workforce demand as early as 2027 (Morrison, et al., 2024).
We have conceptualised the sectoral overlap of skills for the onshore wind and solar sectors (Figure 2). This demonstrates that although critical, specialised skills training provision is needed for solar and onshore wind separately, the majority of roles are shared by the sectors requiring allied STEM and other skills. We found that there are gaps for both sectors in specialised, role-specific training aligning to industry needs. However, siloed approaches for skills governance in solar and onshore wind could be counterproductive as the sectors compete for many of the same skillsets.
Allied STEM skills training provision in Scotland is extensive, with a significant number of students enrolling in relevant and transferable courses each year. These programmes equip trainees with foundational skills that can be applied across various sectors, including renewable energy. However, there is a lack of clarity regarding student destinations after completing these courses, making it difficult to track how many trainees are entering the solar and onshore wind sectors in Scotland. Stakeholder engagement highlighted that the onshore wind and solar sectors need to increase their job attractiveness in a highly competitive skills marketplace, including through increased visibility and clear career pathways.
Throughout this report, we have demonstrated the value of an integrated perspective, with the above conclusions being applicable to both sectors. However, our findings also suggest conclusions for the specific sectors, as set out below.
Sector specific conclusions: Onshore wind
Training provision for the onshore wind industry is available in Scotland but needs better alignment with the sector’s specific operational demands, especially with a stronger emphasis on practical, hands-on skills like wind turbine maintenance and site management. While there are few significant barriers preventing individuals from entering the industry, poor sector visibility is an issue. Industry leaders are keen to see training programmes that allow workers to quickly transition into the workforce, building on their existing knowledge while providing opportunities for continued upskilling. Modular training and “topping up” skills are considered vital to ensuring that workers can effectively meet the evolving needs of onshore wind projects and contribute to the industry’s success.
Sector specific conclusions: Solar
The solar industry in Scotland faces several challenges related to training and skills development. Currently, training provision is limited to domestic rooftop installations, which already require an electrical qualification. A major concern is Scotland’s lack of expertise in ground-mounted solar, which poses a potential threat to the sector’s development. There are no specialist courses available or training providers equipped to deliver the necessary skills. Skills governance for the solar sector is also lagging behind that of other renewable sectors, which further hinders the industry’s growth.
Like the onshore wind sector, the solar sector would greatly benefit from increased modular training provision to upskill workers quickly. However, training providers require a clear signal from the industry indicating a need for such courses. Addressing these gaps is essential for ensuring that the solar industry has a skilled workforce capable of supporting its growth.
Next steps
This study has identified the key barriers, opportunities and needs for intervention to increase training provision for solar and onshore wind sectors in Scotland. The next critical step is to develop a detailed, fast-paced action plan that engages all key stakeholders, including policymakers, industry representatives, training providers and potential talent pool representatives. Given the urgency of workforce demands and a projected peak of skills need as early as 2027, this action plan must establish clear and fast-paced timelines for intervention, with an aim to launch initiatives before the start of the next academic year (2025/2026). Coordinating this effort will be crucial to ensuring that Scotland can support the sectors’ rapid growth and deliver its renewable energy commitments.
References
Morrison, M., Beinarovica, J., Weir, I., Fagura, J., Schreib, S. (2023) ‘Workforce and skills requirements in Scotland’s onshore wind industry.’ Available at: https://www.climatexchange.org.uk/projects/workforce-and-skills-requirements-in-scotlands-onshore-wind-industry/ (Accessed: 25/09/2024).
Creamer, D., Beinarovica, J., Weir, I., Stodart, J., Romero, I. (2024) ‘Workforce and skills requirements in Scotland’s solar industry.’ Available at: https://www.climatexchange.org.uk/projects/workforce-and-skills-requirements-in-scotlands-solar-industry/ (Accessed: 25/09/2024).
Energy and Utility Skills (2024) National Occupational Standards (NOS) and Qualifications Review. Available at: https://www.euskills.co.uk/2024/08/20/national-occupational-standards-nos-and-qualifications-review/ (Accessed: 25/09/2024)
European Climate Infrastructure and Environment Executive Agency (2011) BUILD UP Skills – Upskilling and reskilling interventions for building decarbonisation. Available at: https://www.euro-access.eu/en/calls/1268/BUILD-UP-Skills–Upskilling-and-reskilling-interventions-for-building-decarbonisation#subtable4 (Accessed: 25/09/2024).
European Commission (2020) The Pact for Skills. Available at: https://pact-for-skills.ec.europa.eu/about_en (Accessed: 25/09/2024).
Government of India (2020) Skill Council for Green Jobs. Available at: https://sscgj.in/ (Accessed: 25/09/2024).
Highlands and Islands Enterprise (2019) Highlands and Islands Key statistics. Available at: https://www.hie.co.uk/media/6341/highlandsplusandplusislandspluskeyplusstatistics.pdf (Accessed: 24/09/2024)
India Corporate Sustainability and Responsibility (2023) Green Jobs Demand to Surge 15-20% Annually for a Decade. Available at: https://indiacsr.in/green-jobs-demand-to-surge-15-20-annually-for-a-decade-nlb-services/ (Accessed 24/09/2024)
International Energy Agency (2022) Skills Development and Inclusivity for Clean Energy Transitions. Available at: https://iea.blob.core.windows.net/assets/953c5393-2c5b-4746-bf8e-016332380221/Skillsdevelopmentandinclusivityforcleanenergytransitions.pdf (Accessed: 07/11/2024).
Morrison, M., Beinarovica, J., Weir, I., Fagura, J., Schreib, S. (2024) ‘Workforce and skills requirements in Scotland’s onshore wind industry’. Available at: https://www.climatexchange.org.uk/projects/workforce-and-skills-requirements-in-scotlands-onshore-wind-industry/ (Accessed: 25/09/2024).
Scottish Government (2022) Scotland’s National Strategy for Economic Transformation. Available at: https://www.gov.scot/publications/scotlands-national-strategy-economic-transformation/ (Accessed: 25/09/2024).
Skills Development Scotland (2020) Climate Emergency Skills Action Plan 2020-2025. Available at: https://www.skillsdevelopmentscotland.co.uk/media/w0ulewun/climate-emergency-skills-action-plan-2020-2025.pdf (Accessed: 25/09/2024).
Skills Development Scotland (2023) CESAP Pathfinder WP1 Executive Summary. Available at: https://www.skillsdevelopmentscotland.co.uk/media/el4fhf0m/cesap-pathfinder-wp1-executive-summary.pdf (Accessed: 25/09/2024).
Skills Development Scotland (2024) Apprentice Voice 2023 Annual Results. Available at: https://www.skillsdevelopmentscotland.co.uk/media/0twj3fpe/apprentice-voice-ma-kpis-2023.pdf (Accessed: 05/11/2024).
UK Government (2023) Solar Taskforce. Available at: https://www.gov.uk/government/groups/solar-taskforce (Accessed: 24/09/2024)
UK Government (2024) Onshore Wind Industry Taskforce. Available at: https://www.gov.uk/government/groups/onshore-wind-industry-taskforce (Accessed: 24/09/2024)
Appendices
List of consulted stakeholders
Skills Development Scotland
Universities Scotland
Solar Energy UK
Scottish Training Federation
Scottish Funding Council
Gensource
Engineering and Construction Industry Training Board
ITPEnergised
Scotland’s Electrical Trade Association (SELECT)
Career Transition Partnership
EVO Energy
Dumfries and Galloway College
Ayrshire College
NMIS/University of Strathclyde
NESCol/Energy Transition Skills Hub
NESCol/National Energy Skills Accelerator
Hitachi Energy
SSE Renewables
Scottish Power Renewables
Highland Council
Energy Skills Partnership (ESP)
|
Level |
Course name | |
|---|---|---|
|
Ayrshire College |
L5 (school) |
Skills for Work Introduction to Renewable Energy |
|
Ayrshire College |
L5 (pre-apprenticeship) |
Electrical Engineering and Renewables |
|
Ayrshire College |
SCQF L6 |
Wind Turbine Systems |
|
Borders College |
No formal qualification |
Introduction to Renewables Technology SPF |
|
Dumfries & Galloway |
NC (SCQF L6) |
Natural Power Wind Turbine Technician Trainee |
|
Dumfries & Galloway |
NQ (SCQF L4) |
Introduction to Engineering and Renewable Energy |
|
Dumfries & Galloway |
GWO |
Basic Technical Training (BTT) |
|
Dumfries & Galloway |
SCQF L5 |
Renewable Energy Practical Skills |
|
Edinburgh |
BEng |
Energy and Environmental Engineering |
|
Edinburgh Napier University |
BEng |
Energy & Environmental Engineering |
|
Fife |
GWO |
Basic Technician Training |
|
Forth Valley |
BPEC (NOS Mapped) |
Solar Photovoltaic Systems |
|
Glasgow Caledonian University |
BEng / MEng |
Electrical Power Engineering |
|
Glasgow Clyde |
BPEC |
Electrical Energy (Battery) Storage Systems (EESS) |
|
Glasgow Clyde |
BPEC |
Solar Photovoltaic (PV) Systems |
|
Heriot Watt |
MSc |
Renewable and Sustainable Energy Transition |
|
Heriot Watt |
MSc |
Renewable Energy Engineering |
|
Inverness (UHI) |
BEng (Hons) |
Energy Engineering |
|
Inverness (UHI) |
MBA |
Renewable Energy |
|
Moray (UHI) |
MBA |
Renewable Energy |
|
Moray (UHI) |
BEng (Hons) |
Energy Engineering |
|
NESCoL |
SCQF 4/5 |
Automation & Renewables |
|
NESCoL |
NC (SCQF L5) |
Engineering Systems: Renewables |
|
NESCoL |
NC (SCQF L5) |
Engineering Systems: Renewables |
|
NESCoL |
Skills for Work (SCQF Level 5) |
Engineering: Sustainability & Renewables |
|
NESCoL |
ECITB (SCQF Level 6) |
Engineering: Wind Turbine Technician (WT) Pathway |
|
NESCoL |
SCQF Level 5 |
Girls in Energy |
|
NESCoL |
SCQF Level 5 |
Performing Engineering Operations: Renewables |
|
NESCoL |
Online certificate |
Principles of Sustainable Energy Management |
|
North West & Hebrides (UHI) |
BEng (Hons) |
Energy Engineering |
|
North West & Hebrides (UHI) |
PDA |
Renewable Energy Systems |
|
North West & Hebrides (UHI) |
MSc |
Sustainable Energy Solutions |
|
North West & Hebrides (UHI) |
CPD (SCQF L9) |
Sustainable Resource Management |
|
North West & Hebrides (UHI) |
MBA |
Renewable Energy |
|
Perth (UHI) |
BEng (Hons) |
Energy Engineering |
|
Perth (UHI) |
MBA |
Renewable Energy |
|
Robert Gordon University |
BEng / MEng |
Renewable Energy Engineering |
|
SLC |
BPEC |
Solar PV |
|
University of Aberdeen |
MEng |
Electrical and Electronic Engineering with Renewable Energy |
|
University of Aberdeen |
MEng |
Energy Transition Systems and Technologies |
|
University of Aberdeen |
MSc |
Renewable Energy Engineering |
|
University of Edinburgh |
MSc |
Advanced Power Engineering |
|
University of Edinburgh |
MSc |
Electrical Power Engineering |
|
University of Edinburgh |
MSc |
Sustainable Energy Systems |
|
University of Glasgow |
MSc |
Sustainable Energy |
|
University of Strathclyde |
MSc |
Offshore Wind Energy |
|
University of Strathclyde |
MEng |
Electrical Energy Systems |
|
University of Strathclyde |
MSc |
Advanced Electrical Power & Energy Systems |
|
University of Strathclyde |
MSc |
Advanced Mechanical Engineering with Energy Systems |
|
University of Strathclyde |
MSc |
Electrical Power and Energy Systems |
|
University of Strathclyde |
MSc |
Energy Systems Innovation |
|
University of Strathclyde |
MSc |
Renewable Energy & Decarbonisation Technologies |
|
University of Strathclyde |
MSc |
Sustainable Engineering: Offshore Renewable Energy |
|
University of Strathclyde |
MSc |
Sustainable Engineering: Renewable Energy Systems & the Environment |
|
University of Strathclyde |
MSc |
Wind Energy Systems |
|
University of the West of Scotland |
MSc |
Sustainable Technology and Energy |
|
West Lothian |
SCQF Level 5 |
Electrical Sustainability Through Renewable Technology |
Table 1. Training provision relevant to solar and onshore wind sectors available through Scottish colleges and universities in the academic year 2024/2025.
|
Organisation |
Course name |
|
Skills Training Group |
Solar PV Installation Course With Battery Storage |
|
BPEC |
BPEC Solar Photovoltaic Systems NOS Mapped |
|
TotalSkills |
Level 3 Solar PV & Battery Storage Systems EESS – 4 Day course |
|
Energy Technical Academy Group |
Solar PV Installer Training (Solar PV & Battery Storage) |
|
IRT Scotland |
Roof Safety for Solar Installers |
|
Clyde Training Solutions |
GWO Advanced Rescue |
|
Clyde Training Solutions |
GWO Wind Basic Technical Straining |
|
Clyde Training Solutions |
GWO Enhanced First Aid |
|
Clyde Training Solutions |
GWO Sea Survival Training |
|
Clyde Training Solutions |
GWO First Aid Training |
|
Clyde Training Solutions |
GWO Manual Handling |
|
Clyde Training Solutions |
GWO Working at height |
|
Clyde Training Solutions |
GWO Basic Safety Training (BST) Package – Offshore |
|
dwpa |
Wind Turbine Technology Essentials |
|
dwpa |
Advanced Platform Theory |
|
dwpa |
Wind Turbine Maintenance |
|
dwpa |
Wind Turbine Troubleshooting |
|
dwpa |
Maintenance Quality Inspection (MQI) |
|
dwpa |
Asset Integrity Inspection (AII) |
|
dwpa |
Turbine Operation & Maintenance |
|
dwpa |
Gearbox Maintenance & Inspection (GMI) |
|
dwpa |
Remote Operations Awareness |
|
dwpa |
Operation & Maintenance Awareness |
|
Aurora Energy |
GWO Working at Height |
|
Aurora Energy |
GWO Manual Handling |
|
Aurora Energy |
GWO First Aid |
|
Aurora Energy |
GWO Fire Awareness |
|
Aurora Energy |
IRATA Rope Access |
|
Aurora Energy |
Mechanical Joint Integrity (MJI) |
|
Aurora Energy |
Confined Space Entry |
|
Aurora Energy |
Working at Height |
|
Aurora Energy |
CCNSG Safety Passport |
|
Aurora Energy |
ECITB CCNSG LaTS (Leading a Team Safely) |
|
Aset Training |
ECITB MJI 10, 18, 19: Mechanical Joint Integrity |
|
Aset Training |
ECITB MJI 33: Torque and Tension Wind Turbine Bolted Connections |
|
Aset Training |
Flange Make Up and Bolting for Integrity: SCQF Level 6 |
|
Aset Training |
GWO Basic Technical Training (BTT) Bolt Tightening Module |
|
Aset Training |
GWO Basic Technical Training (BTT) Combined |
|
Aset Training |
GWO Basic Technical Training (BTT) Electrical Module |
|
Aset Training |
GWO Basic Technical Training (BTT) Hydraulics Module |
|
Aset Training |
GWO Basic Technical Training (BTT) Mechanical Module |
|
Aset Training |
GWO Control of Hazardous Energies (COHE) Basic Safety Module |
|
Aset Training |
GWO Control of Hazardous Energies (COHE) Combined |
|
Aset Training |
GWO Control of Hazardous Energies (COHE) Combined Refresher |
|
Aset Training |
GWO Control of Hazardous Energies (COHE) Electrical Safety Module |
|
Aset Training |
GWO Control of Hazardous Energies (COHE) Pressure Fluid Safety Module |
|
Aset Training |
GWO Fire Awareness |
|
Aset Training |
GWO Fire Awareness Refresher |
|
Aset Training |
GWO Manual Handling |
|
Aset Training |
GWO Manual Handling Refresher |
|
Aset Training |
GWO Working at Heights |
|
Aset Training |
GWO Working at Heights Refresher |
|
Aset Training |
HV Switching and System Control (City & Guilds 0672) |
|
Aset Training |
HV Switching and System Control Refresher |
|
Aset Training |
Hydraulic Engineering Failure Analysis and Troubleshooting – Stage 2: SCQF Level 6 |
|
Aset Training |
Hydraulic Engineering Fundamentals – Stage 1: SCQF Level 5 |
|
Aset Training |
Hydraulic Engineering Systems Design and Advanced Troubleshooting – Stage 3 |
|
Aset Training |
Introduction to PLCs in Programming: SCQF Level 6 |
|
Aset Training |
Major Emergency Management Initial Response for Renewable Energy (Wind) |
|
Aset Training |
OPITO Emergency Coordinator for Renewable Energy |
|
Aset Training |
OPITO Introduction to Mechanical and Electrical Engineering in Renewable Energy |
|
Aset Training |
Power System Protection (Protection Relays) |
|
Aset Training |
Rotating Machinery Alignment Techniques: SCQF: Level 6 |
|
Aset Training |
Small Bore Tubing and Pipework: SCQF Level 6 |
|
Aset Training |
Valve Maintenance and Valve Pressure Testing: SCQF Level 6 |
|
Heightec |
GWO Basic Safety Training – Onshore Package |
|
Heightec |
GWO Working at Heights with Manual Handling (WAH & MH) |
|
Heightec |
GWO Manual Handling (MH) |
|
Heightec |
GWO Fire Awareness (FAW) |
|
Heightec |
GWO First AId |
|
Heightec |
GWO Slinger Signaller |
|
Heightec |
Advanced Hub Rescue for Wind Turbines |
|
Heightec |
Wind Turbine Lifting Hoist Operations |
|
Heightec |
Evacuation by Descent |
|
Coast Renewables Solutions |
GWO Manual Handling |
|
Coast Renewables Solutions |
GWO Working at Height |
|
Coast Renewables Solutions |
GWO First Aid |
|
Coast Renewables Solutions |
GWO Fire Awareness |
|
Coast Renewables Solutions |
GWO Advanced Rescue Training (ART) |
|
Coast Renewables Solutions |
GWO Hub Rescue |
|
Coast Renewables Solutions |
GWO Basic Technical Training (BTT) |
|
MRS Training and Rescue |
GWO Wind Turbines Onshore Basic Safety Training (BST) |
|
MRS Training and Rescue |
GWO Wind Turbines Onshore Basic Safety Training Refresher (BSTR) |
|
MRS Training and Rescue |
GWO Wind Turbines Working at Height with Manual Handling |
|
MRS Training and Rescue |
GWO Wind Turbines Working at Height with Manual Handling Refresher |
|
MRS Training and Rescue |
GWO Wind Turbines First Aid |
|
MRS Training and Rescue |
GWO Wind Turbines First Aid Refresher |
|
MRS Training and Rescue |
GWO Wind Turbines Fire Awareness |
|
MRS Training and Rescue |
GWO Wind Turbines Enhanced First Aid |
|
MRS Training and Rescue |
GWO Wind Turbines Enhanced First Aid Refresher |
|
MRS Training and Rescue |
GWO Wind Turbines Advanced Rescue |
|
360 training |
Wind Turbine Powered Hoist Operator and Slinger Signaller TICCCS |
|
360 training |
Wind Turbine Powered Hoist & Hydraulic Loader Operator and Slinger Signaller TICCCS |
|
360 training |
Skyman Service Lift User Training TICCS |
|
360 training |
Power Climber SD4 Service Lift User Training TICCCS |
|
360 training |
Power Climber RD3 Service Lift User Training TICCCS |
|
360 training |
Equipamientos Eolicos Service Lift User Training TICCCS |
|
360 training |
GWO Advanced Rescue Training |
|
360 training |
GWO Basic Safety Training |
|
360 training |
GWO Basic Technical Training |
|
360 training |
GWO Basic Technical Training – Electrical |
|
360 training |
GWO Basic Technical Training – Hydraulic |
|
360 training |
GWO Basic Technical Training – Mechanical |
|
360 training |
GWO Fire Awareness |
|
360 training |
GWO Manual Handling |
|
360 training |
GWO Working at Height |
|
GWT |
GWO Five Module Package |
|
Steam Marine Training |
GWO Five Module Package |
|
Synergie Training |
Wind Turbine Safety Rules+A1:B110 (WTSR) |
Table 2. Training provision relevant to solar and onshore wind sectors available through private providers.
|
NOS |
Description |
Sector relevance |
|---|---|---|
|
EUSWT01* |
Pre-Assemble Wind Turbine Components |
Onshore wind |
|
EUSWT03 |
Remove plant and apparatus in the electricity power utilities environment |
Onshore wind |
|
EUSWT04 |
Maintain plant and apparatus in the electricity power utilities environment |
Onshore wind |
|
EUSWT05 |
Inspect plant and apparatus in the electricity power utilities environment |
Onshore wind |
|
EUSWT06 |
Configure plant and apparatus in the electricity power utilities environment |
Onshore wind |
|
EUSWT07 |
Diagnose faults on plant and apparatus in the electricity power utilities environment |
Onshore wind |
|
EUSWT08 |
Develop yourself in the work role |
Onshore wind |
|
EUSWT09 |
Work with other people |
Onshore wind |
|
EUSWT10 |
Minimise risks to life, property and the environment in electricity power utilities |
Onshore wind |
|
EUSWT11* |
Install and maintain hydraulic systems on wind turbines |
Onshore wind |
|
EUSWT12 |
Replace plant and apparatus in the electricity power utilities environment |
Onshore wind |
|
SEMETS347 |
Producing technical information for engineering activities |
Onshore wind |
|
SEMENG305 |
Obtain resources for engineering activities |
Onshore wind |
|
SEMMAN2302 |
Using and interpreting engineering data and documentation |
Onshore wind |
|
SEMMAN2303 |
Working efficiently and effectively in engineering |
Onshore wind |
|
INSML002 |
Develop your knowledge, skills and competence to meet the requirements of your work |
Onshore wind |
|
INSML024 |
Build teams and allocate work to team members |
Onshore wind |
|
INSML025 |
Manage and quality assure work in your team |
Onshore wind |
|
INSML031 |
Develop and sustain working relationships with colleagues and stakeholders |
Onshore wind |
|
EUSEPUS014 |
Fault location and diagnosis on plant and apparatus in the electricity power utilities |
Onshore wind |
|
EUSEPUS044 |
Location and identification of underground utility services in the electricity power utilities |
Onshore wind |
|
INSEA5 |
Promote low and zero carbon energy technologies |
Onshore wind & solar PV |
|
PROST01* |
Prepare the structure for photovoltaic/solar thermal panel installation – existing structure |
Solar PV |
|
PROST02* |
Fix solar thermal/photovoltaic panels onto a roof structure |
Solar PV |
|
PROST03* |
Fix solar thermal/photovoltaic panels into a roof structure |
Solar PV |
|
PROST04* |
Fix solar thermal/photovoltaic panels onto a non-roof structure |
Solar PV |
|
PROST05* |
Solar thermal/photovoltaic panels post installation activities |
Solar PV |
|
PROST06* |
Identify solar thermal/photovoltaic installation requirements |
Solar PV |
|
PROST07* |
Produce specifications for solar thermal/photovoltaic installations |
Solar PV |
|
BSESPV02* |
Install and connect Solar PV and EESS systems |
Solar PV |
|
BSESPV03* |
Inspect and test Solar PV and EESS Systems |
Solar PV |
|
BSESPV04* |
Commission Solar PV and EESS systems |
Solar PV |
|
BSESPV05* |
Identify and rectify faults in Solar PV and EESS systems |
Solar PV |
|
BSESPV06* |
Maintain Solar PV and EESS systems |
Solar PV |
|
BSESPV07* |
Develop and agree project designs for Solar PV |
Solar PV |
|
BSESPV08 |
Develop, test and agree project designs for EESS |
Solar PV |
|
BSESPV01* |
Install assemblies and enclosures for Solar PV and EESS systems |
Solar PV |
Table 3: National Occupational Standards (NOS) that are relevant to onshore wind and solar PV.
* denotes NOS that are specific to onshore wind and/or solar PV. All others are more general, but still of relevance.
|
Apprenticeship Type |
Framework |
|
Foundation |
Civil Engineering |
|
Engineering | |
|
IT: Hardware and System Support | |
|
IT: Software Development | |
|
Scientific Technologies | |
|
Construction L4/5 | |
|
Graduate |
Civil Engineering |
|
Civil Engineering: Higher Apprenticeship at SCQF Level 8 | |
|
Construction and the Built Environment | |
|
Cyber Security | |
|
Data Science | |
|
Business Management: Project Management | |
|
Engineering: Design and Manufacture | |
|
Engineering: Instrumentation, Measurement and Control | |
|
IT: Software Development | |
|
IT: Management for Business | |
|
Modern |
Life Sciences and Related Science Industries |
|
Life Sciences and Related Science Industries Technical | |
|
Maritime Occupations | |
|
Power Distribution | |
|
Industrial Applications | |
|
Process Manufacturing | |
|
Rural Skills: Environmental Conservation | |
|
Construction Technical Apprenticeship: Built Environment, | |
|
Construction Technical Apprenticeship: Contracting Operations | |
|
Construction: Building | |
|
Construction: Civil Engineering | |
|
Construction: Specialist | |
|
Construction: Technical | |
|
Data Analytics: Technical | |
|
Digital Technology | |
|
Electrical Installation | |
|
Engineering: Asset Lifecycle and Maintenance | |
|
Engineering: Manufacturing and Fabrication | |
|
Engineering: Technical Support | |
|
Engineering Construction | |
|
Engineering and Digital Manufacturing Technical Apprenticeship | |
|
Management | |
|
Project Management | |
|
Digital Technology Technical Apprenticeship | |
|
Sustainable Resource Management | |
|
Supply Chain Management |
Table . List of Apprenticeship Frameworks identified as relevant for the broader STEM skills provision.
|
University courses |
Transferability |
Full person equivalents (2021/2022) |
|
Aeronautical and aerospace engineering |
|
980 |
|
Agricultural sciences |
|
170 |
|
Agriculture |
|
1445 |
|
Artificial intelligence |
|
1130 |
|
Biology (non-specific) |
|
1070 |
|
Biosciences (non-specific) |
|
1820 |
|
Biotechnology |
|
460 |
|
Building |
|
3470 |
|
Chemical, process and energy engineering |
|
2760 |
|
Civil engineering |
|
3755 |
|
Earth sciences |
|
1750 |
|
Ecology and environmental biology |
|
1480 |
|
Electrical and electronic engineering |
|
4095 |
|
Engineering (non-specific) |
|
3170 |
|
Environmental and public health |
|
1055 |
|
Environmental sciences |
|
1630 |
|
Forestry and arboriculture |
|
150 |
|
Geography (non-specific) |
|
220 |
|
Information systems |
|
1950 |
|
Information technology |
|
2755 |
|
Landscape design |
|
255 |
|
Maritime technology |
|
40 |
|
Materials science |
|
10 |
|
Materials technology |
|
10 |
|
Mechanical engineering |
|
4720 |
|
Microbiology and cell science |
|
1325 |
|
Naval architecture |
|
315 |
|
Others in engineering |
|
225 |
|
Physical and geographical sciences |
|
1865 |
|
Physical sciences (non-specific) |
|
150 |
|
Planning (urban, rural and regional) |
|
815 |
|
Plant sciences |
|
110 |
|
Production and manufacturing engineering |
|
1060 |
|
Rural estate management |
|
245 |
|
Sciences (non-specific) |
|
815 |
|
Software engineering |
|
3335 |
|
Zoology |
|
1050 |
|
Others |
|
1925 |
Table 5. Scottish university courses and their relative transferability to solar and onshore wind sector. This list is derived from SFC records where courses are ranked in red, amber, and green for their relative transferability to onshore wind and solar sector skills needs. The RAG rating was assigned through qualitative reasoning of the consultants following in-depth thematic analysis of the course content as discussed in Section 6.1.2. The full person equivalent data was provided by the Scottish Funding Council.
How to cite this publication: Beinaroviča, J., Creamer, D., Morrison, M., Brown, J., Knox, D. (2025) Training provision in Scotland’s onshore wind and solar industries, ClimateXChange. http://dx.doi.org/10.7488/era/5399
© The University of Edinburgh, 2025
Prepared by Optimat on behalf of ClimateXChange, The University of Edinburgh. All rights reserved.
While every effort is made to ensure the information in this report is accurate, no legal responsibility is accepted for any errors, omissions or misleading statements. The views expressed represent those of the author(s), and do not necessarily represent those of the host institutions or funders.
This work was supported by the Rural and Environment Science and Analytical Services Division of the Scottish Government (CoE – CXC).
ClimateXChange
Edinburgh Climate Change Institute
High School Yards
Edinburgh EH1 1LZ
+44 (0) 131 651 4783
Research completed: January 2025
DOI: http://dx.doi.org/10.7488/era/5568
Erratum: Please note that this report was updated on 16 May 2025 to refer in three instances to Climate Ready HES: Adaptation Plan (2021) instead of Historic Environment Scotland Climate Action Plan (2020). Row 74 in the accompanying database has also been updated.
Executive summary
Introduction
Public bodies in Scotland are key players at the forefront of responding to climate change impacts in Scotland, given their roles as health, education, housing and social care providers, and emergency and risk management agencies. This study reviews the state of play of public body climate adaptation planning in Scotland. The report highlights approaches for delivering climate adaptation, common themes, similarities and differences between public bodies. It summarises available information on costs and benefits, to help inform a collective understanding among stakeholders and highlight knowledge gaps.
Summary of key findings
Overview of public body adaptation plans
The adaptation planning landscape is complex. In many public bodies, there is no single, dedicated climate adaptation plan; more often, adaptation is integrated into one or more documents. Public body adaptation plans vary widely in their scope, content and levels of maturity. Because of this variability it is difficult to evaluate progress on a like-for-like basis.
Affirming previous findings by the Sustainable Scotland Network (Sustainable Scotland Network, 2023), this study found multiple examples of confusion between climate change adaptation (i.e. responding to the impacts of climate change) and climate change mitigation (i.e. reducing greenhouse gas emissions). Public Bodies Climate Change Duties Reports (PBCCDRs) also frequently signposted to documents such as flood risk assessments that they are required to produce but do not constitute dedicated climate adaptation plans. Therefore, public bodies’ self-reported levels of adaptation planning is not always accurate.
Local authorities are not explicitly required by law to produce adaptation plans. We found that fewer than one-third of local authorities have a dedicated adaptation plan. The remainder have undertaken at least some planning relevant to climate adaptation, in line with their statutory duties on adaptation. Adaptation plans are generally area-wide in scope. These plans frequently made use of guidance, tools and resources made available through the Adaptation Scotland programme. There are several regional plans that have been produced via consortia, which are supported by additional evidence and are comparatively more mature.
As of October 2024, all 22 NHS Boards (including the 14 regional NHS Boards and 8 special NHS boards) have produced a climate change risk assessment (CCRA) and 18 have produced an adaptation plan. There is a requirement for NHS Boards to produce these in a standard Excel-based format, which prompts them to list actions against each risk. These plans generally focused on the organisation’s own operations, assets and supply chain.
The adaptation plans for Historic Environment Scotland, Scottish Water and Transport Scotland were sector-specific and took different approaches to adaptation planning overall. We observed some key differences between local authorities, NHS boards and the other organisations we reviewed, which likely reflect the different remits, the sectors and geographic areas they cover. Key differences include: the scope of their adaptation planning, the themes and content of their adaptation actions, whether they focused solely on the organisation or on the wider area, and whether they were underpinned by a CCRA.
Information on costs and benefits in adaptation plans
We found that the adaptation plans we reviewed contained minimal quantitative information on either costs or benefits. The latter are considered qualitatively in varying levels of detail.
For local authorities, the majority of quantitative information that is available comes from two regional economic impacts reports on climate risks produced by Paul Watkiss Associates. East Dunbartonshire Council was the only example we found of a local authority that had attempted to downscale this information to a local level. Otherwise, there was minimal cost information aside from a handful of local authorities who cited high-level costs, usually in relation to flood infrastructure or associated damage.
NHS boards are prompted to indicate the cost of adaptation measures in relation to each risk they identify. However, not all of them utilised this part of the form; some fields were left blank and it was not clear why. Where costs were indicated, it was not always clear what they referred to.
Of the other organisations reviewed, only Scottish Water cited costs in its adaptation plan, referring to the level of investment required in future years.
It is likely that more quantitative information on costs and benefits is held by public bodies but not necessarily incorporated into their adaptation plans.
Recommendations
Recommendations for policy are set out below. Further details are in Section 8.2
- Engage with public bodies and undertake further research to understand the barriers they face to identify the specifics of the support they need for adaptation planning. Suggested topics for further study are provided in Section 8.2.
- Require local authorities to produce climate change risk assessments that consider topics additional to flooding. Use these to develop climate change adaptation plans, in line with guidance from the Adaptation Scotland programme.
- Provide public bodies with advice on how the regional economic impact assessments (see Section 6.2.2) and other national evidence relating to costs and benefits can be downscaled to support the case for local adaptation planning and investment.
- Align the Sustainable Scotland Network’s (SSN) system for rating the maturity of adaptation planning with the Adaptation Capability Framework. This would likely require organisations to assess and self-report their scores, which links to Recommendation 2. See Section 7.1 for more information.
- Explore ways to support public bodies with limited resources to produce adaptation plans or CCRAs. This could involve signposting to information provided by the Adaptation Scotland programme on easy wins, low-regret actions, no- or low-cost actions and partnership arrangements to share skills, knowledge and budgets.
- Clarify what information on adaptation should be reported within Public Bodies Climate Change Duties Reports and what information is unnecessary in terms of key performance indicators. See Section 7.4 for more information.
- In future, where mitigation programmes are undertaken or funded by the Scottish Government and public bodies would be involved in their delivery, signpost links between mitigation and adaptation.
Glossary / Abbreviations table
|
Adaptation |
In human systems: The process of adjustment to actual or expected climate and its effects, to moderate harm or exploit beneficial opportunities. In natural systems: The process of adjustment to actual climate and its effects; human intervention may facilitate adjustment to expected climate and its effects. (IPCC) |
|
Mitigation |
A human intervention to reduce emissions or enhance the sinks of greenhouse gases (IPCC). |
|
CCC |
Climate Change Committee |
|
CCRA |
Climate Change Risk Assessment |
|
GHG |
Greenhouse Gas |
|
GCoM |
Global Covenant of Mayors |
|
GCR |
Glasgow City Region |
|
LA |
Local Authority |
|
LCLIP |
Local Climate Impacts Profile |
|
NHS |
National Health Service |
|
PBCCDR |
Public Bodies Climate Change Duties Report |
|
PSCAN |
Public Sector Climate Adaptation Network |
|
SECAP |
Sustainable Energy and Climate Action Plan |
|
SDaC |
Sustainable Design and Construction Guide |
|
SNAP |
Scottish National Adaptation Plan |
|
Sniffer |
Scotland and Northern Ireland Foundation for Environmental Research |
|
SSN |
Sustainable Scotland Network |
Introduction
Context
Public bodies are at the forefront of responding to climate change, given their roles as health, education, housing and social care providers, emergency and risk management agencies, and more. Under the Climate Change (Duties of Public Bodies: Reporting Requirements) (Scotland) Order 2015, public bodies in Scotland are required to produce annual reports on their compliance with their statutory climate change duties, covering mitigation, adaptation and sustainability. These are known as Public Bodies Climate Change Duties Reports (PBCCDRs).
Although public bodies are required to report how they are contributing to help deliver the national adaptation plan and whether they have their own climate adaptation plans, some organisations do not have them; it is not a statutory requirement. The plans that do exist demonstrate varying levels of maturity and detail.
The Scottish Government has identified that a particular gap exists regarding costs and benefits of adaptation measures. This presents a barrier to action in several ways, e.g. making it difficult to:
- Determine the required levels of resilience
- Identify the best use of public sector resources and which projects to prioritise
- Understand who will be affected and how, as well as who bears the cost, which is important in the context of a just transition
- Engage with stakeholders and generate buy-in
- Develop business cases and obtain funding
This research study reviews the current ‘state of play’ of adaptation planning in Scotland, highlighting common themes, similarities, and differences among public bodies. It summarises available information on costs and benefits, to help inform a collective understanding among stakeholders and highlight knowledge gaps.
Climate change terminology
Adaptation vs. mitigation
This study focuses on climate change adaptation plans. Adaptation in this context refers to actions that are taken to manage and respond to the effects of climate change. This is distinct from climate change mitigation, which refers to actions that are intended to reduce greenhouse gas (GHG) emissions, and thereby limit how much climate change occurs in the future.
In some cases, adaptation actions help to mitigate emissions, and vice-versa. For example, planting trees can help to provide cooling and shade in a warming climate (adaptation) while also removing carbon dioxide from the atmosphere (mitigation). In other cases, actions may contradict or subvert each other.
This review found several examples of climate change plans that confused adaptation and mitigation (for more information, see Sections 5.5 and 5.6). It also found examples where the linkages were either ignored or not fully acknowledged. There is a particular risk of confusion because climate change adaptation actions may be described as ‘mitigating climate risks’ in the standard language of risk management. This is distinct to climate mitigation actions that mitigate greenhouse gas emissions.
Risks: The interaction between hazard, vulnerability and exposure
The IPCC defines risk as, ‘The potential for adverse consequences for human or ecological systems, recognising the diversity of values and objectives associated with such systems […] In the context of climate change impacts, risks result from dynamic interactions between climate-related hazards with the exposure and vulnerability of the affected human or ecological system to the hazards.’ (IPCC, 2019)
Climate hazards include phenomena like heatwaves and floods, exposure refers to the presence of people, assets or services in places that could be affected by hazards and vulnerability is the predisposition to be adversely affected.
Methodology
Scope of the study
This study primarily focused on the climate change adaptation plans or strategies produced by Local Authorities and NHS Boards. This included consortium studies by three regional adaptation partnerships: Climate Ready Clyde, Climate Ready South East Scotland (SES) and Highland Adapts. At the request of the Scottish Government, the study was expanded to include Historic Environment Scotland, Scottish Water and Transport Scotland.
The study prioritised documents using a tiered approach:
- Tier 1: Climate change plans or strategies that focus on adaptation and include ‘adaptation’ in the title.
- Tier 2: Other climate change strategies or action plans with adaptation-related content (even if the primary focus is on mitigation)
- Tier 3: Supporting documents and other evidence, such as climate change risk assessments (CCRAs), which contain information relevant to adaptation planning within Tier 1 and 2 documents.
Unless otherwise specified, the study did not examine other plans, strategies and documents where climate change was not the primary topic. Examples would include Local Development Plans, Flood Risk Assessments and Corporate Strategies.
Adaptation is often incorporated into multiple documents, to varying levels of detail. For simplicity, this report refers to all Tier 1 and Tier 2 documents as ‘adaptation plans’; however, readers should be mindful that the term is being used in a broad sense. Note, this tier system has been developed solely for the purpose of this study, to differentiate between various types of documents that were reviewed.
Research approach
This study comprised a desk review of climate adaptation plans and related documents as described in the previous section. The review was carried out from July to December 2024.
The initial task was to create a data collection template, ensuring consistent information recording. PBCCDRs for relevant public bodies were identified through the SSN website. Documents that were not publicly available were requested from the relevant public bodies.
Each document was then reviewed and evidence collated within the data template. The templates were collated into summary sheets to enable thematic analysis. An overview of these data can be found in the accompanying spreadsheet.
Limitations of the approach
This project is based on a desk review only. The results have not been informed by additional stakeholder consultation.
As stated previously, the scope of this review focused on dedicated climate adaptation plans/strategies. Climate adaptation measures that are integrated into other documents, such as Local Development Plans, may not be captured if they are not included in the organisation’s main climate change plan(s).
Public bodies may hold additional information or evidence relevant to climate adaptation, including quantified costs and benefits, that was not captured by this review. For example, the costs of additional flood protection infrastructure may have been assessed as part of individual business cases.
If an organisation has carried out further work on climate adaptation since its 2023/24 PBCCDR was published, it may not be included in this review. The same applies to any ongoing work or documents that are not yet finalised.
It is possible, although unlikely, that this review omitted some Tier 1 and 2 documents that are available online. This might be the case if they are not included in PBCCDRs, cross-referenced in other documents, or clearly signposted on the relevant public body’s website.
Overview of public body adaptation plans
This section summarises the overall landscape in regard to climate adaptation planning, for the Scottish public bodies that were reviewed.
How many public bodies have climate adaptation plans?
As noted within Section 4.1, adaptation planning is often incorporated into a wide variety of plans, strategies and other documents. As a result, simple metrics – such as the number of adaptation plans or how many actions they contain – are difficult to calculate. They also do not convey the overall level of maturity of public bodies’ climate adaptation planning.
To highlight the overall complexity of the landscape, consider the following example. West Dunbartonshire Council has produced a Climate Change Strategy that addresses both adaptation and mitigation but primarily focuses on the latter (West Dunbartonshire Council, 2021). The Strategy is supported by a Climate Change Action Plan. Both documents are structured around nine themes, of which ‘Climate Impacts, Risk and Adaptation’ is one. The adaptation section contains three actions: (1) to deliver relevant actions set out in the Glasgow City Region (GCR) Climate Adaptation Strategy, (2) to undertake a local CCRA and (3) to use the Adaptation Capability Framework to identify areas for further improvement. The reference to Glasgow City Region acknowledges a separate piece of work, underpinned by a regional CCRA and economic impact assessment, that has been produced by Climate Ready Clyde (Climate Ready Clyde, 2021). This relationship is illustrated in Figure 1.

Based on this review, among the 32 Local Authorities that were assessed:
- Nearly all Local Authorities have either a Tier 1 and/or Tier 2 document, indicating that some level of climate adaptation planning has been carried out, either individually or as part of a regional consortium. Note that the level of maturity and detail varies widely, as will be discussed in various sections of this report.
- Approximately 2/3rds of Local Authorities have access to a CCRA, either for their council area and/or as part of a regional consortium.
- Fewer than 1/3rd of Local Authorities have a specific, dedicated climate adaptation plan (a Tier 1 document as defined in Section 4.1).
- A small number of Local Authorities (up to 3) appear not to have undertaken any climate adaptation planning. It is acknowledged that adaptation might be addressed in wider documents and strategies which were excluded from this review.
Among the 14 regional NHS Boards and 8 special NHS boards:
- All 22 have undertaken a CCRA using a standard template.
- 18 of them have produced adaptation plans by listing actions against risks within their CCRAs. These combined CCRA/action plans have been counted as Tier 1 documents. Of those, 3 have also produced separate climate change strategies and/or action plans (Tier 2 documents).
- One NHS Board which does not have a Tier 1 adaptation plan has produced a separate climate change strategy (Tier 2) which discusses adaptation at a high level.
An additional challenge was understanding how the adaptation plans and related documents (such as wider climate change strategies) produced by each public body interrelate. The research found several instances of organisations that had produced a form of adaptation-related documentation that was not referenced in their PBCCDR. There were also examples where key documents, such as regional adaptation plans with supporting evidence bases, were mentioned in passing but not highlighted as being particularly significant within the wider context of the public body’s adaptation planning or governance approach. These issues could indicate a lack of internal awareness of what planning has been undertaken and/or confusion about what to include in the PBCCDR. On the latter point, it may be useful to provide organisations with further clarity (see recommendations in Section 8.3).
Authorship of climate adaptation plans and other documents
Based on this review, the Tier 1 adaptation plans for most of the NHS boards, Scottish Water, Transport Scotland and HES appear to have been undertaken in-house, i.e. there are no other authors listed within the documents that were reviewed. However, correspondence with NHS NSS has confirmed that some NHS Boards had funding for external consultancy support to produce their combined CCRA/adaptation plans.
For Local Authorities, there are fewer Tier 1 climate adaptation plans. With the exception of the 2012 adaptation strategy by Highland Council, all of these appear to have either been produced in collaboration with other regional stakeholders or some other form of external support. The majority of Local Authority Tier 2 documents appear to be produced in-house, but as in the case of NHS Boards, some of these are known to have had input from external consultancies. Local Authority Tier 3 documents were more likely to have consultancy firms listed as the main authors, often being commissioned by a consortium. Although the sample size is small, the difference in authorship between Tier 1 and Tier 2 documents is notable. It might suggest that Local Authorities have higher in-house skills and capacity to develop mitigation plans compared with adaptation plans. It could also signify a preference for partnership working on adaptation. The two are not mutually exclusive.
Varying levels of additional support were provided by the Adaptation Scotland. Adaptation Scotland is a programme funded by the Scottish Government, which provides advice and support to businesses, communities and public sector organisations seeking to become more resilient to the effects of climate change. In this advisory capacity, Adaptation Scotland offer tools and guidance for public bodies undertaking adaptation reporting (see Table 1 below).
Joint plans have been developed at the regional scale to promote collaborative climate adaptation action, sharing guidance and resources between public bodies. These include Climate Ready Clyde (CRC), Climate Ready South East Scotland (SES) and Highland Adapts. Appendix A contains a list of the organisations that are involved in each of these consortia.
It is understood that Perth and Kinross, Angus and Dundee Councils are also currently exploring opportunities to create a Tayside Regional Adaptation Partnership. A list of regional and place-based adaptation partnerships is available on the Adaptation Scotland programme’s website (Adaptation Scotland, n.d.).
What standards, guidance and tools do they use?
Public bodies use a range of guidance and tools to inform their adaptation planning.
- For Local Authorities, 14 of the 32 councils’ PBCCDRs referred to the Adaptation Scotland programme, although not all have used these resources and the outputs show considerable variation.
- NHS boards are required to carry out CCRAs in a standard format using templates provided by NHS National Services Scotland (NSS), and then use these to inform adaptation plans.
- Historic Environment Scotland and Transport Scotland also state in their PBCCDRs that they have used Adaptation Scotland’s Capability Framework (Adaptation Scotland, 2019). Scottish Water is also understood to have utilised this framework although this is not specifically mentioned in the documents that were reviewed.
The table provides more information on the standards, guidance and tools that were referred to in the documents that our team reviewed.
|
Name |
Description |
Comments |
|---|---|---|
|
Adaptation Scotland |
Adaptation Scotland is a programme funded by the Scottish Government and currently delivered by sustainability charity Sniffer. Adaptation Scotland provides a range of support and resources, including:
If following the Adaptation Capability Framework, public bodies are expected to undertake a self-assessment of their progress on adaptation planning using the Benchmarking Tool. For more information, see Appendix C. |
17 of 32 Local Authorities specifically mentioned having engaged with one or more of these resources, as did Historic Environment Scotland and Transport Scotland. Out of 32 Local Authorities, 24 are members of the Public Sector Climate Adaptation Network (PSCAN). Based solely on a desk review, this study was unable to determine the extent to which NHS Boards have engaged with the Adaptation Scotland programme. |
|
NHS NSS tools |
NHS National Services Scotland (NSS) have collaborated with Health Facilities Scotland and JBA Consulting to provide a range of climate change resources for health boards in Scotland. These are intended to help assess climate change risks and develop adaptation plans, focusing on assets and physical infrastructure. Tools include:
NHS Boards are required to carry out CCRAs using the template provided, and then use this to inform an adaptation plan. |
Aether was provided with a summary of NHS adaptation plans (not publicly available). According to that review, 22 NHS boards have completed CCRAs and 18 have produced adaptation plans using NHS NSS tools. Many of these also referred to the SDaC when discussing future planning for their buildings. |
|
LCLIP |
The Local Climate Impacts Profile (LCLIP) tool has been developed by the UK Climate Impacts Programme (UKCIP). The simple tool helps organisations assess their exposure and vulnerability to weather and climate. Note that UKCIP has been discontinued. |
Three Local Authorities made reference to this tool in the documents we reviewed. |
|
SECAP |
Signatories to the Global Covenant of Mayors (GCoM) commit to producing a Sustainable Energy and Climate Action Plan (SECAP). This includes a climate risk and vulnerability assessment which are entered into in an Excel-based template, following GCoM’s methodology. |
At least three Local Authorities (Angus, Fife and Dundee Councils) have produced a SECAP. |
Table 1: Standards, guidance and tools referenced in public bodies’ climate adaptation plans
It is likely that other standards, guidance and tools (particularly ones from the UK Climate Impacts Programme) have been used even if they were not captured by this review. This review did not record any specific references to the internationally-recognised ISO 14090:2019 standard, although it underpins the NHS NSS requirements.
Even among public bodies that referenced the same guidance, the outputs still varied in scope, content, themes, structure, and level of detail. This could be due, in part, to the fact that the Adaptation Scotland Capability Framework allows flexibility for organisations that are at different stages of maturity in planning for climate change adaptation, and the Adaptation Scotland website offers a wide range of tools and resources which public bodies can choose to adopt. The guidance is non-prescriptive and is designed to be tailored to the organisation’s needs.
Tools were also used differently by different organisations. For example, not all NHS boards responded to all of the prompts in the CCRA template. These differences in overall scope and content are explored more in the next section.
Overall scope and content of adaptation plans
Local Authorities
Although some Local Authority’s adaptation plans focus on risks to their own organisation’s assets and services, most are area-wide and cross-sectoral in their approach. In other words, they address issues that the council can influence directly, as well as those that are relevant to the geographic area as a whole where the council may have indirect influence.
There is wide variation in the level of detail and complexity in adaptation planning for Local Authorities. For example, Edinburgh City Council produced an adaptation plan in 2016 (Edinburgh City Council, 2016) which has already been updated with a new one (Edinburgh City Council, 2024). Whereas, for some Local Authorities, adaptation planning includes only a brief reference to adaptation within a document that is primarily mitigation-focused.
Regarding the specific climate hazards that the plans consider, the most common are flooding and severe weather. Many of the plans also discuss the impacts of climate change on the natural environment, green spaces or green infrastructure, and biodiversity. Overheating is mentioned in some of the plans but overall is not a key focus. This may reflect the types of climate hazards that have historically been more common in Scotland (flooding) and those that are more visible (the natural environment and green spaces).
Unlike NHS board plans (see next section), not all of the Local Authority plans were supported by a CCRA. Those that had undertaken a CCRA tended to address climate hazards, but did not necessarily assess exposure or vulnerability (see definitions in Section 3.2).
There was not a clear link between the level of detail of the adaptation plans and whether or not the Local Authority had a CCRA as part of their evidence base. There were some that had access to regional CCRAs (e.g. via Climate Ready Clyde) but the extent to which those findings had been incorporated into locally-specific climate adaptation plans or strategies was unclear based on this desk review. In other cases, organisations may have undertaken a CCRA as a first step but not yet produced an adaptation plan. Those organisations might be expected to have more detailed adaptation plans but it is not yet possible to say.
In terms of other commonalities and themes, there did not appear to be a clear correlation between the level of adaptation planning a Local Authority had undertaken, and its budget or number of employees. This is linked to the fact that some local authorities have joined together to produce regional risk assessments or strategies (see Appendix A).
Similarly, to the extent that there were regional differences in overall levels of adaptation planning, these were related to whether or not organisations were part of those joint strategies.
NHS Boards
NHS boards’ adaptation plans are targeted at the level of their own organisation, healthcare assets and services, and supply chains. Mostly, the focus is on physical assets. Based on information provided by the project steering group, it is understood that this focus was intentional, due to a need to narrow scope in line with budget and resourcing constraints.
As part of NHS NSS requirements, NHS boards are required to undertake a CCRA and develop adaptation plans using a standard Excel-based template. It includes the following headings, which are presented sequentially in the order that they appear.
- Risk type;
- Asset group;
- Relevant climate hazard;
- Assets at risk;
- Potential impact category;
- Risk exposure score;
- Existing [risk] mitigation measures;
- Recommended adaptation measures;
- Residual risk exposure score;
- Risk owner;
- Delivery partners;
- Timeline;
- Financial costs;
- Monitoring approach.
In general, there tends to be less variance in scope between NHS Boards plans, compared to Local Authority plans. Notably, although the template is framed as a risk assessment, many of the actions proposed in response to specific hazards are to undertake more detailed assessments of the risk. For more information on actions, see Section 5.6.
In addition, at least six NHS Boards have produced broader climate change strategies (or similarly titled documents) and most of these discuss adaptation at a high level.
NHS Boards plans are generally focused on hazards such as flooding, overheating, structural damage from severe weather, and general risks to the estate and services. For example, in the NHS Greater Glasgow and Clyde Climate Change and Sustainability Strategy, one adaptation action focuses on utilising the existing outdoor estate to retrofit green infrastructure and combat increased flooding (NHS Greater Glasgow and Clyde, 2023). NHS Greater Glasgow and Clyde was a stakeholder within the Climate Ready Clyde group until 2024, demonstrating that some NHS Bodies, like some Local Authorities, are benefitting from shared regional learnings.
Other organisations
Historic Environment Scotland’s (HES) adaptation plan focuses on sector-specific climate risks (Historic Environment Scotland, 2021). The adaptation plan is accompanied by a detailed project methodology and results report, including results of the CCRA. A risk management strategy and severe weather policy has also been created to support the Climate Ready HES approach. The Adaptation Scotland Capability Framework was used to inform the organisation’s action plan. The plan groups risks into 5 broad categories: physical climate risks to physical assets, natural capital, operations, people and transition risks. For more detail on transition risks, see Appendix D.
Transport Scotland’s adaptation plan covers its area of operation, which covers all of Scotland (Transport Scotland, 2021). It outlines seven transport related climate risks and prioritises four high level strategic outcomes to help achieve the vision of a well-adapted transport system in Scotland. Transport Scotland used resources from the Adaptation Scotland programme to develop its plans. The risks are evidenced using the UK CCRA and a separate CCRA has not been undertaken for the organisation. The strategic outcomes relate to trunk roads, rail network, aviation network and maritime network. Each strategic outcome includes sub-outcomes which provide a much narrower scope for action. For example, for the strategic outcome relating to trunk roads, one sub-outcome is to deliver a programme of proactive scour schemes across the network.
Like Transport Scotland, Scottish Water’s adaptation plan is focused on its own assets and operations nationally (Scottish Water, 2024). The plan is embedded within their overall risk management process. It covers eight main themes, which include: impact on services, drought, deteriorating water quality, customer flooding and environmental pollution, waste water and environmental quality, asset flooding and coastal erosion, interdependent risks and enablers. Outcomes and outputs for each adaptation action are clearly defined along with timelines for adoption and enabling actions. The plan is based on a CCRA that contains two climate scenarios, in line with CCC recommendation to plan for a 2°C increase in global temperatures but assess for a 4°C increase.
Themes and structure of adaptation plans
Most of the adaptation plans reviewed in this study were structured around multiple thematic areas. However, there was little consistency in what these themes were and the scope of what they covered within different plans. This was true when comparing different types of organisation (e.g. NHS board vs. local authority) as well as when comparing across organisations of the same type (e.g. NHS board with NHS board). The thematic groupings used can be broadly categorised as:
- Broad sectoral themes such as buildings, infrastructure and biodiversity – This is the most common way of defining themes. It is similar to the outcomes used to structure the third Scottish National Adaptation Plan (SNAP3). The thematic areas are not uniform across plans that use this approach and often different language is used to describe similar themes, for example ‘property assets and housing’ and ‘buildings’. A theme relating to nature, the environment and/or biodiversity was common to almost all plans that used this approach, and the built environment was also a common theme. Of the outcomes in SNAP3, the ‘economy, business and industry’ theme was least prominent across plans.
- Sector-specific themes – For non-local authority organisations, including NHS boards, an approach similar to the sectoral themes above may be used but with specific themes more closely aligned to their delivery functions. For example, the Transport Scotland plan is structured around themes including trunk roads, rail, aviation and maritime.
- Themes based on climate hazards – Some of the adaptation plans are structured around themes such as ‘flooding’, ‘heat’, ‘drought’ and ‘coastal adaptation’. This was most common among NHS Boards, as the CCRA template prompts the user to list actions against each risk (although some NHS Boards had also produced separate climate change strategies that addressed adaptation at a high level and did not follow the same structure). Overall, the plans generally have a stronger focus on flooding than other hazards, likely reflecting the current risk profile in Scotland.
- Enablers – Many of the plans also contain at least one theme based around enablers for adaptation action, including governance, building understanding and knowledge, working in partnership and monitoring and evaluation.
- Climate adaptation as one theme in a wider strategy – Some organisations have mitigation and adaptation combined into a single strategy document. Those tended to include a number of chapters of mitigation themes (transport, waste, land use etc.) and one or two additional chapters on adaptation and/or resilience. Having a single strategy could theoretically help with integrating adaptation and mitigation actions but in many cases this opportunity has been missed (see Section 5.6).
Some plans apply a mix of the above approaches, for example, using primarily sectoral themes with an additional chapter on a topic such as flooding or governance.
The wide variety of themes identified in the adaptation plans likely reflects the local and function specific nature of risk and adaptation to different organisations, as well as differing organisation priorities. However, this diversity of themes does make it difficult to compare plans and establish whether individual plans contain comprehensive coverage of the relevant risks and necessary actions.
Not all plans explicitly acknowledge interactions between themes. This creates a risk of siloed working and missed opportunities for join-up.
Inclusion of specific actions and policies in adaptation plans
Most of the plans include relatively high-level actions with a focus on planning and policy making rather than delivery and implementation. This suggests that the organisations may not yet be at a sufficiently mature stage of adaptation planning to have a delivery focus. For example, many plans include actions like ‘Set out a proactive approach to climate change adaptation within our Asset Management Plan’ and ‘Develop policies to strengthen the resilience of the transport network to the impacts of climate change’. In some cases, actions like ‘maximise partnership approaches’ are suggested, without outlining clear mechanisms for how partnerships will be built or who needs to be involved. As a result, implementation and monitoring progress against the action may be difficult (see Section 5.7 for further information).
Mirroring the diversity of themes within public bodies’ adaptation planning, a wide variety of adaptation policies and actions have been proposed. Some actions were common across many plans. For example, many included adaptation actions aiming to expand and protect green space and actions to improve governance such as incorporating climate risk into corporate risk registers; note, this is a specific capability and range of tasks within the ACF. Fewer plans included actions to reduce risks due to high temperatures. Actions aiming to address the higher exposure of rural and island communities were limited, even amongst local authorities with significant rural populations. In some cases, including the plans for Transport Scotland, Angus Council and Shetland Council, vulnerability due to the greater reliance of remote communities on specific transport links such as ferries and other infrastructure was acknowledged but specific, targeted actions to address this were not included or have not yet been developed. One exception was the Highland Council, which included an action to map vulnerable communities and sectors in their 2012 plan (Highland Council, 2012).
Overall, there is limited information on how actions have been prioritised, including a lack of direct use of information from risk assessments to ensure the most significant risks are acted upon. Historic Environment Scotland’s plan was an exception in that a relatively detailed methodology document accompanies their adaptation plan.
In many cases, it was not clear from reviewing the documents in this study how many plans commit to new or strengthened actions, rather than reiterating actions that would take place anyway. For example, many actions relating to flooding may be covered under existing local flood risk management work. This is a challenge when it comes to costing adaptation specifically.
Adaptation and mitigation actions are sometimes mis-categorised. SSN found, in their analysis of PBCCDRs for the year 2022/23, that 10% of NHS boards and 6% of local authorities listed mitigation measures in response to questions on adaptation (Sustainable Scotland Network, 2023). Examples of this confusion have been found within a number of plans. For example, the resilience section of one Local Authority plan refers to ‘milestones for our resilience journey to reduce GHG emissions’. There is an opportunity here for further training and knowledge dissemination.
Opportunities to join up adaptation and mitigation action, particularly where a single climate strategy covers both areas of work, have often been missed. For example, a number of plans contain actions to improve insulation of buildings to reduce emissions without explicitly considering the potential synergies with adaptation, such as the potential to reduce costs by retrofitting adaptation and mitigation measures to buildings at the same time, or the increased risks of overheating in insulated but poorly ventilated buildings. However, there are examples of plans that do acknowledge the synergies even if this is not a major focus. For example, NHS Greater Glasgow and Clyde have an action to ‘Ensure energy models take account of future weather trends and models to be monitored in use with systems adjusted as required’ (NHS Greater Glasgow and Clyde, 2023) and East Ayrshire acknowledges the benefits of green infrastructure for reducing flooding, improving biodiversity and sequestering carbon (East Ayrshire Council, 2021).
Approach to monitoring, evaluation and learning
Monitoring, evaluation and learning is a key part of the adaptation policy cycle which allows progress and performance to be understood and learned from to inform future policy development and implementation. It also allows decision makers flexibility to evolve their approaches as new information becomes available. At the national level, the Scottish Government have developed a monitoring and evaluation framework as part of SNAP3.
Of the NHS boards and Local Authorities that have specific, dedicated adaptation plans, or broader climate strategies that include adaptation, just under two thirds explicitly mention some kind of monitoring and evaluation arrangements. A similar number have plans to review and update these, many on an annual timescale but all within the next five years.
The reason for some plans not including monitoring and evaluation plans is not known but could be due to a lack of resource or a lack of skills or knowledge. Some of those not including monitoring plans have used standards or guidance in the development of their plans, such as the Adaptation Scotland Capability Framework.
The mechanisms proposed for monitoring and evaluation vary across different organisations. In some cases, plans acknowledge the need for monitoring and evaluation but do not include designs of specific frameworks, relying instead upon reporting through the PBCCD or setting up a steering group to review on an ongoing basis.
For the most mature plans, more detailed frameworks of governance and internal reporting, including performance indicators for actions and themes, have been developed. However, indicators are not comparable across different plans, meaning comparison or aggregation across different organisations would not be straightforward. For example, both the Aberdeen City Council and Dundee Council action plans contain actions relating to raising awareness of the health impacts of climate change. Aberdeen suggest measuring progress as the number of people reached by the campaigns for raising awareness (Aberdeen City Council, 2022) whereas Dundee proposes indicators relating to the number of people affected by illness (Sustainable Dundee and the Dundee Partnership, 2019)
Variations in key performance indicators across the public sector is likely to make it harder to consistently track progress at a national level.
Information on costs and benefits in the public body adaptation plans
Introduction
How have we defined costs and benefits?
This was interpreted broadly to include both monetary and non-monetised costs, as opposed to only costs associated with financial spend, and benefits associated with adaptation actions. To holistically appraise the costs and benefits of adaptation, three types of information need to be considered:
- The cost of inaction – costs incurred due to the impacts of climate change in the absence of further adaptation
- The cost of adaptation measures – the spend and investment required to implement adaptation measures
- Ancillary costs and benefits – the wider impacts of adaptation action on the economy, society and the environment that go beyond avoided losses. For example, adaptation actions that enhance green space could result in benefits to human health and wellbeing.
The IPCC’s view on cost-benefit analysis
In ‘Economics of Adaptation’, the IPCC acknowledges that conventional cost-benefit analysis may not be the most suitable approach when it comes to adaptation measures (IPCC, 2018). The report cites several reasons for this, such as the inherent uncertainty associated with different climate futures, and the difficulty of ascribing a monetary value to non-market impacts on public health, heritage, ecosystem services, etc.
According to the IPCC, ‘A narrow focus on quantifiable costs and benefits can bias decisions against the poor and against ecosystems and those in the future whose values can be excluded or are understated.’ On this basis, the IPCC suggests that, in some cases, it may be more appropriate to use multi-metric decision making techniques. These might better enable decision-makers to weigh competing objectives.
In the UK context, research has recently been conducted into the latest methods for valuing the costs and benefits of climate risk and adaptation policy (Cambridge Econometrics, 2023) and the economics of adaptation (Advisory Group on the Economics of Climate Change Risk and Adaptation, 2024) in preparation for the fourth UK Climate Change Risk Assessment (CCRA4). Other relevant recent work includes The Costs of Adaptation, and the Economic Costs and Benefits of Adaptation in the UK (Paul Watkiss Associates, 2022), Barriers to financing adaptation actions in the UK (Frontier Economics & Paul Watkiss Associates, 2022) and Investment for a Well Adapted UK (Climate Change Committee, 2023).
Local authorities
Overview
The majority of quantitative cost-benefit information comes from two regional economic impact assessments produced on behalf of Climate Ready Clyde and Highland Adapts. More information on these is provided in the next section.
Several Local Authorities described quantitative costs or benefits in a more light-touch way, making a small number of references to these without providing more detail. Usually this referred to flood damages or infrastructure. For example, the City of Edinburgh’s adaptation plan (Edinburgh City Council, 2016) refers to the cost of maintaining and repairing coastal defences between 2008-2011 (£740,000). Aberdeen City Council and Dundee City Council both describe the cost of damage due to unmitigated flooding. The cost of flooding to Aberdeen without intervention is estimated to be £12.5m (Aberdeen Adapts, 2022) and the cost to residents, businesses and infrastructure in Broughty Ferry in Dundee of a 1 in 200 year flood is estimated to be in the region of £97m. (Sustainable Dundee and the Dundee Partnership, 2019).
It is considered likely that Local Authorities have a more detailed understanding of the costs and benefits of flood prevention measures because they have statutory duties in relation to flooding. There may be other topic areas where the cost of interventions has been or could be estimated by different departments, even if it is not captured within their climate adaptation plans. An example might be the cost of repairing potholes, which could increase due to climate change because of increased temperatures, rainfall and freeze-thaw cycles.
Some adaptation plans referred to the cost of inaction. This was framed as part of the overall rationale for taking steps to address climate change, rather than being used as a counterfactual to support specific adaptation measures. For example, Aberdeen City Council refers to the Stern Review (Stern, 2006) when explaining that the benefits of early action outweigh the costs of action. It also mentions the potential impact on gross domestic product (GDP). Perth and Kinross state that, ‘In general, each £1 spent on resilience measures has been demonstrated to generate between £2-£10 pounds in savings’ although no citation was provided (Perth and Kinross Council, 2021).
Several Local Authorities acknowledge the lack of information on costs and benefits, e.g.:
- The LCLIP for Aberdeenshire (Aberdeenshire Council, 2019) recommends introducing a ‘cost code to capture costs from all extreme weather events’ and indicates that the Council may investigate setting up a central fund for climate adaptation.
- One of the City of Edinburgh’s stated objectives in the draft Climate Ready Edinburgh Plan 202-2030 (Edinburgh City Council, 2023) is to ‘Carry out further research to enable options appraisals and cost benefit analysis of different adaptation responses in Edinburgh to improve decision making.’
The regional economic impact assessments (see Section 6.2.2) demonstrate that Local Authorities have been working together to address this gap, and there is evidence that there is an appetite for further collaboration. It is understood that Climate Ready Clyde has been exploring options to develop an Adaptation Finance Lab to help ‘support alternative financing models for adaptation action within Glasgow City Region’ (Climate Ready Clyde, 2021).
Regional reports
Two regional economic assessments have been produced by Paul Watkiss Associates on behalf of Climate Ready Clyde and Highland Adapts. These reports consider the overall economic impacts of climate change on these regions and key sectors, providing a monetary valuation of ‘relevant costs and benefits to Government and society’. Together, these reports provide an evidence base for nine out of 32 Local Authority areas.
It should be noted that the costs set out in these reports relate to climate risks, i.e. the potential cost of inaction, as opposed to adaptation actions.
The methodology of both reports is informed by guidance set out in the UK Government HM Treasury Green Book, which is the guidance the government provides for appraising, monitoring and evaluating programmes, projects and policies. This mirrors the approach taken to quantify costs as part of the first, second and third UK CCRAs (although CCRA4 is expected to use a different approach).
The data sources used in these analyses come from a range of studies, with estimates of future cost based on different socio-economic and climate change scenarios. Therefore, the authors acknowledge that they do not necessarily provide a like-for-like comparison across different risks. They also state that the values would need to be adjusted for use in a cost-benefit analysis.
For Climate Ready Clyde, the regional analysis (Paul Watkiss Associates, 2019) includes:
- Current economic costs of extreme weather events, based on four recent examples in the Glasgow City region (the report notes that these costs are likely to be significant underestimates due to data gaps):
- December 2015 river floods (£4m – £10m)
- July 2012 surface water floods (£1m – £2m)
- October 2017 wind storm (>£20m)
- 2013 warm and dry summer (£20m)
- Potential economic costs (and benefits) associated with all risks identified in the regional CCRA
- Total economic costs, expressed as indicative order of magnitude estimates for the 2020s, 2050s and 2080s.
For Highland Adapts (Paul Watkiss Associates, 2024), it includes:
- Economic costs of flooding and wildfires
- Potential health costs of higher temperatures
- Impacts of reduced heating degree days
- Macro-economic or economy-wide costs
As part of the Highland Adapts project, additional sector reports were provided for (1) Energy (2) Forestry and Timber (3) Food and Drink.
We found one example of an organisation that had attempted to downscale these costs to a more local level. East Dunbartonshire Council has produced an evidence report to inform its forthcoming climate adaptation plan and this contains indicative costs against each of the adaptation actions that are proposed (East Dunbartonshire Council, 2019). However, in general, it is not clear how a Local Authority would be expected to downscale these estimates to support a business case for a specific, local project. Therefore, in addition to this type of regional assessment, additional forms of evidence may be needed.
Reflecting on the quantitative information available to Local Authorities, at present the majority comes from these two reports by a single consultancy firm. While we do not suggest that there is any issue with the methodology, there would be higher confidence in the results if they could be validated using different approaches.
NHS boards
All NHS Boards are required to undertake a CCRA using a standard template. The intention is that the information is then turned into a climate adaptation plan. The form prompts the user to indicate the financial cost of responding to each of the hazards that are identified.
In the CCRA template, costs are represented as a range which users can select from a drop-down menu. It is possible that the responses are simply estimates based on the user’s judgment rather than drawing from more detailed analysis.
This study reviewed CCRAs for 20 out of 22 NHS Boards. Of those that were reviewed:
- Two only included a risk assessment, with no adaptation actions or cost information.
- Two included adaptation actions, but left the cost section blank.
- The remaining 16 provided costs for some or most of the adaptation actions. However:
- In three cases, the same costs were listed in each row, which may indicate an error or oversight.
- In one case, the NHS Board only included costs for 3 out of 32 actions; however, rather than indicating a range using the drop-down menu, those costs appear to be specific quotes for building repair/upgrade work.
The guidance provided within the spreadsheet specifies that the financial costs relate to the cost to implement the proposed adaptation measure. However, it appears that some users have interpreted this in different ways, with some appearing to describe the cost of repairing damage, i.e. the cost of inaction.
Note the following:
- Aside from NHS Dumfries and Galloway, which included an extract of its risk assessment in its PBCCDR, none of the CCRAs are publicly available. This means that some of the cost information cannot be shared.
- Aether did not have access to any information about the methodology used to calculate the costs. Therefore, we cannot comment on the details of what the estimates include. For example, in several CCRAs, costs were indicated against a specific risk, but the proposed response was to undertake a further assessment of that risk. It is not clear whether the cost refers to the price of the assessment, or the potential cost of repairing damage.
Other organisations reviewed
The 2024 Adaptation Plan for Scottish Water (Scottish Water, 2024) describes the level of investment needed to respond to climate change impacts as being ‘in the range of £2-5 billion over the next 25 years.’ This was notable because it refers to costs as an ‘investment’, a term which acknowledges the long-term benefits and payback. However, the report does not explain how this figure was obtained. There are a few other similar costs cited, including £1.5bn having been invested in flooding/environmental projects in Glasgow, and £500m further investment needed for combined sewer overflows.
Transport Scotland’s adaptation plan (Transport Scotland, 2021) does not contain any quantitative information on costs or benefits. However, it contains information which suggests that these will be considered separately. For instance, a Vulnerable Locations Group has been established, which is expected to ‘deliver cost effective actions in the short term whilst developing a move to a long-term proactive approach, including a dedicated budget for climate adaptation.’
Historic Environment Scotland’s adaptation plan (Historic Environment Scotland, 2021) references the ‘triple dividend of adaptation, which is discussed qualitatively. This includes: (1) avoided losses (2) economic gains and (3) social, environmental and cultural benefits.
Key points regarding quantitative costs and benefits
Local Authorities: Overall, there is very little quantitative information on costs and benefits within Local Authority adaptation plans. Costs and benefits are addressed qualitatively to varying levels of detail. Two regional economic impact assessments have been produced, for Climate Ready Clyde and Highland Adapts, which together cover nine out of 32 Local Authorities. A small number of other adaptation plans cite costs for specific measures, mostly linked to flood damage and flood infrastructure.
NHS Boards: Those that undertake a CCRA using the standard template are prompted to record costs against individual risks, but not all have done so. In many cases it is not clear what the costs refer to. The costs primarily relate to the cost of upgrading infrastructure or repairing damage to assets (e.g. due to flooding).
Other organisations: Scottish Water referred to total investment costs at a high level in its adaptation plan. Transport Scotland and Climate Ready HES both address costs and benefits from a qualitative standpoint.
Reflections on the adaptation planning landscape
Maturity of adaptation plans
This section describes the overall maturity of adaptation plans, which can be assessed in different ways.
SSN measures the extent of adaptation action reported by organisations in their PBCCDs on a scale from ‘none’ to ‘advanced’, where advanced is defined as a ‘strategy or adaptation pathway with targets to assess progress on risk management and actions to address shortfalls.’
The Adaptation Scotland Capability Framework (Adaptation Scotland, 2019) rates organisations’ adaptive capacity as starting, intermediate, advanced or mature along four different axes relating to culture and resources, understanding, planning and implementation and working together. A benchmarking tool is provided for organisations to assess their own maturity. As there is no overall rating, an organisation can be ‘mature’ in one of the capabilities, but ‘starting’ in another. For more information, see Appendix C.
Within this report we have not formally defined a scale for how the maturity of an adaptation plan should be assessed. However, we have looked beyond reported action in the PBCCDRs to consider dimensions that influence the maturity of specific, dedicated climate adaptation plans where they exist. Dimensions that contribute to a mature plan, that have been discussed throughout this report, include:
- Clear objectives and a vision for adaptation are defined.
- A range of hazards and future scenarios are considered in a risk assessment that provides an evidence-based plan.
- Individual actions are specific, have ownership, timescales, resourcing and relevance.
- Monitoring and evaluation is in place.
- The plan has been co-developed with stakeholders.
- Synergies with mitigation actions are understood and exploited but adaptation and mitigation are not conflated.
SSN’s most recent summary analysis of PBCCDRs (Sustainable Scotland Network, 2023) assessed the extent of adaptation action reported, finding that 28% of local authorities and 65% of NHS boards reported limited adaptation planning, with 15% of NHS boards reporting no action at all.
There are some examples of more mature plans adhering to the principles outlined above, particularly amongst local authorities and the ‘other’ organisations reviewed here. For example, the City of Edinburgh Council updated its previous adaptation plan this year and the new plan contains numerous features of a more mature approach, including undergoing a consultation process during its development, setting out a high-level vision for adaptation and including timescales and ownership of specific actions. Conversely, there are also local authorities without consolidated adaptation planning and those that have confused adaptation and mitigation, so overall there is a wide range of capacity and maturity of planning in Scotland.
Unlike Local Authorities, all of the NHS plans were underpinned by a CCRA. They could be considered more mature than Local Authority plans by that metric. However, they generally focused on a narrower range of risks. It is therefore difficult to compare their maturity on a like-for-like basis.
This range of maturity and understanding across public bodies should be taken into account as further adaptation guidance is developed. Further work to understand the barriers for organisations to reach a greater level of maturity would be useful. It is acknowledged that organisations such as Sniffer may already have explored this topic and that Adaptation Scotland’s PSCAN offers an opportunity for organisations with less mature planning learn from those at a more advanced stage.
Finally, although this study did not specifically seek to compare adaptation plans against mitigation plans, it appears that adaptation plans are less mature overall.
Gaps and omissions in the adaptation plans reviewed
When taking a broad view of the documents that have been reviewed as part of this study, there are several notable gaps and omissions. The missing information may be recorded by public bodies in another form, or answers may be known internally by the organisation. Nevertheless, these gaps and omissions may have policy implications and could be investigated further to identify barriers to effective public body adaptation planning. These are presented in no particular order.
- With the exception of flooding, the implications for emergency planning and risk management were generally omitted from Local Authorities’ plans. For example, the potential need to revise major incident plans to reflect more severe weather events.
- Few organisations made an explicit link between adaptation and mitigation actions. Some of them mentioned potential co-benefits or the risk of unintended consequences. However, our team found various instances where there were linkages that had not been explored. This was not limited to mitigation but also applies to policies on health, biodiversity/nature, etc.
- Some public bodies provided evidence of engaging with stakeholders such as business groups or utility companies. However, the adaptation plans that were reviewed in this study contained relatively limited information about how the public bodies engaged with, and sought input from, affected communities. A few (e.g. Shetland, Aberdeen) did refer to having held public events. It is acknowledged that various forms of community engagement have been undertaken (examples include, but are not limited to, the Highland Adapts/Outer Hebrides Climate Story Maps and work undertaken as part of Climate Ready Clyde) which may not be referenced in published adaptation plans.
- Where organisations had produced their own adaptation plans, these generally did not appear to be coordinated with other public bodies operating in the same area except where regional partnerships exist. Several plans mentioned the need to consult with stakeholders, or cross-referenced regional studies that have been carried out. There was one example of an NHS board acknowledging that its adaptation response would rely in part on action taken by the Local Authority. However, that Council has not yet produced an adaptation plan so this desk review was unable determine the extent to which collaborative working may be taking place.
- Where climate risk assessments were carried out, hazards were usually considered, but vulnerability and exposure were frequently not addressed. It is therefore difficult to state whether organisations have targeted their adaptation actions appropriately.
- NHS boards that followed the CCRA template generally assessed the impacts of climate change on particular assets (e.g. flooding to car parks). They generally did not consider how climate change would affect the types of services they provide (e.g. having to treat different diseases).
Potential barriers
The scope of this study did not include an assessment of what barriers public bodies face when trying to develop more mature adaptation plans. However, our team identified a variety of potential contributing factors that could be explored in future:
- Adaptation might be considered a lower priority than other issues, given that public bodies face competing demands on their resources.
- For Local Authorities, the lack of dedicated climate adaptation plans may simply reflect the fact that they are not explicitly required to produce them.
- Public bodies may have insufficient in-house capacity to develop more detailed plans. This could be due to a lack of time and/or budget to produce a plan or (where necessary) upskill personnel to complete them. Where there is insufficient in-house capacity, the bodies may also lack the financial resources to commission the work externally. If public bodies have received training or guidance, factors such as staff turnover could prevent this knowledge from becoming part of the institutional memory.
- Although there is a variety of guidance available for public bodies to use for adaptation planning in general, some may be unaware of it, unsure how to access it, or not understand how to use it in the context of all the guidance that is available.
- As discussed in Section 6.1, it may be challenging to apply conventional cost-benefit analysis to adaptation measures. Although methodologies for doing this do exist, they may not be accessible for public bodies to use.
- Some organisations provide a wider range of services than others, or operate within a larger/more diverse geographic area. One reason their adaptation plans might contain less detail could be because they have to ensure that actions are relevant across all of their operations. A public body with a narrower remit might find it easier to develop specific adaptation actions.
It is important to gain a better understanding of what barriers public bodies face, because they may require different support and interventions.
Potential modifications to PBCCDRs
This review found that the responses to PBCCDRs that were intended to address climate change adaptation often included information that was not directly relevant. As a result, it was difficult to interpret the public bodies’ overall level of adaptation planning based on their PBCCDRs.
Below is a list of clarifications and questions that could be incorporated into the PBCCDR form or practical guidance to help address this issue. These are intended solely as examples for consideration.
- At the start of the adaptation tab, add wording to the effect of: ‘This section requests information about your organisation’s climate change adaptation plans. Adaptation in this context refers to actions that are taken to manage and respond to the effects of climate change. This is distinct from climate change mitigation, which refers to actions that are intended to reduce greenhouse gas (GHG) emissions, and thereby limit how much climate change occurs.’
- On Question 4a, clarify that a comprehensive CCRA would consider a range of topics, not just flooding. Alternatively, state that Local Authorities do not have to describe their Flood Risk Assessments unless these have been incorporated into wider climate adaptation planning or CCRAs.
- Add a new question or adjust Question 4b to ask, ‘Does your organisation have a dedicated climate change strategy and/or action plan that specifically addresses climate change adaptation?’
- ‘Have you assessed your progress against the ACF? If so, please provide your scores.’
- [Local Authorities only] ‘If providing information about your Local Development Plan, please focus on specific ways that climate adaptation has been considered. If the plan only addresses climate adaptation as an overarching theme, without requiring any specific assessments or actions to be taken, this information can be excluded.’
Conclusion
This work has provided an overview of the adaptation planning landscape among Scottish public bodies, focusing on local authorities and NHS boards. It has described the information on costs and benefits of adaptation that is contained in public bodies’ climate adaptation plans. It has also presented reflections on the overall maturity and level of progress among different types of organisations. In doing so, it will help inform a collective understanding among stakeholders and identify knowledge gaps.
Key findings, topics for further study and recommendations are provided below.
Summary of key findings
The study reviewed a wide range of plans, strategies and other documents that are relevant to adaptation planning. It was clear that many organisations have utilised guidance, tools and resources made available through Adaptation Scotland. Nonetheless, we have identified that public body adaptation plans vary widely in their scope, content and levels of maturity.
There were some key differences observed between local authorities, NHS boards and other organisations (Scottish Water, Historic Environment Scotland and Transport Scotland), which likely reflect these organisations’ different remits, sectors and the geographic areas that they cover. Notably, NHS boards are required to produce CCRAs and adaptation plans in a standard format whereas local authorities are not.
Affirming earlier findings by SSN, this study found multiple examples of confusion between climate change adaptation and mitigation. Therefore, public bodies’ self-reported levels of adaptation planning is not always accurate.
The adaptation plans reviewed in this study were found to contain minimal quantitative information on costs and benefits.
For local authorities, the majority of quantitative information that is available relates to the regional economic impacts of climate risks (i.e. the cost of inaction). This is set out in two reports, both undertaken by Paul Watkiss Associates. We found one example of a local authority that had attempted to downscale this information in order to indicate costs against local adaptation measures. Overall, however, the regional assessments may not be suitable for the purpose of developing a business case.
NHS boards, when carrying out CCRAs, are prompted to indicate the cost of adaptation measures in relation to each risk that they identify. However, in most cases these sections were left blank. Where costs were indicated, it was not always clear what they referred to. Our team did not have any information on the methodology used to estimate those costs.
Flooding is the one topic area where organisations clearly showed a more mature understanding of the risks, historic impacts/damages, and the costs and benefits of adaptation measures.
Some adaptation plans specifically acknowledge the lack of information on costs and benefits, citing this as an area where further study is needed. There is evidence that public bodies have an appetite for collaborative working to address these gaps, as demonstrated by the existing partnerships such as Climate Ready Clyde and Climate Ready SES.
Although not the focus of this study, our team has proposed some potential barriers to adaptation planning that merit further exploration. In our view, gaining a better understanding of those barriers is a prerequisite to identifying a suitable policy response.
Topics for further study
There were several questions that arose from this review which could be considered for further study:
- Barriers: Given the resources available to local authorities, what is preventing them from producing more detailed plans? A list of initial suggestions is in Section 7.3.
- Guidance: There is already a broad range of public sector and international standards that define the approach to adaptation planning. Would more targeted guidance on how to utilise available resources be useful, e.g. more clarity on how to fill out the PBCCDR and NHS CCRA templates to help standardise the outcomes? Should there be sectoral or regional guidance, e.g. targeted at island communities? Or is guidance not one of the key barriers that public bodies face? Note, any new guidance should consider opportunities to address the gaps described in Section 7.2.
- Missing information: Potentially, there could be more evidence on costs and benefits that is not reflected in the action plans or PBCCDRs.
- Governance: To what extent have organisations actually embedded adaptation into their other plans, strategies and operations? From the PBCCDRs, it was not always clear whether the public bodies were carrying out dedicated adaptation planning or simply reiterating work that would happen anyway e.g. flood risk assessments.
Recommendations
The table below presents recommendations for policy, based on this review.
|
Ref. |
Recommendation |
Rationale |
|---|---|---|
|
1 |
Engage with public bodies and undertake further research to understand the barriers they face to identify the specifics of the support they need for adaptation planning. Suggested topics for further study are provided in Section 8.2. |
Establishing the details and actions on the support that is needed will allow budgeting for targeting resources effectively. |
|
2 |
Require local authorities to produce climate change risk assessments that consider topics additional to flooding, and use these to develop climate change adaptation plans, in line with guidance from the Adaptation Scotland Programme. |
Local authorities are not currently required to produce adaptation plans. New statutory guidance is being developed. This could be used to encourage public bodies to have an adequate level of adaptation planning in place, with recognition of scope, remit and budget differences. |
|
3 |
Provide public bodies with advice on how the regional economic impact assessments (see Section 6.2.2) and other national evidence relating to costs and benefits can be downscaled to support the case for local adaptation planning and investment. |
This would make use of the existing evidence base. The authors of the regional reports acknowledge that the information would need to be adapted for use in a cost-benefit analysis as part of an outline business case. |
|
4 |
Align SSN’s system for rating the maturity of adaptation planning with the Adaptation Capability Framework. This would likely require organisations to assess and self-report their scores, which links to Recommendation 2. See Section 7.1 for more information. |
Currently these do not align, which makes it difficult to track progress. |
|
5 |
Explore ways to support public bodies with limited resources to produce adaptation plans or CCRAs. This could involve signposting to information provided by the Adaptation Scotland programme on easy wins, low-regret actions, no- or low-cost actions and partnership arrangements to share skills, knowledge and budgets. |
All local authorities could benefit from this information. For some, there may be instances where it would be better to focus on a small number of key actions instead of using limited resources to produce an adaptation plan that lacks detail or substance. |
|
6 |
Clarify what information on adaptation should be reported within PBCCDRs and what information is unnecessary in terms of key performance indicators. In particular, PBCCDR guidance should include clarity on the difference between mitigation and adaptation. See Section 7.4 for more information. |
Responses were inconsistent and often appeared to signpost to workstreams or documents that would have happened anyway. Some responses signposted to information that relates to mitigation, not adaptation. This has also been observed by SSN. |
|
8 |
In future, where mitigation programmes are undertaken or funded by the Scottish Government and public bodies would be involved in their delivery, signpost links between mitigation and adaptation. |
Considering mitigation and adaptation in parallel is important to maximise co-benefits and avoid unintended consequences. |
Table 2: List of recommendations and description of the rationale
References
Aberdeen City Council, 2019. Aberdeen Adapts: Climate Adaptation Framework, Appendix 1 – Consultation Summary. [Online]
Available at: https://committees.aberdeencity.gov.uk/documents/s105310/PLA.19.407%20-%20Appendix1%20ConsultationSummary.pdf
Aberdeen City Council, 2022. Aberdeen Adapts: Climate Adaptation Framework. [Online]
Available at: https://www.aberdeencity.gov.uk/sites/default/files/2022-11/Aberdeen%20Adapts_Nov1_proof.pdf
Aberdeenshire Council, 2019. Local Clmate Impact Profile. [Online]
Available at: https://aberdeenshirestorage.blob.core.windows.net/acblobstorage/b70a7fc3-42f6-4766-8d05-44642f2a010f/lclip-2019-high-res.pdf
Adaptation Scotland, 2019. Adaptation Scotland Capability Framework. [Online]
Available at: https://adaptation.scot/take-action/adaptation-capability-framework/
Adaptation Scotland, n.d. NHS Lanarkshire – Place-based and site specific action. [Online]
Available at: https://adaptation.scot/take-action/nhs-lanarkshire/
Adaptation Scotland, n.d.. Regional Partnerships. [Online]
Available at: https://adaptation.scot/our-work/regional-partnerships/
[Accessed 2024].
Advisory Group on the Economics of Climate Change Risk and Adaptation, 2024. Interim Report to the CCC – Advisory Group on the Economics of Climate Risk and Adaptation, s.l.: UK Climate Risk.
Cambridge Econometrics, 2023. Valuing the costs and benefits of climate change risk and adaptation policy, s.l.: UK Climate Risk.
Climate Change Committee, 2023. Investment for a well-adapted UK. [Online]
Available at: https://www.theccc.org.uk/publication/investment-for-a-well-adapted-uk/
Climate Ready Clyde, 2019. Glasgow City Region Climate Adaptation Strategy and Action Plan, Annex 1: Economic and Financial Assessment. [Online]
Available at: https://climatereadyclyde.org.uk/wp-content/uploads/2021/06/08-Annex-1-Economic-Case-and-Finanacial-Assessment.pdf
Climate Ready Clyde, 2021. Climate Change Adaptation Strategy and Action Plan. [Online]
Available at: https://climatereadyclyde.org.uk/climate-change-adaptation-strategy-and-action-plan/
Climate Ready Clyde, n.d. CRC Climate Vulnerability Map. [Online]
Available at: https://climatereadyclyde.org.uk/climate-vulnerability-map/
Comhairle nan Eilean Siar Council, 2022. Outer Hebrides Climate Rationale: An overview of our changing climate and impacts for the islands. [Online]
Available at: https://adaptation.scot/app/uploads/2024/08/ohcpp-climate-rationale-final.pdf
Dundee City Council, 2019. Dundee Climate Action Plan. [Online]
Available at: https://www.dundeecity.gov.uk/sites/default/files/publications/climateactionplan.pdf
East Ayrshire Council, 2021. Clean Green East Ayrshire: Climate Change Strategy. [Online]
Available at: https://www.east-ayrshire.gov.uk/Resources/PDF/C/Climate-Change-Strategy.pdf
East Dunbartonshire Council, 2019. Adaptation and Nature-Based Solutions Options Assessment Report:. [Online]
Available at: https://eastdunbarton.moderngov.co.uk/documents/s4704/Appendix%204%20-%20ANBS%20Options%20Assessment%20Report%2019-09-23.pdf
East Dunbartonshire Council, 2019. Adaptation and NBS Options Assessment Report. [Online]
Available at: https://eastdunbarton.moderngov.co.uk/documents/s4704/Appendix%204%20-%20ANBS%20Options%20Assessment%20Report%2019-09-23.pdf
Edinburgh City Council, 2016. Edinburgh Adapts: Climate Change Adaptation Plan 2016-2020, s.l.: s.n.
Edinburgh City Council, 2023. Draft Climate Ready Edinburgh Plan 2024-2030. [Online]
Available at: https://consultationhub.edinburgh.gov.uk/bi/climate-ready-edinburgh/user_uploads/draft-climate-ready-plan-for-consultation–22-jan-24-.pdf
Edinburgh City Council, 2024. Climate Ready Edinburgh Plan 2024-2030. [Online]
Available at: https://www.edinburgh.gov.uk/downloads/file/35638/climate-ready-edinburgh
Frontier Economics & Paul Watkiss Associates, 2022. Barriers to financing adaptation actions in the UK. [Online]
Available at: https://www.theccc.org.uk/publication/barriers-to-financing-adaptation-actions-in-the-uk-frontier-economics-paul-watkiss-associates/
Highland Council, 2012. Adapting to the Impacts of Climate Change in Highland. [Online]
Available at: https://www.highland.gov.uk/download/downloads/id/3584/adapting_to_climate_change.pdf
Historic Environment Scotland, 2020. Historic Environment Scotland Climate Action Plan 2020-2025. [Online]
Available at: https://www.historicenvironment.scot/archives-and-research/publications/publication/?publicationId=94dd22c9-5d32-4e91-9a46-ab6600b6c1dd
IPCC, 2018. Fifth Assessment Report (AR5), Chapter 17: Economics of Adaptation. [Online]
Available at: https://www.ipcc.ch/site/assets/uploads/2018/02/WGIIAR5-Chap17_FINAL.pdf
IPCC, 2019. Special Report on the Ocean and Cryosphere in a Changing Climate Glossary , s.l.: s.n.
NHS Greater Glasgow and Clyde, 2023. NHSGGC Climate Change and Sustainability Strategy 2023-2028. [Online]
Available at: https://www.nhsggc.scot/downloads/climate-change-and-sustainability-strategy-2023-2028/
Paul Watkiss Associates, 2019. Towards a Climate Ready Clyde: Climate Risks and Opportunities for the Glasgow City Region – Economic Assessment. [Online]
Available at: https://static1.squarespace.com/static/5ba0fb199f8770be65438008/t/5c70173ce4966bc8cf635bca/1550849870187/25+CRC+Climate+Risk+-+economic+impact+report.pdf
Paul Watkiss Associates, 2022. The Costs of Adaptation, and the Economic Costs and Benefits of Adaptation in the UK. [Online]
Available at: https://www.theccc.org.uk/publication/the-costs-of-adaptation-and-the-economic-costs-and-benefits-of-adaptation-in-the-uk-paul-watkiss/
Paul Watkiss Associates, 2024. Regional Report: Highland Climate Risk & Opportunity Assessment – Economic Analysis. [Online]
Available at: https://highlandadapts.scot/wp-content/uploads/2022/02/Regional-Report-HCROA.pdf
Perth and Kinross Council, 2021. Climate Change Strategy and Action Plan. [Online]
Available at: https://www.pkclimateaction.co.uk/climate-resilience
Scottish Water, 2024. Climate Change Adaptation Plan. [Online]
Available at: https://www.scottishwater.co.uk/-/media/ScottishWater/Document-Hub/Key-Publications/Climate-Change/290224ScottishWaterAdaptationPlan.pdf
Scottish Water, 2024. Scottish Water Climate Change Adaptation Plan. [Online]
Available at: https://indd.adobe.com/view/d63df175-559e-4ec7-a2b5-8227596a710e
Stern, N., 2006. The Economics of Climate Change, s.l.: s.n.
Sustainable Dundee and the Dundee Partnership, 2019. Dundee Climate Action Plan, s.l.: s.n.
Sustainable Dundee and the Dundee Partnership, 2019. Dundee Climate Action Plan, s.l.: s.n.
Sustainable Scotland Network, 2023. Public Bodies Climate Change Duties Reporting Analysis Report 2022/23. [Online]
Available at: https://sustainablescotlandnetwork.org/uploads/store/mediaupload/2472/file/SSN-Analysis-Report-2022-23.pdf
Sustainable Scotland Network, 2023. Public Bodies Climate Change Duties Reporting. Analysis Report 2022/23, Edinburgh: Sustainable Scotland Network.
Transport Scotland, 2021. Transport Scotland’s Approach to Climate Change Adaptation and Resilience. [Online]
Available at: https://www.transport.gov.scot/media/53779/ts-approach-to-climate-change-adaptation-and-resilience-accar.pdf
West Dunbartonshire Council, 2021. Climate Change Action Plan: Taking Action for a Net Zero Future. [Online]
Available at: https://www.west-dunbarton.gov.uk/media/4320717/climate-change-action-plan.pdf
West Dunbartonshire Council, 2021. Climate Change Strategy: A Route Map for a Net Zero Future. [Online]
Available at: https://www.west-dunbarton.gov.uk/media/4319776/climate-change-strategy.pdf
Appendices
Appendix A – Organisations involved in joint adaptation plans
The table below sets out a list of organisations that have joined together to produce climate adaptation plans or evidence base documents. This is based on our team’s understanding at the time of writing (October 2024) and may not be an exhaustive list.
|
Name |
Organisations involved |
|---|---|
|
Climate Ready Clyde |
Members: North Lanarkshire Inverclyde Council Glasgow City Council East Renfrewshire Council East Dunbartonshire Council West Dunbartonshire Council Renfrewshire Council South Lanarkshire Council University of Strathclyde Scottish Government Strathclyde Partnership for Transport University of Glasgow Scottish Environment Protection Agency |
|
Climate Ready South East Scotland |
Members: City of Edinburgh East Lothian Fife Midlothian Scottish Borders West Lothian Other collaborators: 6 community climate action hubs, CAG Consultants, Paul Watkiss Associates |
|
Highland Adapts |
Members: NatureScot ChangeWorks Sniffer Highlands & Islands Climate Hub Zero Waste Scotland NHS Highland Forestry and Land Scotland The Highland Council Highlands and Islands Enterprise |
Table 3: Organisations involved in joint adaptation plans
Appendix B – Recent and upcoming work
There are several recent and upcoming developments that will provide further evidence relating to adaptation in Scotland generally, and costs and benefits in particular. These include, but are not limited to, the following:
- SNAP3, which was published in September 2024. This will influence adaptation planning among public bodies because they have a duty to help deliver against its objectives.
- A Local Authority Climate Service, recently launched by the Met Office. This should make it easier for Local Authorities to access relevant data on climate projections.
- Updated versions of the Adaptation Scotland Public Sector Adaptation Capability Framework, Further Guidance, Starter Pack, and Benchmarking Tool will be published in early-2025.
- The fourth UK climate change risk assessment (CCRA4). The independent evidence base supporting this will be published in 2026.
- A regional CCRA is being commissioned by Climate Ready South East Scotland. It is expected to be released in 2025.
- Perth and Kinross, Angus and Dundee Councils are currently exploring opportunities to create a Tayside Regional Adaptation Partnership and have released a tender to commission a regional analysis of the combined climate risk and opportunity assessments of the three member organisations .
- NHS NSS has carried out a review of NHS boards’ adaptation plans and CCRAs. At the time of writing (October 2024) this is not publicly available, but it is understood that the work will provide a more detailed look at the content of those plans.
All of these programmes could help contribute to a better understanding of adaptation among Scottish public bodies, and facilitate planning.
Appendix C – Adaptation Scotland Capability Framework
The Capability-Maturity Approach identifies four capabilities to be developed in the context of adaptation and recommends tasks to support progress. These capabilities are: (1) organisational culture and resources (2) understanding the challenge (3) planning and implementation and (4) working together.

To benchmark, the public body scores themselves against the criteria for each capability using a score between 0 and 3, in relation to how accurately the description describes the organisation. The public body must record evidence to justify the current activity against each task.
As the criteria are open to interpretation, this allows public bodies to apply the guidance based on their understanding, priorities and strategic outcomes. This has led to very diverse outputs across the Local Authority adaptation plan landscape.
For the capability, organisational culture and resources; the ‘starting’ and ‘intermediate’ steps focus on resource availability and allocation, whereas the ‘advanced’ and ‘mature’ steps focus on identifying internal plans, policies and procedures to include adaptation within.
Appendix D – Case studies
There are many examples of public bodies whose work on adaptation shows unique features and demonstrates good practice. A selection of case studies is below.
These have been selected to illustrate nuances in public bodies’ approaches to adaptation planning. These nuances may not be captured in the database summary, and can be used to contextualise recommendations in the report.
Note, inclusion in this list does not suggest that the case study is the best or only example of a given approach.
Considering the impacts of risks on different cross-cutting themes: Highland Council
In its 2012 climate adaptation report (Highland Council, 2012), the Highland Council employed a multi-criteria assessment approach to evaluate risks in relation to cross-cutting themes, rather than looking at them in isolation. Whilst this example is more than a decade old, and will be superseded by the forthcoming risk assessment produced by Highland Adapts, this is an example of holistic thinking. An excerpt is shown below.

To assess the risk posed by identified threats such as severe weather events, a multi-criteria analysis approach was adopted. Each threat was assessed in relation to cross-cutting themes, drawing out potential further threats, and opportunities, following the framework of 12 sectors set out by the Scottish Government. For example, for the threat to water resource management, a risk is identified that ‘drought could lead to mandatory water conservation measures being enforced’.
This approach would have helped Highland Council consider its wider remit and identify opportunities to maximise co-benefits and optimise use of resources in adaptation action planning.
Linking climate change impacts to other corporate priorities: Comhairle nan Eilean Siar Council
As part of its Climate Rationale (Comhairle nan Eilean Siar Council, 2022), Comhairle nan Eilean Siar Council undertook an exercise to map climate change impacts against priority areas within its Local Outcome Improvement Plan (LOIP). It acknowledges that, ‘To respond to the climate challenge and realise the LOIP vision, climate adaptation and resilience must be linked to societal issues, moving beyond sectoral responses and acknowledging the environment as the support network underpinning everything, to enable a safer, healthier and more prosperous Outer Hebrides.’
This is a good example of an organisation firstly acknowledging that their wider corporate priorities are dependent on climate change action, and then seeking to align the two. In principle, this would help to achieve a more integrated response to both issues. It could also help to generate stakeholder buy-in by highlighting how climate adaptation planning is crucial for achieving success against a range of other metrics, whether those are social or economic.

Using stakeholder engagement to inform adaptation plans: Aberdeen City Council
This is an example of a public body that has used extensive stakeholder engagement to inform its adaptation plans. Aberdeen City Council, as part of their Aberdeen Adapts programme, set up 5 stakeholder workshops, in which 41 local organisations participated. These workshops looked at: the impacts of climate change for Aberdeen; collected ideas for vision and strategy; shared information about actions that are already underway or are planned to support adaptation, and examined opportunities for increasing resilience. The arts were used in these engagement activities, and young people were also included.
In the consultation summary report (Aberdeen City Council, 2019), for each theme or question discussed, the report details the number of respondents, the percentage who agreed, disagreed or were unsure and key comments. An example is shown below.


Notably, a need for stronger links between emission reduction actions and policies and plans was identified by stakeholders. This focus appears to have translated into the adaptation strategy that was subsequently produced (Aberdeen Adapts, 2022), which makes a point of highlighting the need to align with actions on decarbonisation.
Acknowledging different types of benefits and risks: Historic Environment Scotland
In Historic Environment Scotland’s Climate Action Plan (Historic Environment Scotland, 2020), a distinction is made between the ‘internal benefit’ and ‘wider benefit’ of adaptation actions. This encourages the adaptation planning team to consider types of benefits, and where benefits might be multiple or could be enhanced. For identifying co-benefits, this aids the process of decision-making in terms of financing initiatives and actions, as public bodies could contextualise financial costs for adaptation actions in relation to costs that may be saved, internally, and in terms of other sectors or competing priorities.
![A screenshot of a table which lists the potential benefits associated with an action to "undertake [...] research to better increase knowledge of the physical, social and economic impacts of climate change on the historic environment". Internal benefits could include better-informed decision-making. Wider benefits could accrue to the heritage and museum sectors once they disseminate the research.](https://www.climatexchange.org.uk/wp-content/uploads/2025/01/a-screenshot-of-a-table-which-lists-the-potential.png)
HHistoric Environment Scotland’s dedicated Adaptation Plan (Historic Environment Scotland, 2021), which was published the following year, was also the only adaptation plan identified in this study which included transition climate risks for their organisation. Transition climate risks are the risks introduced when regulators, legislators, consumers and companies start to take action on climate change, and transition to a low-carbon economy.
By identifying transition risks, public bodies can gain a better understanding of the potential unintended consequences of taking action on climate change, and seek to address these. Additionally, considering transition risks may help strengthen the business case for more funding or resourcing, if they can identify upfront multiple risks that could be compounded due to inaction.

Assessing local vulnerability to climate impacts: Climate Ready Clyde
Many of the adaptation plans reviewed in this study consider the hazards that may arise due to climate change, but not many address how vulnerable key receptors are to those hazards. As part of the Climate Ready Clyde project, an interactive map (Climate Ready Clyde, n.d.) has been produced, which shows different neighbourhoods’ comparative level of vulnerability to both flooding and overheating – see an excerpt in Figure 8. This is focused on social and community vulnerability and is based on the Scottish Index of Multiple Deprivation. It also shows contextual information such as woodland coverage and areas of vacant or derelict land.
The information could be used to target different stakeholder engagement approaches and/or adaptation actions at a postcode level, although the map authors acknowledge that a specific household or individual’s vulnerability will differ within any given area.

Using regional information to support local action: East Dunbartonshire Council
As explained previously, for Local Authorities, the majority of quantitative information that is available comes from two regional economic impacts reports on climate risks. This review found one example of a Local Authority (East Dunbartonshire) that had attempted to downscale information from the Climate Ready Clyde (CRC) Economic and Financial Assessment (Climate Ready Clyde, 2019), along with some other sources, to a local level within its adaptation options report (East Dunbartonshire Council, 2019).
This appears to have been done in a few different ways, depending on the action:
- Citing overall costs for the Glasgow City Region
- Referring to the cost-benefit ratio set out in, or derived from, the CRC Economic and Financial Assessment
- Providing an indicative range of costs specific to East Dunbartonshire, some of which appear to be based on internal advice from Roads & Environment or other Council departments
The cost-benefit ratio was one of the most common metrics cited, which suggests that this was considered useful for the purpose of developing a case for local action.
Developing indicators and targets for adaptation: Dundee City Council
This example highlights an instance where proposed performance indicators and targets were given for adaptation actions. In the Dundee Climate Action plan (Sustainable Dundee and the Dundee Partnership, 2019), for some actions, detail is given to help make monitoring and tracking of progress against the suggested actions, feasible and achievable. By labelling them as proposed indicators, the plan leaves space for discussion and refinement, making sure the most appropriate indicators are decided upon. Along with detail on the lead responsible agency for the actions, they support accountability for achieving the actions.
The image below shows an extract from Annex 1 of the Dundee Action Plan.
Figure 9: Presentation of the actions within the Dundee climate action plan, including performance indicators and targets where applicable
Undertaking site-based risk assessments: NHS Lanarkshire
In addition to the overarching CCRA that it is required to produce, NHS Lanarkshire has undertaken site-based CCRAs for its major sites. This recognises that its assets are diverse and therefore may require different adaptation responses. Although the documents are not publicly available, according to the Adaptation Scotland website (Adaptation Scotland, n.d.), the risk assessments also contain information on the costs that NHS Lanarkshire has incurred as a result of extreme weather events.
Although not necessarily feasible for all public bodies, this approach would allow more tailored actions to be taken for specific properties.
Transparency regarding stakeholder input to the adaptation plan: Edinburgh Adapts
The Edinburgh Adapts: Climate Change Adaptation Action Plan 2016-2020 (Edinburgh City Council, 2016) clearly describes what input was sought from different stakeholders when developing the adaptation plan. This addresses input from local business and communities as well as the support received from the Adaptation Scotland programme. It also sets out what stakeholders will have responsibility for long-term governance arrangements. It is also clear about the overall guidance that was followed. This is important from a transparency perspective.

© The University of Edinburgh, 2024
Prepared by Aether Ltd on behalf of ClimateXChange, The University of Edinburgh. All rights reserved.
While every effort is made to ensure the information in this report is accurate, no legal responsibility is accepted for any errors, omissions or misleading statements. The views expressed represent those of the author(s), and do not necessarily represent those of the host institutions or funders.
ClimateXChange
Edinburgh Climate Change Institute
High School Yards
Edinburgh EH1 1LZ
+44 (0) 131 651 4783
Research completed December 2024
DOI: http://dx.doi.org/10.7488/era/5567
Executive summary
Project aims
Scottish public bodies need to make long-term investment and planning decisions. It is their responsibility to consider the risks affecting the outcomes of these decisions. These include risks from climate change, which are highly uncertain, difficult to communicate and require specific expertise.
For instance, public bodies need to be able to plan: where to build a new development considering the risk of coastal flooding; how much to invest in protecting a train line from heat damage or coastal change; or the expected increase in winter disruption to services in the coming decades.
Climate scenario analysis (or simply, scenario analysis) is a tool and process developed to help answer questions like these. It assesses the impact of different plausible future climate change scenarios on an organisation, project or strategy. Understanding the impact of climate change under each scenario can inform decisions.
This study reviewed policies, guidance and stakeholder insights, and examined practices and publicly available data. Based on our findings, we make recommendations for the development of a practical scenario analysis tool to help public bodies in climate adaptation planning. Many of the principles can also be applied to resilience and mitigation planning.
Findings
Stakeholders have told us that the main use of these recommendations will be to help with climate adaptation decisions.
We found a gap, as much of the guidance we reviewed focused on climate scenario analysis for financial reporting requirements[1] and often focused on climate transition risks, making it less relevant for adaptation planning.
Scottish Government and other stakeholders relayed that long-term public-sector investment and planning decisions should be based on climate risk information and approaches that are:
- consistent across the public sector; e.g. they use the same scenarios, look at similar time horizons and use the same data to assess the same hazards.
- based on information that is up-to-date, accurate, useable and freely available
- consistent with climate risk information they are required to use for other purposes.
A data review indicated a relatively complex data landscape. Data availability varied significantly depending on the climate hazard. There is a lack of standardisation across data providers when it comes to scenarios, temporal and spatial resolution, and data format. These factors are a significant source of frustration for stakeholders.
Where our recommendations are different from existing regulations and guidance it is because they are intended to help public sector organisations make better long-term decisions to plan for adaptation.
Recommendations
We recommend that the scenario analysis decision tool covers each of the recommendations in Table 1.
|
Factor |
Summary of recommendation on decision tool content |
|---|---|
|
Hazards covered |
Scenario analysis should cover both chronic and acute physical climate hazards. Transition risks should be considered separately by organisations, where they may have a significant impact. |
|
Scenario prescription and definition |
To drive consistency, organisations should consider both 2°C and 4°C warming scenarios. |
|
Number of scenarios |
At least two scenarios should be considered, specifically 2°C and 4°C warming scenarios. |
|
Climate data provider |
The tool should point to up-to-date primary sources of data for different hazards as informed by the ongoing climate data review by the Scottish Government. |
|
Scope of scenario analysis |
The scope of scenario analysis should be proportional to the use case. Use-case specific guidance should be followed. |
|
Timeframe of scenarios |
Short term: In line with business planning cycles. Medium term: 2045-50s. Long term: 2080s-end of century. |
|
Frequency of updates |
Scenario analysis should be updated every 3 to 5 years. |
|
Qualitative versus quantitative analysis |
Scenario analysis should be quantitative, but qualitative analysis can also be used to provide a richer narrative. |
|
Inclusion of the impact of the organisation on the climate |
Analysis only needs to cover the impact of the climate on the organisation. |
Table : Summary of recommendations
These recommendations aim to support the development of a practical scenario analysis decision tool. This should then enable Scottish public bodies to spend more time on trying to understand how their organisation could respond to those scenarios and less time on identifying plausible scenarios to assess.
Glossary and abbreviations table
Terms defined in the glossary and abbreviations table are highlighted in bold throughout this report.
|
Term |
Definition |
|
Acute hazard |
Acute hazards are event driven (rapid-onset), extremely severe, and short term. These events can include extreme weather such as cyclones, hurricanes or floods (TCFD 2017). |
|
Adaptation planning |
Planning that set outs actions to build resilience to climate change (Scottish Government, 2024). |
|
CCC |
Climate Change Committee |
|
CCRA |
Climate Change Risk Assessment. Under the 2008 Climate Change Act the UK Government is required to publish a CCRA every five years (CCC, n.d.). |
|
Chronic hazard |
Longer-term shifts in climate patterns (e.g., sustained higher temperatures) that may cause sea level rise or chronic heat waves (TCFD, 2017) |
|
Climate anxiety |
The sense of fear or worry associated with climate change. |
|
Climate scenario analysis |
Broadly a tool for assessing what could happen to different aspects of an organisation or project (costs, income, policy, asset values, liability, workforce etc) under different climate scenarios. See section 3.3. |
|
CSRD |
Corporate Sustainability Reporting Directive |
|
Defra |
Department for Environment, Food and Rural Affairs |
|
Double materiality |
Impact materiality and financial materiality. Including both means organisations consider the impact of climate change on the organisation as well as the impact of the organisation on the climate (Commission Delegated Regulation (EU) 2023/2772, 2023). |
|
Earth system tipping points |
Earth system tipping points are thresholds beyond which changes in a part of the climate system become self-perpetuating often leading to abrupt and irreversible changes that could have a profound impact on our planet (Armstrong et al., 2022). |
|
Ecosystems |
A functional unit consisting of living organisms, their non-living environment and the interactions within and between them. |
|
El Niño |
A phenomenon associated with increasing sea surface temperatures that occurs every few years, typically concentrated in the central-east equatorial Pacific. |
|
Emission pathways |
See RCP. |
|
EU |
European Union |
|
FRC |
Financial Reporting Council |
|
GAD |
Government Actuary’s Department |
|
Global warming levels |
Also referred to as temperature-based scenarios. Scenarios based on global mean temperatures regardless of the time at which that level has been reached (Met Office, 2023). |
|
Green Book |
Guidance issued by His Majesty’s Treasury on how to appraise policies, programmes and projects. |
|
HadGEM3 |
Hadley Centre Global Environment Model version 3 |
|
HMT |
His Majesty’s Treasury |
|
IFoA |
Institute and Faculty of Actuaries |
|
IFRS |
International Financial Reporting Standards |
|
IPCC |
Intergovernmental Panel on Climate Change |
|
ISSB |
International Sustainability Standards Board |
|
Macro-economic |
The study of financial systems at a national level. |
|
Micro-economic |
The study of the economic problems of businesses and people and the way particular parts of an economy behave. |
|
Physical risk |
Also referred to as physical hazards, physical climate hazards or similar. Risks related to the physical impacts of climate change including acute and chronic hazards (TCFD, 2017). |
|
Qualitative analysis |
Analysis focused on the identification of trends and on the overarching narratives of the scenarios, often providing insight into less quantifiable company characteristics. It can involve descriptions of plausible future worlds, describing their main characteristics, relationships between key driving forces, and the dynamics of their evolution (TCFD, 2020). |
|
Quantitative analysis |
Analysis and presentation of quantified information within a scenario. Quantitative scenario analysis can take many forms, targeting various aspects of an organisation’s vulnerability to climate related risks (MIT, 2019). |
|
Radiative forcing |
The net amount of the sun’s energy absorbed by the Earth. |
|
RCP |
Representative Concentration Pathway. RCPs correspond to different levels of total atmospheric radiative forcing by 2100. |
|
Resolution |
The number of data points (level of detail or granularity) within a unit of measurement. |
|
Scenario analysis |
See climate scenario analysis. |
|
SEPA |
Scottish Environmental Protection Agency |
|
SNAP |
Scottish National Adaptation Plan |
|
SSP |
Shared Socioeconomic Pathways. The SSPs combine socio-economic narratives and approximate global effective radiative forcing levels. |
|
TCFD |
Task Force on Climate-related Financial Disclosures |
|
Tipping points |
See earth system tipping points. |
|
Transition risk |
Risks that arise from efforts to transition to a lower-carbon economy. Transition risks include policy, legal, technological, market and reputational risks (TCFD, 2017). |
|
UKCP |
United Kingdom Climate Projections |
Introduction
Background
Climate change in Scotland
Scotland’s climate is changing due to the rise of global greenhouse gas emissions with further change expected over the coming decades (Scotland’s Environment, 2024). Average global temperatures are already 1.2°C above their preindustrial levels. Further warming up to 2°C or more is becoming increasingly likely, resulting in hotter, drier summers, wetter winters, more extreme weather events, and rising sea levels. Despite international efforts to mitigate further global warming, some of these changes are already ‘locked in’ until 2040 and are unavoidable (Watkiss, 2022). The most recent UK Climate Projections (UKCP18) suggest that Scotland will be exposed to more intense and frequent extreme weather events, such as heatwaves and storms, and long-term shifts in temperature, rainfall and sea level rise (Adaptation Scotland, 2021). These changes will significantly impact Scotland’s people, ecosystems, and economy.
Climate policy has also been responding to the changing climate today and future climate projections. Scotland’s third National Adaptation Plan (2024) sets out Scottish Government’s plans over 2024-2029 to adapt to climate change. Public bodies have a statutory duty to help deliver the Adaptation Plan (Scottish Government, 2011) and Scottish Government has committed to updating its corresponding statutory guidance.
Future climate in decision making
To successfully adapt to climate change, organisations must embed climate change considerations in their decision making over the short and long term. It is crucial for organisations to develop strategies and make decisions with the awareness that our climate is changing.
This is particularly important for public bodies, which often operate over longer time horizons and have a responsibility for decisions that often cannot easily be reversed (infrastructure planning, for example). It is also important they receive help to do this on a more consistent basis to improve the coherence of decision making.
Scenario analysis is a useful tool to help organisations consider climate change implications. It can be used to:
- Test the resilience of their current strategies and business plans to future changes in climate
- Understand the future potential impacts of climate change and actively prepare to adapt to these risks
- Explore and promote strategies to reduce their emissions and therefore mitigate future climate change
Aims
Adaptation measures can help reduce the risks associated with future climate change in Scotland. However, climate adaptation planning is not straightforward and faces uncertainties in both the magnitude of future change and timing. A single climate projection is likely to be inaccurate and therefore multiple versions of what could happen in the future need to be assessed to inform robust decision making. Climate scenario analysis addresses this challenge by providing a framework to better understand climate uncertainties by assessing the implications of different plausible climate futures.
As climate change has moved up the agenda over recent years, regulators in various jurisdictions have mandated climate related disclosures for public bodies, companies, and financial institutions. This has also included recommending scenario analysis to assess the resilience of strategies and portfolios to different climate futures and inform decision making (e.g. Taskforce for Climate-related Financial Disclosures (TCFD) in the UK and Corporate Sustainability Reporting Directive (CSRD) in the EU).
Regardless of purpose, conducting climate scenario analysis can feel complex and the choices which need to be made, for example, which scenarios to consider, can often be confusing. To support future-proofed plans and strategic decision making, the Scottish Government (2024) has committed to develop a climate scenario decision tool for the public sector. The tool will aim to provide guidance and support around the implementation of climate scenario analysis to drive robust and consistent analysis of future climate-related risks across the public sector in Scotland and enable cohesion in adaptation planning.
This report aims to provide advice to the Scottish Government on the development of guidance for climate scenario analysis. Specifically, it provides recommendations on the climate change emissions or temperature scenarios, timeframes, climate hazards and other important factors public sector bodies should consider as part of any climate scenario analysis. The report also sets out additional features and guidance required by a climate scenario decision tool for the public sector, informed by insights from stakeholder consultation and the wider literature.
The findings and recommendation of this report will guide the development of the Scottish Government’s climate scenario decision tool, supporting public bodies with climate scenario analysis and enabling climate adaptation planning and decision within Scotland informed by a robust understanding of future climate change.
Methodology
The research which forms the basis for the guidance and recommendations in this report was commissioned by CXC and conducted by GAD between March and September 2024. The research was largely based on information from three main sources which are described in Section 4 of this report. The research project was split into three phases.
Phase 1: A review of existing policy, guidance, and stakeholder practice on use of future climate scenarios and climate hazard data when making investment judgements, exploring the resilience of current plans, and developing adaptation strategies.
We undertook a targeted desk-based review of current policy and guidance in relation to climate scenario analysis, consisting of:
- A scoping exercise to map out the volume of literature and collate policy papers and guidance published in the last five years.
- Identification of further key sources underpinning the literature published outside of the five-year timescale.
- A synthesis of the key recommendations and considerations of these for climate scenario analysis.
The review focussed on guidance and policy applicable within Scotland and the UK, and the EU. This included TCFD scenario analysis recommendations and the Climate Change Committee’s (CCC) recommendations on global warming scenarios to consider in adaptation planning in Scotland.
For the review of current practice, we worked with ClimateXChange and Scottish Government to identify and prioritise relevant stakeholders to engage with. This included those in Scotland already using climate scenario analysis and future climate hazards data to inform their longer-term planning strategies.
Individual and group stakeholder engagement sessions were conducted over summer 2024 in person and virtually. Sessions sought to understand the purpose and aims of stakeholders’ climate scenario and hazard analyses and their experience of it. We examined what hazards and scenarios they had considered, how results had been used, pain points that they had encountered, and what decision-making support could further assist them. We captured stakeholders’ views via recording the meetings and using an online whiteboarding tool, Miro, where participants could record their ideas under question prompts. We also shared our key findings with stakeholders following the workshops to ensure we had accurately reflected and understood their views and comments. We engaged with a broad range of stakeholders including:
- Climate Change Committee
- Dynamic Coast
- Edinburgh City Council
- Forestry and Land Scotland
- Highlands and Islands Airports Limited
- Historic Environment Scotland
- Met Office
- NatureScot
- Network Rail
- Paul Watkiss Associates Limited
- Scottish Environmental Protection Agency (SEPA)
- Scottish Government
- Scottish Water
- Sniffer
- Transport Scotland
- University of Glasgow.
To supplement information gathered through stakeholder engagement we also examined current best practice in the private sector, specifically through the work of the Financial Reporting Council (FRC) thematic review of TCFD reports (FRC, 2022).
Phase 2: Identify common themes across existing guidance and stakeholder practice.
We used qualitative content analysis methods to identify commonalities and differences in the policy and guidance and current practice. An analytical framework was developed to provide structured outputs of summarised qualitative data collated in Phase 1. The framework captured key guidance factors that feed into climate scenario analysis such as hazards to consider, scenario definitions, numbers of scenarios, timeframes, frequency of analysis and expected outputs.
This allowed themes in existing guidance to be easily identified whilst also providing a holistic view of the current policy and guidance landscape.
We also considered availability of data. As part of Phase 2, we conducted a rapid review of the latest publicly available physical climate hazard data. This included an assessment of potential data limitations and consideration of whether climatic tipping points are captured. This included an overview of the UKCP18 data from the Met Office.
Phase 3: Options and recommendations for setting national-level guidance to support accounting for future climate hazards in today’s decision making.
Outputs from Phases 1 and 2 of the research have been critically assessed to determine the level of prescriptiveness that Scottish Government could take in setting out recommendations for assessing future climate-related risks for strategic planning and adaptation in the public sector.
The recommendations are based on considerations of the consistency required to establish shared planning assumptions across multiple public sector bodies, the needs of stakeholders in considering climate scenarios and hazards in Scotland, the complexity that may be introduced, potential user capability and associated costs. We actively consulted with Scottish Government and public sector stakeholders during this phase of the project to gain feedback and discuss their views.
Research limitations
As the research was conducted within fixed timelines and budget the level of detail may not meet the needs of all potential audiences, e.g. those requiring climate scenario details to support investigation of highly specific and unusual risks in their planning and decisions.
Indeed, due to the budget and timeline constraints, we carried out three stakeholder workshops as part of our research. With further workshops we could have potentially gathered wider and deeper views on climate scenario analysis from public bodies across Scotland. However, engagement during our workshops was very high and the insights we gained from participants were invaluable in shaping our recommendations.
Climate scenario analysis
There is inherent uncertainty in assessing the physical impacts of climate risks. This is due to the uncertain future trajectory of global emissions, and uncertainty around how the planet will respond to those levels of future emissions. The uncertainty at an organisational or project level is impossible to accurately quantify due to the combination and complexity of uncertain inputs.
Scenario analysis relies on defining plausible futures and analysing them to better understand the impacts of the risks being faced. No likelihood is placed on any single scenario. Instead, the relevance of the analysis relies on selecting a range of scenarios under which the risks most relevant to the organisation emerge.
Defining climate risks
Climate risks can be better understood by using the International Panel on Climate Change (IPCC) framework of hazard, exposure and vulnerability (Cardona et al., 2012). Each of these components should be considered when determining climate risk as part of climate scenario analysis.
Risk = hazard x exposure x vulnerability
Hazard: The possible future occurrence of physical climate events that may have adverse effects (damage and loss) on vulnerable or exposed people, assets, services, resources, infrastructure, or systems. Examples of climate hazards include heatwaves, sea level rise, floods, and storms.
Exposure: The presence of people, assets, services, resources, infrastructure and systems that could be adversely impacted by the hazard. Proximity to the hazard is an important consideration here. For example, buildings close to the coast will have a greater exposure to sea level rise than those further inland.
Vulnerability: The propensity of exposed aspects (people, assets, services, resources, infrastructure, systems) to suffer adverse events when impacted by climate hazards. Vulnerability relates to predisposition, susceptibility, fragility, weakness, deficiency, adaptive capacity etc. For example, elderly people are less able to regulate their core temperature compared to younger adults and therefore more vulnerable to overheating than younger people (Moreira Sousa, 2022).
Exposure and vulnerability are often thought of as one but can be distinguished – it is possible to be exposed to a climate hazard but not vulnerable to it, for example by living in a floodplain but having means to modify building structure to avoid potential loss. However, to be vulnerable to a climate hazard, you must be exposed to it.
Whilst hazard data can be relatively generic, information on exposure and vulnerability is normally specific to an organisation.
What are climate scenarios?
Climate scenarios are plausible future outcomes of climatic conditions and macro- and micro-economic development in response to climate change and the transition to a low carbon economy. They were brought into the public consciousness in large part by the IPCC. This is a United Nations body for assessing the science related to climate change whose purpose is to provide governments with scientific information that they can use to develop climate policies.
The IPCC define their scenarios by emissions pathways, also known as Representative Concentration Pathways (RCPs). Whilst these emissions pathways are widely used as different climate scenarios for scenario analysis, in recent years there has been a trend to focus on temperature increase scenarios, rather than emissions pathways. Temperature increase scenarios are also known as global warming levels.
Emissions-based pathway scenarios: These are different projections of atmospheric concentration of greenhouse gasses up to 2100. The RCPs correspond to different levels of total atmospheric “radiative forcing” (a direct measurement of the greenhouse effect) meaning that they each produce different degrees of future global temperature increase. There are ranges of temperature increases that could exist for each emissions pathway.
Global warming level scenarios: Global warming level scenarios don’t generally include a timeframe. Instead, they represent a world that has reached the stated average warming for the period (Met Office, 2023). The CCC looks at +2oC and +4oC temperature increase scenarios within their most recent Climate Change Risk Assessment (CCRA3) (CCC, 2021); as well as considering higher levels of warming and low-likelihood, high-impact events such as climate tipping points (Betts and Brown, 2021).
The Met Office provides the UKCP18 data which are based on regional climate model[2] simulations. Data is available for different RCP scenarios but also global warming levels of 1.5oC, 2oC, 3oC and 4oC.
Climate scenario analysis in decision making
There is no single accepted definition of scenario analysis. Broadly it is a tool for assessing what could happen to different aspects of an organisation[3] or project (costs, income, policy, asset values, liability, workforce etc) under different climate scenarios.
Scenario analysis is constantly evolving to better explore the impacts of climate change on the above listed aspects. As climate related risks and opportunities begin to become more commonly considered, analysis will become more sophisticated and likely produce outputs that better support decision making.
Scenario analysis is a tool to enhance critical strategic thinking. An initial single analysis is unlikely to capture all climate-related risks at the level of detail required. Scenario analysis should be an iterative process where the objectives and scope of each analysis are well defined and tailored to ensure the output of decision useful information is maximised.
Often there will be a trade-off between:
- Very well defined but near impossible to quantify narrative scenarios; and
- Scenarios that can be quantified, but in doing so need simplifying assumptions which may be unrealistic.
Scenario analysis is a valuable tool for assessing and understanding uncertainty. It can be used by organisations to:
- Challenge their current thinking. It is useful in testing if strategies and plans are resilient to plausible future changes in the climate
- Make better informed decisions by looking over the longer term
- Identify potential changes in the severity and frequency of climate-related risks. Additionally, completing scenario analysis may help organisations to identify new climate-related risks.
Limitations and challenges
Scenario analysis is difficult to carry out. For example, it is hard to know where to start and what scenarios are plausible. There is a need to recognise the limitations and challenges around data, skills, and uncertainty relating to timescales and quantifiability.
Data
Data can be hard to obtain and even when available it often has shortcomings like lack of coverage or uncertainty. This includes external data, like those covering the frequency and severity of climate hazards. It also includes lack of data held by the organisation itself on its exposure and vulnerability to climate risks.
Skills and risk awareness
A range of skills are needed to carry out scenario analysis. Few organisations will have access to all of those skills. Many address this by employing consultants or contractors, sometimes at great expense. The recommendations in this report will not eliminate this gap but aim to reduce this burden on public sector bodies.
One such skill is the ability to understand and communicate different types of uncertainty. Scenario analysis is a tool designed to help with this but also requires practitioners to have relevant skills in this area. Throughout the workshops, the importance of good communication of climate-related risks was a key theme. Participants noted the various challenges associated with ensuring communication with the public was transparent without causing climate anxiety.
Proportionality
Different organisations will be impacted by climate change in different ways, and it is the people who work at the organisation itself who will best understand the climate hazards that are most pertinent to their organisation.
Organisations should therefore take a proportionate approach to completing scenario analysis. When certain climate hazards are irrelevant for the organisation (for example, they have no exposure or are not vulnerable even where they are exposed), it is acceptable for these to be left out of climate scenario analysis. The organisation should satisfy itself that these hazards have been considered and agreed not to be investigated further. Stating this explicitly would be considered best practice and ensures transparency in any publications or disclosures.
Research findings
Recommendations presented in Section 5 are informed by three main sources of information:
- Policy and guidance: Review of documents including policy, scenario analysis guidance, and reviews of existing practices.
- Data: Rapid review of 21 commonly used data sources to understand data availability for different climate hazards.
- Stakeholder views and experience: Three workshops with stakeholders including Scottish Government, public sector organisations, and experts in climate risks.
We reviewed over 50 documents setting out policy, guidance and best practice examples of climate scenario analysis in Scotland and further afield. There are different legislations and regulations that bring climate reporting (such as that compliant with the TCFD (2017) recommendations including climate scenario analysis) into scope for various organisations and entities. We also considered any application guidance that went with the legislation and regulation.
Many of the sources considered covered more than just climate scenario analysis, and in contexts wider than just adaptation planning. Due to the focus of this review, greater consideration was made where sources spoke specifically about scenario analysis and in contexts relevant to adaptation planning. These sources are listed in Appendix C.
We identified nine factors that can be used to guide scenario analysis and that are frequently referred to within the policy and guidance literature. These were:
- Which climate hazards should be covered?
- What climate scenarios should be used?
- How many climate scenarios should be considered?
- Where data should be sought from?
- The scope of the climate scenario analysis (i.e. whether analysis should cover the entire organisation / project or only certain parts of it).
- Timeframes to be considered (i.e. how far into the future and at which specific time periods to look).
- Frequency of updates to analysis.
- Whether the analysis should be qualitative or quantitative.
- Materiality (including double materiality).
The accompanying spreadsheet to this report, Technical appendix – Review of current policy and guidance, sets out a framework which compares each climate scenario analysis factor to the guidance and policy reviewed. The framework also provides a cross comparison with insights from the stakeholder workshops and the recommendations given in Section 5.
Key findings from the review indicated:
- The current published guidance is primarily focused on scenario analysis based on requirements for financial reporting. The most obvious example of this is the recommendations of the TCFD (2017), but many other sources are also routed in this, including the requirements for pension schemes (The Occupational Pension Schemes (Climate Change Governance and Reporting) Regulations 2021) and companies (The Companies (Strategic Report) (Climate-related Financial Disclosure) Regulations 2022) in the UK.
- TCFD (2017) mainstreamed the categorisation of climate-related risks as either physical or transition. Although transition risks (risks associated with the transition to net zero) can impact organisations and projects, they are generally less relevant to adaptation planning which is predominantly focused on reducing vulnerability to physical climate hazards. Physical hazards can be divided into acute hazards (specific events, such as floods or storms) and chronic hazards (events that gradually evolve over time, such as average temperature increase or sea level rise). Considering both acute and chronic physical hazards is consistent with a range of guidance, including that from Defra (2023) and the CCC (2024).
- Due to the nature of sea level rise, including its lagged response to emissions of greenhouse gases, and the complex and dynamic nature of coastal change, alternative or additional scenario analysis guidance may be required for this climate hazard.
- Guidance related to financial reporting, often mentions considering a +2°C or lower or “Paris-aligned” scenario. Emissions or temperature scenarios below +2°C may be more appropriate for analysing transition risks rather than physical risks. The His Majesty’s Treasury Green Book (2020), CCC (2022), and Defra Adaptation Reporting Power (2023) all use scenarios based on global warming levels focussed on +2°C and +4°C by the end of the century.
- The more scenarios considered, the more analytical work and data gathering is required. Using fewer scenarios may allow organisations to consider each scenario in greater depth. However, multiple scenarios are needed to capture uncertainty associated with future climate change and allow for more robust decision making.
- Guidance is conflicted regarding the required scope of climate scenario analysis. For example, some sources state the full organisation should be covered (e.g. Defra, 2023), whilst others restrict scope, initially at least, to cover more significant areas of an organisation (e.g. Department for Business, Energy and Industrial Strategy, 2022).
- There is a lack of guidance on length of timescales to consider; analysis of reporting shows that many consider “long” timescales to be 10 years.
- From an adaptation perspective, it is important to focus on climate change impacts on the organisation, rather than the organisation’s impact on the climate. Considering both aspects is sometimes referred to as “double materiality” (Commission Delegated Regulation (EU) 2023/2772, 2023).
- Finally, published guidance makes clear that transparency around assumptions and limitations of analysis is vital.
Rapid data review
We reviewed 21 publicly available climate data sources commonly used to source data for climate scenario analysis (Appendix B). These included the providers of UK wide data (e.g. Met Office climate data portal and the UKCP18 user interface), global data (e.g. IPCC’s Interactive Atlas, Copernicus climate data store) and the Scotland focused data (e.g. Nature Scot GIS, Marine Scotland).
We found that there was a very wide variation in the data provided across this small sample of sources. Different data sources provided data on different climate hazards at different levels of spatial resolution and over different time projection periods. They also varied between using emissions-based (RCP) and temperature-base/global warming level scenarios. Climate projections based on the fifth phase of the Coupled Model Intercomparison Project (CMIP5), which are used as the basis of the IPCC’s fifth assessment report (AR5), were the most readily available. This is despite updated CMIP6 model simulations being used for the more recent sixth assessment report (AR6) (IPCC, 2021), demonstrating the long time lag often experienced for climate data updates. This lack of standardisation across climate hazard data providers was a source of frustration for those we spoke to in our workshops.
Chart 1 indicates that data availability varies significantly depending on the climate hazard under investigation. Of the 21 data sources reviewed, the greatest data availability is for temperature-based hazards, such as chronic temperature change and extreme heat events, whilst there is very limited data available for more complex hazards such as soil movement and landslip.
Chart 1: Data availability by climate hazard (21 data providers reviewed)
ClimateXChange is conducting a geospatial climate hazard data review project which should improve the understanding of the data landscape for those carrying out scenario analysis.
Current practice and insight from stakeholders
Workshops on climate scenario analysis
We engaged with multiple Scottish public bodies and other relevant stakeholders (Appendix D) across two separate workshops to discuss their experience of climate scenario analysis.
Stakeholders shared their experience of completing (or advising others on completing) climate scenario analysis, their key challenges and what would have helped to alleviate them, the tools and resources they used along with limitations, and their ability to quantify the climate impacts on their organisation.
A summary of key findings from these workshops were:
- There was strong appetite across the stakeholders to learn more about how to conduct better scenario analysis. It was felt that nationally defined climate scenarios would help reduce conflict between parties using different data.
- Scenario analysis is carried out for many purposes which lead to different needs for data and expertise. However, stakeholder primary use cases were to inform risk management strategies and plans and inform business decision making. Most organisations need to bring in outside expertise to help.
- Stakeholders agreed that quantification of analysis should be a clear aim, but the importance of qualitative analysis is also recognised.
- Analysis should aim to increase the ability of organisations to make decisions under uncertainty. The impact of “doing nothing” should also be considered.
- There are advantages and disadvantages to using emissions-based scenarios and global warming levels – each have their place. Emissions based scenarios may be more suitable for climate hazards which do not scale well with global mean temperature (CCC, 2024). This includes sea level rise where a long lag time exists between global temperature increase and the full sea level response.
- Stakeholders can often find it hard to obtain or understand climate data. Data availability can be limited as can the in-house capability to analyse it. Data does not always extend to the local level needed.
- More data on asset vulnerability to hazards is also needed so that risk can be fully assessed.
- Secondary and indirect climate impacts are particularly difficult to quantify and more guidance in these areas would be welcome.
- Consideration of climate tipping points in adaptation planning is challenging due to large associated uncertainties in probability of occurrence, impact, and timing. It was noted that even when tipping points are breached, the impact may take many years to be felt.
- Communication of the results of scenario analysis to users and the public was a key consideration for stakeholders and something that was often found to be challenging. Comparisons with other risks to communicate uncertainty may be helpful along with improvement of climate literacy beyond climate experts.
Workshop on scenario analysis for coastal change
‘Compared to other factors, sea level only gets worse.’
Insight from a stakeholder at the coastal change workshop, June 2024.
In addition to the two workshops held on climate scenario analysis, we held a dedicated workshop with coastal change experts. This was to allow a better understanding of specific scenario analysis guidance that may be required for coastal hazards such as sea level rise, which has a significant lagged response time and that impacts highly complex coastal processes. CXC has also commissioned a piece of research on coastal change adaptation planning conducted by the University of Glasgow which will further contribute to improving future guidance on coastal change adaptation planning.
A summary of key findings from this workshop were:
- Sea level rise and coastal change can be considered to have a unique risk profile compared to other climate hazards. This is because 1) impact is always negative 2) timescales of impact are much longer and 3) the impacts are irreversible. Sea level rise is a chronic risk where the entire current baseline state is shifting.
- Sea level rise will affect erosion rates and wave heights. It will impact drainage systems, structures, natural features and ecosystems. The complex interaction between sea level rise and other systems and services needs to be better mapped.
- There was strong agreement that a precautionary approach was required for assessing the impacts of sea level rise and coastal change due to the permanent nature of the risk and the uncertainties associated with modelling, tipping points, and current understanding of dynamic processes.
- Due to the chronic nature of sea level rise, assessments need to look over long time periods. As in the climate scenario analysis workshops, stakeholders were very supportive of ensuring scenario analysis considered a long-term timeframe to ensure adaptation measures represented maximum cost-effectiveness.
- However, for adaptation planning, a focus on timescales may be a barrier to action as we are generally bad at long-term thinking. Instead, a focus on “what would the impact of a x meter rise in sea level be?” could be taken, analogous to the global warming level approach.
- Consideration should be given to where assets/infrastructure affected by sea level rise will need to be moved to.
- Coastal literacy is particularly poor among the public and within organisations. This prevents a comprehensive understanding of the associated risks. This has led to push back on modelled results in areas such as land use planning as there is an assumption that risks are being overstated.
- The stakeholders felt strongly that there should be better communication of the risks and uncertainties associated with impacts of sea level rise and coastal change. Scenarios should be communicated not as pessimistic but realistic given what is currently known and the associated uncertainties.
- The UK Met Office provide a range of datasets for the examining sea level rise under climate change and are in the process of updating these based on the more recent IPCC emissions scenarios.
Additional stakeholder insights
Stakeholder consultation as part of the 2024 SNAP statutory consultation process, indicated that there was strong support from organisations for any guidance to align scenarios with those recommended by the CCC (adapt to 2°C of warming, plan for the risks associated with 4°C of warming). Stakeholders also stated they would welcome guidance on the interpretation of data particularly relating to understanding climate data terminology (e.g. on emissions pathways and global warming levels).
Many stakeholders had previously considered flood risk, but the consideration of other hazards was less consistent. The Scottish Government (2023a) also confirmed this through the Business Insights and Conditions Survey. Over 60% businesses surveyed reported that they had not assessed for coastal erosion, increased flooding, temperature increases or water scarcity.
A scenario analysis decision tool has the potential to help ensure a range of hazards are considered in adaptation planning decisions, encouraging consistency and robustness. Whilst not all hazards will be material for all organisations, organisations should include all hazards that they deem to be material within their analysis.
Case Study: Climate Resilience Strategy (SP Energy Networks, 2021)
The Climate Resilience Strategy sets out how SP Energy Networks will maintain a safe and resilient network despite climate change. The analysis was done considering “four key climate change projection variables (temperature, precipitation, sea level rise, and wind speed/storminess) over three time periods (2030s, 2050s and 2100s) and two Representative Concentration Pathways (RCP) projection scenarios (RCP6.0 and RCP8.5)”.
Here, by considering chronic risks alongside acute ones, SP Energy Networks can ensure they understand interdependencies between different risks. For example, they note that “sea level and storm surge” could lead to an impact on their operations with sea level rise and coastal erosion increasing the exposure of their assets to storm surge events.
Recommendations
Our recommendations on the content of the decision tool are summarised below and more detail on these can be found throughout this section. There is also a section on our recommendations for the tool development (Section 5.10). These recommendations are designed to support adaptation planning so may not be suitable for scenario analysis carried out for other purposes such as financial reporting.
|
Factor |
Summary of recommendation on decision tool content |
|---|---|
|
Hazards covered |
Scenario analysis should cover both chronic and acute physical climate hazards. Transition risks should be considered separately by organisations, where they may have a significant impact. |
|
Scenario prescription and definition |
To drive consistency organisations should consider both 2°C and 4°C warming scenarios. |
|
Number of scenarios |
At least 2 scenarios should be considered, specifically 2°C and 4°C warming scenarios. |
|
Climate data provider |
The tool should point to up-to-date primary sources of data for different hazards as informed by the ongoing climate data review by the Scottish Government. |
|
Scope of scenario analysis |
The scope of scenario analysis is proportional to the use case, and use-case specific guidance should be followed. |
|
Timeframe of scenarios |
Short term: In line with business planning cycles. Medium term: 2045-50s. Long term: 2080s-end of century. |
|
Frequency of updates to analysis |
Scenario analysis should be updated every 3-5 years. |
|
Qualitative versus quantitative analysis |
Scenario analysis should be quantitative, but qualitative analysis can also be used to provide a richer narrative. |
|
Inclusion of the impact of the organisation on the climate |
Analysis normally needs only to cover the impact of the climate on the organisation. |
Table : Summary of recommendations
Hazards covered
Our research confirms that scenario analysis can consider both physical climate hazards and climate-related transition risks. However, as the decision tool will be designed to support adaptation planning, we recommend that the focus is on physical hazards only.
Transition risks should be considered separately by organisations, where they have the potential to have a significant impact on the organisation.
Scenario analysis should however cover different types of physical hazards, specifically it should cover both acute and chronic hazards (see Figure 1):
- Acute hazards are specific events such as floods or storms.
- Chronic events gradually evolve over time, such as average temperature increase or sea level rise.
Coastal change and sea level rise
While coastal change does pose specific threats, as indicated by the Scottish Government’s (2023b) Coastal Change Adaptation Plan Guidance and the Dynamic Coast (accessed 2024) project and explored further in the specific stakeholder workshop on this topic, we recommend considering it alongside other chronic risks as the first stage of the climate decision tool.
This will then enable stakeholders to get a better understanding of the shifting baseline in the future they are analysing, before assessing acute risks under that scenario. For example, sea level rise may bring with it a greater number and intensity of storm surges closer to shore. This is an important consideration for an organisation with infrastructure or physical assets that cannot be moved inland.
Chronic and acute hazards
Figure : Proposed structure of tool, considering chronic hazards before acute ones
Framing hazards as chronic and acute, with the sequencing set out as in Figure 1, should help tool users:
- Understand how baselines like current coastlines, precipitation levels and average temperatures are expected to change over time under different climate scenarios.
- Ensure that chronic physical risks are not overlooked, given their more gradual change which could lead to a progressive decline in service delivery rather than acute hazards that can cause more noticeable impacts and disruption.
- Consider connections and interactions between different physical risks, that in aggregate may provide a different risk profile than when considered independently.
- Ultimately provide a more holistic view, which will improve the standard of scenario analysis.
There will, however, be some challenges, specifically around data availability as revealed by the rapid data review.
An alternative would be to consider sea level rise and coastal change in a separate tool, noting some of the unique challenges posed by the risk. However, our recommendation encourages all risks to be considered in a single tool to help ensure interdependencies (and/or entire risks) are not missed.
Scenario prescription and definition
Prescribing the use of specific scenarios in the tool drives consistency across organisations and projects. This will enable better communication and comparisons supporting improved adaptation planning, particularly where several organisations are impacted by, or involved in, adaptation measures.
We recommend considering specific scenarios, aligned with other reporting frameworks we reviewed which organisations may be required/choose to comply with. This will further improve consistency (by allowing more consistency within organisations) and minimise additional work and costs for organisations.
We recommend considering both of the following scenarios:
- 2°C global warming level (above pre-industrial levels) by end of century.
- 4°C global warming level (above pre-industrial levels) by end of century.
When communicating the results of scenario analysis it is important to clearly articulate the rationale for choosing particular scenarios. Hence, we would recommend justifications for the choices of scenario are included in the tool, in particular, these could include:
- alignment with the updated CCC methodology (2024) and Defra’s Adaptation Reporting Power (2023).
- choosing a 2°C warming scenario allows organisations to assess their resilience against the lower end of plausible temperature outcomes by the end of the century.
- choosing a 4°C warming scenario allows organisations to assess their resilience to much higher physical risk, towards the upper end of plausible temperature outcomes by the end of the century.
- scenarios of 2°C and 4 °C gives a sensible range of likely futures based on current global efforts to reduce greenhouse gas emissions (CCC, 2020).
To enable a greater volume of the available climate data to be used we recommend that organisations can make use of emission pathways-based data, as well as data focused on global warming levels.
We have set out a table in Appendix F that can be used as a reference when comparing and contrasting emissions-based and temperature-based scenarios. In particular, the pathways best aligned to the scenarios prescribed above are:
|
Global warming level (above pre-industrial levels) by end of century |
RCP (5-95% temperature increase range at end of century) |
SSP-RCP (5-95% temperature increase range at end of century) |
|---|---|---|
|
2°C |
RCP 2.6 (1.1 – 2.3°C ) RCP 4.5 (1.8 – 3.2°C ) |
SSP1 – 2.6 (1.0 – 2.2°C ) |
|
4°C |
RCP 8.5 (3.2 – 5.5°C ) |
SSP3 – 7.0 (2.8 – 5.5°C) or SSP5 – 8.5 (3.6 – 6.6°C) |
Table : Global warming levels and equivalent RCPs and SSP-RCPs for prescribed scenarios
What are earth system tipping points?
Earth system tipping points are thresholds beyond which changes in a part of the climate system become self-perpetuating often leading to abrupt and irreversible changes that could have a profound impact on our planet (Armstrong et al., 2022).
Examples include melting of the major ice sheets or significant changes in the fundamental ocean circulation patterns.
GAD also recommends that earth system tipping points are excluded from the analysis at present due to the significant uncertainty and difficulty in robustly modelling their timing and impact. The tool should ensure this is explicitly stated so that users are aware of this limitation.
This guidance should be kept under review. Over time, as our understanding of tipping points develops, it may be reasonable to allow for them in the relevant scenarios. For this to be the case more data on their onset, the pace at which the impacts of tipping points occur, and the severity and extent of the potential impact will be needed. It is worth noting that CCRA3 includes some consideration of low likelihood, high impact risks (Watkiss and Betts, 2021).
Organisations may find it valuable to also consider a reasonable worst-case scenario. However, it is likely that this is more appropriate to do as part of emergency planning exercises, rather than scenario analysis for adaptation planning. Reasonable worst-case scenarios could include tipping points being breached and other thresholds being crossed beyond which the organisation may struggle to operate.
Number of scenarios
We recommend the use of at least two scenarios, in particular those described above being a +2°C and +4°C futures.
Considering two scenarios means that the scenario analysis meets the expectations of all the policy and guidance sources we reviewed in this project, detailed in Appendix C.
Climate data provider
Climate data is available from a large number of providers. While some of this data must be purchased, we recommend using publicly available data wherever possible as this increases transparency and reproducibility of the scenario analysis.
We recommend that the tool should point to primary sources of data for different hazards, informed by the ongoing climate data review by the Scottish Government.
Sources of data may be preferred based on a number of criteria:
|
Criteria |
Description |
|
Coverage of different climate hazards |
Sources that cover multiple hazards may enable more consistent scenario analysis across different hazards as well as improve internal efficiency and capability. |
|
Reliability of source |
UKCP and data from the Met Office are generally regarded as the best publicly available data that is specific to the UK. |
|
Spatial granularity of data |
Some data are available on a 1x1km grid, whereas other data are only available at the country-wide level. Techniques are available which can sometimes be appropriate to increase the granularity of the data. Assessing different climate hazards also requires different data granularity. The tool should allow for this and differences in spatial granularity between hazards should be communicated in the output of the scenario analysis. |
|
Timeframe of the data |
Ideally this should cover the end of the century. Different data sources may include different frequency, horizons, and baseline periods. The producer of the scenario analysis should make sure they understand these differences and communicate any implications of these in their scenario analysis output. |
|
Scenarios for which data is available |
For example, some data providers only have data relating to specific scenarios. |
|
Format and ease of accessibility of data |
This is particularly important for organisations that are inexperienced in conducting scenario analysis. |
|
Familiarity with data |
Organisations will be more efficient when using data with which they are already familiar. They may have already carried out relevant analysis using this data which can be reused. However, some caution should be exercised as there is a risk of familiarity bias. |
Table : Criteria for climate data provider selection
Scope of scenario analysis
We believe the most significant factor in determining a suitable scope for the scenario analysis will be the context and purpose of the analysis. There are also advantages of considering a broader scope for the analysis to ensure that interconnected risks are understood and analysed appropriately.
For adaptation planning, we recommend that the entire organisation is included within the scope of the scenario analysis[4]. There will be instances where certain hazards will be more material for certain areas of the organisation. However, including the entire organisation within the scenario analysis will ensure that adaptation measures are well considered and have less chance of creating unintended consequences to seemingly less-affected areas.
Depending on the nature of the organisation, or adaptation measure under consideration, it may be proportional to limit the scope of any analysis, in line with any specific guidance relevant to its use. The principle of proportionality was discussed further in Section 3.3.1.3.
The scope of scenario analysis should include a range of external factors which could affect an organisation such as energy supply, communications and transport systems.
‘Cross-boundary issues and wider interdependencies should also be considered with neighbouring bodies and wider stakeholders such as Network Rail, Transport Scotland, Scottish Water and SEPA.’
NHS Scotland Climate Emergency & Sustainability Strategy 2022-2026 (Scottish Government, 2022).
Timeframe of scenarios
A large volume of the scenario analysis literature reviewed refers to the use of short-, medium- and long-term timeframes. These are, however, seldom defined, leaving it up to the organisation to define timeframes relevant to them. This might, however, come at the expense of consistency which is needed when organisations are collaborating on adaptation planning.
There is also a risk that the timeframes considered are too short, preventing an organisation from taking a sufficiently long-term view for adaptation planning. To enable more consistency, we recommend that the timeframes are prescribed, and are aligned to those commonly cited, including mid-century and end-of-century.
GAD recommends the following timeframes:
|
Term |
Definition |
|---|---|
|
Short |
Defined by an organisation based on their business planning cycle. |
|
Medium |
Mid-century with organisations likely to use 2050s or 2045 to align with Scotland’s net zero target. |
|
Long |
End-of-century, i.e. 2080 – 2100. |
Table : Timeframes for scenario analysis
We have left the most flexibility around the short-term timeframe recommendation. We think that this is most helpful for organisations who have different planning cycles. It will allow them to have a greater level of internal consistency between their adaptation and other business planning, which should lead to a greater incentive to integrate climate considerations into business-as-usual planning. However, by not defining this timeframe, there will be less consistency in scenario analysis between organisations. Given the longer-term nature of many climate risks, this is considered to be a reasonable compromise.
The recommendations for the medium- and long-term still offer some flexibility, as mid- and end-of-century, as opposed to specific years such as 2050 or 2100. This is intended to make it possible for organisations to use a range of data sources more easily, or to align with other work they are doing. We believe that this will give a sufficiently high level of consistency across organisations whilst not becoming too onerous.
Carrying out scenario analysis over a longer timeframe adds greater complexity. However, we believe there is good reason to consider timeframes to the end of the century for most adaptation decision making. Through the stakeholder consultation there was a clear steer to ensure scenario analysis covered sufficiently long timeframes.
There is a delay, often lasting decades, between global climate action and the resulting impact on temperature rise and other climate risks. This means that physical risk scenarios are often very similar to each other in the short to medium term. For example, up to 2050 a +2°C end of century warming scenario may be very similar to a +4°C end of century warming scenario. This should give opportunity to consolidate analysis for the earlier years to make it more efficient.
The long timeframe of the analysis can allow false comfort as it can show that the risks are unlikely to affect the organisation for many years. However, actions to address the risks can take a similar amount of time or longer and the longevity of a physical or infrastructure asset as well as the projected sustainability of the business or organisation are more often measured in decades rather than shorter term. The uncertainty inherent in the analysis should also be considered as it means the risks may appear sooner.
Frequency of updates to analysis
Understanding of our climate and how it is changing is constantly improving. Practice in scenario analysis is also improving. In this rapidly evolving field, it is therefore important to ensure that scenario analysis is not seen as a one-off activity, but as an iterative process. In this way, the results from one scenario analysis exercise can inform the input to the next.
As updating scenario analysis can be a significant undertaking, we recommend a pragmatic approach, updating scenario analysis every 3-5 years. This can be more frequent if, for example, there are significant developments in climate science or events mean that the assumptions used are no longer suitable. Scenarios, by design, should be plausible and hence new information may mean they need to be changed.
Events that could trigger an update to a scenario analysis include, but are not limited to, the following:
- New IPCC analysis or report, which has a significantly different future climate outlook affecting the hazard facing an organisation.
- New data with a greater spatial resolution is realised, allowing a more accurate assessment of an organisation’s exposure to a hazard.
- Assets moving from the planning to design to operational phases, affecting the organisation’s vulnerability as a result.
As with other factors, a proportionate approach should be taken, and organisations should consider the extent to which an update is needed. This will differ depending on what has changed since the last analysis. It may be appropriate for organisations to update scenario analysis at different frequencies to better align with internal planning and decision-making processes. This should be justified appropriately.
Qualitative versus quantitative analysis
What is the difference between qualitative and quantitative analysis?
Qualitative scenario analysis focuses on the identification of trends and on the overarching narratives of the scenarios, often providing insight into less quantifiable organisation characteristics. It can involve descriptions of plausible future worlds, describing their main characteristics, relationships between key driving forces, and the dynamics of their evolution (TCFD, 2020).
Quantitative scenario analysis refers to the presentation of quantified information within a scenario. Quantitative scenario analysis can take many forms, targeting various aspects of [an organisation’s] vulnerability to climate‑related risks (MIT, 2019).
Quantification is often useful for adaptation planning as it can form part of a cost benefit analysis or support business cases for different adaptation measures. Quantitative analysis can allow for an easier comparison of alternatives.
However, there is also value in qualitative exploratory analysis, particularly where climate data may be limited. Qualitative analysis can also be easier to communicate to a broader audience.
We recommend that organisations carry out quantitative analysis. We recommend the decision tool also suggests where qualitative analysis could be most helpful. This could be in the short term where it can be used alongside quantitative analysis results to supply a richer narrative.
Case Study: No Time To Lose: New Scenario Narratives for Action on Climate Change (Cliffe et al., 2023)
This report by the Universities Superannuation Scheme and University of Exeter focuses on the power of qualitative analysis, with four short-term scenario narratives defined by assumptions for a range of drivers.
The resulting analysis is colourful and highly descriptive. “In 2024, the world confronts the challenges of a “Super El Niño” event, exacerbated by human-induced climate change, resulting in powerful and prolonged weather phenomena. Southern Africa and India experience prolonged droughts exacerbating water scarcity and food insecurity, as changing rainfall patterns disrupt crop yields and livestock production. Record temperatures and prolonged droughts lead to ‘heatflation’ due to smaller harvests and higher prices.”
Qualitative analysis of this type can be a powerful communication tool, especially when quantitative analysis would require a considerable number of assumptions that may make communication challenging.
Good quality communication of the results of climate scenario analysis, whether analysis has been quantitative or qualitative is imperative. This includes communication to others involved with or affected by the analysis, disclosures or publications both inside and outside of the organisation. When communicating climate risks, organisations may find it helpful to compare these risks to others with which readers may be more familiar (Reisinger et al., 2020).
Inclusion of the impact of the organisation on the climate
We recommend that analysis should focus on the impact of climate on the organisation. Requirements to consider the impact of the organisation on the climate arise from other existing legislation and duties.
Additional recommendations for tool development
The decision tool could take many forms. Based on the literature and data review, insight from stakeholders and experience, we set out key recommendations for tool development below, split by tool content and tool features. We consider the design of both the content and features to be important to ensure public bodies use the tool. In producing the tool not all these features and content are needed at once. They can be released and updated in stages.
Tool content recommendations
The tool needs to include the recommendations summarised in Section 5. Additional content is needed to provide context, technical guidance, and links to useful resources. We recommend the following are considered:
- A step-by-step process for public bodies and/or types of adaptation decision-makers to follow to complete scenario analysis in their context.
- Technical guidance on assessment of risk, using the exposure / hazard / vulnerability framework (Cardona et al., 2012).
- Technical guidance on how to translate data between RCPs and global warming levels, see Appendix F.
- Material helping with communication of risk and uncertainty.
- Worked examples of analysis.
- Educational materials describing scenario analysis.
- A description of the limitations of the approach and data.
Tool features recommendations
The platform and format of the tool should be selected to provide the following features:
- Accessibility to public bodies including consideration of software requirements.
- Ability to roll out updates of the content effectively when new data becomes available.
- A clear guided pathway through the parts of the tool, potentially with interaction to allow users to make decisions based on their needs.
As well as this we recommend an awareness campaign and engagement or training programme to encourage use of the tool.
Examples of scenario analysis tools
Most examples available of scenario analysis tools are aimed at organisations in the private sector preparing climate-related disclosures. There are good examples of toolkits for scenario analysis from New Zealand’s Ministry for the Environment (no date) and for adaptation from Local Partnerships (no date). These examples take different approaches to different use cases, but both set out a clear process and link to further helpful resources.
Conclusions
This research has highlighted the importance of climate scenario analysis for effective adaptation planning, despite the lack of policy and guidance specific to this area. Our research findings were derived from a holistic review of policies, guidance and stakeholder insights, as well as an examination of current practices and publicly available data.
Our findings underscore the importance of considering a broad array of climate hazards, noting however this may be limited by data availability. The review also confirmed the importance of considering multiple scenarios across a variety of timeframes, including into the long term, to capture the uncertainty of future climate change.
Stakeholder engagement revealed a significant need for improved communication of climate risks and greater climate literacy. It also demonstrated clear support for a decision tool that can help standardise and streamline the scenario analysis process, making it more accessible and consistent across Scottish organisations.
Based on our research findings, we have made recommendations covering nine key factors that should be considered when undertaking scenario analysis.
The recommendations provided aim to guide the Scottish Government in developing a clear, practical decision tool for public bodies to use, which can make scenario analysis easier and more consistent. These include prescribed scenarios, consistent timeframes and a focus on quantitative analysis while recognising the value of qualitative insights. Additionally, we emphasise the need for iterative updates to scenario analysis to incorporate new data and evolving climate science.
We hope with this report that by defining some factors of the scenarios that organisations should consider within their scenario analysis, they will be able to spend more time on trying to understand how their organisation could respond to those scenarios and less time on identifying plausible scenarios to assess.
Ultimately, by implementing these recommendations and developing a robust decision tool, we hope public bodies in Scotland can enhance their climate resilience, ensuring that adaptation measures are well-informed, cost-effective and aligned with broader climate goals.
References
Adaptation Scotland (2021). Climate Projections for Scotland – Summary. Available at: climate-projections-scotland-summary-dec21.pdf
Armstrong McKay, D.I., Staal, A., Abrams, J.F., Winkelmann, R., Sakschewski, B., Loriani, S., Fetzer, I., Cornell, S.E., Rockström, J. and Lenton, T.M. (2022). Exceeding 1.5°C global warming could trigger multiple climate tipping points. Science, 377(6611). doi:10.1126/science.abn7950
Betts, R.A. and Brown, K. (2021). Introduction. In: The Third UK Climate Change Risk Assessment Technical Report [Betts, R.A., Haward, A.B. and Pearson, K.V. (eds.)]. Prepared for the Climate Change Committee, London. Available at: Introduction – UK Climate Risk
Cardona, O.D., van Aalst, M.K., Birkmann, J., Fordham, M., McGregor, G., Perez, R., Pulwarty, R.S., Schipper, E.L.F., and Sinh, B.T. (2012). Determinants of risk: exposure and vulnerability. In: Managing the Risks of Extreme Events and Disasters to Advance Climate Change Adaptation. A Special Report of Working Groups I and II of the Intergovernmental Panel on Climate Change (IPCC). Cambridge: Cambridge University Press, pp. 65-108. Available at: 2 – Determinants of Risk: Exposure and Vulnerability (ipcc.ch)
CCC (2020). Why do we look at high warming levels when assessing UK climate risk? Available at: Why do we look at high warming levels when assessing UK climate risk? – Climate Change Committee
CCC (2021). Independent Assessment of UK Climate Risk – Advice to Government – For the UK’s third Climate Change Risk Assessment (CCRA3). Available at: Independent-Assessment-of-UK-Climate-Risk-Advice-to-Govt-for-CCRA3-CCC.pdf (theccc.org.uk)
CCC (2022). Is Scotland climate ready? 2022 Report to Scottish Parliament. Available at: Is Scotland climate ready? 2022 Report to Scottish Parliament (theccc.org.uk)
CCC (2023). Adapting to climate change – Progress in Scotland. Available at: Adapting to climate change – Progress in Scotland (theccc.org.uk)
CCC (2024). Proposed methodology for the Fourth Climate Change Risk Assessment – Independent Assessment (CCRA4-IA). Available at: Proposed methodology for the Fourth Climate Change Risk Assessment – Independent Assessment (CCRA4-IA) – Climate Change Committee (theccc.org.uk) [Accessed: September 2024]
CCC (no date). Introduction to the CCRA. Available at: Introduction to the CCRA – Climate Change Committee (theccc.org.uk)
Cliffe, M., Abrams, J.F., Barker, M., Branum-Burns, K., Campbell, R., Cordinale, M., Clark, M., Clark, N., Lalande, W., Laskey, T., Lenton, T.M., Matthews, L., Oliver, J., Picot, R., and Pilcher, S. (2023). No Time To Lose: New Scenario Narratives for Action on Climate Change. Available at: No-Time-To-Lose-New-Scenario-Narratives-for-Action-on-Climate-Change-Full-Report.pdf (greenfuturessolutions.com)
Climate Change (Scotland) Act 2009. Available at: Climate Change (Scotland) Act 2009.
Commission Delegated Regulation (EU) 2023/2772 of 31 July 2023 supplementing Directive 2013/34/EU of the European Parliament and of the Council as regards sustainability reporting standards (2023). Available at: Delegated regulation – EU – 2023/2772 – EN – EUR-Lex (europa.eu)
Defra (2023). Climate Adaptation Reporting – Fourth round guidance.
Department for Business, Energy and Industrial Strategy (2022). Mandatory climate-related financial disclosures by publicly quoted companies, large private companies and LLPs – Non-binding guidance. Available at: Mandatory climate-related financial disclosures by publicly quoted companies, large private companies and LLPs (publishing.service.gov.uk)
Dynamic Coast (accessed 2024). Available at: Dynamic Coast [Accessed: September 2024]
FRC (2022). CRR Thematic review of TCFD disclosures and climate in the financial statements. Available at: FRC TCFD disclosures and climate in the financial statements_July 2022
HM Treasury (2022, last updated 2024). The Green Book (2022). Available at: The Green Book (2022) – GOV.UK (www.gov.uk) [Accessed: September 2024]
IFRS (2023). IFRS S2 Climate-related Disclosures. Available at: ISSB-2023-A – Issued IFRS Standards
Lee, J.-Y., Marotzke, J., Bala, G., Cao, L., Corti, S., Dunne, J.P., Engelbrecht, F., Fischer, E., Fyfe, J.C., Jones, C., Maycock, A., Mutemi, J., Ndiaye, O., Panickal, S., and Zhou, T. (2021). Future Global Climate: Scenario-Based Projections and Near-term Information in Climate Change 2021: The Physical Science Basis. Contribution of Working Group I to the Sixth Assessment Report of the Intergovernmental Panel on Climate Change [Masson-Delmotte, V., Zhai, P., Pirani, A., Connors, S.L., Péan, C., Berger, S., Caud, N., Chen, Y., Goldfarb, L., Gomis, M.I., Huang, M., Leitzell, K., Lonnoy, E., Matthews, J.B.R., Maycock, T.K., Waterfield, T., Yelekçi, O., Yu, R., and Zhou, B. (eds.)]. Cambridge: Cambridge University Press, pp. 553–672. doi:10.1017/9781009157896.006.
Local Partnerships (no date). Climate adaptation toolkit and risk generator. Available at: Climate adaptation toolkit and risk generator (localpartnerships.gov.uk) [Accessed: September 2024]
Met Office (2023). Making sense of climate change projections. Available at: Making sense of climate change projections | Official blog of the Met Office news team
MIT (2019). Climate-Related Financial Disclosures – The Use of Scenarios. Available at: Climate Finance Disclosures – Scenarios.pdf (mit.edu) [Accessed: September 2024]
Ministry for the Environment [New Zealand] (no date). Climate scenarios toolkit. Available at: Climate scenarios toolkit | Ministry for the Environment [Accessed: September 2024]
Moreira Sousa, A. (2022). Staying safe in extreme heat – UK Health Security Agency. Available at: Staying safe in extreme heat – UK Health Security Agency (blog.gov.uk)
Reisinger, A., Howden, M., Vera, C., Garschagen,M., Hurlbert, M., Kreibiehl, S., Mach, K.J., Mintenbeck, K., O’Neill, B., Pathak, M., Pedace, R., Pörtner, H., Poloczanska, E., Rojas Corradi, M., Sillmann, J., van Aalst, M., Viner, D., Jones, R., Ruane, A.C., and Ranasinghe, R. (2020) The Concept of Risk in the IPCC Sixth Assessment Report: A Summary of Cross-Working Group Discussions. Geneva: Intergovernmental Panel on Climate Change, pp15. Available at: Risk-guidance-FINAL_15Feb2021.pdf (ipcc.ch)
Scotland’s Environment (2024). Changing climate. Available at: Changing climate | Scotland’s environment web [Accessed: September 2024]
Scottish Government (2011). Public bodies climate change duties: putting them into practice, guidance required by part four of the Climate Change (Scotland) Act 2009. Available at: Public bodies climate change duties: putting them into practice, guidance required by part four of the Climate Change (Scotland) Act 2009 – gov.scot
Scottish Government (2022). NHS Scotland Climate Emergency & Sustainability Strategy 2022-2026. Available at: NHS Scotland Climate Emergency and Sustainability Strategy 2022-26 (www.gov.scot)
Scottish Government (2023a). BICS weighted Scotland estimates: data to wave 88. Available at: BICS weighted Scotland estimates: data to wave 88 – gov.scot (www.gov.scot)
Scottish Government (2023b). Coastal Change Adaptation Plan Guidance. Available at: Coastal Change Adaptation Plan Guidance
Scottish Government (2024). Scottish National Adaptation Plan 2024 – 2029 Actions today, for a climate resilient future. Available at: Scottish National Adaptation Plan (2024-2029) (www.gov.scot)
Seneviratne, S.I., Zhang, X., Adnan, M., Badi, W., Dereczynski, C., Di Luca, A., Ghosh, S., Iskandar, I., Kossin, J., Lewis, S., Otto, F., Pinto, I., Satoh, M., Vicente-Serrano, S.M., Wehner, M., and Zhou, B. (2021) Weather and Climate Extreme Events in a Changing Climate Supplementary Material in Climate Change 2021: The Physical Science Basis. Contribution of Working Group I to the Sixth Assessment Report of the Intergovernmental Panel on Climate Change [Masson-Delmotte, V., Zhai, P., Pirani, A., Connors, S.L., Péan, C., Berger, S., Caud, N., Chen, Y., Goldfarb, L., Gomis, M.I., Huang, M., Leitzell, K., Lonnoy, E., Matthews, J.B.R., Maycock, T.K., Waterfield, T., Yelekçi, O., Yu, R., and Zhou, B. (eds.)]. Available at: 11SM – Weather And Climate Extreme Events in a Changing Climate Supplementary Material (ipcc.ch)
SP Energy Networks (2021). Climate Resilience Strategy. Available at: Annex_4A.7-Climate_Resilience_Strategy.pdf (spenergynetworks.co.uk)
Sustainable Scotland Network (2023). Public Bodies Climate Change Reporting 2021/22 Analysis Report. Available at: Sustainable Scotland Network Analysis Report 2021 to 2022
Swinney, J (2024). Priorities for Scotland: First Minister’s statement. Available at: Priorities for Scotland: First Minister’s statement – 22 May 2024 – gov.scot (www.gov.scot)
TCFD (2017). Recommendations of the Task Force on Climate-related Financial Disclosures. Available at: FINAL-2017-TCFD-Report.pdf (bbhub.io)
TCFD (2020). Guidance on Scenario Analysis for Non-Financial Companies. Available at: 2020-TCFD_Guidance-Scenario-Analysis-Guidance.pdf (bbhub.io)
The Companies (Strategic Report) (Climate-related Financial Disclosure) Regulations 2022 (SI 2022/31). Available at: The Companies (Strategic Report) (Climate-related Financial Disclosure) Regulations 2022
The Occupational Pension Schemes (Climate Change Governance and Reporting) Regulations 2021 (SI 2021/839). Available at: The Occupational Pension Schemes (Climate Change Governance and Reporting) Regulations 2021
Watkiss, P. and Betts, R.A. (2021). Method. In: The Third UK Climate Change Risk Assessment Technical Report [Betts, R.A., Haward, A.B. and Pearson, K.V. (eds.)]. Prepared for the Climate Change Committee, London. Available at: Chapter 2: Method – UK Climate Risk
Watkiss, P (2022). The Costs of Adaptation, and the Economic Costs and Benefits of Adaptation in the UK. Available at: The Costs of Adaptation, and the Economic Costs and Benefits of Adaptation in the UK (theccc.org.uk)
Appendices
This report has been prepared by the Government Actuary’s Department (GAD) at the request of ClimateXChange on behalf of the Scottish Government.
The report has been prepared for the use of ClimateXChange and the Scottish Government and is published on ClimateXChange’s website. Therefore, we acknowledge that it will likely have a wider audience than the intended recipients. However, other than ClimateXChange and Scottish Government, no person or third party is entitled to place any reliance on the contents of this report, except to any extent stated herein. GAD has no liability to any person or third party for any action taken or for any failure to act, either in whole or in part, on the basis of this report.
In preparing this report, GAD has relied on publicly available data and other information as described in the report. Any checks that GAD has made on this information are limited to those described in the report, including any checks on the overall reasonableness and constancy of the data. These checks do not represent a full independent audit of the data supplied. In particular, GAD has relied on the general completeness and accuracy of the information supplied without independent verification.
GAD provides both actuarial and other advice. For clarity, this report provides research findings and recommendations and as a result is not subject to the Technical Actuarial Standard TAS 100 issued by the Financial Reporting Council (FRC) for actuarial work in the UK.
There is significant uncertainty involved when assessing climate risks. Care has been taken to ensure that, where material, this work has taken into consideration the latest climate change research and appropriate climate data.
The Institute and Faculty of Actuaries (IFoA), the regulatory body for GAD’s actuaries, has issued three climate change related risk alerts to members. These have all been considered when preparing this work.
Over time, as the global emissions pathway becomes clearer and there are advances in science and technology, our view of future climate risks will undoubtably change. Future developments may have a material impact on the results and conclusions contained in this work and care should be taken when referring back to this analysis after the date of issue.
One of the challenges for public sector organisations (and others) conducting scenario analysis is the range of potential approaches and assumptions that can be taken. Through preparing this guidance we have considered various other approaches in producing the final recommendations, some of which have been outlined in Section 4.
- Data sources reviewed[5]
Climate Analytics Climate Impact Explorer
Climate Analytics Climate Risk Dashboard
Global Infrastructure Climate-Related Risk Analytics
Environment Agency Climate Impacts Tool
Met office Climate Data Portal
UK Climate Projections User Interface (UKCP18)
Copernicus Climate Data Store (extreme climate indices)
Copernicus Climate Data Store (changes in water levels)
Copernicus Climate Data Store (climate and energy indicators)
Copernicus Bioclimatic Indicators
World Resources Institute Aqueduct
UK Climate Risk Indicator Explorer
SEPA Flood Risk Management Maps
World Bank Climate Knowledge Portal
Climate Central’s Coastal Risk Screening Tool
Documents reviewed:
|
Title |
Category |
Publication Year |
Overview |
|---|---|---|---|
|
Best practice |
2022 |
The FRC reviewed the TCFD disclosures and climate related reporting of twenty-five premium listed companies. | |
|
European Environment Agency (EEA): European Climate Risk Assessment |
Best practice |
2024 |
The EEA named 36 climate risks across Europe, considering factors such as severity, policy readiness and risk ownership. |
|
Best practice |
2022 |
HM Government outlined the key climate change risks and opportunities faced by the UK today, considering 61 UK-wide climate risks across various sectors in the economy. Prioritised areas for action include risks to habitats, soil health, carbon stores, food supply, power systems, and human health from increased heat exposure. | |
|
Best practice |
2021 |
Research conducted by the Alliance Manchester Business School in collaboration with the FRC delves into the practical processes and approaches used by UK companies engaged in climate scenario analysis. The report sheds light on motivations, value, common phases and challenges faced during this analysis, helping companies identify and prepare for climate change impacts on their business models. The study emphasises the importance of embedding climate-related scenario analysis into strategic planning processes. | |
|
Transport Scotland: Transport Scotland’s Approach to Climate Change Adaptation & Resilience |
Best practice |
2023 |
The report outlines key climate risks affecting Scotland’s transport system and discusses strategic outcomes for road, rail, aviation and maritime networks. It emphasises a well-adapted, safe, reliable and resilient transport system, providing a framework based on up-to-date climate science addressing each network’s specific challenges. |
|
Best practice |
2022 |
The CCC assesses Scotland’s climate resilience progress. The report highlights adaptation efforts have stalled across sectors. CCC recommends clear targets, improved monitoring, and local initiatives are recommended for effective climate adaptation. | |
|
Policy |
2019 |
A 5-year initiative aimed at preparing Scotland for the challenges posed by climate change. The report emphasises urgent action on emissions cuts and links adaptation and mitigation efforts. It outlines policies and proposals to address climate risks across sectors, including threats to food, water, health, biodiversity and Scotland’s historic environment. | |
|
Scottish Government: Draft Scottish National Adaptation Plan (2024-2029) |
Policy |
2024 |
Scottish Government outlines actions to enhance Scotland’s resilience to climate change. It addresses challenges like heatwaves, flooding and sea-level rise which are already affecting the country. The plan focuses on five outcomes: Nature Connects, Communities, Public Services and Infrastructure, Economy, Industry, and Business, and international Action. |
|
Policy |
2022 |
Department of Business and Trade (DBT) outlines regulations requirements on certain publicly quoted companies and large private companies to incorporate TCFD-aligned climate disclosures in their annual reports. Companies must reveal climate risks, management strategies, and the impact of climate change on their business. Focuses on enhancing transparency and informed decision-making about climate risks and opportunities. | |
|
Policy |
2022 |
DBT outlines regulations enhancing transparency for large UK traded and limited liability partnerships (LLPs) (meeting specific employee criteria) to include climate related disclosures in their strategic reports, including risks and opportunities. | |
|
Policy |
2021 |
The Department for Work and Pensions (DWP) regulations outline regulations requiring trustees of occupational pension schemes to understand climate change risks and opportunities, aligning with TCFD recommendations. The goal is to enhance governance quality and encourage proactive management of climate-related risks. | |
|
Other |
2023 |
Defra outlines approach for enhancing climate adaptation reporting in the UK. Consultation seeks input from stakeholders on reporting requirements, guidance and risk assessment related to climate change impacts. Aims to improve transparency, informed decision-making and proactive management of climate risks within various sectors. | |
|
Policy |
2023 |
CCC evaluates Scotland’s progress in climate adaptation, particularly during the second Scottish Climate Change Adaptation Programme (SCCAP2). Overall progress remains slow, with gaps in delivery and implementation. The (now recently published) SNAP3 must address these challenges, embed adaptation in legislation and enhance monitoring and evaluation systems. | |
|
Taskforce on Climate Related Financial Disclosures (TCFD): TCFD Recommendations |
Recommendations and Guidance |
2017 |
TCFD aims to ensure consistent, comparable and reliable climate-related financial disclosures by companies. It covers four key areas: governance, strategy, risk management, and metrics and targets. |
|
Policy |
2023 |
The European Sustainability Reporting Standards (ESRS) were adopted by the EU commission in 2023 to make corporate economic, social and governance (ESG) reporting across the EU more consistent, comparable, and achieve greater standardisation. | |
|
Recommendations and Guidance |
2023 |
The ISSB outlines requirements for disclosing information about an entity’s climate-related risk and opportunities. This standard enhances transparency by guiding organisations in reporting climate impacts, strategies, and metrics. | |
|
TCFD: Implementing the Recommendations of the Task Force on Climate-related Financial Disclosures |
Application Guidance |
2021 |
The TCFD provides widely adoptable recommendations for organisations across sectors and jurisdictions, which aim to elicit decision-useful, forward-looking information that can be incorporated into mainstream financial findings. |
|
TCFD: Guidance on Scenario Analysis for Non-Financial Companies |
Application Guidance |
2020 |
The TCFD released guidance helping non-financial companies in using climate-related scenarios to assess risks and opportunities, contributing to strategy resilience and flexibility. |
|
Accounting for Sustainability (A4S): TCFD Climate Scenario Analysis |
Application Guidance |
2021 |
Accounting for Sustainability (A4S) has published guidance for finance teams on frequently asked questions on scenario analysis, which is useful for preparers of TCFD reports, although targeted towards the private sector. |
|
Application Guidance |
2021 |
DWP brought in regulation for private sector pension schemes to complete TCFD reporting in 2021. | |
|
Application Guidance |
2022 |
The Financial Conduct Authority (FCA) updated their listing rules (in 2020 for premium listed and 2021 for standard listed companies), and DBT amended the Companies Act in 2022 to bring in TCFD aligned reporting requirements for publicly listed companies and LLPs in the UK. | |
|
Application Guidance |
2021 |
The Physical Climate Risk Assessment Methodology (PCRAM) developed by the Coalition for Climate Resilient Investment (CCRI), integrates physical climate risks (PCRs) into investment appraisal practices. It guides infrastructure investment practitioners in assessing climate risk analytics, credit quality and investment decisions. The CCRI aims to enhance investment decision-making and foster resilient economic and communities world-wide. | |
|
Other |
2024 |
The Transition Plan Taskforce (TPT) provides guidance for comprehensive transition planning, emphasising the integration of adaptation and physical resilience considerations into transition plans. | |
|
Other |
2023 |
The TPT sets out gold standard recommendations for developing and disclosing robust and credible transition plans. Aligned with international standards, this framework provides essential tools for businesses navigating the global transition to net zero. | |
|
Recommendations and Guidance |
2024 |
The TPT provides essential guidance for robust and credible plan transition plan disclosures. It builds upon the TPT Disclosure Framework, offering practical recommendations and a valuable resource for navigating their global transition to net zero. | |
|
Recommendations and Guidance |
2022 |
ClimateXChange investigates adaptive flood risk management planning in Scotland, focusing on addressing barriers identified in a 2019 report and examinates three case studies: Outer Hebrides coastal adaptation, Moray fluvial adaptation, and The Clyde tidal adaptation. The research implies the importance of a managed adaptive approach, flexibility, stakeholder involvement, and readiness assessments for successful adaptation investments. | |
|
Scottish Government: Coastal Change Adaptation Plan Guidance |
Recommendations and Guidance |
2023 |
The Scottish Government’s interim guidance on Coastal Change Adaptation Plans aims to support local authorities and their partners across Scotland. These plans go beyond Shoreline Management Plans by considering long-term adaptation and resilience for coastal communities and assets in the face of climate change and coastal shifts. The guidance emphasises principles of adaptation, natural system collaboration, and community engagement, providing a framework for safeguarding coastlines. |
|
Best practice |
2021 |
Network Rail published this report that focuses on understanding and managing climate change impact. It emphasises weather and climate risks, policy alignment, and investments in resilience. Implementation is still a challenge, but the organisation is committed to enhancing on-ground resilience. | |
|
Network Rail: Scotland’s Railway Climate Ready Plan 2024 – 2029 |
Best practice |
2024 |
Scotland’s Railway climate ready plan discusses improving railway assets to withstand climate challenges, incorporating expertise into decision-making, and laying groundwork for managing climate risks. |
|
Intergovernmental Panel on Climate Change (IPCC): Climate Change 2022: Mitigation of Climate Change |
Recommendations and Guidance |
2022 |
The IPCC report provides a comprehensive assessment of global climate change mitigation efforts. It covers near-to-mid-term strategies, sectoral perspectives, policy considerations, innovation, and technology. The report aims to guide stakeholders in addressing the climate crisis while ensuring sustainable development. |
|
Recommendations and Guidance |
2023 |
The CCC’s report assesses the UK Government’s actions in reducing emissions. Key highlights include the need for urgent policy implementation, transparent reporting, and collaboration with international frameworks. The report emphasises specific strategies such as demand-side policies, land use planning, and transitioning away from fossil fuels. | |
|
Scottish Government: Scotland’s response to the CCC Annual Progress Report 2022 Recommendations |
Recommendations and Guidance |
2022 |
This Scottish Government report was a response to the 2022 CCC annual progress report. The report evaluates recommendations from the CCC with the Scottish Government accepting or partially accepting 98/99 recommendations. |
|
Sustainable Scotland Network (SSN): Public Bodies Climate Change Reporting 2021/2022 |
Best practice |
2022 |
This report presents summary analysis and key findings from 188 public sector bodies’ annual climate change reporting across the 2021/22 reporting period |
|
Network Rail: Scotland’s Railway CP6 Weather Resilience and Climate Change Adaptation Plans |
Best practice |
2020 |
The aim of the report is to define Scotland’s Railway Weather Resilience and Climate Change Adaptation (WRCCA) Plan for Control Period 6 (2019-2024) |
|
Defra: Accounting for the effects of climate change – Supplementary Green Book guidance |
Recommendations and Guidance |
2024 |
Supplementary guidance to HM Treasury’s Green Book supports analysts and policy makers to ensure, where appropriate, that policies and projects are resilient to the effects of climate change and that these are considered when appraising options. |
|
National Audit Office: Overcoming challenges to managing risks in government |
Other |
2023 |
A guide outlines the challenges to managing risks in government and ways senior leaders and risk practitioners can overcome these challenges. |
|
Sniffer: Evidence for the third UK Climate Change Risk Assessment CCRA3 – Summary for Scotland |
Recommendations and Guidance |
2022 |
The summary presents comprehensive evidence on the current and future impacts of climate change in Scotland. It details the specific risks facing Scotland, including those related to weather extremes, biodiversity loss, and economic vulnerabilities. It aims to inform policy and action to enhance resilience and adaptability in the face of climate change across Scotland. |
We would like to thank the following organisations who contributed to our research and provided useful insights on their areas of expertise and experience of completing climate scenario analysis:
Climate Change Committee
Dynamic Coast
Edinburgh City Council
Forestry and Land Scotland
Highlands and Islands Airports Limited
Historic Environment Scotland
Met Office
NatureScot
Network Rail
Paul Watkiss Associates Limited
Scottish Environmental Protection Agency (SEPA)
Scottish Government
Scottish Water
Sniffer
Transport Scotland
University of Glasgow.
Climate risks and opportunities are often broken down into risks related to the physical impacts of climate change and risks related to the transition to a lower-carbon economy. The TCFD (2017) further breaks down transition and physical climate risks as summarised below.
Acute:
- River and coastal flooding
- Surface water flooding
- Storm events – cyclone, hurricane etc
- Storm sea level surge
Chronic:
- Change in precipitation
- Rising mean temperatures
- Sea level rise and coastal change
Policy and legal:
- Increasing price of GHG emissions
- Enhanced emissions reporting requirements
- Regulation of products and services
- Exposure to litigation
Technology:
- Substitution with lower emitting products and services
- Unsuccessful investment in new technologies
- Costs to transition to lower emissions technologies
Market:
- Change in customer behaviour
- Uncertainty in market systems
- Increased cost of raw materials
Reputation:
- Change in customer preferences
- Stigmatisation of sector
- Increased stakeholder concern or negative stakeholder feedback
IPCC Coupled Model Intercomparison Project Phase 5 (CMIP5) – used for the IPCC’s 5th assessment report and UKCP18 (Seneviratne et al., 2021):
|
RCP |
Associated mid-century temperature increase relative to pre-industrial temperature (°C) Multi-model average, 5-95% range |
Associated end of century temperature increase relative to pre-industrial temperature (°C) Multi-model average, 5-95% range |
|---|---|---|
|
RCP 2.6 |
1.7 (1.3-2.2) |
1.7 (1.1-2.3) |
|
RCP 4.5 |
2.0 (1.5-2.6) |
2.5 (1.8-3.2) |
|
RCP 6.0 |
1.9 (1.4-2.4) |
2.8 (2.3-3.6) |
|
RCP 8.5 |
2.5 (1.9-3.2) |
4.4 (3.2-5.5) |
IPCC Coupled Model Intercomparison Project Phase 6 (CMIP6) – used for the IPCC’s 6th assessment report (Lee et al., 2021):
|
SSP-RCP |
Associated mid-century temperature increase relative to pre-industrial temperature (°C) Multi-model average, 5-95% range |
Associated end of century temperature increase relative to pre-industrial temperature (°C) Multi-model average, 5-95% range |
|---|---|---|
|
SSP1 – 1.9 |
1.7 (1.1-2.4) |
1.5 (1.0-2.2) |
|
SSP1 – 2.6 |
1.9 (1.2-2.7) |
2.0 (1.3-2.8) |
|
SSP2 – 4.5 |
2.1 (1.5-3.0) |
2.9 (2.1-4.0) |
|
SSP3 – 7.0 |
2.3 (1.6-3.2) |
3.9 (2.8-5.5) |
|
SSP5 – 8.5 |
2.6 (1.8-3.4) |
4.8 (3.6-6.5) |
How to cite this publication:
Grace, E., Marcinko, C., Paterson, C., Stobbs, W. (2024) ‘Using future climate scenarios to support today’s decision making’ ClimateXChange. http://dx.doi.org/10.7488/era/5567
© The University of Edinburgh, 2024
Prepared by Government Actuary’s Department on behalf of ClimateXChange, The University of Edinburgh. All rights reserved.
While every effort is made to ensure the information in this report is accurate, no legal responsibility is accepted for any errors, omissions or misleading statements. The views expressed represent those of the author(s), and do not necessarily represent those of the host institutions or funders.
This work was supported by the Rural and Environment Science and Analytical Services Division of the Scottish Government (CoE – CXC).
ClimateXChange
Edinburgh Climate Change Institute
High School Yards
Edinburgh EH1 1LZ
+44 (0) 131 651 4783
Usually these are to disclose information in line with ISSB (IFRS, 2023), or TCFD (2017) requirements. ↑
Derived from their global HadGEM3 model. ↑
Whilst the focus of this report is on public bodies, there are many aspects that will be applicable and useful to private sector organisations. Therefore, throughout the report, we refer to “organisations” to encompass both public bodies and private companies. ↑
In some instances (for example Local Authorities) this will include the whole area where the organisation has influence. ↑
Links correct at date of publication. ↑
Research completed: October 2023
DOI: http://dx.doi.org/10.7488/era/3991
Executive summary
This project was commissioned to inform the Scottish Government on the evidence and arguments for and against the inclusion of metered energy consumption data in Energy Performance Certificates (EPCs). Methods included a literature review and interviews with stakeholders in Scotland, the UK and Sweden.
We outline the potential opportunities for and barriers to using energy consumption data; the practicalities of obtaining and using energy consumption data; and the value of including such data, when considering the variables that affect actual energy usage.
Key findings
Metered energy consumption data could be used in EPCs in two ways to provide information to occupants or potential occupants:
- to provide more accurate information on building fabric performance, known as an asset rating
- to give a rating of how energy is used in a building when compared with similar buildings, known as an operational rating.
These two uses of metered consumption data – asset rating and operational rating – are not mutually exclusive and could both be included in EPCs. This could be developed as a dynamic, digital EPC.
Neither of these two uses could be implemented immediately as 57% of homes in Scotland do not yet have smart meters, which are the most reliable means of collecting metered energy consumption data. Particular difficulties include:
- A small proportion of homes will never have smart meter capability, including homes with unregulated heating fuels such as oil, LPG, or solid fuels.
- There is no process to access smart meter data to generate EPCs. The Smart Meter Energy Data Repository Programme is investigating the commercial feasibility of a repository that would enable this.
The most straightforward use for metered energy consumption data is to include the operational rating value on an EPC alongside a reference figure, such as a national average, modelled archetype, or historic consumption data for a property.
- Correcting energy consumption in a property for weather and normalising it by floor area would enable potential occupants to compare properties.
- An operational rating could be included as a part of the EPC or exist as a separate document.
EPCs should retain an asset rating that is based on standard assumptions of occupancy and use, to allow comparison between properties. This could be based on modelled or measured data.
For an accurate asset rating, metered energy consumption data can be used to calculate the heat transfer coefficient of buildings. This requires collecting internal temperature data, as well as metered energy consumption data. The latest smart meter in-home display units have inbuilt temperature sensors. The possibility of transmitting temperature readings alongside meter readings is being investigated by the Data Communications Company.
Accurate heat transfer coefficient figures can inform retrofit decisions. Further consideration is needed around the level of retrofit recommendations provided by EPCs and how these are used in policy decisions. Using metered energy consumption data to inform retrofit recommendations may be more suited to detailed retrofit plans such as renovation roadmaps.
Consumer consent will be needed to collect and process metered energy consumption data.
Recommendations
This report explores whether it is possible for metered energy consumption data to be used within EPCs and outlines two ways in which this data could be useful. In order to progress with either or both of these options, we recommend that the Scottish Government define the purpose and intended outcome of using metered energy consumption data within EPCs.
Our research has highlighted that further work is needed in this area to explore:
- The practicalities of collecting required data, including:
- Metered energy consumption data at the individual building level, rather than from aggregated datasets. This will require a standardised process for collecting consumer consent. Public sector bodies can obtain household-level data without the need for individual consent through the legal basis of ‘public task’. However, this is for aggregated data and there are no examples of data being used to provide insights into individual households, so further investigation is needed into the legal basis for this. Legal routes for this were not explored as part of this research.
- Processes for data collection, as these are mostly dependent on the rollout of smart meters. An alternative methodology will need to be developed for households using unregulated fuels, as their heating consumption will not be captured in smart meter data.
- Additional information from occupants, which can be used to contextualise energy consumption data when used for an operational rating. Examples of this kind of data include the number of occupants or typical heating regime. Further work is required to understand the minimum amount of contextual information to enable metered energy consumption data to be useful.
- Internal temperature data for the purpose of calculating a heat transfer coefficient as part of an asset rating. This would require the mass rollout of internal temperature sensors, which are already included in some in-home display devices. Internal temperature data could also be useful contextual data for an operational rating.
- Different formats that could be used to display consumption data when used for an operational rating. This should consider whether consumption data would work best as one of multiple ratings within the EPC or separately.
- For energy-generating homes, how total energy consumption, generation, export and cost can be displayed in a straight-forward manner.
- Any regulatory or practical barriers to inputting the heat transfer coefficient as a measured value in Standard Assessment Procedure calculations for the asset rating.
- The value of Display Energy Certificates for non-domestic public buildings in England and Wales, and whether there would be value in expanding their use in Scotland.
Glossary / Abbreviations table
|
Term |
Definition |
|
Asset rating |
A measure of building fabric performance. It provides no information about how the building is used in practice. |
|
BEIS |
Department for Business, Energy & Industrial Strategy. Split in 2023 to form three departments, including the Department for Energy Security and Net Zero (DESNZ). |
|
CCC |
Climate Change Committee. An independent, statutory body whose purpose is to advise the UK and devolved governments on emissions targets and then report to Parliament. |
|
DCC |
Data Communications Company. A licenced monopoly regulated by Ofgem. Responsible for linking smart meters in homes and businesses with energy suppliers, network operators and energy service companies. |
|
DEC |
Display Energy Certificate. Shows the energy performance of a building based on the operation rating, on a graphical scale from A (very efficient) to G (least efficient). Measures the actual energy usage of a building based on annual consumption. |
|
DESNZ |
Department for Energy Security and Net Zero. The UK Government department responsible for securing long-term energy supply, reducing bills, and encouraging greater energy efficiency. |
|
DNO |
Distribution Network Operator. A company licensed to distribute electricity in the UK. |
|
DOR |
Domestic Operational Rating. A proposed operational rating scheme for domestic properties that quantifies the actual, in-use energy demand, greenhouse gas emissions and energy costs of homes. |
|
EER |
Energy Efficiency Rating. A review of a property’s energy efficiency which is then scored. The energy efficiency charts are divided into rating bands ranging from A+ to G, where A+ is very efficient and G is least efficient. |
|
EPBD |
Energy Performance of Building Directive. The key policy instrument to increase the energy performance of buildings across the European Union. Originally introduced in 2002, it was recast in 2010 and revised in 2018 and 2021. |
|
EPC |
Energy Performance Certificate. A document that provides information about the energy efficiency of a building. Used in many countries including Scotland. |
|
FIT |
Feed-in-tariff. A support mechanism designed to pay small scale renewable energy generators for the electricity that is exported to the grid. |
|
GDPR |
General Data Protection Regulation. A regulation that enhances how people can access information about them and places limitations on what organisations can do with personal data. |
|
HDD |
Heating Degree Day. A measurement designed to quantify the demand for energy needed to heat a building. It is the number of degrees that a day’s average temperature is below a base temperature of 15.5°C. |
|
HTC |
Heat Transfer Coefficient. A common metric for the thermal performance of a building. It describes the rate of heat transfer between two areas. |
|
IEA |
International Energy Agency. An international body that provides policy recommendations, analysis and data on the global energy sector. |
|
IHD |
In-home display. A portable device with a screen showing energy usage and its associated cost. |
|
kWh |
Kilowatt hour. A measure of how much energy is used per hour. |
|
MEPI |
Measured Energy Performance Indicator. A method to determine the energy performance of a building based on measured energy use. |
|
MEP |
Measured Energy Performance. A tool that utilises accurate measurements of the HTC of a property, along with an RdSAP-style survey to produce a more accurate EPC rating for a property. |
|
MPG |
Miles per gallon. Used to describe how many miles a vehicle can travel for every gallon of fuel used. |
|
Operational rating |
Shows the actual energy usage of a building. |
|
Performance Gap |
The difference between predicted and actual performance of a building’s fabric. Also sometimes used to describe the difference between predicted energy usage and actual (metered) energy usage, therefore also including the impact of occupancy factors. |
|
PHPP |
Passive House Planning Package. Modelling software developed by the Passivhaus institute. Used when designing energy efficient buildings to calculate their operational energy use and carbon emissions. |
|
RdSAP |
Reduced Data Standard Assessment Procedure. A simplified version of SAP calculated using a set of assumptions about the dwelling based on conventions and requirements at the time it was constructed. |
|
Regulated energy |
The energy which is consumed by the building and its fixed utilities including space heating, cooling, hot water, ventilation, lighting. |
|
RHI |
Renewable Heat Incentive. A Government financial incentive to promote the use of renewable heat. |
|
SAP |
Standard Assessment Procedure. The method for calculating the energy performance of dwellings in the UK. Scores typically range from 1 to 100+, with higher scores indicating more efficient building stock. SAP is owned by the UK Government. Building Research Establishment (BRE) is responsible for the development of SAP. |
|
SBEM |
Standard Building Energy Model. Government approved methodology that calculates the energy required to heat, cool, ventilate and light a non-dwelling. |
|
SHCS |
Scottish House Condition Survey. A national survey designed to look at the physical condition of Scotland’s homes as well as the experience of householders. |
|
SMETER technologies |
Smart Meter Enabled Thermal Efficiency Ratings technologies that measure the thermal performance of homes using smart meters and other data. |
|
Unregulated energy |
The energy which is consumed by the building in the form of fixtures or appliances like refrigeration, TVs, computers, kettles, microwaves, hobs, and ovens. The usage of these appliances varies based on occupants’ choices and behaviours. |
|
US DoE |
United States Department of Energy. Department of the US federal government that oversees national energy policy and manages domestic energy production and conservation. |
|
ZDEH |
Zero Direct Emissions Heating systems are systems which produce zero direct emissions at the point of use. |
Introduction
This research has been commissioned in response to calls on the Scottish Government to make use of metered energy consumption data within Scottish EPCs. A common criticism of EPCs is that they do not provide useful information to householders about the actual energy consumption and real-life performance of properties. As a result, EPCs can be perceived as unreliable and unhelpful.
Increasing evidence shows that there are significant and consistent gaps between properties’ actual energy consumption and the consumption modelled in EPCs (BEIS, 2021; Few et al., 2023; The Times, 2023). EPCs were not designed to predict actual consumption (see Section 3). This raises the question of whether the methodology or format would benefit from including metered consumption data. The installation of smart meters in an increasing number of Scotland’s homes presents an opportunity to collect this data. In this report, we explore how such data could be incorporated into EPCs to potentially improve their usefulness and reliability.
The question of using energy consumption data is complex – there are many ways it could be included, and each has different implications. This report sets out two key uses for energy consumption data: to inform an asset rating; and to inform an operational rating.
EPC Overview and Research Scope
Energy Performance Certificates (EPCs)
An EPC is a document that provides information about the energy efficiency of a building. Their introduction was driven by the European Union’s Energy Performance of Buildings Directive (EPBD). Article 11 of the EPBD states the original purpose of EPCs was “to make it possible for owners or tenants of the building or building unit to compare and assess its energy performance” (Directive 2010/31/EU, 2010). Article 2 specifies that EPCs are intended to show “the energy demand associated with a typical use of the building” (ibid.). This makes it clear that the original purpose of EPCs was to enable the comparison of building performance under ‘typical’ conditions.
Annex I also states that the energy performance of buildings can be evaluated using either the calculated (producing an asset rating) or actual energy consumption (producing an operational rating) (Directive 2010/31/EU, 2010). Methods based on measured energy consumption must separate out building performance from other factors, primarily occupancy. The variability of these other factors can be controlled when using calculated methods. However, calculated methods are often associated with inaccuracy (Crawley et al., 2019; Hardy and Glew, 2019) and pose the problem that what is built can be different from what was designed or modelled (the performance gap).
In practice, most EPC methodologies use a calculated approach, incorporating real building data from surveys or physical tests (Arcipowska et al., 2014). In Scotland, as in the rest of the UK, EPCs are produced using SAP, RdSAP and SBEM methodologies. SAP (Standard Assessment Procedure) is used to generate EPCs for both new and existing residential buildings. Full SAP is primarily used for new dwellings whereas RdSAP (Reduced Data SAP) is used for existing dwellings. RdSAP uses the same calculation as full SAP but with a simplified data collection process. This enables the calculation to take place where a complete data set for a property is unavailable, and for a lower cost than full SAP.
Existing SAP methodologies used to calculate the domestic asset rating use standard assumptions for occupancy, energy-use, and climate to ensure that the thermal performance can be compared under the same set of conditions. This asset rating is not reflective of how the building is used, for example due to the specific energy requirements of the occupants or the local climate.
SBEM (Standard Building Energy Model) is used to produce EPCs for non-domestic buildings. SBEM utilises a different calculation methodology to SAP. For the generation of an EPC, the SBEM calculation utilises standardised information for several factors to allow comparability between similar building types. Like SAP, SBEM requires a certain amount of standardisation to enable comparability between buildings for benchmarking purposes.
Research scope
This report considers whether metered energy consumption data can and should be used in the production of EPCs in Scotland. This brings with it questions around the suitability of EPCs for their various uses. However, the purpose of this report is not to assess whether EPCs (or SAP / RdSAP) are the most appropriate tool for the functions set out in Section 4. Additionally, this report does not detail the limitations of EPCs or SAP. There is an existing body of research which evidences these limitations, for example Jones Lang LaSalle (2012), Kelly et al. (2012), Jenkins et al. (2017), Hardy et al. (2019), and BEIS (2021).
The scope of this research is to consider whether it is possible to access and include metered energy consumption data on Scottish EPCs, and whether this would be a valuable addition. In some instances, we have suggested that the information provided by metered energy consumption data may be useful but would be better presented elsewhere and not as part of an EPC. The focus of the research is on domestic EPCs as tools for providing information to occupants, rather than EPCs as a policy tool or for benchmarking purposes.
The focus of this report is domestic EPCs. The use of metered energy consumption data for non-domestic EPCs is briefly explored in Section 10.
Functions of EPCs in Scotland
EPCs in Scotland are used for a range of purposes, including (but not limited to):
- Providing information to potential buyers and tenants on a building’s energy use, and estimated energy costs.
- Providing information to property owners on suggested retrofit measures.
- Serving as a policy tool to measure, regulate and set targets for the reduction of carbon emissions from housing.
- Facilitating housing stock analysis by landlords to plan and implement improvements.
- Supporting national housing stock analysis through the Scottish House Condition Survey (SHCS).
- Acting as a proxy indicator to support the identification of households in fuel poverty, for example for the targeting of fuel poverty prevention or alleviation services.
This report does not assess how well EPCs can perform each of these functions. The use of energy consumption data within EPCs will have implications for all of the above uses. Our research considers whether the use of energy consumption data could improve EPCs for the following specific purposes:
- Providing information on a building’s fabric performance.
- Providing an estimate of energy costs.
- Providing information on how buildings are actually used.
- Informing retrofit decisions.
The case for including energy consumption data
The arguments for using energy consumption data depend on the use-case of EPCs that is being considered. As outlined in Section 4, EPCs now serve a number of purposes for which they were not originally designed. This, along with issues such as inconsistencies between assessors, means that they are perceived as unreliable (Crawley et al., 2020; Kelly et al., 2012). A major driver for using energy consumption data is the premise that this will make EPCs more reliable for users, by reducing reliance on assumptions and assessor judgement.
Currently, EPCs can be of limited value to householders who may expect EPCs to provide information reflecting actual energy consumption. Similarly, for policy or housing stock management decisions, EPC asset ratings do not reflect the actual energy consumption of buildings. The need for policy decisions to be based on actual rather than modelled energy efficiency of buildings is also a key argument for the use of metered energy consumption data in EPCs (Baker & Mould, 2018; Lomas et al., 2019).
This report considers two key uses for energy consumption data in EPCs. It can be used to provide a more accurate asset rating or to provide an operational rating. An asset rating is a measure of building fabric performance and does not consider how a building is used. An operational rating based on energy consumption data can help understand how a building is used, which is not currently addressed by EPCs. This has the potential to provide information to householders on actual energy costs associated with a building, as well as supporting wider decarbonisation policy.
Reducing the performance gap
Improving the accuracy of EPCs through the use of energy consumption data is intended to reduce the performance gap. The performance gap refers to the difference between modelled energy performance (e.g. through SAP) and measured energy performance (Fitton et al., 2021). There are a significant number of variables which influence this gap. These include factors related to the building fabric, building use, and the accuracy of the model.
The term ‘performance gap’ usually refers to the discrepancy between designed and as-built fabric performance, particularly for new-builds. However, it is also used to refer to the difference between predicted energy usage and actual (metered) energy usage. When used in this way, the term is also incorporating the impact of occupancy factors.
Recent research found that even when other factors are accounted for (i.e. in households that meet EPC standard assumptions), EPCs overpredict energy use (Few et al., 2023). This suggests that the methodology and its underlying assumptions also contribute to the performance gap.
Improving the accuracy of asset ratings
Energy consumption data can provide a more accurate calculation of a building’s fabric performance. Utilising real-world data to calculate actual space heating demand could improve accuracy and therefore, increase consumer confidence in the reliability of the asset rating. A more accurate asset rating would enable more accurate predictions of annual energy cost. The cost metric would be predicted under standardised conditions, which would maintain the ability to make comparisons between buildings.
A programme of work by the International Energy Agency known as Annex 71 sought to test demand amongst industry stakeholders[1] for a method to calculate HTC. Their survey results indicated a high level of demand for this across several different use-cases including energy certification (Fitton et al., 2021).
Providing an operational rating
Currently EPCs are based on a building fabric model, and do not consider how energy is used by occupants. Asset ratings alone are not sufficient to reduce energy demand. This requires measuring and achieving reductions in actual energy consumption in buildings (Few et al., 2023; Jones Lang LaSalle, 2012; The Times, 2023).
The use of energy consumption data can provide tailored information for consumers regarding the potential energy costs to occupy a specific property, i.e., a measure of the operational performance of the property. Research has shown that the ability to compare energy use with that of similar dwellings is perceived as beneficial to householders (Zuhaib et al., 2021). In order for comparisons between dwellings to be useful, some contextual information is needed to account for occupancy factors which impact energy use (Section 6).
The ways in which this contextual information could be collected and used are discussed in Section 9. However, some stakeholders (Richard Fitton, Professor of Building Performance; Alan Beal, Bacra; Thomas Levefre, Managing Director, Etude) were wary of using energy consumption data in this way, as we will never be able to fully account for or control all the variables that affect how energy is used in the home.
A significant benefit of introducing an operational rating is to provide more accurate cost saving figures to improve the energy efficiency improvement recommendations. Actual consumption data could also enable a better assessment of the impact of retrofit measures and whether they perform as intended.
There is evidence that householders would find it useful to see actual energy costs on an EPC. There are number of ways this information could be contextualised or compared. A study of five European countries (Zuhaib et al., 2022) found that the majority of householders who responded to their survey would like to see the energy costs of the previous occupier included in EPCs, as well as the energy cost of ‘similar’ households[2]. However, the same study notes that energy consumption comparisons were was perceived as more useful when comparing against the previous year than with similar households. Year-on-year comparisons of energy use may be more appropriately provided by energy suppliers rather than on an EPC (see Section 7.2 for detail on dynamic EPCs).
Informing retrofit decisions
Another purpose of EPCs (as described in EBPD) is to provide improvement recommendations for householders. The Scottish Government’s latest consultation on EPCs states that EPCs are intended as a starting point for householders, but not to provide bespoke recommendations for retrofit (Scottish Government, 2023). However, the information currently provided to householders on an EPC could still be improved using energy consumption data, particularly in relation to predicted savings (Baker & Mould, 2018). Energy consumption data could be used to provide accurate predictions of savings from retrofit measures (Cozza et al., 2020).
Aside from informing individual householders, retrofit recommendations on EPCs and their associated predicted savings are also used to support the targeting of investment in retrofit. The scale of investment required for retrofit means that estimates of potential financial savings must be accurate. Laurent et al. (2013) argue that the economics of retrofit should not be evaluated using normative models. This is because all normative models (not just SAP) have been shown to overestimate potential savings and the cost effectiveness of retrofit measures. For these reasons, if the Scottish Government intends to continue to use EPC retrofit recommendations as a policy tool for directing funding, further investigation is needed into how energy consumption data could support this (Baker & Mould, 2018).
The use of energy consumption data in EPCs could better reflect the actual energy performance of building fabric (Section 8). This would provide a more realistic baseline asset rating on which to base recommended retrofit measures. However, the recommendations on an EPC would still be generated automatically by SAP based on general property characteristics. Metered energy consumption data could also play a role in measuring the impact of retrofit, as explained in Section 8.
Energy consumption data provides information on how a building is used. It can therefore be used to support the development of bespoke retrofit recommendations. However, such EPCs are not the tool for developing bespoke retrofit plans (Scottish Government, 2023). PAS 2035 or renovation roadmaps (Small-Warner & Sinclair, 2022) provide a more appropriate framework for this. This view was supported by interviewees (Kevin Gornall and Sam Mancey of DESNZ; Richard Atkins, Chartered Architect) who stated that retrofit plans should be delivered through the industry professionals and not through EPCs. An example of a tool being developed to support this is provided in Box. 1
Box 1: HTC-Up: Informing retrofit using metered energy consumption data
Chameleon Technology were recently awarded funding through the Green Home Finance Accelerator project from DESNZ to develop the HTC-Up project (Chameleon Technology, 2023). Using smart meter data alongside internal and external temperature data, a more accurate HTC figure can be generated which better reflects the actual thermal energy performance of a property. With this data, Chameleon Technology designs a programme for retrofit specific to the home. They direct householders to approved suppliers and installers, and also offer financing solutions if needed.
Validating models and assumptions
The Elmhurst Almanac (Elmhurst Energy, 2022) refers to the need to use the ‘Golden Triangle’ to inform decision-making. This refers to a building’s asset rating (predicted energy cost and consumption based on standard occupancy), occupancy rating (predicted energy consumption based on how the building is used), and actual energy consumption (smart meter data). In the Golden Triangle, smart meter data is used as a validation point for comparison with figures generated as part of the asset and occupancy ratings. This validation can help to identify issues with performance and where to focus improvements.
Metered consumption data could also be used to improve assumptions contained within SAP/RdSAP. For example, Hughes et al. (2016) showed that the difference between modelled and actual energy consumption could be reduced by using assumptions for internal temperature, number of heating hours, and the length of heating season, that are developed based on actual consumption data.
At a larger scale, metered energy consumption data could also be used to calibrate and improve the modelling used for EPCs (Thomson and Jenkins, 2023). Similar exercises have been undertaken to validate the PHPP model (Mitchell and Natarajan, 2020; Passipedia, n.d.). Using real energy consumption data for this purpose was explored as part of the X-tendo project (Zuhaib et al., 2021). The project findings suggest that real energy consumption data from large housing stock datasets can be used to improve models and for benchmarking performance levels. This particular use is not explored further in this report as it is out of scope. Our focus is on EPCs as a tool for providing information to building occupants.
Factors affecting metered energy consumption
Many variables impact on the energy use of a building. These can be broadly split into variables impacting the building fabric, system efficiency (e.g. heating) and those that impact how energy is used within the building. All of these are influenced by wider variables such as fluctuations in energy prices, deprivation levels, social and cultural norms, and changes in climatic conditions.
There is no consensus on the relative importance that can be attributed to either building characteristics or to consumption behaviour in terms of their impact on domestic energy consumption. The variables affecting household energy consumption are understudied (Fuerst et al., 2019) and strong conclusions about how to control or account for them cannot be drawn. Jones et al. (2015) found that 62 household level factors have been studied in the literature as potentially influencing domestic electricity use[3], with varying significance.
In terms of occupancy factors, the review suggests that the number of occupants, the presence of teenagers, and level of household income and disposable income all have a significant impact on electricity consumption. Electrical appliances make a very significant contribution to a household’s electricity consumption (ibid.), however the review noted that only a few previous studies have analysed the effects of the ownership, use and power demand of appliances. The review also indicates that the following building fabric characteristics have a significant effect: dwelling age, number of rooms, number of bedrooms, and total floor area.
Building fabric
When considering the physical building characteristics alone, there is little consensus on the significance of physical building characteristics, other than floor area, that impact energy consumption. Research consistently suggests a significant positive correlation between floor area and consumption (ibid.), mostly associated with demand for space heating.
There is little consensus on the impact of dwelling age. Some studies reviewed by Jones et al. (2015) found newer dwellings have a higher electricity demand, attributed to high consumption appliances such as air conditioning. Other studies observed that newer homes had lower consumption due to efficient appliances and better insulation levels. Several studies also concluded there was no relationship, including a UK study by Hamilton et al. (2013).
Built-form type (such as terraced, detached, semi-detached) has also been investigated and a large number of studies concluded that electrical energy consumption increases with the degree of detachment of a building. However, it is not clear whether this relationship is explained by the building fabric or by occupancy factors. In general, the literature suggests that the influence of built-form type on electricity consumption is related to floor area. However, building occupancy is also a possible reason. For example, Wyatt (2013) attributed lower electricity consumption in bungalows to the fact they are normally occupied by elderly residents with comparatively lower energy consumption than the rest of the population. The review by Jones et al. (2015) suggests that there is a relationship between the level of detachment of dwellings and electricity consumption, but the effect could not be determined as either positive or negative.
Occupancy factors
A regression analysis of household energy consumption in England concluded that gas usage was largely determined by occupancy characteristics such as income and household composition, rather than physical characteristics of the building (Fuerst et al., 2019). This contrasts with the findings from other regression model studies across several countries which report that building characteristics have a greater effect on domestic energy consumption than occupancy characteristics (such as Santin et al., 2009, Estiri, 2014, Huebner et al., 2015).
Fuel poverty is another factor which impacts energy consumption. Levels of fuel poverty in Scotland are geographically uneven across the country, and are higher in rural areas (Changeworks, 2023). Fuel poverty is associated with coping mechanisms such as only heating one room – behaviours which would have a significant impact on energy use. It is well-recognised that households in homes with poor energy efficiency tend to ration energy, known as the ‘prebound effect’ (Sunikka-Blank and Glavin, 2012).
Any use of energy consumption data will need to be attuned to, for example, the difference between energy rationing and energy saving behaviours, and avoid approaches that inadvertently ‘reward’ underheating through favourable EPC ratings. For example, it would be problematic if a household with higher-than-standard heating regimes, such as for health reasons, received a more negative EPC rating. This highlights the importance of collecting internal temperature data (to measure heating outcomes), alongside consumption data (Section 8.1.1).
Regulated and unregulated energy use
The question of how and whether to include consumption data on EPCs largely relates to the purpose of doing so. Not all energy use is relevant to all audiences. The SAP calculations used for EPCs only consider regulated energy use, which includes energy used for heating and cooling, domestic hot water, mechanical ventilation, and fixed lighting. The total energy consumption of a property includes other uses (unregulated energy), such as appliances. This is primarily dependent on the occupants. Although unregulated energy generally accounts for a minority of the total energy consumption in most properties, it is also more likely to fluctuate more often. Factors that can impact this could be an occupant starting to work from home, an occupant moving out, or purchasing a new electrical appliance (Jones et al., 2015).
A householder may be interested in understanding the efficiency of their appliances, but this is less relevant to a building technician working to improve the building fabric or heating system. However, industry experts have suggested that SAP 11 should consider both regulated and unregulated energy use (BEIS, 2021). In part, this is to enable EPCs to better support Net Zero, which requires a reduction in all energy use – not just regulated energy. Another reason is that unregulated energy use is becoming a larger proportion of total energy use as buildings become more energy efficient and use less energy for heating.
Disaggregating energy use
Metered energy consumption data will account for both regulated and unregulated energy, and unless submetering is used it will be difficult to disaggregate these without relying on assumptions. This disaggregation issue was highlighted in the European X-tendo project (Hummel et al., 2022), where four countries tested a methodology for including energy consumption data on EPCs. Three of the countries encountered challenges around determining the energy consumption used for different purposes in the buildings. Metered data for the different energy uses was not available, so the consumption data for space heating and hot water were estimated based on energy bills. This was perceived as complex, time consuming, and inexact (ibid.).
In properties with natural gas heating, disaggregation is not a significant issue, as most of the metered gas consumption can be assumed to be used for heating. However, it poses a challenge in the increasing number of properties with electric heating. There is a risk that relying on assumptions of typical use will replicate the issues that the inclusion of metered data is trying to solve. In Sweden, the disaggregation of energy uses is carried out by the energy assessor based on their competence and judgement. Considering the existing inconsistencies identified among assessors in the generation of UK EPCs (Jenkins et al., 2017), it is likely this approach would introduce further inaccuracies in EPC output.
Box 2: An example scenario of the need to disaggregate energy use
A property with electric heating has recently had internal wall insulation installed. The household is interested in using an energy consumption metric to understand whether the wall insulation has resulted in the expected decrease in energy consumption. However, the same month they also bought an electric vehicle which they charge at home. Without disaggregating their electricity usage, they are unable to tell if their wall insulation is performing as predicted.
The use of sub-metering could help to alleviate these challenges. Chartered Architect Richard Atkins suggested that, in the future, smart meters will be fed into from a series of data points within the home (e.g., heating system, renewable generation assets, storage assets). However, Alan Beal of Bacra indicated that this granularity of metering is unlikely to be available for at least 10 years, and as noted in Section 8.1, regular smart meters are far from fully rolled out in Scotland.
Properties with energy generation
Further consideration is needed for properties with energy generating assets, which adds a layer of complexity to the question of how different aspects of household energy data can be displayed for different audiences.
MCS standards already require a generation meter, and smart meters record the amount of energy exported to the grid, so this data should already be available (Jon Stinson of Building Research Solutions), but it will need to be represented in a way that is legible to the relevant audiences. For example, David Allinson (Building Energy Research Group, University of Loughborough) suggested that consumers would want to see historic levels of energy generation displayed on an EPC.
Overall, the challenge is to design a methodology and an output that works for all properties in Scotland, from properties with no metered heating system and no smart meters, to those with complex systems that include various types of energy generation.
Considerations for using metered energy consumption data
Practicalities of data collection
The potential for using metered data to understand buildings’ energy performance is largely linked to smart meters, which provide accurate and frequent meter readings. The number of smart meters continues to increase. As of March 2023, 57% of all gas and electricity meters in the UK were smart (National Audit Office, 2023). However, in most of Scotland, the rates of domestic smart electricity meters were lower (43%), with rates below 10% in Na h-Eileanan Siar, the Orkney Islands, and the Shetland Islands (DESNZ, 2023). This has implications for the approaches reviewed in this report.
Accessing smart meter data
Aside from the rollout, the main challenge associated with accessing smart meter data relates to where the data is stored and how it can be shared. This also relates to General Data Protection Regulation (GDPR) (Section 7.3). Energy consumption data is considered personal data under current GDPR and requires the consumer’s consent to access it. Consumption data (and export profiles in homes with generation technologies) are stored on individual meters.
There are currently two ways that third parties can access smart meter data (Energy Systems Catapult, 2023), though both require explicit consent from the consumer:
- Organisations (such as energy suppliers) can be integrated into the smart metering system. These organisations must lay out their approach to obtaining householder consent during the onboarding process. Work is underway within the DCC to make the on-boarding process easier and more streamlined.
- Through a Consumer Access Device (CAD). This is a read-only monitor fitted to the home area network. These can only be fitted by registered users of the DCC’s systems.
DESNZ are currently exploring options for creating a central repository for smart meter data through their Smart Meter Energy Data Repository Programme. The aim of this is to explore the feasibility of creating a central repository which would support the innovation of services and products for the benefit of consumers and the wider network. This could include all types of smart meter data, either aggregated or at householder level. The primary focus of projects funded through this programme is to enable access to aggregated data sets.
Public sector bodies, or any organisation carrying out a specific task in the public interest, can access household metered energy data without the need for individual consent. This is through the legal basis of ‘public task’. However, currently this route is only used to access aggregated consumption data. There are no current examples of data being used to provide insights at the individual level. For example, metered gas consumption data is collected by DESNZ from individual households (through Xoserve[4]) for the purpose of compiling subnational consumption statistics. In this instance, individual consent is not required from the householder, and data is presented in aggregate. Legal routes for accessing individual household consumption data under the basis of public task were not explored as part of this research. Further investigation is needed to understand the GDPR considerations.
Aggregated data sets could be used as a validation point to support the improvement of the existing SAP methodology (Section 5.5), though would have little benefit for the two approaches outlined in later sections of this report (improving the asset rating or calculating operational rating for individual EPCs). Our discussions with stakeholders indicate that the current focus of work is to enable access to aggregated smart meter data.
Matt James of the DCC explained that organisations seeking to access smart meter data via DCC must undertake a series of technical, security and administrative steps to on-board and integrate with the smart meter system.
Several policy initiatives, such as ‘Data for Good’ (Energy Systems Catapult, 2023) are making the case for improved, appropriate access to smart meter data for public benefit. An alternative access route to aggregated data is through the electrical Distribution Network Operators (DNOs). DNOs currently have access to anonymised half-hourly smart meter data, for the purpose of delivering an efficient network. By February 2024 DNOs will be obligated to report smart meter data as aggregated and anonymised open access data (interview with Matt James of the DCC). Phase 2 of the Smart Meter Energy Data: Public Interest Advisory Group Project is exploring how smart meter data collected by DNOs could be of value in delivering wider public policy objectives (Sustainability First & Centre for Sustainable Energy, 2021).
Properties without smart meters
For homes without smart meters there are sources of data for analogue (non-smart) meters. ElectraLink is responsible for operating the UK’s central energy data transfer function. They have access to metered electricity data, including from analogue meters, every time the meter is settled[5]. ElectraLink estimates that 95% of UK households with analogue meters have at least annual electricity meter data available (interview with ElectraLink) which may be a useful source of energy consumption data for EPCs. Similar daa is collected for gas meters by Xoserve. However, infrequent meter readings from occupants can result in assumed energy use based on the suppliers’ algorithms. This would not be an accurate measure of energy consumption.
Different strategies would be needed to collect non-smart metered data for the different approaches explored in Sections 9 and 10. The SmartHTC approach (see Section 9) developed by Build Test Solutions overcomes this by being able to also work with just an opening and closing meter reading over a set period. In such cases the meter readings could be read by an energy assessor or surveyor, or could be supplied manually by the householder. The latter could introduce a risk of incorrect readings, deliberately or not (Zuhaib et al., 2021).
Alternatively, an assessor could take the manual meter readings, though this would add additional cost. As a workaround for homes undertaking retrofit monitoring without smart meters, JG Architects fit additional monitors to capture live energy data over a set time period. The representative from JG Architects suggested it is more valuable to capture time series energy use data than static meter readings. Time series data provides more detail about how the property is performing.
The risk from incorrect readings depends on how the data is used; it is more serious if the data is used as the input data on an EPC with policy implications, but less concerning if the data only serves the purpose of providing an additional metric for householders to better understand their energy usage. Given the large number of properties in Scotland without smart meters, this should be given significant consideration.
Properties heated with unregulated (unmetered) fuels
The stakeholders agreed that properties heated with unregulated fuels (such as oil, coal, wood, and biofuels) pose the most difficult challenge. As noted by Richard Fitton, Professor of Building Performance, these properties are out of scope of the smart meter rollout and at risk of being excluded from new approaches to EPCs that use metered data. Lomas et al. (2019) state that their proposed Domestic Operation Rating method (Section 9) will not work for homes using these types of fuels.
Different solutions could be implemented depending on the specific approach but would be associated with significant uncertainty and be difficult to implement. Build Test Solutions suggested an overnight test that uses direct electric heaters[6]. This requires a property to be vacant for the 15-hour test period. It is also possible to add meters into LPG and oil supply feeds, which could be installed temporarily and then removed and reused. These are not generally fitted as standard. This does not overcome the issue of metering solid fuels.
Jon Stinson discussed that Building Research Solutions (BRS) has navigated this challenge by backtracking energy consumption from invoices, though noted that this is a time-consuming process. He also suggested a requirement for those using solid fuel to install some sort of heat meter (as with RHI, FIT and generation meters). This would still rely on some form of modelling and would also need an interface or programme through which people can submit their meter readings.
Alternatively, Richard Atkins, Chartered Architect, suggests instigating a requirement on coal and oil suppliers to keep a record and to provide this– though there would be no certainty of how the fuel is used in the property. Sam Mancey from DESNZ noted that for this data to be useful you would also need to know the length of time between refills to understand how long it takes to use a specific quantity.
Given the move toward ZDEH (Zero Direct Emissions Heating) systems, consideration should be given to whether it is proportionate to develop a system for assessing the metered energy consumption of properties using alternative fuels. An estimation based on an annual measure of fuel use may be more appropriate and proportionate (Lomas et al., 2019), although less accurate.
Dynamic EPCs
Most stakeholders supported proposals for dynamic EPCs. These will provide improved opportunities to utilise energy consumption data. Dynamic EPCs are live reports, and this will allow for some data inputs to be updated on a more regular basis than the required EPC timeline (currently 10 years but proposed to be 5 years). This could result in the inclusion of energy pricing or carbon emission factors.
Dynamic EPCs could also allow users to input their own contextual data (see 9.3) to tailor the reported consumption data to their own usage patterns. Stakeholders proposed a public EPC which contains building performance information, and a separate private element which allows users to input their occupancy data. A representative from Build Test Solutions suggested that if EPCs enabled householders to input their specific occupancy hours and set points, this would achieve an EPC much more closely aligned with actual consumption. This could overcome the challenges around collecting data on occupancy. Users can input this data if they would find the output useful, but otherwise a standard EPC for the building exists without the need for any occupancy data.
GDPR
Energy consumption data is considered as personal data under GDPR. GDPR is not a barrier to collecting and using energy consumption data for the purpose of EPCs, as exemplified by its use in Sweden and Germany. However, any process for collecting and processing energy consumption data will need to be GDPR compliant. Below are some of the key GDPR considerations for the use of metered energy consumption data at the individual household level.
Data ownership
Energy consumption data is owned by the person who consumed the energy (usually the energy bill payer). The stakeholders we consulted believed that householder consent would be required to access and use this data, and this was confirmed by the DCC. There was disagreement between the stakeholders we interviewed about the degree to which this poses a challenge for the use of energy consumption data.
The impact of GDPR on energy consumption data depends on how it is used and stored. For example, Build Test Solutions explained that they do not identify the individual or specific address associated with the energy consumption data they collect in order to calculate the heat transfer coefficient (Section 8), and they only hold location data at a partial postcode level. Kevin Gornall from DESNZ also noted that as part of the SMETER project (Section 8.1), there was a central database of metrics based on the metered data, but the metered data itself was not stored.
Data management
The stakeholders we interviewed agreed that the processing and management of personal energy data and consent poses a significant challenge. This is particularly true if live data is collected at scale, as mentioned in Section 7.2. The actors currently involved in energy consumption data management include energy utilities, DNOs, ‘Other Users’ (other registered users of the smart meter system), and the DCC.
Andrew Parkin at Elmhurst Energy highlighted the challenge of accessing energy consumption data which is decentralised and held by the energy utilities. Several stakeholders suggested that energy consumption data could be stored in a central repository. Householders could then have the option to consent to their energy data being used for different purposes. As indicated previously, work is being undertaken by DESNZ to explore the feasibility of this (Section 7.1.1).
Jon Stinson at Building Research Solutions pointed to the US Department of Energy (US DoE) as an example of how this could be done. He explained that the US DoE collates all energy data from utilities. Initially, this was done to enable academics to access these large data sets for research purposes. In this way, energy data is centralised, and there are fewer issues should the consumer change supplier or meters regularly.
Impact of tenancy type
There are also potential challenges associated with different tenancy types. Crawley et al. (2020) note that EPCs are often commissioned by a landlord, not the owner of the consumption data. In such cases the building owner would require the tenant to provide consent to access these data, adding a layer of complexity to the process.
Energy consumption data to improve the asset rating accuracy
Metered consumption data could be used to calculate a heat transfer coefficient (HTC), which is part of the calculation for EPC ratings. HTC is a common metric for the thermal performance of buildings. For the purposes of producing EPCs, HTC is predicted using SAP/RdSAP for domestic properties and SBEM for non-domestic properties. This is based on assumptions about the heat loss of various aspects of the building (walls, floor, roof, windows etc.) It is used as part of the calculations to estimate annual heating bills, CO2 produced by the building, and the A-G asset rating (Fitton, 2020).
HTC can also be measured in-situ through a co-heating test. This is an intrusive and expensive test which measures the rate of heat loss over a certain period (usually one to three weeks) (Hollick, 2020) and must take place whilst the building is unoccupied.
Research is currently ongoing to investigate how metered energy consumption data could be used to calculate the HTC more accurately than the current predictions in RdSAP, and a more cost-effective way than the co-heating test.
Several stakeholders interviewed[7] discussed the potential for energy consumption data to be used to calculate the HTC of individual properties. All were of the view that calculating an HTC using energy consumption data is more accurate than the HTC values predicted by RdSAP. However, some stakeholders did question the usefulness of this to householders. For example, the representative from the Climate Change Committee (CCC) suggested that this would be useful for improving building standards, but the information is unlikely to be something that householders want or need.
Current research
Several approaches are currently being developed and tested. The Smart Meter Enabled Thermal Efficiency Ratings (SMETER) Innovation Programme has undertaken field trials to test nine SMETER technologies. The trials took place in a non-representative sample of 30 homes (BEIS 2022). The accuracy of each SMETER technology was evaluated by comparison with the measured HTC[8].
Build Test Solutions has developed the SmartHTC method, which is commercially available and has been applied to over 10,000 buildings at time of writing. . SmartHTC is a technology agnostic algorithm. It can either be delivered as an assessment service led by an assessor, or embedded into smart devices such as a smart meter IHD or a smart thermostat. The algorithm was used by the two best-performing HTC technologies in the SMETER research (BEIS, 2022). The IEA’s Annex 71 is also investigating methods for measuring HTC, including through smart meter data (Fitton et al., 2021).
Common to all these approaches is the need for three key pieces of information; metered consumption data (provided by smart meters for gas and electricity), internal temperature data and external temperature data.
Internal temperature data
Internal temperature is critical to collect. Senave et al. (2019) demonstrate that estimated internal temperatures can lead to errors in the HTC of up to 26.9% compared to internal temperature data from one room in the home. Ideally indoor temperatures should be measured in two locations. The literature points to the increasing popularity of “on-board devices” (Fitton, 2020) such as smart heating controls as a valuable source of internal temperature data. However, this is not currently a viable option in the context of producing EPCs. The majority of homes do not have this technology, and it is unclear how this data could be collected centrally.
Newer models of smart meter in-home displays (IHD) also have the capacity to record temperature data. For example, Chameleon’s IHD7 IHD which is already being deployed in the smart meter rollout. The UK Government is currently funding projects to explore whether smart meter infrastructure can be used for more than just energy data (DESNZ, 2023b). As part of this, Matt James explained that the DCC is involved in an ongoing pilot to investigate whether temperature and humidity data can be transmitted through the system, alongside meter readings.
Research has also explored whether it is possible to use smart meter data to estimate thermal performance without the need for temperature data. Chambers and Oreszczyn (2019) only used smart meter data and used the building’s location to make assumptions about local temperatures[9]. Three of the SMETER trials also did not use internal sensors and demonstrated that it is possible to generate an HTC figure without collecting internal temperature data. However, these SMETER technologies were found to generate less accurate HTCs than those which also measured internal temperatures.
An interim solution, suggested by Baker and Mould (2018), is that until in-home sensing equipment is mainstream, homeowners and landlords could be incentivised to record this data voluntarily for inclusion in domestic EPCs. For their SmartHTC method, if internal temperature data cannot be collected via existing devices such as smart thermostats, Build Test Solutions send several low-cost temperature sensors to householders to collect temperature data over a period of 3 weeks.
External temperature data
External temperature is a key factor influencing the amount of energy used in a building. Whilst some smart heating controls do have external temperature sensors (for weather compensation), most studies and trials to date have relied on data from nearby weather stations and online tools. Stakeholders we spoke to commented that, generally, external weather data is readily available, detailed, and reliable (Richard Fitton, Professor of Building Performance and Build Test Solutions).
Potential applications
As an input to EPC calculations
The HTC is not weighted or normalised in any way. It does not account for the size, shape or age of a building. In general, the HTC is higher for larger homes (Fitton, 2020), and therefore does not allow buildings to be compared. For this reason, the majority of stakeholders interviewed for this research felt that the HTC figure should not be presented on EPC certificates and instead should be used in the calculation of EPC metrics.
As a standalone figure on EPCs
In contrast to the above, the IEA Annex 71 report recommends that the raw HTC figure is reported on EPCs. The report authors compare the HTC to the miles per gallon (MPG) metric used for vehicles. The MPG metric is widely understood by consumers and is not normalised for size (the cylinder capacity of the engine). Similarly, they propose the HTC value could become a recognised and well-understood metric. This would require householders to be provided with a bespoke annual heating degree day (HDD) figure, in the same way that motorists are usually aware of their annual mileage.
We did not find that this view was widely reflected amongst stakeholders that we interviewed, though David Allinson also used MPG as an analogy. He noted that when looking a purchasing a vehicle, we would not expect to know or predict exactly how much a particular vehicle would cost to run and that MPG is a useful metric to understand the relative fuel efficiency of a vehicle. He suggests that in the same way we should not look at an EPC and expect to know exactly how much a property will cost to run, though we could be using HTC figures in a more useful way. Richard Fitton suggested that if the HTC value is included on EPCs it should be normalised by floor space (m2) to become the ‘heat loss parameter’ or better still by volume (m3) to account for high ceilings.
The performance gap
The HTC can be used to identify where new buildings or retrofitted buildings are not performing in line with modelled predictions (Fitton, 2020). As outlined in Section 5, this is not uncommon.
In relation to new builds, Kevin Gornall from DESNZ suggested that one of the most promising applications for in-use HTC is to identify issues with building fabric. He suggested that if the modelled HTC derived through SAP is vastly different to the measured in-use HTC figure, then it may point to construction problems which needs to be addressed. This can prompt further investigation help to identify issues that would usually go unnoticed.
HTC readings can also be an effective tool for monitoring the impacts of retrofit. For example, Elmhurst suggests that their Measured Energy Performance (MEP) tool[10] is most effective as a tool for evaluating the impacts of retrofit projects. Calculating the HTC pre- and post-installation can provide a more accurate assessment of the impacts that retrofit measures have had on the thermal performance of the property. MEP can also be used as a part of meeting the PAS 2035 requirements for monitoring and evaluation (Elmhurst, 2021).
Challenges to this approach
As outlined in Section 7 there are a number of challenges around relying on smart meter data.Technologies to measure and transmit internal temperature data are also not widely available in most homes. Both interviewees from DESNZ, Jon Stinson from BRS and a representative from Build Test Solutions all discussed the use of a co-heating test as an alternative method for homes without smart meters. This is not a practical or cost-effective solution for generating EPCs at scale. Overnight HTC tests or temporary meters are likely to be the most practicalsolutions for homes with unmetered fuels. Additionally, the SmartHTC algorithm can be used with only opening and closing meter readings for non-smart meters.
A representative of Build Test Solutions stated that another challenge is accounting for electrical loads outside the building envelope such as electric cars, outdoor offices or hot tubs. Ideally, these should be metered separately.
Annex 71 (Fitton et al., 2021) highlights that the regulatory energy models in the UK do not allow for the HTC to be directly entered as a measured value. Multiple stakeholders confirmed that this is technically possible to overwrite the HTC value in SAP. Therefore, further investigation is required as to whether there are regulatory or practical barriers to doing this.
Energy consumption data for operational performance
Metered energy consumption data can be used to produce an operational rating which is more closely aligned with actual energy use and gives an indication of how a building is used. This type of metric will include the impact of occupant behaviour. The influence of occupant behaviour makes this approach less suitable for comparison between buildings. However, this can also be an advantage, especially when combined with a good benchmark. Comparison against a benchmark can be used to encourage both building energy performance and user behaviour change (Zuhaib et al., 2021).
The most straightforward use for metered energy consumption data is to include the value on an EPC alongside a reference figure. The reference figure could be historical energy consumption data for that property (Zuhaib et al., 2021). This would not allow for comparison against other buildings unless the data is normalised to account for factors such as size and occupancy.
Current examples
Display Energy Certificates
Display Energy Certificates (DEC) for public non-domestic buildings[11] are an example of an operational rating (section 10). Energy consumption is compared to a benchmark for similar types of buildings (Lomas et al., 2019).
Measured Energy Performance Indicator (MEPI)
The X-tendo project (Verheyen et al., 2019; Zuhaib et al., 2021) developed the Measured Energy Performance Indicator (MEPI) to be compatible with EPCs. It proposes that real energy consumption data is used to generate an ‘energy use indicator’ on EPCs. To enable comparison between buildings, this figure is weather-corrected and normalised for building size and primary energy factors[12]. This method relies on sub-metering to disaggregate consumption for heating and hot water. Sub-metering is not widely used in domestic buildings in Scotland.
This method has undergone testing in four European countries. This revealed that further corrections are needed to be able to make useful comparisons, for example the number of hours the heating system is used. The method contains an optional module to correct for indoor temperature.
EPCs in Sweden
A representative from Boverket explained that EPCs in Sweden are based on real energy consumption data, which is disaggregated by the energy assessor to only consider energy used for heating, cooling, domestic hot water, and fixed lighting, and then corrected to reflect typical use. This results in an operational rating than enables comparisons between buildings. A challenge of this approach is that it requires the energy assessor to make assumptions about a building’s energy use, since disaggregated metered data rarely exists for each of the different energy uses.
Domestic Operational Rating (DOR)
Researchers from Loughborough University and De Montfort University have proposed and tested a DOR scheme for assessing the energy performance of occupied dwellings (Lomas et al., 2019). They propose this scheme as separate and complementary to existing SAP methodology, similar to DECs for non-domestic buildings.
The DOR uses metered energy consumption data alongside the existing survey data for a property collected for an EPC. For example, a key piece of information needed to normalise the energy consumption figure is total usable floor area (Lomas and Allinson, 2019). The proposed DOR scheme provides three operational ratings for energy demand (DORED), GHG emissions (DORGG) and energy costs (DOREC). These are intended to correspond with current metrics on an EPC. The energy cost metric is derived from the energy demand figure. It could be based either on a nationally standardised fuel cost (similar to SAP look-up tables) or on the actual fuel prices paid by each household.
The authors also explore the idea that a DOR certificate could be used to convey additional energy-related behaviour and advice to households. It could also have particular relevance for identifying homes in fuel poverty or residents that are under-heating their homes. Another key benefit of DOR is that it accounts for all energy used (regulated and unregulated).
David Allinson (Building Energy Research Group, University of Loughborough) suggests that moving towards DOR with normalised data to account for anomalies (e.g., a particularly cold winter), would allow people to compare with other people in the neighbourhood or the same property type.
Enabling comparison
Normalisation of data
Experts have proposed different methods which use different degrees of correction or normalisation. In its purest form, annual metered data could be included as-is. With no correction, this would result in a worse score during colder years where the heating requirements are higher. Conversely, recommendations for a new heating system based on a particularly mild winter where the heating demand of the property was lower than usual, or energy savings measured between non-typical years would be misleading.
There is consensus in the reviewed literature that a metric of this type should be normalised at least by floor area (Baker and Mould, 2018; Lomas et al., 2019). In France, EPCs for pre-1948 buildings were previously calculated based on an average of three years of metered data corrected by floor area (Crawley et al., 2020). However, this option was removed as part of recent EPC reforms due to issues related to buildings with irregular occupancy (Rosemont International, 2021; Thomson and Jenkins, 2023).
Weather-correction
The DOR uses weather-correction to enable the comparison of ratings between homes in different locations across the country. The metered daily gas and electricity consumption of homes is corrected based on the number of heating degree-days. An alternative to weather-correcting the energy demand data is to instead correct the benchmark that the energy is compared to (see below).
Corrections for standard user behaviour have also been proposed (Zuhaib et al., 2021). The latter is possible if occupancy profile data is available, but the authors note that this is hard to obtain.
Benchmarks
The DOR proposes that weather-corrected and normalised energy demand is compared against a benchmark of the average energy demand for the UK. Selecting an appropriate benchmark requires careful consideration (Lomas et al., 2019).
Jon Stinson of BRS also recommended inclusion of an average energy use figure across the previous three years, normalised with internal and external temperature data. He suggests that this could be a rolling figure, updated annually, linked to a dynamic EPC.
Non-domestic DECs use a building-specific benchmark corrected to account for the duration of occupancy and weather conditions. However, this approach is less appropriate for domestic buildings, since the proportion of energy that is used for space heating (and therefore should be weather corrected) varies significantly (Lomas et al., 2019).
Contextual occupancy data
If energy consumption data is provided on EPCs then some level of contextual data about the occupants is also required. For example, a potential tenant or buyer would need to know some details of the previous occupant(s) to understand the relevance of their energy usage.
Three stakeholders (from Build Test Solutions; Thomas Lefevre of Etude; Alan Beal of Bacra and Richard Fitton, Professor of Building Performance) were wary of using energy consumption data in isolation as it is difficult to account for all variables and to collect this data from occupants.
Several stakeholders (Kevin Gornall, DESNZ; Barbara Lantschner, JG architects; and a representative of the CCC) suggested that a small number of key questions regarding in-use occupancy information could be sufficient to generate an output which is accurate enough for the purposes of an EPC. Key information identified included:
- Occupancy (number of people in the household)
- Heating regime (hours of heating and preferred temperatures)
- Energy behaviours (information on unregulated energy use, e.g., large appliances)
Kevin Gornall from DESNZ suggested that in future there could be the option for occupants to answer several survey questions surrounding how they use energy in the home at the point of assessment. This information alongside internal temperatures and patterns of energy consumption could replace the occupancy assumptions used within SAP to generate more tailored outputs. His view was that the existing SAP model can generate accurate outputs providing that accurate information is fed in, and the key is to provide an open version of SAP where assumptions can be altered.
A similar exercise has been done with EPCs before, through the Green Deal Occupancy Assessment. This used standard EPC inputs and amended these with data from a series of additional questions. For example, standardised occupancy patterns were amended to reflect the household.
A representative of Build Test Solutions suggested that metered data could be used to achieve a more accurate baseline asset rating (see Section 8), with further occupational data added as a separate metric to achieve an output much more closely aligned with the total energy consumption.
As highlighted in Section 8.1.1, and by Jon Stinson of BRS, internal temperature data could be used to understand heating outcomes to contextualise the energy consumption data.
Alternatively, the DOR is designed so that it does not require any contextual data from occupants. Metered consumption data is normalised and compared to a national benchmark (Lomas et al., 2019). The authors note that not accounting for number of occupants may result in a poorer DOR for homes occupied by more people. They note privacy concerns over collecting this information, and the practicalities of defining occupant numbers, particularly in HMO properties (ibid.).
Presenting the data
An operational rating could be presented on an EPC alongside the asset rating. However, Lomas et al. (2019) suggest that the DOR is provided on a separate certificate. This would be similar to DECs for non-domestic buildings[13]. The move to dynamic EPCs will have implications for how an operational rating can be displayed (Section 7.2).
In contrast, Baker and Mould (2018) suggest that consumption data should replace the existing modelled SAP methodology rather than complement it, with all EPCs being based on an operational rating.
It is possible to use asset ratings and operational ratings to produce two different kinds of EPCs. This is the case in Germany, where EPCs can take the form of either a demand certificate, which provides an asset rating, or a consumption certificate, which provides an operational rating (Lomas et al., 2019). While the resulting energy certificates differ, they are both considered to be EPCs that fulfil the requirements of EPBD. It should be noted that in Germany, the operational rating based EPCs are only available for buildings with more than five flats, since including multiple households approximates normalisation for different occupant behaviours. This would not be possible in Scotland where EPCs are produced for individual dwellings rather than buildings.
Challenges to this approach
One challenge to developing an operational rating is determining whether and how much contextual data to collect from occupants. Additionally, Lomas et al. (2019) state that it is desirable for a DOR to disaggregate energy used for space heating, domestic hot water, and electrical energy use. Sub-metering is not widely used in domestic properties (see Section 6.3.1), so this will be challenging.
Non-domestic EPCs
The most obvious use for metered energy consumption data in non-domestic EPCs in Scotland is to extend the use of DECs. This was suggested as the best way to use metered consumption data for non-domestic buildings by Joshua Wakeling of Elmhurst Energy. The operational rating on a DEC is based on meter readings for 12 months of energy consumption and compared to a benchmark. The operational rating is a numerical indicator and is also illustrated on an A-G scale.
Additionally, Joshua Wakeling (Elmhurst Energy) noted the need for more investment in improving the DEC methodology and to better understand occupancy assessment. The DEC methodology has not been updated for over 10 years (Elmhurst Energy, 2022).
The considerations around different types of energy use, as discussed in Section 7, are also relevant to non-domestic buildings. An analysis by Jones Lang LaSalle (2012) of 200 non-domestic buildings in the UK found little or no correlation between EPC ratings and actual energy performance. This significant performance gap has been attributed to a combination of uncertainty in the modelling, occupant behaviour, and poor operational practices (van Dronkelaar, 2015).
Jon Stinson of BRS has found that accessing metered data is more straightforward for non-domestic buildings than for domestic. Many occupants of non-domestic buildings will already have processes in place to collate energy consumption data, and larger buildings tend to have sub-metering arrangements as well as Building Energy Management Systems (BeMS). However, Joshua Wakeling of Elmhurst Energy noted that in England and Wales the deployment of DECs to private sector buildings has been hampered by a reluctance to share energy data.
Stakeholders discussed the use of metered energy consumption data for the purpose of an operational rating, but not for an asset rating. The comparison of HTC figures is not as important for non-domestic buildings as it is for domestic buildings. This is because building fabric has a comparably lower impact on heat loss than ventilation and air-conditioning systems (Jon Stinson, BRS).
Conclusions and recommendations
This report has explored two ways in which metered energy consumption data can be used in EPCs and the factors that need to be considered to enable this. Metered energy consumption data can provide more accurate information on building fabric performance (asset rating) and give an operational rating of how energy is used in a building.
A more accurate asset rating can be generated by using metered energy consumption data to calculate the HTC (heat transfer coefficient) in properties. Although various methods have been tested in recent years, they are not yet sufficiently developed for widespread roll out in EPCs. This approach requires collecting internal temperature data and is limited in properties without smart meters. Further work is required within the industry to enable the reliable collection of internal temperature data and consumption data across properties with different meters and fuel types.
Accurate HTC figures calculated using energy consumption data will also have value for informing retrofit decisions. This is currently being explored through projects such as Chameleon’s HTC-Up project. The use of energy consumption data in EPCs will provide a more realistic baseline asset rating on which to base recommended retrofit measures. However, the recommendations on an EPC would still be generated automatically by SAP.
Metered energy consumption data can be used to produce an operational rating to give an indication of how a building is used. A wide range of different approaches have been explored in the literature. The most straightforward use for metered energy consumption data is to include the value on an EPC alongside a reference figure. Another option is a DOR showing the energy consumption of a property, corrected by weather and floor area. This rating could be included as a part of the EPC or exist as separate document.
Using energy consumption to provide an operational rating has the challenge that different energy uses are not yet disaggregated. As a result, it can be difficult to determine what causes increases or decreases in energy consumption. Sub-metering has been suggested as a potential solution, though this technology is not commonplace in Scottish homes at present. The X-tendo project also proposes a method to achieve an operational rating but requires further normalisation of the data to account for different energy uses.
This operational rating could be included as part of existing EPCs or could be presented separately to provide additional information as to how efficiently energy is used in the home. Generation of an operational rating has the potential to be incorporated as part of dynamic, digital EPCs where data can be updated and adjusted without the need for a new EPC to be created. This format could enable occupancy-related data to be separate from the public asset rating.
Energy consumption data could be used in both or either of the two ways outlined above. EPCs should retain an asset metric (whether based on modelled or measured data) that is based on standard occupancy assumptions to allow comparison between properties regardless of who occupies them. This should not be replaced with an energy use metric, which contains occupancy variables that cannot be fully accounted for. Such a metric could be useful in addition to a standardised metric for comparison. It was suggested that metered data could be used to achieve a more accurate baseline asset rating, with further occupational data added as a separate metric to achieve an output much more closely aligned with the total energy consumption.
In both cases, consumer consent will be needed to collect and process metered energy consumption data and further consideration must be given as to how this can be facilitated.
Recommendations
This research has highlighted that further work is needed in this area to explore:
- The practicalities of collecting required data. This will include:
- Metered energy consumption data at the individual building level, rather than from aggregated datasets. This will require a standardised process for collecting consumer consent. Currently, public sector bodies can obtain household-level data without the need for individual consent through the legal basis of public task’. However, this is for aggregated data and there are no current examples of data being used to provide insights at the individual household level. Further investigation is needed into the legal basis of public task for collection of metered data for reporting at the household level. Legal routes for this were not explored as part of this research.
- Processes for data collection, as these are mostly dependent on the rollout of smart meters. An alternative methodology will need to be developed for households using unregulated fuels, as their heating consumption will not be captured in smart meter data.
- Additional information from occupants which can be used to contextualise energy consumption data when used for an operational rating. Examples of this kind of data include the number of occupants or typical heating regime. Further work is required to understand the minimum amount of contextual information to enable metered energy consumption data to be useful.
- Internal temperature data for the purpose of calculating HTC as part of an asset rating. This would require the mass rollout of internal temperature sensors, which are already included in some IHD (in-home display) devices. Internal temperature data could also be useful contextual data for an operational rating.
- Different formats that could be used to display consumption data when used for an operational rating. This should consider whether consumption data would work best as one of multiple ratings within the EPC or separately.
- For energy-generating homes, how total energy consumption, generation, export, and cost can be displayed in a straight-forward manner.
- Whether there are regulatory or practical barriers to inputting the HTC as a measured value in SAP calculations for the asset rating.
- The value of Display Energy Certificates for non-domestic public buildings in England and Wales, and whether there would be value in expanding their use in Scotland.
References
|
Arcipowska, A., Anagnostopoulos, F., Mariottini, F. and Kunkel, S. (2014) Energy Performance Certificates across the EU: A Mapping of National Approaches. Rep. Brussels: Buildings Performance Institute Europe. Available at: https://www.bpie.eu/publication/energy-performance-certificates-across-the-eu/ (Accessed: 25 August 2023). |
|
Baker, K. J. and Mould, R. (2018) Energy Performance Certificates: An Alternative Approach. Available at: https://commonweal.scot/policies/energy-performance-certificates-an-alternative-approach/ (Accessed: 25 August 2023). |
|
Baker, K.J. and Rylatt, R. M. (2008) ‘Improving the prediction of UK domestic energy-demand using annual consumption-data’, Applied Energy, 85(6), pp. 475–482. Available at: https://doi.org/10.1016/j.apenergy.2007.09.004 |
|
Bordass, B. (2020) ‘Metrics for energy performance in operation: the fallacy of single indicators’, Buildings and Cities, 1(1), pp. 260–276. Available at: https://journal-buildingscities.org/articles/10.5334/bc.35 |
|
Chambers, J. D. (2017) ‘Developing a rapid, scalable method of thermal characterisation for UK dwellings using smart meter data’. UCL Energy Institute. Available at: https://discovery.ucl.ac.uk/id/eprint/10030678/ (Accessed: 31 August 2023). |
|
Chambers, J. D. and Oreszczyn, T. (2019) ‘Deconstruct: A scalable method of as-built heat power loss coefficient inference for UK dwellings using smart meter data’, Energy and Buildings, 183, pp. 443-453. Available at: https://doi.org/10.1016/j.enbuild.2018.11.016 |
|
Chameleon Technology (2023) Chameleon Technology awarded six-figure funding for green finance project HTC-Up. Available at: https://chameleontechnology.co.uk/2023/06/12/chameleon-technology-awarded-six-figure-funding-for-green-finance-project-htc-up/ (Accessed: 30th August 2023) |
|
Changeworks (2023) A Perfect Storm: Fuel Poverty in Rural Scotland. Available at: https://www.changeworks.org.uk/wp-content/uploads/2023/05/A-Perfect-Storm-Fuel-Poverty-in-Rural-Scotland.pdf (Accessed: 7 September 2023). |
|
Cozza, S., Chambers, J., Deb, C., Scartezzini, J.L., Schlüter, A. and Patel, M.K. (2020) ‘Do energy performance certificates allow reliable predictions of actual energy consumption and savings? Learning from the Swiss national database’, Energy and Buildings, 224. Available at: https://doi.org/10.1016/j.enbuild.2020.110235 |
|
Crawley, J., Biddulph, P., Northrop, P.J., Wingfield, J., Oreszczyn, T. and Elwell, C. (2019) ‘Quantifying the measurement error on England and Wales EPC ratings’, Energies, 12(18), pp.3523. |
|
Crawley, J., McKenna, E., Gori, V. and Oreszczyn, T. (2020) ‘Creating domestic building thermal performance ratings using smart meter data’, Buildings & Cities, 1(1), pp.1-13. |
|
Deb, C.,Gelder, L. V., Spiekman, M., Pandraud, G., Jack R., and Fitton, R. (2021) ‘Measuring the heat transfer coefficient (HTC) in buildings: A stakeholder’s survey’, Renewable and Sustainable Energy Reviews, 144, Available at: https://doi.org/10.1016/j.rser.2021.111008 |
|
Department for Business, Energy & Industrial Strategy (2021) Making SAP and RdSAP 11 fit for Net Zero. Available at: https://www.levittbernstein.co.uk/site/assets/files/3670/making_sap_and_rdsap_11_fit_for_net_zero-full_report.pdf (Accessed: 7 September 2023). |
|
Department for Business, Energy & Industrial Strategy (2022) Technical Evaluation of SMETER Technologies (TEST) Project. Available at: https://assets.publishing.service.gov.uk/government/uploads/system/uploads/attachment_data/file/1050881/smeter-innovation-competition-report.pdf (Accessed: 7 September 2023). |
|
Department for Energy Security & Net Zero (2023a) Guidance: Use of electricity meter and gas meter personal data collected through the Energy Price Guarantee scheme in Great Britain and Northern Ireland: privacy notice Available: https://www.gov.uk/government/publications/energy-price-guarantee-scheme-privacy-notice/use-of-electricity-meter-and-gas-meter-personal-data-collected-through-the-energy-price-guarantee-scheme-privacy-notice (Accessed: 24 Aug 2023). |
|
Department for Energy Security & Net Zero (2023b) Smart meter based internet of things applications: Phase 1 projects, UK Government. Available at: https://www.gov.uk/government/publications/smart-meter-system-based-internet-of-things-applications-programme-successful-projects/smart-meter-based-internet-of-things-applications-phase-1-projects (Accessed: 7 September 2023). |
|
Directive 2010/31/EU of the European Parliament and of the Council of 19 May 2010 on the energy performance of buildings (recast) (2010) Official Journal L153, p. 13. (Accessed 7 September 2023). Available from: https://eur-lex.europa.eu/legal-content/EN/TXT/?uri=CELEX:32010L0031 |
|
Elmhurst Energy (2021) Measured Energy Performance – Behind the Scenes. Available at: https://www.elmhurstenergyconsultancy.co.uk/2022/11/17/measured-energy-performance-behind-the-scenes/ (Accessed: 7 September 2023). |
|
Elmhurst Energy (2022) The Elmhurst Almanac. Available at: https://www.elmhurstenergy.co.uk/app/uploads/2022/05/Elmhurst_Almanac_2022.pdf (Accessed: 7 September 2023). |
|
Elmhurst Energy (2023) EPCs are misunderstood, not misleading. Available at: https://www.elmhurstenergy.co.uk/blog/2023/02/27/epcs-are-misunderstood-not-misleading/ (Accessed: 7 September 2023). Energy Systems Catapult (2023) Data for Good. Smart Meter Data Access. Available at: https://es.catapult.org.uk/news/data-for-good-smart-meter-data-access/ |
|
Estiri, H. (2014) ‘Building and household X-factors and energy consumption at the residential sector: a structural equation analysis of the effects of household and building characteristics on the annual energy consumption of US residential buildings’, Energy Econ, 43, pp. 179-184. |
|
Few, J., Manouseli, D., McKenna, E., Pullinger, M., Zapata-Webborn, E., Elam, S., Shipworth, D. and Oreszczyn, T. (2023) ‘The over-prediction of energy use by EPCs in Great Britain: A comparison of EPC-modelled and metered primary energy use intensity’, Energy & Buildings, 288. Available at: https://doi.org/10.1016/j.enbuild.2023.113024 |
|
Fitton, R. (2020) ‘Energy pathology: Measuring a dwelling’s energy performance using smart meter and IoT data’, Journal of Building Survey, Appraisal & Valuation, 9(2), pp. 181-190, Available at: https://www.ingentaconnect.com/content/hsp/jbsav/2020/00000009/00000002/art00010 (Accessed: 7 September 2023). |
|
Fitton, R., Bouchie, R., Spiekman, M., Jack, R., Spindler, U., Gorzalka, P., Jimenez, M., Erkoreka, A., Marshall, A., Gorse, C., Chirag, D., Alan, D., Farmer, D., Masy, G., Virginia, G., Pandraud, G., Deltour, J., Gelder, L., Roles, S., Metzger, S. and Hughes, T. (2021) ‘Building energy performance assessment based on in-situ measurements Challenges and general framework’ Energy in Building and Communities Programme, IEA EBC Annex 71. Available at: https://salford-repository.worktribe.com/output/1336362/building-energy-performance-assessment-based-on-in-situ-measurements-challenges-and-general-framework (Accessed: 7 September 2023). |
|
Fuerst, F., Kavarnou, D., Singh, R., Adan, H. (2019) ‘Determinants of energy consumption and exposure to energy price risk: a UK study’, Zeitschrift für Immobilienökonomie, 6, pp. 65-80. Available at: https://link.springer.com/article/10.1365/s41056-019-00027-y |
|
Hamilton, I.G., Steadman, P.J., Bruhns, H. Summerfield, A.J., Lowe, R. (2013) ‘Energy efficiency in the British housing stock: Energy demand and the Homes Energy Efficiency Database’, Energy Policy, 60, pp. 462-480, Available at: https://doi.org/10.1016/j.enpol.2013.04.004 |
|
Hardy, A. and Glew, D. (2019) ‘An analysis of errors in the Energy Performance certificate database |
|
Hellwig, R.T. (2019) ‘On the relation of thermal comfort practice and the energy performance gap’, IOP Conference Series: Earth and Environmental Science, 352. Available at: https://iopscience.iop.org/article/10.1088/1755-1315/352/1/012049 |
|
Hollick, F.P., Gori, V., and Elwell, C.A. (2020) ‘Thermal performance of occupied homes: A dynamic grey-box method accounting for solar gains’, Energy & Buildings, 208. Available at: https://doi.org/10.1016/j.enbuild.2019.109669 |
|
Huebner G.M., Hamilton, I., Chalabi, Z., Shipworth, D., and Oreszczyn, T. (2015) ‘Explaining domestic energy consumption—The comparative contribution of building factors, socio-demographics, behaviours and attitudes’, Applied Energy, 159, pp. 589–600. Available at: https://doi.org/10.1016/j.apenergy.2015.09.028 |
|
Hughes, M., Pope, P., Palmer, J., and Armitage, P. (2016) ‘UK Housing Stock Models Using SAP: The Case for Heating Regime Change’, Science Journal of Energy Engineering, 4(2), pp. 12–22. Available at: 10.11648/j.sjee.20160402.11 Hummel, M., Campbell, D., Weatherall, D., and Green, G. (2022) Concrete implementation of new energy performance certificates features: Testings and results in nine countries – Real energy consumption. Available at: https://x-tendo.eu/wp-content/uploads/2020/01/X-tendo_deliverable5.2_Feature4_RealEnergyConsumption_Final.pdf (Accessed: 3 October 2023) |
|
Jenkins, D., Simpson, S., and Peacock, A. (2017) ‘Investigating the consistency and quality of EPC ratings and assessments’, Energy, 138 (1), pp. 480-489. Available at: https://doi.org/10.1016/j.energy.2017.07.105 |
|
Jones, R. V., Fuertes, A., and Lomas, K. J. (2015) ‘The socio-economic, dwelling and appliance related factors affecting electricity consumption in domestic buildings’, Renewable and Sustainable Energy Reviews, 43, pp. 901-917. Available at: https://doi.org/10.1016/j.rser.2014.11.084 |
|
Kelly, S., Crawford-Brown, D., and Pollitt, M. G. (2012) ‘Building performance evaluation and certification in the UK: Is SAP fit for purpose?’, Renewable and Sustainable Energy Reviews, 16, pp. 6861–6878. Available at: https://doi.org/10.1016/j.rser.2012.07.018 |
|
LaSalle, J.L. (2012) A Tale of Two Buildings. Available at: https://www.betterbuildingspartnership.co.uk/tale-two-buildings (Accessed: 31 August 2023). |
|
Laurent, M.H., Allibe, B., Oreszczyn, T., Hamilton, I., Galvin, R. and Tigchelaar (2013) ‘Back to reality: How domestic energy efficiency policies in four European countries can be improved by using empirical data instead of normative calculation’, European Council for an Energy Efficient Economy (ECEEE). Available at: https://www.eceee.org/library/conference_proceedings/eceee_Summer_Studies/2013/7-monitoring-and-evaluation/back-to-reality-how-domestic-energy-efficiency-policies-in-four-european-countries-can-be-improved-by-using-empirical-data-instead-of-normative-calculation/ (Accessed: 7 September 2023). |
|
Lomas, K. J. and Allinson, D. (2019) ‘Domestic Energy Demand in the UK: Trends, Regulation and Energy Rating’, Loughborough University. Available at: https://repository.lboro.ac.uk/articles/dataset/Domestic_Energy_Demand_in_the_UK_Trends_Regulation_and_Energy_Rating_Supplementary_information_to_A_Domestic_Operational_Rating_for_UK_homes_Concept_Formulation_and_Application_Energy_and_Buildings_Lomas_KJ_et_al_2019_/7836317/1 (Accessed: 7 September 2023). |
|
Lomas, K. J., Beizaee, A., Allinson, D., Haines, V.J., Beckhelling, J., Loveday, D.L., Porritt, S.M., Mallaband, B. and Morton, A. (2019) ‘A domestic operational rating for UK homes: Concept, formulation and application’, Energy and Buildings, 201, pp. 90–117. Available at: https://doi.org/10.1016/j.enbuild.2019.07.021 |
|
Mitchell, R. and Natarajan, S. (2020) ‘UK Passivhaus and the Energy Performance Gap’, Energy and Buildings, 224, pp. 110240. Available at: https://doi.org/10.1016/j.enbuild.2020.110240 |
|
National Audit Office (2023) Update on the rollout of smart meters. Available at: https://www.nao.org.uk/wp-content/uploads/2023/06/update-on-the-rollout-of-smart-meters-summary.pdf (Accessed: 7 September 2023). |
|
Passipedia (2022) Energy efficiency of the Passive House Standard: Expectations confirmed by measurements in practice. Available at: https://passipedia.org/operation/operation_and_experience/measurement_results/energy_use_measurement_results (Accessed: 24 August 2023). |
|
Passivhaus Trust (2020) EPCs as Efficiency Targets Lowering emissions, raising standards. Available at: https://www.passivhaustrust.org.uk/news/detail/?nId=892 (Accessed: 31 August 2023) |
|
Pullinger, M., Berliner, N. Goddard, N. and Shipworth, D. (2022) ‘Domestic heating behaviour and room temperatures: Empirical evidence from Scottish homes’, Energy and Buildings, 254. Available at: https://doi.org/10.1016/j.enbuild.2021.111509 |
|
Rosemont International (2021) The reform of the energy performance diagnosis (DPE). Available at: https://rosemont-int.com/en/article/news/the-reform-of-the-energy-performance-diagnosis-dpe (Accessed 8 September 2023). |
|
Santin, O.G., Itard, L., and Visscher, H. (2009) ‘The effect of occupancy and building characteristics on energy use for space and water heating in Dutch residential stock’, Energy and Buildings, 41(11), pp. 1223-1232. Available at: https://doi.org/10.1016/j.enbuild.2009.07.002 |
|
Scottish Government (2023) Energy Performance Certificate (EPC) Reform Consultation Available at: https://www.gov.scot/publications/energy-performance-certificate-epc-reform-consultation (Accessed 3 October 2023). |
|
Senave, M., Reynders, G., Sodagar, B., Verbeke, S., and Saelens, D. (2019). ‘Mapping the pitfalls in the characterisation of the heat loss coefficient from on-board monitoring data using ARX models’. Energy and Buildings, 197, pp. 214–228. Available at: https://doi.org/10.1016/j.enbuild.2019.05.047 |
|
Small-Warner, K. and Sinclair, S. (2022) Green Building Passports: a review for Scotland. Available at http://dx.doi.org/10.7488/era/2075 (Accessed: 7 September 2023) |
|
Sunikka-Blank, M, and Galvin, R. (2012) ‘Introducing the prebound effect: the gap between performance and actual energy consumption’, Building Research & Information, 40(3), pp. 260-273. Available at: https://www.tandfonline.com/doi/full/10.1080/09613218.2012.690952 |
|
Sustainability First and Centre for Sustainable Energy (2021) Smart Meter Energy Data: Public Interest Advisory Group – Phase 2 final report. Available at: https://www.sustainabilityfirst.org.uk/publications-project-research-reports/381-piag-phase-2-final-report (Accessed: 8 September 2023). |
|
The Times (2023) Why misleading EPC ratings are a national scandal. Available at: https://www.thetimes.co.uk/article/why-misleading-epc-ratings-are-a-national-scandal-ztc5ss2b0 (Accessed: 04 September 2023). |
|
Thomson, L. and Jenkins, D. (2023) ‘The Use of Real Energy Consumption Data in Characterising Residential Energy Demand with an Inventory of UK Datasets’, Energies, 16. Available at: https://doi.org/10.3390/en16166069 |
|
Van Dronkelaar, C., Dowson, M., Burman, E., Spataru, C. and Mumovic, D. (2016) ‘A Review of the Energy Performance Gap and Its Underlying Causes in Non-Domestic Buildings’ Frontiers in Mechanical Engineering, 1(17), Available at: https://doi.org/10.3389/fmech.2015.00017 |
|
Vatougiou, P., McCallum, P., Jenkins, D. (2022) An evidence review of data associated with non-domestic buildings. Available at: http://dx.doi.org/10.7488/era/2557 (Accessed: 7 September 2023) |
|
Verheyen, J., Zuhaib, S. and Broer, R. (2019) Introductory Reports: Real Energy Consumption. Available at: https://x-tendo.eu/wp-content/uploads/2020/01/D3.1-Real-Energy-consumption.pdf (Accessed: 24 August 2023) |
|
Wyatt, P. (2013) ‘A dwelling-level investigation into the physical and socio-economic drivers of domestic energy consumption in England’, Energy Policy, 60, pp. 540-549. Available at: https://doi.org/10.1016/j.enpol.2013.05.037 |
|
Zuhaib, S., Pedraz, G.B., Verheyen, J., Kwiatkowski, J., Hummel, M. and Dorizas, V. (2021) Exploring Innovative Indicators for The Next-Generation Energy Performance Certificates features – Real Energy Consumption. Available at: https://x-tendo.eu/wp-content/uploads/2020/01/D3.1-Real-Energy-consumption.pdf (Accessed: 24 August 2023). |
|
Zuhaib, S., Schmatzberger, S., Volt, J., Toth, Z., Kranzl, L., Maia, I.E.N., Verheyen, J., Borragán, G., Monteiro, C.S., Mateus, N. and Fragoso, R. (2022) ‘Next-generation energy performance certificates: End-user needs and expectations’, Energy Policy, 161. Available at: https://doi.org/10.1016/j.enpol.2021.112723 |
Appendix: Research methodology
Desk research
This report was informed by desk research in the form of a literature review of academic articles and grey literature such as reports, statements, policy literature, and consultations.
An initial literature search was carried out using the search terms listed in table 1. The list expanded throughout the research process as key terms and concepts were identified. Further sources were identified from relevant sources cited in included literature. Literature from the past five years was prioritised, though some older works also informed the research. Through the search, 51 relevant pieces of literature were identified.
|
List of search terms (non-exhaustive) | |
|
Calculated (energy) use |
EPC(s) |
|
Measured (energy) use |
Performance gap |
|
Real/actual (energy) use |
Building |
|
Energy use/usage |
Assessment |
|
Consumption data |
Heat transfer coefficient |
|
Energy performance |
Operational performance/rating |
|
Smart meter(s) |
GDPR |
Stakeholder interviews
Fourteen interviews were carried out with stakeholders in Scotland, the UK, and Sweden. These were semi-structured, 30–45-minute interviews undertaken in July and August 2023.
Interviews were held with the following stakeholders:
- A representative from Boverket, the Swedish National Board of Housing, Building and Planning.
- Richard Fitton, Professor of Building Performance, University of Salford.
- A representative from the Climate Change Committee.
- David Allinson, Building Energy Research Group, School of Architecture, University of Loughborough.
- Richard Atkins, Chartered Architect.
- Jon Stinson, Managing and Technical Director, Building Research Solutions.
- Thomas Levefre, Managing Director, Etude.
- Alan Beal, Bacra.
- Barbara Lantschner, Building Performance Specialist, John Gilbert Architects.
- A representative from Build Test Solutions.
- Sam Mancey, SMETER Implementation Team, DESNZ.
- Kevin Gornall, SMETER Implementation Team, DESNZ.
- Andrew Parkin, Director of Technical Development, Elmhurst Energy
- Joshua Wakeling, Director of Operations, Elmhurst Energy.
- Matt James from the Data Communications Company.
Qualitative analysis
The literature and interviews were analysed in NVivo using inductive coding. This allowed key concept (e.g. performance gap) and categories (e.g. asset vs operational ratings) to emerge throughout the analysis process. Findings from the interviews and the evidence review were analysed using the same coding structure. This approach also facilitated the identification of research gaps.
© The University of Edinburgh, 2023
Prepared by Changeworks on behalf of ClimateXChange, The University of Edinburgh. All rights reserved.
While every effort is made to ensure the information in this report is accurate, no legal responsibility is accepted for any errors, omissions or misleading statements. The views expressed represent those of the author(s), and do not necessarily represent those of the host institutions or funders.
Survey respondents included engineers, architects, product manufacturers, social housing providers, policy makers and researchers. ↑
The term ‘similar households’ was not defined in the study. Because of the variance of occupancy influence on energy use, this could be interpreted as similar age or number of occupants, heating pattern, income, or other factors. ↑
For most studies included in the review the electricity use of dwellings may include electric space heating, electric water heating and electric space cooling. Not all studies explicitly stated whether these were included which makes it difficult to draw clear conclusions. ↑
Xoserve is the Central Data Service Provider for Britain’s gas market. ↑
Meters are ‘settled’ each time a meter reading is provided from the consumer. ↑
Examples of these tests include QUB and Veritherm. ↑
including a representative of Build Test Solutions, a representative of the Climate Change Committee, Sam Mancey and Kevin Gornall of the SMETER Implementation Team at DESNZ, Jon Stinson from Building Research Solutions, and Thomas Lefevre from Etude. ↑
Determined using the QUB test, which is an alternative to the co-heating test and can estimate the HTC within a day. ↑
Note that this study calculated Heating Power Loss Coefficient (HPLC) rather than HTC. The difference is that HPLC incorporates thermal losses from the heating system as well as the building fabric. ↑
This tool uses four temperature and humidity monitors throughout the home to record internal data for a three-week period. Measured energy use during this period is also taken to calculate the HTC figure. ↑
Public buildings in England and Wales over 250 m2 must have a DEC. In Scotland, public buildings are required to have an EPC rather than DEC. ↑
The amount of primary energy used to generate a unit of electricity or a unit of useable thermal energy in a building. ↑
Public buildings in England and Wales over 250 m2 must have a DEC. In Scotland, public buildings are required to have an EPC rather than DEC. ↑
Research completed in December 2023
DOI: http://dx.doi.org/10.7488/era/5478
Executive summary
Background
The generation of energy from organic matter, such as plants, is called bioenergy. The Update to the Climate Change Plan (CCPu) identifies the significant role that bioenergy could play in delivering Scotland’s legally binding commitment to achieve net zero by 2045. This could be achieved whilst also supporting a green economic recovery from the effects of the Covid-19 pandemic and a just transition that creates jobs and supports people and rural communities.
To meet this expanded role for bioenergy in Scotland, a scaling up of domestic biomass production would be required. The UK Climate Change Committee (CCC) highlighted the opportunity for domestic production as a key pillar for delivering the CCPu ambition.
This research examines the economic potential of perennial energy crops (PECs) for farmers and land-managers, as well as the wider economic implications. The three PECs considered are miscanthus, short rotation coppice (SRC) and short rotation forestry (SRF).
Key findings
Profitability of perennial energy crops
- PECs have the potential to generate income for farmers and land-managers in Scotland.
- Comparison of gross margins shows income from PECs is likely to be lower than from other typical farm enterprises on suitable land, such as lowland cattle and sheep and ‘mixed agriculture’. This is assessed on the basis of yearly average gross margins over the lifetime of the PEC in comparison to equivalent gross margins for other farm enterprises.
- Income (gross margin calculation) from PECs compared very favourably in the analysis compared to the farming type known as ‘general cropping: forage’. This is growing crops for animal consumption, usually on lower quality land, and it typically makes a significant loss.
- There is a need for greater confidence that PECs will deliver good economic returns in order for them to be viewed as an attractive, economically viable option by farmers and land managers in Scotland. High upfront establishment costs for perennial energy crops and low revenue potential are both likely to hinder uptake.
- Miscanthus showed the highest average gross margin of the three crops studied, at £382 per hectare per year. However, there are some potentially limiting factors:
- There is uncertainty about achievable yields in the Scottish climate and on the grades of land above category 4.1 in the Land Capability for Agriculture in Scotland.
- There is limited theoretical growing area in Scotland, which is much lower than for SRF or SRC.
- SRF and SRC showed lower profitability for farmers: £80 and £87 per hectare per year over their lifetime respectively for ‘SRF: broadleaved’ and SRC. However, there is more suitable land for growing these.
- SRF conifer would see a negative gross margin, given that the production costs outweigh the value of the crop sold.
Potential opportunities
- PECs could help diversify a business, creating additional income, without adding significant additional labour requirements or ongoing input costs because minimal management time and inputs are required once crops are established.
Potential barriers
- Cash flow could pose a barrier to uptake. The distribution of costs and income year-on-year for PECs is significantly different to typical farming activities which have an annual profit cycle. PECs need investment in site preparation and planting upfront, but income only arrives after first harvest several years later. This is 2-3 years for miscanthus with subsequent annual harvests, 6 years for SRC with periodical harvests thereafter, and 15 years for SRF first and only harvest.
- Farmers and land managers may view PECs as a risky proposition due to uncertainty about market demand and achievable crop sale prices, combined with the need for upfront investment to establish production.
- Other potential barriers to uptake include: farmer and land-manager unfamiliarity with PEC production, low appetite for risk, need for new skills, access to equipment and services, concerns about community perception of land-use change, and impacts on other agricultural production, e.g. available animal feed.
Enhancing economic potential and production
Potential approaches to improve the economic potential of PECs in Scotland include:
- Financial incentives, such as government specific subsidies under future agricultural support or other market-focused incentives.
- Risk reduction strategies, such as secure, attractively priced contracts with end markets, alongside expansion of the market.
- Innovations to allow processing at the farm and to improve transportability of crops could also help to increase the economically viable travel distance.
- Improving access to skills and knowledge to produce PECs could also remove a barrier to uptake, if economic prospects are improved.
Implications for wider Scottish economy
- Future demand for PECs to support the Scottish Government’s climate ambition is likely to require increased production, and previous research suggests 38,000 hectares could be feasibly planted by 2032 and 90,000 by 2045.
- We modelled two demand scenarios to illustrate the potential range in results if land was transitioned to growing PECs:
- Scenario 1: conversion of approximately 38,000 hectares. This would result in an economic gain in terms of increased gross margin of around £9.6 million. This would however result in a shortfall in non-PEC agricultural yield (crops, stock-feeding crops and grass) of between 537,600 and 700,000 tonnes.
- Scenario 2: conversion of approximately 90,000 hectares. This would result in an economic loss of around £9.5 million per year, based on gross margin, and a shortfall in non-PEC agricultural yield (crops, stock-feeding crops and grass) of between 708,200 and 1.6 million tonnes. The financial loss is because under this scenario more economically advantageous land is transitioned to PECs and the PECs perform less well economically.
Economically viable production locations
- Economically viable production locations for PECs are influenced by multiple factors including proximity to markets and local access to services and facilities for crop management, such as harvesting contractors, to avoid incurring excessive costs.
- The research identified suitable growing regions (some SRC/miscanthus and most for SRF) within an economically viable transport distance to existing biomass plants and potential sites for Bioenergy with Carbon Capture and Storage (BECCS) near the proposed east coast carbon capture and storage feeder pipeline (assumed 50-100 km).
- Economic viability may be a barrier to SRF production increases even if suitable land is available, given that it is economically uncompetitive against other land use options.
Potential further steps
Key debates and areas for further research include:
- Considering more in-depth ‘whole farm’ economic analysis. This study focused on gross margin comparison, which is useful for comparing specific crops and farm enterprises, but has limitations in terms of how well it allows assessment of integration of energy crops into a whole farm business. This will vary farm to farm but could be explored through farm case studies. This could include considering a wider range of costs for farmers and that after initial set up the PECs would require less workload.
- Comparing the economic and environmental potential of using land for energy crops with utilising the same land for other renewable energy options, such as using the land for solar panels alongside grazing.
- Exploring the potential role for on-farm use of perennial energy crops.
- Considering future biomass markets, including how future Greenhouse Gas Removal (GGR) schemes, global demand and demand from biotechnology sector may impact it.
- Identifying how to make domestic biomass from energy crops a more attractive option than imports and a more profitable use of land, and on what basis this can be justified. For example, taking account of full LCA and rewarding greatest emission saving.
- Considering in more detail the role of PECs in the context of how the agriculture sector is changing and how it may have to change to reduce GHG emissions.
- Considering the value, including the financial value, of other benefits of energy crops, such as flood mitigation or animal shelter, relative to existing or potential alternative land-uses.
- Exploring how PECs support/interact with tier 2 or 3 objectives of the ARP.
- Considering the impact of subsidies.
The most economically and environmentally advantageous approach is likely to be site-specific and determined by local circumstances. Making judgements about the best use of land is complex for policy makers, farmers and land managers alike. Guidance on this decision-making is likely to be needed.
Abbreviations table
|
BECCS |
Bioenergy with Carbon Capture and Storage |
|
CCC |
UK Government Climate Change Committee |
|
CCPu |
Scotland’s Climate Change Plan Update (2020) |
|
CXC |
ClimateXChange |
|
LFA |
Less Favoured Area (a designation in Scotland for disadvantaged agricultural areas – including crofting) |
|
NETs |
Negative Emissions Technologies |
|
PEC |
Perennial energy crops |
|
SRC |
Short Rotation Coppice |
|
SRF |
Short Rotation Forestry |
Introduction
This evidence assessment focuses on examining the economic potential of perennial energy crops (PECs) for farmers and land-managers in Scotland, along with considering the wider economic implications for Scotland. The assessment builds upon recent ClimateXChange reports which demonstrated that there are significant opportunities for the expansion of perennial energy crop cultivation in Scotland (Martin et al, 2020) and that increased supply of biomass for energy generation from such crops will be needed to meet forecast future demand in the context of Scotland’s climate mitigation plan goals (Meek et al, 2022). However, in scaling up domestic biomass production it is important to consider how the economics intersect with other relevant issues including biodiversity, land-use, water management and a ‘just transition’. This report aims to consider these issues, alongside the economics and support the Scottish Government’s development of policy in relation to perennial energy crop production.
The policy context for energy crops in Scotland
The Scottish Government’s Update to the Climate Change Plan (CCPu) forecast a role for Negative Emissions Technologies (NETs) , including bioenergy with carbon capture and storage (BECCS), to remove carbon dioxide from the atmosphere to compensate for residual emissions. ). The UK Climate Change Committee (CCC) acknowledges Scotland’s opportunity to scale up domestic biomass production to meet this aim, recommending careful consideration of impacts on land-use and agriculture. In line with Scottish Government’s Vision for Agriculture, and set out in the Scottish Agricultural Bill, future subsidy support which will replace Common Agricultural Policy, will be split across unconditional support and support targeted to sustainable food production and environmental outcomes, including low carbon farming and biodiversity. Scotland’s draft ‘Energy Strategy and Just Transition Plan’ aims to use bioenergy where it can best support Scotland’s Net Zero Journey, and aligns with and supports Scotland’s goals for protecting and restoring nature. Considering the role for production of PECs in the evolving Scottish policy landscape will be critical.
Alongside this the UK Government has also published a new biomass strategy, which aims to support sector growth and strengthen biomass sustainability. The strategy acknowledges that bioenergy policy involves a mix of reserved and non-reserved powers, and so as the Scottish Government develops its Bioenergy Policy Statement, Scotland has an opportunity to build on UK policies and develop policies appropriate for Scotland. Further policy information is included in Appendix A.
Introduction to perennial energy crops for Scotland:
Previous research for CXC identified that perennial energy crops (PEC) present opportunities for scaling up biomass production in Scotland, with short-rotation coppice (SRC), short-rotation forestry (SRF) and energy grass Miscanthus, showing most potential (Martin et al, 2020). Details of each crop can be found in Appendix B. PECs support climate mitigation by providing a renewable energy source; displacing fossil fuel use; helping to reverse soil carbon loss, and acting as a carbon sink. When used for energy generation and combined with carbon capture and storage (CCS), such crops have the potential to generate negative emissions and contribute towards Scotland’s net zero ambitions. PECs can also bring additional benefits, such as flood mitigation (see Section 4 below for further details).
Figure 3.2: Schematic diagram of bioenergy with carbon capture and storage [1]
Currently, Scotland grows only a small area of PECs – about 250 ha (Martin et al, 2020). Previous geo-spatial mapping work for Scotland (Martin et al, 2020) has shown theoretical potential for approximately 900 kha of land, to be suitable for PECs (913kha SRF, 219 kha SRC and 52kha Miscanthus – with some overlap between suitable areas) mainly in the east and the lowlands. This analysis considered topography, soil type, climatic variables and suitable land capability classes[2] to identify these theoretically feasible growing areas. Future demand for PECs to support the Scottish Government’s climate ambition is likely to require increased production of such crops.
Markets for PEC Biomass in Scotland
Research[3] has identified the following potential uses of biomass via ‘Negative Emissions Technologies’:
- BECCS Power – bioenergy with carbon capture and storage (BECCS) for electricity in a power station
- BECCS hydrogen – either via gasification of biomass or steam methane reforming of biomethane, with carbon capture and storage
- BECCS in industry (for heat and other industrial processes)
- BECCS Biomethane – processing of biomass via Anaerobic Digestion (AD), gasification or pyrolysis, with carbon capture and storage
- Biochar – pyrolysis of biomass, with carbon capture and storage
PEC biomass can also be used in combined heat and power plants and biomass boilers at a variety of scales. The market for the biomass produced from PECs is relatively immature in Scotland. There are several biomass energy plants ranging in size from large scale industrial units and power stations to small units supplying individual farms. These mostly utilise wood from local forests, waste wood from Scotland sawmills and other industries so the market for further PEC biomass is currently limited[4]. Scotland’s largest wood-fuelled power station, is located in Markinch, with 55MW capacity utilising mostly recovered wood, some virgin wood chip. The next biggest is Steven’s Croft, in Lockerbie which generates 44MW of electricity and 6MW of heat which initially planned to source fuel from local forests (60%), SRC willow (20%) grown within a 60-mile radius (and requiring around 4,000 hectares land) and recycled wood fibre (20%) (Warren et al., 2016), but the latest data suggests it mostly uses a mix of wood and waste wood[5]. BECCS plants are not expected to deploy in Scotland until 2030.
Evaluating economic potential of PEC in Scotland
To understand the real potential, it is critical to consider not just the overall economic viability of PECs, but also how the demand for land for PECs can be balanced against, or integrated with other uses such as food and fodder production and biodiversity, and the skills, knowledge and attitudes of the farmers or land managers.
The economic potential of energy crops
A Rapid Evidence Assessment (REA) seeking evidence of the economic potential of energy crops in Scotland was undertaken and identified peer-reviewed and grey literature. The methodology can be found in Appendix C. The review focused on Miscanthus, SRC and SRF to specifically identify:
- The positive and negative economic potential of energy crops.
- Other (non-economic) opportunities and barriers to deployment.
- Further economic potential (e.g., in relation to employment; technologies; wider decarbonisation, just transition).
Key insights are presented here, along with relevant insights from the stakeholder research. For full details of information found in the literature review and references to information sources (please see Appendix d), for details of stakeholder interviews conducted see Appendix G.
Key findings of the rapid evidence assessment and stakeholder engagement
Evidence of positive economic potential
- There is evidence that PECs can be profitable, but there are limited studies directly applicable to Scotland and to the current economic climate (Appendix D: 15.1)
- Economic performance of biomass production is influenced by production costs, crop yields, crop price and end-use/market opportunities. (Appendix D: 15.1)
- Several studies comparing energy crops reported a high return per hectare for miscanthus primarily due to low maintenance cost along with the low requirement for field operations. (Appendix D: 15.1)
- The tree species chosen for SRF influences plantation establishment costs and therefore profitability as costs vary between species. Initial indications from trials underway in Scotland suggest hybrid apsen to have most potential, with common alder, silver birch and Sitka spruce having potential at some sites. (Appendix D: 15.1)
Evidence of negative economic impacts
- The most prominent evidence of negative economic impacts in the literature was the high upfront cost to establish PECs, lack of established markets, and the uncertainty over the stability of the long-term market. (Appendix D: 15.2)
- Profitability and economic considerations for farmers are dominated by high establishment costs, uncertainties about the market, a delayed period of revenue, and biomass yield. (Appendix D: 15.2)
Economic potential of PECs in comparison to other land uses
- The literature review did not provide clear evidence of how the three key PECs compare economically to other crops, annual crops and agricultural land-uses – some studies showed favourable comparison and others did not. Limited insights can be gained from the literature given the recent economic changes affecting agricultural costs and market prices (Appendix D: 15.3)
Influences on decisions to plant PECs
- One of the main factors affecting the uptake of PEC is economic profitability (Appendix D: 15.4)
- Appetite for and perception of financial risk, skills, attitudes and access to markets can influence farmer and land-manager decisions. (Appendix D: 15.4)
- Even where PECs, or energy crops in general, can deliver positive economic results for farmers and land managers, this on its own is not always sufficient to convince them to start growing PECs. (Appendix D: 15.4)
Other features of PEC production that influence economic potential
- Producing PECs has specific economic implications for growers which influence their economic potential and attractiveness. These include lack of flexibility of land-use, reduced market responsiveness, and opportunities for diversification alongside current farming enterprises. (Appendix D: 15.5)
- To view PECs as economically worthwhile, farmers need confidence that they can achieve an acceptable and secure market price into the future. As farms typically operate in a risk-averse manner, reduced risk is an important factor in farmer decision-making for PECs. (Appendix D: 15.5)
- The way PECs are deployed on farms influences their economic potential. Integration of PECs alongside other enterprises and on land which is not performing well could be advantageous. (Appendix D: 15.5)
Opportunities to improve economic potential
- Cultivation techniques, crop variety choice and other technological developments can influence economic potential of PECs in Scotland and have potential to improve profitability for farmers and land managers in future. (Appendix D: 15.6)
- There are factors which can negatively affect the economics of PEC production, which if addressed are potential opportunities to improve economic performance. (Appendix D: 15.6)
- Gaps in the crop (i.e. patches where it didn’t grow) was a key factor reducing profitability of miscanthus in the UK.
- Ensuring access and enabling harvesting equipment is essential for economics of SRF to be viable
- For SRF effective plantation establishment is important for the economics and general success of a SRF plantation
- Single species monocultures can offer greatest economic return by providing higher yields per hectare
- Highest yield are achieved on fertile soil or under intensive management systems, including weed control, fertilizer application and irrigation
Evidence of potential for wider economy
- There was limited research addressing the potential contribution to the wider Scottish economy and a just transition, but some opportunities and challenges can be inferred. These include sales for local energy generation and other industrial uses, employment opportunities in contract services, along with potential payments for environmental outcomes. (Appendix D: 15.7)
Evidence of non-economic opportunities
- Non-economic opportunities and benefits of PECs were identified including several relating to positive environmental outcomes such as reduced agro-chemical use, reduced soil and water pollution, carbon sequestration, and biodiversity benefits. (Appendix D: 15.8)
- The opportunities for environmental improvements resulting from PECs vary depending on planting, prior land-use and landscape context. (Appendix D: 15.8)
Challenges and deployment barriers
- Non-economic challenges facing the production of PECs in Scotland, relate to skills, land-use commitment, compatibility with current culture and habits, farm businesses, perceived land suitability and environmental concerns. (Appendix D: 15.9)
- Deployment barriers include the need for farmers to commit land for a long period of time, land quality, knowledge, profitability, time to financial return and social resistance relating to whether land should be used for energy or food production. In addition for SRC and SRF, converting land once planted is challenging, and additionally for SRF conversion be restricted by regulations as land will no longer be classed as agricultural. (Appendix D: 15.9)
- Lack of access to specialist skills and to specialist contractors and machinery was identified as a barrier to deployment. While there is interest amongst farmers in diversification, appetite for change is tempered by concern about moving into unfamiliar activities which require new skills.
- Culture and attitudes can be a barrier to PEC deployment. (Appendix D: 15.9)
- There are concerns about the impact on biodiversity from PECs. (Appendix D: 15.9)
- Energy generation from biomass is a potential source of direct and indirect emissions and limiting these emissions would need consideration. (Appendix D: 15.9)
Other relevant crops and planting regimes
- Hemp has the potential to provide high yields or returns with little or no pesticides and insecticides, significant potential in carbon sequestration, fits well into crop rotations with food and feed crops and helps improve soil structure and soil-borne pests. Constraints on producing hemp in Scotland includes the current lack of market as there are no large processing facilities in or near Scotland, strict regulations on growing hemp including the need to obtain a costly license, and some reports of low profitability according to Scottish growers. (Appendix D: 15.10)
- Specific studies focused on Scotland to show how PECs could be grown in agroforestry systems were not found, but provided the design of agroforestry systems can allow for economically efficient planting, management and harvesting it could provide an advantageous model. (Appendix D: 15.10)
Key evidence gaps
The research found some uncertainties – due to lack of Scottish specific data and in relation to climate impacts on PECs – which are described in the relevant sections above, and also some key gaps in the evidence which are summarised here.
Lack of Scottish data and research leading to economic uncertainty
Research related to the production and economic potential of energy crops in Scotland is limited. SRC is currently grown, but only at a small scale, and miscanthus still requires further trials and research before implementing at a commercial scale. SRF trials are currently underway in Scotland with findings slowly emerging as plantations reach maturity (Parratt, 2017). There is therefore uncertainty regarding the economic potential in Scotland.
The literature is inconclusive regarding the financial performance of PEC production. Conflicting results are found across studies, for example, a study in Ireland found miscanthus production to be an economically viable option (Zimmermann et al., 2014), yet in France, Miscanthus was found to be less profitable compared to conventional cropping systems (Glithero et al., 2013). Research by Warren (2014) reported that the soils and climate across Scotland offer significant biophysical potential, especially for SRC willow cultivation, which can also achieve good growth rates. However, with such limited data on Scotland and in light of the less favourable climate than found in locations of many studies there is uncertainty about the economic viability in Scotland.
Climate change
The effects of climate change on PECs are to some extent unknown. Research suggests that SRC willow yield may reduce as a result of rising temperatures, while miscanthus performs favourably (Alexander et al., 2014). However, as the temperature rises, this may change the habitat suitability, further research is required to establish the suitability and risks that a changing climate may have on seed development in miscanthus throughout the UK (Martin et al., 2020). We did not find research which commented on how extreme weather such as storms, flooding and drought would affect PECs. Some research suggests that water-logged soils hinder growth of PECs (Martin et al, 2020), but a recent technical webinar from Biomass Connect suggested that willow SRC is not negatively affected by water-logging, and can help improve water management when established.
Active debates within the sector
It is evident from the literature and stakeholder interviews that there are some topics with differing views including what types of land are most suitable for PEC growing considering the wider land-use debates, and likely impacts on biodiversity.
Land use and use of unproductive areas of land
In Scotland, there is competition for land to deliver food, materials, environmental services (such as carbon sequestration), leisure opportunities and more (Martin et al., 2020; Scottish Government, 2021). Scotland has the potential to produce 9.25TWh/yr and 1.75Modt/yr for SRC (Martin et al., 2020) such as SRC willow, however amongst the farming community there is social resistance relating to land being used for energy instead of food production (Anejionu and Woods 2019). The Scottish Government’s Land-use Strategy (Scottish Government, 2021) highlights the complexity of balancing the need for land to support the move to net zero with other essential activities such as food production, and that whilst land-use decisions are often determined by the land suitability, much land is suited to multiple different uses. In these cases multiple factors need to be considered as to whether PECs are a suitable use for the land.
Literature identifies that using ‘marginal’ land, for energy crop production could be a solution to this land use debate. However, there are several challenges in understanding whether this ‘solution’ could usefully apply in Scotland. Ranacher et al., 2021 found there is a gap in the available literature regarding farmers’ willingness to adopt short rotation plantations on marginal lands. There is also no agreed definition in the literature of what comprises ‘marginal’ land, so it is unclear how this would apply in the Scottish context. Much discussion in research focuses on cropland, yet in Scotland grasslands including rough grasslands, which may be viewed as ‘marginal’ from some perspectives, are a critical part of the Scottish rural economy and environment and so a more indepth analysis of the potential social, environmental and economic implications of PECs on grasslands is needed. Additionally, not all literature agrees on whether PECS will successfully grow on marginal land.
Biodiversity & ecosystem services
Converting land to energy production in Scotland will have direct impacts on biodiversity, wildlife, and landscape connectivity, yet the exact nature of these is unclear from the literature. Research shows that bioenergy crop choice and location influence biodiversity outcomes – choosing appropriate bioenergy crops in the right location is vital for the protection of biodiversity and ecosystems and to prevent damage to the surrounding ecosystem.[6] Contradictory evidence has been found throughout the REA on the effects of converting land for energy crop production in Scotland. Existing sustainability criteria for the use of biomass to produce heat or electricity require that PECs are not grown on land of high biodiversity value[7]. Beyond application of these criteria, the research could create uncertainty about how to select the right crops for the right locations in Scotland to ensure good outcomes for biodiversity and ecosystem services. Extrapolation of potential biodiversity effects from conversion of ‘marginal’ land has low confidence (Holland, et al., 2015) (Vanbeverena & Ceulemansa, 2019), and application of this research to the Scottish context with different land-use types is therefore very difficult.
The impact on biodiversity from SRC, SRF and Miscanthus differ depending on location, previous land use and crop type and management (e.g., cultivations, pesticide, and fertiliser use). The replacement of any semi-natural habitat by a dedicated bioenergy crop is likely to result in significant biodiversity losses due to creating a monoculture habitat (Martin et al., 2020). Significant areas of land classified as ‘Less Favoured Areas’ (LFA) in Scotland which were identified as potential PEC growing areas could be described as semi-natural – and seen as ‘marginal’ – but there is a risk of biodiversity loss if this is converted to PEC.
The REA identified a conflict in opinion as to whether PECs provide a biodiversity gain or loss. Firstly, factors such as reduced ground disturbance, increased diversity of nectar and pollen sources, and the potential to provide over wintering sites which are associated with energy crop production will benefit pollinating species. Conversely the monoculture nature of energy crops is likely to be detrimental to pollinator species as landscape homogenisation is widely accepted to be a driver for the current loss of pollinating species (Martin et al., 2020). Holland et al. (2015) identified ecosystem services such as hazard regulation, disease and pest control, water, and soil quality may benefit from the conversion of arable land to energy crop production, and that the transition of marginal land[8][9] to bioenergy crops will likely deliver benefits for some ecosystem services while remaining broadly neutral for others. On the other hand, conversion of forest to energy crops will likely have a negative impact due to the increased disturbance associated with the management cycle.
Estimating economic potential
This research looked at perennial energy crops (PECs), SRF, SRC and Miscanthus and included two core economic analyses:
- Farm-scale economic analysis and comparison with typical land-use options:
- A farm scale economic analysis of the net economic benefit for a farmer or land-manager from producing and selling the Miscanthus, SRC and SRF.
- A comparison of this net economic benefit for a farmer or land-manager with typical existing land-uses.
- Assessment of wider economic implications: drawing on geo-spatial data about existing farming and land-use types, the study analysed what the economics implications would be for the wider Scottish economy of a transition to growing more energy crops.
Farm Scale Economic Analysis
Methodology overview
- For the farm-scale economic analysis high, medium and low-cost scenarios were developed for the production costs for: Miscanthus; short rotation coppice: willow; short rotation forestry: conifer; and short rotation forestry: broadleaved. The higher scenario includes high output/high price minus low costs, the medium scenario scenario includes medium output/medium price minus medium costs and the low scenario includes low output/low price minus high costs.
- The following production costs were included; pre-planting/land preparation, planting, post-planting, harvesting and storage and reversion.
- Capital investment costs were not included: where specialist equipment would be needed, which a farmer would not typically have on a farm, such as cutting equipment for SRF, we have assumed services of a specialist contractor would be utilised and this cost has been included within the production costs.
- Estimates of likely income from PEC sales were combined with costs to create a ‘gross margin[10]’ (income minus costs) for each bioenergy crop. Because the PECs all have a long lifespan, time series charts are used to show the income minus costs over the lifetime of the crop. The results of which can be found in section 5.1.3. Depending on the crop, the yield changes over the lifespan of the rotation, for example due to lower yields in early years after establishment and harvest only occurring in some years. Details on the yields during rotation can be found in Appendix D. For Miscanthus and SRF a low, medium and high price presented, whereas for SRC a single price is used due to limited data. Prices used in the analysis are in Appendix D.
- To compare to the economics of current land use, three farm types were used these were lowland cattle and sheep; mixed farming[11]; and general cropping – forage. These were selected because they are feasible on the land capability of grades; 4.1, 4.2, 5.1, 5.2, 5.3 and 6.1, – typically suitable for mixed agriculture, improved grassland and high-quality rough grazing, and also the land capability grades assumed suitable for PECs . To calculate the gross margins for the farm types used in the analysis the latest data from the ‘Scottish farm business income: annual estimates 2020-2021’ were used[12].
- Subsidies are not included in this analysis.
- Total average output in the farm business survey[13] includes the output categories; total crop output, total livestock output and miscellaneous output. For the ‘general cropping – forage’ category census data is used and output represents the estimated farm-gate worth (£s) of crops and animals without taking account of the costs incurred in production.
A more detailed description the methodology used, assumptions and data sources is included in Appendix E.
Limitations with the methodology
The calculations for the farm types used in the analysis are based on data from the Scotland Farm Business Income Survey, therefore the estimates are based on averages and so any other factors that might influence the costs and output for example climate, soil type will not be accounted for. This is the same for the costs and output estimates for the bioenergy crops. We have not allocated an economic value to any additional benefits a farmer may gain for the other farm enterprises, such as shelter for livestock on adjacent land.
It should also be noted that this study focused on gross margin comparison, which is useful for comparing specific crops and farm enterprises, but has limitations in terms of how well it allows assessment of integration of energy crops into a whole farm business. This will vary farm to farm and would require more in depth ‘whole farm’ economic analysis to be fully understood.
Results of Farm Scale Economic Analysis
Figure 5‑1 shows what land managers could earn on average in a year if costs and yield were spread equally over the lifecycle of the bioenergy crop as well as for farm types (for full details on the method please see Appendix E). There are gross margins for a low, medium and high scenario for each of the bioenergy crops and for the farm types (except for general cropping, forage[14]). The low, medium and high scenario for lowland cattle and sheep and mixed farming includes the lower (25%), average and upper (25%) of data from the farm business income data respectively, average data from 6 years 2016-17 to 2021-22 uprate to reflect 2023 prices[15].
Figure 5-1 ‑Yearly average gross margins for each of the PECs over the lifetime of the PEC and for each farm type £/ha (2023 prices)
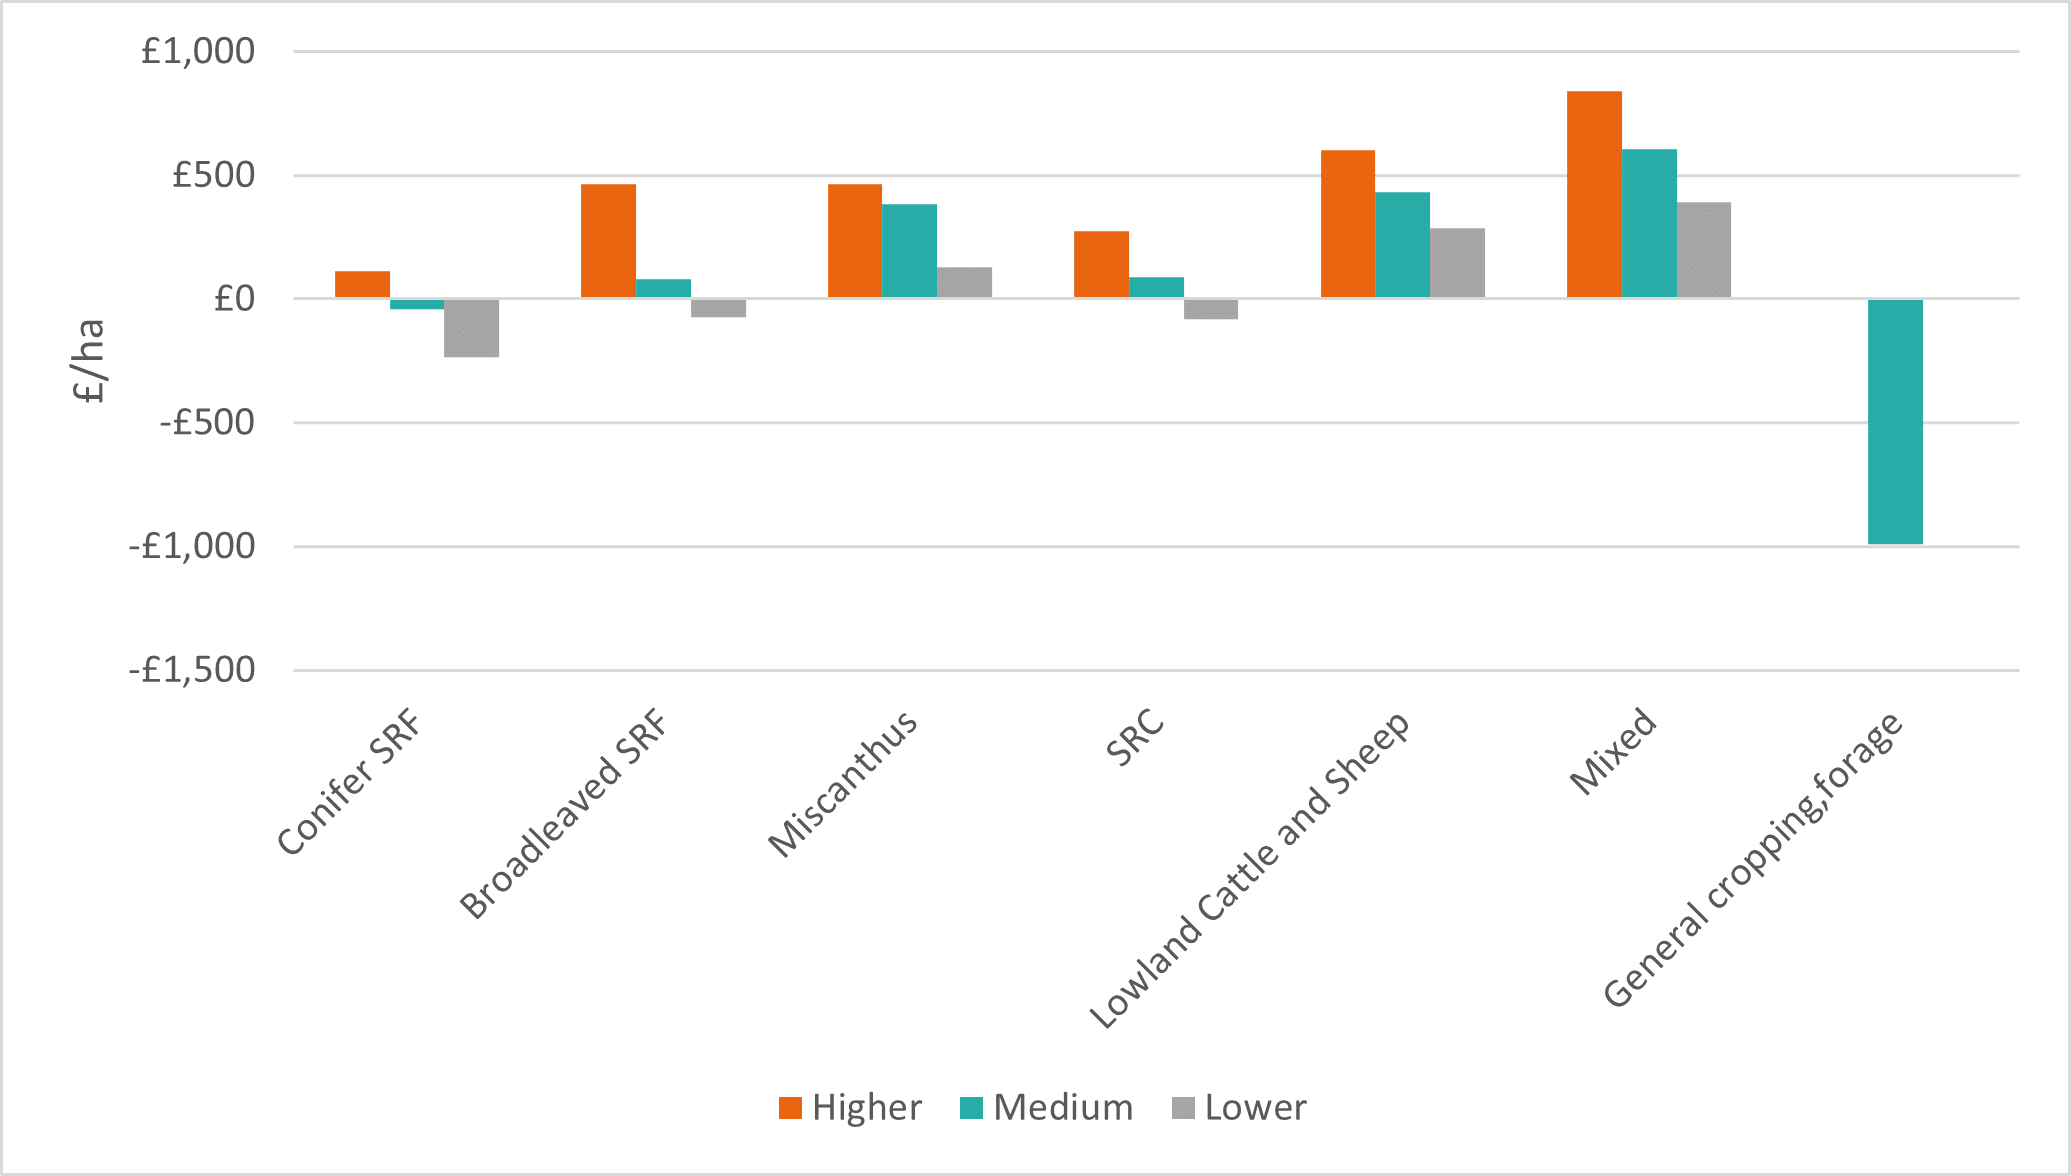
If costs and income were spread equally over the lifetime of the crop, the medium scenario suggests:
- Miscanthus produces a positive average annual gross margin of £382 per hectare, SRC £87 per hectare and SRF broadleaved £80 per hectare.
- SRF conifer would see a negative gross margin i.e., the production costs outweigh the value of the crop sold. The planting and the ground preparation costs are the main drivers behind this negative gross margin (see Appendix D for more detailed costs).
- Mixed farming and and lowland cattle and sheep farms both show a greater average annual gross margin than all of the PECs examined.
- The average gross margin per year for general cropping, forage is negative at around £990 per hectare, significantly lower than for all of the PECs. Based on these average annual gross margins, growing PECs in lowland cattle and sheep and mixed farming would reduce financial returns in the farm. Whereas, growing PECs in farms in the general cropping forage category could improve their financial returns.
Figure 5‑2, Figure 5-3, Figure 5-4, Figure 5-5 shows the low, medium and high scenario gross margins (output minus variable costs) over time of each of the PECs: Miscanthus, SRC, SRF broadleaved (silver birch) and SRF conifer (Sitka spruce). The higher scenario includes high output/high price minus low costs, the medium scenario includes the medium output/medium price minus medium costs and the lower scenario includes low output/low price minus high costs.
Costs included in the calculations included:
- Site preparation / land preparation (including from different prior land-uses where data is available)
- Establishment / planting
- Crop management costs e.g., during initial growth
- Harvesting
- Reversion (where relevant)
Detailed breakdowns of these costs for the PECs are included in Appendix E.
Figure 5-2 Gross margins for Miscanthus (£/ha) (2023 prices)
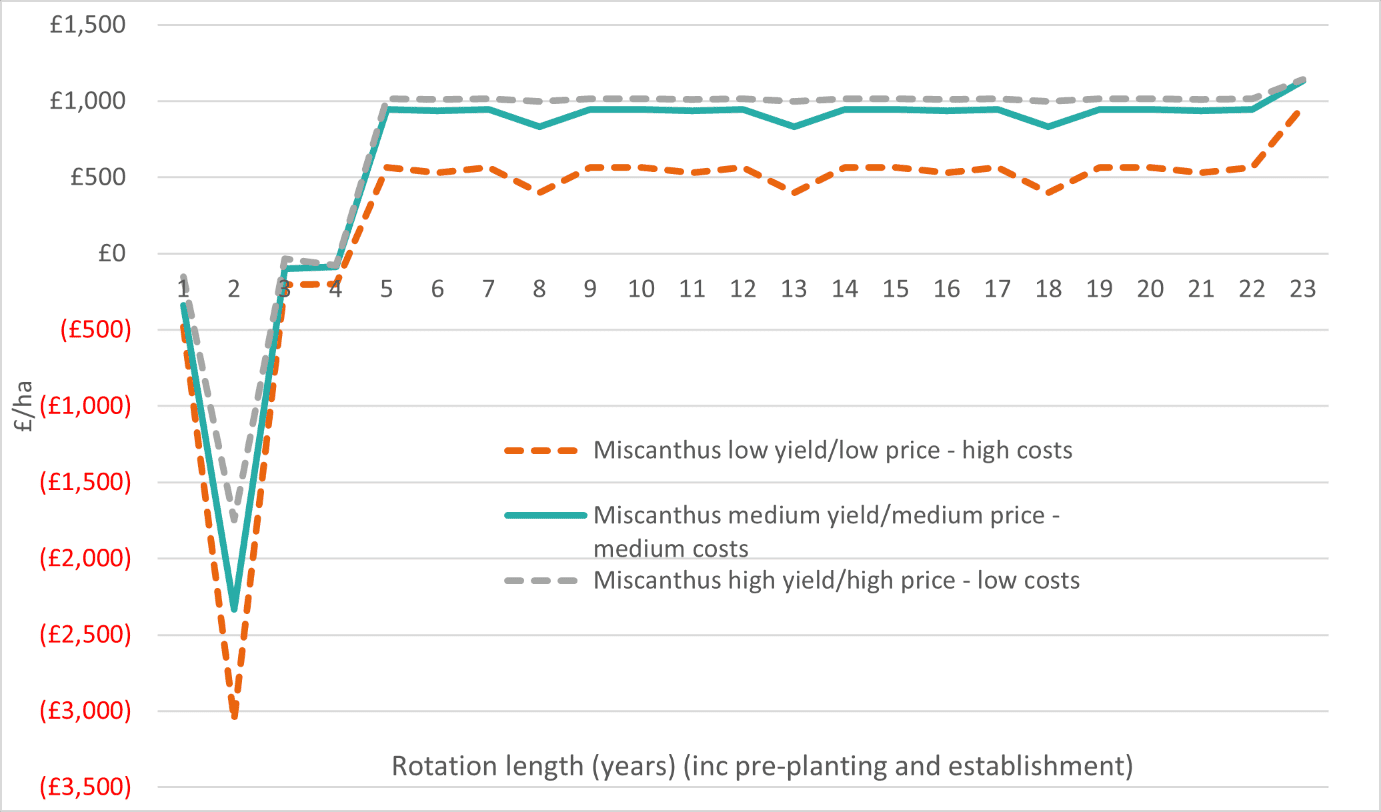
- Miscanthus shows an initial negative gross margin in the first two years during the site preparation and plant stages, but then picks up in the following years with harvesting driving the positive gross margins in the following years. The gross margin drops slightly in the year 21 when the costs of reversion take place.
Figure 5-3 Gross margins for short rotation coppice (£/ha) (2023 prices)
- Short rotation coppice shows a negative gross margin for the first 3 years, in part driven by the pre-planting/land preparation costs in years -1 and 0. Gross margin is then positive in the years 3, 6, 9, 12, 15 and 18 reflecting when harvesting takes place.
Figure 5-4 Gross margins for short rotation forestry – Sitka Spruce (£/ha) (2023 prices)
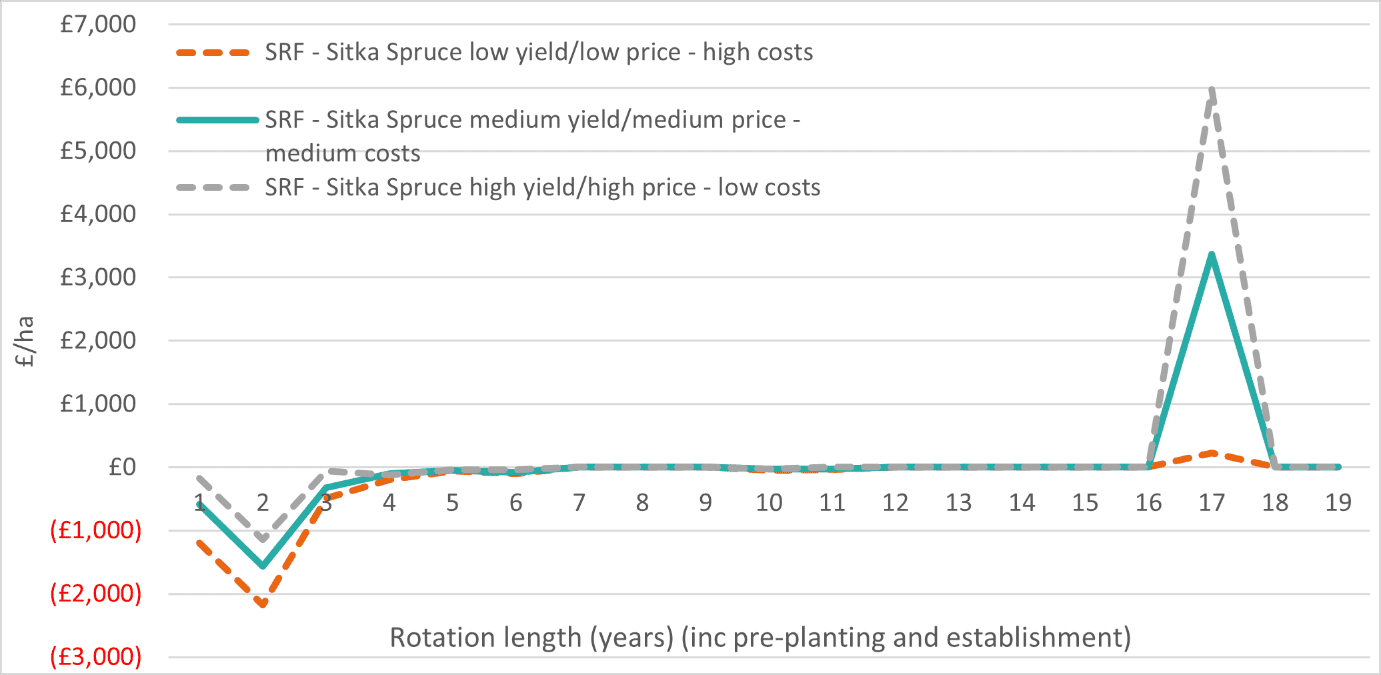
Figure 5-5 Gross margins for short rotation forestry – Silver Birch (£/ha) (2023 prices)
- Short rotation forestry for silver birch and Sitka spruce shows a negative gross margin except for the year 15 when harvesting takes place.
Linking back to Figure 5-1 with the lowland cattle and sheep category on average earning £433 per hectare per year, the mixed farming category £597 per hectare per year and the general forage making a loss of £990 per ha per year the results show;
- Miscanthus, initially has a lower gross margin than all the other farm types, however, after the first few years, land managers would be better off planting Miscanthus.
- SRC, produces a better gross margin than general cropping-forage after the first few years but is outperformed by all other categories when the yield is harvested in years five, eight, 11, 14, 17, 20 and 23.
- SRF, again outperforms general cropping- forage, but has a lower gross margin than the other farm types, except for when harvest takes place in year 18.
Assessment of implications for Scotland’s rural economy
To consider the potential implications of growing more PECs, the results from the farm-scale economic analysis (Section 5.1) were extrapolated across Scottish regions, to consider a transition of approximately 40,000 to 90,000 hectares of suitable land to grow PECs – the area judged to be feasible by 2032 and 2045 respectively (see below for the source of these estimates).
Key findings:
This transition of land in mixed holdings and non-LFA cattle and sheep to PECs would create a shortfall of non-energy crops and and reduced income across the Scottish rural economy due. Because PECs would be more profitable than ‘general cropping: forage’ land-use, there would be an economic gain from transition, but loss of production of animal feed, which may have knock-on implications for livestock production costs (which have not been quantified here).
This research found that, if land to match the level of demand as set out in these scenarios, was utilised for perennial energy crops it would create:
- a gain in gross margin[16] of around £9.6 million (scenario 1) or a loss of around £9.5 million (scenario 2) per year across the regions.[17]
- a shortfall in agricultural yields (of farm outputs generated by existing land-use activity, which would not be available when the activity ceased to be replaced with PECs) across the regions between 537,600 tonnes (scenario 1) and 708,200 tonnes (scenario 2).
Our analysis which forms the basis of this assessment is set out below – with details of each scenario (approximately 40,000 and 90,000 hectares).
Limitations:
This assessment does not consider potential loss or additions to the economy due to changes in associated services. Some additional contracting employment for PECs servicing is likely based on the research, but this, and any potential shortfall in other employment from reducing other farm enterprises have not been assessed.
It should also be noted that the findings relate solely to gross margin comparison. Actual farm income – whole farm business income – is very different, comprising multiple farm enterprises (livestock, crops, diversifications) and may be supplemented with off-farm income. For the farm types considered here typical farm income levels are shown in Table 5-1 below (note General Cropping, Forage is not a type assessed in the Scottish Farm Business Income Survey so data is not available). Assessment of implications for PECs on the overall farm costs and income has not been fully assessed here and may reveal additional positive and negative economic implications of PECs.
Table 5-1: Annual Farm Business Income (£) (average of 6 years 2016-17 to 2021-2022)
|
Farm total |
Per hectare | |||||
|
Farm Type |
Lower (25%) |
Average |
Upper (25%) |
Lower (25%) |
Average |
Upper (25%) |
|
Mixed Farming |
-9271 |
37,791 |
129,023 |
-58 |
225 |
551 |
|
Lowland Sheep & Cattle (non-LFA) |
-20,688 |
25,756 |
105,926 |
-176 |
191 |
451 |
Method and results
For each of non-LFA cattle & sheep, mixed holdings, general cropping; forage, areas that would be suitable to grow PECs have been identified (see Table 5-1). (See Appendix E for further details on how these areas were selected.) This was done by using the GIS mapping done in previous work for CxC (Martin et al,2020) which identified land suitable for PECs to identify the percentage of land in region which was suitable for PECs. This percentage was then applied to the land area estimated to be in each farm type in the region, to derive the land are potentially suitable for PECs by farm type. There is some overlap between the types of land suitable for each of the three types of PECs so the areas in the table cannot be summed to give a total area.
Table 5-1 Potential land suitable for each bioenergy crop on different farm types (hectares)
|
General Cropping, Forage |
Non-LFA Cattle & Sheep |
Mixed Holdings |
Total (all farm types) | |
|
Land potentially suitable for SRF |
13,601 |
66,189 |
27,746 |
107,536 |
|
Land potentially suitable for SRC |
7,967 |
50,520 |
20,156 |
78,643 |
|
Land potentially suitable for Miscanthus |
1,352 |
12,633 |
4,770 |
18,755 |
A previous CXC study (Meek et al, 2022) indicated that, bearing in mind land suitability, an estimated total of approximately 27,000 ha PECs[18] could be planted by 2030, 38,000 by 2032 and 90,250 hectares by 2045. Using these estimates and the potential land that can grow bioenergy crops two illustrative scenarios have been created to estimate the potential economic gain/loss of growing bioenergy crops at the Scottish level.
Scenario 1:
From the results presented in section 5.1 it was financially beneficial to grow bioenergy crops on general cropping, forage land. Furthermore, of all the PECs, growing miscanthus was the most financially beneficial. Therefore, the first scenario assumes that two-thirds (66%) of the general cropping, forage land suitable for SRF and for SRC will be converted and 100% for Miscanthus. Only 66% of land for SRF and SRC are assumed to be converted to avoid double counting due to the likelihood that some areas identified are suitable for both PECs and thus appear in both estimates of suitable areas. Although the results in section 5.1 show that growing bioenergy crops on both non-LFA cattle and sheep and mixed holdings would not be financially beneficial, the loss was less on non-LFA cattle and sheep land. Therefore, to get to the 38,000 hectares, it was assumed that 15% of the land suitable for both SRF and SRC in non-LFA cattle and sheep holdings will be converted and 30% for Miscanthus (see Table 5-2). Overall this means that about 20% of total land in Non-LFA Cattle and Sheep[19] and 1.1% of land in general cropping, forage are converted to PECs.
Table 5-2 Land that is converted for each bioenergy crop for each farm type in scenario 1 (hectares)
|
General Cropping, Forage |
Non-LFA Cattle & Sheep |
Mixed Holdings |
Total | |
|
SRF |
8,977 |
9,928 |
– |
18,905 |
|
SRC |
5,258 |
7,578 |
– |
12,836 |
|
Miscanthus |
1,352 |
3,790 |
– |
5,142 |
|
Total (all PECs) |
15,587 |
21,296 |
– |
36,883 |
|
Total land in farm type in Scotland |
1,378,365 |
107,712 |
304,901 |
1,790,978 |
|
Percentage of total area converted |
1.1% |
20% |
0% |
2.1% |
Results: scenario 1
Figure 5-6, shows that, for Scenario 1 there would be an economic gain for converting land used for general cropping and forage to PECs. This is because PECs have a positive, albeit small gross margin, compared to the large negative gross margin for general cropping and forage. The total gain in gross margins across the region is around £16.6 million, of which almost half occurs in Grampian.
Figure 5-6 Change in gross margin for converting General Cropping, Forage land to Miscanthus, SRC and SRF (Scenario 1)
Figure 5-7, shows there would be potential economic loss for converting non-LFA cattle and sheep land to Miscanthus, SRC and SRF in table 5-2 (scenario 1) with Grampian showing a loss of a total of about £1.8 million. SRF showed the greatest loss in the majority of the regions, as it has the lowest gross margin of all the PECs but has more land suitable for it. Miscanthus showed the smallest loss across all regions. The total loss in gross margins across regions is just under £7 million. This loss is lower than the gain in gross margin from growing PECs on general cropping and forage farms, suggesting that achieving 38,000 ha of PECs could give a net increase in gross margins across the two farm categories of £9.6 million.
Figure 5-6 Change in gross margin from converting Non-LFA Cattle and Sheep land to Miscanthus, SRC and SRF (Scenario 1)
Figure 5-8 shows the reduction in production (crops, stock-feeding crops and grass from grazing land) that could occur when converting the land shown in Table 5-2 to PECs. From converting land to PECs, there is an estimated yield loss of 537,600 tonnes: 263,000 tonnes for crops replaced by with SRF, 85,300 tonnes for crops replaced by Miscanthus and 189,000 tonnes for crops replaced with SRC.
Figure 5-8 Reduction in production (barley, stock-feeding crops and grass) resulting from converting land to PECs (thousand tonnes) (Scenario 1)
Scenario 2:
For the second scenario to get to around 90,000 hectares of land, it was assumed that more of the suitable general cropping and forage land was converted to SRF and SRC (66%), and more of the non-LFA cattle and sheep land (30% of land suitable for SRF and SRC and 60% of land suitable for Miscanthus). It was assumed that a small percentage of the suitable land on mixed holdings was converted (50% of land suitable for SRF and SRC and 50% of land suitable for Miscanthus). Overall, this means that about 40% of the total land in non-LFA cattle and sheep farms, around 9% of total mixed holdings and 1.3% of total general cropping /forage land are converted to PECs.
Table 5-3 Land that is converted for each bioenergy crop for each farm type in scenario two (hectares) (Scenario 2)
|
General Cropping, Forage |
Non-LFA Cattle & Sheep |
Mixed Holdings |
Total (all farm types) | |
|
SRF |
10,201 |
19,857 |
13,873 |
43,931 |
|
SRC |
5,975 |
15,156 |
10,078 |
31,209 |
|
Miscanthus |
1,352 |
7,580 |
4,770 |
13,701 |
|
Total (all PECs) |
17,528 |
42,592 |
28,721 |
88,841 |
|
Total land in farm type in Scotland |
1,378,365 |
107,712 |
304,901 |
1,790,978 |
|
Percentage of total area converted |
1.3% |
40% |
9% |
5% |
Results: scenario 2
Figure 5-9, show the results of the conversion rates set out in table 5-3 (scenario 2). The only farm type which shows an increase in gross margin for conversion to PECs is general cropping and forage (due to its current large negative gross margin). Conversions on the other farm types (necessary to meet the target planting area of around 90,000 ha) give a loss in gross margins. Overall, the increase in income in general and cropping farms of £18.6 million is not enough to offset losses in the other two farm types, (£13.9 million in non-LFA cattle and sheep farms and £14. 2 million on mixed holdings) meaning there is a net loss in gross margin of £9.5 million.
Figure 5-9 Change in gross margins from converting Non-LFA Cattle and Sheep land to Miscanthus, SRC and SRF (Scenario 2)
Figure 5-10 shows the crop production that could potentially be lost from converting the land shown in table 5-3 (scenario 2) to PECs. This based on loss of stock feeding crops (barley, maize and lupin) and grass silage and hay produced on each farm type. From converting land to PECs, there is estimated yield loss of 708,200 tonnes for replacing with SRF, 248,100 tonnes for replacing with Miscanthus and 523,900 tonnes for replacing with SRC.
Figure 5-10 Reduction in crop production (barley, stock-feeding crops and grass) resulting from converting land to PECs (thousand tonnes) (Scenario 2)
Preferred locations: considerations
Preferred locations for economically viable production of PECs are influenced by multiple factors including proximity to markets (current biomass energy plants and potential future BECCS plants) and local enough access to services and facilities for crop management (e.g. harvesting contractors) to avoid excessive costs. We assessed preferred locations for economically viable energy crops in Scotland considering the locations of end markets in relation to viable growing areas for PECs.[20]. Insights from our rapid evidence assessment and stakeholder consultation were also considered, for example comments on economically viable transport distance.
Our analysis showed economically viable areas for PEC production bearing in mind future anticipated demand resulting from Scotland’s net zero ambitions, but only SRF could provide quantity needed, due to lack of availability of suitable land for SRC and miscanthus. As SRF is economically uncompetitive against current land-use, this suggests economic viability may be a barrier to PEC production increases even if suitable land within economically viable distance of end markets is available.
Proximity to users of biomass for energy
Biomass energy crops are bulky to transport and so haulage cost from the location where they are grown to where they are used is a factor which determines which growing locations are economically viable – a crop grown too far from its end destination will be prohibitively expensive to transport. It has been difficult to identify a specific economically viable distance in the available research. Stakeholder comments suggest that whilst 100km is a typical maximum distance to haul wood to a sawmill, a significantly lower distance is economic for biomass crops, as their value is lower than wood which will become sawn timber. In our economic analysis transport costs pre-farm gate e.g. for delivery of planting material are included, but haulage of the bioenergy crops to biomass plants has not been included in the costs as this will depend on the distance and whether the price paid to the farmer is at the farm gate or at delivery to the bioenergy plant. For the purposes of the analysis here, we assume a maximum viable distance of 100km, and consider a shorter 50km distance to reflect stakeholder feedback.
Proximity to existing biomass plants:
Biomass plants in Scotland were identified from DESNZ’ Renewable Energy Planning database which lists both existing and planned plants[21]. Existing sites vary in scale and use – some are generating power for the grid, others are located on industrial sites such as distilleries, sawmills and papermills supplying heat and power for the industry, whilst others are small supplying e.g. a hotel. Eight sites were selected from the list as being most likely to consider using PECs as a fuel (See Appendix J). Plant which are located on sites where there is already a ready supply of fuel (e.g. sawmills, paper and pulp) were excluded as were very small sites and sites which were not yet operational or under construction.
A buffer of 50km and 100km from these biomass plants has been applied in Figure 6-1, to show the potential geographical areas which could supply biomass markets in Scotland.
Figure 6-1: Biomass plant locations
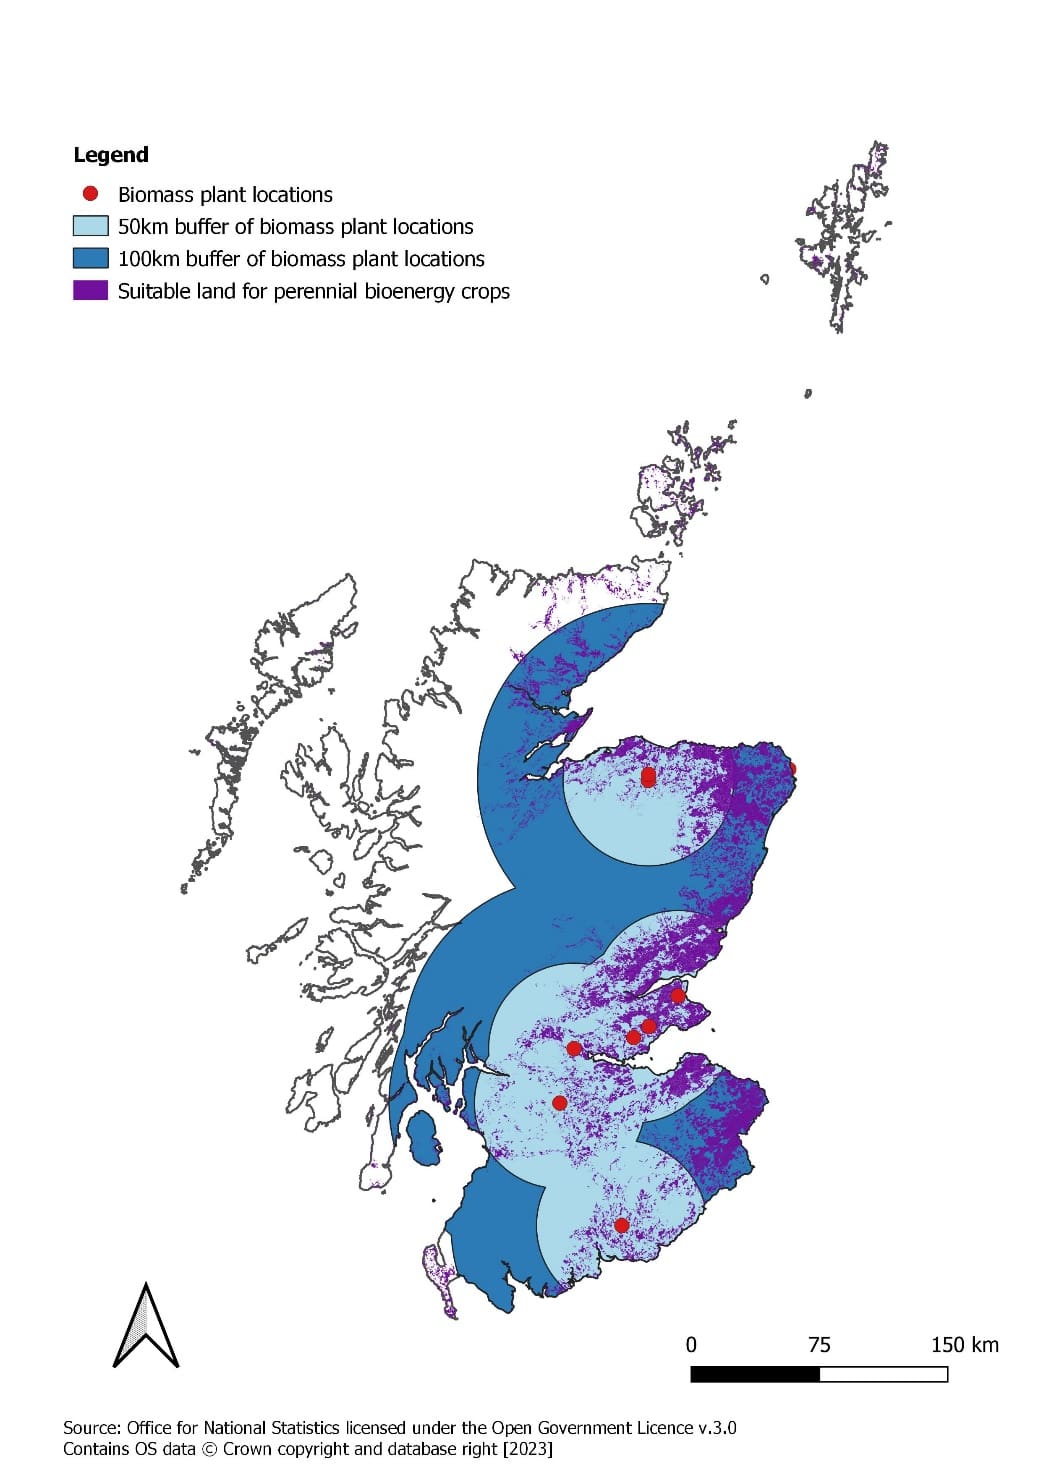
Proximity to future BECCS facilities:
CCC[22] highlights that Scotland has very good potential for deploying Bioenergy with Carbon Capture and Storage (BECCS) due to its access to a potential CO2 storage site in the North Sea, along with its ability to produce domestic BECCS feedstocks. A pilot facility, the Acorn Transport and Storage Facility in Aberdeenshire looks set for further investment after the UK government announced in March 2023 that it considers this site to be one of the two best placed to deliver its objective of capturing 20-30 megatonnes of CO2 across the UK economy by 2030[23]. The proposed access points to this facility are via a feeder pipeline along Scotland’s east coast which starts at Bathgate and ends at St Fergus, with two injection points at Kirriemuir and Garlogie. Large scale BECCS plants for electricity, biomass gasification for hydrogen, or biofuel production[24] may be located in proximity to these access points to benefit from easy access to the pipeline. This study assesses how much land suitable for growing bioenergy crops is within 50km and 100km of these access points. This mapping is presented in Figure 6-2.
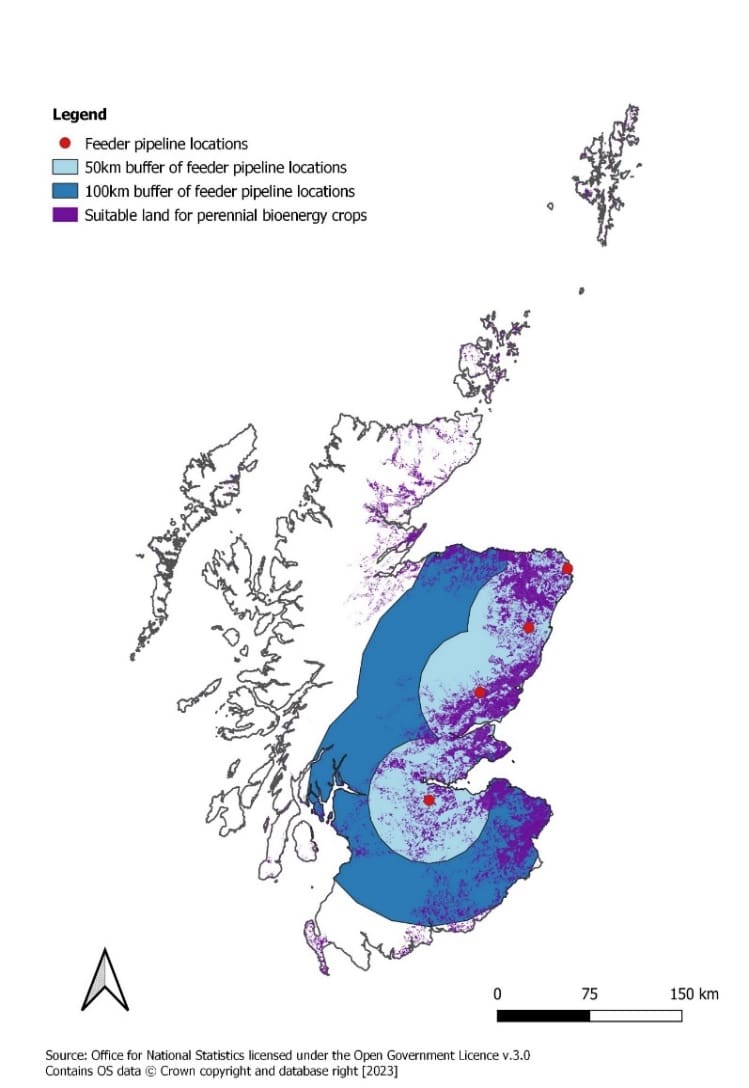
Kirriemuir
St. Fergus
Garlogie
Bathgate
Figure 6-2 Feeder pipeline locations and nearby land suitable for PECs
Table 6-1 shows the total potential PEC growing areas with these distances.
A previous CXC study (Meek et al, 2022) indicated that, bearing in mind land suitability, an estimated total of approximately 27,000 ha PECs[25] could be planted by 2030 and 38,000 by 2032; With this area of land, depending on the yields obtained for PECs and the efficiency of the power plant, PECs could provide feedstock for a BECCs power plant producing between 60 and 80 MWe. The data in Table 6-1 suggests that this land is available, within 50km of all proposed access points along the east coast feeder pipeline for SRC and Miscanthus, but this would require a large portion of the suitable land to be used. A larger land area which is suitable for growing SRF is available.
Table 6-1: Total potential PEC growing areas within 50km and 100km of potential BECCS sites, and existing biomass plant locations.
|
|
Feeder pipeline locations |
Biomass plant locations | ||
|
|
Within 50km |
Within 100km |
Within 50km |
Within 100km |
|
SRC |
82,471 ha |
161,016 ha |
117,222 ha |
225,013 ha |
|
Miscanthus |
8,224 ha |
18,057 ha |
18,280 ha |
28,873 ha |
|
SRF |
551,303 ha |
826,528 ha |
555,193 ha |
858,669 ha |
Access to service and facilities for crop management, harvesting and processing.
Access to services and facilities for crop management harvesting and processing, such as local contractors with suitable equipment has been identified in the research and by stakeholders as a factor which would influence the suitability of growing areas for PACs. The evidence review did not provide information on the availability and access to these services in Scotland, or the speed with which services could develop if a growth in production were planned. Easy access should not be assumed, particularly given the shortage of forestry skills in Scotland and constraint on travel distance which influence the economic viability – access issues would need to be addressed before an area could be suitable for economically viable PEC growing.
Other location considerations
As is evident from the REA, biodiversity and other ecosystem services can impacted by PEC cultivation. Choice of crop, cultivation regime and location need to be carefully considered to optimise environmental benefits and avoid negative impacts. The impact is highly situation specific and could not be assessed in detail within scope of this research but should be considered carefully when selecting locations.
SWOT & PESTLE Analysis
This section provides analysis of the strengths and weaknesses of these crops, and the factors supporting or hindering uptake, drawing together the research findings. A PESTLE analysis was also carried to understand the potential enabling and preventative factors which could influence the economic viability of energy crops in Scotland. Further detailed SWOT and PESTLE analyses are available in Appendix I.
SWOT Analysis of energy crop economic potential
Table 7-1 presents SWOT analysis common to PECs assessed in this research. Further discussion of variations between Miscanthus, SRC and SRF is included in Section 9.
Table 7-1: Summary of strengths, weaknesses, opportunities and threats for PEC in Scotland.
|
Strengths |
Weaknesses |
|
|
|
Opportunities |
Threats |
|
|
PESTLE Analysis
The PESTLE analysis considersthe political, economic, social technical, legal and environmental factors which currently enable or prevent energy crops becoming an economically viable prospect for farmers in Scotland. The summary PESTLE is set out in Table 7-2 below, discussion of the results follows in Section 9.
Table 7.2: Summary of PESTLE analysis for growing PECs in Scotland.
|
|
Enabling factors |
Preventative factors |
|
Political |
|
|
|
Economic |
|
|
|
Social |
|
|
|
Technical |
|
|
|
Legal |
|
|
|
Environmental |
|
|
Discussion
The research and analysis show multiple positive and negative features of the PECs. The implications of these for economic viability of PECs in Scotland is discussed here.
Economic potential to farmers and land managers
Economic potential of PECs in Scotland for farmer and land managers
Overall, the economic analysis showed Miscanthus could be most profitable over the life cycle, but though SRC and SRF broadleaves appear to achieve lower profitability, there are larger areas suited to these crops and less uncertainty about their suitability to the Scottish climate.
Achievable biomass yields, which significantly influences economic viability, is still subject to some uncertainty as commercial growing and trials in Scotland are limited, particularly for SRF and Miscanthus. The analysis shows a significant difference between high, medium and low costs and income from the three PECs considered. It could be reasonably assumed that this level of uncertainty may lead to farmers and land-managers having low confidence to plant the crops. Forthcoming results of Scottish research trials and developments may improve confidence, for example Miscanthus varieties more suitable to Scotland’s climate are in development (see Appendix H) which could extend the range or improve yields in Scotland.
Equipment needs, and therefore costs and economic potential, vary for the different PECs:
Miscanthus can be harvested by typical harvesting equipment which an arable or mixed farmer would either own, or have easy access to via local contractors; whereas for SRC and SRF the equipment needs are more specialist, so requires significant investment or access to local contractors, which is currently constrained in Scotland.
The PESTLE analysis shows that, of the factors which are likely to prevent farmers and land-managers from currently viewing PECs as an attractive proposition and hinder the uptake across Scotland. The most important, are:
- the low or negative income from the crops,
- upfront investment requirement, and
- uncertain market for the crops.
Stakeholder feedback suggested some approaches which may addressing these issues:
- Financial support for farmers, land-managers and other necessary parts of the sector including to enable adoption of forthcoming innovations aimed at improving yields and cutting costs, such as new harvesting techniques and mobile machinery for processing materials on farms.
- Fixed price and long-term contracts for future crops, at prices higher than production costs. However, given imported biomass and fossil fuels appear to be available at lower cost it is unlikely that end-users will find it feasible to offer attractively priced contracts.
- Greater clarity over the likely environmental impacts in Scottish context – both local impacts such as on biodiversity and wider impacts for example indirect land-use change from competition for food / animal feed crops – and how to design of PEC planting in Scotland to maximise positive environmental benefits.
Locational and temporal issues
In terms of suitable and preferred locations for energy crop production in Scotland, as described in Section 6, the proximity to biomass markets (such as power plants) is a key determining factor. The research has shown that there are suitable growing regions, primarily for SRC and SRF within 50km to 100km of existing biomass plants, or potential sites for BECCS plants close to the proposed east coast feeder pipeline, which are likely to be the dominant market demand in a future, more mature biomass market aligned to the Scottish Governments climate ambition. There is some uncertainty about the economically viable distance to transport energy crops, with stakeholders suggesting it would be significantly less than the typical 100km for sawmill quality wood. The number of viable production areas with 50km of potential sites is lower, but they are most advantageous due to lower transport costs (and GHG emissions).
The study did not explore in detail the potential for on-farm use of biomass, but stakeholder consultation suggested this may be an economically viable alternative, particularly for farms not located close to a suitable biomass plant, and given the context of high energy costs. On farm use of PECs is not a negative emissions technology, as it is not feasible to apply carbon capture to small scale plants, but it would contribute to decarbonising agriculture if it replaced fossil fuel use for power and heating in farm buildings.
Looking ahead, if demand for biomass grows in Scotand, UK and elsewhere as countries expand BECCS capacity the market prices for PECs may change. Input costs can also vary significantly. It is beyond scope of this research to deliver a full analysis of future scenarios for the market, or local market dynamics related to specific BECCS sites, but it is clear from the range of profitability demonstrated in Section 5.1, that a range of scenarios should be planned for.
Interactions between PECs and adjacent land-use and wider landscapes and ecology was shown to be an important location factor to consider. Impacts could be beneficial, such as shading / shelter for livestock and to reduce wind exposure for adjacent crops, or could be negative depending on local landscape features, for example reduced yields in adjacent crops due to shading. Positive potential biodiversity impacts have been suggested by some stakeholders, such as habitat for birds, mammals and beneficial insects if edges between PEC and other land-use is maximised, but there was also concern about negative consequences of land-use change and monoculture PECs on biodiversity. Water management benefits also vary across the crops, and the lifecycle of the crops. The implication of the research is that the effective integration of PECs into natural landscapes and farming systems in Scotland to deliver maximum additional environmental benefits will require careful design in relation to the specific local environmental context.
A key issue for economic viability of PECs is the distribution of costs and income over time. Poor cashflow for farmers and land-managers is typical for PECs, because initial costs of establishment are not recouped until harvest after several years. The time from establishment to first harvest varies so the time where a farmer/ land-manager would likely experience cash flow challenges would also vary. The shortest time to first harvest was for Miscanthus, at around 2-3 years for full harvest with potentially a small harvest in the first year, SRC is typically 3 years for first harvest, and 6 years to first full harvest, and for SRF there is typically around 15 years till first harvest. Sequential planting can help create a more regular income because a portion of the crop would be ready for harvest each year. For SRC/ SRF this can be feasible if the harvesting equipment is already available on the farm, or the yearly harvest would be enough to warrant a visit from a contractor. For Miscanthus, there is an annual harvest once established so sequential planting of a portion of land intended for Miscanthus each year would allow for some of initial income to be used for subsequent planting reducing the size of initial outlay whilst increasing the area allocated to the crop over time.
Income diversification
Stakeholder comments suggest that the current levels of interest from farmers in diversification, including into crops with lower input costs and stable income, could be a significant enabler to the uptake of PECs. However, the economic analysis suggests that this would only be the case, if the core barriers around profitability, cashflow and financial risk were addressed.
Other factors influencing PEC uptake
The research found that farmer and land manager attitudes, habits, skills and perceptions, as well as those of the wider community are likely to be influential, alongside the economics, in determining the degree to which energy crops are adopted in Scotland. Low appetite for financial risk is a key preventative factor, with most farmers looking to reduce their exposure to risk and so only likely to be interested in energy crops if they are perceived as a low risk strategy in their own right, or a beneficial diversification of income as part of a wider business risk reduction strategy. The research suggests that, without clearer evidence of favourable market, price and productivity the current perception of these crops as relatively risky is unlikely to change. Concerns about competition with other crops, sustainability credentials, and public perception of the ‘morality’ of energy crops is also likely to influence farmers and land-manager attitudes. Alongside these factors, it was highlighted during the research that farmers often have a strong preference for their current farming enterprises and so may be reluctant to adopt new crops even if they appear financially advantageous and that a significantly higher financial return may be needed to persuade a shift to energy crops in these circumstances.
State of the evidence base and identification of any key gaps
The key gaps and debates in the literature were described in Section 4, and limitations in economic analysis in Section 5. The research shows a need for more robust evidence on potential yields, production costs and environmental impacts specifically for Scotland.
Quantification of potential wider farm benefits, such as shelter for livestock, and estimation of economic value of these benefits to farmers was not identified through this research, but could help create a fuller picture of the economic potential of energy crops for Scotland.
We found limited research on the risks for crop failure / poor productivity from pest, diseases, extreme weather which hampers full assessment of the financial risk exposure of farmers and land-managers associated with planting PECs.
This study has not included a detailed comparison of PECs for NETs with annual bioenergy crops and other bioenergy technologies, such as anaerobic digestion or smaller scale use of PECs on farms for direct energy generation. The REA and stakeholder feedback indicated potential for farmers to benefit from energy security and reduce energy costs if they were to utilise energy crops for their own energy generation. This study has not modelled the current economics of investment in relevant plant and ongoing cost: benefit of this scenario. This research would be potentially beneficial to understand how local small-scale use compares to larger scale use in NETs, and therefore fully understand the relative economic potential of PECs in Scotland.
The research found debates and discussions about how land should be used to fulfil societies various material needs (food, fuel, fibre etc.) and provide space for biodiversity and deliver other ecosystem services. To inform this debate various additional factors, beyond the scope of this research are relevant including the relative benefits of using land for PECs vs other types of renewable energy such as wind and solar energy. Stakeholders highlighted that solar, for example compares, well and there is growing interest in agrivoltaics – solar voltaic panels within agricultural land that may still retain some of its agricultural use such as livestock grazing.
Conclusions
Perennial energy crops have the potential to generate income for farmers and land-managers in Scotland.
- However, income is likely to be lower than they could earn from other farm enterprises, such as lowland cattle and sheep and ‘mixed agriculture’, that are typical on the types of land which may be suitable.
- The exception is where PEC profitability is compared to ‘general cropping: forage’ farming type (growing crops for animal consumption, usually on lower quality land) this activity typically makes a significant loss, so PECs compared very favourably in the analysis.
- for PECs to be viewed as an attractive, economically viable option by farmers and land managers there is a need for greater confidence that it will deliver good economic returns. The high upfront establishment costs for perennial energy crops and low revenue potential are both likely to hinder uptake.
Profitability of perennial energy crops based on gross margin calculations
If costs and income were spread equally over the lifetime of the crop and compared, PECs are less profitable than current farming enterprises, except for ‘general cropping: forage’ which is not typically making a profit.
- Of the three crops studied, Miscanthus showed the highest average gross margin at £382 per hectare per year but there are some potentially limiting factors:
- uncertainty about achievable yields in the Scottish climate and on the grades of land above category 4.1 in the Land Capability for Agriculture in Scotland. If yields were lower, then profit may be lower.
- Limited theoretical growing area in Scotland – much lower than for SRF or SRC based on analysis of land quality and characteristics and Scotland’s climate.
- SRF and SRC showed lower profitability for farmers: £80 and £87 per hectare per year over their lifetime respectively for SRF: broadleaved and SRC, making them less attractive but there is more suitable land for growing these. SRF conifer would see a negative gross margin i.e., the production costs outweigh the value of the crop sold.
Potential opportunities
- The research also identified some potential positive attributes of PECs which might encourage uptake – PECs could help diversify a business, creating additional income, without adding significant additional labour requirements or ongoing input costs – minimal management time and inputs are required once crops are established.
Potential barriers
- Cash flow could pose a problem – the distribution of costs and income year-on-year for PECs is significantly different to typical farming activities which have an annual profit cycle. PECs need investment in site preparation and planting upfront, but income only arrives after first harvest several years later (2-3 years Miscanthus, 6 for SRC, 15 for SRF) and then only periodically after that.
- Coupled with uncertainty about market demand and achievable crop sale prices, the need for upfront investment to establish PEC production, means farmers and land managers may view them as a risky proposition and be reluctant to grow them.
- We identified other potential barriers to uptake, including farmer and land-manager unfamiliarity with PEC production, low appetite for risk, need for new skills, access to equipment and services, and concerns about community perception of land-use change and impacts on other agricultural production, e.g. available animal feed.
Enhancing economic potential and production of PECs
Potential approaches to improve economic potential in Scotland include:
- financial incentives, such as government specific subsidies under future agricultural support,
- risk reduction strategies such as secure, attractively-priced contracts with end markets, alongside expansion of the market.
- Innovations to allow processing at the farm and to improve transportability of crops could also help to increase the economically viable travel distance.
Implications for wider Scottish economy:
- Previous research suggests 38000 could be feasibly planted by 2032 (scenario one) and 90,000 by 2045 (scenario two).
- We found that, if land to match this level of demand, was utilised for perennial energy crops (using the scenarios as defined in section 5.2), it would create a gain in gross margin of around £9.6 million (scenario 1) or a loss of around £9.5 million (scenario two) across the regions.
Economically viable production locations:
Economically viable production locations for PECs are influenced by multiple factors including proximity to markets (current biomass energy plants and potential future BECCS plants) and local enough access to services and facilities for crop management (e.g. harvesting contractors) to avoid excessive costs.
- We identified suitable growing regions (some SRC/Miscanthus and most for SRF) within an economically viable transport distance to existing biomass plants and potential sites for BECCS near the proposed east coast carbon capture and storage feeder pipeline (assumed 50-100 km).
- As SRF is economically uncompetitive against current land-use, this suggests economic viability may be a barrier to PEC production increases even if suitable land is available.
Potential further steps
Key debates and areas for further research include:
- Considering more in-depth ‘whole farm’ economic analysis. This study focused on gross margin comparison, which is useful for comparing specific crops and farm enterprises, but has limitations in terms of how well it allows assessment of integration of energy crops into a whole farm business. This will vary farm to farm but could be explored through farm case studies. This could include considering a wider range of costs for farmers and that after initial set up the PECs would require less workload.
- Comparing, the economic and environmental potential of using land for energy crops with utilising the same land for other renewable energy options (for example using the land for solar panels alongside grazing) and
- Potential role for on-farm use of perennial energy crops.
- Considering future biomass markets, including how future Greenhouse Gas Removal (GGR) schemes, global demand and demand from biotechnology sector may impact it.
- Identifying how to make domestic biomass from energy crops a more attractive option than imports and a more profitable use of land, and on what basis this can be justified. For example, taking account of full LCA and rewarding greatest emission saving.
- Considering in more detail the role of PECs in the context of how the agriculture sector is changing and how it may have to change to reduce GHG emissions.
- Considering the value, including the financial value, of other benefits of energy crops, such as flood mitigation or animal shelter, relative to existing or potential alternative land-uses.
- Exploring how PECs support/interact with tier 2 or 3 objectives of the ARP.
- Considering the impact of subsidies.
References
Alexander, P., D. Moran, et al. (2014). “Estimating UK perennial energy crop supply using farm-scale models with spatially disaggregated data.” Global Change Biology Bioenergy 6(2): 142-155.
Alexander, P., Moran, D., Rounsevell, M.D., Hillier, J. and Smith, P., 2014. Cost and potential of carbon abatement from the UK perennial energy crop market. GCB Bioenergy, 6(2), pp.156-168.
Alexander, P., Moran, D. and Rounsevell, M.D., 2015. Evaluating potential policies for the UK perennial energy crop market to achieve carbon abatement and deliver a source of low carbon electricity. Biomass and Bioenergy, 82, pp.3-12.
Anejionu, O.C. and Woods, J., 2019. Preliminary farm-level estimation of 20-year impact of introduction of energy crops in conventional farms in the UK. Renewable and Sustainable Energy Reviews, 116, p.109407.
Berkley, N. A. J., Hanley, M. E., Boden, R., Owen, R. S., Holmes, J. H., Critchley, R. D., … Parmesan, C. (2018). Influence of bioenergy crops on pollinator activity varies with crop type and distance. GCB Bioenergy, 10(12), 960–971. https://doi.org/10.1111/gcbb.12565
Bocquého, G., 2017. Effects of liquidity constraints, risk and related time effects on the adoption of perennial energy crops. Handbook of Bioenergy Economics and Policy: Volume II: Modeling Land Use and Greenhouse Gas Implications, pp.373-399.
Bourke, D., Stanley, D., O’Rourke, E., Thompson, R., Carnus, T., Dauber, J., … Stout, J. (2014). Response of farmland biodiversity to the introduction of bioenergy crops: effects of local factors and surrounding landscape context. GCB Bioenergy, 6(3), 275–289. https://doi.org/10.1111/gcbb.12089
Brown, C., Bakam, I., Smith, P. and Matthews, R., 2016. An agent‐based modelling approach to evaluate factors influencing bioenergy crop adoption in north‐east Scotland. Global Change Biology Bioenergy, 8(1), pp.226-244.
Busch, G., 2017. A spatial explicit scenario method to support participative regional land-use decisions regarding economic and ecological options of short rotation coppice (SRC) for renewable energy production on arable land: case study application for the Göttingen district, Germany. Energy, Sustainability and Society, 7, pp.1-23.
Dandy, N., 2010. Stakeholder Perceptions of Short-rotation Forestry for energy.
Davies, I., 2020. Miscanthus: Can it tackle climate change and turn a profit? Farmers Weekly. 18 March 2020. [Date accessed 9 August 2023].
Dogbe, W. and Revoredo-Giha, C., 2022 Current and Potential Market Opportunities for Hempseed and Fibre in Scotland.Donnison, I. S. and M. D. Fraser (2016). “Diversification and use of bioenergy to maintain future grasslands.” Food and Energy Security 5(2): 67-75.
Glithero, N.J., Wilson, P. and Ramsden, S.J., 2013. Prospects for arable farm uptake of Short Rotation Coppice willow and Miscanthus in England. Applied energy, 107, pp.209-218.
Griffiths, N.A., Rau, B.M., Vaché, K.B., Starr, G., Bitew, M.M., Aubrey, D.P., Martin, J.A., Benton, E. and Jackson, C.R., 2019. Environmental effects of short‐rotation woody crops for bioenergy: What is and isn’t known. GCB Bioenergy, 11(4), pp.554-572.
Hastings, A., Mos, M., Yesufu, J.A., McCalmont, J., Schwarz, K., Shafei, R., Ashman, C., Nunn, C., Schuele, H., Cosentino, S. and Scalici, G., 2017. Economic and environmental assessment of seed and rhizome propagated Miscanthus in the UK. Frontiers in Plant Science, 8, p.1058.
Haszeldine, R., Cavanagh, A., Scott, V., Sohi, S., & Masek, O. (2019). Greenhouse Gas Removal Technologies – approaches and implementation pathways in Scotland. University of Edinburgh & Heriot Watt University 2019 on behalf of ClimateXChange. https://www.climatexchange.org.uk/media/3749/greenhouse-gas-removal-technologies.pdf
Holland, R. A., Eigenbrod, F., Muggeridge, A., Brown, G., Clarke, D., & Taylor, G. (2015). A synthesis of the ecosystem services impact of second generation bioenergy crop production. Renewable and Sustainable Energy Reviews, 46, 30-40.
Hudiburg, T.W., Davis, S.C., Parton, W. and Delucia, E.H., 2015. Bioenergy crop greenhouse gas mitigation potential under a range of management practices. Gcb Bioenergy, 7(2), pp.366-374
Kralik, T., Vavrova, K., Knapek, J. and Weger, J., 2022. Agroforestry systems as new strategy for bioenergy—Case example of Czech Republic. Energy Reports, 8, pp.519-525.
Leslie, Andrew, Mencuccini, Maurizio, Perks, Mike and Wilson, Edward (2019) A
review of the suitability of eucalypts for short rotation forestry for energy in the
UK. New Forests, 51 (1). pp. 1-19.
Liu, C.L.C., Kuchma, O. and Krutovsky, K.V., 2018. Mixed-species versus monocultures in plantation forestry: Development, benefits, ecosystem services and perspectives for the future. Global Ecology and conservation, 15, p.e00419
Low Carbon Contracts Company, 2022. Fuel Measurement and Sampling (FMS) Guidance. Available at https://lcc-web-production-eu-west-2-files20230703161747904200000001.s3.amazonaws.com/documents/FMS_Guidance_-_Version_2_February_2022.pdf
Martin, G., Ingvorsen, L., Willcocks, J., Wiltshire, J., Bates, J., Jenkins, B., Priestley, T., McKay, H. and Croxten, S., 2020. Evidence review: Perennial energy crops and their potential in Scotland.
McCalmont, J.P., Hastings, A., McNamara, N.P., Richter, G.M., Robson, P., Donnison, I.S. and Clifton‐Brown, J., 2017. Environmental costs and benefits of growing Miscanthus for bioenergy in the UK. Gcb Bioenergy, 9(3), pp.489-507.
Meek, D. Jenevezian, A. , Leishman, R., Odeh, N., and Bates, J. Ricardo Energy & Environment, 2022, Comparing Scottish bioenergy Supply and Demand in the context of Net-Zero targets.
Mola-Yudego, B., I. Dimitriou, et al. (2014). “A conceptual framework for the introduction of energy crops.” Renewable Energy 72: 29-38.
Morris, J. and Day, G., 2023. The Potential of Agroforestry for Bioenergy in the UK.
Ofgem, 2018. Renewables Obligation: Sustainability Criteria. Available at https://www.ofgem.gov.uk/sites/default/files/docs/2018/04/ro_sustainability_criteria.pdf
Ofgem, 2021. Sustainability Self-Reporting Guidance. Available at https://www.ofgem.gov.uk/sites/default/files/docs/2021/04/sustainability_self-reporting_guidance_final_2021.pdf
Olba-Zięty, E., Stolarski, M.J. and Krzyżaniak, M., 2021. Economic evaluation of the production of perennial crops for energy purposes—A review. Energies, 14(21), p.7147.
Ostwald, M., Jonsson, A., Wibeck, V. and Asplund, T., 2013. Mapping energy crop cultivation and identifying motivational factors among Swedish farmers. Biomass and Bioenergy, 50, pp.25-34.
Parratt, M. 2017, Short Rotation Forestry Trials in Scotland 2017 Report, Forest Research
Perrin, A., Wohlfahrt, J., Morandi, F., Østergård, H., Flatberg, T., De La Rua, C., Bjørkvoll, T. and Gabrielle, B., 2017. Integrated design and sustainable assessment of innovative biomass supply chains: A case-study on Miscanthus in France. Applied Energy, 204, pp.66-77.
Petrenko, C. and Searle, S., 2016. Assessing the profitability of growing dedicated energy versus food crops in four European countries. Proceedings of the Working paper, 14.
Ranacher, L., Pollakova, B., Schwarzbauer, P., Liebal, S., Weber, N. and Hesser, F., 2021. Farmers’ Willingness to Adopt Short Rotation Plantations on Marginal Lands: Qualitative Study About Incentives and Barriers in Slovakia. BioEnergy Research, 14, pp.357-373.
Scottish Government, 2021, Scotland’s Third Land-use Strategy 2021-2026
Schiberna, E., Borovics, A. and Benke, A., 2021. Economic modelling of poplar short rotation coppice plantations in Hungary. Forests, 12(5), p.623.
Shepherd, A., Clifton‐Brown, J., Kam, J., Buckby, S. and Hastings, A., 2020. Commercial experience with Miscanthus crops: Establishment, yields and environmental observations. GCB Bioenergy, 12(7), pp.510-523.
Shepherd, A., Littleton, E., Clifton‐Brown, J., Martin, M. and Hastings, A., 2020a. Projections of global and UK bioenergy potential from Miscanthus× giganteus—Feedstock yield, carbon cycling and electricity generation in the 21st century. GCB Bioenergy, 12(4), pp.287-305.
Spackman, P., 2012. Energy crops need support to fulfill potential. Farmers Weekly. 8 June 2012. [Date accessed 9 August 2023].
Thornley, P., 2006. Increasing biomass based power generation in the UK. Energy Policy, 34(15), pp.2087-2099.
Tullus, H., Tullus, A. and Rytter, L., 2013. Short-rotation forestry for supplying biomass for energy production. Forest bioenergy production: management, carbon sequestration and adaptation, pp.39-56.
Vanbeverena, S., & Ceulemansa, R. (2019). Biodiversity in short-rotation coppice. Renewable and Sustainable Energy Reviews, 111, 34-43.
Walle, I.V., Van Camp, N., Van de Casteele, L., Verheyen, K. and Lemeur, R., 2007. Short-rotation forestry of birch, maple, poplar and willow in Flanders (Belgium) I—Biomass production after 4 years of tree growth. Biomass and bioenergy, 31(5), pp.267-275.
Warren, C. R., 2014. “Scales of disconnection: mismatches shaping the geographies of emerging energy landscapes.” Moravian Geographical Reports 22(2): 7-14.
Warren, C.R., Burton, R., Buchanan, O. and Birnie, R.V., 2016. Limited adoption of short rotation coppice: The role of farmers’ socio-cultural identity in influencing practice. Journal of Rural Studies, 45, pp.175-183.
Whittaker, C., Hunt, J., Misselbrook, T. and Shield, I., 2016. How well does Miscanthus ensile for use in an anaerobic digestion plant? Biomass and Bioenergy, 88, pp.24-34.
Witzel, C.P. and Finger, R., 2016. Economic evaluation of Miscanthus production–A review. Renewable and Sustainable Energy Reviews, 53, pp.681-696.
Winkler, B., Mangold, A., von Cossel, M., Clifton-Brown, J., Pogrzeba, M., Lewandowski, I., Iqbal, Y. and Kiesel, A., 2020. Implementing Miscanthus into farming systems: A review of agronomic practices, capital and labour demand. Renewable and Sustainable Energy Reviews, 132, p.110053.
Zhang, B., Hastings, A., Clifton‐Brown, J.C., Jiang, D. and Faaij, A.P., 2020. Spatiotemporal assessment of farm‐gate production costs and economic potential of Miscanthus× giganteus, Panicum virgatum L., and Jatropha grown on marginal land in China. GCB Bioenergy, 12(5), pp.310-327.
Zimmermann, J., Styles, D., Hastings, A., Dauber, J. and Jones, M.B., 2014. Assessing the impact of within crop heterogeneity (‘patchiness’) in young Miscanthus× giganteus fields on economic feasibility and soil carbon sequestration. Gcb Bioenergy, 6(5), pp.566-576.
Appendix A: Policy Context for Energy Crops in Scotland
Climate Change Policy
The Update to the Climate Change Plan (CCPu)[27], published by the Scottish Government in December 2020, whilst focused on reducing emissions, identifies the need to also remove carbon dioxide from the atmosphere to compensate for residual emissions. It foresees a role for technologies to achieve a net reduction in emissions – often referred to as Negative Emissions technologies (NETs). It identifies several NETs pathways with potential in Scotland, including bioenergy with carbon capture and storage (BECCS). Climate Committee’s (CCC) 6th Carbon Budget sets out that achieving the required scale of BECCS will necessitate a significant increase in the domestic production of biomass feedstocks[28].
The CCC’s 2022 review of Scotland’s progress[29] highlighted that Scotland’s planned deployment of NETs was ambitious, comprising two thirds of UK government overall ambition for 2030, but also notes the advantage of Scotland’s large land area and potential to draw on substantial biomass stocks. It recommends consideration of the impacts and interactions that increased domestic biomass production could have on land use and agriculture. The Scottish Government has acknowledged that these targets can’t be met – the NETs feasibility study gives more realistic targets[30]. Failure to meet NETs targets for Scotland implies deeper emissions reductions in harder-to-decarbonise sectors, such as aviation and agriculture, and so it is critical to consider how farmers and land-managers can deliver the necessary biomass feedstocks. The CCPu includes a proposal to develop rural support policy to enable, encourage planting of biomass crops within broader measures on sustainable, low carbon farming[31]. The CCC recommends maintenance and enhancement of support for agroforestry[32], and a target of 5% trees on farmland by 2035.
Agricultural policy
Scottish Government’s Vision for Agriculture recognises the essential role agriculture has in delivering sustainable food production, climate adaptation and mitigation, biodiversity recovery and nature restoration and proposes that future subsidy support for agriculture will be split across unconditional support and support targeted to environmental outcomes, including low carbon farming and biodiversity The new Scottish Agriculture Bill as introduced to parliament on 28th September 2023 provides a replacement for the Common Agricultural Policy (CAP) and has been drafted to provide the required powers and framework to deliver the Vision for Agriculture. The bill would require Scottish Ministers to prepare a five-year Rural Support Plan for farming, forestry, and rural development. The Agricultural Reform Route Map (ruralpayments.org) sets out the milestones and timescales for change. The Agriculture Bill and Rural Support Plan will have implications for how economically viable it may be in future for farmers and land-managers to grow energy crops. Whilst the details are yet to be confirmed, it is clear that any expansion of perennial energy crops will need to take these policy developments into account.
Other key policies:
Principles of ‘just transition’ are defined in legislation[33] and Scotland’s draft ‘Energy Strategy and Just Transition Plan’[34] was published in January 2023. It describes Scotland’s aim to use bioenergy where it can best support Scotland’s Net Zero Journey, and aligns with and supports Scotland’s goals for protecting and restoring nature. It contains a commitment to review the potential to scale up domestic biomass supply chains. Bioenergy crops, if economically viable, could offer the agricultural sector a new income stream and support the rural economy, which would be consistent with the draft plan. The draft plan also includes a proposal to develop a strategic framework for the most appropriate use of finite bio-resources (published in a Bioenergy Action Plan), acknowledging the potential for competing demands on land and natural resources. CCPu also acknowledges the need for open a discussion on optimum land uses beyond just farming and food production to multi-faceted land use including forestry, peatland restoration and management and biomass production.
UK biomass policy context
The UK Government’s Department for Energy Security and Net Zero (DESNZ) published a Biomass Strategy in August 2023 which set out the Government’s view that well-regulated BECCS can deliver negative emissions and ensure positive outcomes for people, the environment, and the climate. It commits the UK Government to strengthen sustainability criteria and verification processes for biomass, acknowledging challenges with international supply chains, and creating a cross-sector sustainability framework for biomass (subject to consultation). The focus will be on addressing greenhouse gas emissions, indirect land-use change, and potentially soil carbon changes. The strategy anticipates a key role for both domestic and imported biomass use across the economy, on a limited timescale. It also sets out how the government is actively developing demand side policies to support emerging technologies such as BECCS and Greenhouse Gas Reduction (GGR) business models, for example the potential for a ‘Contracts for Difference’ (CfD)[35] approach. The strategy acknowledges that bioenergy policy involves a mix of reserved and non-reserved powers, and so as the Scottish Government develops its draft Bioenergy Policy Statement, Scotland has an opportunity to build on UK policies and develop policies appropriate for Scotland.
Appendix B: Introduction to Perennial Energy Crops
Introduction to Miscanthus
Miscanthus is a tall perennial grass with woody canes like bamboo, of East Asian Origin. The most common variety of Miscanthus grown is the sterile hybrid Miscanthus x giganteus (M. giganteus). Miscanthus is a renewable source of fibre which has a wide potential range of uses as biomass or fibre. Whilst Miscanthus can be grown in parts of Scotland, it is not currently grown at commercial scale and further trials are required to verify its potential future contribution (Meek et al., 2022). Nonetheless, Martin, et al 2020 found 51,800ha of land is theoretically suitable in Scotland to grow Miscanthus which could produce 2.59TWh/yr and 0.52Modt/yr.
To grow, the crop must be established by planting pieces of rhizome (underground plant stem capable of producing the shoot and root systems) which have been collected from fields where Miscanthus is already established[36]. Prior to planting, site preparation may typically involve breaking up compacted soil, removing weeds (using herbicides), ploughing to 30cm depth, then further levelling and soil cultivation to create a fine level soil to around 15cm[37]. Equipment which is typically available on an arable farm can be used for this site preparation and planting. Planting using specialist equipment achieves best results, but a potato planter could alternatively be used[38]. Biodegradable plastic film to prevent frost damage and retain moisture and fencing to prevent rabbits damage can improve success of crop establishment. Once planted, some gap filling might be needed (done manually) and chemical weed control in the first year or so. Fertilisers are not usually needed. After the first year the material is cut back and left in the field. In year 2, depending on the growth rate, there will be a small harvest, or another cut back. Once established a Miscanthus crop is harvested annually, usually in early spring when moisture content is lower, and can be productive for around 15 years. The material is baled, or sometime chipped, to enable easier transport and storage. Sometimes drying is required in storage (natural or mechanical ventilation). At the end of the crop lifetime, to revert the land to other uses, a herbicide is often used to kill Miscanthus shoots and rhizome, followed by ploughing.
Introduction to short rotation coppice[39]
Short Rotation Coppice (SRC) commonly consists of high-yielding varieties of either poplar or willow, densely planted on a piece of land. The solid, woody biomass provides a source of biofuel that is either used alone or combined with other fuels to power district heating systems and electric power generation stations[40],[41]. It was noted previously by Martin et al. (2020), that the production of energy crops in Scotland has in the past been limited, with only SRC currently grown at small commercial scale (250ha). There is greater potential for further SRC cultivation in Scotland provided that suitable land area is available.
Most types of land, except for heavy clay soils and water-logged land, are suitable for SRC. The initial steps to establishment include removing weeds using herbicide, ploughing to 30cm and further cultivation to 15cm. Rods or cuttings are planted with a specialist planter. Gap filling and protection using rabbit or deer fencing may also be needed. During the first year weed control using herbicides and control of plant diseases using pesticides may be needed. Once established, SRC plantations are typically harvested at 3-year intervals using a forage harvester with a specific cutting system, then chipped and stored outside on a concrete base or in the field. Plantations typically remain productive for 15-25 years[42]. After this, a new planting can be established, or the field reverted through a process that involves stump grinding and the application of herbicides to prevent regrowth.
Introduction to short rotation forestry
Short rotation forestry (SRF) involves planting relatively fast-growing tree species and harvesting them for biomass after around 15-20 years, which is much quicker than conventional forestry. Species can be coniferous (e.g., Sitka spruce, Douglas fir) or broadleaved (e.g., aspen, poplar, silver birch, downy birch, sycamore). SRF is not currently operated commercially in Scotland although there are some trial plots. Nonetheless 912,600 ha of suitable land is theoretically currently suitable for planting of SRF in Scotland (Martin et al., 2020). Limited, recent literature material and evidence was found in the REA relating to the economic potential of SRF in and around the UK.
Process steps are like conventional forestry: the plantation is grown from seedlings or cuttings, or sometimes direct seeding, into land prepared through steps such as drainage, ploughing, and fencing. Some weed control or replacement planting may be needed initially, but after this limited maintenance is required. All the trees in a growing area are harvested at the same time using specialist cutting equipment, then either cut into lengths and stacked to air dry ready for collection or chipped on site. With SRC the shorter rotation, and the higher planting density, reduces the potential for co-production of logs for sawmill timber[43]. After harvest the site can be cleared, using machinery and herbicides as per SRC and then replanted or reverted to other land-use. Alternatively new stems can be allowed to regrow for coppicing, or a single good stem selected to continue growing for harvest after 15-20 years. Broadleaved varieties tend to produce higher wood density which is advantageous for use as bioenergy.
Appendix C: Methodology to Rapid Evidence Review
- The Rapid Evidence Assessment (REA) methodology used for this project aligns with NERC methodology[44] and comprised of the following steps.
- Define the search strategy protocol, identify key search words or terms, define inclusion/exclusion criteria. A list of key words, terms and search strings was created and reviewed by Ricardo’s bioenergy and agriculture technical experts and the project steering group to direct the REA review to the most relevant sources. This list was and divided into six relevant categories ‘Energy Crops’; ‘Economic potential’; ‘Farm business and agronomic considerations’; ‘Preferred/feasible locations’; ‘Agricultural & land-use options’; ‘Other considerations e.g., just transition, decarbonisation’ to ensure that all appropriate aspects of the economic potential of energy crops were identified which supported the focus the review. Any literature that is considered out of scope based on our list of assumptions was excluded from the search. We also excluded literature that is older than 10 years, unless it was from a credible source and was the only piece of evidence available (particularly for data).
- Searching for evidence and recording findings. Literature was searched using Google Scholar and Science Direct, utilising our accounts with Science Direct and Research Gate to access restricted pdfs where required. Grey literature, such as farming press and industry reports were used to provide examples and case studies of the economic potential of energy crops. In addition to the search engines, two existing evidence reviews, prepared by Ricardo were used to sources relevant literature: ‘Evidence review: Perennial energy crops and their potential in Scotland’ and ‘Evidence review: Increasing Sustainable Bioenergy Feedstocks Feasibility Study’. Academic paper ‘Greenhouse Gas Removal Technologies –approaches and implementation pathways in Scotland’ (Haszeldine et al, 2019) was also provided to us to supplement our evidence base. For each individual search a unique search reference was assigned, the date, search string used, total number of results found, and the total number of relevant papers found were recorded. Our search strings can be found in the table below.
TableA‑2: Search strings used for REA
|
“Perennial energy crops” “Scotland” |
|
economic potential bioenergy crops Scotland |
|
“Perennial energy crops” “farm level” “Scotland” |
|
“Short rotation coppice” “economic potential” “Scotland” |
|
Miscanthus energy crop Scotland |
|
“Miscanthus” “economic potential” “UK” |
|
economic potential “short rotation forestry” Scotland |
|
economic impact short rotation coppice Scotland |
|
profitability short rotation coppice UK |
|
profitability short rotation forestry UK |
|
farmers weekly economic potential of perennial energy crops |
|
“short rotation forestry” “UK” “profit” |
|
revenue + perennial energy crops Scotland |
|
Short Rotation Forestry Trials in Scotland Forest Research |
|
short rotation forestry for energy “willow” “poplar” “economics” |
|
perennial energy crops “operating costs” “UK” |
|
hemp energy crop economics Scotland |
All results were recorded in an excel spreadsheet with information extracted on the following:
- Country
- Type of energy crop (SRC, SFC or Miscanthus)
- Additional information on crop type
- Scale of deployment
- Positive economic potential
- Negative economic potential
- Issues/barriers of deployment (non-economic uptake considerations)
- Temporal considerations (e.g., agronomic/climatic conditions)
- Further economic potential (e.g., decarbonisation of agricultural practices and creation of new jobs)
A RAG (red, amber, green) rating was assigned to each source, based on the g criteria:
|
Description |
Rating |
|
Quality | |
|
Peer reviewed journal, sound data sources and methodology |
Green |
|
Government funded research reports, sound data sources and methodology |
Green |
|
Research funded by NGOs (e.g., AHDB), sound data sources and methodology |
Amber |
|
Work is unreliable because of unreliable data sources, or limited sources, or because the method is not robust |
Red |
|
Information from websites, blogs etc., of unknown quality |
Red |
|
Relevance | |
|
Timeframe: within last 10 years |
Green |
|
Timeframe: within last 20 years |
Amber |
|
Timeframe: older than 20 years |
Red |
- Screening. Sources of evidence was then screened initially by title and then accepted papers were then screened again using the summary or abstract. Literature was screened for information on the following inclusion criteria:
- SRC, SRF, Miscanthus (and hemp / alternatives if strong evidence to show economic viability)
- Economic potential (positive and negative) of energy crops – qualitative and quantitative information
- How farmers / land-managers are making decisions about which enterprises and land-uses to adopt and research which provides evidence of likely preferences and decision-making influences.
- Agronomic or other considerations which would influence viability / adoption by farmers / land-managers.
- Extract and appraise the evidence. The screening provided an organised list of papers which enabled evidence to be extracted directly from the literature into the report. Literature extracted also guided the internal workshop and supported information included in the SWOT and PESTLE tables.
Appendix D Evidence of positive economic potential
We found some evidence in literature that PECs can be profitable for farmers and land managers, but limited studies directly applicable to Scotland and to the current economic climate. The price of fuels and other agricultural inputs have been subject to significant rises and fluctuations since most studies were undertaken and studies were mostly in locations with different growing conditions to Scotland. Economic performance of biomass production is influenced by production costs, crop yields, crop price and end-use/market opportunities (Olba-Zięty et al., 2021).
Several studies comparing energy crops reported a high return per hectare for miscanthus, (Martin et al., 2020, Zhang et al, 2020). One reason for this is that miscanthus can produce high outputs from low inputs which is economically significant for farmers (Donnison and Fraser 2016), particularly in the current context of high agricultural input costs. Miscanthus is attractive as it requires few farm operations, has low labour needs, crop management is straightforward and existing farming machinery and skills can be utilised in its production (Shepherd et al., 2020a and Glithero et al 2013) thus improving its economic potential in comparison to annual crops (such as cereals) used for energy. Growers invest in miscanthus due to this low maintenance cost along with the low requirement for field operations (Shepherd et al., 2020). However, Mola-Yudego et al., (2014) in a Swedish study found SRC willow had the lowest production costs overall, compared with other energy crops (miscanthus, reed canary grass and triticale). The production costs, and therefore profit, will vary depending on equipment available on farm (Ostwald et al,2013a).
The tree species chosen for SRF influences plantation establishment costs and therefore enterprise profitability – costs vary between species: Hybrid Aspen requires a costly micro-propagation technique, and so is more costly to establish than Poplar (Tullus et al., 2013). The literature did not provide detailed information on how well-suited different species are to the Scottish climate and the expected yields of biomass in Scotland. Initial indications from trials currently underway in Scotland (Parratt, M, 2017) suggest Hybrid Apsen appears to have most potential, with common alder, silver birch and Sitka spruce having potential at some sites, but full assessment of biomass is not complete and economics are not assessed.
A farming press example of a grower for Terravesta, the major purchaser of Miscanthus in England (Davies, in Farmers Weekly, 2020), reported that for Miscanthus, an average net profit of £530.85/ha over a 15-year period based on a mature yield of 14/t/ha was achievable. Stakeholders interviewed for this study indicated that Miscanthus is still economically viable under this growing model in England, despite current economic conditions, but questioned whether this yield, which would be a key determinant of profit, is feasible in Scottish growing conditions.
Evidence for negative economic impacts
The most prominent evidence of negative economic impacts in the literature was the high upfront cost to establish PECs, lack of established markets, and the uncertainty over the stability of the long-term market (Martin et al., 2020 and Witzel and Finger 2016). Profitability and economic considerations for farmers are dominated by these costs, market dynamics and biomass yield (Zimmermann et al., 2014).
High establishment costs and uncertainties about the market, mean that farmers may perceive PECs as financially risky and are discouraged from growing them (Witzel and Finger 2016, Zimmermann et al., 2014, Hastings et al., 2017). Previous farm-scale modelling was conducted to improve the understanding of the potential economic PEC supply across the UK. The results concluded that without increases in market prices, SRC willow would likely only provide a small proportion of the UK’s PEC target (Alexander et al., 2014). Similar studies were not found for SRF and Miscanthus, and the economics will have changed since this study making it difficult to understand from the literature if this is still the case but it is clear market access and price is a key issue.
In relation to Scotland specifically, the research found that high initial capital investment and a delayed period of revenue are major factors that negatively influence economic potential of PECs. Farmers receive no income from crop sales in the first years after establishment of PECs leading to poor cash flow, which can be an obstacle preventing farmer uptake (Bocquého, 2017). This period before first crop sales varies: typically 2-3 years for miscanthus production (Martin et al. (2020), around 4 years for SRC (Warren, 2016), and 10-20 years for SRF (Martin et al., 2020, Tullus et al., 2013), meaning a farmer may be waiting several years before the crop breaks even, for example miscanthus typically breaks even after between 4 and 11 years (Martin et al 2020).
Economic potential of PECs, in comparison to other crops
The literature review did not provide clear evidence of how the three key PECs being studied here compare economically to other crops, annual crops and agricultural land-uses – some studies showed favourable comparison and others did not. Key studies are highlighted below, but limited insights can be gained on this question from the literature given the recent economic changes affecting agricultural costs and market prices. See Section 5 for a comparative analysis reflecting current economic situation. Petrenko and Searle (2016) found the profitability of miscanthus and SRC to be competitive, with oats in the south of England, and with oats and rye in Southern Germany and, but could not compete with wheat in Europe generally or typical arable rotations in France (Glithero et al., 2013). Lower input costs may mean that PECs are more competitive now, than arable crops which typically require high levels of expensive inputs (such as fuel, pesticides and fertiliser), but literature does not confirm this. Glithero et al (2013) showed miscanthus to have lower biomass production costs (calculated as cost per gigajoule of energy) in comparison to straw-based crops in England. Busch (2017), in Germany, found SRC to be financially superior when compared to three different crop rotation systems consisting of oilseed rape, wheat, barley, and maize crops, concluding that SRC can compete against annual crops provided proper site selection and a suitable market (in this case, wood chip production). Mola-Yudego et al., (2014) highlight research in Northern Ireland which showed similar gross margin to grain production, assuming average yields in both cases.
We did not find research which compared energy crop economics with livestock farming systems economics.
Influences on farmer and land-manager decisions on planting PECs
One of the main factors affecting the uptake of PEC is economic profitability (Olba-Zięty,2021). Appetite for and perception of financial risk, skills, attitudes and access to markets can also influence farmer and land-manager decisions about planting PECs. Evidence from the literature, and our research interviews with stakeholders suggests that even where PECs, or energy crops in general, can deliver positive economic results for farmers and land managers, this on its own is not always sufficient to convince them to start growing PECs. A choice-experiment study in Sweden, found that lower production costs can enable farmers to achieve higher profit from energy crops, in comparison the traditional crops, but that further compensation of up to 215 Euro per hectare would be needed to persuade a farmer to switch to SRC (Ostwald et al,2013a).
A study by Warren (2014) on farmers’ attitudes to PECs in south-west Scotland found that farmers perceived growing SRC to be ‘financially risky’. SRC production was associated with uncertain returns on harvested wood as prices can be volatile. A lack of access to local markets was also highlighted as a potential barrier to current market adoption by producers (Alexander et al., 2014).
Other economic features of PEC production which influence economic potential for farmers and land-managers in Scotland
Producing PECs has specific economic implications for growers which influence their economic potential and attractiveness. These include challenges: lack of flexibility of land-use, reduced market responsiveness; and opportunities for diversification alongside current farming enterprises.
Unlike with annual arable crops, miscanthus producers can’t maximise profitability by changing crop each year to react to market prices (Hastings et al. (2017). The implication of this, which was highlighted during stakeholder interviews, is that to view PECs as economically worthwhile, farmers need confidence that they can achieve an acceptable and secure market price into the future. Long term production contracts between private biomass processors/plants and farmers are an important consideration in managing financial risk for producers (Bocquého, 2017). Stakeholders highlighted that joined up contracts including harvesting and haulage services, currently being used for some crops, can also help reduce risk and simplify the economics for producers.
The literature review suggested that the way PECs are deployed on farms influences their economic potential. Integration of PECs alongside other enterprises and on land which is not performing well could be advantageous. Glithero et al., (2013) reported that when integrated as a diversification enterprise on-farm miscanthus can be highly competitive. Less productive land, for example poor agricultural land with insufficient returns for food crop, is suitable for miscanthus (Shepherd et al., 2020a), which implies it could provide an economic benefit if deployed on this type of land within a farm.
Brown et al., (2016) report that introducing SRC into traditional cropping systems allows producers to diversify their farming operation, which in turn enhances income, improves income security and reduces risk. Alexander and Moran., 2013, similarly found a portfolio of crops including conventional crops, alongside Miscanthus has been found to achieve a more stable income for farmers, and furthermore conclude that, as farms typically operate in a risk-averse manner, reduced risk is an important factor in farmer decision-making for PECs.
The economic potential of SRC is largely dependent on the establishment of strong markets and demand driven by power companies (Brown, 2016). In the UK, it is generally found that further development of energy cropping only occurs once a plant has been built and several farmers adopt SRC practices to supply crops for that plant (Alexander et al., 2015).
Opportunities to improve economic potential of PECs in Scotland
Cultivation techniques, crop variety choice and other technological developments can influence economic potential of PECs in Scotland and have potential to improve profitability for farmers and land managers in future. For example, the use of plastic mulch film to reduce establishment time can improve crop economics (Hastings et al. 2017). Introduction of new and seed propagated hybrids of Miscanthus alongside agronomic developments have been projected to significantly reduce the cost of Miscanthus production. Mobile briquetting of Miscanthus can also increase the economic potential of Miscanthus (Perrin et al., 2017). Through the Biomass Innovation Fund, £32 million of research funding was awarded to innovation projects across the UK to deliver ‘commercially viable innovations in biomass production. Several innovations have potential to improve yields and reduce production costs for Miscanthus in Scotland, including efficient and mobile harvesting equipment and development of new cultivars more suited to colder climates (see Appendix F).
The literature review and stakeholder interviews both highlighted some factors which can negatively affect the economics of PEC production, which if addressed are potential opportunities to improve economic performance. Gaps in the crop (patchiness) was a key factor reducing profitability of miscanthus in the UK, resulting in longer payback periods. Tackling this by addressing issues such as planting technique, bad rhizome quality, poor overwintering, or variations in the soil quality helps maximise crop yield and improve farmer income (Zimmermann et al., 2014). Ensuring access for harvesting equipment is essential for economics of SRF to be viable – ensuring areas planted are on slopes not more than around 20 degrees is important to ensure the economic benefits of mechanised harvesting can be accessed (Martin et al 2020). For SRF effective plantation establishment is important for the economics and general success of a SRF plantation, yet our research did not find clear consensus on how to achieve this: Tullus et al., 2013 found low planting density was preferred amongst producers to minimize establishment costs, although impact on yield is uncertain in the literature. Research also found that single species monocultures can offer greatest economic return by providing higher yields per hectare (Liu et al., 2018), highest yield are achieved on fertile soil (Tullus et al., 2013) or under intensive management systems, including weed control, fertilizer application and irrigation (Walle et al., 2007).
Evidence of potential for Scotland’s wider economy
There was limited research addressing the potential contribution to the wider Scottish economy and a just transition, but some opportunities and challenges can be inferred. These include sales for local energy generation and other industrial uses, employment opportunities in contract services, along with potential payments for environmental outcomes. The requirement for contractors and local services during annual Miscanthus harvesting presents employment opportunities (Martin et al., 2020), as does SRF planting and harvesting (Liu et al., 2018). Depending on the existing farm enterprises, and choice of PEC, the workload for PECs may fall at a different time of year to other peaks in labour demand, helping to spread labour requirement through the year and reduce overall labour requirement. This could make farming more economically viable on farms which rely on family labour or very small workforces and reduce seasonal labour demands.
In addition to being used as BECCS feedstock, PECs have other potential uses and markets. Miscanthus can be sold for animal bedding, thatching, paper production, horticulture, construction materials[45], and biodegradable plastics (Anejionu and Woods 2019). There has been research on using Miscanthus as a feedstock for fermentation to transport fuels or through anaerobic digestion (AD) to biogas (Witzel and Finger, 2016). Miscanthus for AD has been found to be uneconomical according to Whittaker et al.(2016). Our stakeholder interviews confirmed that farmers would benefit more from growing feedstocks tailored to AD if this is their desired market, yet Winkler et al. (2020) reported significant potential for additional income from biogas production.
SRF and SRC, (when processed into woodchips) can provide a fuel source for biomass boilers and CHP units on-farm and for local domestic or other use[46] (Spackman, 2012, Ranacher et al., 2021). This can be an alternative market to diversify income sources and also potentially save farmers money on their own energy bills. The literature did not provide details on the economic implications of this but the stakeholder interviews flagged that farmers are currently interested in exploring opportunities to cut energy bills. Miscanthus was also identified to be used in small scale CHP plants on-farms for heating buildings and for domestic uses such as wood burners[47].
Beyond selling the biomass from PECs as a product, the literature reviewed suggested the potential of PECs to deliver environmental and ecological benefits which could potentially be monetised. SRC and SRF are currently not eligible for carbon credits, and it is unlikely that PECs can provide evidenced carbon storage in biomass or soils in order to qualify under other certification schemes. There may be opportunities to gain economic benefit from flood protection and biodiversity benefits that some PECs can deliver – the research has not identified significant information on this.
Evidence of non-economic opportunities
Non-economic opportunities and benefits of PECs were identified during the research, including several relating to positive environmental outcomes such as reduced agro-chemical use and biodiversity. All three PECs investigated require less chemical inputs, and reduce soil and water pollution (McCalmont et al., 2017). They also sequester carbon, for example miscanthus has a carbon mitigation potential of 4.0–5.3 Mg C ha-1 yr-1 (Zimmermann et al., 2014). Conversion of agricultural land to SRC leads to a reduction in management intensity of the land, resulting in potential soil benefits (Schiberna et al., 2021). The impacts of SRF may be positive or negative depending on what the land was previously used for. Soil compaction and disturbance caused by the harvest of SRF can lead to erosion and a loss in soil organic matter (Martin et al., 2020). Impacts may be neutral or possibly negative if conversion of land is from pasture or native forest to SRF (Griffiths et al., 2019). However, if displacing arable production, SRF has been reported to improve soil stability (Martin et al., 2020) with the potential to have positive effects on carbon soil organic carbon, water retention and erosion rates (Griffiths et al., 2019). SRF can also help flood alleviation as a SRF plantation would slow the rate of water flow (Martin et al., 2020).
The opportunities for biodiversity improvements resulting from PECs vary depending on planting, prior land-use and landscape context. Miscanthus has been reported to have positive effects on biodiversity (Bourke et al 2014 and Berkley et al 2018) in comparison to arable cropping systems. Shepherd et al., 2020 found an abundance of wildlife in UK miscanthus fields which, apart from at harvest time is left undisturbed. However, the effects on biodiversity of large-scale plantations are unknown (Bourke et al 2014). The introduction of SRC sites within arable cropping systems has in some cases been found to enhance the presence of some pollinators (hoverflies, bumblebees and butterflies), which can benefit crop production. However, it should be noted that these benefits are highly context dependent (Berkley et al., 2018). Opportunities to increase bird populations and diversity is thought to increase if native species of SRF are introduced (Martin et al., 2020).
Challenges and deployment barriers
The research identified several non-economic challenges facing the production of PECs in Scotland, relating to skills, land-use commitment, compatibility with current culture and habits, farm businesses, perceived land suitability and environmental concerns. Deployment barriers for Miscanthus include the need for farmers to commit land for a long period of time, land quality, knowledge (Glithero et al 2013), profitability, time to financial return and social resistance relating to whether land should be used for energy or food production (Anejionu and Woods 2019). These barriers also apply largely to SRC and SRF: land committed towards SRC and SRF will be in production for several years and conversion back to arable and the removal of tree roots is challenging (Warren 2016). Additionally for SRF land conversion may be deemed irreversible as reversion to farming use may be prohibited by government regulations once SRF is planted, and the land will no longer be classed as agricultural.
Lack of access to specialist skills (including a shortage of trained foresters[48]) and to specialist contractors and machinery (e.g., for SRF mechanised planting machines was also identified as a barrier to deployment. The most likely cause of this is limited demand and a ‘lack of off the shelf machinery’[49]. Whilst this could be seen as an opportunity for development of new infrastructure and employment opportunities, it could currently also be seen as a practical constraint for many producers. The establishment of SRC requires new skills and different machinery compared to conventional cropping, this unfamiliarity and technical lack of knowledge prohibits adoption by producers (Warren, 2014). Stakeholders who we interviewed suggested that there is increased interest amongst farmers in diversification, but that appetite for change was tempered by concern about moving into unfamiliar activities which require new skills.
Culture and attitudes can be a barrier to PEC deployment. Warren et al. (2016) found Scottish farmers opposed SRC (willow) production because they considered it was not suitable for their current farming business or the land. Whilst fertile land is best for SRF production, a study conducted by Walle et al., 2007 found that farmers willing to introduce SRF, are not willing to do so on their ‘best agricultural soils’. Ranacher et al., 2021 found there is a gap in the available literature regarding farmers’ willingness to adopt short rotation plantations on less productive land. Another potential barrier which may prejudice farmers against SRC cultivation is the cultural separation of forestry and farming in Scotland – SRC has historically been viewed as a threat towards the socio-cultural identity of Scottish agriculture (Warren, 2014). In addition, an Environmental Impact Assessment – something which farmers may not be familiar with and is likely to incur costs – may be required[50] if converting agricultural land to forestry for SRF or SRC (Martin et al., 2020).
Concerns about biodiversity identified included, concern about SRF reducing the habitat for ground feeding birds and other ‘open land’ wildlife (Martin et al., 2020).The winterhardiness of miscanthus is considered a constraint for this crop in Scotland (Martin et al., 2020), and according to stakeholder may reduce achievable yields.
From a biofuel perspective, as with all PECs, it has been noted in the literature that energy generation from biomass is a potential source of direct and indirect emissions, despite carbon being captured during crop growth. Production, transport and processing are potential sources of direct emissions (Alexander et al., 2015). Considerations to limit such emissions, for example distance from farm to biomass plant, must therefore be taken into account. Indirect emissions related to land use change are more varied in the literature.It has been noted that the establishment of SRC on peat/high organic soils, found in the upland areas of Scotland, can potentially harm soil organic carbon (SOC) levels (Martin, 2020) . Existing sustainability criteria for the use of biomass to produce heat or electricity require that PECs are not grown on land that was peatland in January 2008, or of high biodiversity value, and that any change in SOC from cultivation of PECs is taken into account when checking that the electricity or heat produced meets the relevant GHG saving criteria (see e.g. Ofgem, 2018 and Ofgem, 2021, Low Carbon Contracts Company, 2022).
Other relevant crops and planting regimes
Aside from Miscanthus, SRC and SRF there are other potential energy crops – both perennial and annual crops – which can be used for bioenergy and which are potentially suitable for Scotland. The literature reviewed above mostly considered planting of PECs as replacement for arable crops . There is also literature to suggest integrating PECs alongside existing land-use may be feasible and potentially relevant for Scotland. These alternative crops and planting regimes are considered here. Note that relatively limited research was carried outon these as the PECs above were the core focus of this study.
Hemp
Hemp was once widely grown in Scotland and suits both the climate and growing conditions in the main agronomic areas especially parts of the Borders, East Lothian, Fife, Angus, Moray and the Black Isle. Hemp has a significant potential in carbon sequestration and there is evidence to demonstrate its suitability as a feedstock for bioenergy production therefore, bringing a new ‘cash-crop’ to Scotland which would also offer new job opportunities[51]. Dogbe and Revoredo-Giha., (2022) found through a farmer’s survey, that farmers identify diversification benefits i.e. planting hemp ‘as a safety net’ as a reason for producing hemp in Scotland. Biomass Connect technical article (2023), considering the UK as a whole, found hemp to have greater versatility and profitability than other biomass crops like Miscanthus, willow and poplar and high biomass yield (12-15t/ha of air-dried biomass). They also reported it to be an above-average energy crop for some biochemical-based biofuel production (in comparison to other similar yielding bioenergy crops)[52]. Hemp can also be used in bio-based building materials such as Hempcrete and textiles [53].
Hemp has the potential to provide high yields or returns with little or no pesticides and insecticides (Dogbe and Revoredo-Giha., 2022). It fits well into crop rotations with food and feed crops and helps improve soil structure and soil-borne pests. Constraints on producing hemp in Scotland includes the current lack of market as there are no large processing facilities in or near Scotland, strict regulations on growing hemp including, the need to obtain a costly license, and some reports of low profitability according to Scottish growers[54].
PECs in agroforestry systems,
Agroforestry is the planting of trees on farmland, alongside cropland or pastureland, usually in strips, clusters or scattered individual trees, that can be grazed or cultivated in between. The REA did not find specific studies focused on Scotland to show how PECs could be grown in agroforestry systems, but provided the design of agroforestry systems can allow for economically efficient planting, management and harvesting (i.e. still allow for machinery access), it could provide an advantageous model. Kralik et al., 2022[55] conducted a study to address the economic efficiency of agroforestry systems using SRC in comparison to conventional 4-year arable rotation, in Czechia. The results of this paper showed that the agroforestry system generate similar income and profits as the conventional annual crops when cultivating on appropriate sites and practicing good farming principles.
In terms of the scale of production which could be delivered through agroforestry, for the UK in general, Morris and Day (2023) estimated that 20% of UK farmland could transition to agroforestry by 2060. Utilising the aforementioned land area and yield data, the study observed three UK scenarios for SRC Willow. One scenario found where 30% of the yield arising from SRC Willow was used for bioenergy purpose and this would equate to 1.2 million tonnes of domestic wood fuel and therefore contribute significantly towards bioenergy needs and net zero.
Appendix E Methodology for economic analysis
Farm scale economic analysis
Calculating the gross margins for bioenergy crops
Step 1: Calculating the costs for the activities for the different types of bioenergy crops
Miscanthus, willow short rotation coppice (SRC), and short rotation forestry are the energy crops for which there is information that lets us build a baseline model that takes into consideration the different costs involved in the production process of these crops. We conducted an extensive literature review of the growing cycle for different crops, identifying the different steps for growing each of the crops and identifying the costs to undertake those actions. The costs used in our analysis are based on the costs that were used in the Sustainable Bioenergy Feedstocks Feasibility Study report for the Department for Business, Energy and Industrial Strategy (BEIS) published in 2021. This report carried out an extensive review of the available information for different types of bioenergy crops. Information was obtained through a literature review, which was supplemented by interviews with a range of key stakeholders, and expert insight from the project team. In addition, insights were gained through a review of development of SRC in Sweden, which has the largest planted area of SRC in the EU. A list of organisations consulted during the stakeholder analysis is given in appendix 2 of the Feedstocks Innovation Study report.
The three scenarios identified in the Feedstocks Innovation Study (low, medium and high-cost scenarios) were used in the analysis. This allows for some variation in factors that affect costs in agriculture and establish hypothetical scenarios that capture different combinations of costs. In the following sections, an overview of the actions and the costs are included for each of the three bioenergy crops;
- Site preparation / land preparation (including from different prior land-uses where data is available)
- Establishment / planting
- Crop management costs e.g., during initial growth
- Harvesting
- Reversion (where relevant)
For information on the assumptions on the costs please see the Feedstock Innovation Study.
Miscanthus
For Miscanthus, the cost of production is made up from a number of elements that will be grouped in four phases. The phases for growing Miscanthus are:
- Site preparation
- Planting
- Harvesting
- Reversion
Figure B‑1 shows an example timeline of the Miscanthus growth cycle.
Figure B‑2 Growing cycle for Miscanthus
|
|
Year -1 |
Year 0 |
Year 1 |
Year 2 |
Every 3 years |
|
Jan |
Existing crop |
Site preparation |
Dormancy/Cut back |
Dormancy |
Harvest |
|
Feb | |||||
|
Mar | |||||
|
Apr |
Planting |
Growth |
Growth |
Growth | |
|
May | |||||
|
Jun |
Gap filling | ||||
|
Jul |
Growth | ||||
|
Aug |
Site preparation | ||||
|
Sep | |||||
|
Oct | |||||
|
Nov |
Senescence |
Senescence |
Senescence/ Harvest |
Senescence | |
|
Dec |
Table B‑1 shows all the input costs for Miscanthus used in this study taken from the Feedstocks Innovation Study adjusted to 2023 prices using the latest GDP deflators[56]. As well as adjusting for inflation, fertiliser costs have been increased using the latest data from AHDB on fertiliser prices[57]. Using this data, costs for fertilisers were adjusted by comparing the average annual increase in fertilisers from 2019 to 2023.
Table B‑1 Input costs for Miscanthus (2023 prices)
|
Broad action category |
Cost element |
Unit |
Lower |
Medium |
Higher |
|
Site preparation |
Professional costs 1 (Advice on Environmental Impact Assessment) |
£/ha |
0 |
120 |
120 |
|
Professional costs 2 (Advice on agronomy) |
£/ha |
0 |
0 |
28 | |
|
Soil sampling |
£/ha |
7 |
7 |
7 | |
|
Land rent equivalent |
£/ha |
0 |
0 |
0 | |
|
Clearance & ploughing |
£/ha |
89 |
97 |
106 | |
|
Total herbicide / insecticide + application 1 |
£/ha |
57 |
57 |
69 | |
|
Miscellaneous / risk to allow for unforeseen issues in land preparation |
£/ha |
0 |
61 |
180 | |
|
Planting |
Power harrow |
£/ha |
57 |
68 |
68 |
|
Pest control incl. rabbit fencing |
£/ha |
0 |
0 |
341 | |
|
Rhizomes, planting, rolling |
£/ha |
1533 |
1987 |
2271 | |
|
Fertiliser + application 1 |
£/ha |
18 |
61 |
67 | |
|
Total herbicide + application 2 |
£/ha |
57 |
66 |
69 | |
|
Weed/spray |
£/ha |
84 |
93 |
102 | |
|
Miscellaneous / risk to allow for unforeseen issues during planting |
£/ha |
0 |
57 |
142 | |
|
Harvesting |
Mowing / cutting |
£/ha |
79 |
85 |
97 |
|
Baling (at £12/wet tonne) |
£/t |
12 |
14 |
17 | |
|
Loading, stacking, storage (at £2/wet tonne) |
£/t |
2 |
2 |
5 | |
|
Fertiliser + application 2 |
£/ha |
25 |
157 |
229 | |
|
Miscellaneous / risk 2 to allow for unforeseen issues during havesting |
£/ha |
0 |
0 |
102 | |
|
Reversion |
Reversion costs (herbicide + plough) |
£/ha |
145 |
153 |
174 |
|
Overall Total |
2143 |
3025 |
4105 |
The broad action category: site preparation category includes costs of establishment. The establishment phase involves preparing the soil for the new crops, acquiring all the plant material, weed control, and planting the crops. In the production phase, the crops are matured and harvested throughout the years. This is the longest phase as it repeats for every harvest and includes all processes related to harvesting and regrowing the crop. The third phase will be reversion, when the plant material is removed, and the field is made available for a new crop (see Figure 13‑1).
There are variabilities and uncertainties related to estimating the production costs for each crop. These may arise for a variety of reasons such as:
- Differences in soil type and/or condition
- Differences in climate
- Differences in farming practices across different companies/farms
- Differences in end-product requirements/specifications.
In the establishment phase, the first lifecycle stage of Miscanthus, the field is taken care of and prepared for plantation. In our model, we have done this in year -1, with year 0 being the reference year for the plantation of the crops. In year -1, the land is prepared for the plantation of the crops in year 0. Several factors affect the cost of planting such as the site, soil type, and drainage. We have incorporated this variance into our model by modelling for different cost scenarios to reflect different possible cost combinations.
In the high-end cost scenario, we have included a possible pest-control component, such as rabbit-fencing to protect the crops. If needed, the pest control section could possibly be a major cost factor.
A couple of years after planting the Miscanthus crops, the first harvest happens. This first harvest marks the beginning of the production phase, which happens every year for the next 18 years. In the production phase, all steps related to harvesting the Miscanthus yield take place. These include mowing/cutting the plant, baling the harvest, and loading it to be further processed or sold. A margin for miscellaneous costs has also been included in the high-cost scenario. At the end of the crop’s life cycle, the reversion process happens to make the land suitable for other crops.
SRC: In this study, we have considered short-rotation coppice such as poplar and willow, two species which can be used for energy generation. Similar to Miscanthus, we have considered different costing phases that are involved in the process of growing SRC. However, given the differences there are between growing these crops and Miscanthus, the processes will be different, meaning that costs will also differ from Miscanthus. We have considered the following phases in the SRC production process:
- Pre-planting/land preparation
- Planting
- Post-planting
- Harvesting
- Reversion
The same as Miscanthus, the costs have been taken from the Feedstocks Innovation Study adjusted for inflation and the fertiliser costs adjusted as explained in the Miscanthus method section (see Figure B‑2).
Figure B‑2 Growing cycle for SRC
|
|
Year -1 |
Year 0 |
Year 1 |
Year 2 |
Every 3 years |
|
Jan |
Existing crop |
Site preparation |
Dormancy/Cut back |
Dormancy |
Harvest |
|
Feb | |||||
|
Mar | |||||
|
Apr |
Planting |
Growth |
Growth |
Growth | |
|
May | |||||
|
Jun |
Gap filling | ||||
|
Jul |
Growth | ||||
|
Aug |
Site preparation | ||||
|
Sep | |||||
|
Oct | |||||
|
Nov |
Senescence |
Senescence |
Senescence/ Harvest |
Senescence | |
|
Dec |
Table B‑2 Range of production costs for SRC (2023 prices)
|
Broad action category |
Cost element |
Unit |
Lower |
Medium |
Higher |
|
Pre-planting/land preparation |
Professional costs 1 for EIA advice |
£/ha |
0 |
127 |
127 |
|
Professional costs 2 for agronomy advice |
£/ha |
0 |
28 |
28 | |
|
Soil sampling and testing 1 |
£/ha |
7 |
7 |
7 | |
|
Soil sampling and testing 2 |
£/ha |
7 |
7 |
7 | |
|
Land rent equivalent |
£/ha |
0 |
0 |
0 | |
|
Total herbicide plus application 1 |
£/ha |
57 |
57 |
60 | |
|
Land prep (ploughing) |
£/ha |
89 |
97 |
106 | |
|
Land prep (power harrow) |
£/ha |
61 |
69 |
75 | |
|
Land prep (miscellaneous / risks) |
£/ha |
34 |
68 |
103 | |
|
Pest protection (rabbit fencing) |
£/ha |
0 |
341 |
341 | |
|
Fertiliser + application 1 |
£/ha |
18 |
112 |
164 | |
|
Planting |
Plant material |
£/ha |
1107 |
1249 |
1419 |
|
Planting |
£/ha |
454 |
454 |
511 | |
|
Fertiliser + application 2 |
£/ha |
18 |
112 |
164 | |
|
Total herbicide plus application 2 |
£/ha |
57 |
57 |
60 | |
|
Post-planting |
Herbicide / weed / spray 1 |
£/ha |
84 |
93 |
93 |
|
Gapping up |
£/ha |
15 |
17 |
19 | |
|
Cutback / mowing |
£/ha |
51 |
57 |
62 | |
|
Harvesting and storage |
Harvesting, handling and storage |
£/ha |
710 |
823 |
852 |
|
Fertiliser + application 3 |
£/ha |
18 |
112 |
164 | |
|
Herbicide / weed / spray 2 |
£/ha |
84 |
102 |
102 | |
|
Other annual costs |
Miscellaneous / risks |
£/ha |
11 |
23 |
34 |
|
Reversion costs |
£/ha |
341 |
341 |
511 | |
|
Overall Total |
£/ha |
3,242 |
4,301 |
4,911 |
In the pre-planting stage, the land is prepared for growing the SRC crop. Similar to Miscanthus, in the land preparation stage different steps to prepare the land such as soil sampling and testing, ploughing, and power harrow take place. We have modelled these to happen in year -1, with year 0 being the year in which planting takes place. Heavier or more compacted soils will require additional ploughing and sub-soiling compared to lighter costs. Multiple herbicide applications may be needed depending on the specific circumstances. A rabbit fence or other forms of pest control might be needed.
In the planting phase, costs for the plant material and other costs involved in the planting process (such as labour costs and fuel costs) are taken into consideration as well as the costs for soil fertilisation and herbicide application. Fertiliser will be applied either by the farmer or a contractor after planting in and around the plants. Fertiliser could be a purchased product or sewage sludge (if permitted) which comes at zero cost.
In the post-planting phase, the farmer maintains the plants to ensure the plants are healthy and the soil usage is being optimised. At the end of third year when the leaves have fallen, the farmer will apply herbicide and cut back the crop to encourage the plant to grow more stems and fill any gaps in the crop with new, larger size rods which can compete with the already established plants which have just been cut back. In this phase, the farmer also cuts the emerging shoots to encourage more shoots per plant.
Once the plants are ready for harvest, the harvesting process begins. We have combined all the different costs (machinery, labour, fuel, handling, storage, etc) into a single category as there would be too much granularity if we considered them separately. After each harvest, the application of fertiliser and weed/spraying takes place. We have also allowed for possible miscellaneous costs which could affect the final cost of this process.
Short Rotation Forestry (SRF)
Two scenarios have been defined for SRF:
- SRF conifer scenario
- SRF broadleaved scenario
As with Miscanthus and SRC the costs for SRF have been taken from the Sustainable Bioenergy Feedstocks Feasibility Study report for the Department for Business, Energy and Industrial Strategy (BEIS) published in 2021. The costs have been adjusted for inflation to 2023 prices using the latest GDP deflators[58].
A low, medium and high scenario for both SRF broadleaved and SRF conifer are included.
For the SRF broadleaved scenario, the costs are based on fast growing native broadleaves on medium quality land in lowlands, grown without thinning on a 15- to 20-year rotation and harvested conventionally as pole length or shortwood. The lower cost outcome uses fast growing poplar on farmland, whereas the medium and higher cost outcomes use birch in forest conditions. For more information on the costs please see the Feasibility Study. Details on the costs can be found in Table 13‑4. For the SRF conifer scenario, the costs are on the basis on a fast-growing conifer species (e.g., Sitka Spruce) on medium quality land, grown without thinning on a 15 to 20-year rotation and harvested conventionally as pole length or shortwood. The lower cost outcome assumes new planting, whereas the medium and higher cost outcome assume restocking in forest conditions. For all costs, please see Table B‑5.
Table B‑3 Range of production costs for broadleaved short rotation (2023 prices)
|
Broad action category |
Cost element |
Unit |
Lower |
Medium |
Higher |
|
Ground preparation |
Deer fencing |
£/ha |
0 |
727 |
965 |
|
Rabbit control |
£/ha |
0 |
79 |
119 | |
|
Spirals |
£/ha |
710 |
0 |
0 | |
|
Draining |
£/ha |
0 |
45 |
85 | |
|
Cultivation |
£/ha |
51 |
170 |
369 | |
|
Planting |
Plant supply |
£/ha |
1079 |
937 |
1516 |
|
Planting, restock |
£/ha |
0 |
250 |
443 | |
|
Planting, New |
£/ha |
97 |
0 |
0 | |
|
Beat up, Labour & plants |
£/ha |
125 |
392 |
766 | |
|
Establishment and maintenance |
Top up Spray (Hylobius) |
£/ha |
0 |
0 |
0 |
|
Weeding |
£/ha |
199 |
352 |
505 | |
|
Cleaning/respacing |
£/ha |
0 |
0 |
51 | |
|
General maintenance |
£/ha |
182 |
250 |
312 | |
|
Forest-scale operations |
£/ha |
51 |
62 |
91 | |
|
Management overhead |
£/ha |
0 |
0 |
0 | |
|
Land rent equivalent |
£/ha |
0 |
149 |
206 | |
|
Harvesting |
Thinning |
£/ha |
0 |
0 |
0 |
|
Clearfell |
£/odt |
5 |
7 |
8 | |
|
Residue removal |
£/ha |
0 |
0 |
0 | |
|
Comminution (chipping) |
£/odt |
3 |
6 |
9 | |
|
Reversion |
Reversion |
£/ha |
1136 |
1419 |
1817 |
|
Overall Total |
£/ha |
3628 |
4833 |
7246 |
Table B4 Range of production costs for conifer short rotation (2023 prices)
|
Cost element |
Unit |
Lower |
Medium |
Higher | |
|
Deer fencing |
£/ha |
0 |
290 |
647 | |
|
Rabbit control |
£/ha |
0 |
0 |
0 | |
|
Spirals |
£/ha |
0 |
0 |
0 | |
|
Draining |
£/ha |
0 |
45 |
85 | |
|
Cultivation |
£/ha |
170 |
250 |
466 | |
|
Planting |
Plant supply |
£/ha |
676 |
738 |
1022 |
|
Planting, restock |
£/ha |
0 |
227 |
312 | |
|
Planting, New |
£/ha |
153 |
0 |
0 | |
|
Beat up, Labour & plants |
£/ha |
193 |
386 |
562 | |
|
Establishment and maintenance |
Top up Spray (Hylobius) |
£/ha |
0 |
102 |
261 |
|
Weeding |
£/ha |
165 |
324 |
432 | |
|
Cleaning/respacing |
£/ha |
0 |
79 |
119 | |
|
General maintenance |
£/ha |
182 |
250 |
312 | |
|
Forest-scale operations |
£/ha |
51 |
62 |
91 | |
|
Management overhead |
£/ha |
0 |
0 |
0 | |
|
Harvesting |
Thinning |
£/ha |
0 |
0 |
0 |
|
Clearfell |
£/odt |
5 |
7 |
8 | |
|
Residue removal |
£/ha |
0 |
0 |
0 | |
|
Comminution (chipping) |
£/odt |
3 |
6 |
9 | |
|
Reversion |
Reversion |
£/ha |
1136 |
1419 |
1817 |
|
Overall Total |
£/ha |
2700 |
4180 |
6135 |
Step 2: Calculating the output (yield and price)
Miscanthus
Data for yields in Scotland were obtained from the Scottish farm management handbook. Similar to what has been done in the costing section, different scenarios have been considered in order to account for possible variance in yields. 12 ODT, 14 ODT and 15 ODT were used for the low, medium and high scenario, respectively. ODT/ha stands for Oven dry tonne per hectare and corresponds to the total amount of above-ground living organic matter produced in a single hectare. Harvesting takes place in year 3 and is harvested on annual basis. Pricing data for Miscanthus was obtained from the John Nix pocketbook, £95, £97, £98 £/odt for the lower, medium and higher scenario, respectively (adjusted from 2021 to 2023 prices using the latest GDP deflators). This value is taken from the value that is offered to farmers from Terravesta. There are penalties if the crop is out of specification and bonuses available of £2/tonne if bales have been stored in a barn.
SRC
SRC is harvested with 2–3-year intervals and similar to Miscanthus, yields can vary for a wide range of reasons such as site conditions, type of planting method, years since planting, crop type, orography, and weather conditions. The yields used in the analysis come from the official statistics published by Defra which looks at Plant biomass: Miscanthus, short rotation coppice and straw[59]. These are 24, 35, 45 odt/ha, respectively. In the analysis, fluctuations in the yield of SRC have been included (Table ‑6).
Table B5 SRC rotation used in analysis if assuming fluctuations take place
|
Year |
Units |
Lower |
Medium |
Higher |
|
Year 1 |
odt/ha |
|
|
|
|
Year 2 |
odt/ha |
|
|
|
|
Year 3 |
odt/ha |
20 |
29 |
38 |
|
Year 4 |
odt/ha |
|
|
|
|
Year 5 |
odt/ha |
|
|
|
|
Year 6 |
odt/ha |
26 |
38 |
49 |
|
Year 7 |
odt/ha |
|
|
|
|
Year 8 |
odt/ha |
|
|
|
|
Year 9 |
odt/ha |
26 |
38 |
49 |
|
Year 10 |
odt/ha |
|
|
|
|
Year 11 |
odt/ha |
|
|
|
|
Year 12 |
odt/ha |
26 |
38 |
49 |
|
Year 13 |
odt/ha |
|
|
|
|
Year 14 |
odt/ha |
|
|
|
|
Year 15 |
odt/ha |
25 |
35 |
46 |
|
Year 16 |
odt/ha |
|
|
|
|
Year 17 |
odt/ha |
|
|
|
|
Year 18 |
odt/ha |
23 |
33 |
43 |
|
Year 19 |
odt/ha |
|
|
|
|
Year 20 |
odt/ha |
|
|
|
|
Year 21 |
odt/ha |
21 |
31 |
40 |
For the price of SRC, the value used in the latest John Nixs Pocketbook (2022) has been used. Adjusted to 2023 prices this is £59 per odt. This figure is based on what a grower in Cumbria could get.
SRF
SRF is harvested at 15-year intervals for both conifer (sikca spruce) and broadleaved (silver birch). The yield estimates were taken from the Feedstock Innovation Study. The price for both types of SRF were taken from a stakeholder from Scottish Forestry, which estimated that the payment for SRF that had been stacked and cut would be between £50 to £64.
Step 3: Calculating the gross margin
To calculate the gross margins for the bioenergy crops, firstly the costs were placed over the lifetime of the crop. For example, clearance and ploughing costs for Miscanthus were included in the first year (-1). The accompanying spreadsheet shows how all the costs are spread over the lifecycle of the crop. The costs were then taken away from the output estimates to calculate the gross margins over the lifecycle of the crop.
To calculate the gross margins for all the farm types used in the analysis the latest data from the Scotland farm business survey[60] was used using data from the years 2016 to 2022. An average over these years was used to take account of variability in agricultural costs and outputs. To get to the £ per hectare value, using the time series data from 2016, total average output for each of the farm types was divided by the average size of the farm. For variable costs, total average inputs – other fixed costs were taken away from the total average inputs to get to the variable costs. This was then converted to per hectare values. For the general cropping, forage category data was taken from the latest census[61] for the output data and the costs were taken from the farm management handbook[62].
Table C: Breakdown of costs and outputs used for gross margin calculations (average data from 6 years from 2016-17 to 2021-22 from Scottish Farm Business Income Survey)
|
Type of farm |
Lowland Sheep & Cattle |
Mixed | ||||
|
Performance band |
Lower 25% |
Average |
Upper 25% |
Lower 25% |
Average |
Upper 25% |
|
Total crop output |
10,516 |
22,962 |
48,895 |
73,507 |
102,314 |
180,117 |
|
Total livestock output |
74,755 |
126,232 |
304,160 |
72,675 |
104,739 |
165,523 |
|
Miscellaneous output |
7,184 |
8,973 |
11,508 |
13,028 |
20,741 |
50,036 |
|
Total average output |
92,455 |
158,167 |
364,563 |
159,210 |
227,793 |
395,676 |
|
Crop expenses |
15,097 |
20,175 |
38,586 |
37,388 |
45,197 |
67,023 |
|
Livestock expenses |
42,485 |
62,298 |
142,947 |
41,068 |
52,412 |
73,146 |
|
Other fixed costs |
92,125 |
91,391 |
151,465 |
133,423 |
146,043 |
208,434 |
|
Total average inputs |
149,707 |
173,864 |
332,999 |
211,879 |
243,652 |
348,603 |
|
Total average inputs – other fixed costs |
57,582 |
82,473 |
181,534 |
78,457 |
97,609 |
140,169 |
Table D: General cropping – forage gross margin calculation data
|
Arable silage |
forage maize |
Whole winter wheat fermented |
Whole winter wheat cracked |
Average |
Total | |
|
Total cost per annum (£/ha)[63] |
1,193 |
1,113 |
1,441 |
1,625 | ||
|
General cropping – forage output (£/ha)[64] |
58 | |||||
|
Gross margin (£/ha) |
1285 |
Gross margin calculation: Average total cost per annum – forage output = gross margin
Figure A: Excerpt from Scottish Farm Mangement Handbook showing data used in the calculations in Table D above.
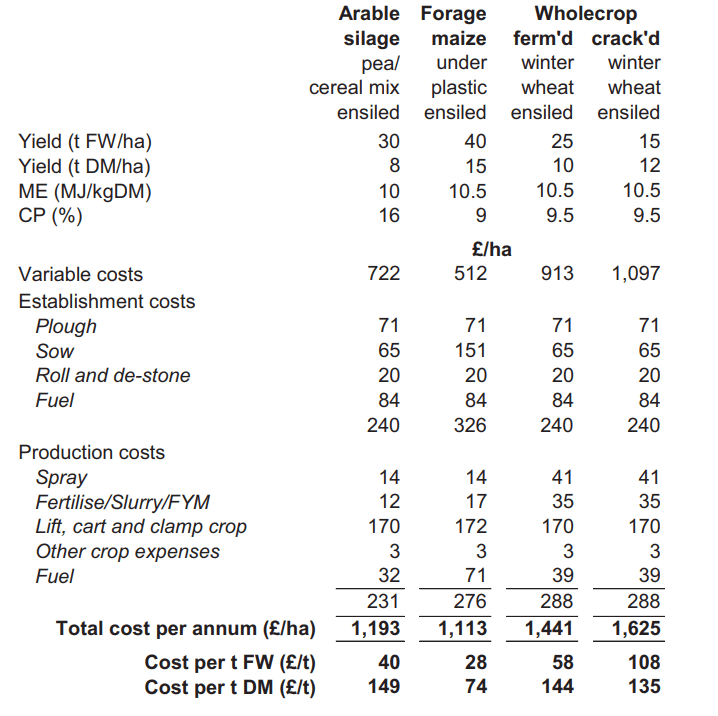
Comparing bioenergy crops to existing land-use economics: three scenarios
Bioenergy energy crop scenarios
For the low scenario, high costs were compared with lower output. For the medium scenario, medium costs were compared with medium output. For the high scenario, low costs were compared with high output.
Farm scenarios
For the different farm income scenarios, the farm business income definitions were used from the Scotland farm business survey. For low this uses the lower 25% percentile for that farm category, for medium the average percentile was used and for the higher, the upper 25% percentile was used.
Yearly average gross margins for each of the bioenergy crops and farm types
To calculate the yearly average gross margins for each of the bioenergy crop and the farm type scenarios a discount rate was applied to future years. The discount rate applied is the standard discount rate recommended by the green book[65]. The Green Book recommends that costs and benefits occurring in the first 30 years of a programme, project or policy be discounted at an annual rate of 3.5%, and recommends a schedule of declining discount rates thereafter. A discount rate is applied as it is assumed that people prefer to receive financial outputs now rather then in the future.
Assessment of implications for Scotland’s rural economy
Using the geo-spatial mapping data from the previous project, which identified land that was theoretically suitable for PEC production considering land capability, slope, and climate (Martin et al, 2020), percentages of the land that could be converted to bioenergy crops were derived for each of the regions. This percentage was then applied to the land area estimated to be in each farm type in the region, to derive the land are potentially suitable for PECs by farm type. The land area in each farm type in each region was estimated by combining data on crop areas in each region with estimates of the percentge of crop area at the Scottish level which occurs in each each farm type.
A previous CXC study (Meek et al, 2022) indicated that, bearing in mind land suitability, an estimated total of approximately 27,000 ha PECs could be planted by 2030, 38,000 by 2032 and 90,250 hectares by 2045. Two scenarios were then constructed to see what land transitions could meet these areas of PECS. Using information on the gross margins for the three farm types of interest and the gross margins for the PECs, the economic impact of each land use change can be ranked.
Table E Change in gross margin (£/ha) in transitioning to PECs
|
SRF |
SRC |
Miscanthus | |
|
Non-LFA Cattle & Sheep |
-£414 |
-£347 |
-£52 |
|
Mixed holdings |
-£577 |
-£511 |
-£215 |
|
General cropping |
£1,009 |
£1,076 |
£1,371 |
These rankings were used to guide how much of the potential land suitable for PECs in each farm type was assumed to be converted, with more land converted for more economically beneficial transitions. Care was also taken, particularly in Scenario 2, where high levels of trnaition are needed to meet the higher PEC target area, that levels of overall change were not too high. This resulted in the assumed changes shown in the Tables below
Table F Assumed changes in land use Scenario 1
|
Percentage of suitable land assumed converted to PECs |
Ha converted to PECs | ||||||
|
Non-LFA Cattle & Sheep |
Mixed Holdings |
General Cropping, Forage |
Non-LFA Cattle & Sheep |
Mixed Holdings |
General Cropping, Forage |
Total area | |
|
PEC |
|
|
|
ha |
ha |
ha |
ha |
|
SRF |
9,928 |
– |
8,977 |
18,905 | |||
|
SRC |
7,578 |
– |
5,258 |
12,836 | |||
|
Miscanthus |
3,790 |
– |
1,352 |
5,142 | |||
|
Total land are converted |
21,296 |
– |
15,587 |
36,883 | |||
|
Percentage of total land in farm type converted |
20% |
0% |
1.1% |
2.1% | |||
Table G Assumed changes in land use Scenario 2
|
Percentage of suitable land assumed converted to PECs |
Ha converted to PECs | ||||||
|
PEC |
Non-LFA Cattle & Sheep |
Mixed Holdings |
General Cropping, Forage |
Non-LFA Cattle & Sheep |
Mixed Holdings |
General Cropping, Forage |
Total area |
|
|
|
|
ha |
ha |
ha |
ha | |
|
SRF |
30% |
50% |
75% |
19,857 |
13,873 |
10,201 |
43,931 |
|
SRC |
30% |
50% |
75% |
15,156 |
10,078 |
5,975 |
31,209 |
|
Miscanthus |
60% |
100% |
100% |
7,580 |
4,770 |
1,352 |
13,701 |
|
Total land are converted |
21,296 |
– |
15,587 |
42,592 | |||
|
Percentage of total land in farm type converted |
40% |
9% |
1.3% |
5.0% | |||
The Potential change in farm income due to change in gross margin was calculated by multiplying the change in gross margin from each transition in Tables E, with the areas in transition in Tables F and G. This was done on a regional basis.
The estimated shortfall in crop production from a shift to PECs, was calculated by using data on the areas of crop land in each farm type and the areas converted to PECs to calculate lost areas of crop production. These were then multiplied by typical crop yields[66]. This was all done at a regional level. Estimate the change in livestock production that might come from the shift to PECs would require a more detailed analysis than was possible in this study.
Appendix F: Mapping outputs from 2020 project
A previous CXC Project (Martin et al, 2020) used geo-spatial mapping to identify suitable areas of land in Scotland for growing PECs. The project focused on land capability of grades; 4.1, 4.2, 5.1, 5.2, 5.3 and 6.1, which are typically suitable for mixed agriculture, improved grassland and high-quality rough grazing [67], and assessed what area of these grades where suitable for SRC and Miscanthus growth which limited the potential production area. For SRF the assessment also included land capability for agriculture grades F1, F2, F3, F4 and F5.
Figure C-1: Distribution of suitable land available for Short Rotation Forestry
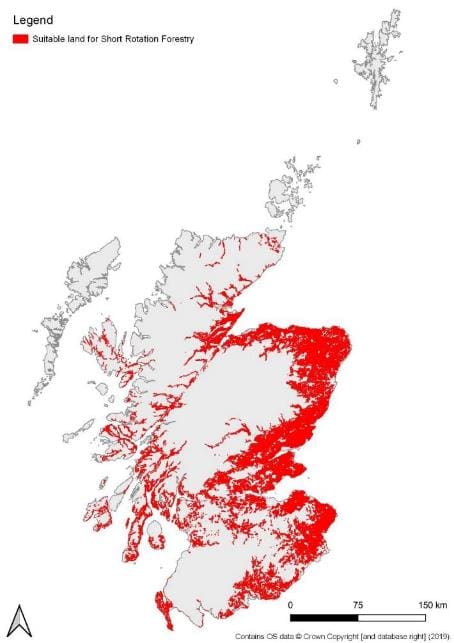
Figure C-2: Distribution of suitable land available for Short Rotation Coppice
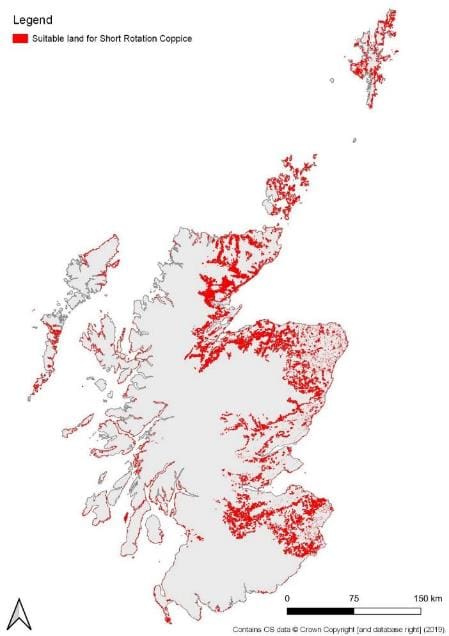
Figure C-3: Distribution of suitable land available for Miscanthus
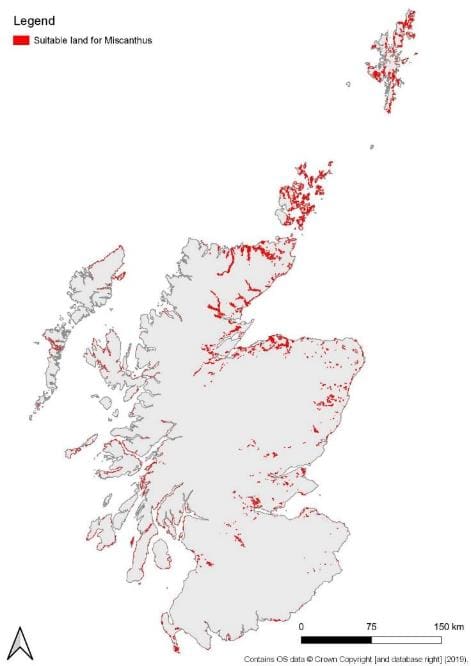
Data attributions
The data used in the bioenergy crop growth analysis was downloaded from multiple sources. In order to comply with their licences, as well as to acknowledge the use of the data, attributions for each data source is provided in Table C-1. In all cases these attributions are those directly required by the data licence or metadata.
Table C-1: Data attributions
|
Dataset name and data source |
Data attribution |
|---|---|
|
James Hutton Institute: Land Capability for Agriculture, 1:250,000 |
James Hutton Institute: Land Capability for Agriculture, 1:250,000 copyright and database right The James Hutton Institute 1980. Used with permission of The James Hutton Institute. All rights reserved. Any public sector information contained in these data is licensed under the Open Government Licence v.2.0 |
|
James Hutton Institute: Land Capability for Forestry, 1:250,000 |
James Hutton Institute: Land Capability for Forestry, 1:250,000 copyright and database right The James Hutton Institute 1980. Used with permission of The James Hutton Institute. All rights reserved. Any public sector information contained in these data is licensed under the Open Government Licence v.2.0 |
|
Ordnance Survey: Terrain 50 50m resolution digital elevation model |
Contains OS data © Crown Copyright [and database right] (2019). |
|
Ecological Site Classification |
Forestry Commission, (2019). |
|
Centre for Ecology and Hydrology: Gridded Estimates of Areal Rainfall (GEAR) |
Tanguy, M.; Dixon, H.; Prosdocimi, I.; Morris, D.G.; Keller, V.D.J. (2019). Gridded estimates of daily and monthly areal rainfall for the United Kingdom (1890-2017) [CEH-GEAR]. NERC Environmental Information Data Centre. https://doi.org/10.5285/ee9ab43d-a4fe-4e73-afd5-cd4fc4c82556 |
|
Centre for Ecology and Hydrology: Climate Hydrology and Ecology Research Support System (CHESS) |
Martinez-de la Torre, A.; Blyth, E.M.; Robinson, E.L. (2018). Water, carbon and energy fluxes simulation for Great Britain using the JULES Land Surface Model and the Climate Hydrology and Ecology research Support System meteorology dataset (1961-2015) [CHESS-land]. NERC Environmental Information Data Centre. https://doi.org/10.5285/c76096d6-45d4-4a69-a310-4c67f8dcf096 |
|
James Hutton Institute: National Soils of Scotland, 1:250,000 |
James Hutton Institute: National Soils of Scotland, 1:250,000 copyright and database right The James Hutton Institute 2019. Used with permission of The James Hutton Institute. All rights reserved. Any public sector information contained in these data is licensed under the Open Government Licence v.2.0 |
|
Scottish Natural Heritage: Carbon and Peatland Map 2016. |
Contains public sector information licensed under the Open Government Licence v3.0. |
|
Forestry Commission: National Forestry Inventory Woodland Scotland 2017 |
Contains Forestry Commission information licensed under the Open Government License v3.0. |
|
European Space Agency: CORINE 2018 |
© European Union, Copernicus Land Monitoring Service 2019, European Environment Agency (EEA) |
|
Ordnance Survey: Open Zoomstack |
Contains OS data © Crown Copyright [and database right] (2019). |
|
Scottish Natural Heritage: National Parks, National Scenic Areas, Country Parks etc. |
Contains public sector information licensed under the Open Government Licence v3.0. |
|
Scottish Natural Heritage: World Heritage Sites, Battlefields, Conservation Areas etc. |
Contains public sector information licensed under the Open Government Licence v3.0. |
|
Scottish Natural Heritage: Ramsar, SAC, SPA, SSSI etc. |
Contains public sector information licensed under the Open Government Licence v3.0. |
AppendixG: Methology for geospatial analysis of agricultural land use change
Geospatial analysis
To calculate the current land area available for change to bioenergy cropping, based on the locations from the previous CXC project, geospatial analysis was completed. The percentage of the total land area suitable for bioenergy growth in each agricultural region was calculated and applied to the total hectarage of the the agricultural land used within the land capability categories. This was then divided into three main farm types: Non-LFA cattle and sheep, Mixed holdings, General cropping – forage. This presented a total hectarage by agricultural region and farm type that could be converted to SRC, Miscanthus and SRF. This data was used in economic calculations to present the change in economic potential for the three farm types under a land use change to bioenergy crops. Details of sources used are presented in Table D-1.
Table D‑1 Data sources and usage
|
Data type |
Source |
Reference |
Usage |
Assumption |
|
Table 14 Land Use by Region Dataset |
Scottish Agricultural Census June 2021 |
Hectarage of barley (spring and winter), stockfeeding crops (maize and lupin) and grass (under 5 years old, and 5 years old and over) used to calculate the current land usage within the Scottish agricultural regions. |
N/A | |
|
Table 17 Livestock by Region (Number of heads) Dataset |
Scottish Agricultural Census June 2021 |
Data used to calculate the percentage split of the number of animals using grass (hay and silage) within Scotland. |
Assumption that beef and dairy cattle will consume similar feed amounts each day, supported by review or recommended dry matter intake by online sources. | |
|
Table 1 Crops and grass area, hay and silage production, 2010 to 2020 |
Agricultural Statistics: Results of December 2020 Agricultural Survey |
Data used to calculate the percentage split of grass cut for hay and silage. |
Assumption that all grass yield would match yields of hay and silage crops. | |
|
Table 1b. Agricultural area in hectares, 2011 to 2021 |
Scottish Agricultural Census June 2021 |
Data used to calculate the percentage split of stockfeeding crops between maize and lupin. |
Only Maize and Lupin stockfeeding crops have been included as these have been named in the Table 14 footnote. | |
|
Barley usage in Scotland |
NFU Scotland: What we produce |
Data used to calculate the percentage of barley produced in Scotland used for animal feed. |
Assumed that all barley produced for animal feed is produced in land capability categories 3.3-5.3, in line with the areas selected for potential growth of SRC and Miscanthus. | |
|
Land capability – agriculture |
James Hutton Institute: Land Capability for Agriculture, 1:250,000 |
https://www.hutton.ac.uk/learning/exploringscotland/land-capability-agriculture-scotland |
Dataset used to compare the land capability categories against the potential growth area of SRC and Miscanthus to calculate the percentage of land area for bioenergy growth applied in calculations. | |
|
Land capability – forestry |
James Hutton Institute: Land Capability for Forestry, 1:250,000 |
https://www.hutton.ac.uk/learning/natural-resource-datasets/landcover/land-capability-forestry |
Dataset used to compare the land capability categories against the potential growth area of SRF to calculate the percentage of land area for bioenergy growth applied in calculations. | |
|
Percentage of crops by farm type |
Technical knowledge |
Division of crops between farm types used to split the total hectarage of crops into three main farm type categories: Non-LFA cattle and sheep, Mixed holdings, General cropping – forage for economic farm level analysis. |
Assumptions have been made on the percentage split of the crops focused within the mixed agriculture and improved grassland land capability categories, based on the removal of total crops used for other farm types (e.g. specialist dairy and non-animal feed cropping categories – general cropping and specialist cereals). |
Appendix H: Stakeholder engagement methodology and key findings
In addition to the rapid evidence assessment and economic analysis, we conducted stakeholder engagement with a robust representative sample of stakeholders from across the Scottish agricultural network to provide input into the project. The engagement was conducted in two stages:
- Topic expert research interviews: eight semi-structured interviews of approx. one hr were carried out as part of the evidence gathering process. Interviewees were sent a briefing of key areas of enquiry prior to their interview to aid their preparation. Ricardo recorded each discussion as meeting recording, transcript and attendee notes.
- Stakeholder workshop: Stakeholder input was sought to scrutinise findings and ensure the SWOT and PESTLE are as complete and robust as possible. This engagement was delivered through a one hour structured on-line meeting held on the 16th October 2023 with a combination of stakeholders who had already contributed to individual interviews and representatives of wider organisation and businesses. Initial finding were presented by the project team and comment on accuracy, completeness and additional considerations sought throughout.
Following the meeting, the presentation and list of questions (below) was sent to all attendees with an invitation for follow up comment.
Insights were gained into:
- What influences farmer and land-manager decisions on energy cropping.
- Wider concerns or questions about potential implications.
- Benefits and disadvantages of energy crops.
- Opportunities to drive greater uptake.
- Insights in economic aspects and state of knowledge on this for Scotland in particular.
Feedback reflected some of the points of discussion and debate that were identified in the REA such as questions over what land is suitable and how best to use land given Scotland’s climate targets and other priorities, and debate over yields, prices and how to ensure wider environmental benefits from energy crops, and to what extent this is possible in Scotland.
The insights from this stakeholder engagement have been integrated into Section 4 Evidence Base and Section 7 SWOT & PESTLE analysis.
Summary of questions posed to stakeholders during the engagement element of the project:
General:
- Do you think there are opportunities for farmers and land managers in Scotland to benefit from producing perennial energy crops?
- If so, which crops, locations and circumstances do you think could be most economically viable, and why?
- How could we improve our costings and economic assumptions to make them more reflective of the reality of the Scottish context?
- What economic and other considerations would most influence farmers’ and land-managers’ decision to start producing energy crops?
- What are the most significant potential benefits and challenges at a wider economy scale?
Economic analysis at farm scale
- How could we improve our costings and economic assumptions to make them more reflective of the reality of the Scottish context?
- Would you suggest any adjustments to our costs?
- Would you suggest any adjustment to our yield or prices?
- Are the rotation lengths appropriate?
Preferred locations
- How is best to select preferred biomass locations? E.g. based on areas in proximity to market usage? Or based on land with best production potential?
- Are there any existing or proposed large-scale biomass plants in Scotland?
- What is a maximum travel distance from farm to plant?
- Are there any key biomass planting / harvesting contractors in Scotland? If so, where?
Output of Stakeholder Engagement
The output of the stakeholder interviews included suggestions for data and information sources to support the economic analysis. Stakeholders also provided commentary on the opportunities and challenges of perennial energy crop production in Scotland; this is summarized below:

|
Miscanthus |
Short Rotation Coppice |
Short Rotation Forestry |
|
Low input & maintenance costs Use existing harvester (maize harvester) Alternative markets (eg bedding) Earlier harvest income than SRC/SRF & annual harvest Knowledge base/innovation pipeline Harvest contractor employment Soil health |
Sequential planting to allow harvest every year (albeit small volumes) Opportunity to improve efficiency with modern machinery Potential for biodiversity net gain / natural capital payments Soil health / shelter benefits for other enterprises on farm. |
No costs whilst growing Alternative markets (for same diameter wood/ maybe to grow on) Suits wider range of conditions Potential community involvement Shelter for livestock / crops Poor cashflow |
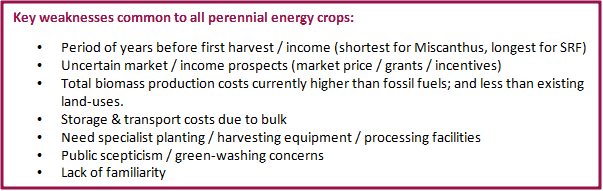
|
Miscanthus |
Short Rotation Coppice |
Short Rotation Forestry |
|
Upfront cost: 2-3yrs to harvest Winter hardiness challenge (although new cultivars being developed) Land-use change carbon stock Challenge sourcing planting stock |
Need access to drying / chipping Farmers consider financially risky Limits rotation flexibility Risk of sharing neighbour crop Pests: willow rust Yield uncertain over lifetime |
Need access to drying / chipping Change of land-use/payment lost Limits rotation flexibility Risk of sharing neighbour crop Longest period before harvest Less research in Scotland Competition for wood output |
Individual stakeholder interviews:
|
Crops4Energy |
Kevin Lindegaard |
Director of Crops for Energy |
|
Eadha Enterprises |
Peter Livingstone |
CEO |
|
NatureScot |
Cécile Smith |
Climate Change & Land Use Adviser |
|
NatureScot |
Kirsty Hutchison |
Agricultural Officer | Natural Resource Management |
|
NFUS |
David Michie |
Crop Policy Lead |
|
NFUS |
Kate Hopper |
Policy Manage Climate Change |
|
Scottish Forestry |
Jason Hubert |
Head of Forest Sector Development |
|
Willow Energy |
Jamie Rickerby |
Director |
Stakeholder online workshop attendees:
|
Scottish Land and Estates |
|
Terravesta |
|
Crown Estate Scotland |
|
SRUC/BiomassConnect |
|
CONFOR |
|
SEPA |
|
NFUS |
|
AHDB |
|
Willow Energy |
|
CAAV |
|
SOAS |
|
Crops4Energy |
|
Scottish Forestry |
|
Director of International Land Use Study Centre – James Hutton Institute |
|
NatureScot |
|
AHDB |
|
Scottish Land and Estates |
Appendix I: Biomass Feedstock Innovation Funding in the UK
|
There is currently significant investment in innovation to increase the production of sustainable domestic biomass, including the Biomass Feedstocks Innovation Programme[68], which is funding innovative ideas that address barriers to biomass feedstock production across the UK. It is supporting projects those seeking to improve productivity through breeding, planting, cultivating and harvesting. Summaries of the 12 funded projects, taken from the GOV.UK programme page, are given below[69].
Led by UK Centre for Ecology & Hydrology. The Biomass Connect Phase 2 project will create a demonstration and knowledge sharing platform to showcase best practice and innovations in land-based biomass feedstock production.
Led by Verna Earth Solutions Ltd (formerly Forest Creation Partners Limited). Project BIOFORCE will create and demonstrate new, upgraded versions of Forest Research’s industry-standard Ecological Site Classification (ESC) tool, and Verna’s successful ForestFounder system.
Led by SeaGrown Limited. Scarborough-based SeaGrown operates a 25-hectare offshore seaweed farm in the North Sea off the Yorkshire Coast. This project seeks to apply SeaGrown’s experience in pioneering this new sector to create an innovative, automated end-to-end seaweed farming system.
Led by Agri Food and Biosciences Institute (AFBI).The EnviroCrops web app is envisaged as a central source of impartial information in an easy to access, free or low-cost, user-friendly format, that will enable farmers, land managers and consultants to make an informed decision about planting biomass crops.
Led by Aberystwyth University. The aim of this project is to demonstrate the application of genomic selection (GS) in accelerating the breeding of high yielding, resilient Miscanthus varieties for the UK.
Led by New Energy Farms EU Limited. The project objectives are to increase the number of energy grass varieties that are available, increase yield and develop agronomic improvements to multiplying and planting energy crops.
Led by Terravesta Farms Ltd. The project will utilise the Terravesta Harvest Hub platform to integrate data collected from all stages of our establishment pipeline alongside their existing harvest and growth data. Through data integration with the current supply chain, the OMENZ team will gain insights into long term crop performance and improve the entire Miscanthus biomass supply chain, benefiting both growers and end-users.
Led by White Horse Energy Ltd in developing and constructing a robust mobile pelletiser enabling farms to process a range of feedstocks, enabling domestic biomass pellets to displace imported pellets in the UK energy supply mix.
Led by Teesdale Environmental Consulting Ltd (TEC Ltd). The Teesdale Moorland Biomass Project aims to utilise existing managed heather moort and harvest commercially viable biomass products from naturally generated moorland crops that are currently burned in situ as part of annual land management practices.
Led by University of Surrey. The project uses novel aeroponic technology to rapidly cultivate Short Rotation Coppice (SRC) willow cuttings which can be planted into the field for bioenergy.
Led by Rickerby Estates Ltd. The team is developing innovations aimed at revolutionising the industry and maximising marginal gains through more efficient machinery.
Led by Rothamsted Research. The Accelerating Willow Breeding and Deployment (AWBD) project will accelerate the breeding of SRC willow and generate information to guide the intelligent deployment of current varieties. |
Appendix J: SWOT and PESTLE Analysis: Detailed Results
The SWOT analysis assessed the current economic potential for perennial energy crops for farmers and land-managers in Scotland, looking at strengths, weaknesses, opportunities, and threats (SWOT) to provide a simplified picture and more clarity of what would be needed in order for these crops to be an attractive proposition economically, whilst also considering the other factors which farmers and land-managers would be likely to consider alongside the economics. The SWOT tables below are grouped according to the following categorisations:
- Perennial energy grasses (primarily Miscanthus);
- Short rotation coppice (primarily Willow);
- Short rotation forestry (including broadleaved; conifer)
Table G1. SWOT table covering Perennial energy grasses, focused on Miscanthus.
|
Strengths |
Weaknesses |
|
|
|
Opportunities |
Threats |
|
|
Table G2. SWOT table covering Short Rotation Coppice
|
Strengths |
Weaknesses |
|
|
|
Opportunities |
Threats |
|
|
Table G3. SWOT table covering Short Rotation Forestry
|
Strengths |
Weaknesses |
|
|
|
Opportunities |
Threats |
|
|
PESTLE Analysis of economic potential of energy crops in Scotland
Energy crops are subject to a range of enabling and preventative factors which would influence the benefits and potential uptake of the crops in Scotland. A political, economic, social, technical, legal, and environmental (PESTLE) analysis was therefore undertaken to assess the potential to…increase economic viability and uptake of energy crops in Scotland This assessment was produced following the SWOT analysis to incorporate the strengths and opportunities of each energy crops (and more generally) identified in the SWOT.
Table G4. Summary PESTLE Analysis: enabling and preventative factors for economically viable energy crops in Scotland
The combination of high production costs, particularly the upfront investments uncertain policies and uncertain market prices for future harvests discourage farmers from growing SRC plants. (Zięty et al, 2022)
|
|
ENABLER |
BARRIER |
|
Political |
|
|
|
Economic |
|
|
|
Social
|
|
|
|
Technical
|
|
|
|
Legal
|
|
|
|
Environmental
|
|
|
Appendix K: Biomass plants included for proximity analysis
|
Operator |
Site Name |
Installed Capacity (MWel) |
CHP |
Development Status |
|
RWE |
Markinch Biomass CHP Plant |
65.00 |
Yes |
Operational |
|
E.ON |
Stevens Croft |
50.40 |
No |
Operational |
|
SIMEC/ Liberty House |
Liberty Steel Dalzell |
17.00 |
Operational | |
|
Norbord (West Fraser) |
Cowie Biomass Facility |
15.00 |
No |
Operational |
|
EPR Scotland |
Westfield Biomass Power Station |
12.50 |
No |
Operational |
|
Speyside Renewable Energy Partnership |
Speyside Biomass CHP Plant |
12.50 |
Yes |
Operational |
|
Scottish Bio-Power |
Rothes Bio-Plant |
8.30 |
Yes |
Operational |
|
University of St Andrews |
Sustainable Power and Research Campus |
6.50 |
Yes |
Operational |
How to cite this publication: Dowson, F., Leake, A., Harpham, L., Willcocks, J., Peters, E., David, T., Bates, T., Wood, C. (2024). ‘Economic potential of energy crops in Scotland’, ClimateXChange. http://dx.doi.org/10.7488/era/5478
© The University of Edinburgh, 2024
Prepared by Ricardo plc on behalf of ClimateXChange, The University of Edinburgh. All rights reserved.
While every effort is made to ensure the information in this report is accurate, no legal responsibility is accepted for any errors, omissions or misleading statements. The views expressed represent those of the author(s), and do not necessarily represent those of the host institutions or funders.
ClimateXChange
Edinburgh Climate Change Institute
High School Yards
Edinburgh EH1 1LZ
+44 (0) 131 651 4783
IEA, 2017 IEA Technology Roadmap: Delivering Sustainable Bioenergy, Unlocking the potential of bioenergy with carbon capture and utilisation or storage (BECCUS) – Analysis – IEA, License: CC 4.0 ↑
Land Capability for Agriculture in Scotland | Exploring Scotland | The James Hutton Institute – the study identified the capability classes for agriculture 4.1 to 6.1 and classes for forestry F1 to F5. ↑
Williams et al (for Ricardo), 2023, Report for the Scottish Government: Negative Emissions Technologies (NETS): Feasibility Study: Negative Emissions Technologies (NETS): Feasibility Study – gov.scot (www.gov.scot) ↑
Stakeholder interview ↑
Bioenergy Crops Better For Biodiversity Than Food-Based Agriculture | University of Southampton ↑
Defined as land which was primary forest, designated for nature protection, highly biodiverse grassland (except where harvesting is necessary to maintain grassland status), peatland, continuously forested, wetland in or after 2008. ↑
Based on a meta-analysis of 45 studies on transition to energy crops from ‘marginal’ land. ↑
Definition of marginal land may not be applicable to Scotland. ↑
Gross margin in agricultural costings is typically defined as ‘Output from the enterprise less the Variable Costs, including the allocated variable costs of grass and other forage’ ↑
Defined in the Scottish Farm business income survey as “Farms with no enterprise contributing more than two-thirds of their total standard output” – typically including livestock and crops, including animal fodder. An average income ↑
Scottish farm business income: annual estimates 2020-2021 – gov.scot (www.gov.scot) – note that the mixed farming data is an average across farms that meet the definition above. ↑
Scottish Agricultural Census: results – gov.scot (www.gov.scot) ↑
The general cropping, forage category has only one scenario due to the data coming from the Scottish Government Census data which doesn’t provide a low, medium and high scenario and the cost data coming form the Farm Management Handbook 2023/2024 ↑
Scottish farm business income: annual estimates 2021-2022 – gov.scot (www.gov.scot) ↑
Gross margin is farm income from a specific production enterprise, e,g, crop or livestock minus costs directly associated with production of that output, but excluding ‘fixed costs’ such as costs associated with farm buildings, general labour and finance costs. Further detail available in: Appendix E Methodology for economic analysis. ↑
The transition of a large land area – scenario 2 – to PECs creates a loss because of the assumptions within our study – we assumed that land which is more economically advantageous for PECs would be converted preferentially, so a larger portion of land transitioned in scenario 1 would make a profit from the transition to PECs, whereas in scenario 2 a large area of land which would make a loss from the transition was included, and so resulted in a total loss on balance. ↑
This study focused mostly on Miscanthus and SRC, but has been used as a best estimate here to give some basis for understanding how potential demand for bioenergy crops could evolve in future to meet Scottish Government NETs ambition. ↑
This refers to the percentage of all Non-LFA Cattle and Sheep land in Scotland – suitable and not suitable for PECs. ↑
Methodology and maps of potential production areas of the three crops produced within the previous project are in Appendix F. ↑
https://www.gov.uk/government/publications/renewable-energy-planning-database-monthly-extract. The database only includes plants generating electricity so large biomass boilers are not captured. ↑
Scottish Emissions Targets – first five-yearly review (theccc.org.uk) ↑
Green growth for Scotland with multi billion pound investment – GOV.UK (www.gov.uk) ↑
These three types of BECCS (Bioenergy with Carbon Capture and Storage) were identified in CCPu, along with BECCS in industry, as potential options for Scotland. ↑
This study focused mostly on Miscanthus and SRC, but has been used as a best estimate here to give some basis for understanding how potential demand for bioenergy crops could evolve in future to meet Scottish Government NETs ambition. ↑
Based on stakeholder comments. ↑
Securing a green recovery on a path to net zero: climate change plan 2018–2032 – update – gov.scot (www.gov.scot) ↑
The-Sixth-Carbon-Budget-The-UKs-path-to-Net-Zero.pdf (theccc.org.uk) ↑
https://www.theccc.org.uk/publication/scottish-emission-targets-progress-in-reducing-emissions-in-scotland-2022-report-to-parliament/ ↑
Supporting documents – Negative Emissions Technologies (NETS): Feasibility Study – gov.scot (www.gov.scot) ↑
Update to the Climate Change Plan 2018 – 2032: Securing a Green Recovery on a Path to Net Zero (www.gov.scot) p. 193 ↑
Agroforestry is the practice of planting trees, usually to produce a crop of food or wood products, on farmland in combination with arable or livestock farming, often in small patches or strips with fields. ↑
The just transition principles are defined in the Scottish legislation as:
‘the importance of taking action to reduce net Scottish emissions of greenhouse gases in a way which:
a) supports environmentally and socially sustainable jobs,
b) supports low-carbon investment and infrastructure,
c) develops and maintains social consensus through engagement with workers, trade unions, communities, non-governmental organisations, representatives of the interests of business and industry and such other persons as the Scottish Ministers consider appropriate,
d) creates decent, fair and high-value work in a way which does not negatively affect the current workforce and overall economy,
e) contributes to resource efficient and sustainable economic approaches which help to address inequality and poverty.’ ↑
Draft Energy Strategy and Just Transition Plan (www.gov.scot) ↑
A Contract for Difference (CfD) is a private law contract between a low carbon electricity generator and the Low Carbon Contracts Company (LCCC), a government-owned company. Contracts for Difference – GOV.UK (www.gov.uk) ↑
Teagasc- Miscanthus Energy Crop Miscanthus Energy Crop – Teagasc | Agriculture and Food Development Authority ↑
Sustainable Bioenergy Feedstocks Feasibility Study report for the Department for Business, Energy and Industrial Strategy (BEIS) published in 2021 ↑
Miscanthus Growers’ Handbook (forestresearch.gov.uk) ↑
Sustainable Bioenergy Feedstocks Feasibility Study report for the Department for Business, Energy and Industrial Strategy (BEIS) published in 2021 ↑
Short rotation coppice (SRC) – Crops4energy ↑
Short rotation coppice establishment – Forest research ↑
As above ↑
Feedstocks innovation study task 1 report ↑
https://nora.nerc.ac.uk/id/eprint/512448/1/N512448CR.pdf ↑
Teagasc Miscanthus best practice guidelines Miscanthus_Best_Practice_Guidelines.pdf (teagasc.ie) ↑
Energy crops need support to fulfil potential – Farmers Weekly ↑
DEFRA Area of crops grown for bioenergy in England and the UK Area of crops grown for bioenergy in England and the UK: 2008-2014 – GOV.UK (www.gov.uk) ↑
Forestry sector workforce ‘chronically under-resourced’ | The Scottish Farmer ↑
Forest Research -Short Rotation Forestry Establishment Microsoft Word – TD Project Report FCS SRF DI SRMast v AJH.doc (forestry.gov.scot) ↑
Dependent on size of planting area and location in relation to National Scenic Areas and other sensitive areas – latest guidance available from Forestry Scotland. Scottish Forestry – Environmental Impact Assessments ↑
Hemp Project | The Rowett Institute | The University of Aberdeen (abdn.ac.uk) ↑
Hemp-as-Biomass-Crop-1.pdf (biomassconnect.org) ↑
HEMP-30 catalysing a step change in the production – phase 1 report (publishing.service.gov.uk) ↑
Carbon-busting hemp could help transform Scottish agriculture to zero emissions (theconversation.com) ↑
Agroforestry systems as new strategy for bioenergy — Case example of Czech Republic – ScienceDirect ↑
GDP deflators at market prices, and money GDP March 2023 (Quarterly National Accounts) – GOV.UK (www.gov.uk) ↑
GDP deflators at market prices, and money GDP March 2023 (Quarterly National Accounts) – GOV.UK (www.gov.uk) ↑
Section 2: Plant biomass: Miscanthus, short rotation coppice and straw – GOV.UK (www.gov.uk) ↑
Scottish farm business income: annual estimates 2021-2022 – gov.scot (www.gov.scot) ↑
Scottish Agricultural Census: results – gov.scot (www.gov.scot) ↑
fas.scot/downloads/farm-management-handbook-2022-23/ ↑
Source: Scottish Farm Management Handbook 2022-23 ↑
Source: Final Results of the June 2021 Agricultural Census: Table 12 ↑
Green Book supplementary guidance: discounting – GOV.UK (www.gov.uk) ↑
June Agricultural Census (ruralpayments.org) ↑
The James Hutton Institute, N.D., Land Capability for Agriculture in Scotland. https://www.hutton.ac.uk/sites/default/files/files/soils/lca_leaflet_hutton.pdf ↑
https://www.gov.uk/government/publications/biomass-feedstocks-innovation-programme-successful-projects ↑
https://www.gov.uk/government/publications/biomass-feedstocks-innovation-programme-successful-projects/biomass-feedstocks-innovation-programme-phase-2-successful-projects ↑
Research completed: July 2024
DOI: http://dx.doi.org/10.7488/era/5506
Executive summary
The Scottish Government’s Carbon Calculator for wind farms on Scottish peatlands was developed in 2008, to calculate the impact of wind farm development on peatland carbon stocks in Scotland and thereby support decision making. Electricity generation emission factors are updated annually, but no major revisions have been made to the Carbon Calculator since 2014.
Aims
The increased focus on the transition to net zero might affect the suitability of the Carbon Calculator for future use. This research conducted a detailed review of the latest spreadsheet version of the Carbon Calculator (v2.14), which mirrors the web version (v1.8.1). It provides an evidence base for future considerations and recommendations.
This review has initiated further discussions and highlighted the need for ongoing engagement, which will be instrumental in the development of the Carbon Calculator.
Key findings
Based on the findings of a technical assessment, evidence review and quality control mechanisms, we recommend that when considered against recent policy updates and advancements in science, the Carbon Calculator, in its current form, should be updated. Each area of the Carbon Calculator was assessed for scientific accuracy and data availability:
- The ‘payback time and CO2 emissions’ are not relevant/consistent with the findings of the technical assessment and literature review. It is important to consider whether emissions due to turbine life and back up are required, given new planning policy and the applicability of whole lifecycle carbon assessments.
- For all peat-related areas of the Carbon Calculator, as well as the forestry area, accuracy is lacking in one or more methodologies, use of emission factors and assumptions.
- While some data are accessible to users, it is not clear if they are able to accurately obtain some of that data – in particular, for variables that drive the results (the water table depth and extent of drainage), which could affect the accuracy of outputs.
In addition to the technical assessment, the research has triggered the need to examine the wider planning and consenting context through the following questions:
Does the calculator need to consider the lifecycle emissions of the wind farm, or could the focus be purely on the impact of development on peat?
Well established methods and tools are available to undertake Whole Life Carbon Assessments (e.g. PAS2080), including forthcoming offshore wind carbon footprinting guidance. This aspect of the Carbon Calculator might not be necessary as it replicates these approaches. Instead, it may be more beneficial to concentrate efforts on analysing the specific impacts of development on peatlands/habitat carbon emissions.
Is the output of the Carbon Calculator useful as a decision-making tool?
Since the inception of the Carbon Calculator, it has become clearer that improving and restoring biodiversity is important to tackling climate change. This progress is reflected the National Planning Framework 4’s mitigation hierarchy.
As the UK transitions to net zero, the current ‘carbon payback’ approach becomes less relevant, as it compares development emissions to the counterfactual of electricity generated by fossil fuels. The focus should shift to evaluating the impact of the developments on the natural environment, specifically, whether it improves the environment and sequesters CO2 effectively.
To better assess the development’s impact on peatland carbon emissions, the timeline for achieving ‘carbon payback’ or ‘carbon neutrality’ should consider land-based emissions. For example, ‘payback time’ could be defined as the period needed to restore peatland to a ‘near pristine’ condition from a reported baseline, compared to the site’s baseline emissions without development and counterfactual scenarios for non-peaty sites, and Scotland’s widespread peatland restoration efforts.
Should the Carbon Calculator incorporate other land use types?
This would offer a more comprehensive view of the carbon impact on other land use types, as compared to the carbon impact on peatland. This aspect should be evaluated considering Scotland’s evolving biodiversity net gain requirements, current Peatland Management Plans (PMP), Habitat Management Plans (HMP), and their anticipated updates.
Are the quality controls sufficient?
There are no in-built quality control mechanisms within the Carbon Calculator. Due to its complexity and skillsets required to review the data outputs, the Carbon Calculator is not used as a decision-making tool in the capacity it is intended. Additional quality controls would be beneficial.
The future of the Carbon Calculator
In addition to the technical review, the report also considers the future of the Carbon Calculator in terms of a review of incorporating high-resolution spatial data (HRSD) and/or peatland condition categories (from the Peatland Carbon Code), and applicability of the Carbon Calculator to other developments.
Integrating HRSD into the Carbon Calculator would enable an understanding of land cover types, providing proxies for peat condition and water table depth. This could reduce the need for manual site surveying for data collection and enable wider evaluation of the site.
We recommend that the integration of HRSD is explored for future versions of the Carbon Calculator, to ascertain the level of accuracy these enhancements could bring (i.e. through reduced manual inputs and/or quality controls). This can be done in conjunction with the findings from Scottish Government’s exploration of a national LiDAR mapping scheme.
The Peatland Code’s emission calculator provides emission factors to calculate the average net emissions from peatland in various conditions, based on the UK inventory. Whilst not Scotland-specific, integration of the peatland condition categories could provide a recognised approach to quantifying the benefits of peatland restoration activities.
There is potential for the Carbon Calculator to be adapted and applied to grid infrastructure and other development types on peatland and carbon rich soils, even though it is currently employed solely for wind farm developments. There are no concerns on the Carbon Calculator’s ability to be used on projects of all sizes. However, to be applied to different infrastructure types, consideration would need to be given to their unique spatial aspects, e.g. the effects of shading and effect of excess heat for solar farms. Further research is needed to understand the implications of other infrastructure developments on peatland and carbon rich soils prior to extending the applicability of the Carbon Calculator.
Glossary / Abbreviations
|
Baseline |
Current baseline represents existing GHG emissions from the project boundary site prior to construction and operation of the project under consideration (IEMA, 2022). |
|
Carbon-rich soils |
Organo-mineral and peat soils are known as carbon-rich soils. A peat soil is defined in Scotland as when soil has an organic layer at the surface which is at least 50cm deep. Organo-mineral soil or peaty soil is soil which has an organic layer at the surface less than 50cm thick and overlies mineral layers (e.g. sand, silt and clay particles). There is also a relatively rare group of soils in Scotland known as humose soils. These have organic rich layers with between 15 and 35% organic matter. These are mineral soils but also considered to be carbon rich. |
|
Dissolved Organic Carbon |
fraction of organic carbon that can pass through a filter with a pore size between 0.22 and 0.7 micrometres. |
|
High-Resolution Spatial Data |
High-resolution spatial data refers to detailed information about the Earth’s surface captured with exceptional precision by satellite imagery. |
|
Life Cycle Assessment |
A Life Cycle Assessment (LCA) is a methodology for assessing environmental impacts associated with all the stages of the life cycle of a commercial product, process, or service. |
|
PAS 2080 |
PAS 2080 is a globally applicable standard for managing carbon in infrastructure. The standard looks at the whole value chain of a project and aims to reduce carbon and cost through design, construction, and use. |
|
Particulate Organic Carbon |
fraction of organic carbon that can’t pass through a filter with a pore size between 0.22 and 0.7 micrometres. |
|
Payback period |
Payback period is used within the Carbon Calculator to estimate the time it will take for a wind farm to ‘offset’ the greenhouse gases emitted. I.e., the displacement of the carbon ‘costs’ of construction with the carbon ‘savings’ due to the displacement of grid-based electricity generation from non-renewable sources. |
|
Peat |
Peat is organic material formed when dead plant material collects in cool, waterlogged conditions where there is very little oxygen, it breaks down slowly forming a layer of mainly organic matter. |
|
Peat soil |
(organic soil) in Scotland is defined as soil with a surface peat layer with more than 60% organic matter and of at least 50cm thickness. |
|
Peaty soils |
(organo-mineral soil) have a shallower peat layer at the surface less than 50cm thickness over mineral layers. |
|
Peatland |
Under NPF4, peatland is defined by the presence of peat soil or peaty soil types. This means that “peat-forming” vegetation is growing and actively forming peat, or it has been grown and formed peat at some point in the past. Peatlands can include blanket bog, upland raised bog, lowland raised bog and fens. |
|
Peatland Code |
The Peatland Code is a voluntary certification standard in the UK and is designed for peatland restoration projects aiming to market the climate benefits of restoration. The Peatland Code ensures that restoration projects are credible and deliverable, providing assurances to carbon market buyers. The Peatland Code defines ‘peatland’ as ‘areas of land with a naturally accumulated layer of peat, formed from carbon-rich dead and decaying plant material under waterlogged conditions’. |
|
Peat Management Plan |
A peat management plan (PMP) is an operational plan in development projects on peat, describing baseline peat conditions, detail on excavation and reuse volumes, classification of the excavated material, how the excavated peat will be handled, stored, reinstated or other use or disposal. |
|
Peatland Restoration |
Carrying out an intervention which in combination with natural processes improves the hydrological function and coverage and good condition of priority peatland habitat vegetation, aiming to result in a peatland that is actively forming peat and sequestering carbon. Further detail will be stated in the Peatland Standard (under preparation). |
|
Priority Peatland Habitat |
Peatland National Vegetation Classification communities noted as a Priority Peatland Habitat are: M1, M2, M3, M15, M17, M18, M19, M20 and M25, together with their intermediates. These have been recognised under the Scottish Biodiversity Framework as being important to protect for their conservation and biodiversity value. |
|
Scottish Environment Protection Agency |
The Scottish Environment Protection Agency is Scotland’s principal environmental regulator, its main role is to protect and improve Scotland’s environment. |
|
Whole life carbon |
Assessment of emissions associated with an asset over its entire life; encompassing its development, operation, and end-of-life. |
|
CH4 |
Methane |
|
CO2 |
Carbon Dioxide |
|
DOC |
Dissolved organic carbon |
|
ECU |
Energy Consents Unit |
|
EIA |
Environmental Impact Assessment |
|
ESA |
European Space Agency |
|
GHG |
Greenhouse Gas |
|
GIS |
Geographic Information Systems |
|
HRSD |
High-Resolution Spatial Data |
|
IPCC |
Intergovernmental Panel on Climate Change |
|
JHI |
James Hutton Institute |
|
kWh |
Kilowatt-Hour |
|
LCA |
Life Cycle Assessment |
|
LiDAR |
Light Detection and Ranging airborne mapping technique |
|
MW |
Megawatt |
|
MWh |
Megawatt-Hour |
|
NASA |
National Aeronautics and Space Administration |
|
NPF4 |
National Planning Framework 4 |
|
N2O |
Nitrous Oxide |
|
PEAG |
Scottish Government’s Peatland Expert Advisory Group |
|
PMP |
Peat Management Plan |
|
POC |
Particulate Organic Carbon |
|
SAR |
Synthetic Aperture Radar |
|
SEPA |
Scottish Environment Protection Agency |
|
IUCN |
International Union for Conservation of Nature |
|
WLCA |
Whole lifecycle carbon assessment |
Introduction
Background
The Scottish Government’s Carbon Calculator for wind farms on Scottish peatlands (hereafter referred to as ‘the Carbon Calculator’) was developed in 2008 and updated in 2011 and 2014. It was developed due to concerns raised about the reliability of methods used to calculate the time taken for these facilities to reduce greenhouse gas emissions, combined with an increasing public policy demand for renewable energy following Scotland’s commitments at the time to reduce greenhouse gas emissions by reducing the use of fossil fuels for energy generation, principally; Scottish Planning Policy 6: Renewable Energy to deliver renewable energy in a way that “affords appropriate protection to the natural and historic environment without unreasonably restricting the potential for renewable energy development” (Scottish Government, 2007).
The Carbon Calculator was developed to ‘support the process of determining wind farm developments in Scotland. The tool’s purpose is to assess, in a comprehensive and consistent way, the carbon impact of wind farm developments. This is done by comparing the carbon costs of wind farm developments with the carbon savings attributable to the wind farm.’ (Nayak et al, 2008). The output of the Carbon Calculator compares the carbon costs of a wind farm development with the carbon savings attributable to the production of renewable energy (when compared to a counterfactual alternative). Electricity generation emission factors are updated annually, but no major revisions have been made to the Carbon Calculator since 2014.
The Scottish Environment Protection Agency (SEPA) developed the Carbon Calculator into a web Carbon Calculator (C-CalcWebV1.0), which has been available since 2016. The calculator is currently owned by the Scottish Government and is hosted and maintained by SEPA. The Carbon Calculator is currently used by developers to submit project carbon assessments. These submissions are then evaluated by the Energy Consents Unit (ECU) as part of the application for consent.
An evolving legislative, policy, science, and technology landscape
In the 16 years since the Carbon Calculator’s inception, there has been an increased focus on the transition to net zero, with updates to Scottish legislation and policy reflecting this shift. Key legislation and policy drivers include:
- The Climate Change (Emissions Reduction Targets) (Scotland) Act 2019 (updated): sets a key driver for Scotland to deliver and meet its carbon reduction targets.
- Scotland’s National Planning Framework 4 (NPF4) (adopted in February 2023): sets the framework for development across Scotland, including renewable energy. NPF4 includes national planning policies which set out ‘to protect carbon-rich soils, restore peatlands and minimise disturbance to soils from development’. Policy 5 sets out a mitigation hierarchy[1], and new development proposals on peatlands, carbon-rich soils, and priority peatland habitat are only supported in certain limited circumstances, including renewable energy generation. The policy also outlines the need for a site-specific assessment (such assessments may include peat depth surveys, Peat Landslide Hazard Risk Assessment, and detailed habitat and condition surveys) to identify the likely net effects of the development on climate emissions and loss of carbon. The mitigation hierarchy can be achieved through the Construction Environmental Management Plan, Habitat Management Plan (HMP), and Peat Management Plan (PMP), developed at the application stage.
There have also been significant advancements in science and technology during this period. The collective understanding of peatland science has evolved, and research, technology, and collaborative groups have fostered a greater understanding of the science, with the likes of the Peatland Code and NatureScot National Peatland Plan emerging as a result. This new legislative, policy and science landscape highlight the need for a comprehensive review of the Carbon Calculator’s original design and purpose.
Aim of the report
This report provides the findings of a technical assessment of the latest spreadsheet version of the Carbon Calculator (v2.14), which mirrors the web-version (v1.8.1) to determine if in its current form it remains fit for purpose, considering recent policy updates, the ongoing transition to net zero, and advancements in science. Furthermore, the report provides an evidence base for future considerations and explores how the Carbon Calculator could be improved via Peatland Code category integration, use of High-Resolution Spatial Data (HRSD), and improved quality controls.
Carbon Calculator Technical Assessment
Overview
The Carbon Calculator features numerous components used to assess the carbon impact of wind farm developments on Scottish peatland. The Carbon Calculator is split into the areas shown in Table 1. Appendix 11.3 provides a detailed breakdown of each section, including their specific calculations and assumptions.
Table 1: Carbon Calculator Section
|
Areas of the Carbon Calculator |
Report Section |
|
Data inputs |
3.2 |
|
The core input data, forestry input data, and construction input data tabs are used by the user to insert key variables into the Carbon Calculator, to inform the development’s estimated payback time and CO2 emissions. | |
|
Payback time and CO2 emissions |
3.3 |
|
Collates the results from each area of the Carbon Calculator and presents the carbon payback period and carbon intensity per kWh electricity generated. | |
|
Wind farm CO2 emission savings |
3.4 |
|
Savings are calculated against the electricity generated by coal, a fossil-fuel mix, and the UK average grid mix, multiplied by the wind farm’s lifetime electricity generation at the time of the development’s application. | |
|
Emissions due to turbine life |
3.5 |
|
Emissions associated with turbine life (manufacturing, construction, and decommissioning) are presented based on user input or estimated based on installed capacity. Emissions associated with foundations (concrete) are calculated separately. | |
|
Loss of carbon due to back up power generation |
3.6 |
|
Emissions associated with back up requirements are calculated against the electricity generated by coal, a fossil-fuel mix, and the UK average grid mix, multiplied by the wind farm’s lifetime electricity generation. | |
|
Loss of carbon fixing potential of peatlands |
3.7 |
|
Quantification of the annual carbon sequestration from bog plant fixation (without the wind farm) and thereby the loss as a result of development. | |
|
Loss of soil CO2 |
3.8 |
|
Emissions associated with loss of soil organic carbon from the peat removed and peat drained. | |
|
CO2 loss by DOC and POC loss |
3.9 |
|
CO2 losses from dissolved organic carbon (DOC) and particulate organic carbon (POC) within waters in drained land that has been restored. | |
|
Loss of carbon due to forestry loss |
3.10 |
|
Loss of future carbon sequestration associated with forest felling as part of the wind farm development. | |
|
Carbon saving due to improvement of peatland habitat |
3.11 |
|
Estimates the reduction in GHG emissions due to restoration following the end of the wind farm’s lifespan. |
The assessment provides a review of each area of the Carbon Calculator as outlined in Table 1. Each section consists of the following:
- Assessment findings – narrative summarising the findings from the technical assessment and evidence review. For the technical areas of the Carbon Calculator a Red, Amber, Green (RAG) rating has been provided to illustrate the technical accuracy and data availability of each area. It uses the colour rating system presented in Table 2.
- Key considerations and questions – considers the key takeaways from the assessment, and outlines questions for policy decision makers when considering revisions to the current Carbon Calculator.
|
RAG |
Criteria: Scientific accuracy |
Criteria: Usability |
|
White |
Not applicable (rationale explained within narrative). | |
|
Green |
The methodologies, use of emissions factors and assumptions are relevant and consistent with best practice. |
Data is site/project specific, is available to the Carbon Calculator user, and supports an accurate outcome. |
|
Amber |
Accuracy is lacking in one or more methodologies, use of emissions factors and assumptions. |
There is some uncertainty around the data availability. |
|
Red |
The methodologies, use of emissions factors and assumptions are not relevant/consistent with findings of the literature review. |
Data is not site specific/ is inaccessible/unavailable to the user. |
Assessment findings: Data inputs
Scientific accuracy
The scientific accuracy of the data inputs is provided as part of the narrative within the assessment findings for the corresponding technical areas of the Carbon Calculator (Sections 3.3-3.11). Therefore, no RAG rating has been provided.
Usability
The following commentary applies to the Carbon Calculator’s core input data. Specific commentary relating to data inputs of the technical areas of the Carbon Calculator are covered within the corresponding sections of this report (Sections 3.3-3.11).
- The user is required to input a high number of variables (i.e. for the core input data, 70 input variables are required).
- Each input variable requires an expected value, as well as a minimum and maximum range, therefore over ~200 input variables are required in total for core inputs.
- For infrastructure design related inputs (wind farm characteristics, borrow pits, foundations, access tracks, cable trenches and peat excavated) the values are well defined based on the wind farm design, therefore the minimum and maximum ranges could represent unnecessary data requirements for design related inputs given their level of certainty. If still viewed as necessary in some instances, a minimum and maximum range could be automated, and/or an optional requirement for users.
Key consideration: Minimum and maximum data inputs
Wind farm characteristics – consider removal/option to ‘opt out’ of minimum and maximum variables where site specific data is known and can be evidenced by the user.
Peat variables – Review the minimum and maximum parameters for peat variables and explore replacing with individual infrastructure specific inputs (i.e. Turbine 1, 2 etc). Industry feedback indicated that prior to completing the Carbon Calculator, users proactively aim to reduce the impact of development on peat through the design process. If there is large variation in peat parameters around the site, should more detailed site-specific data be captured (to reflect the construction and forestry ‘areas’, and/or align with the PMP reporting where individual infrastructure outputs are provided) as an alternative?
Assessment findings: Payback time and CO2 emissions
Scientific accuracy
- Although the calculations that produce the payback time and CO2 emissions are accurate (i.e. there are no errors in them), the carbon payback time that is generated (measured against the current fossil-mix of electricity generation) is a significant simplification which does not present an accurate representation of future payback. This is because the payback calculations assume a consistent counterfactual for the lifetime of the wind farm. However, as we transition to net zero, the National Grid is rapidly decarbonising and forecast to be near net zero by 2035 (DESNZ, 2023).
Usability
- Payback combines infrastructure emissions (embodied carbon from wind turbines and their construction) with site-specific factors associated with peatland disturbance, and/or management. Emissions from the wind turbine manufacturing make up the largest proportion of the emissions, and so in this context, the overall carbon impact on peat (i.e. all peat related carbon calculations) appears to the user as a small proportion.
- Currently there are no official guidelines about what constitutes an acceptable or unacceptable payback time, which would benefit both users and decision makers in determining ‘what good looks like’ for land based emissions.
Key consideration: Is the output of the Carbon Calculator useful as a decision-making tool?
As the National Grid transitions to net zero, the presented ‘savings’ (comparison to fossil generated electricity) become less relevant. It may be more appropriate to consider the ‘payback time’ as the time taken to restore the peatland condition to ‘near pristine’ from a reported baseline. To inform this, the sources of emissions could be split out and reported separately:
- Emissions resulting from land use change (the impact on land carbon emissions as a result of the development including all peatland and other carbon rich soil related carbon sources), should be compared against the project site’s baseline emissions.
- Emissions associated with the construction, operation, and decommissioning (Whole Lifecycle Carbon Assessment (WLCA)) of the wind farm. To aid decision making, this should be benchmarked against industry best practice, and/or compared against the whole life carbon impact of the counterfactual (e.g. gas turbine plant). Although this may be included within a WLCA, in which case this function is not required.
- The carbon intensity of electricity generated could primarily be compared against i) the current back-up energy source of natural gas and ii) against the UK average (considering future decarbonisation) if not done so via a WLCA.
Key consideration: Is the focus of the Carbon Calculator correct?
Currently, the main use within decision making is the payback period. However, this is based on the counterfactual of electricity generated by fossil fuels. Focusing on land-based emissions and the impact of development on peatland, an alternative would be to consider the baseline site conditions and ‘payback’ time to a restored site (see 3.3.3 for suggested approach). There is widespread action to restore degraded peatland across Scotland (Scottish Government, 2024), it could be expected that if a wind farm is not developed, the sites would be restored through a variety of financial mechanisms such as the Peatland Code, and Scottish Government funding (ibid). Another relevant counterfactual could include the land-based emissions from a non-peaty site. Whether a counterfactual payback period should be updated to reflect this context is an important consideration.
Key consideration: Does the Carbon Calculator need to consider the lifecycle emissions of the wind farm, or could the focus be purely on the impact of development on peat and other carbon rich soils?
In order to demonstrate a minimisation of emissions, established methods and tools are available to undertake WLCA (e.g. PAS2080), which will include materials, construction, operational and decommissioning emissions of the entire wind farm. NPF4 Policy 2 (climate mitigation and adaptation) states that all proposals will be ‘be sited and designed to minimise lifecycle greenhouse gas emissions as far as possible.’ Given the new policy context in combination with the Carbon Calculator’s core aim (to determine the impact of development on peatland carbon emissions), key considerations include:
- Whether the lifecycle emissions of a wind farm need to be included in the Carbon Calculator?
- Could the calculations in the Carbon Calculator solely be focused on the impact of the development on peatland emissions?
- Is the presentation of the current payback output necessary or appropriate for decision making?
Assessment findings: Wind farm CO2 emission savings
Scientific accuracy
- The UK grid average is forecast to be broadly decarbonised by 2035 (BEIS, 2020). Using the current grid average (DESNZ, 2023) across the lifetime of the wind farm project represents a ‘static’ coefficient which is not representative of long-term UK grid decarbonisation over time. Additionally, over time as the grid average decarbonises this comparison will not show an operational benefit of using renewable energy.
- The UK generates ca. 1% of electricity from coal (Statista, 2024). The emissions factors in the Carbon Calculator are updated annually. If users apply the current (optional) coal factor, this factor is also a ‘static’ coefficient. Coal is due to be phased out completely by the end of September 2024 (BEIS, 2021), and therefore the ‘coal-fired electricity generation’ comparison should be removed as it is not a representative comparison.
- Renewable energy from wind and solar is not guaranteed and therefore a backup is required. Currently, where back up for renewables is required, gas peaking plants provide additional capacity. As we transition to a zero-carbon grid, natural gas will continue to be used to support both renewable back-up and additional demand (BEIS, 2020). There is also work ongoing nationally (Great Grid Upgrade, (National Grid, 2024)) to improve infrastructure and connectivity which will reduce the reliance on back-up energy requirements.
- Most of Scotland’s electricity demand is already met by renewables (Scottish Government, 2024). There is an opportunity to increase renewables across the UK and for exports, however, this will require appropriate infrastructure.
- The counterfactual emission factors only include electricity generation (i.e. the emissions associated with burning fossil fuels to generate electricity). They exclude the development of the infrastructure (i.e. the power station). Therefore, savings are based on operational energy efficiency, there is no consideration to the embodied carbon or operational maintenance of the alternative power.
- Noting the transition to net zero, consideration needs to be given to the appropriateness of represented savings.
Usability
- This section of the Carbon Calculator is used to calculate the Wind farm CO2 emissions. The input variables which inform it are acceptable in terms of usability.
See Section 3.3.4 Key consideration: Is the focus of the Carbon Calculator correct?
Assessment findings: Emissions due to turbine life
Scientific accuracy
- The methodology for estimating emissions is based on turbine capacity derived from the regression analysis of data points found within a selection of papers dated between 2002 and 2006. The wind industry has evolved in the last 20 years and these assumptions are outdated, for the following reasons:
- The average onshore wind turbine has increased over recent years to 2.5-3MW (National Grid, n.d.). the references within the current Carbon Calculator are based on studies around 1MW (Lenzen and Munksgaard, 2002; Ardente et al., 2006; Vestas, 2005) and have a direct correlation between turbine MW and embodied carbon (i.e. the greater the power, the higher the embodied carbon), however due to technology advancements (i.e. lightweighting), increased power may not require increased materials. The methodology should be updated to consider more recent manufacturer lifecycle assessments.
- The physical size of UK wind turbines (i.e. height and turbine span) have increased.
- The Carbon Calculator uses an emissions factor for reinforced concrete taken from The Concrete Centre (2013). This reference has been superseded with the most recent market data being available for 2023 (Concrete Centre, 2023) and should be updated.
- Estimations only account for lifetime emissions attributed to turbine structures and concrete hard standings. The methodology disregards emissions from the manufacture, construction, and disassembly of other wind farm assets (e.g., site fences, access tracks, battery storage, etc) (Appendix 10.1). Carbon emissions resulting from the transport of labour and materials to the construction-site is also excluded. This underestimates emissions and does not align to common WLCA practice (e.g., PAS 2080).
- Emissions exclude decommissioning; due to the uncertainty in this area this would be difficult to estimate, however it should be recognised that decommissioning activities would result in additional disruption to peat. With the net zero transition and increasing energy demand it is likely that sites will be repowered rather than decommissioned. However, as wind farm developments are only provided with consent to operate for fixed period (and should be followed by decommissioning), it may not be appropriate to include this functionality.
Usability
- Many lifecycle assessments for wind turbines include foundations (e.g. Vesta, n.d.). Therefore the ‘carbon dioxide emissions from turbine life’ variable may result in double counting of construction emissions when using the ‘direct input of total emissions’ option if not split out by the turbine provider and/or Carbon Calculator user, when paired with foundations and hardstanding emissions, and/or the construction input data tab.
- As this is a significant part of the assessment, lifecycle emissions should be modelled on site specific data.
- Depending on the size of the development, developers may be required to submit an Environmental Impact Assessment (EIA), including a WLCA. Scottish Government is preparing Planning and Climate Change guidance, which includes consideration of information sources, tools, methods and approaches (including WLCAs) that can be used to demonstrate whether and how lifecycle greenhouse gas emissions of development proposals have been minimised. For reference, there is currently an industry standard approach for wind farm LCA being developed for offshore wind developments through the Offshore Wind Sustainability JIP (anticipated to be released by the end of 2024) (The Carbon Trust, 2022).
See Section 3.3.4 Key consideration: Is the focus of the Carbon Calculator correct?
See Section 3.3.5 Key consideration: Does the Carbon Calculator need to consider the lifecycle emissions of the wind farm, or could the focus be purely on the impact of development on peat?
Assessment findings: Emissions due to back up power generation
Scientific accuracy
- Back up requirements are typically modelled using the guidance note assumption of 5% of the wind farm capacity following guidance within the Carbon Calculator (Dales et al, 2004). The wind industry has evolved in the last 20 years. From a review of literature and current policy, there are no specific requirements for back-up in planning applications for renewable energy. As the National Grid decarbonises (DESNZ, 2023) back-up will increasing be supplied by other renewable energy. Therefore, this area of the Carbon Calculator could be redundant.
- Emissions associated with back up are calculated based on a grid connection. See Section 3.4 regarding selection of counterfactual emission factors. There are other options such as interconnections, energy storage solutions and nuclear that provide alternatives (National Grid, 2024).
Usability
- The input variable is acceptable in terms of usability.
Key consideration: Should the Carbon Calculator include ‘Back-up requirements’?
From a review of literature and current policy, there are no specific requirements for back-up in planning applications for renewable energy, As the National Grid decarbonises (DESNZ, 2023) back-up will increasing be supplied by other renewable energy. Where back-up requirements are specified, it’s anticipated that these would be included within an WLCA. Therefore, this area of the Carbon Calculator could be redundant.
Assessment findings: Loss of CO2 fixing potential
Scientific accuracy
- This section of the Carbon Calculator quantifies the annual carbon sequestration from bog plant fixation (without the wind farm). The loss of carbon fixing potential is calculated from user inputs for the area which peat is removed (m2) as well as the area affected due to drainage (m2). Loss of CO2 fixing potential has a low significance within the outputs of the Carbon Calculator (typically 1-2% of the total lifetime emissions), most land-based CO2 losses due to wind farm development are associated with soil organic matter (see Appendix 11.3).
- Loss of carbon fixation is calculated based on the lifetime of the wind farm and time required until full peatland functioning is restored. No consideration is given to the condition the peatland will be restored to.
- The Carbon Calculator currently assumes that peatland is in a pristine condition and therefore is a net carbon sink. However, 80% of UK peatland is already degraded (NatureScot, 2015). Degraded peatland is likely to be a net source of emissions rather than a sink (NatureScot, 2015).
- The Carbon Calculator assumes a constant rate of carbon fixation over time, failing to take account for the impact of changing climatic conditions e.g. increased frequency of drought. See key consideration 3.7.4 on the impacts of climate change.
- The condition of the peatland is influenced by vegetation composition (Marshall et al, 2021), and degraded peat is associated with changes to vegetation structure with scrubbier species to the disadvantage of characteristic peatland species (NatureScot, n.d.). Literature was located which described the known link between ecosystem resilience and peatland vegetation (Speranskaya et al, 2024), and highlighted that the interactions between temperature, precipitation, nitrogen deposition, and atmospheric CO2 and their effects can be a result of vegetation composition (Heijmans et al, 2008).
- The literature review indicates that the Carbon Calculator’s current output for ‘loss of carbon fixation potential’ may not be accurate, because: i) the current condition of peatland may not be pristine, and may therefore have a lower carbon fixation rate, and ii) there is considerable uncertainty in the ability to restore peatland to its fully functioning ‘pristine’ state so the future fixation rate may be overestimated.
- However, no research was located which presented the relationship between peatland condition and bog fixing potential, or updated fixation emission factor rates. This is anticipated to be because other methodologies (e.g. Evans et al, 2023) do not explicitly assess the loss of bog fixing potential, but instead assess the ‘Net Ecosystem Production of the peatland’. There was also no literature located to explain how the interaction between vegetation and hydrology impacts carbon fixing potential, and so the degree to which peatland condition impacts the carbon fixation value in the Carbon Calculator is uncertain and represents an evidence gap.
- This review is unable to conclusively determine the accuracy of this area of the Carbon Calculator and whether carbon fixation is accurately represented. Although carbon fixation represents a very small proportion of the total emissions, the current assumption is likely to represent a worst case (in terms of emissions) and may be suitable in the absence of other literature to inform it. This area of the Carbon Calculator could be superseded through the integration of the Peatland Code which uses the UK inventory and includes carbon sequestration (e.g. carbon fixation from bog plants) within its net emission factors.
Usability
- Carbon fixed by bog plants is a user input (a guidance note within the Carbon Calculator states ‘the Scottish National Heritage use a value of 0.25tC/ha/yr.’ however the guidance which informs this is no longer available, and this is highlighted as an evidence gap.
Key consideration: Should the baseline condition of peatland be incorporated in the Carbon Calculator?
Whilst the loss of CO2 fixing potential will remain the same, degraded peatland is likely to be a net source of emissions rather than a sink (ibid) and there is no consideration of these emissions within the Carbon Calculator. Other reasons for incorporating the baseline condition and replication of the Peatland Code’s calculation methodology are provided within this report (see Section 3.11.1). The use of HRSD could support the identification of peatland condition.
Key consideration: Impacts of climate change
Carbon fixing potential of blanket bogs (which make up 90% of Scotland’s peatland) is anticipated to decline/be under threat by 2050-80 when considering the impact of climate change (Ferretto et al, 2019). The impact of climate change on peat has not previously been considered, however is of growing concern. Degraded peatlands are less resilient to the impacts of climate change, so the emissions will change proportionally more in degraded versus pristine peatland. Climate change is also likely to make successful restoration more challenging Norby et al (2019), although it has also been indicated that successful restoration of degraded/actively eroded sites could see the greatest CO2 improvements (Evans et al, 2023), there is variation in results of the impacts of climate change on carbon fluxes following restoration (see Section 3.11 for more information).
Assessment findings: Loss of soil CO2
Scientific accuracy: Peat removed
- Calculating volume of peat removed:
- The Carbon Calculator uses an appropriate methodology for calculating the volume of peat removed for borrow pits, turbine foundations, hard-standing and access tracks, as well as any additional peat.
- However, the use of averages may be producing a less accurate result than if actual numbers for each infrastructure feature (i.e. turbine foundation #1,2,3 etc) were inputted, as carried out in PMPs. This was reflected in industry feedback where it was highlighted that excavation volumes shown in the PMP are more realistic than what is shown in the Carbon Calculator.
- Calculating CO2 loss from removed peat:
- This is the largest source of peatland related carbon emissions because of development.
- The carbon content of dry peat and dry soil bulk density are important parameters which drive the outputs of the Carbon Calculator. Sensitivity analysis (Appendix 10.2) demonstrates the correlation between carbon content of dry peat and dry soil bulk density and carbon losses from soil organic matter. Halving the data input values of either independent variable has the impact of a 60% reduction on emissions associated with carbon losses from soil organic matter.
- Literature review findings indicate that carbon content of dry peat has a typical range of 50% to 55% and dry soil bulk density a range of 0.06 to 0.25 gcm3 (e.g., Chapman et al., 2009; Ratcliffe et al., 2018; Heinemeyer et al., 2018; Howson, 2021, Lindsay, 2010; Parry and Charman, 2013; Levy and Gray, 2015; Carless et al., 2021; Howson et al., 2022).
- The calculation methodology is appropriate.
- The Carbon Calculator assumes a worse-case scenario that all peat removed is destroyed and the carbon content is lost. Although in practice peat is often relocated, which should be more favourable, subject to it being sensitively relocated (SEPA, 2012; IUCN, 2023), there is an evidence gap in literature which illustrates successful peat relocation (i.e. via emissions rates from relocated excavated peat). In the absence of evidence, the assumption that the carbon content will be lost over time is an appropriate worst-case conclusion.
Usability: (Peat removed)
- Calculating volume of peat removed:
- The ‘average depth of peat at site’ input variable in the ‘characteristics of peatland before wind farm development’ is not applied to any of the calculations in the Carbon Calculator. However, the ‘average depth of peat removed’ from each development feature (i.e. ‘average depth of peat removed from borrow pit, hard standing, turbine foundations’) is applied to calculate the quantity of peat removed. This provides greater accuracy than the singular ‘average depth of peat at site’ variable which could be removed from the Carbon Calculator.
- Mirroring the assessment findings from 3.8.1, the data inputs for peat depth provide an average peat depth for each development feature type (e.g. ‘average depth of peat removed from turbine foundations’) they are not specific to each individual feature on which the average is may up of. For example, there will be multiple turbine foundations. The use of an average in this context may be a poor representation of the spatial variability in peat cover, as well as the positioning of infrastructure within that peat cover. This is particularly relevant where there are different peat conditions, depths and land use types across a site. Peat depth is not uniform and varies over short distances due to the underlying topography (Parry et al., 2014). Under blanket peat thickness is typically 0.4–6 m; it can be up to ten metres and often more in raised bogs, and in fens is 0.4–5m. Peat soil is defined as requiring a depth of 0.5m and a surface peat layer containing more that 60% organic matter (NatureScot, 2023). A more detailed data input, like the ‘construction and forestry input data’ sheets and/or reflecting how peat is reported in the PMP (i.e. by turbine, borrow pit etc.) could allow for a more accurate assessment of the quantity of peat removed.
- NPF4 requires consideration of peaty soils, peat soil and peatland. Whilst the Carbon Calculator can be used in its current form on any peatland and responds appropriately to shallow peat depths (inputted as averages for each infrastructure type) a more specific data input for peat depth from each area where peat is removed would allow for better differentiation between different depths.
- Calculating CO2 loss from removed peat:
- Carbon content of dry peat and dry soil bulk density are user inputs. Whilst the exact metrics will be site specific, industry feedback indicated that these data inputs were difficult to obtain due to the lab analysis requirements (to obtain accurate data peat samples requiring drying out for long periods of time) and are therefore often based on assumptions, with one user utilising the von post scale. The ranges identified from the literature review could be incorporated into the Carbon Calculator as recognised minimum and maximum parameters to inform an inbuilt quality control measure.
Key consideration: replace the use of averages with infrastructure specific inputs
This approach would provide more accurate outputs and replicate how peat is reported in the PMP.
Key consideration: Reuse of removed peat
Feedback from industry indicated that where possible projects seek to relocate peat (excavate peat for development and then reuse it where there is a need e.g. due to cut and fill balance) rather than remove from site. There were concerns the Carbon Calculator assumes a worse-case scenario. Consideration of whether the Carbon Calculator should incorporate an option to include peat reuse needs to be weighed up against whether this would be appropriate, as the reuse of peat is site specific, i.e. there will be limited sites with options appropriate for peat reuse, and unless peat for reuse is handled carefully it is likely to oxidise over time and lose carbon to the atmosphere. Options for positive reuse are highlighted as an evidence gap and would require additional research prior to updating the Carbon Calculator.
Key consideration: Incorporate minimum and maximum parameters into the Carbon Calculator for the carbon content of dry peat and dry soil bulk density variables
These two variables have a significant impact on the Carbon Calculator output. The literature review has identified an acceptable range for both variables which could act as parameters and inform quality control.
Key consideration: the use of HRSD
A recent study from JHI explored the mapping of soil profile depth, bulk density and carbon stock in Scotland using remote sensing and spatial covariates (Aitkenhead and Coull, 2020), Although further research is required to determine the appropriateness of this approach, in relation to bias in datasets, model complexity and comparison, model performance, and separate models for interrelated properties, and further engagement with JHI and NatureScot on the role of HRSD in this context is recommended as a next step.
Scientific accuracy: Peat drained
- Calculating volume of peat drained:
- Volume of peat drained is calculated based on the depth of the drain and the extent of drainage. However, accurately establishing drainage efficacy is complicated as it affected by other parameters which are not well documented, and the changes brought about by drainage are expressed over a long period of time (IUCN, 2014).
- In pristine peatland the water table is typically close to the surface. As a result of excavation, drainage causes a drop in the water table (Irish Peatland Conservation Council, n.d.). This stimulates soil respiration and the release of carbon (Ma et al., 2022).
- Drainage also leads to subsidence (Ma et al., 2022) (IUCN, 2014). Subsidence should be measured alongside the water table depth to fully inform the likely extent of drainage.
- Drainage can be influenced by distance between ditches, hydraulic conductivity, and slopes (Price et al, 2023).
- There is a linear relationship between age of a drain and the cumulative carbon lost (Evans et al, 2021).
- Within degraded peat, the local formation of drainage ‘pipes’ is common, therefore possibly enhancing the extent of drainage.
- Despite research in the area there is an evidence gap in understanding what a suitable average is, and the methodologies to define the extent of drainage are difficult to apply.
- Volume of peat drained is calculated based on the depth of the drain and the extent of drainage. However, accurately establishing drainage efficacy is complicated as it affected by other parameters which are not well documented, and the changes brought about by drainage are expressed over a long period of time (IUCN, 2014).
- Calculating CO2 loss from drained peat:
- In flooded soils, CO2 emissions are equalled or exceeded by fixation leading to near-zero emissions or net carbon sequestration, whilst in drained soils CO2 emissions exceed fixation leading to net emissions. The carbon emissions associated with peat drainage are calculated based on the difference between emissions from drained land and emissions from undrained land.
- If site is not restored after decommissioning: The Carbon Calculator assumes a worse-case scenario that all carbon is lost (i.e. full drainage) following the same approach as removed peat. Due to the uncertainty in the parameter of the extent of drainage, this approach provides an appropriate worst-case scenario.
- If site is restored after decommissioning: The Carbon Calculator calculates emissions from drained land against the lifetime of the wind farm, restoration period (as defined by the user) and considers the number of flooded days per year based on IPCC (1997) assumptions, which should be updated to reflect more recent literature (see below ‘calculating emission rates from soils’). Due to the uncertainty around end-of-life and decommissioning it may be more appropriate to assume a worse-case scenario (i.e. assume site is not restored after decommissioning), and separately account for the benefits from restoration within the ‘CO2 gain – site improvement’ tab so that it is reported separately to the impact during the lifetime of the wind farm.
- See Section 3.8.1 for commentary on ‘carbon content of dry peat’ and ‘dry soil bulk density’ data inputs.
- Calculating emission rates from soils:
- The purpose of this calculation is to determine the loss of soil carbon in the peatland as a result of a wind farm development. This is calculated from the total carbon loss from physically removed peat, and total carbon loss from peat drainage.
- There are two approaches included within the Carbon Calculator – the IPCC methodology is a default approach and excludes any site detail; the model used by Nayak et al, 2008 is provided as a site-specific option. Users have the option to use either the IPCC (1997) methodology or the site-specific methodology. However, the Carbon Calculator states the site-specific method must be used for planning applications. If the IPCC (1997) methodology is redundant, it should be removed from the Carbon Calculator.
- IPCC 1997:
- This has been superseded by the 2014 Wetland Supplement.
- Whilst the Carbon Calculator does not include N2O (as it uses IPCC (1997) emission factors), the implications of this are small, and further updates could be made to include this. Whilst not expected to be a significant emission (ca. 2%) and dependent on the nutrient content of soils, it could be incorporated based on nitrogen content of soil samples. Where relevant (in the instance of intensive farming) N2O emissions could be comparable to CH4 .
- The IPCC emission factors referenced are Tier 1, and therefore not representative of Scotland’s peatlands. The factors are mainly based on warm season data, and peatlands in colder climates are likely to emit less (Hongxing and Roulet, 2023).
- Although these Tier 1 emissions factors could be updated by those represented by Evans et al, 2023 (Tier 2) and used within the 2021 update to the Emissions Inventory for UK Peatlands, they may not be fully representative of Scotland (which is wetter, and agriculture is predominantly less intensive). Furthermore, the Carbon Calculator states the site-specific method must be used for planning applications. It is therefore recommended that the IPCC (1997) methodology is removed due to the greater accuracy that the site-specific methodology can provide.
- Nayak et al, 2008:
- Calculates emissions factors via a bespoke methodology. Two options for type of peatland provided: acid bog, and fen (core data inputs). This covers the four main peatland habitats in Scotland; blanket bog (acid bog), raised bog (acid bog), fen (fen) and bog woodland (acid bog).
- The methodology equations for CO2 and CH4 emissions are derived by regression analysis, considering the average annual air temperature and average water table depth. Whilst the methodology does not directly refer to peatland condition, it incorporates air temperature and water table depth which is a good proxy in establishing emission rates (Tiemeyer et al., 2020) (Ma et al, 2022), as the water table has a significant influence on peatland CO2 and CH4 emissions (Huissteden et al, 2016, Evans et al, 2021). Empirical relationships between water table depth and CH4 and CO2 emissions defined by Evans et al (ibid) enable it to be used to calculate carbon emissions, as illustrated by Evans et al (2023).
- The evidence base for the methodology uses multiple peer reviewed studies (Bubier et al. 1993, Martikainen et al. 1995, Silvola et al. 1996, MacDonald et al. 1998, Nykänen et al, 1998, Alm et al. 1999), the analysis includes a robust sensitivity analysis which supports accuracy. However, the studies referenced reflect boreal peatland, and this element of the Carbon Calculator could be updated to reflect more recent literature ( (Evans et al, 2021), (Evans et al, 2023), (Ojanen and Minkkinen, 2019), (Wilson et al, 2016), (Tieymer et al, 2016)) which reflects a temperate climate and/or accounts for land use type.
Usability: Peat drained
- Calculating volume of peat drained:
- The volume of peat drained is highly sensitive to the user input for the ‘average depth of peat removed’ from each development feature (i.e. ‘average depth of peat removed from borrow pit, hard standing, turbine foundations’); increasing the depth and/or extent of drainage directly correlates with the volume of peat effected by drainage. This volume feeds into the calculations for CO2 loss from drained peat.
- The average water table depth and extent of drainage is a user input. These parameters vary depending on the specific site, and within the site itself. Authors of the Carbon Calculator, Nayak et al (2008) underline the importance of accuracy in the choice of these inputs. However, the cost of correctly following the methodologies presented in the Carbon Calculator were highlighted by industry stakeholders as ‘prohibitively high’ for projects that may not obtain planning consent.
- Average water table depth variable: The Carbon Calculator describes this variable as the upper boundary of the groundwater. Considerable variety in the method used to obtain the ‘average water table depth’ by users was observed – from obtaining an average depth via hydrologists, to using the water table depth from a previous similar site. Evidence of the hydrology calculations to inform user inputs were not assessed as part of this research, and could merit further research in conjunction with a review of other EIA deliverables and their applicability to the Carbon Calculator’s data inputs. The narrow timescales associated with the preparation of planning documents (i.e. EIA) present a challenge in obtaining reliable information, and the current approach does not account for the temporal changes of the water table. The Carbon Calculator output likely only represents a ‘snapshot’ which consequently, in combination with the variety in approaches to obtaining the variable, may be inaccurate.
- Average extent of drainage around drainage features at site’ variable: Industry feedback on this variable’s method was resolute in it being impractical to collect this data (due to both time requirements and associated cost) during planning timescales. Despite reviewing available evidence, a practical methodology (i.e. within planning timescales) to inform this variable could not be identified.
- Calculating CO2 loss from drained peat:
- See Section 3.8.2 for commentary regarding carbon content of dry peat and dry soil bulk density.
- Emission rates from soils:
- See Section 3.8.2 for commentary regarding emission rates from soils.
Key consideration: update the methodology for emissions rates from soils
The methodology should incorporate recent literature and a temperate peatland that reflects the Scottish context, it should also acknowledge the role of the mean annual water table depth, which has been identified as the overwhelmingly dominant control on CO2 fluxes (Evans et al, 2021). The literature review identified papers which should be reviewed when undertaking this update:
- Tiemeyer et al (2020)’s ‘A new methodology for organic soils in national greenhouse gas inventories: Data synthesis, derivation and application’ incorporates HRSD and uses water table data to determine Germany’s GHG estimate for organic soils at a National level, which it states could be applied at a project level.
- Evans et al (2023) ‘Aligning the Peatland Code with the UK peatland inventory’ provides an overview of low-cost methodologies to obtain site data to inform peat-carbon variables, including water table depth and reference to ‘Eyes on the bog’ methodologies (Lindsey et al, 2019).
Key consideration: should the Carbon Calculator account for emissions from drainage ditches?
Although the extent of drainage is captured in the Carbon Calculator, drainage ditches represent an additional source of CH4 emissions from drained organic soils (Peacock et al, 2021) which are not currently included in the calculations. Emissions from ditches are captured in the IPCC’s 2014 Wetlands supplement and could be applied to developments if the Carbon Calculator were to specify to peat condition, to replicate the approach used in the Peatland Code (Evans et al, 2023). The inclusion of drainage ditches could also be informed by the use of HRSD (see 3.8.12).
Key consideration: Investigate the use of HRSD in measuring water table depth
HRSD can be utilised to ascertain water table depth and provide historic trends. This could enhance the accuracy of Carbon Calculator when combined with ground truthing. For more information, please see Section 5. This could also inform Quality Control Mechanisms.
Key consideration: to what extent can assumptions/parameters, and HRSD be used to inform ‘Average extent of drainage around drainage features at site’?
The current methodology to obtain the extent of drainage is viewed as being impractical within planning timescales. Whether this variable (using an indicative assumption) should be automated, and/or include parameters, requires careful consideration, particularly as it is a highly sensitive input. The IUCN classifies drained peatland as that which lies within 30m of an active drain, (IUCN, 2022). The literature review was unable to determine a range to inform parameters on this variable, although it did identify a paper where GIS was utilised to establish surrounding drainage areas (Sallinen et al, 2019). The role of HRSD in informing this input variable should be considered in conjunction with other efforts being undertaken to establish better accuracy in quantifying drainage impacts. This includes work undertaken (and ongoing) at the James Hutton Institute (e.g. Aitkenhead et al, 2016, the Peat Mothership Project (2024)) to inform the best approach. Discussion of the draft report highlighted an additional study utilising HRSD to provide a national scale map of Scotland’s individual drainage channels and erosion features (Macfarlane et al, 2024) which would further inform the role of HRSD in this context and Section 3.8.10.
Key consideration: what quality control mechanisms are needed to enable a consistent (and accurate) approach to obtaining WTD and extent of drainage?
Industry feedback consistently highlighted concerns around the time and cost in obtaining the input variables required for extent of drainage and water table. These variables have a significant bearing on the carbon outputs, and so the approach to obtaining them should be uniform and feasible within planning timescales. This could be remedied through further engagement, the subsequent development/updating of guidelines (i.e. Guidance on Developments on Peatland, 2017), and/or the provision of training (to users and decision makers) and reinforced through the appropriate use of quality controls. This data could then go on to inform a national dataset of measurements.
Assessment findings: CO2 loss by Dissolved Organic Carbon (DOC) and Particulate Organic Carbon (POC) loss
Scientific accuracy
- This area of the Carbon Calculator determines the gross loss of soil carbon from both DOC and POC loss following peat drainage. Only restored formerly drained land is included in this calculation because if land is not restored, the carbon lost has already been counted as carbon dioxide via ‘CO2 loss from drained peat’ (Section 3.8.7). CO2 loss by DOC and POC has a low significance within the outputs of the Carbon Calculator, most CO2 losses due to wind farm development is associated with soil organic matter (see Appendix 10.2).
- The Carbon Calculator advises that “No POC losses for bare soil included yet. If extensive areas of bare soil is present at site need modified calculation (Birnie et al, 1991)”.
- Assuming site restoration, DOC and POC are calculated for the period (years) of site restoration (i.e. the time between the year of site improvement and the year of the sites habitat and hydrology being restored).
- Emissions are calculated based on a percentage of the total gaseous losses of carbon from improved/restored land, these are based on averages from Worrall (2009) which provide the following:
- DOC – 26% (7-40%)
- POC – 8% (4-10%)
- These assumptions (including the minimum and maximum) are tied into the Carbon Calculator (i.e. not editable by the user). DOC has a broad range, which could be causing some inaccuracy in the results. The Carbon Calculator’s assumption that DOC and POC loss is only applied to restored formerly drained sites may be underestimating DOC and POC emissions for sites which have eroding peatland.
- The Peatland Code methodology Smyth et al. (2015) uses DOC and POC emission factors (reflecting condition type) which follow Tier 1 default values for drained and rewetted temperate peatlands developed for the IPCC Wetland Supplement (IPCC, 2014). Evans et al (2023) note for DOC that few limited UK studies have been published, and other studies fall outside the UK-relevant climatic region; and similar for POC; few additional POC flux estimates exist to enable refinement. Although some recent UK evidence indicates DOC increases may be larger or smaller depending on the peatland type, there is insufficient DOC flux data across the range of UK peat types and condition classes to support a full country specific approach (ibid).
- Pickard et al (2022) found that increased DOC concentrations were detected in areas of drained peatland relative to non-drained peatland from the UK’s largest tract of blanket bog in the Flow Country of northern Scotland. These findings could be incorporated into the Carbon Calculator, however, as they represent one study based on a unique area of pristine peatland, a more conservative approach is recommended until further research is available.
- Discussion of the draft report raised an additional study from the Whitlee wind farm development exploring the effect of development phasing in relation to DOC and POC loss over a ten-year timespan, we suggest that further review incorporates the findings from this study.
Usability
- DOC and POC calculations require no inputs from the user.
Key consideration: align DOC and POC with the 2014 IPCC Wetland Supplement
For the purposes of the Carbon Calculator, emissions factors for DOC and POC could be applied to projects based on the peat condition, utilising the IPCC 2014 methodology, replicating the Peatland Code (Evans et al, 2023) which uses the UK inventory emissions factors. This would replace the current methodology but is more robust as the studies used to inform these default factors were based partly on a small number of UK studies (including two from Worrall), rather than a single study as currently used. This approach would have the added benefit of capturing DOC and POC emissions that are already occurring on eroding peatland and provide greater accuracy. The literature review highlighted an evidence gap where additional research is required to provide more specific DOC and POC estimations, building on the findings from Pickard et al (2022).
Assessment findings: CO2 losses associated with loss of forest
Scientific accuracy (simple)
- The simple methodology for forestry CO2 loss uses figures obtained from a single source (Cannell, 1999). Loss of future carbon sequestration is calculated by multiplying an emission factor by the area of forestry and lifetime of the wind farm. In the simple methodology this is a user input, “estimated carbon sequestered (t C ha-1 yr-1)”. The guidance note provides an assumption of 3.6 tC ha-1 yr-1 for yield class 16 m3 ha-1 y-1 (Cannell, 1999). Whilst this is comparable with an average (over 200 years) from the Woodland Carbon Code (Yield 16, 1.7m spacing, thinned) Woodland Carbon Code, 2024) it doesn’t consider aspects such as species, age, density etc of the site-specific parameters. Therefore, a level of uncertainty/ error can be inferred for users with differing site characteristics (tree species).
- There is no consideration of emissions associated with the felling activities. Whilst this is likely to be insignificant, it could be incorporated into the Carbon Calculator for completeness.
- There is no consideration of emissions associated with the loss of carbon stock (i.e. if the felled forest wood is destroyed), which depending on the use of the wood could be relevant (e.g. if the timber is burnt).
- There is no consideration of the impact on the peatland of removing the trees (where forestry is located on peatland). Whilst expected to have a positive impact over time on peatland restoration, it is acknowledged that further research is required in this area (Howson et al, 2021; IUCN, 2020).
- Based on our sensitivity analysis results (Table 3) from the simple and detailed methodology vary significantly based on similar parameters:
Table 3: Forest methodologies sensitivity analysis
|
Simple methodology | |||||||||
|
Data inputs |
Area of forestry plantation to be felled (ha) |
100 | |||||||
|
Average rate of carbon sequestration in timber (tC ha-1 yr-1) |
3.6 | ||||||||
|
tCO2e |
33,003 | ||||||||
|
Detailed methodology (presenting a reference scenario comparable to the simple methodology and subsequently scenario adjustments to consider the sensitivity of each input variable) | |||||||||
|
Data inputs |
Reference scenario |
Scenario 1 |
Scenario 2 |
Scenario 3 |
Scenario 4 |
Scenario 5 | |||
|
(Peat type) |
(Species) |
(Age) | |||||||
|
Soil type |
Deep peat |
Peaty gley | |||||||
|
Area to be felled (ha) |
100 | ||||||||
|
Width of forest around felled area (m) |
1 | ||||||||
|
Tree species |
Scots pine |
Sitka spruce | |||||||
|
Age (yrs.) |
10 |
5 |
20 |
40 | |||||
|
tCO2e |
99,465 |
90,149 |
110,282 |
98,170 |
100,625 |
96,990 | |||
- This is due to the simple methodology not accounting for/underestimating the following:
- Tree species and age.
- cleared forest emissions (currently labelled ‘carbon sequestration in soil under trees’ in the detailed methodology).
- Underestimating the amount of carbon lost due to felling in comparison to the detailed methodology (likely because of the additional variables that inform the detailed methodology – light interception and primary production).
Usability (simple)
- The input variables are acceptable in terms of usability. However, there is the potential for error with the current input variables guidance. The Carbon Calculator notes that sequestration rate is dependent on the yield class of the forestry. The guidance note provides an assumption of 3.6 tC ha-1 yr-1 for yield class 16 m3 ha-1 y-1. No guidance is provided as to how the species of tree influences yield class, although poplar, Sitka, and beech CO2 sequestration rates are provided in the separate user Guidance document, they are not visible in the Carbon Calculator. Enhanced user guidance and/or reference to sources of information (e.g. The Woodland Carbon Code) could be provided.
Scientific accuracy (detailed)
- The detailed method uses similar principles to the simple method, however, differs in its calculation of ‘the average carbon sequestered per year’, it requires additional user input (‘forestry input data tab’) to account for carbon loss based on soil type, species, and age of forestry, and provides a more complete account of the emissions from forestry in comparison to the simple methodology (see Table 3) .
- The method which informs these calculations (Xenakis et al, 2008) is comprehensive in calculating emissions from forestry. It uses the uses 3-PG (Landsberg, J.J., Waring, R.H., 1997). A generalised model of forest productivity using simplified concepts of radiation-use efficiency, carbon balance and partitioning, and builds on this to incorporate a soil organic matter decomposition mode, incorporating differences due to age of forestry at felling. The model has been calibrated and tested for commercial plantations of Scots pine in Scotland.
- ‘Carbon sequestration in soil under trees’: is noted within the Carbon Calculator as ‘more data needed’. ‘ It states that the aim of this calculation is to ‘account for the respiration from newly felled and disturbed soil, so as to include respiration from fresh plant inputs, from background soil organic matter decomposition, and from the disturbance of soil resulting in the release of additional carbon from soil aggregates. Different types of management disturbance should be considered’. This is labelled as ‘Cleared Forest Floor Emissions’ within the Carbon Calculator. It later states that this information is not yet available, so as an interim measure, carbon sequestration in soil under trees (including background respiration from soil organic matter decomposition and respiration from fresh plant input) is used.
- The two emissions factors currently used for the ‘Carbon sequestration in soil under trees’ are based on two studies located in Scotland which is appropriate. However, both studies assumes that forestry is on peaty soils, which may not be the case for all forestry inputs. Given that this element of the Carbon Calculator was originally planned to account for the ‘Cleared Forest Floor Emissions’ only (see previous paragraph), the emissions factors used in lieu of this are possibly overestimating the carbon sequestration associated with soil under trees. Since this literature was published, there has been further research to understand the relationship between carbon emissions and newly felled/disturbed soils (West, 2011) (Matthews et al. 2012), these studies have informed the development of the Woodland Carbon Code (2024).
- The detailed methodology also provides a calculation to determine the capacity factor for the turbines at the site. This is dependent on tree height, forest width and distance of the forest from the turbine. Although this methodology appears scientifically correct in terms of the measurements being used, none of the references provide justification of the overarching rationale/purpose of this calculation. Some of the references used for wind speed calculations are over 20 years old and it’s unclear whether these factor in the impacts of climate change on wind speeds. The technological advances in turbine functionality (and the extent to which they are impacted by forestry) needs to be considered. It is also reasonable to assume that the potential capacity of the wind turbines and influence of forestry on a wind turbine’s power curve will be considered by developers when establishing the Levelised Cost of Electricity (i.e. site feasibility) for a development. Overall, the appropriateness of this calculation in the context of the Carbon Calculator’s purpose is questionable and should be removed (see 3.3.4 Key consideration: Is the focus of the Carbon Calculator, correct?).
Usability (detailed)
- Feedback from industry engagement highlighted that the detailed methodology is not used as the number of input variables required is perceived as onerous/requiring specialist support.
- The forestry input data tab provides two options for soil types provided: peaty gley and deep peat. This appropriately covers both peat (organic) soils and peaty (organo-mineral) soils.
- The forestry input data tab provides two options for species: Scots pine and Sitka spruce. Scots pine is the main species in bog forests (NatureScot, n.d) the inclusion of other species may be beneficial in providing a more accurate output.
- The separate user Guidance document states the following: ‘Loss from soils of non-forested land is given by the estimated rate of carbon loss for two peat depths taken from Zerva et al (2005) for peaty gley (peat depth 5 to 50cm = 3.98 t C ha-1yr-1), and Hargreaves et al (2003) for deep peat (peat depth>50cm = 5.00 t C ha-1 yr-1)’. The reference to ‘non-forested land’ in the Guidance may be an error given the references used.
- Emissions from felling and transportation are a user input; these could be estimated based on assumptions and utilisation of UK Government emission factors. The existing guidance notes provide outdated references (Morison et al, 2011). The most up-to-date UK Government emission factors should be used and could be automated within the Carbon Calculator.
Key consideration: Replace the simple and detailed methodologies with one approach, informed by Woodland Carbon Code calculations
Although the detailed forestry methodology is comprehensive, it is perceived as onerous/requiring specialist support by users, and so in many applications the simple methodology is used. The simple methodology is likely to be underestimating carbon impacts. In turn, the detailed methodology may be providing inaccuracies in relation to ‘Carbon sequestration in soil under trees’. The comprehensive nature of the detailed approach also has implications for the ability to ‘futureproof’ the Carbon Calculator. The equations which inform it and the formula within the Calculator, are complicated and difficult to interpret without advanced excel skills. This presents a risk when undertaking future updates to the Carbon Calculator.
Having one option in the Carbon Calculator which strikes a balance between inputs required and the generation of an accurate output is an important consideration. The Woodland Carbon Code’s (WCC) (Woodland Carbon Code, 2024) calculator includes a wider range of tree species with rates based on spacing (m), yield class, management type and age. The WCC is supported by Scottish Forestry and has undergone independent validation and verification. It provides a credible dataset that is reviewed and updated regularly. To enable a more robust output, the sequestration rates ‘Biomass Carbon Lookup Table’ could be replicated in the Carbon Calculator and aligned with the WCC to enable consistency in reporting methods.
Key consideration: Remove the option to affect the wind turbine’s capacity factor via the forestry inputs tab
The calculations that inform this appear to go beyond the remit of this Section’s purpose in calculating the CO2 losses associated with forestry. More rationale on why this is not appropriate and should be removed is provided in Section 3.10.3 bullet point 6.
Key consideration: Use of HRSD in determining forestry inputs
The role of HRSD and whether it could be utilised to determine key input variables for forestry and/or estimated carbon stocks (see Tolan et al, 2024, Cheng et al, 2024, which use cutting edge technology to estimate carbon stocks) should be explored in collaboration with forestry organisations (i.e. Scottish Forestry, NatureScot, Forestry and Land Scotland, Forest Research). There are several open resources that could inform this (i.e. Scottish Forestry Map viewer (Scottish Forestry, n.d.), Habitat Land Cover Map of Scotland (2024), Scottish Remote Sensing Portal (Scottish Government, n.d.)). Process-based modelling, data assimilation and remote sensing has been applied by the University of Edinburgh to quantify carbon stock changes, and remote sensing is used by Forest Research to accurately map woodland.
Assessment Findings: CO2 gains from site improvement
Scientific accuracy
- This area of the Carbon Calculator estimates the reduction in GHG emissions due to restoration of the site. The calculation for this area of the tab replicates the calculation used to ascertain loss of soil CO2 (peat drained) (Nayak et al, 2008), and so the findings from 3.8.7 and 3.8.8 are also relevant to this section.
- The current calculations assume that restoration will be successful, and that peatland will be restored to pristine condition. The UK Inventory and Peatland Code transitions land from degraded condition categories to ‘modified bog’ upon restoration, it does not apply the ‘near-natural’ emission factor to restored peatland, recognising the difficulty in fully restoring peatland to the full sequestration potential.
- It is difficult to accurately model emission reductions associated with restoration at pre-planning phases – in particular, the ‘depth of peat above the water table after restoration.’ There are several restoration activities (hydrology and habitat ‘yes/not applicable’ inputs) within the Carbon Calculator are assumed to occur post wind farm operation (>20 years in the future), although these are not linked to any calculations.
- Undisputed, is that the restoration of degraded sites should be a priority, and the benefits of such activities are well documented. However, there is variation in understanding the impact of restoration on carbon savings. How restoration affects carbon fluxes and storage on degraded sites shows variety in the potential results. Peatland recovery is not instantaneous (Gatis et al.,2023, Alderson et al, 2019), with interventions taking at least 5 years or more for ecosystems changes to stabilise (Gregg et al., 2021). Artz et al. (2012) note that carbon savings are dependent on the starting condition prior to restoration with some research indicating that severely degraded sites take longer to achieve emissions reduction than less affected peatlands. Restoring the carbon ‘sink’ functionality of a degraded peatland is possible, however this may take decades, and be dependent on the initial level of site degradation (Gregg et al., Ibid). Lindsay (2010) notes that peat accumulation in blanket bogs can be half that of raised bog due to warmer climatic conditions and suggests a timeframe of around four decades before restoration to a fully functional bog can achieve net carbon gain, although emissions reduction will occur much earlier. Although there can be short term CH4 fluxes because of restoration the long-term carbon savings can negate this short-term effect (Emsens et al., 2021– note this study relates to fen bogs, but also highlights the important role of vegetation establishment). Evans et al. (2022) note that independent modelling studies by Heinemeyer et al. (2019) for the Defra Peatland-ES-UK (Defra BD5104) project, and Simon et al. (2021) for the BEIS review of UK GGR potential both suggested that degraded peatlands have the potential to accumulate carbon rapidly, and therefore that the CO2 sequestration potential of peat restoration may have been significantly underestimated. The current methodology does not take these considerations into account.
- Future climate conditions (e.g. rising temperatures, extreme weather events) could affect the ‘success’ of peat restoration (i.e., carbon accumulation). Climate change is noted to exacerbate ecological stresses on less resilient, managed peatlands over the next 60 years, leading to more rapid losses of stored peat carbon (Worral et al, 2010) (Ferretto et al, 2019) (Natural England, 2020). Any estimates made have a high level of uncertainty, given the relatively short timeframe of restoration in the context of a wind farm’s lifespan.
- The calculations for site restoration are sensitive to water table depth changes, pre- and post-restoration (Appendix 11.3). Water table has a significant influence on peatland CO2 and CH4 emissions (see section 3.8.7). However, there is limited empirical data to provide a high level of certainty in relation to future carbon stocks and carbon flux; carbon benefits can be difficult to quantify and affected by environmental conditions on a site-by-site basis (Wille et al, 2023), Gregg et al. (2021) state in relation to blanket bogs, raised bogs and fens that ‘large spatial variability has been shown and studies have often been carried out at the same sites or regions’, blanket bogs are less responsive to drainage and rewetting alone, but can be beneficial when coupled with peatland stabilisation and re-establishment of vegetation cover, the role of vegetation as well as hydrology in site restoration should therefore be taken into account. Further research is required in the context of restoration, including blanket bog rewetting (Evans et al., 2014; Williamson et al., 2017), and restoration of plantations to semi-natural peatland.
- See also the commentary on ‘emission rates from soils’ within Section 203.8.
Usability
- Calculations within this tab are based on the changes to water table depth pre- and post-restoration of peat (inputted by the user) and the calculated emission rates from soils. It has been noted that small changes to the figures for water table depth can significantly increase the value of carbon gains due to peat restoration. Although the methodology for ‘Water table depth after improvement’ variables indicate an optimal water table level is ‘probably just below the surface (-10 to -6 cm)’, within planning timescales the future water table depth (and other associated variables) can only be approximated. When accounting for the high level of uncertainty regarding restoration, the question of whether this element of the Carbon Calculator should be conventionalised to replicate the Peatland Code’s calculations and guidance requires consideration.
- See also commentary on ‘emission rates from soils’ within Section 203.8.
See 3.3.3 key consideration: is the output of the Carbon Calculator useful as a decision-making tool?
The timeframe for achieving a ‘carbon payback’ or ‘carbon neutrality’ should be considered on a land for land basis (e.g. restoration gains vs construction losses) instead of relying on savings from generation. More information on how this should be presented is provided in 3.3.3.
Key consideration: the Carbon Calculator should be updated to replicate the Peatland Code
Site restoration should explore the option to replicate elements of the Peatland Code’s approach, including its requirements around restoration success. In particular, the Peatland Code utilises up-to-date emissions factors (aligned with the UK inventory), and includes a 15% sensitivity buffer to accommodate the risk of future carbon losses (e.g., restoration failure) (see Section 4 on the Peatland Code). Establishing a baseline condition that reflects the Peatland Code’s classification, would simplify the input required for site restoration (by then selecting the appropriate condition post-restoration). Considering the degree of uncertainty, this is appropriate and could prevent the risk of inaccuracy and/or ‘fixing’ of the current variables. This would negate the use of ‘carbon fixing’, ‘loss of DOC and POC’, and ‘peat drainage after restoration’ calculations. By bringing different funding mechanisms together, this alignment could also support data collection at a national restoration level. Through our engagement with the Peatland Expert Advisory Panel, it was determined that the full implementation of the Peatland Code on development sites is not suitable. Further dialogue with the Peatland Code representatives is recommended to identify the optimal approach for this consideration.
Key consideration: Quality control should review the Carbon Calculator in conjunction with the Peat Management Plan (PMP) and Habitat Management Plan (HMP)
In determining whether a development should be built on peatland, a key decision factor should be the extent to which the developer is able to illustrate site restoration post installation, reflecting the requirements of NPF4 (mitigation hierarchy) and Good Practice restoration Guidance (e.g. NatureScot, Peatland Code). Resilient restoration through credible restoration techniques which prioritise vegetation establishment and a return to high water tables are critical components of this. The remit of the Carbon Calculator is to determine whether the carbon impact of the development on peatland is acceptable, any carbon savings from site restoration should be reviewed holistically in conjunction with a robust PMP and HMP that evidences credible restoration techniques. To inform this, a review of the requirements for key EIA deliverables (i.e. PMP, HMP, Carbon Calculator) could be undertaken, to enable a streamlined decision-making process.
Summary
Based on the findings from the technical assessment and evidence review, Table 4 presents a summary of the Carbon Calculator’s scientific accuracy and data usability ratings.
Table 4. Carbon Calculator areas summary
|
Areas of the Carbon Calculator |
RAG rating Scientific accuracy |
RAG rating Data usability | |
|
3.2 |
Data inputs |
– | Amber |
|
3.3 |
Payback time and CO2 emissions | Red | Amber |
|
3.4 |
Wind farm CO2 emission savings | Red | Green |
|
3.5 |
Emissions due to turbine life | Red | Amber |
|
3.6 |
Loss of carbon due to back up power generation | Red | Green |
|
3.7 |
Loss of carbon fixing potential of peatlands | Amber | Amber |
|
3.8 |
Loss of soil CO2 |
– |
– |
| Amber | Amber | |
| Red | Red | |
|
3.9 |
CO2 loss by DOC and POC loss | Amber |
– |
|
3.10 |
Loss of carbon due to forestry loss |
– |
– |
| Red | Amber | |
| Amber | Red | |
|
3.11 |
Carbon saving due to improvement of peatland habitat | Red | Red |
In summary, the ‘payback time and CO2 emissions’ is not relevant/consistent with the findings of the technical assessment and literature review. The focus of the Carbon Calculator (3.4) requires revisiting, with consideration of whether 3.5. and 3.6. are required considering new planning policy and applicability of WLCAs.
Accuracy is lacking in one or more of the following: methodologies, use of emission factors and assumptions, for all peat-related areas of the Carbon Calculator, as well as the forestry area. The usability of the Carbon Calculator presents a more varied picture, with some data accessible to the user. However, there was uncertainty in the ability to accurately access some of the data required for the Carbon Calculator – in particular, for variables that drive the results, which could have a material bearing on the accuracy of outputs.
Further commentary is provided in 7. Conclusion and recommendations.
SWOT analysis
Table 5 presents the strengths, weaknesses, opportunities, and threats of the current Carbon Calculator identified from this Report’s findings:
Table 5: SWOT analysis
|
Strengths |
|
|
Weaknesses |
|
Accuracy
|
|
Usability
|
|
Opportunities |
|
|
Threats |
|
Evaluation of Peatland Code
The IUCN Peatland Code is a voluntary certification standard for UK peatland (fens and bogs) projects seeking financial benefits from restoration activities through ‘carbon units.’ The code provides a framework for the validation and verification of greenhouse gas reductions.
The principle of the Peatland Code is classification of land use or peatland condition pre-restoration and post-restoration. In the following subsections we explore the value add of integrating this categorisation into the Carbon Calculator, focusing on bog peatland.
The Carbon Calculator does not currently fully align with the Peatland Code; there are opportunities to replicate elements of the Peatland Code within the Carbon Calculator, as well as aligning emission factors.
Overview of the Peatland Code
The Peatland Code encompasses a simplified methodology to quantify the effect of peatland restoration on land emissions, for the purpose of verification for ‘carbon units.’ The Peatland Code considers accuracy and reliability when quantifying the climatic benefits of peatland restoration. As such key requirements on projects include:
- Validation and Verification: There is a requirement for restoration projects to undertake third-party validations and verifications to ensure climate benefits are quantifiable, additional, and permanent.
- Management and monitoring plan: all projects are required to have a restoration management plan for the duration of the project. The monitoring plan should track the peatland condition over time.
- Management of Permanence: to manage the risk of project permanence, a 15% risk buffer is applied to emission reduction calculations. This acknowledges the risk of future carbon losses; either from emissions associated with restoration activities (e.g. fuel use) or to future peatland restoration failure.
Bog emissions calculator
The bog emissions calculator requires four inputs (area, project duration, pre-restoration condition and post-restoration condition) (Table 6) from which emission reductions (tCO2e) are calculated from a ‘emissions lookup table’ across 100-year period (Table 7). The emission factors have been developed to align with the UK Greenhouse Gas Inventory, based on recent research from the UK Centre for Ecology & Hydrology, and the JHI (Evans et al, 2023). The difference between the pre- and post-restoration emission factors provides the carbon reductions achieved through restoration.
Table 6: Peatland Code Condition Categories (bogs)
|
Pre-Restoration (Baseline) Condition Category |
Post-Restoration Condition Category |
|
|
Table 7: Peatland Code Bog Emission Factors
|
Peatland Condition |
tCO2e/ha/year | ||
|
Baseline / Pre-restoration |
Post-restoration |
Pre-restoration |
Post-restoration |
|
Actively Eroding: Hagg/ Gully |
Revegetated |
17.72 |
3.42 |
|
Actively Eroding: Flat Bare |
Revegetated |
17.72 |
3.42 |
|
Drained: Artificial |
Rewetted Modified Bog |
3.32 |
0.32 |
|
Drained: Hagg/ Gully |
Rewetted Modified Bog |
2.51 |
0.32 |
|
Modified |
Rewetted Modified Bog |
2.51 |
0.32 |
|
Near natural |
Near natural |
0.32 |
0.32 |
Fen emissions calculator
The fens emissions calculator requires three inputs for both the pre- and post-restoration scenarios (land use classification, average annual water table depth and average peat depth) (Table 8), from which emissions from peat are calculated. Unlike the bogs emission calculator the emission factors are locked, however are understood to be a combination of Tier 1 and 2 emission factors (IPCC), and emission estimated derived from the site’s effective water table depth (Evans et al. 2021).
|
Fen Land Uses | |
|
|
Benefits and drawbacks
Based on our findings of the Carbon Calculator’s technical assessment (see Section 3) and review of the Peatland Code, Table 9 provides a high-level summary of the benefits and drawbacks of integrating the Peatland Code’s methodology and emission factors within the Carbon Calculator.
Table 9: Peatland Code Summary
|
Benefits |
Drawbacks |
|
|
Recommendations for the Carbon Calculator
The Peatland Code provides an established methodology to quantify GHG benefits across the UK. Aligning with this methodology could improve the accuracy of baseline carbon flux and consistency in reporting the benefits of restoration activities. However, through our engagement with the Peatland Expert Advisory Panel, it was determined that the full implementation of the Peatland Code on development sites is not suitable. Further dialogue with the Peatland Code representatives is recommended to identify the optimal approach for the following opportunities for the Carbon Calculator:
- The condition categories could be replicated to establish a more representative baseline and subsequent restoration status. The Carbon Calculator currently assumes peatland is pristine and presents a worse-case scenario in terms of carbon lost, however lost carbon may not be fairly attributed to the wind farm development.
- Whilst the emission factors may not be wholly representative of Scotland (based on a UK average) they are widely recognised as best practice. Integration of the peatland condition categories could provide a recognised approach to quantifying the benefits of peatland restoration activities (site improvements tab).
- Use of a risk buffer (measure of uncertainty) within the site improvements tab.
- If building on degraded peatland, the Carbon Calculator could include a requirement on developers to improve condition of the site through the project’s lifespan. The principles of the Peatland Code could be used to inform guidance on this.
High Resolution Spatial Data (HRSD)
A literature review (Appendix 11.4) of eight data sources was conducted to identify HRSD measures that could indicate the presence and condition of peat. The following subsections provide analysis of the benefits and drawbacks of HRSD, and how it might improve the Carbon Calculator’s accuracy.
Summary of HRSD methodologies
To date, multiple types of imagery have been used to varying degrees of success (Table 10).
Table 10: HRSD summary of findings
|
#1: Optical/near infrared spectral imaging |
Method |
ESA’ Sentinel 2, NASA LandSat |
|
Author |
Pontone et al., 2024. | |
|
Benefits |
| |
|
Drawbacks |
| |
|
#2: Infrared Land Surface Temperature |
Method |
MODIS TERRA Grid data |
|
Author |
Worrall et al. 2019 | |
|
Benefits |
| |
|
Drawbacks |
| |
|
#3: Synthetic Aperture Radar (SAR) |
Method |
Sentinel 1 VV/VH Backscatter |
|
Author |
Toca et al. 2023, Pontone et al. 2024, Lees et al. 2020 | |
|
Benefits |
| |
|
Drawbacks |
| |
|
#4: InSAR |
Method |
Sentinel 1 Interferometry, Intermittent Small Baseline Subset method |
|
Author |
Bradley et al. 2022, Alshammari et al. 2018 | |
|
Benefits |
| |
|
Drawbacks |
| |
|
#5: LiDAR |
Method |
Bespoke airborne LiDAR |
|
Author |
Carless et al. 2019 | |
|
Benefits |
| |
|
Drawbacks |
|
Summary of literature review findings
For optical based imagery (#1 and #2) cloud cover often limits the number of temporal snapshots captured, although it has not been successful in providing a good measure of condition, it can provide an understanding of landcover, including vegetation.
Active based sensing (#3, #4 and #5) can be coupled with landcover information provided from optical based imagery to provide a holistic understanding of peat condition and water table depth proxies. LiDAR data, as demonstrated by #5, is very useful for mapping topographical features such as draining channels and flow paths in high resolution but is expensive to obtain in real-time, given these features are relatively stable, LiDAR surveys commissioned over a wide area (i.e. a National Scheme) would be a useful dataset for identifying hydrological features that could inform the Carbon Calculator inputs. Our findings indicate that SAR data, coupled with the methodologies referenced in #3 and #4 appears to be the most promising in both its ability to capture hydrological condition of peat (including water depth) and the ability to obtain temporal imagery. More information on ESA’s Sentinel 1 platform is provided in Appendix 11.4. The limiting resolution of this approach may reduce the accuracy for small and/or spatially varying sites, but is advantageous over the deployment of ground-based sensors in that:
- It provides continual mapping across the whole site, compared to a sparse deployment of specific ground-based sensors.
- Archival data and repeated visits provide a longer temporal dataset from which to establish condition compared to ground-based sensors placed for a discrete time interval.
Future trends show a rise in popularity for SAR data products, with companies like Umbra offering high-resolution (1m) options, mitigating some of the current limitations. However, as SAR is unable provide landcover information, combining it with optical imaging could yield the most informative and accurate maps.
Although not assessed as part of this review, it is understood that Scottish Government is exploring a national LiDAR scheme with repeat collections every few years, which could track the stability, loss, and/or growth of peatlands. LiDAR alongside optical SAR and InSAR data could provide key data to inform the Carbon Calculator.
Recommendations for the Carbon Calculator
Scottish Government is exploring a national LiDAR scheme with repeat collections every few years, the results of this could be integrated into the Carbon Calculator, and reviewed to understand whether any further use of HRSD would provide additional transparency and support accuracy, over and above the following:
- Integrating HRSD into the Carbon Calculator, through a model which combines #1, #3 & #4 HRSD types, would enable an understanding of i) land cover types, providing proxies for ii) peat condition, and iii) water table depth, as well as the provision to understand the history of prospective sites to better inform peat condition. It could therefore also be used to inform subsequent monitoring activities. The condition of peat is causally related to the emission and sequestration of carbon sequestration and since this not currently considered by the Carbon Calculator, adding this capability would provide a step change in improving the accuracy of the Carbon Calculator. The water table depth is currently considered in the Carbon Calculator but requires manual surveying. Adopting the remote sensing approach would be advantageous in providing consistent and temporal measurements that would improve the accuracy between sites and support quality control.
- Integrating remote sensing into the Carbon Calculator will depend on having data products that are deemed accurate enough and are readily available at little or no cost. The products from TerraMotion (#4) would appear to be the most promising for peat condition but further stakeholder engagement would be needed to determine whether their offering suffices both in accuracy and cost, over and above the nationwide LiDAR scheme being explored by Scottish Government.
- An additional piece of work could be carried out to explore a proof-of-concept data product that brings together the surface motion, water table depth and vegetation cover measures identified in the review. Combining all three types of data is likely to provide the most informative and accurate measure of presence and condition of peat. The output should be validated against a typical ground-based survey carried out by an organisation using the Carbon Calculator.
Quality Control Mechanisms
Decision makers that utilise the outputs of the Carbon Calculator include the Energy Consents Unit (ECU) and local planning authorities. ECU review applications for consent for the construction, extension and operation of electricity generating stations with capacity more than 50MW. Applications below this threshold are reviewed by the relevant local planning authority. Following engagement with ECU, it has been ascertained that the existing quality assurance processes undertaken to evaluate and support decision-making would benefit from significant enhancement. Due to the Carbon Calculator’s complexity and the skillsets required to review the data outputs, it is ascertained that the Carbon Calculator is not currently used as a decision-making tool in the capacity it was intended but is used to check the credibility of the ‘payback period.’
Recommendations for the Carbon Calculator
The following actions are recommended to improve the utility of the Carbon Calculator as a decision-making instrument:
- The Carbon Calculator should have automated mechanisms for input variables that exceed acceptable error margins or contradict other variables.
- A guidance document should be produced to support developers, ECU, and local planning authorities on the key drivers of peat-related carbon emissions and potential variances (i.e. carbon fluxes), this could be done through the updating of existing guidelines (i.e. Guidance on Developments on Peatland, 2017).
- The decision to build on peatland should consider the developer’s ability to demonstrate post-installation site restoration, in line with NPF4 and Good Practice restoration Guidance (e.g. NatureScot, Peatland Code). Resilient restoration through credible restoration techniques which prioritise vegetation establishment and a return to high water tables are critical components of this. The Carbon Calculator’s purpose is to assess the carbon impact of the development on peatland. Carbon savings from site restoration should be reviewed holistically alongside a robust PMP and HMP. A review of the requirements for key EIA deliverables in terms of the inputs they require could benefit quality control and streamline the decision-making process.
A further consideration is that through the implementation of the above recommendations, Quality-controlled application data could contribute to a national database.
Carbon Calculator applicability
Based on our findings, this section explores the Carbon Calculator’s applicability as a decision-making Carbon Calculator across proposals for alternative infrastructure (e.g., transmission and distribution, battery storage options) and renewable energy development (e.g., solar) on peatland and carbon rich soils within Scotland. Whilst the Carbon Calculator, in its current form, would not be fully applicable to alternative development proposals, modifications can be made to increase transferability. Table 12Table provides some considerations against each area of the Carbon Calculator.
|
RAG |
Criteria |
Green |
Fully transferable to alternative developments |
Amber |
Limited modifications required to enable the Carbon Calculator to be used for other developments |
Red |
Area would require significant work to enable the Carbon Calculator to be used for other developments |
Table 12: Increasing Carbon Calculator applicability (Note Section 3 recommendations apply to the below).
|
Areas |
RAG |
Potential modification/considerations |
|---|---|---|
|
Data inputs | Amber |
Data inputs would need reviewing to cover the characteristics of other renewable technologies and developments. |
|
Payback time and CO2 emissions | Amber |
Payback time may not be an appropriate measure for all asset types. |
|
Carbon emission savings from wind farms | Amber |
Minor modifications would be required to calculate back-up requirements for other renewable energy assets. For some developments (e.g. battery storage) this area may not be relevant. |
|
Emissions due to turbine life | Red |
Currently wind farm specific, however data inputs and assumptions could be modified to allow for a broader selection of assets / technologies (e.g. drop-down selection for technology option). |
|
Loss of carbon due to back up power generation | Amber |
Minor modifications would be required to calculate back-up requirements for other renewable energy assets. For some developments (e.g. battery storage) this area may not be relevant. |
|
Loss of carbon fixing potential of peatlands | Amber |
For wind turbines this area of the Carbon Calculator considers the loss of future carbon fixation through the removal of peat. As the turbines are tall and provide little shading there is minimal impact to the wider area. However, consideration would need to be given to the spatial factors of alternative technologies. For example, if solar panels shade large areas of peatland this is likely to affect the sequestration rate of bog plants. There may also be impacts to peatland carbon cycling through the heat projected into the ground. There is a need for further research to understand the full implications (NatureScot, 2022). |
|
Loss of carbon stored within peatlands | Green |
Methodologies are relevant to any development on peatland. |
|
Loss of carbon due to leaching of DOC & POC | Green |
Methodologies are relevant to any development on peatland. |
|
Loss of carbon due to forestry loss | Green |
Methodologies are relevant to any development on peatland. |
|
Carbon saving due to improvement of peatland habitat | Green |
Methodologies are relevant to any development on peatland. |
Recommendations for the Carbon Calculator
In summary, although amendments would be required to the data inputs, wind turbine related emissions, and the presentation of ‘payback’ and carbon emission savings, the majority of methodologies for the peatland related calculations are relevant to any development on peatland. Whilst currently employed solely for wind farm developments, there is potential for the Carbon Calculator to be adapted to apply to grid infrastructure and other development types on peatland and carbon rich soils. There are no concerns on the Carbon Calculator’s ability to be used on projects of all sizes. However, to be applied to different infrastructure types, it is essential to consider their unique spatial characteristics, such as the shading effects and excess heat generated by solar farms. Further research and engagement are necessary to thoroughly understand how these factors impact peatland and carbon-rich soils before extending the Carbon Calculator to other development types.
Conclusion and recommendations
Conclusion
This report concludes that, based on the findings of a technical assessment, evidence review and quality control mechanisms, we recommend updating the Carbon Calculator in its current form to align with recent policy updates and advancements in science.
Our conclusions and recommendations set out how the Carbon Calculator could be updated through:
- Section 8.2: Addressing ‘big picture’ questions regarding the Carbon Calculator’s current remit to inform future decision making.
- Section 8.3: Making a series of updates to the current Carbon Calculator to bring it in line with scientific understanding and improve its accuracy.
Further areas of research due to evidence gaps identified during the literature review are summarised in Section 8.4.
Overarching considerations to inform future decision making
Key consideration: Does the calculator need to consider the lifecycle emissions of the wind farm, or could the focus be purely on the impact of development on peat? (Section 3.3.5)
Well-established methods and tools are available to undertake Whole Life Carbon Assessments (e.g. PAS2080). NPF4 Policy 2 (climate mitigation and adaptation) states that all proposals will be “be sited and designed to minimise lifecycle greenhouse gas emissions as far as possible.” Given this context, it is pertinent to question the necessity of the Carbon Calculator in replicating these existing approaches. Instead, it may be more beneficial to concentrate efforts on analysing the specific impacts of development on peatland/habitat carbon emissions. Key considerations include:
- Whether the lifecycle emissions of a wind farm need to be included in the Carbon Calculator?
- Could the calculations in the Carbon Calculator solely be focused on the impact of the development on peatland/habitat carbon emissions?
- Is the presentation of the current payback output necessary or appropriate for decision making?
Key consideration: Is the output of the Carbon Calculator useful as a decision-making tool? (Section 3.3.3)
Since the inception of the Carbon Calculator, scientific advancements have deepened our understanding of the interplay between nature and climate change. This progress is reflected in NPF4’s mitigation hierarchy and Policy 3b, which require substantial biodiversity improvements alongside restoration and offsetting requirements. In this context, it is important to acknowledge that carbon emissions sources should be segregated and reported separately to facilitate informed decision-making.
As the UK transitions to net zero, the current carbon payback’ approach (comparing development emissions to the counterfactual of electricity generated by fossil fuels) becomes less relevant. The focus should shift to evaluating the developments on the natural environment, specifically, whether it improves the environment and sequesters CO2 effectively. This method is more insightful than balancing combined wind farm and peatland emissions against ‘carbon payback,’ which does not provide significant insights.
To better assess the carbon impact on peatland, the timeline for achieving ‘carbon payback’ or ‘carbon neutrality’ should consider land-based emissions. For example, ‘payback time’ could be defined as the period needed to restore peatland to a ‘near pristine’ condition from a reported baseline, compared to the site’s baseline emissions without development and counterfactual scenarios for non-peaty sites, considering Scotland’s widespread peatland restoration efforts (refer to Section 3.3.3 for more details).
Key consideration: Should the Carbon Calculator incorporate other land use types?
Considering the previous point, it’s important to consider whether the Carbon Calculator should be updated to account for various land use and habitat types. This would offer a more comprehensive view of the carbon impact on other land use types, as compared to the carbon impact on peatland. This aspect should be evaluated considering Scotland’s evolving Biodiversity Net Gain requirements, current PMPs, HMPs, and their anticipated updates.
Key consideration: The current quality control mechanisms are insufficient
The scope of this report was to identify the key updates or improvements which would bring the tool in line with current scientific understanding and improve the accuracy to better inform decision making. However, this report concludes that due to its complexity and skill sets required to review the data outputs, the Carbon Calculator is not currently used as a decision-making tool. Section 6 on Quality Controls provides more detail on the rationale behind this, and provides recommendations to improve the current approach, which should be considered ahead of updating the Carbon Calculator.
Key updates to bring the Carbon Calculator in line with scientific understanding and improve accuracy
Updates to the current Carbon Calculator
This report concludes that the current Carbon Calculator is no longer up to date following advancements in science, but it could be brought in line with scientific understanding and improved accuracy through the updates to the following:
3.2 Data inputs:
To improve data usability, explore options to integrate the Carbon Calculator and/or allowance for easy transfer from/to input variables that align with/can be obtained directly from other sources, i.e. Peatland Management Plan, Hydrological Assessment, HMP, and (in future) WLCA.
- 3.3 Payback time and CO2 emissions:
Section 8.2 concludes that this area requires a significant update to accurately reflect a carbon ‘payback time’ in relation to land use emissions, and so updating the technical elements of its current calculation approach (Section 3.3.1) would not be appropriate.
- 3.4 Wind farm CO2 emission savings, 3.5 Emissions due to turbine life and 3.6 Loss of carbon due to back up power generation:
Section 8.2 concludes that these areas of the Carbon Calculator are not required. Updating the respective technical elements of each where inaccuracies have been identified would not be appropriate.
- 3.7 Loss of carbon fixing potential of peatlands:
To improve both scientific accuracy and data usability the baseline condition of peatland should be incorporated into the Carbon Calculator, the inclusion of the Peatland Code’s calculation methodology may make this area of the Carbon Calculator redundant (Section 3.7.3).
- 3.8 Loss of soil CO2:
- To significantly improve the scientific accuracy and data usability of this area:
- Incorporate minimum and maximum parameters into the Carbon Calculator for the carbon content of dry peat and dry soil bulk density variables (Section 3.8.5).
- Update the methodology for emissions rates from soils to reflect more recent literature and Scottish context (see Section 3.8.9 for more information).
- Account for emissions from drainage ditches (Section 3.8.10).
- Replace the use of averages with infrastructure specific inputs to replicate how peat is reported on in the PMP.
3.9 CO2 loss by DOC and POC loss:
To improve scientific accuracy, align DOC and POC with the 2014 IPCC Wetland Supplement, replicating the Peatland Code’s calculation methodology (Section 3.9.3).
3.10 Loss of carbon due to forestry loss:
To improve both scientific accuracy and data usability:
- Replace the simple and detailed methodologies with one approach, informed by Woodland Carbon Code calculations (Section 3.10.5) and HRSD.
- Remove the option to affect the wind turbine’s capacity factor via the forestry inputs tab (Section 3.10.6).
3.11 Carbon saving due to improvement of peatland habitat:
To significantly improve scientific accuracy and data usability, Update the Carbon Calculator to replicate the Peatland Code’s principles (Section 3.11.3).
5. High Resolution Spatial Data (HRSD):
HRSD has the potential to improve and enhance the data usability of the Carbon Calculator and could support quality control mechanisms. Recommendations include:
- Consider options to integrate HRSD into the Carbon Calculator to enable an understanding of i) land cover types, providing proxies for ii) peat condition, and iii) water table depth, as well as the provision to understand the history of prospective sites to better inform peat condition, drainage variables, and subsequent monitoring activities. This could act as a quality control measure against inputted variables.
- Further engagement with JHI and other key stakeholders involved in HRSD within Scotland (i.e. Nature Scot, CivTech) is recommended to enable a joined-up and effective approach to the solution developed.
Further research
This review has identified the following evidence gaps that necessitate further research and/or engagement:
- Further research is required to understand the impacts of climate change on the carbon fixing potential of peatlands.
- Further research is required to understand whether the option to reuse peat elsewhere would be appropriate.
- Further research required into the link between peatland condition and bog plant fixing potential, or on updated fixation emission factor rates (if appropriate).
- Further research is required to identify a suitable ‘average extent of drainage.’
- Further research is required to provide more specific DOC and POC estimations.
- Further research is required to understand whether HRSD could inform the carbon content of dry peat and dry soil bulk density variables.
- Further research on the impact on peatland from the removal of trees (where located on peatland and other carbon rich soils).
- Further research is necessary to understand how the spatial variability of different development types could impact peatland and carbon-rich soils.
References
Aitkenhead M, Coull M. (202) Mapping soil profile depth, bulk density and carbon stock in Scotland using remote sensing and spatial covariates. Eur J Soil Sci. 71: 71: 553–567.
Alderson, DM, Evans, MG, Shuttleworth, EL, Pilkington, M, Spencer, T, Walker, J & Allott, TEH (2019), ‘Trajectories of ecosystem change in restored blanket peatlands’, Science of the Total Environment, vol. 665, pp. 785-796.
Alm, J., Saarnio, S., Nykänen, H., Silvola, J. & Martikainen, P.J. (1999) Winter CO, CH and NO fluxes on some natural and drained boreal peatlands. Biogeochemistry, 44 (2), 163–186.
Alshammari, L., Large, D.J., Boyd, D.S., Sowter, A., Anderson, R., Andersen, R. and Marsh, S. (2018). Long-term peatland condition assessment via surface motion monitoring using the ISBAS DInSAR technique over the Flow Country, Scotland. Remote Sensing, 10(7), 1103.
Ardente F., Beccali M., Cellura M., Lo Brano V. (2008). Energy performance and life cycle assessment of an Italian wind farm. Renewable and Sustainable Energy Reviews, 12, 200–217.
Artz, R.R.E., Donnelly, D., Andersen, R., Mitchell, R., Chapman, S.J., Smith, J., Smith, P., Cummins, R., Balana, B., Cuthbert, A. (2012). Managing and restoring blanket bog to benefit biodiversity and carbon balance – a scoping study. Commissioned Report (in preparation). Scottish Natural Heritage.
BEIS (2020). Powering our Net Zero Future Energy White Paper CP 337. HM Government. https://assets.publishing.service.gov.uk/media/5fdc61e2d3bf7f3a3bdc8cbf/201216_BEIS_EWP_Command_Paper_Accessible.pdf
BEIS (2021). End to coal power brought forward to October 2024. Press Release. HM Government. https://www.gov.uk/government/news/end-to-coal-power-brought-forward-to-october-2024
Bubier, J., Moore, T. & Roulet, N. (1993) Methane emissions from wetlands in the mid-boreal region of northern Ontario, Canada. Ecology, 74, 2240–2254.
Cannell, M.G.R., Milne, R., Hargreaves, K.J., Brown, T.A.W., Cruickshank, M.M., Bradley, R.I., Spencer, T., Hope, D., Billett, M.F., Adger, W.N. and Subak, S. (1999). National inventories of terrestrial carbon sources and sinks: the UK experience. Climatic Change, 42, 505-530.
Carbon Trust (2022). Offshore Wind Sustainability JIP. Offshore Wind Sustainability JIP | The Carbon Trust
Carless, D., Luscombe, D.J., Gatis, N., Anderson, K. and Brazier, R.E. (2019). Mapping landscape-scale peatland degradation using airborne lidar and multispectral data. Landscape Ecology, 34, 1329-1345.
Carless, D., Kulessa, B., Booth, A.D., Drocourt, Y., Sinnadurai, P., Street-Perrott, F.A., Jansson, P. (2021). Geoderma, 402.
Chapman, S., Bell, J., Donnelly, D., Lilly, A. (2009). Carbon stocks in Scottish Peatlands. Soil Use and Management 25(2), 105 – 112.
Cheng, F.; Ou, G.; Wang, M.; Liu, C (2024) Remote Sensing Estimation of Forest Carbon Stock Based on Machine Learning Algorithms. Forests 2024, 15, 681.
Concrete Centre (2023). Embodied carbon of concrete – Market Benchmark. Embodied carbon of concrete – Market Benchmark (concretecentre.com)
Chapman, S., Artz, R. and Donnelly, D. (2012). Carbon savings from peat restoration. Climate Exchange, pp.1-17.
Dale, L., Milborrow, D., Slark, R. and Strbac, G. (2004). Total cost estimates for large-scale wind scenarios in UK. Energy Policy, 32(17), 1949-1956.
DESNZ (2023). Greenhouse gas reporting: conversion factors 2023. HM Government. https://www.gov.uk/government/publications/greenhouse-gas-reporting-conversion-factors-2023.
DESNZ (2023). Energy and emissions projections: 2021 to 2040. HM Government.
Emsens, W., Verbruggen, E., Shenk, P., Liczner, Y. (2021). Degradation legacy and current water levels as predictors of carbon emissions from two fen sites. Mires and Peat, 27(14), 15 pp.
Evans, C.D., Page, S.E., Jones, T., Moore, S., Gauci, V., Laiho, R., Hruška, J., Allott, T.E., Billett, M.F., Tipping, E. and Freeman, C. (2014). Contrasting vulnerability of drained tropical and high‐latitude peatlands to fluvial loss of stored carbon. Global Biogeochemical Cycles, 28(11), 1215-1234.
Evans, C.D., Peacock, M., Baird, A.J., Artz, R.R.E., Burden, A., Callaghan, N., Chapman, P.J., Cooper, H.M., Coyle, M., Craig, E. and Cumming, A. (2021). Overriding water table control on managed peatland greenhouse gas emissions. Nature, 593(7860), 548-552.
Evans, M.G., Alderson, D.M., Evans, C.D., Stimson, A., Allott, T.E., Goulsbra, C., Worrall, F., Crouch, T., Walker, J., Garnett, M.H. and Rowson, J. (2022). Carbon loss pathways in degraded peatlands: New insights from radiocarbon measurements of peatland waters. Journal of Geophysical Research: Biogeosciences, 127(7), e2021JG006344.
Evans, C., Artz, R., Burden, A., Clilverd, H., Freeman, B., Heinemeyer, A., Lindsay, R., Morrison, R., Potts, J., Reed, M. & Williamson, J. (2022, updated 2023) Aligning the Peatland Code with the UK peatland inventory. Report to the Department for Business, Energy and Industrial Strategy, Centre for Ecology and Hydrology, Bangor. 88pp.
Ferretto, A., Brooker, R., Aitkenhead, M., Matthews, R. and Smith, P., 2019. Potential carbon loss from Scottish peatlands under climate change. Regional Environmental Change, 19, 2101-2111.
Gatis, N., Benaud, P., Anderson, K. et al. (2023) Peatland restoration increases water storage and attenuates downstream stormflow but does not guarantee an immediate reversal of long-term ecohydrological degradation. Sci Rep 13, 15865. https://doi.org/10.1038/s41598-023-40285-4
Gregg, R., Elias, J.L., Alonso, I., Crosher, I.E., Muto, P. and Morecroft, M.D. (2021). Carbon storage and sequestration by habitat: a review of the evidence. Natural England, York. NERR094.
Gunther, A., Barthelmes, A., Huth, V., Joosten, H., Jurasinski, G., Koebsch, F., Couwenberg, J. (2024). Prompt rewetting of drained peatlands reduces climate warming despite methane emissions. Nature Communications, 11(1644).
He, H., Roulet, N.T. (2023). Improved estimates of carbon dioxide emissions from drained peatlands support a reduction in emission factor. Communications Earth & Environment, 4(1), p.436.
Heijmans, M.M.P.D., Mauquoy, D., van Geel, B. and Berendse, F. (2008), Long-term effects of climate change on vegetation and carbon dynamics in peat bogs. Journal of Vegetation Science, 19: 307-320. https://doi.org/10.3170/2008-8-18368
Heinemeyer, A., Asena, Q., Burn, W.B., Jones, A.L. (2018). Geo: Geography and Environment.
Howson, T.R. (2021). A comparison of the hydrology, hydrochemistry, and aquatic carbon flux from intact, afforested and restored raised and blanket bogs. PhD thesis, University of Leeds.
Howson, T., Chapman, P. J., Shah, N.,Anderson, R., & Holden, J. (2021). The effect of forest-to-bog restoration on the hydrological functioning of raised and blanket bogs. Ecohydrology, e2334.
Howson, T.R., Chapman, P.J., Holden, J., Shah, N., Anderson, R. (2022). A comparison of peat properties in intact, afforested and restored raised and blanket bogs. Soil Use and Management, 39(1), 104-121.
Van Huissteden, J., van den Bos, R. and Marticorena Alvarez, I. (2016) ‘Modelling the effect of water-table management on CO2 and CH4 fluxes from peat soils’, Netherlands Journal of Geosciences – Geologie en Mijnbouw, 85(1), pp. 3–18.
IEMA (2022). Assessing Greenhouse Gas Emissions and Evaluating their Significance.
Irish Peatland Conservation Council. (n.d.). Restoration of Drained Peatlands. Available at: Restoration of Drained Peatlands Irish Peatland Conservation Council (ipcc.ie)
IUCN, (2014). Briefing Note No3. Impact of artificial drainage on peatlands. 3 Drainage final – 5th November 2014.pdf (iucn-uk-peatlandprogramme.org)
IUCN, (2020). POSITION STATEMENT: Peatlands and Trees. IUCN UK PP Peatlands and trees position statement 2020.pdf (iucn-uk-peatlandprogramme.org)
IUCN, (2023). Peatland Code 2.0. IUCN National Committee United Kingdom. https://www.iucn-uk-peatlandprogramme.org/sites/default/files/2023-03/Peatland%20Code%20V2%20-%20FINAL%20-%20WEB_2.pdf
IUCN, (2023). Peatlands and Development. IUCN National Committee United Kingdom. Peatland and Development March 2023 – FINAL.pdf (iucn-uk-peatlandprogramme.org)
IPCC (2014) 2013 Supplement to the 2006 IPCC Guidelines for National Greenhouse Gas Inventories: Wetlands, Hiraishi, T., Krug, T., Tanabe, K., Srivastava, N., Baasansuren, J., Fukuda, M. and Troxler, T.G. (eds). Published: IPCC, Switzerland
Lees, K.J., Artz, R.R., Khomik, M., Clark, J.M., Ritson, J., Hancock, M.H., Cowie, N.R. and Quaife, T. (2020). Using spectral indices to estimate water content and GPP in Sphagnum moss and other peatland vegetation. IEEE Transactions on Geoscience and Remote Sensing, 58(7), 4547-4557.
Lenzen M., Munksgaard J. (2002). Energy and CO2 life-cycle analyses of wind turbines Review and applications. Renewable Energy, 26, 339-362.
Levy, P.E., Gray, A. (2015). Greenhouse gas balance of a semi-natural peatbog in northern Scotland. Environmental Research Letters, 10(9).
Lindsay R. (2010). Peatbogs and carbon: a critical synthesis to inform policy development in oceanic peat bog conservation and restoration in the context of climate change. University of East London, Environmental Research Group.
Lindsay, R., Clough, J., Clutterbuck, B., Bain, C., Goodyer, E., (2019). Eyes on the Bog. IUCN Peatland Programme https://www.iucn-uk-peatlandprogramme.org/sites/default/files/header-images/Eyes%20on%20the%20Bog%20Manual.pdf.
Ma, L., Zhu, G., Chen, B., Zhang, K., Niu, S., Wang, J., Ciais, P., Zuo, H. (2022). A globally robust relationship between water table decline, subsidence rate, and carbon release from peatlands. Communications Earth & Environment, 3 (254).
MacDonald, J.A., Fowler, D., Hargreaves, K.J., Skiba, U., Leith, I.D. & Murray, M.B. (1998) Methane emission rates from a northern wetland: response to temperature, water table and transport. Atmospheric Environment, 32(19), 3219–3227
Macfarlane, F., Robb, C., Coull, M., McKeen, M., Wardell-Johnson, D., Miller, D., Parker, T. C., Artz, R. R. E., Matthews, K., & Aitkenhead, M. J. (2024). A deep learning approach for high-resolution mapping of Scottish peatland degradation. European Journal of Soil Science, 75(4), e13538.
Marshall, C., Bradley, A.V., Andersen, R. and Large, D.J. (2021) Using peatland surface motion (bog breathing) to monitor Peatland Action sites. NatureScot Research Report 1269.
Martikainen, P.J., Nykiinen, H., Alm, J. & Silvola, J. (1995) Changes in fluxes of carbon dioxide, methane and nitrous oxide due to forest drainage of mire sites of different trophy. Plant and Soil, 168, 571–577
Morison, J. Matthews, R.W. Miller, G. Perks, M. Randle, T. Vanguelova, E. White, M. and Yamulki, S. (2012) Understanding the Carbon and Greenhouse Gas Balance of UK Forests. Forestry Commission, Edinburgh.
Natural England and RSPB (2020). Climate Change Adaptation Manual (NE751) – Evidence to support nature conservation in a changing climate. Royal Society for the Protection of Birds. http://publications.naturalengland.org.uk/publication/5679197848862720
NatureScot (n.d.). Restoring Scotland’s Peatlands. Restoring Scotland’s Peatlands | NatureScot
NatureScot (n.d.). Peatland ACTION case study: What’s the connection between peat and nature? https://www.nature.scot/doc/peatland-action-case-study-whats-connection-between-peat-and-nature
NatureScot (2015). Scotland’s National Peatland Plan: Working for our future. NatureScot/ NàdarAlba. https://www.nature.scot/doc/scotlands-national-peatland-plan-working-our-future
NatureScot (2022). General pre-application and scoping advice for solar farms. General pre-application and scoping advice for solar farms | NatureScot
NatureScot (2023) Advising on peatland, carbon-rich soils and priority peatland habitats in development management. Advising on peatland, carbon-rich soils and priority peatland habitats in development management | NatureScot
National Grid (2024). Clean energy: what happens when the wind isn’t blowing, and the sun isn’t shining? Stories, Energy Explained. National Grid. https://www.nationalgrid.com/stories/energy-explained/what-happens-when-wind-isnt-blowing-sun-isnt-shining
National Grid (2024). The Great Grid Upgrade. The Great Grid Upgrade | Making our electricity fit for the future (nationalgrid.com)
National Grid (n.d.). Onshore vs offshore wind energy: what’s the difference? Onshore vs offshore wind energy: what’s the difference? | National Grid Group
Nayak, D.R., Miller, D., Nolan, A., Smith, P. and Smith, J.U. (2008). Calculating carbon savings from wind farms on Scottish peat lands: a new approach. Scottish Government. https://www.gov.scot/publications/calculating-carbon-savings-wind-farms-scottish-peat-lands-new-approach/pages/0/
Nayak, D.R., Miller, D., Nolan, A., Smith, P. and Smith, J.U. (2010). Calculating carbon budgets of wind farms on Scottish peatlands. Mires and Peat, 4(9), 1-23.
Norby RJ, Childs J, Hanson PJ, Warren JM. (2019) Rapid loss of an ecosystem engineer: Sphagnum decline in an experimentally warmed bog. Ecol Evol. 9: 12571–12585.
Nykänen, H., Alm, J., Silvola, J., Tolonen, K. & Martikainen, P.J. (1998) Methane fluxes on boreal peatlands of different fertility and the effect of long-term experimental lowering of the water table on flux rates. Global Biogeochemical Cycles. 12, 53–69.
Ojanen, P. and Minkkinen, K. (2019) The dependence of net soil CO2 emissions on water table depth in boreal peatlands drained for forestry. Mires and Peat, Volume 24 (2019), Article 27, 1–8,
Parry, L.E., Charman, D.J. (2013). Modelling soil organic carbon distribution in blanket peatlands at a landscape scale. Geoderma, 211-212, 75-84.
Parry, L.E., West, L.J., Holden, J., Chapman, P.J. (2014). Evaluating approaches for estimating peat depth. Journal of Geophysical Research: Biogeosciences, 119(4), 567– 576.
Peat Mothership (2024). About the Project. Peat Mothership. https://www.peatmothership.org/
Peacock, M., Audet, J., Bastviken, D., Futter, M.N., Gauci, V., Grinham, A., Harrison, J.A., Kent, M.S., Kosten, S., Lovelock, C.E. and Veraart, A.J., (2021) Global importance of methane emissions from drainage ditches and canals. Environmental Research Letters, 16, 044010.
Pickard, A. E., Branagan, M., Billett, M. F., Andersen, R., and Dinsmore, K. J (2022).: Effects of peatland management on aquatic carbon concentrations and fluxes, Biogeosciences, 19, 1321–1334
Pontone N., Millard K., Thompson D.K., Guindon L., & Beaudoin A. (2024). A hierarchical, multi‐sensor framework for peatland sub‐class and vegetation mapping throughout the Canadian boreal forest. Remote Sensing in Ecology and Conservation. https://doi.org/10.1002/rse2.384
Price, J.S., McCarter, C.P. and Quinton, W.L. (2023). Groundwater in Peat and Peatlands. Groundwater Project. Guelph, Ontario, Canada, 108 pp. ISBN: 978-1-77470-015-0.
Ratcliffe, J.L., Payne, P.J., Sloan, T.J., Smith, B., Waldron, S., Mauqouy, D., Newton, A., Anderson, A.R., Henderson, A., Anderson, R. (2018). Mires and Peat, 23(3), 1-30.
Sallinen, A., Tuominen, S., Kumpula, T. and Tahvanainen, T. (2019). Undrained peatland areas disturbed by surrounding drainage: a large-scale GIS analysis in Finland with a special focus on aapa mires. Mires and Peat, 24(38), 1-22.
Scottish Forestry (n.d.) Scottish Forestry Map Viewer. Scottish Forestry – Scottish Forestry Map Viewer
Scottish Government (n.d). Scottish Remote Sensing Portal. Scottish Remote Sensing Portal | Scottish Government (remotesensingdata.gov.scot)
Scottish Government (2007) Scottish Planning Policy 6 Renewable energy. Withdrawn. ISBN: 9780755965526
Scottish Government, Scottish Natural Heritage, SEPA (2017) Peatland Survey. Guidance on Developments on Peatland.
Scottish Government (June 2024) Energy Statistics for Scotland Q1 2024 Figures
Scottish Government (2023) Onshore wind sector deal, Energy and Climate Change Directorate, ISBN: 9781835213810
Scottish Government (2024) Record high peatland restoration. Press release. https://www.gov.scot/news/record-high-peatland-restoration/
Scottish Government (2024). Scotland Habitat and Land Cover Map – 2022. https://www.data.gov.uk/dataset/fb20f816-d3cb-433b-9cd5-0e0b8eea7367/scotland-habitat-and-land-cover-map-2022
SEPA (2012). Developments on Peat and Off-Site Uses of Waste Peat. Scottish Environment Protection Agency. https://www.sepa.org.uk/media/287064/wst-g-052-developments-on-peat-and-off-site-uses-of-waste-peat.pdf
Silvola, J., Alm, J., Ahlholm, U., Nykänen, H. & Martikainen, P.J. (1996) CO2 fluxes from peat in boreal mires under varying temperature and moisture conditions. Journal of Ecology, 84, 219–228.
Smith, J.U., Graves, P., Nayak, D.R., Smith, P., Perks, M., Gardiner, B., Miller, D., Nolan, A., Morrice, J., Xenakis, G. and Waldron, S. (2011). Carbon Implications of Wind farms Located on Peatlands–Update of the Scottish Government Carbon Calculator Carbon Calculator. Scottish Government, Scotland.
Smyth, M.A., Taylor, E.S., Birnie, R.V., Artz, R.R.E., Dickie, I., Evans, C., Gray, A., Moxey, A., Prior, S., Littlewood, N. and Bonaventura, M. (2015) Developing Peatland Carbon Metrics and Financial Modelling to Inform the Pilot Phase UK Peatland Code. Report to Defra for Project NR0165, Crichton Carbon Centre, Dumfries.
Speranskaya, L., Campbell, D. I., Lafleur, P. M., and Humphreys, E. R. (2024) Peatland evaporation across hemispheres: contrasting controls and sensitivity to climate warming driven by plant functional types, Biogeosciences, 21, 1173–1190.
Statista (2024). Electricity generation in the United Kingdom (UK) from 2010 to 2022, by source. UK: power supply mix 2022 | Statista
Tiemeyer, B., Albiac Borraz, E., Augustin, J., Bechtold, M., Beetz, S., Beyer, C., Drösler, M., Ebli, M., Eickenscheidt, T., Fiedler, S., Förster, C., Freibauer, A., Giebels, M., Glatzel, S., Heinichen, J., Hoffmann, M., Höper, H., Jurasinski, G., Leiber-Sauheitl, K., Peichl-Brak, M., Roßkopf, N., Sommer, M. and Zeitz, J. (2016), High emissions of greenhouse gases from grasslands on peat and other organic soils. Glob Change Biol, 22: 4134-4149.
Tiemeyer, B., Freibauer, A., Albiac Borraz, E., Augustin, J., Bechtold, M.m Beetz, S., Beyer, C., Ebli, M., Eickenscheidt, T., Fiedler, S., Förster, C., Gensior, A., Giebels, M., Glatzel, S., Heinichen, J., Hoffmann, M., Höper, H., Jurasinski, G., Laggner, A., Leiber-Sauheitl, K., Peichl-Brak, M., Drösler, M. (2020). A new methodology for organic soils in national greenhouse gas inventories: Data synthesis, derivation and application. Ecological Indicators, Volume 109, 2020, 105838, ISSN 1470-160X.
Toča, L., Morrison, K., Quaife, T., Artz, R.R.E. and Gimona, A. (2023). Restored Scottish Blanket Bog Monitoring Using Time Series of Optical and Radar Satellite Data. In IGARSS 2023-2023 IEEE International Geoscience and Remote Sensing Symposium, 2708-2710.
Tolan, J., Yang, H-I., Nosarzewski, B., Couairon, G., Vo, H.V., Brandt, Spore, J., Majumdar, S., Haziza, D., Vamaraju, J., Moutakanni, T., Bojanowski, P., Johns, T., White, B., Tiecke, T., Couprie, C. (2024) Very high resolution canopy height maps from RGB imagery using self-supervised vision transformer and convolutional decoder trained on aerial lidar, Remote Sensing of Environment, Volume 300, 113888,ISSN 0034-4257.
JHI (2024). First-ever flux tower on forested peat to measure landscape scale emissions The James Hutton Institute. https://www.hutton.ac.uk/first-ever-flux-tower-on-forested-peat-to-measure-landscape-scale-emissions/
Vestas (2005). Life cycle assessment of offshore and onshore wind power plants based on Vestas V90-3.0 MW turbines. Vestas Wind Systems A/S Alsvej 21, 8900 Randers, Denmark, pp.59. www.vestas.com.
Vestas (n.d.) Life Cycle Assessments of our turbines. Life Cycle Assessments (vestas.com)
Watmough, S., Gilbert-Parkes, S., Basiliko, N., Lamit, L.J., Lilleskov, E.A., Andersen, R., del Aguila-Pasquel, J., Artz, R.E., Benscoter, B.W., Borken, W. and Bragazza, L. (2022). Variation in carbon and nitrogen concentrations among peatland categories at the global scale. Plos One, 17(11), 0275149.
West, V. (2011). Soil Carbon and the Woodland Carbon Code, Forestry Commission, Edinburgh.
Wille, E. A., Lenhart, C. F., & Kolka, R. K. (2023). Carbon dioxide emissions in relation to water table in a restored fen. Agricultural & Environmental Letters, 8, e20112.
Williamson, J., Rowe, E., Reed, D., Ruffino, L., Jones, P., Dolan, R., Buckingham, H., Norris, D., Astbury, S. and Evans, C.D. (2017). Historical peat loss explains limited short-term response of drained blanket bogs to rewetting. Journal of Environmental Management, 188, 278-286.
Wilson, D., Blain, D., Couwenberg, J., Evans, C.D., Murdiyarso, D., Page, S.E., Renou-Wilson, F., Rieley, J.O., Sirin, A., Strack, M., and Tuittila, E.-S., (2016) Greenhouse gas emission factors associated with rewetting of organic soils. Mires and Peat, Volume 17 (2016), Article 04, 1–28.
Woodland Carbon Code (2024). Home- UK Woodland Carbon Code. Woodland Carbon Code https://woodlandcarboncode.org.uk/.
Worrall, F., Chapman, P., Holden, J., Evans, C., Artz, R., Smith, P. and Grayson, R. (2010). Peatlands and climate change. Report to IUCN UK Peatland Programme, Edinburgh. https://www.iucn-ukpeatlandprogramme.org/scientificreviews
Worrall, F., Boothroyd, I.M., Gardner, R.L., Howden, N.J., Burt, T.P., Smith, R., Mitchell, L., Kohler, T. and Gregg, R. (2019). The impact of peatland restoration on local climate: Restoration of a cool humid island. Journal of Geophysical Research: Biogeosciences, 124(6), pp.1696-1713.
Appendices
The following appendices open a download link to each of the spreadsheets.
Appendix 1 Technical assessment (opens spreadsheet)
Appendix 2 Sensitivity Analysis (opens spreadsheet)
Appendix 3 – High Resolution Spatial Data (HRSD) Assessment (opens spreadsheet)
© The University of Edinburgh, 2025
Prepared by AECOM on behalf of ClimateXChange, The University of Edinburgh. All rights reserved.
While every effort is made to ensure the information in this report is accurate, no legal responsibility is accepted for any errors, omissions or misleading statements. The views expressed represent those of the author(s), and do not necessarily represent those of the host institutions or funders.
If you require the report in an alternative format such as a Word document, please contact info@climatexchange.org.uk or 0131 651 4783.
Avoid – by removing the impact at the outset, Minimise – by reducing the impact, Restore – by repairing damaged habitats, Offset – by compensating for residual impact that remains, with preference to on-site over off-site measures. ↑
Research completed in May 2024
DOI: http://dx.doi.org/10.7488/era/4964
This work was carried out in accordance with the requirements of the international quality standard for Market Research, ISO 20252
Executive summary
Aims
This study carried out a programme of deliberative public engagement to inform the design and delivery of Just Transition Plans in the transport, built environment and construction, and land use and agriculture sectors.
This report summarises findings from two phases of public engagement that aimed to:
- uncover informed, considered and collective public opinion on the fair distribution of costs and benefits in the transition to net zero emissions in these three key sectors (phase one)
- gather learning into the factors influencing any changes in participants’ attitudes, beliefs or values as a result of engaging in this deliberative process (phase one)
- gather views on how specific policy options within the transport and built environment sectors could be implemented fairly (phase two).
Overall findings and implications
- We all have something to contribute towards the costs of the transition to net zero, including the Scottish Government, businesses and citizens.
- Participants wanted to see an equitable approach, meaning that everyone contributes but not all in the same way or by the same amount. They felt that a fair distribution of costs must take account of different circumstances, including:
- the amount of control someone has over their level of emissions
- the availability of lower carbon alternatives
- their ability to pay.
- Participants supported a progressive form of taxation to fund some of the changes required across key sectors, with higher income individuals and businesses paying more.
- Participants emphasised the need for systems that protect those least able to afford transitions, including exemptions and support for low-income individuals and for those facing health or disability challenges.
- A combination of incentives and disincentives was broadly supported and was considered the most effective way to encourage (and discourage) certain behaviours.
- The timing of any new taxes, charges or penalties was felt to be a key consideration for ensuring a balance between motivating people to change while not unfairly penalising them. A phased, staggered approach was seen as one way of achieving this balance.
- The importance of clear and transparent communication with the public was emphasised. It was agreed that the public should feel part of the decisions that affect them through ongoing public engagement.
Deliberative process and impact on views
- Participants said they had developed and deepened their understanding of the scale and complexity of a just transition to net zero, in this deliberative process.
- Initially, participants thought that those who emit the most should contribute the most. However, upon further deliberation and consideration of the impacts of this on different groups, they had a strong sense that this approach would be unfair if it did not consider those who have more limited control over their emissions (such as some businesses or people living in rural areas).
- The factors that contributed most to participants’ views deepening or shifting were hearing from participants with different backgrounds; learning from experts; engaging with hypothetical scenarios and considering impacts from a range of perspectives; consolidating their views through voicing them in group discussions; and having time to reflect on the issues between sessions.
- Overall, participants valued the opportunity to learn about, discuss and contribute to Scotland’s just transition. They emphasised the importance of ongoing engagement with the public, through these types of engagement.
Key messages for the transport sector
- Achieving a decarbonised transport system will require significant investment in infrastructure across Scotland.
- For any form of Road User Charging to be considered fair, participants concluded that different circumstances and needs should be considered, rather than taking a blanket approach. They felt there should be concessions or exemptions for some groups, including people on low incomes, those with health conditions or disabilities, elderly people, those living in rural communities and those who rely on their car for their livelihoods.
- Participants felt that Road User Charging would be unfair in rural areas unless there was improved access to public transport.
- They also highlighted the importance of allowing sufficient time for people to prepare for any changes being introduced.
Key messages for the built environment sector
- Participants suggested that those who profit from buildings – including businesses in the construction sector and those owning multiple properties – should pay for the changes needed to lower the carbon emissions of those buildings.
- To ensure the heat transition is paid in the fairest way possible:
- There should be support available to all households but the amount of support should vary depending on circumstances, with those on low incomes and those with older properties entitled to the most government funding.
- There should be protections in place, such as exemptions from penalties for vulnerable groups, rent increase caps to protect renters, regulation on the installation of new heating systems and a fair appeals process.
- Other considerations included careful consideration around loans to avoid pushing anyone into financial hardship, reassurances around the efficacy of new heating systems and clear communication with the public about the changes required.
Key messages for the land and agriculture sector
- Participants agreed that the costs of adopting a more climate friendly approach to food should be shared between the Scottish Government, businesses (including farmers but also other businesses along the supply chain such as supermarkets) and consumers. It was also felt that landowners should bear some of the costs.
- Suggestions to ensure a fair transition in the way we produce and consume food:
- Consider people’s ability to pay, with protection in place for low-income consumers.
- Subsidise farms, favouring smaller farms with less income. Support payments should be specifically allocated towards covering the costs of reducing carbon emissions.
- Give farms sufficient time and opportunity to change and reduce emissions before introducing any financial impacts such as additional tax.
- Ensure that consumers have easier access to sustainable food options.
Introduction and method
This report presents the findings from public engagement regarding a just transition to net zero in three key sectors: transport, built environment and construction, and land use and agriculture. The research was carried out by Ipsos on behalf of ClimateXChange and the Scottish Government.
Background to the research
The Scottish Government’s approach to climate change is underpinned by a commitment to deliver a just transition. The Climate Change Plan 2018-2032 update[1] emphasises that a just transition “puts people, communities and places at the heart of our approach to climate change action.” The plan recognises climate change as a human rights issue and the transition to net zero as an opportunity to tackle inequalities.
The Climate Change (Emissions Reduction Targets) (Scotland) Act 2019[2] places statutory obligations on the Scottish Government to develop Climate Change Plans and demonstrate how just transition principles have been taken into account when preparing these.
The 2019 report[3] from the Just Transition Commission outlined recommendations for achieving a just transition to net zero. In its response, the Scottish Government set out its Outcomes, as part of its National Just Transition Planning Framework, and committed to producing Just Transition Plans for high-emitting sectors, sites and regions.[4] The draft Energy plan was published for consultation in January 2023[5]. Plans for transport, built environment and construction, and land use and agriculture are currently in development.
Alongside these policy commitments, the Scottish Government has also emphasised the importance of public engagement in the transition to a net zero and climate ready Scotland. The Climate Change Public Engagement Strategy (Net Zero Nation)[6] sets out the framework for engaging the Scottish public in the transition to net zero, including the objective “people actively participate in shaping just, fair and inclusive policies that promote mitigation of and adaptation to climate change.”
Objectives
Against the policy background outlined above, ClimateXChange and the Scottish Government commissioned a programme of deliberative research to inform the design and delivery of the outstanding Just Transition Plans in transport, built environment and construction, and land use and agriculture. The research initially had two objectives:
- To uncover informed, considered and collective public opinion on the fair distribution of costs and benefits in the transition to net zero emissions in the three key sectors.
- To gather learning into the factors influencing any changes in participants’ attitudes, beliefs or values as a result of engaging in this deliberative process.
As the research progressed, a third objective was introduced:
- To gather views on how specific policy options within the transport and built environment sectors could be implemented fairly.
Ultimately, the research aimed to directly inform the Just Transition Plans and wider work on the transition to net zero across relevant policy areas.
Methodology
Deliberative approach
A deliberative approach was chosen for this research due to the complex and multi-faceted nature of Scotland’s just transition to net zero. Deliberative engagement is about putting people – through informed discussions, involving diverse perspectives, and understanding lived experiences – at the heart of decision making. It differs from other forms of engagement in that it allows those involved to spend time considering and discussing an issue at length before they come to a considered view. Previous research has noted that the complexity of views around climate change means that this topic lends itself well to deliberative forms of engagement.[7]
This deliberative research used a public dialogue approach,[8] a process whereby members of the public interact with experts and policy makers to deliberate on issues relevant to future policy and research decisions. The research was delivered in two phases, each of which are outlined below.
Phase one overview
Phase one brought together a group of 30 people from across Scotland to address the first two objectives (gathering views on a fair distribution of costs and benefits in the transition to net zero emissions, and gathering learning into the factors influencing participants’ attitudes as a result of engaging in a deliberative process). They met online for six workshops held between August and October 2023, each lasting between two to three hours, with the overall aim of answering these overarching questions in relation to each sector:
- As we transition to net zero, who should pay for the changes that will be needed?
- How can we make sure that system of payment is fair?
- How can we make sure that everyone benefits?
An outline of the process and each workshop can be found in the Appendix A.
Online community
Alongside the workshops, an online community helped support ongoing engagement with the participants, facilitating continued discussion and reflection. The online community was hosted on Community Direct (an Ipsos proprietary platform) and discussion was moderated by Ipsos researchers.
Recruitment
The aim was to achieve a sample of at least 30 participants with over-recruitment to account for potential cancellations or drop-outs. In the end, 30 participants started the process and 27 continued to the end.
Participants were recruited by Fieldmouse, a specialist recruitment organisation, who contacted members of their existing panel of potential research participants by telephone. A screening questionnaire was used to capture demographic information about the participants, designed to help ensure the group’s profile was broadly reflective of the Scottish population. Quotas were set on various characteristics (see Appendix B) in line with national population data. However, those living in a remote rural or island area, from an ethnic minority group, with a disability or long-term health condition, or on a lower income were over-sampled to ensure sufficient representation of these groups.
To support and enable participation in the research, and in line with industry standards, each participant was paid £400. Where necessary, training was provided on how to use the technology and access the meeting platform. This allowed Ipsos to enhance the diversity of those taking part. Workshops were also arranged to take place outside of regular office hours to increase participation.
Materials
Discussion guides (Appendix C) and stimulus (Appendix D) were developed by Ipsos and approved by ClimateXChange and the Scottish Government. A range of specialists joined at different points in the dialogue to provide information that would be useful for participants’ learning and deliberation. Presentations were developed by specialist speakers, in consultation with Ipsos, and these presentations were given live during the main plenary sessions. The specialists were available to answer questions from participants in sessions. Presentation recordings were hosted on YouTube and shared via private links for members to watch again in their own time in preparation for subsequent sessions.
Stimulus were used to encourage participants to consider different impacts of the transition. Ipsos developed fictional characters to help participants think about the impact of potential changes on different groups; and fictional future systems of payment to help participants consider what a fair distribution of costs would look like.
Fictional characters used throughout the workshops
Alice is 28. She lives in Dundee in a third-floor flat that she shares with two other friends. Alice works as a nurse in Ninewells Hospital. She works shift patterns, meaning that she often finishes after 10pm. Alice’s income is £28,000 per year.
David and Sarah are married. David is 42and Sarah is 40, and they have two children, Noah (10) and Katie (7). David works as a financial advisor and Sarah works as a website designer. They live in Bearsden, on the outskirts of Glasgow. David and Sarah’s combined income is £105,000 per year.
Lorraine is 60. She lives on a farm in rural Aberdeenshire where she raises cattle and turkeys. Lorraine employs staff who work on the farm and the farm shop. Her son and daughter also work for the business. Lorraine’s income is £55,000 per year.
Maria is 36. She lives in a flat in Moffat with her daughter, Ella (3). Maria has mobility issues and a respiratory condition that sometimes affects her breathing. Maria looks after Ella full time and does not have another job. Maria’s income from benefits is £21,500.
Nadeem is 50. He lives on the Isle of Lewis, about 10 miles from Stornoway. He lives with his son, Ajay (23). Nadeem is a builder and Ajay works in a shop in Stornoway. Nadeem’s income is £45,000 per year and Ajay’s income is £24,000 per year.
Phase two overview
Phase two brought together a group of 20 people from across Scotland to address the third research objective (exploring specific policy options). They met online for three workshops held in March 2024, each lasting between two and three hours. An outline of the structure of each workshop is shown in Appendix A.
Recruitment
The aim was to achieve a sample of at least 15 participants with over-recruitment to account for potential cancellations or drop-outs. In the end, 20 participants started the process and 19 continued to the end.
Participants were recruited by telephone using a screening questionnaire, as per phase one (see Appendix B for quotas and over-sampled groups). Participants were each paid £140 for their participation.
Materials
Discussion guides (Appendix C) and stimulus (Appendix D) were developed by Ipsos and approved by ClimateXChange and the Scottish Government. Presentations given in session one were developed by specialist speakers and Ipsos. Presentation recordings were hosted on YouTube and shared via private links for members to refer back to.
In the remaining workshops, participants focused on two policies; Road User Charging (RUC) and the heat transition in domestic properties. For each policy, they explored two approaches before forming conclusions. Some of the fictional characters from phase one were used to help participants think about the impact of different approaches on a range of groups and to consider trade-offs.
How to read this report
The main body of this report provides a summary of key findings, while appendices 1-3 provide more detailed discussions relating to each sector.
Readers are reminded that the report contains findings from two deliberative processes which were staged in two phases. Phase one’s remit was to consider the broader principle of fairness across three sectors, while phase two’s remit was to consider how specific policies could be implemented fairly within two of those sectors. Findings related to specific phases are highlighted at appropriate points, however, some chapters draw on both to minimise repetition (for instance, in the next chapter, where the starting points for both cohorts were similar).
More broadly, the conclusions set out and discussed in this report are intended to inform the Scottish Government’s development of Just Transition Plans. The report includes verbatim assertions by participants and their understanding of the issues. These are not intended as authoritative statements of fact, but they tell us something valuable about how key issues have been perceived and understood by members of the public.
It should also be noted that, at different points in the dialogue, participants engaged with hypothetical scenarios and policy approaches designed to help participants engage with the issues. They were not necessarily reflective of the Scottish Government’s powers or its intended course of action.
Further, it should be noted that whilst the method of qualitative analysis is systematic and rigorous and the conclusions robust (being based on groups that are reflective of the diversity of the wider public), the analysis does not seek to quantify findings nor does it indicate statistical significance from a representative sample. This report offers a valuable insight into public perspectives on the key questions posed to them after receiving and deliberating on key information relevant to the questions. It will also provide valuable insights for engaging the public on policies which will have a significant impact on their lives.
Participants’ starting point
This chapter outlines the initial views of participants as they began the dialogue. It includes the views of both cohorts (i.e. participants taking part in phase one or phase two) in their respective first workshops, which covered similar content.
Familiarity with key terms
In both phases, participants were generally aware of and familiar with the term “net zero”. When asked to describe what this meant, they used words such as “reducing”, “balancing” or “offsetting our emissions”. Reference was also made to specific behaviours linked with the transition to net zero, such as changing modes of transport, using renewable sources of energy, and eating less meat or dairy. At this early stage there was some concern about the scale of the challenge of reaching net zero, and a desire to learn more about how we get there.
“I recognise it’s something we should work towards but there are so many challenges to cancel out what we are doing. It would take radical changes to people’s lives. I find it hard to work out how on earth we will get there, which is why I really want to listen to the experts.” (Participant, phase 1, workshop 1)
There was also some scepticism about how the term “net zero” was used, with some asking whether it actually translated into real change, and others asking whether the target was long term enough. This reflected fairly high levels of concern about climate change among these participants, and a desire to see action as a result of the dialogue.
Participants were much less familiar with the term “just transition”. Among the few participants who had heard the term, they understood it to mean the sharing of responsibility for the transition to net zero, while protecting groups such as those in rural areas and those struggling financially. Others spoke of it specifically in terms of jobs, and the aim of protecting people who worked in traditional fossil fuel industries that may become obsolete (using the example of oil workers in Aberdeen). Overall, a just transition was seen as challenging and questions were raised such as “is it achievable?” and “who can be trusted to take the lead on this?”
Participants expressed a general interest and concern in the topic of climate change and hoped to learn more about the policy developments, explore how they as individuals could act to help tackle climate change, and to both hear from others’ perspectives and feel that the Scottish Government is listening to their views.
“There’s such a lot of different opinions, and living in a rural area we might have different opinions to those in a town or city. I wanted to find out more and join in.” (Participant, phase 2, workshop 1)
Reactions to the first presentations
In the first workshop of phase one, participants learned about key concepts that would help them in later deliberations. They heard three presentations which covered: Scotland’s current approach to net zero targets; the principle of a just transition and the work of the Just Transition Commission; and the Scottish Government’s Just Transition Plans for the three key sectors.[9] Phase two participants heard similar introductory presentations, but the second one focussed on the Scottish Government’s Just Transition Plans for the three key sectors; and the third one on wider public engagement on Scotland’s just transition.
As well as generating a number of questions (which were responded to by expert presenters) the presentations highlighted some broader issues of importance for participants. Some emphasised their concern about the scale of change required to reach net zero and how challenging it will be to change attitudes and behaviours. Others felt that achieving a just transition would be very difficult due to the range of different circumstances to be taken into consideration, particularly the differences between urban and rural areas.
“It’s a huge undertaking. I don’t think we can accommodate for every single person in the country not to be left behind.” (Participant, phase 1, workshop 1)
Some felt reassured by the existence of the Just Transition Commission and the Scottish Government’s Just Transition Plans, but there was also a lack of clarity for others around the measures that would be put in place to ensure a just transition. There was therefore a broad interest in understanding more about what these would mean in practice.
“We’ve heard all of this before. I want some of this to get put into practice. I haven’t seen anything […] We talk about emissions and everything but nothing has been put into practice to say “we start from here”. We don’t even know where the money is coming from. The transition part is expensive for ordinary households.” (Participant, phase 2, workshop 1)
In phase two there was some scepticism among participants about the Scottish Government’s ability to implement changes fairly (based on perceptions of how LEZs in Glasgow and Aberdeen had been introduced). Given the focus on phase two on specific policies in the transport and built environment sectors, there were also concerns raised about the high upfront costs of switching to EVs or making home energy improvements (based on participants’ own experiences). Participants wanted to see more evidence of the efficacy of low carbon technologies before they would be willing to spend money on them.
Overall, participants generally found the information in the presentations useful and informative. They stressed the importance of the wider public being made aware of Scotland’s net zero targets and the scale of changes required to meet them – the types of information that participants had just heard.
“We need to make sure that people in this country know how [the transition] is going to affect them. You need to give real examples, concrete examples of what is going on in Scotland.” (Participant, phase 1, workshop 1)
Early thoughts on fairness
At the end of the first workshops (in both phase one and two), participants shared their reflections on what a just transition to net zero would mean. Their responses highlighted that, despite a lack of familiarity with the term, participants were engaging with some of the principles that underpin a just transition. These early themes included the following:
- Costs should be distributed. Participants felt there should be some form of shared responsibility. There was a broad sense that everyone should contribute something, but it was also highlighted that these contributions would not be equal (as people would not be starting from equal positions). It was also felt that some individual actions would need to be supported by systemic changes.
- Different needs and circumstances should be taken into consideration. In particular, fairness was linked to acknowledging people’s different financial circumstances and ability to afford the changes that might be expected of them. It was also linked to understanding the differences between urban and rural communities in relation to access to transport infrastructure.
- Awareness-raising and public engagement are important to help people to understand why change is needed and what changes we can all make. It was stressed that consultation and engagement should focus on those who are most likely to be affected by the transition.
- The transition should not result in further inequality and could even be an opportunity to tackle existing poverty and inequality. Particularly among participants in phase one, there was an aspiration that the transition to net zero should not results in the loss of jobs or communities.
These early themes were revisited and developed further by participants in the remaining workshops, as they learned about specific sectors, deliberated on a fair distribution of costs and benefits, and (in phase two) considered different policy options.
Principles of fairness across sectors
In phase one, individual sectors were covered in three separate workshops on transport, built environment and construction, and land use and agriculture. In these workshops participants heard presentations which outlined some of the changes that may be needed in the sector.
Participants were presented with a vision for the sector in 2040 based on the Scottish Government’s discussion papers and explored this in the context of different fictional characters and how they might be impacted. The visions for each sector outlined changes such as:
- Transport – private cars produce fewer emissions; alternatives to private cars (e.g. public transport, car sharing etc) are readily available; there are measures to discourage car use (e.g. road charges); and new transport jobs have been created.
- Built environment and construction – buildings are more energy efficient; places are designed and used differently (e.g. to cope with extreme weather, or reduce flood risk); the construction sector is more sustainable, using more locally sourced and natural supplies; and new construction jobs have been created.
- Land use and agriculture – land is used differently, with less dedicated to food production and more to planting trees, peatland restoration and supporting biodiversity; people are encouraged to consider the climate impacts of food and waste less food; and land and agriculture based jobs have changed.
Using these examples, and based on their own lived experiences, participants answered these questions for each sector:
- As we transition to net zero, who should pay for the changes that will be needed?
- How can we make sure that system of payment is fair?
- How can we make sure that everyone benefits?
- Answers to those questions were developed in detail in the final workshop and are outlined in the conclusions to phase one. Five common, cross-cutting themes emerged across sectors that are summarised below.
Cross-cutting themes
Support for those most impacted by the transition
Having heard about the potential changes that may be required to reach net zero in each sector, participants identified certain groups that were likely to be impacted more than others. It was felt that these groups would require support so that they did not experience financial or other types of disadvantage as a result of the transition. These groups were:
- Individuals and businesses in rural communities. Across all sectors, it was felt that rural areas would face specific challenges in meeting the aspirations outlined in the sectoral visions. These barriers included: a greater reliance on cars and a lack of public transport infrastructure; high costs of upgrading heating systems due to older, less energy efficient properties; and less easy access to sustainable food options in shops. It was felt that these types of barriers should be accounted for in the planning for the transition.
- People who are unable to afford to make changes. Having heard about the potential changes needed in all three sectors, participants felt that these were likely to be expensive. There was particular concern about the impact of those costs on people who would already be considered financially vulnerable, including those on lower incomes and those struggling with the cost of living. This concern carried through to participants’ later views on fair systems of payment, and the importance of considering an individual’s ability to pay.
- Businesses unable to afford to make changes. Smaller businesses, including small farms, were viewed as being more financially vulnerable and less likely than larger companies to be able to cover costs of the transition.
- People working in jobs most likely to be impacted by the transition. This included: farmers who may be required to change the way they use land and produce food; those who drive for a living who may be impacted by the move to a decarbonised transport system; and the construction sector, who would need to reskill people to retrofit or build new energy efficient buildings.
Shared responsibility for paying for the transition
A theme throughout the sector-focussed workshops was that we all have something to contribute. When discussing each sector, it was felt that the costs of transitioning to net zero should be shared among the Scottish Government, businesses and citizens:
- The Scottish Government should fund infrastructure that helps the public to make lower carbon choices (e.g. funding EV charging infrastructure, free public transport) and provide grants or loans to help people with upfront costs such as replacing heating systems. This support was seen as essential to help those who would not be able to afford these changes. It was also felt that the Government should continue to subsidise farmers, as without these subsidies farms may not survive.
- Businesses should pay for making changes, particularly if they are going to benefit financially. This was seen as particularly the case for the construction sector and parts of the transport industry, but also extended to farmers and the wider food supply chain. The overriding theme was that profit-making businesses would both have the ability to pay (because they could afford to) and a responsibility to pay (if they would benefit from the changes).
- Citizens. It was felt that the public bears some responsibility to pay for changes to our homes, our forms of transport, and the food we consume. It was also agreed that those continuing to make high carbon choices should bear the cost of those choices. However, there were a number of important conditions to this, including the affordability of the changes, and the extent to which someone has alternative choices available to them. These conditions, and how they would be accounted for, were explored in more detail in later workshops.
There were also some specific groups identified as being responsible for changes within individual sectors, including landlords and property owners who it was felt should be responsible for making properties more energy efficient or transitioning to clean heating systems; and landowners who participants suggested should be taxed to help pay for some of the changes to land use needed.
No ‘one size fits all’ approach
Reflecting the points above, it was felt that different approaches would be needed to accommodate the circumstances of and likely impacts on different groups. Across the sectors, the following characteristics were seen as important to bear in mind:
- The extent to which there are options available to support low carbon choices. For example, if there is a lack of public transport options (as in rural areas) or if the use of EVs is not practically feasible, then it would be unfair if people in those areas had to pay to fund EV or public transport infrastructure.
- The ability to pay, so that those on lower incomes are not further disadvantaged by having to pay for changes they are unable to afford. This extended to businesses, as it was felt that farmers, small businesses, and those struggling financially should be provided with support towards making changes.
- Having needs that may impact on behaviours, such as having a disability or health conditions that requires use of a car.
In these sector-focussed workshops, there were mixed views on the extent to which systems of payment should be based on levels of emissions. On the one hand, there was a view that individuals who continue to drive high emitting vehicles or property owners who had neglected to make the necessary changes should be obliged to pay more. On the other hand, it was felt that higher emitters may not have a viable alternative, either because of where they live (i.e. those in rural areas may have no alternative to cars) or because of income (i.e. being unable to afford an EV or to make energy efficiency improvements in their homes).
These views on fair systems of payment were explored in more detail, using hypothetical scenarios, in the penultimate workshop.
Acceptance of the possibility of taxation
- Before they had explored potential systems of payment in detail, participants had already discussed the possibility of taxation to support the costs of the transition. While there was an expectation that the Scottish Government would contribute towards the costs (as noted above), it was also acknowledged that those costs paid could end up being borne by the individual anyway through taxation. A progressive tax was supported in principle, based on both ability to pay and ability to choose, but participants did not discuss (at this stage) the details of how that would be implemented.
- Some participants felt that payments should be covered by a tax on larger, profit-making businesses, particularly whose practices are not climate-friendly (e.g. those who import food from overseas). At the same time, there was recognition that penalising businesses too harshly could force them to leave Scotland which would risk jobs and move carbon emissions elsewhere. There was some support for a “food miles tax” or other form of high carbon products tax, but only if other more sustainable food options were available and affordable.
Need for education and time
When reflecting on the likely changes in each sector, participants felt there was need for further education, engagement, and public consultations around the transition. They felt that the necessity and benefits of transitioning to net zero should be clearly communicated to all citizens.
It was also stressed that people and businesses would need sufficient time to adapt to the changes required for the transition to net zero, and that this would require advance notice of regulations, taxes or other charges, or incentives.
How our fictional characters fared across all sectors
When reviewing the impacts of the transition on our fictional characters, participants highlighted many of the points raised above, particularly the importance of taking into account factors such as location (whether they lived in urban or rural areas), ability to choose, tenure, income, occupation and other lifestyle factors.
Who benefits from changes?
Alice benefits from improvements to public transport which she could use to go to work in Dundee, rather than relying on her petrol car. However, it was pointed out that more regular buses would not necessarily make her feel any safer travelling to work at certain times (one of the main reasons she avoided using public transport). It was felt that Alice would also benefit from improved energy efficiency in her rented flat, provided upgrades were carried out by her landlord and that additional costs associated with this were not passed on to her. She would also benefit if she was able to afford a high-quality new build in future (as she was hoping to buy a property).
An improved public transport system would benefit Maria, who did not drive. This would mean she would be less reliant on taxis, saving her money. As a tenant (in a flat with an EPC rating of C), she might also benefit if the housing association made her home more energy efficient and if appropriate measures were introduced to reduce the risk of flooding to her property (her ground floor flat was located in a flood risk area).
Nadeem (a builder) could benefit from an increase in demand in the construction sector and from training opportunities available on new construction techniques, provided these are accessible to him and his staff.
David and Sarah would benefit from the move to a more sustainable food system because their lifestyle choices were already in line with this vision (as they largely bought locally produced food, and were on the waiting list for an allotment), and they could afford to make further changes or absorb increased costs.
Who might be negatively impacted?
Lorraine would be negatively impacted across all sectors. As a farmer, she may be required to change her use of transport but have limited low carbon alternatives for agricultural vehicles and personal car use (based on the view that the sort of rural area where she lives is unlikely to have the level of integrated transport needed). It was also noted that her property would likely require a lot of work to make it more energy efficient, which she may not be able to afford. Lorraine’s livelihood was also identified as at risk given the challenges of diversifying land use and the need to increase prices to cover the cost of making those changes. Her age was noted as a factor in that she may not have time to benefit before she retires.
It was felt that Nadeem would be negatively impacted because of his reliance on a van for his work and the fact that he lives and works on the Isle of Lewis. Based on the assumption that public transport would not be a viable alternative, it was considered unfair that his earnings would be affected by road charges. Nadeem and Ajay (both vegan) may lose out if a focus on local food products means they have less choice in their diet. This could be exacerbated by additional challenges transporting goods to where they live. Ajay’s job in a food shop might be at risk if it is adversely affected by increased prices.
It was felt that Alice may see her rent increased to cover the costs of making her home more energy efficient. This would affect her ability to save for a new property, especially if very high energy efficiency standards led to increased costs for new builds. Alice and Maria were both identified as at risk of losing out if food prices increase because of their concern about the current cost of groceries. They may also struggle to access local produce; Maria because of her child care requirements, and Alice because of her shift patterns.
Although David and Sarah would have to adapt their lifestyle in relation to transport (e.g. they would likely have to reduce their use of two cars) it was felt they would be able to adapt and absorb the costs with their income. However, it was recognised that there would need to be some flexibility or exemptions given for their use of the car when travelling with their disabled son.
Fair systems of payment in practice
In the penultimate workshop participants explored what a fair system of payment might look like across all three sectors. Hypothetical scenarios were created and used as a way of testing participants’ views of fairness. These were based on information provided in the workshop presentations and ideas raised by the participants themselves during breakout discussions, and were not necessarily reflective of the Scottish Government’s powers or its intended course of action. It should also be noted that participants’ interpretations of the scenarios should not be read as authoritative statements of fact, but rather reflect how key issues were perceived and understood.
Hypothetical scenario 1: Those who earn the most pay the most
In this scenario, costs would be covered through a progressive form of “net zero” tax applied to people in Scotland earning over a certain amount (see figure 4.1).
Figure 4.1. Scenario 1: those who earn the most pay the most

What appealed?
There was broad support for the idea of providing free public transport for those on low incomes, given the strong view that this group should be protected as we transition to net zero. However one participant raised the possibility that people on low incomes might already use public transport more than other groups, so felt that incentivising public transport use among those on higher incomes might have more impact.
Providing grants for purchasing EVs was also an appealing aspect of the scenario, as it too would benefit those on lower incomes. However, it was felt that this policy could be more targeted in areas where public transport was not as available, such as rural areas.
“Why would you give a grant to someone on a low income to buy a car in Glasgow or Edinburgh? People in rural areas don’t have a choice, they have to have a car. Giving them a grant could be a really useful thing, to make sure they’re able to get about.” (Participant, workshop 5)
What were the concerns?
Participants felt that middle income earners would potentially lose out under this hypothetical scenario if they would not qualify for grants or free public transport, but would still struggle to afford an EV or to make significant changes to their home.
“It’s a bit vague, ‘low income’ versus ‘high income’. Those on a middle income fall between the cracks, and they can’t afford an electric vehicle or to make the home improvements.” (Participant, workshop 5)
This fed into broader discussions around income, and participants felt that this would not necessarily correlate to ability to pay. Some reflected on their own situations as they considered the scenario, sharing that they had wanted to improve the energy efficiency of their homes but were unable to afford the changes.
There was broad agreement that it would be unfair to fine people, especially those less well off, if they could not afford to upgrade their home. It was therefore felt that a more nuanced consideration of financial ability would need to be considered. Participants were supportive of the suggestion of a progressive “net zero tax”, using small income bands to avoid stark increases in taxation and ease the impact on households.
Participants were aware of potential unintended negative consequences of this scenario. For instance, if landlords struggled to afford the changes they might choose to sell which could impact rental supply and lead to rent increases. There was some debate around whether all landlords should be ineligible for grants, or whether there should be scope for smaller landlords (i.e. with fewer properties) to be eligible, similar to the support offered to smaller farms in this scenario. However, no firm conclusions were reached on this.
As highlighted in the transport workshop, participants remained concerned that a lack of EV charging infrastructure in rural areas would mean rural and island communities missing out.
How our fictional characters fared in scenario 1
Who benefits?
Participants felt that Maria would benefit from free public transport, while Alice could use a grant to switch her petrol car to an EV.
Who might be negatively impacted?
Lorraine was considered to be a middle income earner who could miss out on financial support. Participants felt that she would be “hammered” under this scenario, given her home has an EPC rating of D and she may not be able to afford the necessary changes to bring it up to an energy efficient rating. With the requirements to reduce emissions on her farm as well, it was felt Lorraine would be negatively impacted in several ways.
David and Sarah (owners of a rental property) were also identified as potentially being impacted through the net zero tax and requirements to change EPC ratings in rental properties, but being ineligible for grants. Although it was felt that they could and should pay a higher share based on their income, seeing the various ways in which they would be charged under this scenario, while caring for a disabled son, gave participants a more nuanced perspective which reinforced the view that income alone does not necessarily equate to affordability.
A fair distribution of costs
Participants felt the ‘Those who earn the most pay the most’ scenario could be fair in theory, but in practice would depend on how it was funded; how much time would be given to prepare for the changes; the infrastructure that would be put in place; and how “low income” would be defined. Participants reiterated the view that personal circumstances would need to be taken into account.
Participants also identified a need for awareness raising to ensure fairness in this scenario. They felt that individuals would need to be given guidance on what changes they needed to make and what support would be available for them, recognising that not everyone knows what their home’s EPC rating is.
A key caveat to the discussions was that the role of industry must also be considered alongside public behaviour change and cost-bearing. This was prompted by the risk of food prices increasing as farmers pass costs on to consumers, which would add to the financial burdens already placed on individuals.
“Things are constantly going up, then with this added cost and figuring out if you pay for costs of your home being energy efficient, it seems a difficult and expensive thing to be going through and I’m not sure how this will be managed.” (Participant, workshop 5)
Food price increases were felt to be somewhat inevitable when discussed in the land and agriculture workshop, but in the context of these scenarios were considered to be unfair, especially if big corporations were not doing their bit. It was suggested that “middle businesses” in the supply chain (such as supermarkets) could absorb more of the costs to minimise the impact on farmers or consumers.
Hypothetical scenario 2: Those who emit the most pay the most
Scenario 2 focused on a system of payment whereby those who emit the most pay the most. Costs would be covered through taxing higher emitting industries and other charges for people who contribute the most emissions (see figure 4.2).
Figure 4.2. Scenario 2: those who emit the most pay the most

What appealed?
There were fewer aspects of this scenario that appealed compared to the others. The tax on high carbon food was identified by some as an effective way to encourage people to change their eating habits. Those who were in favour felt that products like meat becoming a ‘luxury’ would make them be more frugal and cut back on certain foods.
“It might encourage me to think more carefully about what I’m buying, maybe being a bit more frugal in terms of what’s used. I see that as a good thing. I’d be quite happy with less choice in some ways because I feel we’ve got way too much choice now.” (Participant, workshop 5)
However, the high carbon food tax was also criticised for making certain food products unaffordable, which was not considered fair. For some, this was based on the view that meat and dairy products were part of a nutritional diet and should not become a luxury. For others, it was about understanding the demands on peoples’ time and ability to pay for fresh, seasonal produce.
“People don’t buy rubbish food because they love it, sometimes it’s because they don’t have the choice […] I love spending too much money in Real Foods, but not everyone has the ability to do that. It’s making sure we’re not leaving people behind. The affordable choice should be for the environment and the health of the people.” (Participant, workshop 5)
What were the concerns?
The main concern around the ‘Those who emit the most pay the most’ scenario was that some people and businesses were higher emitters due to circumstances outside their control. This echoed a strong theme, which emerged early in the dialogue, that people without low carbon alternatives available to them should not be penalised. The construction and farming industries were highlighted as examples where the costs of decarbonisation could be prohibitive and threaten livelihoods. It was also felt that costs could be passed onto consumers, meaning that it would not just be high emitters who would pay the most.
Participants also expressed concern for homeowners and questioned the cost, feasibility and fairness of requiring homeowners to bring their homes to an EPC rating of C by 2033.
“I think the timescale is an important factor here. At the moment, it’s 10 years away. By the time this is made law, it’s probably only going to be 7 years away. It’s what ability is there to do changes in the 7 years.” (Participant, workshop 5)
It was felt that EVs would not be feasible for those living in rural areas, so they would be subject to road user charging despite having no viable alternative. There was some criticism of LEZs in particular, which were seen to have been unfairly implemented in some areas.
“At Keith [in Moray] they were going to create a LEZ but anyone coming from Shetland, if they needed a car, that’d be taxed by the emissions zone [so] they don’t have a choice.” (Participant, workshop 5)
How our fictional characters fared in scenario 2
Who might be negatively impacted?
Nadeem’s livelihood as a builder was felt to be at risk given the additional costs to his business, such as road user charges (if he was not able to switch to an EV) and paying penalties (if he was not able to reduce emissions). Similarly, it was felt Lorraine’s farm would be penalised and her business would be vulnerable if she could not easily change the use of her land.
Who benefits?
Participants felt that the characters living or working in cities, including Alice, Maria and David and Sarah, would benefit from the LEZs due to cleaner air. Given Nadeem and Ajay are both vegan, it was also felt that they would not be penalised for buying high carbon produce such as meat; “lack of penalty is kind of a benefit”.
A fair distribution of costs
Participants consistently felt an emissions-based approach would be unfair:
“I think it’s penalising. There isn’t a lot of incentives there. It’s very directive, ‘You will do this or you will get fined.’ There isn’t a lot of, ‘We are supporting you’. It’s not a kind system […] It’s very harsh.” (Participant, workshop 5)
They felt this system of payment would need a nuanced approach, recognising that some people and businesses have more limited control over their emissions than others, and they would be unfairly penalised if these differences were not considered.
For the introduction of LEZs to be considered fair, improvements to the public transport infrastructure were considered to be a prerequisite.
“There needs to be reliable, good quality transport. And we should start from that. If we start with installing Low Emission Zones, before we improve public transport, it will make people very hostile towards the idea. (Participant, workshop 5)
Additionally, participants felt that there needed to be more of a balance between penalties and incentivisation to help facilitate low carbon choices. Awareness-raising, education and engagement was felt to be an important part of helping people transition, otherwise:
“You are going to disengage and alienate the population and any change becomes a bigger challenge, dramatically. This is going to affect every single part of life.” (Participant, workshop 5)
Hypothetical scenario 3: Incentives for making low carbon choices
Scenario 3 focused on a system of payment where there are incentives for making low carbon choices. Costs would be covered through general increased taxation and through profits generated from certain businesses benefitting financially from the transition (see figure 4.3).
Figure 4.3. Scenario 3: there are incentives for making low carbon choices

What appealed?
Participants were initially drawn to the supportive nature of this scenario, with its emphasis on incentivisation. The provision of subsidised public transport was widely supported.
“If you’re told you’ll get a bit of help, it’s more positive and people will more likely want to carry out and make these differences, but if they have to pay for it and take care of a family, they won’t want to do it. Incentives are always a good thing.” (Participant, workshop 5)
Prioritising high emitting homes for grants and retrofitting schemes were deemed sensible and effective ways of bringing emissions down quickly. Participants living in higher emitting homes said they would appreciate the support to make improvements. Those who rented were more sceptical about this, as they worried that rent prices would be increased by landlords to make the changes, even if they were receiving grants.
While there was a preference for incentives over penalties, there was a view that “there will always be people who can’t be bothered” to change. Participants also highlighted a risk that money could be wasted if it does not target those who need it most. For example, some questioned whether everyone should be eligible for an EV grant or only made available to those who would be unable to afford one without support.
“The bits about grants for all electric vehicles, some people will be able to afford them so they won’t need them. That money could be used for something else.” (Participant, workshop 5)
What were the concerns?
Despite initial positivity towards the ‘Incentives for making low carbon choices’ scenario, concerns grew over how the various financial supports would be paid for and how effective a system based on incentives would be for reaching net zero targets. The idea of general increased taxation was a less appealing aspect of this scenario, as it was felt that this would ultimately result in everyone paying more, and would place an unreasonable burden on people in the context of a cost of living crisis:
“I think we’ve reached a point where we’re all groaning from increase in taxation and cost of living.” (Participant, workshop 5)
Specifically, and echoing earlier findings, middle income earners were identified as a group who were more likely to bear the brunt of general taxation but not see the benefits through grants and subsidies.
“When you talk about general increases in taxation it’s always the middle income owners hardest hit. They earn more so they pay more tax, they then never get the benefits available. They may be £1 over the cut off but they are taxed higher and get no benefits.” (Participant, workshop 5)
How our characters fared in scenario 3
Who benefits?
Participants felt that David and Sarah and Lorraine would benefit as their low EPC-rated properties (David and Sarah’s rental property was D, Lorraine’s home was E) would be prioritised for retrofitting schemes and grants. Profit-sharing for reskilling initiatives were seen to be beneficial for Lorraine too, as well as for Nadeem and his employees.
A fair distribution of costs
While the use of incentives was seen as a kinder approach than penalties, it did not necessarily follow that this system of payment would be fairer. As highlighted above, participants raised concerns about a general taxation putting pressure on some groups, while open incentivisation might mean grants and subsidies were taken up by those who were better off rather than those with the greatest need. Participants therefore felt that a fair distribution of costs under this system would mean more targeted support through grants and subsidies, in combination with a general taxation. The availability of grants and subsidies would also need to be widely publicised and not administered on a first-come-first-served basis to minimise the risk of people losing out.
“Limiting the cash benefits to any group or individual is the key thing, because this is too open-ended.” (Participant, workshop 5)
As with other systems of payment, it was perceived that the current infrastructure – particularly for public transport and EV charging – was too “fragmented”. It was strongly felt that these issues would need to be addressed first, to ensure people were able to make low carbon choices.
This highlighted the importance of timing and sequencing for a just transition to net zero. The system of payment based on incentives was initially more appealing, but it was also felt that some charges might be necessary once people have had time and encouragement to make the necessary changes.
“On the road to net zero it will probably not be fair to charge based on emissions before we reach the points at which changes SHOULD have been made… Emissions charging should be the “stick” coupled with the “carrot” of a really rigorous and case specific package of support to enable homeowners to make the necessary changes.” (Participant, online community)
Summary on systems of payment
These hypothetical systems of payment highlighted the range of complexities inherent in the different approaches to distributing the costs of the transition. Participants were not asked to choose any one scenario over another, but instead discussed how each scenario might impact different groups and raised key considerations for making these approaches as fair as possible. Their key points are summarised in the following table:
Exploring policies
In phase two of the research, a new group of 20 people from across Scotland were convened to learn about and deliberate on potential policy options within two of the key sectors that were focused on in phase one; transport and the built environment. The two policy options were:
- Approaches to Road User Charging (RUC), involving a charge on car usage based either on distance driven or on a defined geographic area.
- Approaches to funding the transition of domestic properties away from gas or oil-based heating systems to clean heating systems (such as heat pumps or district heat networks).
Picking up where the first cohort left off, they considered the benefits and challenges of these policy options, before providing conclusions on how they should be implemented fairly.
Road User Charging
Views on Road User Charging are explored in more detail in the transport chapter. A summary of the key findings is presented here where participants were shown two possible options to road user charging, presented in the following table:
|
Option 1 – UK national road pricing |
Option 2 – Urban local road user charging |
|
|
Views on option 1: UK national road pricing
UK national road pricing was introduced as a possible approach to RUC that would cover all of Scotland’s roads and involve a charge on drivers based on distance driven.
A perceived general benefit of this form of RUC was that those who drove for convenience might be encouraged to choose public transport instead. In turn, the reduced traffic would improve air quality and bring health benefits. That funds raised would be invested in improvements to public transport was widely welcomed, and it was agreed that rural areas should be prioritised for funding, as public transport was considered to be less available and accessible in these areas.
“A good thing about it is that the money raised is put towards public transport. If the money is invested into rural areas, that’d be really good. That’s where the money should go because they need transport.” (Participant, phase 2, workshop 2)
The challenges participants were keen to ensure were considered and addressed included:
- Taking different circumstances into account: It was felt that some groups would be unfairly impacted as their access to alternative options would be limited (e.g. those who rely on their car because of a disability or health condition, those who have to drive long distances for work, or those who live in rural areas where public transport alternatives are not available). It was agreed that exemptions or permits would need to be in place for these groups and these should be clearly communicated:
- “It would be unfair for those that live in rural areas to pay the same when they don’t have a choice in transport.” (Participant, phase 2, workshop 2)
- Balancing incentives and disincentives: It was surprising to some that EVs were not exempt. There were mixed views on the fairness of this which hinged on the risk of discouraging people from switching to lower carbon alternatives versus the overall objective of reducing distances travelled by car. It was therefore suggested that EVs should not be charged as much as petrol/diesel cars to incentivise lower carbon choices.
- How the charge is paid: It was not considered fair to present drivers with an annual one-off charge, as this could come as a shock and be difficult to pay in one go. Instead, it was suggested that the costs should be spread out. It was also felt that consideration should be given to when the charge is applied (with a suggestion for it to be lower or lifted during the night to ensure those travelling for night shifts are not restricted).
Views on option 2: urban local road user charging
Urban local road user charging was introduced as another possible approach to RUC that would involve a charge to drive into specific parts of an urban area.
The benefits highlighted were similar to those raised in response to option 1 (cleaner air and improved public transport infrastructure). For some, this option was considered to be fairer than national road pricing because it was assumed it would be implemented in areas with readily available public transport alternatives.
“This one is targeting particular areas and not all journeys. You’re given an option to use your car or public transport to get into the city.” (Participant, phase 2, workshop 2)
There were still challenges that participants raised in relation to this approach, including:
- How those who living and working within the charging zone would be treated: It was agreed that exemptions would need to be made for such groups.
- Considering the differences between types of urban areas: Inverness, for instance, was felt to be a different type of urban area to Glasgow or Edinburgh, as it served as a connecting transport hub for those in rural areas.
- Ensuring access to alternatives: It was felt that adequate public transport infrastructure would need to be in place before RUC was introduced to an area.
Funding the heat transition in domestic properties
Views on the heat transition in domestic properties are explored in more detail in the built environment and construction sector. A summary of the key findings is presented here, where participants were shown two possible options to funding the heat transition, detailed in the following table:
|
Option 1 – widely available public funding, stricter penalties |
Option 2 – targeted public funding, softer penalties |
|
|
Views on option 1: widely available public funding
Participants considered a scenario in which Scottish Government grants and loans would be available to all households to improve energy efficiency and install a clean heating system. In this scenario, there would be penalties for non-compliance by the deadlines set out.
As well as considering the general benefits of the clean heat transition (such as the need to use less energy to warm homes, and reduced emissions), participants also felt that the combination of widely available funding and strict penalties would encourage people to make the changes. The presence of exemptions for certain groups, protections for renters, and an appeals process were all welcomed.
Participants also highlighted a number of challenges:
- The 2028 deadline for landlords making home energy improvements was felt to be too close and not enough notice. There were also concerns raised that landlords would choose to sell rather than make the required changes, which would mean fewer homes available to rent.
- Conversely, the 2045 deadline for clean heating systems to be installed was considered to be too far away and raised concerns that people would not be motivated to act quickly enough.
- The availability of funding to all households drew mixed views:
- On the one hand, it was not considered fair to fund households that could afford to pay for changes, while others unable to afford the changes may not receive enough to cover their costs:
- “If you’re really rich, you can pay for it, why should you get a grant for it?” (Participant, phase 2, workshop 2)
- On the other hand, it was considered fair that all households receive some support since the changes were being required of them:
- “I think it would be fair to give grants to all households because they’re enforcing it. If they want people to do it, they’ll need an incentive.” (Participant, phase 2, workshop 2)
In drawing conclusions, there was general agreement that while there should be support available to all households, this should vary depending on circumstances (with those on lower incomes and those with older properties being entitled to the most government funding).
- There was some discomfort around the idea of people taking out loans to cover any remaining costs, particularly for those seeking to avoid debt or already struggling with existing financial commitments.
- While welcomed, there were concerns that that an appeals process could be difficult and stressful which would be off-putting to some.
- Building trust in the efficacy of the clean heating systems was felt to be a necessary pre-requisite to people installing them in their homes, and participants expressed a desire to see evidence of this:
- “More trials, more comparisons and more information. I think if people have that then more people are going to go, ‘We see where you’re coming from, we understand and can get behind it.’” (Participant, phase 2, workshop 2)
Views on option 2: targeted public funding
Participants considered another scenario in which Scottish Government grants and loans would be available to households on lower incomes to improve energy efficiency and install a clean heating system (but not to higher income households, landlords or owners of second properties). In this scenario, there would be penalties for non-compliance on energy efficiency improvements, but penalties for not installing a clean heating system by 2045 would not be enforced straight away.
The flexibility in when and how penalties would be applied was welcomed in this scenario. While there were concerns raised initially about landlords being able to increase rent (as in option 1), it was also recognised that there could be a positive impact for tenants if the properties energy efficiency is improved, leading to better living conditions and cheaper energy bills. It was agreed that a rent cap would be important to protect tenants from sharp rent increases.
Similar challenges identified with a targeted funding approach as were raised in relation to widely available funding, which included concerns around the deadlines (2028 being too near and 2045 being too far), the push towards loans, and the need for clear and comprehensive communications to raise awareness of the changes that people would be required to make.
Other challenges identified with this approach to funding the clean heating transition included:
- A lack of clarity around the penalties, with some being enforced as soon as the deadline expires and others not being enforced right away. This was felt to be problematic and an ineffective way of encouraging people to act:
- “If you say you’ve got to do something by 2045 but there are no consequences for not doing it by 2045 [..] do they really have to do it?” (Participant, phase 2, workshop 3)
- The targeted nature of funding drew mixed views. For some it was felt to be fairer as financial support would be offered to those who need it most, while others felt that targeted funding would result in those just over the qualifying threshold being put under financial pressure. There were also concerns that targeted funding would limit the effectiveness of the policy, with those not eligible being less inclined to act.
- There was a strong view against private financing, which was underpinned by a perception that private sector organisations were motivated solely by profit. If loans were to be offered, it was felt that these should be administered by Scottish Government:
- “I don’t think private sector should offer loans in the first place. The government wants you to do this so they should offer the loan themselves or provide the grant.” (Participant, phase 2, workshop 3)
- As well as providing communications around the efficacy of clean heating systems, participants also felt there should be clear advice on the running costs after installation and reassurance that these would be long-term solutions.
Conclusions
This chapter brings together conclusions from across both phases of the research. Conclusions were reached as participants drew on what they had learned over the course of the dialogue:
In phase one, conclusions were developed iteratively by participants over the course of the dialogue, but were developed in detail in the final workshop and focused on answering the over-arching questions:
- As we transition to net zero, who should pay for the changes that will be needed?
- How do we make that system of payment fair?
- How can we make sure that everyone benefits?
In phase two, conclusions were reached at the end of each sector-focused workshop and concentrated on the fair implementation of Road User Charging, and the funding of the heat transition in domestic properties.
Conclusions have been written using the participants own words as much as possible. Where any edits to wording were made by Ipsos, this was to correct repetition or duplication, or to reorder points into a more logical flow.
As we transition to net zero, who should pay for the changes that will be needed?
The overarching message was that we all have something to contribute. Specific contributions from three broad groups were identified:
Government
The Scottish Government should fund (in an efficient and timely manner):
- Public charging infrastructure for electric vehicles.
- An integrated, accessible, and reliable public transport system.
- Grants and interest-free loans for retrofitting existing homes (available to homeowners and long-term tenants) and purchasing electric vehicles.
- Subsidies and research grants for farmers and other small businesses. This should include support towards the cost of changing land use, encouraging development of lower carbon materials or produce, and reskilling and training initiatives.
- Education and awareness raising programmes.
- Research into low-carbon technologies (e.g. wave power).
- An apolitical body to provide the lead in scientific and evidence-based practice.
- As well as the Scottish Government, local authorities and other public sector bodies also have a big part to play and should cover some of the costs.
Business
Businesses (including landowners and private landlords) should pay for the changes they need to make. This should be through taxes and other means, and with some support from the Scottish Government.
Businesses are especially responsible for costs where:
- There is an opportunity for them to profit from the changes.
- They contribute higher emissions where lower carbon alternatives (e.g. alternative land uses, lower carbon transport options or building materials) are possible.
- They are landlords with a certain number of properties / making a certain amount of money (to be defined).
- They can take on apprentices / reskill people.
- They have a responsibility (e.g. private landlords would be responsible for insulating homes and improving energy efficiency; construction businesses would be responsible for switching to low-carbon materials and technologies; landowners would be responsible and accountable for making changes to the land use).
There should be differentiation between small and large businesses, with support available towards the cost for smaller businesses.
Citizens
All citizens should contribute in some way, whether that’s:
-
- Paying tax fairly.[10]
- Changing how we get around (switching to electric vehicles, using public transport and more active travel) or paying charges for continuing to use high-carbon forms of transport when good low-carbon alternatives are readily available, feasible and appropriate to use.
- Making changes to our homes where applicable (acknowledging that some changes may not be appropriate for older homes), with advice and support available.
How do we make that system of payment fair?
While participants did not settle on one specific system of payment, they did highlight some key aspects of what a fair system would like look. These fall broadly under six themes, as outlined below:
EQUITY
- Make the system equitable, meaning that everyone contributes but not all in the same way or by the same amount.[11]
- Decide what an individual contributes based on their ability to pay (through a means-tested approach) or their ability to act. An independent body should decide on this system of payment (see leadership and accountability section).
- Recognise the range of potential impacts on individuals and communities, and reflect individual circumstances when deciding how much different groups should pay. This should take into account location (differences by urban and rural areas), income and the needs of those with disabilities or long-term health conditions.
- Support those on low incomes, so that they are not disadvantaged by the changes and to avoid people being left with no help.[12] “Low incomes” should be clearly defined and consider overall financial position, including assets and savings. Support could include discounts on travel depending on circumstances.
- Public engagement
- Regularly consult and engage with the public on these difficult decisions.
- Consultation and engagement should be accessible and include a diverse range of groups. These engagements should be representative but small in scale and with a clear timeframe in mind.
- Findings from these consultations should be reported on.
- They should be a joint effort between the Scottish Government and local authorities, allowing for locally-focussed consultation (as national campaigns can miss parts of Scotland and might not reach everyone).
Transparency
- Provide education and information about why we need to make changes to reach net zero and what the impacts will be.[13]
- Be transparent about how taxes, charges, grants and loans related to net zero are decided upon, and about how the Scottish Government is contributing to costs. Make this available to the public in a clear and accessible way.
Infrastructure
- Improve infrastructure across Scotland so that it is easier for people to make low-carbon choices. This should include more access to integrated public transport including in rural areas, affordable or free electric vehicle charging points, measures to make homes more energy efficient and more availability of low-carbon food.
Regulation
- Introduce regulation to control how much businesses (e.g. landlords, supermarkets, energy companies) can pass costs on to consumers. Businesses that don’t comply should be fined.
- Prevent people and businesses from gaming the system or exploiting loopholes (e.g. higher earners, multinationals or landowners receiving more financial support than needed, or paying the charges to avoid making changes that others have to make).
Leadership & accountability
- Have clear leadership and accountability from the Scottish Government, following science and evidence (not politics).[14]
- The Scottish Government should be responsible for setting up a non-political body, overseeing discussions between all the interested parties to take the lead on the just transition (including specialists in all relevant areas). They could take the lead on deciding who pays and ensure it is fair.[15]
- Government-tendered contracts should have a large net zero element and not just who is going to do it cheapest. The independent governing body should review these decisions.
How can we make sure that everyone benefits?
Participants conclusions related to benefits showed similar themes to those relating to systems of payment. Key themes, once again, were of addressing inequality, education, supporting people to make changes and leadership from the Scottish Government.
Reducing inequality
- Use the transition to net zero as an opportunity to reduce other inequalities and make Scotland a fairer society. This could be done by, for example, closing the urban/rural divide, reducing health inequalities, reducing reliance on oil and gas and combatting extreme poverty.
Education and support
- Help all people (adults and children) to understand what outcomes they are contributing to and why it makes a difference.
- Communicate changes in a positive and honest way, emphasising the benefits of net zero for future generations, while acknowledging that changes are unavoidable and will mean sacrifices.
- Proactively tell people what costs and other changes are coming, what support is available to them and what will happen if we don’t make those changes. Proactively combat misinformation. This can be through multiple channels, including TV campaigns and population wide texts.
- Provide easily accessible and accurate information from credible sources.[16] This should include individual calculators/tools to help people determine the impact of their own choices and the support available to them.
- Give people time and support to make these changes (they won’t happen overnight).
Encouraging behaviour change
- Empower[17] individuals and businesses to make low-carbon decisions (where changes are viable) through a mix of “carrot” and “stick” initiatives.[18]
- “Carrots” would be incentives to make low-carbon choices (e.g. tax breaks, grants, subsidies). These should come first and be widely publicised including the consequences of not taking them up (i.e. subsequent “sticks”).
- “Sticks” would be restrictions or charges for making high-carbon choices once low-carbon choices are readily available. These should come after “carrots” and only if there are reasonable, economically viable alternatives already in place.
Business & skills
- Encourage and incentivise key industries to reduce emissions and support small businesses to innovate and come up with solutions.
- Ensure there is an equitable distribution of Scottish Government support across different sectors.
- Ensure that new jobs become available as old jobs become obsolete and that upskilling keeps pace with that.
Planning
- Set milestones so that changes are introduced in a gradual and ordered way, rather than in a late rush nearer to 2045. As part of this:
- Ensure changes are thoroughly planned for first.
- Prioritise changes, so it is clear to people what needs to happen when.
- Continually review progress and adapt plans as needed.
- Be prepared to adapt milestones and follow the science if things change.
Leadership
- Make sure the Scottish Government are leading from the front and setting an example.
What needs to be in place to make Road User Charging fair?
If RUC was to be introduced to reduce emissions within the Scottish transport sector, and to ensure it was implemented fairly, participants concluded that:
It should be implemented with different circumstances and needs to be taken into consideration.
There should be exemptions or concessions for some groups (e.g. people with disabilities, those who live or work in areas where RUC has been introduced, those living in rural areas and those on lower incomes).
Ensure there is reliable, frequent and more integrated public transport infrastructure before RUC is introduced.
Those were the conclusions that participants most strongly agreed upon. But other conclusions reached included that:
- There should be more incentives as well as disincentives (e.g. not charging EV drivers the same as petrol/diesel drivers, and rewarding those who take fewest journeys).
- Changes should be introduced carefully, gradually and the public should be clearly informed about them.
- The changes should be considered in a holistic way, with consideration given to things like the affordability of housing (affecting where people can live and what options they have for getting to work), and the possible impact on tourism in areas where RUC is introduced.
It should be noted that there were mixed views on the principle of RUC, whichever way it is implemented. While it was generally considered to be acceptable if the above conditions were met, there was also a strong and persistent (albeit more exceptional) view that RUC would be intrinsically unfair as it would limit the choices of those less able to afford the charges.
What needs to be in place to ensure funding for the heat transition is fair?
To ensure the costs of the heat transition are distributed fairly, participants concluded that:
There should be support for all, but the share of funding should vary depending on circumstances, such as income and age of property.
Exemptions from penalties should be in place, with a fair appeals process.
Those were the conclusions that participants most strongly agreed upon. But other conclusions reached, which for some were fundamental to any clean heat transition being implemented fairly, included that:
- There should be a proportionate approach that incentivises and supports people to make changes, and allows sufficient time for changes to be made before penalties are imposed.
- The use of loans should be considered carefully, with long and flexible repayment plans that are sensitive to peoples’ circumstances. Ultimately, it was agreed that nobody should be forced to take out a loan.
- There should be reassurances around the efficacy of clean heating systems, grounded in evidence that is clearly communicated with the public. This should be supported by regulation of new technologies being installed.
- There should be a wide-reaching and transparent communications campaign to ensure people understand what’s needed, why it’s needed and what support is available.
Participants’ learning journey
An objective of phase one of the research was to gather learning into the factors influencing any changes in participants’ attitudes, beliefs or values as a result of engaging in this deliberative process. This chapter summarises findings in relation to this objective and draws only on findings from the cohort taking part in phase one.
Extent to which views changed
Early views
As outlined at the start of this report, participants began the process with a fairly good grasp of the term net zero, but less so with the concept of a just transition. Though they had some ideas of the types of change that might be required to reach net zero (such as less reliance on cars, changes to our diet, and different ways of using energy in our homes) they were unsure of the detail about what a just transition to net zero might involve.
Participants started the process slightly daunted by the challenge ahead, but nonetheless open-minded and keen to learn more from experts and from each other. They shared a sense of hope that this deliberative process might lead to some positive action. They also conveyed a sense of the responsibility in their own role in the process, and were keen to make a valuable contribution to the dialogue. However, there was also a note of scepticism about how much impact the process could have, and some questioned whether any action would be taken by the Scottish Government as a result.
Participants’ gradual learning process
As they moved through the process, it was clear that participants were gradually learning new information. During the sector-focussed workshops (workshops two, three and four), participants expressed notes of surprise at some of the information in the expert presentations, which had raised new issues for them or new ways of looking at things. For example, there was surprise at the scale of reduction in car use needed, at the costs of installing heat pumps in homes, and at the level of financial subsidies received by farms.
Learning about the types of changes required to reach net zero also caused some concern among participants, as they appreciated the scale of the challenge ahead and the potential financial implications of those changes. This caused some participants to push back stressing that some changes would be too difficult to implement in certain parts of the country, particularly rural communities, or too costly for certain people.
“It’s hard to imagine me being able to take on any more costs, as someone in fuel poverty. I can’t afford to replace the boiler if it breaks. It seems a bit ambitious, scary. Especially where I live, I am not the worst off, but I struggle to heat the home and then adapt to new technologies.” (Participant, phase 1, workshop 3)
As they discussed the issues further in the sector-focussed workshops, participants said that they had developed a greater appreciation of the need for collective action to reach net zero and for costs to be distributed. Some said they had moved away from a feeling that responsibility lay mostly with the Scottish Government, local authorities or businesses, to feeling that societal-level change was required. However, they acknowledged that sharing of responsibility, and distribution of costs, would be complicated and would require thoughtful decision-making supported by education and awareness raising.
“One of the things that struck me, the just transition will have to be government but also society in general. Society itself has to be a driver. The education value and sharing why this is important will make all the difference.” (Participant, phase 1, workshop 2)
This sense of collective responsibility was a position that they brought into the final workshops, as they started their detailed deliberations and conclusion-forming.
Views at the end of the process
In the final session, participants reflected on whether their views had changed over the course of the process. The overall message was that they had developed and deepened their understanding of the issues, more so than having changed their opinion or position.
Participants noted that, as a result of taking part in the dialogue, they had developed more understanding of the scale and complexity of the challenge of a just transition to net zero. Participants started the process appreciating the importance of reaching our net zero targets, but by the end they had more of an appreciation of how important, but also how difficult, it will be to ensure a just transition.
“I haven’t necessarily changed my views on anything, but it’s forced me to think about this intensely and it’s driven home how important this is.” (Participant, phase 1, workshop 6)
As noted above, there was a greater sense of shared responsibility, and need for collective action to achieve a just transition. At the same time, participants said they had more appreciation of the impacts of the transition on different groups, and for individual circumstances to be born in mind in deciding how costs should be distributed. Indeed, this was one of the strongest messages that participants shared towards the end of the process, and which was reflected in their conclusions. Linked to this, the need to protect the most vulnerable in society was a key theme throughout the process.
“At the start I’d quite naively said the Scottish Government (should be responsible) but I’ve learned a lot and changed my mind…from hearing from the professionals and talking to people in the groups.” (Participant, phase 1, workshop 6)
In addition to the deepening of understanding, one area where views did change somewhat was in relation to systems of payment. In the early stages of the process, some participants felt that responsibility for costs should lie with those who contribute the most carbon emissions. This, they felt, was the fairest way of allocating responsibility for costs. However, as noted in chapter 4, when discussing the scenario of “those who emit the most pay the most”, participants strongly felt that this would not be fair. Having deliberated and considered the impacts of different groups, they felt that some people and businesses have more limited control over their emissions than others. They therefore felt that a more nuanced approach would be required, and that some people and businesses would be unfairly penalised if these differences were not considered.
“I felt it was more apt for the people that produce the most carbon to take the lead…but hearing about farmers and how they don’t really earn money, that really took me aback.” (Participant, phase 1, workshop 6)
Views on who should take the lead
In the first workshop, participants were asked a live-polling question “who should take the lead in tackling climate change in Scotland?” At that stage, around two thirds said it should be everyone (individuals, businesses and the Scottish Government) while two-in-five said the Scottish Government and one-in-five said all individuals in Scotland.
Participants were asked the same question in the final session. As shown in figure 7.1, views did not change to a great extent. The most common answer once again was for everyone to take the lead. However, there was more emphasis placed “certain groups of people” and slightly more on the Scottish Government.
Figure 7.1: Findings from “live polling” question asked in workshops 1 and 6

Participants felt the relative emphasis on the Scottish Government highlighted a need for “leadership from the front”, a point that was highlighted in participants’ conclusions. They also noted that the slight change in the findings between sessions reflected the difficulty of placing responsibility on any one group.
“We all have a part to play but taking a lead, someone has to be in the front. The fact that more people were choosing the Scottish Government and certain businesses and actors, it possibly reflects the complexities of the situation.” (Participant, phase 1, session 6).
In discussing the results of the poll, participants emphasised the distinction between taking action to tackle climate change and taking the lead. It was highlighted that while we all bear responsibility for making changes, there was an expectation that leadership should come from the Scottish Government.
What contributed to views changing
Participants identified a range of factors that had contributed to their learning journey and to their views either deepening or changing. In summary, these were:
- Hearing from each other. Participants felt that having the chance to discuss issues as a group helped them to appreciate different perspectives on the issues and different circumstances. The experiences of rural participants were highlighted as being particularly valuable:
- “I had only thought about my own situation but have learned from people in completely different areas of Scotland and stages of life.” (Participant, phase 1, workshop 6).
- Expert speakers, through their presentations at the workshop and their responses to participants’ questions.
- Characters and scenarios had helped participants to consider the various aspects involved in the transition to net zero and to appreciate how different impacts might be felt by different people.
- Being asked to articulate their views in the sessions helped to clarify and strengthen their own positions:
- “Being asked to speak out, it makes your position clearer. It makes you put it into words, so you’re more aware of your opinion.” (Participant, phase 1, workshop 3).
- Time to think and reflect about the issues, both between the sessions and over the course of the whole dialogue.
Implications from the research
The key outcome of this process was a set of conclusions (shown above) which provide clear suggestions for the Scottish Government to consider as it develops Just Transition Plans. This includes conclusions around specific policy options that were tested in relation to the transport, and built environment and construction sectors. The research also has a number of broader implications for future policy in this area, which are set out below.
- A fair system of payment must consider different circumstances.
When considering three hypothetical payment systems (based on ability to pay, level of emissions, or incentivisation), there were elements of each that were appealing and problematic. While it was recognised that placing responsibility on those who contribute most emissions was fair in principle, there were also concerns that this could be unfair if applied to those without the ability to choose lower carbon alternatives. Meanwhile, a system that considers ability to pay was seen to be more aligned with their overall principles of fairness but would require careful implementation to avoid negative impacts on some groups. Research has shown that there is a disparity between the carbon footprints of high-income and low-income households,[19] which suggests that higher emitters would also be those more able to pay. Ultimately though, participants’ views aligned with the existing National Just Transition Outcome,[20] of a fair distribution of costs and benefits that consider different circumstances.
- There was support for a progressive form of taxation, with higher income individuals and businesses paying more.
It was acknowledged that Scottish Government grants, financial incentives, and wider investment in infrastructure would require additional funding. It was therefore seen as somewhat inevitable that new or different forms of taxation would apply. However, there was resistance to the idea of a general taxation on the basis that this may create financial hardship for those unable to pay more. Instead, participants supported a form of progressive taxation, reflecting the principle of ability to pay noted above. Though not discussed in as much detail, there were also suggestions of taxing larger high-emitting businesses, energy companies, landowners, and a tax on high-carbon products.
- Protecting the most vulnerable in society was seen as a fundamental requirement for any future systems of payment.
Whether discussing broad principles of fairness, or how specific systems of payment or policies should be implemented, participants strongly felt that protections or exemptions should be in place for those least able to afford the payment. Participants also stressed the importance of supporting those with other needs or challenges related to health, disability and life stage.
- A balance between incentives and disincentives may have the greatest appeal and impact.
The use of incentives (such as grants for EVs and clean heating systems, funded retrofitting schemes, tax breaks for businesses that meet emission targets) was considered a more supportive and kinder approach to encouraging behaviour change than using penalties or charges. But they were not universally supported, and some felt they did not go far enough towards encouraging the level of changes required to reach net zero. Disincentives (such as Road User Charging) were broadly accepted on the basis that they would help to discourage car use. However, for both incentives and disincentives to be considered fair, it was felt that they needed to reflect individual circumstances and (as outlined above) ability to pay.
- The timing of any new taxes, charges or penalties will be important.
Introduced too soon, and these pose the risk of placing individuals in financial difficulty and may be met with resistance. Introduced too late and they may not be enough of an incentive to encourage, and instil a sense of urgency in, behaviour change. This was clear when participants discussed the heat transition; they felt that a target of 2028 or 2033 for homeowners to make energy efficiency improvements was too soon, but a target of 2045 for installing clean heating systems was too far away. The most appropriate timing will therefore require a balance between motivating people to change while not unfairly penalising them. A phased, staggered approach was seen as one way of achieving this balance.
- It will be important that the public feel part of the decisions that affect them.
The Just Transition Commission highlighted that “the time for difficult conversions is now”[21] and emphasised the importance of communication and engagement. Participants echoed this sentiment, emphasising the importance of clear and transparent communication about the need for changes in each of the sectors, and the need for ongoing public engagement.
This will be particularly important when it comes to communicating changes such as those outlined in the Heat in Buildings bill. As highlighted in Appendix 2, participants perceived that heat pumps might not be suitable for all environments and there was an appetite for evidence to show their efficacy. A recent study from Energy Systems Catapult found that heat pumps were widely suitable across a broad spectrum of housing types, and that most heat pumps were installed without requiring other energy efficiency upgrades.[22] Communicating such evidence clearly and accessibly will therefore be vital to encouraging uptake.
Learnings from this deliberative process for future public engagement
Reflecting on their involvement in this deliberative research, participants raised a number of considerations to ensure meaningful public engagement on this topic in future. As highlighted in the previous chapter, engaging over a longer period of time enabled participants to consider complex issues more fully than would have been possible with other form of public engagement.
Breakout groups changed between sessions and participants really valued the opportunity this gave them to discuss the issues with different people and to hear a wider range of perspectives. With a relatively small group of people coming together to discuss issues affecting Scotland as a whole, one participant raised a concern that some groups (e.g. those with disabilities) might have been missing from the discussions. Although those with disabilities were represented in the dialogue, this comment underscores the importance of ensuring that participants in public engagement understand why they have been invited to take part, how the group has been recruited, and where their involvement sits in relation to the wider landscape of public engagement on Scotland’s just transition.
Some practical reflections on the process also highlighted the importance of designing an accessible process. As this project sought involvement from people living across Scotland, an online approach was felt to be appropriate and in particular enabled those living in rural areas, those with disabilities, and those with caring responsibilities to take part. Ensuring the information was presented clearly by experts and facilitators was also important, as it enabled participants to engage on the topic and able to express their views in a safe and non-judgemental space. Valuing participants’ time was another factor that ensured an accessible process; as one participant pointed out, they had been set a big task and being paid made them feel that they could dedicate their time and engage meaningfully.
Participants also highlighted the importance (and challenge) of translating the work of the group into effective awareness-raising and engagement with the wider general public.
- “We have now spent almost 15 hours listening to experts and discussing this and we have grown, some have changed [views], some are simply [more aware]. To [share] that kind of information across a population of 5 and a half million…there is quite a gap, with a lot of [work needed] to go forward. Because it’s so complex.” (Participant, phase 1, session 5)
Appendix 1. Transport sector detailed findings
This chapter outlines participants’ views on a just transition in the transport sector. It provides detailed findings from both phases of research:
- Phase one, where a group of 30 people living across Scotland met over six online workshops and an online community to consider what a fair distribution of costs and benefits would look like. It focussed on three sectors, one of which was transport.
- Phase two, where a group of 20 people living across Scotland met over three online workshops to explore specific policy options. One of those workshops focussed specifically on transport, including the potential use of Road User Charging.
Summary of findings related to transport
- The vision for a decarbonised transport system in 2040 was considered difficult to achieve without significant investment in transport infrastructure across Scotland.
- Participants felt that the costs for the transition should be shared between:
- The Scottish Government in providing support and infrastructure.
- Businesses in the transport industry (with support for smaller businesses).
- Citizens, but based on use, access to and choice over lower carbon alternatives, and ability to pay.
- To ensure a fair transition, in which everyone benefits, participants felt that individuals’ circumstances needed to be considered and steps taken to address any barriers they might face. Groups identified as requiring additional support included:
- Those on low incomes.
- People with health conditions or disabilities.
- Elderly people.
- Those living in rural communities.
- Participants highlighted the importance of allowing sufficient time for people to prepare for any changes.
- Improvements to the current public transport infrastructure was seen as a prerequisite for a just transition.
- To ensure any form of Road User Charging is implemented fairly, participants concluded that:
- Different circumstances and needs should be taken into account, rather than taking a blanket approach.
- There should be concessions or exemptions for some groups, including those listed above and those who rely on their car for work.
- Charges should only apply where people have easy access to public transport.
- Road User Charging applied to a defined urban area was considered fairer than an approach based on distances travelled.
What changes were expected?
Early in each phase participants discussed the changes to transport that they thought would need to happen for Scotland to reach net zero. These included:
- A shift towards lower-emitting forms of transport, including more electric vehicles (EVs), car-sharing schemes, and public transport.
- Restrictions on car use in city centres, such as Low Emissions Zones (LEZs) which had already been observed in cities like Aberdeen and Glasgow.
- Electrification of rail and bus networks, with more frequent and efficient trains and ferries.
- Improving cycling infrastructure, including more cycling lanes and incentives for active travel.
- A reduction in the availability of domestic flights in favour of public transport alternatives.
It was felt these changes would be expensive, as the infrastructure in Scotland (for both public transport and EV charging) was perceived to be lacking currently. Participants agreed that the transport network would need to become more integrated for people to be less reliant on cars.
“When I try to travel down south by train, I have to drive to the railway station. That is defeating the object.” (Participant, phase 1, workshop 2)
A distinction was drawn early in the discussions between cities and rural areas which prevailed throughout both phases of the dialogue. Among those living in urban areas, the need to reduce car use and encourage use of public transport was considered a positive, if inconvenient, change. Among those living in rural areas, there was a strong view that insufficient public transport had rendered cars “an essential not a luxury”. Participants expressed concern that public transport would not be improved sufficiently and that rural communities would be forgotten about.
“I worry about rural areas as we have zero public transport. I walk to loads of places but can’t walk 45 miles to the nearest supermarket or 100 miles to the nearest hospital. I feel there’s no voice for rural areas, there’s dreadful infrastructure and I really worry.” (Participant, phase 1, workshop 2)
Overall, it was therefore considered unfair to ask people to rely less on their cars without providing improved public transport. It was felt that this would be particularly unfair on certain groups, such as those living in rural areas, young families, those with disabilities, and elderly people. Improvements that participants wanted to see in transport infrastructure included more frequent, reliable, direct, cost-effective and accessible services.
“Even if the buses were reliable, for what it would cost for a return ticket, you might as well put in the fuel and it works out cheaper.” (Participant, phase 2, workshop 2)
Reactions to initial presentations in phase one
Phase one participants heard introductory presentations providing an overview of the types of changes that would be needed to move to a decarbonised transport system. Following this, the scale of the challenge became more apparent and daunting to some.
“I just think there are some serious decisions to be made – in how we live our lives, do our work, what we feel is essential in our lives – to enable that to happen.” (Participant, phase 1, workshop 2)
As well as sparking further discussion about the potential costs (explored in detail below), the presentations also prompted participants to reiterate concerns about existing infrastructure (such as EV charging), which they felt would need to be significantly improved for this vision to be realised. Participants raised several questions about those infrastructure challenges.
After hearing the presentation about inequalities in the transport sector, participants identified several groups that they felt could be at risk of being left behind in the transition:
- Rural communities, particularly those living on islands, based on the points noted above about the current state of public transport in parts of Scotland.
- Women, noting a point made in the presentation that women were less likely to have access to a car and were more reliant on public transport.
- People on lower incomes, who participants felt may be trapped if they were charged more for using their car but could not afford to replace it with an EV.
- People with disabilities or additional needs, who it was recognised may not find public transport accessible.
- Small businesses, with concerns over potential job losses in the motor industry if EVs required less maintenance and for businesses struggling to absorb the costs of reskilling employees.
Overall, there was a sense that the changes represented an imbalance towards removing transport options without providing alternatives. One participant illustrated this with an example, describing an experience of their partner who sold their car because they could not afford to drive in a LEZ and could not get to work on time using public transport.
“I thought it was quite unfair. She wasn’t able to afford to buy a car she could have driven in the [LEZ] area […] and is now having to use mine […] She was really negative impacted. If she lived on her own she probably would not have been able to keep her job.” (Participant, phase 1, workshop 2)
Vision for the transport sector discussed in phase one
Phase one participants were presented with a vision for public transport in 2040 based on the Scottish Government’s discussion paper (see fig. 9.1) and explored this in the context of different fictional characters and how they might be impacted (see fig. 9.2). The vision was a high level scenario intended to encourage discussion and invite participants to consider its implications, based on the characters and their own lived experiences, before discussing what a fair distribution of costs and benefits would be.
Figure 9.1: Vision for transport

The role of transport for our characters
Alice has a small, petrol car. There is a bus route that can take Alice from the hospital to her flat. But because of her working patterns, Alice prefers to drive to work. Even though this is more expensive, she does not feel safe travelling by bus late at night.
David and Sarah have two cars: a diesel SUV and a mid-sized petrol car. David travels by car most days. Sarah mostly works from home. Either David or Sarah use one of their cars to drop-off and collect their children from school. Noah has a disability and uses a wheelchair.
Lorraine sells produce at a small shop on the farm and supplies local businesses, but most of it is sold to suppliers across Scotland and the rest of the UK. There is no public transport in the area, so Lorraine and her family rely on their cars and vans.
For weekly food shopping and other needs, Maria uses the local shops and services in Moffat. For anything further away, such as medical appointments for herself or for her daughter Ella, she takes a taxi. Those longer journeys would usually require two buses, which are not accessible for Maria.
Nadeem uses a diesel van that he drives most days for work. Ajay drives a small hybrid car, which he uses every day to get to work in Stornoway. He has a bicycle but rarely uses it as he does not feel safe cycling on the road. There is limited public transport where Nadeem and Ajay live.
Who could benefit?
Under this vision, there was a view that anyone in transport poverty[23] would benefit from having access to public transport for their everyday needs. However, there were questions around the extent to which public transport could replace all types of journeys in all places.
Participants felt that these changes might not feel beneficial to everyone immediately, as it would involve more effort and time to get around. Nevertheless, there was an acceptance that this would be a reasonable trade-off for a fairer, healthier society. A broader sense of duty was also felt, with participants recognising that they might not benefit directly from the changes themselves but future generations would.
Who benefits?
As they lived in urban areas and used public transport, participants identified Alice and Maria as two characters who would benefit under the vision, given the improvements to public transport. It was felt that Maria would be able to make more journeys using public transport and would be less reliant on taxis, saving her money. Alice could also use public transport to go to work rather than rely on her car. However, it was pointed out that more regular buses would not necessarily make her feel any safer travelling to work at certain times and that there would be other factors influencing this (such as the bus routes, behaviour of other passengers, and confidence in the driver to manage any issues).
Who might be negatively impacted?
The groups identified as potentially being negatively impacted under this vision were:
- Individuals and businesses in rural communities, if more accessible public transport systems did not reach all parts of Scotland (which some participants felt would be the case), but initiatives like road user charges did.
- Businesses in the tourism or hospitality sector, if road user charging put tourists off travelling to parts of Scotland.
- Families with children, who could find public transport difficult to use.
- People who drive for a living, if they were not exempt from road user charges.
- People with limited mobility, if they were not able to use public transport and were not exempt from road user charges.
Participants also commented on the intersectionality of these groups, and highlighted the need for different circumstances to be taken into account.
Who could be negatively impacted?
Although David and Sarah would have to adapt their lifestyle (e.g. use of two cars), it was felt they would be able to adapt and absorb the costs with their income, so they would not be at risk of losing out. However, it was recognised that there would need to be some flexibility or exemptions given for their use of the car when travelling with their disabled son.
Lorraine was identified as at risk given the impact of the changes on her farm and limited low carbon alternatives for agricultural vehicles and personal car use (based on the view that the sort of rural area where she lives is unlikely to have the level of integrated transport needed).
It was felt that Nadeem would also be negatively impacted because of his reliance on a van for his work and the fact that he lives and works on an island. Based on the assumption that public transport would not be a viable alternative, it was considered unfair that his earnings would be affected by road charges.
While it was recognised that society as a whole would benefit if this vision was achieved – due to reduced air pollution and increased social interconnectedness – doubts remained over whether it could happen, and whether it could be implemented in a way that everyone benefits from.
Phase one conclusions on a fair distribution of costs and benefits
As we transition to net zero in the transport sector, who should pay for the changes that will be needed?
There was a broad sense that the costs of transitioning to net zero in the transport sector should be shared and that no single organisation or group should bear sole responsibility. However, participants identified particular groups as being in a position to take more responsibility for these costs.
A common view was that the Scottish Government should pay a substantial share to help people make the transition to a decarbonised transport system and to encourage behaviour change in how people travel, through incentivisation such as grants for the purchase of EVs and private charging infrastructure, and free public transport.
“If the government wants everyone to change the way that we live, then they need to put more back in than us ourselves. If they want us to do so much more, they need to help out more than us personally.” (Participant, phase 1, workshop 2)
However it was also acknowledged that any costs paid for by the Scottish Government could end up being borne by the individual anyway through taxation. Participants’ discussions therefore focused on ways to make this fair (see fair payment systems).
It was also felt that the transport industry should take on some of the costs, especially where there was scope for businesses to profit (for instance due to increased demand and/or where they contribute higher emissions. Delivery companies had been mentioned in the presentation and it was felt that such businesses could bear the costs of decarbonising their fleets. However, it was also recognised that smaller businesses – such as local mechanics – would need financial support from the Scottish Government to make the initial changes required and to retrain the workforce in new green skills.
Participants recognised that all citizens would ultimately have to pay something to help reach net zero in Scotland’s transport sector, but identified certain groups that they felt should bear more of the costs. It was generally expected that service users – i.e. people already using public transport – would continue to pay for that, and those benefitting from specific aspects of the transport system (e.g. EV infrastructure) should contribute in some way. It was suggested that those contributions could be scaled according to ability to pay and based on some wider investment in infrastructure.
It was suggested that those who can avail of alternative forms of transport (but choose not to) should pay more for making choices that result in higher emissions, for example:
“If someone makes a choice to have two cars in 2040 where we have great transport links, they need to justify it or pay up.” (Participant, phase 1, workshop 2)
It was also suggested that tourists could pay a share of the costs through a tourism tax aimed at supporting changes in certain areas. However, as highlighted above, there were also concerns that such charges could reduce the number of visitors and negatively impact businesses that are reliant on tourism.
There were some references to high carbon emitters and suggestions that they might be expected to pay more e.g. businesses that have high emissions, or individuals that continue to drive petrol or diesel vehicles. It was pointed out that those on higher incomes would be more likely to be able to pay the charges and continue high emitting behaviours, or be more likely to afford the low carbon alternatives.
“The wealthy will always be able to do whatever they want to do. They will do however miles they want because they will pay the charges. The poor will be disadvantaged because they can’t pay.” (Participant, phase 1, workshop 2)
However, this point was qualified by a view that some high emitters may not have a viable alternative, either because of where they live (i.e. those in rural areas may have no alternative to cars) or because of income (i.e. some would not be able to afford the switch to EVs). Affordability, therefore, was seen an important consideration, even in the case of those contributing the highest emissions:
“Those with older vehicles, and so higher emissions, will be penalised but it might be unfair if those people cannot afford new, cleaner vehicles. This will disadvantage those who cannot use public transport as an alternative for whatever reason. People on lower incomes are always left behind.” (Participant, phase 1, online community)
A view shared by some participants was that there will be parts of Scotland that will lose out once the changes are implemented. This view was particularly held by those living in rural areas who did not feel that the vision for transport in 2040 was realistic for rural communities, and considered it unfair to expect those communities to cover the costs of changes that (some felt) ‘will make their situation worse’.
“It will not cover everyone’s needs here, the system and infrastructure is so dreadful they would need to start major roadworks now. I don’t see any of this helping rural areas at all.” (Participant, phase 1, workshop 2)
How can we make sure that system of payment is fair?
Thinking about individuals and groups in society who could pay for the changes needed to reach net zero, participants were supportive of a system of payment based on:
- Use, with those benefitting from a particular mode of transport, or from a part of the transport infrastructure, or using these more paying a higher share. It was also felt that those using forms of transport that carry higher emissions (e.g. petrol/diesel cars) should pay a higher share for that, but only if they can afford to do so and if other choices are available (as outlined in the next two points).
- Ease, availability and choice, with those who have services available to them paying, and correspondingly those who do not have services available or who are not able to use the services not paying. Choice was a particularly important factor in who should pay. Taking road charges as an example, participants felt it was not just important to think about proximity to public transport, but circumstances:
“I live in a rural area where the closest bus is a mile away and the closest train station is nearly 2 miles away. This means I’d have difficulty reaching either of those services, [and] when I am able to get there I’ve either had to walk or drive making it in my eyes a waste of time.” (Participant, phase 1, online community)
- Ability to pay. In defining what ability to pay means, views were mixed. Some suggested this should be linked to benefits (none specified), while others felt this would be unfair to those not on benefits but with low incomes. A more exceptional view was that there should be a flat fee applied to everyone. There was broad agreement, however, that those on lower incomes should pay a smaller share than those on higher incomes:
“It’s got to be based on what people can afford. In principle, it needs to be progressive, otherwise you will end up with poor people paying too much, and richer elements of society paying too little.” (Participant, phase 1, workshop 2)
Participants felt that a fair payment system would require individual circumstances to be taken into consideration, in particular the needs of those in rural communities. For example, it was felt that car users in rural communities should not pay for road user charging if lower carbon alternatives (i.e. public transport or EV infrastructure) were not available to them and they were still reliant on petrol or diesel cars.
“[For] people in rural communities who may struggle to transition to electric cars in particular (short range, financial challenge, no viable public transport alternative), will rural communities be given concessions, assistance?” (Participant, phase 1, online community)
A range of ideas were suggested for taking different circumstances into account. These included a points-based system with an annual self-declaration (considering a range of criteria such as location, mobility, age, and financial circumstances) or a carbon token allowance system for individuals and companies.
When considering the role of business in sharing the costs, participants worried that these could be passed onto the consumer (e.g. consumers paying more for items being delivered to their home or EV charging prices being increased while companies make large profits). It was therefore felt that there should be “checks and balances” in place to prevent this from happening. But there was also concern for smaller businesses being unable to adapt, so it was considered fair that they would be supported by government.
“The government, which has the power to force change must be aware of the negative effects of forcing costly change on businesses that may not be able to afford it. Appropriate support should be in place, this may be financial, educational or of other modes such as time limited exemptions”. (Participant, phase 1, online community)
In terms of the Scottish Government’s role in sharing the costs, it was recognised that some of the funding would inevitably be raised through taxation. A progressive tax was supported, based on both ability to pay and ability to choose.
“Everyone has to contribute, but what you contribute depends on what choices you are able to make. If you make personal choices that will have more of an impact, you should pay more for it. In many places, you don’t have the choice. You have to factor all that in.” (Participant, phase 1, workshop 2)
Overall, it was felt that any fair system of payment would need to give people time to make the changes required. In practice, this would mean giving plenty notice of the introduction of new regulations, taxes, charges, or incentives. Related to this, one suggestion was to introduce a sliding scale so that those not making the changes required are charged more as time elapses.
It was also stressed that certain groups will need additional support, or exemptions from the costs. Echoing earlier views, there was widespread concern about the impact of costs on those who were already struggling financially, particularly in the context of the cost of living crisis. There was therefore a strong desire to protect and support those least able to afford the changes, as well as those with restricted choices in their transport use (e.g. those with disabilities and those in rural areas with no accessible services).
How can we make sure that everyone benefits?
If the vision for a decarbonised transport system was realised by 2040 (and there was some scepticism over whether it would be), a number of broad societal benefits were identified, including:
- A more integrated, smoother and accessible public transport for Scotland (as outlined in the vision) improving health, wellbeing and social connectedness.
- More services for communities to support a thriving local economy, reducing the need for people to travel further for their everyday needs.
As with costs, participants highlighted that the benefits of the transition may not be the same for everyone. To ensure that everyone benefits from the transition, they therefore felt that specific circumstances of different groups should be acknowledged and steps taken to address the barriers they may face. This included the groups already mentioned: those on lower incomes and those struggling financially; people with health conditions, disabilities, and elderly people; and those living in rural communities.
Participants felt that further education and engagement on the benefits of the transition was required. Public consultations, particularly with those most likely to be affected, were suggested as an effective way of understanding the needs of these groups.
“At the moment there seems to be a disconnect between the current Scottish Government and the public; they are not listening to the genuine concerns of those who will be most affected and are least able to shoulder these burdens.” (Participant, phase 1, online community)
It was also felt that the necessity of transitioning to net zero in the transport sector (and the benefits of doing so) would need to be clearly and widely communicated to people living in Scotland. Related to this, a theme of transparency emerged, with participants highlighting the importance of the Scottish Government showing how funds raised were being used (e.g. to improve public transport infrastructure).
“You would need an acceptance from the collective good, that everyone is going to buy in from the system […] You have to take everyone with you on it, and that is a big challenge.” (Participant, phase 1, workshop 2)
There was a view that reducing the cost of public transport would not have an impact on vulnerable groups unless it was available or accessible to them. Infrastructure improvements were therefore seen as a prerequisite for all people benefitting from the transition to net zero in the transport sector.
“Older people already have free access to bus transport but if the buses don’t go where you need it’s no use.” (Participant, workshop 2)
Exploring transport policies in phase two
In phase two, participants discussed the potential application of Road User Charging (RUC) as a way of helping reduce our reliance on cars. They considered two possible approaches to this:
- UK national road pricing, involving a charge on drivers based on distance driven.
- Urban local road user charging, involving a charge to drive into specific parts of an urban area.
Participants explored each approach through scenario-based discussions and considered the implications for different people living in Scotland (using some of the same characters from phase one).
Initial views on the idea of Road User Charging
Before the two approaches were presented, participants shared their initial thoughts on the idea of RUC in principle. Some clear themes emerged, which included:
- Not implementing it as a blanket rule: while it was recognised that RUC could encourage people to reduce their reliance on cars, it was also felt that it could impact negatively on some groups (e.g. those on low incomes and those who rely on their car because of a disability or health condition, their work, or where they live). It was therefore agreed that exemptions or permits would need to be in place for these groups.
- Ensuring there are alternative choices available: initially it was felt that applying some form of RUC would be fair where public transport alternatives were readily available (e.g. in cities), but not in areas where cars are not a choice but a necessity due to a lack of accessible public transport option (e.g. in rural areas):
- “People who live in rural or isolated locations. It’ll be a struggle to get to public transport. I think it will be unfair to put charges on them when they don’t have an option.” (Participant, phase 2, workshop 2)
- Ensuring that funds raised through RUC are spent on public transport improvements, which highlighted the importance of transparency in the policy for the public to trust it:
- “The money raised needs to be used to directly improve the transport system rather than being gobbled up by the government.” (Participant, phase 2, workshop 2)
It was broadly felt that RUC would be acceptable to the public if they understood why it was being introduced and what the benefits would be. However, there was some opposition to the principle of RUC on the basis that it would restrict peoples’ autonomy. It was felt that this would impact those on lower incomes most, as they might have to make decisions based on where they can afford to travel to, while higher earners could absorb the cost and not have to change their behaviour, thus exacerbating current inequalities.
Views on UK national road pricing
UK national road pricing was introduced as a possible approach to RUC that would cover all of Scotland’s roads and involve a charge on drivers based on distance driven, as described in the following table: (see figure 9.3).
|
Option 1 – UK national road pricing |
|
A number of benefits to this approach were identified, such as cleaner air, improved health and wellbeing, and encouraging greater uptake of public transport.
Participants noted that the money raised would be invested in improvements to public transport and active travel infrastructure. It was agreed that this should be prioritised in rural areas where public transport was widely perceived to be less available and accessible.
“A good thing about it is that the money raised is put towards public transport. If the money is invested into rural areas, that’d be really good. That’s where the money should go because they need transport.” (Participant, phase 2, workshop 2)
Consideration for different circumstances
Reflecting one of the recurring themes from phase one, participants felt strongly that an approach like this would need to take account of different circumstances. It was reiterated that a charge on people living in rural areas who are reliant on their cars to access services would be unfair due to the lack of alternative options available to them.
“It would be unfair for those that live in rural areas to pay the same when they don’t have a choice in transport.” (Participant, phase 2, workshop 2)
Participants also discussed the impact on people they knew who travel long distances across the country as part of their jobs. With the prospect of national road pricing, it was felt that they would struggle to absorb these charges.
Participants noted from the scenario description that costs would vary depending on certain factors, such as the user’s disability status, and this was broadly welcomed.
“People who are dependent on cars with disabilities, there should be nothing stopping them using their cars, but people who could make small adjustments to their lifestyle, they should just have to bite it” (Participant, phase 2, workshop 2)
To ensure that national road pricing takes account of different circumstances, it was agreed that there should be clarity around who the charge applies to.
Who would be impacted more?
While it was felt that David and Sarah (a couple living on the outskirts of Glasgow with their two children) could afford the charges and make small adjustments to their lifestyle to reduce car use, it was also recognised that there would be circumstances where they would need their car to care for their disabled son and that they shouldn’t be limited in this circumstance.
This approach was also considered to be unfair for Nadeem (a rural builder), who would not have a choice but to transport his equipment and materials by van and incur the charge.
Balancing incentives and disincentives
When looking at national road pricing, there was some surprise among participants that EV users would not be exempt from the charge. There were mixed views on the fairness of this. On the one hand, it was felt that applying road pricing to EV users would act as a disincentive and would contradict other messaging that encourages drivers to switch to EVs. This concern was tied to a broader wariness around the potential that consumers would be faced with costs from multiple different angles.
“They’re trying to force you to buy an electric car, but once everyone has got an electric car, they’ll change the rules. As a consumer, I just pay, pay, pay.” (Participant, phase 2, workshop 2)
On the other hand, it was felt that EVs should be charged as they would still contribute to emissions through the manufacturing process, to wear on the roads. It was also felt that owners of EVs were more likely to be higher earners and therefore could afford the charge. If the objective is to reduce overall journeys by car, then exempting EVs would not help in achieving this.
It was suggested that this form of RUC would be fairer if EVs were charged less than petrol/diesel cars to encourage lower carbon choices, while also encouraging people to rely less on their cars overall.
“You could say you could be charged reduced rates for that purpose. You are contributing less compared with other people, so that could be one way around.” (Participant, phase 2, workshop 2)
How the charge is paid
The indicative cost of 3-10p per mile driven drew mixed responses. For some this amount was felt to be too low to have the desired impact, while others felt increasing the charge would place an unfair financial burden on people who are already struggling. It was suggested that charges could be increased over time to target those who choose to absorb the cost and continue to drive.
Participants also had questions around how drivers would be expected to pay the charge. It was highlighted that a one-off annual charge could come as a shock to some drivers and would be harder to pay in one go. Instead, participants suggested that the costs should be paid in instalments to ease any financial pressures.
It was also suggested that the charge could be lower (or lifted) during the night to ensure those working night shifts have more choices available to them. This was considered important in the case of people who may not feel safe using public transport at night.
“I think there are different circumstances between somebody travelling to work and somebody travelling for leisure. I’m not sure how you would separate the two for making a charge.” (Participant, phase 2, workshop 2)
Who would be impacted more?
When considering this approach in relation to Alice (a nurse living in a city), the safety concern around her using public transport for night shifts was discussed.
While one view was that Alice has the choice to drive or take public transport available to her and so it would be fair for her to pay the charges, another view was that it would be unfair for her to have to choose between her safety and her finances.
Building on the concern raised about mixed messages, rules changing over time, and the costs for consumers continuing to mount up, it was felt that any changes introduced should be for the long-term.
“If you’re going to have a just transition, make it sensible for the consumer and don’t make the consumer pay more and more.” (Participant, phase 2, workshop 2)
Views on urban local road user charging
Urban local road user charging was introduced as another possible approach to RUC that would involve a charge to drive into specific parts of an urban area, as described in the following table: (see figure 9.4).
|
Option 2 – Urban local road user charging |
|
This approach was considered to be fairer than national road pricing. While delivering the same benefits (e.g. cleaner air and improved public transport), participants also expected this approach to be implemented in areas where alternatives – such as public transport and park and rides – would be readily available. Participants were also reassured that similar systems had already been implemented in other cities.
“This one is targeting particular areas and not all journeys. You’re given an option to use your car or public transport to get into the city.” (Participant, phase 2, workshop 2)
Who could be impacted less?
This approach was considered fairer for Nadeem, as it was assumed that he would not be travelling into areas where RUC was in place and his rural building business would therefore be unaffected.
For David and Sarah, while it was recognised that RUC would likely affect them, they would have alternative public transport options available to them as they lived in a large urban area.
Offering alternatives
Reiterating earlier discussions around the importance of providing alternatives, it was strongly felt that adequate public transport infrastructure would need to be in place before RUC was introduced to an area.
“I think it would have to be done once the developments on public transport were completed and once the government had good confidence that public transport is efficient.” (Participant, phase 2, workshop 2)
Exemptions
Participants queried how those who live within the charging zone, or travel in and out of it for work, would be treated. While it was felt that some businesses would be able to absorb the costs or find alternatives, it was perceived to be unfair on those who already live or work within the RUC areas. There was broad agreement among participants that exemptions would need to be made for such groups. Similar to national road pricing, it was felt that some EVs should also be exempt, such as those used for work purposes.
“If you’re already living in an area and then you suddenly get told you’re going to have to pay £5 or £15 any time you take your car out purely because of where it is, I would say that would be quite unfair.” (Participant, phase 2, workshop 2)
Urban area differences
The definition of an “urban area” was also scrutinised, with a distinction drawn between cities like Glasgow or Edinburgh, and cities like Inverness. Inverness was considered to be a city that connects people by transport in rural areas to the rest of Scotland. If local road user charging was introduced here, there was a concern that it would limit the mobility of those living in the surrounding rural areas. This added to the concerns raised earlier about not taking a blanket approach, but considering different circumstances.
“In Inverness, you wouldn’t just be restricting the city centre, you’d be restricting other areas outside of that. Inverness city centre is a connecting point to get to other areas. I can’t see this working [there].” (Participant, phase 2, workshop 2)
What needs to be in place for Road User Charging to be fair?
Participants identified a number of conditions that would need to be in place to make Road User Charging fair (see conclusions section). In reaching their conclusions participants were broadly accepting of the principles of Road User Charging, based on the view that it could help encourage some of the significant changes needed for Scotland to reach its net zero targets.
A more exceptional view was that it would be difficult (and for one participant, impossible) to make RUC fair. Participants drawing this conclusion considered there to be too many variables to consider, and were concerned that RUC would ultimately deepen inequalities by limiting the choices of those less able to afford the charges.
“I can imagine if you’re already living hand to mouth, it would be very stressful to keep track of all your miles and try and work out exactly what you’re going to be paying.” (Participant, phase 2, workshop 2)
Appendix 2 – Built environment and construction sector detailed findings
This chapter outlines participants’ views on a just transition in the built environment and construction sector. It provides detailed findings from both phases of research:
- Phase one, where a group of 30 people living across Scotland met over six online workshops and an online community to consider what a fair distribution of costs and benefits would look like. It focussed on three sectors, one of which was the built environment and construction.
- Phase two, where a group of 20 people living across Scotland met over three online workshops to explore specific policy options One of those workshops focussed specifically on the built environment, including the transition to clean heating systems in domestic properties.
Summary of findings
The vision for the built environment and construction sector was viewed positively, but also as overwhelmingly ambitious. Participants felt costs should be shared between:
- The construction sector
- Multiple property owners
- Homeowners
- The Scottish Government
To ensure a fair transition, and that everyone benefits , it was suggested that:
- Those who profit from buildings should pay for the work needed to make them adequately energy efficient.
- Costs should be distributed based on ability to pay, which could include a means-tested approach to payment. Having more than one property was viewed, by some, as an indicator of wealth and that such individuals could afford to pay for changes to their properties.
- Landlords have a responsibility to pay for their properties and there should be regulation to ensure they do so without passing on costs to tenants.
To ensure the heat transition is paid for in the fairest way possible, it was concluded that:
- There should be support available to all households but that the amount of support should vary depending on circumstances, with those on low incomes and those with older properties entitled to the most government funding.
- There should be protections in place, such as exemptions from penalties for vulnerable groups, rent increase caps to protect renters, regulation on the installation of new heating systems, and a fair appeals process.
- Other considerations included careful consideration around loans to avoid pushing anyone into financial hardship, reassurances around the efficacy of new heating systems, and clear communication with the public about the changes required.
What changes were expected?
Early in each phase, participants discussed the changes they thought would be needed for the built environment and construction sector to reach net zero. Their suggestions covered people’s homes, commercial or public buildings, and the broader construction sector, including:
- Phasing out use of fossil fuels, for example shifting from gas and oil to cleaner heating systems in homes.
- More energy efficient buildings.
- Using more sustainable materials in construction.
- Increased regulation on standards and location of new builds, including ensuring buildings were weather-proof.
One of the key challenges participants identified at this stage was with retrofitting existing buildings. They felt this would be difficult due to the age and characteristics of a property (e.g. whether it would be possible to install cavity wall insulation), location (e.g. there was a perception that heat pumps did not work well in all environments), and the potential cost and disruption caused by making adaptations.
“It [is] easier to address environmental and energy issues when building new houses, most of the problems arise when we try to improve these issues in older housing stock. It means prohibitive costs to change heating systems and insulate old buildings. Who is going to pay for this?” (Participant, phase 1, online community)
Potential challenges were also raised specifically in relation to rural communities due to the nature of the existing housing stock, the climate, and the availability of skilled workers.
On heating systems specifically, participants raised concerns about the upfront cost, their perceived suitability for some properties (e.g. apartments with limited external space or coastal properties), and the efficacy of such systems based on what they had heard. One participant, who had seen planning applications for heat pumps as part of their job, highlighted that the process of installing can also be difficult.
“I’ve heard a lot of bad press about heat pumps not working properly […] I’ve heard people have installed them and removed them and gone back to boilers as they couldn’t get their house warm enough. It would be off-putting if you’re going to spend thousands.” (Participant, phase 2, workshop 3)
In discussing their expectations for the sector there were early suggestions of financial support for homeowners to make changes to their property in the form of means-tested grants.
Reactions to the initial presentations in phase one
Phase one participants heard a presentation outlining the Scottish Government’s vision for the future of the sector, the types of changes that would be needed to achieve it, and the benefits and challenges associated with decarbonising the sector. A second presentation then outlined the inequalities within the sector that would need to be addressed as part of the transition to net zero.
Echoing many of the sentiments raised in earlier sessions, some participants mentioned feeling overwhelmed about the scale of the challenge in terms of cost, feasibility of retrofitting, and extent of upskilling required.
“It will be difficult to bring current homes up to standard, mainly due to costs…I have an older, solid stone house, which is a nightmare to heat. It’s not on the gas grid, but uses electric and coal. It comes down to funding for me.” (Participant, phase 1, workshop 3)
In their initial reactions to the presentation, participants suggested that those profiting within the sector (landlords, energy companies, and construction companies) should bear a greater share of costs than the public should. Having heard about the costs associated with changes such as heat pumps, participants felt that financial support from the Scottish Government would be needed to help homeowners to afford those changes.
Participants also stressed the importance homeowners receiving trustworthy advice regarding the changes required to their properties, and of contractors carrying out high quality work. The need for regulation in the private rental sector was highlighted, as a way of ensuring that landlords did not pass on the cost of upgrades to tenants.
Vision for the built environment and construction sector discussed in phase one
Phase one participants had a chance to view a future vision for the built environment and construction sector on the online community and again in the workshop. The vision (shown in figure 10.1 below) was based on the Scottish Government’s discussion paper for the sector. As well as sharing their own views on the vision, participants revisited the five fictional characters (show in figure 10.2) and discussed how it might impact on them.
Figure 10.1. Vision for the built environment and construction sector

The role of the built environment for our characters
Alice lives in a three-bed flat with two friends. They rent from a private landlord and share responsibility for bills. The flat has electric heating. It has double glazing but is drafty and has poor insulation. She hopes to buy her own property when she has saved enough money.
David and Sarah live in a semi-detached house which they own. Their home has an EPC B rating. It has gas central heating, double-glazing, and loft and cavity wall insulation. They own a second property, which they rent out. This property lacks insulation and has an EPC D rating.
Lorraine lives in a 1920s home. It does not have central hearing. She uses a wood burning stove and electric storage heaters. She has external wall insulation, but the home still has a low EPC E rating. Her daughter wants to work in construction but there are not many local training opportunities.
Maria lives in a ground floor flat which she rents from the housing association. The flat is in a flood risk area. She requires a minimum level of warmth, meaning her heating is used all the time. The flat has an EPC C rating, with double glazing, central heating and loft insulation.
Nadeem and Ajay live in semi-detached property. The property has solar panels and a ground source heat pump. Nadeem is a builder and is working on more new builds. He feels he needs training on new construction techniques for him and his staff.
Who could benefit?
Participants identified groups who would benefit from the vision, provided certain measures were in place. The construction sector was identified as potentially benefitting from the additional work involved in retrofitting buildings, which could lead to profit and the creation of new jobs. Participants noted that construction firms that were already working in line with the vision would find the transition easier than those having to change practices.
“Most of the cost is in retrofitting older buildings. If you build a new building already to high standards the costs are reasonable. You could factor in a heat pump at the beginning. I think the building industry is perfectly able to adapt to that with minimal challenge.” (Participant, phase 1, workshop 3)
Participants felt that those currently living in an energy inefficient home would benefit from the energy efficiency improvements proposed under this vision. It was suggested that homeowners who could afford to make those changes would likely find this aspect of the transition easiest. It was felt that home buyers would benefit from new builds being built to high energy efficiency standards, as long as those new homes were affordable.
Participants also felt that social renters might face fewer challenges in implementing the changes needed, which was based on a perception that responsibility for making upgrades to their homes would lie with providers of social housing, such as the council. However, they also noted that a drawback for social renters was their lack of control over these types of decisions and that they would have to rely on providers of social housing to make improvements. There was equally a concern that private landlords would pass cost on to tenants.
Who benefits?
Nadeem was identified as benefitting from an increase in work for the construction sector and from training opportunities available on new construction techniques, provided these are accessible to him and his staff.
Alice would benefit from improved energy efficiency, provided upgrades were carried out by her landlord and that additional costs associated with this were not passed on to her. She would also benefit if she was able to afford a high-quality new build.
Maria was also identified as benefiting, if the housing association carries out upgrades and if appropriate measures were introduced to reduce the risk of flooding to her property.
Who could be negatively impacted?
Participants felt that there was potential for homeowners to be negatively impacted if they found energy efficient improvements unaffordable. There was specific concern about middle income earners, who it was felt might not qualify for financial support towards making their homes more energy efficient, yet may not be able to afford those changes.
“The asset rich cash poor single homeowner is going to be the one that’s hit most. You apply for the grant and they’ll say you have a pension and savings but, you can’t access it in the same way a council tenant can.” (Participant, phase 1, workshop 3)
Participants also felt that there would generally be higher costs associated with living in a rural area, which would impact on ability to afford upgrades. For example, it may cost more to transport construction materials to rural areas.
There was concern that new builds with very high energy efficiency standards would be more expensive which would affect home buyers or self-builders’ ability to afford a new property.
As well as barriers related to costs, participants also noted that it may not be possible to upgrade certain properties due to their age or location (e.g. listed buildings) meaning people living in these properties would not benefit from the vision. There was also concern about the possibility of property owners receiving bad advice about upgrades or work not being carried out to a high standard.
While the construction industry was identified as benefitting overall, participants emphasised that some workers could lose out if there were no local training opportunities available to them, or if they would find it difficult to reskill given their age or need for financial support.
Who could be negatively impacted?
Lorraine was identified as at risk because her property had a low EPC rating and would likely require a lot of work to make it energy efficient, which she may not be able to afford.
Reflecting the points raised above, it was felt that Alice was at risk of losing out if her landlord increased her rent to cover the costs of changes to the property. This would also affect her ability to save for a new property, especially if very high energy efficiency standards led to increased costs for new builds.
Phase one conclusions on a fair distribution of costs and benefits
As we transition to net zero, who should pay for the changes needed in the built environment and construction sector?
In the workshop, the types of costs covered by the expert speakers included those associated with the construction of new buildings, those required for the retrofitting of existing buildings (e.g. through insulation or heat pumps), and the training and reskilling of the construction workforce. Participants discussions therefore centred around these broad cost categories.
As with the transport sector, there was a sense among participants that the costs of transitioning to net zero should be shared and that no single organisation or group should bear sole responsibility. Groups that participants felt should contribute to paying for the changes included:
- The construction sector. As noted above, it was felt that the buildings and construction industry was likely to benefit from the changes needed to reach net zero, due to demand for new homes and the retrofitting of existing homes to bring them up to standard. As the industry would likely profit from an increase in demand, it was considered fair for them to pay a share of the costs. In particular, it was felt that the industry should bear the cost of reskilling the workforce, as this would ultimately benefit them (though some suggested that the Scottish Government and colleges or universities should also share some of this cost):
“The companies that are building the new properties should bear a reasonable chunk of [the cost] because they’re going to profit from selling the properties. And they have a duty to bring the properties up to some sort of [standard].” (Participant, phase 1, workshop 3)
- Those owning rental properties. There was an expectation that social landlords would bear responsibility, and therefore the cost of making changes. Further, there was a strong feeling that private landlords should pay to bring those properties to a suitable energy efficiency standard. Similar to the views about the construction industry, it was felt that those generating profit from the property market should and could pay for changes needed, and that they should be held responsible for ensuring properties reach the necessary standard of energy efficiency:
“If they can generate profit from just owning [an additional property], they should be expected to maintain the same or higher standards than private owners or council flats.” (Participant, phase 1, workshop 3)
- Homeowners. It was generally accepted that homeowners should contribute to the costs of making changes to their properties, as this was seen as part of the responsibility of owning a property. As the cost of making changes would potentially be very high, it was suggested that financial support should be made available for homeowners, ideally in the form of grants or interest free loans. Some felt that homeowners may benefit financially in the long term, as making the improvements to the property may save money on bills or increase its value, although this would depend on local circumstances. A tiered system of payment was therefore suggested, reflecting ability to pay and other circumstances (explained further below in relation to systems of payment):
“I think that low or no interest loans would be welcomed. It’s taken me this long to put together a 5% deposit. I’ve done the biggest bunch of [saving] that I can do … that would take the pressure off me.” (Participant, phase 1, workshop 3)
- The Scottish Government. Due to the scale of changes required to buildings (e.g. one of the expert speakers noted that almost 2 million homes will need retrofitting) and the level of costs (e.g. installing a heat pump was described by one of the experts as potentially costing up to £15,000 for some households), it was felt that individuals would require support from the Scottish Government. Some participants shared their own experiences of looking into heat pumps, saying that they were unable to get them because they were prohibitively expensive. Government support towards this, and other costs associated with retrofitting, was therefore considered necessary:
“I don’t think it’s doable to pay for this all on our own. Obviously this is something we all want and it needs to be done. But there does need to be funding or grants to help people.” (Participant, phase 1, workshop 3)
How can we make sure that system of payment is fair?
In discussing fair systems of payment, two clear themes emerged:
- First, that the built environment was complex, with many different players involved and different circumstances to be considered. As such, it was felt that while collective action was required to help reduce the emissions from our buildings, there was no “one size fits all” approach to covering the costs.
- Second, that those who were unable to afford the changes, particularly those on lower incomes, should be provided with support. Of the potential systems of payment discussed in the workshop and online community, the approach that was met with most support was one based on addressing inequality and ensuring that those on lower incomes did not get left behind.
There was at least some level of support for the following systems of payment:
- Ability to pay. It was felt that individuals all have a part to play, but there should be a tiered, perhaps means-tested, approach to payment. This would mean that those most able to afford changes would make higher contributions, potentially through a tax-based system of payment. There was some discussion of the pros and cons of means testing given the bureaucracy this would require, balanced with a need to act quickly in order to reach net zero by 2045.
“The people who build the biggest and poshest houses, there should be some kind of tax on them to help insulate the people at the bottom of the market… A bit of taxation redistribution there would be useful.” (Participant, phase 1, workshop 3)
- Profit-sharing. As noted above, a strong sentiment in the workshops was that those who made profit from buildings (both from their construction and from leasing them to tenants) could and should pay for the work needed to make those buildings adequately energy efficient.
- Number of properties. Having more than one property was viewed, by some, as an indicator of wealth and that such individuals could afford to pay for changes to their properties. However, some challenged this by saying that having a second home did not automatically mean that they could cover the high costs of installing heat pumps or similar measures.
“Unless there are solid reasons why the individual owns more than one home, then they should incur more cost and inconvenience than those living in properties which are appropriate to their needs.” (Participant, phase 1, online community)
- Ability to make changes. Linked to the point above, it was felt that landlords (both private and social) have a responsibility to pay for their properties, and that tenants should not be obliged to cover the costs. It was seen as unfair for landlords to pass the costs of improvements on to tenants – otherwise, the already challenging costs of renting and attempting to purchase a home would become even more prohibitive. This led participants to suggest regulation of private landlords to ensure they bring their properties up to standard and prevent them from passing these costs on to tenants.
“If they talk of passing on costs to the renter, if there are not things like rent controls, then the housing situation will become so bad that no one will be able to afford to live anywhere.” (Participant, phase 1, workshop 3)
- Some participants with experience of renting or owning a property within a building with shared ownership felt it would be unfair if they had to pay costs that they had not agreed to or that would not be borne by social renters.
Opinion was split on whether a payment system based on level of emissions (i.e. with those living in higher emitting homes paying more) was fair. On the one hand, there was a view that property owners who had neglected to make the necessary changes should, after time, be obliged to pay more. On the other hand, there was a view that those in less energy efficient properties may also be those with the lowest incomes, they should not be penalised for not being able to afford the changes needed. Indeed, it was suggested that these properties should be prioritised for support.
“Some houses are not able to have all the new fancy equipment and insulation fitted to them… people living in such buildings should be offered more help and not penalised. However, that being said if such houses have refused to update their homes and continue to use excessive carbon emissions without trying to cut down then, yes, they should pay more.” (Participant, phase 1, online community)
Participants also recognised that building standards have changed over time so it would not be fair to penalise owners who have “inherit[ed] decisions made by previous owners…that were taken in good faith”. More broadly, participants emphasised the need to consider links between sectors when it comes to an overall system of payment.
“I suggest a nuanced, means-tested approach, which is tailored to each person’s circumstances. I also suggest that this approach takes into account the overall carbon emissions caused by an individual’s lifestyle…Treating these as separate issues seems to be missing the point.” (Participant, phase 1, online community)
How can we make sure that everyone benefits?
To ensure everyone benefits from the transition, the general feeling was that appropriate financial assistance should be provided to those on lower incomes and those with particular support needs (on account of their age, health, or disability). Participants therefore suggested financial support for homeowners to retrofit their properties, ideally in the form of a government grant reflective of ability to pay.
Other specific suggestions included assistance in the form of a scheme similar to ‘Help to Buy’ but for energy efficient new builds, and a loan encompassed with mortgage to help owners replace heating systems.
“The people who will find it most difficult are the people that have been in their family home for 40 years and it’s their responsibility to fit it. The support seems patchy for people trying to make these changes…so ultimately homeowners need the most help.” (Participant, phase 1, workshop 3)
Protecting private renters was also seen as important. It was felt that private renters may be at risk of being left behind if the focus of support was on homeowners. Their concern that some landlords may not be able to afford to make the changes required to their rental property (e.g. if also making changes to the home they live in), therefore leaving renters in energy inefficient properties. To make sure that renters benefit from the changes, there was a suggestion of both regulation for landlords (outlined above) and financial support if necessary.
The importance of awareness raising was also highlighted as a way of ensuring everyone benefits. Specifically, it was seen as important to ensure that everyone understood the EPC rating system, what changes they would need to make to achieve the new requirements, and what support would be available.
Finally, it was noted that rural areas may need different solutions and retrofitting may be harder in rural properties. Several factors were highlighted including age of property, local climate, availability of tradespeople, and additional costs or logistics associated with each of these factors. The importance of adapting to the needs of rural areas was therefore highlighted as a way of ensuring people living in rural areas are not left behind and that people are not discouraged from moving to a rural community.
Exploring policies related to heating systems in phase two
In phase two, participants discussed the transition to clean heating systems in domestic properties (i.e. homes that people live in, whether owned, private-rented, or social-rented) and considered two possible approaches for funding and implementing this:
- Widely available public funding, with stricter penalties for non-compliance.
- Targeted public funding, with softer penalties for non-compliance.
Participants explored each approach through scenario-based discussions and considered the implications for different people living in Scotland (using the same characters from phase one of the research).
Initial views on the idea of a clean heat transition
Before the two approaches were presented, participants shared their initial thoughts on the idea of transitioning domestic properties to clean heating systems and making energy efficiency improvements in principle.
The Scottish Government support currently available for people switching to clean heating systems (in the form of grants and interest free loans) was viewed positively and the timescales for this (i.e. prohibiting polluting heating systems by 2045) were considered reasonable. However, several practical questions were raised around: how homeowners and landlords would go about installing clean hearing systems ; how suitable they would be for some types of properties (one participant had used support from Home Energy Scotland and was advised that a heat pump was not viable); how listed buildings would be protected; and what the ongoing costs of clean heating systems would be.
The energy efficiency improvements were also viewed positively in terms of the impact they would have on properties’ ability to retain heat. These changes were also considered to be easier, cheaper and more manageable to make than the heat system changes. However, participants questioned the availability of tradespeople, with one participant having been unable to find someone to install loft insulation despite receiving support for that.
Some broader themes also emerged that remained prominent through later discussions:
- Concerns around the upfront costs and the impact on certain groups (e.g. students, elderly people, those with disabilities or health conditions, people with older properties, landlords[24] having to absorb the costs, and tenants who might be subject to rent increases).
- A view that grants should be limited to those on low incomes or those in older properties who have to make the biggest changes.
- A perception that rent freezes or caps would be necessary to prevent renters experiencing the shock of sudden rent increases.
- An appetite for more evidence from trials and system comparisons to reassure people that the solutions proposed are the right ones and are for the long term.
Views on widely available public funding
Participants considered a scenario in which Scottish Government grants and loans would be available to all households to improve energy efficiency and install a clean heating system. In this scenario, there would be penalties for non-compliance by the deadlines set out (see figure 10.3 below).
Figure 10.3: Widely available public funding with stricter penalties

It was felt that widely available funding would prompt more people to be proactive and make changes to their homes earlier rather than waiting until the last minute. This, coupled with stricter penalties, was considered an effective way of encouraging people to switch.
The fact that exemptions would be in place for some homeowners based on certain circumstances was “heartening” for participants. It was felt that people with disabilities, health conditions, pensioners and people living in older properties (who would find the changes most difficult) should be exempt. Participants were also supportive of an appeals process being in place to enable people to challenge penalties.
Who would be impacted more?
Participants identified Lorraine (a rural farmer with an older property) as someone who should be exempt. In her case, being exempt was felt to be important to protect her from further financial precarity, as an older person living in an older property who was already paying off debts.
Participants were also reassured by the fact that tenants would be protected from rent increases, although there were some concerns raised about landlords ignoring the regulations or exploiting loopholes (e.g. by increasing rents before making the required changes).
Deadlines and penalties
The 2028 deadline for private landlords making home energy improvements was felt to be too close, and that introducing penalties without a longer notice period would be unfair. While some welcomed the fact that landlords would not be able to pass along additional costs to tenants, others raised concerns about the potential consequences of this. One participant highlighted the risk of landlords (including her own current landlord) deciding to sell in response to the 2028 deadline, penalties and restrictions, which would mean fewer homes available to rent.
“Very many landlords will simply sell their properties rather than fork out such a large sum of money, this will, of course remove even more homes from housing stock when there is already a housing crisis.” (Participant, phase 2, workshop 3)
The 2033 target for homeowners to make energy efficiency improvements was also considered too soon. For this funding approach to be made fairer, participants suggested that homeowners and small business landlords should be given more time to make the necessary changes before penalties are introduced. Exemptions from penalties were also considered to be fair if homeowners and landlords could demonstrate that they had made some effort towards meeting the targets or that they cannot afford to make them.
“If you make an effort and don’t achieve the target, it seems unfair to give you a penalty. The people who do make an effort and achieve it, fair enough. It depends if the target is achievable or not. Be fair about it all and make the target reasonable and achievable.” (Participant, phase 2, workshop 3)
The 2045 deadline for clean heating systems to be installed, however, was considered too far away. There were concerns that this timescale would not provide enough motivation for people to act quickly.
“How are you going to get people interested at all when the penalties don’t kick in for another 20 years?…It feels too distant.” (Participant, phase 2, workshop 3)
While the appeals process was welcomed, there were concerns that it could be a difficult and stressful process which would be off-putting for some.
Availability of funding
The availability of funding to all households drew mixed views. Some participants felt this was unfair, as wealthier households could afford to make the changes without funding support, while those struggling financially would be reliant on support.
Other participants felt that the Scottish Government should provide financial support to everyone if the changes were being made compulsory. Broader availability of funding was also considered fairer than the alternative, as there was a perceived risk that targeted funding could lead to some households not being eligible for funding but still being put under financial pressure.
“If the government were to enforce this, I think it wouldn’t be very fair to give grants to some and some to not…If they want people to do it, they’ll need an incentive.” (Participant, phase 2, workshop 3)
There was some discomfort around the idea of people taking out loans to cover the remaining costs, particularly for those seeking to avoid loans or already struggling with debt.
“I went through my life trying to avoid debt. Taking on debt in your 80s, you’ve had a lifetime not owing anybody then because someone has decided your gas boiler is out of fashion you have to find £15,000.” (Participant, phase 2, workshop 3)
If loans were to be offered, participants agreed that long repayment plans should be available to ease any financial burdens, particularly for those paying off existing debts. Among participants who preferred targeted funding, it was felt that lower income households should be given higher grants so that they would not have to take out a loan.
“If giving you a loan, it’s on top of the debts I already have. If [repayments] don’t eat into my pay, maybe it’s manageable, but trying to squeeze the little I earn to then pay for the renovations I don’t need, it’s a bit too much.” (Participant, phase 2, workshop 3)
Trust and transparency
Discussions on the heat transition highlighted issues of trust in systems such as heat pumps and heat networks. Participants sought more reassurances around the efficacy of these systems and felt that there would need to be a campaigns on a continual basis to raise awareness among the public (using a range of methods such as letter, billboards, and social media). One participant suggested reaching people through alerts on their phones, highlighting the sense of urgency and scale required to make sure the public are aware so that they can start to prepare.
While the focus of these discussions was on homeowners and landlords making the heat transition in their properties, it was also felt that housing developers should be responsible for installing heat pumps in new builds, or connecting them to heat networks. This was linked to a broader sense that these policies were placing an unfair burden on consumers without systemic action or leadership being demonstrated by industry or government.
“They’re still putting gas boilers in. Why don’t they put heat pumps in new builds so people know how they work. It feels like it’s just the stick at the moment, there’s no carrot.” (Participant, phase 2, workshop 3)
Views on targeted public funding
Participants considered another scenario in which Scottish Government grants and loans would be available to households on lower incomes to improve energy efficiency and install a clean heating system (but not to higher income households, landlords or owners of second properties). In this scenario, there would be penalties for non-compliance on energy efficiency improvements, but penalties for not installing a clean heating system by 2045 would not be enforced straight away (see figure 10.4 below).
10.4: Targeted public funding with softer penalties

Those who preferred a more targeted funding approach saw this as fairer than the option of broadly available funding, as they felt it would support those who needed it most. As well as people with low incomes, people with disabilities were also identified as a group who should be eligible for grants.
While there were concerns raised initially that private landlords being able to increase rent would negatively impact tenants, it was also recognised that tenants could benefit from their homes being made more energy efficient, which in turn could lead to better living conditions and cheaper energy bills. It was agreed that a rent cap would be important to protect tenants from sharp rent increases.
Deadlines and penalties
As highlighted in discussions around the timescales for implementing changes in option one, it was felt that some deadlines (e.g. 2028 for landlords to meet a minimum energy standard)) were too soon and would not provide enough notice, while others (e.g. 2045 for switching to a clean heating system) were too far away and would not instil enough of a sense of urgency in the changes required.
In discussing the introduction of penalties for non-compliance, participants raised concerns that this would lead to people rushing to install the technologies before the deadline and mistakes being made. This prompted questions around how the clean heating systems would be installed and regulated.
“I think penalties scare people off more and maybe they’ll do things quickly and they’ll be done wrongly. Who’s checking these things? Are there people checking it’s done correctly? It could be a cowboy builder doing things that are wrongly done and then you get penalties for something that you thought was right.” (Participant, phase 2, workshop 3)
There was also a lack of clarity around the timings of the penalties, with some being enforced as soon as the deadline expires and others not being enforced right away. This was felt to be problematic and an ineffective way of encouraging people to act.
“If you say you’ve got to do something by 2045 but there are no consequences for not doing it by 2045, [it] doesn’t make sense. I could say anyone has to do something but if there are no consequences, do they really have to do it?” (Participant, phase 2, workshop 3)
Participants suggested that the penalties should be made clearer, but agreed that there should be some flexibility in how and when they are applied by taking the household’s circumstances into account first.
Targeted funding
Although some participants supported a more targeted funding approach, there was also a strong view that targeted funding could create financial hardship and worsen the cost of living crisis. It was also felt that targeted funding could limit the effectiveness of the policy, with those not eligible for funding being less inclined to act.
As in the previous scenario, some were not comfortable with people being pushed into any form of debt, even with some of the costs covered by grants.
“They’re saying 0% interest loans, but you’re putting a heap of people into debt, vulnerable people, young people. I think this would be quite horrible.” (Participant, phase 2, workshop 3)
There were strong views against private financing, which were underpinned by a perception that private sector organisations – and energy companies in particular – were motivated solely by profit. If loans were to be made available, it was preferable that these be Scottish Government-administered and not privately financed.
“I don’t think private sector should offer loans in the first place. The government wants you to do this so they should offer the loan themselves or provide the grant.” (Participant, phase 2, workshop 3)
While some were not comfortable with private financing in the form of loans, there was some openness to other forms of private financing, such as discounts on energy bills in return for making energy efficiency improvements. Alternative sources of funding for the heat transition were also suggested, such as a tax on the profits of energy providers.
Trust and transparency
As in the previous scenario, participants felt that there would need to be clear and comprehensive communications with the public to raise awareness of the changes that homeowners and landlords would be required to make. Building on this, participants expressed a clear appetite for these communications to provide reassurances around the reliability of the clean heating systems and the ongoing running costs as well as installation costs.
“If I knew that my energy bills were going to drop sufficiently then it wouldn’t bother me at all having to try and fund it from a low interest loan. But I would feel extremely nervous on going that it might. It’s a big jump to take just based on faith.” (Participant, phase 2, workshop 3)
Related to this was an unease around the longevity of the policy, the risk of requirements changing in future, and the cost of this to consumers in future.
“Scottish Government years ago encouraged people to buy diesel cars, and now diesel is dreadful, encouraged to install wood burning stoves and central heating, again now it’s wrong. How many times are the public expected to listen to the government and spend money converting to whatever it is only to be told within a short time that it’s wrong.” (Participant, phase 2, workshop 3)
Appendix 3 – Land use and agriculture sector detailed findings
This chapter discusses participants views on a just transition for land use and agriculture. As with the previous sector-focussed chapters, it describes initial views on changes needed, learning during the workshop, and conclusions in relation to the three questions. Policy options for the land and agriculture sector were not explored as part of phase two of the research, so the findings presented here are in relation to phase one only.
In agreement with ClimateXChange and the Scottish Government, the workshop dedicated to this sector focussed on what the transition to net zero means for food production and consumption. Recognising the scale and complexity of the land and agriculture sector, this topic was chosen as an area in which participants would be able to relate to their everyday lives.
Summary
Participants supported the move towards more climate friendly approach to food, but were concerned the overall fairness of the vision and impact on rural communities.
Participants felt costs should be shared between:
- The Scottish Government
- Farmers
- Other businesses (e.g. supermarkets)
- Consumers
- Landowners
To ensure a fair transition, in which everyone benefits, it was suggested that:
- People’s ability to pay is taken into account, with protection in place for low-income consumers.
- Farms are subsidised, favouring smaller farms with less income. Support payments should be specifically allocated towards covering the costs of reducing carbon emissions.
- Farms should be given sufficient time and opportunity to change and reduce emissions before introducing any financial impacts such as additional tax.
- Ensure that consumers have easier access to sustainable food options.
What changes were expected?
Before the workshop, participants used the online community to discuss the changes they thought would be needed for the land use and agriculture sector to reach net zero.
They anticipated changes to the way we buy and eat food. There was a widespread sense that people should eat more local, seasonal and sustainable produce, with fewer products imported from abroad. Many participants interpreted this as a climate friendly diet. It was also suggested that we may need to reduce meat consumption, especially imported meat. While it was noted that these changes would likely reduce the range of foods available, participants were generally very positive about the environmental and health benefits they could bring. However, some participants felt that it would be difficult for consumers and the wider food industry to adapt to these kinds of changes, and that this could have economic consequences.
“The range of food we have readily available may be reduced. I don’t have a problem with that and feel it is something we should make the best of in terms of reducing food miles and eating found produced as near to home as possible.” (Participant, phase 1, online community)
Changes to farming practices were also anticipated, with a strong focus on farming practices being more “ecologically friendly”. Participants suggested that there may be move towards more organic farming, vertical farming (i.e. growing crops in vertical layers) to make space for rewilding, and regenerative practices (e.g. techniques that preserve and enhance soil quality). It was also suggested that our approach to land management more broadly may need to change, with greater emphasis on tree planting, biodiversity and creation of more carbon sinks.
Participants were generally positive about the types of changes to food production described above, though some felt that food price rises for consumers were inevitable. Others emphasised that farming should be supported to become profitable without passing on costs to consumers. There was therefore support for subsidies for farmers, as food production was considered a “vital” industry, but not for “wealthy landowners”.
Overview of presentations and reactions to them
At the workshop, participants heard two presentations delivered by experts. The first outlined the Scottish Government’s vision for the future of the sector, the types of changes that would be needed to achieve it, and the benefits and challenges associated with reducing emissions in the sector. The second outlined the inequalities within the sector that would need to be addressed as part of the transition to net zero.
Participants were struck by the complexity of the topic and emphasised a need for more public education around food production and consumption. Several participants were unaware that the sector received financial support from the Scottish Government, and were surprised at the extent to which businesses relied on this subsidy (e.g. the presentations had explained that without support payments, many farms would be in deficit). This led to a feeling that many farms were financially vulnerable and in need of ongoing support, which set the context for the later discussions around who should pay.
“Farming is already so heavily subsidised. One can’t imagine it continuing in any shape or form without large subsidies in the future, unless we were to lose the farming industry…I can’t imagine the rug being whipped from the farming industry.” (Participant, phase 1, workshop 4)
There was some surprise at how much food was imported, particularly fruit (the presentation explained that 16% of our fruit was produced domestically). There was also discussion on the average age of farmers, and about the need to encourage young people into the sector.
Some participants stressed the importance of considering wider aspects of land use which they felt impacted efforts to reach net zero. This echoed their initial thoughts on changes needed and included aspects like deer management, shooting estates and carbon credits. These are explored in more detail below.
Vision for the land use and agriculture sector
Participants had a chance to view a future vision for the land use and agriculture sector on the online community and again in the workshop. The vision (shown in figure 11.1) was based on the Scottish Government’s discussion paper for the sector. As well as sharing their own views on the vision, participants revisited the five fictional characters and discussed how it might impact on them.
Figure 11.1: Vision for the land use and agriculture sector

The role of land use and agriculture (particularly food) for our characters
Alice picks things up on her way to and from work. She doesn’t have a lot of time to cook and gets a takeaway or delivery a few times a week. Alice feels that she spends too much on food. She would like to eat more fresh fruit and vegetables and better-quality meat, but these are not easily available in the shops close to her flat.
David and Sarah have a large garden. They buy locally produced food as much as they can, even if it is more expensive. They get their weekly food shop from several places. They have reserved a space at a local community allotment.
Lorraine’s farm specialises in cattle and turkeys. She is planning on making changes to the business to help reduce its emissions. These changes would increase the cost of producing food and the business would not be able to absorb these costs.
Maria gets all her food shopping delivered from the supermarket and has a strict weekly food budget. She choses whichever products are cheaper. She tries to ensure that her daughter eats a healthy diet, but this can be difficult within her budget.
Nadeem and Ajay have a vegan diet. They get their weekly groceries from the supermarket. Buying food that suits their diet is more important to them than where it comes from. Ajay works at a small food shop. If farmers increase their prices, the shop will increase the price it charges consumers.
From the outset, the potentially negative impacts of the vision on rural communities were noted, particularly in relation to the suggestion that less land would be dedicated to food production. There was a sense that crofting land would not be suitable for other uses and so crofters may lose out if they are not able to continue current practices.
“Crofting is environmentally friendly. There’s no fertiliser use, it’s a very natural way of farming and yet that’s the one that’s going to be penalised against much more intensive farming in arable areas. That’s the wrong note to hit, the wrong balance.” (Participant, phase 1, workshop 4)
There was also some resistance to using more land for tree planting. One reason for this was the perception that would reduce the potential for farmers to earn money, as they would be giving up land used for grazing or meat production in favour of forestry. Another reason was in relation to the impacts on communities, with some participants describing how plantations had led to a sense of isolation for their community and a feeling that they were “cut off” as result of being surrounded by trees.
Reflecting their initial thoughts on the changes needed in the sector, there was support for importing less and eating more local and seasonal produce, and for continued support for food producers. However, there was discussion of the difficulty of changing consumer habits, especially in the context of the cost-of-living crisis, and the challenges that some might face in accessing climate friendly food.
Who could benefit?
Under this vision, participants felt that farmers who were able to diversify could benefit if the changes resulted in a more financially sustainable business, provided there was support and advice available to help them do so.
Participants felt that consumers could see health benefits from access to more quality, nutritious produce, and if there was more education on how to cook meals from scratch. It was also felt that communities could in turn see economic benefits from more people shopping locally.
Participants felt that wealthier consumers would find the transition easiest as they could absorb an increase in food prices. Similarly, participants felt that wealthier farmers would be able to afford to make changes to their business. There was also a sense that the scale of change required for businesses in the wider supply chain (e.g. larger supermarkets, retailers and distributers) would be smaller than for food producers directly.
Overall participants recognised that consumers who were already eating a sustainable diet or businesses whose practices were already in line with the vision would find the transition easier as they would need to make fewer changes.
Who benefits?
It was felt that David and Sarah would benefit because their lifestyle choices were already in line with the vision, and they could afford to make further changes or absorb increased costs.
Who could lose out?
Participants highlighted farmers and crofters who specialise in livestock may lose out, as their ability to do so may be restricted if more land is dedicated to forestry. There was a suggestion that the vision would “decimate” these communities in the north of Scotland. It was also felt that, if farmers were growing less food, there may be knock-on impacts on others working in the food sector and potentially job losses.
Participants felt that food price rises were inevitable and therefore that people on low incomes would lose out.
“All the changes will come with a cost. We already have a lot of food banks and people struggling. Those people will be impacted even more than they are now. It’s difficult to tell what would make it fairer. How can we help the poor more than we are helping now with food banks.” (Participant, phase 1, workshop 4)
There was a view that consumers may lose out if they were not able to grow their own food (some participants, especially in urban areas, felt this would be difficult for them to do), or were not able to access sustainable produce.
“Consumers are going to miss out if there are no local food co-ops, food sharing, food communities. Some people are surrounded by takeaways and corner shops. They don’t necessarily have access to local foods because of where they live.” (Participant, phase 1, workshop 4)
Who could lose out?
Lorraine’s livelihood was identified as being at risk given the challenges of diversification and the need to increase prices to cover the cost of making changes. Her age was also noted as a factor in that she may not have time to benefit before she retires.
Alice and Maria were identified as at risk of losing out if prices increase because of their concern about the current cost of groceries. They may also struggle to access local produce; Maria because of her child care requirements, and Alice because of her shift patterns.
Nadeem and Ajay may lose out if a focus on local products means they have less choice in their diet. This could be exacerbated by additional challenges transporting goods to where they live. Ajay’s job might be at risk if the viability of the shop where it works is affected by increased prices.
As we transition to net zero, who should pay for the changes needed in the land use and agriculture sector?
The types of costs that were outlined in the presentations and that participants explored in their discussions included: the costs associated with change the way land is used and food is produced, the costs associated with the wider food supply chain and distribution network, and the costs of food for consumers.
Generally, it was felt that costs should be paid for by a balance between government, industry and consumers. Specific groups that they felt should be responsible for some of the costs of the transition included:
- The Scottish Government. Farming subsidies were described as a “practical necessity” in order to sustain the industry and keep prices affordable. It was therefore felt that some level of subsidies should continue, and that these could help to fund some of the costs associated with the transition. However, it was also suggested that not all farms should be supported to the same extent and that subsidies should vary to reflect the size and financial performance of the farm (outlined further in the next section).
- Farmers. It was felt that farmers should cover some of the costs associated with changes to land use or food production, especially if they would benefit directly from the changes (e.g. if the changes to practices helped with their operational efficiency, helped them to generate income, or added value to their business). However, participants stressed that farmers would unlikely be able to incur significant additional costs without becoming financially unviable. It was therefore felt that, as noted above, ongoing financial support for farmers would be required.
“It will have to be [supported by] the government…I don’t see it being viable without subsidies. Loads of farms will just go out of [business].” (Participant, phase 1, workshop 4)
- Consumers. There was a sense that an increase in food prices for consumers will be “inevitable” and that those who can afford to pay should share some of the costs. With this came a sense that consumer behaviour would also need to change, with more of a focus on eating a climate friendly diet. Some participants supported prices rises to encourage consumer behaviour change. However, there was a sense that consumers have less responsibility for paying for changes than other businesses as they do not have a direct say in the costs.
“We eat like kings, all of us, and we need to come back to [eating] more sustainable things.” (Participant, phase 1, workshop 4)
- Other businesses. While not a common theme, it was suggested that businesses in the wider food supply chain should also share some of the costs. In particular it was felt that large, profit-making businesses such as supermarket chains would be able to afford some of the costs (e.g. for reducing or replacing packaging), rather than farmers and consumers.
“It’s those businesses in the middle that should pay because the consumer and the farmer don’t have the money… commercial businesses who are making big profits, they should make more of a contribution to this process to make this fairer.” (Participants, phase 1, workshop 4)
- Landowners. From the outset, some participants raised issues with the current structure of land ownership in Scotland, with a perception that absentee landowners earn from large shares of land that might otherwise have been used for food production. It was suggested that these landowners should be taxed to help pay for some of the changes need to land use. As previously noted, there were also calls for wider land reform which, for some participants, was seen as inextricably linked to viability of the farming industry.
“One of the biggest factors affecting the viability of Scottish farming is land ownership…the fact that huge swathes of good land are owned by…absentee landlords leaving very little for homegrown farmers.” (Participant, phase 1, online community)
How can we make sure that system of payment fair?
While acknowledging the scale of the challenge, participants showed at least some support for systems of payment based on:
- Ability to pay. Consumers on lower incomes were seen as likely to find any increase in food costs most disruptive and difficult. Echoing findings from the transport and built environment workshops, participants therefore felt that a future system of payment should take into account people’s ability to pay and protect low-income consumers. At the same time there was recognition that placing a greater burden of the costs on wealthier households could discourage them from making good choices which may be counterproductive.
- Subsidising some, but not all, farmers. As noted above, continuation of farming subsidies was considered a fair way of helping the sector to adapt to change. It was suggested that the subsidy system should favour smaller farms with less income (and therefore less ability to pay). It was also suggested that support payments should be specifically allocated towards covering the costs of reducing carbon emissions and making farming practices more sustainable. Recognising that some farms or crofts may already be operating sustainably, there was also a suggestion that a payment system should “penalise neglect”.
“[Financial] support can help the transition but should only be given where additional costs are incurred and not where changes may actually help profitability. This is one area where justice in transition could easily be lost as large farmers, forestry companies and green investors soak up ever larger sums of public money.” (Participant, phase 1, online community)
- Taxing larger businesses. Some participants felt that payments should be covered by larger, profit-making businesses, particularly whose practices are not climate-friendly (e.g. those who import food from overseas). They suggested taxing these businesses, or having a payment system that means these businesses absorb costs rather than passing them on to consumers. At the same time there was recognition that penalising businesses too harshly could force them to leave Scotland which would risk jobs and move carbon emissions elsewhere.
“What about taxing the big business that’s importing things from faraway countries that they could get here? People like Maria [one of the fictional characters used as stimulus for the discussion] don’t really care much about where food is from and how it’s sourced, it’s just about feeding their family.” (Participant, phase 1, workshop 4)
- Taxing high-carbon products. There was some support for a “food miles tax” or other form of high carbon products tax, but only if other more sustainable food options were available and affordable. It was also suggested that a tax on food waste (for supermarkets, not consumers) would help to reduce the amount of food currently wasted. However, some participants felt that it was not fair to base a payment system on emissions as some farms emit more than others depending on their produce.
To make the transition as fair as possible, it was also stressed that farms need to be given sufficient time and opportunity to change, diversify and reduce emissions before introducing any financial impacts such as additional tax.
How can we make sure that everyone benefits?
As well as a reduction in carbon emissions, participants identified a range of potential benefits from the future vision for the sector including: health benefits of eating more locally grown, quality food; physical and mental health benefits for individuals and communities growing their own food; economic benefits of supporting local businesses (though business viability was also seen as a risk); a reduction in food waste; more job opportunities within the land use and agriculture sector; and financial benefits for farmers from diversification.
An overarching message was that financial support was required to ensure that farmers and consumers could benefit from the changes. To make sure everyone benefits, participants also felt that we should:
- Provide people with the opportunity to eat the right kinds of food. It was felt that steps should be taken to ensure that low carbons foods remain affordable for people on low incomes. It was also suggested that more access to individual and community growing spaces and food sharing initiatives may help more people to benefit from these types of food, particularly for those who do not already have access to a garden.
“Consumers are going to miss out if there are no local food co-ops, food sharing, food communities. Some people are surrounded by takeaways and corner shops. They don’t necessarily have access to local foods because of where they live.” (Participant, phase 1, workshop 4)
- Improve communication and engagement with the public. Participants felt that there was need for more awareness-raising about how the food system works, the types of changes that will be necessary, and what types of food are more climate-friendly, and how to make healthy affordable meals. It was stressed that the public need to understand why change is necessary before they can accept those changes. Participants also advocated more community and local government involvement in decision-making about land use.
- Change the system of land ownership to provide more equitable access to land. A few participants felt strongly that widescale change to land ownership was required, so that smaller farms have more opportunity to be profitable and that there were more opportunities for young people to work in the sector.
Appendices A-D: Research materials
Appendix A – Structure of workshops
Phase 1
- The first workshop introduced participants to the process and key concepts. This was followed by three separate workshops on transport, built environment and construction, and land use and agriculture. In these workshops participants learned about key issues associated with the transition in each sector and shared their views, before answering these overarching questions in relation to that sector.
|
Date/time |
Objective |
Session description |
Presentations | |
|
Session 1 – Introduction |
10 August 2023, 6pm to 9pm |
Introduction to the process and aims. Participants learn key concepts. |
Introduction to the process. Participant introductions. Presentations from expert speakers (see right). Small breakout discussions followed by Q&A with speakers. Initial thoughts on a fair transition. |
Introduction to key concepts relating to climate change, just transition, net zero and Scottish Government plans. |
|
Session 2 – Transport Session 3 – Buildings and Construction Session 4 – Land use and agriculture |
15 August 2023, 6pm to 9pm 29 August 2023, 6pm to 9pm 14 September 2023, 6pm to 9pm |
Participants develop an understanding of each sector and form initial thoughts on a fair distribution of costs and benefits for that sector. |
Presentations from expert speakers (see right). Breakout discussion followed by Q&A with speakers. Breakout discussion of future vision in relation to fictional characters. Breakout answers to the overarching questions in relation to the sector. |
Future vision for the sector. Addressing inequalities in the sector |
|
Session 5 |
30 September 2023, 10am to 1pm |
Participants consolidate their views on a fair distribution of costs and benefits and form wider conclusions on cross-cutting elements |
Breakout discussion of future scenarios in relation to fictional characters. Breakout forming conclusions on a fair transition. |
No presentations |
|
Session 6 – Conclusions |
5 October, 2023, 6pm to 9pm |
Participants review, ratify and finalise their conclusions. |
Breakout discussion on answers to the overarching questions. Reflections on the process. Postcard to the future task. |
No presentations |
Phase 2
The first workshop introduced participants to the process and key concepts. This was followed by two workshops, each focussing on a policy area within the transport and built environment sectors. The transport sector session focused on two possible approaches to Road User Charging; UK national road pricing or urban local charging. The built environment sector session focused on two approaches to funding the heat transition in domestic properties; widely available funding (with stricter penalties) or targeted funding (with softer penalties).
|
Date/time |
Objective |
Session description |
Presentations | |
|
Session 1 – Introduction |
6 March 2024, 6.30pm to 8.30pm |
Introduction to the process and aims. Participants learn key concepts. |
Introduction to the process. Participant introductions. Presentations from expert speakers (see right). Small breakout discussions followed by Q&A with speakers. Initial thoughts on a fair transition. |
Introduction to key concepts relating to climate change and the move to net zero; concept of just transition and Just Transition Plans; previous public engagement on just transition. |
|
Session 2 – Transport |
14 March 2024, 6.30pm to 9pm |
Participants learn about Road User Charging (RUC) and discuss how to ensure this is implemented fairly. |
Presentation (see right). Breakout discussion considering two approaches to RUC in relation to fictional characters. Breakout answers to form conclusions on RUC. |
Introduction to RUC. |
|
Session 3 – built environment and construction |
20 March, 6pm – 9pm |
Participants learn about clean heat transition in domestic properties and discuss how to ensure this is funded fairly. |
Presentation (see right). Breakout discussion considering two approaches to funding the clean heat transition in relation to fictional characters. Breakout answers to form conclusions on clean heat transition. |
Introduction to clean heat transition and Heat in Buildings bill. |
Appendix B – Recruitment quotas
Phase 1
The quota targets were based on data from the Scottish Household Survey 2019, unless otherwise stated. Groups that were over-sampled are indicated with asterisk (*).
|
Variable |
% in population |
Target number |
Achieved number | |
|
Age |
16-24 |
11% |
4 |
4 |
|
25-34 |
18% |
6 |
4 | |
|
35-54 |
32% |
11 |
11 | |
|
55+ |
38% |
12 |
11 | |
|
Gender |
Woman |
52% |
17 |
17 |
|
Man |
48% |
16 |
13 | |
|
Non-binary/other |
No clear data |
No target |
0 | |
|
Region of Scotland (source: NRS mid-year population estimates) |
Central |
12% |
4 |
2 |
|
Glasgow |
13% |
4 |
4 | |
|
Highlands and Islands* |
8% |
5 |
5 | |
|
Lothians |
15% |
5 |
5 | |
|
Mid Scotland and Fife |
12% |
4 |
3 | |
|
North East Scotland |
14% |
4 |
4 | |
|
South |
13% |
4 |
3 | |
|
West |
13% |
4 |
4 | |
|
Ethnicity |
African, Caribbean, Black or Black Scottish/British* |
1% |
2 |
0[25] |
|
Asian, Asian Scottish or Asian British* |
3% |
3 |
3 | |
|
White Scottish/Other British/White Other |
96% |
27 |
25 | |
|
Other ethnic group or mixed/multiple ethnic groups* |
0% |
1 |
2 | |
|
Disability |
No long-term physical or mental health condition |
70% |
19 |
16 |
|
Long-term physical or mental health condition which is limiting* |
24% |
10 |
10 | |
|
Long-term physical or mental health condition which is not limiting* |
6% |
4 |
4 | |
|
Household income, per year |
Less than £10,000* |
9% |
4 |
3 |
|
£10,001 – £20,000* |
30% |
11 |
9 | |
|
£20,001 – £30,000 |
21% |
7 |
6 | |
|
£30,001 – £40,000 |
15% |
5 |
4 | |
|
More than £40,001 |
24% |
6 |
8 | |
|
Attitudinal measure (SHS 2019): Which of these statements, if any, comes closest to your own view? |
Climate change is an immediate and urgent problem |
68% |
Aim for mix |
17 |
|
Climate change is more of a problem for the future |
14% |
7 | ||
|
Climate change is not really a problem |
3% |
1 | ||
|
None of these / don’t know |
9% |
5 | ||
|
I’m still not convinced that climate change is happening |
6% |
Excluded[26] |
0 |
Phase two
The quota targets were based on data from the Scottish Household Survey 2019, unless otherwise stated. Groups that were over-sampled are indicated with asterisk (*).
|
Variable |
% in population |
Target number |
Achieved number | |
|
Age |
16-24 |
11% |
2 |
2 |
|
25-34 |
18% |
4 |
4 | |
|
35-54 |
32% |
6 |
7 | |
|
55+ |
38% |
8 |
7 | |
|
Gender |
Woman |
52% |
10 |
10 |
|
Man |
48% |
10 |
10 | |
|
Non-binary/other |
No clear data |
No target |
0 | |
|
Region of Scotland (source: NRS mid-year population estimates) |
Central |
12% |
2 |
2 |
|
Glasgow |
13% |
3 |
3 | |
|
Highlands and Islands |
8% |
2 |
2 | |
|
Lothians |
15% |
3 |
3 | |
|
Mid Scotland and Fife |
12% |
2 |
2 | |
|
North East Scotland |
14% |
3 |
3 | |
|
South |
13% |
3 |
3 | |
|
West |
13% |
2 |
2 | |
|
Urban/rural |
Urban |
83% |
15 |
15 |
|
Rural* |
17% |
5 |
5 | |
|
Ethnicity |
African, Caribbean, Black or Black Scottish/British* |
1% |
2 |
3[27] |
|
Asian, Asian Scottish or Asian British* |
3% |
2 |
2 | |
|
White Scottish/Other British/White Other |
96% |
15 |
14 | |
|
Other ethnic group or mixed/multiple ethnic groups* |
0% |
1 |
1 | |
|
Disability |
No long-term physical or mental health condition |
70% |
12 |
12 |
|
Long-term physical or mental health condition which is limiting* |
24% |
6 |
6 | |
|
Long-term physical or mental health condition which is not limiting* |
6% |
2 |
2 | |
|
Household income, per year |
Less than £10,000* |
9% |
2-3 |
2 |
|
£10,001 – £20,000* |
30% |
6-7 |
7 | |
|
£20,001 – £30,000 |
21% |
4 |
4 | |
|
£30,001 – £40,000 |
15% |
3 |
2 | |
|
More than £40,001 |
24% |
4 |
4 | |
|
Attitudinal measure (SHS 2019): Which of these statements, if any, comes closest to your own view? |
Climate change is an immediate and urgent problem |
68% |
Aim for mix |
17 |
|
Climate change is more of a problem for the future |
14% |
3 | ||
|
Climate change is not really a problem |
3% |
0 | ||
|
None of these / don’t know |
9% |
0 | ||
|
I’m still not convinced that climate change is happening |
6% |
Excluded[28] |
Appendix C – Discussion guides
Phase one, session one
Thursday 10 August 2023, 6pm-8pm
Overarching objective: introduce participants to key concepts and familiarise them with the online discussion format and their role throughout the dialogue. Opportunity for Q&A to develop understanding before moving into focused discussion on each sector in subsequent sessions.

Phase one, session two
Tuesday 15 August 2023, 6pm-9pm. Group of 30 participants, with 5 pre-assigned breakout groups (of 6 participants each).
Overarching objective: Participants develop an understanding of the vision for a transition to net zero in the transport sector and an understanding of the costs, benefits and challenges associated with that transition. Participants provide views on the fair distribution of costs and benefits.

Phase one, session three
29 August 2023, 6pm-9pm. Group of 30 participants, with 5 pre-assigned breakout groups (of 6 participants each).
Overarching objective: Participants develop an understanding of the vision for a transition to net zero in the built environment and construction sectors and an understanding of the costs, benefits and challenges associated with that transition. Participants provide views on the fair distribution of costs and benefits.

Phase one, session four
14 September 2023, 6pm-9pm. Group of 30 participants, with 5 pre-assigned breakout groups (of 6 participants each).
Overarching objective: Participants develop an understanding of the vision for a transition to net zero in the land and agriculture sector (with a particular focus on food production) and an understanding of the costs, benefits and challenges associated with that transition. Participants provide views on the fair distribution of costs and benefits.
|
Discussion structure |
Time allocated |
Objective |
Questions and materials |
|---|---|---|---|
|
Set-up: Facilitators check-in 25 mins |
17.30-17.50 |
Set up and test tech, and team preparation |
Facilitator and tech team only
|
|
Participant check-in 10 mins |
17.50-18.00 |
Ensure participants are supported with set up |
Participants log into the online session
|
|
Introductions and context setting 10 mins |
18.00 – 18.10 |
Re-familiarising participants with the process, settling back in. |
Ipsos Chair to welcome the room back (10 mins): Participants allocated to (new) break-out groups, but not put in them.
As we transition to net zero…
|
|
Move to breakout (18.10) | |||
|
Table introductions 5 mins |
18.10 – 18.15 |
Introducing participants to new group and reflections on previous workshop. |
Break-out group introductions and warm-up FACILITATOR INTRODUCES THEMSELVES AND THE GROUP’S NOTE TAKER, THANKS FOR CONTINUED PARTICIPATION. COLLECTS PERMISSION/CONSENT FOR RECORDING.
|
|
Move to plenary (18.15) | |||
|
Future land and agriculture sector 10 mins |
18.15 – 18.25/30 |
To introduce the types of changes needed and why they are necessary |
CHAIR TO INTRODUCE SPEAKER – ASK PARTICIPANTS TO NOTE DOWN ANY THOUGHTS AND/OR QUESTIONS AS THEY LISTEN, WHICH WE WILL RETURN TO LATER Plenary presentation: Vision for a future land use and agriculture (Scotland’s Rural College) Presentation to help participants understand the land and agriculture sector, the changes that are likely to be needed, and how this impacts on food. Covering:
|
|
How different groups might be impacted by the transition 10 mins 5 minute buffer built in |
18.25/30 – 18.40 |
To help participants understand potential inequalities, that the just transition hopes to address |
CHAIR TO GIVE PARTICIPANTS A MINUTE TO REFLECT ON PRESENTATION 1 AND WRITE DOWN ANY BURNING THOUGHTS/QUESTIONS BEFORE INTRODUCING SPEAKER. Plenary presentation: Impacts of the transition on different groups (Climate Change Committee). To help participants to understand the impacts of the transition, covering:
|
|
Move to breakouts (18.40) | |||
|
Future land and agriculture sector -discussion 25 mins |
18.40 – 19.05 |
Initial views on future costs and their fairness. Opportunity to clarify any points from presentation |
We have the opportunity now to reflect on that presentation and to ask questions.
FACILITATOR TO PREPARE TOP QUESTION (WITH TWO BACK-UP). ENCOURAGE VOLUNTEERS TO ASK QUESTIONS ON BEHALF OF GROUP. |
|
BREAK |
19.05 – 19.15 |
BREAK |
Break (10 mins) Chair to present screen advising on time to return from break. TECH TEAM KEEP BREAK OUTS OPEN UNTIL END OF THE BREAK. |
|
Move to plenary (19.15) | |||
|
Q&A 20 mins |
19.15 – 19.35 |
Q&A |
Q&A in panel-style, with both presenters. CHAIR TO FACILITATE Q&A SESSION, WITH FACILITATORS ASKING THE QUESTIONS FROM THEIR BREAK-OUT GROUP OR CALLING ON PARTICIPANTS TO. |
|
Move to breakouts (19.35) | |||
|
Deliberation on key issues 30 mins |
19.35 – 20.05 |
Deliberation on key issues – changes required, impact on different groups, and how that could be made more fair |
[10 MINS] We’re now going to look at a Vision for 2040, which describes a future land use and agriculture sector. This Vision is based on the changes that the Scottish Government believes are necessary if we are to reach net zero, and some of these have been mentioned already by [the speakers]. FACILITATOR SHOWS THE SLIDE WITH THE “VISION FOR LAND USE AND AGRICULTURE IN 2040” AND READS THROUGH. REMIND PARTICIPANTS THAT THE SCENARIO IS BASED ON A VISION FOR SCOTLAND’S FUTURE LAND AND AGRICULTURE SYSTEM, PARTICULARLY HOW THAT IMPACTS ON FOOD.
[20 MINS]
SEE SLIDES LABELLED – “CHARACTERS – LAND USE AND AGRICULTURE”. SHOW THESE ON SCREEN. AIM TO COVER 2 CHARACTERS IF THERE IS TIME.
|
|
BREAK |
20.05 – 20.15 |
BREAK |
Break (10 mins) Facilitator to advice their group on the return time (back into plenary). |
|
Deliberation on key issues 30 minutes |
20.15-20.45 |
Deliberation on key issues – specific costs areas and how they should be shared fairly |
DURING THESE FINAL DISCUSSIONS ENCOURAGE PARTICIPANTS TO REFLECT ON THEIR OWN CIRCUMSTANCES, THOSE OF THE OTHER PARTICIPANTS IN THEIR GROUP, AND THE TYPES OF PEOPLE THEY DISCUSSED IN THE PREVIOUS EXERCISE. We are going to use this final discussion to bring together everything we have been discussing so far. We will do this in the same way we did in the previous session. Remember, for tonight, we’re focussing only on the changes that will be needed in the land and agriculture sector.
IF NOT COVERED ABOVE: Should the system of payment be based on:
|
|
Move to plenary (20.45) | |||
|
Feedback in plenary |
20.45-20.55 |
Participants hear from each other |
Each facilitator to give a recap on the key themes coming out of their breakout discussions – focussing on the key themes of how we share costs and benefits fairly. |
|
Close 5 mins |
20.55-21.00 |
Close |
Chair to close the day:
Thank participants and close |
Phase one, session five
30 September 2023, 10am – 1pm. Group of 30 participants, with 5 pre-assigned breakout groups (of 6 participants each).
Overarching objective: Participants consolidate their views on the costs, benefits and challenges associated with the transition and form wider conclusions on the cross-cutting elements relating to a just transition (i.e. fairness). Findings from this session will feed into the final concluding session.
|
Discussion structure |
Time allocated |
Objective |
Questions and materials |
|---|---|---|---|
|
Set-up: Facilitators check-in 25 mins |
09.30-09.50 |
Set up and test tech, and team preparation |
Facilitator and tech team only
|
|
Participant check-in 10 mins |
09.50-10.00 |
Ensure participants are supported with set up |
Participants log into the online session
|
|
Introductions and context setting 10 mins |
10.00 – 10.10 |
Re-familiarising participants with the process, settling back in. |
Ipsos Chair to welcome the room back (10 mins): Participants allocated to (new) break-out groups, but not put in them.
|
|
Move to breakout (10.10) | |||
|
Table introductions 15 mins |
10.10 – 10.25 |
Introducing participants to new group and initial discussions around fairness. |
Break-out group introductions and warm-up FACILITATOR INTRODUCES THEMSELVES AND THE GROUP’S NOTE TAKER, THANKS FOR CONTINUED PARTICIPATION. COLLECTS PERMISSION/CONSENT FOR RECORDING.
ALLOW PARTICIPANTS A MINUTE TO REFLECT ON THAT QUESTION, AND NOTE DOWN THEIR THOUGHTS ON A PIECE OF PAPER BEFORE ASKING THEM TO SHARE.
|
|
Move to plenary (10.25) | |||
|
Introduce future scenarios 10 mins |
10.25 – 10.35 |
To introduce the future scenarios |
Plenary presentation: Future scenarios (Ipsos chair) The chair will talk everyone through the future scenarios and provide a brief explanation of the plan for the remainder of the session (emphasising that it is largely over to them now to deliberate, with the help of Ipsos facilitators). An overview of the scenarios are:
Chair will explain that the scenarios are based on the sorts of changes we have been discussing in the sector sessions, and the different ways in which these changes might be brought about. The chair will emphasise that these are all things that are being considered or are already being done around the world, and are options that could be considered in Scotland. The chair will remind participants that the task is not to focus so much on how likely or desirable the changes are in Scotland, but how we make sure the costs and benefits of these changes are distributed fairly IF they were to happen. Will also emphasise that the aim is not for participants to choose the “best” scenario or decide which once should be implemented – we are using these as a way of helping participants to think differently about the three big questions we are trying to answer. |
|
Move to breakouts (10.35) | |||
|
Future scenarios – part 1 discussion 40 mins |
10.35 – 11.15 |
Exploring first scenario in detail |
SCENARIOS SUMMARY. EACH FACILITATOR TO FORCUS ON TWO SCENARIOS, BUT WITH THE OPTION TO COVER THE OTHERS WITH ANY REMAINING TIME: FACILITATORS TAKE ASSIGNED SCENARIO FOR FIRST BREAKOUT: FACILITATOR SHARE SCREEN AND GO TO FIRST SCENARIO IN MIRO, USING DIGITAL POST-ITS TO RECORD CROSS-CUTTING THOUGHTS / EMERGING CONCLUSIONS THAT ARISE DURING DISCUSSION, PLAYING THESE BACK TO PARTICIPANTS. The first scenario we are going to look at is [read title]. We’ll read through it together and then have a discussion about it. FACILITATOR READ THROUGH SCENARIO AND ALLOW TIME FOR PARTICIPANTS TO REFLECT/NOTE THINGS DOWN. Initial reactions to scenario (10 mins)
Scenario + individual impacts (15 mins) Let’s now think about this scenario in terms of your own live, if you are comfortable sharing.
Scenario + character impacts (15 mins) Now let’s look at this scenario in relation to our characters. FACILITATOR MOVE ALONG ON MIRO BOARD TO CHARACTER SUMMARY CARDS AND READ THROUGH THESE, THEN MOVE ALONG TO SCENARIO AND CHARACTERS SHOWN TOGETHER WITH ICONS. FACILITATOR REFER TO EACH BOX IN SCENARIO AND ASK:
PLACE GREEN CHARACTER ICONS ON PARTS OF SCENARIO WHERE PARTICIPANTS THINK THEY WILL BENEFIT. PLACE RED CHARACTER ICONS ON PARTS OF SCENARIO WHERE PARTICIPANTS THINK THEY WILL LOSE OUT.
LET PARTICIPANTS KNOW THAT THEY MIGHT NOT THINK ANY OF THE CHARACTERS SHOULD PAY, AND THEY CAN ADD GROUPS THAT THEY THINK SHOULD PAY USING POST-ITS (E.G. GOVERNMENT, BUSINESS, OTHER GROUPS OF PEOPLE).
|
|
Stay in breakouts (11.15) | |||
|
BREAK |
11.15 – 11.25 |
BREAK |
Facilitator sends own group on break and advises on return time (ensuring everyone gets at least 10 minutes) |
|
Stay in breakouts (11.25) | |||
|
Future scenarios – part 2 discussion 40 mins |
11.25 – 12.05 |
Exploring second scenario in detail |
SCENARIOS SUMMARY. EACH FACILITATOR TO FORCUS ON TWO SCENARIOS, BUT WITH THE OPTION TO COVER THE OTHERS WITH ANY REMAINING TIME: FACILITATORS TAKE ASSIGNED SCENARIO FOR SECOND BREAKOUT: FACILITATOR TO USE DIGITAL POST-ITS TO RECORD CROSS-CUTTING THEMES THAT EMERGE DURING DISCUSSION, PLAYING THESE BACK TO PARTICIPANTS. The first scenario we are going to look at is [read title]. We’ll read through it together and then have a discussion about it. FACILITATOR READ THROUGH SCENARIO AND ALLOW TIME FOR PARTICIPANTS TO REFLECT/NOTE THINGS DOWN. Initial reactions to scenario (10 mins)
Scenario + individual impacts (15 mins) Let’s now think about this scenario in terms of your own lives, if you are comfortable sharing.
Scenario + character impacts (15 mins) Now let’s look at this scenario in relation to our characters. FACILITATOR MOVE ALONG ON MIRO BOARD TO CHARACTER SUMMARY CARDS AND READ THROUGH THESE, THEN MOVE ALONG TO SCENARIO AND CHARACTERS SHOWN TOGETHER WITH ICONS. FACILITATOR REFER TO EACH BOX IN SCENARIO AND ASK:
PLACE GREEN CHARACTER ICONS ON PARTS OF SCENARIO WHERE PARTICIPANTS THINK THEY WILL BENEFIT. PLACE RED CHARACTER ICONS ON PARTS OF SCENARIO WHERE PARTICIPANTS THINK THEY WILL LOSE OUT.
LET PARTICIPANTS KNOW THAT THEY MIGHT NOT THINK ANY OF THE CHARACTERS SHOULD PAY, AND THEY CAN ADD GROUPS THAT THEY THINK SHOULD PAY USING POST-ITS (E.G. GOVERNMENT, BUSINESS, OTHER GROUPS OF PEOPLE).
|
|
Stay in breakouts (12.05) | |||
|
BREAK 10 mins |
12.05 – 12.15 |
BREAK |
Facilitator sends group on break. Halfway through break, tech support to close breakouts and bring everyone back to plenary. |
|
Move to plenary (12.15) | |||
|
Feedback |
12.15 – 12.25 |
Participants hear from others |
Chair invites facilitator to feedback on group discussions, briefly summarising scenarios explored and what the group’s conclusions were around how fair/unfair they are and what would need to be in place to ensure fairness. |
|
Move to breakouts (12.25) | |||
|
Emerging conclusions |
12.25 – 12.55 |
Emerging conclusions captured (preparing for final session) |
Reflections on feedback (5 mins) Before we get into our final task, I just want to get your thoughts on what the other groups have been discussing:
Forming conclusions (20-25 mins) We’re now going to revisit the discussion we had earlier about what fairness means, to help us start forming conclusions around how we ensure the costs and benefits of the transition to net zero – in each of the sectors we’ve been looking at – are fair. FACILITATOR SHARE DIGITAL WHITEBOARD AND READ OUT POST-ITS THAT WERE WRITTEN AT THE START. THEN BRING IN POST-ITS THAT HAVE BEEN WRITTEN OVER THE COURSE OF THE SESSION. Our final task is to start to tidy these up into conclusions, i.e. what we think the Scottish Government should consider as they draft the Just Transition Plans for each sector.
Revisit S1 Jamboard (5 mins) IF TIME, FACILITATOR SHOW JAMBOARD FROM SESSION 1 SHOWING INITIAL THOUGHTS ON WHAT A FAIR TRANSITION TO NET ZERO MEANS.
|
|
Move to plenary | |||
|
Close 5 mins |
12.55-13.00 |
Close |
Chair to close the day:
Thank participants and close |
Phase one, session six
5 October 2023, 6-9pm. Group of 30 participants, with 5 pre-assigned breakout groups (of 6 participants each).
Overarching objective: Participants review, ratify and finalise their conclusions.
|
Discussion structure |
Time allocated |
Objective |
Questions and materials |
|---|---|---|---|
|
Set-up: Facilitators check-in 25 mins |
17.30-17.50 |
Set up and test tech, and team preparation |
Facilitator and tech team only
|
|
Participant check-in 10 mins |
17.50-18.00 |
Ensure participants are supported with set up |
Participants log into the online session
|
|
Introductions and context setting 15 mins |
18.00 – 18.15 |
Re-familiarising participants with the process, settling back in. |
Ipsos Chair to welcome the room back (15 mins): Participants allocated to (new) break-out groups, but not put in them.
|
|
Move to breakout (18.15) | |||
|
Table introductions and ratifying conclusions on Q1 20 mins |
18.15 – 18.35 |
Introducing participants to new group and ratifying conclusions on Q1 |
Break-out group introductions and warm-up FACILITATOR INTRODUCES THEMSELVES AND THE GROUP’S NOTE TAKER, THANKS FOR CONTINUED PARTICIPATION. COLLECTS PERMISSION/CONSENT FOR RECORDING.
As the chair said, we’re going to spend most of this workshop finalising our conclusions on each of the overarching questions. As we do this, we’ll think about each of the sectors too. FACILITATOR SHARE SCREEN WITH DRAFT RESPONSES TO FIRST QUESTION: As we transition to net zero, who should pay for the changes that will be needed? This is a summary of responses that we have pulled together based on what you’ve said in previous sessions. These conclusions should be in your words, so I’m going to ask what (if anything) you’d like to change, add or take away to make sure it reflects what you think, based on what you’ve heard throughout this process. If we don’t agree on anything, that’s absolutely okay, we will discuss it as a group if that’s the case FACILITATOR TO CONTINUALLY CHECK WHETHER THERE IS AGREEMENT ON ANY CHANGES OR IF THERE ARE DIFFERENT VIEWS. IF THERE IS DISAGREEMENT, CAPTURE DIFFERENT VERSIONS TO REFLECT DIFFERENT PERSPECTIVES.
|
|
Move to plenary (18.35) | |||
|
Feedback on Q1 10 mins |
18.35 – 18.45 |
Feedback on Q1 |
Chair invites each facilitator to share screen and summarise the group’s changes / reasoning. |
|
Move to breakout (18.45) | |||
|
Reflections on Q1 edits and ratifying conclusions on Q2 10 mins |
18.45 – 18.55 |
Reflections on Q1 edits and ratifying conclusions on Q2 |
Reflecting on other edits (10 mins)
IF NEEDED, FACILITATOR TO REITERATE CHAIR’S REMARKS ABOUT HOW THE FINAL CONCLUSIONS WILL BE PRESENTED IN THE REPORT (I.E. THEY WILL REFLECT THE GROUP’S EDITS BUT ALSO THE RANGE OF VIEWS AROUND THEM, SO IT’S IMPORTANT TO HEAR FROM ANYONE WHO DISAGREES WITH PARTICULAR WORDING SO THAT WE CAN EXPLAIN THIS IN THE REPORT).
|
|
Ratifying conclusions on Q2 20 mins |
18.55- 19.15 |
Ratifying conclusions on Q2 |
FACILITATOR SHARE SCREEN WITH DRAFT RESPONSES TO SECOND QUESTION: How can we make that system of payment is fair? Moving onto question 2, this is a summary of responses that we have pulled together based on what you’ve said in previous sessions. FACILITATOR TO CONTINUALLY CHECK WHETHER THERE IS AGREEMENT ON ANY CHANGES OR IF THERE ARE DIFFERENT VIEWS. IF THERE IS DISAGREEMENT, CAPTURE DIFFERENT VERSIONS TO REFLECT DIFFERENT PERSPECTIVES.
|
|
Stay in breakouts (19.15) | |||
|
BREAK 10 mins |
19.15 – 19.30 |
BREAK |
Facilitator to advise on time to return from break |
|
Move to plenary (19.30) | |||
|
Feedback on Q2 10 mins |
19.30 – 19.40 |
Feedback on Q2 |
Chair invites each facilitator to share screen and summarise the group’s changes / reasoning. Chair introduces poll and asks participants to answer this question again: “Who do you think should take the lead in tackling climate change in Scotland?
Chair closes poll but results not shown. Chair explains that they will be presented again later. |
|
Move to breakouts (19.40) | |||
|
Reflections on Q2 edits 10 mins |
19.40 – 19.50 |
Reflections on Q2 edits |
IF NEEDED, FACILITATOR TO REITERATE CHAIR’S REMARKS ABOUT HOW THE FINAL CONCLUSIONS WILL BE PRESENTED IN THE REPORT (I.E. THEY WILL REFLECT THE GROUP’S EDITS BUT ALSO THE RANGE OF VIEWS AROUND THEM, SO IT’S IMPORTANT TO HEAR FROM ANYONE WHO DISAGREES WITH PARTICULAR WORDING SO THAT WE CAN EXPLAIN THIS IN THE REPORT).
|
|
Stay in breakouts (19.55) | |||
|
Ratifying conclusions on Q3 20 mins |
19-50-20.10 |
Ratifying conclusions on Q3 |
FACILITATOR SHARE SCREEN WITH DRAFT RESPONSES TO THIRD QUESTION: How can we make sure that everyone benefits? Moving onto our final question, this is a summary of responses that we have pulled together based on what you’ve said in previous sessions. FACILITATOR TO CONTINUALLY CHECK WHETHER THERE IS AGREEMENT ON ANY CHANGES OR IF THERE ARE DIFFERENT VIEWS. IF THERE IS DISAGREEMENT, CAPTURE DIFFERENT VERSIONS TO REFLECT DIFFERENT PERSPECTIVES.
|
|
Move to plenary (20.10) | |||
|
Feedback on Q3 edits and poll 10 mins |
20.10 – 20.20 |
Feedback on Q3 edits and poll |
Chair invites each facilitator to share screen and summarise the group’s changes / reasoning. Chair presents slide showing S1/S6 poll and comments on results/any shifts. Introduces final breakout. |
|
Move to breakouts (20.20) | |||
|
Reflections on Q3 edits, poll results and projective exercise 10-15 mins (Facilitators to judge length based on how much they say in the reflections section) |
20.20 – 20.30-35 |
Participants hear from others |
Reflections on Q3 edits (5-10 mins)
Poll results and reflections on process (5-10 mins)
IF ANY TIME REMAINING: Before we finish, I’d be interested in hearing your reflections on this process overall.
|
|
Move to plenary (20.30/35) | |||
|
Close |
20.30/35 – 20.40/45 |
Thank participants |
Chair to thank participants for their efforts over the 6 sessions, explain next steps including final online community activity (see below*), and reporting. Ipsos to thank participants and close the session. Final activity for the online community On the online community, we will ask you to write a postcard to yourself as if you were in the year 2040. Imagine you are writing back to yourself in the current moment – in 2023 – about the changes that have been made in Scotland: what has it meant for how you travel around in 2040? The house you live in? The food you eat? And how you feel about these changes? |
Phase two, session one
Wednesday 6 March 2024, 6.30pm-8.30pm
Overarching objective: introduce participants to key concepts and familiarise them with the online discussion format and their role throughout the dialogue. Opportunity for Q&A to develop understanding before moving into focused discussion on each sector in subsequent sessions.
|
Discussion structure |
Time |
Objective |
Questions and materials |
|---|---|---|---|
|
Set-up: Facilitators check-in 20 mins |
18.00-18.20 |
Set up and test tech, and team preparation |
Facilitator and tech team only
|
|
Participant check-in 10 mins |
18.20-18.30 |
Ensure participants are supported with set up |
Participants log into the online session
|
|
Introductions and context setting 10 mins |
18.30 – 18.40 |
Welcome and introduction of process |
Ipsos Chair to welcome everyone to the dialogue (10 mins): Participants allocated to break-out groups, but not put in them.
To explore the public’s views on how the changes in the transport and the built environment sectors are done fairly to ensure a just transition to net zero.
|
|
Move to breakout (18.40) | |||
|
Table introductions |
18.40 – 18.50 |
Introducing participants to group, gathering initial thoughts and feelings. |
Break-out group introductions (10 mins)
|
|
Move to plenary (18.50) | |||
|
Presentation on climate change and the move to net zero 10 mins |
18.50 – 19.00 |
Introduction to key issues around climate change and the transition to net zero |
Plenary presentation 1 (10 mins): Climate change and the move to net zero. CXC BEFORE PRESENTATION STARTS – CHAIR TO ASK PARTICIPANTS TO WRITE DOWN ON (ON A PIECE OF PAPER, OR ON THEIR PHONE) ANY THOUGHTS OR QUESTIONS WHICH THEY WILL HAVE THE OPPORTUNITY TO SHARE LATER ON. Presentation to help participants understand the key concepts relating to climate change, net zero and to outline the SG’s plans generally:
|
|
Stay in plenary (19.00) | |||
|
Presentation on just transition 10 mins |
19.00 – 19.15 5 minute buffer built in here to allow for intros/ crossover |
Introduction to just transition |
Plenary presentation 2 (10 mins): Just Transition and JTPs. Scottish Government BEFORE PRESENTATION STARTS – CHAIR TO ASK PARTICIPANTS TO WRITE DOWN ON (ON A PIECE OF PAPER, OR ON THEIR PHONE) ANY THOUGHTS OR QUESTIONS WHICH THEY WILL HAVE THE OPPORTUNITY TO SHARE LATER ON. Presentation to help participants understand the concept of just transition:
|
|
BREAK (19.15) | |||
|
Chair displays break time on screen and encourages participants to take a screen break 19.15-19.25 (10 mins) | |||
|
Return to plenary (19.25) | |||
|
Presentation on public engagement so far |
19.25 – 19.35 |
Overview of the range of public engagement already carried out |
Plenary presentation 3 (10 mins): Findings from public engagement so far. Chair, Ipsos Scotland BEFORE PRESENTATION STARTS – CHAIR TO ASK PARTICIPANTS TO WRITE DOWN ON (ON A PIECE OF PAPER, OR ON THEIR PHONE) ANY THOUGHTS OR QUESTIONS WHICH THEY WILL HAVE THE OPPORTUNITY TO SHARE LATER ON. Provide an overview of what public engagement has happened so far, and what it’s told us:
|
|
Move to breakouts (19.35) | |||
|
Reflections and question forming 25 mins |
19.35 – 20.00 |
Reflect on presentations and gather questions |
Reflections on presentations (15 mins): FACILITATOR REMIND PARTICIPANTS THAT THE PRESENTATIONS HAVE BEEN RECORDED AND WILL BE MADE AVAILABLE TO WATCH BACK AT ANY TIME. AIM FOR ABOUT 5 MINS OF DISCUSSION PER PRESENTATION. ORDER FOR GROUPS 1-2: CXC, SG, IPSOS ORDER FOR GROUP 3: IPSOS, SG, CXC
Question gathering (5 mins):
GATHER QUESTIONS FROM ANY PART OF THE SESSION AND ASK GROUP TO PRIORITISE 2-3 FOR Q&A (REASSURE THAT OTHER QUESTIONS WILL BE PUT TO SPEAKERS AFTER SESSION AND WRITTEN RESPONSES PROVIDED OVER EMAIL OR RECAPPED IN NEXT SESSION). |
|
Move to plenary (20.00) | |||
|
Q&A 20 mins |
20.00 – 20.20 |
Q&A with experts |
CHAIR TO CALL ON FACILITATORS IN TURN TO ASK QUESTIONS AND DIRECT TO RELEVANT EXPERTS |
|
Stay in plenary (20.20) | |||
|
Final reflections and wrap up 10 mins |
20.20 – 20.30 |
Final reflections and exercise |
Chair to thank experts and participants for taking part in the discussion and introduce final plenary exercise ( 5 mins) On screen, you’ll see a sentence and all we want you to do is complete this sentence in your own words based on what you’ve heard tonight. There is a character limit so try and keep it short and snappy! To me, a just transition to net zero means… Chair to comment on results before closing the session (5 mins):
|
Phase two, session two
Thursday 15 March 2024, 6.30pm-9pm
Overarching objective: To introduce potential changes to our transport system including road user charges, and to test views on different approaches to this in terms of their fairness.
|
Discussion |
Time |
Objective |
Questions and materials |
|---|---|---|---|
|
Set-up: Facilitators check-in 20 mins |
18.00-18.20 |
Set up and test tech, and team preparation |
Facilitator and tech team only
|
|
Participant check-in 10 mins |
18.20-18.30 |
Ensure participants are supported with set up |
Participants log into the online session
|
|
Introductions and context setting 10 mins |
18.30 – 18.40 |
Welcome and introduction to this session |
Ipsos Chair to welcome everyone Participants allocated to break-out groups, but not put in them.
|
|
Move to breakout (18.40) | |||
|
Role of transport in your life 15 mins |
18.40 – 18.55 |
Introducing participants to group, understanding their current transport behaviour |
Break-out group introductions and warm-up FACILITATOR INTRODUCES THEMSELVES AND THE GROUP’S NOTE TAKER, THANKS FOR CONTINUED PARTICIPATION. COLLECTS PERMISSION/CONSENT FOR RECORDING.
|
|
Move to plenary (18.55) | |||
|
Presentation on road user charging 10 mins |
18.55 – 19.05 |
Help participants understand why charging is necessary |
Plenary presentation: How can we reduce our reliance on cars? Presentation to help participants understand why we are focussing on actions related to road users and to introduce road user charging. Coverage of presentation:
|
|
Move to breakout (19.05) | |||
|
Discussion on road user charging 15 mins |
19.05 – 19.20 |
To understand overall views on charging and to set up key considerations for the discussion on specific policies. |
We have the opportunity now to reflect on and discuss your views on what you heard. We are going to look at some specific examples of road user charging later, so that we can discuss how it might work. But first…
NOTE – IF PARTICIPANTS RAISE CONCERNS ABOUT 20 MIN NEIGHBOURHOODS, OR HAVE THE IMPRESSION THAT THEY MEAN RESTRICTING WHERE WE CAN DRIVE, YOU CAN SAY: “The idea behind 20 minute neighbourhoods is to create thriving, positive places and tackle inequalities by improving access to local facilities. It is not about restricting movement or ability to travel, but is based on better provision of local services and amenities that reduce the need to travel. The idea is flexible and should be adapted to support local needs and context, and effective community engagement is a key part of it.” |
|
BREAK 19.20-19.30 (10 mins) | |||
|
Return to breakouts (19.30) | |||
|
Reviewing different charging approaches 45 mins |
19.30 – 20.15 |
To test the acceptability and fairness of policy options |
We are now going to look at how road user charging might be applied in Scotland. The Scottish Government is currently exploring options for how car demand management could be applied in future. It has carried out research exploring how different options could work, and is reviewing the existing powers that local authorities have to ensure these are fit for purpose in the future. As part of these considerations we are now interested in your views on road user charging options, including what they might mean for you and your household, and for other people across Scotland. There are two potential approaches that we are going to look at. These are based on approaches that have happened elsewhere. I am going to show you each option on screen, and after each one we will have a discussion about it. As you will see, these are fairly brief descriptions and are not shown as fully formed ideas. That is because we want to open up discussion about how approaches like these might work, how fair they feel, and what else you think should be considered. These workshops are part of the process of developing these policies, so we do invite questions and even challenge about these. ORDER OF THE OPTIONS TO BE ROTATED BETWEEN GROUPS FACILITATOR TO HAVE SLIDES THAT HAVE MOCKED-UP DESCRIPTIONS OF THE TWO OPTIONS, INCLUDING THE FOLLOWING INFORMATION: Option 1: UK National road pricing.
NOTE: If asked about how this apples to SG, explain that “The Scottish Government would be involved in discussions about future systems, and would use any evidence (such as what this group tells us) to continue to press the UK Government for a fair and progressive future transport finance system.” Option 2: Urban local road user charging.
AFTER EACH OPTION, ASK THE FOLLOWING:
CHARACTERS AFTER GOING THROUGH EACH OPTION, FACILITATOR INTRODUCES THE CHARACTERS
SHOW CHARECTORS ON SCREEN, ONE BY ONE, EACH GROUP COVERING 1-2 CHARACTERS. ORDER:
|
|
Move to breakouts (20.25) | |||
|
Conclusion-forming 25 mins |
20.25-20.50 |
To bring everything together and form conclusions |
We are going to use this final discussion to bring together everything we have been discussing so far. Working together, I’d like you answer this question: “If road user charging is introduced, what needs to be in place to make it fair?” REMIND PARTICIPANTS THAT IN THIS FINAL SECTION WE ARE TALKING ABOUT ROAD USERS CHARGING IN GENERAL, NOT ONE OF THE SPECIFIC OPTIONS ABOVE (BUT THEY CAN REFER TO THOSE IF THEY LIKE). ASK PARTICIPANTS TO COME UP WITH THREE STATEMENTS IN RESPONSE TO THIS OVERARCHING QUESTIONS. PARTICIPANTS START BY CALLING OUT THEIR RESPONSES, WHICH ARE NOTED DOWN ON VIRTUAL POST ITS. THEY THEN DISCUSS / RANK THE 3 THAT THEY FEEL ARE MOST IMPORTANT. FACILITATOR HAS THESE 3 STATEMENTS WRITTEN UP (ON THE MIRO BOARD, OR ON 3 BULLET POINTS ON A SLIDE), READY TO FEEDBACK IN PLENARY. |
|
Move to plenary (20.50) | |||
|
Feedback and wrap up 10 mins |
20.50 – 21.00 |
Final reflections and exercise |
CHAIR THANKS EVERYONE INVITES FEEDBACK FROM EACH OF THE THREE GROUPS, CONCENTRATING ON THEIR 3 CONCLUDING STATEMENTS THEY CREATED. BRIEF RECAP ON NEXT STEPS, THANK AND CLOSE. |
Phase two, session three
Wednesday 20 March 2024, 6pm-9pm
Overarching objective: To introduce changes required to transition to clean heating in homes, and to test views on different financing approaches to this in terms of their fairness.
|
Discussion |
Time |
Objective |
Questions and materials |
|---|---|---|---|
|
Set-up: Facilitators check-in 20 mins |
17.30-17.50 |
Set up and test tech, and team preparation |
Facilitator and tech team only
|
|
Participant check-in 10 mins |
17.50-18.00 |
Ensure participants are supported with set up |
Participants log into the online session
|
|
Introductions and context setting 10 mins |
18.00 – 18.10 |
Welcome and introduction to this session |
Ipsos Chair to welcome everyone Participants allocated to break-out groups, but not put in them.
Thinking about the energy efficiency of your home, which of these statements – if any – comes closest to your own view or experience?
If you were considering making changes to the energy efficiency of your home over the next decade, which of these – if any – would be the biggest factor in your decision to go ahead or not?
|
|
Move to breakout (18.10) | |||
|
Role of transport in your life 15 mins |
18.10 – 18.25 |
Introducing participants to group, understanding their current transport behaviour |
Break-out group introductions and warm-up FACILITATOR INTRODUCES THEMSELVES AND THE GROUP’S NOTE TAKER, THANKS FOR CONTINUED PARTICIPATION. COLLECTS PERMISSION/CONSENT FOR RECORDING.
|
|
Move to plenary (18.25) | |||
|
Presentation on energy transition in homes 10 mins |
18.25 – 18.35 |
Help participants understand why heat transition is necessary and options for financing it |
Plenary presentation: How can we fairly transition our homes to clean energy? Presentation to help participants understand why we are focussing on heat transition in homes and different approaches to paying for this. Coverage of presentation:
|
|
Move to breakout (18.35) | |||
|
Discussion on clean heating 20 mins |
18.35 – 18.55 |
To understand overall views on charging and to set up key considerations for the discussion on specific policies. |
We have the opportunity now to reflect on and discuss your views on what you heard. We are going to look at some specific approaches for making these changes later, so that we can discuss how it might work. But first…
|
|
BREAK 18.55-19.05 (10 mins) | |||
|
Return to breakouts (19.05) | |||
|
Reviewing different financing approaches to heat transition 55 mins |
19.05 – 20.00 |
To test the acceptability and fairness of policy options |
We are now going to look at how the transition to more energy efficient homes could be achieved in Scotland. The Scottish Government is currently exploring options for how the transition to clean heating and more energy efficient homes can be financed, recognising that it will be unaffordable to finance this through public funding alone. The Scottish Government is considering how best to make use of the public and private funding options available. As part of these considerations we are now interested in your views on approaches to paying for these changes to homes, including what different payment options might mean for you and your household, and for other people across Scotland, as well as the timescales for making changes. There are two potential approaches that we are going to look at. I am going to show you each option on screen, and after each one we will have a discussion about it. ORDER OF THE OPTIONS TO BE ROTATED BETWEEN GROUPS FACILITATOR TO HAVE SLIDES THAT HAVE MOCKED-UP DESCRIPTIONS OF THE TWO OPTIONS, INCLUDING THE FOLLOWING INFORMATION: Option 1: More widely available public financing, stricter penalties (approx. 20 mins)
*If asked about the EPC rating, facilitators to read out: An Energy Performance Certificate (EPC) gives a property an energy efficiency rating from A (most efficient) to G (least efficient) and is valid for 10 years. *If asked about penalties, facilitators to read out: For landlords, civil penalties might include a fine for not responding to a compliance notice, and the landlord may not be able to let the property after 2028 if the required energy efficiency rating isn’t met by then, For homeowners, civil penalties could include a fine if the property does not meet required energy efficiency rating by 2033. Option 1 discussion:
Option 2: More targeted public financing, softer penalties (approx. 20 mins)
*If asked about the EPC rating, facilitators to read this out: An Energy Performance Certificate (EPC) gives a property an energy efficiency rating from A (most efficient) to G (least efficient) and is valid for 10 years. *If asked about penalties, facilitators to read out: For landlords, civil penalties might include a fine for not responding to a compliance notice, and the landlord may not be able to let the property after 2028 if the required energy efficiency rating isn’t met by then. Option 2 discussion:
CHARACTERS (approx. 15 mins) AFTER GOING THROUGH EACH OPTION, FACILITATOR INTRODUCES THE CHARACTERS
SHOW CHARECTORS ON SCREEN, ONE BY ONE, EACH GROUP COVERING 1-2 CHARACTERS. ORDER:
|
|
BREAK 20.00-20.10 (10 mins) | |||
|
Move to breakouts (20.10) | |||
|
Conclusion-forming 30 mins |
20.10-20.40 |
To bring everything together and form conclusions |
We are going to use this final discussion to bring together everything we have been discussing so far. Working together, I’d like you answer this question: “If all households are going to be required to improve their home’s energy efficiency and switch to clean heating, what needs to be in place to make how we pay for it fair?” REMIND PARTICIPANTS THAT IN THIS FINAL SECTION WE ARE TALKING ABOUT CHANGES TO HEATING SYSTEMS IN GENERAL, NOT ONE OF THE SPECIFIC OPTIONS ABOVE (BUT THEY CAN REFER TO THOSE IF THEY LIKE). ASK PARTICIPANTS TO COME UP WITH THREE STATEMENTS IN RESPONSE TO THIS OVERARCHING QUESTIONS. PARTICIPANTS START BY CALLING OUT THEIR RESPONSES, WHICH ARE NOTED DOWN ON VIRTUAL POST ITS. THEY THEN DISCUSS / RANK THE 3 THAT THEY FEEL ARE MOST IMPORTANT. FACILITATOR HAS THESE 3 STATEMENTS WRITTEN UP (ON 3 BULLET POINTS ON A SLIDE), READY TO FEEDBACK IN PLENARY. (IF TIME) Reflections on the process With the few minutes remaining, I’d be interested to hear your thoughts on this process and your participation…
|
|
Move to plenary (20.40) | |||
|
Feedback and wrap up 10 mins |
20.40 – 20.50 |
Final reflections and exercise |
CHAIR THANKS EVERYONE INVITES FEEDBACK FROM EACH OF THE THREE GROUPS, CONCENTRATING ON THEIR 3 CONCLUDING STATEMENTS THEY CREATED. CHAIR CONDUCTS END OF SESSION POLL. Thinking about the changes that will be required to how people heat their homes, and your own personal view on the issues we’ve discussed this evening, which of these statements would you agree with more?
I agree with A more than B I agree with B more than A I don’t agree with either I’m not sure THANKS PARTICIPANTS FOR THEIR CONTRIBUTIONS, EXPLAIN NEXT STEPS FOR REPORTING AND THAT WE WILL SEND AN EMAIL TO CHECK PREFERENCES FOR KEEPING IN TOUCH ABOUT THAT, AND POTENTIAL FUTURE OPPORTUNITIES TO TAKE PART IN PUBLIC ENGAGEMENT ON THIS. INVITE REP FROM CXC/SG TO SAY CLOSING REMARKS. THANK AND CLOSE. |
Appendix D – Characters
The following character descriptions were provided to participants in the sector specific workshops to aide their deliberations. The characters were created by Ipsos, with input from Scottish Government and ClimateXChange, and were used as stimulus to help participants consider a range of different experiences from across Scotland. The design of the dialogue and development of characters was informed by interviews with stakeholders in each of the sectors who identified several groups who would be more likely to be impacted by the changes.
Phase 1


Phase 2


© The University of Edinburgh, 2024
Prepared by Ipsos on behalf of ClimateXChange, The University of Edinburgh. All rights reserved.
While every effort is made to ensure the information in this report is accurate, no legal responsibility is accepted for any errors, omissions or misleading statements. The views expressed represent those of the author(s), and do not necessarily represent those of the host institutions or funders.
https://www.gov.scot/publications/securing-green-recovery-path-net-zero-update-climate-change-plan-20182032/documents/ ↑
https://www.legislation.gov.uk/asp/2019/15/enacted ↑
https://www.gov.scot/publications/transition-commission-national-mission-fairer-greener-scotland/documents/ ↑
National Just Transition Planning Framework – Just Transition – A Fairer, Greener Scotland: Scottish Government response – gov.scot (www.gov.scot) ↑
https://www.gov.scot/publications/draft-energy-strategy-transition-plan/ ↑
https://www.gov.scot/publications/net-zero-nation-public-engagement-strategy-climate-change/ ↑
https://www.climatexchange.org.uk/media/4231/understanding-and-engaging-the-public-on-climate-change.pdf; https://www.theccc.org.uk/publication/the-role-of-deliberative-public-engagement-in-climate-policy-development-university-of-lancaster/ ↑
https://sciencewise.org.uk/about-sciencewise/our-guiding-principles/ ↑
https://www.gov.scot/publications/transition-transport-sector-discussion-paper/; https://www.gov.scot/publications/transition-built-environment-construction-sector-discussion-paper/; https://www.gov.scot/publications/transition-land-use-agriculture-discussion-paper/ ↑
Participants felt a fair tax system would be required, whereby those who can afford to pay a higher share. ↑
Discussions on a fair system of payment also led some participants to call for wider overhauls of the existing tax system, which they felt should be fairer and more equitable. However, this broader point fell beyond the remit of this dialogue. ↑
When discussing protecting those on low incomes, some felt that this should be widened to say “support those on differing incomes”. The point was that people not defined as “low income” may also need support. These two positions did not necessarily conflict, as both were based on the principle of protecting those who could not afford to make changes. However, the group that suggested “differing incomes” wanted to stress the point (made earlier in the report) that income was not the only determinant of ability of pay. ↑
In discussion about informing the public on the changes needed, it was specified that this should highlight how the changes will positively impact the future of transport, home energy and food production/consumption. ↑
In discussion about their aspirations related to leadership and accountability, one group suggested that there should be measures in place to prevent future leaders from totally reversing changes that have been agreed on. However, they also said leaders should have some flexibility to change the approach. They also hoped for cross-party consensus if possible. ↑
This conclusion built on discussions from previous sessions, and those who suggested it saw the role of a non-political body as providing independent monitoring of the transition and associated costs, ensuring that people are treated fairly. It was described as something akin to Ofgem (the independent energy regulator) but specifically for the transition to net zero. ↑
While participants did not specify what exact sources they would consider “credible”, they noted specific media outlets which they personally would not trust (which are not named in this report). They also suggested that specialist advisers should be placed in Citizen’s Advice Bureaux, in Job Centres, or at community meetings. This highlights some of the sources that they felt would be useful means of disseminating information. ↑
Some felt that empowerment would only be achieved through the use of incentives and not through the use of charges or penalties. They therefore suggested changing the language from “Empower people” to “Encourage people”. As this was only suggested by one group, the original language was kept but their views are noted here. ↑
It was emphasised that carrots should be identified based on investment in research. It was felt that sticks need to be carefully thought about in terms of where they should fall – e.g. taking into account individual circumstances. One group felt that certain industries should be exempt (from the sticks) where it is technically not possible to reduce emissions. They used the example of steel manufacturers, which falls outside of the remit of this research. ↑
https://www.futureeconomy.scot/publications/59-measuring-carbon-inequality-in-scotland ↑
https://www.gov.scot/publications/transition-fairer-greener-scotland/pages/5/ ↑
https://www.justtransition.scot/publication/time-to-deliver-annual-report-2023/ ↑
https://es.catapult.org.uk/project/electrification-of-heat-demonstration/ ↑
Public Health Scotland define transport poverty as the lack of transport options that are available, reliable, affordable, accessible or safe that allow people to meet their daily needs and achieve a reasonable quality of life, see: https://publichealthscotland.scot/publications/transport-poverty-a-public-health-issue/transport-poverty-a-public-health-issue/ ↑
Please note that participants did not generally distinguish between private landlords and the social rented sector when discussing issues relating to those in rental properties. The type of landlord is specified where participants did make this distinction. ↑
The achieved number of African, Caribbean, Black or Black Scottish/British participants was zero in phase one due to a last minute dropout. Additional targets were set in phase two to ensure representation from this ethnic minority group. ↑
Anyone agreeing with the statement “I’m still not convinced that climate change is happening” was screened out at the recruitment stage to help ensure that those convened for the dialogue could focus on how the costs/benefits of the changes could be distributed fairly to reach net zero (not whether changes should happen at all, though views on this – where expressed – were noted). ↑
A particular focus and boost was placed on the African, Caribbean, Black or Black Scottish/British minority ethnic group due to lack of representation of this group in phase one. ↑
Anyone agreeing with the statement “I’m still not convinced that climate change is happening” was screened out at the recruitment stage to help ensure that those convened to engage in the dialogue could focus on how the costs/benefits of the changes could be distributed fairly to reach net zero (not whether changes should happen at all, though views on this – where expressed – were noted). ↑
Research completed in September 2024
DOI: http://dx.doi.org/10.7488/era/4915
This work was carried out in accordance with the requirements of the international quality standard for Market Research, ISO 20252.
Executive summary
This report sets out key findings from an exercise that mapped public engagement activities on the heat transition in Scotland.
The aim of the research was to help inform the delivery of the Heat in Buildings Public Engagement Strategy by addressing questions related to who delivers engagement activities and to whom, the type of activities and messages, and gaps in engagement.
We conducted a web search, interviews with experts from organisations involved in the heat transition and an online survey of organisations delivering public engagement activity.
Findings
Overview of ongoing activities:
- A wide range of organisations across the public, private and charitable sectors have been delivering public engagement activities on the heat transition in Scotland.
- The types of public engagement have also been varied, with the most common being advice services, workshops and information sharing online.
Target audience, messaging and accessibility as discussed by experts and organisations:
- Engagement activities were mostly open to the general public. There were also some specific target groups identified, including residents within a specific geographic area, homeowners, people in fuel poverty, low-income households and energy sector professionals.
- Despite attempts to engage a broad range of audiences, those actually engaged in the activities were typically more climate aware than the general public overall.
- Messaging that was focused on home energy efficiency and reducing energy bills, rather than the adoption of clean heating systems, resonated better with wider audiences in the context of the cost of living.
- Engagement on “simple fixes” (e.g. turning boiler temperature down) was therefore more widespread than messaging around bigger steps (e.g. installing a heat pump).
- Activities delivered through trusted messengers and existing local channels were accessible forms of engagement.
- Tailoring messages to the specific target audience was an effective approach to accessible engagement as it helped to improve understanding.
Gaps in public engagement identified by experts and organisations:
- Audiences under-engaged on the heat transition included private landlords, renters, professionals in the energy sector, young people and the digitally excluded.
- Lack of regulatory clarity on clean heat and energy efficiency was a key reason for the engagement gap among landlords and the energy sector.
- The upfront costs of transitioning were a barrier to widening reach among the general public, especially in the context of the cost of living crisis.
- Key messaging gaps in public engagement included:
- A lack of public understanding of heating systems.
- Insufficient practical and transparent advice on installing and operating clean heating systems.
- Interviewees thought that certain aspects of the transition, such as what clean heating systems are and how to install them, were not successfully communicated to the wider public due to their perceived complexity.
- They felt that communication about the efficacy of clean heating systems, based on real use cases, was lacking.
- There was a shortage of trusted messengers providing reliable, impartial advice, as well as a lack of tradespeople able to provide technical support on the practical aspects of the transition.
Conclusions
To ensure that public engagement on the heat transition builds on what has been done before and is effective in prompting action, consider:
- Prioritising the private rented sector, professionals in the energy sector and those who are digitally excluded:
- Firstly, engage with the energy and private rented sectors to drive engagement and action forward, for example by sharing information and practical advice among the wider public.
- Secondly, engage with the general public, emphasising the experiences of early adopters to build trust in the efficacy of clean heating systems.
- Tailoring messages to the audience:
- For industry professionals, provide clarity on the changes required and reassurance on the support available.
- For the general public, make it easier for those who are more highly motivated by the climate crisis to take action, so that there are more operational examples to encourage those who may be more hesitant to take action.
- Highlight the financial benefits and availability of grants and loans.
- Building trust:
- Improve the baseline public understanding of clean heating systems.
- Communicate transparently around the needs, benefits and risks of transitioning to a clean heating system.
- Use trusted messengers who are already embedded in local communities.
- Providing regulatory clarity, as organisations feel they cannot deliver effective public engagement activities without knowing if and when clean heat and energy efficiency regulations will come into force, and what specific changes will be required.
Introduction
This report presents the findings from research conducted by Ipsos on behalf of ClimateXChange and the Scottish Government, mapping public engagement on the heat transition in Scotland.
Background
Scotland’s climate change legislation sets a target date for net zero emissions of all greenhouse gases by 2045. The Scottish Government reports that domestic buildings account for around 12% of Scotland’s greenhouse gas emissions, and non-domestic buildings contribute another 7%. Urgently reducing emissions from Scotland’s buildings is therefore a crucial part of achieving net zero, and will require the majority of households in Scotland to change their heating systems. Plans for this are set out in the Scottish Government’s Heat in Buildings Strategy (HiBS). The process of transitioning heating from using fossil fuels to using clean heating systems, is often referred to as the ‘heat transition’.
To ensure success in decarbonising Scotland’s home heating, public engagement is key. Existing research by Consumer Scotland highlights a general lack of awareness among the Scottish public about the heat transition, clean heating systems, and low-carbon technology. Building on this, research conducted for ClimateXChange included recommendations about the ways in which messages around the heat transition should be communicated to the public, including making a positive case for change in a highly visible way, harnessing the influence of existing trusted messengers to deliver information consistently, and giving plenty notice in advance of any legislation being announce. The Existing Homes Alliance Scotland published a report in July 2023 which highlighted the need for clear and tailored messaging, backed up with accessible resources, to encourage action at the scale and pace required to reach net zero.
In this context, the Scottish Government published its Heat Transition Public Engagement Strategic Framework in December 2023 to guide its engagement work around clean heat and energy efficiency. The Framework aims to ensure the Scottish public are aware of and understand the changes required in the heat transition, know how to access support, can actively participate in shaping policy, legislation and delivery schemes, and importantly can take action in decarbonising their homes.
Research aims
ClimateXChange and the Scottish Government commissioned Ipsos Scotland to map existing public engagement on the heat transition in Scotland to help inform the delivery of the Heat in Buildings Public Engagement Strategy.
This public engagement mapping aimed to address the following research questions:
Who is delivering engagement activities?
What types of activities are being delivered?
Which audiences are being targeted?
What types of messages are being communicated?
How accessible are messages and activities?
Where are the gaps in engagement?
Method
The research involved three strands:
A web search to identify public engagement activities.
Interviews with 10 experts representing a range of organisations involved in the heat transition.
An online survey of organisations delivering public engagement activity.
A brief overview of each strand is provided below, and a more detailed methodology can be found in Appendix A.
Web search
First, a web search was conducted using defined search parameters and search strings (see Appendix B) in May 2024. The web search included a traditional search using Google and Google Scholar, and Ipsos’s proprietary social media listening tool, Synthesio.[1]
Over 2,500 references to public engagement across social media channels were reviewed and, from those initial results, 62 instances of engagement matched the inclusion criteria and were included in the analysis. The results from the web search also informed the sample development for the expert interviews and online survey, and the design of the interview topic guide and questionnaire.
Expert interviews
Interviews were conducted with 10 organisations involved in the Scottish heat transition from 30 May to 7 Aug 2024 (identified via web search and recommendations from the Scottish Government and ClimateXChange). The profile of expert organisations included a mix of charities/advice services, climate hubs, private companies, non-government organisations and industry bodies.
This strand of the research explored the different types of public engagement activities currently being delivered in Scotland in more detail. A topic guide was developed by the Ipsos research team and reviewed by ClimateXChange and the Scottish Government (see Appendix C). Interviews also helped to identify potential organisations for inclusion in the online survey sample.
Online survey
The third strand of the research involved a five-minute online survey with organisations delivering public engagement activities in Scotland to explore the purpose and nature of these activities. The questions were designed by Ipsos and reviewed by ClimateXChange and the Scottish Government (see Appendix D).
An initial sample of 78 contacts was generated by Ipsos through the web search and interviews, and the survey link was also shared by ClimateXChange and the Scottish Government, through various email networks and communications channels, to broaden participation.
The survey was live for five weeks, from 19 June to 24 July 2024, and 34 completed responses were received. Of these, 25 organisations reported that they had delivered some form of public engagement in the last three years.
Analysis
The data generated from the web search, interviews and online survey was used to map the range of activities (including details such as the type of activity, who delivered it, when it happened, who it was aimed at, and the topics covered). More reflective themes relating to impact, challenges and possible gaps in engagement were drawn from online survey results and the interviews.
Scope and limitations
The web search identified a wide range of public engagement activities across Scotland over a number of years. However, this search was not exhaustive, as it was limited to what was available online, and provided varying levels of detail depending on what was published. Data collected from interviews with experts provided more in-depth and reflective insights from a range of perspectives, but on a much smaller range of activities than that of the web search. Meanwhile the online survey provided insights on activities across a wider range of activities, but not in as great a depth, as those gathered from the interviews.
Using multiple data sources has enabled a more comprehensive understanding of public engagement activity in Scotland than any one source would be able to provide. However, it is important to acknowledge that the research parameters may have overlooked some forms of public engagement (particularly those at a small community level or those not promoted online). Furthermore, not all perspectives on the heat transition (such as those of the intended target audiences) have been captured.
The online survey was an open link and responses were gathered anonymously. This means that the data may contain multiple responses from the same organisation and duplication of responses between the survey and web searches. Interviews were also conducted confidentially, and so their views have been reported anonymously. Any examples or organisations mentioned in the report are taken from publicly available information and it should not be assumed that they correlate with organisations taking part in either the depth interviews or online survey. Where more detailed case studies are provided (e.g. in relation to Impacts), these have been shared with the permission of the main delivery organisation responsible.
Lastly, online survey results are based on a small sample and so should be read and interpreted with this in mind. Where percentage figures don’t sum to 100, this is due to computer rounding. Where counts do not sum to the base, this is due to questions allowing multiple responses.
Public engagement on the heat transition
This chapter provides an overview of the types of public engagement that have taken place in Scotland between October 2021 and May 2024 and the organisations delivering them. It addresses the following research questions:
- Who is delivering current heat transition-related engagement activities and messaging in Scotland?
- What types of activities are being delivered?
This chapter also explores awareness of the Scottish Government’s Heat in Buildings Strategy among the organisations delivering public engagement.
- A wide range of organisations from across the public, private and charitable sectors, have been delivering public engagement activities on the heat transition in Scotland.
- The types of public engagement have also been varied, with the most common being advice services, workshops and information sharing online.
- Awareness of the HiBS is high among those delivering public engagement.
Who is delivering current heat transition-related engagement activities and messaging in Scotland?
The web search, survey and expert interviews identified a range of organisations delivering public engagement activities in relation to the heat transition since October 2021, including:
- Charities, such as One Parent Families Scotland, Age Scotland, Under One Roof, and Community Energy Scotland.
- Non-profit organisations and social enterprises, such as Nesta, Scarf and Energy Action Scotland.
- Community groups, such as climate hubs and local interest groups.
- Private sector organisations, such as UK energy companies.
- Advice and support bodies, such as Energy Savings Trust (who administer the Scottish Government’s Home Energy Scotland service).
- Collectives, consortiums, networks or member groups that include organisations representing a range of sectors (e.g. Built Environment-Smarter Transformation and the Poverty Alliance).
- Local authorities.
- Education and research institutes, such as the University of Strathclyde and the Energy Training Academy.
The Synthesio (social media listening) search provided an indication of the extent of activity and messaging from particular organisations, based on volume of online mentions (see Figure 1). This does not necessarily mean that these organisations have delivered more engagement, but rather reflects higher levels of posts on the heat transition by organisations directly or by other actors citing them.
Figure 1. Organisations delivering public engagement by volume of online mentions

What types of activities are being delivered?
The types of activities being delivered were broad, and included advice services, workshops and various types of information and knowledge sharing. The online survey data and Synthesio search provided a snapshot of this range (see Figure 2), which was also reflected in the interviews.
Figure 2. Types of public engagement activities

Among the most common types of public engagement activity were advice and support services, which have been delivered by a range of organisations (including non-profits, non-government bodies, charities and community groups). This was a broad category encompassing free impartial advice on energy saving measures and keeping homes warm, through to practical advice on installing renewable technologies and verifying providers of retrofitting work. A range of advice and support services were accessible online, in-person and via telephone.
Advice and support services example
Energy Saving Trust is an independent organisation supporting households and businesses towards decarbonisation, and is one of the Scottish Government’s main partners in addressing the climate emergency.
Their Green Homes Network connects those interested in low carbon heating with householders who have installed clean heating systems through a database. Households give permission to post case studies so others can find out about their journeys and contact them for further advice. Households may also be invited to speak at webinars or to the press about their conversion to a new heating system.
Workshops were delivered by a range of actors (including local authorities, charities, non-government organisations, social enterprises and community groups). Some were one-off events while others were run as a series of workshops. The aims of the workshops included: to generally increase knowledge and understanding around the Scottish Government’s heat policy, to help community groups and individuals reduce costs, and to inform individuals on the availability of grant funding for heat transition projects and energy efficiency improvements.
Workshop example
Transition Black Isle is a community group that aims to help Black Isle communities respond to the climate emergency and to encourage non-car travel, local food production and energy saving measures. The group organised a series of workshops in March 2022 on low carbon home heating which involved expert speakers and group discussions:
- Session 1 explored ways to make houses warmer and cheaper to heat without compromising air quality or risking damage to building fabric.
- Session 2 identified various low carbon methods of home heating and circumstances which suit each approach.
- Session 3 covered managing these changes, including financial support, choosing contractors and incorporated advice from those who had already been through the process.
Lectures and talks were delivered by organisations of all types. Some events were open to the public, either as stand-alone events or pop-ups as part of other events or festivals, and provided opportunities to learn about opportunities and risks in making properties more energy efficient. Others engaged industry professionals specifically and provided information on the Scottish Government’s energy policy, availability of funding, best practice for retrofitting schemes and challenges in heat pump deployment. There was also evidence of employee engagement, with organisations being invited to give talks to advise employees on ways to save energy at home.
Training and knowledge sharing were typically targeted at industry and policy makers. These took the form of panel discussions and events, as well as online networks/hubs to facilitate knowledge exchange and practical training modules on aspects of the heat transition.
Training and knowledge sharing example
HeatSource is a programme funded by Scottish Enterprise that aims to better equip companies involved in manufacturing, installation, training and the wider supply chain to deliver clean heating systems.
The programme seeks to support the decarbonisation of Scotland’s built environment through the creation of an online information hub to help industry maximise the opportunities around new zero carbon heating.
Various organisations have provided information online and delivered public information campaigns aimed at the general public, including:
-
- Get a Heat Pump – a website that provides information on what a heat pump is, how to get one installed and the associated costs (Nesta).
- Heat pump heroes – an annual awareness-raising campaign to promote conversion to heat pumps (Home Energy Scotland).
- Money-saving boiler challenge – a public-facing campaign which aimed to raise awareness about how to use energy more efficiently and save on bills (set in the context of the cost of living crisis) (Nesta).
Other public engagement activities included:
- Showcases, including live demonstrations and trial installations of heat pumps in different types of homes to gather user feedback.
- Consultations, typically delivered by community groups to gather responses to the Heat in Buildings (HiBs) proposal and the Scottish Local Heat and Energy Efficiency Strategies (LHEES).
- Advocacy work, such as speaking up for consumers who have had issues with clean heating systems (e.g. increased energy costs) and opinion pieces published in media outlets to raise awareness and tackle myths around the heat transition.
Awareness of Heat in Buildings Strategy
Among organisations that have delivered public engagement activity and responded to the online survey, the majority (88%) reported knowledge of the HiBS, of which just under two-thirds (64%) said they knew a fair amount or great deal about it. Just over one in ten (12%) had either heard of the strategy but knew nothing about it, or had never heard of it (see Figure 3).
Figure 3. Awareness of the HiB strategy among survey participants

Experts interviewed for the research also reported that their organisations had high levels of awareness and understanding of the HiBS. This was based on their existing relationships with the relevant policy teams in Scottish Government, involvement in the initial consultation process, and/or providing responses to it. Other ways in which experts mentioned becoming familiar with the strategy included through the introduction of new build heat standards and working with local authorities.
Target audiences and messaging
This chapter provides an overview of the types of public engagement that have taken place between October 2021 and May 2024 and the organisations delivering them. It addresses the following research questions:
- Who is the target audience of these activities?
- What types of messages are being communicated?
- How accessible are the activities being delivered?
- Activities were mostly open to the general public, however, there were some target groups identified (e.g. residents within a specific geographic area, homeowners, people in fuel poverty, low-income households and energy sector professionals).
- Messaging focused on home energy efficiency and reducing energy bills, rather than the adoption of clean heating systems, was felt to resonate more with wider audiences.
- Engagement on “simple fixes” (e.g. turning boiler temperature down) was therefore more widespread than practical messaging around bigger steps (e.g. installing a heat pump).
- Activities delivered through trusted messengers and existing local channels were felt to be more accessible forms of engagement. Tailoring messages to the specific target audience was also a key consideration.
- However, there was a clear distinction between intended target audiences and those actually being engaged, who typically were those who were already more climate aware in any case.
Who is the target audience of these activities and messaging?
Public engagement activities were mostly targeted at a broad, general public audience. Evidence gathered from the Synthesio search, interviews and survey showed that activities were often advertised as open to all, rather than targeting a specific demographic. This was driven by the understanding that there are high levels of concern about climate change among the general public (an assertion supported by public opinion research), and that the environmental impact of energy use affects everyone, which requires a wide reaching approach to engagement.
However, the research highlighted a clear distinction between audiences being targeted and audiences actually being engaged.
Intended target audiences
While most engagement activities were targeted at the general public, the research also found evidence of some activities targeted at specific groups, including local residents of a specific geographic area, people in fuel poverty and low-income households, homeowners, and energy sector professionals (see Figure 4).
However, it should be noted that delivery organisations responding to the online survey often mentioned targeting multiple different groups rather than one group in particular.
Figure 4. Target audiences (number of mentions by organisations delivering public engagement activities)

Public engagement at regional or local levels was found to be happening across Scotland, with most events concentrated in Edinburgh and Glasgow and a smaller number of activities being delivered in East Lothian, Falkirk, Perth and Kinross, Dundee, West of Scotland, Fife, Aberdeen and Aberdeenshire, and Highlands. There was some evidence of public engagement activities happening on the islands, highlighted by experts, however this was more limited (which could reflect the fact that engagement was more localised and less promoted online).
People in fuel poverty and low-income households were frequently identified as a key target group for engagement activities. However, evidence from the Synthesio search and from the interviews indicated that the primary focus of those activities was encouraging simple energy efficiency changes that would lead to lower energy bills rather than promoting a transition to clean heating systems.
There was also some evidence of engagement targeting energy sector professionals (e.g. through conferences, knowledge-sharing and training). However, there was a broad view among experts that this group had not been sufficiently engaged (see Gaps).
Audiences actually being engaged
While activities were advertised as open to all (with some targeting), experts observed that they tended to draw interest from those who were typically more climate aware, highly engaged on the topic of sustainable home energy solutions, and more involved in their community anyway. This is consistent with earlier research conducted for ClimateXChange which found that early adopters tend to have higher than average knowledge of, and interest in, climate change as well as time and willingness to research energy alternatives.
In line with this research, the demographic profile of those who experts perceived to be more engaged was described as homeowners over the age of 40 with disposable income. It was also suggested that men were more likely to be interested in installing low-carbon heating technology than women. Experts cited lower attendance rates among other groups as a particular challenge to widening reach (see challenges).
What types of messages are being communicated?
Messaging around the heat transition mainly focused on energy efficiency rather than the adoption of clean heating systems, according to both the survey (see Figure 5) and Synthesio findings.
The focus on energy efficiency measures was seen to be driven by the cost of living crisis and rising energy prices. Experts highlighted energy efficiencies and reducing energy bills as messaging that had resonated most with the public and led to greater engagement. Some examples of this type of messaging included:
- “Warmer Homes, Cheaper Bills, Greener Lives” (an event organised by Sustaining Musselburgh and advertised on Eventbrite).
- “How to save cash with a single change to your boiler settings” (from Nesta’s Money-saving boiler challenge).
- “To help you lower your energy bills and have more energy efficient homes, whilst also reducing your carbon footprint” (from Thurso Community Development Trust’s home energy advice webpage).
Organisations that had delivered engagement activities with more of a focus on retrofit and the installation of heat pumps reported using the benefit of cheaper bills as a “pitch” to increase engagement among the wider public. This type of messaging was considered to resonate more with the public than messaging around heating systems.
There was also a perception among experts that the public have a limited understanding of their current heating systems. Experts felt that this, coupled with existing financial pressures, was contributing to a lack of curiosity about installing greener alternative systems. As highlighted in the examples above, some delivery organisations have focused on smaller, easier steps to address this and encourage engagement.
Organisations reported that they had found messaging focused on easy steps and “simple fixes”, such as turning down the flow temperature of a boiler, to be more effective than discussions around new heating systems. This reflects other recent research findings on heat transition communication, which suggested that messaging should be breaking down behaviour into small steps. Experts also felt that ensuring a basic understanding of how existing heating solutions affect bills would be an essential first step to engaging households about further decarbonisation measures beyond energy efficiency.
The web search and online survey found more limited evidence of practical messaging around bigger steps such as how to install and operate clean heating systems like a heat pump. Experts felt that this type of messaging was primarily engaging people who were already motivated to change their heating system.
How accessible are messages and activities being delivered?
Delivering engagement through trusted messengers was highlighted by experts as one of the more effective approaches in terms of accessibility. For example, engaging the public through existing community networks was a way in which some organisations had engaged hard-to-reach demographics, such as older people, people in poverty and vulnerable groups.
“That type of engagement [with vulnerable demographics] has to come from local trusted messengers – it’s about building that relationship. It’s not going to come from anywhere else for the most vulnerable. I think that is where there’s a role for community organisations to play.”
Climate Hub (interview)
Experts also highlighted local community events that are already well-attended by local residents as an effective way of promoting transition messaging to the broader public and extending the reach of engagement beyond the climate aware audiences. For example, one organisation had delivered entertainment for children at family-friendly local events to engage parents.
Synthesio search findings suggest that most activities had been held either online or in hybrid form and experts felt that this had promoted greater accessibility across Scotland. Social media was also used as a method of advertising and delivering engagement, particularly to reach younger demographics more effectively. Nevertheless, while the value of online activity for promoting wider reach was acknowledged, face-to-face engagement was still widely considered by experts to be the most effective.
Among the activities delivered, there was also evidence of public awareness campaigns utilising TV and printed media to reach a broad audience, including Nesta’s “Money Saving Boiler Challenge”, Citizens Advice Scotland’s “Big Energy Saving Winter” and Smart Energy GB’s “Smart Energy Heroes”. According to experts, wider public campaigns (in combination with simple and accessible messaging) have been most accessible for members of the public not already aware of, or engaged on, energy and climate issues.
Delivery organisations also reported the use of simple and clear messages to improve the accessibility of their public engagement activities. Experts felt that emphasising the energy efficient changes that individuals could easily adopt in their homes and outlining the financial benefits of making them was most effective in improving understanding of the impact of heating systems on the climate. In particular, the importance of clearly presenting the financial case for change was highlighted, recognising the challenges people face currently with their energy bills.
“The challenge is making sure the information is really simple and easy to access and reflects the fact that people are in crisis at the time – just transition terminology, for example, doesn’t work.”
Charity (interview)
Using informal (“chatty”) language in communication with the wider public on energy advice was felt to have promoted both accessibility and trust. The importance of positive, hopeful and uplifting rhetoric was highlighted, such as an emphasis on the short-term benefits (e.g. immediate decrease in energy bills). This was seen as particularly effective for effectively reaching low-income households and those in fuel poverty.
“The scale of the transition is immense and the potential opposition to some of what’s needed is also significant, so there’s a need to make sure that there are as many positive and supportive voices as possible to counter the noisy negativity.” Charitable organisation (interview)
Experts also emphasised the importance of tailoring messages to the specific target audience as a way to improve accessibility and understanding of information. For example, one expert described how their organisation changed the focus and language of any transition-focused activity depending on who they were aiming to reach. When speaking to tenants, they would highlight the links between climate change and heating and assert the case for the need for transition, while when addressing flat owners, they would discuss the specific challenges this group faces and focus on heat networks rather than heat pumps as a solution.
Some experts reported offering advice and information services in different languages and providing materials accessible to people with different reading abilities. However, among those delivering engagement, evidence of organisations making these accessibility considerations was limited.
Despite these considerations for delivering accessible engagement, our interviews identified accessibility as a challenge. This related primarily to the complexity of the topic and the highly technical language of certain aspects of the heat transition which was widely considered to be inaccessible and, therefore, limiting the reach of engagement beyond those who are already engaged on climate issues. Some examples that were recognised as particularly difficult for the wider public to understand included EPC ratings and the practicalities of choosing and installing clean heating systems. This is discussed in more detail in the following chapter.
Reflections on the effectiveness of public engagement
This chapter reflects on the perceived impact of public engagement activity and the challenges that delivery organisations have experienced, before summarising any future public engagement being considered or planned by delivery organisations who participated in this research.
Key findings
Impacts
- Simple messaging that focuses on easy energy efficiency actions and outlines financial benefits were felt to be the most effective forms of public engagement, building trust through the use of trusted messengers.
- Building trust with the audience was identified as one of the most important aspects of delivering successful engagement. Community-level engagement was seen as an effective way to foster that trust and reach hard-to-reach groups.
Challenges
- Lack of regulatory clarity on clean heat and energy efficiency was identified as the main barrier to delivering effective engagement.
- Misconceptions and lack of public awareness around sustainable heating solutions was also seen as a challenge.
- The cost of living crisis was recognised as a barrier to widening the reach of engagement. In this context, the general public was seen as unwilling to accept the upfront cost of transitioning.
- Certain aspects of the transition, such as installation of clean heating systems, were not seen to have been successfully communicated to the wider public due to topic complexity and specialised language that is not widely understood.
Impacts
Those delivering public engagement largely felt that their activities had had a positive impact on people’s understanding of issues relating to the heat transition in Scotland (see Figure 5). Among those taking part in the online survey, 89% reported that their audience’s understanding of the topic had improved as a result of engagement. There was less certainty over the extent to which public engagement had led to action, with fewer than half of organisations (44%) reporting that those activities had led to action and 26% reporting that individuals had decided to switch to a clean heating system as a result of the engagement.
Figure 5. Perceptions of impact 
Both the interviews and the Synthesio search also identified a number of impactful initiatives centred around simple energy efficiency actions that organisations felt had been effective at reaching the broader public and prompting people to action small changes, often framed around saving money as well as reducing carbon emissions (see Figure 6).
“The stuff that lands better with people, unsurprisingly, is – there’s a pretty quick fix that you can organise yourself and it saves you money.” Charity (interview)
Community-driven engagement was also highlighted by sector experts as a success factor in terms of reaching certain demographic groups, such as older people, families in in-work and fuel poverty and vulnerable groups (see figure 6). This was felt to be important because of the perception that community organisations enjoy high levels of trust from members of the community. Building trust was identified as one of the most important aspects of delivering effective engagement.
Figure 6. Evidence of impact
Money Saving Boiler Challenge Campaign
The campaign was delivered by Nesta, in partnership with energy providers and other organisations in the energy industry, which focused on providing basic and simple energy efficiency advice. The activity aimed to reach the general public and convince people to turn down flow temperature on their boiler, thus reducing carbon emissions and energy costs.
The campaign also aimed to promote better understanding of existing heating systems and their environmental impact among the general public. This activity was part of a wider campaign on decarbonisation.
Following the campaign, close to 240,000 households turned their boiler flow temperature down, resulting in savings of £112 per year for an average household and a reduction of carbon emissions by 37,000 tonnes.[2]
Success factors:
- Simple and straightforward messaging that resonated with people in the context of the cost of living crisis.
- Promoted small and easy changes.
- Partnership with trusted voices – public-facing organisations offering energy advice and energy providers.
- Clearly communicated individual financial benefits of making the changes.
- A wide public campaign that was advertised on TV and mainstream media.
Home Energy Advice Portal
The web portal was developed by Thurso Community Development Trust together with the Highlands and Islands Climate Hub.[3] The website aims to improve pathways to support and uptake of grants by providing energy advice and a comprehensive overview of the energy support services available to residents in Scotland. The portal is accessible to all but is aimed primarily at local community organisations. It provides training to staff and volunteers in offering energy advice, recognise struggling households most in need of energy support, how to approach them and signpost residents to local energy service providers and financial support.
As of May 2024, 435 community groups in the region had been trained on the portal, which has led to improved knowledge and confidence among staff on the topic of energy. The portal has been actively used, with an average of 3,000 hits per month and approximately 5,000 people supported through it to date. It has also reached some hard-to-reach and vulnerable groups, including older people and low-income families.
Success factors:
- Clear and accessible messaging.
- Community-based engagement.
- Use of trusted voices in the community.
Challenges
The research identified a range of challenges in delivering engagement that were perceived to have negatively impacted attendance rates and limited overall effectiveness.
A perceived lack of clarity around clean heat and energy efficiency regulations was one of the key challenges identified in the interviews. There was a shared sense that public engagement activities would be limited in their effectiveness until the legislative requirements are known. Experts felt there had been frequent changes in proposed legislation in the past and that there is currently a lack of clarity around the requirements for properties, which has created confusion among some groups and limited the reach and effectiveness of some engagement activities. Landlords in particular were identified as a group at risk of disengaging on the topic until there is clarity on what they will be required to do. The perceived frequency of changes in proposals was felt to have made it difficult for organisations to deliver effective public engagement because they feel they are unable to provide straightforward advice.
“Until there’s clarity on what the requirements are going to be, it’s difficult to go out there with firm messaging. You always have to caveat your messaging with “it’s just a proposal and it might change.”
Private company (interview)
It was also suggested in the interviews that the concern over further changes in requirements has caused hesitation among organisations to engage with the public until the legislation is finalised.
“[When] things can still change, that’s a disincentive to people actually doing works in their properties. Because they don’t know if the money they’re going to spend and the improvements they’re going to make are going to be beneficial when it comes to complying with possible future standards because we still don’t know what those possible future standards are going to be.” Private company (interview)
Representatives of the homebuilding sector highlighted that while homebuilders “are ready, understand and are committed to what needs done in supporting the transition”, there are concerns within the sector regarding limited communication from the Scottish Government about availability of the technology required to support the transition.
At the same time, interviewees stressed that there are still misconceptions, misinformation and lack of public awareness around sustainable heating solutions. It was suggested that the general public is still widely uninformed about the costs associated with the transition and whether low-carbon technology would be an effective heating solution for their home. Moreover, some stakeholders suggested that there is confusion around the different regulations in England and Scotland.
“…There’re still too many barriers to retrofitting – heat pumps are still considered pretty unusual and there’s a lot of myths, misinformation and misconceptions around how effective low-carbon tech is, which highlights the need for the public engagement strategy.” Membership organisation (interview)
The wider socio-economic context of the cost of living crisis was highlighted by experts as the key structural barrier to engaging the general public in the conversation about the heat transition and decarbonisation, particularly given the upfront costs of retrofitting and installing clean heating systems. They felt that, for most people, the kinds of interventions that will be required for the transition would be unaffordable.
“There is certainly a general gap in terms of people wanting to decarbonise their homes because of cost.” Private company (interview)
It was suggested that the public would be largely unprepared and unwilling to accept the cost of transitioning upfront based on a promise of future energy savings.
“We’re considering how we can get that messaging out to the public to make the public aware of the changes that will be required of them – yes, it might cost them more upfront but it should create longer- term benefits – but I don’t think the public is ready to make that connection yet and I don’t think any government messaging that I’ve seen to date has been explicit about that.” Private company (interview)
The complexity of the changes required and language accessibility around those changes was also identified by experts as a significant challenge. It was suggested that the language around the heat transition (e.g. clean heating systems) is specialised and requires a certain level of knowledge on the subject. It was therefore felt to be less accessible to people who don’t already have awareness on the topic.
“The challenge is making sure the information is really simple and easy to access and reflects the fact people are in crisis at the time – just transition terminology, for example, doesn’t work.” Statutory body (interview)
Despite attempts by organisations delivering engagement to address this challenge, such as by delivering energy advice through simple messaging, it was felt that other aspects of the transition such as installation of new heating systems have not been successfully communicated in a way that can be more widely understood. One expert, reflecting on their own experience installing a clean heating system, commented that even they found it difficult to navigate existing advice despite being highly engaged and knowledgeable on the topic.
“The challenge is that we were asking people to do the absolute low-hanging fruit thing in terms of decarbonisation of heating. So, it’s not as simple to take that framing – do this simple thing and save money – to almost any other part of the heat transition. The rest of the message is much harder.” Charity (interview)
Notwithstanding these challenges, over half of organisations who completed the survey (59%) and several of the interviewees said their organisations planned to deliver public engagement activities on the heat transition in Scotland in the future. These were mainly charities, but also included a range of other organisation types mentioned in Chapter 3. The types of activities planned included a continuation of existing advice and support services and information sharing campaigns, as well as further workshops or knowledge sharing events and new pilot schemes (such as for retrofitting).
Delivery organisations mentioned that these future activities would be open to all, but some specific target groups included homeowners, the social rented sector (landlords and tenants), those in fuel poverty, those living in flats, people with protected characteristics, and small businesses. It was felt that schemes like the Green Homes Network and Heat Pump Heroes should be promoted more widely to encourage further uptake of clean heating systems.
However, there was also reluctance among delivery organisations to carry out further public engagement until more is known about Scottish Government policy on the heat transition and the specific requirements needed for the different target groups.
“It is not worth individuals investing in bespoke renewables or low carbon heating systems. We need to know more about when the heat networks will be coming.” Charity (online survey)
Overall, while public engagement efforts have made good progress in raising awareness of the heat transition, substantial challenges remain in translating understanding into widespread action.
Gaps in public engagement
This chapter addresses the final research question: where are the gaps in engagement?
While the research has identified a range of different engagement activities that are reaching the broader public as well as targeted demographic groups, it has also identified some clear gaps in engagement. The identified gaps broadly relate to target audiences and messaging, but also relate to potential messengers (i.e. those who could have a role in supporting public engagement on the heat transition).
Key findings
- Audiences identified as having been under-engaged on the heat transition included private landlords, renters, professionals in the energy sector, young people and the digitally excluded.
- The key messaging gaps in public engagement include addressing the general lack of understanding among the public about current heating systems, as well as insufficient practical and transparent advice on installing and operating clean heating systems.
- Using existing case studies was also felt to be lacking, but could provide an opportunity to show how the technologies have been implemented in Scotland and elsewhere.
- A general lack of trusted messengers providing reliable and impartial advice was also identified, as well as those able to provide technical support on the practical aspects of the transition.
Target audience
Delivery organisations responding to the online survey felt that most groups of people would benefit from support or information on the heat transition in Scotland, with young people being a notable exception (Figure 7). Experts interviewed suggested that, although public engagement activities have largely been open to all because the transition is seen as an issue that will affect everyone, there were some groups who should be prioritised. The top four groups who would benefit from more information on the topic, as identified in the survey, were people in fuel poverty, homeowners, low-income households and landlords (see Figure 7).
Figure 7. Groups who would benefit from support

As highlighted in the previous chapter, experts suggested that there had been limited engagement with private landlords. This was reflected in the survey results too, with 77% of participants highlighting landlords as one of the groups who would benefit from support or information on the heat transition. This was seen as an important gap to address, since private landlords are expected to play an essential role in driving the heat transition forward and to be directly affected by the upcoming regulations around clean heat and energy efficiency under the current HiBS.
Experts perceived that the benefits of making the transition were not clear to landlords who would be bearing the costs of retrofit, leading to a reluctance to engage on the subject. Stakeholders who had conducted activities aimed at this group said that engaging with them had proven particularly difficult because of the sector’s resistance to being regulated, with both individual landlords (and some organisations representing them) pushing back and advocating against the legislation.
However, it was also acknowledged that responses to the HiBS have varied across this group. Some landlords, particularly the more climate conscious, were described as “very keen” to make sustainable improvements, but it was felt that a lack of clear and consistent information on the extent of upcoming regulations has held them back from taking action.
“It’s such a shame because people will phone us up – they have the money and the inclination to do the work and I have to tell them – actually, you’re better off not doing the work and spending the money just now because we don’t know what the requirements are going to be.”
Membership organisation (interview)
Lack of information and means to take action were felt to be even more of an issue in relation to renters. Out of all 62 public engagement activities identified through the Synthesio search, only two were targeted directly at tenants. Moreover, 66% of survey participants believed that private renters would benefit from more advice on the heat transition and 63% said the same in relation to social housing renters. Experts interviewed for this research felt that renters have been widely disengaged from the topic because they feel very limited in their power to make any changes in a rented home and the resources advising them are sparse. Moreover, it was suggested that renters were largely apprehensive about discussing the transition with their landlords due to concerns about losing housing in a competitive rental market.
“Those in rented accommodation often don’t know who to turn to – you may know that certain property standards exist but are not necessarily able to enforce them. In a rental market where renters are under pressure and aware that there is competition to rent, it doesn’t encourage you to speak to your landlord about these additional measures, for fear of losing housing.” Charity (interview)
Experts therefore perceived that those renting from private landlords would benefit from more sources offering practical advice on what changes they can make and how to discuss these with their landlords. In relation to social housing tenants, experts suggested that messaging should focus on building a stronger case for the need for transition. They felt that it was important to ensure that social housing tenants understood why retrofitting works were being carried out in their homes and what the benefits would be, and that they did not feel like the changes were being imposed on them. This echoes findings from the 2024 research on social housing decarbonisation conducted for ClimateXChange which highlighted the importance of tenant engagement and agreement prior to conducting decarbonisation works.
Limited engagement with professionals working in the energy sector was highlighted as a substantial gap in engagement on the heat transition. The Synthesio search and expert interviews identified some activities targeted at industry professionals being delivered, including professional conferences, training and workshops. However, it was widely felt by experts that this group has not been sufficiently engaged.
Industry-level engagement was described as a missed opportunity by experts who considered industry professionals and energy service providers as trusted messengers. It was felt they could provide technical and tailored advice to the public to mitigate the challenge highlighted earlier of poor understanding of clean heat technologies (see Challenges).
Beyond being a potential engagement opportunity, this gap was also seen by some experts as a risk; for example, if heat engineers do not understand clean heating systems themselves, they may provide incorrect advice to consumers. A comprehensive nationwide effort was deemed necessary to address the gap, and a particular focus on addressing any training or skills gap in rural areas.
Across the interviews, there is a widely shared sentiment that young people were one of the groups who have been least engaged on the heat transition. Experts suggested this related to the cost of living and the availability of affordable housing being more prevalent and pressing challenges for this group. It was also partly explained by young people in the rented market having limited agency to make any energy saving changes to their homes (with that responsibility resting upon the landlord) and therefore considering the heat transition as having limited personal relevance.
“Young people are not thinking about how they heat a home because they’re just trying to find a home in the first place. […] There’re so many issues in terms of housing for young people – particularly, if they are in the rented sector, they usually have no control over how that home may be heated.” Climate Hub (interview)
Despite these reflections expressed during the interviews, survey findings suggest that organisations involved in delivering engagement did not consider young people as a group that would benefit from more advice on the heat transition, with no participants identifying this as a priority group.
While it was felt that activities being delivered online have enabled broader participation (see Accessibility), it was also acknowledged by experts that those who are digitally excluded are potentially being left out of the conversation. Although organisations such as Scarf and HES do provide multimodal advice (via telephone, in-person, or online), these are often promoted online which experts felt could be limiting reach.
Messaging
One of the main perceived messaging gaps was addressing the lack of understanding among the general public about their existing heating systems. It was felt that this lack of awareness could act as an obstacle to the success of the longer-term strategy for decarbonisation, as people are unlikely to take action on changing their boiler to a different heating system if they do not fully understand the current one. Experts highlighted that energy efficiency advice promoting better understanding of how heating systems work and their impact on the climate should be a pre-requisite for any required action on the transition.
Interviewees also widely felt across interview that insufficient practical advice had been offered to the wider public around how to install and operate clean heating systems. This gap was closely linked to the limited engagement with the energy sector professionals who are seen as the key actors who would be able to offer such advice. Experts contrasted the availability of sources offering grant and funding support – which was felt to be plentiful – with the lack of reliable sources offering tailored practical advice.
“If you’ve got a property and you have absolutely no idea whether it has a wall that can be insulated, there are few sources that you can go to for advice – some of them are great and some of them aren’t so great. So, it’s very difficult when it comes to actually making changes.” Membership organisation (interview)
It was also stressed by some experts that there needs to be transparency in the practical advice about the things that can go wrong and any potential risks around the transition to ensure that consumers are making an informed choice and are equipped with the practical knowledge of what to do if issues arise. For example, some experts reported engaging with members of the public who had transitioned to clean heating systems and had experienced issues such as an increase in energy bills but did not know how to deal with those issues and could not find information about them. It was suggested that the lack of transparency around potential risks, coupled with negative experiences such as these, could limit progress on the heat transition.
“Once something has been installed, people need to be clearly shown how to use this system and that they’re not left with something that they don’t know how to work. […] we risk putting people into more expensive systems when they’ve been told they’ll be able to save money […] We’re sitting on quite a lot of evidence around where things aren’t working particularly well or where they can act against the just transition, e.g. increasing costs.” Statutory body (interview)
However, experts also emphasised the importance of demonstrating the efficacy of these heating systems, by showing how they have been implemented in homes across Scotland and in other countries. It was also felt that the experiences of those adopting low-carbon heating technologies could be amplified. By drawing on and learning from real-life experiences, whether positive or negative, it was felt that this could help to build trust in the systems and encourage more widespread uptake over time.
One expert also suggested that public engagement on the heat transition should focus more on heat networks. This was felt to be lacking in current discussions but a likely solution for lots of people, particularly those living in flats.
Messengers
When it comes to those delivering engagement and communicating these messages, despite sharing some examples of engagement activities delivered through trusted messengers, experts shared a view that there is a general lack of impartial and reliable sources offering tailored practical advice on managing clean heating systems. This was seen as significant given the importance of building trust in, and understanding of, clean heating systems for effective engagement (see Section 5.2).
Experts defined trusted messengers in different ways. Some considered private energy providers and installers of clean heating systems to be trusted voices given their technical expertise on the matter and consumer-facing branding. Others felt that local community organisations trained in providing energy advice should play that role as they are embedded in communities already and seen as trusted sources.
Another suggestion was that there should be a separate group of messengers who are impartial (i.e. not private contractors) and able to provide technical and tailored advice to people depending on their property, location, and circumstances. This group was seen as a missing link in the process which could help connect people with verified installers.
“If someone approached us asking if we could recommend someone they could speak to about insulating their property, I honestly don’t know where the best place for them to go to would be. It would be nice if somebody could tell us where we can signpost them to. You don’t necessarily want a contractor, you want someone who could give you independent advice on what you best options are, what the likely cost would be and ideally signpost you to some reliable contractors. It feels like there is a missing stage in the process.” Membership organisation (interview)
Reflecting on the gaps in audiences, messages, and messengers, there was a dominant perspective that more needed to be done to drive effective public communication and engagement activity on the heat transition in Scotland. One expert suggested that they would benefit from more guidance and insight into the effectiveness of the Scottish Government’s own engagement on the topic, as this would help organisations when developing their own engagement strategies.
Conclusions
This research has identified several considerations for ensuring future public engagement on the heat transition builds on what has be done before and is effective in prompting action.
Prioritising groups
Delivery organisations felt that public engagement activities should be open to all on the basis that the heat transition will affect everyone some way. However, certain priority groups were identified, including:
- The private rented sector, as landlords will be expected to play an essential role in driving the heat transition forward under the current HiBs proposals, which would require landlords to make energy efficiency improvements by 2028, and tenants will be affected by the changes.
- Professionals in the energy sector, including energy providers and engineers who can be trained in clean heating systems, amplifying messaging around the transition, and providing tailored technical advice to households.
- Those who are digitally excluded, who may not be accessing the full range of engagement activities given so much of it is being promoted online.
It was suggested that there should first be a focus on engaging professionals in the energy sector (e.g. providers and engineers) and housing sector (e.g. landlords and housing associations). This was based on the view that they represent groups who have been under-engaged but who will be key to driving the transition forward. It was also felt that engagement with industry professionals first would present an opportunity to harness their influence among wider groups, to encourage action by sharing information and practical advice, and helping to tackle the spread of misinformation.
With the support of these sectors, focus should then be given to engaging the general public. There was a view among experts that focusing on early adopters first could help to encourage action among other more hesitant groups by building up a larger body of evidence of successful examples across different types of properties. This was seen as key to building trust in the efficacy of clean heating systems.
Tailoring messages
For engaging with industry professionals, it was felt that messages should provide clarity on the changes required and reassurance on the support available, as well as addressing any issues or hesitations that might be prevalent among these groups. An in-person approach to engagement with this group was considered necessary for this, to ensure any barriers are addressed directly.
For engaging the general public it was recognised that framing activities around the climate benefits would engage those who are already highly motivated by the climate crisis and more likely to be early adopters. It was felt that making it easier for them to take action (with clear and consistent messaging and practical advice) would in turn make it even easier for those less motivated by the climate crisis to take action as they could benefit from the experiences and knowledge of those who have already done it.
Highlighting the financial benefits and availability of grants and loans was identified as a key message that could be amplified more. This was seen to be particularly important for engaging members of the public for whom the upfront costs would be off-putting or those who are struggling with their energy bills already.
It was also felt that messages should be tailored, based on an understanding that different solutions will be needed for different groups and that the benefits/challenges associated will also be different depending on people’s circumstances (e.g. for those in houses compared to those in flats, and for those living in urban areas compared to those living in rural areas).
Overall, experts were in favour of more national-level campaigning – coordinated between the Scottish Government and key stakeholders – to raise awareness around the HiBs proposal and emphasise positive messaging around the heat transition. It was also felt that this would need to be supported by local-level public engagement that is tailored to, and addresses, the needs of different groups.
Building trust
There was a broad sense that any public engagement activity on the heat transition needs to first build a baseline understanding of heating systems, before engaging on transitioning between current and future systems. It was felt that priority should be given to improving basic understanding among general public about how boilers operate and start with simple changes they can make their homes more energy efficient.
Building on this, it was felt that public engagement should emphasise the needs and benefits of the transition to clean heating systems. At the same time, the importance of transparency in communicating the potential risks was also highlighted. Ensuring the availability of practical advice on how to navigate these risks and deal with challenges (particularly around installation and unforeseen costs), was felt to be missing from engagement currently.
Using trusted messengers – whether organisations already embedded in communities, those with technical knowledge (e.g. industry professionals), or a new group of independent advisers from a range of backgrounds – was seen as an effective vehicle for communicating these aspects of the transition. Experts interpreted trusted messengers in a range of ways, and further research would be beneficial to determine who the public would trust to deliver messages.
Regulatory clarity
Organisations delivering public engagement reported feeling limited in what they can deliver until it is clearer when the regulations will come into force, and what the regulations will include (i.e. the changes that people will be required to make in relation to clean heat and energy efficiency). There was a general understanding of the direction of travel, but it was felt that a lack of detailed information was limiting the effectiveness of communication and engagement on the heat transition in Scotland.
Regulatory clarity was therefore widely called for, although it was recognised that this would be difficult to provide until the legislation is finalised. Nevertheless, it was strongly suggested that regulatory and financial decisions need to be made first. Organisations delivering public engagement activities felt they needed clarity on what the regulations will be, when they will come into force, and what financial support will be available, so that they can be equipped to support their members, service users and the general public through the transition.
Appendices
Appendix A – detailed methodology
The research involved three strands:
- A web search to identify public engagement activities.
- Interviews with 10 experts representing a range of organisations involved in the heat transition.
- An online survey of organisations delivering public engagement activity.
Web search
The web search was initially conducted using a traditional online search method, whereby “Boolean search strings” were used in Google and Google Scholar. Search strings were created beforehand and then refined throughout the search process where necessary, to improve the relevance of results (see Appendix B for the full list of search strings used).
Ultimately, the traditional online search results were limited, and the majority of public engagement examples analysed were identified through using Ipsos’ proprietary social listening software, Synthesio. The software works by identifying mentions of specified terms (in a similar way as search strings) across the web, including platforms such as X (formerly Twitter), Facebook, YouTube, Instagram and Facebook.
The initial Synthesio search (using the search string listed in Appendix B) produced around 2,500 references to public engagement across these social media channels, which were reviewed by the research team. Through search refinement using key word filtering and further manual review, most mentions were ultimately excluded due to duplication or being out of scope.
An analysis of 62 instances of engagement that matched the inclusion criteria (as specified below). Details of these engagement examples were recorded in a mapping spreadsheet in Excel, by the research team. Examples from a previous, brief web search by the Scottish Government that did not appear in Ipsos’ web search were also included in the spreadsheet, along with a very small number of activities that Ipsos were already aware of.
Expert interviews
A longlist of potential organisations was generated by Ipsos following an initial web search and initial recommendations from the Scottish Government and ClimateXChange, and was reviewed by ClimateXChange and the Scottish Government. Organisations were selected on the basis that they could comment on public engagement on the heat transition (either from direct delivery experience or from involvement on the heat transition in other ways) and that they represented a range of perspectives. Experts were invited to take part via email and the profile of expert organisations included a mix of charities/advice services, climate hubs,[4] private companies, non-government organisations and industry bodies.
This strand of the research explored the different types of public engagement activities in more detail. A topic guide was developed by the Ipsos research team and reviewed by ClimateXChange and the Scottish Government (see Appendix C). Interviews lasted around 45 minutes each, and covered public engagement activities/communications recently delivered or known about, target audiences, perceived impact of engagement, any future activities planned, and views on current gaps in engagement.
Interviews also helped to identify potential organisations for inclusion in the online survey sample. Interviews were originally planned to be completed before the online survey fieldwork began. However, the decision was made to hold four interviews back until the online survey was underway. This decision was partly practical to be flexible around participants’ availability, but also to allow for survey responses to inform discussions and identify potential organisations to interview for a broader range of perspectives.
Online survey
The third strand of the research involved a five-minute online survey with organisations delivering public engagement activities in Scotland to explore the purpose and nature of these activities (e.g. key topics, target audience and impact). The questions were designed by Ipsos and reviewed by ClimateXChange and the Scottish Government (see Appendix D).
An initial sample of 78 contacts was generated by Ipsos through the web search and interviews, and the survey link was also shared by ClimateXChange and the Scottish Government through various email networks and communications channels, such as X (formerly Twitter) and the CXC newsletter, to broaden participation.
Two reminder emails were sent to the sample during the fieldwork period to boost response rates. The survey was live for five weeks, from 19 June to 24 July, and 34 completed responses were received. Of these, 25 organisations reported that they had delivered some form of public engagement in the last three years.
Appendix B – overview of web search
Web search strings
The following strings were placed into Google or Google Scholar:
- ‘Public engagement’ AND ‘Scotland’ AND [heat transition/ heat decarbonisation/ clean heating/ energy efficiency/ net zero heating/ green heating/ zero emission heating/ zero direct emission heating/ fabric first] OR
- ‘Public participation’ AND ‘Scotland’ AND [heat transition/ heat decarbonisation/ clean heating/ energy efficiency/ net zero heating/ green heating/ zero emission heating/ zero direct emission heating/ fabric first] OR
- ‘Deliberative/deliberation’ AND ‘Scotland’ AND [heat transition/ heat decarbonisation/ clean heating/ energy efficiency/ net zero heating/ green heating/ zero emission heating/ zero direct emission heating/ fabric first] OR
- ‘Public consultation’ AND ‘Scotland’ AND [heat transition/ heat decarbonisation/ clean heating/ energy efficiency/ net zero heating/ green heating/ zero emission heating/ zero direct emission heating/ fabric first] OR
- ‘Public dialogue’ AND ‘Scotland’ AND [heat transition/ heat decarbonisation/ clean heating/ energy efficiency/ net zero heating/ green heating/ zero emission heating/ zero direct emission heating/ fabric first] OR
- ‘Citizen engagement’ AND ‘Scotland’ AND [heat transition/ heat decarbonisation/ clean heating/ energy efficiency/ net zero heating/ green heating/ zero emission heating/ zero direct emission heating/ fabric first] OR
The following string was placed into Synthesio
(Scotland OR Edinburgh OR Glasgow OR Aberdeen OR Aberdeenshire OR Dundee OR Inverness OR Isles OR Isle OR Ayrshire OR Arran OR Islands OR Lothian OR Fife OR Highlands OR Perth OR “Outer Hebrides” OR Shetland OR Orkney OR Stirling OR Angus OR Dumfries OR Galloway OR Argyll) NEAR/5 (advice* OR consultation* OR discussion* OR event* OR conference* OR talk* OR “public service” OR report* OR session* OR lecture* OR conversation* OR public OR forum* OR seminar* OR workshop* OR outreach OR community OR engagement OR dialogue OR meeting* OR briefing* OR presentation* OR program* OR survey* OR roadshow* OR “public outreach”)) AND (“heat transition” OR “heat decarbonisation” OR “clean heating” OR “energy efficiency” OR “net zero heating” OR “green heating” OR “zero emission heating” OR “zero direct emission heating” OR “fabric first” OR “#EnergyEfficiency”)
Parameters
Across both searches, the following inclusion criteria were used:
- Topic: Public engagement related to heat transition/ energy efficiency. The research team included public engagement that is wider than just the Heat in Buildings agenda, but focused on engagement that is exclusively focused on the heat transition. (The relative focus on the heat transition in general climate change engagement was also mapped where relevant).
- Date: From October 2021 onwards (introduction of the Heat in Buildings Strategy in Scotland). This was reviewed during initial stages of searching and was deemed to be appropriate based on the volume of material available. The final eligible date for inclusion was 20th May 2024, corresponding with when the web review strand of the research ended.
- Methodology: “For the purposes of this research, “Public engagement” was understood as including various forms (e.g. public participation, public consultation, public dialogue) and methods.
- Geographical coverage: Scotland.
- Level: National- and potentially regional-level public engagement was initially prioritised for this project, rather than community-level. However, much of the engagement examples identified were at the more local, community-level and so relevant examples of these were also reviewed and included in the mapping.
- Language: English language (it was agreed that the research team would also record any search results in Gaelic, but this was not called for).
Appendix C – Topic guide for expert interviews
Introduction (3 mins)
Ipsos has been commissioned by ClimateXChange and the Scottish Government to conduct research into public engagement on the heat transition in Scotland.
As part of the research, we are conducting interviews with organisations across Scotland who have carried out, been involved in, or have a good awareness of, engagement activities with the public on the heat transition. This includes engagement on topics like clean heating and energy efficiency, low carbon technology and zero direct emissions heating systems. These interviews will help us obtain a fuller understanding about the types of activities that have been carried out so far.
The research will inform the delivery of the Scottish Government’s Heat in Buildings Public Engagement Strategy.
The interview should last about 45 minutes and everything you say will be treated in the strictest confidence. No identifying information about individuals will be included in the report, for example, if we would like to quote you, we will do it anonymously. ClimateXChange and the Scottish Government will not receive notes from individual interviews or attributable comments.
Participation is voluntary and you can change your mind at any time, up until the report is published.
- We would like to record the discussion for analysis purposes. It will not be provided to anyone outside of the Ipsos research team. The recordings will be securely stored and will be destroyed three months after we have completed the evaluation.
Do I have your permission to record?
Turn on the recorder and record consent to take part and for the discussion to be recorded.
Do you have any questions before we begin? Are you happy to proceed?
Background (3-5 mins)
To start with, can you tell me a bit about yourself and your role at [organisation].
What, if anything, do you know about the Scottish Government’s Heat in Buildings Strategy?
IF NECESSARY: The strategy was published in October 2021, and sets out how the Scottish Government will achieve warmer, greener and more energy efficient heating in domestic and non-domestic buildings in Scotland. It established a target of decarbonising all properties in Scotland by 2045, including the approximately 2 million homes that currently use mains gas as their primary heating fuel.
And what, if anything, do you know about the Scottish Government’s Heat in Buildings Public Engagement Strategy?
IF NECESSARY: The Heat in Buildings Public Engagement Strategy provides an overview of how Scottish Government will work with other stakeholders to deliver a programme of public awareness raising, education and participation around clean heat and energy efficiency, in order to meet targets set out in the Heat in Buildings Strategy.
PROBE:
- General views on strategy – any positives, negatives
- Does organisation have a specific strategy / business plans in relation to this?
Overview of activities (10-15 mins)
We are interested in finding out about the different types of activities organisations may have carried out over the last three years to engage members of the public in relation to the heat transition to net zero emissions in Scotland. Can you tell me about any activities that your organisation has…
- Carried out over the last three years to engage the public on this topic?
- Contributed to or supported in some way?
- Been aware of (but not been involved in)?
Interviewer: note down examples initially raised by stakeholder, then gather information about each one in relevant section (apportioning time on each section depending on the number of examples relavant to each).
At this stage probe for brief details about each activity (explain you will ask for more detail after you’ve heard about all the different types of activities carried out):
- what was it about?
- what did it involve / how was it carried out?
- who was it carried out with? target audience?
- was anything published / any information available online?
- (if yes – interviewer does not need to spend time collecting factual information that will likely be in the report – focus on key questions instead).
Note to interviewer: if there are lots of activities to discuss and the stakeholder is not able to stay on the call, ask if they would be willing to share details of the remaining examples by email.
A – Information about activities the organisation delivered themselves (10-15 mins)
I’d now like to ask you a bit more about the [activity/activities] you mentioned.
It would be useful to know more about what took place, and your thoughts on how well you think this method of engagement worked and any impact it may have had.
You might not have all the answers, which is absolutely fine.
Interviewer: ask about each (relevant) activity mentioned in turn with remaining time. ask or adapt questions depending on the type and format of engagement activity being described. if short on time or if there are lots of examples, prioritise those that are newly uncovered, unpublished or that we have not collected details about already.
ensure that you leave five minutes at end to ask the future engagement section.
- What was the purpose or overall aim of the activity?
- Who was the activity aimed at? General public or specific groups?
Probe on groups such as:
- Particular geographical areas;
- Socio-economic groups;
- People living in particular types of properties
- Homeowners/landlords/renters
- Based on protected characteristics – disability, ethnicity
- other groups
- Why were you interested in engaging with [this group / these groups] in particular? Why was this important?
PROBE IF NECESSARY:
- How did you identify there was a need to engage with this group?
I’d now like to ask about the topics that were covered and the way those topics were communicated to the public…
- What areas / topics did the activity cover?
PROBE:
- What were the main / key messages being communicated / delivered by the activity?
- Why were these particular messages chosen?
- And were any steps taken to make it easier for people to take part or engage with the activity?
PROBE:
- Design of materials
- Language (e.g. use of plain English; terminology used; Gaelic)
- Location of activity (any considerations for urban/rural audiences)
- How engaged / method of engagement
- Why did you do this? Were there any groups of people you thought may have struggled to understand/engage with the activity otherwise?
- What is your understanding of the impact this activity has had? Did it achieve its goals/aims?
- If yes – In what ways would you say the activity was successful?
- If too early to tell / not sure:
- Why is that? (clarify whether activity was too recent, or if the impact is expected to be over longer term e.g. it will take a while for people to install heat pumps)
- What do you hope that the impact of the activity will be?
- PROBE: Was the impact or success of the activity measured in any way?
- Why do you think it was successful / unsuccessful?
- If not previously mentioned: And do you think it was it successful at reaching the target audience?
- Were there any groups of people missing?
- IF YES: What were the reasons for that?
- Does your organisation have any future plans to further engage the public on the heat transition to net zero emissions?
- IF YES:
- What? When?
- Who is the target audience (and why)?
- Are these plans based on learnings from any previous engagement?
B – Information about activities the organisation contributed to in some way (5-10 mins)
Thinking now about the other [activity], which you mentioned being involved in.
- If not covered already – What was involved in the activity?
- What was the purpose or overall goal of the activity?
- If not covered already – What was your organisation’s involvement?
- What were the main / key messages being communicated / delivered by the activity?
- Who was the activity aimed at? General public or specific groups? Probe on reasons for this (if known)
- Do you know if the target audience was reached successfully?
- Any groups not reached successfully?
- Do you think it was it easy or difficult for people to take part and engage with the information provided [or to attend the activity]?
- What is your understanding of the impact the activity had? Probe on what went well, any challenges, what could be improved
C – Information about activities that the organisation is aware of (5-10 mins)
Moving onto [activity], which you said you were aware of.
- If not covered already – What was involved in the activity?
- If not covered already – Who delivered the activity?
- What were the main / key messages being communicated / delivered by the activity?
- Who was the activity aimed at? General public or specific groups? Probe on reasons for this (if known)
- Do you know if the target audience was reached successfully?
- Any groups not reached successfully?
- Do you think it was it easy or difficult for people to take part and engage with the information provided [or to attend the activity]?
- What is your understanding of the impact the activity had? Probe on what thought went well, any challenges, what could be improved
Engagement gaps (5 minute)
Interviewer: ask all
Finally, I’d like to ask if you think there are any gaps in the engagement activities that have been carried out so far on the heat transition. For example, in terms of the groups of people being targeted or the types of activities being carried out.
- First of all, as far as you are aware, are there any groups of people you think are missing from the activities that have been carried out the heat transition in Scotland so far?
Probe:
- Why do you think this is?
- Are there any groups of people that your organisation would have liked to have engaged but have been unable to so far?
- And are there any particular types of public engagement activities not currently happening that you think should be?
- If yes: What? When? Who should the target audience be (and why)?
- Do you think you would benefit from any advice or support on public engagement in relation to the heat transition in Scotland?
- If yes: What would you find useful?
Close (3 mins)
That’s all the questions I wanted to ask you today, unless you think there is anything else we might have missed which would be useful for us to know?
Thanks. In the next few weeks, we will be conducting follow up research among organisations across Scotland responsible for delivering public engagement activities on the heat transition. This will comprise a short, 5-minute online survey asking about activities or communications being delivered. Would you, or someone else from your organisation, be willing to take part in the survey?
If yes: take contact details (name, email)
We are keen to invite as many organisations as possible to take part in the survey. Can I check, are there any other organisations or people you are aware of who are delivering public engagement activities on the heat transition that you think we should invite to take part in the survey?
Finally, the ClimateXChange and Scottish Government research teams may wish to conduct follow up research about this topic within the next 2 years. Are you willing to have your name and contact details passed on to the ClimateXChange and Scottish Government teams for this purpose?
Thank you so much for taking the time to speak to me today, it’s been really helpful.
Appendix D – online survey questionnaire
ASK ALL.
QWORK: First of all, which of the following best describes who you work for?
- Charitable organisation
- Community group
- Education or research institute
- Local authority
- Non-Governmental organisation
- Non-profit organisation
- Private sector organisation
- Scottish Government department
- Social enterprise
- Other – please specify:
- Don’t know
ASK ALL.
How much, if anything, would you say you currently know about the Scottish Government’s Heat in Buildings Strategy?
- A great deal
- A fair amount
- Just a little
- Heard of it but know nothing about it
- Never heard of it
ASK ALL.
Q1. As you may know, the Scottish Government’s Heat in Buildings Strategy aims to transform Scotland’s buildings and the systems that supply their heat, as part of the transition to net zero emissions by 2045. This includes working to support the rapid adoption of zero emissions systems for home heating, such as heat pumps and district heat networks.
Have you, or your organisation, carried out any activities over the last three years to engage members of the public about changing their home heating systems?
- Yes
- No
- Don’t know
IF YES AT Q1.
Q2. Which of the following categories would those activities most closely fall under? MULTICODE
- Workshops
- Public information campaigns
- Open days or showcases
- Lectures / talks
- Training or knowledge-sharing sessions
- Providing information online
- Consultations
- Citizens Panel
- Advice service (in person)
- Advice service (online)
- Advice service (telephone)
- Other – please specify:
ASK IF YES AT Q1
Thinking about the most recent activity that you / your organisation carried out…
Q3. Which of the following topics, if any, were covered by the activity? MULTICODE
- General provision of energy efficiency advice/information
- Information about Scottish Government’s Climate Change Plan / net zero targets
- Improving the energy efficiency of households (such as through improving home insulation)
- Installing air source or ground source heat pumps
- District heating networks
- Other types of clean heating systems*
- Provision of information about grants / loans
- Other – please specify:
- Don’t know
ASK IF YES AT Q1
Q4. Which groups, if any, was the activity targeted at? MULTICODE
- General public (no specific target groups) at national level
- General public (no specific target groups) at regional or local level
- Businesses or people working in the energy sector
- Homeowners
- Private renters
- Those renting their home from a local authority or housing association
- Landlords
- Low-income households
- Households in urban areas
- Households in rural areas
- Households using gas/oil heating
- People with protected characteristics (e.g. disabled people, minority ethnic groups)
- People in fuel poverty
- Older people
- Younger people
- Other – please specify:
- Don’t know
Q5. What was the main reason or reasons for focusing the activity on those groups in particular?
- OPEN TEXT
- Don’t know / not sure
ASK IF CODE 1 AT Q1.
Q6. To what extent do you agree or disagree with the following statements about the activity?
- The activity was effective at reaching its target audience.
- The activity was effective at improving the target audience’s awareness / understanding of the issue.
- Members of the public took action as a result of engaging with the activity.
- Members of the public decided to change their home heating system to a zero direct emissions heating system as a result of engaging with the activity.
- It was easy for members of the public to take part and engage with the activity / the information provided.
ANSWER OPTIONS
- Strongly agree
- Tend to agree
- Neither agree nor disagree
- Tend to disagree
- Strongly disagree
- Too early to tell
- Not relevant
- Don’t know
ASK IF YES AT Q1.
Q7a Has your organisation carried out an evaluation of any of its public engagement activities?
- Yes
- No
- Don’t know
ASK IF YES AT Q7a.
Q7b. Would you be willing to share this information with the ClimateXChange and Scottish Government research team, to allow them to understand more about the impact of public engagement activities on this topic? SINGLE CODE
- Yes
- No
- Don’t know
SHOW IF CODE 1 AT Q7b
Thank you, please send this information to UK-PA-HeatTransition@ipsos.com and let us know if there is anything you would not like to be shared with the ClimateXChange and Scottish Government research team.
Select ‘Next’ to move on to the next question.
ASK ALL.
Q8. Do you or your organisation have any plans to deliver public engagement activities on the heat transition in Scotland in the future?
- Yes
- No
- Don’t know
ASK IF CODE 1 AT Q8
Q9. Could you tell us more about your future plans, including what the activities will involve and who they will be targeted at?
- OPEN TEXT
- Don’t know / not sure
ASK ALL.
Q10: Are you aware of any activities that have been carried out over the last three years by other organisations to engage members of the public in relation to the heat transition to net zero emissions in Scotland?
- Yes
- No
- Don’t know / Can’t remember
IF YES AT Q10.
Q11. What types of public engagement activities are you aware of that have been carried out over the last three years? MULTICODE.
- Workshops
- Public information campaigns
- Open days or showcases
- Lectures / talks
- Training or knowledge-sharing sessions
- Providing information online
- Consultations
- Citizens Panel
- Advice service (in person)
- Advice service (online)
- Advice service (telephone)
- Other – please specify:
ASK IF CODE 1 AT Q10.
Q12. What topics did that activity / did those activities relate to? MULTICODE
- General provision of energy efficiency advice/information
- Information about Scottish Government’s Climate Change Plan / net zero targets
- Improving the energy efficiency of households (such as through improving home insulation)
- Installing air source or ground source heat pumps
- District heating networks
- Other types of clean heating systems*
- Provision of information about grants / loans
- Other – please specify:
- Don’t know
ASK IF CODE 1 AT Q10.
Q13. And, as far as you are aware, which of the following groups of people / households did this activity/ those activities focus on? MULTICODE
- General public (no specific target groups) at national level
- General public (no specific target groups) at regional or local level
- Businesses or people working in the energy sector
- Homeowners
- Private renters
- Those renting their home from a local authority or housing association
- Landlords
- Low-income households
- Households in urban areas
- Households in rural areas
- Households using gas/oil heating
- People with protected characteristics (e.g. disabled people, minority ethnic groups)
- People in fuel poverty
- Older people
- Younger people
- Other – please specify:
- Don’t know
ASK ALL
Q14. Which of the following groups of people, if any, do you think would benefit from more support or information on the heat transition in Scotland? MULTICODE
- General public (no specific target groups) at national level
- General public (no specific target groups) at regional or local level
- Businesses or people working in the energy sector
- Homeowners
- Private renters
- Those renting their home from a local authority or housing association
- Landlords
- Low-income households
- Households in urban areas
- Households in rural areas
- Households using gas/oil heating
- People with protected characteristics (e.g. disabled people, minority ethnic groups)
- People in fuel poverty
- Older people
- Younger people
- Other – please specify:
- Don’t know
© The University of Edinburgh
Prepared by Ipsos Scotland on behalf of ClimateXChange, The University of Edinburgh. All rights reserved.
While every effort is made to ensure the information in this report is accurate, no legal responsibility is accepted for any errors, omissions or misleading statements. The views expressed represent those of the author(s), and do not necessarily represent those of the host institutions or funders.
Synthesio is an Ipsos proprietary tool that trawls the social web and mainstream media to monitor online presence and identify posts, re-posts and tags on a given topic (in this case, public engagement on the heat transition in Scotland). ↑
https://moneysavingboilerchallenge.com/ ↑
https://www.thursocdt.co.uk/helpandsupport ↑
Climate hubs are volunteer-led networks that supports community-led action across Scotland’s regions: https://www.gov.scot/policies/climate-change/community-led-climate-action/ ↑
Research completed: October 2024
DOI: http://dx.doi.org/10.7488/era/5354
Executive summary
Scotland has set ambitions in its Hydrogen Action Plan to install at least 5 gigawatts of renewable and low-carbon hydrogen production capacity by 2030, and 25 gigawatts by 2045. Given Scotland’s hydrogen export ambitions, it is critical to understand any barriers to compliance with standards in potential markets, as well as Scotland’s international competitiveness as a hydrogen exporter.
Aims of the project
The main objectives of this study are to compare existing and developing hydrogen sustainability standards globally; and to compare the greenhouse gas (GHG) emissions of hydrogen and derivatives exported from Scotland to the EU market with those from other regions in meeting EU requirements.
Findings and recommendations
Key hydrogen standards globally already set out different GHG calculation methodologies and compliance requirements for producers. Hydrogen imported to the EU market currently must comply with rules set by the EU Renewable Energy Directive (RED) and the EU Gas Directive, if they are to contribute towards targets set under these policies. While an international standard is being developed (ISO 19870), it is unclear if the UK or EU will align with it in the future.
With regard to GHG emissions, electrolytic hydrogen produced in Scotland and exported to the EU market could be one of the most competitive from the countries we studied. Today, electrolytic hydrogen produced from renewable electricity in Scotland can already meet the EU RED GHG emission threshold (Figure 1). We refer to the GHG intensity of electricity used for Scotland pathways as the “Scottish grid” and use the National Grid country GHG intensity for Scotland rather than the GB grid electricity average GHG intensity. Of the other countries we considered, only Norway, with a grid that uses mainly hydro-electric power, can deliver electrolytic hydrogen to the EU with lower GHG emissions than Scotland. Further grid decarbonisation would increase the likelihood of compliance for hydrogen made from grid power, known as grid-connected electrolysis, by 2030. This would be the case even if, under EU rules, the Great Britain (GB) grid average factor has to be used instead of the (much lower) Scottish grid average.
When transported over short distances as compressed hydrogen via pipelines or ships, electrolytic hydrogen produced using low-carbon electricity is expected to meet the EU GHG threshold. This is applicable in both 2023 and 2030 to renewable hydrogen produced in Scotland, Norway and Morocco, and to hydrogen produced from nuclear power in France (Figure 1).
Transporting hydrogen as ammonia leads to significantly higher GHG emissions. Producers who rely on ammonia for long-distance transport from countries such as Chile and the USA may need to reduce emissions further to comply with EU policies, particularly if ammonia is reconverted to hydrogen for final use. Over shorter distances, hydrogen produced in Scotland or Norway using renewable electricity and transported as ammonia is likely to comply with the EU GHG emission threshold by 2030 (Figure 1). France will only meet the EU threshold if ammonia is used as the end-product in 2030 due to additional emissions from nuclear electricity inputs. Meeting the threshold requires further emission reduction measures such as using renewable electricity for hydrogen distribution.
Only countries with a high share of low-carbon electricity on their grid can meet the EU GHG emission threshold for hydrogen produced from grid electricity. In 2023, hydrogen produced from grid electricity in Norway could already meet the EU threshold when transported as compressed hydrogen. This could also be achieved in Scotland if compressed hydrogen is transported via pipelines. In 2030, all production pathways in Scotland can meet the EU threshold if the GHG emission intensity of grid electricity (emissions per kilowatt-hour of electricity generated) specific to Scotland decreases in line with policy aspirations. If using the GB grid emission intensity, only the pipeline transport pathway could meet the threshold by 2030, with grid decarbonisation in line with policy ambitions. Hydrogen produced from grids heavily reliant on fossil fuels such as those in Morocco, Chile and the USA will not be compliant (Figure 2).
Many natural gas pathways modelled will not comply with the EU Gas Directive threshold. These pathways are highly sensitive to the GHG intensity of upstream natural gas production, which is uncertain and can be highly variable depending on the source (e.g. imported LNG with high intensities). Based on the default upstream natural gas intensity published in the EU RED Delegated Act 2023/1185 (as the EU Gas Directive Delegated Act is not yet finalised), hydrogen produced from natural gas in the UK could be compliant when piped or shipped as compressed hydrogen (Figure 3). This would give it an emissions advantage over US natural gas-derived hydrogen, which is transported via ammonia.
GB’s electricity grid as a whole has a significantly higher GHG intensity than Scotland, so further clarity on the definition of bidding zones in the EU RED Delegated Act is critical. Using the GB grid GHG intensity average for grid-electrolysis projects in Scotland results in high risk of non-compliance with the EU GHG threshold whereas using data specific to Scotland would confer significant advantages on grid electrolysis projects, including exemptions from some EU requirements.
This GHG emission analysis could be combined with the previous ClimateXChange cost analysis to evaluate the overall competitiveness of these hydrogen pathways. Further work could provide a view on the costs of adopting renewable electricity across all the post-production supply chain steps, alternative renewable heat for the ammonia cracking step of relevant pathways and/or switching in 2030 to using only zero emission marine fuels for shipping pathways. Implementing the hydrogen and ammonia pathways modelled in this study may require significant investment in new infrastructure for some countries, and these infrastructure needs and any first-mover advantages could be investigated further.

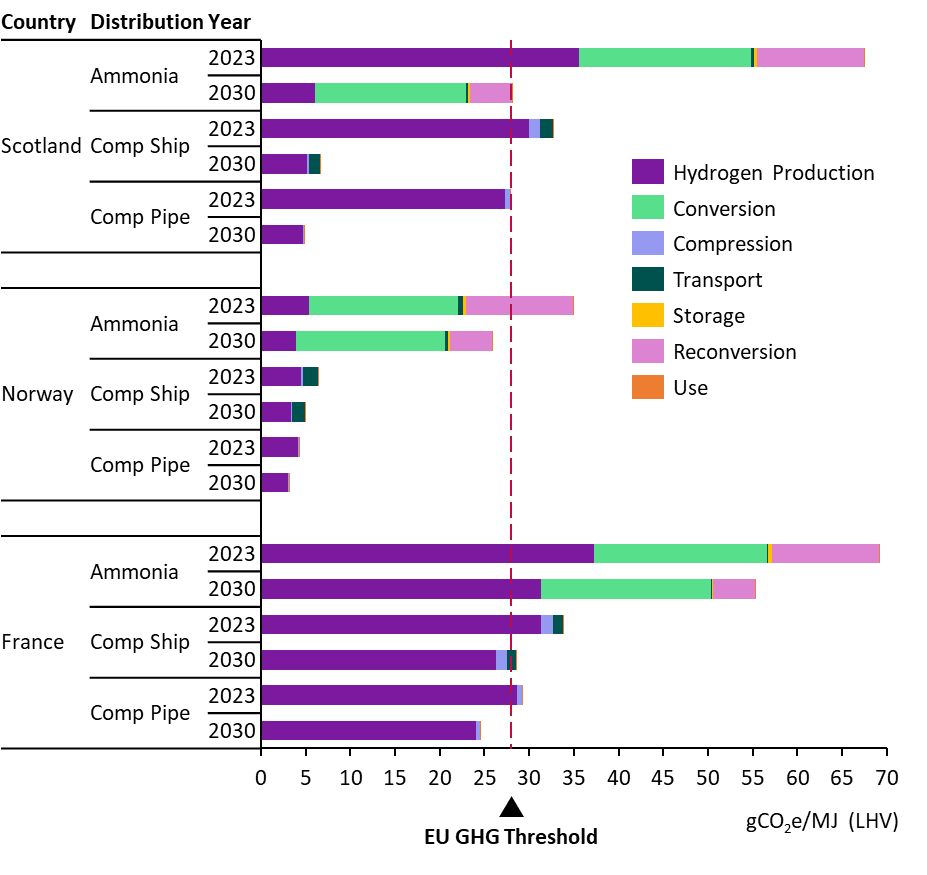

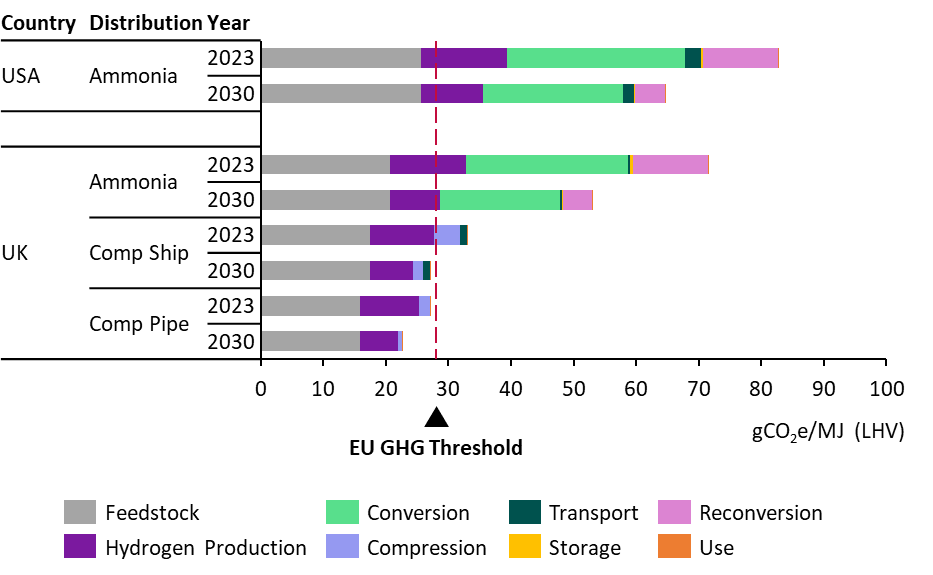
Abbreviations table
|
ATR |
Autothermal Reforming |
|
CCR |
Carbon Capture and Replacement |
|
CCS |
Carbon Capture and Storage |
|
CCU |
Carbon Capture and Utilisation |
|
CfD |
Contract for Difference |
|
CO2 |
Carbon Dioxide |
|
DA |
Delegated Act |
|
DESNZ |
Department for Energy Security and Net Zero |
|
EU RED |
European Union Renewable Energy Directive |
|
H2 |
Hydrogen |
|
GB |
Great Britain |
|
GH2 |
Green Hydrogen Standard |
|
GHG |
Greenhouse Gas |
|
GO |
Guarantee of Origin |
|
GREET |
Greenhouse gases, Regulated Emissions and Energy use in Transportation model |
|
GTP |
Global Temperature Potential |
|
GWP |
Global Warming Potential |
|
IPHE |
International Partnership for Hydrogen and Fuel Cells in the Economy |
|
IRA |
Inflation Reduction Act |
|
ISO |
International Organization for Standardization |
|
LCHS |
Low Carbon Hydrogen Standard |
|
LHV |
Lower Heating Value |
|
MJ |
Megajoule |
|
MPa |
Megapascal |
|
PPA |
Power Purchase Agreement |
|
PTC |
Production Tax Credit |
|
RCF |
Recycled Carbon Fuel |
|
REC |
Renewable Energy Certificate |
|
RES |
Renewable Energy Source |
|
RFNBO |
Renewable Fuel of Non-Biological Origin |
Introduction
In the 2022 Hydrogen Action Plan, Scotland set ambitions to install at least 5 gigawatts of renewable and low-carbon hydrogen production capacity by 2030, and 25 gigawatts by 2045 (Scottish Government, 2022). Given Scotland’s significant potential for hydrogen production using renewable electricity, the government has also published its Hydrogen Sector Export Plan (HSEP).
Low-carbon hydrogen is a nascent market, as most hydrogen used today is derived from fossil sources. As such, regulations, standards and schemes are being put in place globally to promote the use of low-carbon hydrogen, as well as to ensure that its production and use are sustainable. For example, in the UK, the Low Carbon Hydrogen Standard (DESNZ, 2023) has been established and continues to evolve. EU rules exist for renewable hydrogen pathways and are being developed for non-renewable pathways. Additionally, a global standard for hydrogen lifecycle GHG emissions is under development.
The main objective of this study is to compare existing and developing hydrogen lifecycle GHG standards globally and quantify how the GHG emissions (including not only carbon dioxide but other GHGs such as methane and nitrous oxide) of Scottish exports to the EU, in various forms, would compare against those from other regions in meeting EU requirements. Results from this report supported the development of the Hydrogen Sector Export Plan (HSEP) by identifying potential barriers to compliance with standards in potential markets, as well as Scotland’s international competitiveness as a hydrogen exporting country.
This report is a follow-up to a previous CXC project: “Cost reduction pathways of green hydrogen production in Scotland – total costs and international comparisons” (Arup, 2024).
International hydrogen standards
Several hydrogen standards, sustainability schemes and policies have recently been developed to support the implementation of national hydrogen strategies around the world. These standards typically set out a GHG emission calculation methodology and (where applicable) a maximum GHG emission intensity, as well as broader sustainability criteria and evidence requirements for eligible hydrogen pathways to comply with.
This section provides summary tables of those standards/schemes/relevant policies (referred to as standards thereafter when referenced collectively) listed in Table 1 and provides a snapshot of the key criteria. A detailed review of each standard can be found in Appendix B which focuses the discussion on key differences, along with key uncertainties and potential changes. The UK Low Carbon Hydrogen Standard (LCHS) is used as a benchmark for this comparison, as it sets the requirements for producers in Scotland receiving UK Government support. This review includes:
The scope of each standard, including:
- The type of standard (mandatory, voluntary), and who it was developed by.
- Geographies covered.
- Implementation status.
Eligibility criteria:
- Conversion technology or feedstock restrictions, including any biomass feedstock sustainability rules.
- Any GHG emission intensity thresholds.
- Any categories of hydrogen labelled by the standard.
GHG calculation methodology, including:
- System boundary – which parts of the supply chain are in or out of scope of the GHG emissions calculations. This can vary between standards, thereby potentially omitting or including significant emissions, and making comparison of results challenging between different standards.
- Splitting of emissions across co-products. When systems produce multiple outputs (product, co-products, wastes, residues, etc.), GHG emissions must be assigned between them. This can be done through various approaches, including through an allocation of emissions based on the relative masses, energy contents or economic value of the (co-)products. This can also be done by looking at the products these co-products would replace in the market (via system expansion) to assign substitution credits. Typically, wastes and residues are not assigned emissions. A full discussion of the various methods is provided in Appendix A.
- Reference flow – a set pressure and/or purity for the hydrogen product. Hydrogen produced at a lower pressure or purity may be required to account for the emissions for theoretical compression and/or purification to reach the reference flow, and in some standards, hydrogen produced at a higher pressure and/or purity than the reference may be given an emissions credit.
Other relevant requirements, such as:
- Chain of custody. This is the process of following and evidencing materials through steps of the supply chain, which provides insights into the product’s origin, components, processes, and handlers. As illustrated in Appendix A, there are different chain of custody models, and while some standards are explicit and prescriptive in their requirements on how to trace feedstocks and hydrogen products, others are not; and
- Renewable electricity sourcing. Some standards may impose requirements to ensure the use of renewable electricity for hydrogen production does not negatively impact the wider grid. These can include temporal correlation (matching generation with consumption over defined time periods), geographical correlation (rules about locations and grid connections) and “additionality” (hydrogen production contracting with new, rather than existing, renewable electricity generation).
In addition to national or regional standards and policies, and several voluntary schemes[1], a global hydrogen lifecycle GHG standard is also currently being developed by the International Organization for Standardization (ISO). This could enable greater harmonisation of GHG emission calculation methodologies across the globe. The implications of this scenario will be explored further in Chapter 3.
|
Region |
Relevant hydrogen standards[2] |
|---|---|
|
UK |
|
|
EU |
|
|
US |
|
|
International |
|
Summary of hydrogen standards
|
Standard |
Geographic scope |
Type of standard |
Status |
System boundary |
|---|---|---|---|---|
|
UK LCHS |
UK producers |
Mandatory government standard for accessing subsidy schemes |
Implemented. V3 is live (Dec 2023) |
Cradle to production gate |
|
EU RED |
Hydrogen consumed in the EU |
Directive (with Delegated Acts) |
REDII (Dec 2018) is fully transposed into Member State legislation and Delegated Acts (Feb 2023) are live. REDIII implemented (Oct 2023) but still being transposed |
Cradle to use |
|
EU Gas Directive |
Hydrogen consumed in the EU |
Directive (with draft Delegated Act) |
Implemented (July 2024), but still being transposed into Member State legislation. Delegated Act is pending, due by July 2025 |
Cradle to use |
|
CertifHy |
Hydrogen producers in EU, EEA and CH |
Voluntary standard, industry developed |
Implemented. V2 is live (April 2022) |
Cradle to production gate |
|
France Energy Code L. 811-1 |
Hydrogen consumed in France |
Mandatory standard for accessing subsidies, Government developed |
Implemented. V1 is live (July 2024) |
Cradle to use |
|
US IRA 45V |
US producers |
Tax credit |
Implemented. March 2024 revision is live |
Cradle to production gate |
|
IPHE |
Global producers and consumers |
Voluntary transnational effort on GHG methodology harmonisation |
Implemented. V3 is live (July 2023) |
Cradle to use |
|
ISO 19870 |
Global producers |
Voluntary standard, ISO developed |
Technical Specification published in Dec 2023, full standard 19870-1 under revision during 2024, due to be finalised in 2025 |
Cradle to production gate. ISO 19870 series will next look at downstream hydrogen vectors |
|
TÜV SÜD |
Global producers |
Voluntary standard, industry developed |
Implemented. V 11/2021 is live (Nov 2021) |
Cradle to production gate (GreenHydrogen), or to point of use (GreenHydrogen+) |
|
TÜV Rheinland |
Global producers |
Voluntary standard, industry developed |
Implemented. V2.1 is live (March 2023) |
Cradle to production gate or to point of use |
|
GH2 |
Global producers |
Voluntary standard, industry developed |
Implemented. V2 is live (Dec 2023) |
Cradle to production gate |
|
Scheme |
GHG threshold |
Category |
Eligible pathways |
Eligible main inputs |
Biomass sustainability |
|---|---|---|---|---|---|
|
UK LCHS |
20 gCO₂e/MJLHV |
“Low carbon” |
Electrolysis, Fossil/Biogenic gas reforming with CCS, Biomass/Waste gasification, Gas splitting producing Solid Carbon. Pathways can be added |
Electricity (all types), Fossil fuels, Biomass, Bio/fossil wastes & residues |
Biomass inputs must meet relevant Forestry, Land and/or Soil Carbon criteria, and report indirect land use change GHGs |
|
EU RED |
28.2 gCO₂e/MJLHV |
“Biofuel”, “RFNBO”, “RCF” |
All production pathways eligible but feedstock dependent |
Renewable electricity, Biomass & Fossil wastes |
Biomass feedstocks must meet relevant Forestry, Land and/or Soil Carbon criteria |
|
EU Gas Directive |
28.2 gCO₂e/MJLHV |
“Low carbon fuel” |
All pathways eligible |
Non-renewable energy sources |
Follows RED, where applicable |
|
CertifHy |
36.4 gCO₂e/MJLHV |
“Green” |
All pathways eligible |
Renewable energy sources |
Not specified |
|
“Low-carbon” |
Non-renewable sources | ||||
|
France Energy Code L. 811-1 |
28.2 gCO₂e/MJLHV |
“Renewable”, |
RFNBOs, RCF, nuclear-based |
Follows EU RED and adds nuclear electricity |
Follows EU RED |
|
US IRA 45V |
Increasing tax credits at 33.3, 20.6, 12.5 or 3.75 gCO₂e/MJLHV |
“Clean” |
All pathways eligible. Those not in 45V-GREET can apply for a “provisional emissions rate” |
Electricity (all types), Fossil fuels, Biomass |
None |
|
IPHE |
None, only a method |
No categories |
Electrolysis, steam cracking, fossil gas reforming + CCS, coal or biomass gasification + CCS, biomass digestion + CCS. More will be added |
Fossil fuel, Biomass, Bio/fossil wastes & residues |
Not specified |
|
ISO 19870 |
None, only a method |
No categories |
All pathways eligible |
Feedstock neutral |
None |
|
TÜV SÜD |
28.2 gCO₂e/MJLHV |
“Green” |
Electrolysis, Biomethane steam reforming, Glycerine pyro-reforming |
Renewable electricity, Bio waste/residue, Biomass |
Biomass feedstocks must meet EU RED criteria |
|
TÜV Rheinland |
28.2 gCO₂e/MJLHV |
“Renewable” |
Renewable electrolysis |
Renewable electricity |
Not specified |
|
“Low-carbon” |
All production pathways |
Feedstock neutral | |||
|
GH2 |
8.33 gCO₂e/MJLHV |
“Green” |
Electrolysis |
Renewable electricity |
Low iLUC risk, non-biodiverse land |
|
Scheme |
Chain of Custody |
Co-product allocation |
Reference flow |
Renewable power evidence |
|---|---|---|---|---|
|
UK LCHS |
Mass balance used, but cannot blend biomethane with nat gas (upstream) |
LHV energy allocation (Carnot efficiency for heat), plus system expansion for waste fossil feedstock counterfactual |
3 MPa, 99.9 vol% purity. If below, adjustment required |
Additionality not required. PPA with 30-minute temporal correlation from UK generator needed, or avoided curtailment proof |
|
EU RED |
Mass balance (H2 + upstream) |
LHV energy allocation (Carnot efficiency for heat). If co-product ratio can change, physical causality used. If co-product has zero LHV, economic allocation used |
None |
Renewable PPAs complying with additionality, temporal and geographic correlation rules |
|
EU Gas Directive |
Mass balance (H2 + upstream) |
Assumed to follow EU RED |
None |
In line with EU RED Delegated Act for RFNBOs |
|
CertifHy |
Book & Claim as GOs allowed (upstream) |
Defined approach for each pathway broadly follows EU RED. O2 method TBC |
Same as UK LCHS |
GOs are allowed. No additional requirements. |
|
France |
Follows EU RED |
Follows EU RED |
None |
Follows EU RED |
|
US IRA 45V |
None specified, but proposed mass balance for biomethane (upstream) |
System expansion. Restrictions placed on the size of steam co-product credit |
2 MPa, 100% purity. Adjustment required for higher/lower |
PPAs complying with additionality, temporal and geographic correlation |
|
IPHE |
None specified but GOs allowed (upstream) |
Follows hierarchy but recommended approach for each pathway differs |
Not specified |
GOs are allowed. Additionality not required. |
|
ISO 19870 |
None specified but GOs allowed (upstream) |
Can be system expansion or attributional. Approach defined for pathways differ |
None. GHG increase to reflect impurities and their release |
Grid GOs are allowed if ISO 14064-1 “proper quality criteria” are met |
|
TÜV SÜD |
Mass balance (H2 + upstream) |
Follows EU RED, but chlor-alkali has choice of energy allocation, economic allocation or system expansion |
Same as UK LCHS |
GreenHydrogen must follow EU RED. GreenHydrogen + must meet more stringent additionality rules. |
|
TÜV Rheinland |
None specified but assumed to follow EU RED & Gas Directive |
Assumed to follow EU RED & Gas Directive |
None |
PPAs to have temporal correlation (up to yearly) and geographic correlation within the same country. Additionality not required. |
|
GH2 |
Follows IPHE |
System expansion recommended, as oxygen nil LHV |
Same as UK LCHS |
Additionality, temporal and geographical correlations are allowed but not required |
Lifecycle GHG emission intensity of hydrogen pathways for import to the EU market
The GHG emission intensity of various hydrogen pathways from Scotland and other exporting countries were calculated using ERM’s in-house GHG assessment model. The hydrogen pathways modelled used a combination of the production, distribution, and use steps, set out in Table 5 below. For a comprehensive list of the GHG pathways modelled, refer to Appendix D, and see Table 8 for the assumptions and references used in the modelling process.
|
Production location |
Hydrogen production types |
Hydrogen transport |
Final use |
|---|---|---|---|
|
Scotland Norway France Morocco USA Chile UK |
Electrolysis using grid electricity Electrolysis using renewable electricity (excluding France) Electrolysis using nuclear electricity (only in France) Natural gas autothermal reforming with carbon capture & sequestration (ATR + CCS) |
Ammonia shipping Ammonia shipping with reconversion to hydrogen Compressed hydrogen shipping Compressed hydrogen pipeline |
Hydrogen in refinery boiler Ammonia in marine vessel |
Methodologies used to model lifecycle GHG emission intensity of imported hydrogen pathways
Section 2 detailed the various GHG calculation methodologies and compliance requirements set by key hydrogen standards that are currently active globally. In the EU market, EU RED and the EU Gas Directive currently set the eligibility criteria and the methodology for calculating the GHG emission intensity for imported hydrogen. As the hydrogen market becomes more established and globalised, there could be growing interest globally in harmonising approaches for GHG accounting (e.g. through alignment with ISO 19870). However, the EU has not yet expressed any intentions to do so. As such, two scenarios can be envisioned regarding possible evolutions of the EU’s approach for calculating life-cycle GHG emissions of hydrogen:
- Business-as-usual: The EU RED and EU Gas Directive will continue to apply for hydrogen imported in the EU, regardless of global methodologies such as ISO 19870.
- International alignment: The EU aligns with ISO 19870 at some future point in time, after publication.
The components of calculating the GHG emissions under these scenarios can be found in Appendix C. The key methodological differences considered during modelling include:
- System boundary: The system boundary for EU policies is ‘cradle-to-use’, whereas ISO/TS 19870 uses ‘cradle-to-production gate’. Results under scenario 2 therefore exclude potentially significant emissions from distribution of hydrogen to the EU.
- GHG threshold: EU sets a GHG threshold of 28.2 gCO2eq/MJLHV hydrogen, whereas ISO does not set a GHG threshold. As such, compliance with GHG thresholds were only carried out for results using the EU methodology.
- Reference flow: EU RED and the EU Gas Directive do not set a reference flow. The reference flow under ISO 19870 is set by the end-user but the GHG intensity is adjusted upwards for (project specific) impurities and their release.
- Co-product emission assignment: For electrolysis with co-product oxygen sales, economic allocation is required by EU RED, whereas ISO/TS 19870 currently recommends economic allocation or system expansion. For fossil gas reforming, the EU Gas Directive DA currently uses LHV energy allocation (with steam Carnot efficiencies), whereas ISO/TS 19870 has sub-division then LHV energy allocation (using steam enthalpy changes) or else system expansion. However, as no co-products are modelled for either electrolysis or reforming pathways in this study (it is assumed for simplicity there are no oxygen or steam customers), 100% of emissions in both scenarios are assigned to the hydrogen product.
At the time of writing this report, a draft version of the EU Gas Directive DA had been released for consultation and is still therefore subject to revision. This report follows the draft DA methodology to assess the GHG emissions of fossil natural gas hydrogen pathways under the BAU scenario (as outlined in Appendix C). However, due to uncertainty about the timings of reporting under the EU Methane Regulations, this report does not apply conservative default values for upstream natural gas emissions from the draft DA, and instead relies on the upstream natural gas GHG intensity given in the final published RED DA.
GHG emission intensity results
This section presents GHG emission results for various hydrogen production pathways under EU and ISO methodologies, including hydrogen used in refinery boilers and ammonia for marine vessels. Modelling have been carried out for production in 2023 and 2030 to reflect potential impacts from decarbonisation projections (e.g. grid decarbonisation, increased use of renewable fuels in transport), and technology improvements.
Specifically for the modelling of hydrogen production in Scotland, the National Grid country GHG intensity for Scotland is used, rather than the GB grid electricity average GHG intensity. From this point forward, the GHG intensity of electricity used for Scotland pathways is referred to as the “Scottish grid”.
In addition, a sensitivity analysis was conducted on the following parameters:
- Using renewable electricity across the entire pathway
- Using renewable heat for the ammonia cracking step of relevant pathways
- Using low-carbon marine fuel for shipping pathways
- Using the UK vs Scottish grid average intensity
Further details and results of this sensitivity analysis are given in Appendix F. These results are used in the GHG emission compliance scoring matrix to assess whether a previously non-compliant production pathway can adopt mitigation measures to meet the EU GHG threshold. This matrix can be found in Appendix G.
GHG emission results for pathways producing hydrogen for use in a refinery boiler under EU methodologies
A breakdown of the GHG emissions at each stage of the hydrogen production life-cycle is provided in Figure 1, Figure 2 and Figure 4. The value chain steps included in each stage include:
Feedstock emissions: this is only relevant to natural gas pathways (Figure 3), and accounts for the upstream emissions of natural gas inputs (e.g. extraction, transport, pre-processing, including methane leakage).
Hydrogen production emissions: these arise from the electrolysis or natural gas autothermal reforming with carbon capture (ATR+CCS) processes. Sources of emissions include electricity consumption, uncaptured fossil CO2 and chemical inputs.
Distribution emissions: these include compression, transport, storage, reconversion and downstream emissions. The emissions depend significantly on the hydrogen transport pathways.
- Ammonia pathways include conversion of hydrogen to ammonia, transport via truck to a port, port storage, shipping to Rotterdam, port storage, reconversion/cracking ammonia to hydrogen (requiring heating and catalysts), transport via pipeline to a refinery, and end use of hydrogen in a refinery combustion boiler.
- A separate end use case is modelled where instead of cracking and hydrogen transport, ammonia stored in Rotterdam is loaded onto a maritime vessel for combustion in the propulsion engines.
- The compressed hydrogen shipping pathways include compression of hydrogen for trucking, transport of hydrogen via truck to a port, port storage, shipping to Rotterdam, port storage, transport via pipeline to a refinery, and use of hydrogen in refinery combustion boiler.
- The compressed hydrogen pipeline pathways include compression of hydrogen, piping to Rotterdam, transport via pipeline to a refinery, and end use of hydrogen in a refinery combustion boiler.
- Transport to the EU via pipeline or via compressed hydrogen shipping were not modelled for the USA and Chile due to the long transport distance making these options unviable, following the previous ClimateXChange report.
The input values and assumptions used in the GHG modelling are detailed in Appendix E.
Figure 1 represents the GHG intensity of pathways that use renewable electricity for electrolytic hydrogen production, followed by distribution to the EU (using grid electricity and gas), before use of gaseous hydrogen in a refinery boiler. The exception is nuclear electricity with an emission factor of 3.64 gCO2e/MJ elec[3] being assumed to be used for electrolysis in France, which leads to higher production emissions compared to other regions using renewable electrolysis (0 gCO2e/MJ elec).
These results show that hydrogen produced from renewable electricity-based electrolysis is likely to meet the EU GHG threshold when transported as compressed hydrogen. However, transporting compressed hydrogen via ships generates higher emissions compared to transport via pipeline due to the fuel used for trucking and shipping, plus additional electricity requirements for storage at the shipping ports.
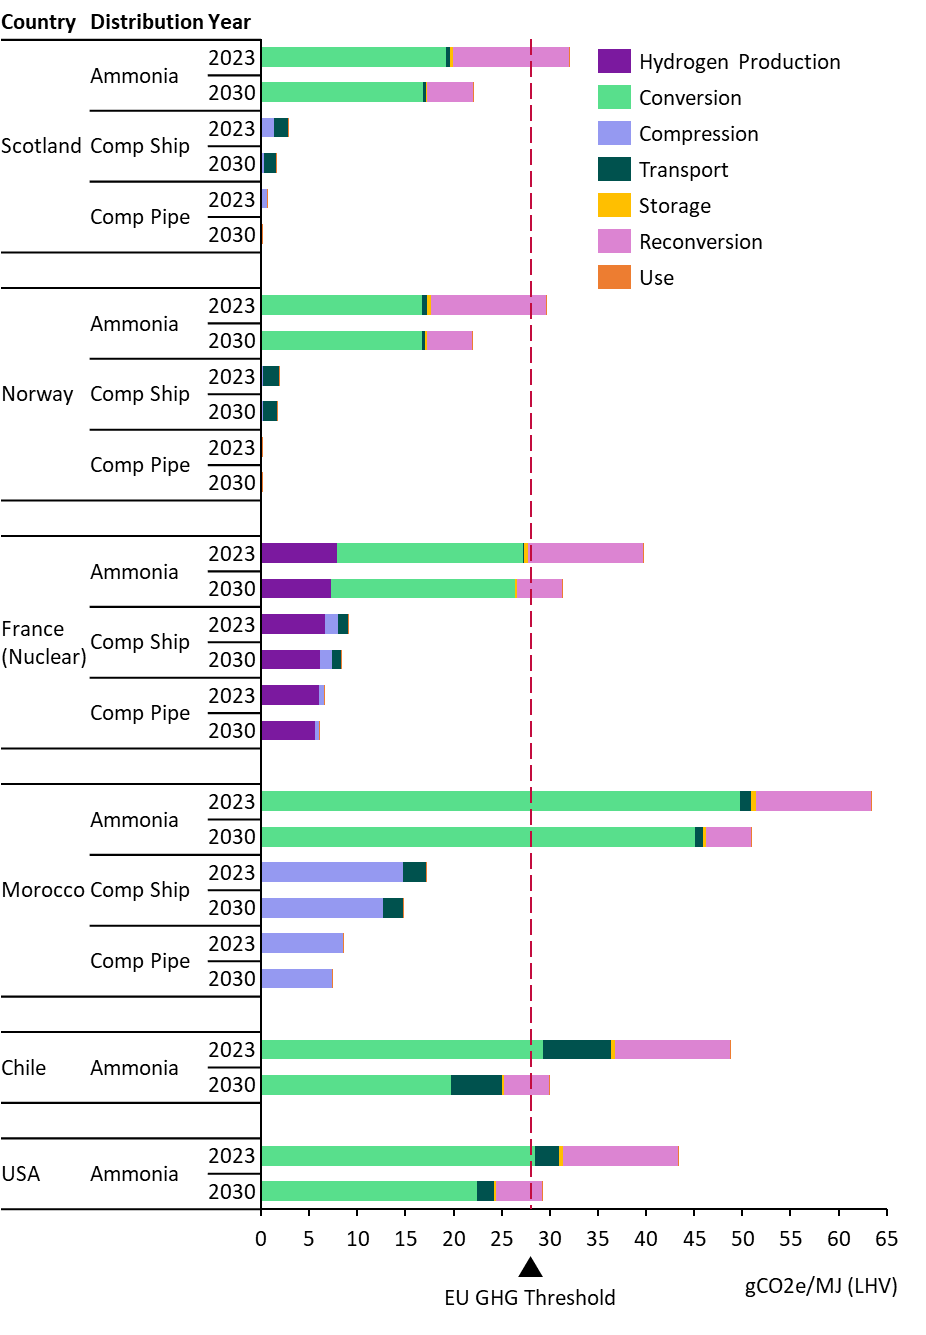
Emission intensities of hydrogen using ammonia as an intermediary vector are significantly higher than those of gaseous hydrogen pathways and may not meet the EU threshold in 2030. This is primarily due to the use of grid electricity in distribution steps, the efficiency losses in the (re)-conversion steps, and the release of nitrous oxide during ammonia production. Only Norway and Scotland might comply by 2030, due to low enough emission grid electricity in these countries. Emissions from the conversion step (ammonia production) remain significant in 2030 due to the release of nitrous oxide emissions, and the ammonia cracking step uses Netherlands grid electricity which has a high GHG intensity (although this improves significantly by 2030).
Figure 2 below shows the GHG intensity results if grid electricity is used for electrolysis instead of renewable electricity. Note the change in x-axis scale between the two graphs.
In these pathways, the emissions factor of the grid is the most important contributor to overall GHG emissions intensity of delivered hydrogen. Decarbonisation of electricity grids in some countries (i.e. Scotland and France) may enable some of the pathways to achieve the EU GHG threshold in 2030. However, gaseous pathways from Norway are expected to already comply.
For Scottish pathways, the average grid factor for Scotland was used in the GHG modelling (see Appendix E for details). This assumes that the Scottish grid intensity could be used under EU rules instead of the GB grid average, however, it remains unclear how EU rules on bidding zones apply to Scotland. A sensitivity analysis in Appendix F explores the GHG impact of using the GB grid average compared to the Scottish grid average. The results in Figure 2 show that using the Scottish grid factor in electrolysis results in the GHG emission intensity of piped and shipped compressed hydrogen pathways close to the EU GHG threshold in 2023 but easily achieving it by 2030 as the Scottish grid decarbonises. Ammonia pathways from Scotland may just meet the threshold in 2030 as electricity grids in Scotland and the Netherlands decarbonise.
Pipeline hydrogen pathways are all expected to fall below the EU GHG threshold in 2030 as electricity grids decarbonise, except for Morocco, which has a significantly higher grid GHG intensity compared with other countries. Hydrogen production in countries with high shares of fossil fuel power generation in their grid mix will have to rely on renewable electricity (Figure 1 results) to export to EU markets. For example, neither of the grid electrolysis pathways from Chile or the USA are expected to be able to meet the EU threshold, due to both high grid GHG intensities and additional emission arising from ammonia supply chains.
It is important to note that hydrogen produced from grid electricity is likely to have both renewable and non-renewable consignments. Both consignments will have the same GHG intensity under EU rules, and if this is low enough to meet the EU GHG threshold, the renewable fraction may be eligible as a RFNBO under EU RED, and the non-renewable fraction may be eligible under the EU Gas Directive.

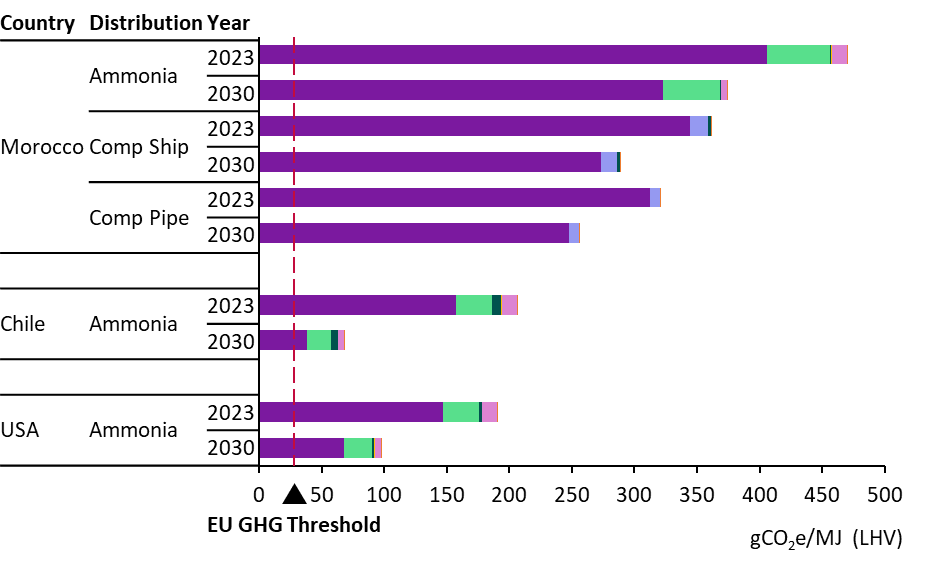
As shown in Figure 3, natural gas reforming with CCS pathways may struggle to meet the EU Gas Directive’s GHG emission threshold (same as the EU RED threshold). The emissions of hydrogen produced from these pathways are very sensitive to upstream natural gas intensities, which are highly uncertain and can be highly variable depending on the source of natural gas (e.g. imported LNG can have much higher intensities than domestic gas supplies used for hydrogen production).
The European Commission is expected to establish a methodology for calculating the methane emissions of fossil feedstocks (including natural gas) at a producer level by 2027. In the absence of this more accurate data, an upstream natural gas intensity of 12.7 gCO2e/MJLHV natural gas was used to model both USA and UK reforming pathways, based on the published generic value in the EU RED DA. However, individual producers or countries could have intensities significantly above this value. This value will likely need to be updated as more accurate, audited data is reported by the fossil gas industry.
In the UK, pathways with compressed shipping or pipeline could meet the EU GHG emission threshold. In contrast, long transport distances from the USA to the EU means that it is not feasible to transport hydrogen via compressed shipping or pipeline (requiring large additional emissions from ammonia distribution), leading to the UK natural gas pathways via compressed hydrogen distribution having a significant GHG advantage compared with ammonia pathways from the USA.

GHG emission results for pathways producing ammonia for use in a marine vessel under EU methodologies
Ammonia was also modelled as the end-product for use in a marine vessel in Rotterdam. As shown below in Figure 4, Figure 5 and Figure 6, GHG emissions of these ammonia use pathways are lower than pathways with hydrogen as the end-product because ammonia reconversion back to hydrogen is not required. As in the previous analysis, grid electricity is assumed to be used for ammonia distribution (conversion, storage, reconversion) in both grid and renewable electricity-based electrolysis pathways.
Ammonia produced using renewable electricity (Figure 4) is likely to comply with the EU GHG threshold in 2023 and 2030 in both Scotland and Norway, and may just comply in France by 2030. Similar to the earlier analysis, production in the US and Chile may still struggle to comply, as the conversion step (ammonia production) accounts for a significant portion of the total pathway emissions. This is due to the release of nitrous oxide emissions, the use of grid electricity in distribution and losses in conversion efficiency.
Grid electricity-based ammonia produced in all countries modelled in this study (Figure 5) is unlikely to meet the threshold, except for Norway in both years and for Scotland in 2030. As discussed in the previous section, only the renewable portion of the ammonia would likely qualify under EU RED, the remaining portion would need to qualify under the EU Gas Directive. As shown in Figure 6, even avoiding emissions from reconversion of ammonia to gaseous hydrogen does not sufficiently reduce the emissions of natural gas reforming pathways via ammonia to comply with the EU GHG threshold.
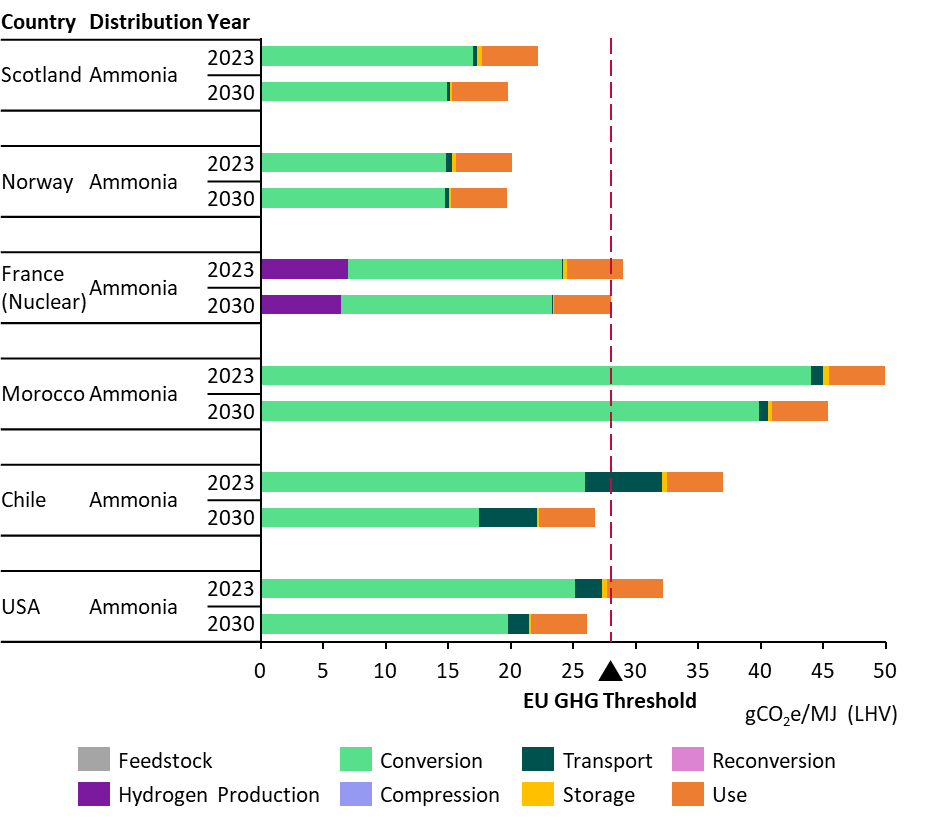
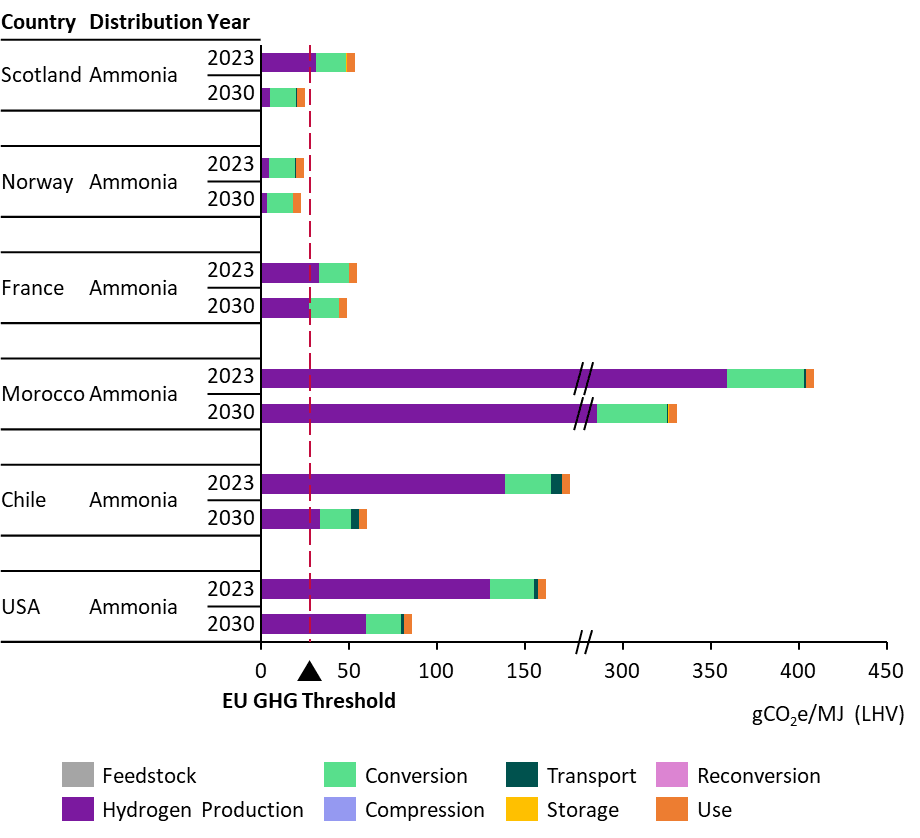
gCO2e/MJ (LHV)
Processing
Conversion
Compression
Transport
Storage
Reconversion
Downstream
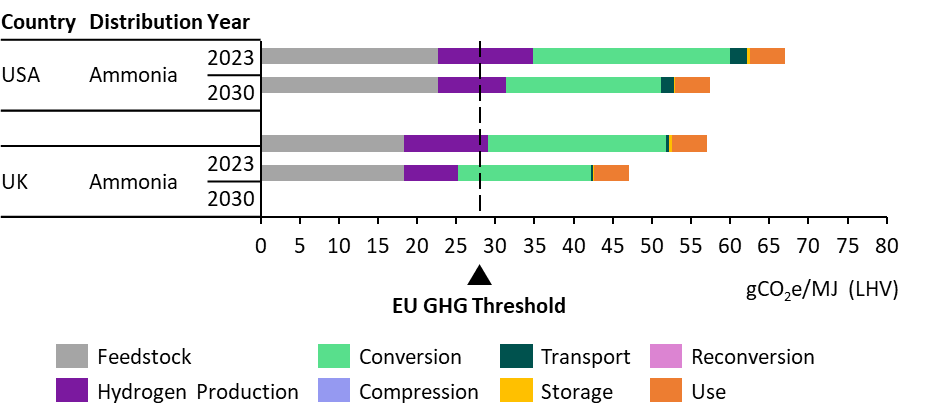
GHG emission results for hydrogen production pathways under ISO 19870 methodology
The GHG emission intensities of pathways modelled under the ISO methodology are shown below in Figure 7. Only emissions from feedstock and hydrogen production are modelled given the current ISO 19870 system boundary is “cradle to production gate” and does not include any downstream steps. There is also no GHG emissions threshold under ISO 19870, so compliance is not assessed.
Emissions for renewable electrolysis pathways are close to zero because there are only very small emissions for consumed water and minor chemicals. Emissions for delivered wind, hydro and solar electricity are considered to be zero, as in EU RED. Once again, grid electricity intensities dominate the grid electrolysis results.
For the natural gas reforming pathways, the difference in emissions between the UK and USA is mainly due to differences in upstream natural gas emissions intensities and grid electricity intensities. Under the ISO methodology, which allows producer, region or country-specific data to be used, the upstream natural gas intensities in the ISO analysis are assumed to be 8.7 and 9.2 gCO2e/MJLHV natural gas for the UK and USA respectively, based on current published UK and US government data.
These values could be significantly underestimating true upstream emissions, including the impact of LNG imports and methane leakage rates, and are lower than the generic single value the EU RED DA applies to all natural gas supplies (12.7 gCO2e/MJLHV natural gas). However, UK and US government data is likely to be updated more frequently (e.g. annually) in light of new evidence or updated gas source mixes compared to the single value published in the EU RED DA (which is based on the JEC WTT v5 study from 2020).
Those applying the ISO methodology are not required to use government estimates and could use other credible sources, including producer-specific data. This means that natural gas intensities under the ISO method are likely to vary significantly between projects, although where several credible options exist, there may be pressure from projects to choose lower values. In contrast, the EU Gas Directive requires the phasing in of producer-specific methane intensity data and does not give a choice as to which dataset to use.
The ISO 19870 method requires adjustments upwards for impurities by mass, and applies GWPs assuming the impurities are released. This may slightly affect the results, depending on the project-specific impurities. The engineering design data used assumes high purities (>99.9% by volume), so hydrogen product compositions were not modelled. However, for hydrogen production facilities that generate hydrogen at lower purities (e.g. 95-99% by volume), these impurity adjustments have a more significant impact, as hydrogen purity by mass is significantly lower than purity by volume.
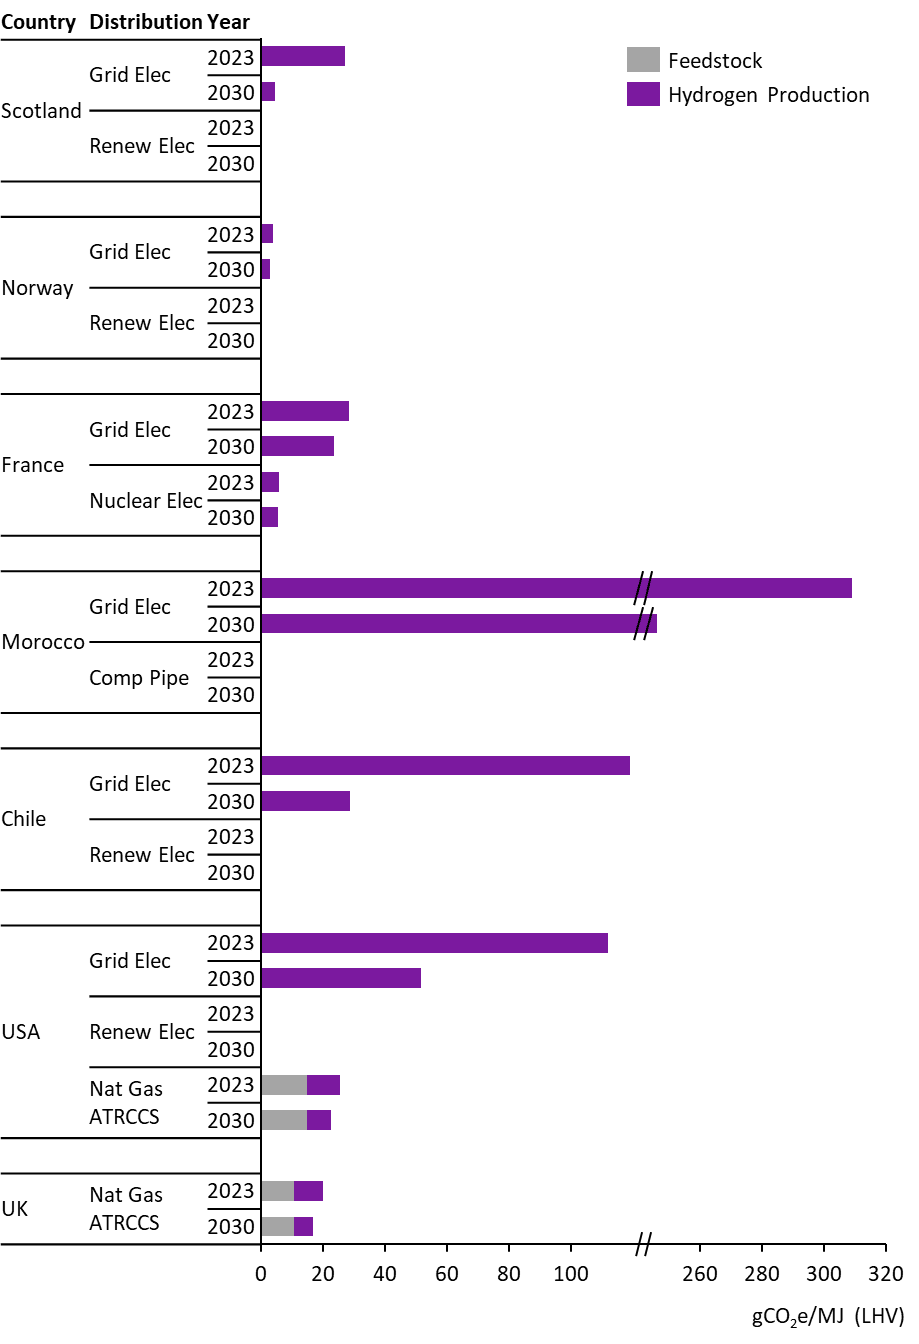
Conclusions and recommendations
Key hydrogen standards globally already set out different GHG calculation methodologies and compliance requirements for producers. Hydrogen imported to the EU market must comply with rules set by the EU Renewable Energy Directive (RED) and the EU Gas Directive, if they are to contribute towards targets set under these policies. While an international standard is being developed (ISO 19870), it is unclear if the UK or EU will align with it in the future.
With regard to GHG emissions, electrolytic hydrogen produced in Scotland and exported to the EU market could be one of the most competitive among the countries we studied. Today, electrolytic hydrogen produced from renewable electricity in Scotland can already meet the EU RED GHG emission threshold. Further grid decarbonisation would increase the likelihood of compliance for grid connected electrolysis by 2030, even if the GB grid average factor has to be used under EU rules instead of the (much lower) Scottish grid average. Of the other countries considered in this study, only Norway with its hydro-electric dominated grid can deliver electrolytic hydrogen to the EU with lower GHG emissions than Scotland.
When transported over short distances as compressed hydrogen via pipelines or ships, electrolytic hydrogen produced using low-carbon electricity is expected to meet the EU GHG threshold. This applies in both 2023 and 2030 to renewable hydrogen produced in Scotland (930 km), Norway (1,312 km) and Morocco (2,747 km by ship, 1,930 km by pipeline), as well as nuclear electricity-derived hydrogen from France (261 km by ship, 435 km by pipeline).
Transporting hydrogen as ammonia leads to significantly higher GHG emissions. Producers relying on ammonia for long-distance transport from countries such Chile and the USA may need to adopt additional emission reduction measures to comply with EU policies, particularly if ammonia is reconverted to hydrogen for final use. Over shorter distances, hydrogen produced in Scotland or Norway using renewable electricity and transported as ammonia is likely to comply with the EU GHG emission threshold by 2030. However, in France, ammonia pathways will only meet the EU threshold if ammonia is used as the end-product in 2030 due to additional emissions from nuclear electricity inputs. Meeting the threshold requires further emission reduction measures such as using renewable electricity for hydrogen distribution.
Only countries with a high share of low-carbon electricity on their grid can produce grid-based electrolytic hydrogen meeting the EU GHG threshold. In 2023, grid electricity-based hydrogen from Norway can already meet the EU threshold when transported as compressed hydrogen. Scotland could also achieve compliance if compressed hydrogen is transported via pipelines. By 2030, all production pathways in Scotland can meet the EU threshold if the GHG intensity of grid electricity specific to Scotland decarbonises in line with policy aspirations. However, if GB’s grid emission intensity is used, only the hydrogen pipeline transport pathway could meet the threshold by 2030, assuming the grid decarbonises as planned. Hydrogen produced from fossil heavy electricity grid mixes such as those in Morocco, Chile and the USA will not be compliant.
Many natural gas pathways modelled will not comply with the EU Gas Directive threshold. These pathways are highly sensitive to the upstream GHG intensity of natural gas, which is uncertain and can be highly variable depending on the natural gas source (e.g. imported LNG with high intensities). Based on the default upstream natural gas intensity published in the EU RED Delegated Act 2023/1185 (as the EU Gas Directive Delegated Act is not yet finalised), natural-gas derived hydrogen produced in the UK could be compliant when piped or shipped as compressed hydrogen, giving it an emissions advantage over US natural gas-derived hydrogen (transported via ammonia).
GB’s electricity grid has a significantly higher GHG intensity than Scotland, so further clarity on the definition of bidding zones in the EU RED Delegated Act is critical. Using the GB grid average for grid-electrolysis projects in Scotland results in high risk of non-compliance with the EU GHG threshold (see Appendix F for results of this analysis), whereas use of grid GHG intensity data specific to Scotland would confer significant advantages on grid electrolysis projects, including exemptions from some EU requirements.
This GHG emission analysis could be combined with the previous CXC cost analysis to evaluate the overall competitiveness of these hydrogen pathways. Further work could also provide a view on the costs of adopting the different emission reduction measures discussed in the sensitivity analysis section of this report. Appendix H provides an abatement cost methodology, to calculate the minimum cost of compliance for those pathways above the EU GHG threshold but where emissions reduction measures could lead to compliance. We also note that implementation of the hydrogen and ammonia pathways modelled in this study may require significant investment in new infrastructure for some countries, and these infrastructure needs and any first-mover advantages could be investigated further.
Recommended next steps
The following recommendations could be considered for follow-on work:
- Expand the sensitivity analysis to cover additional sensitivities:
- Low-emission trucking
- Nitrous oxide mitigation
- Sensitivities in 2023, given several grid-electrolysis pathways do not consider any sensitivities in 2023
- Expand the analysis to include:
- Other distribution options e.g. methanol, liquid organic hydrogen carriers (LOHC)
- Additional time periods e.g. 2040 and 2050
- Additional emerging export regions e.g. Oman, Egypt, Australia, Namibia
- Combine the previous CXC cost analysis with the GHG emission analysis in this study to evaluate the overall competitiveness of the hydrogen and ammonia pathways
- Integrate upstream fossil fuel emissions intensity data once more reliable data is available e.g. EU methane regulations, any UK studies
We also suggest engagement with policymakers on the following aspects:
- Confirm with the European Commission whether Scotland counts as a country with its own GHG intensity or whether the GB grid bidding zone takes priority
- The EU Gas Directive Delegated Act as it is finalised and published, as interpretation of these rules could significantly impact fossil pathways
- The potential impacts of ISO 19870 once published, including the level of EU engagement or willingness to align with the standard, and when downstream hydrogen vectors e.g. ammonia will be included in future iterations of ISO 19870.
References
Arup. (2024). Cost reduction pathways of green hydrogen production in Scotland – total costs and international comparisons. Available at: https://www.climatexchange.org.uk/projects/green-hydrogen-production-and-international-competitiveness/
BEIS. (2023). Decarbonisation of the power sector. Available at: https://committees.parliament.uk/publications/39325/documents/193081/default/
CertifHy. (2023). SD Carbon footprint calculation. Available at: https://www.certifhy.eu/wp-content/uploads/2023/03/CertifHy_Carbon-footprint-calculation_220214.pdf
CertifHy. (2022). CertifHy-SD Hydrogen Criteria. Available at: https://www.certifhy.eu/wp-content/uploads/2022/06/CertifHy_H2-criteria-definition_V2.0_2022-04-28_endorsed_CLEAN-1.pdf
CERTIFHY. (n.d.). CERTIFHY DOCUMENTS – CERTIFHY. Available at: https://www.certifhy.eu/certifhy-documents/
Circularise. (2022). Four chain of custody models explained. Available at: https://www.circularise.com/blogs/four-chain-of-custody-models-explained
Department for Energy Security & Net Zero (DESNZ). (2023). UK Low Carbon Hydrogen Standard. Available at: https://assets.publishing.service.gov.uk/media/6584407fed3c3400133bfd47/uk-low-carbon-hydrogen-standard-v3-december-2023.pdf
Ding, Y., Baldino, C. and Zhou, Y. (2024). Understanding the proposed guidance for the Inflation Reduction Act’s Section 45V Clean Hydrogen Production Tax Credit. Available at: https://theicct.org/wp-content/uploads/2024/03/ID-132-%E2%80%93-45V-hydrogen_final2.pdf
E4tech. (2021). Options for a UK low carbon hydrogen standard Final report. Available at: https://assets.publishing.service.gov.uk/media/616012fce90e071979dfebba/Options_for_a_UK_low_carbon_hydrogen_standard_report.pdf
Ember. (n.d.). Electricity Data Explorer | Open Source Global Electricity Data. Available at: https://ember-climate.org/data/data-tools/data-explorer/
European Union. (2023a). DIRECTIVE (EU) 2023/2413 OF THE EUROPEAN PARLIAMENT AND OF THE COUNCIL of 18 October 2023 amending Directive (EU) 2018/2001, Regulation (EU) 2018/1999 and Directive 98/70/EC as regards the promotion of energy from renewable sources, and repealing Council Directive (EU) 2015/652 (EU RED III). Available at: https://eur-lex.europa.eu/legal-content/EN/TXT/?uri=CELEX:02018L2001-20220607
European Union. (2023b). Commission Delegated Regulation (EU) 2023/1184 of 10 February 2023 supplementing Directive (EU) 2018/2001 of the European Parliament and of the Council by establishing a Union methodology setting out detailed rules for the production of renewable liquid and gaseous transport fuels of non-biological origin. Available at: https://eur-lex.europa.eu/legal-content/EN/TXT/?uri=uriserv%3AOJ.L_.2023.157.01.0011.01.ENG&toc=OJ%3AL%3A2023%3A157%3ATOC
European Union. (2024a). Directive – EU – 2024/1788 of the European Parliament and of the Council of 13 June 2024 on common rules for the internal markets for renewable gas, natural gas and hydrogen. Available at: https://eur-lex.europa.eu/legal-content/EN/TXT/PDF/?uri=OJ:L_202302413
European Union. (2024b). Texts adopted – Common rules for the internal markets for renewable gas, natural gas and hydrogen (recast) – Thursday, 11 April 2024. Available at: https://www.europarl.europa.eu/doceo/document/TA-9-2024-0283_EN.html
European Union. (2024c). Methodology to determine the greenhouse gas (GHG) emission savings of low-carbon fuels. Available at: https://ec.europa.eu/info/law/better-regulation/have-your-say/initiatives/14303-Methodology-to-determine-the-greenhouse-gas-GHG-emission-savings-of-low-carbon-fuels_en
European Union. (2024d). Regulation (EU) 2024/1787 of the European Parliament and of the Council of 13 June 2024 on the reduction of methane emissions in the energy sector and amending Regulation (EU) 2019/942. Available at: https://eur-lex.europa.eu/legal-content/EN/TXT/?uri=OJ:L_202401787
GHG Protocol. (n.d.). GHG Protocol Scope 2 Guidance. Available at: https://ghgprotocol.org/sites/default/files/2023-03/Scope%202%20Guidance.pdf
GH2 Standard. (2023). The Global Standard for Green Hydrogen and Green Hydrogen Derivatives. Available from: https://gh2.org/sites/default/files/2023-12/GH2_Standard_2.0_Dec%202023.pdf
International Partnership for Hydrogen and Fuel Cells in the Economy (IPHE). (2023). Methodology for Determining the Greenhouse Gas Emissions Associated with the Production of Hydrogen. Available at: https://www.iphe.net/_files/ugd/45185a_8f9608847cbe46c88c319a75bb85f436.pdf
International PtX Hub. (2023). Introduction to the IPHE methodology. Available at: https://ptx-hub.org/wp-content/uploads/2023/08/International-PtX-Hub_202308_IPHE-methodology-electrolysis.pdf
International Organization for Standardization (ISO). (2023). ISO/TS 19870:2023. Hydrogen technologies — Methodology for determining the greenhouse gas emissions associated with the production, conditioning and transport of hydrogen to consumption gate. Available at: https://www.iso.org/standard/65628.html
Martin, P. (2023). France to launch €4bn contracts-for-difference programme to support clean hydrogen production | Hydrogen Insight. Available at: https://www.hydrogeninsight.com/policy/france-to-launch-4bn-contracts-for-difference-programme-to-support-clean-hydrogen-production-reports/2-1-1508431
République Francaise. (2024). Decree of 1 July 2024 specifying the greenhouse gas emissions threshold and the methodology for qualifying hydrogen as renewable or low-carbon. Available at: https://www.legifrance.gouv.fr/jorf/id/JORFTEXT000049870616
Scottish Government. (2022). Hydrogen action plan. Available at: https://www.gov.scot/publications/hydrogen-action-plan/pages/3/
Scottish Renewables. (2021). Renewable Energy Facts & Statistics | Scottish Renewables. www.scottishrenewables.com. Available at: https://www.scottishrenewables.com/our-industry/statistics
TÜV Rheinland. (2023). Standard H2.21 Renewable and Low-Carbon Hydrogen Fuels. Available at: https://www.tuv.com/content-media-files/master-content/global-landingpages/images/hydrogen/tuv-rheinland-hydrogen-standard-h2.21-v2.1-2023-en.pdf
TÜV SÜD. (2021). Standard CMS 70 Production of green hydrogen (GreenHydrogen). Available at: https://www.tuvsud.com/en-gb/-/media/global/pdf-files/brochures-and-infosheets/tuvsud-cms70-standard-greenhydrogen-certification.pdf
US Department of Energy (DOE). (2024). Guidelines to Determine Well-to-Gate Greenhouse Gas (GHG) Emissions of Hydrogen Production Pathways using 45VH2-GREET Rev. March 2024. Available at: https://www.energy.gov/sites/default/files/2024-05/45vh2-greet-user-manual_may-2024.pdf
Appendices
Appendix A Definitions
Chain of custody
There are 4 types of chain of custody models to trace sustainability throughout supply chains. They are listed below in order of high to low level of physical connection required (Circularise, 2022).
|
Identify preservation – this model does not allow the certified product from a certified site to mix with other certified sources. It requires tracking the actual molecule of the material as they move through the supply chain. |
 |
|
Segregation – this model requires the certified product from a certified site to be kept separately from non-certified sources. However, it allows different certified sources to be mixed if they share the same defined standard. |
 |
|
Mass balance – this model tracks the total amount of sustainable content through virtual balancing of physical allocation. It allows the mixing of sustainable and non-sustainable materials producers and end-users must operate within the same ecosystem (e.g. gas grid). |
 |
|
Book-and-claim – the sustainable attributes are tracked virtually where sustainable and non-sustainable materials flow freely through the supply chain without the requirement of them being supplied and used in the same ecosystem. |
 |
In addition to the 4 types of chain of custody models, some hydrogen standards also use Environmental Attribute Certificates (EAC). This is a mechanism to demonstrate to end-users that a product (e.g. hydrogen, electricity, biogas) is produced from renewable sources. EACs enable the decoupling of physical goods from their environmental attributes, and can take the form of guarantees of original (GOs), renewable electricity certificates (RECs), etc. EACs could adopt either a mass balance or book-and-claim chain of custody model, or a combination of both. As such and where possible, the report uses terms referenced directly in the hydrogen standards.
Emission allocation methods
Hydrogen production pathways can generate co-products. Consequently, the total emissions resulting from the hydrogen production (and its upstream emissions) should be divided between the hydrogen and its co-products where these co-products are valorised. Outputs that would normally be discarded or that do not carry any economic value are considered as wastes or residues and do not receive any emissions burden. There are multiple methods of assigning emissions to the co-products, as described below.
System expansion – In this method, co-products are considered alternatives to other products on the market. The emissions avoided as a result of this replacement is subtracted from the product system, whereby the remaining net emissions are assigned to the main product (e.g. hydrogen). This requires understanding of the counterfactuals (i.e. the GHG emission of the products being replaced).
Energy allocation – Emissions are assigned to each co-product based on their energy content (generally on the basis of lower heating values). This can also include application of Carnot efficiencies or enthalpy changes to only account for the useful heat contained within any steam/heat co-products.
Physical causality – This allocation method is specifically mentioned in EU RED for processes where the ratio of the co-products produced can be changed. In these processes, the allocation should be determined based on physical changes in emissions, by incrementing the output of just one co-product whilst keeping the other outputs constant.
Economic allocation – Emissions are allocated in proportion to the (co-)product economic values based on total revenues obtained for each.
Mass allocation – Rarely used, but emissions would be allocated in proportion to the (co-)product mass flows.
Appendix B Detailed review of international hydrogen standards
UK Low Carbon Hydrogen Standard (LCHS)
The UK’s Low Carbon Hydrogen Standard (LCHS) was published in 2022 to support the implementation of the UK Hydrogen Strategy, setting requirements that UK hydrogen projects must meet to access revenue support under the Hydrogen Production Business Model and/or the Net Zero Hydrogen Fund (DESNZ, 2023).
Eligibility
The LCHS is feedstock neutral, but hydrogen must be produced via an eligible pathway as shown in the summary table in Table 3. New pathways can apply to be added to this list.
The LCHS sets a maximum GHG emission threshold of 20 gCO2e/MJLHV of hydrogen product (DESNZ, 2023). This threshold is applicable to a ‘cradle-to-production gate’ system boundary, which includes emissions from feedstock production up to and including hydrogen production.
Hydrogen derived from biogenic inputs is required to satisfy biomass feedstock Sustainability Criteria (Land, Soil Carbon and/or Forest Criteria, following those established in EU RED), and >50% of any biogenic hydrogen must be derived from waste or residue feedstocks. Indirect land use change emissions are also required to be reported separately.
GHG calculation methodology principles
Under the LCHS, hydrogen producers using electricity must demonstrate one of the following electricity supply configurations:
- Power Purchase Agreement (PPA) with a specific generator or private network. Here, physical delivery including losses and 30 minute temporal correlation (showing delivered volumes of electricity at least match the electricity consumption) is required for producers to use the GHG intensity of that generator or private network; or
- Grid electricity supply, where the GHG intensity is determined by the 30 minute average grid factor (GB or Northern Ireland, as applicable); or
- Grid electricity that would otherwise have been curtailed, which is permitted to use nil GHG intensity.
Proof of renewable electricity additionality is not a requirement of the UK LCHS (e.g. new windfarms do not have to be built to supply a hydrogen production facility). The LCHS requires that the contracted electricity generator must be located within the UK but does not impose further geographical correlation rules.
The LCHS uses energy allocation to assign GHG emissions based on (co-)products’ lower heating value energy contents. When heat or steam are produced as co-products, Carnot efficiencies[5] are applied for the energy allocation. However, the LCHS also requires that pathways using waste fossil feedstocks account for their displaced counterfactual emissions (i.e. the emissions that would have occurred if the feedstock had not been diverted to hydrogen production), which is a partial inclusion of a system expansion method.
A pressure of 3MPa and purity of 99.9% by volume is used as a reference flow under the LCHS. If the hydrogen produced is below these values, the theoretical emissions from compression and/or purification required to reach the reference flow need to be added. No adjustment is made if hydrogen is produced above the reference flow values.
Other requirements
Under the UK LCHS, mass balance chain of custody is generally used for upstream supply chains. However, the LCHS also currently states that biomethane cannot be mixed with fossil natural gas at any point, i.e. imposing an identity preserved chain of custody for biomethane feedstocks.
Uncertainties and future direction
Uncertainties in the LCHS include if/when downstream emissions from producer to user might be included within the system boundary, if/when hydrogen producers will be able to report producer-specific upstream natural gas GHG intensities (given the current lack of methodology and paucity of fossil industry data), plus when fugitive hydrogen emissions might be accounted for (and at what Global Warming Potential). It is also unclear how the UK LCHS will interact with ISO-19870 once published.
EU Renewable Energy Directive (RED)
Under EU law, regulations are directly applicable and binding in all Member States without the need for national implementation. Directives, on the other hand, set goals that Member States must achieve, and require Member States to first transpose them into national law, which allows for differences in policy mechanisms to arise in how these goals are met.
The Renewable Energy Directive (RED) is the legal framework for the development of clean energy across all sectors of the EU economy which Member States must transpose into national law (European Union, 2023a). Unlike the UK LCHS which currently only determines the eligibility for domestic UK hydrogen production to receive financial support, the RED mandates renewable energy consumption more broadly. Under EU RED, both domestically produced and imported hydrogen can contribute towards Member States’ compliance with renewable energy targets (European Union, 2023a).
Eligibility
EU RED does not prescribe a list of eligible technology pathways but evaluates eligibility based on fuel type, which is defined by the feedstock used to produce hydrogen.
- Biofuel – hydrogen produced from biomass that meets RED sustainability criteria;
- Recycled carbon fuels (RCF) – hydrogen produced from waste streams of non-renewable origin (European Union, 2023a);
- Renewable fuel of non-biological origin (RFNBO) – hydrogen derived from renewable energy sources other than biomass.
When used in transport, biofuels, RCFs and RFNBOs must achieve at least 70% GHG emissions savings (variable depending on year of commissioning) compared to the fossil fuel comparator of 94 gCO2eq/MJ. This means that lifecycle GHG emissions must be below 28.2 gCO2eq/MJLHV hydrogen. This threshold is measured on a ‘cradle-to-use’ system boundary, which goes beyond the UK LCHS’s ‘cradle-to-production gate’ system boundary.
GHG calculation methodology principles
In the EU, rules determining the GHG emission intensity of electricity inputs are set by the Delegated Act (DA) on renewable electricity under EU RED (European Union, 2023b). This states that renewable electricity from direct connections and PPAs need to meet additionality requirements to be considered to have nil GHG impact. Grid connected facilities with PPAs must also fulfil temporal and geographical correlation requirements, with some exceptions.
- Additionality: Requires that hydrogen production is connected to new (i.e. less than 36 months before the electrolyser starts operation), rather than existing, renewable energy generation assets. Additionality is not required before 2028, and for plants built before 2028, it is only required starting in 2038. This is different to the UK LCHS, which does not have additionality requirements.
- Temporal correlation: Until 2030, this rule requires that hydrogen must be produced within the same calendar month as the renewable electricity used to produce it, and hourly thereafter (European Union, 2023b). This is more relaxed than the 30-minute requirement in the UK LCHS.
- Geographical correlation: Requires that the hydrogen producer must be in the same bidding zone as the renewable energy installation or in an interconnected bidding zone with day ahead prices higher than that of the renewable generation asset.
- Exceptions: Additionality is not required for renewable PPAs with temporal and geographical correlation where the emission intensity of the bidding zone is <18gCO2/MJe. Bidding zones with >90% renewables do not have to meet any of these three criteria provided that the load hours of the hydrogen production plant are lower than the grid’s renewability share.
Similar to the UK LCHS, the default allocation method for hydrogen production pathways under EU RED is based on lower heating value (LHV) energy content for any co-product fuel, electricity or heat/steam (applying Carnot efficiencies). However, EU RED states that if the plant can change the ratio of the co-products produced, physical causality allocation is used (see definition in Appendix A). If co-products are produced that have no LHV energy content (e.g. oxygen, chlorine), GHG emissions are shared among co-products through economic allocation, based on the average factory-gate values of the (co-)products over the last three years. As with the UK LCHS, waste fossil feedstocks used for RCF production account for their displaced counterfactual emissions. EU RED sets no reference flow, with purity and pressure requirements only determined by the end user.
Uncertainties and future direction
According to the DA on renewable electricity (European Union, 2023b), the GHG emission intensity of grid electricity is determined at the level of countries or at the level of bidding zones. Different bidding zones do not currently exist in the GB power grid, but it is unclear how the DA defines a country. If Scotland is defined as a country under the DA, grid electrolysis projects could claim nil emissions for their input electricity without having to meet rules on additionality, temporal and geographical correlation, as Scotland’s grid has more than 90% renewables (Scottish Renewables, 2021). This would be a significant advantage and allow these projects to reduce their input electricity costs due to the lower regulatory burden. But if not defined as a country under the DA, these projects would have to take the GHG intensity of the GB grid, which only had an approximately 50% renewable share in 2023 (Ember, n.d.), requiring producers to instead procure renewable electricity PPAs that meet additionality, temporal and geographical correlation rules to claim nil emissions for the input electricity.
There are also uncertainties as to how individual Member States will implement the latest revised version of the RED, given that there is a May 2025 deadline for RED III to be transposed into national laws. Even within the confines of RED III, the policy mechanisms created and pathways deemed eligible by Member States can vary across the EU.
EU Gas Directive
The EU Gas Directive (formally called the Directive on common rules for the internal markets for renewable gas, natural gas and hydrogen) was published in July 2024 as part of the Hydrogen and Decarbonised Gas Market Package, it established a framework for the development of the future gas market in the EU, and its scope includes renewable and low-carbon hydrogen. Renewable hydrogen is defined as bio-hydrogen and RFNBO hydrogen, which must follow RED requirements (European Union, 2024a), whereby the EU Gas Directive sets requirements for low-carbon nuclear and fossil-fuel based pathways (outside of fossil waste derived RCFs) that are not currently covered by RED. This policy shares many similarities with the methodology set under RED, including a GHG emission threshold of 28.2 gCO2e/MJLHV and a ‘cradle-to-use’ system boundary.
The European Commission has until July 2025 to adopt a Delegated Act (DA) specifying the GHG methodology for low-carbon fuels (other than RCFs) (European Union, 2024b). On September 27, 2024, a draft version of this DA was released for public consultation (European Union, 2024c).
This draft version sticks to the same RED renewable power sourcing rules (and does not expand them to nuclear or fossil + CCS generator PPAs), but also appears to have several differences to the RED methodology for RFNBOs. For example, carbon capture and utilisation (CCU) in permanently chemically bound products is currently permitted in the draft DA, and there are also more detailed CCS requirements including allowing solid carbon sequestration, but ruling out enhanced oil & gas recovery (European Union, 2024c). Upstream natural gas emissions are to be based on reported producer values under EU methane regulations (European Union, 2024d), but before these are available, a conservative value from the DA is to be used. However, it is unclear how the existing use/fate of fossil fuel feedstocks is to be interpreted, and whether this counterfactual term is to be ignored or would generate a large emissions penalty or a large credit – both latter options would be a major departure from the attributional GHG methodology used in the RED and other EU legislation. Given the current consultation stage, other significant changes to the DA before final publication are possible, which also adds uncertainty.
CertifHy
CertifHy is an industry developed voluntary Guarantee of Origin (GO) certificate scheme within the EU, the European Economic Area and Switzerland. The CertifHy GO scheme verifies the origin (e.g. production location, production technology, feedstocks etc.) and GHG emissions of hydrogen products (CertifHy, n.d.). Rather than a set of legislative requirements, it is a scheme that producers can choose to participate in to demonstrate sustainability to their end-users.
Eligibility
CertifHy hydrogen can be labelled “green hydrogen” which covers renewable pathways, or “low-carbon hydrogen” which covers low-carbon fossil and nuclear pathways. For both, a GHG emissions threshold of 36.4gCO2e/MJ LHV hydrogen applies, which is measured on the same ‘cradle-to-production gate’ system boundary as the UK LCHS. This represents a reduction of 60% compared to the benchmark fossil process of 91gCO2e/MJLHV hydrogen product (via steam reforming of natural gas) (CertifHy, 2022).
GHG calculation methodology principles
When producing hydrogen from the electricity grid, the renewable origin can be established by cancelling of GOs[6]. Unlike the UK LCHS and EU RED, CertifHy does not specify further requirements such as additionality, temporal or geographical correlation.
Under CertifHy, co-products are dealt in different ways and are defined based on the production pathways. For pathways producing steam as a co-product, CertifHy requires its producers and consumers to use the same allocation method. Economic allocation is applied for hydrogen produced from chlor-alkali processes and its co-products. However, the method for allocating emissions to any co-produced oxygen from electrolysis is yet to be adopted (CertifHy, 2023).
Other requirements
The CertifHy GO scheme allows for the decoupling of physical hydrogen supply and its environmental attributes, via a book & claim system.
Uncertainties and future direction
The future use of this voluntary scheme and others such as TÜV SÜD and TÜV Rheinland could be impacted by the potential future alignment with ISO 19870.
France Energy Code L. 811-1
In July 2024, France transposed the definition of renewable hydrogen in alignment with EU RED under L. 811-1 of the Energy Code (République Francaise, 2024). It is a government developed standard and mandatory for accessing subsidy schemes.
Eligibility
As it is a transposition of EU RED, requirements for renewable hydrogen follow EU RED. The Energy Code also specifies the GHG methodology for low-carbon hydrogen, which is based on EU RED rules, but allows electricity from nuclear power generation.
Uncertainties
Recent Government changes in France resulted in a pause in publishing the new hydrogen strategy and subsequent Government funding in the form of a CfD for hydrogen developers producing renewable or low-carbon hydrogen. It is also currently unclear if France permits RCFs to count towards the REDIII renewable energy target (Martin, P., 2023).
United States Inflation Reduction Act 45V Tax Credit
The Inflation Reduction Act (IRA) introduced the Clean Hydrogen Production Tax Credit (PTC) (45V) to promote the production of low-carbon hydrogen in the US. This tax credit can be claimed by producers for every kilogram of eligible hydrogen they produce in the US. The value of the tax credit is determined by a tiered approach based on the GHG emissions intensity of the hydrogen with significant multipliers also available if the production facility meets the labour requirements set out under the tax credit.
Eligibility
Eligibility for 45V is determined by whether the produced hydrogen meets GHG emission thresholds, which is measured on a ‘cradle-to-production gate’ system boundary. The maximum GHG threshold is defined at 4 kgCO2e/kg H2. Hydrogen produced with lower GHG emissions is eligible for higher support, which is determined by a percentage of the maximum credit value[7] as seen in table below.
|
kgCO2e/kg hydrogen |
gCO2e/MJLHV |
% of Production Tax Credit value |
|
>4 |
>33.3 |
0% |
|
2.4 to 4 |
20 to 33.3 |
20% |
|
1.5 to 2.5 |
12.5 to 20 |
25% |
|
0.45 to 1.5 |
3.8 to 12.5 |
33.4% |
|
<0.45 |
<3.8 |
100% |
GHG calculation methodology principles
For electricity input for electrolytic hydrogen, rules to demonstrate renewability are similar to requirements set under EU RED’s DA. Producers must procure PPAs for renewable electricity that demonstrate incrementality (new generation capacity must begin operations within 3 years of hydrogen facility being placed into service, this is similar to the additionality concept in the EU), deliverability (clean power must be sourced from the same region), and temporal correlation (annual matching is until 2028, with hourly matching thereafter).
The reference flow is set at 2MPa at 100% purity, rather than 3MPa and purity of 99.9% under the UK LCHS. Producing hydrogen below/above this reference flow means the GHG intensity is adjusted higher/lower. By contrast, only upwards adjustments are required for the UK LCHS.
Further differences include the allocation approach. In the US, a system expansion (displacement) approach is generally used for co-product allocation, instead of energy allocation as in the UK LHCS. The US method can therefore give significantly negative GHG intensities for hydrogen produced from organic waste based biomethane[8]. Additionally, 45V places a cap on the amount of steam that can claimed as co-product from natural gas reforming to avoid incentivising over-production of steam to lower hydrogen GHG emissions (US DOE, 2024).
Uncertainties and future direction
45V is currently undergoing consultation to seek industry opinion on methods to enable a virtual tracking system for both direct connection and mass balancing for biomethane and fugitive methane. This includes counterfactual assumptions for biomethane feedstocks, treatment of fugitive emissions, and how to track and verify biomethane through virtual systems. It appears likely that 45V will impose “incrementality” (additionality), temporal matching and deliverability requirements for biomethane but details are unknown at present (Ding et al., 2024). More broadly, while the IRA has been signed into law, a change in US administration could create instability regarding the future of this tax credit.
International Partnership for Hydrogen and Fuel Cells in the Economy (IPHE)
IPHE is an international inter-governmental partnership, which aims to develop a set of mutually agreed methodologies and an analytical framework to determine the GHG emissions of hydrogen production. Use of this methodology is voluntary and differs from other standards reviewed as it serves as a framework for determining GHG emissions of hydrogen production only and does not set any eligibility criteria.
Version 3 of IPHE defines GHG methodologies for electrolysis, steam cracking, fossil gas reforming with CCS, fossil (coal) gasification with CCS, biomass biodigestion (anaerobic digestion to biomethane) with CCS, and biomass gasification with CCS. The methodologies for other pathways will be developed in the future. Unlike other standards, IPHE does not provide guidance on any categories (e.g., “renewable” or “low-carbon”), and it does not stipulate any GHG emission intensity threshold. (IPHE, 2023). This is expected to be done by individual countries participating in IPHE, if they wish to do so.
GHG calculation methodology principles
The current IPHE guidance covers a ‘cradle-to-point of use’ system boundary, which includes supply chain steps to transport hydrogen from the producer to the end user, but not the final use of the hydrogen. This goes beyond the UK LCHS system boundary, but not quite as far as EU RED.
Market-based emissions accounting approach such as renewable energy certificates (RECs) can be used to substantiate electrolytic hydrogen production from renewable electricity. There are no requirements on additionality, temporal correlation and geographic correlation criteria.
IPHE provides pathway-specific recommendations for splitting GHG emissions between co-products, following a hierarchy of options (i.e. allocation based on LHV energy content, followed by system expansion, then economic value). However, certain allocation methods are deemed not appropriate for certain pathways (e.g. energy allocation is not recommended for electrolysis and chloralkali pathways.
Key uncertainties and future direction
The latest IPHE Working Paper (Version 3) was released in July 2023. It is unclear if additional versions will be published, or whether future IPHE developments will be incorporated within the ISO 19870 process, since ISO is developing a global standard starting from the IPHE V3 methodology.
ISO 19870
The IPHE methodology V3 was used as the basis of a draft ISO Technical Specification (ISO/TS 19870) published in late 2023 (ISO, 2023). This is now being further developed into an ISO International Standard on the “Methodology for determining the greenhouse gas emissions associated with the production, conditioning and transport of hydrogen to consumption gate”. This standard is due to be published in 2025. This first ISO hydrogen standard (ISO 19870-1) will cover cradle to production gate, but future standards in the series may cover downstream steps including hydrogen conversion and distribution.
Similar to IPHE, ISO 19870-1 will not provide any threshold values or define any hydrogen categories, labels or colours. All pathways are eligible, but detailed guidance will be provided for a number of pathways. Given the focus is purely on GHG emissions, sustainability requirements are not currently set for biomass feedstocks.
GHG calculation methodology principles
Onsite/direct connection to renewable generators are allowed provided no contracts are sold to a third party. Alternatively, power may be purchased from the grid with a contract and energy attribute certificates (e.g. RECs, GOs) provided ISO 14064-1 (part E.2.2) quality criteria are met (ISO, 2018).
No reference flow is set in ISO/TS 19870, with pressure and purity only set by the next user in the supply chain. However, the GHG emissions intensity shall be adjusted upwards to reflect the presence of impurities in the hydrogen product (e.g. water, nitrogen, carbon dioxide, carbon monoxide, methane etc), and their release to atmosphere.
Other requirements
Chain of custody requirements are not specified, but energy sourcing allows grid purchase with Guarantees of Origin (GOs). Production batches can be any length of time chosen by the operator. GHG emissions of capital equipment are to be reported separately.
Uncertainties
ISO 19870-1 is still under development, therefore significant uncertainties exist, particularly around the (multiple) allocation methodologies that will be recommended for each individual pathway, and the level of detail required for evidence. Whilst ISO standards flow into national standards, Governments are not required to adopt or use a national standard. As a result, how countries/regions choose to align their policies with the new ISO standard once published is unclear (International PtX Hub, 2023). This may depend on whether ISO 19870-1 remains broad in simultaneously accommodating different methodology choices (e.g. consequential or attributional allocation) or becomes more prescriptive with a single methodology and more detailed evidence requirements.
TÜV SÜD
TÜV SÜD is an industry developed, voluntary standard which provides a guaranteed proof of origin alongside certification for renewable hydrogen. The present standard is based on European legislation but is in principle applicable worldwide. A certificate for the production of hydrogen from renewable energy sources labelled “GreenHydrogen” can be issued if all requirements are met (TÜV SÜD, 2021).
Eligibility
The GHG emission threshold follows EU RED, though it accepts two system boundaries which are ‘cradle-to-point of use’ (GreenHydrogen+) or ‘cradle-to-production gate’ (GreenHydrogen) if delivered at the plant gate or injected in a transmission grid. TÜV SÜD also requires that during periods when hydrogen production is not certified as “GreenHydrogen”, emissions still remain below 91 gCO₂e/MJLHV. The scheme currently covers four production pathways, all of which are renewable. Biomass feedstocks used for hydrogen production must meet relevant RED sustainability criteria.
GHG calculation methodology principles
Proof of renewable electricity for electrolysis hydrogen production can be provided by purchasing and retiring GOs or comparable certificates (RECs) which follow EU RED rules though it is unclear if this refers to the renewable electricity DA. GreenHydrogen+ imposes further requirements which includes additionality (new power production must have commissioned no later/earlier than 11 months following the hydrogen production facility installation), temporal correlation (every 15 minutes) and geographical correlation. These rules are more stringent than the UK LCHS and EU RED. The approach to allocating emissions between co-products follows EU RED, although where hydrogen is produced as a by-product such as in chlor-alkali electrolysis, it is possible to allocate emissions using energy allocation, economic allocation or system expansion.
Uncertainties and future direction
The future use of this voluntary scheme and others such as CertifHy and TÜV Rheinland could be impacted by the potential future alignment with ISO 19870.
TÜV Rheinland
TÜV Rheinland is an industry developed, voluntary standard similar to TÜV SÜD, but has an expanded scope which covers both “Renewable Hydrogen” and “Low Carbon Hydrogen”. The present standard is based on European legislation but is in principle applicable worldwide (TÜV Rheinland, 2023).
Eligibility
The GHG emission threshold follows EU RED for both hydrogen categories. Though the system boundary is defined by the user (e.g., cradle to production gate or to point of use). “Renewable hydrogen” has two sub-categories, “Green Hydrogen” and “RFNBO (RED II)”. Eligible pathways for both are electrolytic hydrogen produced from renewable (non-biogenic) electricity and water or aqueous solutions (e.g. chlor-alkali electrolysis) but have different renewable power purchasing requirements. For low-carbon hydrogen, all pathways are eligible e.g., steam reforming, electrolysis, pyrolysis etc.
GHG calculation methodology principles
To be certified as “Green Hydrogen”, renewable electricity can be supplied via a direct connection or the electricity grid (with PPA). The renewable electricity is not required to be additional, but if sourcing via the grid, must have temporal matching on an annual basis and located within the same country. “RFNBO (RED II)” certification requires RED II renewable electricity rules are met.
Green Hydrogen Standard (GH2)
The Green Hydrogen Organisation (GH2) is an industry developed voluntary standard (non-profit foundation) based in Switzerland. Green hydrogen projects that meet the requirements will be licensed to use the label “GH2 Green Hydrogen” and will be eligible to generate and trade GH2 certificates of origin (GH2 Standard, 2023).
Eligibility
GH2 only allows electrolytic hydrogen produced from 100% renewable energy supplied via a direct connection or the electricity grid (with PPA). It sets a significantly lower GHG emissions threshold than the UK LCHS, of 8.33 gCO2e/MJ LHV hydrogen product on a ‘cradle-to-production gate’ basis. Hydrogen developers have the option to calculate and report on embodied emissions including construction emissions.
Where biomass is used in electricity generation, hydrogen developers are required to demonstrate a low risk of indirect land use change, including verifying that production of feedstock does not take place on land with high biodiversity, that land with a high amount of carbon has not been converted for feedstock production. Additionally, hydrogen developers are required to address any risks relating to the displacement of crops for food and feed. Adherence to the EU Commission Delegated Regulation 2019/807 (criteria for determining the high ILUC-risk feedstock) or an equivalent national standard will satisfy this requirement.
GHG calculation methodology principles
Under GH2 the same ‘cradle-to-production gate’ system boundary as the UK LCHS is used. Renewable electricity through RECs are allowed but not required to meet additionality, temporal and geographical correlation. Co-product allocation is not specifically mentioned but given GH2 applies the methodology for the electrolysis production pathway as per IPHE, it is assumed that this will also follow IPHE. For electrolysis, the use of system expansion is recommended for co-product allocation between hydrogen and oxygen products as energy allocation is not appropriate for this co-product.
Uncertainties and future direction
The scheme may expand to include nuclear and other forms of energy production with low emissions but the timeframe for this is currently unknown.
Appendix C GHG calculation methodology
EU RED
Biofuel: E = eec + el + ep + etd + eu – esca – eccs – eccr
Where,
|
E |
= |
total emissions from the use of the fuel; |
|
eec |
= |
emissions from the extraction or cultivation of raw materials; |
|
el |
= |
annualised emissions from carbon stock changes caused by land-use change; |
|
ep |
= |
emissions from processing; |
|
etd |
= |
emissions from transport and distribution; |
|
eu |
= |
emissions from the fuel in use; |
|
esca |
= |
emission savings from soil carbon accumulation via improved agricultural management; |
|
eccs |
= |
emission savings from CO2 capture and geological storage; and |
|
eccr |
= |
emission savings from CO2 capture and replacement. |
RFNBO and RCF: E = ei + ep + etd + eu – eccs
Where,
|
E |
= |
total emissions from the use of the fuel; |
|
ei |
= |
emissions from supply of inputs = ei elastic + ei rigid – e ex-use; |
|
ei elastic |
= |
emissions from elastic inputs; |
|
ei rigid |
= |
emissions from rigid inputs; |
|
e ex-use |
= |
emissions from inputs’ existing use or fate; |
|
ep |
= |
emissions from processing; |
|
etd |
= |
emissions from transport and distribution; |
|
eu |
= |
emissions from the fuel in use; |
|
eccs |
= |
emission savings from CO2 capture and geological storage |
EU Gas Directive
E = ei + ep + etd + eu – eccs – eccu
Where,
|
E |
= |
total emissions from the use of the fuel; |
|
ei |
= |
emissions from supply of inputs = ei elastic + ei rigid – e ex-use; |
|
ei elastic |
= |
emissions from elastic inputs; |
|
ei rigid |
= |
emissions from rigid inputs; |
|
e ex-use |
= |
emissions from inputs’ existing use or fate; |
|
ep |
= |
emissions from processing (including captured carbon); |
|
etd |
= |
emissions from transport and distribution; |
|
eu |
= |
emissions from the fuel in use; |
|
eccs |
= |
net emission savings from CO2 capture and geological storage; |
|
eccu |
= |
net emission savings from CO2 captured and permanently chemically bound in long-lasting products. |
ISO/TS 19870
E = ecombustion emissions + efugitive emissions + eindustrial process emissions + eenergy supply emissions + eupstream emissions
Where,
|
ecombustion emissions |
= |
combustion of relevant solid, liquid and/or gaseous fuels |
|
efugitive emissions |
= |
leakages and accidental losses, as well as other losses due to incorrect management of plant operations |
|
eindustrial process emissions |
= |
specific GHG gases used across a number of industry activities (e.g., hydrofluorocarbons (HFCs) used in industrial refrigeration and/or cooling systems, and sulphur hexafluoride (SF6) used in electrical switchgear). |
|
eenergy supply emissions |
= |
emissions associated with the supply of energy |
|
eupstream emissions |
= |
emissions relating to the upstream extraction of resources |
Appendix D Hydrogen pathways modelled
|
Hydrogen production pathway |
Hydrogen production country |
Distribution pathway to Rotterdam |
End product |
|---|---|---|---|
|
Electrolysis using renewable electricity |
Scotland, Norway, Morocco, Chile, USA |
Ammonia shipping with reconversion to hydrogen |
Hydrogen |
|
Electrolysis using renewable electricity |
Scotland, Norway, Morocco, Chile, USA |
Ammonia shipping |
Ammonia |
|
Electrolysis using renewable electricity |
Scotland, Norway, Morocco |
Compressed hydrogen shipping |
Hydrogen |
|
Electrolysis using renewable electricity |
Scotland, Norway, Morocco |
Compressed hydrogen pipeline |
Hydrogen |
|
Electrolysis using nuclear electricity |
France |
Ammonia shipping with reconversion to hydrogen |
Hydrogen |
|
Electrolysis using nuclear electricity |
France |
Ammonia shipping |
Ammonia |
|
Electrolysis using nuclear electricity |
France |
Compressed hydrogen shipping |
Hydrogen |
|
Electrolysis using nuclear electricity |
France |
Compressed hydrogen pipeline |
Hydrogen |
|
Electrolysis using grid electricity |
Scotland, Norway, France, Morocco, Chile, USA |
Ammonia shipping with reconversion to hydrogen |
Hydrogen |
|
Electrolysis using grid electricity |
Scotland, Norway, France, Morocco, Chile, USA |
Ammonia shipping |
Ammonia |
|
Electrolysis using grid electricity |
Scotland, Norway, France, Morocco |
Compressed hydrogen shipping |
Hydrogen |
|
Electrolysis using grid electricity |
Scotland, Norway, France, Morocco |
Compressed hydrogen pipeline |
Hydrogen |
|
Natural gas ATR+CCS |
UK, USA |
Ammonia shipping with reconversion to hydrogen |
Hydrogen |
|
Natural gas ATR+CCS |
UK, USA |
Ammonia shipping |
Ammonia |
|
Natural gas ATR+CCS |
UK |
Compressed hydrogen shipping |
Hydrogen |
|
Natural gas ATR+CCS |
UK |
Compressed hydrogen pipeline |
Hydrogen |
*In the case of France, electrolytic hydrogen production was modelled using electricity from nuclear sources instead of renewable sources
Appendix E Modelling assumptions
|
Location |
Assumption |
2023 |
2030 |
References | |
|---|---|---|---|---|---|
|
Hydrogen production location |
USA |
The Northeast region of the US was used in the 2023 CXC report but no specific location was stated. To align with the CXC report and based on likely shipping ports, New Jersey has been assumed for the production location (and electricity grid factor), and Port Newark for the export location. |
– |
– | |
|
Shipping distances/days |
All |
The shipping distances from Scotland, Norway, Morocco and Chile to Rotterdam, were taken from the 2023 CXC report. A shipping distance for the US was not given, so has been calculated from Port Newark to Rotterdam. The shipping time (days) has been calculated based on a ship speed of 29.6 km/hr (JRC, 2024) and calculated using Sea-Distances, 2024. The shipping distance for France was 38.2 km in the CXC report – assumed this is a typo given the shortest shipping distance between France and Rotterdam is from Port of Dunkirk (261 km). |
Scotland: 930 km / 1.3 days Norway: 1,312 km / 1.8 days France (Port of Dunkirk): 261 km / 0.4 days Morocco: 2,747 km / 3.9 days USA (Port Newark): 6,265 km / 14 days Chile: 17,970 km / 25.3 days |
Scotland: 930 km / 1.3 days Norway: 1,312 km / 1.8 days France (Port of Dunkirk): 261 km / 0.4 days Morocco: 2,747 km / 3.9 days USA (Port Newark): 6,265 km / 14 days Chile: 17,970 km / 25.3 days |
CXC, 2023, pg41 |
|
Pipeline distances |
All except USA & Chile |
The pipeline distances from Scotland, Norway, France and Morocco to Rotterdam, were taken from the 2023 CXC report. |
Scotland: 930 km Norway: 1,312 km France: 435 km Morocco: 1,930 km |
Scotland: 930 km Norway: 1,312 km France: 435 km Morocco: 1,930 km |
CXC, 2023, pg41 |
|
Electricity grid GHG intensity |
Scotland |
Average annual grid generation intensity recorded for 2023 taken as current value (45.9 gCO2/kWh) (National Grid ESO, 2024). gCO2/kWh value increased by 1% to derive gCO2e/kWh value based on the difference between gCO2 and gCO2e intensities reported in UK Gov Conversion Factors, 2024. Given EU RED and ISO/TS 19870 requirements, upstream emissions were added for Scottish generators, calculated (as 3.61 gCO2e/MJ elec currently) using the electricity generation mix from DESNZ, 2023 and applying the fuel emission factors in Table 3 of the RED Delegated Act on GHG methodology for RCFs and RFNBOs. Imports of electricity into Scotland were ignored in the upstream calculations. Scottish electricity grid in 2030 is estimated to reach 120 TWh/yr generation and emit 1025 ktCO2e/yr (Scottish Government, 2024). Upstream emissions were estimated for 2030 by applying the same ratio as the generation emissions for 2023 compared to 2030. |
16.5 gCO2e/MJ elec |
3.0 gCO2e/MJ elec |
National Grid ESO, 2024, Country Carbon Intensity Forecast UK Gov, 2024, Greenhouse gas reporting: conversion factors 2024 DESNZ, 2023, Energy Trends https://www.gov.scot/policies/renewable-and-low-carbon-energy Scottish Government, 2024, Greenhouse gas emissions projections |
|
Electricity grid GHG intensity |
Norway |
2023 grid mix taken from Ember (Ember, 2024). Generation and upstream emissions were calculated using the fuel combustion and upstream emission factors in Table 1 and Table 3 of the RED Delegated Act on GHG methodology for RCFs and RFNBOs and generator efficiencies from JRC (2020). Norway renewables capacity is expected to increase by 40 TWh in Norway in 2030 (DLA Piper, 2023). |
2.46 gCO2e/MJ elec |
1.95 gCO2e/MJ elec |
European Commission, 2023, Delegated Act 2023/1185. |
|
Electricity grid GHG intensity |
France |
2023 grid mix taken from Ember (Ember, 2024). Generation and upstream emissions were calculated using the fuel combustion and upstream emission factors in Table 1 and Table 3 of the RED Delegated Act on GHG methodology for RCFs and RFNBOs and generator efficiencies from JRC (2020). France aims for 34% renewable electricity in 2030 compared to currently 24.7% (IEA, 2024). |
17.3 gCO2e/MJ elec |
15.7 gCO2e/MJ elec |
European Commission, 2023, Delegated Act 2023/1185. |
|
Electricity grid GHG intensity |
Morocco |
2023 grid mix taken from Ember (Ember, 2024). Generation and upstream emissions were calculated using the fuel combustion and upstream emission factors in Table 1 and Table 3 of the RED Delegated Act on GHG methodology for RCFs and RFNBOs and generator efficiencies from JRC (2020). Current renewables capacity is ~38%, aiming to increase to 52% by 2030 (International Trade Administration, 2024). This anticipated percentage increase in renewables capacity was used to estimate the grid emission factor for 2030. |
188.4 gCO2e/MJ elec |
162.1 gCO2e/MJ elec |
European Commission, 2023, Delegated Act 2023/1185. |
|
Electricity grid GHG intensity |
USA (New Jersey) |
Latest year grid mix for the RFC East subregion in which New Jersey is in (EPA, 2022). Generation and upstream emissions were calculated using the fuel combustion and upstream emission factors in Table 1 and Table 3 of the RED Delegated Act on GHG methodology for RCFs and RFNBOs and generator efficiencies from JRC (2020). New Jersey is targeting 50% reduction in electricity generation emissions by 2030 compared to 2005 (climate-Xchange.org, 2024, NJ DEP, 2024). This emissions reduction was applied to the 2023 generation emissions to calculate the 2030 generation emissions. To estimate the 2030 upstream emissions, the 2023 upstream to generation emissions ratio was applied. |
68.2 gCO2e/MJ elec |
34.1 gCO2e/MJ elec |
European Commission, 2023, Delegated Act 2023/1185. JRC, 2020, JEC-Well-to-Tank report v5 climate-Xchange.org, 2024, New Jersey NJ DEP, 2024, NJ Greenhouse Gas Emissions Inventory Report Years 1990-2021 |
|
Electricity grid GHG intensity |
Chile |
2023 grid mix taken from Ember (Ember, 2024). Generation and upstream emissions were calculated using the fuel combustion and upstream emission factors in Table 1 and Table 3 of the RED Delegated Act on GHG methodology for RCFs and RFNBOs and generator efficiencies from JRC (2020). By 2030, Chile aims to reduce emissions by 84% compared to 2021 (Wartsila, 2022) – 2021 grid mix used to estimate 2030 grid emission factor (Ember, 2024). |
72.7 gCO2e/MJ elec |
19.1 gCO2e/MJ elec |
European Commission, 2023, Delegated Act 2023/1185. |
|
Electricity grid GHG intensity |
UK |
2023 factor calculated based on the GB generation intensity data from National Grid ESO (2024). Given EU RED and ISO/TS 19870 requirements, upstream emissions were added, calculated using the GB electricity generation mix (DESNZ, 2023) and applying the fuel upstream emission factors from UK Gov (2024), and generator efficiencies from JRC (2020). Upstream emissions of imported electricity were calculated using the same approach, using country electricity grid generation mixes (IEA, 2023) for France, Belgium, Netherlands and Norway, weighted by the proportion of imported electricity from UK Gov Energy Trends (2024). 2030 generation factor calculated based National Grid Future Energy Scenarios (FES) following the Holistic Transition scenario. The upstream emissions factors from GB generation were calculated using the 2030 GB electricity generation mix (National Grid ESO, 2024). Transmission and distribution losses (7.5%) were included for all upstream emissions calculations (National Grid ESO, 2024), to give consistent gCO2e/kWh delivered values. For simplicity, GB factors taken for UK. |
53.8 gCO2e/MJ elec delivered (11.4 upstream + 42.4 generation) |
16.7 gCO2e/MJ elec delivered (5.0 upstream + 11.6 generation) |
National grid ESO, 2024, ESO’s Carbon Intensity Dashboard. European Commission, 2023, Delegated Act 2023/1185. UK Gov, 2024, Greenhouse gas reporting: conversion factors 2024 UK Gov, 2024, Energy Trends: UK electricity IEA, 2023, Energy Statistics Data Browser JRC, 2020, JEC-Well-to-Tank report v5 National Grid ESO, 2024, Future Energy Scenarios: Pathways to Net Zero. |
|
Electricity grid GHG intensity |
Netherlands |
2023 grid mix taken from Ember (Ember, 2024). Generation and upstream emissions were calculated using the fuel combustion and upstream emission factors in Table 1 and Table 3 of the RED Delegated Act on GHG methodology for RCFs and RFNBOs and generator efficiencies from JRC (2020). The 2030 Netherlands grid mix is taken from the JRC and upstream and combustion emission factors from the RED were applied to estimate the 2030 grid emission factor (JRC, 2024). |
81.2 gCO2e/MJ elec |
31.6 gCO2e/MJ elec | |
|
Renewable electricity GHG intensity |
All |
Generation and upstream emissions for wind, hydro and solar electricity are considered as zero, as per EU RED and ISO/TS 19870. |
0 gCO2e/MJ elec |
0 gCO2e/MJ elec | |
|
Nuclear electricity GHG intensity |
France |
Emission factor for nuclear fuel is taken from Table 3 from RED Delegated Act on GHG methodology for RCFs and RFNBOs (1.2 gCO2e/MJ LHV fuel) (European Commission, 2023). Nuclear power plant LHV efficiency of 33% then applied (JRC, 2020). |
3.64 gCO2e/MJ elec |
3.64 gCO2e/MJ elec |
European Commission, 2023, Delegated Act 2023/1185. JRC, 2020, JEC WTT v5 – NUEL chain (Pathways 6 Electricity workbook) |
|
Natural gas grid GHG intensity |
Netherlands, UK & USA (following EU RED DA methodology) |
Natural gas supply and combustion emissions are taken from RED Delegated Act on GHG methodology for RCFs and RFNBOs (European Commission, 2023), given the factors in the Delegated Act do not distinguish between different countries (including those outside of the EU). In the absence of 2030 intensity projections by country, assumed the same GHG intensity for 2030. |
Upstream: 12.7 gCO2e/MJ LHV Combustion: 56.2 gCO2e/MJ LHV |
Upstream: 12.7 gCO2e/MJ LHV Combustion: 56.2 gCO2e/MJ LHV | |
|
Natural gas grid GHG intensity |
Netherlands (following ISO/TS 19870 methodology) |
Natural gas supply and combustion emissions are taken from RED Delegated Act on GHG methodology for RCFs and RFNBOs (European Commission, 2023). In the absence of 2030 intensity projections by country, assumed the same GHG intensity for 2030. |
Upstream: 12.7 gCO2e/MJ LHV Combustion: 56.2 gCO2e/MJ LHV |
Upstream: 12.7 gCO2e/MJ LHV Combustion: 56.2 gCO2e/MJ LHV | |
|
Natural gas grid GHG intensity |
UK (following ISO/TS 19870 methodology) |
Upstream natural gas emissions taken from the UK Low Carbon Hydrogen Standard V3 (DESNZ, 2023). In the absence of 2030 intensity projections by country, assumed the same GHG intensity for 2030. |
Upstream: 8.7 gCO2e/MJ LHV Combustion: 56.2 gCO2e/MJ LHV |
Upstream: 8.7 gCO2e/MJ LHV Combustion: 56.2 gCO2e/MJ LHV | |
|
Natural gas grid GHG intensity |
USA (following ISO/TS 19870 methodology) |
Upstream natural gas CO2 emissions taken from GREET (16.52 gCO2/kWh natural gas). The methane leakage rate (7.5 gCH4/kg natural gas) is based on the Pennsylvania region in Sherwin et al. (2024) given this is the closest region to New Jersey. The natural gas LHV applied to convert units is from UK Gov Conversion Factors (2024). Combustion emissions were based on RED Delegated Act on GHG methodology for RCFs and RFNBOs. In the absence of 2030 intensity projections by country, assumed the same GHG intensity for 2030. |
Upstream: 9.2 gCO2e/MJ LHV Combustion: 56.2 gCO2e/MJ LHV |
Upstream: 9.2 gCO2e/MJ LHV Combustion: 56.2 gCO2e/MJ LHV |
R&D GREET, 2023, NA NG from Shale and Conventional Recovery UK Gov, 2024, Greenhouse gas reporting: conversion factors 2024 |
|
Electrolyser inputs |
All |
Assume PEM electrolyser with current LHV efficiency 61% and output pressure at 30 bar (CXC, 2022 – aligns with DESNZ, 2023; IEA, 2019; Element Energy, 2019). 2030 value assumed to reach 66% efficiency (CXC, 2022) – this aligns with other sources (IEA, 2019). CXC assume 25 kg H2O/kg H2 in water consumption for current year (CXC, 2023) and assumed remains constant to 2030. Chemical inputs (hydrochloric acid and sodium hydroxide) required to deionise water are based on industry data. The emissions associated with these chemical inputs are very small. |
Electrolyser efficiency: 61% Water consumption: 25 kg H2O/kg H2 Chemical inputs: 1.8 x10⁻⁶ kg NaOH/MJ H2 1.6 x10⁻⁶ kg HCl/MJ H2 |
Electrolyser efficiency: 66% Water consumption: 25 kg H2O/kg H2 Chemical inputs: 1.8 x10⁻⁶ kg NaOH/MJ H2 1.6 x10⁻⁶ kg HCl/MJ H2 |
IEA, 2019, The Future of Hydrogen Element Energy, 2018, Hydrogen supply chain evidence base prepared for BEIS |
|
ATR + CCS inputs |
UK, USA |
ATR+CCS plant LHV efficiency from Environment Agency (2023) and electricity input and water consumption from the same reference. These values align with other sources (Element Energy, 2018). Included grid electricity for ATR+CCS operations (JRC, 2020). Hydrogen output from ATR assumed to be at 20 bar (Element Energy, 2018) – hence included electricity for additional hydrogen compression to 30 bar (DESNZ, 2023). Emissions of fugitive methane and N2O, and consumption of MEA catalyst are from industry data. CO2 capture rate of 95% (Environmental Agency, 2023; Element Energy, 2018). All inputs assume to remain constant to 2030. Assume same inputs for US and UK. |
LHV efficiency: 80.6% ATR electricity: 8.8 MJ elec/kg H2 Electricity for nat gas compression: 0.0059 MJ elec/MJLHV nat gas Additional electricity for hydrogen compression: 0.0068 MJ elec/MJLHV H2 Water consumption: 3.8 kg H2O/kg H2 Catalyst consumption: 0.000081 kg MEA/MJLHV H2 CO2 capture rate: 95% Fugitive emissions: 0.00071 gCH4/MJLHV H2 0.0028 gN2O/MJLHV H2 |
LHV efficiency: 80.6% ATR electricity: 8.8 MJ elec/kg H2 Electricity for nat gas compression: 0.0059 MJ elec/MJLHV nat gas Additional electricity for hydrogen compression: 0.0068 MJ elec/MJLHV H2 Water consumption: 3.8 kg H2O/kg H2 Catalyst consumption: 0.000081 kg MEA/MJLHV H2 CO2 capture rate: 95% Fugitive emissions: 0.00071 gCH4/MJLHV H2 0.0028 gN2O/MJLHV H2 |
JRC, 2020, JEC-Well-to-Tank report v5 Element Energy, 2018, Hydrogen supply chain evidence base prepared for BEIS |
|
Hydrogen compression before pipeline transport |
Scotland, Morocco, Norway, France, UK |
Hydrogen assumed to be produced at 30 bar. Compression required to reach 100 bar for injecting in transmission pipeline network (Element Energy, 2018). Electricity required for compressing hydrogen from 30 bar to 100 bar calculated using formula in DESNZ, 2023. |
0.78 kWh/kg H2 |
0.78 kWh/kg H2 |
Element Energy, 2018, Hydrogen supply chain evidence base prepared for BEIS |
|
Pipeline transport |
Scotland, Morocco, Norway, France, UK |
Offshore subsea pipelines assumed for Scotland, and Norway; onshore pipelines will be used for France; and both onshore and offshore pipelines will be used for Morocco. Pipelines have been excluded for Chile and the USA due to the distances required. Dedicated pipeline compressor ratings in the CXC report were used and pipeline throughput from European Hydrogen Backbone report for 36-inch pipeline at 75% capacity. Assume losses in pipeline transport of 1% (JRC, 2024). |
Scotland: 36 MWe/1000 km Norway: 60 MWe/1000 km France: 45 MWe/1000 km Morocco: 40 MWe/1000 km Pipeline losses: 1% 36-inch pipeline throughput at 75% capacity: 3600 MWLHV H2 |
Scotland: 36 MWe/1000 km Norway: 60 MWe/1000 km France: 45 MWe/1000 km Morocco: 40 MWe/1000 km Pipeline losses: 1% 36-inch pipeline throughput at 75% capacity: 3600 MWLHV H2 | |
|
Hydrogen compression before trucking |
All (expect USA and Chile) |
Hydrogen assumed to be produced at 30 bar. Compression required to reach 500 bar (JRC, 2020) for trucking of hydrogen and storage of hydrogen (Element Energy, 2018) at either side of the shipping port. Electricity required for compressing hydrogen from 30 bar to 500 bar calculated using formula in DESNZ, 2023. |
2.34 kWh/kg H2 |
2.34 kWh/kg H2 |
JRC, 2020, JEC-Well-to-Tank report v5 Element Energy, 2018, Hydrogen supply chain evidence base prepared for BEIS |
|
Compressed hydrogen trucking |
All (expect USA and Chile) |
Hydrogen trucked at 500 bar, from hydrogen plant to port. Trucks are assumed to use diesel with biofuel blend in the current year based on UK Gov conversion factors (2024). By 2030, assume trucks use a 12% biofuel blend (LHV basis) in 2030 based on DfT targets (2021), and for simplicity, this applies to all regions. For all pathways, assume a trucking distance of 50 km between hydrogen production site and port (JRC, 2020). Standard truck fuel use was taken from JEC (2020) and an adjustment factor was applied to account for trucking hydrogen. The leakage rate for compressed hydrogen trucking is assumed to be the same as for storage (Frazer-Nash, 2022) therefore assumed 0.24% leakage per day during trucking. |
Distance: 50 km Payload: 0.955 tonne H2 payload Capacity: 28 tonne tank mass Losses: 0.24%/day Fuel use: 0.81 MJ diesel/tonne.km |
Distance: 50 km Payload: 0.955 tonne H2 payload Capacity: 28 tonne tank mass Losses: 0.24%/day Fuel use: 0.81 MJ diesel/tonne.km |
UK Gov, 2024, Greenhouse gas reporting: conversion factors 2024 JRC, 2020, JEC-Well-to-Tank report v5 Frazer-Nash Consulting, 2022, Fugitive Hydrogen Emissions in a Future Hydrogen Economy |
|
Compressed hydrogen storage |
All (expect USA and Chile) |
Hydrogen stored in gaseous form at 500 bar. The leakage rate ranges from 0.12% – 0.24% per day depending on the storage pressure, cylinder and valve material, and the size of the cylinder. Assume a smaller cylinder is required due to hydrogen being stored at high pressure therefore expect the leakage rate to be at the top end of this range (0.24%). Average duration of compressed hydrogen delivery is 2 – 30 days (Frazer-Nash, 2022). Here assume 20 days storage. |
Losses: 0.24%/day Storage time: 20 days |
Losses: 0.24%/day Storage time: 20 days |
Frazer-Nash Consulting, 2022, Fugitive Hydrogen Emissions in a Future Hydrogen Economy |
|
Hydrogen decompression |
All (expect USA and Chile) |
Assumed no heat required for decompression of gaseous hydrogen from high pressure. |
– |
– | |
|
Compressed hydrogen shipping |
All (expect USA and Chile) |
Hydrogen shipped at 250 bar on ship with capacity (1370 t H2) and fuel usage (534 kt diesel/Mt H2) taken from JRC (2024). Fuel usage converted to MJ diesel/km assuming 29.1 ships deliver 1 Mt H2/yr over distance of 2,500 km (JRC, 2024). Assumed current shipping runs on fossil marine diesel oil (not biodiesel as in JRC source), and by 2030, 25% of hydrogen carrying vessels are assumed to be running on external sources of zero carbon hydrogen (so effectively 25% lower fossil marine diesel oil use by 2030). Ship speed (29.6 km/hr) taken from JRC (2024). The leakage rate for compressed hydrogen shipping is assumed to be the same as for storage (Frazer-Nash, 2022) therefore assumed 0.24% leakage per day during shipping. Return ship journeys always assumed to be empty (IEA, 2019). |
Ships: 100% fossil marine diesel oil Fuel usage: 437 MJ diesel/km |
Ships: 75% fossil marine diesel oil, 25% zero carbon hydrogen Fuel usage: 328 MJ diesel/km | |
|
Capacity: 1370 tonne H2 Vessel speed: 29.6 km/hr Losses: 0.24%/day |
Capacity: 1370 tonne H2 Vessel speed: 29.6 km/hr Losses: 0.24%/day |
Frazer-Nash Consulting, 2022, Fugitive Hydrogen Emissions in a Future Hydrogen Economy | |||
|
Ammonia production |
All |
Data for ammonia production taken from JRC, 2024. Includes inputs of electricity, iron-based catalyst, and water consumption (150 L/kg ammonia used for cooling where 9% is consumed and the rest is recycled in the process; 1.9 L/kg ammonia used for water deionisation). Also, ammonia emissions and nitrous oxide emissions are included. |
Electricity requirement: 0.81 kWh/kg NH3 Catalyst: 0.055 g catalyst/kg NH3 Water consumption: 15.4 L H2O/kg NH3 Fugitive emissions: 1.63 gNH3/kgNH3 1.0 gN2O/kgNH3 |
Electricity requirement: 0.81 kWh/kg NH3 Catalyst: 0.055 g catalyst/kg NH3 Water consumption: 15.4 L H2O/kg NH3 Fugitive emissions: 1.63 gNH3/kgNH3 1.0 gN2O/kgNH3 | |
|
Ammonia trucking |
All |
Trucks are assumed to use diesel with biofuel blend in the current year based on UK Gov conversion factors (2024). By 2030, assume trucks use a 12% biofuel blend (energy basis) in 2030 based on UK targets (DfT, 2021). No boil-off assumed (IEA, 2020). For all pathways a trucking distance of 50 km has been assumed from ammonia plant to port (JRC, 2020). Standard truck fuel use taken from JEC (2020) and an adjustment factor was applied to account for trucking ammonia, with the truck payload calculated based on an equivalent 2.6 tonne H2 capacity per ammonia truck (IEA, 2020) converted to 14.7 tonnes of ammonia using molar masses (JRC, 2020). |
Distance: 50 km Payload: 14.7 tonne NH3 payload Capacity: 28 tonne tank mass Losses: 0%/day Fuel use: 0.81 MJ diesel/tonne.km |
Distance: 50 km Payload: 14.7 tonne NH3 payload Capacity: 28 tonne tank mass Losses: 0%/day Fuel use: 0.81 MJ diesel/tonne.km |
UK Gov, 2024, Greenhouse gas reporting: conversion factors 2024 |
|
Ammonia storage |
All |
0.005 kWh/kg ammonia electricity required for storage at export terminal and 0.02 kWh/kg ammonia required for storage at import terminal. Assume 0%/day boil-off rate and 20 days storage time (IEA, 2020). |
Electricity for export terminal: 0.005 kWh/kg NH3 Electricity for import terminal: 0.02 kWh/kg NH3 Losses: 0%/day Storage time: 20 days |
Electricity for export terminal: 0.005 kWh/kg NH3 Electricity for import terminal: 0.02 kWh/kg NH3 Losses: 0%/day Storage time: 20 days | |
|
Ammonia shipping |
All |
Ammonia ship capacity and fuel use are calculated using the JRC, 2024 report. The ship capacity is based on compressed hydrogen ship capacity, applying the ratio of ships required to deliver 1 Mt H2/yr using compressed hydrogen (29.1 ships) compared to ammonia (4.5 ships). Fuel usage (57 kt diesel/Mt H2) assumed over shipping distance of 2,500 km. Assumed current shipping runs on fossil marine diesel oil, and by 2030, 25% of ammonia carrying vessels are assumed to be running on external sources of zero carbon ammonia (so effectively 25% lower fossil marine diesel oil use by 2030). Boil off rate assumed to be 0.02%/day (JRC, 2024). Ship speed (29.6 km/hr) taken from JRC, 2024. Return ship journeys always assumed to be empty (IEA, 2019). |
Fuel use: 100% fossil marine diesel oil, 302 MJ diesel/km Capacity: 8,859 tonne NH3 Vessel speed: 29.6 km/hr Losses: 0.02%/day |
Fuel use: 75% fossil marine diesel oil, 25% zero carbon ammonia, so 226.5 MJ diesel/km Capacity: 8,859 tonne NH3 Vessel speed: 29.6 km/hr Losses: 0.02%/day | |
|
Ammonia cracking |
All |
Data for ammonia cracking is based on JRC, 2024. Assume part of ammonia delivered to the cracker is used for heating (1.63 kg ammonia/kg H2), in addition to 5.67 kg ammonia/kg H2 feedstock use, used to calculate LHV efficiency of this step, given ammonia LHV = 18.6 MJ/kg. Hydrogen produced from ammonia cracking is assumed to be at 99.97% purity and 240 bar. No additional electricity required to compress hydrogen further for downstream usage. |
Ammonia input: 7.3 kg ammonia/kg H2 Electricity: 4.86 kWh/kg H2 Nickel-based catalyst: 1.46 g catalyst/kg H2 Zeolite powder: 0.88 g zeolite/kg H2 Fugitive emissions: Ammonia: 7.05 mg/kg H2 N2O: 4.89 mg N2O/kg H2 |
Ammonia input: 7.3 kg ammonia/kg H2 Electricity: 4.86 kWh/kg H2 Nickel-based catalyst: 1.46 g catalyst/kg H2 Zeolite powder: 0.88 g zeolite/kg H2 Fugitive emissions: Ammonia: 7.05 mg/kg H2 N2O: 4.89 mg N2O/kg H2 | |
|
Piping of hydrogen to hydrogen user |
Netherlands |
Transport of hydrogen via pipeline from port storage to the refinery was assumed to be 50 km. Hydrogen transferred from storage to pipeline assumed to be at sufficient pressure, so no additional compression electricity required (Element Energy, 2018). Pipeline compressor rating and throughput from European Hydrogen Backbone report for 36-inch pipeline at 75% capacity (similar to country specific ratings in the CXC 2023 report). Assume some losses in pipeline transport (JRC, 2024) with fugitive losses 1% |
Pipeline distance: 50 km Pipeline losses: 1% |
Pipeline distance: 50 km Pipeline losses: 1% |
Element Energy, 2018, Hydrogen supply chain evidence base prepared for BEIS |
|
Hydrogen user |
Netherlands |
In Rotterdam, there is a large focus on using hydrogen in industry, including petrochemical terminals and refineries. To align with a hydrogen application in Rotterdam, usage of gaseous hydrogen in a refinery was selected as the downstream application. For hydrogen use in a refinery boiler, N2O emissions have been included (0.272 mgN2O/kWh) (Scottish Government, 2023) with hydrogen losses of 0.5% (JRC, 2024). The input hydrogen pressure was assumed to be 10 bar (HyNet, 2022). |
N2O emissions: 0.272 mgN2O/kWh H2 Hydrogen losses: 0.5% |
N2O emissions: 0.272 mgN2O/kWh H2 Hydrogen losses: 0.5% |
Rotterdam Maritime Capital, Europe’s Hydrogen Hub Scottish Government, 2023, Nitrous Oxide emissions associated with 100% hydrogen boilers: research |
|
Ammonia user |
Netherlands |
Main uses of ammonia are in fertilisers, with shipping proposed as a major future market. Given the significance of the maritime sector in Rotterdam, usage of ammonia in shipping was selected as the downstream application. No further transport of ammonia before the final user Accounted for nitrous oxide emissions (0.061 gN2O/kWh) releasing during shipping (Maersk Mc-Kinney Moller Center, 2023). |
N2O emissions: 0.061 gN2O/kWh NH3 |
N2O emissions: 0.061 gN2O/kWh NH3 |
Rotterdam Maritime Capital, Europe’s Hydrogen Hub Maersk Mc-Kinney Moller Center, 2023, Managing Emissions from Ammonia-Fueled Vessels |
Appendix F Sensitivity Analysis
Sensitivity 1: All renewable electricity
The baseline results shown in Section 3.2 assume grid electricity in the relevant country is used whenever electricity is consumed in any of the steps downstream of hydrogen production, and that grid electricity is also used during hydrogen production via natural gas ATR+CCS.
This sensitivity tests the impact of using renewable electricity for all steps of the value chain, including hydrogen distribution (e.g. compression, ammonia production, cracking, storage etc) as well as for hydrogen production via ATRCCS. However, no change was made to the electrolysis input electricity source, and this sensitivity was not applied to grid electrolysis pathways as these pathways are unlikely to adopt fully renewable electricity for downstream steps outside of their control when the electrolysis is using grid average electricity.
Results in Figure 8 and Figure 9 below show that all renewable electrolysis pathways could fall even further below the GHG emission threshold in 2023 and 2030 when this sensitivity is applied. Compared to the baseline renewable electrolysis pathways (without the sensitivity applied), the emission intensity reduces by up to 46 gCO2e/MJLHV when utilising renewable electricity – this largest reduction is achieved for renewable electrolytic hydrogen produced in Morocco and transported as ammonia.
After application of this sensitivity, the main remaining emissions for the renewable electrolysis pathways will be the release of nitrous oxide in ammonia pathways, and the shipping fuels used for transporting ammonia or compressed hydrogen. The difference between 2023 and 2030 results is due to the decarbonisation of trucks and ships using cleaner fuels.
All renewable ammonia pathways are also expected to meet the EU GHG threshold. However, these pathways will still have significantly higher emissions compared to the gaseous hydrogen shipping pathways due to efficiency losses in the (re-)conversion steps and release of nitrous oxide.
Compared to the baseline, hydrogen produced in the UK or USA via natural gas pathways and transported as ammonia still exceeds the EU GHG threshold due to the upstream emissions and emissions associated with ammonia (re-)conversion. However, the emissions from producing hydrogen in the UK via natural gas ATR+CCS and transported via compressed shipping or pipeline could just meet the GHG threshold in 2023. The UK could therefore have an emissions advantage over the USA if comparing natural gas reforming pathways.
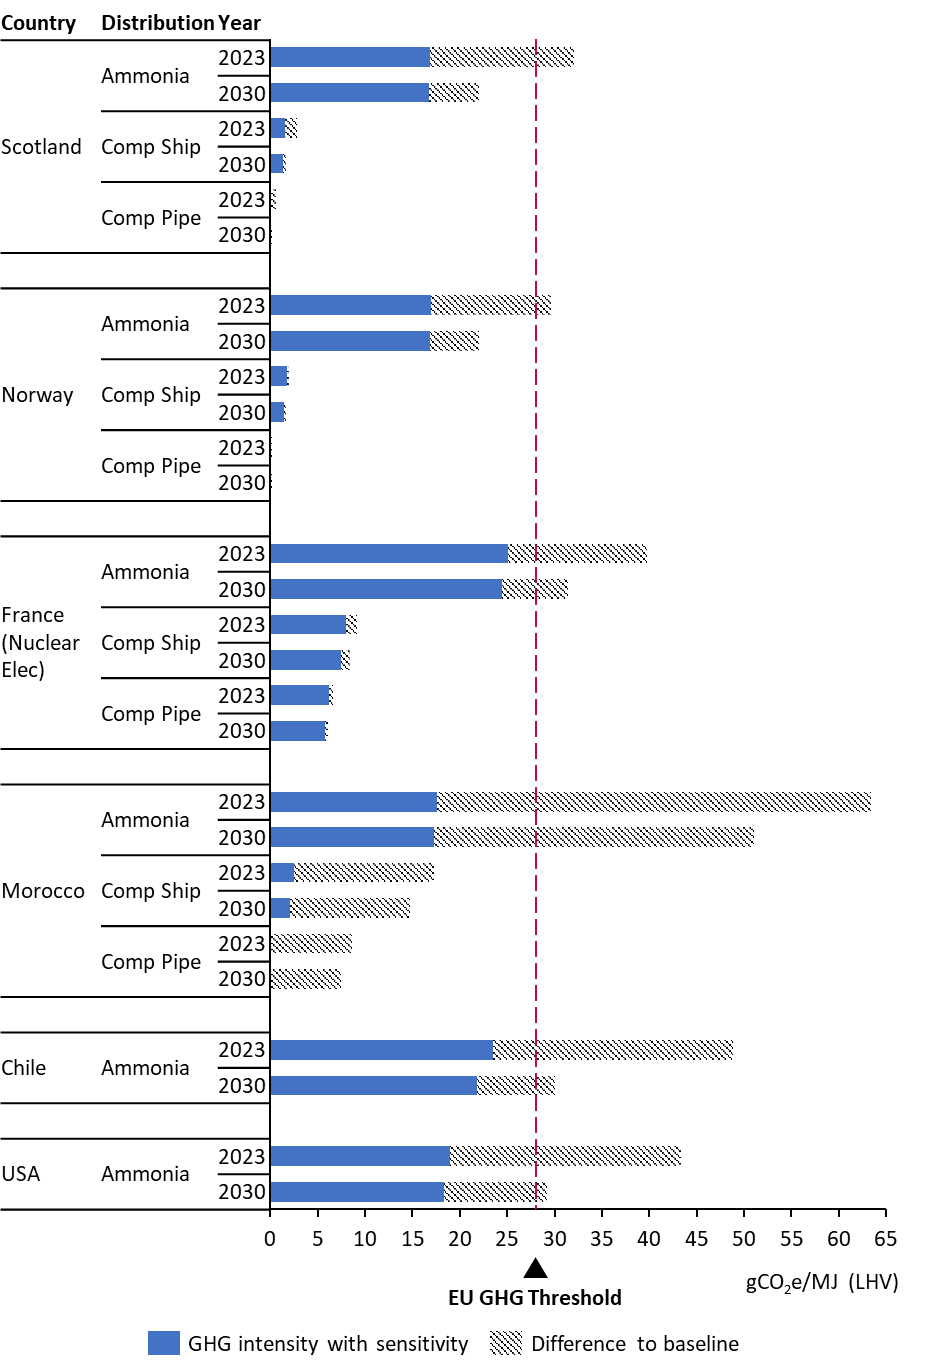
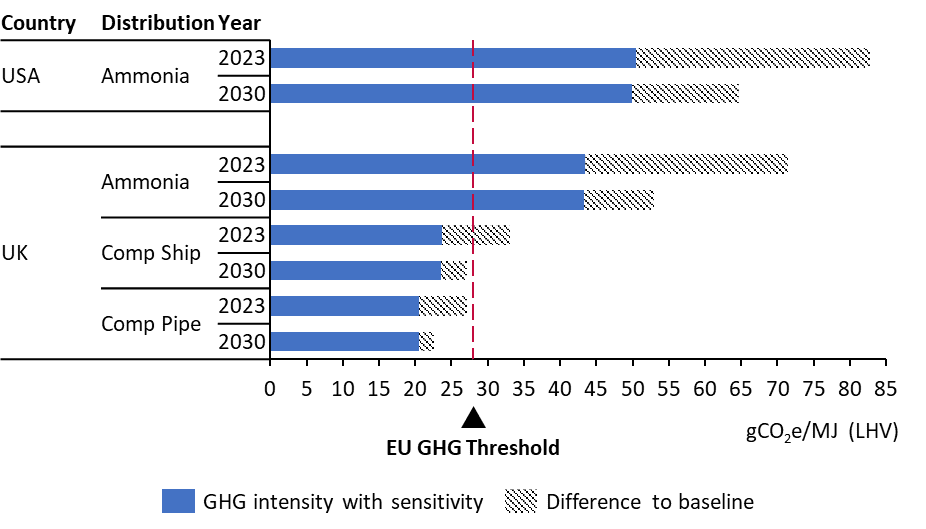
Sensitivity 2: GB vs Scotland grid electricity
In the baseline, Scottish grid electricity GHG intensities are modelled for Scottish production, although under EU RED or the EU Gas Directive, the European Commission are yet to confirm whether the Scottish or GB (or even average UK) grid intensity should be used. The GB grid electricity GHG intensity is significantly higher than that of Scotland’s due to the GB grid electricity mix consisting of a higher contribution from natural gas (~40% compared to ~10% in Scotland’s grid mix) and a lower contribution from renewable sources (~40% compared to ~70% in Scotland’s grid). Scotland is expected to have a much lower grid GHG intensity compared to GB until full decarbonisation of the GB grid is achieved. The UK Government have set a target to decarbonise the electricity grid by 2030 but for modelling purposes, the projected GHG intensity of the UK electricity grid is based on the grid mix data in the National Grid’s Future Energy Scenarios (~70% reduction in the electricity grid GHG intensity in 2030 compared to today). The GHG intensities modelled for the GB and Scottish grids include upstream emissions in line with EU RED requirements. As shown in Figure 10, all Scottish electrolysis and distribution pathway combinations using GB grid electricity intensities are expected to be above the EU GHG threshold in 2023, and only the compressed pipeline pathway may just comply in 2030.
The added emissions from the higher GB grid intensity are particularly significant for pathways transporting hydrogen via ammonia, increasing by over 100% compared to the same pathway using the Scottish grid factor.
Scottish producers would therefore gain a significant advantage if the Commission were to allow a Scottish grid factor to be used (and under EU RED rules, this decision would also become more likely if zonal pricing across GB is introduced, provided there are one or more zones in Scotland).
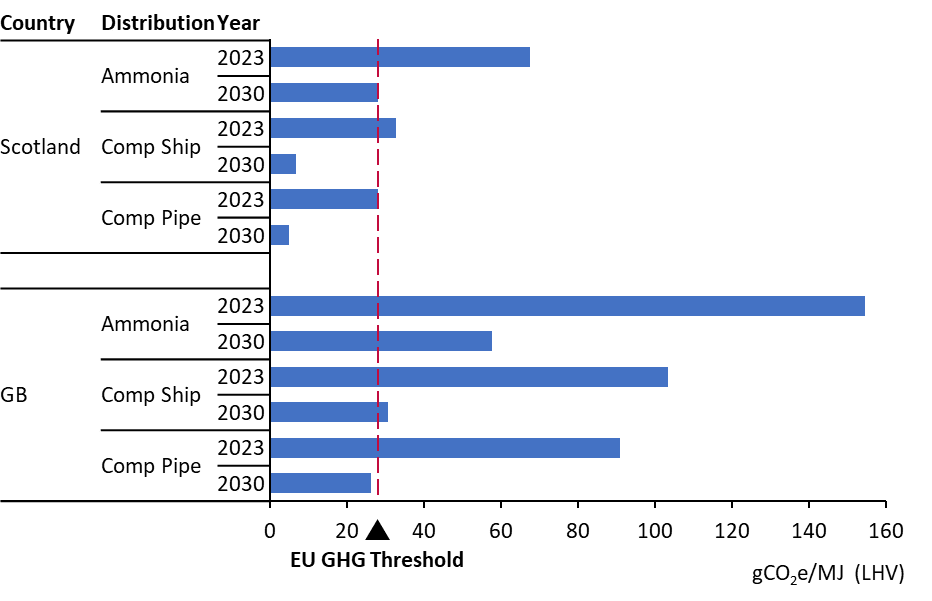
Sensitivity 3: Low-carbon shipping fuel
In the baseline, ships are assumed to use fossil marine diesel fuel exclusively in 2023, but in 2030, 25% of the fleet is assumed to be fuelled by zero emission hydrogen or ammonia. As a sensitivity, we explored switching to 100% zero emission shipping fuel (such as renewable ammonia) in 2030, when supply is expected to be more readily available. For simplicity, this zero emission fuel is assumed to be sourced from supplies other than the shipping cargo, so as to not impact the chain efficiencies. The resulting sensitivity results show a modest reduction in emissions across all shipping pathways but is more noticeable in pathways with high shipping distances such as from Chile.
Compared to the baseline, using 100% zero emissions shipping fuel to transport renewable or grid electricity based ammonia from Chile to Rotterdam could reduce the total pathway emissions by 18% or 8% respectively in 2030, or by 6% for US renewable ammonia pathways in 2030. This sensitivity for the Chile and USA renewable electrolysis pathways would enable compliance with the EU GHG threshold in 2030.
However, for hydrogen production in countries other than Chile and USA (using renewable electricity and ammonia distribution), decarbonising shipping fuel in 2030 is unlikely to be significant enough to enable previously non-compliant pathways to fall below the GHG threshold.
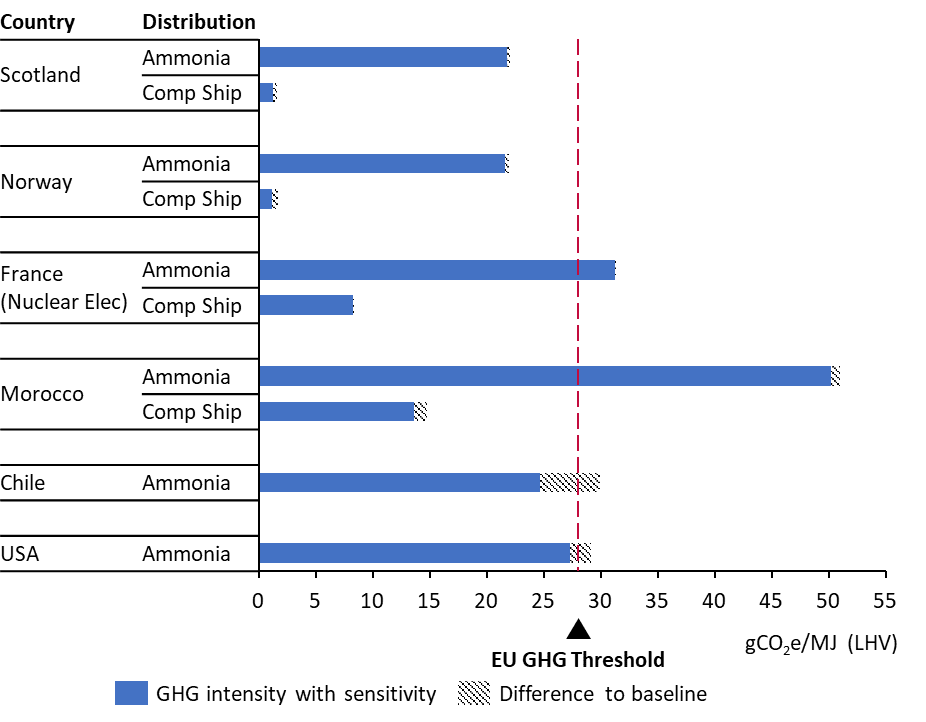
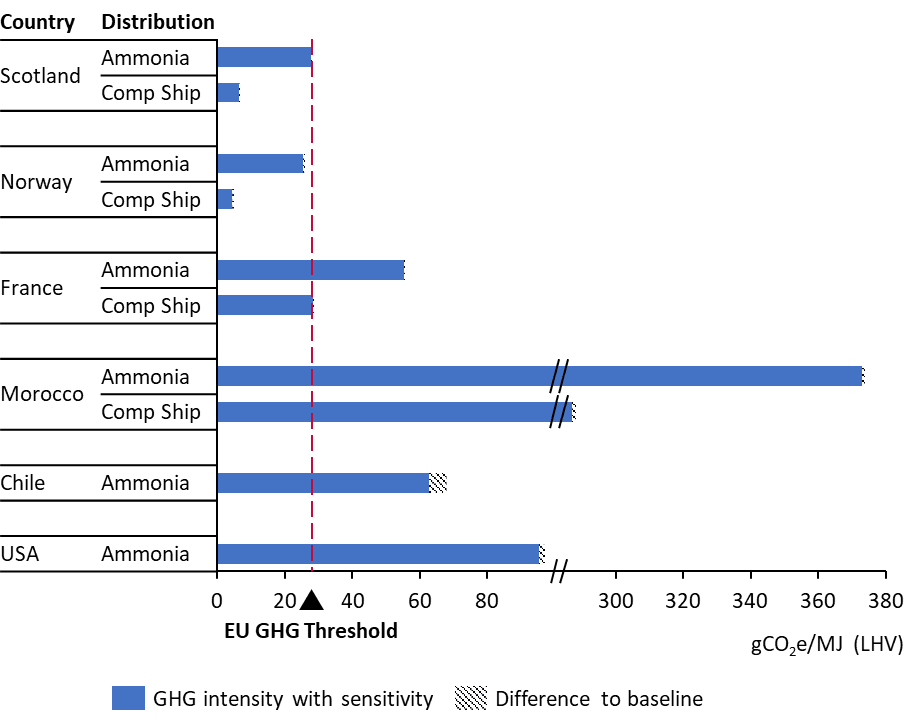
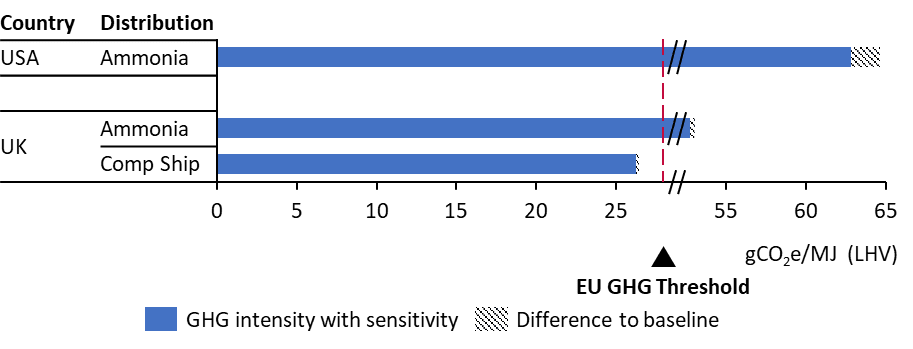
Sensitivity 4: Renewable heat
In the baseline, the ammonia pathways that require reconversion to gaseous hydrogen are assumed to consume some of the shipped ammonia to provide heat for the cracking process. For this sensitivity, utilisation of renewable industrial heat (from an alternative source with zero emissions) instead of self-consumption of ammonia was modelled.
Figure 14 shows that using alternative renewable heat for renewable ammonia cracking could enable production in Norway to achieve compliance with the threshold in 2023, but not other countries. However, as shown in Figure 15, this sensitivity does not sufficiently reduce the GHG intensity to achieve compliance with the EU GHG threshold for any grid-based ammonia pathways in 2023. But by 2030, decarbonisation of Scotland’s grid may be enough to enable the Scottish grid-based ammonia pathway to comply.
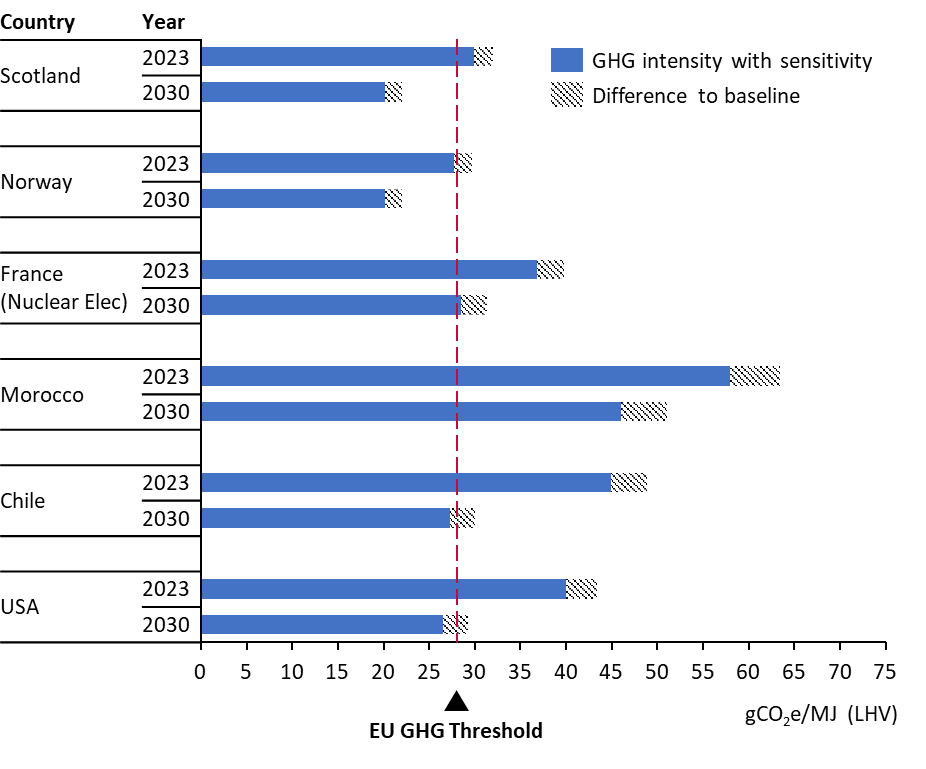
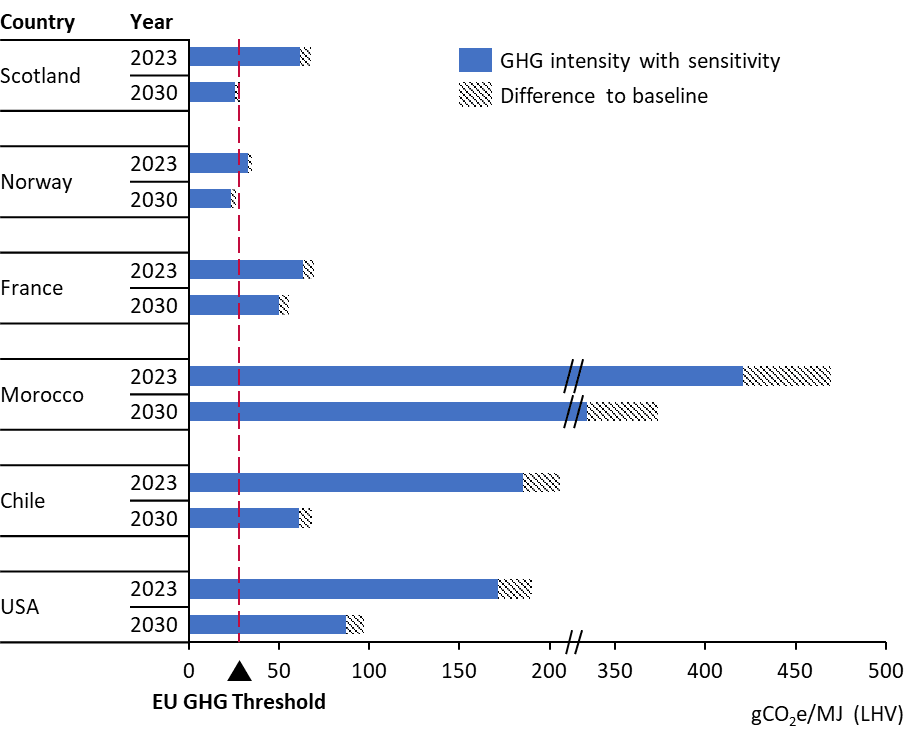
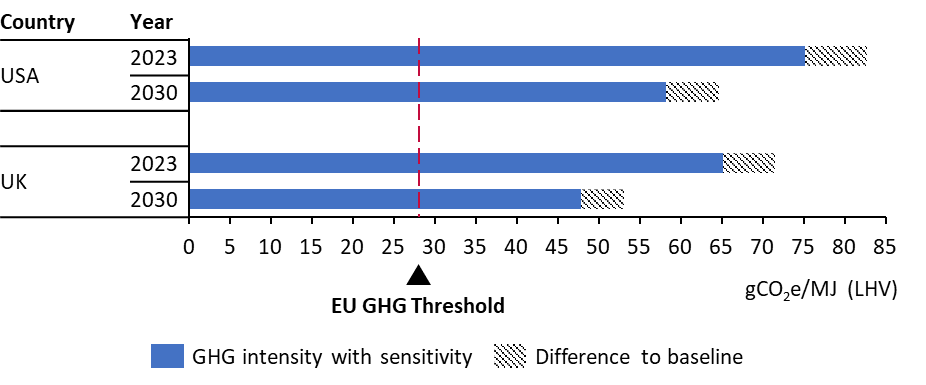
Appendix G GHG Emission Compliance Scoring Matrix
The GHG intensity calculated for each pathway in 2023 and in 2030 were compared against the EU GHG emissions threshold of 28.2 gCO2e/MJLHV to evaluate the risk of non-compliance for each potential hydrogen exporting country. The table below summarises the results from the GHG intensity scoring including justification for the scores. A selection of GHG reduction measures were modelled in the sensitivity analysis to evaluate the impact of using renewable electricity across all the post-production supply chain steps, using (alternative) renewable heat for the ammonia cracking step of relevant pathways, and/or switching in 2030 to using only zero emission marine fuels for shipping pathways. See Appendix F for further details. Scottish vs GB grid results are given below as separate pathways scores. Those scores marked with a * do not have any relevant sensitivities modelled that reduce their emissions, so cannot be medium risk. The following scoring was used:
|
L |
Low risk: Likely to comply with GHG threshold set under EU RED and EU Gas Directive |
|
M |
Medium risk: Could comply if relevant GHG reduction measures modelled in the sensitivity analysis are applied |
|
H |
High risk: Likely to not comply, even with relevant GHG reduction measures modelled in the sensitivity analysis |
|
Country |
Hydrogen Value Chain |
2023 |
2030 |
Reasoning |
|
Scotland |
Ammonia (Scottish grid factor), shipping, cracking, H2 use |
M |
L |
2023 can comply if renewable electricity is used throughout the chain. In 2030, Dutch electricity grid decarbonisation reduces cracking impact allowing compliance. |
|
Scotland |
Ammonia (Scottish grid factor), shipping, Ammonia use |
L |
L |
Below the threshold, despite emissions arising from conversion steps. |
|
Scotland |
Compression (Scottish grid factor), shipping, H2 use |
L |
L |
Well below the threshold |
|
Scotland |
Compression (Scottish grid factor), shipping, H2 use |
L |
L |
Well below the threshold |
|
Scotland |
Ammonia (GB grid factor), shipping, cracking, H2 use |
M |
L |
2023 can comply if renewable electricity is used throughout the chain. In 2030, Dutch electricity grid decarbonisation reduces cracking impact allowing compliance. |
|
Scotland |
Ammonia (GB grid factor), shipping, ammonia use |
L |
L |
Below the threshold, despite conversion emissions. |
|
Scotland |
Compression (GB grid factor), H2 use |
L |
L |
Well below the threshold |
|
Scotland |
Compression (GB grid factor), pipeline, H2 use |
L |
L |
Well below the threshold |
|
Norway |
Ammonia, shipping, cracking, H2 use |
M |
L |
Using renewable heat or renewable electricity in 2023 can enable compliance. |
|
Norway |
Ammonia, shipping, ammonia use |
L |
L |
Below the threshold, despite conversion emissions. |
|
Norway |
Compression, shipping, H2 use |
L |
L |
Well below the threshold |
|
Norway |
Compression, pipeline, H2 use |
L |
L |
Well below the threshold |
|
France (nuclear) |
Ammonia, shipping, cracking, H2 use |
M |
M |
Threshold can be met in 2023 and 2030 by using renewable electricity for ammonia cracking. |
|
France (nuclear) |
Ammonia, shipping, ammonia use |
M |
L |
Using renewable electricity throughout chain enables compliance in 2023. 2030 is just compliant due to decarbonisation of the Dutch electricity grid. |
|
France (nuclear) |
Compression, shipping, H2 use |
L |
L |
Well below the threshold, even with some nuclear electricity emissions. |
|
France (nuclear) |
Compression, pipeline, H2 use |
L |
L |
Well below the threshold, even with some nuclear electricity emissions. |
|
Morocco |
Ammonia, shipping, cracking, H2 use |
M |
M |
Morocco’s grid leads to high ammonia conversion emissions, but if renewable electricity was used instead, could comply. |
|
Morocco |
Ammonia, shipping, ammonia use |
M |
M |
Morocco’s grid leads to high ammonia conversion emissions, but if renewable electricity was used instead, could comply. |
|
Morocco |
Compression, shipping, H2 use |
L |
L |
Below the threshold, despite Moroccan grid input for compression. |
|
Morocco |
Compression, pipeline, H2 use |
L |
L |
Below the threshold, despite Moroccan grid input for compression. |
|
USA |
Ammonia, shipping, cracking, H2 use |
M |
M |
Using renewable electricity can enable compliance. |
|
USA |
Ammonia, shipping, ammonia use |
M |
L |
2030 just below threshold, but using renewable electricity throughout chain, rather than New Jersey’s high intensity grid, can enable compliance in 2023. |
|
Chile |
Ammonia, shipping, cracking, H2 use |
M |
M |
Using renewable electricity throughout chain can enable compliance. |
|
Chile |
Ammonia, shipping, ammonia use |
M |
L |
2030 just below threshold, but using renewable electricity throughout chain, rather than Chile’s high intensity grid, can enable compliance in 2023. |
|
Country |
Hydrogen Value Chain |
2023 |
2030 |
Reasoning |
|
Scotland (Scottish grid factor) |
Ammonia (Scottish grid factor), shipping, cracking, H2 end use |
H |
L |
Electricity grid decarbonisation enables this pathway to just fall below the threshold in 2030, but not in 2023. |
|
Scotland (Scottish grid factor) |
Ammonia (Scottish grid factor), shipping, ammonia end use |
H* |
L |
Electricity grid decarbonisation enables this pathway to just fall below the threshold in 2030, but not in 2023. |
|
Scotland (Scottish grid factor) |
(Scottish grid factor) compressed H2, shipping, H2 end use |
H* |
L |
Just above the threshold in 2023, but electricity grid decarbonisation enables this pathway to fall well below the threshold in 2030. |
|
Scotland (Scottish grid factor) |
(Scottish grid factor) compressed H2, pipeline, H2 end use |
L* |
L* |
Just below the threshold in 2023, and electricity grid decarbonisation enables this pathway to fall well below the threshold in 2030 |
|
Scotland (GB grid factor) |
Ammonia (GB grid factor), shipping, cracking, H2 end use |
H |
H |
GB electricity grid ~3 times more GHG intensive than Scotland’s, leading to emissions well above the threshold, even with projected grid decarbonisation. |
|
Scotland (GB grid factor) |
Ammonia (GB grid factor), shipping, ammonia end use |
H* |
H |
GB grid ~3 times more GHG intensive than Scotland’s, leading to emissions well above the threshold, even with projected grid decarbonisation. |
|
Scotland (GB grid factor) |
(GB grid factor) compressed H2 shipping, H2 end use |
H* |
H |
GB electricity grid decarbonisation not quite enough to meet threshold by 2030. |
|
Scotland (GB grid factor) |
(GB grid factor) compressed H2 pipeline, H2 end use |
H* |
L |
GB electricity grid decarbonisation not quite enough to meet threshold by 2030. |
|
Norway |
Ammonia, shipping, cracking, H2 end use |
H |
L |
Decarbonisation of Norway and Netherlands electricity grids enables compliance in 2030. |
|
Norway |
Ammonia, shipping, ammonia end use |
L* |
L |
Below threshold, despite conversion emissions. |
|
Norway |
Compressed H2 shipping, H2 end use |
L* |
L |
Well below the threshold. |
|
Norway |
Compressed H2 pipeline, H2 end use |
L* |
L* |
Well below the threshold. |
|
France |
Ammonia, shipping, cracking, H2 end use |
H |
H |
France’s electricity grid decarbonisation is not enough to comply in 2030. |
|
France |
Ammonia, shipping, ammonia end use |
H* |
H |
France’s electricity grid decarbonisation is not enough to comply in 2030. |
|
France |
Compressed H2 shipping, H2 end use |
H* |
H |
France’s and Netherland’s electricity grid decarbonisation is not enough to comply. |
|
France |
Compressed H2 pipeline, H2 end use |
H* |
L* |
France’s electricity grid decarbonisation combined with low emissions from distribution allows compliance in 2030. |
|
Morocco |
Ammonia, shipping, cracking, H2 end use |
H |
H |
Morocco’s grid has a very high GHG intensity, significantly exceeding the threshold. |
|
Morocco |
Ammonia, shipping, ammonia end use |
H* |
H |
Morocco’s grid has a very high GHG intensity, significantly exceeding the threshold. |
|
Morocco |
Compressed H2 shipping, H2 end use |
H* |
H |
Morocco’s grid has a very high GHG intensity, significantly exceeding the threshold. |
|
Morocco |
Compressed H2 pipeline, H2 end use |
H* |
H* |
Morocco’s grid has a very high GHG intensity, significantly exceeding the threshold. |
|
USA |
Ammonia, shipping, cracking, H2 end use |
H |
H |
New Jersey’s grid has a high GHG intensity, significantly exceeding the threshold, even with expected decarbonisation by 2030. |
|
USA |
Ammonia, shipping, ammonia end use |
H* |
H |
New Jersey’s grid has a high GHG intensity, significantly exceeding the threshold, even with expected decarbonisation by 2030. |
|
Chile |
Ammonia, shipping, cracking, H2 end use |
H |
H |
Chile’s grid has a high GHG intensity, significantly exceeding the threshold, even with expected decarbonisation by 2030. |
|
Chile |
Ammonia, shipping, ammonia end use |
H* |
H |
Chile’s grid has a high GHG intensity, significantly exceeding the threshold, even with expected decarbonisation by 2030. |
|
Country |
Hydrogen Value Chain |
2023 |
2030 |
Reasoning |
|
USA |
Ammonia, shipping, cracking, H2 end use |
H |
H |
Natural gas upstream emissions combined with N2O emissions, chain efficiency losses and the New Jersey electricity grid means emissions significantly above the threshold. |
|
USA |
Ammonia, shipping, ammonia end use |
H |
H |
Natural gas upstream emissions combined with N2O emissions, chain efficiency losses and the New Jersey electricity grid means emissions significantly above the threshold. |
|
UK |
Ammonia (GB grid factor), shipping, H2 end use |
H |
H |
Natural gas upstream emissions combined with N2O emissions, chain efficiency losses, and GB electricity grid means emissions significantly above the threshold. |
|
UK |
Ammonia (GB grid factor), shipping, Ammonia end use |
H |
H |
Natural gas upstream emissions combined with N2O emissions, chain efficiency losses, and GB electricity grid means emissions significantly above the threshold. |
|
UK |
Compression (GB grid factor), shipping, H2 end use |
M |
L |
Using renewable electricity for ATR+CCS hydrogen production and distribution could enable compliance in 2023. GB electricity grid and shipping decarbonisation could just lead to compliance in 2030 (but still sensitive to upstream natural gas emissions). |
|
UK |
Compression (GB grid factor), pipeline, H2 end use |
L |
L |
Low distribution emissions may just allow compliance in 2023 (but still sensitive to upstream natural gas emissions). |
Appendix H Methodology for calculating the cost of compliance
For those pathways identified with an amber rating, ClimateXChange requested a methodology for calculating the costs (in £/kg) of meeting EU GHG intensity requirements if the GHG intensity of a delivered hydrogen pathway is too high but could be made compliant via implementing various GHG emission reduction measures.
This methodology will allow ClimateXChange to combine energy and fuels unit cost data (for 2023 and 2030) from their previous report with the usage rates and relative GHG emission intensities from this project, to calculate the added costs of compliance, potentially as a weighted average cost across multiple mitigation options.
Table 12 outlines the steps that can be taken to calculate the minimum cost of compliance for the “amber rating” hydrogen pathways. This approach relies on the user selecting mitigation measures that are independent of each other[9] and does not take into account any variation in cost within a mitigation measure, nor how these abatement costs compare to other options outside of the supply chain sensitivities explored (or other decarbonisation options for the end user outside of these hydrogen pathways).
|
Step |
Methodology |
Example (purely illustrative) |
|---|---|---|
|
1 |
Model the GHG intensity of the delivered hydrogen without any measures applied |
48.2 gCO2e/MJLHV hydrogen |
|
2 |
Model the cost of the delivered hydrogen without any measures applied |
£19.2/kg ÷ 120 MJLHV/kg = £0.16/MJLHV hydrogen |
|
3 |
Calculate the reduction in GHG intensity required to achieve the EU GHG emission threshold (step 1 – 28.2 gCO2e/MJLHV) |
48.2 – 28.2 = 20.0 gCO2e/MJLHV hydrogen abatement required |
|
4 |
Identify an emission reduction measure |
Wind electricity replacing grid electricity across the whole pathway (at the same availability as grid) |
|
5 |
Model the delivered hydrogen GHG intensity with the new measure applied |
15.2 gCO2e/MJLHV hydrogen |
|
6 |
Calculate the maximum abatement potential of the new measure (step 1 – step 7) |
48.2 – 15.2 = 33.0 gCO2e/MJLHV hydrogen abated |
|
7 |
Model the delivered hydrogen cost with the new measure applied |
£21.6/kg ÷ 120 MJLHV/kg = £0.18/MJLHV hydrogen |
|
8 |
Calculate the added cost of the new measure (step 7 – step 2) |
0.18 – 0.16 = 0.02 £/MJLHV hydrogen |
|
9 |
Calculate the abatement cost of the new measure, by dividing step 8 by step 6 then multiplying by 1,000,000 |
(0.02 £/MJLHV hydrogen ÷ 33.0 gCO2e/MJLHV hydrogen) x 1,000,000 g/t = £606/tCO2e abated |
|
10 |
Repeat steps 4 – 9 for each individual mitigation measure, and rank the mitigation measure abatement potentials by their abatement costs (step 9 results) |
Max 2.0 gCO2e/MJLHV hydrogen abated @£300/tCO2e for renewable shipping fuel replacing fossil marine diesel Max 33.0 gCO2e/MJLHV hydrogen abated @£606/tCO2e for renewable power replacing Scottish grid Max 12.0 gCO2e/MJLHV hydrogen abated @£700/tCO2e for (alternative) renewable heating replacing ammonia cracking self-heating |
|
11 |
Repeat steps 4-10 as many times as there are measures, but instead of assessing measures individually, start with the lowest abatement cost measure, then cumulatively include each extra measure on top of the others (following the step 10 ranking), to output a new list of abatement potentials ranked by their new abatement costs. At the end of each new step 10, overwrite step 1 with the latest step 5 result, and overwrite step 2 with the latest step 7 result, before adding the next measure in step 4 again. |
2.0 gCO2e/MJLHV hydrogen abated @£300/tCO2e for renewable shipping fuel replacing fossil marine diesel 33.0 gCO2e/MJLHV hydrogen abated @£606/tCO2e for renewable power replacing Scottish grid 3.0 gCO2e/MJLHV hydrogen abated @£2,800/tCO2e for (alternative) renewable heating replacing ammonia cracking self-heating |
|
12 |
Select enough measures in ranked order (cheapest first) from step 11 to achieve the step 3 requirement, noting that the whole abatement potential of each measure may not be needed |
2.0 gCO2e/MJLHV hydrogen abated @£300/tCO2e for renewable shipping fuel replacing fossil marine diesel 18.0 gCO2e/MJLHV hydrogen abated @£606/tCO2e for renewable power replacing Scottish grid No (alternative) renewable heating needed |
|
13 |
Calculate a weighted average of the selected step 12 abatements and abatement costs to calculate the overall minimum cost of compliance |
(2 x 300 + 18 x 606 + 0 x 2,800) / (2 + 18 + 0) = £575/tCO2e abated |
|
14 |
Finally, convert step 13 into £/kg by dividing by 1,000,000 then multiplying by step 3 and multiplying by the LHV energy content of the delivered hydrogen |
(£575/tCO2e abated ÷ 1,000,000 g/t) x 20 gCO2e/MJLHV hydrogen x 120 MJLHV/kg = £1.38/kg extra required to comply with EU GHG threshold |
© The University of Edinburgh, 2024
Prepared by ERM on behalf of ClimateXChange, The University of Edinburgh. All rights reserved.
While every effort is made to ensure the information in this report is accurate, no legal responsibility is accepted for any errors, omissions or misleading statements. The views expressed represent those of the author(s), and do not necessarily represent those of the host institutions or funders.
The rationale for a voluntary standard is that it builds consumer trust and encourages participation through market-driven benefits like increased demand and price advantages, without imposing penalties. It supports self-regulation and is easier to implement internationally, avoiding the need for legislative enforcement. ↑
Other standards that could incentivise the uptake of low-carbon hydrogen are also available in some regions (e.g. UK’s Renewable Transport Fuel Obligation, or California’s Low Carbon Fuel Standard). They have been excluded from this analysis because they are targeted at non-EU consumption, which is unlikely to affect hydrogen exports to the EU market. No further relevant standards were identified within those countries (Norway, Morocco, Chile) in scope of this study. ↑
Upstream emission factor for nuclear fuel is taken from Table 3 from RED Delegated Act on GHG methodology for RCFs and RFNBOs (1.2 gCO2e/MJ LHV fuel) (European Commission, 2023). Nuclear power plant LHV efficiency of 33% then applied (JRC, 2020). ↑
Feedstock emissions are only relevant to natural gas pathways and includes the upstream emissions for e.g. natural gas extraction, pre-processing and transport, including methane leakages. ↑
The maximum theoretical efficiency that a heat engine may have operating between two given temperatures. It is used in the LHV energy allocation methodology when heat or steam is a co-product. ↑
GOs is an assurance scheme to demonstrate to end-users that a product (e.g. hydrogen, electricity, biogas) are produced from renewable sources. In electricity, this can take the form of Renewable Electricity Certificates (RECs) or Power Purchasing Agreements (PPAs). More information on this in Appendix A. ↑
The maximum credit value is $0.60/kg hydrogen. This amount is multiplied by 5 (i.e. maximum credit value of $3.0/kg hydrogen) if the production facility meets prevailing wage requirements and apprenticeship requirements defined under the IRA. ↑
This is due to avoided methane emissions. ↑
If any of the measures are not independent of each other (e.g. if one measure impacts the efficiency of the supply chain), these non-independent measures may change the maximum abatement potential of other measures, and the abatement costs of some measures may also be impacted by the costs and order/combinations of other measures applied (or not applied). This process to find a minimum compliance cost may be iterative and will rely on cost & GHG modelling of the whole supply chain exploring combinations of measures. ↑