
Event date: 10 December 2024
DOI: http://dx.doi.org/10.7488/era/5651
Key points
- The forum brought together experts from academia, policymakers and a range of stakeholders to discuss the design of the electricity market and its role in enabling a least cost and equitable transition to a net zero power sector in Scotland.
- Participants discussed locational pricing in wholesale electricity markets. A proposal to split the integrated GB market into separate pricing zones has been put forward by the UK Government in its recent Review of Electricity Market Arrangements (REMA).
- The measure is designed to improve the operational efficiency of the electricity system and to reduce the costs to consumers of curtailing renewables.
- A fundamental change to the current market design and the introduction of locational pricing would likely have large impact on Scottish consumers and investors.
- The forum discussed key opportunities and challenges of electricity market reform for Scotland, drawing on the best available evidence and international expertise.
- There were over 40 participants from across a range of stakeholder groups, including consumer bodies, the energy industry, the Scottish and UK Governments, the National Energy System Operator (NESO) and representatives from Highlands and Islands communities.
Executive summary
The main topic addressed at the ‘Scottish forum on future electricity markets’ in December 2024 was locational pricing in wholesale electricity markets. This is a particularly complex and contentious area that forms a key part of the UK Government’s ongoing Review of Electricity Market Arrangements (REMA) programme.
Locational pricing would involve separation of the GB power market into multiple pricing zones, which are defined around the most significant constraints on the transmission grid. This would contrast with the current national pricing model where the revenues electricity generators earn from selling into the wholesale power market do not reflect their impact on the transmission system.
The argument for locational pricing is that it would reduce constraints on the network and therefore also reduce payments to generators to adjust their output due to network congestion, thus benefiting consumers. Incorporating scarce transmission network capacity into the wholesale electricity price would also improve overall system efficiency as market participants would be incentivised to locate assets and operate them more in line with the physical realities of the power system.
A fundamental change to the current market design and the introduction of locational pricing would likely have a significant impact on Scottish consumers and investors. The high level of renewables located in Scotland relative to its electricity demand means that locational pricing could see Scottish consumers benefit from significantly lower bills. This could help accelerate the electrification of heating and transport. Meanwhile, the availability of cheap, reliable and clean power could attract substantial inward investment by energy intensive industries and data centre operators.
However, fundamental market reform brings risks. If these cannot be managed by investors, the cost of financing large scale wind projects will increase, putting in jeopardy a key pillar of Scotland’s energy and economic strategy. On this basis, some argue instead for a ‘reformed national market’, which would involve NESO – the National Energy System Operator – making substantial improvements to its current approach to balancing and redispatch.
Scottish and UK Government representatives opened the forum by setting out policy priorities and the latest developments in the REMA programme. Participants then heard from Scottish and invited international experts who outlined the operation of locational pricing in European and US markets. The forum discussed what lessons have been learned, what relevance these market designs may have for the specific Scotland/GB context and the challenges faced in meeting net zero.
In the final part of the day participants were divided into thematic discussion groups, which addressed different questions and challenges relating to the implementation of electricity market reforms from a Scottish perspective. During the discussions, participants identified several key questions and issues pertaining to the Scottish Government’s net zero, just transition and economic strategy, which need to be addressed:
- Aligning market reform and the clean power mission: Stakeholders expressed concern that the multiple and highly complex reform processes ongoing at the UK level may not be complementary and could conflict with one another, thus exacerbating investment risk and putting Scotland’s net zero target in jeopardy.
- Impacts on the cost of capital: The modelled socio-economic benefits of locational pricing are highly sensitive to changes in the cost of capital. The evidence base on the extent to which locational pricing could increase the cost of financing large renewables projects in Scotland and for how long this premium may endure is not sufficient.
- The relationship between locational pricing and industrial policy: There are conflicting claims in the debate about the extent to which lower wholesale electricity prices influence investment decisions in electricity intensive industry. For some, this could be a key advantage of locational pricing, whereas others argue that power prices are only one, relatively minor, factor in industrial siting decisions. The economic impacts of different electricity pricing scenarios should be analysed and modelled to inform the Scottish Government’s industrial and foreign direct investment policy.
- Delivering large transmission projects: The benefits of locational pricing diminish as more capacity is added to the transmission system, in a way which alleviates constraints. More work could be done examining recent experiences of delivering large transmission projects on time and budget, exploring key challenges such as supply chain coordination, public acceptability and optimism bias.
- Updating the counterfactual: The next phase of REMA and the decision about a zonal or reformed national market will require an updated counterfactual to locational pricing. There is a need to investigate how a package of reforms to the current market, including transmission network charging reforms and better management of interconnector flows, can be delivered and implemented.
- Understanding zonal markets: Zonal markets have been in operation across the EU/EEA, in the US and Australia for more than three decades. More and better evidence could be gathered on these international experiences, particularly recent cases of creating zonal markets and the legacy/transitional arrangements introduced.
- Open access and transparent modelling: Much of the electricity market modelling expertise is within economic consultancies, only accessible by governments and large energy companies. The need for open access and more transparent modelling tools was cited in the discussions, along with the need to build electricity market modelling capabilities within Scotland.
- Socio-economic welfare impacts: Socio-economic welfare impacts of different market design options need to be studied from a Scottish perspective, requiring a detailed analysis of impacts on consumer groups and regions.
- Ongoing dialogue: Finally, REMA should not be seen as a one-off reform. Regardless of the preferred option – zonal pricing or a reformed national market – there will need to be an ongoing dialogue between the Scottish Government, the UK Government and the wider stakeholder community regarding implementation and future reforms as the electricity system evolves over the coming decades.
Abbreviations
|
BETTA |
British Electricity Trading and Transmission Arrangements |
|
CfD |
Contracts for Difference |
|
DESNZ |
Department for Energy Security and Net Zero |
|
EEA |
European Economic Area |
|
EV |
Electric Vehicle |
|
FERC |
Federal Energy Regulatory Commission |
|
GB |
Great Britain |
|
NESO |
National Energy System Operator |
|
PJM |
Pennsylvania-New Jersey-Maryland Interconnection |
|
REMA |
Review of Electricity Market Arrangements |
|
SG |
Scottish Government |
|
TCA |
Trade and Cooperation Agreement |
|
TNUoS |
Transmission Network Use of System |
|
TSO |
Transmission System Operator |
Background
This report was written by University of Edinburgh academics and is based on discussions at the forum along with their own background research. The forum was held under the Chatham House Rule.
Scotland and the British electricity market
Although electricity markets policy is a reserved policy area, under direct control of the UK Government, Scotland is at the heart of the clean power transition as it has an abundant wind resource and a significant energy industrial base.
Since 2005 Scotland has been part of an integrated power market known as the British Electricity Trading and Transmission Arrangements (BETTA). BETTA, in essence, is a set of technical rules and codes governing the relationship between the physical transmission grid and commercial transactions in the wholesale power market. Its function is to ensure that the operation of the market through which power is transacted respects the physical limitations of the grid and that the electricity system remains in continual balance.
Participation in BETTA has largely been beneficial for Scottish electricity generators and consumers. It has created an effective route to market for the growing renewables industry in Scotland, while the diversity provided by a wider market has improved competition and trading liquidity, thus providing a benefit for Scottish consumers. It’s a generally accepted principle that larger and more diversified markets improve the efficiency of electricity systems and help deliver security of supply.
BETTA is a decentralised market, meaning that buyers and sellers of power are free to enter commercial transactions, as would be the case in any commodity market. Across timeframes, from years ahead to just before physical delivery, market participants can adjust their positions as more information about supply and demand is revealed. Trading can take place via bilateral contracts, brokerages and auctions organised by power exchanges. Across these markets, contract durations can range from short increments of 30 minutes to an entire year.
A decentralised power market based on ‘self-dispatch’ is not unique to Britain and is the standard model across the EU. The philosophy underpinning these markets is that to as great an extend as possible, risks are manged through the operation of the free market and the role of central coordination is minimised.
Even in such a model however there is still a requirement for a central system operator who takes actions to ensure that generation output and demand across the integrated market stays in balance. In Britain, the National Energy System Operator (NESO), a public body, has recently taken over this role from the National Grid Group. NESO’s primary means of ensuring an alignment of market trading and the physical constraints of the system is the balancing mechanism. This is a centrally coordinated real-time market operating close to delivery for each half hourly trading period through which bids and offers to adjust generation and demand are accepted.
Market participants wishing to participate in the balancing mechanism – the Balancing Market Units – are required to notify NESO of their contractual positions in advance and any deviations between their physical and contractual positions are subsequently charged at energy imbalance prices. These prices relate to the costs incurred by NESO in adjusting generation and demand in the balancing mechanism and, depending on the tightness of the market, they can provide strong incentives on market participants to operate in line with the needs of the system.
However, while imbalance pricing provides an incentive on generators to operate in line with system needs, it is not a cost recovery mechanism. Under the current ‘connect and manage’ transmission regime, generators on the system receive financially firm access rights, and thus need to be compensated for any lost revenue resulting from NESO’s balancing actions. As a result, the costs of NESO’s redispatch through its balancing actions need to be recovered through network tariffs; they are effectively socialised across all electricity consumers.
The costs of the balancing market have increased substantially in recent years, as has the volume of traded energy in the balancing mechanism. NESO estimates that redispatch costs could be c.£3bn annually by the end of this decade and stress that operating the system under the current market arrangements is proving increasingly difficult.
The case for change
In recent years, several factors have coalesced to create momentum behind reforming Britain’s electricity market. The Scottish and the UK Government have committed to reach net zero by mid-century, requiring significant new investments in low carbon generation, networks and storage capacity. Meanwhile, the 2021-2023 energy crisis exposed an over-reliance on volatile gas markets which have a direct impact on electricity prices. The current electricity market design was introduced in the early 2000s when these challenges were not as acute and there is now a consensus that fundamental reform is required. A key case for changing the current market arrangement is that the role of the balancing mechanism has had to expand greatly in recent years.
When the balancing mechanism was first introduced in the early 2000s, it was intended to play relatively a minor residual balancing role, focusing on the general supply-demand balance across the GB market. However, the technological composition of the electricity system has changed, with a rapid increase in renewables and interconnector capacity. This requires the system operator to address locational constraints (locational balancing) in instances when power flows exceed the physical capacity of parts of the transmission network.
Given the rapid penetration of wind power in Scotland, much of the congestion problem has been concentrated at the Scottish-English border.[1] The geographic concentration of renewables, combined with the historic underdevelopment of the transmission network, often results in wind plants in Scotland being paid to turn down at times when there are constraints on the system.[2] At the same time, generators south of the border are paid to increase their output to compensate for the lost wind power. This has obvious negative cost impacts on consumers, but also damaging environmental impacts as generation capacity in the south is more carbon intensive due to the concentration of gas-fired generation in England. Previous work (Barnes & Brauer F, 2024) showed that the high level of renewables located in Scotland relative to its electricity demand means that locational pricing could see Scottish consumers benefit from significantly lower bills.
Central to this debate is whether NESO continues to take responsibility for managing congestion through the balancing mechanism and passes the costs of this redispatch onto consumers. If locational pricing is introduced, these system costs would be incorporated into the wholesale electricity price and market players would be incentivised to operate their assets in line with the physical realities of the system.[3]
Within these two broad options there is much to discuss and evidence before a final decision can be made. The key question rests on whether the benefits of lower redispatch costs and increased transparency about network congestion delivered through locational pricing outweighs the potential costs of fundamental market reform. A transition to locational pricing would introduce new risks and potentially lead to an increase in the cost of financing the net zero transition.
REMA – The next phase
The UK Government published a first consultation on the Review of Electricity Market Arrangements in October 2022. This set out a wide range of options, including a switch to a qualitatively different market model based on centralised dispatch and nodal pricing. A second consultation in March 2024 narrowed down the options to two – zonal pricing and reformed national pricing:
- Zonal pricing: This would involve the separation of the GB power market into multiple pricing areas which are defined around the most significant transmission constraints. Zonal pricing would contrast with the current national market model where generator revenues from the wholesale market do not reflect their impact on the transmission system. On average, the north of England and Scotland would see lower wholesale prices relative to other regions.
- Reformed National Market: This option would involve NESO making substantial improvements to its current approach to balancing and redispatch. Key elements of a reformed national market would include managing interconnector flows more efficiently and transparently, improving dispatch software and processes such that battery storage participates more effectively in balancing, and taking actions outside the balancing mechanism to manage constraints.
The Labour Government has committed to achieving ‘clean power’ by 2030, requiring an accelerated delivery of low carbon investments, most significantly in wind, solar and large transmission projects. While electricity market reform is a longer-term programme, and fundamental changes to the market would not be implemented until the end of the decade at the earliest, the interactions between these two policy processes – REMA and Clean Power 2030 – will be an important factor in the UK Government’s final decision which is due in mid-2025. Key considerations will be the impacts of different reform options on investor confidence and how the economic benefits of lower electricity prices arising from less gas-fired generation can be exploited.
Discussion 1: Zonal or national pricing?
The forum involved an in-depth discussion of the two main options for electricity market reform – zonal and reformed national pricing. In evaluating these options, the importance of understanding trade-offs between investor and consumer interests was stressed by many of the participants. Also, there was a widely held view that decisions around wholesale power market design – whether zonal or national – cannot be considered in isolation. Interactions between the wholesale market, existing and future contracts for difference and transmission charging, along with a range of other market design parameters, need to be considered as part of an overall reform package.
Zonal market design options discussed at the forum included the degree to which different consumer groups would be shielded from locational prices variations, the methodology for setting and revising zonal boundaries, and the design of trading and dispatch arrangements. Although a reformed national market may be less disruptive, it was stressed that there would still be substantial changes required to NESO’s processes and software systems to improve its approach to redispatch and operation of the balancing mechanism, along with the potential expansion of constraint management measures and improved management of interconnector flows. Across both options there will need to be further consideration of transmission access and pricing rules, particularly transmission network (TNUoS) charging.
Unpacking zonal pricing
Participants heard from international experts on the design of locational markets in Norway, Germany and the US. Professor Mette Bjørndal of the Norwegian School of Economics outlined the operation of the Nord Pool zonal power market which has been in place since the mid-1990s. It was outlined that zonal pricing has a long history. However, it’s a complex market arrangement, requiring continual monitoring and updating. For example, the procedure through which cross-zonal capacity is allocated by transmission system operators has recently been updated with the introduction of a ‘flow-based’ methodology. While this improves the overall efficiency of the system as the use network capacity is optimised, its introduction has been difficult and characterised coordination challenges between the participating TSOs and market operators.
A particular issue in the Nordic context is the definition and revision of zonal boundaries. There is a trade-off between liquidity and efficiency in this respect. Dividing the market into many small zones may be efficient from a technical point of view as the resulting zonal prices are more reflective of transmission constraints, thus reducing the need for redispatch. However, this fragmentation can negatively impact market liquidity, resulting in a lack of opportunities for generators and suppliers to hedge against volatile spot prices.
Another issue recently experienced in the Nordic region was the impact of price shocks and the exposure of retail consumers to increasingly volatile prices, particularly during the 2021-2023 energy crisis. A feature of the Norwegian electricity market is the high proportion of domestic consumers on spot market-linked retail contracts. While this has encouraged flexibility and played a role in Norway’s successful roll out of EVs, it does expose consumers to price shocks. During the energy crisis, politicians in Norway came under strong pressure to reduce electricity exports and to halt the development of new interconnectors. Politicisation of the market was exacerbated by increasing divergence in prices across the various zones, with those in the southern regions more exposed to gas price volatility. This cross-zonal divergence then put Nord Pool’s risk management systems under stress. There is an ongoing discussion in the Nordic context about the need to improve risk management and hedging opportunities such that consumers can be offered long-term contracts which can – at least partially – insulate them from extreme price volatility.
The forum also heard from Professor Karsten Neuhoff, head of the Climate Policy Department at the German Institute for Economic Research. Professor Neuhoff outlined the German picture with respect to locational pricing. Within Germany there has been a similar debate about how to address congestion arising from power flows between northern Germany, where the wind resource is abundant, and demand centres in the south. Germany, like Britain, has become over-reliant on expensive redispatch measures. Professor Neuhoff was sceptical about the extent to which proposed zonal configurations, for example dividing Germany into two or three bidding zones, would fundamentally address the problem. He argued instead for a local pricing approach, more akin to the US model of nodal pricing. A feature of his proposal is the high level of importance attached to consumer engagement with their respective local marketplaces to maximise flexibility potential. Such a model, he argued, could be introduced across the EU on a gradual basis, following successful trials and pilots.
Scepticism about zonal pricing was also expressed by Dr Richard O’Neill, former Chief Economic Advisor at the US Federal Energy Regulatory Commission (FERC). Dr O’Neill outlined that prior to the introduction of nodal pricing the Pennsylvania-New Jersey-Maryland (PJM) and California market regions had introduced zonal markets, but it was found that this led to market power problems and inefficiencies as transmission scarcity within each zone was not accounted for in the model. Many US jurisdictions have now adopted a standard market model based on centralised dispatch and more refined nodal pricing, a market design which was initially considered as part of REMA but since ruled out.
Dr O’Neill stressed that, despite the demonstrated benefits of the US model, the question of long-term investment signals has recently come to the fore. While locational markets have a track record of delivering significant operational efficiencies, Dr O’Neill argued that further revisions to pricing methodologies are required to ensure that the full value of investments in new generation capacity can be captured by investors. It was also stressed that long-term transmission planning has been neglected in the US, requiring FERC to step in and require states to standardise their approaches to transmission planning and cost allocation.
Based on the contributions of the international speakers at the forum, we can see that there are different variations on locational market designs. The Nordic approach of small zones and spot-price linked retail contracts seemed to work well until the energy crisis, which exposed consumers to extreme price volatility and resulted in pressure being put on politicians to intervene. The experience has raised questions about the need for new measures to support liquidity and expand hedging opportunities as a means of reducing exposure to short-term price swings. This will be an issue in a British zonal market given the continued reliance on gas-fired generation and the likely high levels of price volatility as weather-dependent renewables form the backbone of the electricity system.
Larger price zones, along the lines of the German and continental European model, would deliver higher levels of market liquidity, but the trade-off would be a continued reliance on expensive redispatch measures. There is a view amongst some EU electricity market analysis that, given the limitations of centralised redispatch, in the long-term zonal pricing will prove inadequate for accessing the flexibility opportunities emerging at the demand-side of electricity systems, particularly in relation to heat and transport loads. As the system becomes more decentralised, with the electrification of heating and transport, many of the assets capable of providing flexibility to the system will not be participating in the balancing mechanism. Redispatch can only go so far and generally is only applicable to large assets and aggregated loads. However, as decentralised generation, storage, EVs and heat pumps become more common, the potential to tap into this decentralised flexibility may be substantial and may only be achieved through locational pricing.
The forum also discussed the complexity of zonal markets. They are evolving constructs that need periodic adjustments to address issues such as zonal boundary definition, capacity allocation between zones, how to manage inter-zonal price variability and the design of financial markets for risk hedging. If a zonal market was to be introduced in Britain, there would need to be robust procedures and supporting institutions to ensure that the market could evolve in line with the changing dynamics of the electricity system. While much of the REMA debate has been centred around the modelled benefits of zonal pricing, there needs to be a much more sophisticated and evidence-based discussion of the practicalities of implementing a zonal pricing model in the British market context. There are lessons to be learned from the Nord Pool and EU markets. Lessons can also be learned from the negative experience of zonal pricing in California and PJM. Mistakes were made; for example poor design of auction software, capacity markets not functioning well, and federal-state regulation that was unclear and problematic.
Finally, a common challenge across all locational markets is incentives for long-term capital investment and coordinated transmission planning. These market models were designed in the 1990s and 2000s when the main priority was operational efficiency. However, delivering net zero is in large part a capital investment challenge. Accompanying reforms to the contracts for difference (CfD) scheme and integrated network planning will be required to ensure that the consumer and efficiency benefits from locational pricing do not come at the expense of achieving net zero. Britain should not make the same mistakes as the US regarding the expansion of the transmission grid and putting too much faith in short-term markets to deliver a wide range of energy system needs.
Reformed national pricing: Updating the counterfactual
Dr Simon Gill of the Energy Landscape presented his work on proposals to reform the existing national market as an alternative to zonal pricing. The early modelling studies underpinning Ofgem’s and DESNZ’s analysis of the benefits of locational pricing were based on a comparison with the status quo – essentially the BETTA model that has been in operation for almost 20 years. However, proponents of a ‘reformed national market’ argue that there is scope to significantly improve aspects of the current market design. As part of the next phase of REMA, modelling studies need to compare locational pricing against a realistic model of the national market. This would include incremental reforms such as improvements to NESO’s current approach to redispatch, the design of the balancing mechanism, how interconnector flows are managed and revising the methodology underpinning the TNUoS regime.
During the forum discussions the topic of interconnector redispatch was raised by several participants. Under the current national pricing model, it can be the case that interconnectors exacerbate congestion within the GB system. An example cited is flows on the system from the Norwegian interconnector – the North Sea Link. Flows based on wholesale price differentials will often see exports from the low-price Norwegian hydropower system to Britain, but as the link comes into the north of England, at times of high wind this interconnector can exacerbate locational constraints within GB. If zonal pricing was in place, price differentials between Norway and Britain would be more reflective of scarce capacity on the grid, likely resulting in more exports to Norway during high wind periods and reduced north-south flows within GB.
Under the current market arrangements interconnectors do not participate in the balancing mechanism. To alter flows NESO must either hold separate intraday auctions or enter direct agreements with neighbouring system operators during the balancing timeframe. These interventions can be costly and there is a lack of transparency on the extent and cost of these short-term trades. The practicalities of changing interconnector flows have been made more difficult by the fact that Britain no longer participates in the EU single market for electricity and has thus far failed to implement a long-term trading arrangement which was agreed under the Trading and Cooperation Agreement (TCA). An important question is whether, given the high transaction costs involved in redispatching interconnectors, flows can be altered sufficiently in the absence of the clear signal that would be provided by locational pricing.
The UK Government has recently concluded (Department for Energy Security and Net Zero, 2004) that there is limited scope to improve how interconnector flows are managed as unilateral action by NESO would conflict with the UK’s agreements regarding electricity trading with the EU and Norway. This is problematic for proponents of a reformed national market as modelling has shown that improved management of flows across the interconnectors could significantly diminish the benefits of a transition to zonal pricing. A failure to improve this aspect of the national market would see a continued reliance on expensive redispatch measures, at least until the UK can implement a more efficient trading regime with the EU and Norway.
A reform of the current TNUoS regime was also identified as a key component of a reformed national market. Under the existing market arrangement, investors are exposed to TNUoS charges on a locational basis; they are thus a key driver of siting decisions for generators and other large assets. However, several participants outlined that TNUoS charges are increasingly volatile and unreliable, and unrepresentative of the future electricity network configuration. While under a zonal market, TNUoS will still be required to recover the capital costs of network reinforcement, these charges would play a less significant role in locational investment decisions. Under a reformed national market they would remain a key driver of siting decisions; there would therefore be a need to redesign the methodology by which TNUoS charges are calculated. Ofgem recently advised that a cap and floor be introduced as the difficulty of estimating the long-term trend of TNUoS charges has become a barrier to investment (Ofgem, 2024).
Alongside reforms to TNUoS, developments in long-term transmission planning were cited by proponents as a key argument in favour of a reformed national market. Scenarios which see a significant expansion of capacity on the transmission system, particularly between Scotland and England, have been shown to reduce the benefits of zonal pricing (LCP Delta, 2024). A key question which needs to be addressed in this argument is the extent to which NESO’s ambitious network plans – the Holistic Network Design subsequent updates – can be delivered. Large scale transmission projects are challenging to deliver, with multiple regulatory, planning, financial and supply chain constraints. If ambition does not match reality, the case for a reformed national market would diminish. Several participants cited the need for a better understanding of the realistic timeframes for reinforcing the transmission system as this forms a key part of the argument for a reformed national market.
Participants also pointed out that improved dispatching of assets in the balancing mechanism would enhance the current national market. Although this is based on the logic that the least cost mix of bids (to turn down) and offers (to turn up) are selected by NESO, there are often cases when certain technologies are not selected, or ‘skipped’. This is a particular issue for battery storage, a technology which will play a crucial role in optimising a largely renewables-based system. It was outlined at the forum that improving storage and skip rates has been a priority for NESO and this will require updated dispatch software and processes.
Discussion 2: Key challenges and opportunities for Scotland
Forum participants formed smaller discussion groups to identify opportunities and challenges from a Scottish perspective. The context for this discussion was the high-level principles for market reform, as previously set out by the Scottish Government in its response to the second REMA consultation: “Achieving a transition to net zero and ensuring a fair and just transition.”
Investor certainty
A theme which emerged from the group discussions was the need for investor certainty for achieving these aims. A key question which emerged was the extent to which locational pricing would significantly increase the cost of financing the net zero transition, a cost which would ultimately be borne by electricity consumers and wider society. Modelling results show that the benefits of locational pricing are highly sensitive to changes in the cost of capital (Ofgem, 2023), (LCP Delta & Grant Thornton, 2023). One argument is that transferring locational risk to generators – away from consumers – will increase uncertainty and make it more difficult to convince investors to deploy capital in Scotland. While applying to all technologies, this is a particular issue for offshore wind in Scotland which is highly capital intensive and reliant on a broad, international investor base. An issue with the current modelling is that there is a wide range in estimates of possible cost of capital increases resulting from an introduction of locational pricing.
The evidence base on investors is limited, with little work investigating the views of the international investment community. Zonal pricing may not be a concern for some investors who are significantly diversified across geographies and technologies. As one respondent outlined, we are currently treating investors as a black box. International investors who supply most of the capital into UK infrastructure is a diverse actor group, with different considerations, levels of willingness to accept risk, and different capabilities for risk management and diversification. The key concern for these actors may not be the fact of zonal pricing, rather how it’s introduced – over what timeframe, with what legacy and transition arrangements in place and with what potential for risks to be diversified through trading and hedging mechanisms?
An issue raised in this discussion was that the current system is overly complex from an investor point of view and suffers from a lack of transparency. Investors need to operate across multiple markets, imposing high transaction costs, leading to a loss of efficiency and a potential misallocation of capital. Therefore, whether the preferred option is zonal or reformed national pricing, an overall simplification of the system from an investor point of view should be a priority.
Managing the transition
Participants pointed out that a key challenge for the UK Government is to manage its clean power mission and REMA project in a complementary way. With multiple overlapping and interdependent reforms taking place (TNuoS, CfD and capacity market reform, planning and connection reform, constraints collaboration, the development of spatial and centralised network plans), it’s crucial that investors do not get conflicting messages and that the timeframes for these reforms are aligned with the overall objective of accelerating investment.
A particular concern raised was the interaction between the upcoming Allocation Round (AR) 7 and the expected REMA white paper. The UK Government has since clarified that all CfDs awarded in the AR 7 auction will be on the same terms as existing agreements and that any substantial changes to CfD design would not take effect until subsequent rounds. It has also been announced that financially firm access rights will remain in place, that self-dispatch would continue under a zonal or reformed national market, and that CfD generators’ reference price will be their zonal price, continuing to shield them from price risk. This will likely reduce the incentive under locational pricing but it will likely see more offshore wind located in Scotland under zonal pricing as siting decisions would be based on achieving the highest load factors. However, depending on the design of the future CfDs, risk related to the output of plant which can be sold – or volume risk – will remain, and it will likely be exacerbated under either option as the number of negative pricing hours increases. Addressing this volume risk will be a crucial component of the overall REMA package.
Communicating and capturing the benefits of electricity market reform
While there are challenges associated with investment certainty, locational pricing could position Scotland as a low-cost hub for clean electricity. The benefits of locational pricing in terms of lower electricity prices can be modelled, but for Scottish society to fully benefit, industry and consumers would need to make the right decisions about investments and electricity consumption.
Participants discussed what communication may be needed before, during and after a rollout of zonal pricing. Important questions identified were: What information may be needed for the different types of stakeholders? How can the specific needs of regions and communities across Scotland, particularly vulnerable consumers in cities and rural areas, be addressed?
It was stressed that if consumers aren’t on side – and they haven’t been considered at the outset – there is potential for bad press which undermines the market reform project. It was highlighted that lessons can be learned from other significant reforms, e.g. the mistakes made in the smart meter rollout which suffered from poor communication and coordination across industry.
Several forum participants stressed the need to understand how demand can help optimise the system and where it can help to most efficiently utilise renewables. Zonal prices, if passed through to all consumers, could have a significant impact on investment decisions in heating, transport and industrial energy systems. If that demand is to become a driver for the future energy system and deliver on flexibility potential, the need to build capabilities for this and open consumer access to innovative products and services should be prioritised. This should align with future reforms of the retail market associated with the introduction of market-wide half-hourly settlement.
The potential economic benefits of this in terms of lower bills and economic competitiveness ought to be fore-fronted. The Norwegian case was cited in this context. Here people closely watch the power price and change their behaviour as a result. This is a culture of engaging with and understanding the electricity system and the dynamics of the market.
At a broader level, it was discussed how transitioning away from fossil fuels will change the macroeconomic picture for Scotland. All parts of government need to understand the electricity market in terms of their connections into it. The combination of low carbon power, efficient market design, certainty and reliability should be fore-fronted by the Scottish Government in its wider macroeconomic and FDI strategy. If this was prioritised, it was felt that Scotland could gain a competitive advantage.
Improving the evidence base
A key challenge identified for Scottish stakeholders at the forum was understanding the evidence base for market reform and accessing analytical tools to evaluate the impacts of REMA on Scottish consumer groups, industry, and regions. Regardless of which reform option is taken, the electricity market is becoming more complex and it’s crucial that Scottish stakeholders – both public and private – can evaluate these changes and develop appropriate strategies. During the discussions, several specific aspects of the locational pricing debate were highlighted as requiring more evidence:
Aligning market reform and the clean power mission: Stakeholders expressed concern that the multiple and highly complex reform processes ongoing at the UK level may not be complementary and could conflict with one another, thus exacerbating investment risk and putting Scotland’s net zero target in jeopardy. There is a need for a high-level risk assessment framework for market reform, looking across the entire landscape of electricity and net zero policy. It was suggested to identify and categorise key risks in a hierarchy which could be communicated to investors. Developing such a framework would require a close alignment of workstreams across DESNZ, Ofgem and NESO.
Impacts on the cost of capital: The modelled socio-economic benefits of locational pricing are highly sensitive to changes in the cost of capital. The current evidence base on the extent to which locational pricing could increase the cost of financing large renewables projects in Scotland and for how long this premium may endure is not sufficient. Whilst the expressed views of large energy companies are well known to policy makers, there is a need to also understand the full ecosystem of international and domestic investors. It’s these actors, together with energy companies and developers, who will ultimately finance the net zero transition. It should be recognised that, given the stakes involved, the internal strategies and policies of the relevant companies and investors cannot be known externally with certainty.
The relationship between locational pricing and industrial policy: There are conflicting claims in the debate about the extent to which lower wholesale electricity prices influence investment decisions in electricity intensive industry. For some, this could be a key advantage of locational pricing, whereas others argue that power prices are only one, relatively minor, factor in industrial siting decisions. More work is needed to examine specific regional cases, for example, northern Sweden where zonal pricing has been in operation and there has been success in attracting green steel production, battery manufacturing and data centres. The macroeconomic impacts of different electricity pricing futures should be modelled to inform the Scottish Government’s industrial and foreign direct investment policy.
Delivering large transmission projects: The benefits of locational pricing diminish as more capacity is added to the transmission system, in a way which alleviates constraints. NESO has made impressive progress in developing and updating its Networks Options Assessment and Holistic Network Design processes, while Ofgem has introduced flexible mechanisms to approve strategic investments. However, a dose of realism is required in understanding the practical challenges of financing and delivering a highly ambitious programme of transmission investment. More work could be done examining recent experiences of large transmission projects in Britain and internationally, exploring key challenges such as supply chain coordination, public acceptability and optimism bias. Also, the potential for reduced network investment required under a zonal approach needs to be quantified and incorporated into the overall socio-economic appraisal.
Updating the counterfactual: The next phase of REMA and the decision about a zonal or reformed national market will require an updated counterfactual to locational pricing. As many participants have stressed, the status quo is not an option. Therefore, work is required to investigate how a package of reforms to the current market – TNUoS reforms, more efficient redispatch, better management of interconnector flows and operation of the balancing mechanism – can be delivered and implemented. Along with the overall design of a reformed national market, there needs to be further analysis of how the costs of the various interventions associated with this option are allocated across the consumer base. This will require careful consideration to balance the policy priorities of efficiency and equity.
Understanding zonal markets: Zonal markets have been in operation across the EU/EEA, in the US and Australia for more than three decades. Better evidence could be gathered on these international experiences, particularly recent cases of creating zonal markets and the legacy/transitional arrangements introduced, e.g. the split of Sweden into separate bidding zones in 2011 and the separation of the former German-Austrian single bidding zone in 2018.
Open access and transparent modelling: Currently, much of the electricity market modelling expertise is within economic consultancies, and this can only be accessed by governments and large energy companies. The need for open access and more transparent modelling tools was cited in the discussions, along with the need to build electricity market modelling capabilities within Scotland. While there are large sums being spent on model development, not enough of is being spent on the transparency of modelling. Open sourcing can be expensive as it involves paying the developers enough to make IP open. Another point referenced was whether it’s better to have one good study or multiple studies in which there may be less confidence individually.
Impacts on electricity demand: An area highlighted in these discussions on market modelling was the need for a more demand-led approach to the modelling. Currently, only very high level and aggregate assumptions about future demand are being included in the modelling studies. Participants discussed the need to more fully investigate the impacts of different market reform options on demand-side transitions, particularly how the roll-out of heat pumps and EVs across regions of Scotland might be impacted under different market design options.
Socio-economic welfare impacts: As part of its Locational Pricing Review, Ofgem has produced an analysis of consumer impacts of locational pricing which concludes that zonal pricing would benefit most electricity consumers. The main driver of this is the reduced payments currently being made to generators located behind transmission grid constraints. If locational pricing is to be pursued, this work will need to be updated as the REMA team in the UK Government provides more details on zonal configurations, transition arrangements and any measures to shield consumer groups from zonal price variations. Socio-economic welfare impacts also need to be studied from a Scottish perspective, requiring a more detailed and refined analysis of impacts on consumer groups and regions.
Getting the balance right
The decision of whether to reform the existing national market or transition to a zonal design can be informed by further technical and modelling studies but it is, in essence, a political judgement about the distribution of costs and risks across society. The argument in favour of a zonal market hinges on a judgement that the consumer and efficiency benefits of more accurate pricing in the wholesale market would outweigh the risks of transitioning. Given the diversity of the investor community and uncertainty around the extent to which market participants would adapt to the new regime, evidence around this issue will not be definitive in advance of a final decision.
There are also uncertainties on the side of the reformed national market. While this option will likely involve higher redispatch costs, the transitional risks and impacts on the cost of capital will likely be lower. However, given the vested interests and inherent uncertainties, it’s impossible to verify the claims of proponents of this option in advance. The impacts of reforms to the transmission charging regime (TNUoS), and NESO’s efforts to improve its approach to redispatch and the management of interconnector flows would only be demonstrated in practice, with the latter likely requiring deeper collaboration with neighbouring TSOs in the EU/EEA.
REMA should not be seen as a one-off reform; regardless of the preferred option – zonal pricing or a reformed national market – there will need to be an ongoing dialogue between the Scottish and UK governments, and the wider industry and stakeholder community, regarding implementation and future reforms as the electricity system evolves over the coming decades. There are no perfect answers in electricity market reform; it’s about balancing multiple and sometimes conflicting objectives in the real-world context.
References
Barnes, F. & Brauer F, a. T. F., 2024. GB wholesale electricity market reform: impacts and opportunities for Scotland, Edinburgh: ClimateXChange.
Department for Energy Security and Net Zero, 2004. Review of electricity market arrangements (REMA): Autumn Update, 2024. [Online]
Available at: https://www.gov.uk/government/publications/review-of-electricity-market-arrangements-rema-autumn-update-2024
LCP Delta & Grant Thornton, 2023. System Benefits from Efficient Locational Signals: A study on moving the electricity market to a locational pricing model for the Department of Energy Security and Net Zero. [Online]
Available at: https://assets.publishing.service.gov.uk/media/65e3a3dc3f69450263035fc3/9-system-benefits-from-efficient-locational-signals.pdf
LCP Delta, 2024. Zonal Pricing in Great Britain: Assessing the Impacts of the ‘Beyond 2030’ Network Plans. [Online]
Available at: https://insights.lcp.com/rs/032-PAO-331/images/LCP-Delta-SSE-Impacts-of-Beyond-2030-network-plans-on-zonal-pricing-October-2024.pdf
Ofgem, 2023. Assessment of Locational Wholesale Pricing for GB. [Online]
Available at: https://www.ofgem.gov.uk/sites/default/files/2023-10/Ofgem%20Report%20-%20Assessment%20of%20Locational%20Pricing%20in%20GB%20%28final%29.pdf
Ofgem, 2024. Open Letter: Seeking industry action to develop a temporary intervention to protect the interests of consumers by reducing the uncertainty associated with projected future TNUoS charges. [Online]
Available at: https://www.ofgem.gov.uk/publications/seeking-industry-action-mitigate-investment-impacts-very-high-projected-tnuos-charges
Dr Ronan Bolton is a Reader in Science, Technology and Innovation Studies at the University of Edinburgh. Email: ronan.bolton@ed.ac.uk
Professor Chris Dent holds a Personal Chair in Industrial Mathematics at the University of Edinburgh
Dr Lars Schewe is Reader in Operational Research at the School of Mathematics, University of Edinburgh
How to cite this publication:
Bolton, R., Dent, C, Schewe, L. (2025) Report on the First Scottish Forum on Future Electricity Markets. RSE/ClimateXChange. Edinburgh http://dx.doi.org/10.7488/era/5651
© The University of Edinburgh and Royal Society of Edinburgh, 2025
Prepared by University of Edinburgh on behalf of ClimateXChange, The University of Edinburgh and the Royal Society of Edinburgh. All rights reserved.
While every effort is made to ensure the information in this report is accurate, no legal responsibility is accepted for any errors, omissions or misleading statements. The views expressed represent those of the author(s), and do not necessarily represent those of the host institutions or funders.
This work was supported by the Royal Society of Edinburgh, University of Edinburgh and the Rural and Environment Science and Analytical Services Division of the Scottish Government (CoE – CXC).
ClimateXChange
Edinburgh Climate Change Institute
High School Yards
Edinburgh
EH1 1LZ
+44 (0) 131 651 4783
info@climatexchange.org.uk
Royal Society of Edinburgh
22-26 George Street
Edinburgh
EH2 2PQ
+44 (0) 131 240 5000
info@theRSE.org.uk
Electricity Markets Research HubOld Surgeons Hall High School YardsUniversity of EdinburghEH1 1LZ
+44 (0) 131 650 4011
www.energy.ed.ac.uk/research-themes/electricity-markets-research-hub
The B6 boundary separates Scotland and England. In summer 2024, B5 – further north – was the most problematic because of outages due to maintenance. ↑
Although generators lose their support payments when they are curtailed (either their ROC or CfD top up payment) this is generally outweighed by the need to compensate them (based on their bid prices and volumes) in the balancing mechanism along with the payments required to compensate generators south of the border for increasing their output (based on their offer prices and volumes in the balancing mechanism). ↑
It should be noted that even fully nodal pricing does not completely remove the need for balancing actions, but it reduces them to the extent that the revenues involved are not significant. ↑
Heat loss from domestic buildings has been identified as a major source of carbon emissions. Energy Performance Certificates (EPCs) present energy efficiency ratings for buildings. They will become an increasingly important tool in quantifying energy loss for individual properties in Scotland, as outlined in the proposed Heat in Buildings Bill.
This study reviews the approaches taken in European Union (EU) member states on operational governance of EPCs, through a literature review, expert interviews and in-depth case studies of three countries of interest.
The study has identified opportunities for Scotland to learn from examples of best practice in other countries. It also presents a series of options that could be implemented as part of a potential reform of the operational framework for EPC governance in Scotland.
Key findings
- Governance models: Member states allocate responsibility for EPC implementation and quality assurance of their EPC regimes in different ways. Some member states utilise a central government body, and others use a publicly funded arms-length body. A few member states use an external private organisation or allocate this responsibility at a regional level.
- Minimum qualifications, training and accreditation for EPC assessors: Member states must ensure that EPC assessors are suitably qualified and certified. They do this by setting requirements for assessors, such as a higher education degree and/or professional experience in a related field. Most member states also have approved training courses and/or examinations, which might be voluntary or mandatory. Some countries also require mandatory recertification or retraining after a set period of time or require programmes of continuous professional development.
- Auditing and quality assurance in the production of EPCs: Member states must ensure that quality standards are upheld in the production of EPCs. They are required to carry out random sampling of EPCs. While some member states conduct random sampling of total EPCs issues, others sample a percentage of EPCs per assessor. Some member states also choose to conduct additional targeted audits, which can be desk-based or on-site and are triggered by specific risk factors. Some member states also use digital screening systems, which automatically screen input data to identify incorrect or inconsistent data. All member states implement some sort of penalty system for assessor errors to uphold quality standards. These usually depend on the severity of the infraction, but include reissuing the EPC, additional targeted training, or monetary fines. For severe or repeat offences, assessors in some member states can also have their assessor license suspended or withdrawn.
- Enforcement mechanisms: Most member states can issue fines for failing to present a valid EPC at the point of sale or rental. However, many do not enforce this requirement or issue fines in practice and there are data gaps in how well the requirement is enforced. Analysis by the European Commission found that only a small number of member states have a robust system for enforcing the requirement to present an EPCs at the point of sale. Those that do require legal professionals to check that an EPC is present as part of the sale. However, rental agreements often do not involve a legal professional in the process, so they cannot be targeted in the same way as sales are more difficult to enforce.
Case studies
For further information, including on suggested options for Scotland, please read the report.
If you require the report in an alternative format, such as a Word document, please contact info@climatexchange.org.uk or 0131 651 4783.
Research completed: July 2024
DOI: http://dx.doi.org/10.7488/era/5342
Executive Summary
Heat loss from domestic buildings has been identified as a major source of carbon emissions. Energy Performance Certificates (EPCs) present energy efficiency ratings for buildings. They will become an increasingly important tool in quantifying energy loss for individual properties in Scotland, as outlined in the proposed Heat in Buildings Bill.
This study reviews the approaches taken in European Union (EU) member states on operational governance of EPCs, through a desk-based literature review, expert interviews and in-depth case studies of three countries of interest.
We identify opportunities for Scotland to learn from examples of best practice in other countries. We also present a series of options that could be implemented as part of a potential reform of the operational framework for EPC governance in Scotland.
Key findings
Governance models
Member states allocate responsibility for EPC implementation and quality assurance of their EPC regimes in different ways. Some member states utilise a central government body, and others use a publicly funded arms-length body. A few member states use an external private organisation or allocate this responsibility at a regional level.
Minimum qualifications, training and accreditation for EPC assessors
Member states must ensure that EPC assessors are suitably qualified and certified. They do this by setting requirements for assessors, such as a higher education degree, and/or professional experience in a related field. Most member states also have approved training courses and/or examinations, which might be voluntary or mandatory. Some countries also require mandatory recertification or retraining after a set period of time or require programmes of continuous professional development.
Auditing and quality assurance in the production of EPCs
Member states must ensure that quality standards are upheld in the production of EPCs. They are required to carry out random sampling of EPCs, although some member states conduct random sampling of total EPCs issues, and others sample a percentage of EPCs per assessor. Some member states also choose to conduct additional targeted audits, which can be desk-based or on-site and are triggered by specific risk factors. Some member states also use digital screening systems, which automatically screen input data to identify incorrect or inconsistent data.
All member states implement some sort of penalty system for assessor errors to uphold quality standards. These usually depend on the severity of the infraction, but include reissuing the EPC, additional targeted training, or monetary fines. For severe or repeat offences, assessors in some member states can also have their assessor license suspended or withdrawn.
Enforcement mechanisms
Most member states can issue fines for failing to present a valid EPC at the point of sale or rental. However, many do not enforce this requirement or issue fines in practice and there are data gaps in how well the requirement is enforced. Analysis by the European Commission found that only a small number of member states have a robust system for enforcing the requirement to present an EPCs at the point of sale. Those that do require legal professionals to check that an EPC is present as part of the sale. However, rental agreements often do not involve a legal professional in the process, so they cannot be targeted in the same way as sales are more difficult to enforce.
Options for Scotland
We have established a list of potential options which could improve the operational governance of EPCs in Scotland.
Option 1 – Including standard training requirements for EPC assessors in the Operational framework
This could include introducing standard education and qualification requirements into the operational framework, approving a standardised mandatory training programme for EPC assessors, and/or requirements for assessors to attend mandatory annual re-training.
Option 2 – Develop standardised quality assurance procedures for approved organisations in the operational framework
This could include developing a digital quality assurance system to screen EPC input data, establishing a ‘Helpdesk’ function to receive complaints about EPCs, implementing targeted audits of EPCs based on specific risk factors and/or outlining a clear penalty system for assessor infractions.
Option 3 – Engage wider stakeholders in the rental/sales process to support enforcement of the requirement to present an EPC
Formalising the requirement for solicitors to check EPC documentation at the point of sale could help enforce this requirement in practice. Engaging stakeholders involved in the rental market, such as estate agents, could help encourage checking of EPC documentation for lettings.
Glossary and abbreviations table
|
ADENE |
The Portuguese Energy Agency |
|
AO |
Approved organisations – whose members are approved to deliver EPCs in Scotland |
|
APEL |
Approved Prior Experiential Learning |
|
BER |
Building Energy Rating – energy efficiency ratings used for buildings in Ireland |
|
CPD |
Continuous professional development |
|
CzK |
Czech Koruna |
|
EU |
European Union |
|
EPBD |
Energy Performance of Buildings Directive |
|
EPC |
Energy Performance Certificate |
|
HRK |
Hrvatska Kuna (Croatian Kuna) |
|
ICS |
Independent Control System – EPBD requirement that member states must allocate responsibility for upholding the quality of EPCs and their associated QA procedures. This can be allocated to a government department or to an external organisation. |
|
NVQ |
National Vocational Qualification |
|
Operational framework |
The document which governs approved organisations in Scotland and outlines key processes to ensure that EPCs are prepared by sufficiently qualified persons |
|
QQI |
Quality and Qualifications Ireland |
|
QA |
Quality assurance |
|
SEAI |
Sustainable Energy Authority of Ireland |
|
VEKA |
Flemish Energy and Climate Agency |
Introduction
Context
Energy Performance Certificates in Scotland
The Energy Performance of Buildings Directive (EPBD) is the primary legislative instrument used to promote energy efficiency in buildings in the European Union (EU). First published in 2002, it was recast in 2010, 2018 and most recently in May 2024 to align with the higher energy efficiency ambition in the European Green Deal (European Union, 2024).
The Energy Performance of Buildings (Scotland) Regulations 2008 transposed the original EU’s EPBD into Scottish statute. The Regulations dictate how Energy Performance Certificates (EPC) are implemented in Scotland, and outline that an EPC must be produced when a new building is constructed and when a building is sold or rented. This applies both to homes and to non-domestic buildings. EPCs contain an energy efficiency rating, as well as recommendations on how to improve a building’s energy efficiency. Therefore, they are widely considered to be useful tools for helping to drive emission reductions from buildings.
However, using EPCs as a basis upon which to set standards can be problematic, as a result of issues including:
- Poor quality or low robustness of assessments
- Infrequently updated assessments
- Use of modelled data rather than actual energy performance data
- A lack of incentives for decarbonising heat
To ensure that EPCs are fit for purpose in the context of Scotland’s leading net zero objectives, the Scottish Government is planning to revise the role of EPCs in line with the proposed Heat in Buildings Bill. There could be a more prominent role for EPCs, particularly as a tool for demonstrating compliance.
Operational governance of EPCs in Scotland and reform
In Scotland, an EPC must be produced by members of six “Approved Organisations” (AOs). Regulation 8(3) of the Energy Performance of Buildings Regulations (Scotland) 2008 requires that AOs “ensure that members are fit and proper persons who are qualified by their education, training and experience to carry out the preparation and issuing of energy performance certificates”. AOs therefore hold primary responsibility for training and accrediting EPC assessors in Scotland. An operational framework outlines key processes that ensure EPCs are prepared and issued by sufficiently qualified persons, including (Scottish Government, 2012):
- Ensuring integrity and operational resilience
- Accreditation of energy assessor members
- Administering the operation of energy assessor members
- Maintaining records to facilitate effective operation of the scheme and periodic audit by the Scottish Government
A report by Alembic Research Ltd et al, (2019) and commissioned by the Scottish Government, made recommendations on minimum standard qualifications for EPC assessors, auditors, and AOs. It also suggested an independent redress avenue for EPC consumers. In line with this, the Scottish Government are looking to assess and potentially review the Operating Framework and its role in upholding the quality and robustness of EPCs. This will ensure EPCs are fit for purpose in their potentially enhanced role in the upcoming Heat and Buildings Bill.
Objectives and scope
In this study, we investigate how the operational governance provisions of the EPBD have been implemented in the EU member states. This will enable us to identify opportunities for Scotland to learn from examples of best practice in other countries. The key objectives of this study are therefore to:
- Review the approaches taken to operational governance of EPCs in EU member states
- Identify different methods of implementation and areas of interest for Scotland
- Develop options for potential reform of the operational framework for EPC governance in Scotland.
We only consider approaches taken in EU member states in this review. In addition, we do not consider aspects related to EPC methodologies. The focus is on the operational aspects of EPC governance. These include:
- Governance model – whether central government or arms-length bodies hold responsibility for EPC governance, or if this is delegated to external organisations.
- Training for EPC assessors – including coverage of any education prerequisites to apply for certification, training courses or examinations that assessors must complete, and any requirements for re-certification or retraining after a set period.
- Auditing, verification and quality assurance (QA) procedures – the systems and processes in place to guarantee the quality of EPC production, how the requirement for an independent control system (ICS) is met, including who holds QA responsibilities and any penalties issued for assessor infractions.
- Enforcement mechanisms – how member states enforce the requirement to present an EPC at the point of construction, sale or rental of a property, and any associated penalties
- Affordability – any information identified on how member states ensure the affordability of EPCs, in line with Article 16 of the EPBD.
Methodology
We collected data for this study primarily through a desk-based literature review. This was supplemented with a series of interviews with EPC experts,[1] which we used to triangulate findings from the literature review and to fill any identified gaps in the evidence. We then selected three countries of interest for Scotland (Belgium, Croatia and Ireland) and developed an in-depth case study for each. The collected data was used to derive policy options for improving the operational governance of EPCs in Scotland. Full methodological detail, including relevant limitations, is presented in Appendix A.
Operational governance of EPCs in the EU member states
Governance models
This section explores the governance models that member states use to implement Energy Performance Certificate regimes, including how they delegate the responsibility for the Independent Control System required in the Energy Performance of Buildings Directive.
EPBD requirements
member states can delegate the responsibility for implementing the ICS for EPCs as they deem fit under Annex VI of the EPBD. This system aims to ensure the quality of EPCs and their associated QA procedures. (European Commission, 2021a). Amongst other requirements, the ICS should:
- Provide a clear definition of a valid EPC, which should include requirements to check the validity of input data and calculations used to generate the EPC
- Clearly outline the quality objectives and level of statistical confidence that the EPC framework should achieve (these are further explained in Section 4.3.1)
- Ensure that EPCs are available to prospective buyers and tenants so that informed decisions can be made on their decision to buy or rent a property
- Account for different building typologies, such as single residential, multi-residential, offices or retail
- Regularly publish information on the ICS, through the national database of EPCs.
Member state approaches
Scottish approach
Scotland follows the approach agreed in the UK when the EPBD was transposed into domestic regulation in 2008, when the UK was an EU Member State.
The Scottish Government implements EPCs, including the ICS, through six external private organisations, called Approved Organisations. The Scottish Government has an agreement with these AOs, who are governed by an operational framework, which was published in 2012. Members of AOs are often self-employed energy assessors, whom the AOs contract to produce EPCs in line with government-approved methodologies and tools (Delorme and Hughes, 2016). However, the role of the AOs is to ensure that their members have the skills and expertise necessary to prepare and issue EPCs. They are also responsible for upholding QA protocols and for issuing penalties for incorrect EPCs.
A similar approach is adopted in England and Wales, where six independent accreditation schemes are responsible for managing energy assessors and for ensuring they possess the appropriate skills for the role.
Table 1 gives an overview of the governance models adopted in the member states. The majority place the responsibility of implementing the ICS for EPCs on a Central Government body. This approach is adopted in Greece for example, where the Department of Energy Inspection hold QA responsibilities (CRES, 2020). Some member states have allocated the responsibility of implementing the ICS on government-funded, arms-length bodies. For example, this is the approach adopted in Ireland, where the Sustainable Energy Authority of Ireland (SEAI) is responsible, and in Slovakia, where this falls to the Slovak Trade Inspection. Both bodies are publicly funded, non-profit organisations separate to the central government Ministries and Departments responsible for overall EPC policy (SEAI, 2017b) (Slovak Trade Inspection, n.d.).
|
Governance model |
Description |
Examples of Member State adoption |
|
Government body (Central Government Ministry or Department) |
Most common model of governance adopted – the Government Ministry or Department made responsible for implementing the ICS |
Cyprus, Czechia, Estonia, Finland, France, Greece, Croatia, Lithuania, Luxembourg, Latvia, the Netherlands, Poland, Romania, Slovenia |
|
Government body (arms-length bodies) |
Responsibility of implementing the ICS lies with government-funded, arms-length organisations that are separate from the Government |
Bulgaria, Denmark, Ireland, Hungary, Malta, Slovakia and Sweden |
|
External body |
Responsibility of the ICS lies with an external private organisation |
Portugal, Scotland, England and Wales[2] |
|
Regional differentiation |
ICS responsibilities are allocated differently at regional level |
Austria, Belgium (Flanders, Brussels and Wallonia), Germany, Italy and Spain |
Portugal has allocated the responsibility of implementing the EPBD and the ICS to an external body. The Portuguese Energy Agency (ADENE) oversees the central register and assessor accreditation. An EU-level EPC expert interviewed for this project perceived that this approach was adopted to separate EPC governance from changing political governments, instilling stability and allowing for a long-term vision for the system to be implemented.
Five member states implement the ICS at regional level. Each of the Belgian regions govern EPCs independently. In Austria, some regions have allocated responsibility of conducting QA on EPC data to the municipalities (OIB, 2020), whereas energy agencies oversee the QA in others (TU Wien, 2021). Italian regions and autonomous provinces had autonomy over energy topics until 2015, resulting in a complex regulatory framework. Guidelines for regulating EPCs were released in 2015 that implemented a new standardised EPC system at national level (Azzolini et al., 2020).
Minimum qualifications, training and accreditation for EPC assessors
This section outlines the training and certification schemes member states have adopted to ensure that EPC assessors are suitably qualified independent experts.
EPBD requirements
Article 25 of the EPBD sets out a requirement for member states to ensure that EPCs are carried out by ‘independent experts’. It outlines that:
- Experts must be suitably qualified and certified, but can be self-employed, employed by public bodies or by private enterprises
- Information on the training and certification process should be made available to the public
- A list of certified experts or companies that offer the services of experts must be regularly updated and made available to the public.
Member state approaches
Scottish approach
The Operating Framework mandates that AOs reference the UK National Occupational Standards for Energy Assessors. These have been developed to ensure energy assessors are competent and possess the right skills to conduct energy assessments. A Level 3 NVQ qualification for assessors exists in Scotland, as well and in England and Wales. However, AOs are ultimately responsible for ensuring EPC assessors are suitably qualified in Scotland. Although some assessors obtain this NVQ, it is not mandatory and AOs use Approved Prior Experiential Learning (APEL), which considers relevant experience, skills, and training of a potential assessor.
EPC experts must complete a 3-5 day training course, designed and delivered by AOs. These can cost between £700 and £1250 (Kanzyl, 2020a). The type of accreditation depends on the building type to be assessed – with separate accreditations for:
- Domestic EPCs (existing buildings).
- Domestic EPCs (new buildings).
- Non-domestic EPCs (existing buildings).
- Non-domestic EPCs (new buildings).
Continuous professional development (CPD) is required, although the minimum level of CPD is specified by each AO (Delorme and Hughes, 2016).
As AOs in Scotland are responsible for ensuring assessors are suitably qualified, and there are no minimum national standards for qualifications, training, or continuous professional development. Therefore, there may be a variation in standards across the country.
The approach taken in England and Wales is similar, where accreditation schemes have discretion over whether assessors hold the necessary skills to become an assessor. However, energy assessors can satisfy requirements through training and examinations, or by demonstrating suitable qualifications and experience (Delorme & Higley, 2020).
Pre-Requisites for independent experts
Table 2 outlines the approaches member states have taken to setting pre-requisites for independent experts. Thirteen member states have set subject-specific educational requirements. These are all higher education requirements (either Bachelors or Masters) in subjects such as engineering and architecture. Sweden, Romania and the Netherlands are the only member states only requiring professional experience as a pre-requisite for accreditation. In Sweden for example, applicants must first have 5 years of professional experience to undergo the training for assessor accreditation (Hjorth et al., 2020).
|
Pre-requisite requirement |
Description |
Examples of Member State adoption[3] |
|
Education |
Higher education (Bachelors or Masters) degree required. These are always in subjects such as engineering or architecture. |
Austria, Bulgaria, Cyprus, Czechia, Denmark, Finland, France, Greece, Croatia, Hungary, Italy, Luxembourg, Malta, Poland, Slovenia |
|
Professional |
Professional experience in a related field (such as construction) |
Sweden, Romania and the Netherlands |
|
Both education and professional |
Combination of both educational and professional experience required |
Estonia, Germany, Lithuania and Portugal |
|
Flexible approach |
Multiple pathways available to assessors (either education, or prior professional experience) |
Belgium (Flanders, Brussels, Wallonia), Ireland, Scotland, England and Wales |
Some member states have more flexible requirements and recognise either professional or educational experience. Others, however, require both specific higher education degrees and professional experience. For example, in Lithuania applicants must have an engineering degree and three years’ experience in the construction sector (Kranzl, 2020a).
Training courses for independent experts
Table 3 outlines the approaches to training independent experts adopted by member states for assessor accreditation.
|
Training requirements |
Description |
Examples of Member State adoption[4] |
|
Mandatory training programme |
Mandatory accreditation training administered either by external certified organisations or government bodies |
Germany, Estonia, Croatia, Luxembourg, Slovenia, Sweden and Scotland |
|
Mandatory training and exam |
Mandatory accreditation training and examination administered either by external certified organisations or government bodies |
Belgium (Flanders, Brussels and Wallonia), Bulgaria, Cyprus, Denmark, Finland, France, Greece, Ireland, Italy, Lithuania, Malta, The Netherlands, Poland, Portugal, Romania, England and Wales[5] |
|
Voluntary training only |
Voluntary training for assessor accreditation, accreditation authority responsible for granting accreditation |
Austria and Germany |
|
Voluntary training and exam |
Voluntary training for assessor accreditation, accreditation authority responsible for granting accreditation. Mandatory examination also required. |
Cyprus and Hungary |
Most member states have implemented a mandatory training programme for EPC assessor accreditation. The majority of member states (including Bulgaria, Denmark, Greece and Ireland) have also implemented a mandatory written examination as a requirement for accreditation. Malta requires both written and oral examinations (BPIE, 2014). Six member states (Austria, Germany, Estonia, Croatia, Luxembourg and Slovenia) do not have a mandatory exam for prospective assessors.
Some member states have only introduced a voluntary training scheme for assessor accreditation. In these member states (Austria and Germany), the authority responsible for assessor accreditation certifies experts based on professional experience or education achievements, without the adoption of mandatory training (Kranzl, 2020a) (BPIE, 2014). In Cyprus and Hungary, despite the adoption of voluntary training, completion of a mandatory exam is required for accreditation (BPIE, 2014). The training requirements for member states do not appear to be linked to the stringency of pre-requisites, for example, the countries who implement a voluntary training programme only do not necessarily have more stringent pre-requisites (and vice versa).
Training course administration
In most cases, training is administered by external, private organisations that have been approved by the Government. In Ireland for example, the national agency for qualifications, ‘Quality and Qualifications Ireland’ oversees the accreditation of training course providers. Only courses administered by these organisations are accepted (SEAI, 2017a). Similarly, in member states such as Denmark and Greece, a singular accreditation body has been appointed (National Energy Agency in Sweden and the Ministry of Environment, Energy and Climate Change in Denmark) (Ruggieri et al., 2023). An interview with an EPC expert in the Belgium (Flanders) highlighted that whilst the Flemish Government had outsourced the delivery of training and examinations to external providers, they are now in the process of re-instating the administration of the accreditation internally. No further clarification on why this was the case was provided.
Recertification or retraining for independent experts
Table 4 outlines the approaches to recertification and retraining adopted in EU member states.
|
Recertification or retraining requirements |
Description | Examples of Member State adoption[6] |
|
Recertification or retraining requirements |
Requirement for independent experts to recertify or retrain after a set period of time |
Estonia, Finland, France, Ireland, Lithuania, Luxembourg |
|
Continuous professional development requirements |
Requirement that independent experts complete programmes of Continuous Professional Development |
Austria, Belgium (Flanders, Wallonia and Brussels), Bulgaria, Czechia, Germany, Denmark, Croatia, Slovenia, Scotland, England and Wales |
|
Voluntary refresher training |
No requirements for recertification, retraining or continuous professional development |
Romania and Portugal |
Some member states require independent experts to recertify or retrain after a set period of time. This is achieved either by re-sitting the accreditation examination, taking refresher training or through proof of experience. Eight member states have a requirement that independent experts complete programmes of CPD. In Belgium (Flanders), for example, all independent experts must undergo training and sit an examination annually. This training is used to either introduce new concepts or developments (ensuring continuous improvement) or to provide targeted refresher training for specific areas where errors have been identified by a significant number of assessors. The annual training is administered by the Flemish Energy and Climate agency (VEKA) and is tailored each year.[7] In Germany however, no official continuous development or recertification procedures have been adopted but experts are required to take personal responsibility for the quality of certification and ensure they are up to date with developments in the field (BPIE, 2014). ADENE in Portugal administers regular refresher training for experts in Portugal who wish to improve their skills (Kranzl, 2020a).
Auditing and quality assurance in the production of EPCs
This section discusses the various approaches that member states take to ensure that the quality of EPCs and their associated quality assurance procedures are upheld.
EPBD requirements
Annex VI of the recast EPBD (European Commission, 2024) outlines provisions related to QA of EPCs that the ICS should implement. These include requiring member states to:
- Provide a clear definition of quality objectives, including the level of statistical confidence that the EPC framework should achieve – at a minimum the ICS should ensure that at least 90% of all valid EPCs issued are evaluated with 95% statistical confidence over a period that cannot exceed one year.
- Carry out random sampling of EPCs to assess the level of quality and confidence in the ICS for EPCs.
- Use a third party to verify at least 25% of the random sample when the ICS has been delegated to non-governmental bodies.
- Ensure the validity of the input data through an on-site visit for at least 10% of EPCs that are part of the random sampling (this is a new requirement of the 2024 recast of the EPBD).
- Employ pre-emptive and reactive measures to ensure the quality of the overall EPC regime, including but not limited to:
- Additional training for independent experts.
- Targeted sampling (in addition to random sampling) to specifically detect and target poor-quality EPCs.
- Obligations to resubmit EPCs.
- Monetary fines.
- Temporary or permanent bans for independent experts.
Article 24 of the EPBD states that member states should implement penalties with regards to infringements of aspects of EPBD implementation, including EPCs. These penalties are not prescribed, however must be “effective, proportionate and dissuasive”.
Scottish approach
AOs hold responsibility for QA in Scotland. They must check a representative sample of EPCs, with a minimum of 2% of all EPCs produced being checked. In 2016, 260,206 EPCs were produced, and 6,604 (2.53%) were checked (Delorme and Hughes, 2016). The checks repeat the EPC calculations using data on the register, most checks are desk-based. Assessors’ outputs are checked every six months. Poor performance can lead to targeted auditing, retraining, suspension, or being struck off (Delorme and Hughes, 2016).
The Scottish Government audits AOs on a 3-yearly basis to ensure compliance with the Operating Framework. In addition, AOs are obliged to complete and return annual reports to the Scottish Government, which were recently reviewed to include more detailed QA information in an effort to better understand the nature of audit failures, complaints, and other important information. Organisations failing to meet the terms of the Framework are subject to corrective action and may have their agreement terminated (Delorme and Hughes, 2016).
A similar approach is taken in England and Wales, where Accreditation Schemes hold responsibility for assuring the outputs produced by their accredited energy assessors. The government then audits the Accreditation Schemes to ensure quality standards are upheld (Delorme & Higley, 2020).
Member state approaches
Digital quality assurance audits
|
Approach to digital quality assurance |
Description |
Examples of Member State adoption[8] |
|
Random sampling of a percentage of total EPCs issued |
Conducting digital audits on a statistically significant number of the total EPCs issued within a given timeframe (maximum one year) |
Austria, Belgium (Brussels), Bulgaria, Czechia, Estonia, Malta, Romania, Scotland, England and Wales |
|
Random sampling of a percentage of EPCs per assessor |
Conducting digital audits on a statistically significant number EPCs issued per assessors issued within a given timeframe (maximum the last year) |
The Netherlands |
|
Random sampling – per assessor and per total of EPCs issued |
Conducting both audits on a random sample of a percentage of total EPCs issued and a random sample of a percentage of EPCs per assessor |
France |
|
Two-tiered approach to digital QA |
Additional targeted audits conducted. These are identified either by errors flagged during the random sampling or by specific citizen complaints of non-compliance |
Belgium (Flanders and Wallonia), Germany, Denmark, Spain, Finland, Greece, Croatia, Cyprus, Hungary, Luxembourg, Lithuania, Latvia, Ireland, Poland, Portugal and Sweden |
Digital screening systems
Some member states have adopted a digital system that automatically screens EPC input data before an EPC is issued. The Portuguese EPC database does this, and flags inconsistencies detected to prevent the input of incorrect or inconsistent data. An EU-level interviewee stated that implementing a mechanism like this limits the amount of QA that is required at later stages of the process.
This study found that all member states are conducting a statistically significant number of random sampling audits as per the requirements of the EPBD. Some member states collate a random sample by sampling a percentage of the total number of EPCs, which is the approach taken in Scotland. Others collate a sample of EPCs by sampling a percentage of EPCs per assessor. France reported conducting a two-tiered random sampling QA approach, conducting audits on both a random sample of total EPCs issues and on a percentage of EPCs per assessor.
Several member states reported that a second phase of targeted audits forms part of their QA procedures. These audits are carried out on EPCs whereby inconsistencies are identified during the random sampling auditing phase. Moreover, targeted audits are conducted in some member states where instances of non-compliance are reported. An interview with an EPC expert in Belgium (Flanders) highlighted that a system has been implemented, whereby citizens can notify complaints of non-compliance which can also lead to targeted audits.
It is understood that Slovakia is also conducting random sampling audits, although the nature of these audits is unknown. Moreover, Italy has reported that the approach to QA is implemented at regional level, resulting in variation. The literature review did not identify QA approaches for Slovenia.
A compliance study published by the European Commission in 2015 conducted analysis on the strength of the compliance checking systems implemented in EU member states. The analysis found that Belgium (Wallonia), Cyprus, Denmark, France, Italy and Lithuania had very robust compliance checking systems. Estonia, Latvia, Malta, Poland, Slovakia and Spain were found to have the lowest strength of EPC compliance checking systems (European Commission, 2015).
Public awareness and compliance
A Danish EPC expert we interviewed reported that the high strength and quality of EPCs in Denmark could be linked to high levels of public awareness and acceptance of EPCs and their benefits. It is believed that Danish homeowners have a strong understanding of EPCs and the benefits they can bring in raising property sale prices. This has resulted in higher levels of compliance and a desire to have high-rating EPC certificates.
On-site quality assurance audits
Mandatory on-site inspections were introduced in the 2024 recast version of the EPBD. Therefore, the data collected as part of this literature review may not reflect these most recent requirements and any subsequent changes to Member State QA regimes.
Approved organisations are responsible for carrying out QA checks in Scotland, and the majority of checks are desk-based. This is similar to the approach taken in England and Wales, where Accreditation Schemes are responsible for QA checks. However, Some member states (such as Belgium, Bulgaria, Cyprus, Denmark, Hungary and Ireland) conduct on-site audits alongside digital audits. In the majority of member states, these are carried out where inconsistencies are identified during the digital random sampling audits (as in Denmark[9]) or where specific citizen complaints or reports of non-compliance are received (as in Belgium (Flanders)9). Moreover, as in Ireland9, specific risk factors such as multiple infractions per assessor or an assessor publishing an abnormally high level of EPCs result in on-site audits being conducted. This is because on-site audits can provide a more detailed understanding of the accuracy of the data reported. Auditors can see the properties of the building in person, allowing for an extra level of QA[10]. In a few cases however (as in Cyprus), experts do on-site sample checks to verify data (MECI, 2020).
Approach to assessor infractions
In Scotland, poor performance by assessors can lead to targeted auditing, retraining, suspension, or being struck off. However, this is at the discretion of Approved Organisations. Accreditation Schemes hold similar responsibilities in England and Wales. All member states implement some kind of penalty system for assessors to minimise the risk of producing incorrect or invalid EPCs. member states have different levels of penalties for assessors, which are dependent on the severity of their infraction. For some, including Ireland and Latvia, this is quantified using a penalty points system (BPIE, 2014). In both member states, the penalties range from requiring the assessor to undertake corrective training to a temporarily or permanently suspended licence (BPIE, 2014). In Ireland, points on an assessor’s portfolio last for 2 years before they are removed from the record (SEAI, 2016). In other member states, the level of penalty appears to be linked to the severity or number of errors. Common approaches to assessor infractions are detailed below.
- Reissue of an EPC – Assessors may be required to reissue a correct EPC at their own cost, usually within a certain timeframe. This is one of the most common practices amongst member states. This occurs in member states including Austria, Belgium (Wallonia), Bulgaria, Cyprus, Czechia, Denmark, Spain, Finland, Croatia, Lithuania, Malta, Portugal and Slovenia. In Finland, the penalty sometimes requires the original assessor to pay for a different assessor to carry out the re-certification (TU Wien, 2021).
- Training – Assessors may be required to undergo corrective training. For example, this approach is used in Belgium (Wallonia), Ireland, and Latvia. In the case of Belgium (Wallonia), the assessor must also pass an exam in order to continue carrying out EPC assessments (Fourez et al., 2020).
- Monetary fines – The majority of member states have monetary fines in place, the value of which is usually dependent on the perceived severity of the error. The value of monetary fines can vary greatly within and between member states. Examples of values are shown in Table 6.
|
Member state |
Value of fines for assessors |
|
Belgium (Flanders) |
€250 – €5000 (TU Wien, 2021) |
|
Germany |
Up to €15,000 (TU Wien, 2021) |
|
Estonia |
Up to €6,400 for an individual or €64,000 for an organisation (Ministry of Economic Affairs and Communications et al., 2020) |
|
France |
Up to €1500 (Deslot et al., 2020) |
|
Greece |
€200 – €10,000 (CRES, 2020) |
|
Italy |
€300 – €10,000 (Azzolini et al., 2020) |
|
Portugal |
€500 – €700 (Kranzl, 2020a) |
|
Romania |
€250 – €2000 (Kranzl, 2020a) |
In some member states, monetary fines are technically possible but not imposed in practice. This includes Bulgaria (SEDA, 2020), Czechia (BPIE, 2014), and Estonia (Ministry of Economic Affairs and Communications et al., 2020). Monetary fines are very rarely used in Germany (BfEE, 2020). In Cyprus and Portugal, monetary fines are only possible if the EPC assessor does not reissue the EPC in the required period (MECI, 2020; Fragoso and Baptista, 2016). In other member states, monetary fines are only imposed if the errors surpass a certain threshold. For example, in Croatia an assessor must have produced more than three incorrect EPCs to face a monetary fine (MCPP, 2020), and in Hungary the energy class must be wrong by at least two classes for the assessor to face a monetary fine (Jenei et al., 2020). In Poland, assessors only face monetary fines if the error is quantified at more than 10%, or if they use incorrect technical assumptions in their methodology (Kranzl, 2020a; Bekierski et al., 2016).
No evidence was found that Austria, Denmark (Energistyrelsen et al., 2020), Ireland (BPIE, 2014), Lithuania (Encius, 2016), Luxembourg (Worré et al., 2020), Latvia (BPIE, 2014), Malta (Degiorgio and Barbara 2016), Sweden, and Slovakia impose monetary fines on assessors.
- Suspension or withdrawal of accreditation – In Scotland, poor performance by assessors can lead to penalties including suspension or withdrawal of accreditation at the discretion of Approved Organisations. Accreditation Schemes in England and Wales also have discretion over applying such penalties to assessors. In many member states, assessors can face temporary or permanent loss of accreditation to carry out EPC assessments as a result of infractions. This is the case in Belgium (Flanders) (TU, Wien, 2020; Kranzl, 2020a), Belgium (Wallonia) (Fourez et al., 2020), Cyprus (BPIE, 2014), Czechia (BPIE, 2014), Finland (TU Wien, 2021), France (BPIE, 2014), Greece (TU Wien, 2021), Croatia (Mardetko-Škoro, 2015), Hungary (Jenei et al., 2020), Ireland (BPIE, 2014), Lithuania (Encius, 2016), Luxembourg (Worré et al., 2020), Latvia (BPIE, 2014), and Poland (BPIE, 2014).
In a number of member states, the length of the suspension is dependent on the severity of the infraction. For example, in Greece assessors can face suspensions of between one and three years, depending on the severity of the mistake (TU Wien, 2021). In Croatia, assessors can lose their accreditation if they submit more than three invalid EPCs (Mardetko-Škoro, 2015). In Hungary, assessors can lose their license for three years if errors result in EPCs changing by more than 2 energy classes (Jenei et al., 2020).
In other member states, suspension or withdrawal of a license is only imposed if a threshold is passed. For example, in Ireland, if an assessor submits more than 10 incorrect EPCs in two years, they can be suspended for between 3-12 months (BPIE, 2014). In Latvia, if an assessor has more than seven points on their portfolio they face suspension of six months, and if they have more than 10 points on their portfolio, they face suspension of 12 months (BPIE, 2014). In Denmark, EPC assessors are employed by certified organisations, and the organisations can lose their accreditation in the case of repeated errors from their assessors (Energistyrelsen et al., 2020).
Use of administrative fees and levies
This section explores fees and levies implemented by Member States charged to assessors for the registration or lodgement of EPCs. It does not include fines implemented for assessor registration or fines associated with assessor infractions.
EPBD requirements
There is no requirement in the EPBD for what administrative fees or levies Member States can charge to assessors for EPC lodgement or registration. Therefore, Member States have taken different approaches in whether they choose to implement such a fee or its value.
Member state approaches
Scottish approach
Scotland has implemented a fee for the lodgement of EPCs of Existing Domestic Buildings and Non-Domestic Buildings in Scotland. The value of the fees varies based on the nature of the building. The Energy Performance of Buildings (Scotland) Regulations 2008 outline that the fee associated with a domestic EPC is £2.60, whereas the fee associated with a non-domestic EPC is £12.60. The revenue generated from these fees is ring-fenced to support the effective operation and maintenance of register systems. (Scottish Government, 2017).
|
Country |
Description |
Examples of Member State adoption |
|
No administrative fee |
Member State does not charge an administrative fee to assessors |
Austria, Belgium, Bulgaria, Croatia, Czechia, Cyprus, Estonia, France, Finland, Greece, Hungary, Italy, Luxembourg, Latvia, The Netherlands, Poland, Romania, Slovenia, Slovakia, Spain, Sweden |
|
Administrative fee in place with no ringfencing |
Member State does not ring fence revenue for specific purpose |
Malta |
|
Administrative fee in place with ringfencing of revenue |
Member State ring fences revenue for EPC-related purposes, which can include maintaining the EPC registry or QA procedures, for example |
Ireland, Portugal, England and Wales, Germany, Lithuania, Denmark |
Member state EPC regimes can be partly or fully financed through their lodgement or registration fees, in combination with other fees such as annual assessor registration fees. For example, the EPC system in Ireland was intentionally designed to be cost-neutral (BPIE, 2014). In countries that don’t charge specific administration costs, Borragán and Legon, (2021) report that this fee can also be indirectly covered by the overall EPC assessment price. However, in most cases, Member States rely partly or fully on public funds to support their EPC systems. The amount of public funds used to finance EPC systems can amount to as much as several million euros every year in some Member States (Loncour and Heijmans, 2018).
Lodgement fee value
Whilst the majority of Member States have not implemented fees or levies for issuing or publishing individual EPCs, Ireland, Malta, Lithuania, Portugal, Germany and Denmark have, as have England and Wales (BPIE, 2014). The value of these fees varies between the Member States. Although Malta has the highest fee for domestic EPCs at €75, it doesn’t appear for the other Member States that the size of the Member State or the number of EPCs they issue directly correlates with the value of the fee.
Germany, Lithuania and Malta charge one fee for all EPCs, whereas Denmark, England and Wales, Ireland and Portugal outline different fees for domestic and non-domestic EPCs. In all cases where a different fee is charged, the fee associated with a non-domestic EPC is higher than the fee for a domestic EPC. In England and Wales, the difference is very small, but in Denmark, Ireland and Portugal, the fee associated with a non-domestic EPC is at least double the value of the fee for a domestic EPC.
|
Country |
Fee for domestic EPCs |
Fee for non-domestic EPCs |
|
Denmark [11] |
€17.30 |
€35.30 |
|
England and Wales |
£1.50 |
£1.70 |
|
Ireland (SEAI, 2019). |
€30 |
€60 |
|
Germany [12] |
€6.90 |
€6.90 |
|
Lithuania (Encius and Baranauskas, 2016) |
€6 |
€6 |
|
Malta [13] |
€75 |
€75 |
|
Portugal [14] |
€28 to €65 (pus VAT) |
€135 to €950 (plus VAT) |
Use of revenue generated
In the following Member States that have adopted a fee for registering and publishing EPCs, the revenue generated is ring-fenced and used for EPC-related purposes.
- Ireland – the SEAI uses the revenue to make investments back into the EPC programme, such as by developing, upgrading or replacing the systems and increasing the resources to support assessors, industry, and the wider public through the EPC Helpdesk and quality assurance system[15].
- Portugal – the revenue generated from the fees is used to support daily technical support to the experts, IT infrastructure and developments, quality assessment and enforcement, awareness and communication.[16]
- Germany – the registry budget is supported through the fees for lodging EPCs (BPIE, 2014)
- Lithuania – part of the revenue raised from the EPC lodgement fee is used to finance quality assurance of EPCs (Encius and Baranauskas, 2016).
- Denmark – the fee charged by DEA in covers work carried out by DEA concerning the necessary supervision of the scheme. It involves taking EPCs out for quality control, handling complaints, but also answering general questions about the EPC scheme, developing and maintaining the IT systems (the EPC database, etc.), and the contact with the educational institutions for the training of EPC assessors[17].
- England and Wales – the revenue generated from these fees is ring-fenced to pay for the technical team that run the register for the fees, as well as policy and operations salaries. Moreover, the revenue generated funds any technical running costs associated with the lodgement of EPCs as well as any opportunities identified for “register improvement”[18].
In Malta however, the money generated from the lodgement fee is not ring-fenced for any specific purpose. It joins other sources of revenue and then funding is allocated where and as necessary[19].
Enforcement mechanisms
This section investigates how member states ensure that the requirement to present an EPC for a building at the point of sale/rental is enforced.
EPBD requirements
Article 20 of the recast EPBD (European Commission, 2024) mandates that digital EPCs must be issued for buildings or building units when they are:
- Newly constructed or have undergone major renovation.
- Sold to a new owner.
- Rented to a tenant (or a rental contract is renewed).
- An existing building owned or occupied by public bodies.
It also requires that the EPC must be shown and handed over to prospective tenants or buyers at point of sale or rental. There are some exceptions to this, for example, when the building is only intended to be used for less than four months of the year or has an actual energy consumption of less than 25% of the expected annual energy consumption.
Member state approaches
Scottish approach
Failing to issue EPCs when marketing a property for sale or for rent can result in enforcement actions. Penalties, outlined in the Energy Performance of Buildings Regulations (Scotland) 2008, are £500 for residential dwellings and £1000 for other cases. Local Authorities are the nominated Enforcement Authorities and hold the duty to uphold EPC regulations within their jurisdictions, so are therefore responsible for issuing fines. Local Authorities can also consider criminal action (Delorme and Hughes, 2016).
The Scottish Government does not have a clear picture of the scale of enforcement activity undertaken by the Local Authorities and are currently engaging with all 32 local authorities to gain more detailed information on enforcement in practice.
In England and Wales, local authorities are responsible for enforcement and hold powers to request that copies of an EPC are produced for inspection. They also hold powers to decide the appropriate course of action to enforce compliance, which can include a range of actions from providing compliance advice to issuing a penalty (Delorme & Higley, 2020).
Only a small number of member states have a vigorous mechanism for ensuring EPCs are available at the point of rental or sale (European Commission, 2015) and availability of enforcement rate data is often low. In most of these member states, checks are made by notaries during the sale transaction, which is thought to be an effective system (European Commission, 2015). However, as rental agreements are often less formal, ensuring EPCs are made available here is more challenging. It is thought that ensuring the EPC is signed off by a lawyer in the rental agreement is a good way to address this problem (European Commission, 2015). However, rental agreements are often less formal and do not always involve a legal professional, meaning that the systems in place for enforcement can be less developed in the rental sector than they are for sales. This often results in lower compliance rates or poor data availability in the rental sector. However, in Hungary for example, it is a requirement that a legal professional signs off on rental agreements. They are then responsible for checking the presence of EPC documentation.
The member states found to have the highest level of compliance rates with requirements for new, sold and rented buildings, as well as the highest strength of EPC compliance checking systems, are Belgium (Wallonia), Cyprus, France, Italy, Lithuania and the UK (this study was conducted when the UK was an EU Member State). Latvia and Poland were found to have the lowest compliance rates, coupled with the lowest strength of EPC compliance checking system (European Commission, 2015).
Monetary fines
The majority of member states impose monetary fines on building owners if they fail to present a valid EPC at the point of sale or rental. The cost of fines vary within and between member states, as shown in Table 9.
|
Member state |
Value of fines for building owners |
|
Austria |
Up to €1450 (OIB, 2020; Arbeiterkammer Oberösterreich, 2024) |
|
Belgium (Flanders) |
€500 – €5000 (Kranzl, 2020a) |
|
Belgium (Wallonia) |
€500 – €1000, which can double if the same individual or organisation reoffends within three years (TU Wien, 2021; Fourez et al., 2020) |
|
Czechia |
100,000 Czech Koruna (CZK) (€3979), up to 200,000 CZK (€7958) for apartment buildings (Mečíccrová, 2021) |
|
Germany |
Up to €10,000 (Olschner, 2024) |
|
Spain |
€300 – €6000 (TU Wien) |
|
Greece |
€200 – €2000 (TU Wien, 2020) |
|
Croatia |
5000 Hrvatska Kuna (Croatian Kuna) (HRK) – 30,000 HRK (€662 – €3976) (StanGRAD, n.d.), |
|
Italy |
€3000 – €18,000 (Azzolini et al., 2020) |
|
Lithuania |
Up to €289 (Encius, 2016) |
|
Portugal |
€750 – €7500 (Kranzl, 2020a) |
In most member states, it is unclear what type of infraction results in a higher level of fine for building owners. However, in Spain there are clear guidelines: simple faults result in fines of €300 – €1000, while serious faults can result in fines of up to €6000 (TU Wien, 2021). Serious faults include knowingly falsifying data or having an EPC assessment performed by a non-accredited assessor (TU Wien, 2021). In Finland, the level of fine is dependent on the type of building for which an EPC was not presented, or for the size of the municipality in the case of public buildings (Ministry of the Environment of Finland & Motiva Oy, 2020).
Use of notaries in enforcement
In some member states, notaries or lawyers involved in the sale or rental process are liable for ensuring EPCs are presented when necessary and are also liable for monetary fines if EPCs are not presented. This is the case for lawyers in Hungary, who are required to sign-off the EPC included in a rental agreement (European Commission, 2015). Similarly, notaries in Portugal are required to notify the relevant authorities if an EPC is not presented at the point of sale and can be fined between €250 – €3500 for failing to do so (Kranzl, 2020a). Notaries may also be fined in Belgium (Wallonia), for failing to notify the authorities of an absent EPC at point of sale or rental (TU Wien, 2021).
Affordability of EPCs
This section discusses any action that member states take to ensure that EPCs are affordable.
EPBD requirements
Article 19 of the EPBD requires that member states “take measures to ensure that EPCs are affordable and shall consider whether to provide financial support for vulnerable households.” The EPBD does not require member states to provide any price caps or subsidies, although some member states have chosen to do so.
Little information was found on interventions taken by member states to provide financial support for households requiring EPCs, nor the ability of citizens in member states to pay for EPCs assessments. Therefore, the following discussion focuses on EPC pricing and price controls in member states.
Member state approaches
Scottish approach
The price of EPCs in Scotland is controlled by the market. Research in 2016 showed that indicative starting costs were £35 to £60 (€40 – €70) for residential EPCs and £129 to £150 (€150-€175) for non-residential EPCs. This includes the registration fee payable each time an EPC is recorded on the register (Delorme and Hughes, 2016). There is no cap on EPC prices, and affordability is not actively managed by the Scottish Government.
Price-caps
The majority of member states have not imposed any price limitations on the cost of EPCs and rely on the market to control the affordability of EPCs. However, three member states have imposed price regulations, as detailed in Table 10:
|
Member state |
Details of price cap on EPC cost |
|
Slovenia |
€1.5 / m2 for residential buildings up to 220m2, €2 / m2 for residential buildings over 220 m2, and €1 – €4 /m2 for apartment buildings (between 5 and 51 dwellings) (BPIE, 2014). The total cost is also capped at €170 for one and two-dwelling buildings (Kranzl, 2020a). |
|
Hungary |
An EPC for apartments and single-family homes is capped at €40 (+VAT) (Kranzl, 2020a; Jenei et al., 2020). There is no legally defined price for an EPC in non-residential or public buildings (Jenei et al., 2020). |
|
Denmark |
EPCs in 2024 are capped at €1,067 for a single family house. For larger buildings, the price for EPCs is subject to the market[20]. |
Greece and Croatia used to have price caps which have since been abolished (TU Wien, 2021). In Croatia, the price cap was introduced when there were few EPC assessors in the market which caused prices to increase. When more EPC assessors were accredited, the price cap was removed, and EPC prices are now effectively controlled by the market[21].
While the price caps imposed generally have a positive impact on building owners who face the costs of EPCs, the price caps are commonly criticised for being too low and having resulting impacts on the quality of the certificate produced. For example, in Hungary, there are concerns that the price cap is set unrealistically low which results in lower quality EPCs (Jenei et al., 2020). Similarly, in Croatia, it is thought that the low price cap resulted in the recommendations of energy efficiency measures included in the certificate being of poor quality (Sayfikar & Jenkins, 2024). In Demark, it is thought that competition within the market keeps EPC prices much lower than the price cap, as average prices for single family houses is reported to be around €66720,suggesting the price cap is not necessary here.
Member states which have not imposed price caps have been criticised for average EPC costs being too high. For example, in Bulgaria the average price of an EPC is estimated at €0.2–€1/m2, which is thought to be relatively high for the average EPC consumer in Bulgaria (Sayfikar & Jenkins, 2024). This, alongside low public awareness of EPCs, is thought to be a reason why only around 1% of residential buildings in Bulgaria have an EPC (BPIE, 2018). Appendix F shows a summary of estimated EPC costs across member states, however it is important to note that this data comes from a variety of sources with different publication dates. Some figures have also been subject to exchange rates from local currencies. As a result, price data between member states is not necessarily comparable.
Other measures to ensure affordability
Member states who have not imposed price caps have often not done so to reflect the true cost of an EPC calculation. The cost can vary greatly according to various factors, including the type and complexity of a building and the quality of existing data (TU Wien, 2021). For example, in Czechia the average cost of a standard EPC is thought to be between 3000 – 7000 CZK (€119 – €278). This is because many buildings in the country are old and do not have much existing documentation or data (Mečíccrová, 2021). These buildings require an on-site visit from a specialist assessor, which can increase the cost of an EPC to tens of thousands of CZK (Mečíccrová, 2021).
While no other member states actively control the price of their EPCs, some have introduced other methods of promoting affordability. For example, in Belgium (Wallonia) the EPC methodology is kept as efficient as possible to keep costs down (Fourez et al., 2020). In the Netherlands, the government imposed a system to minimise costs in which building owners first receive a temporary EPC, which is calculated using existing data on a property (e.g. building type, data of construction, insulation, and heating and energy systems). The building owner can then change or add information (alongside proof such as photographs), which is then approved by an assessor. The assessor then recalculates the EPC and uploads it to the national database (Kranzl, 2020a). This process is thought to minimise on-site visits and time spent by assessors, and minimise the final cost of an EPC.
Case studies
After we conducted our review of the approaches taken to operational governance of EPCs in the EU member states, we selected three countries of interest to the Scottish Government. These were countries with approaches which could have the potential to improve the current operational governance procedures in Scotland. The countries we selected were Belgium, Croatia and Ireland.
Full case studies are presented in Annexes B-D, however, an overview of the main findings from each case study is presented in Table 11 – Table 15.
|
Country |
Overview of governance model |
|
Belgium |
EPCs are governed by authorities at the regional level. This is the Flemish Energy and Climate Energy Agency (VEKA) in Flanders, the Department of Energy and Sustainable Buildings in Wallonia and The Brussels Environment Office in Brussels. |
|
Croatia |
The Ministry of Physical Planning, Construction and State Assets (MPGI) is responsible for the implementation of the EPBD including EPCs, the ICS and accrediting independent experts. The Ministry of Economy, Market Inspectorate is responsible for ensuring EPCs are correctly advertised during the sale or lease of a building. |
|
Ireland |
The EPBD Implementation in Ireland is coordinated by senior officials of the following bodies with sufficient authority to make decisions and allocate resources: Department of Environment, Climate and Communications, Department of Housing, Local Government and Heritage, and the Sustainable Energy Authority of Ireland (SEAI). The SEAI is responsible for administering the EPC scheme, which is called a Building Energy Rating (BER) scheme in Ireland. SEAI also govern the registration and performance of BER assessors. |
|
Country |
Affordability |
|
Belgium |
In Wallonia, EPC prices have been actively controlled by designing a short certification process to reduce costs. This reduced costs from €480 to €240 for single-family houses from the early stages of the scheme to 2020. In Flanders, the price of EPCs is regulated by the market. Prices range from €195 for a small apartment to €345 for a 5-bedroom house. No evidence was identified for Brussels. |
|
Croatia |
The price of EPCs was capped at €1.5 / m2, but this requirement was removed in 2014 and the price is now controlled by the market. The average price for an EPC is reported at around 200.00 EUR for an apartment and 380.00 EUR for a house. |
|
Ireland |
The price of a BER assessment is controlled by the market, meaning it can vary based on the supplier and size of a building. Prices are approximately €150 in apartments, while the cost for a standard house is between €200 and €300. Moreover, a levy of €30 is in place for the publication of a Domestic BER Certificate. |
|
Country |
Minimum qualifications, training and accreditation for EPC assessors |
|
Belgium |
|
|
Croatia |
Assessors must have both specific higher education qualifications and at least five years of work experience in the profession or two years of work experience in design and/or expert construction supervision. They must then complete a two-week course, followed by a written and practical examination. Every year, assessors must attend eight-hours of training to upgrade their skills. |
|
Ireland |
Assessors are required to either hold an NFQ level 6 certificate in a construction-related disciplines or equivalent (demonstrated by a combination of appropriate construction-related qualifications or relevant experience). Assessors must also complete an accredited Domestic BER Training Course and achieve a minimum of 70%. Continuous professional development is obligatory for all BER assessors. |
|
Country |
Auditing, verification and QA |
|
Belgium |
|
|
Croatia |
As of October 1, 2017, EPCs can only be issued using the Information System of Energy Certificates (lEC). All EPCs go through administrative checks when uploaded to the EPC database. A random sample undergo more detailed checks, as well as EPCs which have received a complaint. Detailed checks are performed on the contents and accuracy of the EPC report, the input data, and the recommended energy efficiency measures. Assessors are penalised when EPCs are found to be invalid. Penalties include warnings, re-issue of the EPC at their own cost, and having accreditation revoked. Monetary fines are possible but are rarely used in practice. |
|
Ireland |
Ireland conducts audits on both a targeted and random basis. Targeted audits are mostly desk-based reviews, but on-site audits are also conducted when certain risk factors are met. Training audits are also carried out for newly qualified assessors. The SEAI have implemented a penalty point system, whereby the level of penalty imposed on assessors depends on the severity of the assessor infraction. The nature of these penalties ranges from corrective training to the permanent suspension of the license. |
|
Country |
Enforcement |
|
Belgium |
|
|
Croatia |
If building owners fail to produce an EPC at the point of sale or rental, they can receive fines between 662 – 3,976 EUR. |
|
Ireland |
The solicitor managing the sale of the property is responsible for checking the presence of an EPC at the point of sale. Failure to present a BER certificate at the time of rental or sale can result in financial or judicial penalties, with fines ranging from €500 to €5,000. Criminal records and prison sentences are also a possibility. Compliance with the requirement is higher with property sales than with property rentals. |
Conclusions and options for Scotland
Our research has shown that a range of different approaches are applied in the EU member states to enable effective EPC governance. There is limited data available to evidence the effectiveness of the various approaches taken, making it difficult to determine the impact that each approach has on the overall quality of EPCs in each Member State.
To address this gap, we conducted interviews with EPC professionals in member states of interest to understand their opinions on the perceived effectiveness of the approaches they have adopted. We have established a list of potential options which could improve the operational governance of EPCs in Scotland based on evidence collected in the review of approaches taken in the EU member states, targeted interviews and case studies. The options are presented in Table 16.
|
Option |
Rationale | |
|
1 |
Include standardised training requirements for independent experts in the operational framework |
Many member states have standard requirements at a national level to ensure that independent experts have the necessary skills and training. As the Scottish Government currently delegates responsibility for training and certifying assessors to the AOs, there may be variations in the standards across the country. |
|
2 |
Develop standardised QA procedures for AOs in the operational framework |
QA procedures in Scotland are the responsibility of AOs, who are responsible for checking a representative sample of EPCs. However, many member states go beyond the random sampling approach to guarantee the quality of EPCs. A more stringent QA approach could be standardised in the Operating Framework to ensure higher quality EPCs across Scotland. For example, a digital system that screens EPC data or targeted audits based on certain risk factors. |
|
3 |
Establish requirements for stakeholders involved in the rental and sales processes to support enforcement of the requirement to present an EPC |
Enforcing the requirement to present an EPC at the point of sale/rental is difficult for the majority of member states. Those that are enforcing this successfully rely on notaries to check the presence of an EPC as part of the sales process. Although notaries are not generally involved in house sales in Scotland, considering different options for encouraging stakeholders to check the presence of an EPC at the point of sale could result in higher compliance rates in Scotland: for example, formalising the requirement for solicitors involved in sales processes to check whether EPC documents have been presented. For rentals, various options could be explored further to encourage stakeholders to check for compliance. |
Options have not been assessed for feasibility of implementation in Scotland, or for potential long-term impacts. There is an opportunity for additional research, if the Scottish Government wish to explore any of these options in further detail.
Each of these options are outlined below, with a series of sub-options which outline how each overarching option could be operationalised in practice. These options are not mutually exclusive and could be implemented in conjunction with each other.
Including standardised training requirements for independent experts in the operational framework
Sub-option 1a – Introduce standard education and qualification requirements into the operational framework
This could include requirements for higher education and/or relevant professional experience. However, the flexible approach adopted in Bulgaria, Denmark, Estonia and Ireland ensures that independent experts can access via multiple routes. In Scotland, this could mean that experts must either:
- Hold a National Vocational Qualification (NVQ) Level 3 or other similar (as required in England and Wales) or,
- Demonstrate they hold an equivalent level of experience, which could be in the form of another qualification alongside proof of significant industry experience.
Requirements could also be tailored by assessor type. For example, higher education is only required for EPC assessors who conduct EPCs for new buildings in Belgium (Flanders).
Although AOs in Scotland may be using similar pre-requisites for independent experts, these are not standardised and may vary by AO. Ensuring that requirements are clearly defined in the operational framework will reduce ambiguity in requirements and ensure standardisation across the country.
Sub-option 1b – Approve a standardised mandatory training programme for independent experts
This can be delivered by AOs, but the content should be regularly updated and approved by the Scottish Government to ensure independent experts have skills which are aligned with the most recent developments in the sector.
This could be combined with an examination and, on passing, certification proving the independent expert has attended and taken on board the content of the training modules.
Sub-option 1c – Introduce requirements to attend mandatory annual re-training
In addition to a Scottish Government-approved training module for assessors, the Scottish Government could approve an annual retraining course for assessors. Mandatory retraining for assessors to keep their license would ensure assessors are up to date with the latest developments in the field and present an opportunity to learn from and correct mistakes. The approach taken in Belgium (Flanders) could be adopted, where retraining includes both mandatory modules (which cover common errors or new developments in the field) and optional modules, tailored to the assessor type and/or any infractions identified for that assessor in the previous year.
Develop standardised QA procedures for AOs in the operational framework
Sub-option 2a – Develop a digital QA system and screening of EPC input data
To streamline current QA procedures, a central digital system could be developed that screens and sense-checks EPC input data for errors. For example, when an independent expert conducts an assessment, they can input data into a digital system which will flag when they have input data which falls outside an expected range. An example of this approach is the digital ‘control web’ in Belgium (Wallonia), which screens all submitted EPCs to flag inconsistent values or data.
Sub-option 2b – Establish a ‘Helpdesk’ function to receive complaints about EPCs
Some member states, including Croatia and Belgium (Flanders) operate a helpdesk function, which customers can use to submit complaints or report suspected non-compliance. This could be introduced in Scotland and co-ordinated by central government at a national level, with complaints being redirected to the relevant AO for further investigation.
Sub-option 2c – Targeted audits of EPCs based on specific risk factors
In addition to the minimum random sampling required by the EPBD, best practice among member states is to combine this sampling with more targeted audits in a two-tiered QA approach. The approach taken in Ireland and Belgium (Flanders) is that certain risk factors, such as assessors issuing a large number of EPCs, or a complaint from a customer, trigger a targeted audit. These can be desk-based or on-site, but the Operating Framework could clearly outline what risk factors trigger a particular follow-up audit.
Sub-option 2d – Outline a clear penalty system for assessor infractions
A penalty points system, which clearly outlines what infractions result in what penalties, could be outlined in the operational framework to ensure that all assessors and AOs are clear about the penalties which will be issued in identified cases of non-compliance. Linking infractions to points and setting a maximum number of points would result in the suspension of their accreditation.
Penalties for assessors should be developed alongside a standardised and regular training schedule. Working with assessors, by providing regular and up-to-date training opportunities, gives them the opportunity to refresh their training. It also allows repeat issues to be targeted in dedicated training sessions and would ensure assessors remain engaged and interested in the process.
Engage wider stakeholders in the rental/sales process to support enforcement of the requirement to present an EPC
Sub-option 3a – Formalising the requirement for solicitors to check EPC documentation at the point of sale
The European Commission’s 2015 compliance study reported that member states generally struggle to enforce the requirement to make EPCs available at the point of sale or rent and data availability on compliance rates is often low. member states that are enforcing this in a robust manner rely on notaries to conduct checks during the sale transaction (European Commission, 2015).
Solicitors are responsible for checking documentation during a property sale in Scotland. Formalising the requirement to check the presence of an EPC at the point of sale as part of a legal checklist could result in greater enforcement of this requirement in Scotland.
Sub-option 3b – Requirements for stakeholders in the rental market to check EPC documentation
Rental agreements often do not involve a legal professional in the process, so they cannot be targeted in the same way as sales (European Commission, 2015). Hungary was the only country we identified that required a legal professional to sign-off on all rental agreements. Generally, this means that the systems in place to enforce these requirements are less developed in the rental sector, resulting in lower compliance or limited data availability on compliance rates.
Various options could be explored as to how this requirement could be enforced in the rental market. These could include:
- Requiring that a legal professional signs off on all rental agreements in Scotland
- Formalising the requirement to present an EPC when registering on the Scottish Landlord Register
- Introducing compliance measures for estate agents, such as legal obligations or linking compliance to incentives such as green financing
- Encouraging estate agents to use the Helpdesk function to report instances of non-compliance
References
Alembic Research, Energy Action Scotland and Dr Patrick Waterfield (2019) A review of domestic and non-domestic energy performance certificates in Scotland. Available at: A Review of Domestic and Non-Domestic Energy Performance Certificates in Scotland: Research report for the Scottish Government, Heat, Energy Efficiency and Consumers Unit – Final Report (www.gov.scot)
Arbeiterkammer Oberösterreich (2024). Energy certificate. Available at: https://ooe.arbeiterkammer.at/beratung/wohnen/mieten/Energieausweis.html#:~:text=Fehlt%20ein%20g%C3%BCltiger%20Energieausweis%2C%20muss,Geb%C3%A4udes%20entsprechende%20Gesamtenergieeffizienz%20als%20vereinbart.
Arroyo, C. (2024). How much does an energy efficiency certificate cost? cronoShare. Available at: https://www.cronoshare.com/cuanto-cuesta/certificado-eficiencia-energetica
Azzolini et al. (2020). Implementation of the EPBD Italy status in 2020. Energy and Sustainable Economic Development (ENEA) and Italian Thermo-technical Committee (CTI). Available at: https://epbd-ca.eu/wp-content/uploads/2022/03/Implementation-of-the-EPBD-in-Italy-2020.pdf
Bekierski et al. (2020). Implementation of the EPBD Poland status in 2016. Available at: https://epbd-ca.eu/ca-outcomes/outcomes-2015-2018/book-2018/countries/poland
Berard (2023). So, what is it and how does it affect you? Available at: https://blog.se.com/homes/2023/09/21/navigating-the-changing-property-scene-in-france-a-quick-guide-for-renters-and-property-owners/#:~:text=The%20DPE%2FEPC%20is%20payable,is%20valid%20for%20ten%20years.
Borragán, G. and Legon, C. (2021). Guidelines on how national Energy Performance Certificates (EPCs) schemes and the Smart Readiness Indicator (SRI) could be linked. ePANACEA. Available at: https://www.construction21.org/articles/h/epanacea-how-can-national-epc-schemes-be-linked-with-the-smart-readiness-indicator.html
BPIE (2014). Energy performance certificates across the EU. Available at: https://www.bpie.eu/publication/energy-performance-certificates-across-the-eu/#:~:text=This%20report%20explores%20the%20national,of%20the%20European%20building%20stock.
BPIE (2018). Factsheet: Bulgaria current use of EPCs and potential links to iBRoad. Available at: http://bpie.eu/wp-content/uploads/2018/01/iBROAD_CountryFactsheet_BULGARIA-2018.pdf
BRE (n.d.). Fee Factsheet. Available at: https://www.bre.co.uk/filelibrary/Scotland/Fees_Sheet_7_April__update_(2).pdf
Centre for Renewable Energy Sources and Saving [CRES] (2020). Implementation of the EPBD Greece status in 2020. Available at: https://www.ca-epbd.eu/Media/638373599786588364/Implementation-of-the-EPBD-in-Greece-2020.pdf
Certienergie (n.d.b). Prices of Energy Performance Certificates. Available at: https://www.certinergie.be/en/energy-performance-certificate/epc-prices/
Citizens Information (2024). Getting a building energy rating for your home. Available at: https://www.citizensinformation.ie/en/housing/owning-a-home/home-owners/getting-a-building-energy-rating-for-your-home/#:~:text=The%20price%20of%20a%20BER,on%20which%20one%20to%20choose
Degiorgio and Barbara (2016). Implementation of the EPBD Malta. Building Regulation Office. Available at: https://epbd-ca.eu/ca-outcomes/outcomes-2015-2018/book-2018/countries/malta
Delorme and Higley (2020) Implemetation of the EPBD in the United Kingdom – England. Status in 2020. AECOM and Ministry of Housing, Communities and Local Government. Available at: https://www.ca-epbd.eu/Media/638373595508144645/Implementation-of-the-EPBD-in-the-United-Kingdom–England-2020.pdf
Delorme and Hughes (2016). EPBD implementation in the United Kingdom – Scotland. Status in December 2016. AECOM and Local Government and Communities Directorate. Available at: https://epbd-ca.eu/wp-content/uploads/2019/05/CA-EPBD-IV-UK-Scotland-2018.pdf
Deslot et al. (2020). Implementation of the EPBD France status in 2020. General Directorate for Urban Development, Housing and Nature, General Directorate for Energy and Climate (DGEC). Available at: https://epbd-ca.eu/wp-content/uploads/2022/10/Implementation-of-the-EPBD-in-France-%E2%80%93-Status-in-2020.pdf
Encius (2016). EPBD implementation in Lithuania. Status in December 2016. Certification Centre of Building Products (SPSC). Available at: https://epbd-ca.eu/wp-content/uploads/2019/04/CA-EPBD-IV-Lithuania-2018.pdf
Energistyrelsen, Aalborg University & Danish Housing and Planning Authority (2020). Implementation of the EPBD Denmark Status in 2020. Available at: https://epbd-ca.eu/wp-content/uploads/2021/07/Implementation-of-the-EPBD-in-Denmark-%E2%80%93-2020.pdf
European Commission (2021a). Directive 2010/31/EU of the European Parliament and of the Council of 19 May 2010 on the energy performance of buildings. Available at: https://eur-lex.europa.eu/legal-content/EN/TXT/?uri=CELEX%3A02010L0031-20210101
European Commission (2015). Energy Performance of Buildings Directive (EPBD) compliance study. Available at: https://op.europa.eu/en/publication-detail/-/publication/00e943a2-aa0a-11e5-b528-01aa75ed71a1/language-en/format-PDF/source-317980685
European Union (2024). Directive (EU) 2024/1275 of the European Parliament and of the Council of 24 April 2024 on the energy performance of buildings (recast). Official Journal of the European Union. Available at: https://eur-lex.europa.eu/legal-content/EN/TXT/?uri=OJ:L_202401275&pk_keyword=Energy&pk_content=Directive
Federal Agency for Energy Efficiency [BfEE] (2020). Implementation of the EPBD Germany status in 2020. Available at: https://epbd-ca.eu/wp-content/uploads/2022/10/Implementation-of-the-EPBD-in-Germany-2020.pdf
Fourez et al. (2020). Implementation of the EPBD Belgium – Walloon Region Status in 2022. Available at: https://epbd-ca.eu/wp-content/uploads/2022/10/Implementation-of-the-EPBD-in-Belgium-2020-%E2%80%93-Walloon-Region.pdf
Fragoso and Baptista (2016). EPBD Implementation in Portugal. Status in December 2016. Available at: https://epbd-ca.eu/wp-content/uploads/2018/08/CA-EPBD-IV-Portugal-2018.pdf
Hang.ee (2022). Energy label and energy efficient house. Available at: https://www.hange.ee/blogi/energiamargis-ja-energiatohus-maja/
Hjorth et al. (2021). Implementation of the EPBD Sweden status in 2021. Available at: https://epbd-ca.eu/wp-content/uploads/2022/10/Implementation-of-the-EPBD-in-Sweden.pdf
Jenei et al. (2020). Implementation of the EPBD Hungary status in 2020. Available at: https://epbd-ca.eu/wp-content/uploads/2022/10/Implementation-of-the-EPBD-in-Hungary-2020.pdf
Kranzl, L. (2020a). Energy Performance Certificates, assessing their status and potential. Available at: https://x-tendo.eu/wp-content/uploads/2020/05/X-TENDO-REPORT_FINAL_pages.pdf
Loncour, X. and Heijmans, N. (2018). Certification, Control system and Quality – 2018. Concerted Action Energy Performance of Buildings. Available at: https://www.ca-epbd.eu/Media/638373594206410585/CA-EPBD-CT3-Certification_Control-system_Quality-2018.pdf
Marđetko-Škoro, N. (2015). Implementation of the EPBD in Croatia – Status December 2014. In 2016 Implementing the Energy Performance of Buildings Directive (EPBD) – Featuring country reports. ADENE. https://www.epbd-ca.eu/outcomes/2011-2015/CA3-2016-National-CROATIA-web.pdf
Mečíccrová, L. (2021). How much does a certificate of energy performance of buildings cost and when do you need it? Finance.cz. Available at: https://www.finance.cz/538646-energeticke-stitky-budov-platnost-cena-pokuta/#:~:text=Vydat%20platn%C3%BD%20pr%C5%AFkaz%20energetick%C3%A9%20n%C3%A1ro%C4%8Dnosti,3%20a%C5%BE%207%20tis%C3%ADc%20korun.
Ministry of Construction and Physical Planning [MCPP] (2020). Implementation of the EPBD Croatia, Status in 2020. Available at: http://bpes.ypeka.gr/?page_id=21
Ministry of Economic Affairs and Communications, Tallinn University of Technology & Estonian Consumer Protection and Technical Regulatory Authority (2020). Implementation of the EPBD Estonia Status in 2020. Available at: https://epbd-ca.eu/wp-content/uploads/2022/10/Implementation-of-the-EPBD-in-Estonia.pdf
Ministry of Energy, Commerce and Industry [MECI] (2020). Implementation of the EPBD Cyprus status in 2020. Available at: https://epbd-ca.eu/wp-content/uploads/2022/03/Implementation-of-the-EPBD-in-Cyprus.pdf
Ministry of the Environment of Finland & Motiva Oy (2020). Implementation of the EPBD Finland status in 2020. Available at: https://epbd-ca.eu/wp-content/uploads/2021/07/Implementation-of-the-EPBD-in-Finland-%E2%80%93-2020.pdf
Motiva (2024). What does the energy certificate cost? Available at: https://www.motiva.fi/ratkaisut/energiatodistusneuvonta/mika_on_energiatodistus/mita_energiatodistus_maksaa
Netherlands Enterprise Agency (2021). Price survey and international comparison of the NTA 8800 Energy Performance Certificate. Available at: https://www.rvo.nl/sites/default/files/2022/02/price-survey-and-international-comparison-of-the-nta-8800-energy-perfermance-certificate-summary.pdf
Österreichisches Institut für Bautechnik [OIB] (2020). Implementation of EPBD in Austria, status in 2020. Available at: https://www.ca-epbd.eu/Media/638373591769297881/Implementation-of-the-EPBD-in-Austria–2020.pdf
Olschner, S (2024). Energy certificate for the house: when it is mandatory and what it costs. Available at: https://www.adac.de/rund-ums-haus/energie/spartipps/energieausweis/
RTL Today (2014). Understanding the energy passport. Available at: https://today.rtl.lu/life/real-estate/a/1240940.html
Sayfikar, M. & Jenkins, D. (2024). Cross-country comparison of format and nature of recommended improvements in different EPCs. Available at: https://www.crosscert.eu/fileadmin/user_upload/crossCert_D3.4_Cross-country_comparison_recommended_improvements_EPCs.pdf
Schoenherr (n.d.). Slovenia: Energy Performance Certificate (EPC) – Additional Burden on Real Properties’ Owners or Welcomed Measure? Available at: https://www.schoenherr.rs/uploads/tx_news/schoenherr_Slovenia_Energy_Performance_Certificate__EPC_.pdf
Scottish Government (2012). Energy Performance Certificate approved organisations: operational framework. Available at: https://www.gov.scot/publications/energy-performance-certificate-approved-organisations-operational-framework/
Scottish Government (2017). Consultation on funding of the Scottish Energy Performance Certificate Register. Available at: https://www.gov.scot/binaries/content/documents/govscot/publications/consultation-paper/2017/05/consultation-funding-scottish-energy-performance-certificate-register-consultation-funding-scottish/documents/00517537-pdf/00517537-pdf/govscot%3Adocument/?inline=true
SEAI (2016). Quality Assurance System and Disciplinary Procedures (QADP) for Building Energy Rating (BER) and Display Energy Certificates (DEC). Available at: https://www.seai.ie/publications/Quality-Assurance-System-and-Disciplinary-Procedure-New.pdf
SEAI (2017a). Training courses – Step 2: Complete the BER training course. Available at: https://www.seai.ie/register-with-seai/ber-assessor/training-courses/
SEAI (2017b). About us. Available at: https://www.seai.ie/about/
Slovak Trade Inspection (n.d.). Slovak Trade Inspection. Available at: https://www.soi.sk/en/SOI.soi
StanGRAD (n.d.). Energy certification of real estate in Croatia. Available at https://nekretnine-stangrad.hr/about-us/topics/constructing-real-estates-for-sale/energy-certification-of-real-estate-in-croatia
Sustainable Energy Development Agency [SEDA] (2020). Implementation of the EPBD Bulgaria status in 2020. Available at: https://epbd-ca.eu/wp-content/uploads/2022/10/Implementation-of-the-EPBD-in-Bulgaria-2020.pdf
TU Wien (2021). Description of current Energy Performance Certificates (EPCs) related policy framework in implementing countries. Available at: https://epanacea.eu/?smd_process_download=1&download_id=2670
Worré et al. (2020). Implementation of EPBD in Luxembourg, status in 2020. Ministry of Energy and Spatial Planning. Available at: https://epbd-ca.eu/wp-content/uploads/2022/10/Implementation-of-the-EPBD-in-Luxembourg-%E2%80%93-Status-in-2020.pdf
Appendix A Methodology
Literature review
Identifying and logging sources
We conducted a literature review using key search terms and Boolean operators where relevant, to maximise the search outputs and refine results. We used key search terms including: ‘Energy efficiency in buildings’, ‘EPC’, ‘Implementation’, ‘[Name of Member State], in combination with each of the following terms ‘Legislation’, ‘Governance’, ‘Independent Control System’, ‘Assessors’, ‘Accreditation’, ‘Audit’, ‘Verification’, ‘Assurance’, ‘Enforcement body’, ‘Enforcement mechanism’, ‘Affordability’.
We conducted searches in English and in the official language of the MS in question, using machine translation software DeepL. We used Google and Google Scholar to conduct searches.
Data extraction into summary database
When we identified relevant data sources, we reviewed them in full and extracted relevant information into a summary database (Annex A). The summary database was structured with a row for each MS and Scotland (28 total) and columns representing an area of interest for the research. These included:
- Key data sources used for the country in question.
- Governance model.
- Qualifications and training for EPC assessors.
- Auditing, verification and QA of EPCs.
- Enforcement of EPC requirements.
- How affordability of EPCs is ensured.
Case studies
Based on the outputs of the literature review, we selected three case studies of interest, which adopted different approaches to that currently taken in Scotland for the operational governance of EPCs. These were jointly selected with the Scottish Government. The three final case studies selected were:
- Belgium
- Croatia
- Ireland
We first drafted each case study from the outputs of the literature review, and the enhanced them with targeted consultation with experts from the MS in question.
Targeted interviews
We held eight interviews with key stakeholders to supplement this research, as well as an additional interview with a Scottish Government representative to better understand the operational governance. These consisted of:
- Two interviews with overarching EU-level EPC experts.
- One email-based interview with a Danish EPC expert.
- Two interviews with Irish EPC experts.
- One interview with a Belgian EPC expert from Belgium (Flanders), and one email-based interview with an expert from the Walloon region (representatives from Brussels were contacted, but either did not respond or were unavailable to participate in this research).
- One interview with a Croatian EPC expert (additional interviewees from Croatia were contacted, but either did not respond or were unavailable to participate in this research).
- One interview with a Scottish EPC expert.
In most cases, the country-level EPC experts worked on EPC regimes within national governments.
Case study limitations
We conducted this research on a relatively short timescale (between April and July 2024). The collected data was used to derive policy options for improving the operational governance of EPCs in Scotland. A detailed assessment of the long-term impacts of these policy options, including analysis of uncertainties associated with future scenarios and feasibility constraints, was not within scope of this project.
Appendix B Summary database
Submitted as a separate Excel document
Appendix C Case study – Belgium
Submitted as a separate standalone document
Appendix D Case study – Croatia
Submitted as a separate standalone document
Appendix E Case study – Ireland
Submitted as a separate standalone document
Appendix F Table of estimated EPC costs in member states
|
Member state |
Estimate EPC cost |
|
Austria |
Average of €400 (Netherlands Enterprise Agency, 2021) |
|
Belgium (Brussels) |
Gap |
|
Belgium (Flanders) |
Prices range from €195 for a small apartment to €345 for a 5-bedroom house (Certinergie, n.d.b). |
|
Belgium (Wallonia) |
Single family house average of €480 Apartment average €165 (Fourez et al, 2020) |
|
Bulgaria |
€0.2 – €1 per m2 (BPIE, 2014) |
|
Cyprus |
Gap |
|
Czechia |
3000-7000 crowns, tens of thousands of crowns if an energy specialist is required to visit (Mečíccrová, 2021) |
|
Germany |
Single family home average of less than €100 If an on-site inspection is required, this is €300 – €500 (Olschner, 2024) |
|
Denmark |
EPCs in 2024 are capped at €1,067 for a single family house. However, competition makes the price lower – currently around €667. For larger buildings the price for EPCs is subject to a free market. For larger buildings the price for EPCs is subject to a free market[22]. |
|
Estonia |
Average for existing house of €100 – €300 (Hang.ee, 2022) |
|
Spain |
Average price of €60 – €130 for a 50-100m2 building (Arroyo, 2024) |
|
Finland |
Small houses average of €300 – 400 (existing) and €200 – €300 (new) Terraced houses and apartments average of €510 (existing) and €450 (new) (Motiva, 2024) |
|
France |
Average of €100 – €250 (Berard, 2023) |
|
Greece |
Gap |
|
Croatia |
Capped at €1.5 / m2 (BPIE, 2014) |
|
Hungary |
Price is regulated for apartments and single family homes at €40 + VAT (Jenei et al, 2020; Kranzl, 2020a) |
|
Ireland |
Apartments average of €150 Standard house average of €200 – €300 (Citizens Information, 2024) |
|
Italy |
Average of €150 |
|
Lithuania |
Between €100 – €500 (Encius, 2016) |
|
Luxembourg |
Between €500 – €1000 (RTL Today, 2014) |
|
Latvia |
Gap |
|
Malta |
Gap |
|
The Netherlands |
Average of €255 (Netherlands Enterprise Agency, 2021) |
|
Poland |
Between €40 – €1300 (Bekierski et al., 2016) |
|
Portugal |
Average of €200 (Netherlands Enterprise Agency, 2021) |
|
Romania |
Gap |
|
Sweden |
Average for a single family house of €500 (BPIE, 2014) |
|
Slovenia |
Price is regulated at €1.5 / m2 for residential buildings up to 220m2 and €2 / m2 for over 220 m2, and €1 – €4 / m2 for apartment buildings (depending on number of dwellings) (BPIE, 2014) There’s also a cap of €170 for one-dwelling and two-dwelling buildings (Kranzl, 2020a) |
|
Slovakia |
Average of an apartment (60m2) of €200 Average of a single family house (220m2) of €250 Average of small apartment building of €1000 (Schoenherr, n.d.) |
© The University of Edinburgh, 2024
Prepared by Technopolis Ltd on behalf of ClimateXChange, The University of Edinburgh. All rights reserved.
While every effort is made to ensure the information in this report is accurate, no legal responsibility is accepted for any errors, omissions or misleading statements. The views expressed represent those of the author(s), and do not necessarily represent those of the host institutions or funders.
In most cases, the EPC experts consulted work on EPC regimes within national governments. ↑
The UK devolved governments follow the approach agreed in the UK when the EPBD was transposed into domestic regulation in 2008, when the UK was an EU Member State. ↑
The literature review did not identify pre-requisite requirements for Spain, Latvia and Slovakia ↑
The literature review did not identify training requirements for Czechia, Spain, Latvia and Slovakia. ↑
Although Accreditation Schemes can ensure that energy assessors hold the right skills by requiring them to attend a training course and to sit an examination, it appears that assessors can also demonstrate suitable qualifications and experience in place of sitting this exam, so it may not be mandatory in all cases. ↑
The literature review did not identify re-certification requirements for Cyprus, Spain, Greece, Hungary, Italy, Latvia, Malta, The Netherlands, Poland, Sweden, Slovakia and Scotland ↑
We did not identify approaches to QA of EPCs for Slovenia. Italy has adopted a region approach to QA and Slovakia has adopted random sampling, but we did not identify a sampling approach. ↑
Information obtained during an interview with an EPC expert ↑
Information obtained during an interview with an EPC expert ↑
Information obtained during stakeholder consultation with a Danish EPC expert ↑
Information obtained during stakeholder consultation with a German EPC expert ↑
Information obtained during stakeholder consultation with a Maltese EPC expert ↑
Information obtained during stakeholder consultation with a Portuguese EPC expert ↑
Information obtained during stakeholder engagement with an Irish EPC expert ↑
Information obtained during stakeholder consultation with a Portuguese EPC expert ↑
Information obtained during stakeholder consultation with a Danish EPC expert ↑
Information obtained during stakeholder consultation with an EPC expert in England and Wales ↑
Information obtained during stakeholder consultation with a Maltese EPC expert ↑
Information obtained during an interview with an EPC expert in Denmark ↑
Information obtained during an interview with EPC experts from Croatia ↑
Information obtained during interview with Danish EPC Expert ↑
Research completed: October 2023
DOI: http://dx.doi.org/10.7488/era/3991
Executive summary
This project was commissioned to inform the Scottish Government on the evidence and arguments for and against the inclusion of metered energy consumption data in Energy Performance Certificates (EPCs). Methods included a literature review and interviews with stakeholders in Scotland, the UK and Sweden.
We outline the potential opportunities for and barriers to using energy consumption data; the practicalities of obtaining and using energy consumption data; and the value of including such data, when considering the variables that affect actual energy usage.
Key findings
Metered energy consumption data could be used in EPCs in two ways to provide information to occupants or potential occupants:
- to provide more accurate information on building fabric performance, known as an asset rating
- to give a rating of how energy is used in a building when compared with similar buildings, known as an operational rating.
These two uses of metered consumption data – asset rating and operational rating – are not mutually exclusive and could both be included in EPCs. This could be developed as a dynamic, digital EPC.
Neither of these two uses could be implemented immediately as 57% of homes in Scotland do not yet have smart meters, which are the most reliable means of collecting metered energy consumption data. Particular difficulties include:
- A small proportion of homes will never have smart meter capability, including homes with unregulated heating fuels such as oil, LPG, or solid fuels.
- There is no process to access smart meter data to generate EPCs. The Smart Meter Energy Data Repository Programme is investigating the commercial feasibility of a repository that would enable this.
The most straightforward use for metered energy consumption data is to include the operational rating value on an EPC alongside a reference figure, such as a national average, modelled archetype, or historic consumption data for a property.
- Correcting energy consumption in a property for weather and normalising it by floor area would enable potential occupants to compare properties.
- An operational rating could be included as a part of the EPC or exist as a separate document.
EPCs should retain an asset rating that is based on standard assumptions of occupancy and use, to allow comparison between properties. This could be based on modelled or measured data.
For an accurate asset rating, metered energy consumption data can be used to calculate the heat transfer coefficient of buildings. This requires collecting internal temperature data, as well as metered energy consumption data. The latest smart meter in-home display units have inbuilt temperature sensors. The possibility of transmitting temperature readings alongside meter readings is being investigated by the Data Communications Company.
Accurate heat transfer coefficient figures can inform retrofit decisions. Further consideration is needed around the level of retrofit recommendations provided by EPCs and how these are used in policy decisions. Using metered energy consumption data to inform retrofit recommendations may be more suited to detailed retrofit plans such as renovation roadmaps.
Consumer consent will be needed to collect and process metered energy consumption data.
Recommendations
This report explores whether it is possible for metered energy consumption data to be used within EPCs and outlines two ways in which this data could be useful. In order to progress with either or both of these options, we recommend that the Scottish Government define the purpose and intended outcome of using metered energy consumption data within EPCs.
Our research has highlighted that further work is needed in this area to explore:
- The practicalities of collecting required data, including:
- Metered energy consumption data at the individual building level, rather than from aggregated datasets. This will require a standardised process for collecting consumer consent. Public sector bodies can obtain household-level data without the need for individual consent through the legal basis of ‘public task’. However, this is for aggregated data and there are no examples of data being used to provide insights into individual households, so further investigation is needed into the legal basis for this. Legal routes for this were not explored as part of this research.
- Processes for data collection, as these are mostly dependent on the rollout of smart meters. An alternative methodology will need to be developed for households using unregulated fuels, as their heating consumption will not be captured in smart meter data.
- Additional information from occupants, which can be used to contextualise energy consumption data when used for an operational rating. Examples of this kind of data include the number of occupants or typical heating regime. Further work is required to understand the minimum amount of contextual information to enable metered energy consumption data to be useful.
- Internal temperature data for the purpose of calculating a heat transfer coefficient as part of an asset rating. This would require the mass rollout of internal temperature sensors, which are already included in some in-home display devices. Internal temperature data could also be useful contextual data for an operational rating.
- Different formats that could be used to display consumption data when used for an operational rating. This should consider whether consumption data would work best as one of multiple ratings within the EPC or separately.
- For energy-generating homes, how total energy consumption, generation, export and cost can be displayed in a straight-forward manner.
- Any regulatory or practical barriers to inputting the heat transfer coefficient as a measured value in Standard Assessment Procedure calculations for the asset rating.
- The value of Display Energy Certificates for non-domestic public buildings in England and Wales, and whether there would be value in expanding their use in Scotland.
Glossary / Abbreviations table
|
Term |
Definition |
|
Asset rating |
A measure of building fabric performance. It provides no information about how the building is used in practice. |
|
BEIS |
Department for Business, Energy & Industrial Strategy. Split in 2023 to form three departments, including the Department for Energy Security and Net Zero (DESNZ). |
|
CCC |
Climate Change Committee. An independent, statutory body whose purpose is to advise the UK and devolved governments on emissions targets and then report to Parliament. |
|
DCC |
Data Communications Company. A licenced monopoly regulated by Ofgem. Responsible for linking smart meters in homes and businesses with energy suppliers, network operators and energy service companies. |
|
DEC |
Display Energy Certificate. Shows the energy performance of a building based on the operation rating, on a graphical scale from A (very efficient) to G (least efficient). Measures the actual energy usage of a building based on annual consumption. |
|
DESNZ |
Department for Energy Security and Net Zero. The UK Government department responsible for securing long-term energy supply, reducing bills, and encouraging greater energy efficiency. |
|
DNO |
Distribution Network Operator. A company licensed to distribute electricity in the UK. |
|
DOR |
Domestic Operational Rating. A proposed operational rating scheme for domestic properties that quantifies the actual, in-use energy demand, greenhouse gas emissions and energy costs of homes. |
|
EER |
Energy Efficiency Rating. A review of a property’s energy efficiency which is then scored. The energy efficiency charts are divided into rating bands ranging from A+ to G, where A+ is very efficient and G is least efficient. |
|
EPBD |
Energy Performance of Building Directive. The key policy instrument to increase the energy performance of buildings across the European Union. Originally introduced in 2002, it was recast in 2010 and revised in 2018 and 2021. |
|
EPC |
Energy Performance Certificate. A document that provides information about the energy efficiency of a building. Used in many countries including Scotland. |
|
FIT |
Feed-in-tariff. A support mechanism designed to pay small scale renewable energy generators for the electricity that is exported to the grid. |
|
GDPR |
General Data Protection Regulation. A regulation that enhances how people can access information about them and places limitations on what organisations can do with personal data. |
|
HDD |
Heating Degree Day. A measurement designed to quantify the demand for energy needed to heat a building. It is the number of degrees that a day’s average temperature is below a base temperature of 15.5°C. |
|
HTC |
Heat Transfer Coefficient. A common metric for the thermal performance of a building. It describes the rate of heat transfer between two areas. |
|
IEA |
International Energy Agency. An international body that provides policy recommendations, analysis and data on the global energy sector. |
|
IHD |
In-home display. A portable device with a screen showing energy usage and its associated cost. |
|
kWh |
Kilowatt hour. A measure of how much energy is used per hour. |
|
MEPI |
Measured Energy Performance Indicator. A method to determine the energy performance of a building based on measured energy use. |
|
MEP |
Measured Energy Performance. A tool that utilises accurate measurements of the HTC of a property, along with an RdSAP-style survey to produce a more accurate EPC rating for a property. |
|
MPG |
Miles per gallon. Used to describe how many miles a vehicle can travel for every gallon of fuel used. |
|
Operational rating |
Shows the actual energy usage of a building. |
|
Performance Gap |
The difference between predicted and actual performance of a building’s fabric. Also sometimes used to describe the difference between predicted energy usage and actual (metered) energy usage, therefore also including the impact of occupancy factors. |
|
PHPP |
Passive House Planning Package. Modelling software developed by the Passivhaus institute. Used when designing energy efficient buildings to calculate their operational energy use and carbon emissions. |
|
RdSAP |
Reduced Data Standard Assessment Procedure. A simplified version of SAP calculated using a set of assumptions about the dwelling based on conventions and requirements at the time it was constructed. |
|
Regulated energy |
The energy which is consumed by the building and its fixed utilities including space heating, cooling, hot water, ventilation, lighting. |
|
RHI |
Renewable Heat Incentive. A Government financial incentive to promote the use of renewable heat. |
|
SAP |
Standard Assessment Procedure. The method for calculating the energy performance of dwellings in the UK. Scores typically range from 1 to 100+, with higher scores indicating more efficient building stock. SAP is owned by the UK Government. Building Research Establishment (BRE) is responsible for the development of SAP. |
|
SBEM |
Standard Building Energy Model. Government approved methodology that calculates the energy required to heat, cool, ventilate and light a non-dwelling. |
|
SHCS |
Scottish House Condition Survey. A national survey designed to look at the physical condition of Scotland’s homes as well as the experience of householders. |
|
SMETER technologies |
Smart Meter Enabled Thermal Efficiency Ratings technologies that measure the thermal performance of homes using smart meters and other data. |
|
Unregulated energy |
The energy which is consumed by the building in the form of fixtures or appliances like refrigeration, TVs, computers, kettles, microwaves, hobs, and ovens. The usage of these appliances varies based on occupants’ choices and behaviours. |
|
US DoE |
United States Department of Energy. Department of the US federal government that oversees national energy policy and manages domestic energy production and conservation. |
|
ZDEH |
Zero Direct Emissions Heating systems are systems which produce zero direct emissions at the point of use. |
Introduction
This research has been commissioned in response to calls on the Scottish Government to make use of metered energy consumption data within Scottish EPCs. A common criticism of EPCs is that they do not provide useful information to householders about the actual energy consumption and real-life performance of properties. As a result, EPCs can be perceived as unreliable and unhelpful.
Increasing evidence shows that there are significant and consistent gaps between properties’ actual energy consumption and the consumption modelled in EPCs (BEIS, 2021; Few et al., 2023; The Times, 2023). EPCs were not designed to predict actual consumption (see Section 3). This raises the question of whether the methodology or format would benefit from including metered consumption data. The installation of smart meters in an increasing number of Scotland’s homes presents an opportunity to collect this data. In this report, we explore how such data could be incorporated into EPCs to potentially improve their usefulness and reliability.
The question of using energy consumption data is complex – there are many ways it could be included, and each has different implications. This report sets out two key uses for energy consumption data: to inform an asset rating; and to inform an operational rating.
EPC Overview and Research Scope
Energy Performance Certificates (EPCs)
An EPC is a document that provides information about the energy efficiency of a building. Their introduction was driven by the European Union’s Energy Performance of Buildings Directive (EPBD). Article 11 of the EPBD states the original purpose of EPCs was “to make it possible for owners or tenants of the building or building unit to compare and assess its energy performance” (Directive 2010/31/EU, 2010). Article 2 specifies that EPCs are intended to show “the energy demand associated with a typical use of the building” (ibid.). This makes it clear that the original purpose of EPCs was to enable the comparison of building performance under ‘typical’ conditions.
Annex I also states that the energy performance of buildings can be evaluated using either the calculated (producing an asset rating) or actual energy consumption (producing an operational rating) (Directive 2010/31/EU, 2010). Methods based on measured energy consumption must separate out building performance from other factors, primarily occupancy. The variability of these other factors can be controlled when using calculated methods. However, calculated methods are often associated with inaccuracy (Crawley et al., 2019; Hardy and Glew, 2019) and pose the problem that what is built can be different from what was designed or modelled (the performance gap).
In practice, most EPC methodologies use a calculated approach, incorporating real building data from surveys or physical tests (Arcipowska et al., 2014). In Scotland, as in the rest of the UK, EPCs are produced using SAP, RdSAP and SBEM methodologies. SAP (Standard Assessment Procedure) is used to generate EPCs for both new and existing residential buildings. Full SAP is primarily used for new dwellings whereas RdSAP (Reduced Data SAP) is used for existing dwellings. RdSAP uses the same calculation as full SAP but with a simplified data collection process. This enables the calculation to take place where a complete data set for a property is unavailable, and for a lower cost than full SAP.
Existing SAP methodologies used to calculate the domestic asset rating use standard assumptions for occupancy, energy-use, and climate to ensure that the thermal performance can be compared under the same set of conditions. This asset rating is not reflective of how the building is used, for example due to the specific energy requirements of the occupants or the local climate.
SBEM (Standard Building Energy Model) is used to produce EPCs for non-domestic buildings. SBEM utilises a different calculation methodology to SAP. For the generation of an EPC, the SBEM calculation utilises standardised information for several factors to allow comparability between similar building types. Like SAP, SBEM requires a certain amount of standardisation to enable comparability between buildings for benchmarking purposes.
Research scope
This report considers whether metered energy consumption data can and should be used in the production of EPCs in Scotland. This brings with it questions around the suitability of EPCs for their various uses. However, the purpose of this report is not to assess whether EPCs (or SAP / RdSAP) are the most appropriate tool for the functions set out in Section 4. Additionally, this report does not detail the limitations of EPCs or SAP. There is an existing body of research which evidences these limitations, for example Jones Lang LaSalle (2012), Kelly et al. (2012), Jenkins et al. (2017), Hardy et al. (2019), and BEIS (2021).
The scope of this research is to consider whether it is possible to access and include metered energy consumption data on Scottish EPCs, and whether this would be a valuable addition. In some instances, we have suggested that the information provided by metered energy consumption data may be useful but would be better presented elsewhere and not as part of an EPC. The focus of the research is on domestic EPCs as tools for providing information to occupants, rather than EPCs as a policy tool or for benchmarking purposes.
The focus of this report is domestic EPCs. The use of metered energy consumption data for non-domestic EPCs is briefly explored in Section 10.
Functions of EPCs in Scotland
EPCs in Scotland are used for a range of purposes, including (but not limited to):
- Providing information to potential buyers and tenants on a building’s energy use, and estimated energy costs.
- Providing information to property owners on suggested retrofit measures.
- Serving as a policy tool to measure, regulate and set targets for the reduction of carbon emissions from housing.
- Facilitating housing stock analysis by landlords to plan and implement improvements.
- Supporting national housing stock analysis through the Scottish House Condition Survey (SHCS).
- Acting as a proxy indicator to support the identification of households in fuel poverty, for example for the targeting of fuel poverty prevention or alleviation services.
This report does not assess how well EPCs can perform each of these functions. The use of energy consumption data within EPCs will have implications for all of the above uses. Our research considers whether the use of energy consumption data could improve EPCs for the following specific purposes:
- Providing information on a building’s fabric performance.
- Providing an estimate of energy costs.
- Providing information on how buildings are actually used.
- Informing retrofit decisions.
The case for including energy consumption data
The arguments for using energy consumption data depend on the use-case of EPCs that is being considered. As outlined in Section 4, EPCs now serve a number of purposes for which they were not originally designed. This, along with issues such as inconsistencies between assessors, means that they are perceived as unreliable (Crawley et al., 2020; Kelly et al., 2012). A major driver for using energy consumption data is the premise that this will make EPCs more reliable for users, by reducing reliance on assumptions and assessor judgement.
Currently, EPCs can be of limited value to householders who may expect EPCs to provide information reflecting actual energy consumption. Similarly, for policy or housing stock management decisions, EPC asset ratings do not reflect the actual energy consumption of buildings. The need for policy decisions to be based on actual rather than modelled energy efficiency of buildings is also a key argument for the use of metered energy consumption data in EPCs (Baker & Mould, 2018; Lomas et al., 2019).
This report considers two key uses for energy consumption data in EPCs. It can be used to provide a more accurate asset rating or to provide an operational rating. An asset rating is a measure of building fabric performance and does not consider how a building is used. An operational rating based on energy consumption data can help understand how a building is used, which is not currently addressed by EPCs. This has the potential to provide information to householders on actual energy costs associated with a building, as well as supporting wider decarbonisation policy.
Reducing the performance gap
Improving the accuracy of EPCs through the use of energy consumption data is intended to reduce the performance gap. The performance gap refers to the difference between modelled energy performance (e.g. through SAP) and measured energy performance (Fitton et al., 2021). There are a significant number of variables which influence this gap. These include factors related to the building fabric, building use, and the accuracy of the model.
The term ‘performance gap’ usually refers to the discrepancy between designed and as-built fabric performance, particularly for new-builds. However, it is also used to refer to the difference between predicted energy usage and actual (metered) energy usage. When used in this way, the term is also incorporating the impact of occupancy factors.
Recent research found that even when other factors are accounted for (i.e. in households that meet EPC standard assumptions), EPCs overpredict energy use (Few et al., 2023). This suggests that the methodology and its underlying assumptions also contribute to the performance gap.
Improving the accuracy of asset ratings
Energy consumption data can provide a more accurate calculation of a building’s fabric performance. Utilising real-world data to calculate actual space heating demand could improve accuracy and therefore, increase consumer confidence in the reliability of the asset rating. A more accurate asset rating would enable more accurate predictions of annual energy cost. The cost metric would be predicted under standardised conditions, which would maintain the ability to make comparisons between buildings.
A programme of work by the International Energy Agency known as Annex 71 sought to test demand amongst industry stakeholders[1] for a method to calculate HTC. Their survey results indicated a high level of demand for this across several different use-cases including energy certification (Fitton et al., 2021).
Providing an operational rating
Currently EPCs are based on a building fabric model, and do not consider how energy is used by occupants. Asset ratings alone are not sufficient to reduce energy demand. This requires measuring and achieving reductions in actual energy consumption in buildings (Few et al., 2023; Jones Lang LaSalle, 2012; The Times, 2023).
The use of energy consumption data can provide tailored information for consumers regarding the potential energy costs to occupy a specific property, i.e., a measure of the operational performance of the property. Research has shown that the ability to compare energy use with that of similar dwellings is perceived as beneficial to householders (Zuhaib et al., 2021). In order for comparisons between dwellings to be useful, some contextual information is needed to account for occupancy factors which impact energy use (Section 6).
The ways in which this contextual information could be collected and used are discussed in Section 9. However, some stakeholders (Richard Fitton, Professor of Building Performance; Alan Beal, Bacra; Thomas Levefre, Managing Director, Etude) were wary of using energy consumption data in this way, as we will never be able to fully account for or control all the variables that affect how energy is used in the home.
A significant benefit of introducing an operational rating is to provide more accurate cost saving figures to improve the energy efficiency improvement recommendations. Actual consumption data could also enable a better assessment of the impact of retrofit measures and whether they perform as intended.
There is evidence that householders would find it useful to see actual energy costs on an EPC. There are number of ways this information could be contextualised or compared. A study of five European countries (Zuhaib et al., 2022) found that the majority of householders who responded to their survey would like to see the energy costs of the previous occupier included in EPCs, as well as the energy cost of ‘similar’ households[2]. However, the same study notes that energy consumption comparisons were was perceived as more useful when comparing against the previous year than with similar households. Year-on-year comparisons of energy use may be more appropriately provided by energy suppliers rather than on an EPC (see Section 7.2 for detail on dynamic EPCs).
Informing retrofit decisions
Another purpose of EPCs (as described in EBPD) is to provide improvement recommendations for householders. The Scottish Government’s latest consultation on EPCs states that EPCs are intended as a starting point for householders, but not to provide bespoke recommendations for retrofit (Scottish Government, 2023). However, the information currently provided to householders on an EPC could still be improved using energy consumption data, particularly in relation to predicted savings (Baker & Mould, 2018). Energy consumption data could be used to provide accurate predictions of savings from retrofit measures (Cozza et al., 2020).
Aside from informing individual householders, retrofit recommendations on EPCs and their associated predicted savings are also used to support the targeting of investment in retrofit. The scale of investment required for retrofit means that estimates of potential financial savings must be accurate. Laurent et al. (2013) argue that the economics of retrofit should not be evaluated using normative models. This is because all normative models (not just SAP) have been shown to overestimate potential savings and the cost effectiveness of retrofit measures. For these reasons, if the Scottish Government intends to continue to use EPC retrofit recommendations as a policy tool for directing funding, further investigation is needed into how energy consumption data could support this (Baker & Mould, 2018).
The use of energy consumption data in EPCs could better reflect the actual energy performance of building fabric (Section 8). This would provide a more realistic baseline asset rating on which to base recommended retrofit measures. However, the recommendations on an EPC would still be generated automatically by SAP based on general property characteristics. Metered energy consumption data could also play a role in measuring the impact of retrofit, as explained in Section 8.
Energy consumption data provides information on how a building is used. It can therefore be used to support the development of bespoke retrofit recommendations. However, such EPCs are not the tool for developing bespoke retrofit plans (Scottish Government, 2023). PAS 2035 or renovation roadmaps (Small-Warner & Sinclair, 2022) provide a more appropriate framework for this. This view was supported by interviewees (Kevin Gornall and Sam Mancey of DESNZ; Richard Atkins, Chartered Architect) who stated that retrofit plans should be delivered through the industry professionals and not through EPCs. An example of a tool being developed to support this is provided in Box. 1
Box 1: HTC-Up: Informing retrofit using metered energy consumption data
Chameleon Technology were recently awarded funding through the Green Home Finance Accelerator project from DESNZ to develop the HTC-Up project (Chameleon Technology, 2023). Using smart meter data alongside internal and external temperature data, a more accurate HTC figure can be generated which better reflects the actual thermal energy performance of a property. With this data, Chameleon Technology designs a programme for retrofit specific to the home. They direct householders to approved suppliers and installers, and also offer financing solutions if needed.
Validating models and assumptions
The Elmhurst Almanac (Elmhurst Energy, 2022) refers to the need to use the ‘Golden Triangle’ to inform decision-making. This refers to a building’s asset rating (predicted energy cost and consumption based on standard occupancy), occupancy rating (predicted energy consumption based on how the building is used), and actual energy consumption (smart meter data). In the Golden Triangle, smart meter data is used as a validation point for comparison with figures generated as part of the asset and occupancy ratings. This validation can help to identify issues with performance and where to focus improvements.
Metered consumption data could also be used to improve assumptions contained within SAP/RdSAP. For example, Hughes et al. (2016) showed that the difference between modelled and actual energy consumption could be reduced by using assumptions for internal temperature, number of heating hours, and the length of heating season, that are developed based on actual consumption data.
At a larger scale, metered energy consumption data could also be used to calibrate and improve the modelling used for EPCs (Thomson and Jenkins, 2023). Similar exercises have been undertaken to validate the PHPP model (Mitchell and Natarajan, 2020; Passipedia, n.d.). Using real energy consumption data for this purpose was explored as part of the X-tendo project (Zuhaib et al., 2021). The project findings suggest that real energy consumption data from large housing stock datasets can be used to improve models and for benchmarking performance levels. This particular use is not explored further in this report as it is out of scope. Our focus is on EPCs as a tool for providing information to building occupants.
Factors affecting metered energy consumption
Many variables impact on the energy use of a building. These can be broadly split into variables impacting the building fabric, system efficiency (e.g. heating) and those that impact how energy is used within the building. All of these are influenced by wider variables such as fluctuations in energy prices, deprivation levels, social and cultural norms, and changes in climatic conditions.
There is no consensus on the relative importance that can be attributed to either building characteristics or to consumption behaviour in terms of their impact on domestic energy consumption. The variables affecting household energy consumption are understudied (Fuerst et al., 2019) and strong conclusions about how to control or account for them cannot be drawn. Jones et al. (2015) found that 62 household level factors have been studied in the literature as potentially influencing domestic electricity use[3], with varying significance.
In terms of occupancy factors, the review suggests that the number of occupants, the presence of teenagers, and level of household income and disposable income all have a significant impact on electricity consumption. Electrical appliances make a very significant contribution to a household’s electricity consumption (ibid.), however the review noted that only a few previous studies have analysed the effects of the ownership, use and power demand of appliances. The review also indicates that the following building fabric characteristics have a significant effect: dwelling age, number of rooms, number of bedrooms, and total floor area.
Building fabric
When considering the physical building characteristics alone, there is little consensus on the significance of physical building characteristics, other than floor area, that impact energy consumption. Research consistently suggests a significant positive correlation between floor area and consumption (ibid.), mostly associated with demand for space heating.
There is little consensus on the impact of dwelling age. Some studies reviewed by Jones et al. (2015) found newer dwellings have a higher electricity demand, attributed to high consumption appliances such as air conditioning. Other studies observed that newer homes had lower consumption due to efficient appliances and better insulation levels. Several studies also concluded there was no relationship, including a UK study by Hamilton et al. (2013).
Built-form type (such as terraced, detached, semi-detached) has also been investigated and a large number of studies concluded that electrical energy consumption increases with the degree of detachment of a building. However, it is not clear whether this relationship is explained by the building fabric or by occupancy factors. In general, the literature suggests that the influence of built-form type on electricity consumption is related to floor area. However, building occupancy is also a possible reason. For example, Wyatt (2013) attributed lower electricity consumption in bungalows to the fact they are normally occupied by elderly residents with comparatively lower energy consumption than the rest of the population. The review by Jones et al. (2015) suggests that there is a relationship between the level of detachment of dwellings and electricity consumption, but the effect could not be determined as either positive or negative.
Occupancy factors
A regression analysis of household energy consumption in England concluded that gas usage was largely determined by occupancy characteristics such as income and household composition, rather than physical characteristics of the building (Fuerst et al., 2019). This contrasts with the findings from other regression model studies across several countries which report that building characteristics have a greater effect on domestic energy consumption than occupancy characteristics (such as Santin et al., 2009, Estiri, 2014, Huebner et al., 2015).
Fuel poverty is another factor which impacts energy consumption. Levels of fuel poverty in Scotland are geographically uneven across the country, and are higher in rural areas (Changeworks, 2023). Fuel poverty is associated with coping mechanisms such as only heating one room – behaviours which would have a significant impact on energy use. It is well-recognised that households in homes with poor energy efficiency tend to ration energy, known as the ‘prebound effect’ (Sunikka-Blank and Glavin, 2012).
Any use of energy consumption data will need to be attuned to, for example, the difference between energy rationing and energy saving behaviours, and avoid approaches that inadvertently ‘reward’ underheating through favourable EPC ratings. For example, it would be problematic if a household with higher-than-standard heating regimes, such as for health reasons, received a more negative EPC rating. This highlights the importance of collecting internal temperature data (to measure heating outcomes), alongside consumption data (Section 8.1.1).
Regulated and unregulated energy use
The question of how and whether to include consumption data on EPCs largely relates to the purpose of doing so. Not all energy use is relevant to all audiences. The SAP calculations used for EPCs only consider regulated energy use, which includes energy used for heating and cooling, domestic hot water, mechanical ventilation, and fixed lighting. The total energy consumption of a property includes other uses (unregulated energy), such as appliances. This is primarily dependent on the occupants. Although unregulated energy generally accounts for a minority of the total energy consumption in most properties, it is also more likely to fluctuate more often. Factors that can impact this could be an occupant starting to work from home, an occupant moving out, or purchasing a new electrical appliance (Jones et al., 2015).
A householder may be interested in understanding the efficiency of their appliances, but this is less relevant to a building technician working to improve the building fabric or heating system. However, industry experts have suggested that SAP 11 should consider both regulated and unregulated energy use (BEIS, 2021). In part, this is to enable EPCs to better support Net Zero, which requires a reduction in all energy use – not just regulated energy. Another reason is that unregulated energy use is becoming a larger proportion of total energy use as buildings become more energy efficient and use less energy for heating.
Disaggregating energy use
Metered energy consumption data will account for both regulated and unregulated energy, and unless submetering is used it will be difficult to disaggregate these without relying on assumptions. This disaggregation issue was highlighted in the European X-tendo project (Hummel et al., 2022), where four countries tested a methodology for including energy consumption data on EPCs. Three of the countries encountered challenges around determining the energy consumption used for different purposes in the buildings. Metered data for the different energy uses was not available, so the consumption data for space heating and hot water were estimated based on energy bills. This was perceived as complex, time consuming, and inexact (ibid.).
In properties with natural gas heating, disaggregation is not a significant issue, as most of the metered gas consumption can be assumed to be used for heating. However, it poses a challenge in the increasing number of properties with electric heating. There is a risk that relying on assumptions of typical use will replicate the issues that the inclusion of metered data is trying to solve. In Sweden, the disaggregation of energy uses is carried out by the energy assessor based on their competence and judgement. Considering the existing inconsistencies identified among assessors in the generation of UK EPCs (Jenkins et al., 2017), it is likely this approach would introduce further inaccuracies in EPC output.
Box 2: An example scenario of the need to disaggregate energy use
A property with electric heating has recently had internal wall insulation installed. The household is interested in using an energy consumption metric to understand whether the wall insulation has resulted in the expected decrease in energy consumption. However, the same month they also bought an electric vehicle which they charge at home. Without disaggregating their electricity usage, they are unable to tell if their wall insulation is performing as predicted.
The use of sub-metering could help to alleviate these challenges. Chartered Architect Richard Atkins suggested that, in the future, smart meters will be fed into from a series of data points within the home (e.g., heating system, renewable generation assets, storage assets). However, Alan Beal of Bacra indicated that this granularity of metering is unlikely to be available for at least 10 years, and as noted in Section 8.1, regular smart meters are far from fully rolled out in Scotland.
Properties with energy generation
Further consideration is needed for properties with energy generating assets, which adds a layer of complexity to the question of how different aspects of household energy data can be displayed for different audiences.
MCS standards already require a generation meter, and smart meters record the amount of energy exported to the grid, so this data should already be available (Jon Stinson of Building Research Solutions), but it will need to be represented in a way that is legible to the relevant audiences. For example, David Allinson (Building Energy Research Group, University of Loughborough) suggested that consumers would want to see historic levels of energy generation displayed on an EPC.
Overall, the challenge is to design a methodology and an output that works for all properties in Scotland, from properties with no metered heating system and no smart meters, to those with complex systems that include various types of energy generation.
Considerations for using metered energy consumption data
Practicalities of data collection
The potential for using metered data to understand buildings’ energy performance is largely linked to smart meters, which provide accurate and frequent meter readings. The number of smart meters continues to increase. As of March 2023, 57% of all gas and electricity meters in the UK were smart (National Audit Office, 2023). However, in most of Scotland, the rates of domestic smart electricity meters were lower (43%), with rates below 10% in Na h-Eileanan Siar, the Orkney Islands, and the Shetland Islands (DESNZ, 2023). This has implications for the approaches reviewed in this report.
Accessing smart meter data
Aside from the rollout, the main challenge associated with accessing smart meter data relates to where the data is stored and how it can be shared. This also relates to General Data Protection Regulation (GDPR) (Section 7.3). Energy consumption data is considered personal data under current GDPR and requires the consumer’s consent to access it. Consumption data (and export profiles in homes with generation technologies) are stored on individual meters.
There are currently two ways that third parties can access smart meter data (Energy Systems Catapult, 2023), though both require explicit consent from the consumer:
- Organisations (such as energy suppliers) can be integrated into the smart metering system. These organisations must lay out their approach to obtaining householder consent during the onboarding process. Work is underway within the DCC to make the on-boarding process easier and more streamlined.
- Through a Consumer Access Device (CAD). This is a read-only monitor fitted to the home area network. These can only be fitted by registered users of the DCC’s systems.
DESNZ are currently exploring options for creating a central repository for smart meter data through their Smart Meter Energy Data Repository Programme. The aim of this is to explore the feasibility of creating a central repository which would support the innovation of services and products for the benefit of consumers and the wider network. This could include all types of smart meter data, either aggregated or at householder level. The primary focus of projects funded through this programme is to enable access to aggregated data sets.
Public sector bodies, or any organisation carrying out a specific task in the public interest, can access household metered energy data without the need for individual consent. This is through the legal basis of ‘public task’. However, currently this route is only used to access aggregated consumption data. There are no current examples of data being used to provide insights at the individual level. For example, metered gas consumption data is collected by DESNZ from individual households (through Xoserve[4]) for the purpose of compiling subnational consumption statistics. In this instance, individual consent is not required from the householder, and data is presented in aggregate. Legal routes for accessing individual household consumption data under the basis of public task were not explored as part of this research. Further investigation is needed to understand the GDPR considerations.
Aggregated data sets could be used as a validation point to support the improvement of the existing SAP methodology (Section 5.5), though would have little benefit for the two approaches outlined in later sections of this report (improving the asset rating or calculating operational rating for individual EPCs). Our discussions with stakeholders indicate that the current focus of work is to enable access to aggregated smart meter data.
Matt James of the DCC explained that organisations seeking to access smart meter data via DCC must undertake a series of technical, security and administrative steps to on-board and integrate with the smart meter system.
Several policy initiatives, such as ‘Data for Good’ (Energy Systems Catapult, 2023) are making the case for improved, appropriate access to smart meter data for public benefit. An alternative access route to aggregated data is through the electrical Distribution Network Operators (DNOs). DNOs currently have access to anonymised half-hourly smart meter data, for the purpose of delivering an efficient network. By February 2024 DNOs will be obligated to report smart meter data as aggregated and anonymised open access data (interview with Matt James of the DCC). Phase 2 of the Smart Meter Energy Data: Public Interest Advisory Group Project is exploring how smart meter data collected by DNOs could be of value in delivering wider public policy objectives (Sustainability First & Centre for Sustainable Energy, 2021).
Properties without smart meters
For homes without smart meters there are sources of data for analogue (non-smart) meters. ElectraLink is responsible for operating the UK’s central energy data transfer function. They have access to metered electricity data, including from analogue meters, every time the meter is settled[5]. ElectraLink estimates that 95% of UK households with analogue meters have at least annual electricity meter data available (interview with ElectraLink) which may be a useful source of energy consumption data for EPCs. Similar daa is collected for gas meters by Xoserve. However, infrequent meter readings from occupants can result in assumed energy use based on the suppliers’ algorithms. This would not be an accurate measure of energy consumption.
Different strategies would be needed to collect non-smart metered data for the different approaches explored in Sections 9 and 10. The SmartHTC approach (see Section 9) developed by Build Test Solutions overcomes this by being able to also work with just an opening and closing meter reading over a set period. In such cases the meter readings could be read by an energy assessor or surveyor, or could be supplied manually by the householder. The latter could introduce a risk of incorrect readings, deliberately or not (Zuhaib et al., 2021).
Alternatively, an assessor could take the manual meter readings, though this would add additional cost. As a workaround for homes undertaking retrofit monitoring without smart meters, JG Architects fit additional monitors to capture live energy data over a set time period. The representative from JG Architects suggested it is more valuable to capture time series energy use data than static meter readings. Time series data provides more detail about how the property is performing.
The risk from incorrect readings depends on how the data is used; it is more serious if the data is used as the input data on an EPC with policy implications, but less concerning if the data only serves the purpose of providing an additional metric for householders to better understand their energy usage. Given the large number of properties in Scotland without smart meters, this should be given significant consideration.
Properties heated with unregulated (unmetered) fuels
The stakeholders agreed that properties heated with unregulated fuels (such as oil, coal, wood, and biofuels) pose the most difficult challenge. As noted by Richard Fitton, Professor of Building Performance, these properties are out of scope of the smart meter rollout and at risk of being excluded from new approaches to EPCs that use metered data. Lomas et al. (2019) state that their proposed Domestic Operation Rating method (Section 9) will not work for homes using these types of fuels.
Different solutions could be implemented depending on the specific approach but would be associated with significant uncertainty and be difficult to implement. Build Test Solutions suggested an overnight test that uses direct electric heaters[6]. This requires a property to be vacant for the 15-hour test period. It is also possible to add meters into LPG and oil supply feeds, which could be installed temporarily and then removed and reused. These are not generally fitted as standard. This does not overcome the issue of metering solid fuels.
Jon Stinson discussed that Building Research Solutions (BRS) has navigated this challenge by backtracking energy consumption from invoices, though noted that this is a time-consuming process. He also suggested a requirement for those using solid fuel to install some sort of heat meter (as with RHI, FIT and generation meters). This would still rely on some form of modelling and would also need an interface or programme through which people can submit their meter readings.
Alternatively, Richard Atkins, Chartered Architect, suggests instigating a requirement on coal and oil suppliers to keep a record and to provide this– though there would be no certainty of how the fuel is used in the property. Sam Mancey from DESNZ noted that for this data to be useful you would also need to know the length of time between refills to understand how long it takes to use a specific quantity.
Given the move toward ZDEH (Zero Direct Emissions Heating) systems, consideration should be given to whether it is proportionate to develop a system for assessing the metered energy consumption of properties using alternative fuels. An estimation based on an annual measure of fuel use may be more appropriate and proportionate (Lomas et al., 2019), although less accurate.
Dynamic EPCs
Most stakeholders supported proposals for dynamic EPCs. These will provide improved opportunities to utilise energy consumption data. Dynamic EPCs are live reports, and this will allow for some data inputs to be updated on a more regular basis than the required EPC timeline (currently 10 years but proposed to be 5 years). This could result in the inclusion of energy pricing or carbon emission factors.
Dynamic EPCs could also allow users to input their own contextual data (see 9.3) to tailor the reported consumption data to their own usage patterns. Stakeholders proposed a public EPC which contains building performance information, and a separate private element which allows users to input their occupancy data. A representative from Build Test Solutions suggested that if EPCs enabled householders to input their specific occupancy hours and set points, this would achieve an EPC much more closely aligned with actual consumption. This could overcome the challenges around collecting data on occupancy. Users can input this data if they would find the output useful, but otherwise a standard EPC for the building exists without the need for any occupancy data.
GDPR
Energy consumption data is considered as personal data under GDPR. GDPR is not a barrier to collecting and using energy consumption data for the purpose of EPCs, as exemplified by its use in Sweden and Germany. However, any process for collecting and processing energy consumption data will need to be GDPR compliant. Below are some of the key GDPR considerations for the use of metered energy consumption data at the individual household level.
Data ownership
Energy consumption data is owned by the person who consumed the energy (usually the energy bill payer). The stakeholders we consulted believed that householder consent would be required to access and use this data, and this was confirmed by the DCC. There was disagreement between the stakeholders we interviewed about the degree to which this poses a challenge for the use of energy consumption data.
The impact of GDPR on energy consumption data depends on how it is used and stored. For example, Build Test Solutions explained that they do not identify the individual or specific address associated with the energy consumption data they collect in order to calculate the heat transfer coefficient (Section 8), and they only hold location data at a partial postcode level. Kevin Gornall from DESNZ also noted that as part of the SMETER project (Section 8.1), there was a central database of metrics based on the metered data, but the metered data itself was not stored.
Data management
The stakeholders we interviewed agreed that the processing and management of personal energy data and consent poses a significant challenge. This is particularly true if live data is collected at scale, as mentioned in Section 7.2. The actors currently involved in energy consumption data management include energy utilities, DNOs, ‘Other Users’ (other registered users of the smart meter system), and the DCC.
Andrew Parkin at Elmhurst Energy highlighted the challenge of accessing energy consumption data which is decentralised and held by the energy utilities. Several stakeholders suggested that energy consumption data could be stored in a central repository. Householders could then have the option to consent to their energy data being used for different purposes. As indicated previously, work is being undertaken by DESNZ to explore the feasibility of this (Section 7.1.1).
Jon Stinson at Building Research Solutions pointed to the US Department of Energy (US DoE) as an example of how this could be done. He explained that the US DoE collates all energy data from utilities. Initially, this was done to enable academics to access these large data sets for research purposes. In this way, energy data is centralised, and there are fewer issues should the consumer change supplier or meters regularly.
Impact of tenancy type
There are also potential challenges associated with different tenancy types. Crawley et al. (2020) note that EPCs are often commissioned by a landlord, not the owner of the consumption data. In such cases the building owner would require the tenant to provide consent to access these data, adding a layer of complexity to the process.
Energy consumption data to improve the asset rating accuracy
Metered consumption data could be used to calculate a heat transfer coefficient (HTC), which is part of the calculation for EPC ratings. HTC is a common metric for the thermal performance of buildings. For the purposes of producing EPCs, HTC is predicted using SAP/RdSAP for domestic properties and SBEM for non-domestic properties. This is based on assumptions about the heat loss of various aspects of the building (walls, floor, roof, windows etc.) It is used as part of the calculations to estimate annual heating bills, CO2 produced by the building, and the A-G asset rating (Fitton, 2020).
HTC can also be measured in-situ through a co-heating test. This is an intrusive and expensive test which measures the rate of heat loss over a certain period (usually one to three weeks) (Hollick, 2020) and must take place whilst the building is unoccupied.
Research is currently ongoing to investigate how metered energy consumption data could be used to calculate the HTC more accurately than the current predictions in RdSAP, and a more cost-effective way than the co-heating test.
Several stakeholders interviewed[7] discussed the potential for energy consumption data to be used to calculate the HTC of individual properties. All were of the view that calculating an HTC using energy consumption data is more accurate than the HTC values predicted by RdSAP. However, some stakeholders did question the usefulness of this to householders. For example, the representative from the Climate Change Committee (CCC) suggested that this would be useful for improving building standards, but the information is unlikely to be something that householders want or need.
Current research
Several approaches are currently being developed and tested. The Smart Meter Enabled Thermal Efficiency Ratings (SMETER) Innovation Programme has undertaken field trials to test nine SMETER technologies. The trials took place in a non-representative sample of 30 homes (BEIS 2022). The accuracy of each SMETER technology was evaluated by comparison with the measured HTC[8].
Build Test Solutions has developed the SmartHTC method, which is commercially available and has been applied to over 10,000 buildings at time of writing. . SmartHTC is a technology agnostic algorithm. It can either be delivered as an assessment service led by an assessor, or embedded into smart devices such as a smart meter IHD or a smart thermostat. The algorithm was used by the two best-performing HTC technologies in the SMETER research (BEIS, 2022). The IEA’s Annex 71 is also investigating methods for measuring HTC, including through smart meter data (Fitton et al., 2021).
Common to all these approaches is the need for three key pieces of information; metered consumption data (provided by smart meters for gas and electricity), internal temperature data and external temperature data.
Internal temperature data
Internal temperature is critical to collect. Senave et al. (2019) demonstrate that estimated internal temperatures can lead to errors in the HTC of up to 26.9% compared to internal temperature data from one room in the home. Ideally indoor temperatures should be measured in two locations. The literature points to the increasing popularity of “on-board devices” (Fitton, 2020) such as smart heating controls as a valuable source of internal temperature data. However, this is not currently a viable option in the context of producing EPCs. The majority of homes do not have this technology, and it is unclear how this data could be collected centrally.
Newer models of smart meter in-home displays (IHD) also have the capacity to record temperature data. For example, Chameleon’s IHD7 IHD which is already being deployed in the smart meter rollout. The UK Government is currently funding projects to explore whether smart meter infrastructure can be used for more than just energy data (DESNZ, 2023b). As part of this, Matt James explained that the DCC is involved in an ongoing pilot to investigate whether temperature and humidity data can be transmitted through the system, alongside meter readings.
Research has also explored whether it is possible to use smart meter data to estimate thermal performance without the need for temperature data. Chambers and Oreszczyn (2019) only used smart meter data and used the building’s location to make assumptions about local temperatures[9]. Three of the SMETER trials also did not use internal sensors and demonstrated that it is possible to generate an HTC figure without collecting internal temperature data. However, these SMETER technologies were found to generate less accurate HTCs than those which also measured internal temperatures.
An interim solution, suggested by Baker and Mould (2018), is that until in-home sensing equipment is mainstream, homeowners and landlords could be incentivised to record this data voluntarily for inclusion in domestic EPCs. For their SmartHTC method, if internal temperature data cannot be collected via existing devices such as smart thermostats, Build Test Solutions send several low-cost temperature sensors to householders to collect temperature data over a period of 3 weeks.
External temperature data
External temperature is a key factor influencing the amount of energy used in a building. Whilst some smart heating controls do have external temperature sensors (for weather compensation), most studies and trials to date have relied on data from nearby weather stations and online tools. Stakeholders we spoke to commented that, generally, external weather data is readily available, detailed, and reliable (Richard Fitton, Professor of Building Performance and Build Test Solutions).
Potential applications
As an input to EPC calculations
The HTC is not weighted or normalised in any way. It does not account for the size, shape or age of a building. In general, the HTC is higher for larger homes (Fitton, 2020), and therefore does not allow buildings to be compared. For this reason, the majority of stakeholders interviewed for this research felt that the HTC figure should not be presented on EPC certificates and instead should be used in the calculation of EPC metrics.
As a standalone figure on EPCs
In contrast to the above, the IEA Annex 71 report recommends that the raw HTC figure is reported on EPCs. The report authors compare the HTC to the miles per gallon (MPG) metric used for vehicles. The MPG metric is widely understood by consumers and is not normalised for size (the cylinder capacity of the engine). Similarly, they propose the HTC value could become a recognised and well-understood metric. This would require householders to be provided with a bespoke annual heating degree day (HDD) figure, in the same way that motorists are usually aware of their annual mileage.
We did not find that this view was widely reflected amongst stakeholders that we interviewed, though David Allinson also used MPG as an analogy. He noted that when looking a purchasing a vehicle, we would not expect to know or predict exactly how much a particular vehicle would cost to run and that MPG is a useful metric to understand the relative fuel efficiency of a vehicle. He suggests that in the same way we should not look at an EPC and expect to know exactly how much a property will cost to run, though we could be using HTC figures in a more useful way. Richard Fitton suggested that if the HTC value is included on EPCs it should be normalised by floor space (m2) to become the ‘heat loss parameter’ or better still by volume (m3) to account for high ceilings.
The performance gap
The HTC can be used to identify where new buildings or retrofitted buildings are not performing in line with modelled predictions (Fitton, 2020). As outlined in Section 5, this is not uncommon.
In relation to new builds, Kevin Gornall from DESNZ suggested that one of the most promising applications for in-use HTC is to identify issues with building fabric. He suggested that if the modelled HTC derived through SAP is vastly different to the measured in-use HTC figure, then it may point to construction problems which needs to be addressed. This can prompt further investigation help to identify issues that would usually go unnoticed.
HTC readings can also be an effective tool for monitoring the impacts of retrofit. For example, Elmhurst suggests that their Measured Energy Performance (MEP) tool[10] is most effective as a tool for evaluating the impacts of retrofit projects. Calculating the HTC pre- and post-installation can provide a more accurate assessment of the impacts that retrofit measures have had on the thermal performance of the property. MEP can also be used as a part of meeting the PAS 2035 requirements for monitoring and evaluation (Elmhurst, 2021).
Challenges to this approach
As outlined in Section 7 there are a number of challenges around relying on smart meter data.Technologies to measure and transmit internal temperature data are also not widely available in most homes. Both interviewees from DESNZ, Jon Stinson from BRS and a representative from Build Test Solutions all discussed the use of a co-heating test as an alternative method for homes without smart meters. This is not a practical or cost-effective solution for generating EPCs at scale. Overnight HTC tests or temporary meters are likely to be the most practicalsolutions for homes with unmetered fuels. Additionally, the SmartHTC algorithm can be used with only opening and closing meter readings for non-smart meters.
A representative of Build Test Solutions stated that another challenge is accounting for electrical loads outside the building envelope such as electric cars, outdoor offices or hot tubs. Ideally, these should be metered separately.
Annex 71 (Fitton et al., 2021) highlights that the regulatory energy models in the UK do not allow for the HTC to be directly entered as a measured value. Multiple stakeholders confirmed that this is technically possible to overwrite the HTC value in SAP. Therefore, further investigation is required as to whether there are regulatory or practical barriers to doing this.
Energy consumption data for operational performance
Metered energy consumption data can be used to produce an operational rating which is more closely aligned with actual energy use and gives an indication of how a building is used. This type of metric will include the impact of occupant behaviour. The influence of occupant behaviour makes this approach less suitable for comparison between buildings. However, this can also be an advantage, especially when combined with a good benchmark. Comparison against a benchmark can be used to encourage both building energy performance and user behaviour change (Zuhaib et al., 2021).
The most straightforward use for metered energy consumption data is to include the value on an EPC alongside a reference figure. The reference figure could be historical energy consumption data for that property (Zuhaib et al., 2021). This would not allow for comparison against other buildings unless the data is normalised to account for factors such as size and occupancy.
Current examples
Display Energy Certificates
Display Energy Certificates (DEC) for public non-domestic buildings[11] are an example of an operational rating (section 10). Energy consumption is compared to a benchmark for similar types of buildings (Lomas et al., 2019).
Measured Energy Performance Indicator (MEPI)
The X-tendo project (Verheyen et al., 2019; Zuhaib et al., 2021) developed the Measured Energy Performance Indicator (MEPI) to be compatible with EPCs. It proposes that real energy consumption data is used to generate an ‘energy use indicator’ on EPCs. To enable comparison between buildings, this figure is weather-corrected and normalised for building size and primary energy factors[12]. This method relies on sub-metering to disaggregate consumption for heating and hot water. Sub-metering is not widely used in domestic buildings in Scotland.
This method has undergone testing in four European countries. This revealed that further corrections are needed to be able to make useful comparisons, for example the number of hours the heating system is used. The method contains an optional module to correct for indoor temperature.
EPCs in Sweden
A representative from Boverket explained that EPCs in Sweden are based on real energy consumption data, which is disaggregated by the energy assessor to only consider energy used for heating, cooling, domestic hot water, and fixed lighting, and then corrected to reflect typical use. This results in an operational rating than enables comparisons between buildings. A challenge of this approach is that it requires the energy assessor to make assumptions about a building’s energy use, since disaggregated metered data rarely exists for each of the different energy uses.
Domestic Operational Rating (DOR)
Researchers from Loughborough University and De Montfort University have proposed and tested a DOR scheme for assessing the energy performance of occupied dwellings (Lomas et al., 2019). They propose this scheme as separate and complementary to existing SAP methodology, similar to DECs for non-domestic buildings.
The DOR uses metered energy consumption data alongside the existing survey data for a property collected for an EPC. For example, a key piece of information needed to normalise the energy consumption figure is total usable floor area (Lomas and Allinson, 2019). The proposed DOR scheme provides three operational ratings for energy demand (DORED), GHG emissions (DORGG) and energy costs (DOREC). These are intended to correspond with current metrics on an EPC. The energy cost metric is derived from the energy demand figure. It could be based either on a nationally standardised fuel cost (similar to SAP look-up tables) or on the actual fuel prices paid by each household.
The authors also explore the idea that a DOR certificate could be used to convey additional energy-related behaviour and advice to households. It could also have particular relevance for identifying homes in fuel poverty or residents that are under-heating their homes. Another key benefit of DOR is that it accounts for all energy used (regulated and unregulated).
David Allinson (Building Energy Research Group, University of Loughborough) suggests that moving towards DOR with normalised data to account for anomalies (e.g., a particularly cold winter), would allow people to compare with other people in the neighbourhood or the same property type.
Enabling comparison
Normalisation of data
Experts have proposed different methods which use different degrees of correction or normalisation. In its purest form, annual metered data could be included as-is. With no correction, this would result in a worse score during colder years where the heating requirements are higher. Conversely, recommendations for a new heating system based on a particularly mild winter where the heating demand of the property was lower than usual, or energy savings measured between non-typical years would be misleading.
There is consensus in the reviewed literature that a metric of this type should be normalised at least by floor area (Baker and Mould, 2018; Lomas et al., 2019). In France, EPCs for pre-1948 buildings were previously calculated based on an average of three years of metered data corrected by floor area (Crawley et al., 2020). However, this option was removed as part of recent EPC reforms due to issues related to buildings with irregular occupancy (Rosemont International, 2021; Thomson and Jenkins, 2023).
Weather-correction
The DOR uses weather-correction to enable the comparison of ratings between homes in different locations across the country. The metered daily gas and electricity consumption of homes is corrected based on the number of heating degree-days. An alternative to weather-correcting the energy demand data is to instead correct the benchmark that the energy is compared to (see below).
Corrections for standard user behaviour have also been proposed (Zuhaib et al., 2021). The latter is possible if occupancy profile data is available, but the authors note that this is hard to obtain.
Benchmarks
The DOR proposes that weather-corrected and normalised energy demand is compared against a benchmark of the average energy demand for the UK. Selecting an appropriate benchmark requires careful consideration (Lomas et al., 2019).
Jon Stinson of BRS also recommended inclusion of an average energy use figure across the previous three years, normalised with internal and external temperature data. He suggests that this could be a rolling figure, updated annually, linked to a dynamic EPC.
Non-domestic DECs use a building-specific benchmark corrected to account for the duration of occupancy and weather conditions. However, this approach is less appropriate for domestic buildings, since the proportion of energy that is used for space heating (and therefore should be weather corrected) varies significantly (Lomas et al., 2019).
Contextual occupancy data
If energy consumption data is provided on EPCs then some level of contextual data about the occupants is also required. For example, a potential tenant or buyer would need to know some details of the previous occupant(s) to understand the relevance of their energy usage.
Three stakeholders (from Build Test Solutions; Thomas Lefevre of Etude; Alan Beal of Bacra and Richard Fitton, Professor of Building Performance) were wary of using energy consumption data in isolation as it is difficult to account for all variables and to collect this data from occupants.
Several stakeholders (Kevin Gornall, DESNZ; Barbara Lantschner, JG architects; and a representative of the CCC) suggested that a small number of key questions regarding in-use occupancy information could be sufficient to generate an output which is accurate enough for the purposes of an EPC. Key information identified included:
- Occupancy (number of people in the household)
- Heating regime (hours of heating and preferred temperatures)
- Energy behaviours (information on unregulated energy use, e.g., large appliances)
Kevin Gornall from DESNZ suggested that in future there could be the option for occupants to answer several survey questions surrounding how they use energy in the home at the point of assessment. This information alongside internal temperatures and patterns of energy consumption could replace the occupancy assumptions used within SAP to generate more tailored outputs. His view was that the existing SAP model can generate accurate outputs providing that accurate information is fed in, and the key is to provide an open version of SAP where assumptions can be altered.
A similar exercise has been done with EPCs before, through the Green Deal Occupancy Assessment. This used standard EPC inputs and amended these with data from a series of additional questions. For example, standardised occupancy patterns were amended to reflect the household.
A representative of Build Test Solutions suggested that metered data could be used to achieve a more accurate baseline asset rating (see Section 8), with further occupational data added as a separate metric to achieve an output much more closely aligned with the total energy consumption.
As highlighted in Section 8.1.1, and by Jon Stinson of BRS, internal temperature data could be used to understand heating outcomes to contextualise the energy consumption data.
Alternatively, the DOR is designed so that it does not require any contextual data from occupants. Metered consumption data is normalised and compared to a national benchmark (Lomas et al., 2019). The authors note that not accounting for number of occupants may result in a poorer DOR for homes occupied by more people. They note privacy concerns over collecting this information, and the practicalities of defining occupant numbers, particularly in HMO properties (ibid.).
Presenting the data
An operational rating could be presented on an EPC alongside the asset rating. However, Lomas et al. (2019) suggest that the DOR is provided on a separate certificate. This would be similar to DECs for non-domestic buildings[13]. The move to dynamic EPCs will have implications for how an operational rating can be displayed (Section 7.2).
In contrast, Baker and Mould (2018) suggest that consumption data should replace the existing modelled SAP methodology rather than complement it, with all EPCs being based on an operational rating.
It is possible to use asset ratings and operational ratings to produce two different kinds of EPCs. This is the case in Germany, where EPCs can take the form of either a demand certificate, which provides an asset rating, or a consumption certificate, which provides an operational rating (Lomas et al., 2019). While the resulting energy certificates differ, they are both considered to be EPCs that fulfil the requirements of EPBD. It should be noted that in Germany, the operational rating based EPCs are only available for buildings with more than five flats, since including multiple households approximates normalisation for different occupant behaviours. This would not be possible in Scotland where EPCs are produced for individual dwellings rather than buildings.
Challenges to this approach
One challenge to developing an operational rating is determining whether and how much contextual data to collect from occupants. Additionally, Lomas et al. (2019) state that it is desirable for a DOR to disaggregate energy used for space heating, domestic hot water, and electrical energy use. Sub-metering is not widely used in domestic properties (see Section 6.3.1), so this will be challenging.
Non-domestic EPCs
The most obvious use for metered energy consumption data in non-domestic EPCs in Scotland is to extend the use of DECs. This was suggested as the best way to use metered consumption data for non-domestic buildings by Joshua Wakeling of Elmhurst Energy. The operational rating on a DEC is based on meter readings for 12 months of energy consumption and compared to a benchmark. The operational rating is a numerical indicator and is also illustrated on an A-G scale.
Additionally, Joshua Wakeling (Elmhurst Energy) noted the need for more investment in improving the DEC methodology and to better understand occupancy assessment. The DEC methodology has not been updated for over 10 years (Elmhurst Energy, 2022).
The considerations around different types of energy use, as discussed in Section 7, are also relevant to non-domestic buildings. An analysis by Jones Lang LaSalle (2012) of 200 non-domestic buildings in the UK found little or no correlation between EPC ratings and actual energy performance. This significant performance gap has been attributed to a combination of uncertainty in the modelling, occupant behaviour, and poor operational practices (van Dronkelaar, 2015).
Jon Stinson of BRS has found that accessing metered data is more straightforward for non-domestic buildings than for domestic. Many occupants of non-domestic buildings will already have processes in place to collate energy consumption data, and larger buildings tend to have sub-metering arrangements as well as Building Energy Management Systems (BeMS). However, Joshua Wakeling of Elmhurst Energy noted that in England and Wales the deployment of DECs to private sector buildings has been hampered by a reluctance to share energy data.
Stakeholders discussed the use of metered energy consumption data for the purpose of an operational rating, but not for an asset rating. The comparison of HTC figures is not as important for non-domestic buildings as it is for domestic buildings. This is because building fabric has a comparably lower impact on heat loss than ventilation and air-conditioning systems (Jon Stinson, BRS).
Conclusions and recommendations
This report has explored two ways in which metered energy consumption data can be used in EPCs and the factors that need to be considered to enable this. Metered energy consumption data can provide more accurate information on building fabric performance (asset rating) and give an operational rating of how energy is used in a building.
A more accurate asset rating can be generated by using metered energy consumption data to calculate the HTC (heat transfer coefficient) in properties. Although various methods have been tested in recent years, they are not yet sufficiently developed for widespread roll out in EPCs. This approach requires collecting internal temperature data and is limited in properties without smart meters. Further work is required within the industry to enable the reliable collection of internal temperature data and consumption data across properties with different meters and fuel types.
Accurate HTC figures calculated using energy consumption data will also have value for informing retrofit decisions. This is currently being explored through projects such as Chameleon’s HTC-Up project. The use of energy consumption data in EPCs will provide a more realistic baseline asset rating on which to base recommended retrofit measures. However, the recommendations on an EPC would still be generated automatically by SAP.
Metered energy consumption data can be used to produce an operational rating to give an indication of how a building is used. A wide range of different approaches have been explored in the literature. The most straightforward use for metered energy consumption data is to include the value on an EPC alongside a reference figure. Another option is a DOR showing the energy consumption of a property, corrected by weather and floor area. This rating could be included as a part of the EPC or exist as separate document.
Using energy consumption to provide an operational rating has the challenge that different energy uses are not yet disaggregated. As a result, it can be difficult to determine what causes increases or decreases in energy consumption. Sub-metering has been suggested as a potential solution, though this technology is not commonplace in Scottish homes at present. The X-tendo project also proposes a method to achieve an operational rating but requires further normalisation of the data to account for different energy uses.
This operational rating could be included as part of existing EPCs or could be presented separately to provide additional information as to how efficiently energy is used in the home. Generation of an operational rating has the potential to be incorporated as part of dynamic, digital EPCs where data can be updated and adjusted without the need for a new EPC to be created. This format could enable occupancy-related data to be separate from the public asset rating.
Energy consumption data could be used in both or either of the two ways outlined above. EPCs should retain an asset metric (whether based on modelled or measured data) that is based on standard occupancy assumptions to allow comparison between properties regardless of who occupies them. This should not be replaced with an energy use metric, which contains occupancy variables that cannot be fully accounted for. Such a metric could be useful in addition to a standardised metric for comparison. It was suggested that metered data could be used to achieve a more accurate baseline asset rating, with further occupational data added as a separate metric to achieve an output much more closely aligned with the total energy consumption.
In both cases, consumer consent will be needed to collect and process metered energy consumption data and further consideration must be given as to how this can be facilitated.
Recommendations
This research has highlighted that further work is needed in this area to explore:
- The practicalities of collecting required data. This will include:
- Metered energy consumption data at the individual building level, rather than from aggregated datasets. This will require a standardised process for collecting consumer consent. Currently, public sector bodies can obtain household-level data without the need for individual consent through the legal basis of public task’. However, this is for aggregated data and there are no current examples of data being used to provide insights at the individual household level. Further investigation is needed into the legal basis of public task for collection of metered data for reporting at the household level. Legal routes for this were not explored as part of this research.
- Processes for data collection, as these are mostly dependent on the rollout of smart meters. An alternative methodology will need to be developed for households using unregulated fuels, as their heating consumption will not be captured in smart meter data.
- Additional information from occupants which can be used to contextualise energy consumption data when used for an operational rating. Examples of this kind of data include the number of occupants or typical heating regime. Further work is required to understand the minimum amount of contextual information to enable metered energy consumption data to be useful.
- Internal temperature data for the purpose of calculating HTC as part of an asset rating. This would require the mass rollout of internal temperature sensors, which are already included in some IHD (in-home display) devices. Internal temperature data could also be useful contextual data for an operational rating.
- Different formats that could be used to display consumption data when used for an operational rating. This should consider whether consumption data would work best as one of multiple ratings within the EPC or separately.
- For energy-generating homes, how total energy consumption, generation, export, and cost can be displayed in a straight-forward manner.
- Whether there are regulatory or practical barriers to inputting the HTC as a measured value in SAP calculations for the asset rating.
- The value of Display Energy Certificates for non-domestic public buildings in England and Wales, and whether there would be value in expanding their use in Scotland.
References
|
Arcipowska, A., Anagnostopoulos, F., Mariottini, F. and Kunkel, S. (2014) Energy Performance Certificates across the EU: A Mapping of National Approaches. Rep. Brussels: Buildings Performance Institute Europe. Available at: https://www.bpie.eu/publication/energy-performance-certificates-across-the-eu/ (Accessed: 25 August 2023). |
|
Baker, K. J. and Mould, R. (2018) Energy Performance Certificates: An Alternative Approach. Available at: https://commonweal.scot/policies/energy-performance-certificates-an-alternative-approach/ (Accessed: 25 August 2023). |
|
Baker, K.J. and Rylatt, R. M. (2008) ‘Improving the prediction of UK domestic energy-demand using annual consumption-data’, Applied Energy, 85(6), pp. 475–482. Available at: https://doi.org/10.1016/j.apenergy.2007.09.004 |
|
Bordass, B. (2020) ‘Metrics for energy performance in operation: the fallacy of single indicators’, Buildings and Cities, 1(1), pp. 260–276. Available at: https://journal-buildingscities.org/articles/10.5334/bc.35 |
|
Chambers, J. D. (2017) ‘Developing a rapid, scalable method of thermal characterisation for UK dwellings using smart meter data’. UCL Energy Institute. Available at: https://discovery.ucl.ac.uk/id/eprint/10030678/ (Accessed: 31 August 2023). |
|
Chambers, J. D. and Oreszczyn, T. (2019) ‘Deconstruct: A scalable method of as-built heat power loss coefficient inference for UK dwellings using smart meter data’, Energy and Buildings, 183, pp. 443-453. Available at: https://doi.org/10.1016/j.enbuild.2018.11.016 |
|
Chameleon Technology (2023) Chameleon Technology awarded six-figure funding for green finance project HTC-Up. Available at: https://chameleontechnology.co.uk/2023/06/12/chameleon-technology-awarded-six-figure-funding-for-green-finance-project-htc-up/ (Accessed: 30th August 2023) |
|
Changeworks (2023) A Perfect Storm: Fuel Poverty in Rural Scotland. Available at: https://www.changeworks.org.uk/wp-content/uploads/2023/05/A-Perfect-Storm-Fuel-Poverty-in-Rural-Scotland.pdf (Accessed: 7 September 2023). |
|
Cozza, S., Chambers, J., Deb, C., Scartezzini, J.L., Schlüter, A. and Patel, M.K. (2020) ‘Do energy performance certificates allow reliable predictions of actual energy consumption and savings? Learning from the Swiss national database’, Energy and Buildings, 224. Available at: https://doi.org/10.1016/j.enbuild.2020.110235 |
|
Crawley, J., Biddulph, P., Northrop, P.J., Wingfield, J., Oreszczyn, T. and Elwell, C. (2019) ‘Quantifying the measurement error on England and Wales EPC ratings’, Energies, 12(18), pp.3523. |
|
Crawley, J., McKenna, E., Gori, V. and Oreszczyn, T. (2020) ‘Creating domestic building thermal performance ratings using smart meter data’, Buildings & Cities, 1(1), pp.1-13. |
|
Deb, C.,Gelder, L. V., Spiekman, M., Pandraud, G., Jack R., and Fitton, R. (2021) ‘Measuring the heat transfer coefficient (HTC) in buildings: A stakeholder’s survey’, Renewable and Sustainable Energy Reviews, 144, Available at: https://doi.org/10.1016/j.rser.2021.111008 |
|
Department for Business, Energy & Industrial Strategy (2021) Making SAP and RdSAP 11 fit for Net Zero. Available at: https://www.levittbernstein.co.uk/site/assets/files/3670/making_sap_and_rdsap_11_fit_for_net_zero-full_report.pdf (Accessed: 7 September 2023). |
|
Department for Business, Energy & Industrial Strategy (2022) Technical Evaluation of SMETER Technologies (TEST) Project. Available at: https://assets.publishing.service.gov.uk/government/uploads/system/uploads/attachment_data/file/1050881/smeter-innovation-competition-report.pdf (Accessed: 7 September 2023). |
|
Department for Energy Security & Net Zero (2023a) Guidance: Use of electricity meter and gas meter personal data collected through the Energy Price Guarantee scheme in Great Britain and Northern Ireland: privacy notice Available: https://www.gov.uk/government/publications/energy-price-guarantee-scheme-privacy-notice/use-of-electricity-meter-and-gas-meter-personal-data-collected-through-the-energy-price-guarantee-scheme-privacy-notice (Accessed: 24 Aug 2023). |
|
Department for Energy Security & Net Zero (2023b) Smart meter based internet of things applications: Phase 1 projects, UK Government. Available at: https://www.gov.uk/government/publications/smart-meter-system-based-internet-of-things-applications-programme-successful-projects/smart-meter-based-internet-of-things-applications-phase-1-projects (Accessed: 7 September 2023). |
|
Directive 2010/31/EU of the European Parliament and of the Council of 19 May 2010 on the energy performance of buildings (recast) (2010) Official Journal L153, p. 13. (Accessed 7 September 2023). Available from: https://eur-lex.europa.eu/legal-content/EN/TXT/?uri=CELEX:32010L0031 |
|
Elmhurst Energy (2021) Measured Energy Performance – Behind the Scenes. Available at: https://www.elmhurstenergyconsultancy.co.uk/2022/11/17/measured-energy-performance-behind-the-scenes/ (Accessed: 7 September 2023). |
|
Elmhurst Energy (2022) The Elmhurst Almanac. Available at: https://www.elmhurstenergy.co.uk/app/uploads/2022/05/Elmhurst_Almanac_2022.pdf (Accessed: 7 September 2023). |
|
Elmhurst Energy (2023) EPCs are misunderstood, not misleading. Available at: https://www.elmhurstenergy.co.uk/blog/2023/02/27/epcs-are-misunderstood-not-misleading/ (Accessed: 7 September 2023). Energy Systems Catapult (2023) Data for Good. Smart Meter Data Access. Available at: https://es.catapult.org.uk/news/data-for-good-smart-meter-data-access/ |
|
Estiri, H. (2014) ‘Building and household X-factors and energy consumption at the residential sector: a structural equation analysis of the effects of household and building characteristics on the annual energy consumption of US residential buildings’, Energy Econ, 43, pp. 179-184. |
|
Few, J., Manouseli, D., McKenna, E., Pullinger, M., Zapata-Webborn, E., Elam, S., Shipworth, D. and Oreszczyn, T. (2023) ‘The over-prediction of energy use by EPCs in Great Britain: A comparison of EPC-modelled and metered primary energy use intensity’, Energy & Buildings, 288. Available at: https://doi.org/10.1016/j.enbuild.2023.113024 |
|
Fitton, R. (2020) ‘Energy pathology: Measuring a dwelling’s energy performance using smart meter and IoT data’, Journal of Building Survey, Appraisal & Valuation, 9(2), pp. 181-190, Available at: https://www.ingentaconnect.com/content/hsp/jbsav/2020/00000009/00000002/art00010 (Accessed: 7 September 2023). |
|
Fitton, R., Bouchie, R., Spiekman, M., Jack, R., Spindler, U., Gorzalka, P., Jimenez, M., Erkoreka, A., Marshall, A., Gorse, C., Chirag, D., Alan, D., Farmer, D., Masy, G., Virginia, G., Pandraud, G., Deltour, J., Gelder, L., Roles, S., Metzger, S. and Hughes, T. (2021) ‘Building energy performance assessment based on in-situ measurements Challenges and general framework’ Energy in Building and Communities Programme, IEA EBC Annex 71. Available at: https://salford-repository.worktribe.com/output/1336362/building-energy-performance-assessment-based-on-in-situ-measurements-challenges-and-general-framework (Accessed: 7 September 2023). |
|
Fuerst, F., Kavarnou, D., Singh, R., Adan, H. (2019) ‘Determinants of energy consumption and exposure to energy price risk: a UK study’, Zeitschrift für Immobilienökonomie, 6, pp. 65-80. Available at: https://link.springer.com/article/10.1365/s41056-019-00027-y |
|
Hamilton, I.G., Steadman, P.J., Bruhns, H. Summerfield, A.J., Lowe, R. (2013) ‘Energy efficiency in the British housing stock: Energy demand and the Homes Energy Efficiency Database’, Energy Policy, 60, pp. 462-480, Available at: https://doi.org/10.1016/j.enpol.2013.04.004 |
|
Hardy, A. and Glew, D. (2019) ‘An analysis of errors in the Energy Performance certificate database |
|
Hellwig, R.T. (2019) ‘On the relation of thermal comfort practice and the energy performance gap’, IOP Conference Series: Earth and Environmental Science, 352. Available at: https://iopscience.iop.org/article/10.1088/1755-1315/352/1/012049 |
|
Hollick, F.P., Gori, V., and Elwell, C.A. (2020) ‘Thermal performance of occupied homes: A dynamic grey-box method accounting for solar gains’, Energy & Buildings, 208. Available at: https://doi.org/10.1016/j.enbuild.2019.109669 |
|
Huebner G.M., Hamilton, I., Chalabi, Z., Shipworth, D., and Oreszczyn, T. (2015) ‘Explaining domestic energy consumption—The comparative contribution of building factors, socio-demographics, behaviours and attitudes’, Applied Energy, 159, pp. 589–600. Available at: https://doi.org/10.1016/j.apenergy.2015.09.028 |
|
Hughes, M., Pope, P., Palmer, J., and Armitage, P. (2016) ‘UK Housing Stock Models Using SAP: The Case for Heating Regime Change’, Science Journal of Energy Engineering, 4(2), pp. 12–22. Available at: 10.11648/j.sjee.20160402.11 Hummel, M., Campbell, D., Weatherall, D., and Green, G. (2022) Concrete implementation of new energy performance certificates features: Testings and results in nine countries – Real energy consumption. Available at: https://x-tendo.eu/wp-content/uploads/2020/01/X-tendo_deliverable5.2_Feature4_RealEnergyConsumption_Final.pdf (Accessed: 3 October 2023) |
|
Jenkins, D., Simpson, S., and Peacock, A. (2017) ‘Investigating the consistency and quality of EPC ratings and assessments’, Energy, 138 (1), pp. 480-489. Available at: https://doi.org/10.1016/j.energy.2017.07.105 |
|
Jones, R. V., Fuertes, A., and Lomas, K. J. (2015) ‘The socio-economic, dwelling and appliance related factors affecting electricity consumption in domestic buildings’, Renewable and Sustainable Energy Reviews, 43, pp. 901-917. Available at: https://doi.org/10.1016/j.rser.2014.11.084 |
|
Kelly, S., Crawford-Brown, D., and Pollitt, M. G. (2012) ‘Building performance evaluation and certification in the UK: Is SAP fit for purpose?’, Renewable and Sustainable Energy Reviews, 16, pp. 6861–6878. Available at: https://doi.org/10.1016/j.rser.2012.07.018 |
|
LaSalle, J.L. (2012) A Tale of Two Buildings. Available at: https://www.betterbuildingspartnership.co.uk/tale-two-buildings (Accessed: 31 August 2023). |
|
Laurent, M.H., Allibe, B., Oreszczyn, T., Hamilton, I., Galvin, R. and Tigchelaar (2013) ‘Back to reality: How domestic energy efficiency policies in four European countries can be improved by using empirical data instead of normative calculation’, European Council for an Energy Efficient Economy (ECEEE). Available at: https://www.eceee.org/library/conference_proceedings/eceee_Summer_Studies/2013/7-monitoring-and-evaluation/back-to-reality-how-domestic-energy-efficiency-policies-in-four-european-countries-can-be-improved-by-using-empirical-data-instead-of-normative-calculation/ (Accessed: 7 September 2023). |
|
Lomas, K. J. and Allinson, D. (2019) ‘Domestic Energy Demand in the UK: Trends, Regulation and Energy Rating’, Loughborough University. Available at: https://repository.lboro.ac.uk/articles/dataset/Domestic_Energy_Demand_in_the_UK_Trends_Regulation_and_Energy_Rating_Supplementary_information_to_A_Domestic_Operational_Rating_for_UK_homes_Concept_Formulation_and_Application_Energy_and_Buildings_Lomas_KJ_et_al_2019_/7836317/1 (Accessed: 7 September 2023). |
|
Lomas, K. J., Beizaee, A., Allinson, D., Haines, V.J., Beckhelling, J., Loveday, D.L., Porritt, S.M., Mallaband, B. and Morton, A. (2019) ‘A domestic operational rating for UK homes: Concept, formulation and application’, Energy and Buildings, 201, pp. 90–117. Available at: https://doi.org/10.1016/j.enbuild.2019.07.021 |
|
Mitchell, R. and Natarajan, S. (2020) ‘UK Passivhaus and the Energy Performance Gap’, Energy and Buildings, 224, pp. 110240. Available at: https://doi.org/10.1016/j.enbuild.2020.110240 |
|
National Audit Office (2023) Update on the rollout of smart meters. Available at: https://www.nao.org.uk/wp-content/uploads/2023/06/update-on-the-rollout-of-smart-meters-summary.pdf (Accessed: 7 September 2023). |
|
Passipedia (2022) Energy efficiency of the Passive House Standard: Expectations confirmed by measurements in practice. Available at: https://passipedia.org/operation/operation_and_experience/measurement_results/energy_use_measurement_results (Accessed: 24 August 2023). |
|
Passivhaus Trust (2020) EPCs as Efficiency Targets Lowering emissions, raising standards. Available at: https://www.passivhaustrust.org.uk/news/detail/?nId=892 (Accessed: 31 August 2023) |
|
Pullinger, M., Berliner, N. Goddard, N. and Shipworth, D. (2022) ‘Domestic heating behaviour and room temperatures: Empirical evidence from Scottish homes’, Energy and Buildings, 254. Available at: https://doi.org/10.1016/j.enbuild.2021.111509 |
|
Rosemont International (2021) The reform of the energy performance diagnosis (DPE). Available at: https://rosemont-int.com/en/article/news/the-reform-of-the-energy-performance-diagnosis-dpe (Accessed 8 September 2023). |
|
Santin, O.G., Itard, L., and Visscher, H. (2009) ‘The effect of occupancy and building characteristics on energy use for space and water heating in Dutch residential stock’, Energy and Buildings, 41(11), pp. 1223-1232. Available at: https://doi.org/10.1016/j.enbuild.2009.07.002 |
|
Scottish Government (2023) Energy Performance Certificate (EPC) Reform Consultation Available at: https://www.gov.scot/publications/energy-performance-certificate-epc-reform-consultation (Accessed 3 October 2023). |
|
Senave, M., Reynders, G., Sodagar, B., Verbeke, S., and Saelens, D. (2019). ‘Mapping the pitfalls in the characterisation of the heat loss coefficient from on-board monitoring data using ARX models’. Energy and Buildings, 197, pp. 214–228. Available at: https://doi.org/10.1016/j.enbuild.2019.05.047 |
|
Small-Warner, K. and Sinclair, S. (2022) Green Building Passports: a review for Scotland. Available at http://dx.doi.org/10.7488/era/2075 (Accessed: 7 September 2023) |
|
Sunikka-Blank, M, and Galvin, R. (2012) ‘Introducing the prebound effect: the gap between performance and actual energy consumption’, Building Research & Information, 40(3), pp. 260-273. Available at: https://www.tandfonline.com/doi/full/10.1080/09613218.2012.690952 |
|
Sustainability First and Centre for Sustainable Energy (2021) Smart Meter Energy Data: Public Interest Advisory Group – Phase 2 final report. Available at: https://www.sustainabilityfirst.org.uk/publications-project-research-reports/381-piag-phase-2-final-report (Accessed: 8 September 2023). |
|
The Times (2023) Why misleading EPC ratings are a national scandal. Available at: https://www.thetimes.co.uk/article/why-misleading-epc-ratings-are-a-national-scandal-ztc5ss2b0 (Accessed: 04 September 2023). |
|
Thomson, L. and Jenkins, D. (2023) ‘The Use of Real Energy Consumption Data in Characterising Residential Energy Demand with an Inventory of UK Datasets’, Energies, 16. Available at: https://doi.org/10.3390/en16166069 |
|
Van Dronkelaar, C., Dowson, M., Burman, E., Spataru, C. and Mumovic, D. (2016) ‘A Review of the Energy Performance Gap and Its Underlying Causes in Non-Domestic Buildings’ Frontiers in Mechanical Engineering, 1(17), Available at: https://doi.org/10.3389/fmech.2015.00017 |
|
Vatougiou, P., McCallum, P., Jenkins, D. (2022) An evidence review of data associated with non-domestic buildings. Available at: http://dx.doi.org/10.7488/era/2557 (Accessed: 7 September 2023) |
|
Verheyen, J., Zuhaib, S. and Broer, R. (2019) Introductory Reports: Real Energy Consumption. Available at: https://x-tendo.eu/wp-content/uploads/2020/01/D3.1-Real-Energy-consumption.pdf (Accessed: 24 August 2023) |
|
Wyatt, P. (2013) ‘A dwelling-level investigation into the physical and socio-economic drivers of domestic energy consumption in England’, Energy Policy, 60, pp. 540-549. Available at: https://doi.org/10.1016/j.enpol.2013.05.037 |
|
Zuhaib, S., Pedraz, G.B., Verheyen, J., Kwiatkowski, J., Hummel, M. and Dorizas, V. (2021) Exploring Innovative Indicators for The Next-Generation Energy Performance Certificates features – Real Energy Consumption. Available at: https://x-tendo.eu/wp-content/uploads/2020/01/D3.1-Real-Energy-consumption.pdf (Accessed: 24 August 2023). |
|
Zuhaib, S., Schmatzberger, S., Volt, J., Toth, Z., Kranzl, L., Maia, I.E.N., Verheyen, J., Borragán, G., Monteiro, C.S., Mateus, N. and Fragoso, R. (2022) ‘Next-generation energy performance certificates: End-user needs and expectations’, Energy Policy, 161. Available at: https://doi.org/10.1016/j.enpol.2021.112723 |
Appendix: Research methodology
Desk research
This report was informed by desk research in the form of a literature review of academic articles and grey literature such as reports, statements, policy literature, and consultations.
An initial literature search was carried out using the search terms listed in table 1. The list expanded throughout the research process as key terms and concepts were identified. Further sources were identified from relevant sources cited in included literature. Literature from the past five years was prioritised, though some older works also informed the research. Through the search, 51 relevant pieces of literature were identified.
|
List of search terms (non-exhaustive) | |
|
Calculated (energy) use |
EPC(s) |
|
Measured (energy) use |
Performance gap |
|
Real/actual (energy) use |
Building |
|
Energy use/usage |
Assessment |
|
Consumption data |
Heat transfer coefficient |
|
Energy performance |
Operational performance/rating |
|
Smart meter(s) |
GDPR |
Stakeholder interviews
Fourteen interviews were carried out with stakeholders in Scotland, the UK, and Sweden. These were semi-structured, 30–45-minute interviews undertaken in July and August 2023.
Interviews were held with the following stakeholders:
- A representative from Boverket, the Swedish National Board of Housing, Building and Planning.
- Richard Fitton, Professor of Building Performance, University of Salford.
- A representative from the Climate Change Committee.
- David Allinson, Building Energy Research Group, School of Architecture, University of Loughborough.
- Richard Atkins, Chartered Architect.
- Jon Stinson, Managing and Technical Director, Building Research Solutions.
- Thomas Levefre, Managing Director, Etude.
- Alan Beal, Bacra.
- Barbara Lantschner, Building Performance Specialist, John Gilbert Architects.
- A representative from Build Test Solutions.
- Sam Mancey, SMETER Implementation Team, DESNZ.
- Kevin Gornall, SMETER Implementation Team, DESNZ.
- Andrew Parkin, Director of Technical Development, Elmhurst Energy
- Joshua Wakeling, Director of Operations, Elmhurst Energy.
- Matt James from the Data Communications Company.
Qualitative analysis
The literature and interviews were analysed in NVivo using inductive coding. This allowed key concept (e.g. performance gap) and categories (e.g. asset vs operational ratings) to emerge throughout the analysis process. Findings from the interviews and the evidence review were analysed using the same coding structure. This approach also facilitated the identification of research gaps.
© The University of Edinburgh, 2023
Prepared by Changeworks on behalf of ClimateXChange, The University of Edinburgh. All rights reserved.
While every effort is made to ensure the information in this report is accurate, no legal responsibility is accepted for any errors, omissions or misleading statements. The views expressed represent those of the author(s), and do not necessarily represent those of the host institutions or funders.
Survey respondents included engineers, architects, product manufacturers, social housing providers, policy makers and researchers. ↑
The term ‘similar households’ was not defined in the study. Because of the variance of occupancy influence on energy use, this could be interpreted as similar age or number of occupants, heating pattern, income, or other factors. ↑
For most studies included in the review the electricity use of dwellings may include electric space heating, electric water heating and electric space cooling. Not all studies explicitly stated whether these were included which makes it difficult to draw clear conclusions. ↑
Xoserve is the Central Data Service Provider for Britain’s gas market. ↑
Meters are ‘settled’ each time a meter reading is provided from the consumer. ↑
Examples of these tests include QUB and Veritherm. ↑
including a representative of Build Test Solutions, a representative of the Climate Change Committee, Sam Mancey and Kevin Gornall of the SMETER Implementation Team at DESNZ, Jon Stinson from Building Research Solutions, and Thomas Lefevre from Etude. ↑
Determined using the QUB test, which is an alternative to the co-heating test and can estimate the HTC within a day. ↑
Note that this study calculated Heating Power Loss Coefficient (HPLC) rather than HTC. The difference is that HPLC incorporates thermal losses from the heating system as well as the building fabric. ↑
This tool uses four temperature and humidity monitors throughout the home to record internal data for a three-week period. Measured energy use during this period is also taken to calculate the HTC figure. ↑
Public buildings in England and Wales over 250 m2 must have a DEC. In Scotland, public buildings are required to have an EPC rather than DEC. ↑
The amount of primary energy used to generate a unit of electricity or a unit of useable thermal energy in a building. ↑
Public buildings in England and Wales over 250 m2 must have a DEC. In Scotland, public buildings are required to have an EPC rather than DEC. ↑
This project was commissioned to inform the Scottish Government on the evidence and arguments for and against the inclusion of metered energy consumption data in Energy Performance Certificates (EPCs). Methods included a literature review and interviews with stakeholders in Scotland, the UK and Sweden.
The report outlines the potential opportunities for and barriers to using energy consumption data; the practicalities of obtaining and using energy consumption data; and the value of including such data, when considering the variables that affect actual energy usage.
Key findings
Metered energy consumption data could be used in EPCs in two ways to provide information to occupants or potential occupants:
- to provide more accurate information on building fabric performance, known as an asset rating
- to give a rating of how energy is used in a building when compared with similar buildings, known as an operational rating.
These two uses of metered consumption data – asset rating and operational rating – are not mutually exclusive and could both be included in EPCs. This could be developed as a dynamic, digital EPC.
Neither of these two uses could be implemented immediately as 57% of homes in Scotland do not yet have smart meters, which are the most reliable means of collecting metered energy consumption data. Particular difficulties include:
- A small proportion of homes will never have smart meter capability, including homes with unregulated heating fuels such as oil, LPG, or solid fuels.
- There is no process to access smart meter data to generate EPCs. The Smart Meter Energy Data Repository Programme is investigating the commercial feasibility of a repository that would enable this.
The most straightforward use for metered energy consumption data is to include the operational rating value on an EPC alongside a reference figure, such as a national average, modelled archetype, or historic consumption data for a property.
- Correcting energy consumption in a property for weather and normalising it by floor area would enable potential occupants to compare properties.
- An operational rating could be included as a part of the EPC or exist as a separate document.
EPCs should retain an asset rating that is based on standard assumptions of occupancy and use, to allow comparison between properties. This could be based on modelled or measured data.
For an accurate asset rating, metered energy consumption data can be used to calculate the heat transfer coefficient of buildings. This requires collecting internal temperature data, as well as metered energy consumption data. The latest smart meter in-home display units have inbuilt temperature sensors. The possibility of transmitting temperature readings alongside meter readings is being investigated by the Data Communications Company.
Accurate heat transfer coefficient figures can inform retrofit decisions. Further consideration is needed around the level of retrofit recommendations provided by EPCs and how these are used in policy decisions. Using metered energy consumption data to inform retrofit recommendations may be more suited to detailed retrofit plans such as renovation roadmaps.
Consumer consent will be needed to collect and process metered energy consumption data.
For further details, please read the report.
If you require the report in an alternative format, such as a Word document, please contact info@climatexchange.org.uk or 0131 651 4783.
The Scottish Government has set ambitions in its Hydrogen Action Plan to install at least 5 gigawatts of renewable and low-carbon hydrogen production capacity by 2030, and 25 gigawatts by 2045. Given Scotland’s hydrogen export ambitions, it is critical to understand any barriers to compliance with standards in potential markets, as well as Scotland’s international competitiveness as a hydrogen exporter.
This study aimed to compare existing and developing hydrogen sustainability standards globally; and to compare the greenhouse gas (GHG) emissions of hydrogen and derivatives exported from Scotland to the EU market with those from other regions in meeting EU requirements.
Summary findings
- Key hydrogen standards globally already set out different GHG calculation methodologies and compliance requirements for producers.
- With regard to GHG emissions, electrolytic hydrogen produced in Scotland and exported to the EU market could be one of the most competitive from the countries studied.
- When transported over short distances as compressed hydrogen via pipelines or ships, electrolytic hydrogen produced using low-carbon electricity is expected to meet the EU GHG threshold.
- Transporting hydrogen as ammonia leads to significantly higher GHG emissions.
- Only countries with a high share of low-carbon electricity on their grid can meet the EU GHG emission threshold for hydrogen produced from grid electricity.
- Many natural gas pathways modelled will not comply with the EU Gas Directive threshold. These pathways are highly sensitive to the GHG intensity of upstream natural gas production, which is uncertain and can be highly variable depending on the source (e.g. imported LNG with high intensities).
- GB’s electricity grid as a whole has a significantly higher GHG intensity than Scotland, so further clarity on the definition of bidding zones in the EU RED Delegated Act is critical.
- This GHG emission analysis could be combined with the previous ClimateXChange cost analysis to evaluate the overall competitiveness of these hydrogen pathways.
For further information on the findings please download the report.
If you require the report in an alternative format, such as a Word document, please contact info@climatexchange.org.uk or 0131 651 4783.
Note: This research was carried out in 2022/23 and was based on the market conditions at that time. Policy related to and emphasis on electricity networks has changed significantly since this research was conducted and therefore not all aspects of the report reflect the current landscape.
Solar panels can help decarbonise Scotland’s energy supply and there are plans to reduce barriers to enable greater deployment in Scotland. The Scottish Government recently consulted on the potential for a solar ambition and a Solar Vision is in development.
The solar industry has been calling for a 4-6 GW solar photovoltaic (PV) ambition by 2030, to put Scotland in line with the UK target of 70 GW by 2035. This can be broken down as 2.5 GW rooftop solar (1.5 GW domestic and 1 GW commercial), with the remaining capacity made up of large-scale grounded mounted solar.
This study investigates the benefits and impacts of deploying 2.5 GW of rooftop solar PV installation onto the electricity network in Scotland by 2030. The distribution network operators are forecasting lower levels of solar PV uptake in their future energy scenarios.
The study considers the benefits, high-level estimate of reinforcement investments needed to accommodate it and the potential impact on consumer bills. It also considers wider costs to the transmission network.
For further information on the findings, including potential benefits, impacts, costs and recommendations, please download the report.
If you require the report in an alternative format, such as a Word document, please contact info@climatexchange.org.uk or 0131 651 4783.
Research completed: October 2024
DOI: http://dx.doi.org/10.7488/era/5354
Executive summary
Scotland has set ambitions in its Hydrogen Action Plan to install at least 5 gigawatts of renewable and low-carbon hydrogen production capacity by 2030, and 25 gigawatts by 2045. Given Scotland’s hydrogen export ambitions, it is critical to understand any barriers to compliance with standards in potential markets, as well as Scotland’s international competitiveness as a hydrogen exporter.
Aims of the project
The main objectives of this study are to compare existing and developing hydrogen sustainability standards globally; and to compare the greenhouse gas (GHG) emissions of hydrogen and derivatives exported from Scotland to the EU market with those from other regions in meeting EU requirements.
Findings and recommendations
Key hydrogen standards globally already set out different GHG calculation methodologies and compliance requirements for producers. Hydrogen imported to the EU market currently must comply with rules set by the EU Renewable Energy Directive (RED) and the EU Gas Directive, if they are to contribute towards targets set under these policies. While an international standard is being developed (ISO 19870), it is unclear if the UK or EU will align with it in the future.
With regard to GHG emissions, electrolytic hydrogen produced in Scotland and exported to the EU market could be one of the most competitive from the countries we studied. Today, electrolytic hydrogen produced from renewable electricity in Scotland can already meet the EU RED GHG emission threshold (Figure 1). We refer to the GHG intensity of electricity used for Scotland pathways as the “Scottish grid” and use the National Grid country GHG intensity for Scotland rather than the GB grid electricity average GHG intensity. Of the other countries we considered, only Norway, with a grid that uses mainly hydro-electric power, can deliver electrolytic hydrogen to the EU with lower GHG emissions than Scotland. Further grid decarbonisation would increase the likelihood of compliance for hydrogen made from grid power, known as grid-connected electrolysis, by 2030. This would be the case even if, under EU rules, the Great Britain (GB) grid average factor has to be used instead of the (much lower) Scottish grid average.
When transported over short distances as compressed hydrogen via pipelines or ships, electrolytic hydrogen produced using low-carbon electricity is expected to meet the EU GHG threshold. This is applicable in both 2023 and 2030 to renewable hydrogen produced in Scotland, Norway and Morocco, and to hydrogen produced from nuclear power in France (Figure 1).
Transporting hydrogen as ammonia leads to significantly higher GHG emissions. Producers who rely on ammonia for long-distance transport from countries such as Chile and the USA may need to reduce emissions further to comply with EU policies, particularly if ammonia is reconverted to hydrogen for final use. Over shorter distances, hydrogen produced in Scotland or Norway using renewable electricity and transported as ammonia is likely to comply with the EU GHG emission threshold by 2030 (Figure 1). France will only meet the EU threshold if ammonia is used as the end-product in 2030 due to additional emissions from nuclear electricity inputs. Meeting the threshold requires further emission reduction measures such as using renewable electricity for hydrogen distribution.
Only countries with a high share of low-carbon electricity on their grid can meet the EU GHG emission threshold for hydrogen produced from grid electricity. In 2023, hydrogen produced from grid electricity in Norway could already meet the EU threshold when transported as compressed hydrogen. This could also be achieved in Scotland if compressed hydrogen is transported via pipelines. In 2030, all production pathways in Scotland can meet the EU threshold if the GHG emission intensity of grid electricity (emissions per kilowatt-hour of electricity generated) specific to Scotland decreases in line with policy aspirations. If using the GB grid emission intensity, only the pipeline transport pathway could meet the threshold by 2030, with grid decarbonisation in line with policy ambitions. Hydrogen produced from grids heavily reliant on fossil fuels such as those in Morocco, Chile and the USA will not be compliant (Figure 2).
Many natural gas pathways modelled will not comply with the EU Gas Directive threshold. These pathways are highly sensitive to the GHG intensity of upstream natural gas production, which is uncertain and can be highly variable depending on the source (e.g. imported LNG with high intensities). Based on the default upstream natural gas intensity published in the EU RED Delegated Act 2023/1185 (as the EU Gas Directive Delegated Act is not yet finalised), hydrogen produced from natural gas in the UK could be compliant when piped or shipped as compressed hydrogen (Figure 3). This would give it an emissions advantage over US natural gas-derived hydrogen, which is transported via ammonia.
GB’s electricity grid as a whole has a significantly higher GHG intensity than Scotland, so further clarity on the definition of bidding zones in the EU RED Delegated Act is critical. Using the GB grid GHG intensity average for grid-electrolysis projects in Scotland results in high risk of non-compliance with the EU GHG threshold whereas using data specific to Scotland would confer significant advantages on grid electrolysis projects, including exemptions from some EU requirements.
This GHG emission analysis could be combined with the previous ClimateXChange cost analysis to evaluate the overall competitiveness of these hydrogen pathways. Further work could provide a view on the costs of adopting renewable electricity across all the post-production supply chain steps, alternative renewable heat for the ammonia cracking step of relevant pathways and/or switching in 2030 to using only zero emission marine fuels for shipping pathways. Implementing the hydrogen and ammonia pathways modelled in this study may require significant investment in new infrastructure for some countries, and these infrastructure needs and any first-mover advantages could be investigated further.

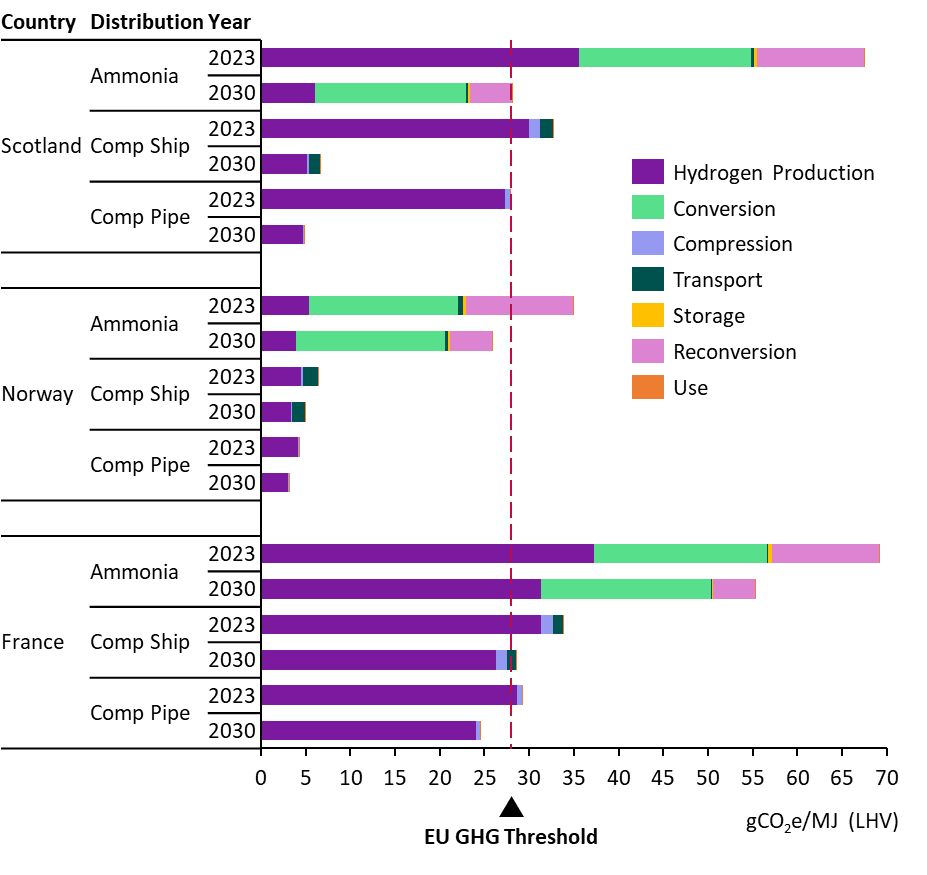

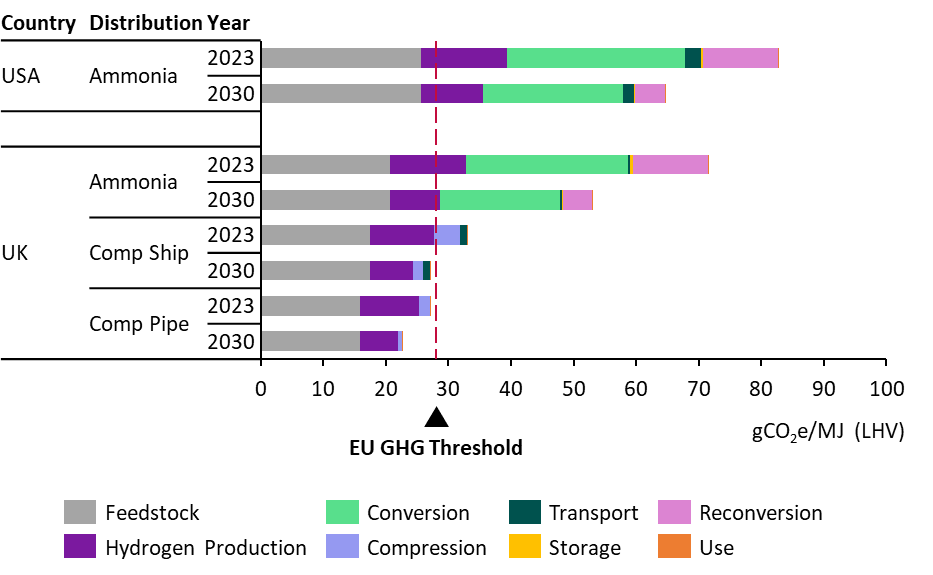
Abbreviations table
|
ATR |
Autothermal Reforming |
|
CCR |
Carbon Capture and Replacement |
|
CCS |
Carbon Capture and Storage |
|
CCU |
Carbon Capture and Utilisation |
|
CfD |
Contract for Difference |
|
CO2 |
Carbon Dioxide |
|
DA |
Delegated Act |
|
DESNZ |
Department for Energy Security and Net Zero |
|
EU RED |
European Union Renewable Energy Directive |
|
H2 |
Hydrogen |
|
GB |
Great Britain |
|
GH2 |
Green Hydrogen Standard |
|
GHG |
Greenhouse Gas |
|
GO |
Guarantee of Origin |
|
GREET |
Greenhouse gases, Regulated Emissions and Energy use in Transportation model |
|
GTP |
Global Temperature Potential |
|
GWP |
Global Warming Potential |
|
IPHE |
International Partnership for Hydrogen and Fuel Cells in the Economy |
|
IRA |
Inflation Reduction Act |
|
ISO |
International Organization for Standardization |
|
LCHS |
Low Carbon Hydrogen Standard |
|
LHV |
Lower Heating Value |
|
MJ |
Megajoule |
|
MPa |
Megapascal |
|
PPA |
Power Purchase Agreement |
|
PTC |
Production Tax Credit |
|
RCF |
Recycled Carbon Fuel |
|
REC |
Renewable Energy Certificate |
|
RES |
Renewable Energy Source |
|
RFNBO |
Renewable Fuel of Non-Biological Origin |
Introduction
In the 2022 Hydrogen Action Plan, Scotland set ambitions to install at least 5 gigawatts of renewable and low-carbon hydrogen production capacity by 2030, and 25 gigawatts by 2045 (Scottish Government, 2022). Given Scotland’s significant potential for hydrogen production using renewable electricity, the government has also published its Hydrogen Sector Export Plan (HSEP).
Low-carbon hydrogen is a nascent market, as most hydrogen used today is derived from fossil sources. As such, regulations, standards and schemes are being put in place globally to promote the use of low-carbon hydrogen, as well as to ensure that its production and use are sustainable. For example, in the UK, the Low Carbon Hydrogen Standard (DESNZ, 2023) has been established and continues to evolve. EU rules exist for renewable hydrogen pathways and are being developed for non-renewable pathways. Additionally, a global standard for hydrogen lifecycle GHG emissions is under development.
The main objective of this study is to compare existing and developing hydrogen lifecycle GHG standards globally and quantify how the GHG emissions (including not only carbon dioxide but other GHGs such as methane and nitrous oxide) of Scottish exports to the EU, in various forms, would compare against those from other regions in meeting EU requirements. Results from this report supported the development of the Hydrogen Sector Export Plan (HSEP) by identifying potential barriers to compliance with standards in potential markets, as well as Scotland’s international competitiveness as a hydrogen exporting country.
This report is a follow-up to a previous CXC project: “Cost reduction pathways of green hydrogen production in Scotland – total costs and international comparisons” (Arup, 2024).
International hydrogen standards
Several hydrogen standards, sustainability schemes and policies have recently been developed to support the implementation of national hydrogen strategies around the world. These standards typically set out a GHG emission calculation methodology and (where applicable) a maximum GHG emission intensity, as well as broader sustainability criteria and evidence requirements for eligible hydrogen pathways to comply with.
This section provides summary tables of those standards/schemes/relevant policies (referred to as standards thereafter when referenced collectively) listed in Table 1 and provides a snapshot of the key criteria. A detailed review of each standard can be found in Appendix B which focuses the discussion on key differences, along with key uncertainties and potential changes. The UK Low Carbon Hydrogen Standard (LCHS) is used as a benchmark for this comparison, as it sets the requirements for producers in Scotland receiving UK Government support. This review includes:
The scope of each standard, including:
- The type of standard (mandatory, voluntary), and who it was developed by.
- Geographies covered.
- Implementation status.
Eligibility criteria:
- Conversion technology or feedstock restrictions, including any biomass feedstock sustainability rules.
- Any GHG emission intensity thresholds.
- Any categories of hydrogen labelled by the standard.
GHG calculation methodology, including:
- System boundary – which parts of the supply chain are in or out of scope of the GHG emissions calculations. This can vary between standards, thereby potentially omitting or including significant emissions, and making comparison of results challenging between different standards.
- Splitting of emissions across co-products. When systems produce multiple outputs (product, co-products, wastes, residues, etc.), GHG emissions must be assigned between them. This can be done through various approaches, including through an allocation of emissions based on the relative masses, energy contents or economic value of the (co-)products. This can also be done by looking at the products these co-products would replace in the market (via system expansion) to assign substitution credits. Typically, wastes and residues are not assigned emissions. A full discussion of the various methods is provided in Appendix A.
- Reference flow – a set pressure and/or purity for the hydrogen product. Hydrogen produced at a lower pressure or purity may be required to account for the emissions for theoretical compression and/or purification to reach the reference flow, and in some standards, hydrogen produced at a higher pressure and/or purity than the reference may be given an emissions credit.
Other relevant requirements, such as:
- Chain of custody. This is the process of following and evidencing materials through steps of the supply chain, which provides insights into the product’s origin, components, processes, and handlers. As illustrated in Appendix A, there are different chain of custody models, and while some standards are explicit and prescriptive in their requirements on how to trace feedstocks and hydrogen products, others are not; and
- Renewable electricity sourcing. Some standards may impose requirements to ensure the use of renewable electricity for hydrogen production does not negatively impact the wider grid. These can include temporal correlation (matching generation with consumption over defined time periods), geographical correlation (rules about locations and grid connections) and “additionality” (hydrogen production contracting with new, rather than existing, renewable electricity generation).
In addition to national or regional standards and policies, and several voluntary schemes[1], a global hydrogen lifecycle GHG standard is also currently being developed by the International Organization for Standardization (ISO). This could enable greater harmonisation of GHG emission calculation methodologies across the globe. The implications of this scenario will be explored further in Chapter 3.
|
Region |
Relevant hydrogen standards[2] |
|---|---|
|
UK |
|
|
EU |
|
|
US |
|
|
International |
|
Summary of hydrogen standards
|
Standard |
Geographic scope |
Type of standard |
Status |
System boundary |
|---|---|---|---|---|
|
UK LCHS |
UK producers |
Mandatory government standard for accessing subsidy schemes |
Implemented. V3 is live (Dec 2023) |
Cradle to production gate |
|
EU RED |
Hydrogen consumed in the EU |
Directive (with Delegated Acts) |
REDII (Dec 2018) is fully transposed into Member State legislation and Delegated Acts (Feb 2023) are live. REDIII implemented (Oct 2023) but still being transposed |
Cradle to use |
|
EU Gas Directive |
Hydrogen consumed in the EU |
Directive (with draft Delegated Act) |
Implemented (July 2024), but still being transposed into Member State legislation. Delegated Act is pending, due by July 2025 |
Cradle to use |
|
CertifHy |
Hydrogen producers in EU, EEA and CH |
Voluntary standard, industry developed |
Implemented. V2 is live (April 2022) |
Cradle to production gate |
|
France Energy Code L. 811-1 |
Hydrogen consumed in France |
Mandatory standard for accessing subsidies, Government developed |
Implemented. V1 is live (July 2024) |
Cradle to use |
|
US IRA 45V |
US producers |
Tax credit |
Implemented. March 2024 revision is live |
Cradle to production gate |
|
IPHE |
Global producers and consumers |
Voluntary transnational effort on GHG methodology harmonisation |
Implemented. V3 is live (July 2023) |
Cradle to use |
|
ISO 19870 |
Global producers |
Voluntary standard, ISO developed |
Technical Specification published in Dec 2023, full standard 19870-1 under revision during 2024, due to be finalised in 2025 |
Cradle to production gate. ISO 19870 series will next look at downstream hydrogen vectors |
|
TÜV SÜD |
Global producers |
Voluntary standard, industry developed |
Implemented. V 11/2021 is live (Nov 2021) |
Cradle to production gate (GreenHydrogen), or to point of use (GreenHydrogen+) |
|
TÜV Rheinland |
Global producers |
Voluntary standard, industry developed |
Implemented. V2.1 is live (March 2023) |
Cradle to production gate or to point of use |
|
GH2 |
Global producers |
Voluntary standard, industry developed |
Implemented. V2 is live (Dec 2023) |
Cradle to production gate |
|
Scheme |
GHG threshold |
Category |
Eligible pathways |
Eligible main inputs |
Biomass sustainability |
|---|---|---|---|---|---|
|
UK LCHS |
20 gCO₂e/MJLHV |
“Low carbon” |
Electrolysis, Fossil/Biogenic gas reforming with CCS, Biomass/Waste gasification, Gas splitting producing Solid Carbon. Pathways can be added |
Electricity (all types), Fossil fuels, Biomass, Bio/fossil wastes & residues |
Biomass inputs must meet relevant Forestry, Land and/or Soil Carbon criteria, and report indirect land use change GHGs |
|
EU RED |
28.2 gCO₂e/MJLHV |
“Biofuel”, “RFNBO”, “RCF” |
All production pathways eligible but feedstock dependent |
Renewable electricity, Biomass & Fossil wastes |
Biomass feedstocks must meet relevant Forestry, Land and/or Soil Carbon criteria |
|
EU Gas Directive |
28.2 gCO₂e/MJLHV |
“Low carbon fuel” |
All pathways eligible |
Non-renewable energy sources |
Follows RED, where applicable |
|
CertifHy |
36.4 gCO₂e/MJLHV |
“Green” |
All pathways eligible |
Renewable energy sources |
Not specified |
|
“Low-carbon” |
Non-renewable sources | ||||
|
France Energy Code L. 811-1 |
28.2 gCO₂e/MJLHV |
“Renewable”, |
RFNBOs, RCF, nuclear-based |
Follows EU RED and adds nuclear electricity |
Follows EU RED |
|
US IRA 45V |
Increasing tax credits at 33.3, 20.6, 12.5 or 3.75 gCO₂e/MJLHV |
“Clean” |
All pathways eligible. Those not in 45V-GREET can apply for a “provisional emissions rate” |
Electricity (all types), Fossil fuels, Biomass |
None |
|
IPHE |
None, only a method |
No categories |
Electrolysis, steam cracking, fossil gas reforming + CCS, coal or biomass gasification + CCS, biomass digestion + CCS. More will be added |
Fossil fuel, Biomass, Bio/fossil wastes & residues |
Not specified |
|
ISO 19870 |
None, only a method |
No categories |
All pathways eligible |
Feedstock neutral |
None |
|
TÜV SÜD |
28.2 gCO₂e/MJLHV |
“Green” |
Electrolysis, Biomethane steam reforming, Glycerine pyro-reforming |
Renewable electricity, Bio waste/residue, Biomass |
Biomass feedstocks must meet EU RED criteria |
|
TÜV Rheinland |
28.2 gCO₂e/MJLHV |
“Renewable” |
Renewable electrolysis |
Renewable electricity |
Not specified |
|
“Low-carbon” |
All production pathways |
Feedstock neutral | |||
|
GH2 |
8.33 gCO₂e/MJLHV |
“Green” |
Electrolysis |
Renewable electricity |
Low iLUC risk, non-biodiverse land |
|
Scheme |
Chain of Custody |
Co-product allocation |
Reference flow |
Renewable power evidence |
|---|---|---|---|---|
|
UK LCHS |
Mass balance used, but cannot blend biomethane with nat gas (upstream) |
LHV energy allocation (Carnot efficiency for heat), plus system expansion for waste fossil feedstock counterfactual |
3 MPa, 99.9 vol% purity. If below, adjustment required |
Additionality not required. PPA with 30-minute temporal correlation from UK generator needed, or avoided curtailment proof |
|
EU RED |
Mass balance (H2 + upstream) |
LHV energy allocation (Carnot efficiency for heat). If co-product ratio can change, physical causality used. If co-product has zero LHV, economic allocation used |
None |
Renewable PPAs complying with additionality, temporal and geographic correlation rules |
|
EU Gas Directive |
Mass balance (H2 + upstream) |
Assumed to follow EU RED |
None |
In line with EU RED Delegated Act for RFNBOs |
|
CertifHy |
Book & Claim as GOs allowed (upstream) |
Defined approach for each pathway broadly follows EU RED. O2 method TBC |
Same as UK LCHS |
GOs are allowed. No additional requirements. |
|
France |
Follows EU RED |
Follows EU RED |
None |
Follows EU RED |
|
US IRA 45V |
None specified, but proposed mass balance for biomethane (upstream) |
System expansion. Restrictions placed on the size of steam co-product credit |
2 MPa, 100% purity. Adjustment required for higher/lower |
PPAs complying with additionality, temporal and geographic correlation |
|
IPHE |
None specified but GOs allowed (upstream) |
Follows hierarchy but recommended approach for each pathway differs |
Not specified |
GOs are allowed. Additionality not required. |
|
ISO 19870 |
None specified but GOs allowed (upstream) |
Can be system expansion or attributional. Approach defined for pathways differ |
None. GHG increase to reflect impurities and their release |
Grid GOs are allowed if ISO 14064-1 “proper quality criteria” are met |
|
TÜV SÜD |
Mass balance (H2 + upstream) |
Follows EU RED, but chlor-alkali has choice of energy allocation, economic allocation or system expansion |
Same as UK LCHS |
GreenHydrogen must follow EU RED. GreenHydrogen + must meet more stringent additionality rules. |
|
TÜV Rheinland |
None specified but assumed to follow EU RED & Gas Directive |
Assumed to follow EU RED & Gas Directive |
None |
PPAs to have temporal correlation (up to yearly) and geographic correlation within the same country. Additionality not required. |
|
GH2 |
Follows IPHE |
System expansion recommended, as oxygen nil LHV |
Same as UK LCHS |
Additionality, temporal and geographical correlations are allowed but not required |
Lifecycle GHG emission intensity of hydrogen pathways for import to the EU market
The GHG emission intensity of various hydrogen pathways from Scotland and other exporting countries were calculated using ERM’s in-house GHG assessment model. The hydrogen pathways modelled used a combination of the production, distribution, and use steps, set out in Table 5 below. For a comprehensive list of the GHG pathways modelled, refer to Appendix D, and see Table 8 for the assumptions and references used in the modelling process.
|
Production location |
Hydrogen production types |
Hydrogen transport |
Final use |
|---|---|---|---|
|
Scotland Norway France Morocco USA Chile UK |
Electrolysis using grid electricity Electrolysis using renewable electricity (excluding France) Electrolysis using nuclear electricity (only in France) Natural gas autothermal reforming with carbon capture & sequestration (ATR + CCS) |
Ammonia shipping Ammonia shipping with reconversion to hydrogen Compressed hydrogen shipping Compressed hydrogen pipeline |
Hydrogen in refinery boiler Ammonia in marine vessel |
Methodologies used to model lifecycle GHG emission intensity of imported hydrogen pathways
Section 2 detailed the various GHG calculation methodologies and compliance requirements set by key hydrogen standards that are currently active globally. In the EU market, EU RED and the EU Gas Directive currently set the eligibility criteria and the methodology for calculating the GHG emission intensity for imported hydrogen. As the hydrogen market becomes more established and globalised, there could be growing interest globally in harmonising approaches for GHG accounting (e.g. through alignment with ISO 19870). However, the EU has not yet expressed any intentions to do so. As such, two scenarios can be envisioned regarding possible evolutions of the EU’s approach for calculating life-cycle GHG emissions of hydrogen:
- Business-as-usual: The EU RED and EU Gas Directive will continue to apply for hydrogen imported in the EU, regardless of global methodologies such as ISO 19870.
- International alignment: The EU aligns with ISO 19870 at some future point in time, after publication.
The components of calculating the GHG emissions under these scenarios can be found in Appendix C. The key methodological differences considered during modelling include:
- System boundary: The system boundary for EU policies is ‘cradle-to-use’, whereas ISO/TS 19870 uses ‘cradle-to-production gate’. Results under scenario 2 therefore exclude potentially significant emissions from distribution of hydrogen to the EU.
- GHG threshold: EU sets a GHG threshold of 28.2 gCO2eq/MJLHV hydrogen, whereas ISO does not set a GHG threshold. As such, compliance with GHG thresholds were only carried out for results using the EU methodology.
- Reference flow: EU RED and the EU Gas Directive do not set a reference flow. The reference flow under ISO 19870 is set by the end-user but the GHG intensity is adjusted upwards for (project specific) impurities and their release.
- Co-product emission assignment: For electrolysis with co-product oxygen sales, economic allocation is required by EU RED, whereas ISO/TS 19870 currently recommends economic allocation or system expansion. For fossil gas reforming, the EU Gas Directive DA currently uses LHV energy allocation (with steam Carnot efficiencies), whereas ISO/TS 19870 has sub-division then LHV energy allocation (using steam enthalpy changes) or else system expansion. However, as no co-products are modelled for either electrolysis or reforming pathways in this study (it is assumed for simplicity there are no oxygen or steam customers), 100% of emissions in both scenarios are assigned to the hydrogen product.
At the time of writing this report, a draft version of the EU Gas Directive DA had been released for consultation and is still therefore subject to revision. This report follows the draft DA methodology to assess the GHG emissions of fossil natural gas hydrogen pathways under the BAU scenario (as outlined in Appendix C). However, due to uncertainty about the timings of reporting under the EU Methane Regulations, this report does not apply conservative default values for upstream natural gas emissions from the draft DA, and instead relies on the upstream natural gas GHG intensity given in the final published RED DA.
GHG emission intensity results
This section presents GHG emission results for various hydrogen production pathways under EU and ISO methodologies, including hydrogen used in refinery boilers and ammonia for marine vessels. Modelling have been carried out for production in 2023 and 2030 to reflect potential impacts from decarbonisation projections (e.g. grid decarbonisation, increased use of renewable fuels in transport), and technology improvements.
Specifically for the modelling of hydrogen production in Scotland, the National Grid country GHG intensity for Scotland is used, rather than the GB grid electricity average GHG intensity. From this point forward, the GHG intensity of electricity used for Scotland pathways is referred to as the “Scottish grid”.
In addition, a sensitivity analysis was conducted on the following parameters:
- Using renewable electricity across the entire pathway
- Using renewable heat for the ammonia cracking step of relevant pathways
- Using low-carbon marine fuel for shipping pathways
- Using the UK vs Scottish grid average intensity
Further details and results of this sensitivity analysis are given in Appendix F. These results are used in the GHG emission compliance scoring matrix to assess whether a previously non-compliant production pathway can adopt mitigation measures to meet the EU GHG threshold. This matrix can be found in Appendix G.
GHG emission results for pathways producing hydrogen for use in a refinery boiler under EU methodologies
A breakdown of the GHG emissions at each stage of the hydrogen production life-cycle is provided in Figure 1, Figure 2 and Figure 4. The value chain steps included in each stage include:
Feedstock emissions: this is only relevant to natural gas pathways (Figure 3), and accounts for the upstream emissions of natural gas inputs (e.g. extraction, transport, pre-processing, including methane leakage).
Hydrogen production emissions: these arise from the electrolysis or natural gas autothermal reforming with carbon capture (ATR+CCS) processes. Sources of emissions include electricity consumption, uncaptured fossil CO2 and chemical inputs.
Distribution emissions: these include compression, transport, storage, reconversion and downstream emissions. The emissions depend significantly on the hydrogen transport pathways.
- Ammonia pathways include conversion of hydrogen to ammonia, transport via truck to a port, port storage, shipping to Rotterdam, port storage, reconversion/cracking ammonia to hydrogen (requiring heating and catalysts), transport via pipeline to a refinery, and end use of hydrogen in a refinery combustion boiler.
- A separate end use case is modelled where instead of cracking and hydrogen transport, ammonia stored in Rotterdam is loaded onto a maritime vessel for combustion in the propulsion engines.
- The compressed hydrogen shipping pathways include compression of hydrogen for trucking, transport of hydrogen via truck to a port, port storage, shipping to Rotterdam, port storage, transport via pipeline to a refinery, and use of hydrogen in refinery combustion boiler.
- The compressed hydrogen pipeline pathways include compression of hydrogen, piping to Rotterdam, transport via pipeline to a refinery, and end use of hydrogen in a refinery combustion boiler.
- Transport to the EU via pipeline or via compressed hydrogen shipping were not modelled for the USA and Chile due to the long transport distance making these options unviable, following the previous ClimateXChange report.
The input values and assumptions used in the GHG modelling are detailed in Appendix E.
Figure 1 represents the GHG intensity of pathways that use renewable electricity for electrolytic hydrogen production, followed by distribution to the EU (using grid electricity and gas), before use of gaseous hydrogen in a refinery boiler. The exception is nuclear electricity with an emission factor of 3.64 gCO2e/MJ elec[3] being assumed to be used for electrolysis in France, which leads to higher production emissions compared to other regions using renewable electrolysis (0 gCO2e/MJ elec).
These results show that hydrogen produced from renewable electricity-based electrolysis is likely to meet the EU GHG threshold when transported as compressed hydrogen. However, transporting compressed hydrogen via ships generates higher emissions compared to transport via pipeline due to the fuel used for trucking and shipping, plus additional electricity requirements for storage at the shipping ports.
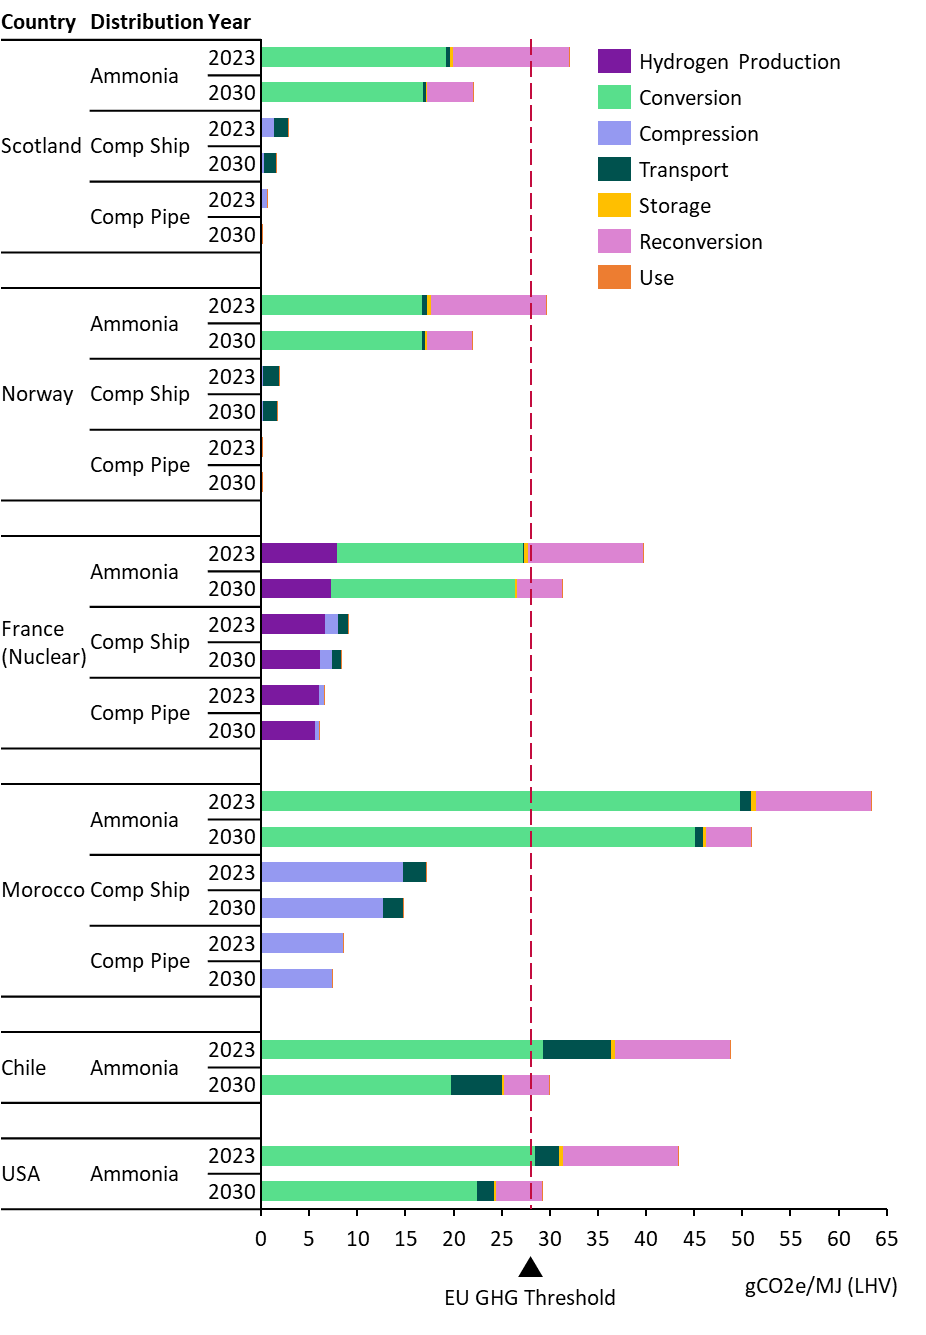
Emission intensities of hydrogen using ammonia as an intermediary vector are significantly higher than those of gaseous hydrogen pathways and may not meet the EU threshold in 2030. This is primarily due to the use of grid electricity in distribution steps, the efficiency losses in the (re)-conversion steps, and the release of nitrous oxide during ammonia production. Only Norway and Scotland might comply by 2030, due to low enough emission grid electricity in these countries. Emissions from the conversion step (ammonia production) remain significant in 2030 due to the release of nitrous oxide emissions, and the ammonia cracking step uses Netherlands grid electricity which has a high GHG intensity (although this improves significantly by 2030).
Figure 2 below shows the GHG intensity results if grid electricity is used for electrolysis instead of renewable electricity. Note the change in x-axis scale between the two graphs.
In these pathways, the emissions factor of the grid is the most important contributor to overall GHG emissions intensity of delivered hydrogen. Decarbonisation of electricity grids in some countries (i.e. Scotland and France) may enable some of the pathways to achieve the EU GHG threshold in 2030. However, gaseous pathways from Norway are expected to already comply.
For Scottish pathways, the average grid factor for Scotland was used in the GHG modelling (see Appendix E for details). This assumes that the Scottish grid intensity could be used under EU rules instead of the GB grid average, however, it remains unclear how EU rules on bidding zones apply to Scotland. A sensitivity analysis in Appendix F explores the GHG impact of using the GB grid average compared to the Scottish grid average. The results in Figure 2 show that using the Scottish grid factor in electrolysis results in the GHG emission intensity of piped and shipped compressed hydrogen pathways close to the EU GHG threshold in 2023 but easily achieving it by 2030 as the Scottish grid decarbonises. Ammonia pathways from Scotland may just meet the threshold in 2030 as electricity grids in Scotland and the Netherlands decarbonise.
Pipeline hydrogen pathways are all expected to fall below the EU GHG threshold in 2030 as electricity grids decarbonise, except for Morocco, which has a significantly higher grid GHG intensity compared with other countries. Hydrogen production in countries with high shares of fossil fuel power generation in their grid mix will have to rely on renewable electricity (Figure 1 results) to export to EU markets. For example, neither of the grid electrolysis pathways from Chile or the USA are expected to be able to meet the EU threshold, due to both high grid GHG intensities and additional emission arising from ammonia supply chains.
It is important to note that hydrogen produced from grid electricity is likely to have both renewable and non-renewable consignments. Both consignments will have the same GHG intensity under EU rules, and if this is low enough to meet the EU GHG threshold, the renewable fraction may be eligible as a RFNBO under EU RED, and the non-renewable fraction may be eligible under the EU Gas Directive.

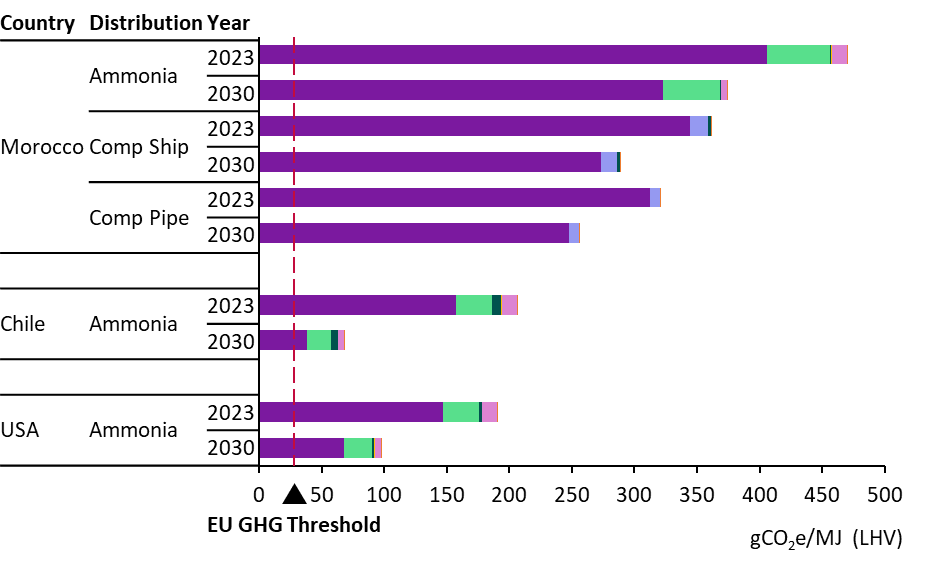
As shown in Figure 3, natural gas reforming with CCS pathways may struggle to meet the EU Gas Directive’s GHG emission threshold (same as the EU RED threshold). The emissions of hydrogen produced from these pathways are very sensitive to upstream natural gas intensities, which are highly uncertain and can be highly variable depending on the source of natural gas (e.g. imported LNG can have much higher intensities than domestic gas supplies used for hydrogen production).
The European Commission is expected to establish a methodology for calculating the methane emissions of fossil feedstocks (including natural gas) at a producer level by 2027. In the absence of this more accurate data, an upstream natural gas intensity of 12.7 gCO2e/MJLHV natural gas was used to model both USA and UK reforming pathways, based on the published generic value in the EU RED DA. However, individual producers or countries could have intensities significantly above this value. This value will likely need to be updated as more accurate, audited data is reported by the fossil gas industry.
In the UK, pathways with compressed shipping or pipeline could meet the EU GHG emission threshold. In contrast, long transport distances from the USA to the EU means that it is not feasible to transport hydrogen via compressed shipping or pipeline (requiring large additional emissions from ammonia distribution), leading to the UK natural gas pathways via compressed hydrogen distribution having a significant GHG advantage compared with ammonia pathways from the USA.

GHG emission results for pathways producing ammonia for use in a marine vessel under EU methodologies
Ammonia was also modelled as the end-product for use in a marine vessel in Rotterdam. As shown below in Figure 4, Figure 5 and Figure 6, GHG emissions of these ammonia use pathways are lower than pathways with hydrogen as the end-product because ammonia reconversion back to hydrogen is not required. As in the previous analysis, grid electricity is assumed to be used for ammonia distribution (conversion, storage, reconversion) in both grid and renewable electricity-based electrolysis pathways.
Ammonia produced using renewable electricity (Figure 4) is likely to comply with the EU GHG threshold in 2023 and 2030 in both Scotland and Norway, and may just comply in France by 2030. Similar to the earlier analysis, production in the US and Chile may still struggle to comply, as the conversion step (ammonia production) accounts for a significant portion of the total pathway emissions. This is due to the release of nitrous oxide emissions, the use of grid electricity in distribution and losses in conversion efficiency.
Grid electricity-based ammonia produced in all countries modelled in this study (Figure 5) is unlikely to meet the threshold, except for Norway in both years and for Scotland in 2030. As discussed in the previous section, only the renewable portion of the ammonia would likely qualify under EU RED, the remaining portion would need to qualify under the EU Gas Directive. As shown in Figure 6, even avoiding emissions from reconversion of ammonia to gaseous hydrogen does not sufficiently reduce the emissions of natural gas reforming pathways via ammonia to comply with the EU GHG threshold.
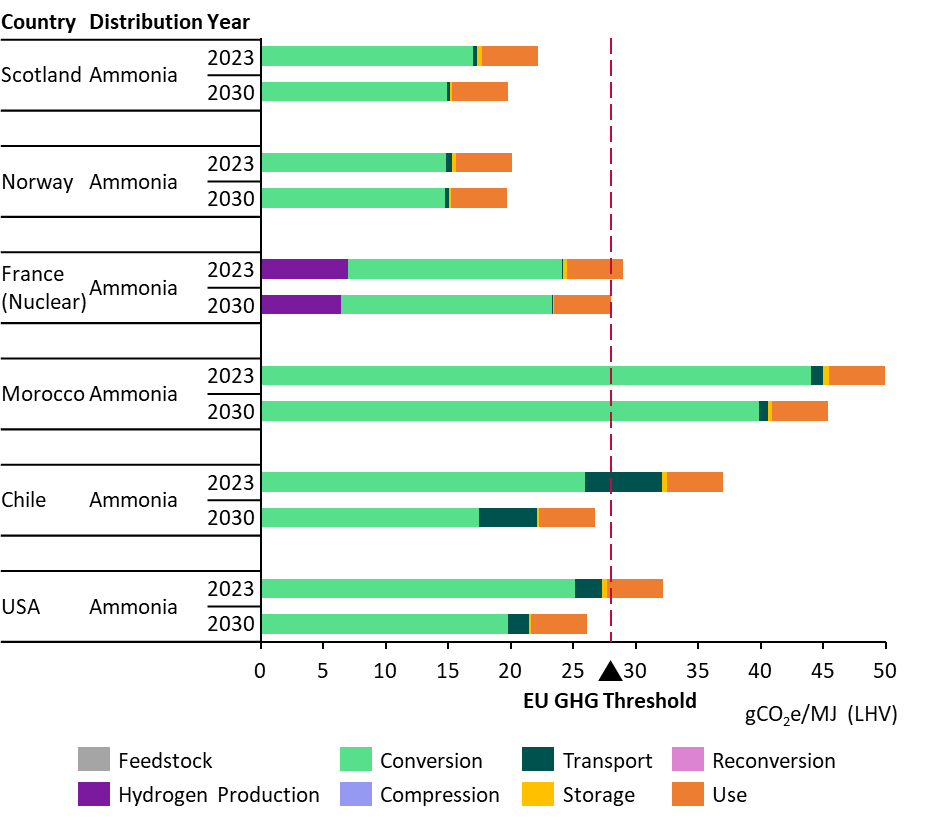
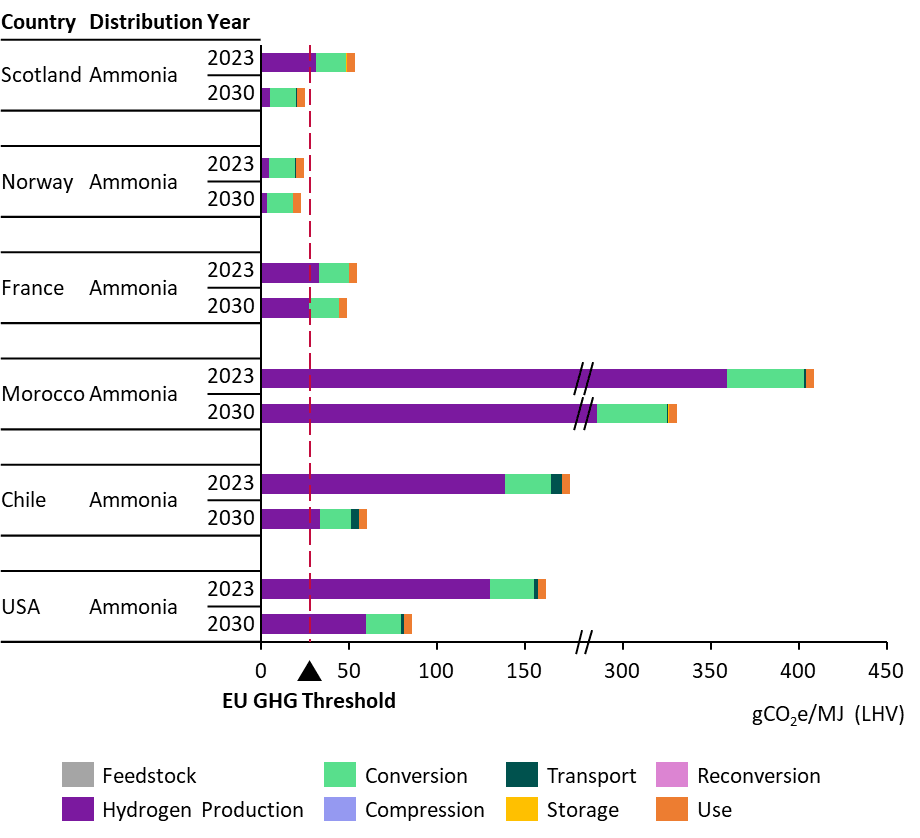
gCO2e/MJ (LHV)
Processing
Conversion
Compression
Transport
Storage
Reconversion
Downstream
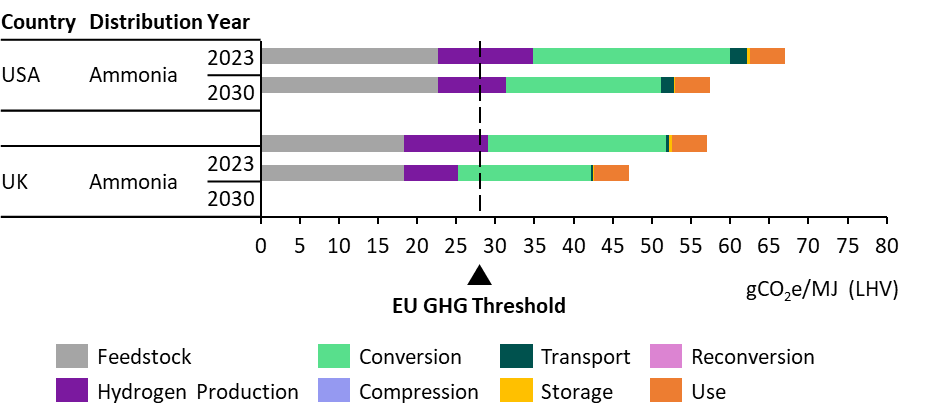
GHG emission results for hydrogen production pathways under ISO 19870 methodology
The GHG emission intensities of pathways modelled under the ISO methodology are shown below in Figure 7. Only emissions from feedstock and hydrogen production are modelled given the current ISO 19870 system boundary is “cradle to production gate” and does not include any downstream steps. There is also no GHG emissions threshold under ISO 19870, so compliance is not assessed.
Emissions for renewable electrolysis pathways are close to zero because there are only very small emissions for consumed water and minor chemicals. Emissions for delivered wind, hydro and solar electricity are considered to be zero, as in EU RED. Once again, grid electricity intensities dominate the grid electrolysis results.
For the natural gas reforming pathways, the difference in emissions between the UK and USA is mainly due to differences in upstream natural gas emissions intensities and grid electricity intensities. Under the ISO methodology, which allows producer, region or country-specific data to be used, the upstream natural gas intensities in the ISO analysis are assumed to be 8.7 and 9.2 gCO2e/MJLHV natural gas for the UK and USA respectively, based on current published UK and US government data.
These values could be significantly underestimating true upstream emissions, including the impact of LNG imports and methane leakage rates, and are lower than the generic single value the EU RED DA applies to all natural gas supplies (12.7 gCO2e/MJLHV natural gas). However, UK and US government data is likely to be updated more frequently (e.g. annually) in light of new evidence or updated gas source mixes compared to the single value published in the EU RED DA (which is based on the JEC WTT v5 study from 2020).
Those applying the ISO methodology are not required to use government estimates and could use other credible sources, including producer-specific data. This means that natural gas intensities under the ISO method are likely to vary significantly between projects, although where several credible options exist, there may be pressure from projects to choose lower values. In contrast, the EU Gas Directive requires the phasing in of producer-specific methane intensity data and does not give a choice as to which dataset to use.
The ISO 19870 method requires adjustments upwards for impurities by mass, and applies GWPs assuming the impurities are released. This may slightly affect the results, depending on the project-specific impurities. The engineering design data used assumes high purities (>99.9% by volume), so hydrogen product compositions were not modelled. However, for hydrogen production facilities that generate hydrogen at lower purities (e.g. 95-99% by volume), these impurity adjustments have a more significant impact, as hydrogen purity by mass is significantly lower than purity by volume.
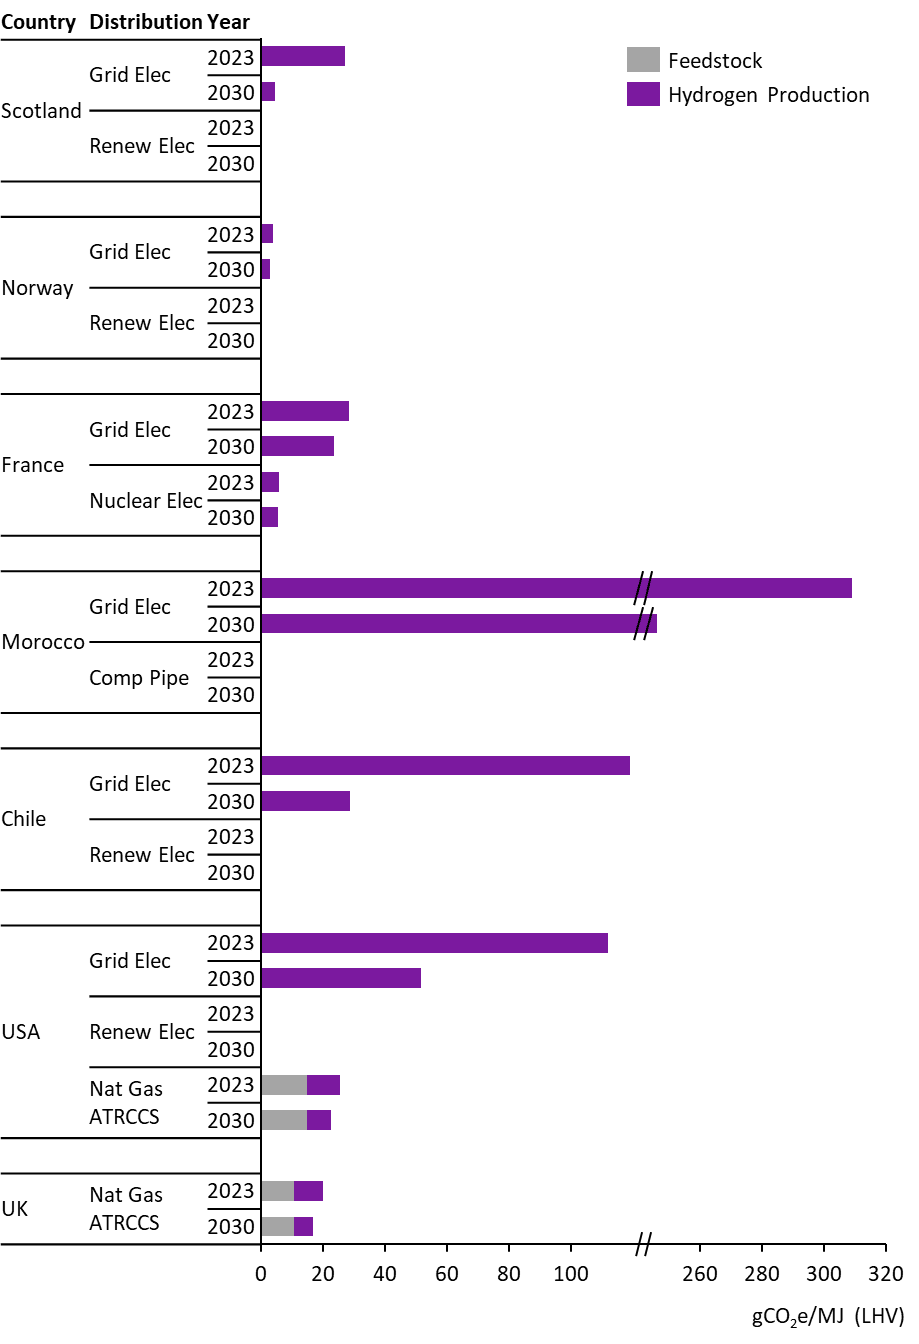
Conclusions and recommendations
Key hydrogen standards globally already set out different GHG calculation methodologies and compliance requirements for producers. Hydrogen imported to the EU market must comply with rules set by the EU Renewable Energy Directive (RED) and the EU Gas Directive, if they are to contribute towards targets set under these policies. While an international standard is being developed (ISO 19870), it is unclear if the UK or EU will align with it in the future.
With regard to GHG emissions, electrolytic hydrogen produced in Scotland and exported to the EU market could be one of the most competitive among the countries we studied. Today, electrolytic hydrogen produced from renewable electricity in Scotland can already meet the EU RED GHG emission threshold. Further grid decarbonisation would increase the likelihood of compliance for grid connected electrolysis by 2030, even if the GB grid average factor has to be used under EU rules instead of the (much lower) Scottish grid average. Of the other countries considered in this study, only Norway with its hydro-electric dominated grid can deliver electrolytic hydrogen to the EU with lower GHG emissions than Scotland.
When transported over short distances as compressed hydrogen via pipelines or ships, electrolytic hydrogen produced using low-carbon electricity is expected to meet the EU GHG threshold. This applies in both 2023 and 2030 to renewable hydrogen produced in Scotland (930 km), Norway (1,312 km) and Morocco (2,747 km by ship, 1,930 km by pipeline), as well as nuclear electricity-derived hydrogen from France (261 km by ship, 435 km by pipeline).
Transporting hydrogen as ammonia leads to significantly higher GHG emissions. Producers relying on ammonia for long-distance transport from countries such Chile and the USA may need to adopt additional emission reduction measures to comply with EU policies, particularly if ammonia is reconverted to hydrogen for final use. Over shorter distances, hydrogen produced in Scotland or Norway using renewable electricity and transported as ammonia is likely to comply with the EU GHG emission threshold by 2030. However, in France, ammonia pathways will only meet the EU threshold if ammonia is used as the end-product in 2030 due to additional emissions from nuclear electricity inputs. Meeting the threshold requires further emission reduction measures such as using renewable electricity for hydrogen distribution.
Only countries with a high share of low-carbon electricity on their grid can produce grid-based electrolytic hydrogen meeting the EU GHG threshold. In 2023, grid electricity-based hydrogen from Norway can already meet the EU threshold when transported as compressed hydrogen. Scotland could also achieve compliance if compressed hydrogen is transported via pipelines. By 2030, all production pathways in Scotland can meet the EU threshold if the GHG intensity of grid electricity specific to Scotland decarbonises in line with policy aspirations. However, if GB’s grid emission intensity is used, only the hydrogen pipeline transport pathway could meet the threshold by 2030, assuming the grid decarbonises as planned. Hydrogen produced from fossil heavy electricity grid mixes such as those in Morocco, Chile and the USA will not be compliant.
Many natural gas pathways modelled will not comply with the EU Gas Directive threshold. These pathways are highly sensitive to the upstream GHG intensity of natural gas, which is uncertain and can be highly variable depending on the natural gas source (e.g. imported LNG with high intensities). Based on the default upstream natural gas intensity published in the EU RED Delegated Act 2023/1185 (as the EU Gas Directive Delegated Act is not yet finalised), natural-gas derived hydrogen produced in the UK could be compliant when piped or shipped as compressed hydrogen, giving it an emissions advantage over US natural gas-derived hydrogen (transported via ammonia).
GB’s electricity grid has a significantly higher GHG intensity than Scotland, so further clarity on the definition of bidding zones in the EU RED Delegated Act is critical. Using the GB grid average for grid-electrolysis projects in Scotland results in high risk of non-compliance with the EU GHG threshold (see Appendix F for results of this analysis), whereas use of grid GHG intensity data specific to Scotland would confer significant advantages on grid electrolysis projects, including exemptions from some EU requirements.
This GHG emission analysis could be combined with the previous CXC cost analysis to evaluate the overall competitiveness of these hydrogen pathways. Further work could also provide a view on the costs of adopting the different emission reduction measures discussed in the sensitivity analysis section of this report. Appendix H provides an abatement cost methodology, to calculate the minimum cost of compliance for those pathways above the EU GHG threshold but where emissions reduction measures could lead to compliance. We also note that implementation of the hydrogen and ammonia pathways modelled in this study may require significant investment in new infrastructure for some countries, and these infrastructure needs and any first-mover advantages could be investigated further.
Recommended next steps
The following recommendations could be considered for follow-on work:
- Expand the sensitivity analysis to cover additional sensitivities:
- Low-emission trucking
- Nitrous oxide mitigation
- Sensitivities in 2023, given several grid-electrolysis pathways do not consider any sensitivities in 2023
- Expand the analysis to include:
- Other distribution options e.g. methanol, liquid organic hydrogen carriers (LOHC)
- Additional time periods e.g. 2040 and 2050
- Additional emerging export regions e.g. Oman, Egypt, Australia, Namibia
- Combine the previous CXC cost analysis with the GHG emission analysis in this study to evaluate the overall competitiveness of the hydrogen and ammonia pathways
- Integrate upstream fossil fuel emissions intensity data once more reliable data is available e.g. EU methane regulations, any UK studies
We also suggest engagement with policymakers on the following aspects:
- Confirm with the European Commission whether Scotland counts as a country with its own GHG intensity or whether the GB grid bidding zone takes priority
- The EU Gas Directive Delegated Act as it is finalised and published, as interpretation of these rules could significantly impact fossil pathways
- The potential impacts of ISO 19870 once published, including the level of EU engagement or willingness to align with the standard, and when downstream hydrogen vectors e.g. ammonia will be included in future iterations of ISO 19870.
References
Arup. (2024). Cost reduction pathways of green hydrogen production in Scotland – total costs and international comparisons. Available at: https://www.climatexchange.org.uk/projects/green-hydrogen-production-and-international-competitiveness/
BEIS. (2023). Decarbonisation of the power sector. Available at: https://committees.parliament.uk/publications/39325/documents/193081/default/
CertifHy. (2023). SD Carbon footprint calculation. Available at: https://www.certifhy.eu/wp-content/uploads/2023/03/CertifHy_Carbon-footprint-calculation_220214.pdf
CertifHy. (2022). CertifHy-SD Hydrogen Criteria. Available at: https://www.certifhy.eu/wp-content/uploads/2022/06/CertifHy_H2-criteria-definition_V2.0_2022-04-28_endorsed_CLEAN-1.pdf
CERTIFHY. (n.d.). CERTIFHY DOCUMENTS – CERTIFHY. Available at: https://www.certifhy.eu/certifhy-documents/
Circularise. (2022). Four chain of custody models explained. Available at: https://www.circularise.com/blogs/four-chain-of-custody-models-explained
Department for Energy Security & Net Zero (DESNZ). (2023). UK Low Carbon Hydrogen Standard. Available at: https://assets.publishing.service.gov.uk/media/6584407fed3c3400133bfd47/uk-low-carbon-hydrogen-standard-v3-december-2023.pdf
Ding, Y., Baldino, C. and Zhou, Y. (2024). Understanding the proposed guidance for the Inflation Reduction Act’s Section 45V Clean Hydrogen Production Tax Credit. Available at: https://theicct.org/wp-content/uploads/2024/03/ID-132-%E2%80%93-45V-hydrogen_final2.pdf
E4tech. (2021). Options for a UK low carbon hydrogen standard Final report. Available at: https://assets.publishing.service.gov.uk/media/616012fce90e071979dfebba/Options_for_a_UK_low_carbon_hydrogen_standard_report.pdf
Ember. (n.d.). Electricity Data Explorer | Open Source Global Electricity Data. Available at: https://ember-climate.org/data/data-tools/data-explorer/
European Union. (2023a). DIRECTIVE (EU) 2023/2413 OF THE EUROPEAN PARLIAMENT AND OF THE COUNCIL of 18 October 2023 amending Directive (EU) 2018/2001, Regulation (EU) 2018/1999 and Directive 98/70/EC as regards the promotion of energy from renewable sources, and repealing Council Directive (EU) 2015/652 (EU RED III). Available at: https://eur-lex.europa.eu/legal-content/EN/TXT/?uri=CELEX:02018L2001-20220607
European Union. (2023b). Commission Delegated Regulation (EU) 2023/1184 of 10 February 2023 supplementing Directive (EU) 2018/2001 of the European Parliament and of the Council by establishing a Union methodology setting out detailed rules for the production of renewable liquid and gaseous transport fuels of non-biological origin. Available at: https://eur-lex.europa.eu/legal-content/EN/TXT/?uri=uriserv%3AOJ.L_.2023.157.01.0011.01.ENG&toc=OJ%3AL%3A2023%3A157%3ATOC
European Union. (2024a). Directive – EU – 2024/1788 of the European Parliament and of the Council of 13 June 2024 on common rules for the internal markets for renewable gas, natural gas and hydrogen. Available at: https://eur-lex.europa.eu/legal-content/EN/TXT/PDF/?uri=OJ:L_202302413
European Union. (2024b). Texts adopted – Common rules for the internal markets for renewable gas, natural gas and hydrogen (recast) – Thursday, 11 April 2024. Available at: https://www.europarl.europa.eu/doceo/document/TA-9-2024-0283_EN.html
European Union. (2024c). Methodology to determine the greenhouse gas (GHG) emission savings of low-carbon fuels. Available at: https://ec.europa.eu/info/law/better-regulation/have-your-say/initiatives/14303-Methodology-to-determine-the-greenhouse-gas-GHG-emission-savings-of-low-carbon-fuels_en
European Union. (2024d). Regulation (EU) 2024/1787 of the European Parliament and of the Council of 13 June 2024 on the reduction of methane emissions in the energy sector and amending Regulation (EU) 2019/942. Available at: https://eur-lex.europa.eu/legal-content/EN/TXT/?uri=OJ:L_202401787
GHG Protocol. (n.d.). GHG Protocol Scope 2 Guidance. Available at: https://ghgprotocol.org/sites/default/files/2023-03/Scope%202%20Guidance.pdf
GH2 Standard. (2023). The Global Standard for Green Hydrogen and Green Hydrogen Derivatives. Available from: https://gh2.org/sites/default/files/2023-12/GH2_Standard_2.0_Dec%202023.pdf
International Partnership for Hydrogen and Fuel Cells in the Economy (IPHE). (2023). Methodology for Determining the Greenhouse Gas Emissions Associated with the Production of Hydrogen. Available at: https://www.iphe.net/_files/ugd/45185a_8f9608847cbe46c88c319a75bb85f436.pdf
International PtX Hub. (2023). Introduction to the IPHE methodology. Available at: https://ptx-hub.org/wp-content/uploads/2023/08/International-PtX-Hub_202308_IPHE-methodology-electrolysis.pdf
International Organization for Standardization (ISO). (2023). ISO/TS 19870:2023. Hydrogen technologies — Methodology for determining the greenhouse gas emissions associated with the production, conditioning and transport of hydrogen to consumption gate. Available at: https://www.iso.org/standard/65628.html
Martin, P. (2023). France to launch €4bn contracts-for-difference programme to support clean hydrogen production | Hydrogen Insight. Available at: https://www.hydrogeninsight.com/policy/france-to-launch-4bn-contracts-for-difference-programme-to-support-clean-hydrogen-production-reports/2-1-1508431
République Francaise. (2024). Decree of 1 July 2024 specifying the greenhouse gas emissions threshold and the methodology for qualifying hydrogen as renewable or low-carbon. Available at: https://www.legifrance.gouv.fr/jorf/id/JORFTEXT000049870616
Scottish Government. (2022). Hydrogen action plan. Available at: https://www.gov.scot/publications/hydrogen-action-plan/pages/3/
Scottish Renewables. (2021). Renewable Energy Facts & Statistics | Scottish Renewables. www.scottishrenewables.com. Available at: https://www.scottishrenewables.com/our-industry/statistics
TÜV Rheinland. (2023). Standard H2.21 Renewable and Low-Carbon Hydrogen Fuels. Available at: https://www.tuv.com/content-media-files/master-content/global-landingpages/images/hydrogen/tuv-rheinland-hydrogen-standard-h2.21-v2.1-2023-en.pdf
TÜV SÜD. (2021). Standard CMS 70 Production of green hydrogen (GreenHydrogen). Available at: https://www.tuvsud.com/en-gb/-/media/global/pdf-files/brochures-and-infosheets/tuvsud-cms70-standard-greenhydrogen-certification.pdf
US Department of Energy (DOE). (2024). Guidelines to Determine Well-to-Gate Greenhouse Gas (GHG) Emissions of Hydrogen Production Pathways using 45VH2-GREET Rev. March 2024. Available at: https://www.energy.gov/sites/default/files/2024-05/45vh2-greet-user-manual_may-2024.pdf
Appendices
Appendix A Definitions
Chain of custody
There are 4 types of chain of custody models to trace sustainability throughout supply chains. They are listed below in order of high to low level of physical connection required (Circularise, 2022).
|
Identify preservation – this model does not allow the certified product from a certified site to mix with other certified sources. It requires tracking the actual molecule of the material as they move through the supply chain. |
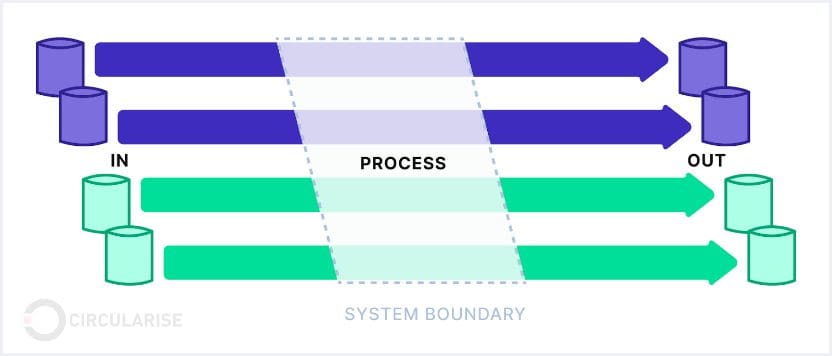 |
|
Segregation – this model requires the certified product from a certified site to be kept separately from non-certified sources. However, it allows different certified sources to be mixed if they share the same defined standard. |
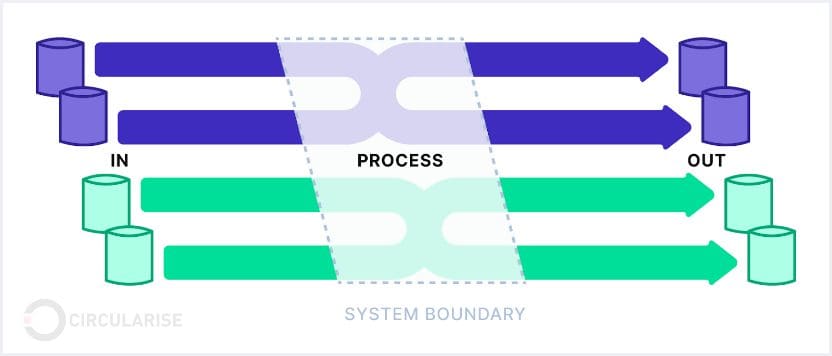 |
|
Mass balance – this model tracks the total amount of sustainable content through virtual balancing of physical allocation. It allows the mixing of sustainable and non-sustainable materials producers and end-users must operate within the same ecosystem (e.g. gas grid). |
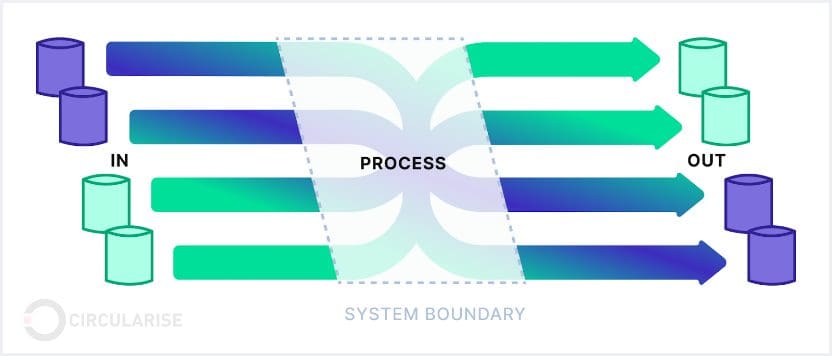 |
|
Book-and-claim – the sustainable attributes are tracked virtually where sustainable and non-sustainable materials flow freely through the supply chain without the requirement of them being supplied and used in the same ecosystem. |
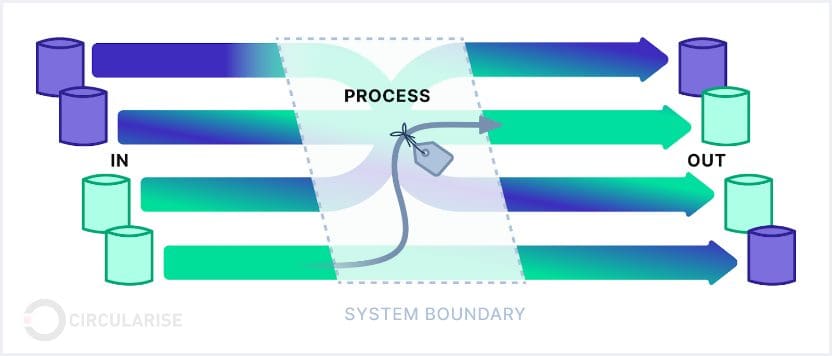 |
In addition to the 4 types of chain of custody models, some hydrogen standards also use Environmental Attribute Certificates (EAC). This is a mechanism to demonstrate to end-users that a product (e.g. hydrogen, electricity, biogas) is produced from renewable sources. EACs enable the decoupling of physical goods from their environmental attributes, and can take the form of guarantees of original (GOs), renewable electricity certificates (RECs), etc. EACs could adopt either a mass balance or book-and-claim chain of custody model, or a combination of both. As such and where possible, the report uses terms referenced directly in the hydrogen standards.
Emission allocation methods
Hydrogen production pathways can generate co-products. Consequently, the total emissions resulting from the hydrogen production (and its upstream emissions) should be divided between the hydrogen and its co-products where these co-products are valorised. Outputs that would normally be discarded or that do not carry any economic value are considered as wastes or residues and do not receive any emissions burden. There are multiple methods of assigning emissions to the co-products, as described below.
System expansion – In this method, co-products are considered alternatives to other products on the market. The emissions avoided as a result of this replacement is subtracted from the product system, whereby the remaining net emissions are assigned to the main product (e.g. hydrogen). This requires understanding of the counterfactuals (i.e. the GHG emission of the products being replaced).
Energy allocation – Emissions are assigned to each co-product based on their energy content (generally on the basis of lower heating values). This can also include application of Carnot efficiencies or enthalpy changes to only account for the useful heat contained within any steam/heat co-products.
Physical causality – This allocation method is specifically mentioned in EU RED for processes where the ratio of the co-products produced can be changed. In these processes, the allocation should be determined based on physical changes in emissions, by incrementing the output of just one co-product whilst keeping the other outputs constant.
Economic allocation – Emissions are allocated in proportion to the (co-)product economic values based on total revenues obtained for each.
Mass allocation – Rarely used, but emissions would be allocated in proportion to the (co-)product mass flows.
Appendix B Detailed review of international hydrogen standards
UK Low Carbon Hydrogen Standard (LCHS)
The UK’s Low Carbon Hydrogen Standard (LCHS) was published in 2022 to support the implementation of the UK Hydrogen Strategy, setting requirements that UK hydrogen projects must meet to access revenue support under the Hydrogen Production Business Model and/or the Net Zero Hydrogen Fund (DESNZ, 2023).
Eligibility
The LCHS is feedstock neutral, but hydrogen must be produced via an eligible pathway as shown in the summary table in Table 3. New pathways can apply to be added to this list.
The LCHS sets a maximum GHG emission threshold of 20 gCO2e/MJLHV of hydrogen product (DESNZ, 2023). This threshold is applicable to a ‘cradle-to-production gate’ system boundary, which includes emissions from feedstock production up to and including hydrogen production.
Hydrogen derived from biogenic inputs is required to satisfy biomass feedstock Sustainability Criteria (Land, Soil Carbon and/or Forest Criteria, following those established in EU RED), and >50% of any biogenic hydrogen must be derived from waste or residue feedstocks. Indirect land use change emissions are also required to be reported separately.
GHG calculation methodology principles
Under the LCHS, hydrogen producers using electricity must demonstrate one of the following electricity supply configurations:
- Power Purchase Agreement (PPA) with a specific generator or private network. Here, physical delivery including losses and 30 minute temporal correlation (showing delivered volumes of electricity at least match the electricity consumption) is required for producers to use the GHG intensity of that generator or private network; or
- Grid electricity supply, where the GHG intensity is determined by the 30 minute average grid factor (GB or Northern Ireland, as applicable); or
- Grid electricity that would otherwise have been curtailed, which is permitted to use nil GHG intensity.
Proof of renewable electricity additionality is not a requirement of the UK LCHS (e.g. new windfarms do not have to be built to supply a hydrogen production facility). The LCHS requires that the contracted electricity generator must be located within the UK but does not impose further geographical correlation rules.
The LCHS uses energy allocation to assign GHG emissions based on (co-)products’ lower heating value energy contents. When heat or steam are produced as co-products, Carnot efficiencies[5] are applied for the energy allocation. However, the LCHS also requires that pathways using waste fossil feedstocks account for their displaced counterfactual emissions (i.e. the emissions that would have occurred if the feedstock had not been diverted to hydrogen production), which is a partial inclusion of a system expansion method.
A pressure of 3MPa and purity of 99.9% by volume is used as a reference flow under the LCHS. If the hydrogen produced is below these values, the theoretical emissions from compression and/or purification required to reach the reference flow need to be added. No adjustment is made if hydrogen is produced above the reference flow values.
Other requirements
Under the UK LCHS, mass balance chain of custody is generally used for upstream supply chains. However, the LCHS also currently states that biomethane cannot be mixed with fossil natural gas at any point, i.e. imposing an identity preserved chain of custody for biomethane feedstocks.
Uncertainties and future direction
Uncertainties in the LCHS include if/when downstream emissions from producer to user might be included within the system boundary, if/when hydrogen producers will be able to report producer-specific upstream natural gas GHG intensities (given the current lack of methodology and paucity of fossil industry data), plus when fugitive hydrogen emissions might be accounted for (and at what Global Warming Potential). It is also unclear how the UK LCHS will interact with ISO-19870 once published.
EU Renewable Energy Directive (RED)
Under EU law, regulations are directly applicable and binding in all Member States without the need for national implementation. Directives, on the other hand, set goals that Member States must achieve, and require Member States to first transpose them into national law, which allows for differences in policy mechanisms to arise in how these goals are met.
The Renewable Energy Directive (RED) is the legal framework for the development of clean energy across all sectors of the EU economy which Member States must transpose into national law (European Union, 2023a). Unlike the UK LCHS which currently only determines the eligibility for domestic UK hydrogen production to receive financial support, the RED mandates renewable energy consumption more broadly. Under EU RED, both domestically produced and imported hydrogen can contribute towards Member States’ compliance with renewable energy targets (European Union, 2023a).
Eligibility
EU RED does not prescribe a list of eligible technology pathways but evaluates eligibility based on fuel type, which is defined by the feedstock used to produce hydrogen.
- Biofuel – hydrogen produced from biomass that meets RED sustainability criteria;
- Recycled carbon fuels (RCF) – hydrogen produced from waste streams of non-renewable origin (European Union, 2023a);
- Renewable fuel of non-biological origin (RFNBO) – hydrogen derived from renewable energy sources other than biomass.
When used in transport, biofuels, RCFs and RFNBOs must achieve at least 70% GHG emissions savings (variable depending on year of commissioning) compared to the fossil fuel comparator of 94 gCO2eq/MJ. This means that lifecycle GHG emissions must be below 28.2 gCO2eq/MJLHV hydrogen. This threshold is measured on a ‘cradle-to-use’ system boundary, which goes beyond the UK LCHS’s ‘cradle-to-production gate’ system boundary.
GHG calculation methodology principles
In the EU, rules determining the GHG emission intensity of electricity inputs are set by the Delegated Act (DA) on renewable electricity under EU RED (European Union, 2023b). This states that renewable electricity from direct connections and PPAs need to meet additionality requirements to be considered to have nil GHG impact. Grid connected facilities with PPAs must also fulfil temporal and geographical correlation requirements, with some exceptions.
- Additionality: Requires that hydrogen production is connected to new (i.e. less than 36 months before the electrolyser starts operation), rather than existing, renewable energy generation assets. Additionality is not required before 2028, and for plants built before 2028, it is only required starting in 2038. This is different to the UK LCHS, which does not have additionality requirements.
- Temporal correlation: Until 2030, this rule requires that hydrogen must be produced within the same calendar month as the renewable electricity used to produce it, and hourly thereafter (European Union, 2023b). This is more relaxed than the 30-minute requirement in the UK LCHS.
- Geographical correlation: Requires that the hydrogen producer must be in the same bidding zone as the renewable energy installation or in an interconnected bidding zone with day ahead prices higher than that of the renewable generation asset.
- Exceptions: Additionality is not required for renewable PPAs with temporal and geographical correlation where the emission intensity of the bidding zone is <18gCO2/MJe. Bidding zones with >90% renewables do not have to meet any of these three criteria provided that the load hours of the hydrogen production plant are lower than the grid’s renewability share.
Similar to the UK LCHS, the default allocation method for hydrogen production pathways under EU RED is based on lower heating value (LHV) energy content for any co-product fuel, electricity or heat/steam (applying Carnot efficiencies). However, EU RED states that if the plant can change the ratio of the co-products produced, physical causality allocation is used (see definition in Appendix A). If co-products are produced that have no LHV energy content (e.g. oxygen, chlorine), GHG emissions are shared among co-products through economic allocation, based on the average factory-gate values of the (co-)products over the last three years. As with the UK LCHS, waste fossil feedstocks used for RCF production account for their displaced counterfactual emissions. EU RED sets no reference flow, with purity and pressure requirements only determined by the end user.
Uncertainties and future direction
According to the DA on renewable electricity (European Union, 2023b), the GHG emission intensity of grid electricity is determined at the level of countries or at the level of bidding zones. Different bidding zones do not currently exist in the GB power grid, but it is unclear how the DA defines a country. If Scotland is defined as a country under the DA, grid electrolysis projects could claim nil emissions for their input electricity without having to meet rules on additionality, temporal and geographical correlation, as Scotland’s grid has more than 90% renewables (Scottish Renewables, 2021). This would be a significant advantage and allow these projects to reduce their input electricity costs due to the lower regulatory burden. But if not defined as a country under the DA, these projects would have to take the GHG intensity of the GB grid, which only had an approximately 50% renewable share in 2023 (Ember, n.d.), requiring producers to instead procure renewable electricity PPAs that meet additionality, temporal and geographical correlation rules to claim nil emissions for the input electricity.
There are also uncertainties as to how individual Member States will implement the latest revised version of the RED, given that there is a May 2025 deadline for RED III to be transposed into national laws. Even within the confines of RED III, the policy mechanisms created and pathways deemed eligible by Member States can vary across the EU.
EU Gas Directive
The EU Gas Directive (formally called the Directive on common rules for the internal markets for renewable gas, natural gas and hydrogen) was published in July 2024 as part of the Hydrogen and Decarbonised Gas Market Package, it established a framework for the development of the future gas market in the EU, and its scope includes renewable and low-carbon hydrogen. Renewable hydrogen is defined as bio-hydrogen and RFNBO hydrogen, which must follow RED requirements (European Union, 2024a), whereby the EU Gas Directive sets requirements for low-carbon nuclear and fossil-fuel based pathways (outside of fossil waste derived RCFs) that are not currently covered by RED. This policy shares many similarities with the methodology set under RED, including a GHG emission threshold of 28.2 gCO2e/MJLHV and a ‘cradle-to-use’ system boundary.
The European Commission has until July 2025 to adopt a Delegated Act (DA) specifying the GHG methodology for low-carbon fuels (other than RCFs) (European Union, 2024b). On September 27, 2024, a draft version of this DA was released for public consultation (European Union, 2024c).
This draft version sticks to the same RED renewable power sourcing rules (and does not expand them to nuclear or fossil + CCS generator PPAs), but also appears to have several differences to the RED methodology for RFNBOs. For example, carbon capture and utilisation (CCU) in permanently chemically bound products is currently permitted in the draft DA, and there are also more detailed CCS requirements including allowing solid carbon sequestration, but ruling out enhanced oil & gas recovery (European Union, 2024c). Upstream natural gas emissions are to be based on reported producer values under EU methane regulations (European Union, 2024d), but before these are available, a conservative value from the DA is to be used. However, it is unclear how the existing use/fate of fossil fuel feedstocks is to be interpreted, and whether this counterfactual term is to be ignored or would generate a large emissions penalty or a large credit – both latter options would be a major departure from the attributional GHG methodology used in the RED and other EU legislation. Given the current consultation stage, other significant changes to the DA before final publication are possible, which also adds uncertainty.
CertifHy
CertifHy is an industry developed voluntary Guarantee of Origin (GO) certificate scheme within the EU, the European Economic Area and Switzerland. The CertifHy GO scheme verifies the origin (e.g. production location, production technology, feedstocks etc.) and GHG emissions of hydrogen products (CertifHy, n.d.). Rather than a set of legislative requirements, it is a scheme that producers can choose to participate in to demonstrate sustainability to their end-users.
Eligibility
CertifHy hydrogen can be labelled “green hydrogen” which covers renewable pathways, or “low-carbon hydrogen” which covers low-carbon fossil and nuclear pathways. For both, a GHG emissions threshold of 36.4gCO2e/MJ LHV hydrogen applies, which is measured on the same ‘cradle-to-production gate’ system boundary as the UK LCHS. This represents a reduction of 60% compared to the benchmark fossil process of 91gCO2e/MJLHV hydrogen product (via steam reforming of natural gas) (CertifHy, 2022).
GHG calculation methodology principles
When producing hydrogen from the electricity grid, the renewable origin can be established by cancelling of GOs[6]. Unlike the UK LCHS and EU RED, CertifHy does not specify further requirements such as additionality, temporal or geographical correlation.
Under CertifHy, co-products are dealt in different ways and are defined based on the production pathways. For pathways producing steam as a co-product, CertifHy requires its producers and consumers to use the same allocation method. Economic allocation is applied for hydrogen produced from chlor-alkali processes and its co-products. However, the method for allocating emissions to any co-produced oxygen from electrolysis is yet to be adopted (CertifHy, 2023).
Other requirements
The CertifHy GO scheme allows for the decoupling of physical hydrogen supply and its environmental attributes, via a book & claim system.
Uncertainties and future direction
The future use of this voluntary scheme and others such as TÜV SÜD and TÜV Rheinland could be impacted by the potential future alignment with ISO 19870.
France Energy Code L. 811-1
In July 2024, France transposed the definition of renewable hydrogen in alignment with EU RED under L. 811-1 of the Energy Code (République Francaise, 2024). It is a government developed standard and mandatory for accessing subsidy schemes.
Eligibility
As it is a transposition of EU RED, requirements for renewable hydrogen follow EU RED. The Energy Code also specifies the GHG methodology for low-carbon hydrogen, which is based on EU RED rules, but allows electricity from nuclear power generation.
Uncertainties
Recent Government changes in France resulted in a pause in publishing the new hydrogen strategy and subsequent Government funding in the form of a CfD for hydrogen developers producing renewable or low-carbon hydrogen. It is also currently unclear if France permits RCFs to count towards the REDIII renewable energy target (Martin, P., 2023).
United States Inflation Reduction Act 45V Tax Credit
The Inflation Reduction Act (IRA) introduced the Clean Hydrogen Production Tax Credit (PTC) (45V) to promote the production of low-carbon hydrogen in the US. This tax credit can be claimed by producers for every kilogram of eligible hydrogen they produce in the US. The value of the tax credit is determined by a tiered approach based on the GHG emissions intensity of the hydrogen with significant multipliers also available if the production facility meets the labour requirements set out under the tax credit.
Eligibility
Eligibility for 45V is determined by whether the produced hydrogen meets GHG emission thresholds, which is measured on a ‘cradle-to-production gate’ system boundary. The maximum GHG threshold is defined at 4 kgCO2e/kg H2. Hydrogen produced with lower GHG emissions is eligible for higher support, which is determined by a percentage of the maximum credit value[7] as seen in table below.
|
kgCO2e/kg hydrogen |
gCO2e/MJLHV |
% of Production Tax Credit value |
|
>4 |
>33.3 |
0% |
|
2.4 to 4 |
20 to 33.3 |
20% |
|
1.5 to 2.5 |
12.5 to 20 |
25% |
|
0.45 to 1.5 |
3.8 to 12.5 |
33.4% |
|
<0.45 |
<3.8 |
100% |
GHG calculation methodology principles
For electricity input for electrolytic hydrogen, rules to demonstrate renewability are similar to requirements set under EU RED’s DA. Producers must procure PPAs for renewable electricity that demonstrate incrementality (new generation capacity must begin operations within 3 years of hydrogen facility being placed into service, this is similar to the additionality concept in the EU), deliverability (clean power must be sourced from the same region), and temporal correlation (annual matching is until 2028, with hourly matching thereafter).
The reference flow is set at 2MPa at 100% purity, rather than 3MPa and purity of 99.9% under the UK LCHS. Producing hydrogen below/above this reference flow means the GHG intensity is adjusted higher/lower. By contrast, only upwards adjustments are required for the UK LCHS.
Further differences include the allocation approach. In the US, a system expansion (displacement) approach is generally used for co-product allocation, instead of energy allocation as in the UK LHCS. The US method can therefore give significantly negative GHG intensities for hydrogen produced from organic waste based biomethane[8]. Additionally, 45V places a cap on the amount of steam that can claimed as co-product from natural gas reforming to avoid incentivising over-production of steam to lower hydrogen GHG emissions (US DOE, 2024).
Uncertainties and future direction
45V is currently undergoing consultation to seek industry opinion on methods to enable a virtual tracking system for both direct connection and mass balancing for biomethane and fugitive methane. This includes counterfactual assumptions for biomethane feedstocks, treatment of fugitive emissions, and how to track and verify biomethane through virtual systems. It appears likely that 45V will impose “incrementality” (additionality), temporal matching and deliverability requirements for biomethane but details are unknown at present (Ding et al., 2024). More broadly, while the IRA has been signed into law, a change in US administration could create instability regarding the future of this tax credit.
International Partnership for Hydrogen and Fuel Cells in the Economy (IPHE)
IPHE is an international inter-governmental partnership, which aims to develop a set of mutually agreed methodologies and an analytical framework to determine the GHG emissions of hydrogen production. Use of this methodology is voluntary and differs from other standards reviewed as it serves as a framework for determining GHG emissions of hydrogen production only and does not set any eligibility criteria.
Version 3 of IPHE defines GHG methodologies for electrolysis, steam cracking, fossil gas reforming with CCS, fossil (coal) gasification with CCS, biomass biodigestion (anaerobic digestion to biomethane) with CCS, and biomass gasification with CCS. The methodologies for other pathways will be developed in the future. Unlike other standards, IPHE does not provide guidance on any categories (e.g., “renewable” or “low-carbon”), and it does not stipulate any GHG emission intensity threshold. (IPHE, 2023). This is expected to be done by individual countries participating in IPHE, if they wish to do so.
GHG calculation methodology principles
The current IPHE guidance covers a ‘cradle-to-point of use’ system boundary, which includes supply chain steps to transport hydrogen from the producer to the end user, but not the final use of the hydrogen. This goes beyond the UK LCHS system boundary, but not quite as far as EU RED.
Market-based emissions accounting approach such as renewable energy certificates (RECs) can be used to substantiate electrolytic hydrogen production from renewable electricity. There are no requirements on additionality, temporal correlation and geographic correlation criteria.
IPHE provides pathway-specific recommendations for splitting GHG emissions between co-products, following a hierarchy of options (i.e. allocation based on LHV energy content, followed by system expansion, then economic value). However, certain allocation methods are deemed not appropriate for certain pathways (e.g. energy allocation is not recommended for electrolysis and chloralkali pathways.
Key uncertainties and future direction
The latest IPHE Working Paper (Version 3) was released in July 2023. It is unclear if additional versions will be published, or whether future IPHE developments will be incorporated within the ISO 19870 process, since ISO is developing a global standard starting from the IPHE V3 methodology.
ISO 19870
The IPHE methodology V3 was used as the basis of a draft ISO Technical Specification (ISO/TS 19870) published in late 2023 (ISO, 2023). This is now being further developed into an ISO International Standard on the “Methodology for determining the greenhouse gas emissions associated with the production, conditioning and transport of hydrogen to consumption gate”. This standard is due to be published in 2025. This first ISO hydrogen standard (ISO 19870-1) will cover cradle to production gate, but future standards in the series may cover downstream steps including hydrogen conversion and distribution.
Similar to IPHE, ISO 19870-1 will not provide any threshold values or define any hydrogen categories, labels or colours. All pathways are eligible, but detailed guidance will be provided for a number of pathways. Given the focus is purely on GHG emissions, sustainability requirements are not currently set for biomass feedstocks.
GHG calculation methodology principles
Onsite/direct connection to renewable generators are allowed provided no contracts are sold to a third party. Alternatively, power may be purchased from the grid with a contract and energy attribute certificates (e.g. RECs, GOs) provided ISO 14064-1 (part E.2.2) quality criteria are met (ISO, 2018).
No reference flow is set in ISO/TS 19870, with pressure and purity only set by the next user in the supply chain. However, the GHG emissions intensity shall be adjusted upwards to reflect the presence of impurities in the hydrogen product (e.g. water, nitrogen, carbon dioxide, carbon monoxide, methane etc), and their release to atmosphere.
Other requirements
Chain of custody requirements are not specified, but energy sourcing allows grid purchase with Guarantees of Origin (GOs). Production batches can be any length of time chosen by the operator. GHG emissions of capital equipment are to be reported separately.
Uncertainties
ISO 19870-1 is still under development, therefore significant uncertainties exist, particularly around the (multiple) allocation methodologies that will be recommended for each individual pathway, and the level of detail required for evidence. Whilst ISO standards flow into national standards, Governments are not required to adopt or use a national standard. As a result, how countries/regions choose to align their policies with the new ISO standard once published is unclear (International PtX Hub, 2023). This may depend on whether ISO 19870-1 remains broad in simultaneously accommodating different methodology choices (e.g. consequential or attributional allocation) or becomes more prescriptive with a single methodology and more detailed evidence requirements.
TÜV SÜD
TÜV SÜD is an industry developed, voluntary standard which provides a guaranteed proof of origin alongside certification for renewable hydrogen. The present standard is based on European legislation but is in principle applicable worldwide. A certificate for the production of hydrogen from renewable energy sources labelled “GreenHydrogen” can be issued if all requirements are met (TÜV SÜD, 2021).
Eligibility
The GHG emission threshold follows EU RED, though it accepts two system boundaries which are ‘cradle-to-point of use’ (GreenHydrogen+) or ‘cradle-to-production gate’ (GreenHydrogen) if delivered at the plant gate or injected in a transmission grid. TÜV SÜD also requires that during periods when hydrogen production is not certified as “GreenHydrogen”, emissions still remain below 91 gCO₂e/MJLHV. The scheme currently covers four production pathways, all of which are renewable. Biomass feedstocks used for hydrogen production must meet relevant RED sustainability criteria.
GHG calculation methodology principles
Proof of renewable electricity for electrolysis hydrogen production can be provided by purchasing and retiring GOs or comparable certificates (RECs) which follow EU RED rules though it is unclear if this refers to the renewable electricity DA. GreenHydrogen+ imposes further requirements which includes additionality (new power production must have commissioned no later/earlier than 11 months following the hydrogen production facility installation), temporal correlation (every 15 minutes) and geographical correlation. These rules are more stringent than the UK LCHS and EU RED. The approach to allocating emissions between co-products follows EU RED, although where hydrogen is produced as a by-product such as in chlor-alkali electrolysis, it is possible to allocate emissions using energy allocation, economic allocation or system expansion.
Uncertainties and future direction
The future use of this voluntary scheme and others such as CertifHy and TÜV Rheinland could be impacted by the potential future alignment with ISO 19870.
TÜV Rheinland
TÜV Rheinland is an industry developed, voluntary standard similar to TÜV SÜD, but has an expanded scope which covers both “Renewable Hydrogen” and “Low Carbon Hydrogen”. The present standard is based on European legislation but is in principle applicable worldwide (TÜV Rheinland, 2023).
Eligibility
The GHG emission threshold follows EU RED for both hydrogen categories. Though the system boundary is defined by the user (e.g., cradle to production gate or to point of use). “Renewable hydrogen” has two sub-categories, “Green Hydrogen” and “RFNBO (RED II)”. Eligible pathways for both are electrolytic hydrogen produced from renewable (non-biogenic) electricity and water or aqueous solutions (e.g. chlor-alkali electrolysis) but have different renewable power purchasing requirements. For low-carbon hydrogen, all pathways are eligible e.g., steam reforming, electrolysis, pyrolysis etc.
GHG calculation methodology principles
To be certified as “Green Hydrogen”, renewable electricity can be supplied via a direct connection or the electricity grid (with PPA). The renewable electricity is not required to be additional, but if sourcing via the grid, must have temporal matching on an annual basis and located within the same country. “RFNBO (RED II)” certification requires RED II renewable electricity rules are met.
Green Hydrogen Standard (GH2)
The Green Hydrogen Organisation (GH2) is an industry developed voluntary standard (non-profit foundation) based in Switzerland. Green hydrogen projects that meet the requirements will be licensed to use the label “GH2 Green Hydrogen” and will be eligible to generate and trade GH2 certificates of origin (GH2 Standard, 2023).
Eligibility
GH2 only allows electrolytic hydrogen produced from 100% renewable energy supplied via a direct connection or the electricity grid (with PPA). It sets a significantly lower GHG emissions threshold than the UK LCHS, of 8.33 gCO2e/MJ LHV hydrogen product on a ‘cradle-to-production gate’ basis. Hydrogen developers have the option to calculate and report on embodied emissions including construction emissions.
Where biomass is used in electricity generation, hydrogen developers are required to demonstrate a low risk of indirect land use change, including verifying that production of feedstock does not take place on land with high biodiversity, that land with a high amount of carbon has not been converted for feedstock production. Additionally, hydrogen developers are required to address any risks relating to the displacement of crops for food and feed. Adherence to the EU Commission Delegated Regulation 2019/807 (criteria for determining the high ILUC-risk feedstock) or an equivalent national standard will satisfy this requirement.
GHG calculation methodology principles
Under GH2 the same ‘cradle-to-production gate’ system boundary as the UK LCHS is used. Renewable electricity through RECs are allowed but not required to meet additionality, temporal and geographical correlation. Co-product allocation is not specifically mentioned but given GH2 applies the methodology for the electrolysis production pathway as per IPHE, it is assumed that this will also follow IPHE. For electrolysis, the use of system expansion is recommended for co-product allocation between hydrogen and oxygen products as energy allocation is not appropriate for this co-product.
Uncertainties and future direction
The scheme may expand to include nuclear and other forms of energy production with low emissions but the timeframe for this is currently unknown.
Appendix C GHG calculation methodology
EU RED
Biofuel: E = eec + el + ep + etd + eu – esca – eccs – eccr
Where,
|
E |
= |
total emissions from the use of the fuel; |
|
eec |
= |
emissions from the extraction or cultivation of raw materials; |
|
el |
= |
annualised emissions from carbon stock changes caused by land-use change; |
|
ep |
= |
emissions from processing; |
|
etd |
= |
emissions from transport and distribution; |
|
eu |
= |
emissions from the fuel in use; |
|
esca |
= |
emission savings from soil carbon accumulation via improved agricultural management; |
|
eccs |
= |
emission savings from CO2 capture and geological storage; and |
|
eccr |
= |
emission savings from CO2 capture and replacement. |
RFNBO and RCF: E = ei + ep + etd + eu – eccs
Where,
|
E |
= |
total emissions from the use of the fuel; |
|
ei |
= |
emissions from supply of inputs = ei elastic + ei rigid – e ex-use; |
|
ei elastic |
= |
emissions from elastic inputs; |
|
ei rigid |
= |
emissions from rigid inputs; |
|
e ex-use |
= |
emissions from inputs’ existing use or fate; |
|
ep |
= |
emissions from processing; |
|
etd |
= |
emissions from transport and distribution; |
|
eu |
= |
emissions from the fuel in use; |
|
eccs |
= |
emission savings from CO2 capture and geological storage |
EU Gas Directive
E = ei + ep + etd + eu – eccs – eccu
Where,
|
E |
= |
total emissions from the use of the fuel; |
|
ei |
= |
emissions from supply of inputs = ei elastic + ei rigid – e ex-use; |
|
ei elastic |
= |
emissions from elastic inputs; |
|
ei rigid |
= |
emissions from rigid inputs; |
|
e ex-use |
= |
emissions from inputs’ existing use or fate; |
|
ep |
= |
emissions from processing (including captured carbon); |
|
etd |
= |
emissions from transport and distribution; |
|
eu |
= |
emissions from the fuel in use; |
|
eccs |
= |
net emission savings from CO2 capture and geological storage; |
|
eccu |
= |
net emission savings from CO2 captured and permanently chemically bound in long-lasting products. |
ISO/TS 19870
E = ecombustion emissions + efugitive emissions + eindustrial process emissions + eenergy supply emissions + eupstream emissions
Where,
|
ecombustion emissions |
= |
combustion of relevant solid, liquid and/or gaseous fuels |
|
efugitive emissions |
= |
leakages and accidental losses, as well as other losses due to incorrect management of plant operations |
|
eindustrial process emissions |
= |
specific GHG gases used across a number of industry activities (e.g., hydrofluorocarbons (HFCs) used in industrial refrigeration and/or cooling systems, and sulphur hexafluoride (SF6) used in electrical switchgear). |
|
eenergy supply emissions |
= |
emissions associated with the supply of energy |
|
eupstream emissions |
= |
emissions relating to the upstream extraction of resources |
Appendix D Hydrogen pathways modelled
|
Hydrogen production pathway |
Hydrogen production country |
Distribution pathway to Rotterdam |
End product |
|---|---|---|---|
|
Electrolysis using renewable electricity |
Scotland, Norway, Morocco, Chile, USA |
Ammonia shipping with reconversion to hydrogen |
Hydrogen |
|
Electrolysis using renewable electricity |
Scotland, Norway, Morocco, Chile, USA |
Ammonia shipping |
Ammonia |
|
Electrolysis using renewable electricity |
Scotland, Norway, Morocco |
Compressed hydrogen shipping |
Hydrogen |
|
Electrolysis using renewable electricity |
Scotland, Norway, Morocco |
Compressed hydrogen pipeline |
Hydrogen |
|
Electrolysis using nuclear electricity |
France |
Ammonia shipping with reconversion to hydrogen |
Hydrogen |
|
Electrolysis using nuclear electricity |
France |
Ammonia shipping |
Ammonia |
|
Electrolysis using nuclear electricity |
France |
Compressed hydrogen shipping |
Hydrogen |
|
Electrolysis using nuclear electricity |
France |
Compressed hydrogen pipeline |
Hydrogen |
|
Electrolysis using grid electricity |
Scotland, Norway, France, Morocco, Chile, USA |
Ammonia shipping with reconversion to hydrogen |
Hydrogen |
|
Electrolysis using grid electricity |
Scotland, Norway, France, Morocco, Chile, USA |
Ammonia shipping |
Ammonia |
|
Electrolysis using grid electricity |
Scotland, Norway, France, Morocco |
Compressed hydrogen shipping |
Hydrogen |
|
Electrolysis using grid electricity |
Scotland, Norway, France, Morocco |
Compressed hydrogen pipeline |
Hydrogen |
|
Natural gas ATR+CCS |
UK, USA |
Ammonia shipping with reconversion to hydrogen |
Hydrogen |
|
Natural gas ATR+CCS |
UK, USA |
Ammonia shipping |
Ammonia |
|
Natural gas ATR+CCS |
UK |
Compressed hydrogen shipping |
Hydrogen |
|
Natural gas ATR+CCS |
UK |
Compressed hydrogen pipeline |
Hydrogen |
*In the case of France, electrolytic hydrogen production was modelled using electricity from nuclear sources instead of renewable sources
Appendix E Modelling assumptions
|
Location |
Assumption |
2023 |
2030 |
References | |
|---|---|---|---|---|---|
|
Hydrogen production location |
USA |
The Northeast region of the US was used in the 2023 CXC report but no specific location was stated. To align with the CXC report and based on likely shipping ports, New Jersey has been assumed for the production location (and electricity grid factor), and Port Newark for the export location. |
– |
– | |
|
Shipping distances/days |
All |
The shipping distances from Scotland, Norway, Morocco and Chile to Rotterdam, were taken from the 2023 CXC report. A shipping distance for the US was not given, so has been calculated from Port Newark to Rotterdam. The shipping time (days) has been calculated based on a ship speed of 29.6 km/hr (JRC, 2024) and calculated using Sea-Distances, 2024. The shipping distance for France was 38.2 km in the CXC report – assumed this is a typo given the shortest shipping distance between France and Rotterdam is from Port of Dunkirk (261 km). |
Scotland: 930 km / 1.3 days Norway: 1,312 km / 1.8 days France (Port of Dunkirk): 261 km / 0.4 days Morocco: 2,747 km / 3.9 days USA (Port Newark): 6,265 km / 14 days Chile: 17,970 km / 25.3 days |
Scotland: 930 km / 1.3 days Norway: 1,312 km / 1.8 days France (Port of Dunkirk): 261 km / 0.4 days Morocco: 2,747 km / 3.9 days USA (Port Newark): 6,265 km / 14 days Chile: 17,970 km / 25.3 days |
CXC, 2023, pg41 |
|
Pipeline distances |
All except USA & Chile |
The pipeline distances from Scotland, Norway, France and Morocco to Rotterdam, were taken from the 2023 CXC report. |
Scotland: 930 km Norway: 1,312 km France: 435 km Morocco: 1,930 km |
Scotland: 930 km Norway: 1,312 km France: 435 km Morocco: 1,930 km |
CXC, 2023, pg41 |
|
Electricity grid GHG intensity |
Scotland |
Average annual grid generation intensity recorded for 2023 taken as current value (45.9 gCO2/kWh) (National Grid ESO, 2024). gCO2/kWh value increased by 1% to derive gCO2e/kWh value based on the difference between gCO2 and gCO2e intensities reported in UK Gov Conversion Factors, 2024. Given EU RED and ISO/TS 19870 requirements, upstream emissions were added for Scottish generators, calculated (as 3.61 gCO2e/MJ elec currently) using the electricity generation mix from DESNZ, 2023 and applying the fuel emission factors in Table 3 of the RED Delegated Act on GHG methodology for RCFs and RFNBOs. Imports of electricity into Scotland were ignored in the upstream calculations. Scottish electricity grid in 2030 is estimated to reach 120 TWh/yr generation and emit 1025 ktCO2e/yr (Scottish Government, 2024). Upstream emissions were estimated for 2030 by applying the same ratio as the generation emissions for 2023 compared to 2030. |
16.5 gCO2e/MJ elec |
3.0 gCO2e/MJ elec |
National Grid ESO, 2024, Country Carbon Intensity Forecast UK Gov, 2024, Greenhouse gas reporting: conversion factors 2024 DESNZ, 2023, Energy Trends https://www.gov.scot/policies/renewable-and-low-carbon-energy Scottish Government, 2024, Greenhouse gas emissions projections |
|
Electricity grid GHG intensity |
Norway |
2023 grid mix taken from Ember (Ember, 2024). Generation and upstream emissions were calculated using the fuel combustion and upstream emission factors in Table 1 and Table 3 of the RED Delegated Act on GHG methodology for RCFs and RFNBOs and generator efficiencies from JRC (2020). Norway renewables capacity is expected to increase by 40 TWh in Norway in 2030 (DLA Piper, 2023). |
2.46 gCO2e/MJ elec |
1.95 gCO2e/MJ elec |
European Commission, 2023, Delegated Act 2023/1185. |
|
Electricity grid GHG intensity |
France |
2023 grid mix taken from Ember (Ember, 2024). Generation and upstream emissions were calculated using the fuel combustion and upstream emission factors in Table 1 and Table 3 of the RED Delegated Act on GHG methodology for RCFs and RFNBOs and generator efficiencies from JRC (2020). France aims for 34% renewable electricity in 2030 compared to currently 24.7% (IEA, 2024). |
17.3 gCO2e/MJ elec |
15.7 gCO2e/MJ elec |
European Commission, 2023, Delegated Act 2023/1185. |
|
Electricity grid GHG intensity |
Morocco |
2023 grid mix taken from Ember (Ember, 2024). Generation and upstream emissions were calculated using the fuel combustion and upstream emission factors in Table 1 and Table 3 of the RED Delegated Act on GHG methodology for RCFs and RFNBOs and generator efficiencies from JRC (2020). Current renewables capacity is ~38%, aiming to increase to 52% by 2030 (International Trade Administration, 2024). This anticipated percentage increase in renewables capacity was used to estimate the grid emission factor for 2030. |
188.4 gCO2e/MJ elec |
162.1 gCO2e/MJ elec |
European Commission, 2023, Delegated Act 2023/1185. |
|
Electricity grid GHG intensity |
USA (New Jersey) |
Latest year grid mix for the RFC East subregion in which New Jersey is in (EPA, 2022). Generation and upstream emissions were calculated using the fuel combustion and upstream emission factors in Table 1 and Table 3 of the RED Delegated Act on GHG methodology for RCFs and RFNBOs and generator efficiencies from JRC (2020). New Jersey is targeting 50% reduction in electricity generation emissions by 2030 compared to 2005 (climate-Xchange.org, 2024, NJ DEP, 2024). This emissions reduction was applied to the 2023 generation emissions to calculate the 2030 generation emissions. To estimate the 2030 upstream emissions, the 2023 upstream to generation emissions ratio was applied. |
68.2 gCO2e/MJ elec |
34.1 gCO2e/MJ elec |
European Commission, 2023, Delegated Act 2023/1185. JRC, 2020, JEC-Well-to-Tank report v5 climate-Xchange.org, 2024, New Jersey NJ DEP, 2024, NJ Greenhouse Gas Emissions Inventory Report Years 1990-2021 |
|
Electricity grid GHG intensity |
Chile |
2023 grid mix taken from Ember (Ember, 2024). Generation and upstream emissions were calculated using the fuel combustion and upstream emission factors in Table 1 and Table 3 of the RED Delegated Act on GHG methodology for RCFs and RFNBOs and generator efficiencies from JRC (2020). By 2030, Chile aims to reduce emissions by 84% compared to 2021 (Wartsila, 2022) – 2021 grid mix used to estimate 2030 grid emission factor (Ember, 2024). |
72.7 gCO2e/MJ elec |
19.1 gCO2e/MJ elec |
European Commission, 2023, Delegated Act 2023/1185. |
|
Electricity grid GHG intensity |
UK |
2023 factor calculated based on the GB generation intensity data from National Grid ESO (2024). Given EU RED and ISO/TS 19870 requirements, upstream emissions were added, calculated using the GB electricity generation mix (DESNZ, 2023) and applying the fuel upstream emission factors from UK Gov (2024), and generator efficiencies from JRC (2020). Upstream emissions of imported electricity were calculated using the same approach, using country electricity grid generation mixes (IEA, 2023) for France, Belgium, Netherlands and Norway, weighted by the proportion of imported electricity from UK Gov Energy Trends (2024). 2030 generation factor calculated based National Grid Future Energy Scenarios (FES) following the Holistic Transition scenario. The upstream emissions factors from GB generation were calculated using the 2030 GB electricity generation mix (National Grid ESO, 2024). Transmission and distribution losses (7.5%) were included for all upstream emissions calculations (National Grid ESO, 2024), to give consistent gCO2e/kWh delivered values. For simplicity, GB factors taken for UK. |
53.8 gCO2e/MJ elec delivered (11.4 upstream + 42.4 generation) |
16.7 gCO2e/MJ elec delivered (5.0 upstream + 11.6 generation) |
National grid ESO, 2024, ESO’s Carbon Intensity Dashboard. European Commission, 2023, Delegated Act 2023/1185. UK Gov, 2024, Greenhouse gas reporting: conversion factors 2024 UK Gov, 2024, Energy Trends: UK electricity IEA, 2023, Energy Statistics Data Browser JRC, 2020, JEC-Well-to-Tank report v5 National Grid ESO, 2024, Future Energy Scenarios: Pathways to Net Zero. |
|
Electricity grid GHG intensity |
Netherlands |
2023 grid mix taken from Ember (Ember, 2024). Generation and upstream emissions were calculated using the fuel combustion and upstream emission factors in Table 1 and Table 3 of the RED Delegated Act on GHG methodology for RCFs and RFNBOs and generator efficiencies from JRC (2020). The 2030 Netherlands grid mix is taken from the JRC and upstream and combustion emission factors from the RED were applied to estimate the 2030 grid emission factor (JRC, 2024). |
81.2 gCO2e/MJ elec |
31.6 gCO2e/MJ elec | |
|
Renewable electricity GHG intensity |
All |
Generation and upstream emissions for wind, hydro and solar electricity are considered as zero, as per EU RED and ISO/TS 19870. |
0 gCO2e/MJ elec |
0 gCO2e/MJ elec | |
|
Nuclear electricity GHG intensity |
France |
Emission factor for nuclear fuel is taken from Table 3 from RED Delegated Act on GHG methodology for RCFs and RFNBOs (1.2 gCO2e/MJ LHV fuel) (European Commission, 2023). Nuclear power plant LHV efficiency of 33% then applied (JRC, 2020). |
3.64 gCO2e/MJ elec |
3.64 gCO2e/MJ elec |
European Commission, 2023, Delegated Act 2023/1185. JRC, 2020, JEC WTT v5 – NUEL chain (Pathways 6 Electricity workbook) |
|
Natural gas grid GHG intensity |
Netherlands, UK & USA (following EU RED DA methodology) |
Natural gas supply and combustion emissions are taken from RED Delegated Act on GHG methodology for RCFs and RFNBOs (European Commission, 2023), given the factors in the Delegated Act do not distinguish between different countries (including those outside of the EU). In the absence of 2030 intensity projections by country, assumed the same GHG intensity for 2030. |
Upstream: 12.7 gCO2e/MJ LHV Combustion: 56.2 gCO2e/MJ LHV |
Upstream: 12.7 gCO2e/MJ LHV Combustion: 56.2 gCO2e/MJ LHV | |
|
Natural gas grid GHG intensity |
Netherlands (following ISO/TS 19870 methodology) |
Natural gas supply and combustion emissions are taken from RED Delegated Act on GHG methodology for RCFs and RFNBOs (European Commission, 2023). In the absence of 2030 intensity projections by country, assumed the same GHG intensity for 2030. |
Upstream: 12.7 gCO2e/MJ LHV Combustion: 56.2 gCO2e/MJ LHV |
Upstream: 12.7 gCO2e/MJ LHV Combustion: 56.2 gCO2e/MJ LHV | |
|
Natural gas grid GHG intensity |
UK (following ISO/TS 19870 methodology) |
Upstream natural gas emissions taken from the UK Low Carbon Hydrogen Standard V3 (DESNZ, 2023). In the absence of 2030 intensity projections by country, assumed the same GHG intensity for 2030. |
Upstream: 8.7 gCO2e/MJ LHV Combustion: 56.2 gCO2e/MJ LHV |
Upstream: 8.7 gCO2e/MJ LHV Combustion: 56.2 gCO2e/MJ LHV | |
|
Natural gas grid GHG intensity |
USA (following ISO/TS 19870 methodology) |
Upstream natural gas CO2 emissions taken from GREET (16.52 gCO2/kWh natural gas). The methane leakage rate (7.5 gCH4/kg natural gas) is based on the Pennsylvania region in Sherwin et al. (2024) given this is the closest region to New Jersey. The natural gas LHV applied to convert units is from UK Gov Conversion Factors (2024). Combustion emissions were based on RED Delegated Act on GHG methodology for RCFs and RFNBOs. In the absence of 2030 intensity projections by country, assumed the same GHG intensity for 2030. |
Upstream: 9.2 gCO2e/MJ LHV Combustion: 56.2 gCO2e/MJ LHV |
Upstream: 9.2 gCO2e/MJ LHV Combustion: 56.2 gCO2e/MJ LHV |
R&D GREET, 2023, NA NG from Shale and Conventional Recovery UK Gov, 2024, Greenhouse gas reporting: conversion factors 2024 |
|
Electrolyser inputs |
All |
Assume PEM electrolyser with current LHV efficiency 61% and output pressure at 30 bar (CXC, 2022 – aligns with DESNZ, 2023; IEA, 2019; Element Energy, 2019). 2030 value assumed to reach 66% efficiency (CXC, 2022) – this aligns with other sources (IEA, 2019). CXC assume 25 kg H2O/kg H2 in water consumption for current year (CXC, 2023) and assumed remains constant to 2030. Chemical inputs (hydrochloric acid and sodium hydroxide) required to deionise water are based on industry data. The emissions associated with these chemical inputs are very small. |
Electrolyser efficiency: 61% Water consumption: 25 kg H2O/kg H2 Chemical inputs: 1.8 x10⁻⁶ kg NaOH/MJ H2 1.6 x10⁻⁶ kg HCl/MJ H2 |
Electrolyser efficiency: 66% Water consumption: 25 kg H2O/kg H2 Chemical inputs: 1.8 x10⁻⁶ kg NaOH/MJ H2 1.6 x10⁻⁶ kg HCl/MJ H2 |
IEA, 2019, The Future of Hydrogen Element Energy, 2018, Hydrogen supply chain evidence base prepared for BEIS |
|
ATR + CCS inputs |
UK, USA |
ATR+CCS plant LHV efficiency from Environment Agency (2023) and electricity input and water consumption from the same reference. These values align with other sources (Element Energy, 2018). Included grid electricity for ATR+CCS operations (JRC, 2020). Hydrogen output from ATR assumed to be at 20 bar (Element Energy, 2018) – hence included electricity for additional hydrogen compression to 30 bar (DESNZ, 2023). Emissions of fugitive methane and N2O, and consumption of MEA catalyst are from industry data. CO2 capture rate of 95% (Environmental Agency, 2023; Element Energy, 2018). All inputs assume to remain constant to 2030. Assume same inputs for US and UK. |
LHV efficiency: 80.6% ATR electricity: 8.8 MJ elec/kg H2 Electricity for nat gas compression: 0.0059 MJ elec/MJLHV nat gas Additional electricity for hydrogen compression: 0.0068 MJ elec/MJLHV H2 Water consumption: 3.8 kg H2O/kg H2 Catalyst consumption: 0.000081 kg MEA/MJLHV H2 CO2 capture rate: 95% Fugitive emissions: 0.00071 gCH4/MJLHV H2 0.0028 gN2O/MJLHV H2 |
LHV efficiency: 80.6% ATR electricity: 8.8 MJ elec/kg H2 Electricity for nat gas compression: 0.0059 MJ elec/MJLHV nat gas Additional electricity for hydrogen compression: 0.0068 MJ elec/MJLHV H2 Water consumption: 3.8 kg H2O/kg H2 Catalyst consumption: 0.000081 kg MEA/MJLHV H2 CO2 capture rate: 95% Fugitive emissions: 0.00071 gCH4/MJLHV H2 0.0028 gN2O/MJLHV H2 |
JRC, 2020, JEC-Well-to-Tank report v5 Element Energy, 2018, Hydrogen supply chain evidence base prepared for BEIS |
|
Hydrogen compression before pipeline transport |
Scotland, Morocco, Norway, France, UK |
Hydrogen assumed to be produced at 30 bar. Compression required to reach 100 bar for injecting in transmission pipeline network (Element Energy, 2018). Electricity required for compressing hydrogen from 30 bar to 100 bar calculated using formula in DESNZ, 2023. |
0.78 kWh/kg H2 |
0.78 kWh/kg H2 |
Element Energy, 2018, Hydrogen supply chain evidence base prepared for BEIS |
|
Pipeline transport |
Scotland, Morocco, Norway, France, UK |
Offshore subsea pipelines assumed for Scotland, and Norway; onshore pipelines will be used for France; and both onshore and offshore pipelines will be used for Morocco. Pipelines have been excluded for Chile and the USA due to the distances required. Dedicated pipeline compressor ratings in the CXC report were used and pipeline throughput from European Hydrogen Backbone report for 36-inch pipeline at 75% capacity. Assume losses in pipeline transport of 1% (JRC, 2024). |
Scotland: 36 MWe/1000 km Norway: 60 MWe/1000 km France: 45 MWe/1000 km Morocco: 40 MWe/1000 km Pipeline losses: 1% 36-inch pipeline throughput at 75% capacity: 3600 MWLHV H2 |
Scotland: 36 MWe/1000 km Norway: 60 MWe/1000 km France: 45 MWe/1000 km Morocco: 40 MWe/1000 km Pipeline losses: 1% 36-inch pipeline throughput at 75% capacity: 3600 MWLHV H2 | |
|
Hydrogen compression before trucking |
All (expect USA and Chile) |
Hydrogen assumed to be produced at 30 bar. Compression required to reach 500 bar (JRC, 2020) for trucking of hydrogen and storage of hydrogen (Element Energy, 2018) at either side of the shipping port. Electricity required for compressing hydrogen from 30 bar to 500 bar calculated using formula in DESNZ, 2023. |
2.34 kWh/kg H2 |
2.34 kWh/kg H2 |
JRC, 2020, JEC-Well-to-Tank report v5 Element Energy, 2018, Hydrogen supply chain evidence base prepared for BEIS |
|
Compressed hydrogen trucking |
All (expect USA and Chile) |
Hydrogen trucked at 500 bar, from hydrogen plant to port. Trucks are assumed to use diesel with biofuel blend in the current year based on UK Gov conversion factors (2024). By 2030, assume trucks use a 12% biofuel blend (LHV basis) in 2030 based on DfT targets (2021), and for simplicity, this applies to all regions. For all pathways, assume a trucking distance of 50 km between hydrogen production site and port (JRC, 2020). Standard truck fuel use was taken from JEC (2020) and an adjustment factor was applied to account for trucking hydrogen. The leakage rate for compressed hydrogen trucking is assumed to be the same as for storage (Frazer-Nash, 2022) therefore assumed 0.24% leakage per day during trucking. |
Distance: 50 km Payload: 0.955 tonne H2 payload Capacity: 28 tonne tank mass Losses: 0.24%/day Fuel use: 0.81 MJ diesel/tonne.km |
Distance: 50 km Payload: 0.955 tonne H2 payload Capacity: 28 tonne tank mass Losses: 0.24%/day Fuel use: 0.81 MJ diesel/tonne.km |
UK Gov, 2024, Greenhouse gas reporting: conversion factors 2024 JRC, 2020, JEC-Well-to-Tank report v5 Frazer-Nash Consulting, 2022, Fugitive Hydrogen Emissions in a Future Hydrogen Economy |
|
Compressed hydrogen storage |
All (expect USA and Chile) |
Hydrogen stored in gaseous form at 500 bar. The leakage rate ranges from 0.12% – 0.24% per day depending on the storage pressure, cylinder and valve material, and the size of the cylinder. Assume a smaller cylinder is required due to hydrogen being stored at high pressure therefore expect the leakage rate to be at the top end of this range (0.24%). Average duration of compressed hydrogen delivery is 2 – 30 days (Frazer-Nash, 2022). Here assume 20 days storage. |
Losses: 0.24%/day Storage time: 20 days |
Losses: 0.24%/day Storage time: 20 days |
Frazer-Nash Consulting, 2022, Fugitive Hydrogen Emissions in a Future Hydrogen Economy |
|
Hydrogen decompression |
All (expect USA and Chile) |
Assumed no heat required for decompression of gaseous hydrogen from high pressure. |
– |
– | |
|
Compressed hydrogen shipping |
All (expect USA and Chile) |
Hydrogen shipped at 250 bar on ship with capacity (1370 t H2) and fuel usage (534 kt diesel/Mt H2) taken from JRC (2024). Fuel usage converted to MJ diesel/km assuming 29.1 ships deliver 1 Mt H2/yr over distance of 2,500 km (JRC, 2024). Assumed current shipping runs on fossil marine diesel oil (not biodiesel as in JRC source), and by 2030, 25% of hydrogen carrying vessels are assumed to be running on external sources of zero carbon hydrogen (so effectively 25% lower fossil marine diesel oil use by 2030). Ship speed (29.6 km/hr) taken from JRC (2024). The leakage rate for compressed hydrogen shipping is assumed to be the same as for storage (Frazer-Nash, 2022) therefore assumed 0.24% leakage per day during shipping. Return ship journeys always assumed to be empty (IEA, 2019). |
Ships: 100% fossil marine diesel oil Fuel usage: 437 MJ diesel/km |
Ships: 75% fossil marine diesel oil, 25% zero carbon hydrogen Fuel usage: 328 MJ diesel/km | |
|
Capacity: 1370 tonne H2 Vessel speed: 29.6 km/hr Losses: 0.24%/day |
Capacity: 1370 tonne H2 Vessel speed: 29.6 km/hr Losses: 0.24%/day |
Frazer-Nash Consulting, 2022, Fugitive Hydrogen Emissions in a Future Hydrogen Economy | |||
|
Ammonia production |
All |
Data for ammonia production taken from JRC, 2024. Includes inputs of electricity, iron-based catalyst, and water consumption (150 L/kg ammonia used for cooling where 9% is consumed and the rest is recycled in the process; 1.9 L/kg ammonia used for water deionisation). Also, ammonia emissions and nitrous oxide emissions are included. |
Electricity requirement: 0.81 kWh/kg NH3 Catalyst: 0.055 g catalyst/kg NH3 Water consumption: 15.4 L H2O/kg NH3 Fugitive emissions: 1.63 gNH3/kgNH3 1.0 gN2O/kgNH3 |
Electricity requirement: 0.81 kWh/kg NH3 Catalyst: 0.055 g catalyst/kg NH3 Water consumption: 15.4 L H2O/kg NH3 Fugitive emissions: 1.63 gNH3/kgNH3 1.0 gN2O/kgNH3 | |
|
Ammonia trucking |
All |
Trucks are assumed to use diesel with biofuel blend in the current year based on UK Gov conversion factors (2024). By 2030, assume trucks use a 12% biofuel blend (energy basis) in 2030 based on UK targets (DfT, 2021). No boil-off assumed (IEA, 2020). For all pathways a trucking distance of 50 km has been assumed from ammonia plant to port (JRC, 2020). Standard truck fuel use taken from JEC (2020) and an adjustment factor was applied to account for trucking ammonia, with the truck payload calculated based on an equivalent 2.6 tonne H2 capacity per ammonia truck (IEA, 2020) converted to 14.7 tonnes of ammonia using molar masses (JRC, 2020). |
Distance: 50 km Payload: 14.7 tonne NH3 payload Capacity: 28 tonne tank mass Losses: 0%/day Fuel use: 0.81 MJ diesel/tonne.km |
Distance: 50 km Payload: 14.7 tonne NH3 payload Capacity: 28 tonne tank mass Losses: 0%/day Fuel use: 0.81 MJ diesel/tonne.km |
UK Gov, 2024, Greenhouse gas reporting: conversion factors 2024 |
|
Ammonia storage |
All |
0.005 kWh/kg ammonia electricity required for storage at export terminal and 0.02 kWh/kg ammonia required for storage at import terminal. Assume 0%/day boil-off rate and 20 days storage time (IEA, 2020). |
Electricity for export terminal: 0.005 kWh/kg NH3 Electricity for import terminal: 0.02 kWh/kg NH3 Losses: 0%/day Storage time: 20 days |
Electricity for export terminal: 0.005 kWh/kg NH3 Electricity for import terminal: 0.02 kWh/kg NH3 Losses: 0%/day Storage time: 20 days | |
|
Ammonia shipping |
All |
Ammonia ship capacity and fuel use are calculated using the JRC, 2024 report. The ship capacity is based on compressed hydrogen ship capacity, applying the ratio of ships required to deliver 1 Mt H2/yr using compressed hydrogen (29.1 ships) compared to ammonia (4.5 ships). Fuel usage (57 kt diesel/Mt H2) assumed over shipping distance of 2,500 km. Assumed current shipping runs on fossil marine diesel oil, and by 2030, 25% of ammonia carrying vessels are assumed to be running on external sources of zero carbon ammonia (so effectively 25% lower fossil marine diesel oil use by 2030). Boil off rate assumed to be 0.02%/day (JRC, 2024). Ship speed (29.6 km/hr) taken from JRC, 2024. Return ship journeys always assumed to be empty (IEA, 2019). |
Fuel use: 100% fossil marine diesel oil, 302 MJ diesel/km Capacity: 8,859 tonne NH3 Vessel speed: 29.6 km/hr Losses: 0.02%/day |
Fuel use: 75% fossil marine diesel oil, 25% zero carbon ammonia, so 226.5 MJ diesel/km Capacity: 8,859 tonne NH3 Vessel speed: 29.6 km/hr Losses: 0.02%/day | |
|
Ammonia cracking |
All |
Data for ammonia cracking is based on JRC, 2024. Assume part of ammonia delivered to the cracker is used for heating (1.63 kg ammonia/kg H2), in addition to 5.67 kg ammonia/kg H2 feedstock use, used to calculate LHV efficiency of this step, given ammonia LHV = 18.6 MJ/kg. Hydrogen produced from ammonia cracking is assumed to be at 99.97% purity and 240 bar. No additional electricity required to compress hydrogen further for downstream usage. |
Ammonia input: 7.3 kg ammonia/kg H2 Electricity: 4.86 kWh/kg H2 Nickel-based catalyst: 1.46 g catalyst/kg H2 Zeolite powder: 0.88 g zeolite/kg H2 Fugitive emissions: Ammonia: 7.05 mg/kg H2 N2O: 4.89 mg N2O/kg H2 |
Ammonia input: 7.3 kg ammonia/kg H2 Electricity: 4.86 kWh/kg H2 Nickel-based catalyst: 1.46 g catalyst/kg H2 Zeolite powder: 0.88 g zeolite/kg H2 Fugitive emissions: Ammonia: 7.05 mg/kg H2 N2O: 4.89 mg N2O/kg H2 | |
|
Piping of hydrogen to hydrogen user |
Netherlands |
Transport of hydrogen via pipeline from port storage to the refinery was assumed to be 50 km. Hydrogen transferred from storage to pipeline assumed to be at sufficient pressure, so no additional compression electricity required (Element Energy, 2018). Pipeline compressor rating and throughput from European Hydrogen Backbone report for 36-inch pipeline at 75% capacity (similar to country specific ratings in the CXC 2023 report). Assume some losses in pipeline transport (JRC, 2024) with fugitive losses 1% |
Pipeline distance: 50 km Pipeline losses: 1% |
Pipeline distance: 50 km Pipeline losses: 1% |
Element Energy, 2018, Hydrogen supply chain evidence base prepared for BEIS |
|
Hydrogen user |
Netherlands |
In Rotterdam, there is a large focus on using hydrogen in industry, including petrochemical terminals and refineries. To align with a hydrogen application in Rotterdam, usage of gaseous hydrogen in a refinery was selected as the downstream application. For hydrogen use in a refinery boiler, N2O emissions have been included (0.272 mgN2O/kWh) (Scottish Government, 2023) with hydrogen losses of 0.5% (JRC, 2024). The input hydrogen pressure was assumed to be 10 bar (HyNet, 2022). |
N2O emissions: 0.272 mgN2O/kWh H2 Hydrogen losses: 0.5% |
N2O emissions: 0.272 mgN2O/kWh H2 Hydrogen losses: 0.5% |
Rotterdam Maritime Capital, Europe’s Hydrogen Hub Scottish Government, 2023, Nitrous Oxide emissions associated with 100% hydrogen boilers: research |
|
Ammonia user |
Netherlands |
Main uses of ammonia are in fertilisers, with shipping proposed as a major future market. Given the significance of the maritime sector in Rotterdam, usage of ammonia in shipping was selected as the downstream application. No further transport of ammonia before the final user Accounted for nitrous oxide emissions (0.061 gN2O/kWh) releasing during shipping (Maersk Mc-Kinney Moller Center, 2023). |
N2O emissions: 0.061 gN2O/kWh NH3 |
N2O emissions: 0.061 gN2O/kWh NH3 |
Rotterdam Maritime Capital, Europe’s Hydrogen Hub Maersk Mc-Kinney Moller Center, 2023, Managing Emissions from Ammonia-Fueled Vessels |
Appendix F Sensitivity Analysis
Sensitivity 1: All renewable electricity
The baseline results shown in Section 3.2 assume grid electricity in the relevant country is used whenever electricity is consumed in any of the steps downstream of hydrogen production, and that grid electricity is also used during hydrogen production via natural gas ATR+CCS.
This sensitivity tests the impact of using renewable electricity for all steps of the value chain, including hydrogen distribution (e.g. compression, ammonia production, cracking, storage etc) as well as for hydrogen production via ATRCCS. However, no change was made to the electrolysis input electricity source, and this sensitivity was not applied to grid electrolysis pathways as these pathways are unlikely to adopt fully renewable electricity for downstream steps outside of their control when the electrolysis is using grid average electricity.
Results in Figure 8 and Figure 9 below show that all renewable electrolysis pathways could fall even further below the GHG emission threshold in 2023 and 2030 when this sensitivity is applied. Compared to the baseline renewable electrolysis pathways (without the sensitivity applied), the emission intensity reduces by up to 46 gCO2e/MJLHV when utilising renewable electricity – this largest reduction is achieved for renewable electrolytic hydrogen produced in Morocco and transported as ammonia.
After application of this sensitivity, the main remaining emissions for the renewable electrolysis pathways will be the release of nitrous oxide in ammonia pathways, and the shipping fuels used for transporting ammonia or compressed hydrogen. The difference between 2023 and 2030 results is due to the decarbonisation of trucks and ships using cleaner fuels.
All renewable ammonia pathways are also expected to meet the EU GHG threshold. However, these pathways will still have significantly higher emissions compared to the gaseous hydrogen shipping pathways due to efficiency losses in the (re-)conversion steps and release of nitrous oxide.
Compared to the baseline, hydrogen produced in the UK or USA via natural gas pathways and transported as ammonia still exceeds the EU GHG threshold due to the upstream emissions and emissions associated with ammonia (re-)conversion. However, the emissions from producing hydrogen in the UK via natural gas ATR+CCS and transported via compressed shipping or pipeline could just meet the GHG threshold in 2023. The UK could therefore have an emissions advantage over the USA if comparing natural gas reforming pathways.
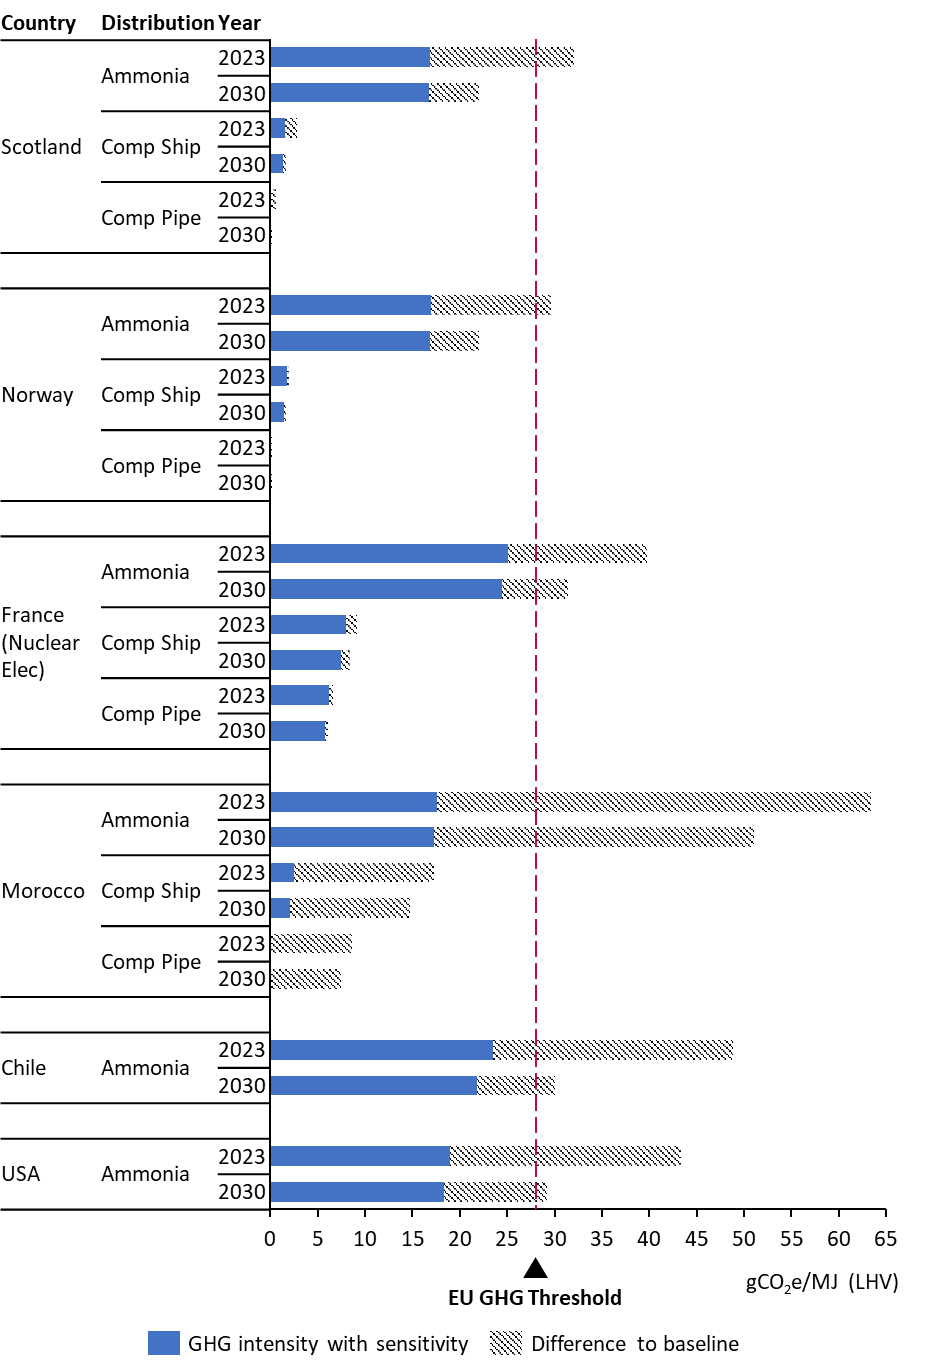
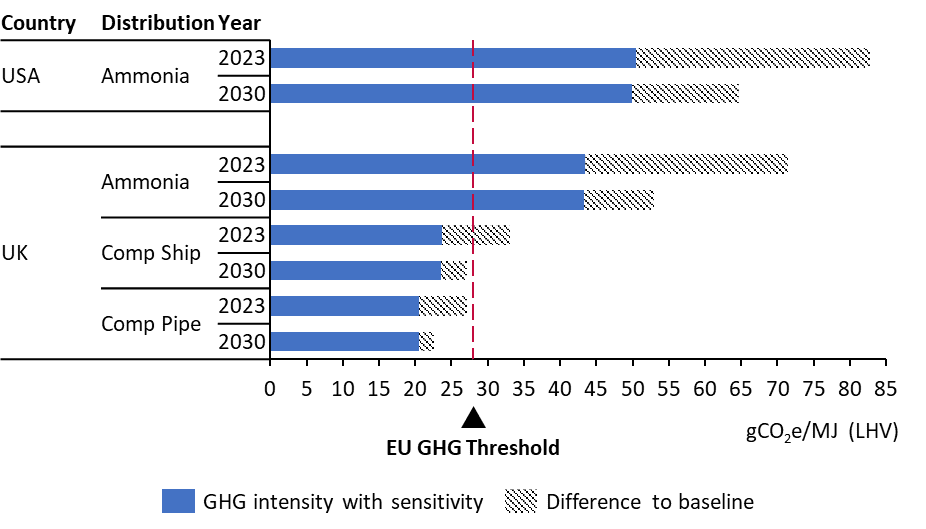
Sensitivity 2: GB vs Scotland grid electricity
In the baseline, Scottish grid electricity GHG intensities are modelled for Scottish production, although under EU RED or the EU Gas Directive, the European Commission are yet to confirm whether the Scottish or GB (or even average UK) grid intensity should be used. The GB grid electricity GHG intensity is significantly higher than that of Scotland’s due to the GB grid electricity mix consisting of a higher contribution from natural gas (~40% compared to ~10% in Scotland’s grid mix) and a lower contribution from renewable sources (~40% compared to ~70% in Scotland’s grid). Scotland is expected to have a much lower grid GHG intensity compared to GB until full decarbonisation of the GB grid is achieved. The UK Government have set a target to decarbonise the electricity grid by 2030 but for modelling purposes, the projected GHG intensity of the UK electricity grid is based on the grid mix data in the National Grid’s Future Energy Scenarios (~70% reduction in the electricity grid GHG intensity in 2030 compared to today). The GHG intensities modelled for the GB and Scottish grids include upstream emissions in line with EU RED requirements. As shown in Figure 10, all Scottish electrolysis and distribution pathway combinations using GB grid electricity intensities are expected to be above the EU GHG threshold in 2023, and only the compressed pipeline pathway may just comply in 2030.
The added emissions from the higher GB grid intensity are particularly significant for pathways transporting hydrogen via ammonia, increasing by over 100% compared to the same pathway using the Scottish grid factor.
Scottish producers would therefore gain a significant advantage if the Commission were to allow a Scottish grid factor to be used (and under EU RED rules, this decision would also become more likely if zonal pricing across GB is introduced, provided there are one or more zones in Scotland).
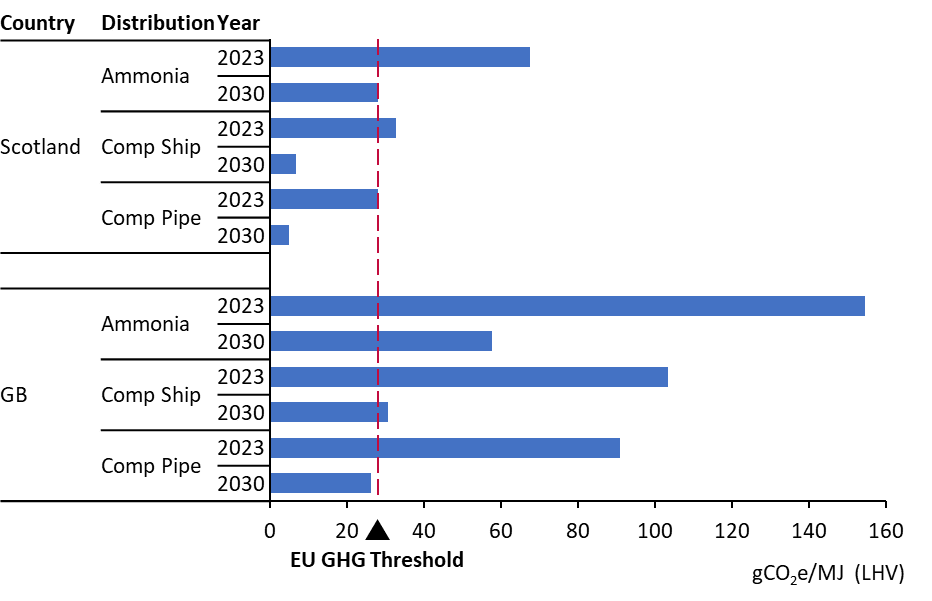
Sensitivity 3: Low-carbon shipping fuel
In the baseline, ships are assumed to use fossil marine diesel fuel exclusively in 2023, but in 2030, 25% of the fleet is assumed to be fuelled by zero emission hydrogen or ammonia. As a sensitivity, we explored switching to 100% zero emission shipping fuel (such as renewable ammonia) in 2030, when supply is expected to be more readily available. For simplicity, this zero emission fuel is assumed to be sourced from supplies other than the shipping cargo, so as to not impact the chain efficiencies. The resulting sensitivity results show a modest reduction in emissions across all shipping pathways but is more noticeable in pathways with high shipping distances such as from Chile.
Compared to the baseline, using 100% zero emissions shipping fuel to transport renewable or grid electricity based ammonia from Chile to Rotterdam could reduce the total pathway emissions by 18% or 8% respectively in 2030, or by 6% for US renewable ammonia pathways in 2030. This sensitivity for the Chile and USA renewable electrolysis pathways would enable compliance with the EU GHG threshold in 2030.
However, for hydrogen production in countries other than Chile and USA (using renewable electricity and ammonia distribution), decarbonising shipping fuel in 2030 is unlikely to be significant enough to enable previously non-compliant pathways to fall below the GHG threshold.
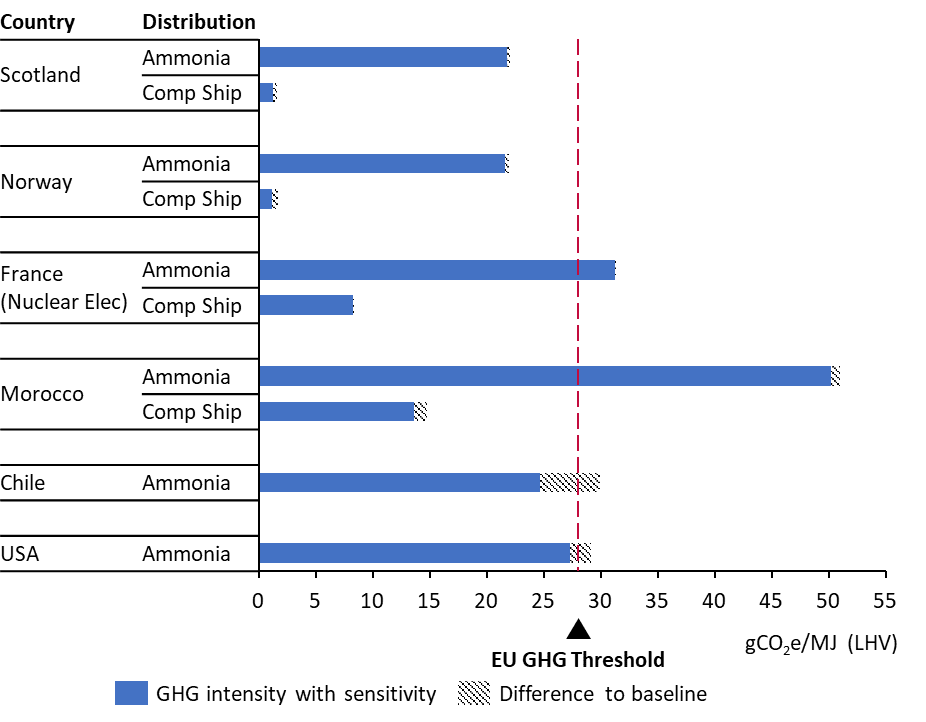
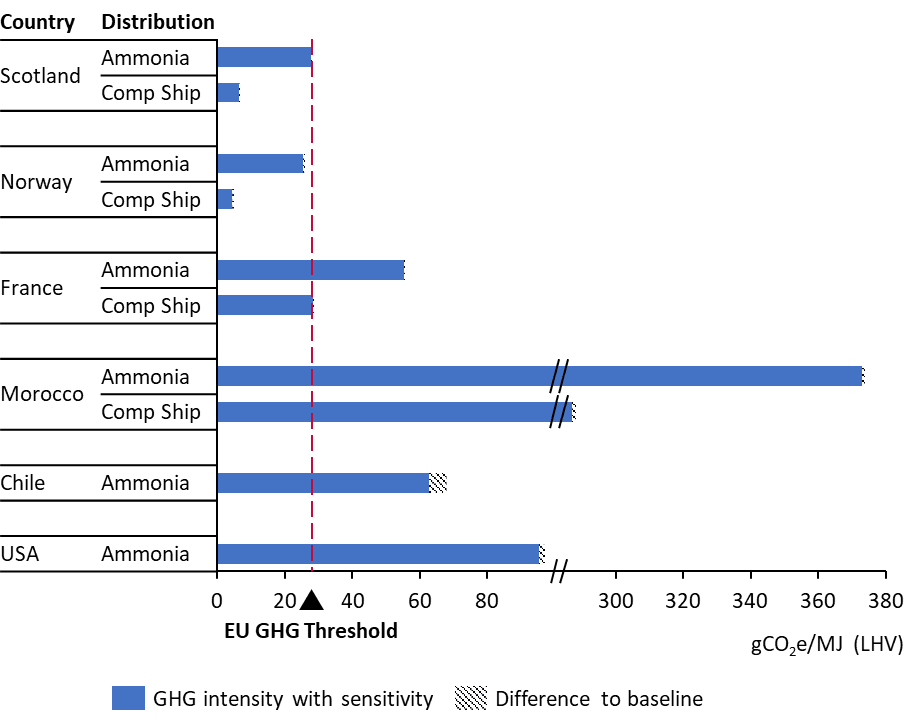
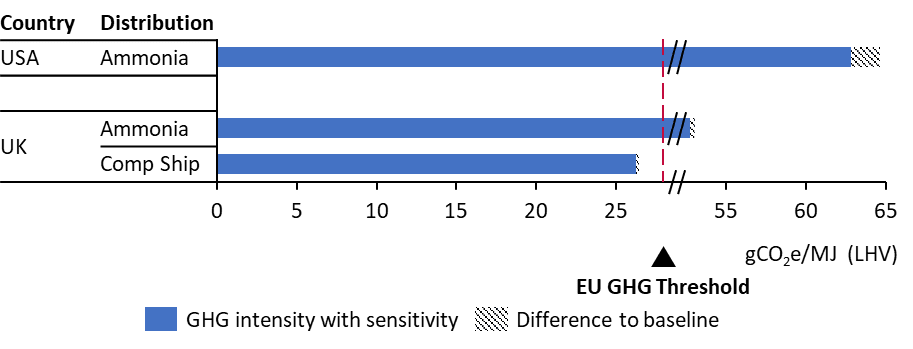
Sensitivity 4: Renewable heat
In the baseline, the ammonia pathways that require reconversion to gaseous hydrogen are assumed to consume some of the shipped ammonia to provide heat for the cracking process. For this sensitivity, utilisation of renewable industrial heat (from an alternative source with zero emissions) instead of self-consumption of ammonia was modelled.
Figure 14 shows that using alternative renewable heat for renewable ammonia cracking could enable production in Norway to achieve compliance with the threshold in 2023, but not other countries. However, as shown in Figure 15, this sensitivity does not sufficiently reduce the GHG intensity to achieve compliance with the EU GHG threshold for any grid-based ammonia pathways in 2023. But by 2030, decarbonisation of Scotland’s grid may be enough to enable the Scottish grid-based ammonia pathway to comply.
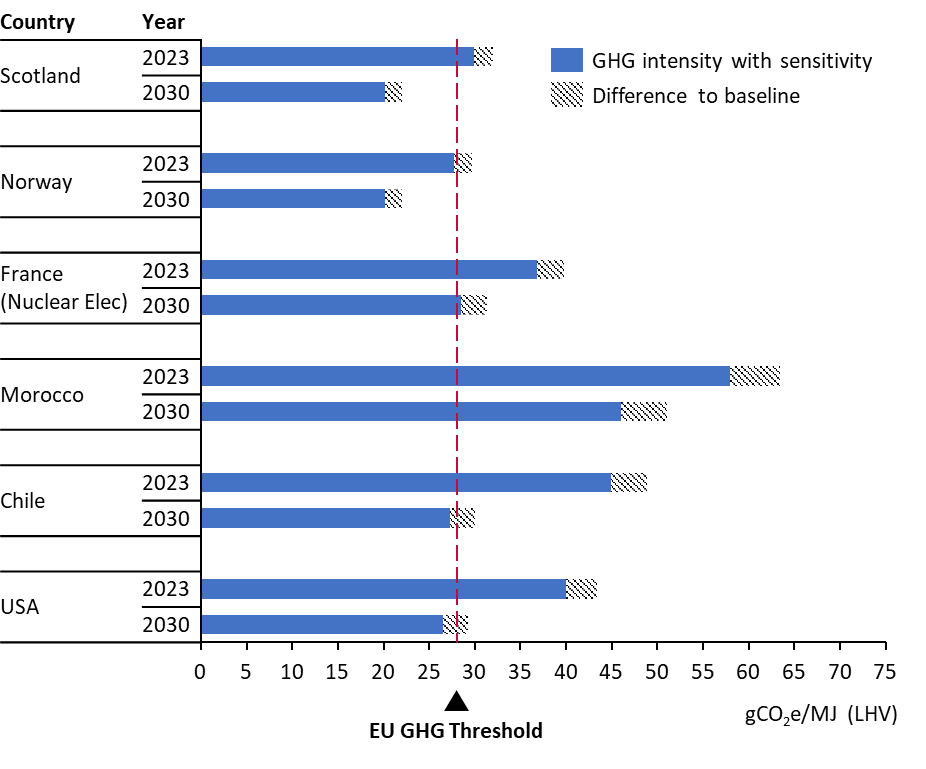
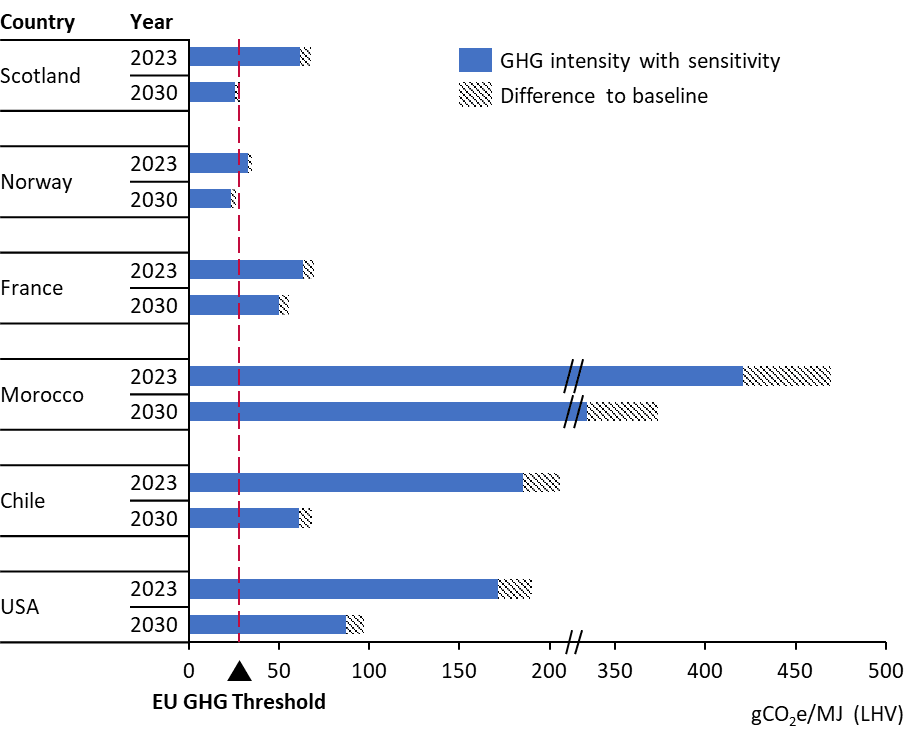
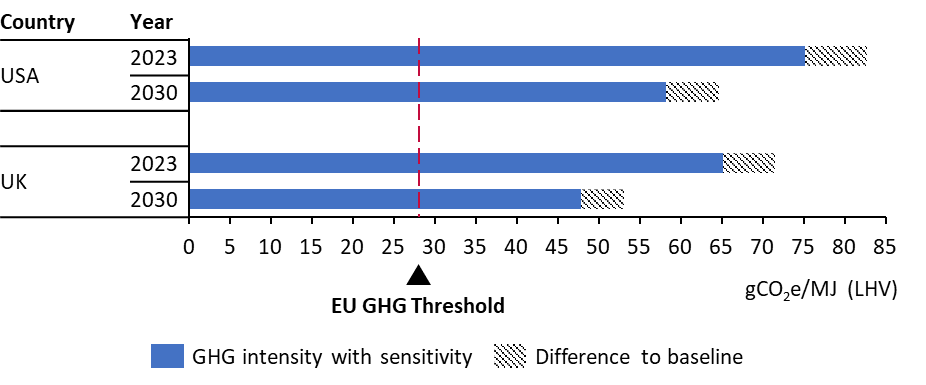
Appendix G GHG Emission Compliance Scoring Matrix
The GHG intensity calculated for each pathway in 2023 and in 2030 were compared against the EU GHG emissions threshold of 28.2 gCO2e/MJLHV to evaluate the risk of non-compliance for each potential hydrogen exporting country. The table below summarises the results from the GHG intensity scoring including justification for the scores. A selection of GHG reduction measures were modelled in the sensitivity analysis to evaluate the impact of using renewable electricity across all the post-production supply chain steps, using (alternative) renewable heat for the ammonia cracking step of relevant pathways, and/or switching in 2030 to using only zero emission marine fuels for shipping pathways. See Appendix F for further details. Scottish vs GB grid results are given below as separate pathways scores. Those scores marked with a * do not have any relevant sensitivities modelled that reduce their emissions, so cannot be medium risk. The following scoring was used:
|
L |
Low risk: Likely to comply with GHG threshold set under EU RED and EU Gas Directive |
|
M |
Medium risk: Could comply if relevant GHG reduction measures modelled in the sensitivity analysis are applied |
|
H |
High risk: Likely to not comply, even with relevant GHG reduction measures modelled in the sensitivity analysis |
|
Country |
Hydrogen Value Chain |
2023 |
2030 |
Reasoning |
|
Scotland |
Ammonia (Scottish grid factor), shipping, cracking, H2 use |
M |
L |
2023 can comply if renewable electricity is used throughout the chain. In 2030, Dutch electricity grid decarbonisation reduces cracking impact allowing compliance. |
|
Scotland |
Ammonia (Scottish grid factor), shipping, Ammonia use |
L |
L |
Below the threshold, despite emissions arising from conversion steps. |
|
Scotland |
Compression (Scottish grid factor), shipping, H2 use |
L |
L |
Well below the threshold |
|
Scotland |
Compression (Scottish grid factor), shipping, H2 use |
L |
L |
Well below the threshold |
|
Scotland |
Ammonia (GB grid factor), shipping, cracking, H2 use |
M |
L |
2023 can comply if renewable electricity is used throughout the chain. In 2030, Dutch electricity grid decarbonisation reduces cracking impact allowing compliance. |
|
Scotland |
Ammonia (GB grid factor), shipping, ammonia use |
L |
L |
Below the threshold, despite conversion emissions. |
|
Scotland |
Compression (GB grid factor), H2 use |
L |
L |
Well below the threshold |
|
Scotland |
Compression (GB grid factor), pipeline, H2 use |
L |
L |
Well below the threshold |
|
Norway |
Ammonia, shipping, cracking, H2 use |
M |
L |
Using renewable heat or renewable electricity in 2023 can enable compliance. |
|
Norway |
Ammonia, shipping, ammonia use |
L |
L |
Below the threshold, despite conversion emissions. |
|
Norway |
Compression, shipping, H2 use |
L |
L |
Well below the threshold |
|
Norway |
Compression, pipeline, H2 use |
L |
L |
Well below the threshold |
|
France (nuclear) |
Ammonia, shipping, cracking, H2 use |
M |
M |
Threshold can be met in 2023 and 2030 by using renewable electricity for ammonia cracking. |
|
France (nuclear) |
Ammonia, shipping, ammonia use |
M |
L |
Using renewable electricity throughout chain enables compliance in 2023. 2030 is just compliant due to decarbonisation of the Dutch electricity grid. |
|
France (nuclear) |
Compression, shipping, H2 use |
L |
L |
Well below the threshold, even with some nuclear electricity emissions. |
|
France (nuclear) |
Compression, pipeline, H2 use |
L |
L |
Well below the threshold, even with some nuclear electricity emissions. |
|
Morocco |
Ammonia, shipping, cracking, H2 use |
M |
M |
Morocco’s grid leads to high ammonia conversion emissions, but if renewable electricity was used instead, could comply. |
|
Morocco |
Ammonia, shipping, ammonia use |
M |
M |
Morocco’s grid leads to high ammonia conversion emissions, but if renewable electricity was used instead, could comply. |
|
Morocco |
Compression, shipping, H2 use |
L |
L |
Below the threshold, despite Moroccan grid input for compression. |
|
Morocco |
Compression, pipeline, H2 use |
L |
L |
Below the threshold, despite Moroccan grid input for compression. |
|
USA |
Ammonia, shipping, cracking, H2 use |
M |
M |
Using renewable electricity can enable compliance. |
|
USA |
Ammonia, shipping, ammonia use |
M |
L |
2030 just below threshold, but using renewable electricity throughout chain, rather than New Jersey’s high intensity grid, can enable compliance in 2023. |
|
Chile |
Ammonia, shipping, cracking, H2 use |
M |
M |
Using renewable electricity throughout chain can enable compliance. |
|
Chile |
Ammonia, shipping, ammonia use |
M |
L |
2030 just below threshold, but using renewable electricity throughout chain, rather than Chile’s high intensity grid, can enable compliance in 2023. |
|
Country |
Hydrogen Value Chain |
2023 |
2030 |
Reasoning |
|
Scotland (Scottish grid factor) |
Ammonia (Scottish grid factor), shipping, cracking, H2 end use |
H |
L |
Electricity grid decarbonisation enables this pathway to just fall below the threshold in 2030, but not in 2023. |
|
Scotland (Scottish grid factor) |
Ammonia (Scottish grid factor), shipping, ammonia end use |
H* |
L |
Electricity grid decarbonisation enables this pathway to just fall below the threshold in 2030, but not in 2023. |
|
Scotland (Scottish grid factor) |
(Scottish grid factor) compressed H2, shipping, H2 end use |
H* |
L |
Just above the threshold in 2023, but electricity grid decarbonisation enables this pathway to fall well below the threshold in 2030. |
|
Scotland (Scottish grid factor) |
(Scottish grid factor) compressed H2, pipeline, H2 end use |
L* |
L* |
Just below the threshold in 2023, and electricity grid decarbonisation enables this pathway to fall well below the threshold in 2030 |
|
Scotland (GB grid factor) |
Ammonia (GB grid factor), shipping, cracking, H2 end use |
H |
H |
GB electricity grid ~3 times more GHG intensive than Scotland’s, leading to emissions well above the threshold, even with projected grid decarbonisation. |
|
Scotland (GB grid factor) |
Ammonia (GB grid factor), shipping, ammonia end use |
H* |
H |
GB grid ~3 times more GHG intensive than Scotland’s, leading to emissions well above the threshold, even with projected grid decarbonisation. |
|
Scotland (GB grid factor) |
(GB grid factor) compressed H2 shipping, H2 end use |
H* |
H |
GB electricity grid decarbonisation not quite enough to meet threshold by 2030. |
|
Scotland (GB grid factor) |
(GB grid factor) compressed H2 pipeline, H2 end use |
H* |
L |
GB electricity grid decarbonisation not quite enough to meet threshold by 2030. |
|
Norway |
Ammonia, shipping, cracking, H2 end use |
H |
L |
Decarbonisation of Norway and Netherlands electricity grids enables compliance in 2030. |
|
Norway |
Ammonia, shipping, ammonia end use |
L* |
L |
Below threshold, despite conversion emissions. |
|
Norway |
Compressed H2 shipping, H2 end use |
L* |
L |
Well below the threshold. |
|
Norway |
Compressed H2 pipeline, H2 end use |
L* |
L* |
Well below the threshold. |
|
France |
Ammonia, shipping, cracking, H2 end use |
H |
H |
France’s electricity grid decarbonisation is not enough to comply in 2030. |
|
France |
Ammonia, shipping, ammonia end use |
H* |
H |
France’s electricity grid decarbonisation is not enough to comply in 2030. |
|
France |
Compressed H2 shipping, H2 end use |
H* |
H |
France’s and Netherland’s electricity grid decarbonisation is not enough to comply. |
|
France |
Compressed H2 pipeline, H2 end use |
H* |
L* |
France’s electricity grid decarbonisation combined with low emissions from distribution allows compliance in 2030. |
|
Morocco |
Ammonia, shipping, cracking, H2 end use |
H |
H |
Morocco’s grid has a very high GHG intensity, significantly exceeding the threshold. |
|
Morocco |
Ammonia, shipping, ammonia end use |
H* |
H |
Morocco’s grid has a very high GHG intensity, significantly exceeding the threshold. |
|
Morocco |
Compressed H2 shipping, H2 end use |
H* |
H |
Morocco’s grid has a very high GHG intensity, significantly exceeding the threshold. |
|
Morocco |
Compressed H2 pipeline, H2 end use |
H* |
H* |
Morocco’s grid has a very high GHG intensity, significantly exceeding the threshold. |
|
USA |
Ammonia, shipping, cracking, H2 end use |
H |
H |
New Jersey’s grid has a high GHG intensity, significantly exceeding the threshold, even with expected decarbonisation by 2030. |
|
USA |
Ammonia, shipping, ammonia end use |
H* |
H |
New Jersey’s grid has a high GHG intensity, significantly exceeding the threshold, even with expected decarbonisation by 2030. |
|
Chile |
Ammonia, shipping, cracking, H2 end use |
H |
H |
Chile’s grid has a high GHG intensity, significantly exceeding the threshold, even with expected decarbonisation by 2030. |
|
Chile |
Ammonia, shipping, ammonia end use |
H* |
H |
Chile’s grid has a high GHG intensity, significantly exceeding the threshold, even with expected decarbonisation by 2030. |
|
Country |
Hydrogen Value Chain |
2023 |
2030 |
Reasoning |
|
USA |
Ammonia, shipping, cracking, H2 end use |
H |
H |
Natural gas upstream emissions combined with N2O emissions, chain efficiency losses and the New Jersey electricity grid means emissions significantly above the threshold. |
|
USA |
Ammonia, shipping, ammonia end use |
H |
H |
Natural gas upstream emissions combined with N2O emissions, chain efficiency losses and the New Jersey electricity grid means emissions significantly above the threshold. |
|
UK |
Ammonia (GB grid factor), shipping, H2 end use |
H |
H |
Natural gas upstream emissions combined with N2O emissions, chain efficiency losses, and GB electricity grid means emissions significantly above the threshold. |
|
UK |
Ammonia (GB grid factor), shipping, Ammonia end use |
H |
H |
Natural gas upstream emissions combined with N2O emissions, chain efficiency losses, and GB electricity grid means emissions significantly above the threshold. |
|
UK |
Compression (GB grid factor), shipping, H2 end use |
M |
L |
Using renewable electricity for ATR+CCS hydrogen production and distribution could enable compliance in 2023. GB electricity grid and shipping decarbonisation could just lead to compliance in 2030 (but still sensitive to upstream natural gas emissions). |
|
UK |
Compression (GB grid factor), pipeline, H2 end use |
L |
L |
Low distribution emissions may just allow compliance in 2023 (but still sensitive to upstream natural gas emissions). |
Appendix H Methodology for calculating the cost of compliance
For those pathways identified with an amber rating, ClimateXChange requested a methodology for calculating the costs (in £/kg) of meeting EU GHG intensity requirements if the GHG intensity of a delivered hydrogen pathway is too high but could be made compliant via implementing various GHG emission reduction measures.
This methodology will allow ClimateXChange to combine energy and fuels unit cost data (for 2023 and 2030) from their previous report with the usage rates and relative GHG emission intensities from this project, to calculate the added costs of compliance, potentially as a weighted average cost across multiple mitigation options.
Table 12 outlines the steps that can be taken to calculate the minimum cost of compliance for the “amber rating” hydrogen pathways. This approach relies on the user selecting mitigation measures that are independent of each other[9] and does not take into account any variation in cost within a mitigation measure, nor how these abatement costs compare to other options outside of the supply chain sensitivities explored (or other decarbonisation options for the end user outside of these hydrogen pathways).
|
Step |
Methodology |
Example (purely illustrative) |
|---|---|---|
|
1 |
Model the GHG intensity of the delivered hydrogen without any measures applied |
48.2 gCO2e/MJLHV hydrogen |
|
2 |
Model the cost of the delivered hydrogen without any measures applied |
£19.2/kg ÷ 120 MJLHV/kg = £0.16/MJLHV hydrogen |
|
3 |
Calculate the reduction in GHG intensity required to achieve the EU GHG emission threshold (step 1 – 28.2 gCO2e/MJLHV) |
48.2 – 28.2 = 20.0 gCO2e/MJLHV hydrogen abatement required |
|
4 |
Identify an emission reduction measure |
Wind electricity replacing grid electricity across the whole pathway (at the same availability as grid) |
|
5 |
Model the delivered hydrogen GHG intensity with the new measure applied |
15.2 gCO2e/MJLHV hydrogen |
|
6 |
Calculate the maximum abatement potential of the new measure (step 1 – step 7) |
48.2 – 15.2 = 33.0 gCO2e/MJLHV hydrogen abated |
|
7 |
Model the delivered hydrogen cost with the new measure applied |
£21.6/kg ÷ 120 MJLHV/kg = £0.18/MJLHV hydrogen |
|
8 |
Calculate the added cost of the new measure (step 7 – step 2) |
0.18 – 0.16 = 0.02 £/MJLHV hydrogen |
|
9 |
Calculate the abatement cost of the new measure, by dividing step 8 by step 6 then multiplying by 1,000,000 |
(0.02 £/MJLHV hydrogen ÷ 33.0 gCO2e/MJLHV hydrogen) x 1,000,000 g/t = £606/tCO2e abated |
|
10 |
Repeat steps 4 – 9 for each individual mitigation measure, and rank the mitigation measure abatement potentials by their abatement costs (step 9 results) |
Max 2.0 gCO2e/MJLHV hydrogen abated @£300/tCO2e for renewable shipping fuel replacing fossil marine diesel Max 33.0 gCO2e/MJLHV hydrogen abated @£606/tCO2e for renewable power replacing Scottish grid Max 12.0 gCO2e/MJLHV hydrogen abated @£700/tCO2e for (alternative) renewable heating replacing ammonia cracking self-heating |
|
11 |
Repeat steps 4-10 as many times as there are measures, but instead of assessing measures individually, start with the lowest abatement cost measure, then cumulatively include each extra measure on top of the others (following the step 10 ranking), to output a new list of abatement potentials ranked by their new abatement costs. At the end of each new step 10, overwrite step 1 with the latest step 5 result, and overwrite step 2 with the latest step 7 result, before adding the next measure in step 4 again. |
2.0 gCO2e/MJLHV hydrogen abated @£300/tCO2e for renewable shipping fuel replacing fossil marine diesel 33.0 gCO2e/MJLHV hydrogen abated @£606/tCO2e for renewable power replacing Scottish grid 3.0 gCO2e/MJLHV hydrogen abated @£2,800/tCO2e for (alternative) renewable heating replacing ammonia cracking self-heating |
|
12 |
Select enough measures in ranked order (cheapest first) from step 11 to achieve the step 3 requirement, noting that the whole abatement potential of each measure may not be needed |
2.0 gCO2e/MJLHV hydrogen abated @£300/tCO2e for renewable shipping fuel replacing fossil marine diesel 18.0 gCO2e/MJLHV hydrogen abated @£606/tCO2e for renewable power replacing Scottish grid No (alternative) renewable heating needed |
|
13 |
Calculate a weighted average of the selected step 12 abatements and abatement costs to calculate the overall minimum cost of compliance |
(2 x 300 + 18 x 606 + 0 x 2,800) / (2 + 18 + 0) = £575/tCO2e abated |
|
14 |
Finally, convert step 13 into £/kg by dividing by 1,000,000 then multiplying by step 3 and multiplying by the LHV energy content of the delivered hydrogen |
(£575/tCO2e abated ÷ 1,000,000 g/t) x 20 gCO2e/MJLHV hydrogen x 120 MJLHV/kg = £1.38/kg extra required to comply with EU GHG threshold |
© The University of Edinburgh, 2024
Prepared by ERM on behalf of ClimateXChange, The University of Edinburgh. All rights reserved.
While every effort is made to ensure the information in this report is accurate, no legal responsibility is accepted for any errors, omissions or misleading statements. The views expressed represent those of the author(s), and do not necessarily represent those of the host institutions or funders.
The rationale for a voluntary standard is that it builds consumer trust and encourages participation through market-driven benefits like increased demand and price advantages, without imposing penalties. It supports self-regulation and is easier to implement internationally, avoiding the need for legislative enforcement. ↑
Other standards that could incentivise the uptake of low-carbon hydrogen are also available in some regions (e.g. UK’s Renewable Transport Fuel Obligation, or California’s Low Carbon Fuel Standard). They have been excluded from this analysis because they are targeted at non-EU consumption, which is unlikely to affect hydrogen exports to the EU market. No further relevant standards were identified within those countries (Norway, Morocco, Chile) in scope of this study. ↑
Upstream emission factor for nuclear fuel is taken from Table 3 from RED Delegated Act on GHG methodology for RCFs and RFNBOs (1.2 gCO2e/MJ LHV fuel) (European Commission, 2023). Nuclear power plant LHV efficiency of 33% then applied (JRC, 2020). ↑
Feedstock emissions are only relevant to natural gas pathways and includes the upstream emissions for e.g. natural gas extraction, pre-processing and transport, including methane leakages. ↑
The maximum theoretical efficiency that a heat engine may have operating between two given temperatures. It is used in the LHV energy allocation methodology when heat or steam is a co-product. ↑
GOs is an assurance scheme to demonstrate to end-users that a product (e.g. hydrogen, electricity, biogas) are produced from renewable sources. In electricity, this can take the form of Renewable Electricity Certificates (RECs) or Power Purchasing Agreements (PPAs). More information on this in Appendix A. ↑
The maximum credit value is $0.60/kg hydrogen. This amount is multiplied by 5 (i.e. maximum credit value of $3.0/kg hydrogen) if the production facility meets prevailing wage requirements and apprenticeship requirements defined under the IRA. ↑
This is due to avoided methane emissions. ↑
If any of the measures are not independent of each other (e.g. if one measure impacts the efficiency of the supply chain), these non-independent measures may change the maximum abatement potential of other measures, and the abatement costs of some measures may also be impacted by the costs and order/combinations of other measures applied (or not applied). This process to find a minimum compliance cost may be iterative and will rely on cost & GHG modelling of the whole supply chain exploring combinations of measures. ↑
Work completed: December 2023
DOI: http://dx.doi.org/10.7488/era/3666
This research was carried out in 2022/23 and was based on the market conditions at that time. Policy related to and emphasis on electricity networks has changed significantly since this research was conducted and therefore not all aspects of the report reflect the current landscape.
Executive summary
Solar panels can help decarbonise Scotland’s energy supply and there are plans to reduce barriers to enable greater deployment in Scotland. The Scottish Government recently consulted on the potential for a solar ambition and a Solar Vision is in development.
The solar industry has been calling for a 4-6 GW solar photovoltaic (PV) ambition by 2030, to put Scotland in line with the UK target of 70 GW by 2035. This can be broken down as 2.5 GW rooftop solar (1.5 GW domestic and 1 GW commercial), with the remaining capacity made up of large-scale grounded mounted solar.
Our work investigates the benefits and impacts of deploying 2.5 GW of rooftop solar PV installation onto the electricity network in Scotland by 2030. The distribution network operators are forecasting lower levels of solar PV uptake in their future energy scenarios.
We consider the benefits, high-level estimate of reinforcement investments needed to accommodate it and the potential impact on consumer bills. We also consider wider costs to the transmission network.
Benefits and opportunities
The rise of electricity generation connected to a distribution network, known as embedded generation, offers new opportunities to the distribution network for managing the future growth of demand. Potential network benefits include:
- Reduction in electricity infrastructure investments due to generation meeting demand
- Reduced line losses from transmitting electricity across the transmission network due to more demand being met by onsite generation.
- Supporting demand in other areas by selling excess power
Financial benefits for consumers adopting solar PV arise from lower electricity bills. Benefits could be increased if demand could be shifted to times of excess generation. Stakeholders from the distribution networks considered that increased solar PV deployment would provide greatest opportunities for commercial consumers whose peak demand during the day would be most likely to match peak solar generation.
We also found that the co-location of commercial or domestic scale battery storage alongside solar PV would provide the greatest economic opportunities by extending the duration throughout the day when demand is met by on-site generation. This could also reduce network impacts by delaying the need for network upgrades.
Impacts and costs
We estimate that 27% (209) primary substations in Scotland might become overloaded with an increased deployment of rooftop solar. The impact is additional to that from other low-carbon technologies (e.g. wind, ground mounted solar, battery storage) as forecast by Distribution Network Operators. The majority (84%) of these substations are located in Scottish Power Energy Networks region, with 16% in Scottish & Southern Electricity Networks region.
Our high-level estimates of total costs for all forecasted network interventions are:
- Scottish Power Energy Networks (SPEN): £130 million worth of work to upgrade high-voltage substations and low-voltage networks and £120 million to upgrade transmission infrastructure.
- Scottish & Southern Electricity Networks (SSEN): £20 million worth of work to upgrade high-voltage substations and low-voltage networks, and £30 million to upgrade transmission infrastructure.
These are based on network reinforcement costs for a mix of areas representative of Scotland and key information on network location and capacity, and magnitude of solar PV in the area, with the results scaled up to represent all of Scotland. The cost of traditional network reinforcement involves replacing substations and overloaded equipment with that of a higher capacity rated equipment.
The distribution costs will be paid by all consumers in Scotland through their energy bills. The estimated average annual increase in domestic consumer energy bills is £0.53 in the SSEN area and £1.81 in the SPEN area. The estimated average annual increase in non-domestic consumer energy bills is £7.17 in SSEN’s area and £24.46 in SPEN’s area.
Alternative ways to release additional capacity from existing assets that could reduce costs include:
- Flexibility services, which contracts consumers/aggregators to generate power or shift load at times of congestion to support constraint management.
- Reconfiguring networks to release capacity from feeders that are close to operational limits.
- Smart solutions and approaches to release capacity, for instance low-voltage monitoring for better informed design and operation, dynamic variable ratings to factor in seasonality and electronic control of power flows.
These have the potential of decreasing or delaying the need for reinforcement but will not entirely negate this need.
Overall, it is difficult to quantify whether the benefits outweigh the impacts on the grid and on consumer bills, but steps can be taken to reduce the potential impacts and enable greater benefits to be realised. Examples include investing in on-site battery storage and continued deployment of network flexibility and innovation solutions.
Recommendations
- Network interventions are triggered because Distribution Network Operators are required to use a conservative assumption that less generation will be consumed onsite with more exported to the network. This could be an area to explore.
- Incentivising the requirement to have domestic and non-domestic battery storage in conjunction with solar PV to absorb any excess solar, thus preventing exports, may reduce the scale of network interventions needed. Battery storage can provide greater network flexibility by charging and discharging as required.
- A co-ordinated approach is needed between key stakeholders including the Distribution Network Operators, transmission operators, local authorities and the solar industry to ensure that a significant increase in solar PV can be accommodated. Improved evidence of large quantities of solar being proposed is needed to allow the network operators to plan accordingly and justify their decisions to Ofgem.
Glossary of terms
|
AC |
Alternating current |
|
ANM |
Active network management |
|
BSPs |
Bulk supply points |
|
DC |
Direct current |
|
DFES |
Distribution future energy scenarios |
|
FIT |
Feed in Tariff |
|
DGCG |
The distributed generation connection guides |
|
DNOs |
Distribution network operators |
|
DUoS |
Distribution Use of System |
|
EHV |
Extra high voltage |
|
EREC |
Engineering recommendation |
|
EV |
Electric vehicle |
|
GSPs |
Grid supply points |
|
GW |
Giga watt |
|
GB |
Great Britain |
|
G98 |
Distributed Generation Connection Guides: G98 |
|
G99 |
Distributed Generation Connection Guides: G99 |
|
HV |
High voltage |
|
kW |
kilo Watt |
|
LCTs |
Low-carbon technologies |
|
LV |
Low voltage |
|
MW |
Mega watt |
|
Ofgem |
Office of Gas and Electricity Markets |
|
PS |
Primary substation |
|
PV |
Photovoltaic |
|
RIIO-ED2 |
RIIO’ stands for ‘Revenue = Innovation + Incentives + Outputs’ and ‘ED’ stands for Electricity Distribution |
|
SEG |
Smart export guarantee |
|
SPEN |
Scottish Power Electricity Network |
|
SPT |
Scottish Power Transmission |
|
SS |
Secondary substation |
|
SSEN |
Scottish & Southern Electricity Networks |
|
SSET |
Scottish & Southern Electricity Transmission |
|
T&D |
Transmission and distribution |
|
TOs |
Transmission operators |
|
UoS |
Use of System |
Introduction
Background
Scotland has made significant progress in decarbonising its energy sector through the growth of renewable electricity generation technology. The Scottish Government has a statutory target legislated in the Climate Change (Scotland) Act 2019 to reach net zero emissions by 2045. This will require further decarbonisation across the entire energy sector in Scotland. The draft Energy Strategy and Just Transition Plan and the Climate Change Monitoring report set out targets for the transformation of Scotland’s energy sector from 2030 and beyond. There is an ambition to deliver at least 20 GW of additional low-cost renewable capacity by 2030, and for at least the equivalent of 50% of Scotland’s energy across heat, transport, and electricity demand to come from renewable sources.
Over recent years, domestic, non-domestic and commercial buildings have been encouraged to become more energy efficient and reduce electricity consumption from the grid. As well as the use of energy efficiency measures, there has been an increase in the adoption of low carbon technologies (LCT), such as rooftop solar PV. Schemes such as Feed in Tariff (FIT) and Smart Export Guarantee (SEG) have further contributed to the rise in solar PV installations. The SEG scheme provides a payment to renewable energy generators for every kilowatt-hour (kWh) of energy that is exported to the grid via a p/kWh tariff agreement.
The Scottish Government recently consulted on the potential for a solar ambition. The solar industry has been calling for a 4-6 GW solar photovoltaic (PV) ambition by 2030, which would align Scotland with the UK Governments target for solar [1]. This can be broken down into the following:
- 1.5 GW domestic rooftop solar
- 1 GW commercial rooftop solar
- Remaining capacity made up of large-scale grounded mounted solar
This level of solar ambition will require additional electricity network capacity, with cost implications in the form of necessary distribution and transmission network interventions. The distribution network costs will, in part, be passed onto electricity consumers across Scotland while transmission costs are levied on consumers at GB level. If distribution network intervention costs are higher in specific network regions, then consumers who sit in this region will pay more towards distribution costs through their energy bills than those in other network regions.
Aims and approach
This report focuses on 2.5 GW of rooftop solar PV installations, spread across domestic and non-domestic premises, and provides an assessment into the impacts on the electricity network and the resulting costs and benefits of greater solar PV deployment in Scotland.
The level of investment needed to accommodate the additional solar installations and potential impact on consumers energy bills is estimated using credible assumptions but is not definitive. The assessment also considers wider costs to the transmission network. Our work was informed through desktop research, stakeholder engagement and analysis using data obtained from DNOs and reports in the public domain.
Electricity network overview
The electrical infrastructure in Scotland is made of two key parts: the transmission network and the distribution network. The transmission network includes the 400 kV, 275 kV and 132 kV network and operated by Transmission Owners (TOs), and the distribution network which includes lower voltage networks and is operated by the Distribution Network Operators (DNOs).
The transmission and distribution networks in Scotland are operated by the following organisations (see Figure 1):
- Scottish Power Energy Networks (SPEN), made up of 2 key parts:
- Scottish Power (SP) Distribution are the DNO of the distribution network in Central & Southern Scotland
- SP Transmission are the TO for Central & Southern Scotland
- Scottish & Southern Electricity Networks (SSEN), made up of 2 key parts:
- SSEN Distribution, who are the DNO for the North of Scotland
- SSEN Transmission are the TO for the North of Scotland
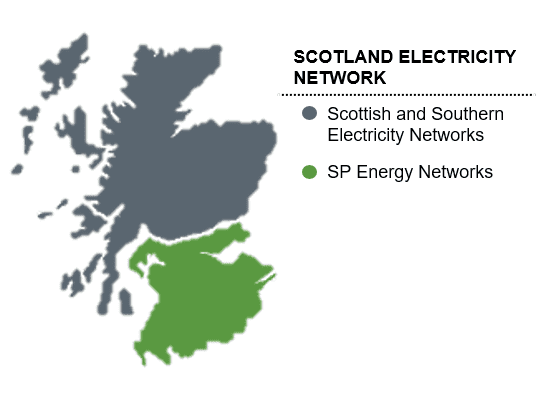
Figure 1 Electricity network operator map for Scotland
At the distribution level, there are four types of electrical substations used to distribute electrical power from the transmission network to consumers:
- Grid Supply Points (GSPs): Provide the connection between the transmission system and the distribution network. GSPs step the voltage down from the transmission network voltage of either 400 kV, 275 kV or 132 kV to the highest distribution network voltage known as the sub-transmission network or EHV network.
- Bulk Supply Points (BSPs): Step the incoming 132 kV voltage down to 33 kV, which is then distributed to different primary substations in the region. Some very large industrial and commercial loads may be directly fed at this level.
- Primary Substations: Take the incoming 33 kV feeder and steps the voltage down to 11 kV which directly supplies some larger commercial loads, as well as the secondary substations.
- Secondary Substations: Take the incoming 11 kV feeder and steps the voltage down to Low Voltage (LV), which will typically supply residential areas.
Solar PV connection types
All solar PV installations (and other generation types) connecting to the distribution network must comply with the Distribution Code and either Engineering Recommendation (EREC) G98 or G99 as applicable [2] [3]. The Distributed Generation Connection Guides (DGCG) outline the steps to be carried out to obtain a connection agreement and gain approval to connect solar PV assets to the network [4].
The DGCG considers both EREC G98 and EREC G99:
- G98 for small-scale installations: This is applicable for small-scale installations with a total capacity of no more than 16 amps per phase connected at low voltage (230 V). This equates to a maximum peak power of 3.68 kW single phase or 11.04 kW three-phase. An example of a G98 application is domestic rooftop solar PV.
- G99 for large-scale installations: This is applicable for installations with a total installed capacity greater than 16 amps per phase connected at either low voltage (Type A only) or high voltage levels. G99 includes four types:
- Type A: From 0.8 MW to < 1 MW
- Type B: From 1 MW to < 10 MW
- Type C: From 10 MW to < 50 MW
- Type D: greater than or equal to 50 MW
Depending on available roof space, a commercial rooftop solar installation may fall into the G99 Type A category. Larger G99 types are likely to be ground-mounted.
Project findings
Potential opportunities for distribution networks from increased solar PV deployment
Distribution network equipment has traditionally been sized to supply the peak load, which is the maximum demand that an area is expected to draw from the wider electricity network. This is to ensure that consumers do not pay for network infrastructure that is not used, known as stranded assets. The electrification of heat and transport through the introduction of heat pumps and electric vehicle charging points will add to the peak demand, potentially resulting in greater network constraints and triggering necessary interventions as a result. There are new ways to manage the impacts, including using the techniques described in Section 4.3.3. The rise of embedded connected generation will offer new opportunities to the distribution network when it comes to managing the future growth of demand.
Benefits include the following:
- Reduction in electricity infrastructure: Connecting distributed generation close to the point of use (e.g., rooftop solar PV behind the meter) could result in a reduced need for distribution infrastructure as the demand is being offset by generation. Increased distributed generation can reduce the average load on network assets and can defer the immediate need for asset replacement and when replacement is required. For example, charging of EVs could be timed to match the generation profile of the solar, reducing the need to supply power from elsewhere in the grid. However, the scale of 2.5 GW of additional solar will need to be investigated further to understand this opportunity in more detail.
- Reduced line losses: Generation can supply loads within the distribution network, reducing the distance between where supply and demand are located, which reduces energy losses.
- Supporting demand in other areas: Generators can sell excess power that cannot be consumed locally to the network to support other demand users. This can have the benefit of reducing network demand during periods of high demand, thus enabling more capacity to be made available for supporting more connections in wider network.
Leveraging these benefits requires active support for flexibility technologies and accounting for these benefits in network design.
Due to its inherent nature, solar PV generates in a finite window which is not generally at times of peak demand. This makes solar less directly beneficial than other renewable energy technologies that have some part of their energy generation window overlapping with the peak demand window. Engagement with DNO stakeholders resulted in the following conclusions on solar opportunities to the network:
- A greater deployment of solar PV in the future will provide only small opportunities to reduce peak demand on the wider network. This is because solar generation is greatest in the summer on sunny days, and the demand peaks in the winter evenings when solar generation is usually at its lowest.
- Domestic consumers who deploy rooftop solar PV are unlikely to present opportunities to the network as it is unlikely that generation will coincide with peak domestic demand.
- There may be greater opportunities to the network from commercial consumers whose demand will peak during the day with a greater chance of matching the peak in solar PV generation. This would especially be the case for commercial buildings with flexible demand, or who provide EV charging points to their employees.
However, it is the view of the stakeholders that co-locating domestic and commercial scale battery storage within the premise along with solar PV can provide greater economic opportunities. It will enable greater benefits to the distribution network to be realised as it will allow consumers to offset their peak demand and extend the duration during which electricity stored from solar PV can meet their own energy requirements [5]. This could provide a valuable flexibility service to the network and delay the need for expensive network upgrades, which can reduce network costs and consumers’ energy bills. Overall, battery storage should be encouraged alongside solar to enable greater opportunities for both the network and technology to be realised going forward.
Potential benefits to consumers from increased solar PV deployment in Scotland
Connecting solar consumers
For an individual connecting solar consumer, the main benefits of installing solar PV include a reduction in electricity costs and direct access to zero carbon renewable electricity.
The Carbon Trust publishes information online to advise businesses on the potential of renewable energy and to assess whether using renewable technologies is a viable option for a business [6]. According to the Carbon Trust, typical small-scale installations are around 15 to 25 square metres, with a 3 kW system comprising of around 15 panels taking up an area of 20 square meters and can generate roughly 2,500 kWh per annum [7]. Maintenance costs are low and estimated payback time varies significantly and will depend on the circumstances of each site. Some domestic installations report a payback period of just 4 years, reduced from previous years due to higher electricity prices in the UK [8].
The potential benefit to individual connecting solar consumers will be on a case-by-case basis and depends on how much solar can be generated and the times of day the consumer is at home to maximise the benefits. For example, an average assumption for domestic solar panels is that 30% of generation is consumed at home and 70% is exported when the owners are out at work from 9-5pm [9]. If the consumer is at home during the day, then self-consumption will increase, while a commercial building is likely to use over 80% onsite. In summer, this offset might be significant, though this will be lower in winter when generation will be lower, and demand is often higher. Installing solar PV can bring financial incentives where a payment can be received from a supplier for a proportion of solar that is sold directly to the grid through securing Smart Export Guarantees [10].
Stakeholders agreed that installing energy storage alongside solar PV can be used to extend the duration when power from solar can offset consumer demand, enabling further reduction in energy bills. Using energy storage can provide benefits by storing the excess solar energy that cannot be consumed at the time of generation, which reduces the level of exports onto the distribution network. This could help to reduce the need for network interventions if the design methods adopted by the DNOs allow for this.
All consumers across Scotland
The scale of solar PV installations in a 2.5 GW ambition will trigger network interventions because the DNOs are required to make conservative assumptions that less generation will be consumed onsite with more exported onto the network. This will have an impact on all consumers electricity bills in Scotland (not only those consumers with solar PV); however, consumers with solar installations will be less impacted compared to consumers without solar installations. Adopting flexibility measures such as domestic and commercial scale battery storage to absorb and reduce the excess solar generation exporting onto the grid will reduce network interventions, and thus reduce overall consumer costs. This should be encouraged alongside the installation of solar PV to maximise the potential of the technology and extend the duration at which demand can be met by on-site generation.
Potential for distribution connected solar PV deployment in Scotland’s energy network
DNO forecasts of rooftop solar PV connections
The decarbonisation of a wide range of economic sectors, including the electrification of transport and heating, is expected to result in high adoption of low-carbon technologies (such as heat pumps and EV chargers) on the electricity distribution grid. As a result, greater network capacity will be required to facilitate supplying these additional loads, and the network load profiles will become less predictable. This could raise new operational and management challenges to the DNOs. In order to plan in advance of future network pinch points, the DNOs carry out studies to identify where network intervention is required between now and 2050 to enable informed investment priority decisions to be made.
As part of their licence, DNOs are responsible for facilitating and creating the network infrastructure to meet electricity demand. To accomplish this, the DNOs forecast and understand consumers changing electricity needs under varying levels of consumer ambition, government policy support, economic growth, and technological development. The DNOs present these results in form of their DFES data, which provide a breakdown of different demand and generation technologies across each scenario up to 2050 and is updated every year after the DNOs have revised their modelling data. Both SP Distribution [11] and SSEN Distributions latest DFES data was assessed as part of this project. SSEN Distribution DFES results is not published in the public domain, this information was obtained directly.
Using the latest DFES data on Scotland’s energy network, the Figure 2 shows both SP Distribution and SSEN Distributions forecasts of new small-scale solar installation until 2030 using 2020 as the baseline.
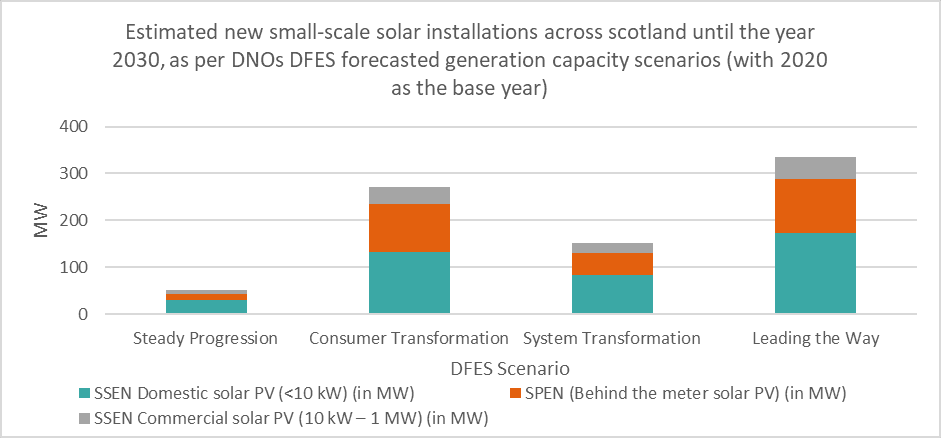
Figure 2: Estimated new solar rooftop installations across Scotland in 2030 (2020 base year) Source: DFES forecasted generation capacity scenarios
Figure 2 shows that projected small-scale solar PV uptake in 2030 is significantly less than the 2.5 GW number suggested by the solar industry. Even the scenario with the highest projected numbers (Leading the Way) forecasts only 13% (c.325 MW) of the 2.5 GW solar industry ambition. This indicates that the evidence collected by DNOs from stakeholder meetings with Local Authorities (LA) and generation developers is for a lower level of solar deployment.
Accommodating a significant number of small-scale solar installations
From our engagement with DNO stakeholders, we understand that individual small-scale (G98) applications are of less concern due to their small export capacity; however, a large cluster within a specific network area will pose greater network challenges. The impact will be location dependent as network topology and capacity will vary. In some cases, depending on the makeup of the LV feeder, the cross-sectional area of the cable, the number of consumers supplied on that feeder and the size of the houses, there may be no problems connecting a significant amount of PV in an area. However, in other cases, network reinforcement may be required with the addition of even a modest amount of PV generation.
DNO stakeholders informed us that major network interventions needed to accommodate a significant amount of G98 applications are designed based on ‘worst case’ principles, where minimum consumer demand and maximum generation output are witnessed on the DNOs network. This approach has been used by DNOs over many years to establish if the network can still operate safely and reliably when there is an excess of generation exports due to low consumer site demand.
Network impact assessments allow the DNO to understand the impacts as a result of accommodating more generation connections. Areas of investigation for the DNOs include:
- Thermal overload
- Voltage rises
- Increased harmonic and fault level contributions
If EREC standards of compliance are not meet through utilisation of the existing network, network interventions are required, and the scale of the work needed is proportional to the resulting network impact.
Larger rooftop solar PV installations (G99 connections) require approval from the DNO before connection is granted. In contrast, G98 connections are ‘fit and inform’, where the connection can proceed without DNO approval. The connections are managed by the DNOs on a first come first serve basis by placing G99 applicants into a managed queue. A network impact assessment is carried out and any reinforcement costs incurred by the DNO are included in the final connection offer. The timescales for accommodating G99 solar PV connections (mainly commercial buildings) depends on the scale of the upgrades needed; however, DNOs are licenced by Ofgem and are obligated to make a final connection offer within the set timescales.
Innovative methods of accommodating new connections
Historically, the connection agreements for generators and load connected at low voltage allowed import or export of the full rated power with no restriction to time or duration. Connections and the network had to be reinforced to allow this. This would involve replacing cables, overhead wires, transformers, and switchgears. Broadly speaking, the more reinforcement works needed at high voltage levels results in greater the reinforcement costs.
However, in recent years DNOs have introduced new methods that enable smarter use of the network equipment and reduce the amount of traditional reinforcement that is needed to accommodate the significant uptake of generation.
The type of interventions used by DNOs include:
- Network flexibility though flexible connection agreements: Flexible connection agreements allow the DNO to manage the load and generation connected to the network to some extent, providing a lever to alleviate overload on equipment or voltage issues. Examples include requiring the generation or load to operate differently if there is an outage of equipment on the network, at certain times during the year, or in response to signals from the DNO. This means that less reinforcement is needed to connect the new load or generation, potentially reducing the cost and time to connection. This does mean though that some developments would not be able to export power at certain times if they signed up to flexible connection agreement.
- Network reconfiguration: This involves using remote controlled switches (mostly manual switching is done at LV level) to reconfigure the network and shift generation output from network equipment that is heavily loaded to another area of the network that is lightly loaded. This helps to release capacity on the network, reduce network constraints and avoid network upgrade investment.
- Other innovative solutions: Both SP Distribution and SSEN Distribution are actively deploying new smart network management tools to manage the network more efficiently to allow a transition away from traditional ways of operating. For example, collection of network data to make more informed decisions on network operation or control systems to manage the network better during peak operation periods which will help reduce network constraints and maintain voltage tolerance limits.
It is important to note that innovative solutions will not alleviate all traditional reinforcement requirements. If the options above fail to provide the necessary network capacity needed to accommodate more generation then infrastructure will need to be upgraded.
Connecting a significant volume of rooftop solar generation
A significant rise in solar PV connections could be accommodated in an efficient manner if the DNOs and policymakers work in collaboration to understand the policy signals, increase data transparency, understand the role different parties need to play and investment required to make this happen in a timely manner.
In order to maintain a smooth transition to greater solar PV uptake, improved intelligence is needed, particularly at LA level, to understand where solar PV is likely to be located. More local information could provide more accurate data to update DNO modelling tools. This will give the DNOs a better picture of where networks will likely require intervention and inform their investment priority decisions ahead of time. This will also provide evidence to justify DNO decisions to Ofgem.
DNOs have an obligation to provide an option to connect, but the timescales for making connections will vary depending on how much network intervention is needed. The cost of providing such interventions is, in part (depending on the particular situation) borne by the developer seeking the ability to export. The scale of investment needed in specific locations could affect connection timescales.
Innovative approaches should continue to be used where possible to reduce the cost and time to connect. This will minimise the barriers to develop new renewable generation projects while maintaining a secure and reliable power supply. Innovative approaches are also a more efficient and cost-effective approach to asset management.
Impacts of increased solar PV deployment on electricity networks
Potential network challenges of increased rooftop PV
The changing nature of the electricity distribution network as a result of dynamic power flows and increased unpredictability in load profile behaviour requires a transition away from traditional ways of operating. For example, electricity networks in Scotland are traditionally managed to meet the maximum demand throughout the day and year by sizing assets accordingly. However, the rise of generation at distribution level creates new challenges, such as demand reduction, increased thermal constraints, reverse power flows, greater voltage constraints, greater fault level contributions and harmonic contributions. These are detailed in Section 7.1.
The impacts depend greatly on the size, design and local network condition of each individual connection. Additional PV generation would also be connected within the context of other LCTs such as heat pumps, batteries, electric vehicles, wind and larger solar generation. It is difficult to predict the specific challenges and impacts which will be experienced with accuracy.
DNO stakeholders informed us that they are most concerned about voltage rises which must be maintained within the correct limits. This will be a big challenge in summer when there is excess generation flowing in the opposite direction onto the network, which increases network voltages. The exact scale is unknown and even a small deviation from voltage limits can damage network infrastructure and appliances because all electrical equipment is designed to handle voltages within specified tolerances.
Estimated scale of network impact
We conducted an analysis to determine how many primary substations are likely to require intervention in 2030 as a result of greater solar PV deployment in Scotland. The analysis used 1.5 GW domestic rooftop solar and 1 GW commercial rooftop solar by 2030, information provided by the DNOs and data from the DNOs DFES. The DFES provides generation forecasts up to 2050, including the distribution of that forecast across primary transformers. It was assumed that the additional solar generation was spread across the network in accordance with the forecasted distribution pattern. The uplifted generation forecast numbers for rooftop solar PV were then used to understand where substations were likely to be overloaded and may require interventions in 2030 by using the DNO headroom report on capacity availability [12] [13]. The methodology behind the analysis is discussed further in the Appendix Section 7.2.
The projected percentage of primary substations that may require intervention in 2030 due to the 2.5 GW solar rooftop are shown in Table 1.
Table 1: Primary substations that may require interventions by network area (Source: DFES data)
|
Scottish Power Energy Networks |
Scottish & Southern Electricity Networks |
Total | |
|
Number of substations that may require intervention in 2030 due to greater rooftop solar PV deployment |
176 |
33 |
209 |
|
Total number of primary substations (down to 11 kV level) |
385 |
384 |
769 |
|
% of primary substations that may require intervention |
46% |
9% |
27% |
We found that 46% of total primary substation equipment in SP Distribution and approximately 9% of total primary substation in SSEN Distribution could be overloaded as a result of increased solar PV generation. This represents 176 primaries out of 385 in SP Distribution’s area and 33 out of 384 in SSEN Distributions area. The analysis can be broken down further into low, medium and highly constrained sites:
Table 2: Extent of site constraints for overloaded sites
|
Lightly constrained (less than 10% overloaded) |
98% of sites |
|
Moderately constrained (10-20% overloaded) |
approximately 1% of sites |
|
Highly constrained (more than 20% overloaded) |
approximately 1% of sites |
The majority of these network interventions are projected to take place in SPENs distribution network area, which is likely to be linked to the fact that it is located in busier urban areas, whereas SSEN Distribution area is more rural.
We carried out a high-level analysis to estimate the cost of interventions for upgrading distribution network infrastructure to accommodate the 2.5GW solar rooftop in 2030. The estimated cost of reinforcement provided by DNOs for selected study areas was scaled up to estimate the reinforcement cost for the entire network.
The methodology used to estimate this cost is described in Section 7.3.
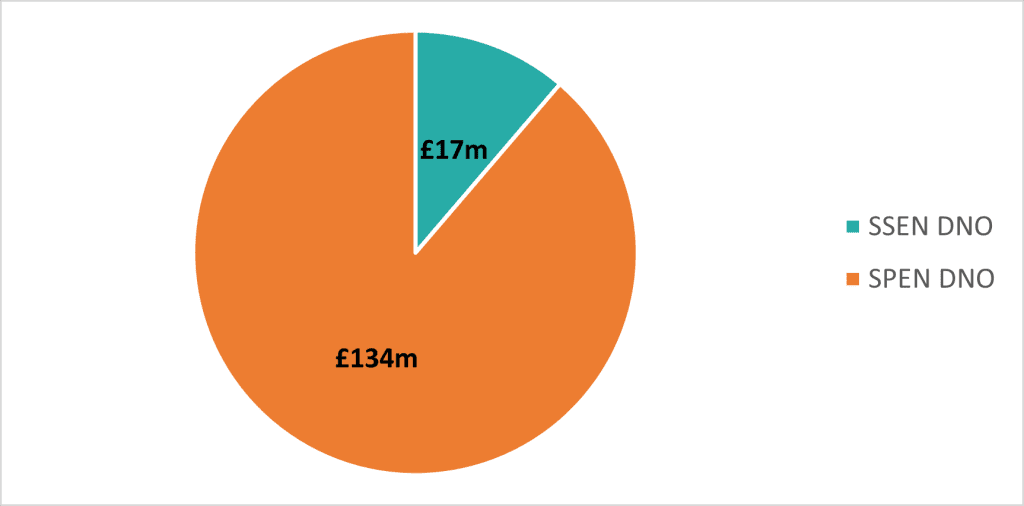
Figure 3: Estimated cost of interventions in 2030 in both SPEN and SSENs distribution boundaries (£ millions)
It can be seen that the cost of intervention is higher in the SP Distribution area (£134m compared to £17m in SSEN Distribution area). This can be attributed to a greater number of interventions being forecast as required in the SP Distribution area.
Impacts on consumers’ bills and potential mitigations
Rules for connection charges and Use of System charges
The DNOs are licenced by the energy regulator, Ofgem, who sets rules regarding the amount of revenue DNOs can recover from consumers, this includes connection charges.
Connection charges for rooftop solar covers the cost of replacing or upgrading equipment to facilitate new generation connections. The DNO determines the extent of network reinforcement required, and the subsequent cost, by studying the impact of the additional generation on the network.
G98 connections, which are likely to include all domestic-scale and smaller commercial rooftops, do not incur connection charge. Larger generation installations under G99 may trigger an upfront connection charge depending on the capacity of the local network. Multiple generation installations in close proximity installed by the same party, for example a housing association fitting solar panels across many properties in one area, may also result in a connection charge.
For all cases, additional costs not covered by the connection charge are recovered through Use of System (UoS) charges. UoS charges are charged to all consumers through their electricity bills. The DNOs are required to calculate these UoS charges annually utilising the Common Distribution Charging Methodology (CDCM) [14]. Each DNO is required to publish their statement of charges in advance of application [15]. These statements provide detail of how the charges are determined for demand or generation customers, and these are further split by domestic and non-domestic categories. The charging statements also contain worked examples of how any reinforcement costs are calculated.
There are a number of steps used to calculate the Distribution Use of System (DUoS) charges which will be impacted by increased solar PV installation. For example, for each category of demand users the DNO estimates the following load characteristics:
- A load factor, defined as the average load of a user group over the year, relative to the maximum load level of that user group; and
- A coincidence factor, defined as the expectation value of the load of a user group at the time of system simultaneous maximum load, relative to the maximum load level of that user group.
In determining the load characteristics of each category of demand user, the DNO will analyse meter and profiling data for the most recent 3 year period for use in the calculation of charges. Load factors and coincidence factors are calculated individually for each of the 3 years and a simple arithmetic average is then used in tariff setting. Large scale PV deployment would impact these calculations but without detailed data it is not possible to accurately determine what the resultant potential impact might be.
The DNO determines a set of different distribution time bands, based on the underlying demand profiles and associated costs – these could be expected to change given large scale PV deployment in some areas. These time bands can only be revised annually on 1 April. It is likely that the large-scale rollout of solar PV for domestic customers will reduce their consumption during daylight hours (co-incident with system peak times) thus leading to a lower DUoS cost over those periods.
The DNO also forecasts the volume chargeable to each tariff component under each tariff for the charging year, which are separately determined for the Domestic Aggregated and Non-Domestic Aggregated tariffs. These volumes would be impacted by PV deployment relating to the two different categories, thus impacting the relevant tariffs differently.
The Significant Code review undertaken by Ofgem “Network Access and Forward-Looking Charges” [16] came into effect from 1 April 2023. This resulted in a reduction in the contribution to network reinforcement made by G99 connections. This improves the business model for many generators, who would otherwise have had to pay larger upfront costs. A summary of the previous and new rules for connection charging is provided below with some key terms.
- Onsite works: This is works needed onsite to accommodate the installation and includes facilitating a connection to the distribution network.
- Reinforcement works: This involves replacing equipment on the existing network to accommodate new connections. This usually involves replacing cables, transformers and switchgears etc.
- Connecting solar consumers: This refers to domestic and commercial entities who have rooftop solar installations. A G98 installation is typically relevant to connecting consumers who are domestic, while G99 is more relevant to connecting consumers who are commercial entities.
Table 3: The new Ofgem Significant Code Review rules for recovering network upgrade costs from generation connections that trigger the need for reinforcement (Source: Ofgem [16])
|
Onsite works |
Reinforcement at connection voltage |
Reinforcement at one voltage level above the connection voltage | |
|
G98 single installation Likely to include all domestic and smaller commercial properties |
Unlikely to be needed, as the property should already be connected to the grid |
Fully funded by the DNO via UoS charges |
Fully funded by the DNO via UoS charges |
|
Multiple G98 or G99 installations |
Connecting solar consumers pay 100%. Bigger installation would likely trigger the needed more bigger fuses onsite. |
Connecting solar consumers pay a proportion of the reinforcement costs (likely to be a small fee or nothing) |
Old arrangement Connecting solar consumer pays a proportion of the reinforcement costs |
|
New arrangement Fully funded by the DNO via UoS charges, up to a High Cost Cap |
Potential impact on consumer bills
Large-scale solar PV adoption will impact the DUoS calculations for consumers. In order to assess the cost impact of the large scale roll out of rooftop solar on all consumer bills (not only consumers with solar installations) we assumed that all network interventions required to accommodate 2.5 GW of solar would be socialised. This is a simplified assumption that provides an estimate of the maximum impact UoS charges has as a result of the modelled interventions. A more accurate assessment would require more data regarding locations of commercial and domestic properties and the scale of solar to be adopted at the premises. This is because larger commercial buildings adopting solar PV will likely make a direct contribution to network intervention costs, thus reducing the UoS spread across all remaining consumers.
According to Scottish Government energy data, non-domestic consumers account for 60% of Scotland’s total electricity consumption. As a result, non-domestic consumers will pay more towards DUoS directly due to their higher energy consumption [17]. We applied a non-domestic to domestic electricity consumption ratio of 60:40 in both DNO licence areas in Scotland. This allocated 60% of the intervention costs in each DNO area to non-domestic, with the remaining 40% of the costs going to domestic consumers.
We then spread the costs using the ratio of number of non-domestic to domestic premises to obtain an indication of the increase in non-domestic and domestic energy bills which could be realised following large-scale solar deployment. SSEN provided this split, where out of total consumers in their licenced area that have electricity meters, 90% are non-domestic premises while 10% are domestic. The Department of Energy Security and Net Zero (DESNZ) has published information on GB electricity meters, and a similar ratio was observed [18]. SPEN did not provide the split in their region, so we have assumed the same ratio will apply.
Table 4 shows the annual impact of socialising the reinforcement investment required at distribution level to accommodate 2.5 GW rooftop solar. Costs per consumer bill split between domestic and non-domestic consumers in Scotland irrespective if they have solar or not have been estimated. Section 7.4 explains the methodology used to calculate this estimate.
Table 4: Annual impact of socialising the reinforcement cost at distribution level on consumers in Scotland (£/year/customer bill)
|
DNO |
Estimated annual impact per domestic customer bill (£) for reinforcement costs in 2030 |
Estimated annual impact per non-domestic customer bill (£) for reinforcement costs in 2030 |
|
SSEN |
£0.53 per year for 45 years |
£7.17 per year for 45 years |
|
SPEN |
£1.81 per year for 45 years |
£24.46 per year for 45 years |
Non-domestic consumers will pay a bigger contribution towards reinforcements triggered by solar PV uptake due to their higher energy consumptions, while domestic consumers pay less towards DUoS. These costs are based on assumptions applied due to lack of available data during the research and should therefore be treated as indicators of what the additional costs over and above baseline energy bills could be but they are not definitive.
The DNOs did not validate or confirm the methodology we used to derive these numbers. These provide a highest cost estimate due to the assumption that all Scottish consumers will pay 100% of reinforcement costs through their electricity bills. However, it is likely that some commercial solar connecting consumers will pay a proportion of the reinforcement costs they triggered upfront directly. This would reduce the impact on all consumer bills but is unlikely to have a large impact. It was not possible to separate the reinforcement cost triggered by commercial consumers due to data limitations.
Potential impacts on the transmission network
A proposed ambition 2.5 GW of small-scale rooftop solar PV by 2030 is likely to trigger the need for network reinforcement across the transmission network in Scotland and the rest of GB. The exact nature and scale of the upgrades required is difficult to predict as there is uncertainty as to where the clusters of solar will be located and the nature of impacts are locationally dependent. Different areas of the transmission network have varying levels of headroom and different amounts of generation could be accepted before voltage and fault levels are triggered.
The nature of transmission network impacts and the intervention design works needed to accommodate future connections (including solar PV and other generation technologies) are determined from the Security and Quality of Supply Standard (SQSS) [19]. This sets the criteria for electricity transmission network planning.
- Network Assessment Approach: The TOs take a deterministic snapshot methodology approach to reduce the risk of transmission assets being overloaded and generators being constrained on their respective networks. In this deterministic methodology, the TOs study the summer minimum demand against the maximum generation output on a given local area network for the assessment of any new generation connecting.
- The results of network impact assessments: The TOs assess thermal, voltage and fault level constraints on the network and conclude if greater solar PV embedded in the distribution network could trigger non-compliance with grid code procedures if reverse power was realised.
The timelines to resolve transmission constraint issues can be significant and are longer than the timescales needed for distribution upgrades.
A high-level analysis was carried out to estimate the transmission network costs incurred by the TOs to upgrade the network. Figure 4 shows the estimated cost on the transmission network in Scotland is over £150 million with £122 million (81%) of this in the SPEN transmission network and £30 million (19%) in the SSEN transmission network.
Section 7.3 explains the methodology used to estimate these costs in more detail. In brief, the estimated cost of reinforcement provided by TOs for our selected study areas was scaled up to estimate the reinforcement cost for the entire network. SPEN transmission reinforcement costs were estimated using cost of reinforcement shared by SSEN transmission for the study area.
There will also be an incremental impact on the transmission network in England which will trigger additional transmission costs due to greater transmission capacity required to accommodate greater solar exports. These have not been considered in this study and the numbers provided below are for transmission assets that are located only in Scotland.
Figure 4: Estimated cost of interventions in 2030 in both SP and SSENs transmission boundaries (£ millions)
The investments made by the TO will be recovered through the price control mechanism with the cost being socialised across all GB energy consumers. Our estimated costs are provided to give insight into the scale of the challenge to reinforce the transmission network but are not definitive. Further, more detailed analysis would be required to reliably quantify the estimated costs associated with interventions in the transmission network.
Conclusions
We assessed the likely benefits and impacts of a proposed ambition for an additional 2.5 GW solar PV at distribution level in Scotland by 2030. In conclusion:
- An additional 2.5 GW solar ambition would enable progress towards net zero targets. The Scottish Government has set a target to reach net zero carbon emission by 2045 and increased rooftop solar could contribute to the ambition to deliver at least 20 GW of additional low-cost renewable capacity by 2030.
- Individual financial benefits are based on the reduction in electricity bills for consumers adopting solar PV. Benefits could be increased if demand could be shifted to times of excess generation.
- Network benefits could be realised by pairing solar PV with battery storage as this will improve flexibility. Solar PV is an intermittent energy source and unlikely to reduce peak demand significantly.
- DNOs would be obliged to make a firm or flexible connection offer to facilitate the extra solar PV in a cost-effective manner. Advance visibility of where large quantities or clusters of rooftop solar PV connections would be located would help DNOs understand the scale of intervention needed and in what timescale it can be delivered.
- We estimate that 30% of primary transformers will require intervention to accommodate a 2.5 GW solar ambition. Most of these will be lightly constrained sites that are less than 10% overloaded. The impact is highly uncertain and depends on specific location of large quantities of solar PV and the status of the local electricity network.
- The cost of this impact is uncertain; we estimate £150m in the distribution networks, and over £150m in transmission networks. These are based on highest-cost assumptions that traditional methods are used for capacity release eg that overloaded equipment is replaced with higher rated equipment.
- The required intervention will be largely paid for by consumers. The network intervention costs associated with implementing the additional rooftop PV will be socialised to all consumers through electricity bills. A proportion of larger installations may be payable through connection charges by the connecting consumer.
- The estimated average annual increase in energy bills for domestic consumers is £0.53 and £1.81 in SSEN and SPEN areas respectively. The average annual increase in non-domestic consumers energy bills is estimated at £7.17 in SSENs area and £24.46 in SPENs area. These are indicators based on assumptions but are not definitive, and the approach has not been validated or confirmed by the DNOs.
- Adopting flexibility measures such as domestic and commercial scale battery storage will reduce the excess solar generation exporting onto the grid. This will reduce network interventions and thus reduce consumer costs. This should be encouraged alongside the installation of solar PV to maximise the potential of the technology and extend the duration at which demand can be met by on-site generation.
- Network interventions are triggered in part because DNOs are required to use the conservative assumption that less generation will be consumed onsite with more exported onto the network.
- Incentivising the requirement to have domestic and non-domestic battery storage in conjunction with solar PV to absorb any excess solar, thus preventing exports, may reduce the scale of network interventions needed. Battery storage can provide greater network flexibility by charging and discharging as required.
- Network operators are developing innovative ways of managing networks which could reduce the costs. Solutions including flexibility, reconfiguring the network, improved network visibility and active network approaches are increasingly being used. These approaches could also speed up the time taken to offer new connections. While these approaches could decrease the need for reinforcement, they are unlikely to entirely mitigate the need to be consistent with relevant technical requirements.
- A co-ordinated approach is needed between key stakeholders including the DNOs, TOs, LAs and the solar industry to ensure that a significant increase in solar PV can be accommodated. Improved evidence of large quantities of solar being proposed is needed to allow the DNOs to plan accordingly and justify their decisions to Ofgem.
- Overall, it is difficult to quantity whether the benefits outweigh the impacts on the grid and on consumer bills, but steps can be taken to reduce the impact and enable greater benefits to be realised. Examples include investing in on-site battery storage and continued deployment of network flexibility and innovation solutions.
References
|
[1] |
Solar Energy UK, “‘Significant appetite’ for more solar power, says Scotland’s new energy plan,” January 2023. [Online]. Available: https://solarenergyuk.org/news/significant-appetite-for-more-solar-power-says-scotlands-new-energy-plan/. |
|
[2] |
Energy Network Association, “G98 Distributed Generation Connection Guide,” 2022. [Online]. Available: https://www.energynetworks.org/search-results?sitesearch=G98&id=113. |
|
[3] |
Energy Networks Association, “G99 Connecting Type,” [Online]. Available: https://www.energynetworks.org/search-results?sitesearch=G99&id=113. |
|
[4] |
Energy Networks Association, “The Distribution Code of Licensed Distribution Network Operators of Great Britain: DG Connection Guides,” 2021 Revision. [Online]. Available: https://dcode.org.uk/current-areas-of-work/dg-connection-guides.html. |
|
[5] |
E.On Energy, “Solar battery storage,” [Online]. Available: https://www.eonenergy.com/solar-battery-storage.html. |
|
[6] |
Carbon Trust, “Renewable energy guide,” Jan 2018. [Online]. Available: https://www.carbontrust.com/our-work-and-impact/guides-reports-and-tools/renewable-energy-guide. |
|
[7] |
Carbon Trust, “Renewable Energy Sources,” [Online]. Available: https://ctprodstorageaccountp.blob.core.windows.net/prod-drupal-files/documents/resource/public/Renewable-energy-guide.pdf. |
|
[8] |
All Seasons Energy, “Solar panel payback period is now 4 years,” 31 August 2022. [Online]. Available: https://allseasonsenergy.co.uk/news-and-blogs/solar-panel-payback-period-4-years/. |
|
[9] |
Spirit Energy, “Solar PV Knowledge Bank: Solar PV Export Tariffs,” 2023. [Online]. Available: https://www.spiritenergy.co.uk/kb-solar-pv-export-tariff. |
|
[10] |
Ecosphere renewables, “Benefits of solar PV,” [Online]. Available: https://www.theecosphere.co.uk/our-services/solar-pv/benefits-of-solar-pv/. |
|
[11] |
Scottish Power Energy Networks, “Distribution Future Energy Scenarios,” 2022. [Online]. Available: https://www.spenergynetworks.co.uk/pages/distribution_future_energy_scenarios.aspx. |
|
[12] |
Scottish Power Energy Networks, “Network Development Plan,” 2022. [Online]. Available: https://www.spenergynetworks.co.uk/pages/network_development_plan.aspx. |
|
[13] |
Scottish and Southern Electricity Networks, “Network Capacity Information,” 2022. [Online]. Available: https://www.ssen.co.uk/our-services/network-capacity-information/. |
|
[14] |
DCUSA, “Section 16: Common Distribution Charging Methodology,” 2022. [Online]. Available: https://dcusa-viewer-staging.electralink.co.uk/dcusa-document/117/423464. |
|
[15] |
Scottish and Southern Electricity Networks, “Scottish Hydro Electric Power Distribution charging statements,” [Online]. Available: https://www.ssen.co.uk/about-ssen/library/charging-statements-and-information/scottish-hydro-electric-power-distribution/. |
|
[16] |
Ofgem, “Access and Forward-Looking Charges Significant Code Review: Decision and Direction,” 3 May 2022. [Online]. Available: https://www.ofgem.gov.uk/publications/access-and-forward-looking-charges-significant-code-review-decision-and-direction. |
|
[17] |
Scottish Government, “Energy Statistics for Scotland – Q3 2022,” December 2022. [Online]. Available: https://www.gov.scot/publications/energy-statistics-for-scotland-q3-2022/pages/energy-consumption/#:~:text=This%20document%20is%20part%20of%20a%20collection&text=Consumption%20of%20electricity%20between%202021,with%20decreased%20in%20both%20sectors.. |
|
[18] |
Department for Energy Security and Net Zero, “Smart Meter Statistics in Great Britain: Quarterly Report to end June 2023: data tables,” August 2023. [Online]. Available: https://www.gov.uk/government/statistics/smart-meters-in-great-britain-quarterly-update-june-2023. |
|
[19] |
National Grid ESO, “Security and Quality of Supply Standard (SQSS),” [Online]. Available: https://www.nationalgrideso.com/industry-information/codes/security-and-quality-supply-standard-sqss. |
|
[20] |
“Distribution Future Energy Scenarios 2022: Results and methodology report – North of Scotland licence area,” April 2023. [Online]. Available: https://www.ssen.co.uk/globalassets/about-us/dso/smart-and-local-benefits/ssen-dfes-2022-north-of-scotland-report.pdf. |
Appendices
Network challenges
Demand Reduction through the use of onsite generation will change the daily domestic and commercial load profiles and make them more unpredictable and more difficult to plan the network. Network operators strive to balance demand and generation in order to maintain grid stability and reliability. An increase in solar PV connections will lead to greater network challenges around grid stability. As distributed generation grows it will remove a significant portion of demand from the network during certain time periods, while higher up in the grid, greater numbers of renewable energy plants (offshore and onshore wind) will be connected leading to greater network imbalance. This will exacerbate the situation and pose additional challenges to grid operation. The National Grid may seek to reduce the imbalance by asking large-scale wind operators to reduce energy output or switch off which leads to constraint payments being made. The deployment of greater network demand through large-scale battery storage and hydrogen production is being actively encouraged to reduce the network imbalances.
Examples of network challenges are as follows:
Increased thermal constraints, where significant generated power is fed into the network, for example if there are clusters of PV generation in one area, and there is a mismatch between onsite solar generation and demand on a sunny day. This can overload equipment causing them to heat up beyond their rated temperatures, causing damage or aging. This will be common in summer where there is mismatch between solar generation and onsite demand.
Reverse power flows, where power is fed into the network from generation resulting in power flowing in the opposite direction than designed. Some substations with new equipment will be able to handle greater reverse power flows, however, older equipment or that with a particular design may have less or no reverse power capability and may require maintenance or replacement.
Greater voltage constraints, where voltage rises due to the reduction in load or the increase in generation across an area of network. All networks are designed to operate at voltages within acceptable tolerances and DNOs have a frequent task to maintain voltages within the correct limits. If voltages go outside their limits, this poses risk to asset health which could be damaged as a result. Greater solar connections runs the risk of exceeding voltage limits as laid out in the DNO licences. Voltage constraints are the biggest concern to the DNOs as they have the biggest impact.
Greater fault level contributions, where the solar PV installations contribute towards greater network fault currents, which are triggered due to disturbances on the network. Faults on the network can cause inrushes of current which can damage critical infrastructure. The network and its protection equipment must be designed to accommodate the fault level for a short time in order to keep equipment and people safe. PV generation contributes to fault level (large inrush of current when there is a fault on the network), and so connection designs must accommodate it. If the fault level rating of equipment is exceeded the DNO will replace the assets. As a result, a significant cluster of generation will increase fault level contributions right up to transmission level.
Harmonic contribution, where PV generation creates distortions in the Alternating Current (AC) signal resulting in a reduction in power quality being delivered to consumers and some consumer equipment might flicker or not operate properly. PV generation contributes to harmonic issues as a result of the inverter equipment, but this contribution is limited by regulation.
Methodology for estimating proportion of interventions needed
The DNOs forecast and understand consumers changing electricity needs under varying levels of consumer ambition, government policy support, economic growth, and technological development. The DNOs create forecasts for multiple scenarios through their DFES data (Leading the Way, Consumer Transformation, System Transformation, Steady Progression) [11] [20]. DFES data from both SPEN and SSEN using the Consumer Transformation Scenario was used in our analysis. This scenario assumes greater consumer engagement, which leads to greater deployment of low-carbon technologies, such as solar PV, to offset network demand. We consider that this assumption would be consistent with increased solar deployment.
Primary substations which are likely to require intervention in 2030 were determined by spreading the 2.5 GW of solar PV across all primary substation assets in Scotland. We used the DNOs modelling assumptions to determine where they believe the high clusters of future solar installations will be located and spread the extra the 2.5 GW using the same pattern of distribution. The detailed approach is described below:
- We used DNOs DFES modelling tools to determine how much rooftop solar PV is estimated between now and 2030 across all primary substation assets. This was clear from SPEN modelling, but SSEN did not provide a degree of granularity and we estimated as the solar PV numbers.
- The DNOs own estimates of rooftop solar PV were removed from the analysis to leave an indication into forecast individual large-scale solar PV (ground-mounted). This was to avoid including the 2.5 GW over and above the DNOs rooftop solar PV forecast as this would duplicate the number of households that has solar PV.
- We calculated the proportion of rooftop solar to total solar using DFES data. The DFES data only provided total rooftop solar numbers across each year rather than across each individual substation per year which reduces the level of granularity. However, the combined solar PV numbers (rooftop + ground mounted) was provided for each substation across every year. We expressed the total rooftop solar PV numbers to the combined solar PV numbers in 2030 as a percentage. This allowed us to estimate the proportion ratio of rooftop solar in 2030, which was then used to separate the rooftop component from the overall total solar PV numbers across all primary substation data. This provided an estimate of rooftop solar PV across each primary substation.
- 2.5 GW of solar capacity was then spread in a similar proportion to the original DNO forecast of rooftop solar across all primary substations to provide an uplifted forecast. For example, if the DNO was estimating that 2 MW of rooftop solar PV would be located in an area in Glasgow, we estimated that 15 MW would be realised in that area in 2030 using the following calculation:
- Uplifted forecast = (2MW / total forecasted rooftop solar PV in 2030 from DNOs modelling tools) * 2.5GW
- The proportion of primary substations that will require interventions was estimated by subtracting the uplifted forecast from the DNOs published headroom report figures.
Methodology for estimating cost of intervention
We used four study areas in order to assess the cost of interventions needed. The study areas covered four categories:
- Rural
- Domestic properties in urban areas
- Mixed domestic & commercial in urban areas
- Commercial properties in urban areas
A primary substation was selected for each study area that was close to being overloaded by using the DNOs published heat map data.
Table 5 Study areas used to assess cost of intervention
|
Rural |
Domestic properties in urban areas |
Mixed domestic & commercial in urban areas |
Commercial properties in urban areas | |
|
DNO |
SSEN Distribution |
SP Distribution |
SP Distribution |
SP Distribution |
|
Location |
Aberdeenshire |
Larbert, Falkirk |
Livingston |
Edinburgh |
|
Primary Substation |
FYVIE |
LARBERT |
DEANS |
KINGS BUILDINGS |
|
Primary S/S generation capacity |
Red (heavily constrained) |
Amber (approaching operational limits) |
Amber (approaching operational limits) |
Amber (approaching operational limits) |
|
GSP |
KINTORE |
Bonnybridge |
DRUMCROSS |
KAIMES |
|
GSP generation capacity |
Red (heavily constrained) |
Red (heavily constrained) |
Red (heavily constrained) |
Red (heavily constrained) |
|
Headroom after adding in 2.5 GW target (MW) |
-2.95 |
-4.74 |
-1.51 |
-3.50 |
|
Uplifted forecast (MW) |
4.51 |
5.47 |
1.73 |
4.03 |
The study areas were submitted to both the DNOs and TOs to gain high level estimates of the type of interventions deployed and the cost of interventions.
Due to time constraints, the DNOs and TOs could not commit to undertaking a detailed analysis, which involves undertaking detailed power flow analysis. The results provided are estimates of interventions from previous assessments carried out by the DNOs. The results of the DNOs and TOs analysis are detailed below.
Table 6 Cost of interventions and assumptions provided by the DNOs for each study area
|
Study area type |
DNO |
Cost of interventions |
Assumptions |
|
Rural |
SSEN Distribution |
£844k for replacing primary substation |
Replacing a 33/11 kV primary substation. The rules used to estimate costs in other parts of the network are for every £1 spent reinforcing the primary network, SSEN will spend:
|
|
Domestic Properties in Urban areas |
SP Distribution |
£0.5m – £1.25m |
This takes into account all reinforcement work from primary down to LV level. |
|
Mixed domestic & commercial properties in urban areas |
SP Distribution |
£0.1m – £0.25m |
This takes into account all reinforcement work from primary down to LV level. |
|
Commercial properties in urban areas |
SP Distribution |
£0.5m – £1.0m |
This takes into account all reinforcement work from primary down to LV level. |
The estimated cost of reinforcement provided by DNOs for the selected study areas was scaled up to estimate the reinforcement cost for the entire network. The headroom capacity numbers across all primary substations that may require intervention was used to scale up the costs.
The results of the investigation with the TOs are provided in Table 7.
Table 7 Cost of interventions and assumptions provided by TO for study area
|
Study area type |
TO |
Cost of interventions |
Assumptions |
|
Rural |
SSEN Transmission |
£5 to £6 million |
|
SPEN transmission reinforcement costs were estimated using the cost of reinforcement shared by SSEN transmission for the study area.
Methodology for estimating the impact on consumer bills
The steps below explain the methodology to estimate the impact of socialised costs on consumer bills split between domestic and non-domestic.
- Allocated 60% of the estimated interventions costs directly to non-domestic consumers with the remaining 40% going to domestic through the DUoS mechanism, which allocates socialised costs to the higher energy consumer. 60% of Scotland’s total electricity consumptions comes from non-domestic.
- Socialised costs were treated as standard network capex and so were added to the DNOs Regulatory Asset Base (RAB).
- The total socialised cost to be recovered through deprecation over a period of 45 years (assumption shared by SSEN DNO).
- The DNOs regulated rate of return was applied to the investment.
- SSENs split of non-domestic and domestic consumers in their licences area (90:10) was provided for the investigation. SPEN did not provide a similar split; however, it is assumed that the same ratio split applies.
- Using the total costs allocated to non-domestic and domestic based on their energy consumptions, and using the quantity of customers split between domestic and non-domestic, an annual impact per customer split between domestic and non-domestic could be obtained.
The numbers are reflective of 2030 prices as this is when 2.5 GW could be realised. The year 2030 was used in isolation throughout this analysis rather than assessing the impact each year up to 2030 as we could not be sure how much solar would be added each year. It was therefore assumed that the grid would see 2.5GW in 2030.
Stakeholder engagement findings
This section presents areas of discussion in a series of stakeholder engagement meetings with DNOs and TOs. The meetings aimed to understand the following:
- The potential for greater solar PV deployment in Scotland and how existing distribution and transmission networks will accommodate them in additional to other generation technologies
- The impacts on the networks as a result of greater solar PV connections and the resulting interventions deployed by the network operators to manage the increase in connection requests
- Establish the intervention assumptions and resulting cost to deploy these interventions when solar PV connections trigger the need when capacity headroom is no longer available
- Explore the opportunities that solar PV can bring to future distribution network
- Explore gathering data on the cost of interventions to support with the analysis
SSEN Transmission
A meeting was held between Ricardo and SSEN Transmission on 20 February 2023 to establish the implications on the North of Scotland transmission network because of greater solar PV connections and how this would be accommodated. A summary of the meeting with the questions relevant for the discussion are summarised below.
Area of discussion: The process that transmission networks use to accommodate a significant increase in PV connections across Scotland’s energy network
The meeting focused on the following topics:
- SSEN TOs view of the 2.5 GW solar PV target by 2030.
- How transmission network impacts are assessed, and the rules adopted for network reinforcement designs.
- The ability of the transmission network to accommodate 100% reverse power flow and identify what needs to happen to accommodate this in the future.
- Establish the impacts on the network from greater generation connections that are off most concern to the transmission network.
- What type of interventions are being deployed to mitigate the impact on consumers.
SSEN DNO
Two meetings were held between Ricardo and SSEN Distribution on 24 January and 10 February 2023 to establish the implications on the North of Scotland distribution network because of greater solar PV connections and how this would be accommodated. A summary of the meeting with the questions relevant for the discussion are summarised below.
Area of discussion: How will existing networks will accommodate a significant increase in solar PV connections across Scotland’s energy network?
Areas explored:
- How are G98 (‘fit and inform’) connections accommodated? How can this be done at a large-scale?
- How are G99 (large-scale) connections accommodated, and how can they be accommodated at large-scale?
- What is the timeframe for a G99 application to be granted approval by SSEN? How is this impacted by a large proportion of consumers requesting connections to the same part of the network?
- What type of interventions are being considered? Any smart grid solutions?
- Do you think it will be technically feasible to accommodate 2.5GW of additional small-scale rooftop solar across Scotland’s energy network by 2030?
SPEN DNO
A meeting was held between Ricardo and SPEN Distribution on 15 February 2023 to establish the implications on the Central and Southern distribution network in Scotland because of greater solar PV connections and how this would be accommodated.
Area of discussion: How will existing networks accommodate a significant increase in solar PV installations between now and 2030?
Areas explored:
- How are G98 (‘fit and inform’) connections accommodated? How can this be done at a large-scale?
- How are G99 (large-scale) connections accommodated, and how can they be accommodated at large-scale?
- What is the timeframe for a G99 application to be granted approval by SPEN? How is this impacted by a large proportion of consumers requesting connections to the same part of the network?
- What type of interventions are being considered? Any smart grid solutions?
- Do you think it will be technically feasible to accommodate 2.5GW of additional small-scale rooftop solar across Scotland’s energy network by 2030?
Solar Energy Scotland
A meeting was held between Ricardo and Solar Energy Scotland (SES) on 28 July 2023 to discuss the solar industry view on the solar ambition, benefits of solar and areas of concern for how new connections are currently assessed by DNOs.
© The University of Edinburgh, 2024
Prepared by Ricardo Energy & Environment on behalf of ClimateXChange, The University of Edinburgh. All rights reserved.
While every effort is made to ensure the information in this report is accurate, no legal responsibility is accepted for any errors, omissions or misleading statements. The views expressed represent those of the author(s), and do not necessarily represent those of the host institutions or funders.
This study reviews the use of fiscal levers to reduce greenhouse gas (GHG) emissions across the world. These levers include taxes, levies, duties or charges applied by governments on major sources of emissions.
The study focuses mainly on direct carbon taxes which are applied to specific goods – typically fuels – based on the amount or intensity of greenhouse gases they produce. We also consider indirect taxes, which place a price on other forms of pollution, such as air or water, but often target GHGs as well. Grants and subsidies are not in scope.
The study examines whether these levers have been effective in decreasing GHG emissions, the revenue that has been raised and how governments have used that revenue. It looks at six international case studies in more detail. It also examines relevant fiscal levers currently applied in the UK and Scotland, and the possible implications for Scotland of adopting any new lever, based on the case studies. This study does not make policy recommendations, nor does it consider the costs and benefits if they were adopted.
Summary findings
The study focused mainly on the use of direct carbon taxes both nationally and sub-nationally (in specific regions or provinces within a country) around the world. Key findings are:
- The use of carbon taxes is increasingly common. Sub-national carbon taxes have also been applied by Canada and Mexico.
- The balance of evidence suggests carbon taxes have reduced GHG emissions.
- Carbon taxes have generated government revenue.
- Implementation has been politically challenging.
For further details on the findings and case studies, please download the report.
If you require the report in an alternative format, such as a Word document, please contact info@climatexchange.org.uk or 0131 651 4783.