

Workforce requirements for net zero: transport and construction
Research completed: July 2026
DOI: https://doi.org/10.7488/era/7189
Executive summary
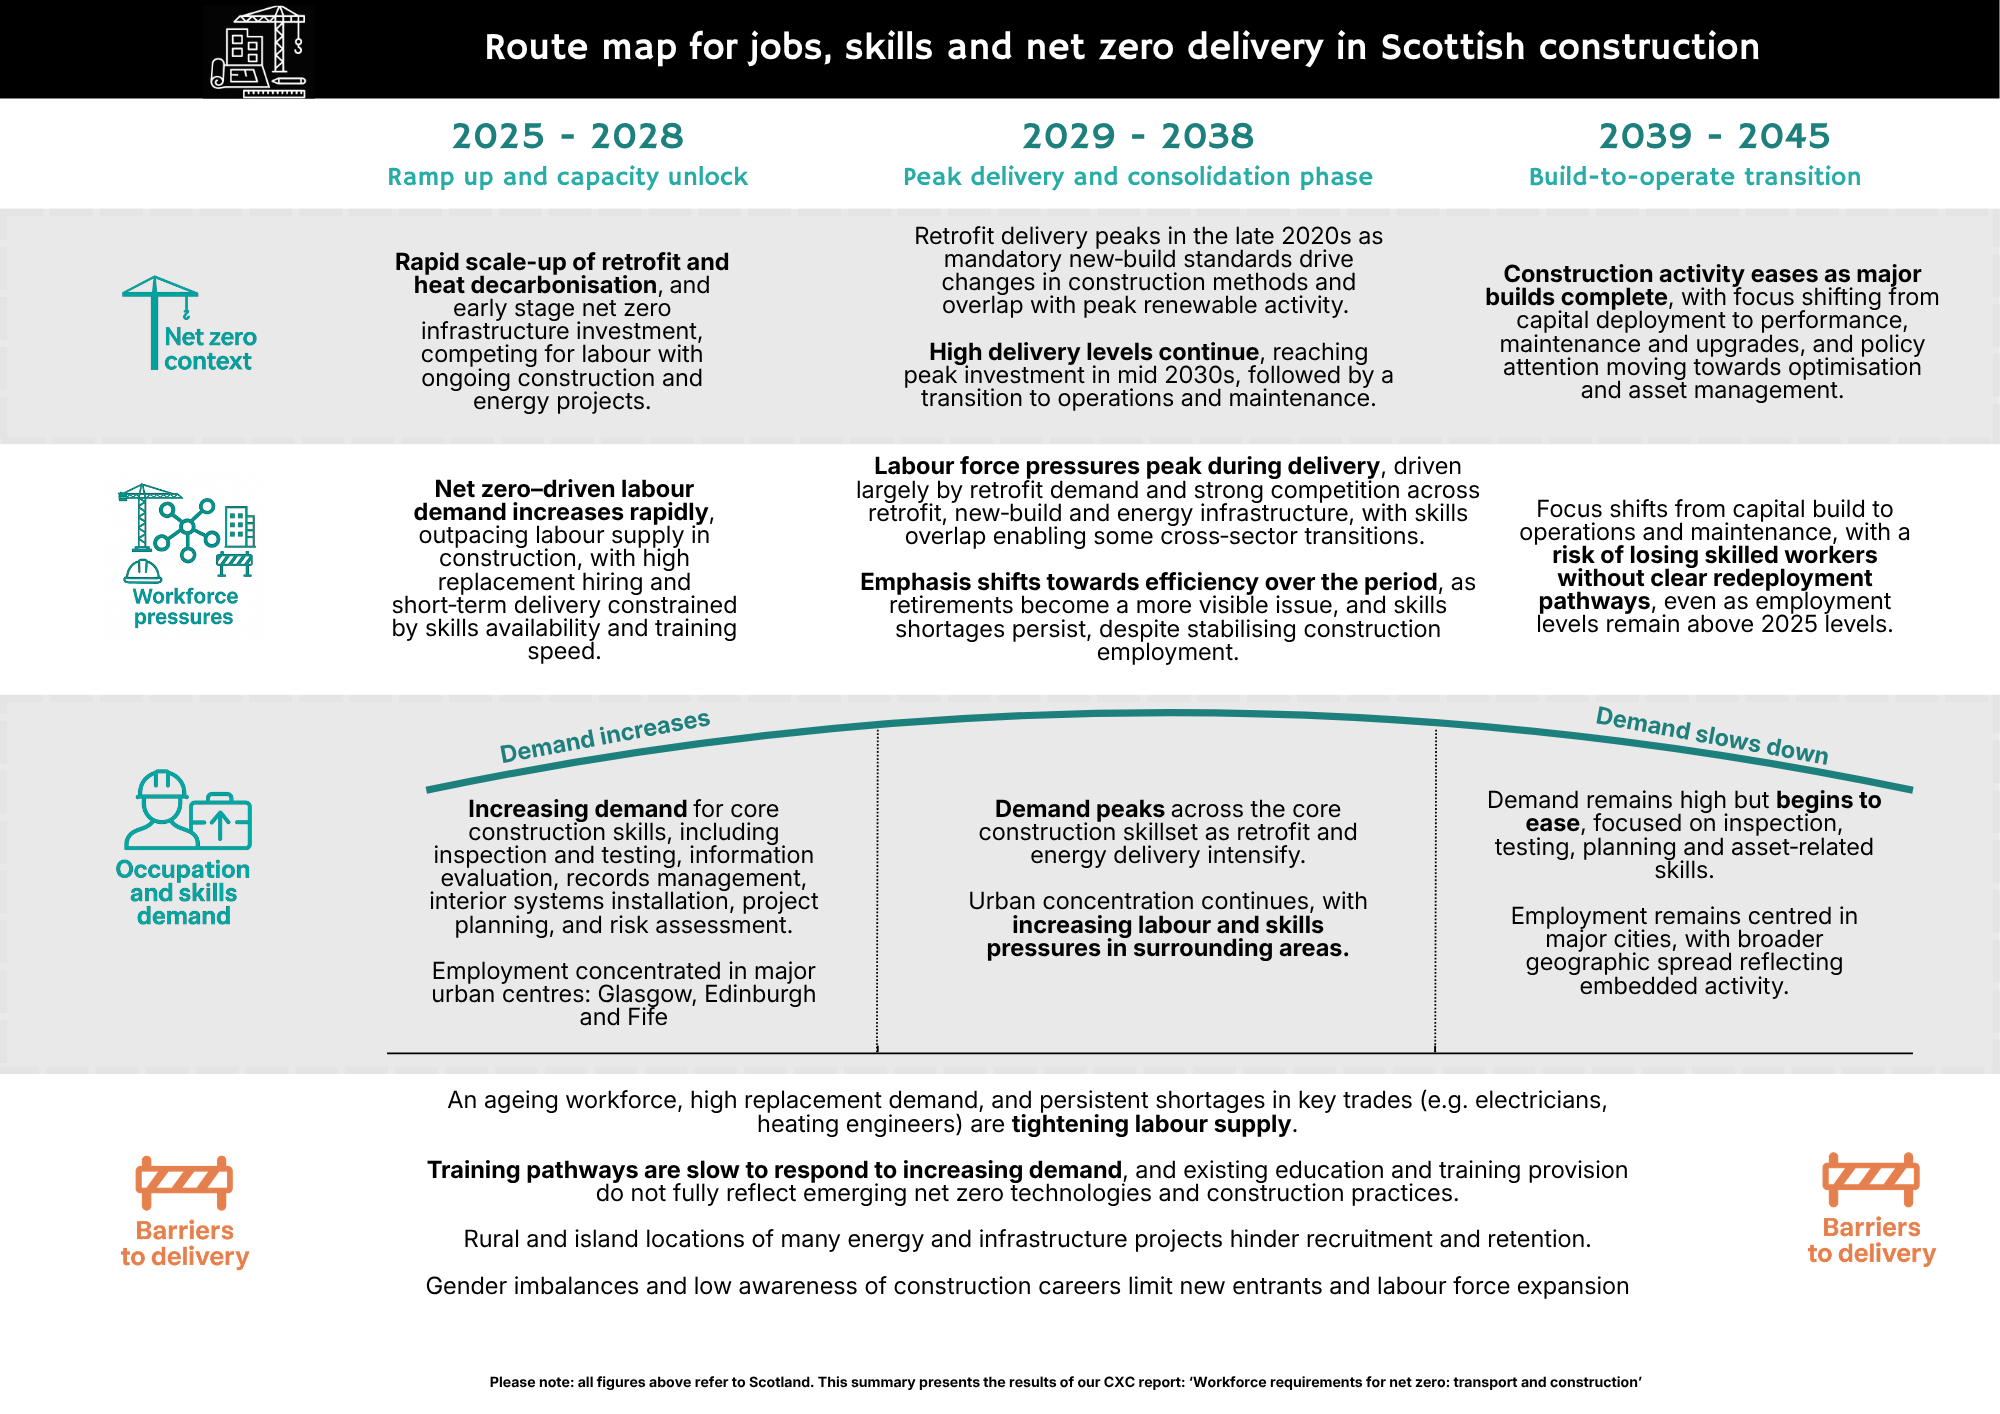
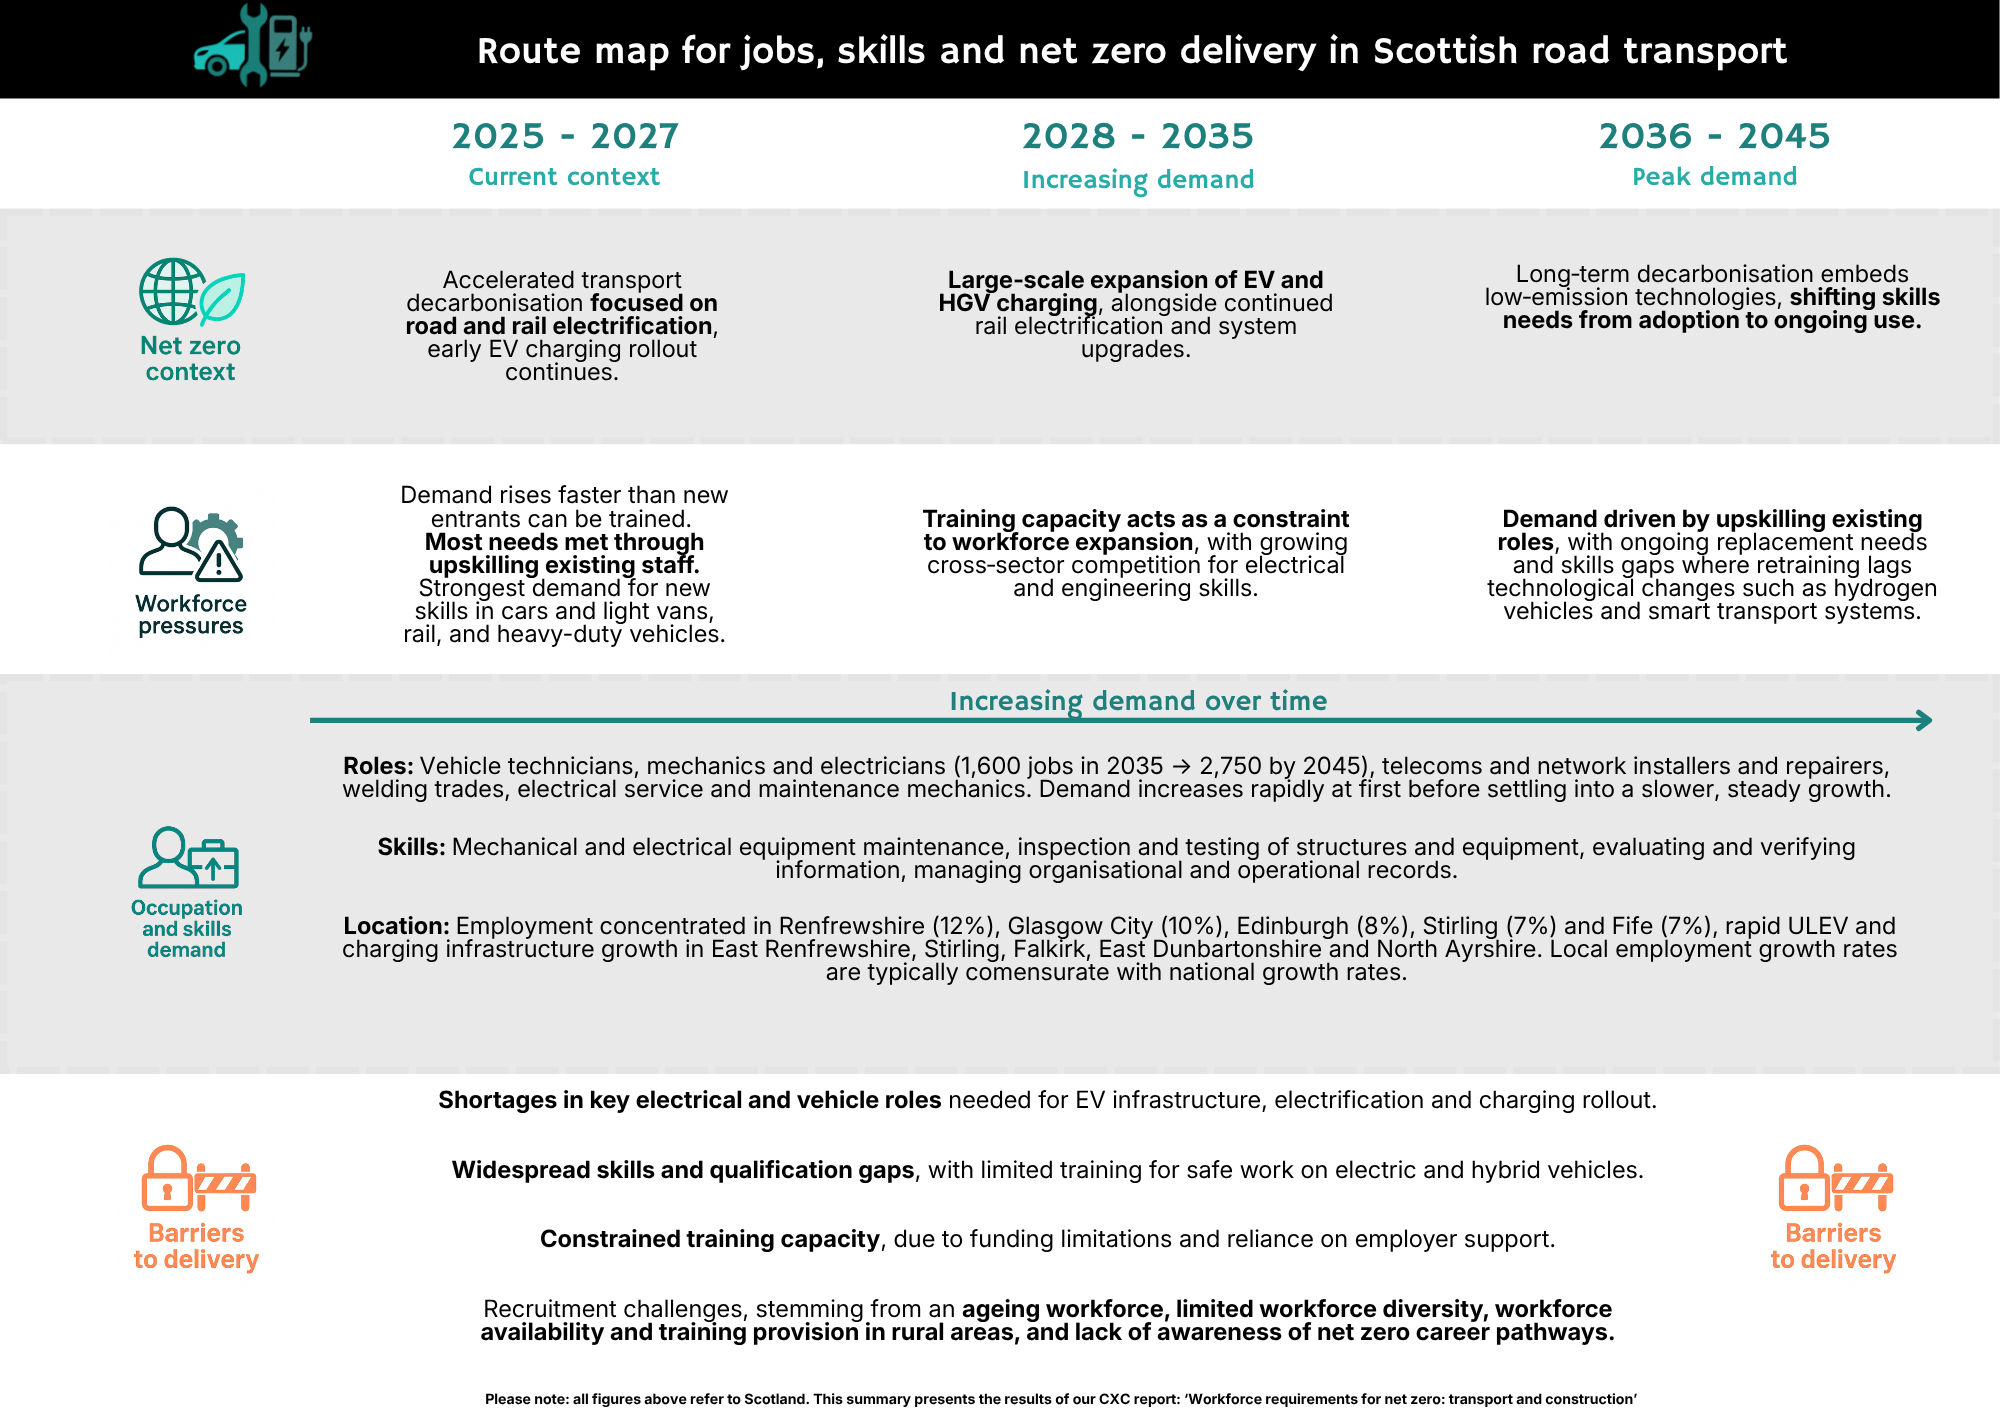
Scotland’s transition to net zero will change the number and types of workers and skills needed in the transport and construction sectors. This report assesses workforce and skills requirements in each sector from 2026 to 2045. It focuses on key activities expected to play a major role in reducing emissions, including renewable energy systems, retrofit programmes to improve the energy efficiency of existing buildings, and the shift to electric transport. The results are presented through sector‑specific route maps for construction and transport, outlining how workforce demand and skills needs develop over time.
Findings
Transport employment
Employment in vehicle and equipment repair and maintenance is projected to decline slightly over the long term, to 2045. However, the expansion of associated technologies is expected to increase demand for new technical skills. Employment linked to electrical vehicle (EV) related activities is projected to increase from around 200 jobs in 2026 to approximately 2,800 jobs by 2045.
The transition is likely to happen mainly by adapting existing jobs. Workers will need skills related to electric and digitally enabled vehicle systems, including electrical systems, battery technologies, and digital tools used to identify and diagnose vehicle problems. Reskilling, which means learning new skills for a different type of work, will also help workers who currently specialise in petrol and diesel engine technologies to move into EV-related activities. The number of electric cars in Scotland is projected to increase from around 122,000 in 2025 to nearly 3 million by 2045.
Construction employment
Overall employment in construction is projected to grow modestly. Activities linked to the net zero transition are expected to grow more rapidly during the early rollout of low‑carbon technologies. For context, the total number of installed air source heat pumps is projected to increase from around 7,000 units in 2025 to approximately 1.7 million by 2045.
Employment linked to net zero construction activities is projected to increase from 2,000 jobs in 2026 to around 13,800 jobs by 2035, before declining from 2039 onwards. A growing share of the workforce will need to adapt existing skills to support renewable energy installation and retrofit. This will require both upskilling – developing new skills within an existing job – and expanding training provision to avoid shortages of workers with specialist construction skills.
Emerging skills
Across both sectors, new skills will be needed as electric technologies, renewable energy systems and digital technologies become more widely used. In transport, these include skills related to EV systems, digital tools for identifying and diagnosing vehicle problems, and connected vehicle technologies. In construction, emerging skills are associated with solar energy systems, smart energy infrastructure, systems to manager energy use in buildings, and technologies and solutions to improve energy efficiency.
Cross-sector workforce mobility
There is significant overlap between the technical skills used in transport and construction, particularly for roles such as electricians, engineering technicians, and telecommunications installers. There is also substantial overlap between skills used in these sectors and in other parts of the economy, especially manufacturing and professional services. This suggests that many core technical and practical skills are transferable between sectors.
For transport-related activities, the greatest overlap with other sectors is in technical skills. For example, 80% of transport sector skills associated with designing and creating are also used in manufacturing and professional services, while 72% of transport sector skills related to operating and monitoring are also used in manufacturing.
For construction, around half of skills are shared with the manufacturing sector. More than half of construction skills in some areas are also shared with professional and technical activities, particularly skills related to higher-level analysis and design.
This overlap creates opportunities for workers to move between sectors as demand changes. However, sector-specific qualifications, certification requirements and experience may affect how quickly workers can transition. Accessible training and clear routes into new roles will therefore be important to support workforce mobility.
Geographical variation
Regional analysis shows that employment in both the construction and transport sectors is concentrated in a small number of urban and industrial regions. This includes major city regions such as Glasgow, Edinburgh and Aberdeen. These areas currently have a large share of the relevant workforce and are likely to remain key hubs for net zero-related activities.
Conclusions
Coordinated, cross-sector workforce planning is critical to ensure there are enough workers with the correct skills to meet the scale and pace of the transition. Our analysis suggests the following policy priorities:
- Expand training in key technical occupations, including electricians, engineering technicians, construction trades and vehicle technicians, to meet future demand.
- Prioritise upskilling and reskilling programmes so that workers can adapt their existing skills to new technologies.
- Ensure training keeps pace with the transition by incorporating renewable energy systems, electrification infrastructure and digital technologies.
- Strengthen collaboration between industry, training providers and government so that training reflects technological developments and changing workforce needs.
- Policies that support workers to move between sectors and develop skills that can be used in different types of work could help address emerging labour shortages.
Glossary and abbreviations
ADAS | Advanced Driver Assistance Systems |
BEMS | Building Energy Management System |
CCC | Climate Change Committee |
CITB | Construction Industry Training Board |
DfT | Department for Transport |
EV | Electric vehicle |
FTE | Full‑Time Equivalent |
GPRS / GPS | General Packet Radio Service / Global Positioning System |
GW | Gigawatt |
HGV | Heavy Goods Vehicle |
LFS | Labour Force Survey |
MW | Megawatt |
ONS | Office for National Statistics |
PV | Photovoltaic |
SIC | Standard Industrial Classification |
SOC | Standard Occupational Classification |
SSC | Standard Skills Classification |
ULEV | Ultra‑Low Emission Vehicle |
Introduction and purpose
Scotland’s legally binding 2045 net zero target is driving major transformation across the economy. This shift is particularly important in the construction and transport sectors, which underpin decarbonisation efforts. Achieving this transformation requires a skilled and adaptable workforce. Existing evidence shows that policymakers and industry lack a clear understanding of how workforce and skills needs will evolve, where shortages will emerge, and which interventions will prove most effective (Climate Change Monitoring Report 2024, Chapter 3: Transport; Built Environment and Construction Factsheet). These challenges affect construction most acutely, where the sector already faces an annual shortfall of more than 5,000 workers (CITB, 2025). Transport also faces significant pressures in the transition to net zero, as it remains Scotland’s highest-emitting sector. Forthcoming policies, such as the Vehicle Emissions Trading Scheme and potential changes to the HGV CO2 emissions regulatory framework, will directly shape workforce demand and training needs (Department for Transport, 2026; Energy and Climate Change Directorate, 2025).
In response, we address these evidence gaps through a detailed assessment of future workforce and skills needs to 2045. We apply a consistent, quantitative skills-mapping framework across the construction and transport sectors. This framework builds on existing analysis, including the Construction Sectoral Skills Assessment 2024, the Climate Emergency Skills Action Plan 2020–2025 (CESAP), and the associated CESAP pathfinder reports (WP1, WP2).
We provide robust, forward-looking evidence to support Scotland’s transition to net zero by examining future workforce demand in these sectors. In particular, this focuses on identifying skills needs, addressing recruitment and retention challenges, and analysing the factors that drive industry investment in workforce development. We present a detailed picture of the workforce required to meet net zero ambitions. This includes needs in energy supply, domestic retrofit, and electric vehicles (including charging points).
For this work, we define ‘net zero’ according to the assumptions and aims set out in the Climate Change Committee’s Balanced Pathway. While different net zero pathways may lead to slightly different outcomes, the broad direction of the results in this study still reflects the scale and scope of the skills landscape across a number of net zero scenarios.
This work builds on existing evidence, which presents the pipeline of various activities needed to achieve Scotland’s net zero target by 2045. In particular, we translate the target pipeline in energy generation, domestic retrofit and EV take-up to employment demand by occupation, and perhaps more informatively, by skills. We forecast workforce demand to 2045, highlight sectoral and cross‑sectoral skills gaps and training needs, and map geographic and temporal variations in workforce requirements across Scotland. By examining employment demand on a skills basis, our work provides government, industry and workers with a clearer picture of the skills, jobs and training requirements needed to enable Scotland’s transition to net zero, a better understanding of the opportunities it presents, and the risks and barriers involved.
Approach
Overview
This section sets out the key assumptions and analytical approach used to interpret net zero scenarios and pathways across the report.
Preparing a net zero technology pipeline
Our approach followed a three-step process for the construction and transport sectors,[1] moving from broad technology analysis to detailed occupational and skills implications. The first stage involved technology mapping, identifying emerging and relevant technologies likely to influence construction and transport under net zero pathways. We then linked these technologies to sectors across installation, operation, and maintenance phases to assess their impact on workforce demand. Finally, we mapped these sectors to occupations using the Standard Occupational Classification (SOC) and occupational shares derived from the Labour Force Survey (LFS), before linking occupations to skills using Skills England’s UK Standard Skills Classification (SSC).
Technologies provide a useful starting point for analysing skills requirements because their deployment shapes the activities that need to be carried out across sectors (Cirillo et al., 2023). Each technology requires specific infrastructure, installation processes, operational systems, and maintenance activities, all relying on particular occupations and skills. Focusing on technologies, therefore, allowed us to link the scale and timing of technology deployment to the workforce capabilities needed for net zero delivery. This process allowed us to quantify skills needs, identify bottlenecks, and highlight training priorities with enough detail to inform planning and policy.
As agreed with the Scottish Government, we used the Climate Change Committee’s (CCC) ‘Balanced Pathway’ scenario from the latest Carbon Budget for Scotland, which outlines a pathway to net zero emissions in Scotland by 2045. Within this framework, we identified key technologies expected to affect construction and transport under net zero pathways, including energy systems, domestic retrofit, and electric vehicles with charging infrastructure. These technologies were selected for their expected emissions-reduction impact and their potential to reshape workforce demand across sectors.
Table 1 outlines the scale and deployment pipeline of key net zero technologies across energy, domestic retrofit, and electric vehicles (including charging points). These projections indicate the potential demand for construction, installation, and vehicle maintenance activities associated with the net zero transition.
Technology | 2025 | 2030 | 2035 | 2040 | 2045 | ||||||
|---|---|---|---|---|---|---|---|---|---|---|---|
Energy – Cumulative installed capacity (GW) | |||||||||||
Wind, of which: | 14.7 | 28.4 | 43 | 56.4 | 58.1 | ||||||
Offshore | 3.2 | 10.1 | 24.2 | 31.9 | 32.2 | ||||||
Onshore | 11.5 | 18.3 | 18.8 | 24.4 | 25.9 | ||||||
Solar PV | 1.1 | 2.3 | 4.8 | 5.5 | 6.2 | ||||||
Hydro | 1.6 | 1.6 | 1.6 | 1.6 | 1.6 | ||||||
Grid storage (inc. battery) | 1.9 | 5.3 | 5.3 | 5.7 | 5.7 | ||||||
Hydrogen | 0 | 0.1 | 0.9 | 3.5 | 4.2 | ||||||
Domestic retrofit – Cumulative deployment | |||||||||||
Air source heat pump | 7,151 | 102,953 | 580,978 | 1,215,376 | 1,753,112 | ||||||
Communal heating conversion | 2,417 | 14,502 | 26,586 | 36,254 | 36,254 | ||||||
Electric heating | 1,966 | 42,077 | 132,374 | 271,740 | 376,960 | ||||||
Ground source heat pump | 102 | 922 | 3,906 | 7,338 | 9,806 | ||||||
Heat network | 0 | 54,910 | 133,332 | 211,615 | 234,707 | ||||||
Hot water tank insulation | 0 | 129,836 | 346,231 | 457,938 | 457,938 | ||||||
Loft insulation[2] | 773 | 22,660 | 32,551 | 32,551 | 32,551 | ||||||
Other | 62,249 | 1,310,678 | 2,652,792 | 2,652,792 | 2,652,792 | ||||||
Electric vehicles – Fleet composition and charge point deployment[3] | |||||||||||
EV buses | 547 | 2,259 | 4,859 | 7,700 | 9,975 | ||||||
EV HGV’s and rigid vehicles | 36 | 2,631 | 13,056 | 26,744 | 35,520 | ||||||
EV vans and motorcycles | 9,100 | 100,268 | 249,436 | 359,590 | 428,745 | ||||||
EV cars | 122,355 | 782,469 | 1,712,967 | 2,466,421 | 2,924,355 | ||||||
EV charge points | 5,626 | 22,720 | 37,841 | 47,614 | 51,958 | ||||||
Peat restoration (hectares) | |||||||||||
Peatlands | 12,750 | 76,500 | 140,250 | 204,000 | 267,750 | ||||||
Table 1: Pipeline. Sources: Economic Impact Scenarios for Scotland’s Energy Transition; Appendix B – Capacity Projections Strong Ambition; Climate Change Committee (CCC) carbon budget methodology; Technology definition aligned to CITB (Domestic Retrofit Workforce Analysis 2025-2050); CCC-Cambridge Economics – Scotland EV data; CCC Scotland’s Carbon Budgets Report
In the energy sector, there is expected to be a substantial expansion in renewable generation capacity, driven primarily by wind. Total wind capacity is projected to increase from 14.7 GW in 2025 to 58.1 GW by 2045. Offshore wind is expected to account for an increasing share of this growth, increasing from 3.2 GW to 32.2 GW over this period. Onshore wind is also expected to increase, although at a slower pace, reaching 25.9 GW by 2045. Solar photovoltaic (PV) capacity is expected to increase steadily from 1.1 GW to 6.2 GW, while grid storage (including batteries) is expected to expand from 1.9 GW to 5.7 GW. Hydrogen deployment is expected to initially be limited, before accelerating from 2035 onwards, reaching 4.2 GW by 2045. Hydro capacity is expected to remain broadly stable.
In the domestic retrofit sector, the pipeline is characterised by a rapid scale-up of low‑carbon heating systems and energy efficiency measures. Air source heat pump deployment is expected to increase considerably, from 7,000 units in 2025 to over 1.7 million by 2045. Electric heating is also expected to expand, reaching 377,000 installations by 2045. The heat network is expected to grow from negligible levels to over 234,000 connections, while communal heating conversion is expected to increase more moderately. Insulation measures, including hot water tank insulation and loft insulation, are expected to be deployed at scale in the earlier years before stabilising.
For electric vehicle activities, the transition is reflected in the rapid growth of the vehicle fleet and supporting infrastructure. Electric cars are expected to account for the largest share, increasing from 122,000 in 2025 to nearly 3 million by 2045. Electric vans and motorcycles are also expected to increase substantially, reaching over 428,000 units by 2045. Heavy goods vehicles and rigid vehicles are expected to increase to over 35,000 units, and electric buses are expected to increase to almost 10,000 units by 2045. A substantial rollout of charging infrastructure is expected, with charge points increasing from 5,600 to 52,000 in 2045. This expected sustained growth implies an ongoing expected demand for installation, maintenance, and electrical infrastructure across the period.
Additionally, we estimated expected peatland restoration activity using national targets and projections from the CCC’s Balanced Pathway. The CCC’s projections indicate a substantial expected increase in restoration, reaching 150,000 hectares of peatland restored or rewetted by 2045. This increase is equivalent to an average annual restoration rate of approximately 12,750 hectares. These estimates inform the assessment of workforce requirements associated with peatland restoration.
This pipeline indicates that the net zero transition will require substantial investment in construction and installation activities, particularly in the short to medium term, followed by increasing demand for operation and maintenance roles. The scale and timing of deployment across energy, domestic retrofit, and transport provide a key input for assessing future workforce and skills requirements (see Sections 5.2 and 6.2).
Sector linking
This section describes the methodology used to translate the investment and delivery pipeline into sector-level workforce requirements.
Sector definition and scope
The pipeline presented in Table 1 provides projections of technology deployment across energy, domestic retrofit, and electric vehicles. To assess the workforce implications of the pipeline, it is necessary to map the associated activities to economic sectors. This is achieved using the Standard Industrial Classification (SIC) framework, which enables alignment with national accounts and labour market data.
The majority of activities associated with the energy and domestic retrofit and peatlands pipeline are mapped to construction (Section F, according to the SIC classification). This is because the delivery of the pipeline is predominantly driven by construction and installation activities, particularly during the build-out phase. The deployment of renewable energy infrastructure requires substantial civil engineering works, including site preparation, foundations, structural assembly, and grid connection. All of these are classed as construction‑related activities. Similarly, domestic retrofit measures, such as the installation of low-carbon heating systems, insulation, and heat networks, are implemented at the building level and rely heavily on construction trades, including electricians, plumbers, and general construction operatives.
In contrast, the electric vehicle (EV) pipeline spans multiple sectors. The maintenance and repair of EVs are mapped to maintenance and repair of motor vehicles (SIC G45), reflecting ongoing servicing and operational requirements. The installation of EV charging infrastructure is mapped to repair and installation of machinery and equipment (SIC C33), capturing the technical and electrical work associated with charging systems. For the purposes of this report, we refer to this group as transport-related activities (vehicle and equipment repair and maintenance).
Converting technology deployment into employment demand
Table 2 summarises the key assumptions and data sources used to convert technology deployment into employment estimates across the energy, domestic retrofit, and electric vehicle technologies. The conversion approach varies by technology type, reflecting differences in how deployment translates into labour demand.
Net zero technology | Assumptions | Source |
|---|---|---|
Energy | Job-years per GW | |
Wind, of which: |
| Rutovitz, J., et al. “Updated employment factors and occupational shares for the energy transition.” |
Offshore wind | 150 | |
Onshore wind | 265 | |
Solar PV | 161 | |
Hydro | 736 | |
Grid storage (inc. battery) | 53 | |
Hydrogen | 736 | |
Domestic retrofit | Workers per deployment | |
Air source heat pump | 0.06 | |
Communal heating conversion | 0.10 | |
Electric heating | 0.03 | |
Ground source heat pump | 0.20 | |
Heat network | 0.21 | |
Hot water tank insulation | 0.01 | |
Loft insulation | 0.03 | |
Other | 0.003 | |
Electric vehicles | Labour intensity | |
EV buses | Maintenance: Every 4 weeks, around 3 hours Repair: Every 4-5 months, around 3 hours | UK vehicle roadworthiness guide |
EV HGV’s and rigid vehicles | Maintenance: Every 6 weeks, around 2 hours Repair: Every 4-5 months, around 3 hours | |
EV vans and motorcycles |
Maintenance: MOT (once a year) around 1 hour
| |
EV cars |
Maintenance: MOT (once a year) around 1 hour
| |
EV charge points | 10.7 jobs per £1 million GVA | |
Peat restoration (hectares) | Labour intensity | |
Peatlands | 0.036 FTE per hectare; around 30% of employment associated with construction-related activities |
Table 2: Employment conversion assumptions and sources. Note: Assumptions are derived from literature and industry reports and reflect typical operating conditions. Where possible, values have been triangulated across multiple sources.
For energy technologies, employment is estimated using job-years per gigawatt (GW) of installed capacity. This is based on the literature on the employment impacts of the energy transition. The coefficients used capture the labour requirements associated with the construction, installation, and operation of energy infrastructure. The employment factors vary across technologies, reflecting differences in labour intensity. Higher values are observed for technologies such as hydro and hydrogen, and lower values for grid storage.
In the domestic retrofit sector, employment is derived using a deployment-per-worker ratio. These ratios link the number of installations to the workforce required to deliver them. The ratios are based on industry evidence and scenario analysis. They reflect the labour requirements associated with installing different retrofit measures, such as heat pumps, insulation, and heat networks. The variation across technologies reflects differences in installation complexity. Labour-intensive measures, such as ground source heat pumps, require greater input from workers per unit of deployment than other interventions, such as insulation.
For electric vehicles, there is a limited availability of standardised data on labour requirements. As such, we draw on industry experience and operational evidence to estimate workforce needs. A bottom-up approach is adopted, using assumptions on inspection frequency, repair rates, and the time required for maintenance and repair. These assumptions are informed by a combination of regulatory guidance, industry standards, and empirical studies. They reflect the ongoing operational nature of labour demand in the transport sector, which is driven by fleet size and utilisation rather than one-off installation activities[4]. For electric vehicle charging infrastructure, employment is estimated using an employment coefficient (jobs per £1 million of output) derived from manufacturing productivity data. This captures the labour required to install and maintain charging infrastructure, linking investment levels to workforce demand.
Finally, for peatland restoration, employment is estimated using a labour intensity expressed in full-time equivalent (FTE) employment per hectare. This is based on available evidence from workforce and economic impact studies. A proportion of this employment is mapped to construction-related activities, reflecting the role of site preparation and restoration works.
Employment estimates are derived by applying the coefficients presented in Table 2 to the technology deployment projections outlined in Table 1. This approach provides a consistent framework for translating projected levels of deployment into workforce requirements across different technologies. The application of these coefficients to the projected deployment pathways produces estimates of employment demand over time. These projections capture the scale and timing of workforce requirements associated with the transition to net zero at sectoral level.
Occupation and skills linking
The sector-level workforce projections, presented in terms of the Standard Industrial Classification (SIC), provide the foundation for estimating occupational and skills demand. Sector employment requirements are mapped to occupations using the UK Standard Occupational Classification (SOC), which classifies jobs by tasks and required skills (see Appendices). The use of SOC ensures consistency with national employment data and enables robust comparison across sectors, geographies, and scenarios.
Occupational employment shares by sector are derived from Labour Force Survey (LFS) data for Scotland over the past five years (2021-2025). Using multiple years reduces short‑term fluctuations and sampling variability, especially for smaller sectors and occupations. This approach provides more stable estimates of each sector’s occupational structure, which we use to allocate projected employment. The occupational structure captures core delivery sectors (such as civil engineering and construction), as well as supporting sectors involved in installation, maintenance, and related professional services.
We then link SOC-based occupational employment to skills requirements using the UK Standard Skills Classification (SSC)[5], a newly developed skills taxonomy released by Skills England (see Appendices). The SSC provides a comprehensive and structured list of skills required by each occupation, allowing occupational projections to be translated into detailed estimates of skills demand. It is structured as a hierarchical framework covering 3,343 individual skills, organised into “skill groups”. These in turn are structured by “skill areas”, linked to 22 high level “skill domains” (see appendix B for more detail). The linkage between SOC and the SSC enables a systematic mapping from sectoral workforce requirements to occupation-specific and skill‑specific needs. Moreover, the SSC is explicitly tailored to the UK labour market context, reflecting UK occupational structures. It incorporates up-to-date information on employer skill demand, including emerging skills such as installing EV charging points, maintaining electrical charging systems, and installing vehicle batteries. This methodology supports a more accurate and policy-relevant assessment of current and future skills needs, particularly in the context of net zero transitions and workforce planning.
We rank skills using a relevance index that combines projected employment levels with information from the UK SSC. The first step links projected employment to occupations, which the SSC then maps to associated skills. This mapping allows us to estimate how many workers are likely to use each skill, based on projected employment by occupation. This component of the index captures the scale of labour demand associated with each skill.
The index also incorporates the frequency with which each skill appears across occupations in the SSC. We count the number of occupations linked to each skill and use this as an additional weighting factor. Skills associated with a larger number of occupations receive higher scores, reflecting their broader relevance across the workforce. This step prevents the index from relying only on employment levels within individual occupations. Instead, the index accounts for how widely a skill is used across different roles.
The relevance index reflects both the scale of employment associated with a skill and the breadth of its use across occupations. This approach highlights both specialised skills linked to high-employment occupations and cross-cutting skills required across a wide range of occupations in the labour market.
Regional analysis
While the main analysis focuses on the net zero transition at the Scotland-level, regional analysis is also provided to support regional planning and policy development. This indicates the occupations needed across regions, while recognising limitations in the granularity and quality of pipeline data at this level.
For the regional analysis, the technology pipeline is disaggregated by council, and the Scotland-level employment estimation framework is applied consistently across council areas. This approach includes the use of employment intensity assumptions and sector‑specific conversion factors to translate technology activity into workforce requirements. Table 3 summarises the sources and methods used.
Technology | Source | ||
|---|---|---|---|
Construction | Energy | Offshore wind | Historic (2014-2024) Scottish council area shares of installed capacity (MW). |
Onshore wind | |||
Hydro | |||
Hydrogen | Live map of active and planned hydrogen projects. | ||
Domestic retrofit | All | Population projections used to estimate the future distribution of domestic retrofit interventions (2025-2045). | |
Transportation | Electric vehicles | EV’s (all vehicle types) | Historic (2009-2025) Scottish council area shares of total EV registrations. |
EV charge points (public only) | Historic (2019-2025) Scottish local authority public EV charge point data. | ||
Table 3: Sectors and council authority allocation methods. Notes: Regional data were not available for grid storage (including batteries) and peatland restoration at the time this document was completed. As these activities account for a small share of total construction employment (less than 1% and 1.6%, respectively), their exclusion from detailed local allocation is not expected to considerably affect overall regional patterns.
For energy technologies, we allocate activity based on historic (2014–2024) Scottish council‑area shares of installed capacity (MW). These historic shares are used to approximate both the relative scale and the pace of technology deployment across regions. To do this, we make the assumption that past spatial patterns provide a reasonable indication of future geographic distribution.
For hydrogen, where consistent historical data are unavailable, we use Hydrogen Scotland’s map of active and planned projects. Areas with a higher concentration of existing or planned hydrogen projects are assumed to have relatively greater employment impacts.
As showed in Section 4.3, domestic retrofit is the largest driver of employment impacts within construction. To allocate retrofit-related activity locally, we use population projections for 2025–2045 to approximate the future distribution of housing-related interventions. The distribution of retrofit activity is closely linked to housing stock, and so population distribution. More densely populated areas, therefore, are expected to generate higher absolute demand for retrofit-related construction employment.
Using the available construction-sector data, we analyse the volume and the speed of each technology deployment at council area, extrapolating trends where necessary. These dimensions are then combined into a composite local indicator, weighted by the estimated employment share generated by each technology. This ensures that technologies with greater employment intensity (i.e. domestic retrofit) proportionately influence the overall spatial distribution.
In the transport sector, electric vehicle (EV) activity is allocated using historic Scottish council-area shares of total EV registrations (2009–2025). As discussed in Section 4.3, the principal driver of employment within the transport pipeline is EV maintenance, making the local distribution of EV uptake a critical determinant of local employment effects[6].
Public EV charging infrastructure is allocated using historic (2019–2025) Scottish local authority data on public charge point deployment. As in the construction sector, we assess both the scale and growth rate of charging infrastructure. These are then integrated into a composite local indicator weighted by the relative employment contribution of each transport technology.
Evidence review and stakeholder workshop
As part of this work, we carried out an extensive and detailed review of existing evidence and research. This review helped develop the approach described above, and helped contextualise the demand-side analysis with evidence of supply-side frictions and barriers, such as recruitment difficulties, skills gaps, and supply pinch-points.
In addition to the evidence review, a series of workshops were held to engage with key construction and transport stakeholders (across government, industry and education) to validate the findings of the evidence review, and gather feedback and expert insights on the study’s approach.
Analysis of net zero workforce requirements: Transport
Context
This section outlines the current structure of employment in Scotland’s transport sector and the emerging workforce implications of the net zero transition. We draw on available evidence to assess the scale and composition of employment, the prevalence of green and transitioning occupations, and the key labour market pressures. We also examine the role of upskilling and reskilling in supporting the transition, alongside regional and sub-sectoral variation in workforce demand.
To provide context, Table 4 shows that Scotland’s transport sector employed 98,000 people in 2022, representing 3.8% of total employment (Skills Development Scotland, 2023). The table also highlights that over half of the workforce is employed in green occupations[7] [8], many of which are expected to experience increasing demand resulting from the transition to net zero.
Details | |
98,000 people (3.8% of total employment in Scotland) | |
Total transport sector employment (2022) | 50,700 workers (52%) were employed in green occupations (defined broadly as occupations affected by the greening of the economy, rather than only exclusively green roles), with nearly 60% of these jobs facing increasing demand due to the transition to net zero1 |
17,000 workers (33.5%) of green jobs require enhanced skills and knowledge2 | |
3,300 workers (6.5%) relate to new and emerging occupations3 |
Table 4: Transport employment (Skills Development Scotland, 2023)
Notes: (1) Increased demand refers to existing occupations having higher employment demand due to green activities, without substantial changes to tasks or worker requirements. (2) Enhanced skills and knowledge describes existing occupations where green activities significantly alter tasks, skills, knowledge, or credentials, while the core purpose of the role remains unchanged. (3) New and emerging occupations arise where green activities create entirely new or substantially transformed roles with distinct work and worker requirements (Dierdorff et al., 2009).
The transport sector differs from other CESAP sectors in having a broadly even split between green and non-green occupations. The high share of roles where green activities considerably alter tasks and skills suggests that the transition in transport will rely primarily on upskilling within existing roles. This pattern indicates adaptation rather than the creation of entirely new occupations. Moreover, these workforce patterns are not evenly spread across Scotland. Lanarkshire and the Glasgow Region accounted for 27% of the transport workforce in 2022, with Edinburgh, East and Midlothian, and Aberdeen City and Shire comprising a further 23% (Skills Development Scotland, 2023). This uneven distribution has important implications for the spatial alignment of skills supply and demand. In particular, as decarbonisation-related infrastructure expands into rural and island regions, workforce availability and training provision may also need to expand in these areas.
Short-term workforce pressures are already evident. For example, despite growing demand for EV maintenance, only 31% of garages currently have the skills to service electric or hybrid vehicles, highlighting a clear short-term skills gap (Skills Development Scotland, 2023). These pressures coincide with ambitious policy commitments, which accelerate demand for new skills. An example of this is the UK Government’s planned phase-out of new petrol and diesel vehicles by 2035. Decarbonisation is driving substantial upskilling and retraining needs across the sector. Whilst much of the transition is expected to occur through upskilling within existing occupations, the literature also suggests that additional workers will be required to meet rising demand associated with electrification and related infrastructure. Table 5 provides a summary of key findings from the literature on workforce demand, skills needs, and labour market trends associated with transport activities. It places a particular focus on the vehicle and equipment repair and maintenance pipeline highlighted in Section 4.2.
Key findings | Details | Source |
|---|---|---|
Projected workforce demand | Additional 24,900 workers were needed by 2025. | (Skills Development Scotland, 2023) |
More than half of demand concentrated in green occupations. | ||
Projected workforce retraining | In 2020, it was estimated that over 65,000 workers will require retraining or upskilling to support EV charging infrastructure, ultra-low emission vehicle maintenance, hydrogen refuelling, and related services over the transition period (2020-2045). | (Skills Development Scotland, 2020) |
Skills shortages | Acute shortages of electricians are already evident, alongside growing demand for electrical engineers, infrastructure planners, and maintenance technicians, particularly in regions with limited local training provision. | (Skills Development Scotland, 2023) (Centre for Sustainable Road Freight, 2025) |
Longer-term projections | Strong growth in employment in low-carbon related technologies linked to Scotland’s wider energy transition. | (Scottish Enterprise, 2024) |
Employment in low-carbon technologies could surpass current oil and gas employment levels, with around 80% of roles concentrated in construction and installation during peak build‑out phases. | ||
More stable operational and maintenance roles sustaining employment thereafter. | ||
Emerging skills demand | Skills demand will emerge unevenly across transport sub-sectors, due to differences in the pace of decarbonisation and the maturity of relevant technologies. There is faster technological change and stronger policy pressures in some sub-sectors, while there is a longer transition period in other sub‑sectors. | (Optimat, 2023) |
Near-term demand | Strongest demand in cars and light vans, rail, and heavy-duty vehicles | |
Longer-term demand | Aviation and maritime decarbonisation expected to drive skills needs over a longer timeframe |
Table 5: Key findings on skills and workforce needs in net zero transport
These findings highlight that transport plays a central role in Scotland’s net zero transition, with increasing demand for green and transitioning occupations. Our review indicates that the workforce shift will rely primarily on upskilling and reskilling existing workers rather than large-scale occupational replacement. We also note that skills demand and workforce pressures vary considerably across regions and sub-sectors, creating challenges for targeted training and effective workforce planning. In the short term, we identify labour shortages in key roles such as electricians and infrastructure-related positions. These shortages coincide with ambitious decarbonisation timelines. Evidence suggests that longer-term employment growth will follow construction-led build‑out phases, before stabilising in operational and maintenance roles. Altogether, these results highlight the strong interconnection between transport and construction workforce needs throughout the transition.
Barriers to delivery and other considerations
Our review identifies multiple barriers that constrain the transport sector’s transition to net zero. These span workforce shortages, training gaps, structural issues, and diversity challenges.
Barrier type | Description |
|---|---|
Shortages in critical occupations | The sector faces acute shortages in key occupations, including electricians, electrical engineers, and mechanics required to develop and maintain EV charging infrastructure and support the electrification of road and rail networks (Skills Development Scotland, 2023). Rural and island regions, such as the South of Scotland and the Highlands and Islands, face the greatest recruitment difficulties. |
A further challenge is the lack of staff trained to repair and maintain Ultra-Low Emission Vehicles (ULEVs). Although three-quarters of garages anticipate servicing ULEVs will form part of their business, only 31% currently have the necessary skills. Common barriers include a perceived lack of near‑term demand (77%) and shortages of appropriately qualified staff (70%), highlighting a misalignment between anticipated market growth and workforce readiness (Skills Development Scotland, 2023). | |
Ageing workforce | Nearly 30% of rail employees are aged over 50, and it was estimated that around 15,000 workers would retire across the UK by 2025 (Skills Development Scotland, 2023). |
Fewer young people are entering the sector, exacerbating skills shortages. | |
Recruitment has also been constrained by Brexit, which reduced access to EU labour. Together, these factors increase pressure on workforce availability at a time of rising demand (Skills Development Scotland, 2023). | |
Workforce diversity | Less than a quarter of transport and storage employees are women, and only 16% of the rail workforce are female (Skills Development Scotland, 2023). |
This imbalance restricts the sector’s ability to attract new entrants and limits the potential labour supply to support net zero initiatives. | |
Training and skills provision | Persistent funding gaps and reliance on employer support limits colleges’ ability to expand training in line with net zero demand (Skills Development Scotland, 2024), (Skills Development Scotland, 2020). |
Less than 10% of vehicle maintenance staff hold recognised qualifications to safely work on electric or hybrid vehicles, and an estimated 15,000 staff will require upskilling or new training by 2032 (Skills Development Scotland, 2023). | |
Decarbonising heavy-duty vehicles (HDVs) and the rail system adds further pressure. Emerging technologies, including battery electric and hydrogen power, as well as marine transport options, will require additional workforce development. Between 34,400 and 38,200 HDV employees were projected to require some level of skills development related to low carbon HDVs by 2026, increasing to 41,000–53,200 by 2032 (Optimat, 2021) | |
This spans staff across manufacturing, charging and refuelling infrastructure, vehicle sales, inspection, repair, and operational occupations. Key barriers include limited commercial returns on training investment, perceived low demand and constrained budgets. | |
Other structural and systemic barriers | Beyond training and recruitment challenges, the transport sector also faces structural and systemic barriers that constrain workforce development. Retaining existing staff remains a challenge, and while interest in entry-level roles is in some cases strong, employers may be unable to absorb and train the volume of workers required to meet future demand. This reflects a broader mismatch between the scale of projected labour needs and the sector’s current capacity and willingness to invest in training new entrants. |
Qualification frameworks are slow to adapt to emerging technologies. Training across further education, higher education, and work-based learning often lags behind new technologies, including hydrogen vehicles and smart transport systems (Skills Development Scotland, 2024) |
Table 6: Workforce barriers constraining the transport sector’s transition to net zero
Net zero workforce requirements
This section examines projected employment levels in activities supporting the net zero transition in transport (vehicle and equipment repair and maintenance), with a focus on the EV pipeline identified above. We present results (a) at the occupational level, (b) by SSC‑defined skills, and (c) across regions.
Employment demand from net zero pathways
The Cambridge Econometrics April 2025 UK forecast estimates that employment in vehicle and equipment repair and maintenance activities will be 69,600 jobs in 2026, decreasing to 65,500 jobs by 2045 (Cambridge Econometrics, 2025).[9] Whilst these projections suggest a modest decrease in employment in the sector, trends may differ across subsectors, with employment in some expected to increase. The projections also exclude explicit assumptions related to the UK’s green transition, including the EV pipeline discussed above. At the time the projections were produced, the UK had published a strategy for its path to reach net zero carbon emissions by 2050 (Department for Energy Security and Net Zero, 2021). While this strategy includes both specific investment commitments and aspirational or goal-based targets, they had not yet been budgeted for or implemented. The level of known planned investments was considered too small to materially affect the macroeconomic outlook (Cambridge Econometrics, 2025).
Consequently, the projections do not reflect more recent policy developments, such as the increased prioritisation of net zero targets and committed investment pipelines, including those associated with the Climate Change Committee’s carbon budgets for Scotland described in previous sections. They should, therefore, be interpreted as a baseline scenario rather than a representation of current policy commitments and planned investments.
Figure 1 shows the additional employment associated with more recent policy plans, particularly EV-related activities, such as charging points installation and vehicle maintenance. The figure indicates that 200 additional jobs will be required in 2026, rising to 2,800 jobs by 2045. These additional jobs are over and above the baseline projections presented earlier, which do not incorporate the effects of the net zero transition.
When combined with the baseline, this implies that total employment in vehicle and equipment repair and maintenance activities would be higher than projected under the baseline alone, partially offsetting the decline associated with conventional internal combustion engine (ICE) activities. These results point to a sustained increase in labour demand associated with the transition to net zero. The growth is driven by ongoing investment in EV technologies and supporting infrastructure. Demand remains elevated over time, reflecting the continuous maintenance requirements of electric vehicles and the expanding size of the EV fleet. This growth forms part of a structural shift, with increasing demand for EV-related jobs coinciding with a gradual decline in roles associated with ICE technologies.
These projections have important implications for workforce development in transport‑related activities. Baseline employment in vehicle and equipment repair and maintenance is projected to decline slightly over the long term. However, the expansion of EV-related activities is expected to increase demand for specific technical capabilities. This indicates that a growing share of the workforce will need to adapt existing mechanical skills to support electrified and digitally enabled vehicle systems. Meeting this demand will require targeted upskilling of the current workforce, particularly in areas such as: electrical systems, battery technologies, and digital diagnostic. Additionally, reskilling pathways that enable workers currently specialised in ICE technologies to transition into EV-related activities will be essential.
As discussed in Section 4, the employment projections are based on the technologies considered and the associated sectoral linkages. In this analysis, the sectoral linkages correspond to maintenance and repair of motor vehicles (SIC G45), and repair and installation of machinery and equipment (SIC C33). Consequently, the number of jobs projected in Figure 1 reflects all occupations associated with these activities (SIC G45 and SIC C33).
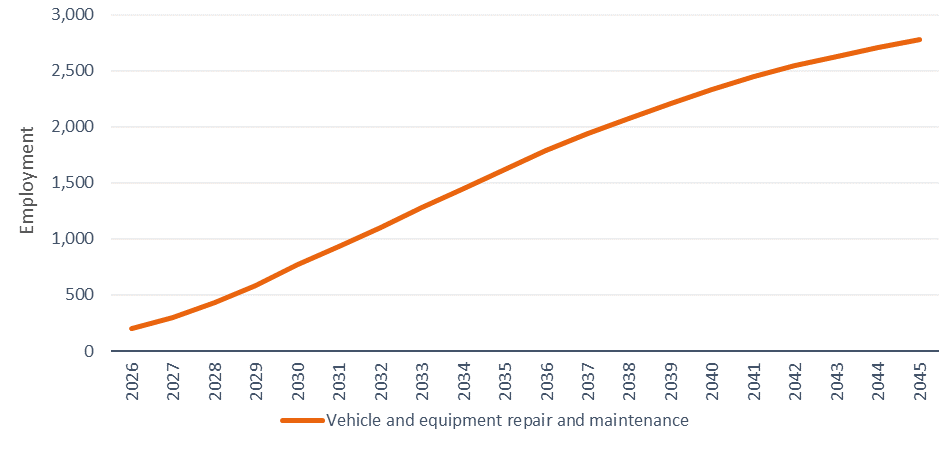
Figure 1: Projected additional employment in the transport sector under net zero pathways, 2026–2045. Source: Cambridge Econometrics. Own calculations
Occupations
While a large share of the employment generated is expected to be directly related to maintenance and repair activities, supporting occupations will also be required. These might include administrative, clerical, and secretarial occupations, providing supporting functions such as appointment scheduling, documentation management, and operational coordination.
At a more granular level, Figure 2 presents the additional projected employment levels across occupational groups involved in vehicle and equipment repair and maintenance. This provides insight into the skills required to fulfil net zero plans for the transport sector. These figures represent additional employment relative to the baseline projections, reflecting the impact of the net zero transition. Overall, employment in all occupational groups is projected to increase as a result of the net zero transition. In particular, skilled trades occupations are expected to account for the largest share of demand. Employment in these roles is projected to increase from 86 additional jobs in 2026 to a peak of 1,180 additional jobs in 2045.
Within skilled trades occupations, particularly strong employment growth is expected in roles associated with zero-emission (ZE) technologies. This growth reflects a transition within the occupation group, as increasing demand for ZE-related maintenance and repair is expected to occur alongside a decline in roles associated with ICE technologies.
Within skilled trades occupations, we expect the following roles associated with ZE-technologies to see particularly strong employment growth. This is expected to account for around 28.7% of the growth in the transport sector between 2026 and 2045:
- Vehicle technicians, mechanics and electricians (SOC code 5231)
- Vehicle body builders and repairers (SOC 5232)
- Telecoms and related network installers and repairers (SOC 5242)
- Electrical service and maintenance mechanics and repairers (SOC 5246)
- Welding trades (SOC 5213)
The second group of occupations in which notable employment growth is expected is sales and customer service occupations. Within this group, we expect the following roles to see particularly strong employment growth. This is expected to account for around 7.3% of the growth in the transport sector between 2026 and 2045:
- Vehicle and parts salespersons and advisers (SOC code 7115)
- Customer service occupations not elsewhere classified[10]
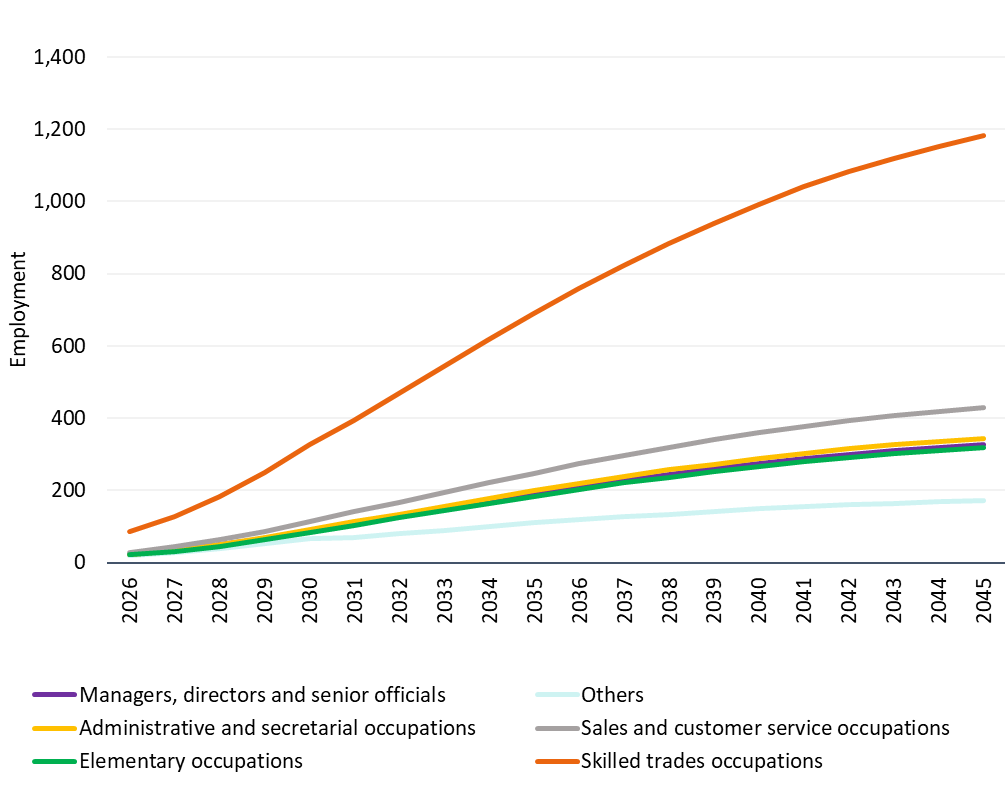
Figure 2: Projected additional employment by occupational group. 2026-2045
Source: Cambridge Econometrics and Labour Force Survey (ONS). Own calculations
The results presented are based on the Climate Change Committee’s Balanced Pathway and other sources, which provide the technology deployment assumptions used to estimate workforce demand in this study. While alternative net zero trajectories may imply different levels of technology deployment and, therefore, different overall employment levels, the broad occupational patterns identified here are unlikely to change. This outcome reflects the fact that most decarbonisation pathways involve large-scale deployment of technologies such as electric vehicles and charging infrastructure, which require installation, operation, and maintenance activities across similar occupational groups. As a result, although the scale of employment may vary across scenarios, demand for occupations linked to technical trades, engineering, installation, and maintenance activities is expected to remain central to the net zero transition.
Skills
Figure 2, while informative, does not explicitly identify the specific skills that will be most in demand during the transition. To address this, we map the skills associated with vehicle and equipment repair and maintenance activities using the newly developed UK Standard Skills Classification (SSC). This provides a more granular understanding of the skills underpinning the net zero transition. As outlined in Section 4.4, the SSC enables both aggregated and disaggregated analyses of skills requirements.
Table 7 presents the skills projected to be in highest demand based on occupational requirements, uses the SSC taxonomy codes. Skills are ranked using a relevance index that combines the projected employment associated with each skill and its frequency within the SSC. This approach ensures that the index captures both the level of employment associated with each skill, and the extent to which it is required across occupations. In practice, skills linked to occupations with higher projected employment and those that are used across a wider range of roles receive higher relevance scores. This allows us to identify not only highly specialised skills, but also those that are widely required across the workforce. The table also distinguishes between Skill Domains (broad categories) and Skill Areas (more detailed classifications), providing a more granular view of skill requirements. This distinction is particularly useful for identifying priority areas for skills development and training.
Our findings indicate that the skill domains[11] projected to be most relevant are:
- Evaluating and Inspecting (from 200 jobs in 2026 to 2,750 by 2045)
- Planning and Resourcing (from 170 to 2,300 jobs)
- Recording and Documenting (from 160 to 2,200 jobs)
- Advising and Supporting (from 150 to 2,100 jobs)
- Maintaining and Repairing (Physical Objects) (from 140 to 1,900 jobs)
At a more detailed level, Table 7 also shows that the most relevant areas include managing organisational and operational records, inspecting and testing structures and equipment, maintaining mechanical and pressurised equipment, evaluating and verifying information. Because the relevance index is derived from the occupational structure and the skills associated with each occupation in the SSC, the relative ordering of skills remains broadly stable over time. In practice, the results therefore indicate that the demand for these skills is expected to increase as employment in the relevant occupations grows, rather than reflecting the emergence of entirely new skills. This level of detail provides a clearer understanding of the specific capabilities required to support the net zero transition within the transport sector.
It is important to note that the table is not intended to identify entirely new skills. In many cases, what may appear to be new skills are in fact existing skills that are being applied or adapted to new technologies. The level of aggregation used in this analysis does not allow us to identify technology-specific skills in detail. For example, the maintenance of electric vehicles requires many of the same diagnostic, inspection, and mechanical maintenance skills traditionally used in servicing internal combustion engine vehicles, although these skills must be adapted to work with electric drivetrains, batteries, and high-voltage systems. Similarly, the installation of electric vehicle charging infrastructure relies on existing electrical installation and inspection skills, which are already used in construction and electrical engineering occupations. In this sense, technological transitions often involve the adaptation and recombination of existing capabilities rather than the creation of entirely new skill sets.
This interpretation is consistent with the broader literature on technological change and skills, which emphasises that many labour market transitions involve upskilling and the adaptation of existing competencies rather than the emergence of completely new skills (OECD, 2022). Evidence suggests that technological change frequently reshapes how skills are used within occupations, often requiring additional training or certification. It requires workers to update and apply existing capabilities in new technological contexts rather than replacing them entirely.
The results in Table 7 provide an indication of the skills most strongly associated with the occupations projected to grow as part of the net zero transition. The table uses SSC classifications to highlight the capabilities that are likely to become increasingly important as demand increases for occupations involved in vehicle and equipment repair and maintenance activities.
Relevance index | Skill Domain | Skill Area |
|---|---|---|
1 | Recording and Documenting (SD.19) | Managing organisational and operational records (SA.095) |
2 | Evaluating and Inspecting (SD.14) | Inspecting and testing structures and equipment (SA.071) |
3 | Maintaining and Repairing (Physical Objects) (SD.21) | Maintaining mechanical and pressurised equipment (SA.100) |
4 | Evaluating and Inspecting (SD.14) | Evaluating and verifying information (SA.077) |
5 | Advising and Supporting (SD.12) | Advising and supporting on legal issues, processes and disputes (SA.062) |
6 | Maintaining and Repairing (Physical Objects) (SD.21) | Maintaining electrical and electronic equipment (SA.104) |
7 | Evaluating and Inspecting (SD.14) | Inspecting and testing facilities, cargo and vehicles (SA.072) |
8 | Advising and Supporting (SD.12) | Advising on vehicles performance and safety (SA.060) |
9 | Marketing and Selling (SD.17) | Developing and implementing marketing strategies (SA.087) |
10 | Planning and Resourcing (SD.03) | Coordinating events, bookings and schedules (SA.016) |
11 | Planning and Resourcing (SD.03) | Procuring and managing supplies (SA.019) |
12 | Communicating and Performing (SD.18) | Communicating complex, technical or sensitive information (SA.089) |
13 | Recording and Documenting (SD.19) | Documenting interviews and compiling reports (SA.094) |
14 | Constructing and Installing (SD.05) | Installing mechanical and pressurised systems and equipment (SA.029) |
15 | Managing and Directing (SD.16) | Leading organisational operations and improvements (SA.082) |
16 | Researching and Analysing (SD.01) | Analysing and interpreting information and data (SA.004) |
17 | Constructing and Installing (SD.05) | Installing electrical and electronic systems and equipment (SA.030) |
18 | Planning and Resourcing (SD.03) | Determining project requirements and plans (SA.018) |
19 | Operating and Monitoring (SD.07) | Joining and moulding components (SA.042) |
20 | Operating and Monitoring (SD.07) | Operating manufacturing and processing machinery and equipment (SA.035) |
Table 7: Skills projected to be in highest demand based on occupational requirements. Source: Cambridge Econometrics and Labour Force Survey (ONS). Own calculations
The analysis can be further disaggregated. As an illustration, Table 8 and Table 9 present the skill requirements for skilled trades and sales and customer service occupations within the activities related to vehicle and equipment repair and maintenance. These are the two occupational groups expected to account for the highest levels of employment. The purpose of this table is to facilitate targeted training and workforce development initiatives tailored to the needs of each group.
The skills presented in Table 8 can be interpreted as bundles of capabilities associated with the occupational groups expected to have the highest employment demand. In the SSC framework, each occupation is linked to multiple skill areas that collectively describe the range of tasks performed within that occupation. As a result, the skills listed in Table 8 should be understood as groups of related competencies that tend to be required together within occupations belonging to the skilled trades and sales and customer service occupational groups.
For skilled trades occupations, the most relevant skill is maintaining mechanical and pressurised equipment, followed by inspecting and testing structures and equipment, evaluating and verifying information, maintaining electrical and electronic equipment, and installing mechanical and pressurised systems. These skills reflect the technical and operational nature of these roles.
Given the central role of skilled trades occupations, particularly, vehicle technicians, mechanics and electricians, in supporting the net zero transition in the transport sector, we analyse the information provided by the SSC at a more disaggregated level. This allows us to identify emerging skills, understood here as skills closely related to the transportation activities outlined in Section 4. Within this subset of skills, several capabilities can be linked to the growing adoption of new vehicle technologies and supporting infrastructure. These include skills related to EV and electrification technologies, such as maintaining electrical charging systems, installing vehicle batteries, and repairing battery components. In addition, advanced vehicle system skills are becoming increasingly relevant, including calibrating vehicle ADAS systems (Advanced Driver Assistance Systems) and inspecting electronic drive systems. The increasing digitalisation of vehicles also creates demand for skills related to digital and connected vehicle systems, such as diagnosing faults on industrial networks, diagnosing and repairing faults in vehicle management systems, and installing GPRS/GPS tracking systems. The growing integration of automated and intelligent systems in modern vehicles highlights the importance of automation and smart system skills, including finding faults in automation control systems and maintaining electrical control systems.
Finally, the analysis also captures a growing demand for electrical and high-voltage skills associated with the expansion of charging infrastructure. This is particularly relevant for heavy-duty vehicles and depot-based charging systems, which require higher-capacity electrical connections and, in some cases, upgrades to local grid infrastructure and substations. While these requirements are not explicitly identified as a separate category within the SSC, they are reflected in skill areas such as maintaining electrical and electronic equipment and installing electrical systems. In practice, this implies an increasing need for workers with advanced electrical competencies, including high-voltage installation, maintenance, and safety procedures.
ID | Skill Area | |
|---|---|---|
SA.100 | Maintaining mechanical and pressurised equipment | |
SA.071 | Inspecting and testing structures and equipment | |
SA.104 | Maintaining electrical and electronic equipment | |
SA.077 | Evaluating and verifying information | |
SA.029 | Installing mechanical and pressurised systems and equipment | |
SA.042 | Joining and moulding components | |
SA.030 | Installing electrical and electronic systems and equipment | |
SA.035 | Operating manufacturing and processing machinery and equipment | |
SA.072 | Inspecting and testing facilities, cargo and vehicles | |
SA.095 | Managing organisational and operational records | |
SA.016 | Coordinating events, bookings and schedules | |
SA.032 | Implementing and refining advanced manufacturing | |
SA.060 | Advising on finance, organisational operations and sustainability | |
SA.004 | Analysing and interpreting information and data | |
SA.008 | Designing industrial machinery, equipment and systems | |
SA.020 | Planning operations, controls and contingencies | |
SA.011 | Designing technical solutions and prototypes | |
SA.031 | Manufacturing, assembling and customising components | |
SA.028 | Installing building interior systems and equipment | |
SA.021 | Designing and managing cloud and network infrastructure |
Table 8: Skills projected to be most in demand for skilled trades and professional occupations. Source: Cambridge Econometrics and Labour Force Survey (ONS). Own calculations
In contrast, sales and customer service occupations (Table 9) place greater emphasis on providing advice on vehicles’ performance and safety; deliver sales presentations; inspect and assess vehicle damage; demonstrate products to customers; and manage customer relationships.
ID | Skill Area |
|---|---|
S.2614 | Provide advice on vehicles performance and safety |
S.0680 | Deliver sales presentations |
S.1302 | Inspect and assess vehicle damage |
S.0686 | Demonstrate products to customers |
S.1691 | Manage customer relationships |
S.2404 | Prepare sales contracts |
S.2772 | Resolve customer complaints |
S.0278 | Build relationships with clients |
S.0380 | Communicate effectively with customers by phone |
S.1151 | Fit vehicle parts or accessories |
S.1516 | Issue purchase orders |
S.0481 | Conduct stock audits |
S.0535 | Coordinate order-picking activities |
S.1134 | Explain technical information to customers |
S.1633 | Maintain service and maintenance records |
S.2371 | Prepare contractual documents |
S.1019 | Enter or update records on business information systems |
S.1779 | Manage stock rotation |
S.3230 | Update computer database information |
S.0200 | Arrange delivery of goods |
Table 9: Skills projected to be most in demand for sales and customer service occupations. Source: Cambridge Econometrics and Labour Force Survey (ONS). Own calculations
Regional analysis (Council areas)
As mentioned in Section 4.5, it is possible to derive indicative estimates of the labour market pressures council areas are likely to face by disaggregating national‑level evidence presented in this report. This can be done using additional data sources such as regional population projections published by the National Records of Scotland, among others.
In the case of the activities related to vehicle and equipment repair and maintenance, Table 10 shows projected increases in activity levels across all council areas, based on local EV uptake and infrastructure deployment patterns. These additional jobs correspond to employment associated with EV-related activities under the net zero transition. This indicates sustained growth across all council areas (consistent with national trends). Activity levels remain highest in larger urban areas such as Renfrewshire, Stirling, the City of Edinburgh, Glasgow City, and Fife. This pattern is expected to translate into high demand for a range of occupations associated with vehicle maintenance and repair, including vehicle technicians, mechanics and electricians; vehicle body builders and repairers; telecommunications and related network installers and repairers; electrical service and maintenance technicians; and welding trades.
Council areas | 2026 | 2030 | 2035 | 2040 | 2045 |
Renfrewshire | 23 | 90 | 197 | 285 | 341 |
Glasgow City | 21 | 79 | 166 | 239 | 285 |
City of Edinburgh | 17 | 64 | 136 | 196 | 234 |
Stirling | 13 | 50 | 107 | 155 | 185 |
Fife | 13 | 49 | 105 | 151 | 180 |
Dundee City | 11 | 41 | 86 | 124 | 147 |
Aberdeenshire | 10 | 37 | 79 | 113 | 135 |
South Lanarkshire | 8 | 31 | 65 | 93 | 110 |
Aberdeen City | 8 | 29 | 60 | 87 | 103 |
North Lanarkshire | 8 | 29 | 59 | 85 | 101 |
Highland | 8 | 29 | 57 | 80 | 95 |
Perth and Kinross | 6 | 24 | 48 | 69 | 82 |
Scottish Borders | 5 | 18 | 39 | 56 | 67 |
West Lothian | 5 | 18 | 39 | 56 | 66 |
Dumfries and Galloway | 5 | 17 | 34 | 48 | 57 |
East Lothian | 5 | 16 | 32 | 45 | 54 |
Midlothian | 4 | 14 | 28 | 41 | 48 |
Falkirk | 4 | 14 | 28 | 41 | 48 |
East Renfrewshire | 3 | 12 | 26 | 38 | 45 |
Angus | 3 | 12 | 25 | 36 | 43 |
East Dunbartonshire | 3 | 11 | 25 | 35 | 42 |
South Ayrshire | 3 | 12 | 25 | 36 | 42 |
Orkney Islands | 3 | 11 | 23 | 33 | 39 |
East Ayrshire | 3 | 11 | 21 | 30 | 36 |
North Ayrshire | 3 | 10 | 21 | 30 | 36 |
Argyll and Bute | 3 | 10 | 21 | 29 | 35 |
Moray | 2 | 9 | 19 | 28 | 33 |
West Dunbartonshire | 2 | 7 | 14 | 20 | 24 |
Inverclyde | 2 | 6 | 13 | 19 | 22 |
Clackmannanshire | 1 | 5 | 10 | 14 | 16 |
Shetland Islands | 1 | 4 | 8 | 11 | 13 |
Na h-Eileanan Siar | 1 | 3 | 6 | 8 | 10 |
Table 10: Projected additional employment supporting the transport sector under net zero pathways by council area and single year, 2026–2045. Source: Cambridge Econometrics and Section 4.5. Own calculations
In addition to the overall stock of vehicles, the pace of growth in both the vehicle fleet and charging infrastructure provides further insight into where demand pressures are likely to intensify. Historical trends indicate that there is rapid expansion in ULEV fleets and charging points in council areas such as Renfrewshire, Stirling, the City of Edinburgh, Glasgow City, and Fife. As a result, these areas are likely to face particularly strong labour market pressures, reflecting both the scale and the growth of demand for EV-related maintenance and repair services.
Analysis of net zero workforce requirements: Construction
Context
Drawing together the evidence reviewed, we highlight several consistent factors shaping the construction workforce in Scotland’s net zero transition. Construction sits at the centre of Scotland’s net zero delivery, underpinning energy efficiency upgrades, large‑scale retrofitting, low-carbon heat deployment, and renewable energy infrastructure. It is consistently identified as a critical enabler of progress across heat decarbonisation, solar deployment, and onshore wind. Across the literature, workforce demand is shown to be closely linked to the scale and pace of investment in these activities.
The tables presented in this section summarise key findings from the literature on workforce demand, labour market pressures, and skills needs in Scotland’s construction sector. The dimensions reported reflect the indicators available in the underlying evidence base, which vary across sources.
Key findings | Details |
Total construction sector employment (2024) |
|
Recruitment and training pressures |
|
Table 11: Construction sector workforce demand and skills Pressures (CITB, 2025)
The evidence reviewed indicates that employment growth is being driven by major infrastructure and retrofit programmes, including rail electrification, renewable energy developments, and building retrofits. The strongest demand is consistently identified for civil engineers, road and rail construction operatives, and steel erectors and metal workers. Demand for these roles and construction project managers is expected to increase steadily through the second half of the decade (CITB, 2025).
Retrofit delivery emerges as a particularly substantial source of workforce demand. At the time the underlying evidence was produced in 2022, around 3,000 renewable heating systems were being installed in Scotland’s homes each year (Skills Development Scotland, 2023). Projections cited in the literature indicate that installation rates would need to increase rapidly to 124,000 systems per year, between 2021 and 2026 (see Table 12). They are expected to peak at over 200,000 installations per year in the late 2020s to meet anticipated regulatory requirements and energy efficiency standards. This implies substantial pressure on the construction workforce across all regions of Scotland.
Year | Annual installation rate |
2022 | Around 3,000 renewable heating systems per year |
2021–2026 | Rapid increase to 124,000 systems per year |
late 2020s | Peaking at over 200,000 systems per year |
Table 12: Projected installation rates of renewable heating systems (Skills Development Scotland, 2023)
Other net zero-related opportunities in construction are expected to expand rapidly across multiple sub-sectors (see Table 13).
Sub-sector | Timeframe | Projected jobs/FTEs | Details |
Heat decarbonisation | 2022–2030 | 5,450 – 16,500 FTE roles | Under the ‘Medium’ scenario. |
Solar sector | By 2030 | 11,000 FTE roles | Majority of roles are construction-related |
Onshore wind | 2024–2027 | 6,900 FTEs (2024), peaking at more than 20,500 FTEs (2027) | Over 90% of roles in construction and installation; many are time-limited and linked to build-out phases |
Longer-term employment will be sustained through operational and maintenance activities |
Table 13: Projected Employment by low-carbon sub-sector (ClimateXChange 2022, 2024)
Construction employment is concentrated in the Glasgow Region, Aberdeen City and Shire, and Edinburgh, East and Midlothian. The evidence also points to marked regional variation in future workforce demand. For onshore wind, Dumfries and Galloway and Highland are projected to account for more than 20% of peak construction and installation workforce demand, while Highland is expected to face sustained demand for operations and maintenance roles into the late 2020s. Wider analysis for the Highlands and Islands suggests that net-zero construction employment could generate substantial, but uneven impacts through to 2040. These impacts will depend on policy choices, infrastructure investment, and grid constraints (HIE, 2025).
The skills profile of the construction workforce is shown to be evolving in response to these demands (Table 14).
Key occupations | Skills needs | Employment trend (2014–2024) | Projected Growth | Main occupational groups | Qualification levels |
Plumbers Heating engineers Insulation installers Civil engineers Technical project managers | Large-scale upskilling and reskilling required | Prolonged decline | Modest recovery in medium term; growth projected to outpace wider Scottish economy | Skilled construction and building trades, professional and managerial occupations | Substantial share of workers holding qualifications at SCQF levels 6 and 7–10 |
Table 14: Key occupations, skills needs, employment trends and qualification levels for heat decarbonisation (Skill Development Scotland, 2024)
Overall, the evidence reviewed indicates that the construction sector faces a combination of strong near-term demand, high workforce churn, and rapidly evolving skills requirements. Employment growth is largely driven by time-limited build-out phases associated with net zero infrastructure, followed by more stable operational and maintenance roles. This evidence reinforces the need for coordinated workforce planning, targeted skills provision, and alignment between construction and related sectors, particularly between transport and energy sectors. This will be essential to support effective delivery of Scotland’s net zero ambitions.
Barriers to delivery and other considerations
Our review identifies a set of interconnected barriers that is limiting the construction sector’s ability to deliver Scotland’s net zero targets (see Table 15). Workforce supply is tightening, as large numbers of experienced workers approach retirement, and recruitment continues to lag behind demand. Training systems struggle to respond at pace, with long apprenticeship routes and limited fast-track options slowing skills supply. Provision has not kept up with rapidly evolving net zero technologies. This reflects both the time required to develop technical competencies through established entry level pathways and the limited capacity of existing training provision to scale rapidly in response to rising demand. As a result, even where new training opportunities are introduced, the process of developing a sufficiently skilled workforce can take several years.
These pressures are intensified in rural and island regions, where projects face persistent recruitment and accommodation constraints. At the same time, shortages in key trades, rising certification requirements, and limited training capacity restrict delivery further. Persistent gender imbalances, urban concentration of employment, and weak perceptions of decarbonisation careers compound these challenges and risk undermining a just transition.
Barrier type | Description |
|---|---|
Ageing workforce and replacement demand | The construction workforce is ageing rapidly. 39% of workers are aged 50 or above, and Skills Development Scotland estimates that 50,000 workers could retire over the next decade (Skills Development Scotland, 2023). |
Recruitment has not kept pace with replacement demand. Earlier estimates suggested a shortfall of 5,200 workers per year (Skills Development Scotland, 2024). More recent evidence lowered this figure to 3,590 workers annually, reflecting changing economic conditions, but significant shortages remain (CITB, 2025). | |
Slow and inflexible entry level pathways | Apprenticeships remain the main entry route into construction (Skills Development Scotland, 2020). Most programmes take up to four years to complete, and this training period creates a long delay between rising demand and workforce supply. |
The CESAP Pathfinder warns that over-reliance on apprenticeships increases delivery risks and recommends expanding alternative entry routes and accelerated reskilling programmes to meet emerging needs faster (CESAP Pathfinder, 2024). | |
Misalignment between training provision and net zero technologies | Evidence from the CESAP (2020) and the CESAP Pathfinder (2023) highlights significant gaps in existing training provision. Current curricula in colleges and universities do not yet adequately reflect emerging net zero technologies or evolving construction practices. Both reports emphasise the urgency of comprehensive curriculum reform to ensure that education and entry level pathways align with future construction methods, low‑carbon materials, and increasingly stringent retrofit standards. |
Regional and geographic constraints | Geographic imbalances in workforce supply create significant challenges for delivering renewable energy projects. Many large renewable energy projects are located in rural and island regions, including Highland, Dumfries and Galloway, and Argyll and Bute. These areas face persistent difficulties in recruiting and retaining local workers for construction, installation, and maintenance roles (ClimateXChange, 2024). |
Projects often rely on temporary workers travelling from outside the region. Limited local accommodation restricts the scale and speed of construction activity. At the same time, construction employment remains concentrated in urban areas. Glasgow, Lanarkshire, Aberdeen City and Shire, and Edinburgh account for the largest workforces and are expected to remain dominant through to 2034 (Skills Development Scotland, 2024). | |
Trade-specific shortages and certification requirements | Trade-specific shortages are worsening as regulatory and certification demands increase. Shortages are most acute in key trades, including heating engineers (Skills Development Scotland, 2024). |
The introduction of PAS 2030 and PAS 2035 has raised quality and compliance requirements for retrofit work. Several new roles now require certification, including Retrofit Advisor, Assessor, Coordinator, Designer, and Evaluator. Training centres able to deliver PAS accreditation remain limited, while high travel and accommodation costs further restrict access, particularly for small firms in rural and island regions. | |
Scale of future workforce demand | National forecasts highlight the magnitude of the workforce challenge ahead. The CITB Construction Workforce Outlook projects a need for 3,590 additional workers each year between 2025 and 2029 (CITB, 2025). |
Demand is highest in absolute terms for construction professionals and technical staff, while civil engineers and road and rail operatives face the fastest relative growth pressures. | |
Gender imbalance and poor career perceptions | Structural barriers are reinforced by persistent gender and perception issues. Men make up 85% of the construction workforce (Skills Development Scotland, 2020), and employers continue to hire young people, women, and ethnic minority groups at lower rates than men. |
CESAP Pathfinder evidence shows that decarbonisation-related careers remain poorly understood by potential entrants (Skills Development Scotland, 2024; CESAP Pathfinder, 2024). Improving career awareness through inclusive recruitment, targeted outreach, and improved career visibility could help to build a more inclusive talent pool and support new entrant retention. |
Table 15: Workforce barriers to the construction sector’s transition to net zero
Net zero workforce requirements
This section examines employment levels in the construction sector and how they evolve over time under net-zero pathways. As described in Section 4, we focus on the effects of domestic retrofit and energy capacity expansion, including wind, solar PV, hydrogen, grid storage, and hydropower. Results are presented at the occupational level, by SSC-defined skills, and across regions.
Employment demand from net zero pathways
The Cambridge Econometrics April 2025 UK forecast estimates that employment in the construction sector will be 171,300 jobs in 2026, increasing to 180,800 jobs by 2045, reflecting growth in general construction activity (Cambridge Econometrics, 2025). Within this context, Figure 3 shows projected additional employment levels associated with technologies expected to be supported by the construction sector under net zero pathways (renewable energy installation and retrofit – Construction).
The projected additional employment demand in construction from the net zero transition in these technologies is estimated to be 2,000 jobs in 2026. This level is projected to double by 2027 and continue to increase steadily, reaching 13,800 jobs by 2035. This is expected to remain relatively stable, before decreasing from 2039 onwards, falling to 6,700 jobs by 2045. Despite this decline, demand in construction from the net zero transition in these technologies remains above initial levels, indicating a lasting structural increase in labour demand associated with the transition to net zero. These projections highlight the distinct phases of employment associated with the net zero transition: rapid early growth, subsequent stabilisation, and a later decline as technologies mature and deployment levels off.
These projections have important implications for workforce development in the construction sector. Overall employment in construction is expected to increase modestly over the long term. Activities linked to the net zero transition, however, are projected to expand more rapidly, particularly during the early deployment phases of low-carbon technologies. This indicates that a growing share of the workforce will need to adapt existing skills to support these activities. Key areas include renewable energy installation, building retrofit, and electrification infrastructure. Meeting this demand will require both upskilling of the current workforce and targeted reskilling to enable workers to move into emerging net zero-related activities. The rapid increase in demand during the early deployment phase also highlights the need for timely expansion of training provision. Such expansion is essential to prevent skills shortages in specialised construction activities.
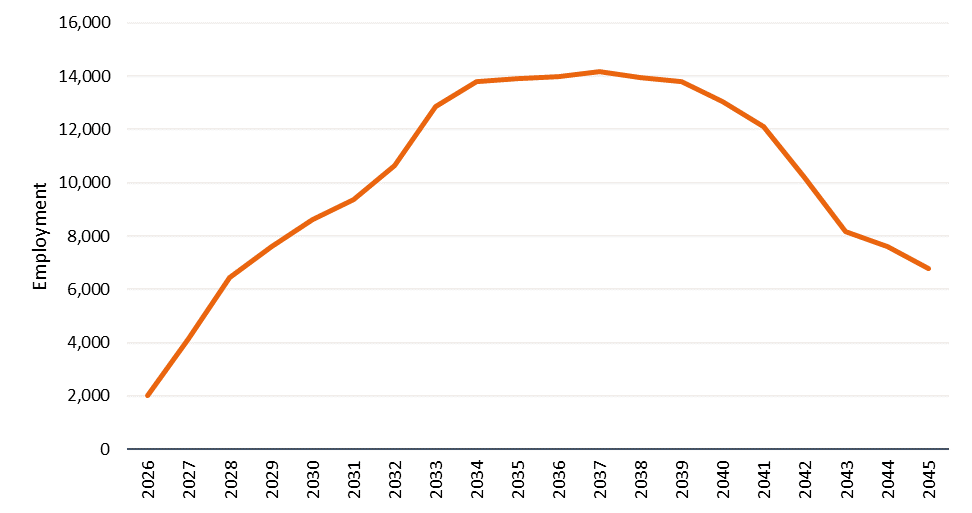
Figure 3: Projected additional employment in the construction sector under net zero pathways, 2026–2045
Source: Cambridge Econometrics. Own calculations
Occupations
Figure 4 shows projected employment levels across occupational groups in the construction sector. Employment in all groups is expected to increase as a result of the net zero transition. Skilled trades occupations are expected to account for the largest share of additional jobs associated with the net zero pipeline, accounting for 1,150 jobs in 2026. Employment in this occupation is expected to increase substantially, peaking between 2034 and 2039 at 9,000 jobs per year. Demand is then expected to decrease to 4,300 jobs by the end of 2045.
Within skilled trades occupations, we expect the following roles to see particularly strong employment growth. This is expected to account for around 47% of the growth in the construction sector between 2026 and 2045.
- Carpenters and joiners (SOC code 5316)
- Electricians and electrical fitters (SOC 5241)
- Painters and decorators (SOC 5323)
- Plumbers and heating and ventilating installers and repairers (5315)
- Roofers, roof tilers and slaters (5314)
The second group of occupations in which there is expected to be strong employment growth is process, plant and machine operatives. Within this group, we expect the following roles to see particularly strong employment growth. This is expected to account for around 8.6% of the growth in the construction sector between 2026 and 2045:
- Scaffolders, stagers and riggers (SOC code 8151)
- Construction operatives n.e.c. (SOC 8159)
- Mobile machine drivers and operatives n.e.c. (SOC 8229)
- Large goods vehicle drivers (SOC 8211)
Professional occupations are also expected to see notable increases, particularly construction project managers and related professionals (SOC 2455) and civil engineers (SOC 2121).
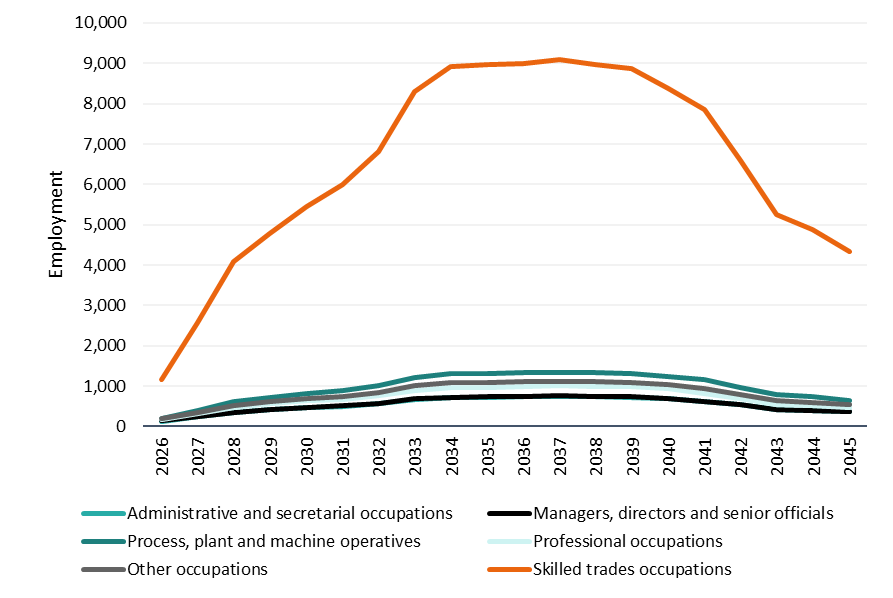
Figure 4: Projected employment by occupational group. 2026-2045
Source: Cambridge Econometrics and Labour Force Survey (ONS). Own calculations
Skills
Figure 4 shows employment trends across occupations, indicating an increase in demand for technical, engineering, and project management skills. However, they do not directly identify the specific skills driving this demand. To address this, we map construction-related occupations to the SSC, providing a more detailed view of the skills required for the net zero transition.
Table 15 presents the skills expected to be in highest demand, ranked according to a relevance index (see Section 4.4). The results indicate that the most in-demand SSC Skill Domains are:
- Evaluating and Inspecting (from 1,900 additional jobs in 2026 to 6,600 by 2045)
- Planning and Resourcing (from 1,800 to 6,200)
- Operating & Monitoring (from 1,700 to 6,100)
- Constructing and Installing (from 1,500 to 5,500)
- Managing and Directing (from 1,500 to 5,500)
At a more detailed level, Table 16 highlights the SSC Skill Areas expected to be most in demand. These include: inspecting and testing structures and equipment; evaluating and verifying information; managing organisational and operational records; installing building interior systems and equipment; and determining project requirements and plans. Together, these results provide a more precise understanding of the specific skills needed to support the construction sector’s net zero transition.
Relevance index | Skill Domain | Skill Area |
|---|---|---|
1 | Evaluating and inspecting (SD.14) | Inspecting and testing structures and equipment (SA.071) |
2 | Evaluating and inspecting (SD.14) | Evaluating and verifying information (SA.077) |
3 | Recording and documenting (SD.19) | Managing organisational and operational records (SA.095) |
4 | Constructing and installing (SD.05) | Installing building interior systems and equipment (SA.028) |
5 | Planning and resourcing (SD.03) | Determining project requirements and plans (SA.018) |
6 | Evaluating and inspecting (SD.14) | Evaluating environments, conditions and risks (SA.074) |
7 | Managing and directing (SD.16) | Leading organisational operations and improvements (SA.082) |
8 | Recording and documenting (SD.19) | Documenting interviews and compiling reports (SA.094) |
9 | Planning and resourcing (SD.03) | Planning operations, controls and contingencies (SA.020) |
10 | Constructing and installing (SD.05) | Building external structures and surfaces (SA.027) |
11 | Maintaining and repairing (physical objects) (SD.21) | Maintaining electrical and electronic equipment (SA.104) |
12 | Accounting and financing (SD.15) | Analysing financial data and forecasting budgets (SA.081) |
13 | Maintaining and repairing (physical objects) (SD.21) | Maintaining mechanical and pressurised equipment (SA.100) |
14 | Planning and resourcing (SD.03) | Procuring and managing supplies (SA.019) |
15 | Operating and monitoring (SD.07) | Colouring, coating or finishing objects (SA.043) |
16 | Constructing and installing (SD.05) | Installing mechanical and pressurised systems and equipment (SA.029) |
17 | Designing and creating (SD.02) | Designing technical solutions and prototypes (SA.011) |
18 | Constructing and installing (SD.05) | Installing electrical and electronic systems and equipment (SA.030) |
19 | Advising and supporting (SD.12) | Advising and supporting on legal issues, processes and disputes (SA.062) |
20 | Researching and analysing (SD.01 | Analysing and interpreting information and data (SA.004) |
Table 16: Skills projected to be in highest demand based on occupational requirements
Source: Cambridge Econometrics and Labour Force Survey (ONS). Own calculations
Table 17 and Table 18 present the skill requirements for (a) skilled trades occupations and (b) process, plant and machine operatives within the construction sector. These are projected to account for the largest share of employment demand. The tables highlight both shared and distinct skill requirements across the two occupational groups. Skilled trades occupations (Table 17) are characterised by a strong emphasis on installation, maintenance, and system integration. They also require key skills related to installing building interior systems, maintaining mechanical and electrical equipment, and planning and evaluating technical operations. These roles also require a combination of technical expertise and analytical capabilities, such as evaluating information, assessing risks, and determining project requirements.
Given the central role of skilled trades occupations in supporting the net zero transition in the construction sector, we analyse the information provided by the SSC at a more disaggregated level in order to identify emerging skills. These are understood to be those skills closely related to the construction activities, as outlined in Section 4. In particular, we focus on carpenters and joiners, and electricians and electrical fitters, given their relatively high employment concentration within the sector.
For carpenters and joiners, the skills associated with these occupations remain largely traditional construction skills, reflecting activities such as installing building components and working with structural materials.
In contrast, the skill set associated with electricians and electrical fitters shows a stronger connection to emerging technologies linked to the net zero transition. Within this subset of skills, several capabilities can be linked to the growing adoption of low‑carbon energy technologies and supporting infrastructure in the construction sector. These include skills related to renewable energy systems, such as installing solar energy systems, maintaining photovoltaic systems, calculating solar panel orientations, operating solar thermal energy systems for hot water and heating, installing inverters, and designing solar energy systems. The transition towards smart energy and grid systems also creates demand for skills such as designing smart grids, monitoring green energy systems, and directing renewable energy production operations. Finally, the growing integration of smart buildings and digital energy technologies highlights the importance of skills such as installing Building Energy Management Systems (BEMS) wiring systems, installing smart home devices, and providing advice on smart home technologies. Alongside these developments, the increasing emphasis on energy efficiency and sustainability requires capabilities such as conducting energy audits and providing advice on energy-saving technologies and strategies to reduce utility consumption.
ID | Skill Area | |
|---|---|---|
SA.028 | Installing building interior systems and equipment | |
SA.077 | Evaluating and verifying information | |
SA.071 | Inspecting and testing structures and equipment | |
SA.043 | Colouring, coating or finishing objects | |
SA.027 | Building external structures and surfaces | |
SA.104 | Maintaining electrical and electronic equipment | |
SA.100 | Maintaining mechanical and pressurised equipment | |
SA.029 | Installing mechanical and pressurised systems and equipment | |
SA.030 | Installing electrical and electronic systems and equipment | |
SA.018 | Determining project requirements and plans | |
SA.042 | Joining and moulding components | |
SA.035 | Operating manufacturing and processing machinery and equipment | |
SA.020 | Planning operations, controls and contingencies | |
SA.074 | Evaluating environments, conditions and risks | |
SA.073 | Evaluating object characteristics, qualities and function | |
SA.031 | Manufacturing, assembling and customising components | |
SA.008 | Designing industrial machinery, equipment and systems | |
SA.019 | Procuring and managing supplies | |
SA.004 | Analysing and interpreting information and data | |
SA.036 | Operating and monitoring outdoor machinery and equipment |
Table 17: Skills projected to be most in demand for skilled trades occupations
Source: Cambridge Econometrics and Labour Force Survey (ONS). Own calculations
In contrast, process, plant and machine operatives (Table 18) are more strongly associated with operational and task-based activities. Key skills include handling and moving materials, operating machinery and vehicles, and monitoring equipment and safety systems. These occupations place greater emphasis on physical and procedural skills and the safe, efficient operation of equipment. These differences underline the need for tailored training and workforce development strategies for each occupational group.
At the same time, there are skills areas of overlap between the two occupational groups, particularly in skills such as inspecting and testing structures and equipment, installing systems, and maintaining machinery. This overlap reflects the interconnected nature of construction activities, where both technical installation and operational execution are required.
ID | Skill Area |
|---|---|
SA.097 | Handling and moving heavy items |
SA.027 | Building external structures and surfaces |
SA.071 | Inspecting and testing structures and equipment |
SA.028 | Installing building interior systems and equipment |
SA.077 | Evaluating and verifying information |
SA.036 | Operating and monitoring outdoor machinery and equipment |
SA.040 | Operating and monitoring safety and control systems |
SA.099 | Operating transport and passenger vehicles |
SA.030 | Installing electrical and electronic systems and equipment |
SA.098 | Handling and moving hazardous materials |
SA.035 | Operating manufacturing and processing machinery and equipment |
SA.082 | Leading organisational operations and improvements |
SA.100 | Maintaining mechanical and pressurised equipment |
SA.102 | Maintaining water systems and equipment |
SA.096 | Sorting and distributing items |
SA.043 | Colouring, coating or finishing objects |
SA.104 | Maintaining electrical and electronic equipment |
SA.095 | Managing organisational and operational records |
SA.020 | Planning operations, controls and contingencies |
SA.029 | Installing mechanical and pressurised systems and equipment |
Table 18: Skills projected to be most in demand for process, plant and machine operatives
Source: Cambridge Econometrics and Labour Force Survey (ONS). Own calculations
Regional analysis (Council areas)
Table 19 presents projected employment requirements in construction by council area, associated with the net zero technology pipeline. The largest projected additional demand is concentrated in the main population centres, particularly Glasgow City, City of Edinburgh, Fife, South Lanarkshire, and North Lanarkshire. Given the national occupational structure, this pattern is expected to generate high demand for key construction occupations, including carpenters and joiners; electricians and electrical fitters; painters and decorators; plumbers, and heating and ventilating installers and repairers; and roofers, roof tilers, and slaters.
Council areas | 2026 | 2030 | 2035 | 2040 | 2045 |
Glasgow City | 178 | 936 | 1,621 | 1,492 | 812 |
City of Edinburgh | 146 | 766 | 1,324 | 1,218 | 662 |
Fife | 106 | 529 | 890 | 807 | 433 |
South Lanarkshire | 129 | 544 | 866 | 807 | 425 |
North Lanarkshire | 93 | 473 | 799 | 723 | 388 |
Aberdeenshire | 96 | 415 | 653 | 591 | 305 |
Highland | 151 | 495 | 674 | 627 | 300 |
Aberdeen City | 63 | 324 | 548 | 494 | 263 |
Renfrewshire | 51 | 271 | 475 | 446 | 246 |
West Lothian | 53 | 265 | 452 | 417 | 226 |
Perth and Kinross | 64 | 261 | 408 | 380 | 198 |
Falkirk | 44 | 221 | 370 | 334 | 178 |
Dundee City | 41 | 212 | 361 | 327 | 176 |
Dumfries and Galloway | 74 | 266 | 377 | 343 | 166 |
East Lothian | 42 | 189 | 314 | 299 | 163 |
Midlothian | 29 | 151 | 268 | 258 | 145 |
Scottish Borders | 55 | 208 | 308 | 284 | 142 |
North Ayrshire | 40 | 189 | 305 | 271 | 140 |
East Ayrshire | 46 | 192 | 297 | 273 | 137 |
East Renfrewshire | 40 | 168 | 268 | 254 | 135 |
East Dunbartonshire | 30 | 155 | 268 | 247 | 135 |
Angus | 33 | 162 | 271 | 245 | 130 |
South Ayrshire | 50 | 192 | 285 | 260 | 130 |
Stirling | 35 | 149 | 236 | 216 | 113 |
Moray | 58 | 191 | 258 | 237 | 112 |
Argyll and Bute | 47 | 166 | 233 | 213 | 103 |
West Dunbartonshire | 23 | 118 | 194 | 171 | 89 |
Inverclyde | 21 | 105 | 171 | 149 | 77 |
Clackmannanshire | 16 | 75 | 123 | 111 | 58 |
Na h-Eileanan Siar | 9 | 39 | 61 | 54 | 27 |
Shetland Islands | 8 | 35 | 56 | 51 | 26 |
Orkney Islands | 8 | 34 | 54 | 49 | 25 |
Table 19: Projected additional employment in the construction sector under net zero pathways by council areas and single year, 2026–2045. Source: Cambridge Econometrics and Section 4.5. Own calculations
In addition to population size, projected growth trends in retrofit and energy-related activity provide further insight into where construction demand is likely to expand most rapidly. Our analysis suggests that there is expected to be relatively strong growth in construction activities in areas such as the Scottish Borders, Stirling, Dundee City, the Highland council area, and Fife. As a result, these areas may face particularly acute labour market pressures, driven both by rising demand and by the need to expand the local skills base to support the transition.
Potential skills cross-over between sectors
Overlaps between construction and transport sectors
Sections 5.2 and 6.2 identify the occupations and skills expected to be most in demand to support net zero objectives within the transport and construction sectors. These sections highlight a degree of overlap between the sectors in relation to required occupations and skills.
In particular, the occupations common to both sectors include:
- Telecoms and related network installers and repairers (SOC code 5242), accounting for 1.8% of employment in transport-related net zero activities and 2.5% in construction-related activities.
- Electricians and electrical fitters (SOC 5241) accounting for 1.7% of employment in transport-related net zero activities and 10.8% in construction-related activities.
- Engineering technicians (SOC 3113), accounting for 1.0% of employment in transport-related net zero activities and 1.1% in construction-related activities.
- Production managers and directors in manufacturing (SOC 1121), accounting for 1.5% of employment in transport-related net zero activities and 0.7% in construction-related activities.
Several specific skills are common to both sectors. Among the most relevant are:
- Managing organisational and operational records (SSC code SA.095)
- Inspecting and testing structures and equipment (SSC SA.071)
- Maintaining mechanical and pressurised equipment (SSC SA.100)
- Evaluating and verifying information (SSC SA.077)
- Advising and supporting on legal issues, processes and disputes (SSC SA.062)
- Maintaining electrical and electronic equipment (SSC SA.104)
- Procuring and managing supplies (SSC SA.019)
- Documenting interviews and compiling reports (SSC SA.094)
- Leading organisational operations and improvements (SSC SA.082)
- Analysing and interpreting information and data (SSC SA.004)
- Installing mechanical and pressurised systems and equipment (SSC SA.029)
- Installing electrical and electronic systems and equipment (SSC SA.030)
- Determining project requirements and plans (SSC SA.018)
This overlap indicates that a subset of technical and engineering occupations is transferable between the two sectors, suggesting scope for labour reallocation to address emerging skill needs. At the same time, it may also generate cross-sector competition for workers with these skills, particularly where supply is constrained. The extent of mobility and competition will depend on the degree of task similarity across sectors, and the availability of targeted training to bridge sector-specific requirements.
Overlaps with other sectors
To broaden the analysis, we analyse the structure of the SSC to identify potential cross‑sectoral overlaps and sources of labour for construction and transport activities supporting net zero. The SSC identifies the skills that are most relevant to specific industry activities (SIC), allowing us to examine how essential skills are distributed across sectors. Using this framework, we identify where essential skills in construction and in transport‑related net zero activities are shared with other sectors. This allows us to highlight potential areas for labour mobility that could support Scotland’s net zero transition.
Transport-related activities supporting the net zero transition
Table 20 shows the extent to which the skills required for transport-related net zero activities are also used in other sectors of the economy. Darker shading indicates a greater degree of shared skills. Shared skills across sectors indicate potential labour mobility between sectors, as workers with comparable skill sets may move between activities as demand evolves. At the same time, shared skill requirements may also create competition for workers across sectors, particularly in occupations where the supply of skilled labour is limited.
The first column of Table 20 lists the skill domains, while the second column reports the number of essential skills within each domain for the construction sector. For example, within the ‘designing and creating’ domain, five key skills are identified: create construction or installation diagrams; design industrial processing systems; create electrical diagrams; produce ultra-precision mechanical systems; and design mechanical equipment.
The remaining columns indicate the extent to which these essential skills are present in other sectors. For instance, two of the “designing and creating” critical skills identified in the transport-related activities are also found in the construction sector. Similarly, within the “researching and analysing” domain three of the skills are also mapped to the manufacturing sector.
Skills Domain | Total skills in the vehicle and equipment repair and maintenance activities | Construction | Manufacturing | Professional, Scientific and Technical Activities | Other sectors1 |
|---|---|---|---|---|---|
Researching and Analysing | 8 | 1 | 3 | 6 | 3 |
Designing and creating | 5 | 2 | 4 | 4 | 0 |
Planning and Resourcing | 8 | 0 | 2 | 0 | 6 |
Programming and Implementing (Digital Tools and Systems) | 3 | 0 | 0 | 1 | 3 |
Constructing and Installing | 31 | 18 | 13 | 0 | 6 |
Manufacturing and Processing | 3 | 0 | 2 | 0 | 0 |
Operating and Monitoring | 32 | 7 | 23 | 2 | 7 |
Advising and Supporting | 3 | 1 | 1 | 2 | 0 |
Educating and Training | 3 | 1 | 1 | 0 | 1 |
Evaluating and inspecting | 38 | 8 | 18 | 16 | 7 |
Accounting and financing | 1 | 0 | 0 | 0 | 1 |
Managing and directing | 8 | 1 | 1 | 0 | 7 |
Marketing and selling | 3 | 0 | 0 | 0 | 2 |
Communicating and performing | 3 | 0 | 0 | 0 | 3 |
Recording and documenting | 4 | 0 | 0 | 1 | 3 |
Handling and transporting | 5 | 0 | 5 | 0 | 4 |
Maintaining and repairing (Physical Objects) | 76 | 7 | 20 | 1 | 15 |
Cleaning and restoring | 2 | 0 | 1 | 0 | 0 |
Table 20: Cross-sectoral overlap in skills associated with transport-related activities supporting the net zero transition. Source: Standard skills classification (SSC). Own calculations
Notes: (1) Other sectors include: mining and quarrying, electricity, gas, steam and air conditioning supply, wholesale and retail trade; repair of motor vehicles and motorcycles, transportation and storage, accommodation and food service activities, information and communication, financial and insurance activities, real estate activities, administrative and support service activities, public administration and defence; compulsory social security, education, human health and social work activities, arts, entertainment and recreation, water supply; sewerage, waste management and remediation activities, other service activities, activities of households as employers, activities of extraterritorial organisations and bodies.
Table 20 reveals a varied pattern of cross-sectoral skills overlap across the skill domains associated with transport-related net zero activities. The highest levels of overlap are observed in technically oriented domains. Within the skill domain of evaluating and inspecting, which represents one of the largest groups with 38 essential skills, there is a high degree of cross-sectoral overlap. 18 of these skills are also present in manufacturing, 16 skills in professional, scientific and technical activities, and eight in construction, with a smaller share (seven skills) found in other sectors. Similarly, operating and monitoring skills exhibit a high degree of overlap with manufacturing (23 skills).
Skills related to designing and creating show substantial alignment with both manufacturing and professional, scientific and technical activities (four key skills in each case). Researching and analysing skills are strongly represented in professional activities (six skills) and, to a lesser extent, manufacturing (three skills).
These patterns indicate that technical, engineering, and operational competencies are highly transferable across sectors, particularly between transport-related activities and manufacturing.
Construction related activities supporting the transition
Table 21 presents the results of potential cross-sectoral overlaps for the construction sector. The first column lists the Skill Domains, while the second column reports the number of essential skills within each domain for the construction sector. For example, within the ‘researching and analysing’ domain, two key skills are identified: reading and interpreting technical instructions, and conducting environmental health investigations.
The remaining columns indicate the extent to which these essential skills are present in other sectors. Darker shading represents a higher degree of overlap. For instance, nine of the ‘designing and creating’ critical skills identified in the construction sector are also found in manufacturing. Similarly, within the ‘constructing and installing’ domain (which represents a core area of construction activity in terms of number of skills), 23 of the skills are also mapped to the manufacturing sector.
Skills Domain | Total skills in the construction | Manufacturing | Professional, Scientific And Technical Activities | Water supply; sewerage, waste management and remediation activities | Other sectors1 |
|---|---|---|---|---|---|
Researching and analysing | 2 | 1 | 1 | 0 | 2 |
Designing and creating | 18 | 9 | 10 | 6 | 5 |
Planning and resourcing | 11 | 1 | 3 | 3 | 3 |
Constructing and installing | 106 | 23 | 1 | 3 | 13 |
Manufacturing and processing | 1 | 1 | 0 | 0 | 0 |
Operating and monitoring | 37 | 14 | 2 | 5 | 8 |
Planting and growing | 1 | 0 | 0 | 0 | 0 |
Advising and supporting | 8 | 1 | 2 | 3 | 1 |
Educating and training | 2 | 1 | 0 | 0 | 1 |
Evaluating and inspecting | 24 | 9 | 11 | 6 | 3 |
Managing and directing | 9 | 2 | 2 | 3 | 2 |
Communicating and performing | 1 | 0 | 0 | 1 | 0 |
Handling and transporting | 2 | 1 | 0 | 2 | 0 |
Maintaining and Repairing (physical objects) | 22 | 9 | 2 | 2 | 9 |
Cleaning and restoring | 2 | 0 | 0 | 1 | 0 |
Table 21: Cross-sectoral overlap of construction skills. Source: Standard skills classification (SSC). Own calculations
Notes: (1) Other sectors include: mining and quarrying, electricity, gas, steam and air conditioning supply, wholesale and retail trade; repair of motor vehicles and motorcycles, transportation and storage, accommodation and food service activities, information and communication, financial and insurance activities, real estate activities, administrative and support service activities, public administration and defence; compulsory social security, education, human health and social work activities, arts, entertainment and recreation, other service activities, activities of households as employers, activities of extraterritorial organisations and bodies.
The results indicate a considerable degree of skills overlap between the construction sector and other sectors in the economy, indicating strong potential for cross-sectoral labour mobility to support the net zero transition. Manufacturing emerges as a key source of transferable skills, with high levels of overlap in domains such as constructing and installing (23 skill out of 106 key skills), designing and creating (9 skills), operating and monitoring (14 skills), and evaluating and inspecting (9 skills). This indicates that workers in manufacturing may possess relevant technical and operational capabilities that could be redeployed to support construction‑related net zero activities.
There is also notable overlap with professional, scientific and technical activities, particularly in higher-level and analytical skill domains. For example, more than half of the skills in designing and creating (10 skills) and nearly half in evaluating and inspecting (11 skills) are shared with this sector.
Sectors such as water supply, sewerage, waste management and remediation activities also show meaningful overlap in specific domains, particularly in evaluating and inspecting (six key skills) and designing and creating (six skills).
Whilst these overlaps suggest potential for labour mobility, the extent to which workers can transition between sectors will depend on the availability of effective reskilling pathways. In practice, transitions across sectors may require additional qualifications, sector-specific experience, or certification requirements, which can limit the speed at which workers redeploy their skills. Industry norms and regulatory frameworks may also constrain mobility if they do not readily recognise transferable skills or alternative pathways into occupations. As a result, even where transferable skills exist, additional training and structured entry pathways may be needed to enable workers from related sectors to move into new roles.
Conclusion
This report assesses the workforce and skills needed as Scotland transitions to net zero in the construction and transport sectors. Using a technology-driven analytical framework, the study translates projected deployment of key net zero technologies into employment demand by sector, occupation and skill. The analysis draws on the Climate Change Committee’s Balanced Pathway scenario, alongside other evidence and modelling assumptions. It focuses on major transition activities such as renewable energy deployment, domestic retrofit, electric vehicle adoption and related infrastructure.
The results indicate that the net zero transition will generate sustained employment demand across both construction and transport-related activities. However, the timing and scale of this demand will vary between sectors. Demand is expected to start increasing in the late 2020s, with the greatest pressures emerging through the 2030s. This may leave a relatively short period to expand training and reskilling opportunities before demand peaks.
Construction employment demand is expected to increase rapidly in the early stages of the transition, driven by large-scale infrastructure deployment and domestic retrofit programmes. Demand is projected to peak in the mid‑2030s before gradually declining as major deployment phases are completed. However, employment is expected to remain above current levels, indicating a lasting increase in workforce demand. In transport-related activities, the transition is expected to change the type of jobs required rather than lead to substantial overall employment growth. Demand for roles linked to zero-emission technologies, including electric vehicle maintenance and charging infrastructure, is expected to increase steadily. Activities related to internal combustion engine technologies are expected to gradually decline.
The scale of this transition is substantial relative to current workforce capacity. Much of the adjustment is expected to occur through upskilling within existing roles. However, rising demand for technical occupations coincides with existing shortages in key areas, including electrical and mechanical skills. This suggests that current training provision may not be sufficient to meet future demand without further expansion.
Skilled trades are expected to account for the largest share of workforce demand across both sectors. In transport-related activities, key occupations include vehicle technicians, mechanics, electricians, electrical service and maintenance technicians, and welding trades. In construction, prominent occupations include carpenters and joiners, electricians and electrical fitters, plumbers and heating installers, painters and decorators, roofers, process and machine operatives, and professional roles such as civil engineers and construction project managers.
The analysis shows that many of the skills needed for the net zero transition already exist within the workforce, but will need to be adapted to new technologies and ways of working. Across both sectors, the most relevant skill areas include evaluating and inspecting, planning and resourcing, recording and documenting, and maintaining and repairing equipment. New skills will also be needed as electrification, digitalisation and low-carbon energy systems become more widely used. In transport, these include skills related to electric vehicle systems, battery technologies, digital diagnostics, and automated control systems. In construction, they include skills related to renewable energy systems, smart building technologies, and energy efficiency solutions – including the installation and maintenance of solar systems, and building energy management systems. Importantly, demand for these skills is expected to intensify over the 2030s, in line with peak deployment across both sectors. This highlights the need to align training provision with expected demand.
Finally, the analysis highlights substantial overlap between the occupations and skills required across construction and transport. Technical occupations such as electricians, engineering technicians, and telecommunications installers are required across both sectors and in other parts of the economy. This reflects the shared infrastructure and technologies that support the net zero transition. The overlap creates opportunities for workers to move between sectors, but could increase competition for people with similar technical skills.
References
Centre for Sustainable Road Freight. (2025). Towards Zero Emission HGV Infrastructure in Scotland: Phase 2 Report . Click or tap here to enter text.
Cardenas Rubio, J., Warhurst, C., Anderson, P., Jeisson, D., & Rubio, C. (2022). Green Jobs in Scotland: An inclusive approach to definition, measurement and analysis. https://warwick.ac.uk/fac/soc/ier
Cambridge Econometrics. (2025). MDM-E3 Annual Economic Forecast: Unpublished.
Cirillo, V., Fanti, L., Mina, A., & Ricci, A. (2023). The adoption of digital technologies: Investment, skills, work organisation. Structural Change and Economic Dynamics, 66, 89–105. https://doi.org/10.1016/j.strueco.2023.04.011
CITB. (2025). Construction Workforce Analysis Scotland 2025 – 2029. Retrieved from https://www.citb.co.uk/cwo/index.html
ClimateXChange. (2022). Clean Heat and Energy Efficiency Workforce Assessment. https://doi.org/10.7488/era/2524
ClimateXChange. (2024). Workforce and skills requirements in Scotland’s onshore wind industry. Retrieved from https://www.climatexchange.org.uk/projects/workforce-and-skills-requirements-in-scotlands-onshore-wind-industry/
ClimateXChange. (2024). Workforce and skills requirements in Scotland’s solar industry. Retrieved from https://www.climatexchange.org.uk/projects/workforce-and-skills-requirements-in-scotlands-solar-industry/
Department for Energy Security and Net Zero. (2021). Net Zero Strategy: Build Back Greener. In Gov.Uk (Issue October). https://www.gov.uk/government/publications/net-zero-strategy
Department for Transport. (2026). Consultation on a New Heavy Goods Vehicle CO₂ Emissions Regulatory Framework for the United Kingdom. https://assets.publishing.service.gov.uk/media/6983430d13622473b51ca9db/new_hgv_co2_emissions_regulatory_framework_for_UK.pdf
Energy and Climate Change Directorate. (2025). Just Transition: draft plan for transport in Scotland: Annex B. In https://www.gov.scot/publications/ecosystem-restoration-code-engagement-paper/. https://www.gov.scot/publications/transition-draft-transition-plan-transport-scotland/
HIE. (2025). Regional Transformational Opportunities in the Highlands and Islands. Retrieved from https://www.hie.co.uk/media/kr3jjbdf/regional-transformational-opportunities-in-the-highlands-and-islands-report-may-2025.pdf
OECD (2022), Skills for the Digital Transition: Assessing Recent Trends Using Big Data, OECD Publishing, Paris,
https://doi.org/10.1787/38c36777-en.
Optimat. (2021). Skills for low carbon Heavy Duty Vehicles. Retrieved from https://www.transport.gov.scot/media/50464/skills-for-low-carbon-hdvs-pdf.pdf
Optimat. (2023). Skills for transport decarbonisation.
Scottish Enterprise. (2024). Economic Impact Scenarios for Scotland’s Energy Transition. Retrieved from https://www.scottish-enterprise.com/media/1ykbucca/the-economic-impact-of-scotlands-energy-transition.pdf
Skill Development Scotland. (2024). Sectoral Skills Assessments. Construction. Retrieved from https://www.skillsdevelopmentscotland.co.uk/media/rleiealf/sectoral-skills-assessment-construction.pdf
Skills Development Scotland. (2020). Climate Emergency. Skills Action Plan 2020-2025 Key Issues And Priority Actions.
Skills Development Scotland. (2023). CESAP Pathfinder. A Dynamic Skills Response to Supporting the Transition to Net Zero. Work Package 1: An Evidence Based Approach to Supporting the Transition to Net Zero. Retrieved from https://www.skillsdevelopmentscotland.co.uk/media/5hcorb5t/cesap-pathfinder-wp1-report.pdf
Skills Development Scotland. (2024). Climate Emergency Skills Action Plan (CESAP) Pathfinder. Final Project Report. Work Package 2. Retrieved from https://www.skillsdevelopmentscotland.co.uk/media/ucmjsq3y/cesap-wp2-final-report.pdf
Appendices
SOC 2020 definitions
The SOC 2020 (Standard Occupational Classification 2020) is the UK’s official system for classifying occupations based on the type of work performed and the skills required. It groups jobs into a hierarchical structure of major, sub-major, minor, and unit groups, enabling consistent analysis and comparison of occupational data across labour market statistics, surveys, and policy research (see Table 22).
Major occupational group | Description |
|---|---|
| This major group covers occupations whose tasks consist of planning, directing and coordinating resources to achieve the efficient functioning of organisations and businesses. Working proprietors in small businesses are included, although allocated to separate minor groups within the major group. Most occupations in this major group will require a significant amount of knowledge and experience of the production processes, administrative procedures or service requirements associated with the efficient functioning of organisations and businesses. |
|
This major group covers occupations whose main tasks require a high level of knowledge and experience in the natural sciences, engineering, life sciences, social sciences, humanities and related fields. The main tasks consist of the practical application of an extensive body of theoretical knowledge, increasing the stock of knowledge by means of research and communicating such knowledge by teaching methods and other means.
|
|
This major group covers occupations whose main tasks require experience and knowledge of principles and practices necessary to assume operational responsibility and to give technical support to Professionals and to Managers, Directors and Senior Officials.
|
|
Occupations within this major group undertake general administrative, clerical and secretarial work, and perform a variety of specialist client-orientated administrative duties. The main tasks involve retrieving, updating, classifying and distributing documents, correspondence and other records held electronically and in storage files; typing, word‑processing and otherwise preparing documents; operating other office and business machinery; receiving and directing telephone calls to an organisation; and routing information through organisations.
|
|
This major group covers occupations whose tasks involve the performance of complex physical duties that normally require a degree of initiative, manual dexterity and other practical skills. The main tasks of these occupations require experience with, and understanding of, the work situation, the materials worked with and the requirements of the structures, machinery and other items produced.
|
|
This major group covers occupations whose tasks involve the provision of a service to customers, whether in a public protective or personal care capacity. The main tasks associated with these occupations involve the care of the sick, the elderly and infirm; the care and supervision of children; the care of animals; and the provision of travel, personal care and hygiene services.
|
|
This major group covers occupations whose tasks require the knowledge and experience necessary to sell goods and services, accept payment in respect of sales, replenish stocks of goods in stores, provide information to potential clients and additional services to customers after the point of sale. The main tasks involve knowledge of sales techniques, a degree of knowledge regarding the product or service being sold, familiarity with cash and credit handling procedures and a certain amount of record keeping associated with those tasks.
|
|
This major group covers occupations whose main tasks require the knowledge and experience necessary to operate and monitor industrial plant and equipment; to assemble products from component parts according to strict rules and procedures and to subject assembled parts to routine tests; and to drive and assist in the operation of various transport vehicles and other mobile machinery.
|
|
This major group covers occupations which require the knowledge and experience necessary to perform mostly routine tasks, often involving the use of simple hand-held tools and, in some cases, requiring a degree of physical effort.
|
Table 22: Standard Occupational Classification (SOC)
Source: ONS
The Structure of the UK Standard Skills Classification (SSC)
The SSC is structured as a hierarchical framework covering 3,343 individual skills needed to perform specific job tasks competently. Each occupational skill is connected to a range of tasks and core skills, where core skills represent broader, transferable capabilities that underpin effective task performance (see Figure 5).
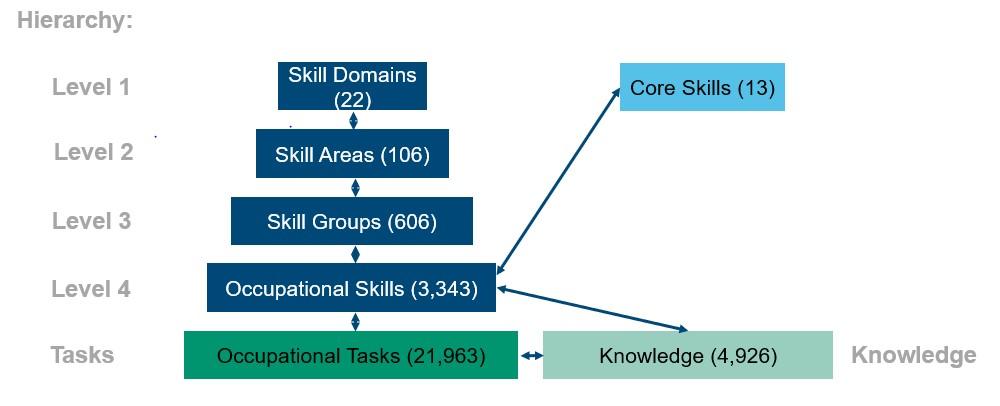
Figure 5: Structure of the Skills Standard Classification
Source: Department for Work and Pensions (DWP) – Skills England
How to cite this publication:
Patel, S. et al. (2026) ‘Workforce requirements for net zero in transport and construction’, ClimateXChange. DOI https://doi.org/10.7488/era/7189
© The University of Edinburgh, 2026
Prepared by Cambridge Econometrics on behalf of ClimateXChange, The University of Edinburgh. All rights reserved.
While every effort is made to ensure the information in this report is accurate as at the date of the report, no legal responsibility is accepted for any errors, omissions or misleading statements. The views expressed represent those of the author(s), and do not necessarily represent those of the host institutions or funders.
This work was supported by the Rural and Environment Science and Analytical Services Division of the Scottish Government (CoE – CXC).
ClimateXChange
Edinburgh Climate Change Institute
High School Yards
Edinburgh EH1 1LZ
+44 (0) 131 651 4783
If you require the report in an alternative format such as a Word document, please contact info@climatexchange.org.uk or 0131 651 4783.
Including vehicle and equipment repair and maintenance. ↑
Loft insulation is modelled as a one-off energy efficiency measure with a 40-year lifetime. The CCC assumes that most eligible homes receive loft insulation during the late 2020s and early 2030s, after which little additional deployment is required. As a result, data for this measure may show no further growth or may be absent in later years. ↑
At the time of reporting, the data referred to charge points. However, following a UK-wide methodology change introduced by the Department for Transport (DfT) and Zapmap on 26 February 2026, the headline metric now counts “EV chargers” instead. As some charge points, particularly rapid and ultra-rapid, can charge more than one vehicle simultaneously, this new measure better reflects overall network capacity and aligns with international standards. The Scottish Government is currently reviewing the implications of this change. ↑
It should be noted that these estimates are based on technical labour requirements and may not fully capture factors such as downtime, training, administrative tasks, and other non-operational activities, which could lead to an underestimation of total workforce needs. ↑
https://www.gov.uk/government/publications/uk-standard-skills-classification-interim-development-report/the-uk-standard-skills-classification ↑
This approach is applied across all vehicle types in the pipeline, including heavy goods vehicles and buses. However, the spatial allocation is based on EV registration patterns, which are largely driven by cars and light vans. As a result, the geographic distribution of HGV and bus activity is approximated using these patterns and may not fully reflect their distinct operational and infrastructure requirements. ↑
Green jobs are occupations affected by the greening of the economy and may take the form of new and emerging roles, existing jobs requiring substantial changes in tasks and skills, or occupations experiencing rising demand (Cardenas Rubio et al., 2022) ↑
This definition captures the number of people working in occupations potentially affected by the greening of the economy. It includes both existing occupations that may undergo transformation due to the green transition and newly emerging occupations (often referred to as pure green jobs). Importantly, not all workers within these occupations necessarily carry out green-related activities. ↑
Cambridge Econometrics (CE) develops annual economic forecasts for all twelve nations and regions (Wales, Scotland and Northern Ireland, and the nine regions of England) in the UK. The forecasts are developed using CE’s Multi‑Sectoral Dynamic Model (MDM-E3) of the UK economy. ↑
This category includes roles such as complain handler, helpdesk operator, etc. ↑
In the SSC, skill domains represent broad groupings of related skills, capturing the main types of activities performed within occupations. Each domain contains several more detailed skill areas, which describe specific capabilities required to perform particular tasks. Identifying the most relevant domains, therefore, provides an overview of the types of capabilities most strongly associated with the projected employment demand, before examining the more detailed skill areas within each domain. ↑