

Monitoring a just transition to a net zero and climate resilient Scotland
Research completed March 2026
DOI: https://doi.org/10.7488/era/7089
Executive summary
Background and aims
The Scottish Government has made successive commitments to delivering a just transition to a net zero and climate resilient Scotland. As part of this, it is important to understand, as far as is practicable, the extent to which transition processes and outcomes are just. Recent years have seen proactive efforts by the Scottish Government and others to develop monitoring and evaluation (M&E) frameworks for a just transition in Scotland. These made progress but the Scottish Government found they were not yet ready to be implemented in practice.
ClimateXChange commissioned this research on behalf of the Scottish Government to deliver a proposal for a just transition M&E framework that prioritises rigour and practical applicability. The project was led by the University of Edinburgh and delivered by a ClimateXChange Research Fellow embedded in the Scottish Government.
This report is independent: it is not Scottish Government policy, nor does it reflect Scottish Government policy positions.
Results – The framework
This project developed an M&E framework for a just transition to a net zero and climate resilient Scotland, informed by a Theory of Change approach. The proposed framework is made up of four outcomes, each with a set of indicators (number of indicators in parentheses):
- Communities and Places (12),
- People and Equity (13),
- Jobs, Skills and Economic Opportunities (17),
- Environment and Biodiversity (8).
There are 50 outcome indicators in total. The framework also identifies 15 summary indicators which are selected from the 50 outcome indicators. These are intended to provide a high-level overview of progress that can be more easily communicated than the full indicator set.
Figure 1 provides an overview of outcome indicators in the M&E framework. These are categorised by outcome, target population, summary indicators and data availability. Some of the proposed indicators cannot be monitored with existing data.
In addition to outcome indicators, this framework proposes a set of 23 indicators for monitoring key sites of transition, or ‘hotspots’. Hotspots are defined as places directly impacted by industrial change or by net zero developments. This project also examines possible anticipatory approaches for early warning identification and monitoring of hotspots, transition risks and opportunities.
Stakeholder engagement is identified as fundamental for just transition M&E. It is presented as a tool for qualitative data collection, an approach for monitoring and indicator interpretation, a real-time tool for risk mitigation and a method for the anticipation of potential transitions.
Framework limitations
- Data availability, timeliness and scale: There are data gaps for some key just transition concerns. Data availability, quality and coverage also vary at local, regional and national scale. In addition, they do not always match the scale of concern (e.g., local authority data does not represent the sub-local authority Grangemouth and Falkirk towns). Most indicators are published with a time delay and will not reflect transition impacts in real time.
- Framework structure, design and development: This project provides a detailed approach to monitoring a just transition in Scotland and to interpreting outcome indicators. Further work is needed to support evaluation of why a just transition is / is not being achieved.
- The proposed M&E framework emphasises the essential role of regular stakeholder engagement to inform all dimensions of M&E. Effective stakeholder engagement in resource constrained contexts can be challenging and may limit implementation.
Recommendations for just transition M&E
- Start now: test and refine the proposed approach through data collection and indicator interpretation across outcome and hotspot indicators. This will enable an assessment of the practical applicability of the framework and its ability to capture just transition concerns in the Scottish context.
- Identify the conditions necessary for just transition delivery and develop approaches to evaluation. This will include attention to issues of governance, responsibility and policy responsiveness to just transition M&E.
- Develop qualitative engagement tools and analytical approaches as part of just transition M&E, to support the identification of transition risks, indicator interpretation and evaluation.
- Implement more integrated approaches to data collation and sharing across Scottish Government and with external stakeholders.
- Fill critical data gaps, including but not limited to (i) workforce transitions in high emitting sectors, (ii) business vulnerability and adaptation to climate change and net zero, (iii) household vulnerability and resilience to climate change and (iv) land use change implications for a just transition.
- Test and refine anticipatory uses of just transition M&E to identify and monitor sites of transition before transitions are underway. This can support the anticipation of risks and opportunities and inform responsive policymaking.
- Use M&E to improve communication with external stakeholders about transition efforts towards net zero and climate resilience, including successes and challenges. Consider the use of data management and visualisation tools such as dashboards, websites and reports for data management, communication and reporting.
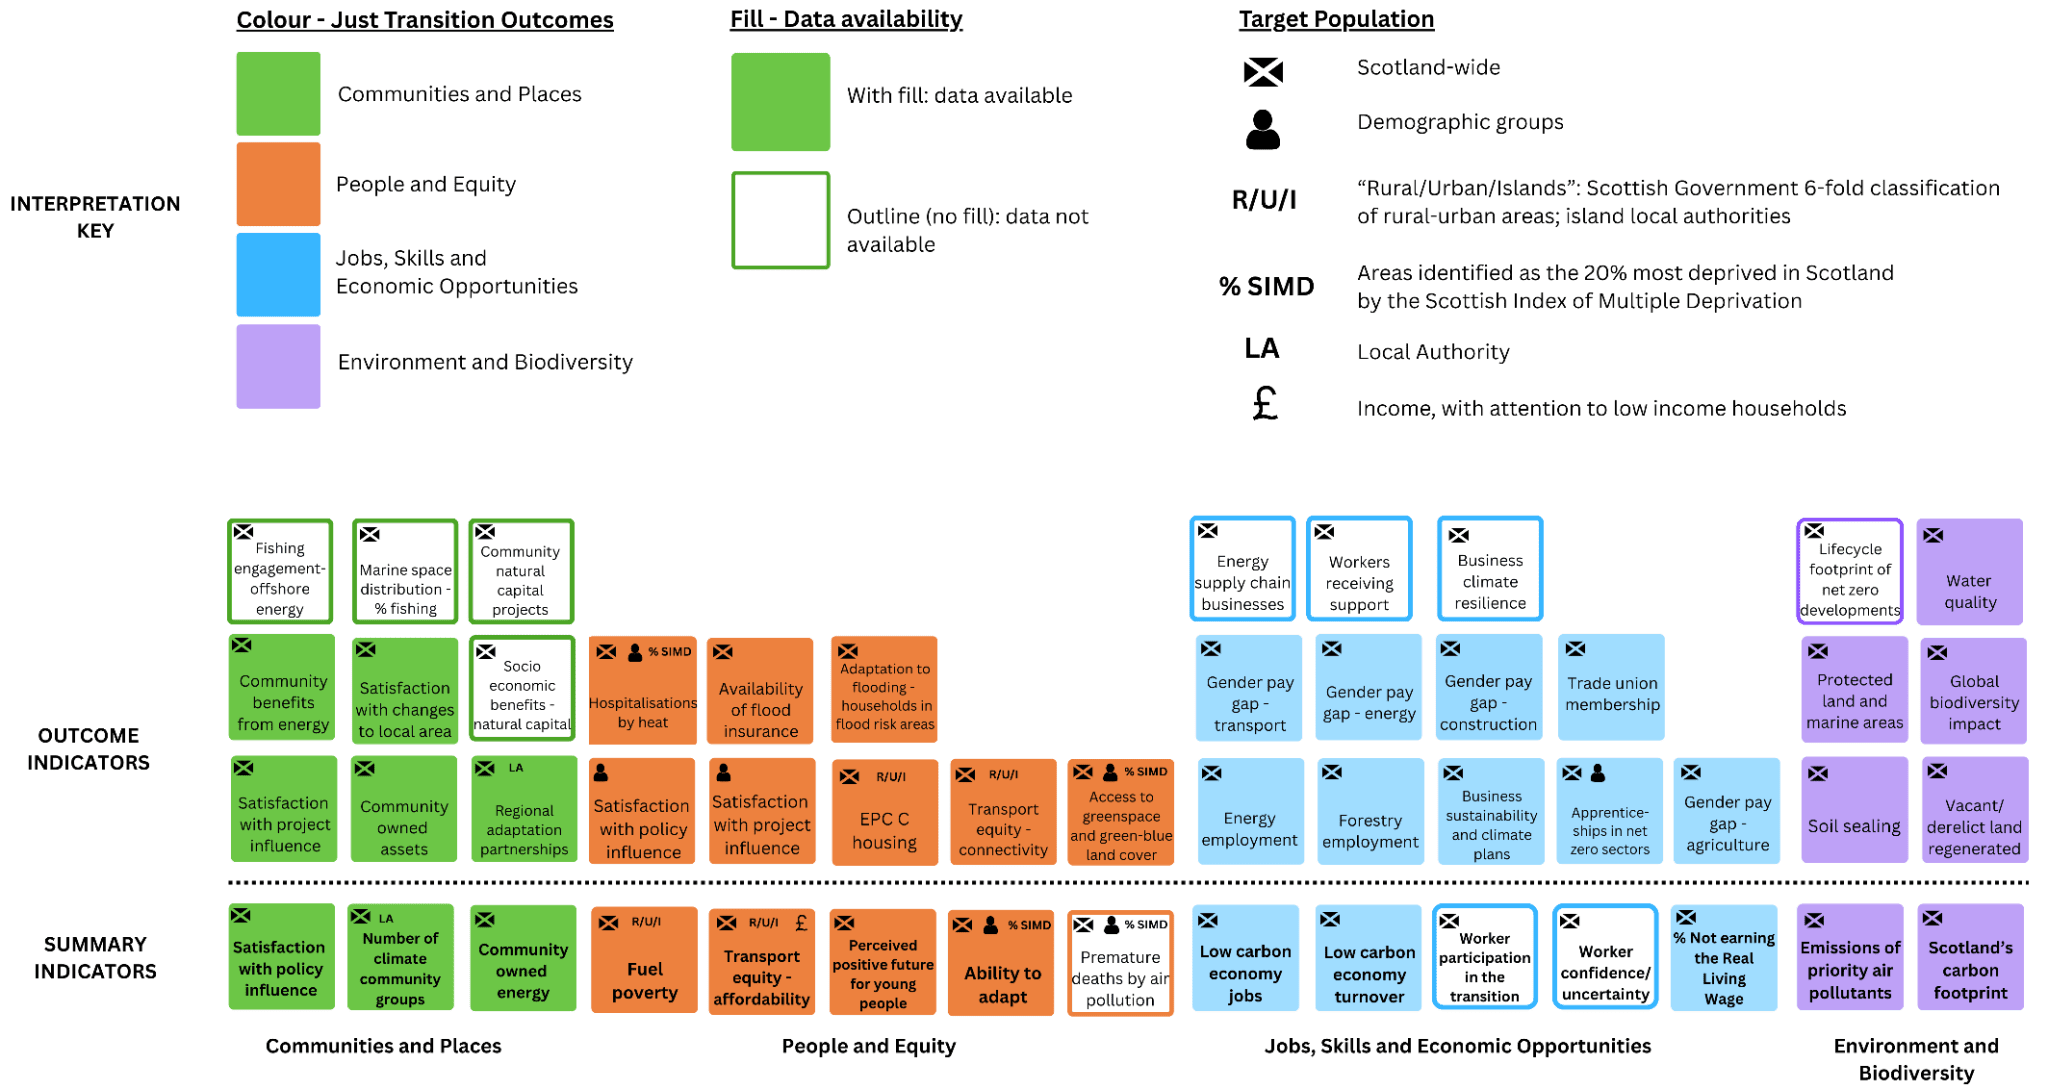
Figure 1. Outcome indicators in the just transition M&E framework. Categorised by outcome, target population, summary indicators and data availability.
Glossary
|
Just Transition |
“For the Scottish Government a just transition means becoming a net zero, climate resilient economy in a fair way that seeks to tackle inequality and injustice. Just transition is about both the outcome – a fairer, greener future for all – and the way we get there in partnership with those most likely to be impacted by the change.” (Scottish Government, 2026a, p.32) |
|
Net zero |
“A situation in which any greenhouse gas emissions put into the atmosphere are balanced out by the greenhouse gases removed from the atmosphere, so that the “net” effect is zero emissions. Scotland has committed to ‘net zero’ emissions by 2045.” (Scottish Government, 2026a, p.33) |
|
Climate resilience |
In this report, climate resilience refers to the results of adapting to a changing climate. “Adaptation to climate change involves the deliberate and systematic adjustment of systems and processes to effectively address both anticipated and actual climate change impacts.” (Scottish Government, 2026a p.32) |
|
Hotspots |
Sites of transition identified on the following basis:
|
|
Monitoring and evaluation |
A practice by which responsible actors can track, measure and assess progress towards identified goals, while analysing the degree to which implemented actions supported the delivery of said goals. |
|
Indicator |
An indicator is a specific, measurable variable which can be monitored over time, often to show trends. An indicator should support assessment of progress towards achieving overall aims. Indicators can be qualitative or quantitative and may be tracked at different timeframes (e.g. annually, biannually, every 5 years). |
Abbreviations
|
CCC |
Climate Change Committee |
|
CCP |
Climate Change Plan |
|
EU |
European Union |
|
JT |
Just Transition |
|
JTC |
Just Transition Commission |
|
M&E |
Monitoring and Evaluation |
|
NSTA |
North Sea Transition Authority |
|
SEPA |
Scottish Environmental Protection Agency |
|
SIMD |
Scottish Index of Multiple Deprivation |
|
STUC |
Scottish Trade Union Congress |
|
SNAP3 |
Scottish National Adaptation Plan 3 |
|
SPRI |
Scottish Pollutant Release Inventory |
|
ToC |
Theory of Change |
|
UK |
United Kingdom |
List of figures and tables
Figure 1. Structure and parts of the full Just Transition M&E framework. 12
Table 1: Methods used in the development of the JT M&E framework. 7
Table 2. Outcomes, M&E framework for a JT to a net zero and climate resilient Scotland. 13
Table 3: Summary indicators for the JT M&E framework. 18
Table 4: Communities and Places outcome for the JT M&E framework. 21
Table 5: People and Equity outcome for the JT M&E framework. 23
Table 6: Jobs, Skills and Economic Opportunities outcome for the JT M&E framework. 25
Table 7: Environment and Biodiversity outcome for the JT M&E framework. 27
Table 8: Hotspot indicators, by hotspot ‘type’ and data source. 36
Introduction
The Scottish Government has made successive commitments to integrating Just Transition (JT) into its policymaking processes and outcomes. JT principles were integrated into the Climate Change Act (Scottish Parliament, 2019) and the Just Transition Commission (JTC) was established with an independent scrutiny role. The Government also published a National JT Planning Framework (2021); draft sectoral JT plans for energy (Scottish Government, 2023), transport (Scottish Government, 2025a) and agriculture and land use (Scottish Government, 2025b); and the Grangemouth Industrial JT Plan (Scottish Government, 2025c). Most recently, JT indicators were included in the Climate Change Plan (CCP) published in March 2026 (Scottish Government, 2026b). The Government also committed support for a JT through the Just Transition Funds for Grangemouth and for the North East and Moray (Scottish Government, 2025c; Scottish Government, 2026c).
JT monitoring and evaluation (M&E) approaches remain in their infancy for various reasons. Defining what is captured within the scope of JT is challenging. In addition, there are difficulties in developing national-level frameworks which also reflect the experiences and needs across people and geographies. There are challenges around the temporal nature of the transition, including the ways in which responsibilities, costs and benefits are spread across generations. The transition to net zero and climate resilience also faces uncertain impacts and unintended consequences, including from unpredictable economic, geopolitical and climatic shocks. From a practical perspective, there are clear data weaknesses and gaps for JT monitoring in Scotland (e.g., Drabble et al. 2024). Finally, there are limited examples of applied frameworks for JT M&E worldwide.
Scotland is embarking on the transition to net zero and climate resilience from a baseline of inequality and existing, legacy injustices (Drabble et al. 2024). The cumulative impacts of climate change, climate adaptation and decarbonisation risk entrenching injustices and creating new ones. At the same time, the systems-wide net zero transition is also an opportunity to correct historical injustices while improving equity, wellbeing and justice in Scotland; goals aligned with the Scottish Government’s JT outcomes in the National JT Planning Framework (2021). It is essential that the Scottish Government can understand, as far as is practicable, how the transition is unfolding, and whether the associated processes and outcomes are just.
Recent years have seen proactive efforts to develop JT M&E approaches in Scotland. Research by the Just Transition Lab in Aberdeen and Aberdeenshire advanced understandings of place-based JT monitoring grounded in local priorities (Shapovalova et al. 2023). The second JTC published various place-based reports (e.g., in Shetland (Voar, 2024), Dumfries and Galloway (2025a) and Aberdeen and the North East (2025b)), showcasing the unique characteristics of net zero transitions in different parts of Scotland. The JTC also published a national JT Theory of Change (ToC) and M&E framework (Drabble et al. 2024). The latter was subsequently translated into the Grangemouth local context (Jenkins et al. 2025). While these works took JT M&E further and provided a broad overview of JT and M&E concerns, the Scottish Government found they were not yet ready to be implemented in practice.
This project was commissioned by ClimateXChange on behalf of the Scottish Government. The aim was to develop a rigorous and pragmatic JT M&E framework that could be made operational by the Scottish Government. As such, it builds on existing work and departs from it, informed by additional empirical stakeholder engagement and a review of the most recent evidence.
The project was led by the University of Edinburgh and delivered by an independent ClimateXChange Research Fellow embedded in the Scottish Government. This report sets out a proposed JT M&E framework and recommendations for JT M&E implementation for the Scottish Government. The report is independent: it not Scottish Government policy, nor does it reflect Scottish Government policy positions.
Conceptualising JT ‘Monitoring and Evaluation’
The term ‘Monitoring and Evaluation’ (M&E) encompasses a range of practices for tracking, measuring and assessing progress towards identified goals. M&E also analyses the degree to which implemented actions supported the delivery of those goals (HM Treasury, 2026; HM Treasury, 2020; Adindu, 2010; Estrella and Gaventa, 1998). The use of M&E frameworks is widespread, often to assess the impact of specific delivery programmes or interventions (e.g., Adindu, 2010).
A ‘JT’ is often not contained to a single policy or project and for some, is an overarching societal goal. Responsibilities and influence over a JT are spread across a variety of stakeholders and its achievement is often conditioned by a broader, shifting context. In this way, it can be comparable to the Sustainable Development Goals (United Nations, n.d.) or aspirational visions of national wellbeing, as reflected in Scotland’s National Performance Framework (currently archived and under revision) (Scottish Government, n.d.).
In Scotland, both Scottish Government policy (e.g., Scottish Government, 2021a) and JTC published reports (e.g., Just Transition Commission, 2024, 2025a, 2025b; Voar, 2024; Drabble et al. 2024; Jenkins et al. 2025) define the JT in expansive terms. This includes a spread of intersecting concerns including employment; community participation and empowerment; the distribution of benefits; industrial change and existing socio-economic inequalities, across scales and sectors. Further increasing complexity, the JT is characterised both as a “process” and “outcome” (Scottish Government, 2021a, p.5; e.g., Jenkins et al. 2025, p.27). So, a JT is as much about the just-ness of how the transition develops, as about the impacts it creates.
In the context of specific delivery programmes, policies or interventions, ‘monitoring’ is the “process of continuously tracking the progress and performance of an intervention, to provide data on whether it is being delivered as intended” (HM Treasury, 2026, p.72). It involves tracking specific data points over time that relate to the overall goal. The cross-cutting, multi-dimensional and multi-stakeholder nature of JT makes such an approach challenging. In the Scottish Government, many policy areas relate to, impact and condition JT delivery, from economic development through to poverty, agriculture, planning or technological development (e.g., Scottish Government, 2021a). Although there is a central JT Unit within the Scottish Government, there is no single, neatly bounded programme for JT delivery.
In a policy context, evaluation can be defined as: “a systematic assessment of the design, implementation and outcomes of an intervention. It involves understanding how an intervention is being, or has been, implemented and what effects it has, for whom and why” (HM Treasury, 2020, p.5). Evaluation is also broader, however, referring to “the process of judging or calculating the quality, importance, amount, or value of something” (Cambridge dictionary, n.d.). It is possible to evaluate what happened, how it happened and/or why it happened. These three types of evaluation are different, require different approaches and all apply in the context of assessing progress towards a JT.
This project understands ‘monitoring’ and ‘evaluation’ as interdependent practices necessary to comprehend the just-ness of the transition to net zero and climate resilience in Scotland. This interdependent approach underpins the conceptualisation and structure of the proposed JT M&E framework. Indicators were selected based on key, monitorable areas related to JT outcomes. Indicator selection was also underpinned by the framework’s evaluation objectives, based on a dual understanding of evaluation as assessing what is happening, and why. Said another way, the framework was designed to enable both an assessment of the just-ness of the transition, and an assessment of why particular impacts have come about.
The framework takes inspiration from ‘Theory of Change’ (ToC). In simple terms, ToC can be defined as “the hypothesis about the way that a program brings about its effects” (Dhillon and Vaca, 2018, p.65). ToC has been identified as a useful tool to design transformational social interventions (Simeone et al. 2023) and has been used by the Scottish Government to inform M&E frameworks for complex, multi-dimensional phenomena. Examples include the third Scottish National Adaptation Plan (SNAP3) M&E framework (Scottish Government, 2024a), and the Grangemouth Industrial JT Plan (Scottish Government, 2025c). Drabble et al. (2024) also used a ToC approach to inform their development of a JT M&E framework for Scotland.
ToC informed M&E frameworks often contain two key dimensions: outcomes and mechanisms. Outcomes are medium term goals, or ‘what success looks like’; while the mechanisms or enablers are the ‘conditions for success’ (Drabble et al. 2024, p. 42). Because mechanisms focus on the conditions for successful delivery of the outcomes, they can support evaluation of why progress is being made.
Drawing on ToC and the JT M&E framework developed by Drabble et al. (2024), the proposed M&E framework is designed to include both outcomes and mechanisms. Within this structure, this project has prioritised (a) outcome identification and refinement and (b) indicator development for monitoring. As currently developed, the framework therefore enables JT monitoring and supports evaluation of what is happening in relation to JT outcomes, but not how or why. The framework’s design enables the future integration of mechanisms to support evaluation of why JT progress is underway. This responds to the project specification to develop:
- High-level quantitative metrics for JT M&E in Scotland,
- Qualitative evaluation proposals to support indicator monitoring, including attention to place-based activity and the experiences of the most vulnerable to negative transition impacts, and
- A proposal for an integrated and practical approach to JT M&E that combines quantitative and qualitative approaches in a coherent theoretical framework.
Project methods and report structure
Methods
The methods used to inform the proposed M&E framework and related recommendations are summarised in Table 1.
|
Method |
Detail |
Purpose |
|---|---|---|
|
Policy review |
Including:
|
|
|
Literature review |
Including:
|
|
|
Semi-structured and unstructured interviews, exchanges |
With external stakeholders and public agencies (Appendix A):
Total: 16 |
|
|
Iterative engagement across Scottish Government areas |
Continuous, routine and ad hoc meetings and follow up discussions with team members across government areas. |
To support indicator development, data identification and recommendations drawing on cross-government expertise. |
|
Workshop |
In-person workshop with purposefully selected stakeholders and Scottish Government team members (held on the 17 November 2025). |
To support indicator identification and refinement across outcomes and attention to affected and vulnerable groups in the transition and climate change context. |
|
Internal sessions |
Internal sessions with Scottish Government team members responsible for the future direction and implementation of JT M&E (organised in February 2026). |
To increase JT M&E framework familiarisation within Scottish Government and inform reflections and recommendations on implementation in a policy context. |
Table 1: Methods used in the development of the JT M&E framework.
The Research Fellow was embedded within the Scottish Government Climate Change Analysis Team in close collaboration with members of the JT Unit. This enabled engagement across government teams, attendance at relevant internal webinars and workshops and direct involvement in discussions on a variety of relevant JT topics. It also informed the methods detailed in Table 1, including through access to support on policy and data identification, workshop design and facilitation, or iterative discussions on M&E framework development. A full list of interviewees, workshop attendees and areas engaged across the Scottish Government is included in Appendix A.
Report structure
Section 2 outlines the evidence reviewed, focusing on Scottish Government policy and JT M&E proposals across policy and academia worldwide. Section 3 presents the key findings from this research. Sections 3.1 and 3.2 detail the core of the proposed M&E framework including JT outcomes, indicator and data selection methods, and outcome indicators. Section 3.3 presents a ‘hotspot’ monitoring approach and indicators, integrating place-based JT M&E within a national M&E framework. It also proposes anticipatory approaches to monitoring as part of JT M&E. Section 3.4 includes detail on interpreting framework indicators. Section 4 sets out framework limitations and reflections on JT M&E. Section 5 presents a set of recommendations and concludes this report.
Evidence review
The Scottish Government published a National JT Planning Framework in 2021 (Scottish Government, 2021a). This included eight JT outcomes focused on empowering communities; skills development and fair work; addressing existing socio-economic inequality; supporting a strong and productive economy; supporting climate adaptation; protecting the environment; ensuring decarbonisation, and furthering human rights while avoiding the creation of new injustice (Scottish Government, 2021a, p.31). The Government also committed to developing sector-specific JT plans for four ‘net zero sectors’: energy (2023), transport (2025a), agriculture and land use (2025b) and buildings and construction (not yet published). In tandem, the Grangemouth Industrial JT Plan was published in 2025.
The National JT Planning Framework, draft sectoral JT plans and the Grangemouth Industrial JT Plan are structured differently and vary in detail and level of indicator development. The sectoral plans and Grangemouth industrial plan all refer to four themes which cluster JT concerns in Scotland: Communities and Places; People and Equity; Jobs Skills and Economic Opportunities, and Environment, Biodiversity and Adaptation[1][2].
In parallel, the second JTC has focused on JT M&E, including through recommendations in their Annual Report (2024) and in their final report in 2026 (Just Transition Commission, 2024, 2026a). They have published numerous JT M&E reports, including by Drabble et al. (2024) who developed a ToC for a JT in Scotland and a national JT M&E framework. The authors detailed JT priorities in the Scottish context, articulating both outcomes (what success looks like) and mechanisms (how to get there). They developed indicators, identified data sources and data gaps and provided a baseline assessment of indicator progress on a traffic light scale (improving – maintaining – declining).
The national JT M&E framework by Drabble et al. (2024) was translated into the Grangemouth local context by Jenkins et al. (2025). This reiterates the importance of place-specific transitions and accordingly, contextualised M&E. Shapovalova et al.’s (2023) work on monitoring a JT in Aberdeen and Aberdeenshire also focused on place-based transitions. Through stakeholder engagement, the authors identified four JT themes and an accompanying suite of indicators, which were analysed in relation to the local context.
The Scottish Government has also commissioned ClimateXChange projects to review and learn from the evolving JT M&E landscape and inform sectoral JT plans. These include a summary of existing approaches to JT M&E (Bergseng, 2023) and three reports by SYSTRA (2023a, 2023b, 2023c). The SYSTRA reports provide JT perspectives into sectoral areas of energy, transport and the built environment and construction.
Drawing boundaries around what is/ is not JT policy is an ongoing challenge. Climate change impacts and actions relating to the transition are cross-cutting issues, as are considerations of justice. Beyond explicit JT policy, there are various Scottish Government policy areas directly relevant to issues of JT. Illustrative examples of strategies and monitoring frameworks which overlap with JT considerations include: the National Performance Framework, the CCP (2026), the SNAP3 M&E framework (2024), the Public Engagement Strategy for Climate Change (Scottish Government, 2021b), the draft Environment Strategy (Scottish Government, 2025e), the Biodiversity Strategy M&E framework (Scottish Government, 2024b), the National Transport Strategy 2 (2020) and related M&E frameworks (Transport Scotland, 2021, 2022, 2024), the National Strategy for Economic Transformation (2022) and the Green Industrial Strategy (Scottish Government, 2024c).
Across Scottish Government JT policies, reports and related policy arenas, there is some convergence around ToC informed approaches to M&E. Most clearly, the Grangemouth Industrial JT Plan includes JT outcomes and ‘transition levers’ (the mechanisms), which capture ‘how the Just Transition will be delivered’ (Scottish Government, 2025c, p.11). In the space of climate adaptation, SNAP3’s M&E framework uses a ToC informed approach with outcomes, objectives and indicators, including a monitored annual baseline and identified climate adaptation ‘enablers’. The ToC has also been mobilised in JT M&E efforts beyond Scotland.
Beyond Scotland
Efforts to monitor and evaluate progress towards a JT are emerging worldwide. The diverse models reflect varying interpretations of the JT both conceptually and in a policy context. In the European Union (EU) context, for instance, JT M&E is proposed in relation to environmental policy (Heyen et al. 2021). The authors present a suite of output, result and impact indicators including measures linked to EU social domains and environmental impacts. More broadly, the EU defines ‘JT regions’ as carbon intensive regions currently supported by the Just Transition Fund (EU, 2024). This contrasts with the more expansive understanding of JT by the Scottish Government.
Kelly et al. (2025) developed a JT M&E approach for the Irish government based on JT ‘domains’. These are broadly sector-oriented (electricity; agriculture and land use; buildings; transport and connectivity, and environment) along with two cross-sectoral domains: skills and employment, and participation and community engagement. The sectoral approach echoes sectoral JT plans under development in Scotland. In Kelly et al. (2025), these are integrated into the core structure for a nation-wide JT monitoring framework for Ireland. The framework is funded by the Environment Protection Agency and sits in relation to environmental policy, as per the EU.
The Spanish Government’s understanding of JT is primarily focused on economic and employment aspects of the transition, alongside additional social concerns (Spanish Government, 2020). In addition, Spain takes an ‘at-risk area first’ approach to JT, which prioritises attention to declining coal and emissions-intensive dependent regions through the implementation of place-based ‘Just Transition Agreements’ (Spanish Government, 2020). From an M&E angle, Spain has been reporting on JT progress for circa five years. Their monitoring and reporting approach is output oriented and focuses primarily on whether policy commitments have been delivered (yes/no), and on data such as the amount of funds invested into different projects (Spanish Government, n.d.). There is lesser attention to Spain’s progress towards a JT overall from an outcome-oriented perspective. Their reports provide detailed, qualitative case studies about place-based ‘Just Transition Agreements’ implementation and delivery (Spanish Government, 2023).
Although not specifically a JT framework, the National Wellbeing Framework for Wales provides an applied example of monitoring multi-dimensional, complex phenomena on an outcome basis, as it has been reported against since 2017[3]. This framework is made up of seven high-level goals (or outcomes) and identifies a suite of 50 indicators which map across the different goals. In this framework, a single indicator may be used to monitor progress across various goals. From these 50 indicators, 16 are selected as milestone indicators to provide a high-level overview of how Wales is doing in relation to wellbeing goals (Welsh Government, 2022a, 2022b). The cross-cutting approach to indicator relevance, along with framework visualisations and reporting experience make this a useful example for JT M&E framework development.
The Taranaki region in New Zealand used a ToC approach to identify JT outcomes for a vision of Taranaki in 2050 (Venture Taranaki, 2020). This framework includes monitoring, causality analysis, policy tracking and evaluation. It is conceptualised in detail but appears at an early stage of implementation, with limited indicator development. Tarfa et al.’s (2024) Monitoring, Reporting and Verification framework for a Just and Gender Inclusive Transition in Nigeria also used a ToC approach. The authors present an overarching JT goal, a vision and eight high-level outcomes, the latter of which are broken down into actions, intermediate outcomes and ultimate outcomes. Indicators cover environmental dimensions like emissions or chemical spillage and pollution, and social dimensions ranging from positive community impacts, reducing social inequalities or the redistribution of oil and gas revenues to social projects.
The Monitoring, Evaluation and Learning framework for tracking a JT in South Africa (ICAT, 2024) is also grounded in a ToC. The authors include restorative justice, procedural justice and distributive justice as underpinning their understanding of JT. This framework incorporates enabling conditions, outputs, milestones and outcomes through which to reach overall JT impact. It identifies 54 priority indicators across these categories. Outcome indicators are focused on fossil fuel consumption, emissions reductions, training and employment creation, and participation measures, at times reporting at smaller geographical levels or by demographic groups.
Research by Oliver et al. (2025) into JT M&E in the Welsh context offers a different approach to ToC and outcome-based frameworks. Drawing on concepts of resilience and vulnerability, the authors identify what would affect a person’s ability to prepare for, respond to, benefit from, and recover from different climate change policies and scenarios. On this basis, they conceptualise a composite, weighted vulnerability index focused on vulnerability to climate change mitigation and rank Welsh local authorities accordingly.
JT M&E has also been explored in academia, often in collaboration with policy or industry. Examples include Htitich et al.’s (2024) methodology for developing a Just Transition Score tool in collaboration with the Social Progress Index, or Kelly et al.’s (2020) composite indicator to identify households at risk of energy poverty. From a policy development and evaluation perspective, Bird et al. (2024) developed a tool to assess ‘Just Energy Transition Plans’, while Kaljonen et al. (2024) set out an approach to combine policy mixes to support JT delivery. McCauley et al. (2023) suggested a JT ranking method through a suite of indicators which they related to theoretical justice tenets. Live, industry-based examples of JT monitoring include the World Wildlife Fund’s tool and scorecard to rank national JT plans (World Wildlife Fund, n.d.); the World Benchmarking Alliance’s JT Methodology (2025) which uses a ‘scoring and weighting’ approach that provides a very high-level numerical score on JT; or the Transition Plan Taskforce’s (2024) review of 13 existing disclosure frameworks that are relevant to transition planning and disclosures.
Summary
The evidence reviewed illustrates a variety of approaches, models and frameworks for JT M&E. These emphasise the use of overarching goals/aims/outcomes, and the different types of monitoring approaches available. Monitoring may be focused on outcome/impact, policy delivery or output tracking. Justice theory (e.g. Heyen et al. 2021; Kelly et al. 2025) and conceptual structures like the ToC explicitly and implicitly underpin several of the reviewed examples. Others, like Oliver et al. (2025), take a composite index approach instead.
Various sources highlight the importance of quality data gathering and indicator development (e.g. Kelly et al. 2025; Tarfa et al. 2024) along with attention to demographic data breakdowns and to the distributional implications of the transition (e.g. Hayen et al. 2021; Oliver et al. 2025; Kelly et al. 2025). The evidence also emphasises the value of M&E and reporting for communication with stakeholders (e.g., ICAT, 2024). In this vein, Kelly et al. (2025, p.25) also recommend the development of a dashboard as a ‘suitable destination framework for communicating and presenting indicators and trends’.
Various reports also refer to the dynamic nature of climate change and the transition. They emphasise the importance of reviewing JT M&E frameworks alongside broader contextual trends over time (e.g., ICAT, 2024). Reports also stress the importance of harnessing an M&E framework and tools for prospective analysis (Oliver et al. 2025), equipping JT M&E and policy with foresight – or anticipatory – capacity (Kelly et al. 2025). This includes anticipatory attention to key ‘at risk’ areas (e.g. Hayen et al. 2021; Spain, 2024; Lázaro Touza et al. 2025).
The Framework
The full structure of the proposed M&E framework (‘the framework’) is illustrated in Figure 1. The objectives of the framework, informed by the evidence, Scottish Government and stakeholder input are to:
- Monitor impacts of the transition across Scotland and provide a stocktake of how Scotland is doing from the perspective of justice,
- Support policy tracing and causality evaluation across mechanisms and policies, in relation to JT outcomes,
- Support anticipation of risks and opportunities of the transition before they happen, including in ‘hotspot’ areas,
- Through the three objectives detailed above, inform policy development,
- Communicate progress in relation to a JT, to (i) hold the government to account and (ii) improve communication of the impacts of the transition.
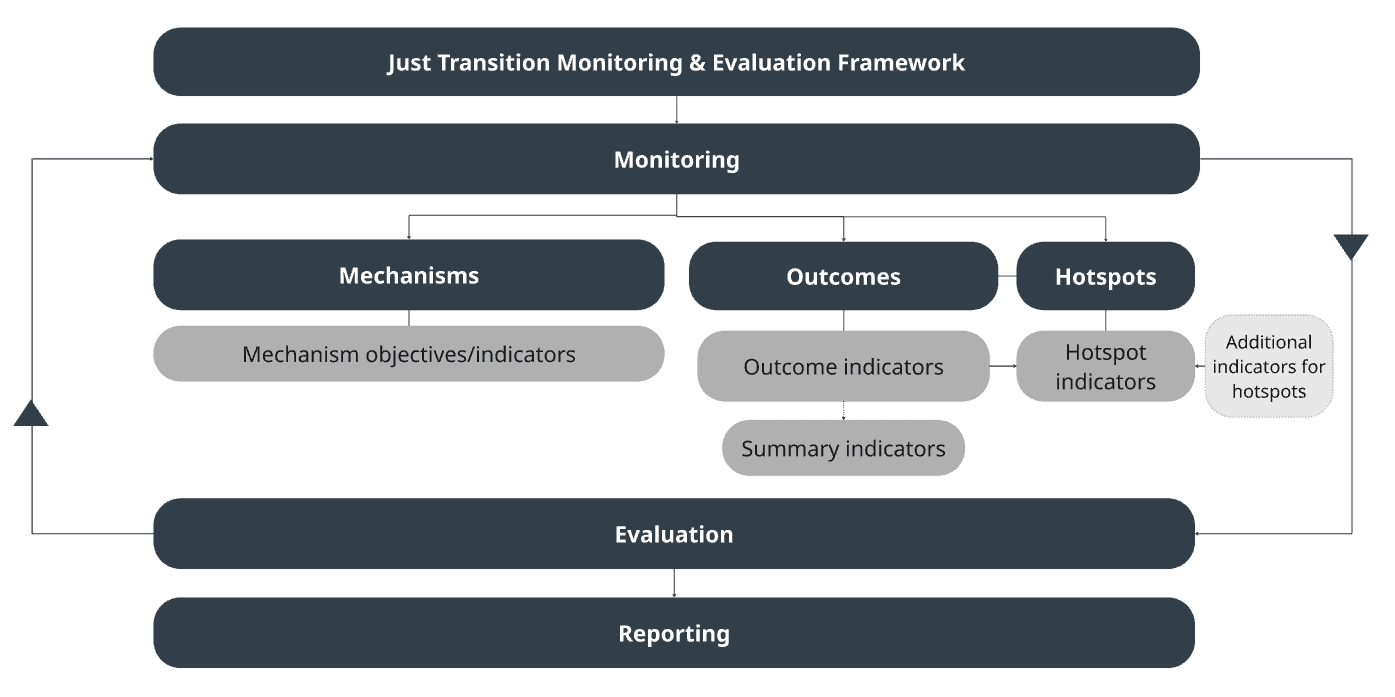
Figure 1. Structure and parts of the full Just Transition M&E framework.
As illustrated in Figure 1, the framework structure is informed by a ToC approach and includes both outcomes and mechanisms, as well as hotspots. Hotspots are defined as places directly impacted by industrial change or by net zero developments, further detailed in section 3.3.
The remainder of this section focuses on outcomes, hotspots and their indicators, as outlined in section 1.1. Section 3.1 details outcome development, followed by outcome indicators in 3.2. Section 3.3 presents the hotspots approach, anticipatory methodologies for hotspot identification and hotspot indicators, followed by recommendations for indicator interpretation in Section 3.4.
Outcomes
This project understands outcomes as ‘what success looks like’ or what characterises a JT in the Scottish context. Within JT policy in Scotland, the definitions and language surrounding JT (and JT M&E) have iteratively evolved since the publication of the National JT Framework in 2021. There have been varying definitions of what outcomes embody a JT in Scotland and for the Scottish Government, and there are arguably inconsistencies. The Scottish Government’s draft sectoral JT plans, for instance, do not refer to the eight outcomes in the National JT Framework (2021)[4]; and neither does the JT section within the CCP (2026). Draft sectoral JT plans, the Grangemouth Industrial JT Plan and the Draft CCP (2025) all refer to four themes: Communities and Places; People and Equity; Jobs, Skills and Economic Opportunities and Environment, Biodiversity and Adaptation. These themes are described as relating to, or grouping JT outcomes (e.g., Scottish Government, 2023; Scottish Government, 2025a)[5].
This project reviewed and mapped references to outcomes, outcome clusters, proxy outcomes, objectives, themes and priority areas (whichever way defined) within existing JT publications by the Scottish Government and in Drabble et al. (2024). Appendix B summarises the terminology and categorisations used in the documents reviewed. This highlighted clear convergence in JT policy and Drabble et al. (2024) around the four themes outlined above. On this basis, this project developed a refined set of four overarching outcomes characterising a JT to a net zero and climate resilient Scotland. These are named according to the four themes and are introduced in Table 2.
The four outcomes below synthesise the key JT areas of concern in Scotland. They were identified and refined based on the evidence review, stakeholder feedback and internal engagement with Scottish Government teams.
|
Outcomes |
|
Communities and Places: The transition to net zero and climate resilience increases agency, social cohesion and community wealth across Scotland through collaboration, empowerment and socio-economic benefit. |
|
People and Equity: The transition to net zero and climate resilience addresses existing inequalities across Scotland and avoids creating new ones, supporting a more equal society overall. |
|
Jobs, Skills and Economic Opportunities: Scotland ensures a managed transition away from high-emissions industries and practices and delivers a diversified, prosperous and climate resilient economy grounded in worker participation, fair work, skills development and thriving business. |
|
Environment and Biodiversity: Through the transition to net zero and climate resilience, Scotland acts within planetary boundaries and restores the natural environment for current and future generations of people and planet. |
Table 2. Outcomes, M&E framework for a JT to a net zero and climate resilient Scotland.
There is inevitable overlap across outcomes. In this framework they are positioned in relation to each other and with no hierarchy (Figure 2). At the same time, each outcome signifies a distinct focus area which enables the thematic grouping of certain indicators per outcome (for a similar approach, see Shapovalova et al. (2023)).
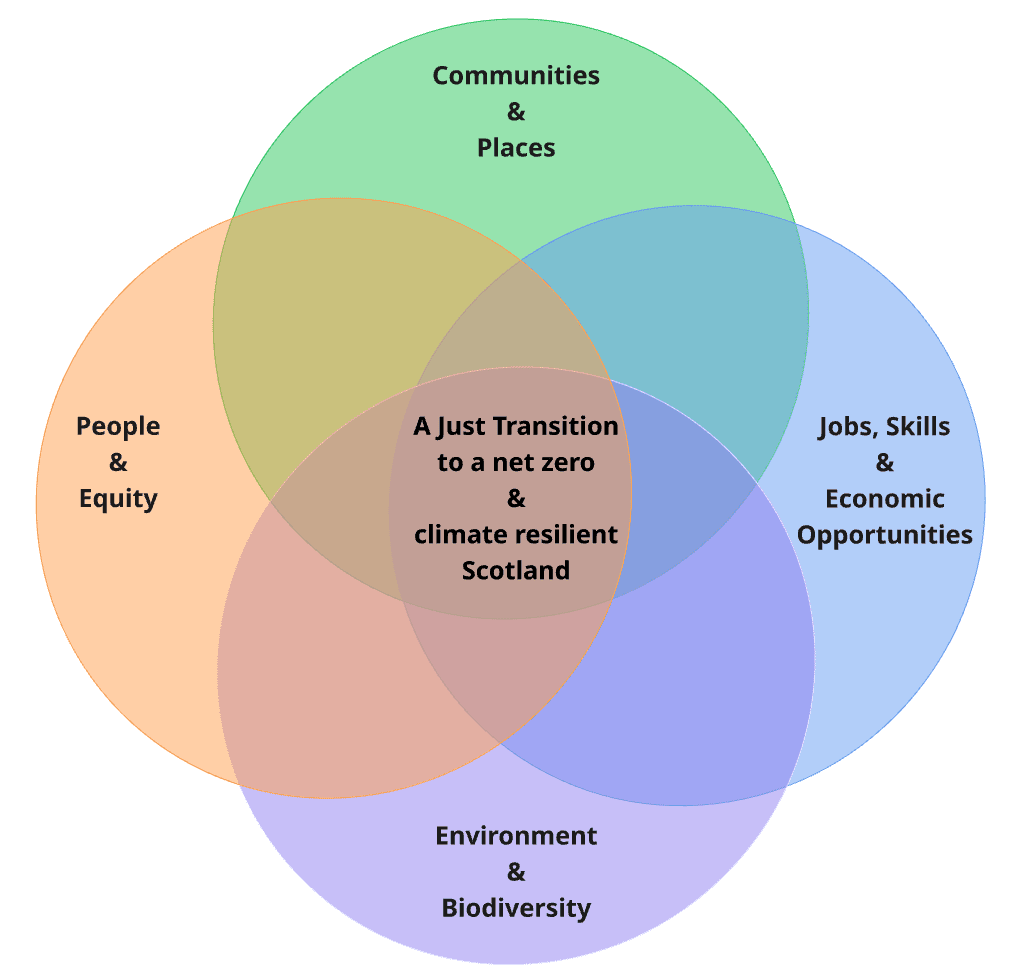
Figure 2. Visualisation of the four outcomes of a JT to a net zero and climate resilient Scotland.
Outcome indicators
Figure 3 provides a visual overview of proposed outcome indicators grouped by outcome, including their target populations for data monitoring. It also signposts the summary indicators (intended to provide a high-level overview of the transition), and identifies the indicators with no data currently available. The remainder of this section presents the indicator development approach followed by an overview of summary indicators and outcome indicators. Additional information on indicators including their desired trend, data timeframes and a quality assessment can be found in Appendix C.

Figure 3. Outcome indicators in the JT M&E framework. Categorised by outcome, target population, summary indicators and data availability.
Indicator development and data selection
Indicator selection was guided by the following priorities: conceptual rigour, relevance and representativeness of a JT in Scotland, data availability, timeliness and responsiveness to the project specification.
Drawing on the evidence review, outcomes were defined first. This established high level JT priorities in the Scottish context. A long list of indicators was developed from policy, reports and academic literature, with attention to their relevance across the four outcomes. This list was complemented with stakeholder input. The workshop and semi-structured interviews were specifically designed to focus on indicator development. To support discussions during these engagements, the four outcomes were sub-divided into descriptive focus areas (available in Appendix D). Informal conversations and meetings with external stakeholders and the Scottish Government further informed indicator development and data identification. The indicator long list was queried and refined to merge, move and remove indicators based on relevance and data availability[6]. Full indicator details and a quality assessment can be found in Appendix C. Further detail on the indicator selection process is available upon request.
The final list of indicators was also informed by data availability. The search for available data involved desk-based research and stakeholder engagement across government teams and with external stakeholders. Tables 1, 2 and 3 in Appendix A summarise the stakeholders and different government areas engaged throughout. Drawing on Taranaki Venture (2020) and SNAP3 (Scottish Government, 2024a), criteria influencing indicator development and data selection included:
- Relevance to the outcomes to be measured,
- Timeliness,
- Sample sizes for Scotland (when data is collected at UK scale),
- Possible breakdowns by socio-economic and geographic scales (where relevant),
- Data availability and accessibility.
Reporting for most indicators is recommended at a ‘Scotland-wide’ target population level. Additional target populations are included for some indicators based on an understanding of their relevance for specific geographies or groups. Target populations for data monitoring (relevant across all outcomes and indicator tables) include:
- Scotland-wide: Data for Scotland as a whole,
- Demographic groups: Age, sex, gender, ethnicity, disability, income (as relevant/ available per data source),
- Scottish Index of Multiple Deprivation (SIMD): By SIMD percentile (e.g., locations identified as the 20% most deprived areas of Scotland) (SIMD, 2020),
- 6-fold urban-rural classification and islands: Geographical data breakdown according to the Scottish Government’s Urban Rural Classification. This distinguishes between large urban areas, other urban areas, accessible small towns, remote small towns, accessible rural and remote rural areas (Scottish Government, 2024d). Alongside the rural-urban classification, this target population group includes monitoring islands separately,
- Local Authorities as relevant to the indicator.
Data identification and indicator refinement were undertaken simultaneously. Efforts focused on identifying indicators where data was readily available, to ensure the feasible implementation of the framework and avoid further delays to JT monitoring. The framework also includes some indicators for which data is currently not available, yet which cover key JT areas of concern. Possibilities for indicator refinement and data collection were also explored for these indicators, the details of which can be found in Appendix E.
Finally, indicators within the framework both draw on and at times, depart from existing Scottish Government JT M&E publications. Appendix F details the parallels and differences between this framework and in particular, JT indicators in the CCP (2026).
Summary indicators
The proposed 15 summary indicators provide a high-level overview of the just-ness of Scotland’s transition across the four JT outcomes. As a small set of indicators, they offer cross-cutting insight into the JT. This may also be useful at reporting stage and for JT communication with internal and external stakeholders.
Summary indicators are selected from across the four outcomes and should be reported on at a Scotland-wide level. Additional reporting by demographic groups is also recommended for three indicators in the list: those about policy influence, opportunities for young people in Scotland and about individuals’ ability to adapt to climate change. These three indicators are selected as proxies for issues of participation, recognition and distribution of impacts and opportunities across groups in Scotland, today and in the future. Table 3 sets out the proposed 15 summary indicators.
|
Outcome |
Summary Indicator (all reported on at Scotland-wide level) |
Target population |
|
Communities and Places: The transition to net zero and climate resilience increases agency, social cohesion and community wealth across Scotland through collaboration, empowerment and socio-economic benefit. |
Proportion of people in Scotland reporting satisfaction with opportunities to influence (i) the Scottish Government’s approach to delivering net zero, and (ii) local policy and planning decisions relating to net zero |
Demographic groups |
|
Number of community groups involved in climate action/sustainability activities, as recorded by the Climate Action Hubs (and case studies). | ||
|
Operational capacity of community and locally owned energy installations in Scotland. Include breakdown (i) by type of ownership (ii) by location and (iii) as a proportion of total renewable energy installed (that year/ overall). | ||
|
People and Equity: The transition to net zero and climate resilience addresses existing inequalities across Scotland and avoids creating new ones, supporting a more equal society overall. |
Percentage of dwellings in Fuel Poverty | |
|
Percentage of people reporting that they can afford their individual transport costs | ||
|
Proportion of people who agree that the transition to net zero and climate resilience will support a more positive future for young people and future generations in Scotland |
Demographic groups | |
|
Level of adaptation action being taken by people in Scotland |
Demographic groups | |
|
Premature deaths due to exposure to fine particulate matter (PM2.5) |
Demographic groups | |
|
Jobs Skills and Economic Opportunities: Scotland ensures a managed transition away from high-emissions industries and practices and delivers a diversified, prosperous and climate resilient economy grounded in worker participation, fair work, skills development and thriving business. |
Employment (full-time equivalent) in the low carbon and renewable energy economy (LCREE) in Scotland | |
|
Low Carbon and Renewable Energy Economy (LCREE) estimated direct and indirect turnover | ||
|
High emitting industry worker participation in decisions affecting them |
| |
|
Sense of uncertainty/ confidence in the transition amongst workers in high emitting industries | ||
|
Proportion (%) of employees earning less than the Real Living Wage | ||
|
Environment and Biodiversity: Through the transition to net zero and climate resilience, Scotland acts within planetary boundaries and restores the natural environment for current and future generations of people and planet. |
Emissions of the eight priority Air Quality pollutants (ammonia, carbon monoxide, nitrogen oxides, non-methane volatile organic compounds, particulate matter, sulphur dioxide and lead) for Scotland | |
|
Scotland’s carbon footprint expressed in million tonnes of carbon dioxide equivalent per year |
Table 3: Summary indicators for the JT M&E framework.
Communities and Places
Table 4 provides an overview of proposed indicators to monitor progress towards the Communities and Places (CP) outcome. This table includes indicator number, indicator, target population (which may include more than one population, indicated as ‘population #2, population #3’) and the data source. Indicators with no currently available data are clustered at the end of the table (CP 9-12). Summary indicators are marked with an asterisk in the CP column (e.g., CP1*). The same approach is used for all outcome tables presented in Sections 3.2.3 – 3.2.6.
|
Communities and Places (CP) | ||||
|
CP |
Indicator |
Population |
Population #2 |
Data source |
|
CP1* |
Proportion of people in Scotland reporting satisfaction with opportunities to influence (i) the Scottish Government’s approach to delivering net zero, and (ii) local policy and planning decisions relating to net zero |
Scotland-wide |
[Demographic group breakdown in P&E] |
Scottish Climate Survey (proposed addition from Autumn 2026) |
|
CP2 |
Proportion of people in Scotland reporting satisfaction with opportunities to influence net zero and climate adaptation developments happening in their local area |
Scotland-wide |
[Demographic group breakdown in P&E] |
Scottish Climate Survey (proposed addition from Autumn 2026) Ad hoc qualitative – with stakeholders |
|
CP3* |
Number of community groups involved in climate action/sustainability activities, as recorded by the Climate Action Hubs (and case studies) |
Scotland-wide |
Local Authorities (qualitative) |
Climate Action Hubs quarterly reporting to Scottish Government Qualitative – with community action stakeholders |
|
CP4 |
Geographical coverage of regional adaptation collaborations [once full coverage, updates on implementation] |
Scotland-wide |
Local Authorities not involved in adaptation partnerships |
Adaptation Scotland reporting to Scottish Government |
|
CP5 |
The proportion of people reporting that changes to their local place due to net zero infrastructure and/or land use change[7] have maintained or improved the quality of their local area |
Scotland-wide |
|
Scottish Climate Survey (proposed addition from Autumn 2026) |
|
CP6 |
Area of community assets (in hectares) |
Scotland-wide |
| |
|
CP7* |
Operational capacity of community and locally owned energy installations in Scotland. Include breakdown (i) by type of ownership (ii) by location and (iii) as a proportion of total renewable energy installed (that year/ overall) |
Scotland-wide | ||
|
CP8 |
Average value of community benefits committed from renewable energy projects commissioned in the last 36 months, where a community or developer form is attached to a project |
Scotland-wide |
| |
|
Indicators with no currently available data |
Population |
Population #2 |
Suggested method/ data source for collection | |
|
CP9 |
Engagement experiences of the fishing sector with offshore energy developments |
Scotland-wide |
|
Qualitative engagement with key stakeholder groups e.g., Regional Inshore Fisheries Group and existing forums. |
|
CP10 |
Distribution of marine space across activities, including % available for fishing |
Scotland-wide |
| |
|
CP11 |
Number of woodland creation projects registered with the Woodland Carbon Code (WCC) and peatland restoration projects registered with the Peatland Code (PC) owned by community groups and small landholdings; and as a % of total registered projects |
Scotland-wide |
|
UK Woodland Carbon Code registry Case studies – qualitative engagement with stakeholders e.g., Scottish Forestry, Peatland Action, Community Land Scotland. |
|
CP12 |
Socio-economic benefits from woodland creation and peatland restoration |
Scotland-wide |
|
Qualitative engagement with key stakeholder groups e.g., Community Land Scotland, Scottish Forestry, Peatland Action, Scottish Land Commission, and with projects under development. The WCC has a benefits self-reporting tool from which data may also be available for the Scottish Government. |
Table 4: Communities and Places outcome for the JT M&E framework.
People and Equity
Table 5 provides an overview of proposed indicators to monitor progress towards the People and Equity (PE) outcome. Earlier versions of the framework included absolute poverty, relative poverty and the GINI coefficient as indicators within this outcome (in keeping with Drabble et al. (2024) and the JTC’s Annual Report (2024)). Following discussions with Scottish Government analysts, these were removed from any one outcome. Instead, they are identified as high level, contextual trends against which to analyse JT progress across all four outcomes. Further detail on the value of using poverty and inequality data as contextual trends for indicator interpretation is provided in Section 3.4.2.
|
People and Equity | |||||
|
PE |
Indicator |
Population |
Population #2 |
Population #3 |
Data source |
|
PE1* |
Proportion of people in Scotland reporting satisfaction with opportunities to influence (i) the Scottish Government’s approach to delivering net zero, and (ii) local policy and planning decisions relating to net zero |
Demographic groups |
|
|
Scottish Climate Survey (proposed addition from Autumn 2026) |
|
PE2 |
Proportion of people in Scotland reporting satisfaction with opportunities to influence net zero and climate adaptation developments happening in their local area. Include breakdown by (a) ocean and (b) land projects |
Demographic groups |
|
|
Scottish Climate Survey (proposed addition from Autumn 2026) Ad hoc qualitative engagement with sectoral stakeholders |
|
PE3* |
Percentage of dwellings in Fuel Poverty |
Scotland-wide |
(ii) 6-fold rural/urban (iii) Island local authorities |
|
Scottish House Condition Survey |
|
PE4 |
Housing with EPC C or above across housing/tenure types |
Scotland-wide |
(ii) 6-fold rural/urban |
| |
|
PE5* |
Percentage of people reporting that they can afford their individual transport costs |
Scotland-wide |
(ii) 6-fold rural/urban |
Income | |
|
PE6 |
Number of people reporting they do not use public transport (buses) due to connectivity issues |
Scotland-wide |
(ii) 6-fold rural/urban classification groups | ||
|
PE7 |
|
Scotland-wide |
Demographic groups |
SIMD percentile (if data is available) |
Ordnance Survey |
|
PE8* |
Proportion of people who agree that the transition to net zero and climate resilience will support a more positive future for young people and future generations in Scotland |
Scotland-wide |
|
|
Scottish Climate Survey (proposed addition from Autumn 2026) |
|
PE9* |
Level of adaptation action being taken by people in Scotland |
Scotland-wide |
Demographic groups |
SIMD percentile |
Scottish Climate Survey |
|
PE10 |
Hospitalisations by heat |
Scotland-wide |
Demographic groups (available by age and sex) |
SIMD percentile | |
|
PE11 |
Proportion of householders with prior flood claims who can receive quotes from 5 or more insurers |
Scotland-wide |
Flood-Re | ||
|
PE12 |
Proportion of people living in a flood risk area who report an inability to implement flood risk measures |
Scotland-wide |
Scottish Climate Survey (proposed addition from Autumn 2026) | ||
|
Indicators with no currently available data |
Population |
Population #2 |
Population #3 |
Suggested method/ data source for collection | |
|
PE13* |
Premature deaths due to exposure to fine particulate matter (PM2.5) (number of premature deaths) |
Scotland-wide |
Demographic groups |
SIMD percentile |
Public Health Scotland |
Table 5: People and Equity outcome for the JT M&E framework.
Jobs, Skills and Economic Opportunities
Table 6 provides an overview of proposed indicators to monitor progress towards the Jobs, Skills and Economic Opportunities (JSEO) outcome. Indicators dependent on UK Sectoral Industrial Classification (SIC) codes may be subject to change and refinement following the revision of UK SIC codes currently underway (Office for National Statistics, 2026). This may result in new sectoral categorisations and sub-categories by activities directly related to ‘net zero’ (e.g., renewable energy) which could support targeted sectoral breakdowns for indicators such as JSEO8, “proportion [%] of employees earning less than the Real Living Wage”.
|
Jobs, Skills and Economic Opportunities | ||||
|
JSEO |
Indicator |
Population |
Population #2 |
Data source |
|
JSEO1* |
Employment (full-time equivalent) in the Low Carbon and Renewable Energy Economy (LCREE) in Scotland |
Scotland-wide |
| |
|
JSEO2 |
Total employment in Energy (including renewables) |
Scotland-wide |
| |
|
JSEO3 |
Employment in forestry and marginal employment changes from woodland creation |
Scotland-wide |
|
Scottish Forestry reporting to Scottish Government |
|
JSEO4* |
Low Carbon and Renewable Energy Economy (LCREE) estimated direct and indirect turnover |
Scotland-wide | ||
|
JSEO5 |
Businesses with 10+ employees with (i) a climate strategy (ii) biodiversity strategy (iii) publishing an annual sustainability report |
Scotland-wide |
|
Business Insights and Conditions Survey (Environment Wave) |
|
JSEO6 |
Number of people in Modern Apprenticeships reporting that their apprenticeship is in a ‘net zero or green sector’ (i) 3-month and (ii) 15-month after finishing |
Scotland-wide |
Demographic groups | |
|
JSEO7 |
Trade union membership density in Scotland |
Scotland-wide |
| |
|
JSEO8* |
Proportion (%) of employees earning less than the Real Living Wage |
Scotland-wide |
|
Annual Survey of hours and earnings |
|
JSEO9 |
The difference between male and female full-time hourly earnings in the transport sector[8]. [SIC H: Transportation and storage] |
Scotland-wide |
|
Annual Survey of hours and earnings |
|
JSEO10 |
The difference between male and female full-time hourly earnings in the energy sector. [SIC B: Mining and Quarrying; SIC D: Electricity, Gas, steam and air conditioning supply] |
Scotland-wide |
|
Annual Survey of hours and earnings |
|
JSEO11 |
The difference between male and female full-time hourly earnings in the construction sector. [SIC F: Construction] |
Scotland-wide |
|
Annual Survey of hours and earnings |
|
JSEO12 |
The difference between male and female full-time hourly earnings in the agriculture sector. [SIC A: Agriculture, forestry and fishing] |
Scotland-wide |
|
Annual Survey of hours and earnings |
|
Indicators with no currently available data |
Population |
Population #2 |
Suggested method/ data source for collection | |
|
JSEO13 |
Number of renewable energy supply chain businesses in Scotland Interim proxy: £ value of ScotWind projects committed to Scottish-based suppliers |
Scotland-wide |
|
Selected industry statistics for business based on pre-identified SIC code sectors. Proxy: Supply Chain Development Statements (accessed via Crown Estate Scotland) |
|
JSEO14 |
Business resilience and ability to adapt to climate change and the transition Interim proxy (in CCP 2026): Proportion of small businesses in Scotland reporting the level of energy prices as an obstacle |
Scotland-wide |
N/A | |
|
JSEO15 |
Number of workers experiencing redundancy in high emitting industries in Scotland receiving support/ reporting that their employers are implementing transition plans for workers |
Scotland-wide |
|
Survey and qualitative engagement with key stakeholders. |
|
JSEO16* |
High emitting industry worker participation in decisions affecting them |
Scotland-wide |
|
Survey and qualitative engagement with key stakeholders. |
|
JSEO17* |
Sense of uncertainty/ confidence in the transition amongst workers in high emitting industries |
Scotland-wide |
|
Survey and qualitative engagement with key stakeholders. |
Table 6: Jobs, Skills and Economic Opportunities outcome for the JT M&E framework.
Environment and Biodiversity
Table 7 provides an overview of proposed indicators to monitor progress towards the Environment and Biodiversity (EB) outcome.
|
Environment and Biodiversity | |||
|
EB |
Indicator |
Population |
Data source |
|
EB1* |
Emissions of the eight priority Air Quality pollutants (ammonia, carbon monoxide, nitrogen oxides, non-methane volatile organic compounds, particulate matter, sulphur dioxide and lead) for Scotland and by industrial sector |
Scotland-wide |
National Atmospheric Emissions Inventory |
|
EB2 |
Improvements to water quality across types in Scotland |
Scotland-wide |
SEPA – Aquatic classification and water classification hub |
|
EB3* |
Scotland’s carbon footprint expressed in million tonnes of carbon dioxide equivalent per year |
Scotland-wide | |
|
EB4 |
Global biodiversity impact (Measures the effect of Scotland’s resource use on biodiversity domestically and abroad) |
Scotland-wide | |
|
EB5 |
Soil sealing |
Scotland-wide | |
|
EB6 |
Regeneration of vacant / derelict urban land (% of which is regenerated through environmental restoration, for climate adaptation and by net zero initiatives) |
Scotland-wide |
Scottish Land Commission/SEPA, qualitative engagement with energy developers. |
|
EB7 |
Number of hectares of newly protected land and marine features across Scotland |
Scotland-wide | |
|
Indicators with no currently available data |
Population |
Suggested method/ data source for collection | |
|
EB8 |
Carbon and social footprint of materials used for net zero developments in Scotland Interim proxy: Carbon Intensity of Materials (Circular Economy Strategy (2026) (Scottish Government, 2026d): indicates whether a nation is consuming more sustainable alternatives, independent of trends in overall GHG impact. |
Scotland-wide |
Data not available. Developers increasingly conduct project lifecycle assessments during the planning process. This may be a starting point for data collection. Proxy: Material Flow Accounts |
Table 7: Environment and Biodiversity outcome for the JT M&E framework.
Monitoring local transitions: hotspot indicators and anticipating risk
In parallel to monitoring indicators for the four, high-level JT outcomes for Scotland, the proposed framework includes a focus on key locations identified as ‘sites of transition’, or transition ‘hotspots’. This is grounded in the inherently spatial nature of (in)justice (Bouzarovski and Simcock, 2017) and the recognised importance of contextualised, placed-based approaches to transitions (e.g., Jenkins et al. 2025; Shapovalova et al. 2023). The hotspots approach integrates attention to specific places experiencing change because of or influenced by[9] the net zero transition.
The definition of ‘hotspots’ as used throughout this report is as follows:
- Places reliant on a high-emitting industry and undergoing industrial change
- Places hosting net zero developments and their aggregated impacts
Some hotspots are already known, while others will need to be identified and may become hotspots over time. Examples of identified hotspots include Aberdeen City, Aberdeenshire and Grangemouth in Falkirk from the perspective of industrial change. Shetland, Dumfries and Galloway or Caithness in the Highland Council are examples of hotspots hosting significant net zero developments (e.g. Voar, 2024; Equitable Energy, 2025; Mountain, 2024; Just Transition Commission, 2025). Two additional hotspot criteria have been identified but remain underdeveloped in this report: (i) places of legacy unjust transitions and aggregated effects and (ii) places facing high levels of climate change risk.
Alongside the importance of place-based transition monitoring, there is growing attention to the need for future-facing, anticipatory approaches to justice (e.g. Santos Ayllón et al. 2025; Trueworthy et al. 2024; Rodhouse et al. 2024). This was also mentioned by stakeholders during the workshop, with reference, for instance, to the known closure of Petroineos oil refinery operations at Grangemouth and a perceived failure to act in a timely fashion. The need for anticipatory, or “early warning” indicators and approaches to JT has also been emphasised in letters and consultation responses to the Draft CCP (2025) (e.g., Just Transition Commission, 2026b).
It is intended that anticipatory approaches to hotspot identification and monitoring as part of JT M&E can help mitigate risks of injustice – and pursue opportunities for more just outcomes – before transitions are locked in (Santos Ayllón et al. 2025).
The hotspot approach developed for this framework draws on existing work on place-based JT M&E. It presents an approach to monitoring place-specific sites of transition and proposes methodologies to anticipate potential transitions. In this vein, sections 3.3.1 and 3.3.2 set out approaches for hotspot identification, not monitoring. These approaches are exploratory and untested in practice and require further analytical development and pilot application. They were informed by support from Scottish Government analysts and by insight from stakeholders such as the Scottish Trade Union Congress (STUC).
Section 3.3.3 details the hotspot monitoring approach and a set of indicators. These indicators are proposed to monitor readily identified hotspots or known sites of transition. The development of the hotspots approach and hotspot indicators integrates place-based JT M&E within the proposed national JT M&E framework for Scotland.
Throughout these sections, this report reiterates the value of formalised and regular stakeholder engagement. Direct engagement with project developers, employers, planning authorities, local councils and sector-specific institutions will be invaluable to understand ongoing transition plans and decisions. This may be one of the most fruitful methods for anticipating potential transitions overall.
Identifying potential hotspots of industrial change
Locating potential industrial transition hotspots will involve identifying places hosting the types of industries which the low carbon economy is expected to move away from. These may include specific sectoral activities (e.g., oil and gas production or domestic vehicle combustion engine construction) and high emitting industrial sites which can be expected to undergo some form of decarbonisation over time.
To identify potential areas of industrial change using available data, the Scottish Government could pre-select a group of high-emitting sectors (e.g., heavy industry, manufacturing, energy, construction, or transport) using UK SIC code classifications. Although SIC code classifications do not precisely match distinctions between emitting and low-carbon activity, industry statistics by SIC code can be broken down to granular sector levels and small-scale geographies across Scotland.
A variety of statistical approaches could be then used to identify potential hotspots in relation to pre-identified sectors. ‘Location quotients’, for example, show the proportion of total employment in a place from a particular industry, compared to the national share. This can show sectors of dependency (or strength) for different local authority areas and at smaller scales. Location quotient data shows Aberdeen City as having a high location quotient in ‘mining and quarrying’ (SIC sector B) of 12.7, and Aberdeenshire of 3.2. This means that the proportion of jobs in ‘mining and quarrying’ in Aberdeen City and Aberdeenshire are 12.7- and 3.2-times the Scotland-wide share respectively (where 0.98% of Scottish jobs are in ‘mining and quarrying’)[10]. The data is sourced from the Business Register and Employment Survey and is available via NOMIS, and used by the Scottish Government, for example, in the Industry Statistics Database.
The Scottish Government could also identify key locations of industrial activity in identified sectors (determined according to SIC codes) based on the following indicators: (i) number of employees and (ii) proportion of employment in the local area dependent on these industries. Data for these measures is available in the Scottish Government’s industry statistics (Scottish Government, n.d.). This proposal takes a slightly different approach to location quotients by recognising the relative importance of industries in places, regardless of their proportional comparison to the rest of Scotland. If a given location is particularly dependent on an industry relative to its local employment levels and economic scale, then a change in this industry could have a significant impact locally (even if the facility is relatively small compared to the Scotland-wide sectoral workforce). Possible geographical scale for these analyses (as advised by analysts in the industry statistics area in government) include, for example, ‘travel to work’ areas, which are based on commuting patterns. Some of these are larger than local authorities, while others are smaller and based around specific towns. The Scottish Government could also use data on ‘anchor firms’ as the largest place-based employers across Scotland to further support hotspot identification.
A sector-based approach could also support the identification of potential net zero ‘growth’ areas, again, using tools such as location quotients or proportion of employment in a local area. The pre-selection of opportunity net zero sectors could be based on existing government strategies and analysis (e.g., the National Strategy for Economic Transformation (2022) and the Green Industrial Strategy (2024)). This will also be conditioned to some extent by available SIC code breakdowns. The current review of SIC code classifications (UK Government, 2026) may enable improved analyses of net zero sectors in the future. There could be overlap between industrial change hotspots and growth areas.
In parallel to sector-based analyses, the Scottish Government could use data sources like the Scottish Environment Protection Agency’s (SEPA) Scottish Pollutant Release Inventory (SPRI), to identify the most emitting industrial sites across Scotland (SEPA, n.d.). This dataset is annually updated and includes an extensive list of pollutants, including key greenhouse gases such as carbon dioxide and methane. As an example, journalist investigations have previously used this data to identify what authors labelled “Scotland’s top 20 climate polluters” with a focus on carbon dioxide emissions (Edwards and Dobson, 2022). The authors identified the single most polluting sites (e.g., SSE’s gas-fired plant at Peterhead) and the most polluting companies (e.g., Ineos). A cement works plant, waste incinerators, a glass manufacturing plant and a whisky distillery were also in the ‘top 20’, highlighting potential transition sites outside of the known industrial transition sectors. This proposal is inspired by similar analyses shared by STUC.
There may also be value in using the regularly updated data and maps from the North Sea Transition Authority (NSTA). NSTA datasets include regularly updated, long term decommissioning plans by well (North Sea Transition Authority, n.d.). Alongside these, the Scottish Government’s Marine Directorate produces spatially mapped data of onshore and offshore oil and gas infrastructure (e.g., MarineScotland, 2020). A spatial, infrastructure-based approach hyper-localises the identification of potential sites of transition and may also support identification of key employers and operators across sites and wells. Additional analysis of the Marine Directorate and NSTA data to identify field names, operators and their employee base could provide further insight into oil and gas transitions more broadly. This project has identified this as a critical area requiring new data collection for JT monitoring.
Identifying potential net zero development hotspots
Scholarships focused on energy, justice and JT have demonstrated the potential negative implications of net zero developments in the places where they are deployed (e.g., Mejía-Montero, 2025; Kalt et al. 2023; Healy et al. 2019). As such, the Scottish Government should also anticipate potential sites of net zero development. This includes both the deployment of renewable energy and related infrastructure (e.g., transmission lines, subsea cables, power stations, and green hydrogen production plants). It also includes sites of land use change like woodland creation and peatland restoration (e.g., for carbon offsetting purposes).
In the case of renewable energy and adjacent energy infrastructure developments, the most comprehensive data source identified is the UK Renewable Energy Planning Database. This is updated multiple times a year (UK Government, n.d.). It tracks the progress of UK renewable electricity projects over 150kW (onshore and offshore) through the planning system across technology types[11]. This data is available in spreadsheet format and as an interactive map, and projects can be filtered by development stages (UK Government, n.d.). The Scottish Government could filter by projects at inception and planning stages as a starting point for anticipatory JT analysis of potential developments.
There is extensive research regarding the justice implications of energy. Data collection associated with renewable energy benefits and ownership distribution is already underway by the Scottish Government. In contrast, this project identifies natural capital projects resulting in land use change for net zero as an important and underexplored area from a JT perspective. The Scottish Crofting Federation, for example, voiced a clear concern regarding land purchase and accumulation through natural capital development opportunities. Conversations across natural capital and Woodland Carbon Code (WCC) areas of government recognised existing concerns about land ownership concentration and the establishment of ‘green lairds’ (McMorran et al. 2022) yet also suggested that ownership concentration is not happening to date. This contrast in stakeholder perspectives demonstrates the relevance of this arena for further research, data collection and anticipatory hotspot attention.
Stakeholder engagement during this project shed light on the limited data available in relation to natural capital projects and their impacts from a JT perspective. Existing data includes publicly available lists of projects registered with WCC and Peatland Code (PC) (Woodland Carbon Code, n.d., Peatland Code, n.d.). In addition, Peatland Action hold and map data regarding completed and in-progress peatland restoration across Scotland (NatureScot, n.d.). Their map includes data on conducted ‘feasibility studies’ which can show sites of future restoration (however, these areas will not necessarily see the development of peatland restoration projects). A similar map was not identified for woodland creation projects. Like energy developments, land use change projects need to obtain consent (e.g., Scottish Forestry, 2025). The Scottish Government could explore avenues to access planning applications for woodland creation and peatland restoration as a step towards understanding planned landscape change for net zero and climate resilience.
Net zero developments are happening at a fast pace and across all of Scotland. This project proposes that the Scottish Government visually map and regularly update related data to enable a more comprehensive understanding of (i) the degree of change across different areas in Scotland and (ii) aggregated effects in a single place. Additional criteria to inform identification of potential hotspots facing net zero developments are (i) considerations of project scale and expected impact and (iii) the local context. This is applicable to both energy and land use change hotspots.
Hotspot indicators
The following section sets out the list of 23 indicators recommended for monitoring hotspots. Various indicators for hotspot JT M&E were selected from the four outcomes in the full M&E framework. Alongside these, additional indicators were identified which provide relevant information regarding transition processes in specific contexts. The selection of indicators was also informed directly by the dual hotspot definition above.
There are known and predicted similarities in the concerns created by specific transition impacts. In the case of industrial change, for example, concerns include worker participation in decision-making processes, unemployment and worker mobility, reskilling, socio-economic wellbeing of the local community, local identity and cohesion and levels of deprivation (e.g., Mayer, 2018; International Labour Organisation, 2015; Walsh et al. 2016; Santos Ayllón and Jenkins, 2023; Shapovalova et al. 2023; Jenkins et al. 2025). For places hosting net zero developments, concerns include transparency and participation in decision-making, stakeholder recognition and decision-making power hierarchies, impacts on identity and place attachment, the distribution of socio-economic impacts and risks of extractivism (Jenkins et al. 2016; Shejale et al. 2025; Raymond et al. 2023; Kalt et al. 2023; Healy et al. 2019; Morrissey, 2023).
Known and predicted concerns informed both the definition of hotspots and the selection of hotspot indicators. As an example, industrial change hotspot indicators include workforce experiences and local economy fluctuations. They also include indicators monitoring alcohol and drug use hospitalisations. While not directly connected to net zero activity, the latter serve as early warning measures of deprivation. Their inclusion draws on Shapovalova et al. (2023) and on the SIMD. Given the SIMD is produced every four to five years, they provide advanced insight into deprivation (SIMD, 2020).
The selection of indicators is further informed by the fact that hotspots directly experiencing industrial or net zero transition impacts (e.g., from the closure of an industrial plant or the deployment of transmission lines), are also impacted by broader transition dynamics captured across the four JT outcomes. In this way, place-specific transitions are layered upon broader JT issues, such as fuel costs, transport accessibility, fair work or participatory capacity in net zero policy-making processes.
Hotspot indicators are proposed as a useful starting point and guide for monitoring hotspot areas. They are not a blanket approach that will apply equally in every site of transition or consistently through time. While hotspots may share characteristics regarding the types of transition underway (e.g. industrial change or decline), each will be unique. Indicators may illustrate similar trends for different hotspots, but this will not necessarily demonstrate that the same transitions are occurring, nor similarities in their just-ness.
Attention should be given to unique, place-based realities including through complementary analytical tools such as the SIMD, existing climate change risk maps and data (e.g., SEPA, 2025; Climate Just, n.d.) and qualitative engagement with stakeholders. This follows recommendations in Jenkins et al. (2025) regarding the importance of bespoke approaches and indicators grounded in the most relevant concerns per place. For the purposes of national-level implementation and taking a national perspective, this report provides a set of indicators as a starting point for hotspot JT monitoring. Table 8 provides an overview of hotspot indicators and their data source. Appendix G provides further detail on hotspot indicators including their desired trend and rationale.
|
H |
Indicator (monitored by selected Local Authority) |
Industrial change |
Net Zero developments |
Data source |
|
H1 |
Employment rate for people aged 16-64 across Scotland |
X |
X | |
|
H2 |
Unemployment rate for people aged 16-64 across Scotland |
X | ||
|
H3 |
Number of people Not in Employment and Education or Training (16-19) |
X | ||
|
H4 |
Number of people in Modern Apprenticeships reporting that (i) their apprenticeship is in ‘green skills’/for the net zero economy’ during, 3-month and 15 months after finishing their apprenticeship and of these, (ii) number of people staying to work in their same Local authority |
X |
X | |
|
H5 |
Population change (with attention to in-out migration) |
X |
X | |
|
H6 |
Business activity/ survivability: Business birth and death rates |
X |
Scottish Government – Sub-Scotland Economic Statistics Database | |
|
H7 |
Sectoral economic dependence/diversification:
Contextualised within broader economic trends per local authority |
X |
X | |
|
H8 |
Proportion of households reporting that they are managing well financially |
X | ||
|
H9 |
Median house price by Local Authority |
X | ||
|
H10 |
People reporting they can afford their individual transport costs |
X |
X | |
|
H11 |
Proportion of adults within 5-minute walk of greenspace |
X | ||
|
H12 |
Operational capacity of community and locally owned energy installations in Scotland. Include a breakdown (i) by type of ownership (ii) by location and (iii) as a proportion of total renewable energy installed in local area |
X |
X | |
|
H13 |
Area of community assets (in hectares) |
X |
X | |
|
H14 |
Community benefits from energy (and for natural capital projects, once available) |
if/as relevant |
X | |
|
H15 |
Number of hospitalisations due to alcohol use |
X | ||
|
H16 |
Number of drug use hospitalisations |
X | ||
|
H17 |
Worker participation in industrial change processes |
X |
Data not currently available | |
|
H18 |
Premature deaths due to exposure to fine particulate matter (PM2.5) |
X |
X |
Data not currently available |
|
H19 |
Fuel poverty |
x (Every 3 yrs) |
x (Every 3 yrs) | |
|
H20 |
Proportion of people who agree that the transition to net zero and climate resilience will support a more positive future for young people and future generations in Scotland |
x (Every 3 yrs) |
x (Every 3 yrs) |
Scottish Climate Survey (proposed addition from Autumn 2026) |
|
H21 |
Proportion of people in Scotland reporting satisfaction with opportunities to influence (i) the Scottish Government’s approach to delivering net zero, and (ii) local policy and planning decisions relating to net zero |
|
x (Every 3 yrs) |
Scottish Climate Survey (proposed addition from Autumn 2026) |
|
H22 |
Proportion of people in Scotland reporting satisfaction with opportunities to influence net zero and climate adaptation developments happening in their local area |
x (Every 3 yrs) |
x (Every 3 yrs) |
Scottish Climate Survey (proposed addition from Autumn 2026) |
|
H23 |
The proportion of people reporting that changes to their local place due to net zero infrastructure and/or land use change have maintained or improved the quality of their local area |
|
x (Every 3 yrs) |
Scottish Climate Survey (proposed addition from Autumn 2026) |
Table 8: Hotspot indicators, by hotspot ‘type’ and data source.
All hotspot indicators share two characteristics: they are all available at local authority level and data is updated on an annual basis (except for the Scottish Climate Survey and fuel poverty data, for which local authority data is available every 3 years). The local authority level is the smallest area for which data is available across all identified indicators. This allows comparability. This scale is also recognised as a limitation to the hotspots approach, given transition impacts may be contained to smaller local areas within local authorities. Highland Council data will not necessarily reflect realities of wind farm and transmission line installations in Caithness, for example, and centralised Orkney Islands level data may be insufficient to understand the just-ness of transitions underway on individual islands within the archipelago.
Annual data collection for most indicators is common and is the most frequent data update period (with some exceptions e.g., labour market trends, which are updated monthly). Given that hotspots are already undergoing transformational change, regular, timely monitoring is critical to understand the implications of the transition. Annual indicators could also serve as early warning indicators for hotspot locations over time. At the same time, this annual updating cycle is recognised as a limitation, given that data will never be available in real time. The limitations of the hotspots approach are returned to in Section 4.
Hotspot indicator monitoring should incorporate regular stakeholder engagement. This will be necessary to better understand both (i) where impacts are localised within each local authority and (ii) to obtain regular, near real time updates while indicator data is unavailable. Regular engagement will also triangulate monitoring with qualitative lived-experience data. The role of stakeholder engagement in JT M&E is expanded on in Section 3.5. A key recommendation for Scottish Government is the further development of effective approaches to engagement as a qualitative monitoring tool.
Interpreting indicators
The sections above have presented a set of proposed indicators across four JT outcomes, a selection of ‘summary indicators’ for these, and an additional set of hotspot indicators. Together, these indicators make up the core for monitoring a JT at a Scotland-wide level and for specific sites of transition in Scotland. The indicators are selected based on their relevance and representativeness of the outcomes and hotspots they relate to, alongside data availability.
The identified indicators are partial. Together, they support an understanding of progress towards JT outcomes, yet they are unable to capture every dimension, nuance and implication of the transition from a JT perspective. The transition itself is underway within a broader landscape of social, economic and planetary change, at local, national and international scales. For improved understanding of the just-ness of the transition, the indicators should be interpreted (i) as interrelated features of a JT within the framework, and (ii) in relation to broader contextual trends. This section addresses each of these points in turn.
Interpreting outcome and hotspots indicators
A JT to net zero and climate resilience is a dynamic, multi-layered process. As an example, an individual may face issues of transport affordability due to the shift towards electric vehicles, gain health benefits from reduced air pollution and be employed in peatland restoration while feeling disenfranchised from decisions about the installation of wind turbines near their home. This understanding of the JT was foundational to the conceptualisation of the proposed JT M&E framework.
A multi-layered and dynamic M&E framework was deemed too unwieldy for feasible implementation. As such, the core of the proposed framework is structured according to a linear logic in which high-level outcomes are monitored by a set of indicators, each with an individual desirable trend. If every indicator in the Communities and Places outcome is progressing in the desired direction, then the Scottish Government could interpret this as progress towards this JT outcome.
A review of individual indicator trends alone, however, is insufficient to assess the just-ness of the transition and may obscure experiences of injustice. As an example, an increasing trend in community energy ownership may not show differences in access to community energy ownership opportunities. These considerations also apply to interactions across indicators, and across outcomes too. Increasing community land ownership, for example, is deemed positive from the perspective of community empowerment and access to net zero opportunities. Yet changes in land ownership could also have negative distributional impacts on people previously employed on the land. The increase in marine protected areas is deemed desirable from the perspective of the Environment and Biodiversity outcome yet may also create additional pressures on fishers and coastal communities in relation to the Communities and Places outcome. Critical inquiry into the indicators, what they do not show and how they relate to each other will improve assessment of JT progress. This critical attention draws from methods developed by the field of responsible research and innovation (e.g., Stilgoe et al. 2013) and has also been proposed in anticipatory justice approaches (e.g., Santos Ayllón et al. 2025). It should be complemented with qualitative, stakeholder engagement, returned to in Section 3.5.
The hotspots approach is designed to capture the multi-layered, cross-cutting nature of the JT more effectively. This is made possible by the narrower scope offered by the hotspots approach. Thus, while hotspot indicators have an indicative desired trend (see Appendix G), they should be interpreted in their local context and, to the extent possible, in relation to each other.
Interpreting indicators against contextual trends
Indicator trends can provide the Scottish Government with an overview of progress towards (or away from) a set of desired outcomes. However, these indicators should be interpreted (i) in the context of climate change mitigation and adaptation actions and (ii) as part of a wider socio-economic landscape. The importance of interpreting indicators within context was emphasised by NatureScot team members, alongside Scottish Government analysts in the industry statistics area. The importance of context to understand quantitative indicators is also clear in Shapovalova et al.’s (2023) narrative interpretation of indicators for a JT in Aberdeen and Aberdeenshire. Contextual interpretation recognises the unpredictability of climate impacts and responses to these, and the ways in which wider trends can impact the ongoing transition (e.g., ICAT, 2024).
This report proposes an initial set of trends which can support the interpretation of monitored indicators. The first two relate to climate change mitigation and adaptation, followed by broader socio-economic trends:
- Greenhouse gas emissions in Scotland: To assess a JT in the context of progress towards climate change mitigation. Greenhouse gas emissions are reported on annually in the CCP (2026) with a time lag of circa two years.
- Climate risk (and adaptation) in Scotland: To assess a JT in the context of changing climate risk. A comprehensive assessment of climate change risk for Scotland is conducted every 5 years by the Climate Change Committee (CCC). Climate adaptation research and policy team members have used the CCC assessment to inform their M&E framework for SNAP3. The CCC presents a set of risks and evaluates these on a scale of high-medium-low. The recommendation is to use this (the number and type of risks per category) as a baseline for climate risk and adaptation (e.g., Climate Change Committee, 2021).
- Land ownership concentration in Scotland: To assess a JT to net zero and climate resilience in the context of evolving land ownership trends in Scotland. Changes in land ownership and land use could have a variety of impacts including potential job losses, landscape change and new distributions of benefits and harms. Land ownership was recognised by stakeholders as key to accessing opportunities from net zero and climate resilience. While data is currently unavailable to monitor land concentration trends, the annual Rural Land Market insights report by the Scottish Land Commission can provide a high-level overview of trends (Scottish Land Commission, 2025). This can be supplemented with insight from relevant Scottish Government teams and stakeholders like Community Land Scotland and the Scottish Land Commission.
- Economic trends in Scotland: To assess a JT to net zero and climate resilience in the context of the health and resilience of the Scottish economy at any given point in time. This can include particular attention to sectoral composition by % of GVA, to support high-level analyses of the direction of the economic transition. Economic statistics are updated annually across Scottish Government. Business and industry surveys are regularly conducted with the least regular surveys taking place on an annual basis.
- Poverty and inequality trends in Scotland: To assess a JT to net zero and climate resilience in the context of structural vulnerabilities and inequity. Relative and absolute poverty statistics, along with GINI coefficient and Palma ratio analyses of inequality are updated annually by Scottish Government.
- Global events: To assess a JT to net zero and climate resilience in the context of global affairs, including geopolitical shocks, economic crises, pandemics or accelerating commitments to climate action. Scotland is part of an interconnected economic, institutional and ecological global landscape. Developments in this landscape will undoubtedly impact on – and could be impacted by – Scotland’s progress towards a JT.
These trends are relevant for JT indicator interpretation across the four outcomes and hotspots[12]. Falling fuel poverty and increasing transport affordability indicate positive advances to address fuel and transport inequities. However, in a context of increasing greenhouse gas emissions these would not necessarily be associated with a net zero transition. A continued increase in poverty levels in a context of falling greenhouse gas emissions and increasing low carbon jobs and economic activity (JSEO1, JSEO4) may signal failings in securing JT objectives. Geopolitical shocks (such as the coronavirus pandemic, Russia’s invasion of Ukraine in 2022, or USA and Israel strikes on Iran in 2026) can impact fuel prices and the cost of living, change government policy priorities and affect public concerns. Analysis of indicators in relation to global affairs can thus support improved interpretation of indicator trends and any sudden shifts these may present.
Stakeholder engagement
The proposed framework is grounded in an underpinning commitment to formalised, regular stakeholder engagement. This is seen as fundamental to supporting JT monitoring. Workshop participants emphasised the value of stakeholder engagement and stakeholder participation both for JT delivery, and specifically to support JT M&E. They explained that building trusted and regular networks with key stakeholders could support data collection, fill data gaps, and improve communication about the transition. This focus on engagement also echoes Mechanism 3 in Drabble et al. (2024, p.47), which identified ‘stakeholder participation in Just Transition decision making’ as one of the conditions for JT success.
Stakeholder engagement is envisaged to enable qualitative data collection for relevant indicators and as a supplement to quantitative data. It is also deemed crucial for indicator interpretation, both to triangulate and contextualise indicators with experience on the ground. Importantly, stakeholder engagement can also provide insight into transition impacts before indicator data is available. Finally, engaging with key stakeholders is also suggested as an anticipatory tool for the Scottish Government to identify potential future hotspots.
Stakeholder engagement can provide granularity, nuance and qualitative case studies grounded in lived experiences of the transition. This can improve understanding of what is and is not captured by indicators, and therefore the multiple implications of the transition. As examples, a Poverty Alliance team member referred to instances in which heat pump installations in social housing had resulted in inhabitants falling into energy debt. During the workshop, a representative from CEMVO explained the difficulties often faced by ethnic minorities in accessing opportunities such as the Community and Renewable Energy Scheme (CARES) funding. Fuel poverty and community energy ownership indicators in the framework (PE3 and CP7) do not reflect these risks and inequalities relating to heat pumps and renewable energy. While indicator data does not capture these experiences, qualitative feedback can.
Some indicators in the framework suggest a combination of quantitative and qualitative data, the latter collected as ad hoc stakeholder insight or case studies. Examples include CP3 on community groups involved in climate and sustainability related activities. Climate Action Hub teams can provide qualitative insight into where community-led action is particularly strong. Conversely, this engagement can also show where it is struggling to take off and offer reasons why. Organisations like the Scottish Community Development Centre and the Scottish Communities Climate Action Network can provide further insight into community-led climate action. Recommendations for stakeholder engagement in indicator JSEO16 (on workforce participation) was informed by a discussion with STUC. This shed light on the legal and practical barriers to worker-involved transitions in high emitting industries.
Some indicators in the framework are fully qualitative. One example is CP9, which monitors engagement experiences of the fishing sector with offshore energy developments. Fishing was discussed not only as an economic activity but a way of life, with strong impact on coastal and island local economies and identities (as explained by the Regional Inshore Fisheries Group and Scottish Government team members). The Regional Inshore Fisheries Group reflected on power and resource hierarchies between offshore energy developers and the fishing sector, and on the different types of fishing and potential diverse impacts. Questions of sectoral coexistence, decline and change in the offshore economy are too complex to be captured in a single data point. Engagement with key stakeholder groups directly involved is therefore key.
The Scottish Government can explore different forms of engagement for JT M&E. These may range from individual meetings to establishing a regular stakeholder forum. There may be opportunities for the Scottish Government to complement these efforts with JTC support, which is to be renewed in 2026 (Scottish Government, 2025f). From the perspective of national JT M&E, the Scottish Government already has extensive knowledge and networks with stakeholder groups and organisations across many JT areas of concern. Internal and external stakeholders engaged with throughout this project are also deemed valuable contact points.
Alongside sector-specific stakeholders, and for national JT monitoring, the Scottish Government can engage with Scottish Government teams working on related Scotland-wide monitoring (e.g., the National Performance Framework or the Wellbeing Economy Monitor) to support contextualisation of indicators into Scotland-wide trends. In addition, the Scottish Government could explore existing connections to local authorities to contrast national-level JT monitoring with local concerns. Stakeholders such as the Convention of Scottish Local Authorities (COSLA) and the Scottish Climate Intelligence Service offer potential to connect nationwide JT monitoring to more local priorities. Local authorities could provide qualitative input to complement indicator monitoring, for example, and could report back on which indicators reflect local priorities at a given point in time.
In the case of hotspots monitoring, the Government could establish regular communication and feedback loops with a bespoke set of stakeholders on the ground. This may include local authority representatives, developers, employers, trade unions and local third sector organisations. Such arrangements could also be used as an anticipatory tool to identify future hotspots facing industrial and net zero change. In addition, existing partnerships and stakeholder networks including the eight Regional Economic Partnerships, for example, or the Sub-Scotland Economic Statistics Group, may be useful to support hotspot indicator interpretation.
While this section has focused on engagement with institutional stakeholders, this does not preclude engagement with individuals directly exposed to and experiencing transition impacts. In some cases, this could be the most direct way to access, listen to and integrate lived experience (e.g., Jenkins et al. 2025). Research into justice in energy transitions has explored the role of intermediaries in translating lived experiences such as of fuel poverty, including both their value and potential risks (e.g., Lacey-Barnacle and Bird, 2018; Santos Ayllón and Jenkins, 2023). This section recommends engagement with institutional stakeholders first for reasons of feasibility, and to ease potential burdens on directly affected groups.
Engagement with individuals experiencing transitions may in some cases be necessary to better understand and evaluate transition impacts. Where needed, the Scottish Government should build in opportunities for ad hoc qualitative research and engagement. The Scottish Government may also explore possible avenues for more formalised engagement approaches to reach lived experience, including through participatory citizens assemblies or ‘experts by experience’ panels (e.g., Elstub et al. 2022; Poverty and Inequality Commission, 2023).
Limitations and reflections
The proposed JT M&E framework has several limitations. Some of these relate to the practicalities of framework implementation, and others to the specific constraints affecting this project. Some limitations reflect the complexity of monitoring a JT itself.
Data availability, temporality and scale
Data availability has played an important role in the final shape of the proposed M&E framework. Broadly speaking, core areas of JT concern are included in the framework across outcomes and hotspot indicator lists. However, for many of these indicators, the data available is partial. For example, ‘adults within 5-minute walking distance of greenspace’ does not provide information on the quality or accessibility of this space. In addition, data for all indicators in the framework is retrospective. While many indicators in the framework are available on an annual basis, others are only available every two or three years. The current lack of real time data is arguably a limitation of any M&E framework aiming to monitor and assess a JT in Scotland.
More broadly, data limitations relate to their collection and categorisation parameters. Two clear examples are industrial classifications by SIC codes or the geographies of data collection, which do not necessarily match geographies of transition. This is particularly key in the case of hotspots. Although data is available at local authority levels, sites of transition often sit within local authorities. Transition dynamics may not necessarily be captured by local authority level data. As discussed in Section 3.5, close engagement with relevant stakeholders will be essential to better understand localised transitions. Engagement will provide as close to real-time data as possible and can triangulate and nuance indicator data. It may also be one of the most effective tools to anticipate future hotspots before transitions begin.
Finally, important data gaps remain. While the framework was developed with feasibility of implementation in mind, it also includes critical areas of JT concern for which both understanding and data is lacking. These gaps suggest areas for further research and data collection. These areas are summarised below:
- Geographic and demographic breakdowns of low carbon and renewable energy jobs (often referred to as ‘green jobs’),
- Education, training and skills development for the economy of the future (in ‘green’ jobs and more broadly),
- Regular data collection on individuals’ sense of influence at smaller geographical scales (Scottish Climate Survey data is only available by local authority every 3 years),
- Worker transitions, including the processes, distributional impacts and lived experience of workers in high-emitting sectors and on retraining pathways,
- Exposure to climate change risk and the ability to access and adopt climate adaptation measures across people and places,
- Climate change and net zero transition impacts on business, with attention to vulnerability, resilience and opportunities for different business types and scales. This includes direct attention to sole traders, who make up 71.9% of businesses in Scotland (Scottish Government, 2025g),
- Implications, benefits and harms of land use change for natural capital projects,
- Opportunities and risks relating to land ownership, access and distribution, with attention to stakeholders such as crofters, farmers and gamekeepers,
- Land and coastal place-based identities and the implications of safeguarding or losing generational occupations and skills (e.g. crofting and fishing),
- The spatial and demographic distribution of environmental degradation, pollution and hazardous sites across Scotland.
The list above relates to all indicators in the framework, including those with available data. For example, although there is an indicator focused on net zero skills development through apprenticeships, this is insufficient to capture the array of skilling and reskilling processes relating to net zero.
Alongside identified data gaps, stakeholder input spotlighted four key areas for further attention. These are not currently captured in the framework because they cut across various outcomes and are affected by extensive data gaps. The Scottish Government could explore (i) how these issues relate to JT delivery in Scotland and (ii) how they may be monitored and evaluated over time:
- Distribution of responsibility, overconsumption and polluter pays considerations: Policy narratives often focus on distributing the benefits of the transition fairly and reducing the burden on disadvantaged households. However, less attention is given to responsibility, overconsumption and polluter pay considerations (at individual, business or industry levels). Participants in the workshop voiced concerns about how ‘climate policy is regressive’. Drabble et al. (2024, p.17) also briefly reflected on these considerations in their reference to ‘assessment of disproportionate benefits’. Most stakeholders engaged in this project and the evidence reviewed did not focus explicitly on issues of historical, international, intergenerational and intragenerational responsibility, often captured by the term ‘climate justice’ (e.g., Roser and Seidel, 2016). Overall, issues of distribution and responsibility are underexplored within a policy context in relation to JT and invite closer attention.
- Intersections between food production systems, stakeholder power, food security, ecosystem and human health, and land use change: Interviews with NatureScot and the Scottish Crofting Federation pointed to the intersections between food production systems, power hierarchies and land use change in the transition to net zero. Concerns were also related to issues of food security, resilience and health. These insights invite further attention into how net zero and climate adaptation actions interact, if at all, with food production, food security and land use, and the risks and opportunities from the perspective of ensuring a JT.
- Intersections between land prices, housing prices and availability and land use change in rural areas: The relevance of land ownership has been highlighted throughout, particularly in relation to distributional justice and access to net zero opportunities. The Scottish Crofting Federation also highlighted issues of land prices, housing prices and the ways in which land use change can affect these, particularly in rural and island areas. This may be directly affected by net zero and climate adaptation developments. In other cases, this may be adjacent to the transition underway and part of broader trends. Improved understanding of how land and house prices interact with the transition will support improved assessment of a JT.
- Implications of human/nature relationships for the planetary crises and JT: There is growing attention to human-and-nature relationships from the perspective of justice, climate change, the energy transition and JT (e.g., Tafon et al. 2023; van Vugt et al. 2025; Tschakert et al. 2020; Stanley et al. 2025). This relates to beliefs, values and ethical systems, similarly to issues of justice (e.g., van Uffelen et al. 2024; Roser and Seidel, 2016). NatureScot interviewees emphasised the importance of assessing the JT within the current, exploitative relationship with nature (in industrial contexts) and its underlying causes. Disconnection from and domination over nature has also been recognised by the Intergovernmental Science-Policy Platform on Biodiversity and Ecosystem Services (IPBES) as an underlying cause of biodiversity loss and nature’s decline (IPBES, 2025, p. 28 Figure SPM.1). In the workshop, indicator discussions for the ‘Environment and Biodiversity’ outcome highlighted diverse perspectives on the role of ‘nature’ within a JT. This included questions about the ways in which the climate and biodiversity crises (also known as the twin-crises) are interlinked; and the implications of this for a JT in Scotland. Overall, the space for nature within understandings of a JT and within JT policy in Scotland is unclear and would benefit from further attention.
Framework structure, design and development
The proposed framework is broadly structured according to a linear logic: outcomes inform the development of indicators which in turn, serve to assess progress towards the outcome. This enables targeted consideration of key areas of concern, along with an opportunity to monitor a suite of indicators providing detail into specific outcomes. At the same time, a linear approach clusters and to some extent, siloes areas and indicators. Indicators captured under ‘People and Equity’ or ‘Environment and Biodiversity’ may also be relevant to monitor progress towards ‘Communities and Places’, for example, but are not easily interconnected in the framework. In contrast to outcomes, a cross-outcome use of indicators is proposed for hotspot monitoring. An example of a cross-cutting indicator approach to M&E is the National Wellbeing Framework for Wales, in which each indicator is relevant to more than one outcome (Welsh Government, 2022b).
Secondly, this framework is designed with in-built stakeholder engagement and qualitative analysis as two fundamental tools for its effective use and delivery. Qualitative approaches are often deemed resource intensive and challenging to implement in practice. Their effectiveness also depends on diverse stakeholders with their own interests and agendas. Emphasis on the role of qualitative approaches also partially moves away from many M&E frameworks that focus predominantly on monitoring quantitative indicator trends over time. Innovation into policy tools and approaches to engage in this feasibly and effectively is a recommendation for the Scottish Government going forward.
Constrained resources for this project resulted in the prioritisation of conceptualisation, outcome and indicator development for monitoring, with less attention to mechanism identification and evaluation proposals. The mechanisms are a key dimension of a full ToC and are important to support evaluation of why a JT is happening, and what actions have driven change (e.g., Drabble et al. 2024, p.42). They allow for “a deeper understanding of what is necessary, and what must be avoided for a ToC to successfully achieve its impact” (Dhillon and Vaca, 2018, p.70). It is recommended that the Scottish Government elaborate on the mechanisms presented by Drabble et al. (2024) to subsequently explore effective and feasible ways for mechanism monitoring. This will also enable more comprehensive evaluations of JT progress.
Finally, the framework has not been ‘tested’ in practice. While indicators have been researched, identified and in some cases, developed, a baseline of data collection has not been undertaken. This report recommends that the Scottish Government collate data across outcome indicators alongside example hotspots such as Aberdeen City or the Shetland Islands. In doing so, it is anticipated that some indicators may evolve, others may be removed and new ones added. This will enable refining of the outcomes and hotspots approach.
Reflections on the temporal nature of (just) transitions
The net zero and climate adaptation transitions, alongside climate change impacts themselves, are by nature fluid, uncertain, and spread over time. Plans such as SNAP3 (2024) and the CCP (2026) set out long term goals to 2045, in keeping with Scotland’s target to reach net zero emissions. This is also reflected in Drabble et al.’s (2024) conceptualisation of a JT ToC for Scotland.
The groups and locations vulnerable to climate change impacts and affected by transition risks and opportunities will change over time. In the case of hotspots, new locations will become focal sites of transition over the next 20 years. The long-term, live and uncertain nature of the transition has implications for any effort towards JT M&E. This requires that the framework be kept live as new issues emerge and new data becomes available. In addition, identifying and defining when sites of transition become hotspots and when their transitions ‘start’ and ‘end’, will be an important consideration for the effective implementation of this framework.
It is recommended that places identified as ‘hotspots’ with known imminent transitions (such as the closure of the Mossmorran chemical plant in Fife (e.g., BBC, 2026)) or those with transitions already underway are monitored as early on as possible. In the case of anticipated hotspots, this becomes a more challenging question relating to pre-empting transitions and the implications of doing so, given that there is no clear cut, pre-determined list of sites of decline or opportunity. Further research into anticipatory policymaking, risk mitigation and future-facing M&E could inform decision-making in this arena.
Reflections on defining the scope of JT
It is also worth reflecting on learnings from this project’s efforts to develop an M&E framework for a JT. Understandings of a JT vary widely. For the development of this M&E framework, this project has understood a JT to be the just-ness of the process and outcomes of the transition in response to climate change through ‘net zero’ and ‘climate adaptation’ in Scotland. Even within these boundaries, issues of JT concern are wide-ranging and incredibly complex. They are also not always comfortably attributable to climate change impacts nor transition actions alone. Instead, they are interwoven with broader local, national and global political, economic and ecological networks, changes and shocks.
The value of tools such as M&E frameworks for a JT should be understood in the messy context of delimiting the scope of JT. Although M&E frameworks will struggle to capture every single aspect and lived experience relating to a JT, they can inform policymaker and societal understanding. They can provide insight into the ways in which the net zero transition and climate adaptation are unfolding and their just-ness. They can also inform interventions and importantly, hold actors in roles of influence and responsibility to account, including the Scottish Government.
Conclusion and recommendations
This project has developed an M&E framework for a JT to a net zero and climate resilient Scotland. The proposed framework supports monitoring of a JT for Scotland as a whole, while integrating attention to specific regions, places and to vulnerable and affected groups. The body of this framework is made up of quantitative indicators alongside recommendations for the development of qualitative indicators. It also integrates qualitative engagement, analysis and interpretation as necessary tools for effective JT M&E.
The proposed framework also builds in a place-based, hotspots monitoring approach. This recognises that specific places will be directly and significantly affected by processes of industrial change and net zero developments. Through the development of the hotspots approach, this framework also presents the future-facing potential of M&E in a JT context, to anticipate and inform transitions towards more just outcomes while mitigating risks (e.g., Santos Ayllón et al. 2025).
This framework is developed within severe constraints on data availability. It offers a step forward towards what is pragmatically possible now. The Scottish Government should keep the framework live and adaptable as the transition unfolds.
The next step is to test the proposed approach through data collection across outcome and hotspot indicators. This will assess how well the framework can be used in practice and its ability to capture JT concerns. In parallel, this report recommends that the Scottish Government develop a set of mechanisms and their monitoring along with approaches to JT evaluation. The identification and development of qualitative engagement tools and analytical approaches for risk mitigation, indicator interpretation and JT evaluation is also encouraged.
Based on stakeholder input and learnings throughout this project, the report closes with a set of key recommendations to Scottish Government for effective M&E of a JT in Scotland:
- Start now: The urgency of understanding transition impacts is clearly felt by stakeholders and within government. The inclusion of JT indicators within the CCP (2026) recognises the centrality of a JT to climate action. In this vein, the Scottish Government should begin to systematically monitor, evaluate and report on progress towards a JT. Implementation of existing (albeit imperfect) frameworks and iterative learning is the next step.
- Data collation and sharing avenues within and beyond government: Data collection and collation in databases, dashboards and reports is underway across teams and directorates in Scottish Government. There is an opportunity to develop cross-team mechanisms to collect and collate this data. There is also an opportunity to put the necessary infrastructure in place for data sharing by non-governmental actors (and to require this, where relevant) with the Scottish Government, to begin to fill data gaps.
- Fill key data gaps with new data collection: Arguably, one of the most pressing data gaps relates to experiences and outcomes of the transitioning workforce in high-emitting sectors. Additional data gaps which require further research from a JT perspective include (i) land use change from natural capital projects, (ii) business vulnerability to climate change and net zero transitions, and (iii) vulnerability to climate impacts and access to adaptation solutions.
- Governance, responsibilities and policy responsiveness: M&E frameworks in other areas of government (such as for SNAP3 (2024) or the Biodiversity Strategy (2024)) have developed governance structures for M&E delivery. It is recommended that the Scottish Government explore questions of JT governance and responsibility, including for JT M&E. This may increase attention and accountability of JT delivery. Relatedly, attention to what bounds JT interventions from a Scottish policy perspective can also support efforts towards governance and attribution analyses, alongside mechanism identification.
- Trial anticipatory approaches to JT M&E: The Scottish Government can use M&E to support proactive JT planning in ways which mitigate risks and pursue opportunities for more just outcomes, particularly in place-specific contexts. The Scottish Government should also identify available tools for policy responsiveness to insights from anticipatory analyses and JT M&E across outcomes and hotspots more broadly.
- Investigate qualitative tools and approaches for M&E: Despite the widespread use of quantitative data for M&E, this project has highlighted the key role of regular stakeholder input, qualitative data and analyses for effective JT M&E. Further development of qualitative engagement tools and analytical approaches is a key recommendation both for indicator monitoring, interpretation and JT evaluation. The implementation of a qualitative-strong JT M&E approach will also require the development and use of strategic analysis capabilities to interpret and evaluate progress towards a JT.
- Use M&E to communicate about the JT and about the transition more broadly: There is value in using JT M&E as a tool for improved communication about climate change, climate action and the impacts of net zero and adaptation. This gains relevance in a political context that is shifting towards anti-climate change and net zero narratives. Monitoring JT indicators and communicating these in relation to net zero and climate adaptation (through dashboards, reports or other tools) is identified as a key avenue for dissemination.
- Identify tools for data management and communication: The breadth and multi-dimensional nature of JT invite the development of digital visualisation tools. These might include websites or dashboards for ease of monitoring, reporting and broader communication purposes. It is also possible to use programmes like Excel to organise data and begin monitoring. This will enable framework implementation in the short-term with readily available tools. It is recommended that transparent internal and external reporting is prioritised.
References
Adindu, A., (2010) ‘Effective Monitoring and Evaluation of Primary Health Care Interventions Requires Participatory Approach,’ Journal of Advancement in Medical and Pharmaceutical Sciences, 4(1), pp. 93-97. Available at: (PDF) Effective Monitoring and Evaluation of Primary Health Care Interventions Requires Participatory Approach
BBC, (2026) ‘Mossmorran stops production after 40 years with jobs at risk,’ BBC News, 3 February, [online]. Available at: https://www.bbc.co.uk/news/articles/cvg1jv77vy8o
Bergseng, A. M., (2023) ‘Monitoring and evaluation of a just transition in Scotland – summary report on international lessons,’ ClimateXChange, April, [online]. Available at: https://www.climatexchange.org.uk/wp-content/uploads/2024/12/CXC-Monitoring-and-evaluation-of-a-just-transition-in-Scotland-%E2%80%93-Summary-report-on-international-lessons.pdf
Bird, M., Büker, P., Keim, M., Treadwell, K., (2024) ‘Assessment Tool for Just Energy Transition Plans: Support for policymakers, stakeholders, and practitioners,’ Deutsche Gesellschaft für Internationale Zusammenarbeit, Just Energy Transition for Coal Regions Knowledge Hub. Available at: https://www.jetknowledge.org/wp-content/uploads/2024/04/IKI-JET-Assessment-Tool-for-Just-Energy-Transition-Plans.pdf
Bouzarovski, S., Simcock, N., (2017), ‘Spatializing energy justice’, Energy Policy, 107, pp. 640-648. Available at: https://www.sciencedirect.com/science/article/pii/S0301421517302185
Brunt, A., Spooner, D., (1998) ‘The development of wind power in Denmark and the UK’ Energy & Environment, 9(2), pp. 279-296. Available at: https://www.jstor.org/stable/44397481
Cambridge dictionary (n.d.) ‘Evaluation meaning’, Cambridge dictionary, [online]. Available at: EVALUATION | English meaning – Cambridge Dictionary https://dictionary.cambridge.org/dictionary/english/evaluation
ClimateJust, (n.d.) Climate Just Map Tool, [online]. Available at: https://www.climatejust.org.uk/map.html
Climate Change Committee (CCC) (2021), ‘Summary for Scotland (CCRA3-IA),’ UK Climate Risk, 16 June, [online]. Available at: https://www.ukclimaterisk.org/publications/summary-forscotland-ccra3-ia/
Crown Estate Scotland, (n.d.) ‘Scotwind leasing round’, [online]. Available at: https://www.crownestatescotland.com/scotlands-property/offshore-wind/scotwind-leasing-round
Department of Health and Social Care, (n.d.) ‘Public Health Outcomes Framework’, [online]. Available at: https://fingertips.phe.org.uk/profile/public-health-outcomes-framework/data#page/0/gid/1000043/pat/15/par/E92000001/ati/6/are/E12000004/yrr/1/cid/4/tbm/1/page-options/car-do-0
Dhillon, L., Vaca, S., (2018) ‘Refining Theories of Change,’ Journal of Multidisciplinary Evaluation, 14(30). Available at: https://jmde.com/index.php/jmde_1/article/view/496/444
Edwards, R., Dobson, P., (2022) ‘The ‘rogues’ gallery’: Scotland’s top 20 climate polluters’, The Ferret, 17 April, [online]. Available at: The ‘rogues’ gallery’: Scotland’s top 20 climate polluters
Elstub, S., Escobar, O., Henderson, A., Thorne, T., Bland, N. & Bowes, E., (2022), ‘Research Report on the Citizens’ Assembly of Scotland’, Scottish Government Social Research, [online]. Available: https://www.gov.scot/isbn/9781802018943
Estrella, M., Gaventa, J., (1998) ‘Who counts reality? Participatory monitoring and evaluation: a literature review’. IDS working paper 70. Available at: https://opendocs.ids.ac.uk/articles/report/Who_Counts_Reality_Participatory_Monitoring_and_Evaluation_A_Literature_Review/26442646/1/files/48090631.pdf
Equitable Energy, (2025) ‘Social value from renewables in the Highlands and Islands,’ Platform, May, [online]. Available at: https://platformlondon.org/app/uploads/2025/05/Social-Value-from-Renewables-EER-280525.pdf
Farrell, C., (2012) ‘A just transition: lessons learned from the environmental justice movement’, Duke Forum for Law and Social Change, 4 (45), pp. 45–63. Available at: https://scholarship.law.duke.edu/cgi/viewcontent.cgi?article=1026&context=dflsc
Healy, N., Stephens, J. C., Malin, S. A. (2019) ‘Embodied energy injustices: Unveiling and politicizing the transboundary harms of fossil fuel extractivism and fossil fuel supply chains,’ Energy Research and Social Science, 48, pp. 219–234. Available at: https://doi.org/10.1016/j.erss.2018.09.016
Heyen, D. A., Beznea, A., Hünecke, K., Williams, R., (2021), ‘Measuring a Just Transition in the EU in the context of the 8th Environment Action Programme – An assessment of existing indicators and gaps at the socio-environmental nexus, with suggestions for the way forward,’ Oko-Insititute, e.V., Trinomics. March, [online]. Available at: JustTransition_Indicator_Paper_final_clean-2021.pdf
HM Treasury, (2026) ‘The Green Book. UK Government Guidance on Appraisal’, UK Government, [online]. Available at: The Green Book – UK government guidance on appraisal
HM Treasury, (2020) Magenta Book. Central Government guidance on evaluation, March, [online], Available at: https://assets.publishing.service.gov.uk/media/5e96cab9d3bf7f412b2264b1/HMT_Magenta_Book.pdf
Htitich, M., Krylová, P., Harmáček, J., (2024) ‘Just Transition Score: Measuring the relative sustainability of social progress,’ Environmental and Sustainability Indicators, 23(100440). Available at: https://doi.org/10.1016/j.indic.2024.100440
Initiative for Climate Action Transparency (ICAT), (2024) ‘Tracking Progress Towards a Just Transition A monitoring, evaluation and learning framework to guide justice-oriented, socially owned transition tracking in South Africa,’ Initiative for Climate Action Transparency, April, [online]. Available at: https://climateactiontransparency.org/wp-content/uploads/2025/01/D8.-JT-MEL-Framework-final.pdf
Intergovernmental Science-Policy Platform on Biodiversity and Ecosystem Services (IPBES), (2025), The IPBES Thematic Assessment Report on the Underlying Causes of Biodiversity Loss and the Determinants of Transformative Change and Options for Achieving The 2050 Vision for Biodiversity (Transformative Change Assessment), [online]. Available for download at: https://www.ipbes.net/transformative-change-assessment
International Labour Organization, (2015), Guidelines for a just transition towards environmentally sustainable economies and societies for all, International Labour Organisation. Available at: https://www.ilo.org/sites/default/files/wcmsp5/groups/public/@ed_emp/@emp_ent/documents/publication/wcms_432859.pdf
Jenkins, K., Drabble, D., Copeland, R., (2025) ‘Assessing the low carbon transition at Grangemouth 2025 A case study for measuring fairness,’ Just Transition Commission, [online]. Available at: https://www.justtransition.scot/wp-content/uploads/2025/07/Assessing-the-low-carbon-transition-at-Grangemouth-A-case-study-for-measuring-fairness.pdf
Jenkins, K., McCauley, D., Heffron, R., Stephan, H., Rehner, R., (2016) ‘Energy justice: A conceptual review,’ Energy Research & Social Science, 11, pp. 174-182. Available at: https://www.sciencedirect.com/science/article/abs/pii/S2214629615300669
Just Transition Commission, (2026a) ‘No Time to Lose Final report of Scotland’s second Just Transition Commission 2022-26,’ Just Transition Commission, 19 February, [online]. Available at: https://www.justtransition.scot/publication/no-time-to-lose-final-report-of-the-2nd-just-transition-commission-2026/
Just Transition Commission, (2026b) ‘Letter to Cabinet Secretary – Developing the Just Transition approach in the draft Climate Change Plan,’ Just Transition Commission, 9 January, [online]. Available at: https://www.justtransition.scot/publication/letter-to-cabinet-secretary-developing-the-just-transition-approach-in-the-draft-climate-change-plan/
Just Transition Commission, (2025a) ‘A Just Transition for Dumfries and Galloway’, 25 March, [online]. Available at: A Just Transition for Dumfries and Galloway – Just Transition Commission
Just Transition Commission, (2025b) ‘A Just Transition for Aberdeen and the North East’, 22 May, [online]. Available at: A Just Transition for Aberdeen and the North East – Just Transition Commission
Just Transition Commission, (2024) ‘Conditions for Success: Annual Report 2024’, 12 December, [online]. Available at: Conditions for Success: Annual Report 2024 – Just Transition Commission
Kaljonen, M., Paloviita, A., Huttunen, S., Kortetmäki, T., (2024) ‘Policy mixes for just transitions: A holistic evaluation framework,’ Environmental Innovation and Societal Transitions, 52(100885). Available at: https://doi.org/10.1016/j.eist.2024.100885
Kalt, T., Simon, J., Tunn, J., Hennig, J. (2023) ‘Between green extractivism and energy justice: competing strategies in South Africa’s hydrogen transition in the context of climate crisis’, Review of African Political Economy, 50(177-178), pp. 302–321. Available at: https://www.jstor.org/stable/48814433
Kelly, J. A., Deegan, C., Collins, A., Milimu, A., Kelleher, L., Farrugia Y., (2025) ‘Just Transition Indicator Framework for Ireland’, Environmental Protection Agency, [online]. Available at: https://www.epa.ie/publications/research/epa-research-2030-reports/Evidence-Synthesis-Report-6.pdf
Kelly, J. A., Clinch, P., Kelleher, L., Shahab, S., (2020) ‘Enabling a just transition: A composite indicator for assessing home-heating energy-poverty risk and the impact of environmental policy measures,’ Energy Policy, 146(111791). Available at: https://doi.org/10.1016/j.enpol.2020.111791
Lacey-Barnacle, M., Bird, C. M., (2018) ‘Intermediating energy justice? The role of intermediaries in the civic energy sector in a time of austerity,’ Applied Energy, 226, pp. 71-81. Available at: https://doi.org/10.1016/j.apenergy.2018.05.088
Lázaro Touza, L., Biones, A., Tirado Sarti, S., Averchenkova, A., López Gunn, E., Escribano, G., (2025) ‘From phasing-out to phasing-in: lessons from Spain’s just transition governance framework,’ Elcano Royal Institute, 27 February, ARI 30/2025, [online]. Available at: https://media.realinstitutoelcano.org/wp-content/uploads/2025/02/ari30-2025-lazaro-et-al-lessons-from-spains-just-transition-governance-framework.pdf
Marine Scotland (2020), ‘Oil and gas sector and infrastructure,’ Scottish Marine Assessment, December, [online]. Available at: https://marine.gov.scot/sma/assessment/oil-and-gas-sector-and-infrastructure
Mayer, A., (2018) ‘A just transition for coal miners? Community identity and support from local policy actors,’ Environmental Innovation and Societal Transitions, 28, pp. 1-13. Available at: https://www.sciencedirect.com/science/article/abs/pii/S2210422417302459
McCauley, D., Pettigrew, K.A., Heffron, R. J., Droubi, S., (2023) ‘Identifying, improving, and investing in national commitments to just transition: Reflections from Latin America and the Caribbean,’ Environmental and Sustainability Indicators, 17(100225). Available at: https://www.sciencedirect.com/science/article/pii/S2665972723000028?via%3Dihub
McMorran, R., Reed, M. S., Glass, J., Bauer, A., Glendinning, J., Macaulay, B., McKee, A., Peskett, L., Rothenberg, L., Rudman, H., Williams, A., (2022), ‘Large-scale land acquisition for carbon: opportunities and risks A SEFARI Special Advisory Group’, SEFARI, Scotland’s Rural College, [online]. Available at: https://sefari.scot/sites/default/files/documents/Final%20report%20v2.pdf
Mejía-Montero, A. (2025) ‘From “just” energy to energy justice? Imaginaries of fair wind power in the Isthmus of Tehuantepec, Mexico’, World Development, 195, p. 107135, pp. 1-11.
Merrell, I., Wheatley, H., Pate, L., Glendinning, J., and MacKessack-Leitch, J. (2025) ‘Rural Land Market Insights Report 2025’, Scottish Land Commission, [online]. Available at: https://www.landcommission.gov.scot/downloads/684fe32f5ede6_SLC-2025-Insights.pdf
Minadakis, P.,Vega-Araújo, J. (2024) ‘Rethinking the social license to operate? A theoretical exploration of its synergies with social acceptance and energy justice for a just transition,’ Energy Research & Social Science, 113(103552), pp. 1-11. Available at: https://www.sciencedirect.com/science/article/abs/pii/S2214629624001439
Morrissey, J., (2023) ‘Coastal communities, blue economy and the climate crisis: Framing just disruptions,’ The Geographical Journal, 189(2), pp. 283-299. Available at: https://rgs-ibg.onlinelibrary.wiley.com/doi/10.1111/geoj.12419
NatureScot (n.d.) ‘Peatland ACTION – Data mapping portal,’ [online]. Available at: https://www.nature.scot/climate-change/nature-based-solutions/nature-based-solutions-practice/peatland-action/peatland-action-data-research-and-monitoring/peatland-action-0
NatureScot, (2025) ‘NatureScot Research Report 1361 – SPANS Scotland’s People and Nature Survey 2023/24 – connection to nature,’ [online]. Available at: https://www.nature.scot/doc/naturescot-research-report-1361-spans-scotlands-people-and-nature-survey-202324-connection-nature
North Sea Transition Authority (NSTA) (n.d.) ‘Interactive maps and dashboards,’ North Sea Transition Authority, [online]. Available at: https://www.nstauthority.co.uk/data-and-insights/insights-and-analysis/maps-and-dashboards/ (NB: Decommissioning data by well can be found under the dashboard heading ‘Power BI’).
Office for National Statistics (ONS) (2026) ‘UK SIC 2026 revision process’, 11 February, [online]. Available at: https://www.ons.gov.uk/methodology/classificationsandstandards/ukstandardindustrialclassificationofeconomicactivities/uksic2026revisionprocess
Oliver, D., Solis, E., Lloyd, K., Heron, S., Lynn S., (2025) ‘Exploring a potential approach to understand and map the local level impacts and opportunities of a Just Transition to Net Zero’. Cardiff: Welsh Government, GSR report number 15/2025. 7 February, [online]. Available at: https://www.gov.wales/understanding-just-transition-approach
Poverty and Inequality Commission, (2023) ‘Learning from the Commission’s Experts by Experience Panel’, 22 December, [online]. Available at: https://povertyinequality.scot/publication/learning-from-the-commissions-experts-by-experience-panel/
Raymond, C. M., Stedman, R., Frantzeskaki, N., (2023) ‘The role of nature-based solutions and senses of place in enabling just city transitions,’ Environmental Science & Policy, 114, pp. 10-19. Available at: https://www.sciencedirect.com/science/article/pii/S1462901123000540
Rodhouse, T.S.G.H., Cuppen, E., Correljé, A., Pesch, U., (2024) ‘A new carrier for old assumptions? Imagined publics and their justice implications for hydrogen development in the Netherlands’, Technological Forecasting & Social Change, 204, pp. 1–13. Available at: https://papers.ssrn.com/sol3/papers.cfm?abstract_id=4044540
Roser, D., Seidel, C., (2016) ‘Climate Justice: An Introduction,’ Oxon, UK: Routledge. E-book available online at: https://doi.org/10.4324/9781315617961
Santos Ayllón, L. M., Jenkins, K. E. H., (2023) ‘Energy justice, Just Transitions and Scottish energy policy: A re-grounding of theory in policy practice,’ Energy Research & Social Science, 96(102922). Available at: https://www.sciencedirect.com/science/article/pii/S221462962200425X
Scottish Environment Protection Agency (SEPA) (n.d.) ‘Scottish Pollutant Release Inventory,’ [online]. Available at: https://beta.sepa.scot/topics/environmental-data-and-reporting/spri/
Scottish Environment Protection Agency (SEPA), (2025) ‘National Flood Risk Assessment 2025. Understanding Current and Future Flood Risk in a Changing Climate’, December, [online]. Available at: https://beta.sepa.scot/media/2kliy0j5/national-flood-risk-assessment-2025.pdf
Scottish Forestry, (2025) ‘Permissions for woodland creation,’ 22 February, [online]. Available at: https://www.forestry.gov.scot/do-i-need-consent-plant-woodlands
Scottish Government, (n.d.) ‘National Performance Framework’, [online]. Available at: [ARCHIVED CONTENT] National Performance Framework | National Performance Framework
Scottish Government, (2026a) ‘Scotland’s Climate Change Plan: 2026-2040. Annex 1 – Supporting Content’, 24 March, [online]. Available at: https://www.gov.scot/publications/scotlands-climate-change-plan-2026-2040-annexes/documents/
Scottish Government, (2026b) ‘Scotland’s Climate Change Plan: 2026-2040’, 24 March, [online]. Available at: https://www.gov.scot/publications/scotlands-climate-change-plan-2026-2040-annexes/documents/
Scottish Government, (2026c), ‘Just Transition Fund for the North East and Moray: applicant guidance 2026 to 2027’, 2 March, [online]. Available at: Commercial and public sector projects – Just Transition Fund for the North East and Moray: applicant guidance 2026 to 2027 – gov.scot
Scottish Government, (2026d) ‘A Circular Economy Strategy for Scotland – Appendix 2 – Circular Economy Indicators list including definitions and data sources’, 24 March, [online]. Available at: https://www.gov.scot/publications/circular-economy-strategy-scotland/documents/
Scottish Government, (2026e) ‘Scotland’s Climate Change Plan: 2026-2040 Annex 3 – Monitoring and Analytical Annex’, 24 March, [online]. Available at: https://www.gov.scot/publications/scotlands-climate-change-plan-2026-2040-annexes/documents/
Scottish Government, (2025a) ‘Just Transition: draft plan for transport in Scotland’, 24 February, [online]. Available at: https://www.gov.scot/publications/transition-draft-transition-plan-transport-scotland/documents/
Scottish Government, (2025b) ‘Supporting Scotland’s transition – land use and agriculture: consultation’, 6 August, [online]. Available at: https://www.gov.scot/publications/supporting-scotlands-transition-land-use-agriculture-consultation/documents/
Scottish Government, (2025c) ‘Grangemouth Industrial – just transition plan: supporting a fair transition for Scotland’s core manufacturing cluster,’ 18 June, [online]. Available at: https://www.gov.scot/publications/grangemouth-industrial-transition-plan-supporting-fair-transition-scotlands-core-manufacturing-cluster/documents/
Scottish Government (2025d) ‘Scotland’s Draft Climate Change Plan: 2026–2040,’ November, [online]. Available at: https://www.gov.scot/binaries/content/documents/govscot/publications/strategy-plan/2025/11/scotlands-climate-change-plan-2026-2040/documents/scotlands-draft-climate-change-plan-20262040/scotlands-draft-climate-change-plan-20262040/govscot%3Adocument/scotlands-draft-climate-change-plan-20262040.pdf
Scottish Government, (2025e) ‘The Environment Strategy for Scotland
Consultation Draft’, July, [online]. Available at: https://www.gov.scot/binaries/content/documents/govscot/publications/strategy-plan/2025/07/draft-environment-strategy/documents/environment-strategy-scotland-consultation-draft/environment-strategy-scotland-consultation-draft/govscot%3Adocument/environment-strategy-scotland-consultation-draft.pdf
Scottish Government (2025f) ‘FM: “Fair transition to net zero vital for Scotland’s economy”’ 29 October, [online]. Available at: https://www.gov.scot/news/fm-fair-transition-to-net-zero-vital-for-scotlands-economy/
Scottish Government (2025g) ‘Businesses in Scotland: 2025,’ 3 December, [online]. Available at: https://www.gov.scot/publications/businesses-in-scotland-2025/
Scottish Government (2025h) ‘Scotland’s Carbon Footprint 1998-2021,’ 8 April, [online]. Available at: https://www.gov.scot/publications/scotlands-carbon-footprint-1998-2021/pages/what-is-scotlands-carbon-footprint/
Scottish Government, (2025i) ‘Scotland’s Draft Climate Change Plan: 2026–2040 Annex 2 – Sectoral Annexes’, November, [online]. Available at: https://www.gov.scot/binaries/content/documents/govscot/publications/strategy-plan/2025/11/scotlands-climate-change-plan-2026-2040/documents/scotlands-draft-climate-change-plan-20262040-annex-2-sectoral-annexes/scotlands-draft-climate-change-plan-20262040-annex-2-sectoral-annexes/govscot%3Adocument/scotlands-draft-climate-change-plan-20262040-annex-2-sectoral-annexes.pdf
Scottish Government, (2024a) ‘Scottish National Adaptation Plan 2024-2029: Monitoring and Evaluation Framework’, September, [online]. Available at: SNAP3 Monitoring and Evaluation Framework
Scottish Government, (2024b) ‘Biodiversity strategy and delivery plan: governance, monitoring and evaluation’, 27 November, [online]. Available at: https://www.gov.scot/publications/biodiversity-strategy-delivery-plan-sbs-governance-monitoring-evaluation/
Scottish Government, (2024c) ‘Green Industrial Strategy’, 11 September, [online]. Available at: https://www.gov.scot/publications/green-industrial-strategy/documents/
Scottish Government, (2024d), ‘Scottish Government Urban Rural Classification 2022,’ 16 December, [online]. Available at: https://www.gov.scot/publications/scottish-government-urban-rural-classification-2022/pages/overview/
Scottish Government, (2023) ‘Draft Energy Strategy and Just Transition Plan – delivering a fair and secure zero carbon energy system for Scotland’, 10 January, [online]. Available at: https://www.gov.scot/publications/draft-energy-strategy-transition-plan/documents/
Scottish Government, (2022) ‘Scotland’s National Strategy for Economic Transformation’, 1 March, [online]. Available at: https://www.gov.scot/publications/scotlands-national-strategy-economic-transformation/documents/
Scottish Government, (2021a) ‘Just Transition – A Fairer, Greener Scotland: Scottish Government response’ 7 September, [online]. Available at: Just Transition – A Fairer, Greener Scotland: Scottish Government response – gov.scot
Scottish Government, (2021b) ‘Climate change – Net Zero Nation: public engagement strategy’, 16 September, [online]. https://www.gov.scot/publications/net-zero-nation-public-engagement-strategy-climate-change/
Scottish Government, (2020) ‘The Environment Strategy for Scotland: vision and outcomes’, 25 February, [online]. Available at: https://www.gov.scot/publications/environment-strategy-scotland-vision-outcomes/documents/
Scottish Government, (2016) ‘Fairer Scotland Action Plan’, 5 October, [online]. https://www.gov.scot/publications/fairer-scotland-action-plan/pages/6/
Scottish Index of Multiple Deprivation (SIMD) (2020) Scottish Index of multiple Deprivation, [online]. Available at: https://www.gov.scot/collections/scottish-index-of-multiple-deprivation-2020/
Scottish Parliament, (2019) ‘Climate Change (Emissions Reduction Targets) (Scotland) Act 2019’, [online]. Available at: https://www.legislation.gov.uk/asp/2019/15
Shapovalova, D., Potts, T., Bone, J., Bender, K. A., (2023) ‘Measuring Just Transition: Indicators and scenarios for a Just Transition in Aberdeen and Aberdeenshire,’ Just Transition Lab, University of Aberdeen, October, [online]. Available at: https://www.abdn.ac.uk/media/site/geosciences/documents/Report_Measuring_JT_Aberdeen_and_Aberdeenshire.pdf
Shejale, S., Xinyu Zhan, M., Sahakian, M., Aleksieva, R., Biresselioglu, M. E., Bogdanova, V., Cardone, B., Epp, J., Kirchler, B., Kollmann, A., Liste, L., Massullo, C., Schibel, K-L. (2025) Participation as a pathway to procedural justice: A review of energy initiatives across eight European countries,’ Energy Research & Social Science, 122 (103982).Available at: https://doi.org/10.1016/j.erss.2025.103982
Shen, W., Srivastava, S., Yang, L., Jain, K., & Schröder, P. (2020). Understanding the impacts of outdoor air pollution on social inequality: advancing a just transition framework. Local Environment, 25(1), pp. 1–17. Available at: https://doi.org/10.1080/13549839.2019.1687431
Simeone, L., Drabble, D., Morelli, N., de Götzen, A., (eds.), 2023 Strategic Thinking, Design and the Theory of Change. Edward Elgar Publishing. Accessed online.
Skills Development Scotland, (2021) ‘Climate Emergency Skills Action Plan 2020-2025’, [online]. Available at: https://www.skillsdevelopmentscotland.co.uk/media/w0ulewun/climate-emergency-skills-action-plan-2020-2025.pdf
Smith, K., (2011) ‘The Danish wind industry 1980–2010: Lessons for the British marine energy industry,’ Underwater Technology, 30(1). Available at: https://doi.org/10.3723/ut.30.027
Spanish Government (n.d.), ‘Plan estratégico de Actuación del Instituto para la Transición Justa, O.A. 2024-2026’, Ministry for the Ecological Transition and the Demographic Challenge, [online]. Available at: https://www.transicionjusta.gob.es/content/dam/itj/files-1/Documents/Plan%20de%20actuacion%20ITJ%202024-2026.pdf
Spanish Government, (2023), ‘Spain, 4 years towards a just energy transition,’ Ministry for the Ecological Transition and the Demographic Challenge, May, [online]. Available at: https://www.transicionjusta.gob.es/content/dam/itj/files-1/Documents/Publicaciones%20ES%20y%20EN/Spain_4%20years%20towards%20a%20just%20energy%20transition.pdf
Spanish Government, (2020) ‘Just Transition Strategy’, Ministry for the Ecological Transition and the Demographic Challenge, [online]. Available at: https://www.miteco.gob.es/content/dam/miteco/es/ministerio/planes-estrategias/transicion-justa/Just%20Transition%20Strategy_ENG.pdf
Stanley, T., Hirons, M., Turnbull, J., Lorimer, J., Mensah Kumeh, E., Hafferty, C., May Anderson, L., McDermott, C., (2025) ‘Just nature recovery: A framework for centring multispecies and multi-dimensional justice in land management’, environmental Science & Policy, 164(103992). Available at: Just nature recovery: A framework for centring multispecies and multi-dimensional justice in land management – ScienceDirect
Stilgoe, J., Owen, R., Macnaghten, P., (2013) ‘Developing a framework for responsible innovation,’ Research Policy, 42(9) pp. 1568-1580. Available at: https://doi.org/10.1016/j.respol.2013.05.008
Sun, L., Liu, X., Hu, Z., Zhang, J., Ducruet, C., Zhang, W., (2024) ‘Does just transition increase social and environmental risks? Evidence from global port cities development,’ Environmental Impact Assessment Review, 105(107370). Available at: https://www.sciencedirect.com/science/article/abs/pii/S0195925523003360
SYSTRA (2023a) ‘Proposed just transition baseline variables: built environment and construction sector,’ ClimateXChange, November, [online] Available at: https://www.climatexchange.org.uk/wp-content/uploads/2024/12/CXC-Proposed-just-transition-baseline-variables-built-environment-and-construction-sector-November-2023.pdf
SYSTRA (2023b) ‘Proposed just transition baseline variables: energy sector,’ ClimateXChange, November, [online] Available at: https://www.climatexchange.org.uk/wp-content/uploads/2024/12/CXC-Proposed-just-transition-baseline-variables-energy-sector-November-2023.pdf
SYSTRA (2023b) ‘Proposed just transition baseline variables: transport sector,’ ClimateXChange, November, [online] Available at: https://www.climatexchange.org.uk/wp-content/uploads/2024/12/CXC-Proposed-just-transition-baseline-variables-transport-sector-November-2023.pdf
Tafon, R., Saunders, F., Pikner, T., Gilek, M., (2023) ‘Multispecies blue justice and energy transition conflict: examining challenges and possibilities for synergy between low‑carbon energy and justice for humans and nonhuman nature,’ Maritime Studies, 22(45). Available at: https://doi.org/10.1007/s40152-023-00336-y
Tarfa, P., Bappa, B., Ogunleye, J., Igwebuike, S., Agbo, C., Otobo, O., Nwordu, M., Msheilla, H., (2024) ‘The Nigeria Just and Gender Inclusive Transition (JGIT) Monitoring, Reporting and Verification (MRV) Framework Report’, Initiative for Climate Action Transparency, June, [online]. Available at: https://climateactiontransparency.org/wp-content/uploads/2024/08/Deliverable-4b.-Final-JGIT-MRV-Report.docx.pdf
Transition Plan Taskforce (2024) ‘Putting People at the Heart of Transition Plans: key steps and metrics for issuers. An advisory paper from the TPT’s Just Transition Working Group,’ April, [online]. Available at: https://itpn.global/wp-content/uploads/2024/11/Just-Transition-1.pdf
Transport Scotland, (2024) ‘Monitoring and Evaluation Report 2024 – National Transport Strategy’, 19 December, [online]. Available at: https://www.transport.gov.scot/publication/monitoring-and-evaluation-report-2024-national-transport-strategy/
Transport Scotland, (2021) ‘Monitoring and Evaluation Strategy – August 2021 – National Transport Strategy’, 26 August, [online]. Available at: https://www.transport.gov.scot/publication/monitoring-and-evaluation-strategy-august-2021-national-transport-strategy/
Transport Scotland, (2022) ‘Monitoring and Evaluation 2019 Baseline Report – May 2022 – National Transport Strategy (NTS2)’, 8 June, [online]. Available at: https://www.transport.gov.scot/publication/monitoring-and-evaluation-2019-baseline-report-may-2022-national-transport-strategy-nts2/
Transport Scotland, (2020) ‘National Transport Strategy 2’, 5 February, [online]. Available at: https://www.transport.gov.scot/publication/national-transport-strategy-2/
Trueworthy, A., McCarrel, A., Wieliczkiewicz, J., Cellan, S., Peterson, W., Anderson, S., DuPont, B., Grear, M., (2024) ‘Who will be making wave energy? A community-driven design approach toward just and sustainable energy futures in Alaska’, Energy Research & Social Science. 115, pp.1–18. Available at: https://doi.org/10.1016/j.erss.2024.103615
Tschakert, P., Schlosberg, D., Celermajer, D., Rickards, L., Winter, C., Thaler, M., Stewart-Harawira, M., Verlie, B., (2020) ‘Multispecies justice: Climate-just futures with, for and beyond humans,’ WIREs Climate Change, 12(2). Available at: Multispecies justice: Climate‐just futures with, for and beyond humans – Tschakert – 2021 – WIREs Climate Change – Wiley Online Library
UK Government, (n.d.), ‘Renewable Energy Planning Database,’ 1 July, [online]. Available at: https://www.gov.uk/government/publications/renewable-energy-planning-database-monthly-extract
UK Government, (2026) ‘UK territorial greenhouse gas emissions statistics,’ 5 February, [online]. Available at: https://www.gov.uk/government/collections/uk-territorial-greenhouse-gas-emissions-statistics
United Nations, (n.d.) ‘The 17 Goals’, department of Economic and Social Affairs. Available at: THE 17 GOALS | Sustainable Development
Van Uffelen, N., Taebi, B., Pesch, U., (2024) ‘Revisiting the energy justice framework: Doing justice to normative uncertainties’, Renewable and Sustainable Energy Reviews, 189, Part A, 113974. Available at: https://www.sciencedirect.com/science/article/pii/S1364032123008328
van Vugt, J., de Ruiter, A., Henning, C., (2025), ‘Where to aim with multispecies climate justice? A critical realist account’, Environmental Politics. Available at: https://doi.org/10.1080/09644016.2025.2582121
Venture Taranaki (2020) Metrics and Evaluation. Transition Pathway Action Plan’, August, [online]. Available at: https://www.taranaki.co.nz/assets/Uploads/Like-No-Other/Metrics-TPAP-FINAL.pdf
Voar, (2024a) ‘A Just Transition for Shetland’, 24 September, [online]. Available at: https://www.justtransition.scot/wp-content/uploads/2024/09/Shetland-Community-Benefit-and-the-Energy-Transition-VOAR-Research-Accessible-Web-Version.pdf
Walsh, D., McCartney, G., Collins, c., Taulbut, M., Batty, G.D., (2016), ‘History, politics and vulnerability: explaining excess mortality in Scotland and Glasgow,’ Glasgow Centre for Population Health, May, [online]. Available at: https://www.gcph.co.uk/assets/000/000/367/Excess_mortality_final_report_with_appendices_original.pdf?1700036406
Welsh Government, (2022a), ‘Well-being of future generations: national indicators and milestones for Wales 2022 infographic’, [online]. Available at: https://www.gov.wales/sites/default/files/publications/2024-05/well-being-future-generations-national-indicators-2022-infographic.pdf
Welsh Government, (2022b), ‘Wellbeing of Wales: national indicators,’ 29 September, [online]. Available at: https://www.gov.wales/wellbeing-wales-national-indicators
World Benchmarking Alliance, (2025) Just Transition Methodology, February [online]. Available at: https://assets.worldbenchmarkingalliance.org/app/uploads/2025/02/Just-transition-methodology-2025_FINAL.pdf
World Wildlife Fund, (n.d.) ‘Territorial Just Transition Plan Scorecard Assessment’, World Wildlife Fund, [online]. Available at: https://www.wwf.eu/?9036866/Territorial-Just-Transition-Plan-Scorecard-Assessment
Appendices
The following tables detail (1) engagement with external (non-core Scottish Government) stakeholders through semi-structured and unstructured interviews and informal exchanges; (2) a list of workshop participants and (3) a descriptive list of areas across government that have engaged with and supported this work. Varying levels of detail on stakeholders reflect participant consents.
|
External stakeholders and public bodies |
Method |
|---|---|
|
NatureScot |
Semi-structured interview |
|
Poverty Alliance |
Semi-structured interview |
|
Scottish Trade Union Congress (STUC) |
Semi-structured interview |
|
Scottish Crofting Federation |
Semi-structured interview |
|
Community Land Scotland (shared project with Scottish Land Commission) |
Unstructured interview |
|
Just Transition Commission Secretariat |
Unstructured interview |
|
PhD researcher – qualitative framework development |
Unstructured interview |
|
Regional Inshore Fisheries Group |
Unstructured interview |
|
Sustainability impact consultant |
Unstructured interview |
|
Sustainability impact consultant |
Unstructured interview |
|
Scottish Climate Intelligence Service |
Meeting and email exchange |
|
Skills Development Scotland |
Meeting and email exchange |
|
Public Health Scotland |
Meetings and written feedback |
|
Academia – Just Transition M&E researchers |
Meeting |
|
IUCN UK Peatland Programme |
Email exchanges |
|
Scottish Environmental Protection Agency |
Email exchanges |
Table 1 (Appendix A): External stakeholder engagement list (by method and in alphabetical order)
|
Role |
Organisation (in alphabetical order) |
|---|---|
|
Environmental Projects Coordinator |
CEMVO Scotland |
|
ClimateXChange project lead |
ClimateXChange |
|
Culture/SHIFT programme manager |
Culture for Climate Scotland |
|
Director of Curriculum for STEM and Construction |
Forth Valley College |
|
Researcher |
Heriot-Watt University |
|
Just Transition Commissioner, Scotland Director for Business in the Community |
Just Transition Commission |
|
Secretary |
Just Transition Partnership |
|
Just Transition Communities Project Manager (Project & Practice Lead) |
NESCAN – Just Transition Communities Project |
|
Information Consultant, Climate Analyst Team |
Public Health Scotland |
|
Principal Information Analyst, Climate Analyst Team |
Public Health Scotland |
|
Strategy Lead, Just Transition Unit |
Scottish Government |
|
Head of Net Zero Economy and Carbon Markets |
Scottish Government |
|
Senior Manager, Sustainability, SSEN Transmission; and member, Climate Emergency Response Group |
SSEN Transmission; Climate Emergency Response Group |
|
Coordinator, Aberdeen Just Transitions Lab |
University of Aberdeen |
|
Operations Coordinator |
2050 Climate Group |
|
Organisation |
Workshop facilitator |
|
University of Edinburgh |
Research Fellow (Lara Santos Ayllón) |
|
University of Edinburgh |
Academic Project Lead (Kirsten Jenkins) |
|
Scottish Government (Climate Change Analysis Unit) |
Project representative (Emily Creamer) |
|
Scottish Government (Just Transition Unit) |
Project representative (Abi Whitefield-Stevens) |
Table 2 (Appendix A): Workshop participants (17 November 2025)
|
Scottish government focus areas |
|---|
|
Agricultural reform research, monitoring and evaluation |
|
City and Region Growth Deals |
|
Climate adaptation policy |
|
Climate adaptation research |
|
Community climate action |
|
Energy transition |
|
Fair Work Convention Secretariat |
|
Flood resistance policy |
|
Geospatial Analysis |
|
Heat research and analysis |
|
Industry Statistics |
|
Inshore fisheries |
|
Just Transition Unit |
|
Land use strategy |
|
Marine climate change and biodiversity policy |
|
National Performance Framework |
|
Natural capital markets policy |
|
Offshore wind policy – fisheries coexistence |
|
Peatland restoration delivery |
|
Poverty and deprivation |
|
Regional Partnerships |
|
Rural and Environment Science and Analytical Services (RESAS) – Environmental Analysis Unit |
|
Rural and Environment Science and Analytical Services (RESAS) – Rural communities research |
|
Scottish Forestry – woodland creation |
|
Transport Statistics |
Table 3 (Appendix A): Scottish Government areas (in alphabetical order)
The following table provides an overview of key Scottish Government JT policies and JT M&E publications by the JTC. It illustrates areas of overlap and difference in the use of M&E terminology and categorisation.
|
Key JT policy/ reports |
Owner |
Four themes |
Additional terminology/ categorisation used |
|---|---|---|---|
|
National Just Transition Planning Framework |
Scottish Government (2021) |
N/A |
Themes, outcomes |
|
Draft Energy Strategy and Just Transition Plan |
Scottish Government (2023) |
X |
Guiding principles, outcomes |
|
Draft Transport Just Transition Plan |
Scottish Government (2025) |
X |
Outcomes, bespoke stakeholder groups, action timeframes |
|
Draft Land Use and Agriculture Just Transition Plan |
Scottish Government (2025) |
X |
Outcomes, themes, objectives |
|
Grangemouth Industrial Just Transition Plan |
Scottish Government (2025) |
X |
Pillars, outcomes, levers |
|
Measuring and Evaluating Success in the Scottish Just Transition |
Drabble et al. (2024) (JTC) |
X |
Outcome clusters, proxy outcomes, ultimate aims, mechanisms, original outcomes |
|
Assessing the low carbon transition at Grangemouth: A case study for measuring fairness |
Jenkins et al. (2025) (JTC) |
X |
Outcome clusters, proxy outcomes, ultimate aims, mechanisms |
Table 1 (Appendix B): Overview of key JT policies and M&E framework terminology and categorisation approaches
This appendix provides a summary of each indicator, including target population, desired trend, data source and timeframe. It also provides a data quality assessment based on three key criteria: relevance, representativeness and data availability. These criteria were selected from SNAP3 (Scottish Government, 2024a) as the most relevant for this project. Each is categorised according to assessed indicator quality. They are colour coded red for low quality, amber for moderate quality and green for high quality. This is aligned with the approach in used in the SNAP3 M&E framework (2024a, p.35) and in the CCP (2026) (Scottish Government, 2026e). Table 1 below describes each quality assessment criterion and its rating. The table is amended from the CCP (2026).
|
Criterion |
Description |
Low |
Moderate |
High |
|---|---|---|---|---|
|
Relevance |
The indicator should relate clearly to the emissions source, climate resilience or just transition outcome it is designed to monitor |
Minimal or indirect relationship to emissions reductions, climate adaptation or just transition |
Some relationship to emissions reduction, climate adaptation or just transition but indirect or partial |
Clear and direct relationship to the emissions pathway, climate adaptation or just transition outcome |
|
Representativeness |
The indicator should be directly relevant to key dimensions of the just transition outcome it is designed to monitor |
The indicator doesn’t capture the key drivers of the expected emissions reduction, climate adaptation or just transition outcome |
Represents some important drivers but not the full picture |
Represents the key drivers of just transition, emissions change or climate adaptation |
|
Data availability |
Data should be regularly published, accessible and sufficiently robust |
Data unavailable, restricted, irregular or highly uncertain |
Data available but with limitations (lag, infrequent updates, quality caveats) |
Data regularly published, accessible, and statistically robust |
Table 1 (Appendix C): Criteria used to evaluate indicators (amended from the CCP (2026) (Scottish Government, 2026e).
Communities and Places
|
CP1: Proportion of people in Scotland reporting satisfaction with opportunities to influence (i) the Scottish Government’s approach to delivering net zero, and (ii) local policy and planning decisions relating to net zero Indicator information:
|
CP1: Indicator quality assessment
|
Criterion |
Rating |
Explanation |
|
Relevance |
High |
This indicator is rated high for relevance given it focuses directly on participation and policymaking in relation to net zero, which is key to a JT. |
|
Representativeness |
Moderate |
This indicator is rated moderate for representativeness given its direct relevance to JT concerns through a focus on participation and influence over net zero policymaking at national and local scales. Breakdown by demographic groups also reflects considerations of recognition and existing socio-economic inequities in relation to participation opportunities. It does not provide insight into the felt experiences of participation opportunities, and interpretations and experiences of influencing policy may vary across survey respondents. |
|
Data availability |
Moderate |
This indicator is rated moderate for data availability given that it depends on the annual commissioning of the Scottish Climate Survey. |
|
CP2: Proportion of people in Scotland reporting satisfaction with opportunities to influence net zero and climate adaptation developments happening in their local area. Indicator information:
|
CP2: Indicator quality assessment
|
Criterion |
Rating |
Explanation |
|
Relevance |
High |
This indicator is rated high for relevance given its direct focus on engagement and influence over net zero and climate adaptation developments. |
|
Representativeness |
Moderate |
This indicator is rated moderate for representativeness of JT concerns given its direct attention to issues of participation and influence over net zero and climate adaptation projects at local scales. Breakdown by demographic groups also reflects considerations of recognition and existing socio-economic inequities in relation to participation opportunities. It does not provide insight into the felt experiences of project engagement processes (e.g., consultations) and could underrepresent harder to reach populations, who are also often underrepresented in formal engagement processes. |
|
Data availability |
Moderate |
This indicator is rated moderate for data availability given that it depends on the annual commissioning of the Scottish Climate Survey. |
|
CP3: Number of community groups involved in climate action/sustainability activities, as recorded by the Climate Action Hubs (and case studies) Indicator information:
|
CP3: Indicator quality assessment
|
Criterion |
Rating |
Explanation |
|
Relevance |
High |
This indicator is rated high for relevance due to its focus on community-led climate action and sustainability initiatives, which related directly to JT outcomes. |
|
Representativeness |
Moderate |
This indicator is rated moderate for representativeness of JT concerns. Community-led and grassroots climate action more broadly are strongly associated to community empowerment and participation in the transition, both key dimensions of JT. Climate Action Hubs data is not representative of all community-led climate action across Scotland and may also include sustainability initiatives not directly related to net zero or climate adaptation. Engagement with the Climate Action Hub team can provide additional qualitative nuance, including insight into where community-led action is/ is not taking place and why, capturing considerations of spatial justice. Engagement with broader sectoral stakeholders can complement this indicator to provide a broader view of activity in Scotland. |
|
Data availability |
High |
This indicator is rated high for data availability given that membership data is already collected by the Climate Action Hubs. |
|
CP4: Geographical coverage of regional adaptation collaborations [once full coverage, updates on implementation] Indicator information:
|
CP4: Indicator quality assessment
|
Criterion |
Rating |
Explanation |
|
Relevance |
High |
This indicator is rated high for relevance due to its direct focus on climate adaptation and on partnership working for climate action. |
|
Representativeness |
Moderate |
This indicator is rated moderate for representativeness of JT concerns. Cross-institutional and cross-stakeholder partnership working has been identified as a key feature of JT. From an adaptation perspective, it captures a range of collaborations and their regional coverage. However, the data records Adaptation Scotland partnerships and may not capture all adaptation activity and collaborations within a region. |
|
Data availability |
Moderate |
This indicator is rated moderate for data availability given that data is collected directly from Adaptation Scotland. The data will not reflect all adaptation collaborations in Scotland. |
|
CP5: The proportion of people reporting that changes to their local place due to net zero infrastructure and/or land use change have maintained or improved the quality of their local area. Indicator information:
|
CP5: Indicator quality assessment
|
Criterion |
Rating |
Explanation |
|
Relevance |
High |
This indicator is rated high for relevance due to its direct focus on the impacts of net zero infrastructure and land use change. |
|
Representativeness |
Moderate |
This indicator is rated moderate for representativeness of JT concerns. It puts the focus on the local perceptions and implications of net zero developments to capture distributional issues of benefit and harm from net zero developments. The focus on ‘quality of their local area’ may be interpreted differently by respondents. It may also obscure issues relating to the processes by which developments happened. |
|
Data availability |
Moderate |
This indicator is rated moderate for data availability given that it depends on the annual commissioning of the Scottish Climate Survey. |
|
CP6: Area of community owned assets (in hectares) Indicator information:
|
CP6: Indicator quality assessment
|
Criterion |
Rating |
Explanation |
|
Relevance |
Moderate |
This indicator is rated moderate for relevance given that land ownership directly affects community participation in the transition. However, it does not directly focus on community ownership of assets relating to net zero or climate resilience. |
|
Representativeness |
Moderate |
This indicator is rated moderate for representativeness of JT concerns. Ownership and control over land enables direct access for communities to net zero opportunities, decision-making and benefits distribution. However, this indicator does not reflect the uses of community owned land nor the related impacts on stakeholders dependent on the land. |
|
Data availability |
High |
This indicator is rated high for data availability given that it is regularly collected by Scottish Government. |
|
CP7: Operational capacity of community and locally owned energy installations in Scotland. Include breakdown (i) by type of ownership (ii) by location and (iii) as a proportion of total renewable energy installed (that year/ overall). Indicator information:
|
CP7: Indicator quality assessment
|
Criterion |
Rating |
Explanation |
|
Relevance |
High |
This indicator is rated high for relevance given that the monetary and non-monetary benefits of community owned energy are well known and directly relate to JT outcomes and net zero. |
|
Representativeness |
Moderate |
This indicator is rated moderate for representativeness because it captures the megawatts of installed capacity but does not provide evidence of the benefit of this to communities. It does not reflect differences in who can and cannot become involved in community ownership initiatives and thus is not representative of socio-economic inequalities. Data breakdowns by type of ownership, by location and as a proportion of total renewable energy installed can provide a more nuanced understanding in this direction. Stakeholder engagement with representative organisations could provide qualitative insight in relation to involved groups and complement this data. |
|
Data availability |
Moderate |
Data are published on an annual basis as part of Energy Saving Trust ‘Community and Locally Owned Energy in Scotland’ report. The register is not compulsory so may not capture all projects. |
|
CP8: Average value of community benefits committed from renewable energy projects commissioned in the last 36 months, where a community or developer form is attached to a project. Indicator information:
|
CP8: Indicator quality assessment
|
Criterion |
Rating |
Explanation |
|
Relevance |
High |
This indicator is rated high for relevance given the focus on community benefits from renewable energy as a net zero development. |
|
Representativeness |
Moderate |
This indicator is rated moderate for representativeness of JT concerns. Community benefits payments are a recognised vehicle to distribute benefit locally and increase community wealth in response to implications of renewable energy developments (including, for example, landscape change, noise and economic opportunities). The indicator does not show the distribution of these benefits across Scotland nor within communities, nor how the funds are used. |
|
Data availability |
Moderate |
This indicator is rated moderate for data availability given that data is regularly collected by Local Energy Scotland. It is provided by developers, project owners and fund administrators on a voluntary basis, so the data may be incomplete. |
|
CP9: Engagement experiences of the fishing sector with offshore energy developments Indicator information:
|
CP9: Indicator quality assessment
|
Criterion |
Rating |
Explanation |
|
Relevance |
High |
This indicator is rated high for relevance given the expected impact of planned offshore energy developments (wind, tidal, wave) as part of the net zero transition. |
|
Representativeness |
Moderate |
This indicator is rated moderate for representativeness of JT concerns. Offshore energy developments create a recognised net zero pressure on the distribution of marine space. The fishing sector is facing cumulative pressures in part, because of the net zero transition. This indicator recommends qualitative engagement with sectoral stakeholders to understand transition dynamics between the offshore energy and fishing sector. This data will not be representative of experiences with every development underway in Scotland and may be highly variable. |
|
Data availability |
Low |
This indicator is rated low for data availability as this data is not currently collected. Stakeholder networks involving the Scottish Government through which to begin to collect this data are available. |
|
CP10: Distribution of marine space across activities, including % available for fishing Indicator information:
|
CP10: Indicator quality assessment
|
Criterion |
Rating |
Explanation |
|
Relevance |
High |
This indicator is rated high for relevance given the scale of potential offshore energy developments (wind, tidal, wave) as part of the net zero transition. |
|
Representativeness |
High |
This indicator is rated high for representativeness of JT concerns. Offshore energy developments are a clear net zero pressure on the use of marine space. The fishing sector is facing cumulative pressures, in part because of the net zero transition. Monitoring available marine space for fishing over time (and where possible, in relation to developing offshore energy projects and related installations e.g., subsea cables) can support distributional justice analyses across energy and fishing stakeholders and provide insight into transition dynamics. |
|
Data availability |
Low |
This indicator is rated low for data availability as this data is not currently collected in a monitorable format. The data exists and is regularly updated in an online map format by the Scottish Government Marine Directorate. |
|
CP11: Number of woodland creation projects registered with the Woodland Carbon Code (WCC) and peatland restoration projects registered with the Peatland Code (PC) owned by community groups and small landholdings; and as a % of total registered projects. Indicator information:
|
CP11: Indicator quality assessment
|
Criterion |
Rating |
Explanation |
|
Relevance |
High |
This indicator is rated high for relevance given the direct focus on natural capital projects developed for carbon offsetting for net zero. |
|
Representativeness |
Moderate |
This indicator is rated moderate for representativeness of JT concerns. Community and small landholding involvement in carbon offsetting projects reflects opportunities for smaller scale participation in carbon offsetting projects as a net zero opportunity. Delimiting ‘natural capital’ and carbon offsetting projects is challenging, and not all projects such projects will be registered with the WCC and PC. This indicator does not capture the impacts of these projects. |
|
Data availability |
Low |
This indicator is rated low for data availability as this data is not currently collected. Data exists on public WCC and PC registries. Specific community and small landholding data may be accessible through further analysis. |
|
CP12: Socio-economic benefits from woodland creation and peatland restoration Indicator information:
|
CP12: Indicator quality assessment
|
Criterion |
Rating |
Explanation |
|
Relevance |
High |
This indicator is rated high for relevance given the direct focus on the type and distribution of benefits from woodland creation and peatland restoration, both of which support net zero and climate resilience. |
|
Representativeness |
Moderate |
This indicator is rated moderate for representativeness of JT concerns. Woodland creation and peatland restoration will create diverse socio-economic benefits and their localised impacts across communities in Scotland directly affects distributional and procedural JT considerations. Defining and quantifying socio-economic benefits from natural capital projects (which are often not monetary benefits) is challenging. Qualitative data collection will support increasing understanding of these projects, their development processes and impacts. |
|
Data availability |
Low |
This indicator is rated low for data availability as this data is not currently collected. Potential stakeholders for qualitative data collection have been identified and have existing networks with the Scottish Government. |
People and Equity
Indicators PE1 and PE2 are covered by the quality assessment in Communities and Places and are not repeated below.
|
PE3: Percentage of dwellings in Fuel Poverty Indicator information:
|
PE3: Indicator quality assessment
|
Criterion |
Rating |
Explanation |
|
Relevance |
High |
This indicator is rated high for relevance given that fuel poverty is an existing, systemic injustice related to access and affordability of energy, a key sector in the transition to net zero. |
|
Representativeness |
Moderate |
This indicator is rated moderate for representativeness given the strong spatial dimension of fuel poverty in Scotland, where it is strongly characterised by its geographical distribution. Data by local authorities is only available every three years, however; and the indicator does not distinguish between fuel poverty and extreme fuel poverty, nor reflects the lived experiences of different households. |
|
Data availability |
High |
This indicator is rated high for data availability given that data is published annually as accredited official statistics. |
|
PE4: Housing with EPC C or above across housing/tenure types Indicator information:
|
PE4: Indicator quality assessment
|
Criterion |
Rating |
Explanation |
|
Relevance |
High |
This indicator is rated high for relevance given that increasing energy efficiency is a key vehicle for net zero, climate resilience, and addressing fuel poverty. |
|
Representativeness |
High |
This indicator is rated high for representativeness given that access to energy efficiency and retrofit solutions is often costly, challenging and is a key avenue to decrease poverty alongside emissions reductions. Inequalities of access to retrofit and efficiency solutions are spread across housing and tenure types, which will also be captured by this indicator. In Scotland, energy efficiency inequalities are also spatially distributed across geographies. |
|
Data availability |
High |
This indicator is rated high for data availability given this data is collected annually in the Scottish House Condition Survey. |
|
PE5: Percentage of people reporting that they can afford their individual transport costs Indicator information:
|
PE5: Indicator quality assessment
|
Criterion |
Rating |
Explanation |
|
Relevance |
High |
This indicator is rated high for relevance given that transport affordability is a key concern relating to the transition to net zero. |
|
Representativeness |
Moderate |
This indicator is rated moderate for representativeness given that it directly asks about issues of affordability and can monitor these across Scotland’s geographies (in which transport needs vary) and with attention to low levels of income. The indicator is based on a reported sense of affordability and could be impacted by various factors other than the net zero transition. Over time, however, as the transition to net zero unfolds, transport should not become unaffordable. |
|
Data availability |
High |
This indicator is rated high for data availability given this data is collected annually through the Scottish Household Survey. |
|
PE6: Number of people reporting they do not use public transport (buses) due to connectivity issues Indicator information:
|
PE6: Indicator quality assessment
|
Criterion |
Rating |
Explanation |
|
Relevance |
High |
This indicator is rated high for relevance given that transport connectivity is a key dimension of transport poverty which could be impacted by the net zero transition. Public transport is a key avenue for transport emissions reductions and is broadly more affordable transport, in particular by bus. |
|
Representativeness |
Moderate |
This indicator is rated moderate for representativeness given that it focuses directly on issues of connectivity. Connectivity is a challenging issue to capture due to its overlap with other considerations. This indicator is based on a combined analysis of data to the question of why respondents do not use public transport (SHS). The suggested analysis includes attention to the following responses: lack of service, too infrequent, takes too long, inconvenient, no direct route, unreliable. In addition, analysis should also include the response ‘use my own car’ overlayed with these issues. Geographical breakdowns reflect different transport needs across regions in Scotland. |
|
Data availability |
High |
This indicator is rated high for data availability given this data is collected annually in the Scottish Household Survey. |
|
PE7: (i) Proportion of adults within 5-minute walk of greenspace (ii) Extent of green-blue land cover in urban areas Indicator information:
|
PE: Indicator quality assessment
|
Criterion |
Rating |
Explanation |
|
Relevance |
Moderate |
This indicator is rated moderate for relevance given the role of greenspace in emissions reductions and increasing climate resilience, alongside the benefits from greenspace access for individuals. It is also important to monitor whether new net zero developments are reducing greenspace access. |
|
Representativeness |
Moderate |
This indicator is rated moderate for representativeness given that it does not reflect the quality, safety nor accessibility of greenspace. Increases in greenspace may not be reflected in responses based on the ‘5-minute walking distance’ perimeter. Greenspace access inequities would support JT analyses, but this is subject to data availability e.g., by SIMD percentile. |
|
Data availability |
High |
This indicator is rated high for data availability given this data is collected annually in the Scottish Household Survey and the Ordnance survey. The two data sources are used in SNAP3 for annual reporting. |
|
PE8: Proportion of people who agree that the transition to net zero and climate resilience will support a more positive future for young people and future generations in Scotland. Indicator information:
|
PE8: Indicator quality assessment
|
Criterion |
Rating |
Explanation |
|
Relevance |
High |
This indicator is rated high for relevance given that an expansive JT has a strong component of intergenerational justice, that is, protecting the planet today for younger people and the generations of the future. This is an underlying driver of the transition to net zero and climate resilience. |
|
Representativeness |
Moderate |
This indicator is rated moderate for representativeness given that respondents could have varying understandings of what the transition means, or what a ‘more positive future’ entails. |
|
Data availability |
Moderate |
This indicator is rated moderate for data availability given that it depends on the annual commissioning of the Scottish Climate Survey. |
|
PE9: Level of adaptation action being taken by people in Scotland Indicator information:
|
PE9: Indicator quality assessment
|
Criterion |
Rating |
Explanation |
|
Relevance |
High |
This indicator is rated high for relevance given it directly focuses on ability to engage in climate change adaptation. |
|
Representativeness |
Moderate |
This indicator is rated moderate for representativeness. The ability to adapt to a changing climate will be impacted by a range of factors, from systemic inequalities through to perceived risk and information and knowledge access. While this indicator captures self-reported data at an individual household level, it does not reflect institutional action to support climate resilience, for example, at local authority level. |
|
Data availability |
Moderate |
This indicator is rated moderate for data availability given that it depends on the annual commissioning of the Scottish Climate Survey. |
|
PE10: Hospitalisations by heat Indicator information:
|
PE10: Indicator quality assessment
|
Criterion |
Rating |
Explanation |
|
Relevance |
High |
This indicator is rated high for relevance given it directly focuses on the distribution of impacts from climate change. |
|
Representativeness |
Moderate |
This indicator is rated moderate for representativeness given that it captures a health concern relating to climate change impacts and by attention to affected populations such as older adults. The data is modelled and will not necessarily reflect the increasing adoption of adaptation measures. |
|
Data availability |
High |
This indicator is rated high for data availability given that the dataset is developed by Public Health Scotland with plans for annual publication and further development. |
|
PE11: Proportion of householders with prior flood claims who can receive quotes from 5 or more insurers Indicator information:
|
PE11: Indicator quality assessment
|
Criterion |
Rating |
Explanation |
|
Relevance |
High |
This indicator is rated high for relevance given it directly focuses on issues of accessing solutions for climate change resilience and adaptation. |
|
Representativeness |
Moderate |
This indicator is rated moderate for representativeness given that it reflects availability of flood insurance for readily impacted households, which has already been monitored at 100%. As flooding becomes more frequent in a changing climate, availability of flood insurance could be at risk of decreasing. The indicator does not reflect the affordability of this insurance, who can/cannot access it nor whether it is taken up. |
|
Data availability |
High |
This indicator is rated high for data availability for the data is collected annually from Flood-Re for SNAP3 M&E. |
|
PE12: Proportion of people living in a flood risk area who report an inability to implement flood risk measures Indicator information:
|
PE12: Indicator quality assessment
|
Criterion |
Rating |
Explanation |
|
Relevance |
High |
This indicator is rated high for relevance given it directly focuses on issues of accessing solutions for climate change resilience and adaptation. |
|
Representativeness |
Moderate |
This indicator is rated moderate for representativeness given that it focuses directly on affected populations by flood risk, and on adaptation capabilities. The implementation of flood resilience at a household level is challenging and very costly. This indicator only focuses on flood risk and does not capture broader risks of climate change and adaptation. |
|
Data availability |
Moderate |
This indicator is rated moderate for data availability given that it depends on the annual commissioning of the Scottish Climate Survey. |
|
PE13: Premature deaths due to exposure to fine particulate matter (PM2.5) (number of premature deaths) Indicator information:
|
PE13: Indicator quality assessment
|
Criterion |
Rating |
Explanation |
|
Relevance |
High |
This indicator is rated high for relevance given the expected positive implications of net zero for reductions in air pollution and the distributed impacts of current pollution across Scotland. |
|
Representativeness |
Moderate |
This indicator is rated moderate for representativeness of JT concerns. Reductions in harmful pollutants is a benefit across Scotland. Suggested geographical and demographic breakdowns draw attention to potential inequities in exposure to polluted environments and subsequent health impacts, which should improve in the transition to net zero. The extent to which this is an issue in Scotland is to be determined once data is collected. |
|
Data availability |
Low |
This indicator is rated low for data availability as this indicator does not currently exist. Advice from Public Health Scotland suggests feasibility of development. |
Jobs, Skills and Economic Opportunities
|
JSEO1: Employment (full-time equivalent) in the Low Carbon and Renewable Energy Economy (LCREE) in Scotland Indicator information:
|
JSEO1: Indicator quality assessment
|
Criterion |
Rating |
Explanation |
|
Relevance |
High |
This indicator is rated high for relevance given it is specifically focused on job creation in the net zero, low carbon economy. |
|
Representativeness |
Moderate |
This indicator is rated moderate for representativeness. The dataset cannot be broken down by geographies, demographic groups nor specific sectors. Capturing who can and cannot access low carbon jobs is thus an important gap in this indicator. The indicator also does not reflect the quality of these jobs. The LCREE data are survey-based estimates based on a sample, and results from sample surveys are always estimates and not precise figures. |
|
Data availability |
High |
This indicator is rated high for data availability given that it is annually published as official statistics by the Office for National Statistics (ONS). |
|
JSEO2: Total employment in Energy (including in renewables) Indicator information:
|
JSEO2: Indicator quality assessment
|
Criterion |
Rating |
Explanation |
|
Relevance |
High |
This indicator is rated high for relevance given the role of the energy sector in Scotland’s economy, and the significance of the energy sector in the move towards net zero. |
|
Representativeness |
Moderate |
This indicator is rated moderate for representativeness. Monitoring energy employment throughout the transition matters in the Scottish context given expected job losses in fossil fuel energy sectors alongside expected job creation in renewable energy. As a major sector driving activity in the net zero transition in Scotland, this justifies directed attention. If energy employment declines over time, there is reasonable scope to infer that the fossil fuel energy industry employment is not being replaced by growing renewable energy jobs. This indicator does not distinguish between types of energy sectors, occupation nor quality of jobs. It focuses solely on energy and hence on just one part of the net zero economy. |
|
Data availability |
High |
This indicator is rated high for data availability for the data is annually collected as official statistics by the Scottish Government. |
|
JSEO3: Employment in forestry and marginal employment changes from woodland creation Indicator information:
|
JSEO3: Indicator quality assessment
|
Criteria |
Rating |
Explanation |
|
Relevance |
High |
This indicator is rated high for relevance given the role of land use change activities in net zero and climate resilience. |
|
Representativeness |
Moderate |
This indicator is rated moderate for representativeness. As the transition unfolds, woodland creation is an economic and emissions reductions opportunity. This indicator captures changes in woodland creation employment, but this is only one of many forms of ‘natural capital’ employment. Not all woodland creation will be for the purposes of net zero or climate adaptation (but all woodland creation will impact emissions). |
|
Data availability |
High |
This indicator is rated high for data availability given that marginal employment changes are calculated annually by Scottish Forestry. In addition, Scottish Forestry also conduct ad hoc research providing further detail into employment impacts. |
|
JSEO4: Low Carbon and Renewable Energy Economy (LCREE) estimated direct and indirect turnover Indicator information:
|
JSEO4: Indicator quality assessment
|
Criteria |
Rating |
Explanation |
|
Relevance |
High |
This indicator is rated high for relevance given its attention to economic turnover in the net zero, low carbon economy. |
|
Representativeness |
Moderate |
This indicator is rated moderate for representativeness given that it is based on businesses self-reporting activity across a bespoke set of 17 sectors defined by the Office for National Statistics (ONS). LCREE estimates are survey-based and gather information from a sample of businesses rather than the whole population, so are subject to measurable sampling uncertainty. |
|
Data availability |
High |
This indicator is rated high for data availability given that it is annually published as official statistics by the Office for National Statistics (ONS). |
|
JSEO5: Businesses with 10+ employees with (i) a climate strategy (ii) biodiversity strategy (iii) publishing an annual sustainability report Indicator information:
|
JSEO5: Indicator quality assessment
|
Criteria |
Rating |
Explanation |
|
Relevance |
High |
This indicator is rated high for relevance given it provides information about business knowledge, planning and action towards climate change and climate adaptation in a transitioning economy. |
|
Representativeness |
Low |
This indicator is rated low for representativeness. It reflects self-reported commitments towards actions on climate change and biodiversity by businesses, which implies a level of awareness, responsiveness and adaptation by businesses to a changing climate and economy. The Business Insights and Conditions Survey does not include every sector and reports on businesses of 10+ employees. This excludes smaller businesses including sole traders, who make up the majority of businesses in the Scottish economy (in Businesses in Scotland, Scottish Government, 2025g). The data is self-reported and does not reflect actual adaptation or decarbonisation actions. |
|
Data availability |
High |
This indicator is rated high for data availability given that it is annually available through the Business Insights and Conditions Survey. |
|
JSEO6: Number of people in Modern Apprenticeships reporting that their apprenticeship is in a ‘net zero or green sector’ (i) 3 months and (ii) 15 months after finishing Indicator information:
|
JSEO6: Indicator quality assessment
|
Criteria |
Rating |
Explanation |
|
Relevance |
High |
This indicator is rated high for relevance given the direct focus on net zero or ‘green’ sectors in relation to skills development through apprenticeship training underway. |
|
Representativeness |
Low |
This indicator is rated low for representativeness. The indicator focus is directly relevant to JT concerns in the transition to net zero. However, apprenticeships are only one of many training and education pathways. The sample size will be too small for the Scottish Government to gain insight into skills development, training and retraining underway in Scotland as a whole. Still, a steady increasing trend of apprenticeships in green sectors, alongside monitoring decreasing inequalities across demographic groups, can be considered a positive trend overall. |
|
Data availability |
High |
This indicator is rated high for data availability because the data is collected on a rolling basis by Skills Development Scotland. |
|
JSEO7: Trade union membership density in Scotland Indicator information:
|
JSEO7: Indicator quality assessment
|
Criteria |
Rating |
Explanation |
|
Relevance |
High |
This indicator is rated high for relevance given the importance of worker representation and participation in decision-making throughout the transition to net zero and climate resilience. Trade union representation and access are core characteristics of the fair work economy, in line with Scottish Government commitments. |
|
Representativeness |
Low |
This indicator is rated low for representativeness given it focuses on trade union membership density in Scotland as a whole, and not in specific sectors relating to the net zero and climate resilience transition. In addition, trade union membership does not ensure worker participation in transition decision-making. Attention to trade union access would support a more nuanced view. |
|
Data availability |
High |
This indicator is rated high for data availability as this is annually collected as official statistics by the UK Government. |
|
JSEO8: Proportion (%) of employees earning less than the Real Living Wage Indicator information:
|
JSEO8: Indicator quality assessment
|
Criteria |
Rating |
Explanation |
|
Relevance |
High |
This indicator is rated high for relevance given the importance of quality and fair work jobs in the low carbon economy in Scotland. The real living wage is a key characteristic of a fair work economy, in line with Scottish Government commitments. |
|
Representativeness |
Moderate |
This indicator is rated moderate for representativeness given that it is not broken down by sectors and specifically, net zero and climate adaptation employment. However, it remains representative of a JT given the economy-wide implications of the transition in Scotland, across sectors. |
|
Data availability |
High |
This indicator is rated high for data availability given it is annually collected by the Office for National Statistics (ONS). |
|
JSEO9: The difference between male and female full-time hourly earnings in the transport sector (SIC H: Transportation and storage) Indicator information:
|
JSEO9: Indicator quality assessment
|
Criteria |
Rating |
Explanation |
|
Relevance |
High |
This indicator is rated high for relevance given the opportunity for increased pay equity in net zero and climate adaptation related sectors (as a key dimension of fair work), including transport. This indicator was identified in the Draft Transport JT Plan (2025). |
|
Representativeness |
Moderate |
This indicator is rated moderate for representativeness. It does not capture sub-sectoral categories of high emissions and low emissions transport, yet trends should highlight changes in the gender pay gap in transport overall. These can be contextualised within progress towards emissions reductions across sectors. |
|
Data availability |
High |
This indicator is rated high on data availability for it is annually collected by the Office for National Statistics (ONS). |
|
JSEO10: The difference between male and female full-time hourly earnings in the energy sector (SIC B: Mining and Quarrying; SIC D: Electricity, Gas, steam and air conditioning supply). Indicator information:
|
JSEO10: Indicator quality assessment
|
Criteria |
Rating |
Explanation |
|
Relevance |
High |
This indicator is rated high for relevance given the opportunity for increased pay equity in net zero and climate adaptation related sectors (a key dimension of fair work), including energy. |
|
Representativeness |
Moderate |
This indicator is rated moderate for representativeness given that current SIC code sectoral breakdowns for energy do not capture the full set of changing and new energy activities as a result of net zero. |
|
Data availability |
High |
This indicator is rated high for data availability for it is annually collected by the Office for National Statistics (ONS). |
|
JSEO11: The difference between male and female full-time hourly earnings in the construction sector. [SIC F: Construction] Indicator information:
|
JSEO11: Indicator quality assessment
|
Criteria |
Rating |
Explanation |
|
Relevance |
High |
This indicator is rated high for relevance given the opportunity for increased pay equity in net zero and climate adaptation related sectors (a key dimension of fair work), including construction. |
|
Representativeness |
High |
This indicator is rated high for representativeness given the expected activity in relation to buildings and construction as part of the transition to net zero and climate resilience. |
|
Data availability |
High |
This indicator is rated high for data availability given that it is annually collected by the Office for National Statistics (ONS). |
|
JSEO12: The difference between male and female full-time hourly earnings in the agriculture sector (SIC A: Agriculture, forestry and fishing) Indicator information:
|
JSEO12: Indicator quality assessment
|
Criteria |
Rating |
Explanation |
|
Relevance |
High |
This indicator is rated high for relevance given the opportunity for increased pay equity in net zero and climate adaptation related sectors (a key dimension of fair work), including in agriculture and land use. |
|
Representativeness |
Moderate |
This indicator is rated moderate for representativeness given that current Sectoral Industrial Classification (SIC) breakdown does not capture sub-sectoral categories of land use change relating to net zero and climate resilience activities. |
|
Data availability |
High |
This indicator is rated high on data availability for it is annually collected by the Office for National Statistics (ONS). |
|
JSEO13: (i) Number of renewable energy supply chain businesses in Scotland. (ii) Proxy: £ value of ScotWind projects committed to Scottish-based suppliers Indicator information:
|
JSEO13: Indicator quality assessment
|
Criteria |
Rating |
Explanation |
|
Relevance |
High |
This indicator is rated high for relevance given that the creation of renewable energy supply chain businesses in Scotland is a key opportunity for distributed benefit from the net zero transition. |
|
Representativeness |
Low |
This indicator is not currently available. The recommended proxy is rated low for representativeness. ScotWind offshore wind project supply chain commitments do not cover all supply chain activity in Scotland, do not represent all renewable energy activity Scotland, nor do they provide detail on business creation and growth. However, as an important energy development with recognised implications in Scotland, it serves as an interim proxy on whether economic opportunities from renewable energy are distributed across the Scottish economy. |
|
Data availability (proxy) |
Moderate |
The proxy indicator is rated moderate for data availability given that it is collected by Crown Estate Scotland through developer supply chain commitments. |
|
JSEO14: (i) Business resilience and ability to adapt to climate change and the transition (ii) Proxy (in the CCP, 2026): Proportion of small businesses in Scotland reporting the level of energy prices as an obstacle. Indicator information:
|
JSEO14: Indicator quality assessment
|
Criteria |
Rating |
Explanation |
|
Relevance |
High |
This indicator is rated high for relevance given the need to understand to what extent businesses in Scotland are resilient to climate change, and whether they are benefiting from or being negatively impacted by net zero. |
|
Representativeness |
Low |
This indicator is not available. The proxy indicator focused on small businesses reporting energy costs as an obstacle to their business is rated low for representativeness. A wide range of factors could be affecting energy prices and business success at different points in time, which makes it challenging to trace this back to the net zero transition itself. The potential impact on energy prices is just one of many ways in which small businesses may be affected by the net zero transition. |
|
Data availability (proxy) |
High |
The proxy indicator is rated high for data availability given that the data is annually collected in the Scotland Small Business Survey. |
|
JSEO15: Number of workers experiencing redundancy in high emitting industries in Scotland receiving support/ reporting that their employers are implementing transition plans for workers Indicator information:
|
JSEO15: Indicator quality assessment
|
Criteria |
Rating |
Explanation |
|
Relevance |
High |
This indicator is rated high for relevance given the implications of the transition to net zero for high emitting industries and their workforce. |
|
Representativeness |
High |
This indicator is rated high for representativeness, Managed, supported transitions for workers in high emitting industries is a core pillar of a JT, and the recommended survey should cover workers across high emitting sectors and in a range of occupations. |
|
Data availability |
Low |
This indicator is rated low for data availability because data is currently non-existent. |
|
JSEO16: High emitting industry worker participation in decisions affecting them Indicator information:
|
JSEO16: Indicator quality assessment
|
Criteria |
Rating |
Explanation |
|
Relevance |
High |
This indicator is rated high for relevance given the implications of the transition to net zero for high emitting industries and their workforce. |
|
Representativeness |
High |
This indicator is rated high for representativeness given that managed, supported and negotiated worker transitions driven by participatory processes are key to delivering a JT. The recommended survey should cover workers across high emitting sectors and in a range of occupations. |
|
Data availability |
Low |
This indicator is rated low for data availability because data is currently non-existent. |
|
JSEO17: Sense of uncertainty/ confidence in the transition amongst workers in high emitting industries Indicator information:
|
JSEO17: Indicator quality assessment
|
Criteria |
Rating |
Explanation |
|
Relevance |
High |
This indicator is rated high for relevance given the implications of the transition to net zero for high emitting industries and their workforce. |
|
Representativeness |
Moderate |
This indicator is rated moderate for representativeness. In a context of industrial change, including at times, site closure and redundancies, the sense of uncertainty and confidence in the transition should to some extent, reflect ongoing experiences with the transition and whether assurances and support are in place. |
|
Data availability |
Low |
This indicator is rated low for data availability because data is currently non-existent. |
Environment and Biodiversity
|
EB1: Emissions of the eight priority Air Quality pollutants (ammonia, carbon monoxide, nitrogen oxides, non-methane volatile organic compounds, particulate matter, sulphur dioxide and lead) for Scotland and by industrial sector Indicator information:
|
EB1: Indicator quality assessment
|
Dimension |
Rating |
Explanation |
|
Relevance |
Moderate |
This indicator is rated moderate for relevance given the expected impact of net zero actions on air pollutants and the implications this has for the future health of people and planet. |
|
Representativeness |
Moderate |
This indicator is rated moderate for representativeness given that air pollution has direct impacts on health across the population. The breakdown by industrial sector enables a degree of attention to where emissions are falling and which ones remain. However, the indicator does not show disproportionate impacts of air pollution on different groups or places, nor the distribution of responsibility for these emissions. Air quality in the UK is not just affected by emissions included in the National Atmospheric Emissions Inventory but also by secondary formation of air pollutants, emissions originating from outside the UK and geographical and meteorological factors. |
|
Data availability |
High |
This indicator is rated high for data availability given it is annually collected by the National Atmospheric Emissions Inventory. |
|
EB2: Improvements to water quality across types in Scotland Indicator information:
|
EB2: Indicator quality assessment
|
Dimension |
Rating |
Explanation |
|
Relevance |
High |
This indicator is rated high for relevance given that the transition to net zero should directly see decreases in water quality pollution from across industries (like fossil fuels and agriculture) but could also create risks to water sources (e.g., through wind farm installation). Annex 2 in the Draft CCP (Scottish Government, 2025i) also identified increased flood risk as posing risks to water quality. |
|
Representativeness |
Moderate |
This indicator is rated moderate for representativeness given that water quality in Scotland is key for healthy populations and ecosystems. However, the indicator does not capture where or by whom the risks and benefits of decreasing/increasing water quality are being felt because of net zero or climate adaptation interventions. |
|
Data availability |
High |
This indicator is rated high for data availability given it is annually collected by SEPA. |
|
EB3: Scotland’s carbon footprint expressed in million tonnes of carbon dioxide equivalent per year Indicator information:
|
EB3: Indicator quality assessment
|
Dimension |
Rating |
Explanation |
|
Relevance |
High |
This indicator is rated high for relevance given the role of embodied emissions in the move towards net zero and the focus of carbon footprint measurements on consumption emissions. Consumption emissions are those associated with the spending of Scottish residents on goods and services, wherever in the world these emissions arise, alongside emissions directly generated by Scottish households through private heating and motoring (Scottish Government, 2025j). This is different to reporting on the greenhouse gas emissions produced within a country’s territory (UK Government, 2026). |
|
Representativeness |
Moderate |
This indicator is rated moderate for representativeness given the implications of consumption, resource use and embodied emissions for a JT in relation to planetary boundaries. The indicator does not monitor the distribution of harm nor responsibility for Scotland’s carbon footprint. It also cannot reflect why the footprint is increasing/ falling. |
|
Data availability |
High |
This indicator is rated high for data availability given it is annually collected by the Scottish Government and trend data is available since 1998. |
|
EB4: Global biodiversity impact (Measures the effect of Scotland’s resource use on biodiversity domestically and abroad) Indicator information:
|
EB4: Indicator quality assessment
|
Dimension |
Rating |
Explanation |
|
Relevance |
Moderate |
This indicator is rated moderate for relevance given that the net zero transition will have indirect impacts on resource use. The biodiversity crisis is a key planetary boundary with implications for climate resilience more broadly.
|
|
Representativeness |
Moderate |
This indicator is rated moderate for representativeness given that the dynamics of resource use, emissions reductions and net zero are uncertain. |
|
Data availability |
Low |
This indicator is rated low for data availability. The indicator is taken from the Circular Economy Strategy (Scottish Government, 2026d). The Material Flow Accounts data is collected by Zero Waste Scotland, but data for this indicator currently unavailable. Frequency of data collection is currently unknown. |
|
EB5: Soil sealing Indicator information:
|
EB5: Indicator quality assessment
|
Dimension |
Rating |
Explanation |
|
Relevance |
Moderate |
This indicator is rated moderate for relevance given that the negative impacts of soil sealing on soil health can limit the potential benefits of healthy soils relating to water filtration and flood risk mitigation. Net zero developments like wind farms can have direct impacts on levels of soil sealing. |
|
Representativeness |
Moderate |
This indicator is rated moderate for representativeness given that the indicator does not show where or why soil is being sealed. The trade-offs between impacts on soil health for climate resilience versus the installation of a wind farm, for example, are uncertain. This indicator can be regarded alongside indicator EB6 on regeneration of vacant/derelict urban land. |
|
Data availability |
Moderate |
This indicator is rated moderate for data availability as data is collected by NatureScot from analysis of Ordnance Survey Mastermap data and NatureScot records of windfarm sites. There is historical data from 2009 to 2020, which was published in 2023. |
|
EB6: Regeneration of vacant / derelict urban land (% of which is regenerated through environmental restoration, for climate adaptation and by net zero initiatives) Indicator information:
|
EB6: Indicator quality assessment
|
Dimension |
Rating |
Explanation |
|
Relevance |
High |
This indicator is rated high for relevance given that environmental restoration of vacant and derelict land directly supports JT outcomes and has implications for climate resilience.
|
|
Representativeness |
Moderate |
This indicator is rated moderate for representativeness given that the currently available data maps known sites of derelict urban land alongside action being taken. Further analysis is needed to understand what type of site regeneration is underway (e.g., environmental) and whether this is supported by net zero projects. Qualitative case studies and engagement with energy developers on regeneration initiatives may be a useful source of detail on activity underway. |
|
Data availability |
Low |
This indicator is rated low for data availability. Although data is published by the Scottish Land Commission it is unclear whether it can be accessed and analysed to monitor this indicator. |
|
EB7: Number of hectares of newly protected land and marine features across Scotland Indicator information:
|
EB7: Indicator quality assessment
|
Dimension |
Rating |
Explanation |
|
Relevance |
High |
This indicator is rated high for relevance given the importance of environmental restoration for JT. Better protected land and marine areas will be more resilient to climate change impacts. |
|
Representativeness |
Moderate |
This indicator is rated moderate for representativeness given that measures of protection and restoration not covered by this dataset will not be reflected in the indicator. |
|
Data availability |
Moderate |
This indicator is rated moderate for data availability given that frequency of data updates is still to be decided (as assessed in the SNAP3 M&E framework, (Scottish Government, 2024a, p. 40). |
|
EB8: Carbon and social footprint of materials used for net zero developments in Scotland Interim proxy: Carbon Intensity of Materials: indicates whether a nation is consuming more sustainable alternatives, independent of trends in overall greenhouse gas impact. Indicator information:
|
EB8: Indicator quality assessment
|
Dimension |
Rating |
Explanation |
|
Relevance |
High |
This indicator is rated high for relevance given that net zero developments like renewable energy projects will have embodied, social and environmental impacts and emissions. These span from material extraction for technological and project development through to waste once projects are decommissioned.
|
|
Representativeness |
Low |
This indicator in unavailable. The proxy indicator is rated low for representativeness given that while it provides an overall picture of trends in the carbon footprint of materials used in Scotland, it cannot distinguish by sectors. |
|
Data availability (proxy) |
Low |
The proxy indicator is rated low for data availability. The indicator is taken from the Circular Economy Strategy (2026). The Material Flow Accounts data is collected by Zero Waste Scotland, but data for this indicator currently unavailable. Frequency of data collection is currently unknown. |
The following table illustrates the breakdown of the four outcomes into more granular focus areas. These were used as prompts during the workshop held on the 17 November 2025 and in semi-structured interviews, to stimulate discussion about possible indicators.
|
Theme and Outcome |
Potential focus areas for indicators, as directly relates to the process and outcome of net zero and climate adaptation: |
|
Communities and Places |
Locally and in relation to Scotland as a whole. |
|
People and Equity |
With particular attention to affected and disadvantaged households and places, from a financial and a spatial lens. |
|
Jobs, Skills and Economic Opportunities |
With particular attention to affected sectors and groups, alongside risks and opportunities for businesses and economic health more broadly. |
|
Environment and biodiversity |
|
Table 1 (Appendix D): Four JT outcomes and focus areas, prompts for discussion.
The four outcomes include indicators for which data is currently not available. These indicators represent key areas of JT concern. Stakeholder engagement and desk-based research have helped to identify possible avenues for further refinement and data collection. These indicators, their relevance for a JT in Scotland and possible avenues for data collection are expanded on below, categorised by outcome.
Communities and Places (indicators CP9-CP12)
CP9: Engagement experiences of the fishing sector with offshore energy developments
The fishing sector is experiencing cumulative pressures in part, because of the energy transition. This includes from marine surveying, subsea cable developments and the installation of offshore wind farms. Fishers face high levels of uncertainty regarding the cumulative impact of developments, both due to varying timelines for different projects and uncertainties around the long-term impacts of offshore energy production on the marine environment. The fishing sector is small in capacity and resource in comparison to large scale offshore wind developers, creating hierarchies of power and influence over decision-making. Often, the just-ness of engagement and decision-making processes depend on each individual developer’s approach. This project has not found quantitative data able to communicate this complexity. The recommendation is for the Scottish Government to monitor a qualitative indicator informed by iterative stakeholder engagement with key fisheries representatives (e.g. Regional Inshore Fisheries Group and others). Various forums involving marine stakeholders and the Scottish Government readily exist and could be a possible avenue for qualitative data collection.
CP10: Distribution of marine space across activities, including % available for fishing
Fishing stakeholders often refer to the experienced ‘spatial squeeze’ by the sector. This refers to the accumulating pressures of new blue economy activities, environmental protection and others and the overlap with – and shrinking of – traditional fishing grounds. Stakeholder insights suggested that potentially relevant indicators like ‘employment in fishing’ will be influenced by too many variables beyond the transition to net zero to be useful for JT M&E. However, monitoring available marine space for fishing over time should be able to increase understandings of ongoing spatial trade-offs in the marine environment, including in direct relation to fishing. The Scottish Government’s Marine Directorate publish an interactive website illustrating the distribution of marine space in Scotland. These visual maps are informed by backend data which could support trend analysis regarding % change in marine space available for fishing over time.
CP11-12: Land use change for net zero and climate resilience: ‘natural capital’ engagement processes, participation and distributed benefits
Research on the types of land use change activities and their implications as part of the transition to net zero and climate resilience illustrated the challenges of defining and monitoring these from a JT perspective. Stakeholders explained the difficulties in setting boundaries around the term ‘natural capital’ and what interventions do/ do not fall into the scope of net zero and climate adaptation efforts. Woodlands may be created for carbon offsetting purposes, for example, for social uses or for other economic productive uses like timber production or tourism; all of which could be considered ‘natural capital’. In addition, many of the benefits from natural capital are considered public goods. In this context, indicators CP11 and CP12 focus on issues of ownership and socio-economic benefits, based on insight from stakeholder discussions and identified avenues to trial data collection. Project ownership will largely be conditioned by land ownership. The benefits and costs of owning woodland creation or peatland restoration as a community will likely differ from those of community owned energy. This suggests the need for continued research in this area. Engagement key stakeholders such as Community Land Scotland and their Natural Capital Community Partnerships project will be important to better understand the implications of these projects from a JT perspective. This can enable qualitative data collection for monitoring alongside refinement of land use change JT indicators.
People and Equity (indicator PE13)
PE13: Premature deaths due to exposure to fine particulate matter (PM2.5)
This indicator draws attention to improved air quality and the health implications of existing pollution levels for Scotland, across different groups and in the most deprived areas. This indicator is available in England (Department of Health and Social Care, n.d.). It reflects distributional justice concerns associated with the unequal distribution of negative impacts from environmental pollution in the current, high carbon economy. This unequal distribution should be addressed throughout the transition to a low carbon one (Farrell, 2012; Shen et al. 2020; Sun et al. 2024). This includes attention both to the geographical distribution of premature deaths by air pollution, to different demographic groups and by levels of deprivation across Scotland. Drabble et al. (2024) included various indicators focused on the spatial distribution of pollution exposure (see p.26, p.28, p.42, p.46). Although this data is not published in this form at present, engagement with Public Health Scotland advised that the development of this indicator would be feasible.
Jobs, Skills and Economic Opportunities (indicators JSEO13 – JSEO17)
JSEO13: Number of renewable energy supply chain businesses in Scotland.
The development of a domestic renewable energy industry has been identified by the Scottish Government as a key economic opportunity from net zero for Scotland (e.g., in the Green Industrial Strategy, Scottish Government, 2024c). The growth of existing supply chain businesses in Scotland and development of new ones as renewable energy is installed would reflect a level of distributed benefit, in contrast with the UK experience with onshore wind in the 20th century (Smith, 2011; Brunt and Spooner, 1998). This indicator is not currently developed. Using UK SIC codes, the Scottish Government could first, identify sectors under which renewable energy supply chain activity would be categorised. It could then monitor business growth and business startups in these sectors, to assess whether there is a developing renewable energy supply chain.
Proxy: £ value of ScotWind projects committed to Scottish-based suppliers
The proxy indicator was identified with support from Scottish Government analysts. It is focused solely on ScotWind, the offshore wind leasing rounds led by Crown Estate Scotland. While offshore wind is not representative of the full renewable energy supply chain, the scale and breadth of expected offshore wind projects justify its use as a proxy (Crown Estate Scotland, n.d.). Developers bidding in ScotWind leasing rounds are required to detail their supply chain spend plans in Scotland. This is a suggested avenue for data collection.
JSEO14: Business resilience and ability to adapt to climate change and the transition
Businesses across Scotland will be affected by climate change and will need to adapt to these changes. They will also be affected by the transition to net zero and may benefit from or be harmed by related impacts. The evidence review alongside stakeholder engagement has highlighted an evidence gap regarding the vulnerabilities, risks and opportunities faced by different business types and scales in Scotland, in the context of climate change and the net zero transition. There are a variety of available, regularly updated data sources about businesses in Scotland (including: the Scottish Annual Business Statistics, Small Business Survey Scotland and Business Insights and Conditions in Scotland, amongst others). While some of these surveys ask businesses about climate change impacts or adaptation measures, this data is currently insufficient to convey business transition, vulnerability, risk and opportunity pathways from a JT perspective.
Proxy: Proportion of small businesses in Scotland reporting the level of energy prices as an obstacle
It is important for the Scottish Government to understand the ways in which energy prices are affecting business success. The proposed framework includes the JT indicator which was included in the CCP (2026) as a proxy. However, business energy costs may be affected by many variables, and is only one of a suite of dimensions reflecting business vulnerability and resilience to climate change and the transition. In addition, engagement with Scottish Government industry analysts suggested there are limited surveys for data collection on sole traders. Sole traders make up over 70% of Scottish businesses (in Businesses in Scotland, Scottish Government, 2025g). This suggests a clear opportunity for targeted data collection on the impacts and experiences of climate change and the transition across business types and scales.
JSEO15-17: Indicators relating to worker transitions
Evidence collected throughout this project has spotlighted the lack of data available/ accessible to understand ongoing industrial transitions and the processes, impacts and experiences of the workforce. Employment and skills development indicators included by Drabble et al. (2024) in their framework already highlighted this data gap, given that data could not be categorised e.g., by specific sectors. The framework proposed by this project includes indicators focused on support and participation experiences alongside a broader sense of uncertainty amongst high emitting industry workers. It recommends the development of a targeted survey alongside qualitative methods to understand what is happening in transitioning industrial sites on the ground. Stakeholders such as STUC recognised the challenges of reaching many workers, particularly those working offshore. Suggested methods include in person surveying in key sites of mobility, such as, for instance, Aberdeen Airport. All three indicators (JSEO15-17) can be supported with qualitative case study and experience data from key stakeholders such as STUC, who are involved in day-to-day experiences on the ground. This new data collection could be complemented with case study data from (i) workers accessing the Oil and Gas Transition Training Fund, (ii) workers experiencing redundancy in Grangemouth accessing skill support, and (iii) any other initiatives by Scottish Government to support managed transitions away from high emitting industries.
Environment and Biodiversity (indicator EB8)
EB8: Carbon and social footprint of materials used for net zero developments in Scotland
This indicator recognises that infrastructure developed for the purposes of net zero will also have social and environmental impacts. These impacts are spread throughout renewable energy technology and projects’ supply chains and lifecycles, from material extraction through to decommissioning and waste. This indicator targets responsible renewable energy developments and addresses procedural risks of greenwashing renewable energy production. Developers are increasingly conducting social and environmental lifecycle assessments as part of their project planning applications. The Scottish Government could explore the extent to which this data is accessible and collatable as a starting point for indicator data collection and monitoring. This data would allow for better understanding of net zero developments in Scotland at local and global scales, including the risks of offshored injustice (e.g., Healy et al. 2019).
This appendix details how this framework relates to existing JT indicators in the CCP (2026), the Grangemouth Industrial JT Plan and draft sectoral JT plans. Detailed attention is awarded to the JT indicators in the CCP (2026) given that it is the first Scottish Government publication to include a set of JT indicators for Scotland within statutory annual reporting.
Climate Change Plan (2026)
The CCP (2026) includes 12 JT indicators. This project developed in parallel to proposals for JT indicators in the Draft CCP (2025). However, this framework’s development process was separate. The proposed framework has parallels with, and at times departs from the JT indicators published in the CCP (2026). Table 1 below presents indicators in the CCP (2026) (Scottish Government, 2026e, p. 14) which are not included in the outcome indicator list in the proposed framework and provides a brief explanation as to why.
|
JT indicator in CCP |
Explanation |
|
Employment rate for people aged 16-64 in five local authorities with high socioeconomic dependence on oil and gas industries: (i) Aberdeen City; (ii) Aberdeenshire; (iii) Falkirk; (iv) Shetland Islands; and (v) Orkney Islands |
This is not in the full outcomes list in the JT M&E framework because it is part of the proposed hotspots approach. |
|
Proportion of households reporting that they are managing well financially in three local authorities with a high proportion of employment in oil and gas industries: (i) Aberdeen City, (ii) Aberdeenshire, and (iii) Falkirk |
This is not in the full outcomes list in the JT M&E framework because it is part of the proposed hotspots approach. |
|
Number of recipients of the Oil and Gas Transition Training Fund joint Scottish Government and UK Government initiative |
This indicator is removed from the proposed M&E framework. It is deemed too specific for a national JT M&E framework. It is more clearly policy-oriented than outcome focused. This indicator could support improved, case specific understanding of the transition in the northeast of Scotland, where the Transition Training Fund is being implemented. It could also support causal evaluations of place-based change alongside the articulation of mechanisms (not included in this report). |
Table 1 (Appendix E): JT indicators in the CCP (2026) not amongst the outcome indicators of this JT M&E framework.
Draft sectoral JT plans and the Grangemouth Industrial JT Plan
This project has delivered an M&E framework at a Scotland level and is thus less focused on granular assessment of the JT in the four net zero sectors identified by Scottish Government (energy, transport, agriculture and land use, buildings and construction). Similarly, the indicators in the Grangemouth Industrial JT Plan are directly relevant to the place and site-specific transition underway in the Grangemouth industrial cluster and will not apply to all transitions underway in Scotland as a whole.
The Jobs, Skills and Economic Opportunities outcome in the proposed framework includes fair work indicators. These focus on gender pay gap for energy, agriculture and land use, transport and buildings and construction. This selection was informed by indicators in the Draft Transport JT Plan (2025) and insight from the Fair Work Convention Secretariat. Additional sectoral breakdowns for other indicators in the Jobs, Skills and Economic Opportunities outcome (such as for trade union density/ access, or green jobs) are not possible with currently available data.
Some JT indicators relevant in the Grangemouth industrial cluster context (such as access to greenspace, attention to derelict sites or satisfaction with opportunities to influence decisions) are also reflected in indicators across the four outcomes in the proposed M&E framework. More broadly, draft sectoral JT plans, the Grangemouth Industrial JT Plan and their indicators were reviewed as evidence to inform this framework.
|
H |
Indicator (reported on per selected local authority) |
Desired trend (contextualised per hotspot) |
Data source |
Rationale |
|
H1 |
Employment rate for people aged 16-64 across Scotland |
Increasing |
Employment trends in hotspots are a key indicator of the workforce’s activity and mobility, both in places of industrial change/decline and in locations hosting large-scale net zero developments. | |
|
H2 |
Unemployment rate for people aged 16-64 across Scotland |
Decreasing |
Unemployment trends provide nuanced insight into changing employment patterns, often reflecting mobility challenges. Combined attention to employment and unemployment is inspired by Shapovalova et al. (2023). | |
|
H3 |
Number of people Not in Employment and Education or Training (16-19) |
Decreasing |
This indicator reflects a lack of engagement with available opportunities, by younger generations in sites of transition. An increasing trend draws attention to whether opportunities are available at all. It can highlight concerning transition dynamics in sites of industrial change and in contrast to pre-transition levels. | |
|
H4 |
Number of people in Modern Apprenticeships reporting that (i) their apprenticeship is in ‘green skills’/for the net zero economy’ during, 3-month and 15 months after finishing their apprenticeship and of these, (ii) number of people staying to work in their same Local authority. |
Increasing |
Although modern apprenticeships are just one of many education pathways, this indicator will reflect levels of training/retraining opportunities in ‘green skills’ in hotspot locations. | |
|
H5 |
Population change (with attention to in-out migration) |
Monitor |
Population changes capture multi-dimensional distributional burdens and opportunities in sites of transition over time. For example, this may include: depopulating areas due to industrial closure or large-scale industrialisation for energy production, or inward-migration due to employment creation as a result of transition interventions. | |
|
H6 |
Business activity/ survivability: Business birth and death rates |
Monitor, increasing survivability |
Scottish Government – Sub-Scotland Economic Statistics Database |
Levels of business birth and death are one way to monitor economic activity in a particular area. These data points can serve as an early signal of changing opportunities in a local economy, including highlighting risks of economic decline. |
|
H7 |
Sectoral economic dependence/diversification:
Contextualised within broader economic trends per local authority. |
Monitor |
Economic diversification was identified as an objective in the Scottish Government’s National Strategy for Economic Transformation (2022) and was identified by the JTC as a key strategic dimension of a JT (Just Transition Commission, 2024, p. 14). Sectoral clustering creates innovation and productivity benefits but also increases potential exposure to sector-specific shocks. This indicator supports monitoring of changing economic patterns in hotspots. However, ‘Economic diversification’ does not necessarily demonstrate either resilience or a JT. The Scottish Government should contextualise this indicator within broader economic trends per local area, and the insight from relevant teams and stakeholders. | |
|
H8 |
Proportion of households reporting that they are managing well financially |
Increasing |
This indicator provides annual data on felt financial wellbeing by households. It will be particularly relevant to monitor a sense of financial wellbeing on an annual basis in places experiencing industrial change. | |
|
H9 |
Median house price by Local Authority |
Monitor |
This indicator captures potential knock-on effects on house prices from changing land use in sites of transition. This may include the installation of energy infrastructure or natural capital projects. | |
|
H10 |
People reporting that they can afford their individual transport costs |
Increasing |
Through annual data, this indicator provides a frequent update on felt transport costs across households in sites of transition. In the case of net zero developments these are often rural and island areas with complex transport realities. | |
|
H11 |
Proportion of adults within 5-minute walk of greenspace |
Increasing |
This indicator monitors greenspace levels in places that will host net zero developments. This includes qualitative attention to reduced greenspace access from these developments (e.g., the Energy Transition Zone using part of St. Fitticks Park in Aberdeen. St Fitticks Park is in Torry, one of the more deprived areas of Aberdeen according to SIMD). | |
|
H12 |
Operational capacity of community and locally owned energy installations in Scotland. Include breakdown (i) by type of ownership (ii) by location and (iii) as a proportion of total renewable energy installed in local area. |
Increasing |
This indicator captures the multi-dimensional features of transitions given that sites of industrial change may also see community ownership developments. Hotspots of net zero transitions may see projects developing owned by a variety of different stakeholders. While community owned energy is identified as desirable from a JT perspective in Scotland, monitoring this in a hotspot context also enables qualitative attention to the benefits and potential harms of this type of ownership as well. | |
|
H13 |
Area of community- owned assets (in hectares) |
Increasing |
This indicator captures the multi-dimensional features of transitions given that sites of industrial change may also see community ownership developments. Community ownership of assets beyond energy also signals to opportunities to access transition opportunities beyond energy, alongside community wealth building and empowerment more broadly. | |
|
H14 |
Community benefits from energy (and for natural capital projects, once available) |
Increasing |
This indicator captures the multi-dimensional features of transitions. Sites of industrial change may also be hosting renewable energy developments making community benefit payments. In net zero development contexts this should increase alongside increasing renewable energy projects. This indicator will not, however, tell the Scottish Government the impact nor local acceptance of these benefits. Engagement with local stakeholders will provide nuanced insight through a JT lens. | |
|
H15 |
Number of hospitalisations due to alcohol use |
Decreasing |
This indicator is included as an early warning sign of deprivation in contexts of industrial change. It is taken directly from Shapovalova et al. (2023). | |
|
H16 |
Number of drug use hospitalisations |
Decreasing |
This indicator is included as an early warning sign of deprivation in contexts of industrial change. It is taken directly from Shapovalova et al. (2023). | |
|
H17 |
Worker participation in industrial change processes |
Increasing |
N/A |
Worker participation in industrial change processes is core to a JT, and hence directly relevant to hotspots of industrial change. Data is currently unavailable. Data collection through surveys and engagement with stakeholders like STUC is recommended. |
|
H18 |
Number of premature deaths by particulate matter (PM2.5) |
Decreasing |
N/A |
This indicator is included for both sites of industrial change and net zero developments. Decreasing emissions should decrease pollution in industrial sites, and inhabitants in these places may have also had higher historical exposure to pollutants. Increasing premature deaths by PM2.5 particulate matter in hotspots of net zero developments would be a clear warning sign of unexpected transition developments/ stagnant transitions. |
|
H19 |
Fuel poverty |
Decreasing |
Scottish House and Condition Survey By Local Authority – every 3 years |
This indicator monitors fuel poverty, which captures energy inequities affected by a complex array of factors. Fuel poverty could increase in areas experiencing industrial change while exacerbating felt injustices in locations hosting renewable energy production. Its inclusion also reflects the multi-dimensional aspect of transitions given that places potentially seeing negative consequences may simultaneously see e.g., falling levels of fuel poverty. |
|
H20 |
Proportion of people who agree that the transition to net zero and climate resilience will support a more positive future for young people and future generations in Scotland |
Increasing |
Scottish Climate Survey (proposed addition from Autumn 2026) By Local Authority – Every 3 years |
This indicator provides high level overview of perceptions of the transition by and for younger people in places directly witnessing transition impacts. This indicator is only available at local authority level every three years. |
|
H21 |
Proportion of people in Scotland reporting satisfaction with opportunities to influence (i) the Scottish Government’s approach to delivering net zero, and (ii) local policy and planning decisions relating to net zero |
Increasing |
Scottish Climate Survey (proposed addition from Autumn 2026) By Local Authority – Every 3 years |
This indicator captures the sense of influence over national and local policy relating to the transition. This is a key dimension of the JT for Scotland and directly relevant in places seeing targeted interventions and experiencing change. This indicator is only available at local authority level every three years. |
|
H22 |
Proportion of people in Scotland reporting satisfaction with opportunities to influence net zero and climate adaptation developments happening in their local area |
Increasing |
Scottish Climate Survey (proposed addition from Autumn 2026) By Local Authority – Every 3 years |
This indicator captures the sense of influence over net zero and climate adaptation projects in hotspots. This is a key dimension of the JT for Scotland and directly relevant in places seeing targeted interventions and experiencing change. It is directly relevant for net zero development hotspots and may also be relevant in hotspots of industrial change. This indicator is only available at local authority level every three years. |
|
H23 |
The proportion of people reporting that changes to their local place due to net zero infrastructure and/or land use change have maintained or improved the quality of their local area |
Increasing |
Scottish Climate Survey (proposed addition from Autumn 2026) By Local Authority – Every 3 years |
This indicator monitors mid-term experiences of change in sites of transition. It is directly relevant to net zero hotspots and may be relevant in industrial hotspots. It does not reflect the reasons for improved quality nor a breakdown by respondents. This indicator is only available at local authority level every three years. |
How to cite this publication:
Santos Ayllón, L. M., Jenkins, K. E. H., (2026) ‘Monitoring a Just Transition to a net zero and climate resilient Scotland’, ClimateXChange. DOI:
© The University of Edinburgh, 2026
Prepared by The University of Edinburgh on behalf of ClimateXChange, The University of Edinburgh. All rights reserved.
While every effort is made to ensure the information in this report is accurate as at the date of the report, no legal responsibility is accepted for any errors, omissions or misleading statements. The views expressed represent those of the author(s), and do not necessarily represent those of the host institutions or funders.
This work was supported by the Rural and Environment Science and Analytical Services Division of the Scottish Government (CoE – CXC).C
ClimateXChange
Edinburgh Climate Change Institute
High School Yards
Edinburgh EH1 1LZ
+44 (0) 131 651 4783
These themes were also referred to in the Draft CCP (2025), though they do not feature in the final CCP (2026). ↑
These four ‘themes’, now widely used across Scottish Government JT policy, are different in focus and definition to four ‘themes’ in the National JT Planning Framework (2021). The latter have not been returned to since. ↑
The National Performance Framework for Scotland is currently archived and under review. ↑
The draft Energy Strategy and JT Plan (2023) refers to the eight national JT outcomes in its Annex F to translate them into energy sector outcomes. ↑
The four themes are not referred to in the final CCP (2026). ↑
Some indicators such as ‘employment’, for example, were removed from the full outcome indicator list and integrated into the hotspots monitoring approach instead. ↑
With ‘net zero infrastructure and/or land use change’ this report refers to the installation of renewable energy production and related infrastructure (power stations, transmission lines), alongside projects of woodland creation and peatland restoration for net zero and adaptation purposes. ↑
JSEO indicators 9-12 focus on the gendered dimension of fair work in the four net zero sectors identified by the Scottish Government, following advice from the Fair Work Convention Secretariat and indicators in the Draft Transport JT Plan (2025). This framework prioritises gender pay gap as a measure of structural inequity. ↑
This caveat recognises that while the net zero transition will impact industries such as oil and gas, their declining activity in Scotland is also a result of various factors other than the response to climate change. These have been affecting these industries for some time (e.g., Shapovalova et al. 2023). ↑
Location quotient calculations were provided by the industry statistics area in Scottish Government, January 2026. ↑
The minimum threshold for installed capacity was 1MW until 2021, at which point it was lowered to 150kW. This means that projects below 1MW that were going through the planning system before 2021 may not be represented. ↑
For hotspots, trend three ‘economic trends in Scotland’ should also be complemented with economic trend data in the specific local authority monitored. ↑