
Research completed: January 2024
DOI: http://dx.doi.org/10.7488/era/4033
Executive summary
This study reviewed the use of fiscal levers to reduce greenhouse gas (GHG) emissions across the world. These levers include taxes, levies, duties or charges applied by governments on major sources of emissions.
It focused mainly on direct carbon taxes which are applied to specific goods – typically fuels – based on the amount or intensity of greenhouse gases they produce. It also considered indirect taxes, which place a price on other forms of pollution, such as air or water, but often target GHGs as well. Grants and subsidies are not in scope.
The study examined whether these levers have been effective in decreasing GHG emissions, the revenue that has been raised, and how governments have used that revenue. It looked at six international case studies in more detail. It also examined relevant fiscal levers currently applied in the UK and Scotland, and the possible implications for Scotland of adopting any new lever, based on the case studies. This study does not make policy recommendations, nor does it consider the costs and benefits if they were adopted.
Findings
The study focused mainly on the use of direct carbon taxes both nationally and sub-nationally (in specific regions or provinces within a country) around the world. Key findings are:
- The use of carbon taxes is increasingly common. There are 37 direct carbon taxes in 27 jurisdictions globally, most of them in Europe. Several jurisdictions outside Europe have adopted taxes and more are considering them. About 6% of global GHG emissions are taxed by carbon taxes and this share has increased over the past 15 years. Sub-national carbon taxes have also been applied by Canada and Mexico.
- Taxes differ in terms of GHG coverage and carbon price: We identified three broad categories:
- ‘High ambition’ instruments with both a relatively high price and coverage of GHGs;
- A mixed level of ambition, with either high prices and low coverage; or a high share but low prices;
- Relatively low prices and coverage.
- The balance of evidence suggests carbon taxes have reduced GHG emissions where adopted, but the data is limited, uncertain and rarely quantifies carbon leakage – when businesses transfer production to other countries with laxer emission constraints. Other regulatory measures are likely to be required alongside them to meet wider climate policy goals. There is limited detailed evidence on how affected businesses and households adjust behaviour in response to taxes.
- Carbon taxes have generated government revenue; between several billion dollars in Sweden to tens of million in Iceland. The potential for revenue generation depends on the prevailing carbon price and coverage of the tax, as well as the size of the economy, its carbon intensity and energy mix. They have been relatively straightforward and inexpensive to administer for governments. Some direct carbon taxes have been used to raise revenues for specific purposes. These have typically been channelled towards green technology and specific rebates or tax cuts for affected groups, including low-income households.
- Implementation has been politically challenging. Carbon taxes have been repealed in Australia, delayed in New Zealand and a planned acceleration of the carbon price was suspended in France. A legal challenge was brought in Mexico over whether the regional government had legal authority to implement a proposed tax.
Current fiscal levers in the UK and Scotland
Fiscal levers that target or address GHG emissions focus on energy and energy intensive industries, transportation and resource use. Examples include Fuel Duty, the Climate Change Levy, the Renewable Energy Obligation and the UK Emission Trading System, as well as Air Passenger Duty and vehicle excise duty. A devolved tax, the Air Departure Tax (Scotland) Act 2017, is being progressed, but needs to address the Highland and Islands exemption and safeguard connectivity. The Scottish Landfill Tax applies to waste disposed to landfill.
The introduction of new national devolved taxes can only be delivered by agreement of the Scottish and UK Parliaments or through a change to the devolution settlement. Four of the six case studies have similarities to UK levies, which would need amending, but two would be entirely new. We consider how elements of the case studies could be applied in Scotland but make no recommendations on whether this would be advisable.
Principles for implementation
Any financial lever would be designed based on the six principles in Scotland’s Framework for Tax: proportionality, efficiency, certainty, convenience, engagement and effectiveness. As such, the precise design of any lever would need to be subject to careful consideration and clear communication in terms of its scope, phase-in, price (including future price escalation), sectors and activities on which it is levied and any relevant exemptions. Distributional effects would have to be carefully considered, including if and how revenue should be reallocated, to whom and under what conditions.
Successful fiscal levers have been based on transparent design, regular monitoring and communication of revenues, costs and benefits, with rapid adjustments if unexpected adverse effects occur. They have formed part of wider fiscal reforms, with a clear strategic objective. Any potential options would be required to undergo extensive further consultation and robust impact assessment to fully understand the costs and benefits.
Glossary
|
1tCO2e |
One tonne CO2 equivalent. A metric that allows like for like comparison of carbon intensity |
|
Abatement technologies |
A technological mechanism or process that has the potential to reduce emissions or pollution |
|
Bonus Malus |
Latin for “good-bad”, used to describe an arrangement – or fiscal lever in this case – which alternatively rewards (bonus) and penalises (malus) specific purchasing behaviour. |
|
Carbon leakage |
A potential situation whereby carbon emissions were displaced, in whole or in part, from one jurisdiction to another, as a result of business production relocation in response to specific policies, for example. |
|
CBAM |
Carbon border adjustment mechanism. A fiscal lever which applies a carbo price to certain products imported into a jurisdiction |
|
CCC |
The Climate Change Committee. A statutory body established to advise the UK government and devolved administrations on emission targets, progress made in reducing GHG emissions and preparing for and adapting to the impacts of climate change. |
|
Counterfactual scenario |
Estimates or analysis of what would have occurred without the policy being adopted. It is used widely used in public policy analysis. |
|
Earmarking or hypothecation (of revenues) |
Commitments – whether set out in legislation, policy documents or via political statements – on specific uses of revenue from taxation (for example on tax rebates for low-income groups, of investment in green technologies) |
|
Ex-ante |
Translates from Latin as “before the event”. It refers to evidence based on prediction or forecast. |
|
Ex-post |
Translates from Latin as “after the fact”. It refers to evidence based on what actually occurred. |
|
ETS |
Emission trading scheme or emission trading system |
|
Fiscal levers |
An intervention or policy used by governments to affect financial revenue generated via taxes, duties, levies, charges (or fees). In this study the scope of the term excludes grants and subsidies. |
|
GHG |
Greenhouse gases, i.e., gases present in the earth’s atmosphere that trap heat. Examples include carbon dioxide (CO2), methane and industrial fluorinated gases hydro fluorocarbons (HFC, perfluorocarbons (PFC). |
|
IPCC |
Intergovernmental Panel on Climate Change. The United Nations expert body for assessing the science related to climate change. |
|
Negative externalities |
Where the social costs of a market transaction are greater than the private costs (for example air passengers may not pay the full costs of the damage from the carbon emission associated with their flight). |
|
Price elasticity of demand and supply |
An economic concept concerned with if, and to what extent, demand or supply of a good or service changes when its price does. It is calculated by observing changes in quantity of a good or service demanded (supplied), divided by the change in its price. Inelastic in this context means that demand (supply) does not change when prices do. |
|
Progressive and regressive taxation |
Terms which refer to the effects of specific taxes based on a person’s or a household’s income. Progressive refers to taxes which increase as a person’s income increases, for example income tax. Regressive taxes are applied uniformly, irrespective of income. The tax would then take a larger share of income from lower earners than from higher. For example, VAT is applied uniformly. |
Introduction
Scotland has a legally binding target to reach “net zero” by 2045, as well as annual climate targets. “Net zero” means reducing carbon emissions to almost zero, with any remaining emissions absorbed by nature (such as via forests) or by technologies (such as carbon capture and storage). Rapid transformation across Scotland’s economy and society is required to meet this goal and the Climate Change Plan sets out a pathway and policies to deliver the targets. The Scottish Government has also committed to a just transition, which endeavours to make rapid decarbonisation beneficial and positive for society. There is currently a gap in our evidence base on the potential role for fiscal levers to deliver reductions in greenhouse gas emissions. For the purposes of this study, we define fiscal levers as taxes, levies, duties, or charges. The use of subsidies, grants and loans are not in scope of this work.
We summarise the results of a targeted evidence review on the international use of fiscal levers seeking to reduce GHG emissions, which have either been considered or adopted by national or sub-national governments. We examine the evidence for how well certain fiscal levers have worked internationally, both in terms of reducing emissions of GHGs and in raising government revenue. We analyse six case studies in detail. After reviewing existing fiscal levers in Scotland, we also assess the potential implications for Scotland.
This report should not be interpreted to mean the Scottish Government intends to adopt the examples analysed in this report, nor any fiscal lever. The purpose is to provide an evidence base for the Scottish Government in their consideration of policy action as part of a strategic approach to climate change mitigation.
Overview of methodology
We conducted a targeted literature review of the global use of fiscal levers currently in place – or being considered – that seek to reduce GHG emissions, either directly or indirectly. We then selected six case study examples that were judged to be relevant to Scotland for further exploration. We conducted semi-structured interviews with academics and technical specialists and with experts in the case study jurisdictions to obtain greater insights. We also conducted a high-level review of existing environmental fiscal levers in the UK (including energy, transport and pollution or resources taxes), focusing the analysis on those that deliver reductions in GHG emissions. This was to help understand whether the six case study examples could be implemented by the Scottish Government under current devolved competencies, or whether their adoption would require joint action with the UK Government. More detail on the methodology we used is in Appendix A.
This approach has limitations. The project was undertaken over a short period, between July and October 2023. As such, the report presents selected results of a targeted search of a large secondary literature supplemented by the interviews referred to above, and it has not been possible to examine all issues in detail. No economic modelling has been undertaken on the potential scope or effects of the levers identified.
The use of fiscal levers for GHG emission reductions
Given the size of the literature and the complexity of the issues involved, we have simplified the review into a smaller number of lever typologies and identified lessons learned via successes and challenges encountered. The information in this chapter is drawn from secondary literature and a small number of targeted interviews with subject matter experts.
We have defined fiscal levers as a tax, duty, levy or charge. Typically enacted by a national or sub-national government, they seek to induce changes in behaviour of companies and consumers via changes in the prices of goods and services. This is sometimes referred to as ‘carbon pricing’, which means levers which apply a price to GHG emissions with the intention of reducing them. Carbon pricing can provide an effective and cost-efficient approach to reducing GHG emissions in multiple economic sectors. They do so by incentivising changes in behaviour, via changes in prices, on both the supply side (i.e., amongst the suppliers of goods and services to invest in new abatement technologies or more efficient processes or products) as well as the demand side (i.e., among consumers in their purchasing choices). They also have the potential to raise government revenue.
Economists often refer to GHGs (and other forms of pollution) as negative externalities. This is a type of market failure where the social costs (in this case the damages caused by climate change to current and future generations) are greater than the private costs from specific transactions (i.e., one only pays for the fuel, not the harm from emissions when filling a tank of petrol). A carbon price is a way of correcting the market failure by ensuring those wider costs are captured or ‘internalised’ in transactions (Coyle, 2020).
The scope of this study does not extend to any assessment of the use of grants and subsidies, including so called “environmentally harmful subsidies” (World Bank, 2023a). These have been considered in Scotland in separate work (Blackburn, 2022).
Typologies of fiscal levers
We developed a list of typologies of fiscal levers to enable their effectiveness to be assessed. We have taken a simple approach to aid clarity, and therefore define five broad types of fiscal lever for this study. These are broadly in line with the categories used by the World Bank (2023b). The types of lever are:
Direct taxation schemes
These are taxes which provide a direct price signal and have the explicit aim to reduce GHG emissions, often referred to in the literature as ‘carbon taxes’. They are levied on emissions, for example £ per tonne of CO2 equivalent (tCO₂e), or on £ on emissions per litre of fuel. Costs incurred increase in direct proportion to emissions, but costs may be reduced or avoided by changes to production processes or purchasing decisions, where feasible. In practice all such direct taxes are applied only to certain sectors or economic activities, with various exemptions. Given that the focus of the work are levers to reduce GHG emissions, we have focused our research on direct taxes, where the link to GHG reduction is clearest.
Indirect taxation schemes
These are taxes which provide an indirect price signal and may have multiple aims, which include addressing GHGs as well as other forms of pollution, such as air or water pollution. The tax may be applied on a range of activities but are not directly proportionate to embodied GHGs.As such there is a much wider range of such taxes in operation.We summarise such schemes at a high-level.
Carbon credit schemes
These are systems where tradable carbon credits (again typically representing 1tCO2e) can be generated via voluntary emission reduction activities. Such activities are varied and can include emission avoidance as well as removal, for example tree planting, or carbon capture and storage activities. These credits can be sold (either by businesses achieving the credits or the organisation that administers the scheme). Demand for such credits (and hence value) are generated via the requirements of other carbon pricing or climate change mitigation policies. These are discussed further below, but our research indicates they offer limited potential for revenue raising by a host government, so are not prioritised in this study.
Emission Trading Scheme (ETS)
A Government places a limit on the mass of GHG emissions from the affected entity (usually businesses within a defined economic sector, or undertaking specific economic activities, e.g. agriculture, or aviation) defined in the legislation. Emissions units or allowances, typically representing one tonne of CO2 equivalent (1tCO2e), are typically auctioned to businesses. These can be traded to enable them to emit GHGs, within a given period. The price from the auction and/or a traded second market represents the price of carbon. There are two main types of ETS:
- Cap and trade ETS: Governments set a cap on total GHG emissions from one or more economic sectors (or specific entities). They then sell allowances, typically in auctions, or distribute them for free (or a combination of both) up to the level of the cap. The cap (or the number of free allowances) may be progressively reduced. The European Union (EU) and UK ETSs are examples.
- Rate based ETS: Here the total emissions are not fixed, but entities are allocated a performance benchmark (typically based on the emission intensity of their output). This then serves as a limit on net emissions. Emission allowances can be earned where entities’ emissions are lower than the benchmark and these can then be traded with those who exceed it. The China national ETS system is an example.
The UK ETS replaced the UK’s participation in the EU ETS on 1 January 2021. The UK ETS applies in England, Scotland, Wales and Northern Ireland, whose governments comprise the UK ETS Authority. In Scotland, the Scottish Environment Protection Agency (SEPA) administer the scheme (UK Gov, 2023a). The UK ETS was originally based on the EU ETS but has since diverged in structure and operation. Given that Scotland currently has an ETS system, further research on such schemes have not been prioritised in the current research. However, in some jurisdictions, national governments have applied domestic ETS to additional sectors not covered by, for the example, the EU scheme. We refer to these as ‘national ETS’. These are included in the research as they could potentially be applied in Scotland.
Carbon border adjustment mechanism (CBAM)
These are policy mechanisms which impose a carbon price at the border on embodied emissions in specific goods imported from elsewhere. These seek to ensure a level playing field between the carbon price imposed via domestic legislation (such as via an ETS) and goods produced outside that jurisdiction as well as mitigate the risk of carbon leakage (i.e., displacement of carbon intensive activities outside of regulated jurisdiction) which may lead to a lower level of emission reduction overall.
The EU CBAM entered a transitional phase in October 2023. This is aligned with the phase-out of the allocation of free allowances under the EU ETS. The first reporting period ends on the 31st January 2024 (European Commission, 2023).
The UK Government is considering a range of further potential policy measures to mitigate the risk of carbon leakage in future. One such policy being considered is a UK CBAM. A consultation on these options was conducted jointly by HM Treasury and the Department of Energy Security and Net Zero between the 30th March and 22nd June 2023. The UK Government is currently considering these responses (UK Gov, 2023b). As such, this review does not focus on CBAM measures in other jurisdictions.
Direct taxation schemes
We used data from the World Bank carbon pricing dashboard (World Bank 2023c) to provide an overview of the characteristics of direct carbon pricing instruments as of March 2023. This dashboard identifies a total of 73 such instruments implemented in 39 national jurisdictions across the world. Together, these cover 11.6 gigatonnes CO2e (GtCO2e) of emissions (23% of global GHG emissions). Of these, 37 instruments are direct carbon tax instruments, the remainder are ETS instruments. These carbon taxes have been implemented in 27 national jurisdictions and they cover 2.7 GtCO2e about 5.6% of global GHG emissions. Several trends are evident from these data.
The vast majority of direct carbon tax instruments in operation are in high-income countries, particularly Europe. In terms of timescales for adoption the earliest adopters of national carbon tax instruments in the 1990s are in Northern Europe (Finland, Sweden, Norway, Denmark) but also Poland. The 2000s saw modest further adoption, with only Estonia, Latvia, Switzerland, Ireland and Iceland adopting national carbon tax instruments by 2010. Thereafter, several further European and Non-European countries adopted instruments (the UK Carbon Price Support and carbon taxes in France, Portugal, Spain, Ukraine, Japan and Mexico). These were followed relatively quickly by carbon taxes in Argentina, Chile, Colombia, then Canada, Singapore and South Africa.
In several jurisdictions, carbon taxes have been applied alongside national (or supranational) ETS instruments. These include several in EU Member States (including the UK at the time), as well as Mexico and Canada.
There are only two jurisdictions where sub-national carbon taxes are in operation. There are a total of five in Canada: British Columbia (BC) which was the first subnational carbon tax anywhere in the world; Northwest Territories; Newfoundland and Labrador; New Brunswick and Prince Edward Island. Mexico has several such instruments, the Zacatecas carbon tax, and instruments in Queretaro and Yucatan, for example. In both cases, these are applied alongside a national carbon pricing mechanism; the Canadian federal fuel charge and the Mexican carbon tax, respectively. As would be the case in Scotland, they are also applied alongside an ETS instrument (the Canadian Federal Output based Pricing System (OBPS) and the Mexican pilot ETS, respectively.
Recently, several further jurisdictions are considering instruments. These include the New Zealand agricultural carbon tax, and taxes in Indonesia and three African states: Botswana, Senegal and Morocco. Manitoba in Canada, Mexico (Jalisco), Catalonia and Hawaii are considering new subnational instruments.
Figure 3.1 provides a visual overview of carbon taxes that are either implemented (in operation), scheduled for implementation (adopted in legislation with an official start date) or under consideration (the relevant government has announced its intention to work toward an initiative). Those that are implemented or scheduled are in blue; those under consideration – four subnational taxes and five national – are in yellow.
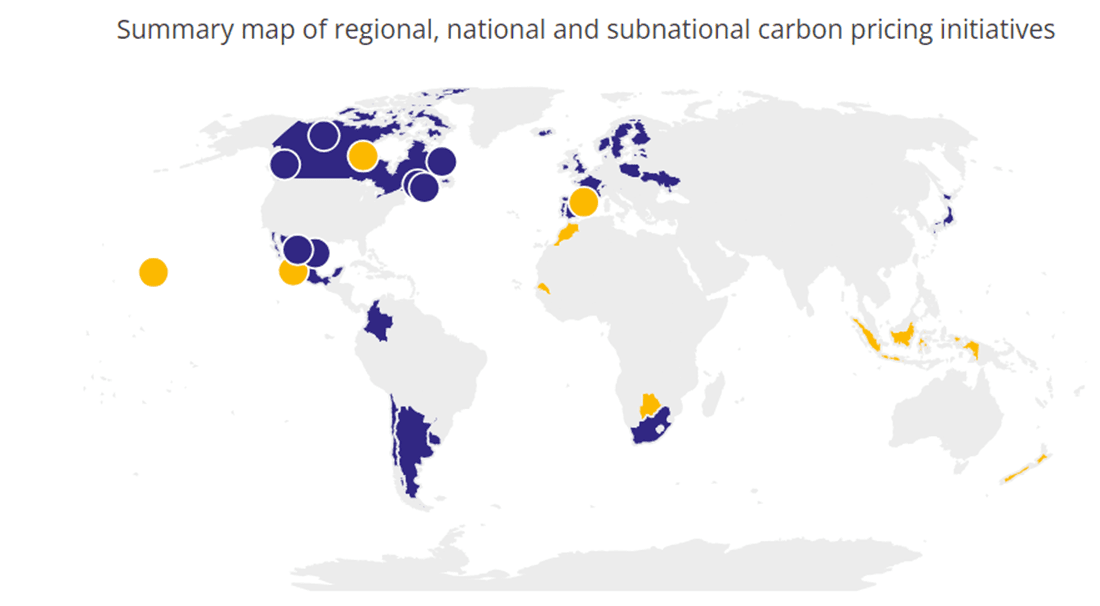
Figure 8.1 (Appendix C) provides time series data on the share of global GHGs covered in the various carbon tax instruments between 1990 and 2023. This provides an indication of the overall significance of their use globally. Note, due to data limitations the share of emissions shown in the figure from 2015 onwards is based on 2015 global emissions data. Several trends are evident, based on these data:
- As of March 2023, carbon tax instruments covered 5.4% of global GHG emissions. This was slightly down from a peak in 2019 of 5.7%. This is likely to reflect reductions in GHG emissions associated with mandatory lockdowns during the Covid-19 pandemic, alongside some emission reductions in at least some jurisdictions.
- Increases in coverage are evident in the last 15 years, arising from the introduction of new instruments in 2011 (Ukraine), 2012 (Japan), 2014 (France and Mexico), and 2019 (South Africa).
- Over the same period however, total global GHG emissions increased by around 50%, from about 31 million kilotonnes of CO₂e (ktCO₂e) in 1990 to over 46 million in 2020 (latest data). Whilst there are some uncertainties in the data, the overall rate of increase in global GHG does appear to have slowed after 2013 (World Bank 2023d).[1]
In terms of overall ambition for the carbon tax instrument, Figure 8.2 (Appendix C) presents data from March 2023 which compares the carbon price (in US Dollars per tCO₂e) with the share of GHG emissions that are covered by the relevant tax. The figure also shows ETSs for comparison. These data highlight that existing instruments vary in both price and coverage. Overall, we can identify three broad groupings based on the overall level of ambition of existing instruments:
- High ambition: those with relatively high carbon prices and relatively broad coverage as a proportion of total GHG emissions in that jurisdiction. The carbon taxes in Liechtenstein, Sweden, Switzerland, Norway and Finland are such examples.
- Mixed ambition: this is a larger group with some trade-offs apparent between share or price. For example, Uruguay’s carbon tax, levied on gasoline, provides the highest carbon price but only covers a small share (less than 20% of relevant GHGs). Conversely, Singapore and Japan have wider coverage but a lower price. Others have middling coverage and price, for example France, Canada’s federal fuel charge, Iceland, Denmark and Portugal.
- Low ambition: a smaller group with relatively low prices and coverage. For example, Poland, Estonia, Argentina, Chile and Colombia.
Indirect taxation schemes
The World Bank (2023) defines indirect carbon pricing as other policies which might change the price of products associated with GHG emissions, but they do so in ways not directly proportional to the emissions associated with those products. So these levers do not tax carbon or tax at a rate proportionate to carbon content. Rather, they tax carbon intensive activities or services (or focus on other forms of pollution, such as air pollution, which also has the benefit of producing GHG reductions alongside), hence indirectly create a carbon price signal and encouraging the reduction of GHG emissions. Indirect taxation schemes are therefore very broad. As such, the World Bank (2023c) note that indirect carbon pricing policies are far more common and wide-ranging than direct pricing. This diversity and the weaker causal link with reductions in GHG emissions present a challenge for assessing their effectiveness in this study. As a result, we have given them a lower priority than direct taxation schemes for the purposes of the evidence review.
Examples of indirect taxes exist across many different sectors. They include landfill taxes, such as those in place in Bulgaria (EEA 2022a) and Austria (IEEP, 2016a) or ‘pay as you throw’, schemes for example in Lithuania (EEA 2022b). Pay as you throw schemes are designed to incentivise citizens to separate their waste at source and charge a fee for the collection of residual waste from households.
France has a ‘General Tax on polluting activities’ which applies to companies which are engaged in the storage, thermal treatment or transfer of non-hazardous and hazardous waste (French Ministry of Finance 2023). Latvia employs a National Resources Tax (Latvian Ministry of Finance, 2020), which applies to the extraction of natural resources, environmental pollution, disposal and use of hazardous goods as well as the packaging used in business activities.
In the field of air quality, levers include the Bonus Malus Scheme in France (see Section 8.9 for further detail), air pollution load charge in Hungary, which applies to emissions of nitrogen oxides, sulphur dioxides and non-toxic dust (IEEP 2016b) and a tax on emissions of SO2 and NO2 in Galicia, Spain (Xunta de Galacia, nd). Other levers include an incentive fee on volatile organic compounds as is in place in Switzerland, and a Pesticide Tax (Sweden and Denmark).
Finland also employs a tax on peat use for energy. However, this represents a unique situation as peat is in fact subsidised in comparison to the tax rates of other fuels, and peat makes up a significant part of Finland’s energy mix.
Carbon credit schemes
We have used data from the World Bank carbon pricing dashboard (World Bank 2023c) to provide an overview of carbon credit schemes, their use, prominence in global trading, and role in international climate agreements.
Carbon credits are units that represent emission reduction activities that include either avoiding the carbon being produced (e.g., capturing methane from landfills), or removing carbon from atmosphere (e.g., sequestering carbon through planting trees or directly capturing carbon from the air and storing it). One credit is typically equivalent to one metric tonne of a carbon dioxide equivalent (tCO₂e) reduced or removed.
Carbon credit schemes create opportunities for investors and corporations to trade carbon credits. The carbon credit market has grown significantly since the concept was establish alongside the 1997 Kyoto Protocol. It experienced a further surge in interest following the Paris Agreement of 2015, more than doubling in size over five years (Dyck, 2022), though the sector grew less between 2021 and 2022, reflecting challenging economic conditions and criticism of the integrity of some schemes (World Bank 2023c). Carbon credits are supplied via regional, sub-national and national governments (such as the California Compliance Offset Program), at international scale through international treaties (such as the Kyoto Protocol and the Paris Agreement), and independently, via non-governmental entities (such as Gold Standard). The largest share of carbon credits is issued via independent non-governmental mechanisms, which had driven much of the overall growth seen between 2018 and 202.1 Figure 8.3 in Appendix C provides more detail.
The biggest driver for demand on carbon credits is companies purchasing credits, usually from independent suppliers, to compensate for emissions-heavy activities, either voluntarily or in response to regulation. However, carbon credits can be controversial because it is not always clear that carbon has in fact been saved or stored, and there are concerns with the ways in which schemes are set up, managed and promoted. The carbon credit market is currently evolving to respond to these concerns (Donaho, 2023).
Effectiveness of fiscal levers
We interpret effectiveness as the extent to which the policy has achieved its desired objectives and reached the affected group(s) (Scot Gov, 2018), compared to the starting (or baseline) position (i.e. has the instrument led to decreases in GHG emissions in the sector or activities targeted). We have also considered the extent to which impacts can be attributed to the policy in question, compared to other factors. We focus on the available secondary evidence and on direct tax examples. We have sought evidence on policy objectives of interest to the Scottish Government; namely the extent to which the instruments have resulted in GHG emission reductions, preferably where these have been quantified and attributed to the tax, and the extent to which they have generated revenues for the host government. Where possible, we consider whether the policy has brought about behaviour change in response to the tax. We have also considered data on the revenues that the tax has created, as well as how that revenue has been used by the host government. Other unintended impacts are noted, where evidence allows.
Before we consider data from specific instruments, a key broader conclusion is that several sources do not consider that existing carbon tax instruments are sufficient to address climate change goals. The Intergovernmental Panel on Climate Change (IPCC) estimated that to meet global GHG reduction requirements the average G20 economy needs to reduce its GHG emissions by over 10% every year (Green, 2021). The sources above suggests that the price and scope of existing instruments are not sufficient to deliver this kind of reduction.
Evidence on effectiveness – GHG emissions and behaviour change
In analysing the literature, we looked for secondary evidence on the overall effectiveness of different fiscal levers. Our assessment was limited by two key factors. First, it is not always possible to attribute GHG reductions to one policy instrument, compared to the various other factors influencing GHG emissions and all such estimates are subject to uncertainty. Possible other factors include rates of overall economic growth, growth within sectors, economic structure (i.e., size of emission intensive sectors and trends within these), imports and exports, as well as economic shocks such as recessions, the Covid-19 pandemic, and the Russian invasion of Ukraine. Similarly, there are several policies that may affect GHG emissions, so it can be difficult to ascribe GHG reduction to one climate-related policy over another. Second, there is a time lag between policy implementation and observed changes which, in this case, limits the available evidence.
Overall, the balance of evidence suggests that the fiscal levers reviewed have reduced GHG emissions in the relevant jurisdictions, but the precise reduction is unclear. A 2021 review (Green, 2021) collated available quantitative ex post evidence on GHG emissions reductions attributed to either ETSs or carbon taxes.[2] Key findings are below (note further detail is provided in Table 8.1 in Appendix C, which contains discussion on the findings of several specific studies, including quantitative GHG emission reduction estimates).
- Although carbon pricing has dominated many political discussions of climate change, only 37 studies assess the actual effects of the policy on emission reductions. Of these, the vast majority are focused on European examples. In turn, most of these examples focus on ETSs, rather than carbon taxes, per se. Similarly, there are few studies which compare either carbon taxes or ETSs to other climate change mitigation policies to establish the relative effectiveness and efficiency of policy measure or packages.
- Most studies suggest that the aggregate reductions from carbon pricing (note this refers to both ETSs and carbon taxes) on emissions are generally limited. The overall reductions observed were on average up to 2% per year (again this refers to both ETSs and carbon taxes). However, there is considerable variation in the GHG reductions seen between sectors.
- In general, the review concluded that the existing evidence suggested carbon taxes may have performed better than ETSs in producing emission reductions. Note this conclusion should be interpreted with caution; it may reflect the prevailing carbon price, rather than the mechanism itself and much of the evidence on emission reductions from ETSs discussed in the review focussed on the EU ETS. Some of the studies on which this conclusion is drawn are based on the pilot phase of the EU ETS, which involved free allocations to several sectors, a higher emissions cap and a relatively low carbon price. Future evidence should be monitored to examine whether that conclusion remains valid.
- However, there is more evidence that other regulatory instruments beyond either ETSs or carbon pricing probably have a greater effect than either measure acting alone. A 2020 study concluded that “the real work of emission control is done through regulatory instruments” (Cullenward and Victor, cited in Green 2021). A 2018 review provides some evidence that nations which are part of the EU ETS and are without a carbon tax experienced emission reduction in those sectors not covered by the ETS at a slightly faster rate than those that applied a domestic carbon tax, alongside the EU ETS (Haites, 2018, cited in Green 2021). There are clearly several factors at play.
- Experience to date indicates that in comparison with ETSs, establishing and administering carbon taxes in the host government are comparatively straightforward and inexpensive.
We have identified limited evidence on the behavioural effects of the taxes. Two studies (Tvinnereim and Mehling 2018, Rosenbloom et al 2020, cited in Green, 2021) consider this. They conclude that there is little evidence that the taxes directly result in wider decarbonisation. The studies suggest a more common response is to mitigate the flow of emissions, via fuel switching or efficiency improvements, rather than more significant changes in manufacturing process or technologies. This may be a product of the nature of the instrument, the activities on which the taxes are targeted or current relatively low prices. It may also reflect a lack of coordination of wider climate mitigation policy, which as we have seen above, is likely to be necessary to sustain wider emission reductions.
Evidence on effectiveness – Revenue generation and ‘hypothecation or earmarking’
We reviewed evidence on both the revenue generated by carbon taxes as well as how these revenues have been used. The available data reflects different time periods and there are some methodological inconsistencies. Two overall conclusions are apparent. First, that carbon taxes have generated substantial income for the host government. Second, that a key characteristic of carbon taxes in operation to date is that a substantial proportion of that revenue is often allocated (or ‘earmarked’ or ‘hypothecated’) for specific purposes. Occasionally this hypothecation is explicit in the legislation, hence legally binding, while in other cases this allocation is via a political commitment, hence potentially subject to change with associated changes in Government.
A 2016 review (Carl and Fedor, 2016) of 56 national or subnational instruments found revenues from carbon pricing (i.e., taxes and ETSs) amounted to $28.3 billion in 2013. Of this, well over $20 billion was raised from carbon taxes.[3] Of this only a small proportion of this revenue overall (about 15% was allocated to ‘green spending’. The review concluded that it was much more common for carbon tax revenues to be reallocated in the form of tax cuts and rebates and this accounted for about 44% of revenues at the time. About 28% were not allocated for a specific purpose, referred to as ‘unconstrained’. The same review indicates indirect taxes are often not reallocated for specific purposes (Carl and Fedor, 2016). Analysis of specific carbon tax instruments were also included, with results shown in Table 8.2 in Appendix C. These data indicate that taxes accounted for revenues between $30 million per year (Iceland) to $1 billion or more (Denmark, British Columbia and Norway). Sweden’s is by far the largest at $3.5 billion and it also has the largest per capita cost and share of GDP. These data indicate – at the time – that the most ambitious schemes constitute well under 1% of GDP. Further quantitative data is set out in Table 8.2 in Appendix C.
More recent data show that by 2022 (World Bank 2023), revenues from carbon pricing had increased significantly to $95 billion, of which carbon taxes generated 31% (just under $30 billion).[4] Although revenues from carbon taxes had increased, this had been driven by rising revenues from ETSs. The overall tax revenue is not just a by-product of prices, but of the share of GHG emission covered, exemptions, the carbon intensity of sectors, and carbon leakage. For example, South Africa’s carbon tax covers nearly 10 times more emissions than Colombia’s and at a higher rate but was delivering a similar amount of revenues (World Bank 2023).
For comparison, a more recent study based on 40 countries also examined the level and use of revenue (OECD, 2019). This source examines whether the revenue reallocations were legally binding (i.e., set out in the relevant legislative act) or based on a political commitment (i.e., via ministerial or policy statement). The review also provides further detail on precisely how the revenues have been used. These full data are produced in Table 8.3 in Appendix C.
Again, the data show that a consistent feature of carbon taxes is the extent to which the revenues are used for specific purposes; around two thirds of total revenues have some form of hypothecation or constraint. They have been particularly directed toward reducing the taxation burden in other spheres, such as associated with employment or in provision of direct financial relief or subsidy to specific groups. Moreover, the review found that introduction of carbon taxes has frequently been part of broader tax reforms and that it has been more common for carbon tax revenue to be allocated based on political, rather than legal commitments. The authors indicate that the tax reform potential of carbon taxes (i.e., reducing the tax liabilities from labour and capital) may form part of the motivation for adoption, alongside the climate mitigation potential in at least some jurisdictions (OECD, (2019).
Lessons learned
We reviewed evidence on where carbon taxes have been effective, as well as where setbacks have occurred and why. We highlight data gaps and conclude with recommendations identified in the literature on how a hypothetical UK carbon tax might be applied.
Are carbon taxes regressive?
A small number of studies have explicitly reviewed the evidence on distributional effects from carbon taxes (i.e., to whom the costs are incurred, with a particular focus on different impacts based on income) and whether carbon pricing results in generally progressive or regressive effects. For example, Ohlendorf et al (2018) provide a meta-review, but the information identified has generally focussed on low and middle-income countries and shown different results. The review notes that literature reviews have shown mostly regressive impacts in developed countries, but that this is not necessarily the case in developing countries. More progressive outcomes were observed for reforms that remove fossil fuel subsidies as well as some transportation policy. Overall, the review is inconclusive and provides limited lessons for Scotland. The tax itself is likely to be regressive, where additional costs incurred via carbon taxes are passed through supply chains to end users or consumers. Without the revenue recycling/rebate measures described above this may disproportionately affect those on the lowest incomes (Ohlendorf et al 2018, LSE, 2019). The UK Government Net Zero Review examines household exposure to the costs associated with the net zero transition. The review concludes that forecasting household costs in detail is not possible, but costs may fall on households via a number of routes. These include via Government decisions on tax and expenditure, via businesses and reflected in prices, wages and consumer choices (HM Treasury, 2021).
What has worked in the application of carbon taxes?
Overall, we found several examples where carbon taxes have been applied, maintained, contributed to emission reduction and generated revenue for the host government, whilst maintaining popular support. However, in every case, the design of the tax has considered the unique context in each jurisdiction.
A significant element of revenue recycling is a characteristic of most instruments adopted to date. An OECD review notes it has been possible, “in most circumstances”, to strike a balance between using the revenue in ways that are socially useful and that contribute to public support for carbon pricing. Such revenue recycling should not be seen as a panacea for public support, however. Introducing carbon pricing instruments generally is seen as more challenging when general public confidence in government is low (note this is not defined and is clearly relative). Such lack of confidence further limits the options for revenue use, by reducing the space for more significant tax reforms and increasing the political appeal for lump sum transfers of revenue (OECD, 2019).
Others have seen the degree of hypothecation of revenues as a way of ensuring ‘lock in’ of the front-end prices and increasing the overall longevity and stability of the instrument. For instance, by ensuring the back-end uses of the proceeds are visible, it is harder to change prices or exempt certain sectors for reasons of political expediency (Carl and Fedor, 2016).
A further balance must be struck between rigid hypothecation of the revenues, which may constrain flexibility, and the benefits of clearly communicating what revenues are being generated and how they are to be used. This communication is considered to be key for creating public support and any policy should be developed in conjunction with stakeholders and be subject to a detailed cost-benefit analysis (OECD, 2019).
Sweden’s carbon tax, for example, may be seen as an exception to this. Some analysis suggests that it has been subject to so many changes that the ultimate effect of the carbon tax is not clearly distinct from effects of other measures e.g., value added tax, excise duties, etc. (Carl and Fedor, 2016). However, what is clear from the Swedish example is that the tax was part of a wider reform which itself had a clear objective (Section 8.6). This may explain at least some of the public support, even with a relatively high carbon price.
The justification made at the time for the introduction of carbon taxes vary and are not confined to emission reduction objectives. For example, reducing taxation in other areas, such as on labour (British Columbia, Sweden) as well as using them for wider fiscal recovery after financial crisis (Ireland, Iceland). Other rationale includes the relative simplicity and stability relative to ETS instruments (Carl and Fedor, 2016).
In the past, carbon taxes have provided a degree of price predictability and of revenue certainty for the host government. For instance, the British Columbia government has been able to predict revenues at least a year ahead within a 5% margin for error (Carl and Fedor, 2016). This would seem to be a feature of the design of the tax (i.e., the sectors at which it is targeted and the overall share of GHG affected).
Gradual introduction of the tax was seen as a positive feature (for example British Columbia), avoiding a sudden increase in the cost base for affected sectors and mitigating unintended consequences. However, they are also seen as visible, tangible and “politically immediate” ways of demonstrating progress toward climate mitigation (Carl and Fedor, 2016, LSE, 2019).
What lessons have been observed in the application of carbon taxes?
It is equally important to draw lessons on where they have not worked or have encountered problems. Reflecting on implementation, we find that existing carbon taxes are generally not sufficient, either in price or scope, to meet existing climate policy goals.
Carbon taxes have also been politically difficult to implement. They have proved controversial in many jurisdictions, including several with similarities to Scotland. Green (2021) suggests this opposition comes from two sources. The first source is the emitting industries themselves. Second, some evidence is presented by Green (2022) that the public tend to prefer other policies to carbon pricing. Use of dividends (i.e., rebates) may mitigate this risk, but only as part of a wider climate change mitigation package of policy.
The review has identified several jurisdictions where significant setbacks have been observed. The clearest case is in Australia where an existing carbon tax policy was cancelled. The tax generated what were at the time the largest overall revenues and per capita costs in the world. This was despite having a carbon price ($30 per tonne as of 2016) which was comparable with other jurisdictions. The revenues were a product of the relative carbon intensity of the country’s – largely coal fired – energy generation infrastructure. Repealing the tax became a key element of the opposition party’s ultimately successful political campaign (Carl and Fedor, 2016).
Mexico is the first Latin American country which has introduced sub-national carbon taxes. Durango is the most recent State to enact one, in January 2023 and others are considering implementing them. Baja California (a Mexican State) introduced a carbon tax as of 2022 as a part of broader fiscal reforms. The tax was levied on emissions from gasoline and diesels. A legal challenge was subsequently brought in Baja California, by the Mexican Federal Government and a group of regulated entities. This argued that under the Mexican Constitution, only the federal government could implement a tax on fuels. The Mexican Supreme Court ruled in favour of the Federal Government (World Bank 2023c).
In France a planned acceleration of the carbon price increase was suspended in 2018. At that point the price was around $50 per tonne. This was in response to a public backlash on the perceived unfairness of the tax, which was introduced at the same time as broader reforms which were perceived as benefiting the wealthy (IMF, 2019). The wider backlash was epitomised by the ‘gilets jaunes’ or ‘yellow vests’ protests about fuel prices.
There are other examples where the instruments have been adjusted, paused, amended or the price escalator has been delayed or otherwise changed. For example, British Columbia and particularly New Zealand, where a proposed ‘fart tax’ was cancelled and an agricultural tax has been delayed (see Section 3.7.4).
A specific challenge is that the UK – and by implication, Scotland – has one of the most complex tax systems in the world. Some experts have consistently criticised a lack of an overall coherent tax strategy for the UK, particularly considering the implications of demographic changes for future taxation targeted at the economically active working age population (Johnson, 2023).
What are the data gaps?
Our review and the interviews have generated limited specific detail on impacts within affected sectors, as well as details on the behavioural response of those sectors. This reflects methodological challenges as well as time lags between policy action and observed effects. It has also identified limited quantitative information on carbon leakage. The emission reduction estimates are likely to be somewhat overstated, given that this has not been quantified.
Recommendations for the UK in the literature
A 2019 policy brief from the Grantham Institute reviewed the global evidence and provided a series of explicit recommendations for the UK if it were to implement a carbon tax (LSE, 2019). The recommendations were:
- The tax rate should be high enough to be consistent with net zero policy objectives. This implied a starting rate somewhere around £40 per tonne (as of 2020) (note this also depends on the scope of the tax, which is not specified in detail in the paper, but would need to be applied “in most sectors”). It should complement and be carefully designed alongside other climate change mitigation policies.
- Credibility requires clear rules, a design that is not susceptible to political pressure and visibility on how the trajectory of prices or scope may change over time (i.e., annually, based on factors like investment cycles or emission performance).
- The price should start low and rise over time. This doesn’t only allow affected industries time to respond but allows evidence on effectiveness and any unintended effects to be observed in practice.
- The use of the proceeds should be carefully and regularly explained alongside information on the economic, social and environmental costs and benefits (via a published, independent cost-benefit analysis, for example).
Case studies
To gain further depth on specific international examples of fiscal levers, we assessed six case studies in further detail. Their selection was based on six predetermined criteria (see Section 8.1.2 in Appendix A on the methodology for the overall study for more detail). An overview of the selected case studies, and the accompanying rationale for their selection against these criteria is in Table 3.1, below. Each criterion has been assigned a red [R], amber [A] or green [G] (RAG) rating. This is based on a judgement of the researchers on the overall similarities between the case study jurisdiction and the Scottish context. For comparison, the Scottish population was some 5.4 million (in 2022), whilst GDP per capita was $42,362 (in 2021).[5] Given Scotland’s devolved powers to create taxes with consent of UK Parliament, we include examples where instruments have been applied sub-nationally (for example Canada, Wallonia). There are cases which include rural and island communities or significant renewable energy generation potential (for example New Zealand). Scotland’s ambition is for Net Zero by 2045 and 75% reduction in emission by 2030, so we have selected jurisdictions with similarly ambitious targets (for example Sweden and Austria).
We discuss key features and potential lessons for Scotland in Sections 3.7.1 to 3.7.4 below the table. Full details of the case studies are in Appendix D.
|
British Columbia |
Sweden |
Austria |
New Zealand |
France |
Wallonia | |
|---|---|---|---|---|---|---|
|
Overview of instrument |
Direct carbon tax, applied to fuels based on their CO2 content |
Direct carbon tax, applied to fuels based on a CO2 price per tonne |
National ETS scheme which augments the EU ETS and applies to sectors excluded from it |
Agricultural tax, applying a farm-level levy on GHG emissions |
Bonus Malus scheme with fees on purchase of new emission intensive vehicles and rebates for electric vehicles |
Indirect tax on environmental impacts from farming, focussed on water resources |
|
Population and GDP per capita |
5 million (2021) and $59,962 [G] |
10.5 million (2022) and $65,157 (2021) [A] |
9 million (2022) and $59,991 (2021) [A] |
5.1 million (2022) and $47,982 (2021) [G] |
68 million (2022) $55,064 (2022) [A] |
3.6 million (2022) and €31,568 (2021) [A] |
|
Administrative and legal arrangements/ competencies |
Sub-national tax, with separate federal tax system [G] |
National level tax, alongside EU ETS [A] |
National ETS designed around EU ETS [G] |
A proposed national-level tax [A] |
National level indirect tax [A] |
Indirect tax at sub-national level [G] |
|
Shared challenges |
Significant renewable energy use (largely hydropower), rural communities [G] |
Rapidly growing renewable energy potential, Rural and Island communities [G] |
Rapidly growing renewable energy potential, rural communities [A] |
Significant renewable energy potential, Peatland[G] |
Increasing renewable energy potential, rural communities [G] |
Increasing renewable energy use [G] |
|
Climate ambition |
Net Zero by 2050 [A] |
Net Zero by 2045 [G] |
Net Zero by 2040 [G] |
Net Zero by 2050 [A] |
Net Zero by 2050 [A] |
80-95% reduction in emissions by 2050 [A] |
|
Data and Evidence |
Good level of evidence [G] |
Good level of evidence [G] |
No ex-post evidence, but detail on design/expected impacts [G] |
Implementation lessons only [R] |
Good level of evidence [G] |
Good detail on lever design, limited evidence on effectiveness [A] |
|
Diversity of Approaches |
Sub-national direct carbon tax [G] |
Longstanding and highest priced direct carbon tax [G] |
National level ETS [G] |
Novel concept [G] |
Indirect tax, administered nationally [G] |
Indirect tax, administered at sub-nationally [G] |
Impact on GHG emissions
The available evidence linking each fiscal lever with GHG emission reduction varies significantly. The case studies include two direct taxes – both of which are applied to various fuels based on their CO2 content – in Sweden and British Columbia (BC), Canada. These levers have been in place for a relatively long period, so have generally good ex-post evidence available. Bernard and Kichian (2019) have calculated that the British Columbia carbon tax, once reaching the rate of $30/ton of CO2, achieved an estimated 1.13-million-ton reduction in CO2 emissions. This equates to an average annual reduction of 1.3% relative to British Columbia’s 2008 diesel emissions and 0.2% relative to all BC CO2 emissions in 2008. However, they do not think it is a viable strategy for achieving net zero goals in isolation. With regards to the Swedish carbon tax, a review of ex-post analyses of carbon taxes by Green (2021) reveals different results around Sweden’s emission reductions. For example, research by Andersson (2019) found an average emission reduction of 6.3% per year between 1990 and 2005, Fernando (2019) found an annual average reduction of 17.2% and research by Shmelev and Speck (2018) found no effect on emissions. A study conducted by Jonsson, Ydstedt, & Asen (2022) state that GHG emissions have declined by 27% between 1990 and 2018. This highlights various methodological differences in conducting these ex-post analyses, and the difficulty in establishing the baseline of what emissions reductions would have occurred even in the absence of the lever.
The Austrian national ETS (nETS) – which extends the EU ETS, of which Austria is a part, to other sectors – is still in a phased implementation stage and will establish a set price which increases each year, reaching a market phase in 2026. Ex-ante modelling conducted by the Austrian government expects the scheme to reduce GHG emissions 800,000 tonnes by 2025. The proposed tax on agricultural emissions in New Zealand has not yet been finalised.
The evidence suggests the French Bonus Malus scheme – which incentivises uptake of low emission vehicles with a combination of fees and rebates – has been effective in shifting vehicle sales toward more environmentally friendly vehicles. Even though progress has slowed in recent years, average emissions have reduced significantly from 149 gCO2/km in 2010 to 111 gCO2/km in 2017. The relationship between the agricultural tax in Wallonia – which is applied at a farm level on the effects on water resources from livestock and land cultivation – and GHG emissions is much less clear.
Revenue generation and use
Data availability on revenue generated by these schemes varies. In all cases, a key element has been that revenues are either directly recycled back to citizens or are offset in other parts of the budget. This has occurred via direct payments/rebates to households or implementing other tax cuts alongside the lever.
The British Columbia carbon tax was designed to be revenue neutral and so was implemented alongside a wider scheme of tax cuts, and is now part of the Canadian Federal approach, which gives direct payments back to households. In 2019, SEK 22.2 billion was generated via the Swedish carbon tax, which is approximately 1% of Sweden’s total tax revenue. The carbon tax revenue goes into the overall government budget, and is not hypothecated, thus it is unclear where the revenue generated is distributed (Jonsson, Ydstedt, & Asen, 2022). The Austrian nETS was implemented as part of a wider policy package. Although revenue for the emissions allowances goes directly into the main budget and there is no hypothecation, ‘climate bonus’ payments are given directly back to households. Revenue in 2022 was approximately €800 million and the government have reallocated around €1 billion.
Since 2014, the Bonus Malus scheme has generated surplus revenue for the French general budget. For 2018, the malus was set at a level that covered the costs of the bonus payments (EUR 261 million) and the additional bonus for scrapped vehicles (EUR 127 million). The agricultural tax in Wallonia generates an annual revenue of around €1.2 million, however, it is unclear how this is subsequently used.
Behaviour change
There is some evidence on how the case study examples influence behaviour change. The carbon tax in British Columbia has been shown to have had a role in decreasing consumer demand for fossil fuels and natural gas (Pretis, 2022). Additional studies from Xiang and Lawley (2018) and Antweiler and Gulati (2016) also draw correlations between the implementation of the tax and a decrease in fuel demand.
The carbon tax in Sweden has shown to be effective in shifting market investment into low-carbon technology, specifically in renewable energy sources such as hydro and wind (Hildingsson and Knaggård, 2022). Levying the carbon tax at different rates on fuels has also resulted in behaviour changes in companies. Between 1993 and 1997, the higher tax rate on fuels used within domestic heating systems compared to fuels used within industry resulted in industries selling their by-products to domestic heating companies, while continuing to burn fossil fuels themselves (Johansson, 2000).
One interviewee suggested that the Austrian nETS, whilst in its fixed price stage, is not expected to generate a strong enough price signal to result in a clear and significant change in behaviour. However, other parts of the policy package have been designed to specifically change behaviour (such as subsidies for changing heating systems in households). The Bonus Malus scheme has had a clear impact on shifting vehicle sales in France towards less CO2 intensive vehicles. However, the scheme may have a rebound effect, as the lower fuel expenditure for consumers due to more efficient vehicles may lead to an increase in vehicle use and thus in fuel consumed (and thus on emissions). There is no evidence regarding the behavioural effects of the agricultural tax in Wallonia.
Unexpected challenges
In British Columbia, the tax was initially designed without exemptions and applied universally. However, after competitiveness concerns were raised, the government introduced a one-time exemption worth $7.6 million in 2012, followed by an ongoing exemption in 2013 to greenhouse growers and an exemption for gasoline and diesel used in agriculture in 2014.
When implementing their nETS, the Austrian government experienced challenges designing the scheme around the existing EU ETS. To ensure that emissions were not double counted, exemptions from the national ETS were given to installations already regulated under the EU ETS. This proved a challenging exercise for the Austrian government.
Challenges have been observed for the proposed agricultural tax in New Zealand. Whilst these are political in nature, they have presented challenges for the implementing government. The original proposal for a split-gas, farm-level levy was revoked after a consultation highlighted public concerns about the impact on the cost and potential implications on availability of produce. A series of media outlets reported tensions between the agricultural sector in New Zealand and the government. Farmers expressed concerns regarding both the profitability and competitiveness of their business, with some expecting to have to reduce their herd size (Pannett, 2023). After revoking the original planned tax, the NZ government are now implementing mandatory monitoring and reporting of emissions from agriculture, to eventually transition into pricing of emissions.
Overview of fiscal levers in the UK
We investigated existing UK environmental fiscal levers, including taxes in the energy intensive industries, the power generation, transport, and pollution and resource sectors in Appendix B. We focused analysis on those that deliver reductions in GHG emissions. These include:
- Fiscal levers specifically targeted to reduce GHG emissions.
- Fiscal levers specifically targeted to address environmental impacts and affecting GHG emissions.
These were classified using the typologies developed in Section 3.1. Fiscal levers that do not contribute to reducing GHG emissions have not been considered. A complete list of environmental taxes in the UK (at time of writing) is in Section 8.1.4.
Existing fiscal levers which target or address GHG emissions focus on energy and energy intensive industries, transportation (road and air transport) and resource use. Examples include Fuel Duty, the Climate Change Levy (CCL), the Renewables Obligation (RO), the UK ETS, the UK Air Passenger Duty (APD), and the Vehicle Excise Duty (VED).
Under the current devolution settlement, most tax powers remain reserved to the UK Government and Parliament. However, any existing national tax can potentially be devolved to the Scottish Parliament. New national taxes can be created through a mechanism allowing the UK Parliament, with the consent of the Scottish Parliament, to grant powers for new national devolved taxes to be created in Scotland (Scottish Parliament, 2021).
Overview of fiscal levers in Scotland and implications of the case studies
Devolution is the statutory delegation of powers from the central government of a sovereign state to govern at a subnational level. It is a form of administrative decentralisation. Devolved territories have the power to make legislation relevant to the area, thus granting them higher levels of autonomy. In the UK, devolution is the term used to describe the process of transferring power from the centre (Westminster) to the nations and regions of the United Kingdom (Torrance, 2022). Devolution provides Scotland, Wales and Northern Ireland with forms of self-government within the UK. In the case of Scotland, this includes the transfer of legislative powers to the Scottish Parliament and the granting of powers to the Scottish Government. While the UK Parliament still legislates for Scotland, it does not do so for devolved matters without the consent of the Scottish Parliament.
The devolution process has led to calls for the Scottish Parliament to be given more responsibility over revenue raised and spent in Scotland. There are existing devolved environmental taxes under the Scottish Government’s remit that contribute to reducing GHG emissions. We have also considered implications of the case studies from a legal and regulatory perspective. No assessment is made of the potential costs and benefits of adoption nor of the practical challenges associated with them.
Legal and regulatory fiscal system in Scotland
The legislative framework for devolution to Scotland was originally set out in the Scotland Act 1998. The Scotland Act 1998 established the Scottish Parliament and set out the matters on which the Scottish Parliament cannot legislate and make laws, known as general and specific reservations. Everything not listed as a reserved matter is assumed to be devolved. Reserved taxation matters include VAT rates, Fuel Duty, and Corporation Tax. The Scottish Parliament currently has devolved responsibilities in relation to five taxes (Scottish Government (2021), as follows:
- Scottish Income Tax, which is partially devolved. It is collected and administered by HMRC on behalf of the Scottish Government.
- Land and Buildings Transaction Tax, a tax paid in relation to land and property transactions in Scotland, and Scottish Landfill Tax, a tax on the disposal of waste to landfill, are fully devolved national taxes and are managed and collected by Revenue Scotland.
- The Scottish Parliament also has powers over local taxes for local expenditure. Currently, the two main local taxes are Council Tax and Non-Domestic Rates (also known as business rates), which are collected by local authorities. Note that a review of local taxes is not covered in this study.
In addition, powers in relation to two further taxes have been devolved to the Scottish Parliament, but these have not yet been implemented and the relevant reserved taxes therefore continue to apply. These taxes are Air Departure Tax, a tax on all eligible passengers flying from Scottish airports, which will replace Air Passenger Duty when introduced, and a devolved tax on the commercial exploitation of crushed rock, gravel, or sand, which will replace the Aggregates Levy when introduced.
The Scottish Parliament has the power to create new local taxes (i.e. local taxes to fund local authority expenditure). There is also a mechanism allowing the UK Parliament, with the consent of the Scottish Parliament, to devolve powers for new national devolved taxes to be created in Scotland. This is unlikely to be a swift process and would likely depend on the complexity of the new national tax and negotiation over devolution of the requisite powers.
The UK Internal Market Act 2020 (IMA) seeks to prevent internal trade barriers among the four countries of the United Kingdom. Schedule 1, paragraph 11 of the IMA specifically exempts taxes (Legislation.gov.uk, 2020a). However, new regulatory acts considered to create additional administrative burdens which may affect intra UK trade may be challenged under the IMA.
Devolved fiscal levers to deliver reductions in GHG emissions in Scotland
The Commission on Scottish Devolution (also referred to as the Calman Commission), established in 2007, identified some taxes (including the Landfill Tax and the Air Passenger Duty) where devolved powers could be applied. Following this, the Scotland Act 2012 devolved powers for a Landfill Tax to the Scottish Parliament to cover landfills and transactions taking place in Scotland, which led to the Landfill Tax (Scotland) Act 2014. At the time of writing, this is the only fully devolved fiscal lever delivering reductions in GHG emissions that currently applies in Scotland.[6] Although the Scotland Act 2016 included the power to introduce a devolved tax on the carriage of passengers by air from airports in Scotland (i.e. to replace the present, UK-wide Air Passenger Duty). The Air Departure Tax (Scotland) Act 2017 was passed by the Scottish Parliament 2017, however the introduction of the tax has been deferred due to state aid (and now subsidy control) issues. The Scotland Act 2016 Act also made provisions for the creation of a devolved tax on extraction of aggregates, which is currently being legislated for in the Scottish Parliament, although this does not specifically look to reduce greenhouse gas emissions.
Indirect Taxation Schemes
The Scottish Landfill Tax (SLfT) replaced the UK Landfill Tax in Scotland from 1 April 2015 under the Landfill Tax (Scotland) Act 2012. The SLfT is part of Scotland’s Zero Waste Scheme and aims to encourage the prevention, reuse and recycling of waste in the country. It is administered by Revenue Scotland with support from the Scottish Environment Protection Agency (SEPA). SLfT is a tax on the disposal of waste to an authorised or non-authorised landfill in Scotland. The taxation of disposals to unauthorised sites (that is illegal dumping) is a key difference between SLfT and UK Landfill tax.
The Scottish Government is responsible for setting the rates of the tax as part of the annual Scottish Budget and determining which waste is subject to it. The tax is paid on the disposal or unauthorised disposal of waste to landfill and is calculated based on the weight and type of the waste material. A standard rate of £102.10 per tonne is applied, while a lower rate of £3.25 per tonne is paid on less polluting (referred to as ‘inert’)[7] materials. Tax revenues have decreased from £149 million in 2015-2016 to £125 million in 2021-2022. The SLfT has been a major part of the success in driving change in Scotland’s waste performance (Revenue Scotland, 2021).
Air Departure Tax (ADT). The Scotland Act 2016 included the power to introduce a devolved tax on the carriage of passengers by air from airports in Scotland. This allows Scotland to design a replacement for APD. The Air Departure Tax (Scotland) Act 2017 made provision for such a tax, which will be managed and collected by Revenue Scotland. However, the tax has not yet been introduced and UK APD continues to apply.
The Scottish ADT will tax flights departing from an airport in Scotland (this includes airports in the Highlands and Islands regions). As with the UK APD, the amount of tax payable depends on the destination of the passenger and the characteristics of the aircraft (take-off weight,[8] flight distance seat pitch and seating capacity). Depending on the aircraft, the passenger will pay either the standard, premium or special rate.[9] Certain flights and passengers are exempt from ADT. Exemptions apply to flights operated under a public service obligation, which may include many flights to/from small islands, although the Air Departure Tax (Scotland) Act 2017 making provision for such a tax does not mention any exemptions for passengers on flights leaving from airports in the Scottish Highlands and Islands. There are also exemptions for emergency medical service flights, military, training or research flights. Passenger exemptions apply to persons that are working during the flight, such as flight crew, cabin attendants, persons undertaking repair, maintenance, safety or security work, persons not carried for reward, such as Civil Aviation Authority flight operations inspectors, or children under the age of 16 (FCC Aviation, 2023).
ADT was originally expected to come into force on 1 April 2018. However, on April 2019 the Scottish Government deferred the introduction of ADT beyond April 2020 until issues have been resolved regarding the tax exemption for flights departing from airports in the Highlands and Islands regions. The devolution process is, thus, on hold. In the meantime, UK APD (and the rates and bands that currently exist) and the current Highlands and Islands exemption continues to apply.
Implications of the case studies for Scotland
We assessed whether the six case study examples (Section 3.7) could hypothetically be implemented by the Scottish Government under current devolved competencies. We also provide a high-level explanation of practical issues (e.g., target of the lever and groups affected). No assessment is made of the costs and benefits of adoption.
While the balance of evidence suggests that similar taxes have reduced GHG emissions where they have been applied elsewhere, the net effect on GHG emissions in the host jurisdiction is uncertain. Challenges in implementation have also been observed and there is limited detailed evidence on behavioural effects. These issues will need to be further investigated before any such tax could be considered for Scotland. If the Scottish Government were to consider exploring any of the examples we have looked at, it would be necessary to undertake thorough policy scoping, analysis and consultation, in addition to the agreement of both the UK and Scottish Parliaments. The Scottish Government could also consider these points in the context of its wider discussions with the UK Government on the direction of climate and fiscal policies as part of a collaborative approach.
Direct Carbon Tax
The UK CCL (which is in practice similar to direct carbon taxes in place in several countries or regions, including Sweden and British Columbia) could be devolved to the Scottish Parliament through an agreement between the Scottish and UK governments and parliaments on the transfer of powers.
A new Scottish carbon tax could then in theory replace the UK CCL in Scotland. This could be broadly similar to the UK CCL, although the Scottish Government could also make its own decisions on issues such as scope and rates to better align it with Scotland’s socioeconomic conditions and emissions reduction targets. Were the Scottish Government to consider such a measure, it would require significant exploration of options and detailed analysis to ensure it achieved these objectives, including consultation and engagement with stakeholders.
Emissions Trading System
The UK ETS is jointly operated by the Scottish Government, UK Government, Welsh Government and Northern Ireland Executive through the UK ETS Authority. It relies primarily on legislation that is devolved (the Climate Change Act), although parts of the ETS relating to auction processes are based on legislation that is more often considered reserved and, thus, relies on UK parliament.
A new ‘Scotland ETS’ could hypothetically replace the UK ETS. This would require prior consent of the UK Parliament, Welsh Parliament, and Northern Ireland Assembly to have effect, as well as the agreement of the Scottish Parliament. The agreement of the Scottish Parliament could be sought through new specific legislation (either primary or secondary). Thus, an Act of the Scottish Parliament to make provision about the functioning of the ETS in Scotland would be required. This could in theory cover additional sectors not covered by the UK ETS, similar to the Austrian nETS operating alongside the EU ETS. However, any such proposal would require comprehensive policy scoping and consultation, in addition to the need for agreement from each legislative body, as detailed above.
Bonus Malus Scheme for Vehicles
The UK VED (similar to the bonus malus scheme explained in Appendix D) paid by businesses and households could in theory be devolved to the Scottish Parliament. Thus the new Scotland VED would replace the UK VED through an agreement between the Scottish and UK governments and parliaments on the transfer of powers.
This could potentially allow for innovation, as differences are in principle permitted, as happened with landfill tax (the SLfT applies on the disposal of waste to both authorised and non-authorised landfills, whereas the UK landfill tax only applies to disposals to authorised sites). It could therefore be feasible to create bonuses to incentivise buyers to purchase low or zero emission vehicles (along the lines of the Bonus-Malus in France), which UK VED does not currently offer. However, this would require detailed policy scoping and consultation to ensure any potential measure operates fairly and effectively, as well as having the consent of both the UK and Scottish Parliaments.
Tax on agricultural emissions
Under Section 80B of the Scotland Act 1998 (as amended), a new tax on agricultural emissions similar to the tax on agricultural emissions proposed in New Zealand (for further details, see Appendix D) could in theory be created in Scotland as the UK Parliament can, with the consent of the Scottish Parliament, devolve powers for new national devolved taxes to be created in Scotland.
This tax might operate by putting a price on agricultural GHG emissions, for example, and could include farmers and growers who operate on Scottish territory, depending on their GHG emissions. The lessons learned from the example in New Zealand clearly demonstrate that consideration of any such measures would require rigorous policy design, consultation and close collaboration with stakeholders in the sector. Whilst new taxes can be effective in changing behaviours and reducing GHG emissions, there is an important and challenging balance to strike between protecting jobs and the viability of industries such as agriculture whilst also meeting net zero targets.
Conclusions
Of the various policies to mitigate the effects of climate change, the use of fiscal levers (taxes, levies, duties or charges) to reduce GHG emissions has gained increased attention and wider adoption by policymakers around the world. Different types of fiscal levers include emission trading schemes; carbon credit schemes; carbon border adjustment mechanisms; and carbon taxes. We focused on direct carbon taxes. Subsidies, grants and loans by the UK or Scottish Governments were not in scope.
International review of fiscal levers for GHG emissions
Use of carbon taxes is increasingly common. 37 direct carbon taxes are in operation in 27 jurisdictions globally. The majority are applied in high-income countries, particularly Europe. Scandinavian countries were among the earliest adopters. Many of these taxes have been applied alongside an ETS. There has been less use outside Europe to date. However, several jurisdictions are currently considering them.
Sub-national carbon taxes have been applied successfully: Of particular relevance to Scotland, two jurisdictions have applied carbon taxes sub-nationally: Canada, which has five, and Mexico, which currently has two with further instruments planned.
Existing instruments differ in terms of GHG coverage and carbon price: about 6% of global GHG emissions are taxed by carbon taxes. This share has increased significantly over the past 15 years. Existing instruments differ in scope, price and coverage. For example, Sweden has a ‘high ambition’ instrument and was one of the earliest adopters with the highest carbon tax globally. Other instruments have a mixed level of ambition e.g. high prices and low share (Uruguay) or high share but low prices (Singapore). Relatively low prices and shares include some Eastern European and South American states.
The balance of evidence suggests carbon taxes have reduced GHG emissions, with caveats. Despite the extensive literature on the merits of carbon taxation, actual data on their impact on GHG emissions is limited. Any assessment of impact is methodologically challenging, particularly in attributing GHG reductions to the specific tax. Effects of carbon leakage are rarely quantified, so estimates may overstate reductions in GHG emissions when taking a global view. Despite these challenges, the evidence indicates that carbon taxes have generally reduced GHG emissions in the relevant sector or jurisdiction. There is some limited evidence that carbon taxes perform better than ETSs in terms of GHG reduction, but both are likely to need additional regulatory measures to deliver the scale of decarbonisation necessary. The extent of reductions attributed to the taxes to date are not considered sufficient to meet broader climate goals.
Evidence on behavioural effects within affected sectors is more limited. The available evidence indicates that fuel switching or efficiency improvements may be more common responses than significant changes to manufacturing processes or technologies. Analysis of the Swedish carbon tax suggests some decreased demand for petrol was offset by increases for diesel but it was considered to have supported a shift in investment toward low-carbon technologies. It is not clear if responses were a result of the design of the tax or a reflection of prevailing prices and/or coverage.
Carbon taxes have generated government revenue but their magnitude depends on the design of the tax. The data contain some methodological and reporting inconsistencies, but 2013 information suggested revenues differed between some $3.5 billion (Sweden) and tens of million (Iceland). Data from 2019 show similar orders of magnitude, but the values for specific jurisdictions differ. The share of GDP represented by the taxes were all under 1% of national GDP at that time. By 2022 carbon tax revenues were upwards of $30 billion globally. Overall, revenues reflect the carbon price, as well as factors including the size of the economy, the coverage of the tax, exemptions, the carbon intensity of the jurisdiction and energy mix. The available evidence suggests that direct carbon taxes are relatively straightforward and inexpensive to administer for the host government.
Direct carbon taxes have involved extensive allocations of revenues for specific purposes. Many of the instruments for which data are available contained extensive allocations, as a percentage of revenue. These were often legally binding or via political commitment. Specific allocations include for green spending and particularly on specific rebates or tax cuts to affected groups, including low-income households and some businesses. British Columbia’s carbon tax was designed to be revenue neutral. In Sweden and Iceland, revenues are unconstrained and used to finance general government expenditure.
Implementation has been politically challenging. Australia is the only jurisdiction identified where an existing carbon tax was repealed. Repealing the tax became a central element of a successful opposition election campaign. Similarly, a planned acceleration of the carbon price was suspended in France as a result of widespread civil unrest, citing the perceived unfairness of the tax, having been introduced alongside tax cuts for the wealthy. A successful legal challenge was brought in Mexico over whether the regional government had legal authority to implement a subnational tax.
Potential implications for Scotland
Our high-level review of existing fiscal levers in the UK identified several existing taxes in the energy, transport and resource sectors which specifically target or address GHG emissions.
The Scotland Act 2012 (Section 80B) provides the Scottish Parliament with the power to devolve any existing national tax of any description to Scotland and create new national taxes such as on activities currently not taxed under the UK tax code. Any changes to existing taxes or the introduction of new taxes will require the agreement of the Scottish Parliament and the prior consent of the UK Parliament to have effect. Several of the case studies contain elements that are in practice similar to existing UK levies, but which would need amending if they were to be considered for Scotland.
Any new carbon tax could hypothetically be applied in Scotland, potentially as part of a devolved Scottish Climate Change levy. Similarly, a new ‘Scotland ETS’ could hypothetically replace the UK ETS, with adjustments in scope to incorporate additional sectors. This would require prior consent of the UK Parliament, Welsh Parliament and Northern Ireland Assembly, as well as the agreement of the Scottish Parliament. A devolved VED could theoretically replace the UK VED in Scotland. New national taxes could also be created in Scotland, requiring consent of both the UK and Scottish Parliaments. In each case, new Scottish legislation would be required.
Principles for implementation
This review has highlighted several fiscal levers used in other countries to reduce GHG emissions. Should any of these be explored further, Scotland’s Framework for Tax sets out the principles and strategic objectives that underpin the Scottish approach to taxation and any new measures (Scottish Government, 2021). These principles are:
- Proportionality: Taxes should be levied in proportion to taxpayers’ ability to pay and a fair system should reflect relative income or wealth of the taxpayer.
- Efficiency: Prospects for revenue should be balanced against the potential for unintended behavioural responses.
- Certainty: So that businesses and individuals can plan and invest with confidence, taxpayers must know what is to be paid, by whom and when.
- Convenience: Taxes should be collected in a way that maximises convenience for taxpayers. Policy should be simple, clear and straightforward and opportunities to streamline the tax system taken.
- Engagement: To ensure accountability and maintain trust, governments should consult as widely as possible on tax design.
- Effectiveness: Taxes should raise the expected revenues and achieve their intended aims. Opportunities for tax avoidance should be minimised.
As such, the effectiveness of any fiscal lever depends on the precise design of the lever and should be subject to careful consideration and clear communication in terms of its scope, phase-in, price (including future price escalation), sectors and activities on which it is levied and any relevant exemptions. Distributional effects should be carefully considered, including if and how revenue should be reallocated, to whom and under what conditions. challenges in implementation have been observed. Successful fiscal lever examples have been based on transparent design, regular monitoring and communication of revenues, costs and benefits, with rapid adjustments if unexpected adverse effects occur. Successful examples have also formed part of wider fiscal reforms, with a clear strategic objective.
Any potential instrument should be subject to detailed economic modelling, including testing different price rates and trajectories, an assessment of the risk of carbon leakage (with or without a UK CBAM), economic competitiveness and innovation effects, distributional effects (and potential mitigation via revenue reallocation), and any impacts on small and medium sizes businesses. This should be published in a robust Regulatory Impact Assessment to provide a comprehensive evaluation of any prospective measures, and ensure they adhere to the principles of the Framework for Tax while achieving GHG reductions through behavioural change.
References
Andersson, J. J. (2019). Carbon Taxes and CO2 Emissions: Sweden as a Case Study. American Economic Journal Policy.
Anon (2021). “Restoring peat wetlands – our climate change secret weapon”. Forest & Bird. Available at: https://www.forestandbird.org.nz/resources/restoring-peat-wetlands-our-climate-change-secret-weapon
Beck, M., Rivers, N., Wigle, R., & Yonezawa, H. (2015). Carbon tax and revenue recycling: Impacts on households in British Columbia. Resource and Energy Economics, 41, 40-69.
Bernard, J. and Kichian, M. (2019). The long and short run effects of British Columbia’s carbon tax on diesel demand. Energy Policy, 131, 380-389.
Blackburn, C (2022). Environmental Fiscal Measures for Scotland: learning from case studies and research to create a potential strategic approach. SPICe Briefing, The Scottish Parliament.
Business Waste. (2023). A guide to the UK landfill tax. Available at https://www.businesswaste.co.uk/a-guide-to-the-uk-landfill-tax/
Carattini, S., Carvalho, M. and Fankhauser, S., 2018. Overcoming public resistance to carbon taxes. Wiley Interdisciplinary Reviews: Climate Change, 9(5), p.e531.
Carl, J and Fedor, D (2016). Tracking global carbon revenues: a survey of carbon taxes versus cap and trade in the real world. Energy Policy, 96 (2016) 50-77.
CCC, (2023). Progress in reducing UK emissions 2023 Report to Parliament https://www.theccc.org.uk/wp-content/uploads/2023/06/Progress-in-reducing-UK-emissions-2023-Report-to-Parliament-1.pdf
Civil Service (2022). Devolution: Factsheet
Coopens, L. et al. (2022). Achieving -55% GHG emissions in 2030 in Wallonia, Belgium: Insights from the TIMES-Wal energy system model. Energy Policy 164, 112871. DOI: 10.1016/j.enpol.2022.112871
Corlett, E. (2022). “Nineteen years after the ‘fart tax’, New Zealand’s farmers are fighting emissions”. The Guardian. Available at: https://www.theguardian.com/world/2022/nov/12/19-years-after-the-fart-tax-new-zealands-farmers-are-fighting-emissions
Coyle, D, (2020). Markets, State and People. Economics for Public Policy. Princeton University Press.
Craymer, L. (2023). “New Zealand Farmers Set for Right-Wing protest vote over Climate Change Policies”. Reuters. Available from: https://www.reuters.com/world/asia-pacific/new-zealand-farmers-set-right-wing-protest-vote-over-climate-change-policies-2023-09-27/.
DairyNZ and B+LNZ (n.d.). “Agriculture Emissions Pricing System”. Available at: https://beeflambnz.com/knowledge-hub/PDF/agriculture-emissions-pricing-system-blnz-dairynz-summary-recommendations
European Commission (2023). Carbon Border Adjustment Mechanism. Available at: https://taxation-customs.ec.europa.eu/carbon-border-adjustment-mechanism_en
European Commision (2022). Environmental Implementation Review 2022. Country Report – Belgium. Available at: https://eur-lex.europa.eu/legal-content/EN/TXT/?uri=comnat%3ASWD_2022_0261_FIN
European Environment Agency (2022a) Early warning assessment related to the 2025 targets for municipal waste and packaging waste: Bulgaria. Available at: https://www.eea.europa.eu/publications/many-eu-member-states/bulgaria/view
European Environment Agency (2022b) Early warning assessment related to the 2025 targets for municipal waste and packaging waste: Lithuania. Available at: https://www.eea.europa.eu/publications/many-eu-member-states/lithuania/view
Eurostat (2023) Share of energy from renewable sources. Energy statistics – quantities, annual data. Available from: https://ec.europa.eu/eurostat/databrowser/view/nrg_ind_ren__custom_7813071/default/table?lang=en
FCC Aviation. (2023). Scottish Air Departure Tax. https://www.fccaviation.com/regulation/united-kingdom/scottish-air-departure-tax
Fernando S 2019 The environmental effectiveness of carbon taxes: a case study of the nordic experience The 1st Int. Research Conf. on Carbon Pricing 14-14 February (New Delhi, India: World Bank) pp 349–68
French Ministry of Finance (2023) General tax on polluting activities. Available at: https://entreprendre.service-public.fr/vosdroits/F23497
Government of Canada (2023a). “Economic Overview”. Canada.ca. Accessible at: https://www.canada.ca/en/pacific-economic-development/corporate/economic-overview.html
Green, J.F., 2021. Does carbon pricing reduce emissions? A review of ex-post analyses. Environmental Research Letters, 16(4), p.043004.
Government of Canada (2023b). Census profile, 2021 census of Population profile Table . Profile table, Census Profile, 2021 Census of Population – British Columbia [Province]. https://www12.statcan.gc.ca/census-recensement/2021/dp-pd/prof/details/page.cfm?Lang=E&DGUIDlist=2021A000259&GENDERlist=1%2C2%2C3&STATISTIClist=1&HEADERlist=0
Government Offices of Sweden (2021). Sweden’s Carbon Tax. Available at: https://government.se/government-policy/swedens-carbon-tax/swedens-carbon-tax/ (Accessed: 10 October 2023).
Harrison, K. (2013), “The Political Economy of British Columbia’s Carbon Tax”, OECD Environment Working Papers, No. 63, OECD Publishing, Paris, https://doi.org/10.1787/5k3z04gkkhkg-en
Harrison, K. (2019). “Lessons from British Columbia’s carbon tax”. Policy options politiques. Available at: https://policyoptions.irpp.org/magazines/july-2019/lessons-from-british-columbias-carbon-tax/ (Accessed: 02 October 2023).
Hildingsson, R. and Knaggård, Å. (2022). The Swedish carbon tax: A resilient success. In C. de la Porte, G. B. Eydal, J. Kauko, D. Nohrstedt, P. ‘t Hart, & B. S. Tranøy (Eds.), Successful Public Policy in the Nordic Countries: Cases, Lessons, Challenges (pp. 239–262). Oxford University Press. https://doi.org/10.1093/oso/9780192856296.003.0012
HM Treasury (2021) Net Zero Review. Analysis exploring the key issues. Available at: https://assets.publishing.service.gov.uk/media/616eb3568fa8f52979b6ca3e/NZR_-_Final_Report_-_Published_version.pdf
Institute for European Environmental Policy (IEEP) (2016a) Landfill Tax, Incineration Tax and Landfill Ban in Austria. Available at: https://ieep.eu/wp-content/uploads/2022/12/AT-Landfill-Tax-final.pdf
Institute for European Environmental Policy (IEEP) (2016b) Air pollution load charge in Hungary. Available at: https://ieep.eu/wp-content/uploads/2022/12/HU-Air-Pollution-Charge-final-1-1.pdf
International Carbon Action Partnership (ICAP), (2022), Emissions Trading Worldwide: Status Report 2022. Berlin: International Carbon Action Partnership. Available at: https://icapcarbonaction.com/system/files/document/220408_icap_report_rz_web.pdf
International Carbon Action Partnership (ICAP), (2023), Austrian National Emissions Trading System. Available at: https://icapcarbonaction.com/en/ets/austrian-national-emissions-trading-system
International Energy Agency (2023) Austria. Available at: https://www.iea.org/countries/austria
International Monetary Fund (2019). Fiscal Monitor: How to mitigate climate change, October 2019 https://www.imf.org/en/Publications/FM/Issues/2019/09/12/fiscal-monitor-october-2019
IPCC, 2023: Sections. In: Climate Change 2023: Synthesis Report. Contribution of Working Groups I, II and III to the Sixth Assessment Report of the Intergovernmental Panel on Climate Change [Core Writing Team, H. Lee and J. Romero (eds.)]. IPCC, Geneva, Switzerland, pp. 35-115, doi: 10.59327/IPCC/AR6-9789291691647
Johansson, A. (2021). European Investment Bank. Available at: https://www.eib.org/en/press/all/2021-386-76-of-swedish-people-in-favour-of-stricter-government-measures-imposing-behavioural-changes-to-address-the-climate-emergency
Johansson, B. (2000) ‘Economic Instruments in Practice 1: Carbon Tax in Sweden’, Swedish Environmental Protection Agency.
Johnson, 2023. Follow the money. How much does Britain Cost? Paul Johnson. Abacus. February 2023
Jonsson, S., Ydstedt, A., & Asen, E. (2020). Looking Back on 30 Years of Carbon Taxes in Sweden. Tax Foundation Fiscal Fact.
Latvian Ministry of Finance (2020) Natural Resources Tax. Available at: https://www.fm.gov.lv/en/natural-resources-tax?utm_source=https%3A%2F%2Fwww.bing.com%2F
Legislaiotn.gov.uk, (1998). The Scotland Act 1998 (as amended in 2012). https://www.legislation.gov.uk/ukpga/1998/46/section/80B
Legislation.gov.uk, (2020) The Greenhouse Gas Emissions Trading Scheme Order 2020 https://www.legislation.gov.uk/uksi/2020/1265/schedule/1/made
Legislation.gov.uk, (2020a) United Kingdom Internal Market Act 2020https://www.legislation.gov.uk/ukpga/2020/27/schedule/1/paragraph/11/enactedLow Carbon Contracts Company. (2023). Contracts for Difference (CfD). Available at https://www.lowcarboncontracts.uk/our-schemes/contracts-for-difference/#:~:text=The%20Contracts%20for%20Difference%20scheme,least%20cost%20to%20the%20consumer
Ministry for the Environment and Ministry for Primary Industries (2022). “Pricing agricultural emissions: Consultation document”. Wellington: Ministry for the Environment. Available at: https://environment.govt.nz/assets/publications/Pricing-agricultural-emissions-consultation-document.pdf
Ministry for Primary Industries, New Zealand Government (2022). “Situation and Outlook for Primary Industries”. Ministry for Primary Industries. Available at: https://www.mpi.govt.nz/dmsdocument/54517-Situation-and-Outlook-for-Primary-Industries-SOPI-December-2022
Monschauer, Y., & Kotin-Förster, S. (2018). Bonus Malus Vehicle Incentive System in France. Federal Ministry for the Environment, Nature Conservation and Nuclear Safety (Germany) and the European Climate Initiative (EUKI). Available at: https://www.euki.de/wp-content/uploads/2018/09/fact-sheet-bonus-malus-vehicle-incentive-system-fr.pdf
Murray, B., & Rivers, N. (2015). British Columbia’s revenue-neutral carbon tax: A review of the latest “grand experiment” in environmental policy. Energy Policy, 86, 674-683.
National Audit Office (2021) Environmental tax measures. Available at https://www.nao.org.uk/wp-content/uploads/2021/02/Environmental-Tax-Measures.pdf
National Farmers Union Scotland (2023). “Farming facts”. National Farmers Union, Scotland. Available at: https://www.nfus.org.uk/farming-facts.aspx#:~:text=Some%2080%25%20of%20Scotland’s%20land,billion%20food%20and%20drink%20exports.
New Zealand Government (2022a). “Towards a productive, sustainable and inclusive economy”. Ministry for the Environment. Available at: https://environment.govt.nz/assets/publications/Aotearoa-New-Zealands-first-emissions-reduction-plan.pdf
New Zealand Government (2022b). “Pricing agricultural emissions”. Ministry for Environment and Ministry for Primary Industries. Available at: https://environment.govt.nz/assets/publications/Pricing-agricultural-emissions-summary-of-the-consultation.pdf
New Zealand Government (2022c). “He Waka Eke Noa, Milestone update and six-month progress report. October 2021-March 2022”. Available at: https://hewakaekenoa.nz/wp-content/uploads/2022/03/He-Waka-Eke-Noa_Six-Month-Progress-Report_March-2022.pdf
New Zealand Government (2023). “Progress update on agricultural greenhouse gas emissions pricing”. Ministry for the Environment. Available at: https://environment.govt.nz/assets/publications/Proactive-release-ag-emissions-Cab-paper.pdf
OECD (2019). The Use of revenues from Carbon Pricing. Centre for Tax Policy and Administration Environment Directorate, Joint Meeting of Tax and Environmental Experts
OECD (2023a), Gross domestic product (GDP) (indicator). OECD Data. Available at: https://data.oecd.org/gdp/gross-domestic-product-gdp.htm#indicator-chart
OECD (2023b), Population (indicator). OECD Data. Available at: https://data.oecd.org/pop/population.htm
Office for Budget Responsibility. (2023). Fuel duties. Available at https://obr.uk/forecasts-in-depth/tax-by-tax-spend-by-spend/fuel-duties/
Office for Budget Responsibility. (2023). Vehicle excise duty. Available at https://obr.uk/forecasts-in-depth/tax-by-tax-spend-by-spend/vehicle-excise-duty/
Office for National Statistics (2023). Environmental taxes dataset. Available at https://www.ons.gov.uk/economy/environmentalaccounts/datasets/ukenvironmentalaccountsenvironmentaltaxes
OFGEM. (2023). Renewables Obligation (RO). Available at https://www.ofgem.gov.uk/environmental-and-social-schemes/renewables-obligation-ro/suppliers
Ohlendorf et al (2018). Ohlendorf, N; Jakob, M: Minx, J; Schroder, C, Steckel, S 2018 Distributional Impacts of Climate Mitigation Policies – a Meta-Analysis. Discussion Paper. Deutsches Institut für Wirtschaftsforschung (DIW Berlin).
OMAAT. (2023). Understanding the UK Air Passenger Duty (APD). Available at https://onemileatatime.com/guides/uk-air-passenger-duty/
Pannett, R. (2023). “How New Zealand plans to tackle climate change: Taxing cow burps”. The Washington Post. Available at: https://www.washingtonpost.com/climate-solutions/interactive/2023/new-zealand-cows-burps-methane-tax/
Parliament Österreich (2022) Ecological Tax Reform Act 2022 Part 1. Available at: https://www.parlament.gv.at/gegenstand/XXVII/I/1293
Portail de Wallonne (2023). “Paying tax on the discharge of domestic and industrial waste water and on environmental loads generated by farming endeavours”. Available at: https://www.wallonie.be/en/demarches/paying-tax-discharge-domestic-and-industrial-waste-water-and-environmental-loads-generated-farming-endeavours
Pretis, F. (2022). Does a carbon tax reduce CO2 emissions? Evidence from British Columbia. Environmental and Resource Economics, 83(1), 115-144.
Revenue Scotland. (2021). Annual Summary of Trends in the Devolved Taxes 2021-22. Available at https://revenue.scot/news-publications/publications/statistics/annual-summary-trends-devolved-taxes-2021-22
Scottish Government (2021). Framework for Tax, 2021. Available at: https://www.gov.scot/publications/framework-tax-2021/pages/3/
Scottish Government (2021b). AFTER BREXIT: The UK Internal Market Act & Devolution. Available at https://www.gov.scot/binaries/content/documents/govscot/publications/strategy-plan/2021/03/brexit-uk-internal-market-bill-scotlands-future/documents/brexit-uk-internal-market-act-devolution/brexit-uk-internal-market-act-devolution/govscot%3Adocument/brexit-uk-internal-market-act-devolution.pdf
Scottish Government (2022). Policy, Climate Change. The UK emissions trading scheme https://www.gov.scot/policies/climate-change/emissions-trading-scheme/
Scottish Government (2023a). GDP Quarterly National Accounts, Scotland. National Statistics. Available at: https://www.gov.scot/binaries/content/documents/govscot/publications/statistics/2023/02/gdp-quarterly-national-accounts-2022-q3/documents/quarterly-national-accounts-2022-q3-full-publication/quarterly-national-accounts-2022-q3-full-publication/govscot%3Adocument/GDP%2BQNAS%2B-%2B2022%2BQ3%2B-%2BPublication.pdf
Scottish Government (2023b). Share of renewable electricity in gross final consumption. Scottish Energy Statistics Hub. Available at: https://scotland.shinyapps.io/Energy/?Section=RenLowCarbon&Subsection=RenElec&Chart=RenElecTarget
Scottish Government (2023c). “Scotland’s census 2022 – rounded population estimates”. Scotland’s Census. https://www.scotlandscensus.gov.uk/2022-results/scotland-s-census-2022-rounded-population-estimates/
Scottish Government, (2020). Update to the Climate Change Plan 2018-2032. Securing a Green Recovery on a Path to Net Zero, the Scottish Government, December 2020. Update to the Climate Change Plan 2018 – 2032: Securing a Green Recovery on a Path to Net Zero (www.gov.scot)
Scottish Renewables (2023) Statistics – Energy Consumption by sector. Available at: https://www.scottishrenewables.com/our-industry/statistics
SEFE Energy. (2023). What is the Climate Change Levy (CCL)? Available at https://www.sefe-energy.co.uk/help-and-support/bills-payments/what-is-the-climate-change-levy-ccl/#:~:text=The%20Climate%20Change%20Levy%20is,to%20reduce%20their%20overall%20emissions
Shmelev S E and Speck S U 2018 Green fiscal reform in Sweden: econometric assessment of the carbon and energy taxation scheme Renew. Sustain. Energy Rev. 90 969–81
Shmelev, S.E. and Speck, S.U., 2018. Green fiscal reform in Sweden: econometric assessment of the carbon and energy taxation scheme. Renewable and Sustainable Energy Reviews, 90, pp.969-981.
Sumner, J., Bird L., & Smith, H. (2009). Carbon Taxes: A review of Experience and Policy Design Considerations. National Renewable Energy Laboratory.
Torrance, D. (2022) Introduction to devolution in the United Kingdom, Commons Library Research Briefing, 25 January 2022
UK Government (2023b). Guidance. Participating in the UK ETS. Update 4th September 2023. Department for Business, Energy and Industrial Strategy and Department for Energy Security and Net Zero. https://www.gov.uk/government/publications/participating-in-the-uk-ets/participating-in-the-uk-ets
UK Government (2023c). Participating in the UK ETS. Available at https://www.gov.uk/government/publications/participating-in-the-uk-ets/participating-in-the-uk-ets#overview
UK Government (2023d). CRC Energy Efficiency Scheme. Available at https://www.gov.uk/government/collections/crc-energy-efficiency-scheme
UK Government, (2023a). Closed Consultation. Addressing carbon leakage risk to support decarbonisation HM Treasury, Department of Energy Security and Net Zero https://www.gov.uk/government/consultations/addressing-carbon-leakage-risk-to-support-decarbonisation
United Nations. (2012) “Case Study: Addressing Competitiveness in introducing ETR United Kingdom’s climate change levy”, in Low Carbon Green Growth Roadmap for Asia and the Pacific, Bangkok. Available at https://www.unescap.org/sites/default/files/48.%20CS-United-Kingdom-climate-change-levy.pdf
World Bank (2023a). Damania, Richard; Balseca, Esteban; de Fontaubert, Charlotte; Gill, Joshua; Kim, Kichan; Rentschler, Jun; Russ, Jason; Zaveri, Esha. 2023. Detox Development: Repurposing Environmentally Harmful Subsidies. Washington, DC : World Bank. http://hdl.handle.net/10986/39423 License: CC BY 3.0 IGO
World Bank (2023b). State and Trends of Carbon Pricing 2023. © http://hdl.handle.net/10986/39796 License: CC BY 3.0 IGO. https://openknowledge.worldbank.org/handle/10986/39796
World Bank (2023c) Carbon Pricing Dashboard https://carbonpricingdashboard.worldbank.org/map_data
World Bank (2023d) World Bank databank. World development Indicators https://databank.worldbank.org/source/world-development-indicators/Series/EN.ATM.GHGT.KT.CE
Xunta De Galacia (nd) Tax guide. Available at: https://www.atriga.gal/es/tributos-da-comunidade-autonoma/contaminacion-atmosferica/guia-do-imposto-sobre-a-contaminacion-atmosferica
Appendices
Appendix A. Methodology
This section provides a more detailed overview of the methodology we used.
Literature review
First, we conducted a targeted literature review on fiscal levers used to reduce greenhouse gas emissions. We focussed on academic and grey literature sources using agreed search terms. These were: ‘fiscal levers’, ‘tax’, ‘levy’, ‘duties’, ‘charges’, ‘carbon tax’, ‘environmental tax’ ‘carbon pricing’, ‘carbon credits’ ‘greenhouse gas emissions’, ‘Net Zero’, ‘climate change’, ‘fiscal measures’, ‘environmental behaviours’, ‘behaviour change’, ‘dis/incentive’, ‘rural” & “island’, ‘revenues’, and ‘devolved’. We used Boolean operators e.g., AND/OR etc to create relevant search strings from these key words and to refine the search results. We used additional terms including ‘effectiveness of’, ‘review of’, ‘evaluation of’, ‘impact assessment of’ and ‘meta-review of’ to identify additional evidence for specific schemes once they had been identified.
We searched databases including PubMed, Web of Science All Databases and Scopus to identify relevant academic literature sources. We also looked for legislation as well as publications from national Governments, supranational organisations such as the European Commission or OECD as well as non-governmental organisations. The grey literature was identified via Google searches and searches of relevant government/organisation websites.
As we identified sources, we screened them using executive summaries or abstracts to ascertain their relevance and quality. If we decided the source was relevant and of sufficient quality, we logged them in a data source register, which was a live Excel document (stored on the project SharePoint site) that was available to all team members. We recorded the source details (title, author, year, source) and information on the contents of the publication, such as the type(s) of lever it discusses, geographical scope, relevance for GHG emissions as well as an indication of the methodological rigour, accuracy and robustness of the source. This ensured that we clearly documented the evidence, and that we could share resources efficiently across the project team. As part of this exercise, 36 sources were logged, informing the beginning of the more in-depth research undertaken for each individual case study.
As we logged the sources in the register, we undertook a secondary screening exercise of the lever examples – where specific examples were discussed – categorising them into an initial list of typologies. This also identified a ‘longlist’ of potential case studies of specific lever examples for more detailed analysis.
Case study selection
We shortlisted six case studies to be analysed in greater detail, from a long list of 12. The case study selection process was twofold. First, initial assessment during literature review stage of the project. While logging the data in the live excel sheet, we conducted a high-level assessment of the relevance of the identified fiscal levers to the Scottish context. Each case study was assigned a RAG rating based on an assessment against six criteria agreed with CxC and the Scottish Government. These criteria were:
- Population, economic structure and GDP: Countries/regions that with comparable population, GDP/GDP per capita and economic structure (i.e., size of manufacturing sectors, predominance of service sectors) were prioritised. This may include certain EU Member States, for example.
- Administrative and legal arrangements and competencies: Countries/regions with similar administrative arrangements (i.e., devolved competencies or instruments applied sub-nationally) were prioritised. Examples may include U.S. States, Australian territories or Belgian Regions.
- Shared challenges: Countries/regions with similar characteristics to Scotland, such as extensive peatland, rural/island communities or extensive renewable energy resources may provide valuable insight. This may include Ireland, Canada, Estonia, Sweden, Finland and Germany, for example.
- Climate ambition: Countries/regions with similar levels of ambition in terms of climate change mitigation should be prioritised. For example, those with net zero targets set out in national legislation.
- Diversity of approaches: Different levers and typologies should be covered in the case studies to allow for a comprehensive analysis.
- Data and evidence: Sufficient data and evidence on the lever and its effectiveness must be available to support case study analysis.
We then used this RAG rating to select the most relevant case studies, which were presented to the project steering group for agreement. The project steering group selected the final six case studies for the project. These case studies are contained in Appendix C.
Semi-structured interviews
To supplement the literature review, we conducted 7 semi-structured interviews of c.45 minutes via MS teams. In two cases, the interviewees requested to respond in writing. Two rounds of interviews were conducted.
We conducted the first round of interviews with experts who could offer an international perspective on the use of fiscal levers for greenhouse gas emission reductions. The purpose of these interviews was to gain expert input on the global picture, to ensure that sound case study options had been selected and to ensure that the project team was aware of all available evidence. We held interviews with Stefano Carattini, an academic specialising in carbon taxation worldwide, Ian Parry an expert from the IMF and Professor Lorraine Whitmarsh, an academic specialising in behavioural change in the face of environmental legislation and carbon taxation.
The second round of interviews aimed to gain more targeted information about specific case studies in the relevant jurisdictions. We aimed to obtain evidence on the effectiveness of the fiscal levers and fill in any data gaps that had persisted after the literature review. These interviews included civil servants working on the policy in the relevant governments where these could be identified, as well as academics with the required expertise working in the relevant countries. We were able to arrange interviews with experts from four out of the six case studies analysed in this study. Experts in British Columbia, Austria, Wallonia and Sweden were consulted. Difficulties related to recent elections, and the early nature of the implementation of the tax in New Zealand meant that no civil servants were available to contribute to our study in this jurisdiction. In France, the expert we contacted rejected our interview request, based on the time which had elapsed since the individual was involved with that instrument. We were satisfied with the amount of information publicly available regarding the Bonus Malus scheme, however.
We provided each interviewee with an interview guide in advance of the interview. The guide included a letter of introduction on the project and a short project briefing note, an interview consent form, detailing how the information would be used and stored (in accordance with GDPR). We requested that each interviewee signed and returned the form in advance of the interview. We recorded the interviews, subject to interviewee consent, and stored their data securely. The recordings were used to create meeting notes which were agreed by both the interviewee and the interviewer.
Fiscal levers in the UK and Scotland
We first identified existing environmental fiscal levers in the UK (including taxes in the energy, transport and pollution/resource sectors). The main source of information was the Office of National Statistics (ONS). The UK environmental taxes annual bulletin from the ONS shows the value and composition of UK environmental taxes, by type of tax and economic activity. These levers were:
- Environmental taxes in the energy sector include the following: Tax on Hydrocarbon oil; Climate Change Levy; Fossil Fuel Levy; Gas Levy; Hydro-Benefit; Renewable Energy Obligations; Contracts for Difference;) UK Emissions Trading Scheme; Carbon Reduction Commitment
- Environmental taxes in the transport sector include the following: Air Passenger Duty; Rail Franchise Premia; Vehicle Registration Tax; Northern Ireland Driver Vehicle Agency; Fuel Duty; Vehicle Excise Duty (VED) paid by businesses; VED paid by households; Boat Licenses; Air Travel Operators Tax; Dartford Toll
- Pollution Resources taxes include the following: Landfill Tax; Fishing Licenses; Aggregates Levy; Plastic Packaging Tax.
As the focus of our assignment is on fiscal levers to deliver reductions in GHG emissions, we focused our analysis on those that deliver reductions in GHG emissions. These include:
- Fiscal levers specifically targeted to address environmental impacts and affecting GHG emissions.
- Fiscal levers specifically targeted to reduce GHG emissions.
The Rail Franchise Premia (premium paid by train companies to UK government to provide specified train services), the Boat Licenses (annual charge required by owners of boats who use or keep their boats on inland waterways in the UK), the Air Travel Operators Tax (an insurance scheme ran by the UK Civil Aviation Authority), the Dartford Toll (toll for motorists to use the Dartford Crossing), the Fishing Licenses (required to fish for certain species of fish in various locations across the UK), the Aggregates Levy (a tax on sand, gravel or rock that has been dug from the ground, dredged from the sea or imported into the UK), and the Plastic Packaging Tax (on finished plastic packaging components containing less than 30% recycled plastic) have not been considered in our analysis. These taxes do not contribute to reducing GHG emissions, either directly or indirectly. The Contracts for Difference and the Vehicle Registration Tax have not been considered either. The Contracts for Difference offers generators a contract with a known strike price for renewable electricity sold and, thus, it is considered a subsidy and not a tax. The Vehicle Registration Tax is a tax on vehicle registration in the UK.
For taxes covered in our assessment (Tax on Hydrocarbon oil (Fuel Duty); Climate Change Levy[10]; Gas Levy; Hydro-Benefit; Renewable Energy Obligations; UK Emissions Trading Scheme[11]; Carbon Reduction Commitment; Air Passenger Duty; VED paid by businesses; VED paid by households and the Landfill Tax), we conducted a literature review of several academic and grey literature sources that reported information. This related to the following issues: objective of the tax, revenue generated, year of introduction, what is taxed and how tax is collected. This provided a good background overview.
Within the UK, the devolution process has led to calls for the Scottish Parliament to be given more responsibility over revenue raised and spent in Scotland. Following the review of existing UK taxes, the next step has been to look at the environmental taxes under the Scottish Government’s remit that contribute to reducing GHG emissions.
The devolution process was examined. This includes Section 80B of the Scotland Act 1998 (as amended), which devolves powers to add new national taxes in Scotland with the agreement of the Scottish Parliament. It also includes the Calman Commission, which supported the principle of devolution and identified some taxes (Stamp Duty Land Tax, Landfill Tax, the Aggregates Levy and Air Passenger Duty, and elements of Income Tax) where devolved powers could be applied. We reviewed the current legal framework and identified existing environmental fiscal levers in Scotland with an impact on GHG emissions where this devolution process has been applied. This only includes the Scottish Landfill Tax, which was devolved to the Scottish Parliament following the Scotland Act 2012 and replaced Landfill Tax on transactions taking place in Scotland. The Air Departure Tax (Scotland) has also been reviewed following the Scotland Act 2016. According to this Act, Air Passenger Duty is due to be fully devolved to Scotland and to be replaced by Air Departure Tax. However, this devolution process is currently on hold until a solution can be identified that protects Highland and Island connectivity and complies with UK subsidy controls.
For the devolved taxes (this includes the Scottish Landfill Tax and the (Scottish) Air Departure Tax, even though the latter is still on hold) we conducted a literature review of academic and grey literature sources that reported information related to the following issues: objective of the tax, revenue generated, year of introduction, what is taxed and how tax is collected. A brief description of the levy/tax is presented, including, depending on the availability of official data, the rates applied, the taxable event, the taxable person and other additional considerations.
Finally, we examined whether the six case study examples could be implemented by the Scottish Government under current devolved competencies, or whether their adoption would require joint action by the UK Government. This was carried out with reference to two key legislative acts. First, the Scotland Act 1998 that established the Scottish Parliament and gave it the power to legislate on certain matters, including certain elements of taxation. Second, Scotland Act 2012 (which amends the Scotland Act 1998) and gives the Scottish Parliament the power to (a) create new taxes in Scotland (such as on activities currently not taxed under the UK tax code) and (b) devolve any tax of any description with the prior consent of the UK Parliament (in addition to fully devolve the power to raise taxes on waste disposal to landfill).
Appendix B. Fiscal levers to deliver reductions in GHG in the UK
Direct taxation schemes
Tax on Hydrocarbon oil (or Fuel Duty)
Fuel Duty is charged on the purchase of petrol, diesel and a variety of other fuels. It is levied per unit of fuel purchased and is included in the price paid for petrol, diesel and other fuels used in vehicles or for heating. The rate depends on the type of fuel, as follows (Office for Budget Responsibility, 2023):
- The headline rate on standard petrol, diesel, biodiesel and bioethanol is 52.95 pence per litre.
- The rate on liquefied petroleum gas is 28.88 pence per kilogram.
- The rate on natural gas used as fuel in vehicles is 22.57 pence per kilogram.
- The rate on fuel oil burned in a furnace or used for heating is 9.78 pence per litre.
In 2022, Fuel Duty revenue was £24.8 billion. It is the largest environmental tax, comprising 52.5% of environmental taxes and 70.2% of energy taxes in 2022 (Office for National Statistics 2023). Data for Scotland is not reported.
Climate Change Levy (CCL)
This levy was introduced by the UK Government in April 2001. It is an environmental tax charged on the energy used by businesses to encourage them to become more energy efficient, while helping to reduce their overall emissions. By 2022, the tax generated revenues of more than £2 billion in the UK (Office for National Statistics, 2023). Data for Scotland indicates that the share collected in Scotland was between 8 and 9% from 2001 to 2019. Revenues collected in Scotland reached £158 million in 2018-2019.
Specifically, the tax applies to four groups of energy products: electricity; coal and lignite products; liquid petroleum (LPG); and natural gas when supplied by a gas utility. The CCL is paid via two rates: the main levy rate (for energy suppliers) and the carbon price support rate (for electricity producers). The CCL must be declared (via submission of a Climate Change Levy return to HMRC) and paid every three months, although small businesses can apply to make annual returns instead of quarterly returns.
Main levy rate
The main levy rate is applied to companies in the industrial, public services, commercial and agricultural sectors, and according to their consumption of electricity, gas and solid fuels (e.g., coal, coke, lignite or petroleum coke). Energy suppliers are responsible for charging the correct levy to their customers (SEFE Energy, 2023).
The levy rate varies for each category of taxable commodity, according to energy content: kilowatt-hours (kWh) for gas and electricity; and kilograms for all other taxable commodities. The rates do not apply to domestic consumers and charities for non-business use. There are also reduced rates for energy consumers that hold a climate change agreement (United Nations, 2012). Climate change agreements (CCA) are voluntary agreements made between UK industry and the relevant Environment Agency to reduce energy use and CO₂ emissions. CCAs are available for a wide range of industry sectors from major energy-intensive processes such as chemicals and paper to supermarkets and agricultural businesses such as intensive pig and poultry farming.
Carbon price support rate
Carbon price support rates apply to owners of electricity generating stations and operators of combined heat and power stations. They become liable for the carbon price support rate when (a) gas passes through the meter at the registration station and or (b) LPG, coal and other solid fossil fuels are delivered through the entrance gate at the generation station. Electricity generators are responsible for measuring, declaring and paying the correct carbon price support rate.
Renewable Energy Obligations
The Renewables Obligations (RO) were introduced in April 2002 in Great Britain, and in 2005 in Northern Ireland, with the aim of increasing the use of renewable energy to help reduce GHG emissions. Revenue from the tax has increased since its introduction, reaching £6.6 billion in 2022 (Office for National Statistics, 2023). Disaggregated data for Scotland is not reported.
This scheme requires electricity suppliers to generate a certain proportion of electricity from renewable sources. It imposes an annual obligation to present to the Office of Gas and Electricity Markets (OFGEM) a specified number of Renewables Obligation Certificates (ROCs) per megawatt hour (MWh) of electricity supplied to their customers during each obligation period. Suppliers can therefore comply with their obligation in two ways: buying and then redeeming ROCs or paying a buy-out price to OFGEM. The energy must be generated in the UK to qualify for ROCs and the eligible renewable sources include landfill gas, sewage gas, hydro (20MW or less), onshore wind, offshore wind, biomass (agricultural and forestry residues), energy crops, wave power and photovoltaics.
The government sets the RO obligation each year based on predictions of the amount of electricity that will be generated in the UK and the number of ROCs that OFGEM will issue to eligible renewable generators. This obligation level is published at least six months before the start of each obligation period, which runs from April 1 through March 31 (Office of Gas and Electricity Markets, 2023).
Carbon Reduction Commitment (CRC)
The CRC was introduced in 2010 to improve energy efficiency and reduce carbon dioxide emissions in private and public sector organisations that are high energy users, although it was closed in 2019. In the years that the tax was in force, the revenue collected ranged from £0.2 billion to £0.7 billion (Office for National Statistics, 2023).
Organisations that met the qualification criteria were required to participate and purchase allowances for every tonne of carbon emitted. For example, the scheme included supermarkets, water companies, banks, local authorities and all central government departments. Participating organisations were required to monitor their energy use and report annually on their energy supply. The Environment Agency’s reporting system then applied emission factors to calculate participants’ CO₂ emissions based on this information. Participants were then required to purchase and surrender allowances for their emissions (UK Government, 2023d).
Emission trading schemes
UK ETS
The UK ETS was established on 1 January 2021. It replaced the EU ETS following the UK’s exit from the EU. The scheme revenue was £4.3 billion in 2022 (Office for National Statistics, 2023).
The UK ETS covers energy-intensive industries, power generation and aviation. For aviation, the routes covered by this scheme include UK domestic flights, flights between UK and Gibraltar, flights between Great Britain and Switzerland, and flights departing the UK to European Economic Area states, conducted by all aircraft operators, regardless of nationality. For installations, the UK ETS applies to regulated activities that result in GHG emissions (except installations whose primary purpose is the incineration of hazardous or municipal waste). Activities in scope are listed in Schedule One (aviation) and Schedule Two (installations) of the in the Greenhouse Gas Emissions Trading Scheme Order 2020 (Legislation.gov.uk, 2020). The scope of the scheme is set to expand to include more high-emitting areas. It will be applicable to large maritime vessels of 5,000 gross tonnage and above from 2026. From 2028, it will also include waste incineration and energy generated from waste.
Installations with combustion activity below 35MW rated thermal capacity (small emitters), installations with emissions of less than 2.500t CO₂e per year (ultra-small emitters) and operators that provide services to hospitals can opt out of the UK ETS. Instead of having to obtain allowances and thus having allowance surrender obligations, these installations will be subject to emissions targets. However, they will be required to monitor their emissions and notify the regulator if they exceed the threshold.
Free allocation of allowances to eligible installation operators and aircraft operators is maintained to reduce the risk of carbon leakage for UK businesses (UK Government, 2023c). The maximum number of free allowances was set at around 58 million in 2021 (approximately 37% of the 2021 cap) and will decline by 1.6 million allowances per year (ICAP, 2022). Eligible installations must submit a verified Activity Level Report. If the data in the Activity Level Report shows an increase or decrease in activity of 15% or more from historical activity levels, their free allocation will be recalculated. Specific data for Scotland has not been reported.
Free allocations will be made available for operators of eligible installations who applied for a free allocation of allowances for the 2021 to 2025 allocation period and for new entrants to the UK ETS. The free allocation will also apply to the allocation period 2026 to 2030, although free allocations are intended to reduce over time. From 2026, flight operators and aviation businesses will need to buy allowances for every tonne of carbon they emit.
Indirect taxation schemes
Air Passenger Duty (APD)
UK APD is a tax levied on airlines based on the number of passengers carried when departing from a UK airport. It was introduced in 1994 to raise funds for the government and to regulate larger aircraft, but over the years it has become an important environmental tax. The amount of APD is based on the distance travelled and the class of service. There are four different pricing bands. Pricing as of April 2023[12] is:
- For domestic flights (only within England, Scotland, Wales and Northern Ireland), the APD is £6.50 in economy, and £13 in a premium cabin.
- For international flights of up to 2,000 miles (short haul), the APD is £13 in economy, and £26 in a premium cabin.
- For international flights of 2,001 to 5,500 miles (long haul), the APD is £87 in economy, and £191 in a premium cabin.
- For international flights of more than 5,500 miles (ultra long haul), the APD is £91 in economy, and £200 in a premium cabin.
This tax does not apply to flights to the UK, as it is a departure tax only, nor to children under the age of 16 (OMAAT, 2023). Passengers carried on flights leaving from airports in the Scottish Highlands and Islands region are exempt, but passengers on flights from other areas of the UK to airports in Scotland are not. As with other environmental taxes, the government’s revenue from the APD has increased over time. Although it declined between 2020 and 2021 due to restrictions placed on air travel during the COVID-19 pandemic, it reached £2.9 billion in 2022 (Office for National Statistics, 2023). According to HM Revenue & Customs, UK APD collections from Scotland have been over 9% since 1999 and over 10% since 2018, amounting to over £380 million in 2022.
Vehicle Excise Duty (VED)
This is paid by businesses and households as a tax levied on vehicles using public roads in the UK. It is payable annually by owners of most types of vehicles, collected by the Driver and Vehicle Licensing Agency. The amount of VED depends on the year of registration of the vehicle: before or after 1 April 2017, or before 1 March 2001. Further changes will come into effect in April 2025, affecting new and existing electric vehicles.
For cars registered before 1 March 2001 the excise duty is based on engine size. Vehicles with an engine size < 1549 cc pay £180 (single annual payment), while vehicles with an engine size > 1549 cc pay £295 (single annual payment). For vehicles registered between 1 March 2001 and 31 March 2017 a standard rate between £0 (up to 100 g/CO₂/km, which includes hybrid vehicles) and £630 (Over 255 g/CO₂/km) is charged based on theoretical CO₂ emission rates per kilometre. The standard rate is only paid in the year the vehicle is first registered.
For vehicles registered from April 2017 onwards, VED are paid every year. First-year VED payments are based on theoretical CO₂ emission rates per kilometre and are in the range between £0 (up to 0 g/CO₂/km, which does not include hybrid vehicles) and £2000 (Over 255 g/CO₂/km). Drivers of Ultra Low Emission Vehicles (ULEVs) are particularly incentivised as they pay zero VED. Drivers of relatively fuel-efficient petrol or diesel cars (up to 10g/km CO₂) pay up to £10 for the year of initial registration (depending on the car’s official CO₂ emissions), while drivers of less fuel-efficient cars pay up to a maximum of £2,000. For the second year and beyond, most drivers pay a fixed flat rate of £140 regardless of their vehicle’s CO₂ emissions (except for zero-emission cars which pay zero). Apart from the payment period, the biggest changes from April 2017 are that hybrid vehicles are no longer rated at £0 and that cars with a retail price above £40,000 will pay a £310 supplement for years 2 to 6. The reformed VED system retains and strengthens the CO₂-based first year rates to incentivise uptake of the very cleanest cars whilst moving to a flat standard rate.
Electric vehicles (EVs) are currently exempt and drivers of EVs pay no VED. However, from 2025 EVs first registered on or after 1 April 2017 will be liable to pay the lower rate in the first year and the standard rate from the second year of registration onwards. This also applies to zero emission vans and motorcycles (Office for Budget Responsibility, 2023).
Landfill tax
The landfill tax was introduced in the UK in October 1996 to encourage recycling and increase the use of reusable materials. Since its introduction, the amount of waste sent to landfill has fallen by 60%. The tax applies to all waste disposed at a licensed landfill site unless the waste is exempt. It is charged by weight and there are two charge rates: a lower rate for ‘inactive waste’, such as rocks or soil, currently £3.25 per tonne, and a standard rate for all other waste, currently £102.10 per tonne. Rates are updated by the UK Government annually and come into effect on 1 April each year.
The landfill tax is paid by the operators or owners of landfill sites, who often pass on the costs to waste producers such as companies or local authority. Households are not required to pay landfill tax directly as local councils and authorities are responsible for the disposal of household waste. However, the cost may be further passed on to households that end up paying it indirectly via their council tax bill.
In 2022, the UK government raised £0.8 billion from the landfill tax (Office for National Statistics, 2023). The revenue is used for a variety of purposes, including supporting environmental projects and programs (Business Waste, 2023). According to HM Revenue & Customs, Scotland’s share of the total collected by the UK Landfill Tax was 13% in 2014-2015 (the tax was devolved to Scotland in 2015), amounting to a collection of £0.15 billion.
Appendix C. Supplementary data
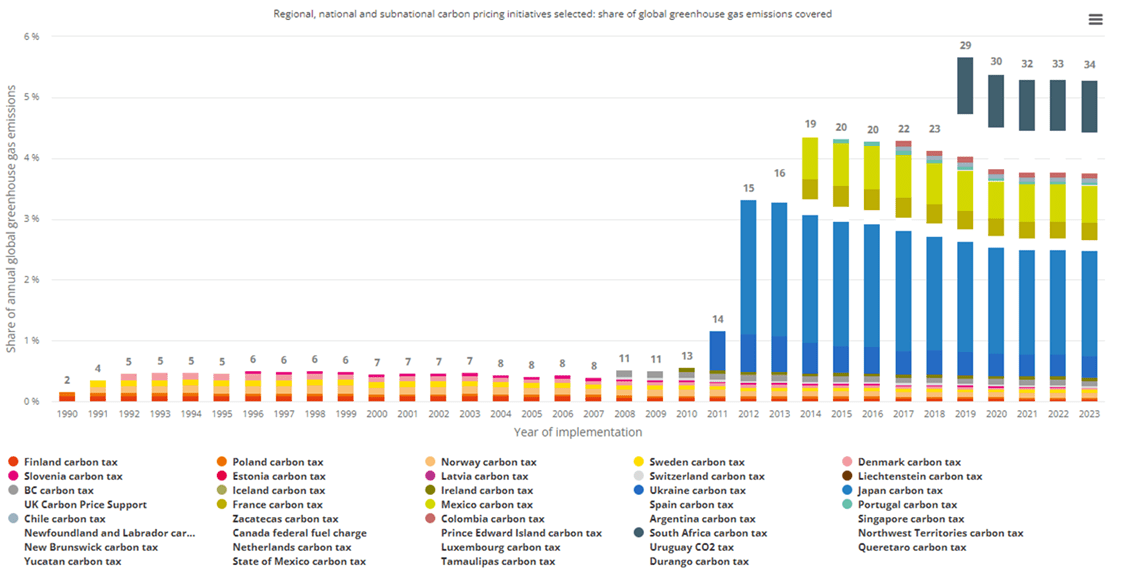 Figure 8.1: Share of GHG emissions covered, as of March 2023 (World Bank 2023c)
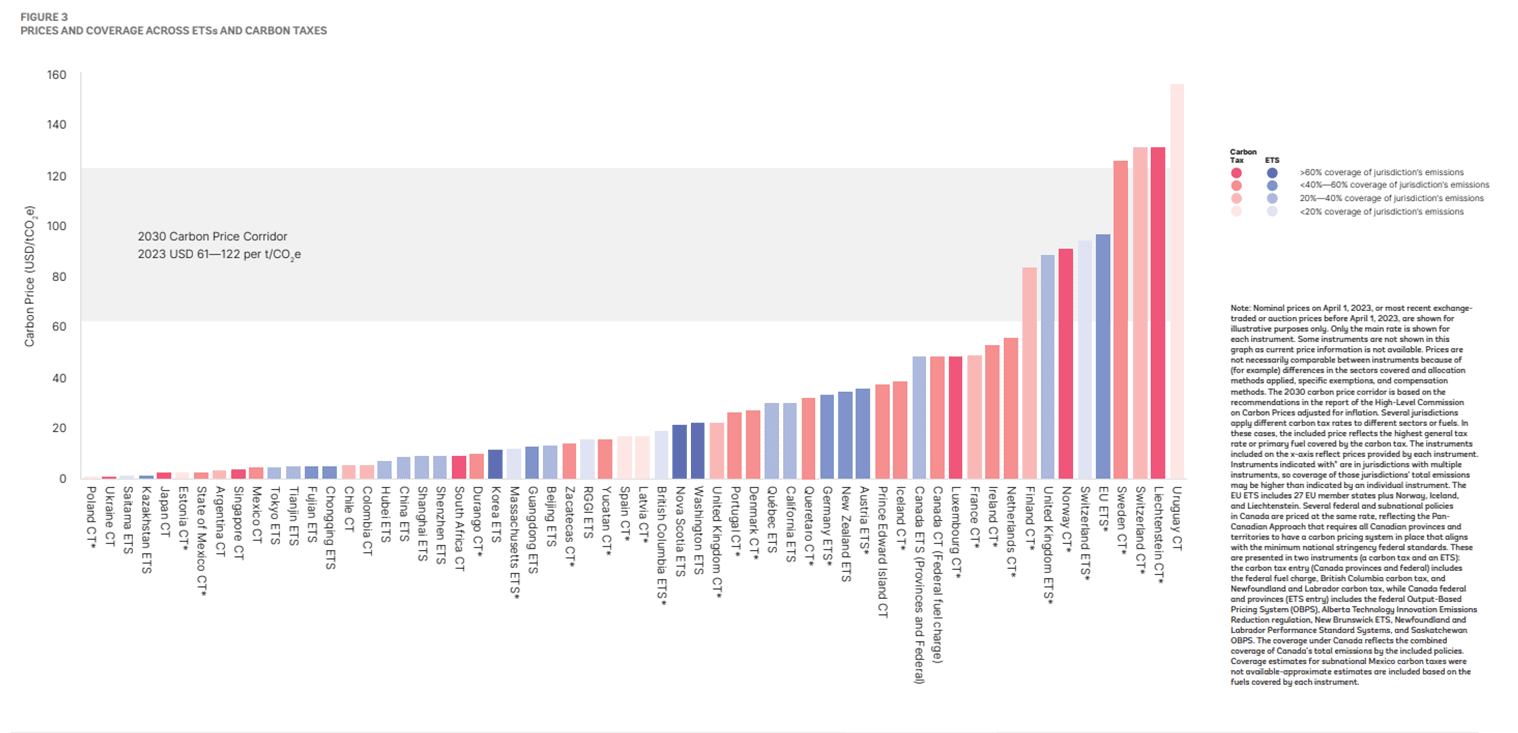
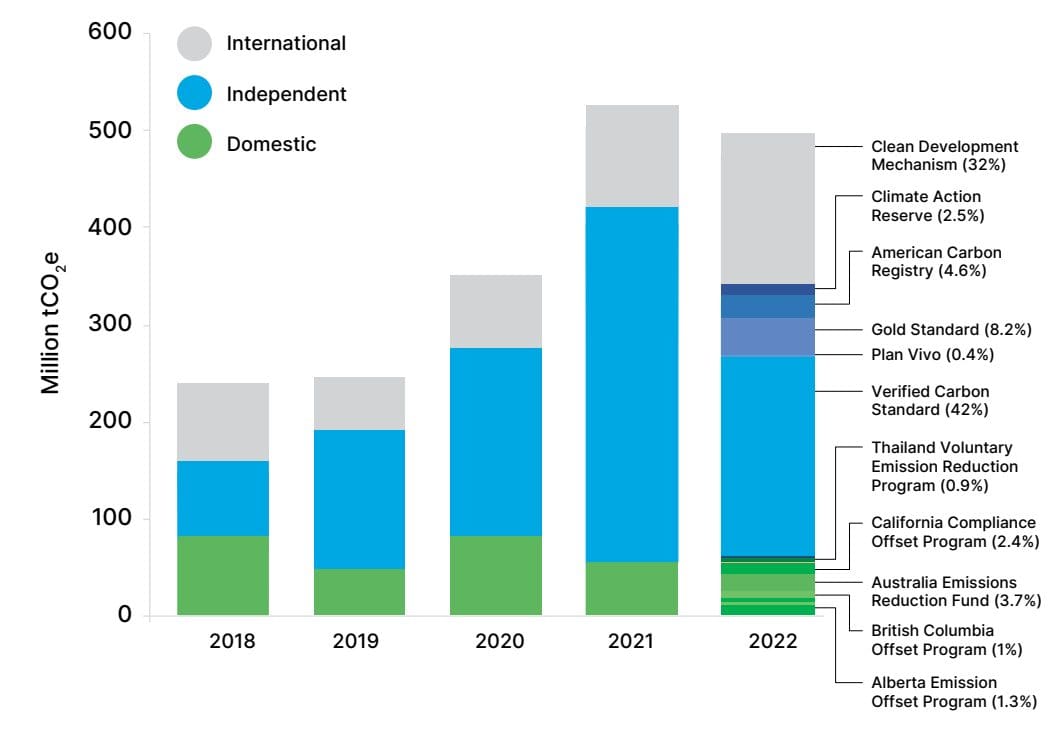 Figure 8.3: An overview of global carbon credit issuance (World Bank 2023c)
|
Instrument |
Quantified GHG emission reductions |
Notes |
|---|---|---|
|
“Carbon taxes in European nations” |
Reduction in GHG emissions “by up to 6.5% over several years”. |
Evidence taken from a 2018 review, drawing on data up to the end of 2015 from 35 carbon taxes (cited in Green 2021). The instruments and period are not specified further. |
|
Carbon tax in British Columbia |
Reductions over 2008 – 2014 (with some variation in dates among studies) range between 5% and 15% below a counterfactual reference level, or around 2% per year. Note it is not clear in the source if this figure relates to total emissions in the jurisdiction or in affected sectors; it is assumed to be the latter. A 2015 study noted it reduced CO2 emissions from gasoline consumption by more than 2.4 million tonnes in the first four years of operation. And a 2020 study over the period 1990-2014 noted the tax had reduced transport sector emissions by 5%. |
Evidence based on a meta-review of various (number not given) of studies on the BC tax. Note this estimate does not include a quantitative estimate of carbon leakage associated with the tax to other jurisdictions. The net reduction is therefore highly likely to be less (cited in Green, 2021). |
|
UK carbon price support (UKCPS) |
A 2019 study concludes the UKCPS reduced emissions in the power sector between 41% and 49% over 4 years (2013–17). Another that it reduced emissions “overall” by 6.2% (2013-2016(2.1% per year)), based on a price of €18 per ton. |
All three studies are cited in Green, 2021. It is not always clear if these studies referred to reductions within the sectors affected by the instrument or overall aggregate reduction. Again, it is assumed to be the former. As above, the treatment of carbon leakage is not specified, hence the emission reduction estimates may be overstated. |
|
UK Climate Change Levy (CCL) |
A third study noted the CCL reduced emissions amongst power plants paying the full levy rate by “between 8.4% and 22.6% compared to plants paying the reduced rate”. The study refers to between 2000 and 2004. | |
|
Sweden Carbon Tax |
Overall, the findings differ. A 2019 study estimated emission reductions of 6.3% in an average year, between 1990 and 2005. Other studies identify emission reductions only in certain sectors (district heating emissions, in a 1998 study and emissions from petrol in a 2018 study). |
The review notes “Nordic taxes tend to do better on emission reductions, although the wide variation in fundings make it hard to conclude this definitively”. The source is not clear on the precise period in question for each statistic, but the overall period assessed was 1960-2010. Other studies suggest the tax had “little or no effect on emissions”. This is an important finding, given the relatively high carbon price in Sweden as well as the length it has been in operation. Note: No estimates have been identified for Liechtenstein and Switzerland, the other jurisdictions with the highest carbon prices. |
|
Finland, Netherlands, Norway, Sweden. |
A 2011 study identified no effect on per capita growth rate of emissions between 1990 and 2008 in any jurisdiction, except Finland (which saw a reduction of 1.7%). |
The study applied a “difference in difference” analysis (a type of economic modelling approach). The time period this refers to is not clear. |
|
Sweden, Norway, Denmark, and Finland. |
A 2019 study identifies annual reductions in Sweden of 17.2% and 19.4% in Norway, but “no statistically significant effects in Denmark or Finland, over the period 1990-2004. |
Based on a synthetic control study (a statistical approach which compares effects based on case studies). Results considered “an outlier” in the Green 2021 review. |
|
Norway |
A 1997 study identifies a reduction of between 3% to 4% between 1991 and 1993 (1-1.3% per year). |
Based on a hypothetical counterfactual scenario. |
|
Denmark, Ireland, Finland, Sweden and Slovenia |
An increase in price of €1 per ton in CO2 tax results in an annual 11.58 kg per capita decrease in emissions. |
Based on panel data. |
|
France |
Carbon tax reduced emissions in manufacturing sectors by between 1% and 5% between 2014 and 2018. |
A 2019 study, using a counterfactual based on historical data. |
|
“Tipping points” |
A 2018 study, based on analysis between 1995 and 2013 suggests that CO2 taxes reduce emission if they surpass 2.2% of GDP. |
Based on economic modelling based on panel data. |
|
Germany, Denmark, Netherlands, UK, Slovenia, Finland and Sweden. |
Average reduction of 3.1% compared to a historical baseline (for 6 of the 7 countries). |
Based on historical data for the baseline and a counterfactual using country specific data. The “7th country” is not specified. |
|
Instrument |
Annual revenue (million) |
Per capita revenue |
Share of GDP |
Earmarking/hypothecation |
|---|---|---|---|---|
|
Sweden carbon dioxide tax |
$3,680 |
$381 |
0.67% |
General funds (50%) and revenue recycling (50%) |
|
Norway carbon dioxide tax |
$1,580 |
$307 |
0.31% |
Green spending (30%); general funding (40%) revenue recycling (30%) |
|
British Columbia carbon tax shift |
$1,100 |
$239 |
0.49% |
Revenue recycling (102%) |
|
Denmark carbon tax act (2010) |
$1,000 |
$177 |
0.29% |
Green spending (8%); general funding (47%) revenue recycling (45%) |
|
Switzerland carbon dioxide levy |
$875 |
$107 |
0.13% |
Green spending (33%); revenue recycling (67%) |
|
Mexico special tax on production and services (2014) |
$870 |
$7 |
0.06% |
General funding (100%) |
|
Finland carbon dioxide tax |
$800 |
$146 |
0.29% |
General funding (50%); revenue recycling (50%) |
|
Ireland [1} |
$510 |
$111 |
0.03% |
Green spending (13%); general funds (88%) |
|
Japan tax for climate mitigation (2012) |
$490 |
$4 |
0.01% |
Green spending (100%) |
|
France [2] |
$452 |
$7 |
0.02% |
Green spending (100%) |
|
Iceland [3] |
$30 |
$92 |
0.22% |
General funds (100%) |
Notes:
- natural gas carbon tax, mineral oil tax and solid fuel carbon tax, data from 2012
- domestic consumption tax on energy products (carbon dioxide), data for 2014 and reflects a partial year
- Carbon tax on carbon of fossil fuel origin
|
Instrument |
Annual revenue (EUR Million) |
Earmarking/ hypothecation commitment |
Notes on revenue use |
|---|---|---|---|
|
Canada (Alberta and BC) |
1,520 |
Legally binding |
Overall spending measures exceed revenues, via tax cuts, rebates and direct compensation. Revenues are distributed to households – targeted to low-income households – as well as business (including small businesses). Since 2018 a “clean growth incentive programme has been supported which focuses on research on fugitive emissions in the oil and gas sector and on slash burning. |
|
Chile |
233 (2018) |
None |
Unconstrained (used for general funds). Tax introduced in 2014 as part of a broader reform, to help fund educational reform policy. |
|
Denmark |
480 |
Political commitment |
No data. |
|
Finland |
1,402 |
All revenues distributed as tax cuts or rebates. | |
|
France |
3,800 |
79% legally binding, remainder unconstrained |
The legally hypothecated 79% is distributed via tax cuts and rebates. Up to 2016 this funded a tax credit for business. Since 2017 revenues are allocated to a dedicated “energy transition account” which compensates affected industries of a proportion of the costs associated with use of renewable energy sources. |
|
Iceland |
26 |
None |
Revenues are unconstrained. |
|
Ireland |
434 |
12% legally binding, reminder via political commitment |
The majority of revenues are distributed via tax cuts and rebates, including reductions in payroll taxes. A small proportion is allocated to energy efficiency measures, particularly household retrofits to help households at risk of fuel poverty and to provide support for rural public transport. |
|
Japan |
No data |
100% legally binding. |
Revenue data is not publicly available but used for energy efficiency and renewable energy support programmes. |
|
Norway |
1,246 |
44% legally binding, reminder via political commitment |
Revenues are distributed via tax cuts and rebates. A proportion of the revenue flows to the Government Pension fund, the returns from which (expected to equate to the real rate of return (3%)) are then allocated to general government funds. |
|
Portugal |
134 |
11% legally binding |
Reallocated to tax cuts and rebates particularly income tax reductions for households with larger families. A proportion of the revenue are allocated to green and environmental spending, including infrastructure for electric vehicles, public transport, conversation and climate change mitigation policy. |
|
Slovenia |
132 |
All revenues are unconstrained |
From 2005 to 2008 some revenues were used to finance carbon reduction projects and environmental subsidies for industries. |
|
Sweden |
2,549 |
Introduced in the early 1990s as part of a broader fiscal reform package. The revenues were used to finance labour tax reductions as well as fund Sweden’s 1996 application to the EU. Revenues from 2016 flow directly to central government budget. | |
|
Switzerland |
985 |
100% of revenues legally binding |
One third of revenues fund energy efficiency in buildings, including geothermal heating as well as a technology fund. The remainder fund social security contributions for businesses as well as subsidies on health care premiums. |
Appendix D. Case studies
For all case studies, RAG rating for similarities to Scotland denoted red [R], amber [A] and green [G].
Case study 1
Lever type: Direct Carbon TaxJurisdiction: British Columbia, Canada
|
Population and GDP |
[G] |
Like Scotland, Canada is a high-income country, it comprises ten provinces and three territories. The British Columbia (BC) economy is similar in size to Scotland’s. For comparison, BC’s GDP was $265.8 billion (around £154 billion)[13] in 2020; Scotland’s was £148 billion. GDP per Capita in BC is $59,962 (Government of Canada, 2023a); in Scotland it was $42,632 in 2021 (Scottish Government, 2023a)[14] BC’s population is also comparable; BC’s population was 5 million in 2021 (Government of Canada, 2023b), compared to 5.4 million in Scotland in 2022 (Scottish Government, 2023c). | |
|
Administrative and legal arrangement/ competencies |
[G] |
The carbon tax in BC was designed, applied, enforced, and administered at province level. This makes it of particular interest to Scotland, given devolution. Since its implementation however, it was frozen and then re-introduced when the Federal carbon tax was implemented at national scale by the Canadian Government. This tax is administered by the Canadian Ministry of Finance. The Ministry of Environment and Climate Change is responsible for the inventory and allocating funding. | |
|
Shared challenges |
[A] |
Canada relies heavily on fossil fuel consumption for both domestic use and net exports of carbon-intensive manufactured goods and fossil fuels. It is also among some of the most intensive emitters of CO2 in the OECD, with per capita emissions for 2010 being recording at 15.5 tonnes per capita of CO₂. This compares to 9.6 tonnes per capita of CO₂ the OECD average and 7.6 tonnes per capita in the UK in the same year (OECD, 2023).[15] BC sources a very high proportion (93% of its electricity in 2008) from renewable energy, specifically hydropower (Harrison, 2013). | |
|
Climate ambition |
[A] |
Canada is committed to achieving Net Zero by 2050. Scotland has committed to reducing emissions by 75% by 2030 and achieving Net Zero by 2045. | |
|
Data and evidence |
[G] |
There is significant information available. | |
|
Diversity of approaches |
[G] |
The approach taken in BC is a direct carbon tax that is administered at sub-national level. It is the only sub-national direct carbon tax selected as a case study. | |
|
Lever design | |||
|
The BC Government introduced the first carbon tax in North America in 2008 (Pretis, 2022). It was introduced at a time when other North American governments were embracing cap and trade over taxation (Harrison, 2013). It is a direct carbon tax applied to fuels based on their CO₂ content, covering all liquid transportation fuels such as gasoline and diesel, as well as natural gas or coal used to power electric plants. The tax is applicable to 70-75% of the province’s GHG emissions, with the remainder of GHG emissions coming from non-combustion CO2 in industrial processes, methane emissions, from natural gas extraction and transmission, nitrous oxide emissions from agriculture and CO₂ emissions from forestry (Murray and Rivers, 2015, p.676). The rate of the tax at implementation was $10 CAD per tonne emitted. Initially, this was set to rise by $5 CAD per year until it reached $30 CAD per tonne in 2012. The tax increase was frozen however in 2012 by the British Columbia Government. In 2018, a change in government and the implementation of a federal carbon tax in Canada resulted in the BC carbon tax being unfrozen and the price increased. However, the legislation surrounding the tax was altered to no longer require revenue neutrality. We understand, following a stakeholder interview, that the British Columbian Government have mirrored the rates set by the federal government at national scale by following the federal government’s schedule for carbon tax increases[16]. The British Columbian government initially committed to the tax being revenue neutral. It operated as a tax shift wherein carbon tax revenues were countered by cuts in other taxes (such as business taxes, personal income tax, low-income tax credits and direct grants to rural households) or direct transfers to households. Between the tax’s implementation in 2008 and 2015, the tax generated C$6.1 billion (Murray and Rivers, 2015). Since 2018, the revenue generated is now allocated centrally by the federal government. The revenues are then redistributed through dedicated tax rebates for low-income households or for public purposes, including climate action.[17] The administration of the tax is via the Ministry of Finance. The Ministry of Environment and Climate Change is responsible for the inventory and fund allocation.[18] When introduced, the tax did not include exemptions for particular sectors, it was applied universally. Concerns were raised, however, by greenhouse plant/vegetable growers (Seed your future, 2023)[19] regarding the competitiveness of their operations in comparison with California and Mexico. This led the Government in BC to introduce a one-time exemption (worth $7.6 million) from the Carbon tax in 2012, an ongoing 80% exemption from the carbon tax for greenhouse growers from 2013, and an exemption for gasoline and diesel used in agriculture from 2014. | |||
|
Lever effectiveness | |||
|
Public perception of the carbon tax in BC, almost 15 years on from its implementation, is seen as generally positive. The tax is considered a success in terms of its role in promoting behavioural change and decreasing consumer demand for fossil fuels and natural gas (Pretis, 2022). The Pretis paper outlines a series of studies, including Xiang and Lawley (2018) and Antweiler and Gulati (2016) that drew correlations between the implementation of the tax and a decrease in fuel demand. Furthermore, evidence shows that the tax has had a low per capita cost, aiding further public acceptance. Bernard and Kichian (2019) assess the extent to which the tax reduces British Columbia’s CO2 emissions. They state that once reaching the rate of $30/ton of CO2, it achieved an estimated 1.13-million-ton reduction in CO2 emissions, amounting to an average annual reduction of 1.3% relative to BC 2008 diesel emissions and to 0.2% relative to all BC CO2 emissions in 2008. Bernard and Kichian (2019) argue however, that whilst the tax can be considered politically successful, the reductions seen are not significant enough for it to be considered a viable strategy, in isolation, for the Canadian government to meet its carbon-related commitments. Pretis (2022) conducted a study on the effectiveness of the tax at reducing aggregate CO₂ emissions in order to determine economy-wide CO2 emission reductions. It was concluded that there is a lack of statistically significant proof of economy-wide effectiveness. The carbon tax was considered too low to result in rapid cross-sectoral changes. Pretis (2022) did outline that the tax has had significant impact on emissions from transport as BC relies heavily on individual motor vehicles due to the long driving distances and limited public transport. It also showed little impact on emissions from electricity production. This is explained by the high reliance on hydropower for electricity generation. The revenue-neutral commitment made by the government upon implementation of the carbon tax has been criticised by some analysts for not fully compensating low-income households for the additional burden due to higher energy prices (Beck et al., 2014). Beck et al. (2014) argues however, that criticisms such as that are unfounded, stating that the government have made every effort to ensure that the policy is equitable. It is important to note however, that this study was published before the revenue-neutrality element of the tax was changed, no later assessments of the equitability of the tax were found. | |||
|
Key lessons learned | |||
|
Pretis (2022) argues that the BC carbon tax is a good example for the introduction of carbon taxes in comparable jurisdictions. It confirms that carbon tax policies with high public support and acceptance are possible. It is also a positive example for how a carbon tax, with targeted sectoral exemptions, can reduce aggregate emissions. Pretis (2022) notes however, that the predominant role that hydropower plays in BC electricity generation potentially limits its applicability where reliance on fossil fuels is higher. Moreover, Harrison (2013) argued that the introduction of a carbon tax in BC resulted from a “perfect storm” of factors that enabled its implementation. These factors included the prominence of the hydropower, an increase in public concern for climate change, a government with the trust of the business community and a political leader (at province level) with the ability and determination to implement his ambitions. It is important to consider therefore, that whilst it worked in the context of BC, other nations considering the implementation of a carbon tax with a similar ethos, will still need a combination of factors related to political, economic and social context which ultimately determine its success. But several elements of the BC context are applicable to Scotland. First, there are lessons to be learnt from the progression of the tax, transitioning from sub-national instrument to later alignment with federal standards. It is an example of how sub-national taxation can be successful at reducing GHG emissions at sectoral level. It also shows that subnational carbon taxation can generate significant revenue for Governments to spend as they deem fit. As in Scotland there is high reliance on private vehicle use in BC, given low population density, extent of rural areas and low reliability of public transport connections in rural areas. Bernard and Kichian (2019) also noted that whilst the carbon tax in BC is generally publicly accepted, it has not been shown to have influenced significant reductions in overall emissions of CO2. They conclude therefore that it should not be considered a viable sole strategy for the Canadian government to meet its carbon-related commitments. | |||
Case study 2
Lever type: Direct Carbon TaxJurisdiction: Sweden
|
Context | ||
|
Population and GDP |
[A] |
Like Scotland, Sweden is a high-income country. Sweden has a larger economy and double the population. For example, GDP per Capita in Sweden was $65,157 in 2021 and in Scotland was $42,362 (Scottish Government, 2023a).[20] Sweden’s GDP was $683 billion in 2021 compared to Scotland’s £148 billion. Sweden has a population of 10.5 million (2022), approximately double that of Scotland (5.4 million in the same year (Scottish Government, 2023c)). |
|
Administrative and legal arrangement/ competencies |
[A] |
Sweden provides an example of a nationally administered carbon tax. The carbon tax is levied on transport fuels and is designed to work alongside Sweden’s energy tax and the EU ETS. Sweden’s energy tax is levied on diesel, coal, oil, and electricity used for heating purposes. This could give valuable lessons for Scotland in terms of designing a similar carbon tax to function alongside the UK ETS and the UK climate change levy. |
|
Shared challenges |
[G] |
Both Sweden and Scotland are increasing their renewable energy potential, in 2021 around 60% of Sweden’s energy production came from renewable sources compared to Scotland at around 57% (Swedish Institute, 2022) (BBC, 2021). In addition, both Sweden and Scotland have rural and rural-island communities which create a unique set of challenges and opportunities in delivering equitable national climate action. |
|
Climate ambition |
[G] |
Sweden is legally bound to achieving Net Zero by 2045. They are on track with this target and have managed to meet one of their renewable energy targets already. Scotland has similarly committed to achieving Net Zero by 2045 and reducing emissions by 75% by 2030. |
|
Data and evidence |
[G] |
There is significant information available for this case study as the carbon tax was implemented in the early 1990s, however there are contesting views on the effectiveness of the tax in reducing greenhouse gas. |
|
Diversity of approaches |
[G] |
This is an example of a direct carbon tax, administered at national level. The tax is one of the oldest and currently the highest priced carbon tax in the world. |
|
Lever Design | ||
|
Due to growing environmental concerns and building on Sweden’s history of levying taxes on energy products, the government introduced their first carbon tax in 1991 (Andersson, 2019). The carbon tax was levied on gas oil, heavy fuel oil, coal, natural gas, petrol, gas oil, heavy fuel oil, coal and natural gas (Johansson, 2000). To ensure Sweden’s existing energy tax – levied on diesel, coal, oil, and electricity for heating purposes – would work alongside the newly introduced carbon tax, fuels used for power generation were exempt from the carbon tax (Johansson, 2000). As such the fuels targeted by the carbon tax were mainly used within the transport sector, which in the early 1990s was Sweden’s largest emitting sector. In 1991, the carbon tax was introduced at a price of US$30 per tonne of CO₂ however tax rates were lowered by 50% for the agricultural and industrial sector to avoid carbon leakage and ensure international competitiveness. Furthermore, full exemptions were made for fuels used within electricity production as these were covered by Sweden’s energy tax (Jonsson, Ydstedt, & Asen, 2022). The Carbon tax introduction in 1991, was part of a wider tax reform by the Swedish Government, referred to as the “green tax switch”. Here, environmental taxes were increased while taxes such as marginal income tax, corporate tax and the capital income tax were lowered. The revenue generated by the carbon tax was 26 billion SEK in 2004 (Government Offices of Sweden, 2021). More recently, the carbon tax covers the direct (Scope 1) CO₂ emissions from all fossil fuels except peat, with 90% of the tax revenue coming from gasoline and motor diesel alone (Andersson, 2019) (World Bank, 2023b). As there are still numerous fuel exemptions from the tax, for example those used for commercial aviation and maritime, only around 40% of Sweden’s greenhouse gas emissions are covered by the tax. Some of the exempted industries are covered by the EU ETS (European Union Emission Trading Scheme) however levies within this scheme currently price carbon lower than the carbon tax (Jonsson, Ydstedt, & Asen, 2022). Note limited data was identified regarding the administration and enforcement of the tax. | ||
|
Lever effectiveness | ||
|
Public perception of the tax is generally positive, and Sweden is acknowledged as a pioneer in environmental governance at an at an international level (Hildingsson and Knaggård, 2022). The tax is considered to be a success as Sweden has been able to reduce its greenhouse gas emissions while maintaining a growing GDP (Government Offices of Sweden, 2021). Published research has attempted to quantify the effectiveness of the tax in reducing greenhouse gas emissions. Research by Sumner, Bird & Smith (2009) evaluates the carbon tax by comparing its implementation period to national greenhouse gas reduction trends. The results state that emissions were reduced by approximately 15% from 1990 to 1996, by 9% from 1990 to 2006 and decreased by 40% from the mid-1970s to 2008. There is some methodological disagreement on what reduction can be attributed to the carbon tax, in isolation. A review of ex-post analyses of carbon taxes by Green (2021) reveals contesting results around Sweden’s emission reductions. For example, research by Andersson (2019) found an average emission reduction of 6.3% per year between 1990 and 2005, Fernando (2019) found an annual average reduction of 17.2% and research by Shmelev and Speck (2018) found no effect on emissions. A study conducted by Jonsson, Ydstedt, & Asen (2022) state that GHG emissions have declined by 27% between 1990 and 2018. In terms of revenue generated by the tax, by 1994 the carbon tax generated 7 billion SEK. From 1994 revenue rapidly increased to 26 billion SEK in 2004 (Government Offices of Sweden, 2021). During this time the carbon tax rate increased from 23 EUR/tonne CO₂ to 84 EUR/tonne CO₂. Fluctuations in revenue generated by the tax have been caused by an increasing tax rate and decreasing tax base (greenhouse gas emissions overall are declining). From 2004, the revenue generated stabilised until 2010 and since then it has gradually declined over the last decade (Jonsson, Ydstedt, & Asen, 2022). In 2019, SEK 22.2 billion was generated which is approximately 1% of Sweden’s total tax revenue. The carbon tax revenue goes into the overall government budget, and is not hypothecated, thus it is unclear where revenue generated is distributed (Jonsson, Ydstedt, & Asen, 2022). The carbon tax has shown to be effective in shifting market investment into low-carbon technology, specifically in renewable energy sources such as hydro and wind (Hildingsson and Knaggård, 2022). In 2019, 59% of Sweden’s energy mix was generated by renewable energy sources (Hildingsson and Knaggård, 2022). Levying the carbon tax at different rates on fuels has also resulted in behaviour changes in companies. Between 1993 and 1997, the higher tax rate on fuels used within domestic heating systems compared to fuels used within industry resulted in industries selling their byproducts to domestic heating companies, while continuing to burn fossil fuels themselves (Johansson, 2000). Our understanding, following a stakeholder interview, is that the carbon tax increased the price of gasoline and diesel for consumers at the fuel pump and in response there was a substitution away from gasoline toward diesel. This interviewee referred to data showing road sector fuel consumption of gasoline decreasing while diesel consumption increased after the carbon tax was implemented. | ||
|
Key lessons learned | ||
|
Sweden’s experience with the world’s longest standing carbon tax makes it a valuable case study for Scotland. Sweden’s carbon tax is described as a ‘resilient success’ by the policy assessment called the “PPPE framework” (programmatic, process, political and endurance) and the tax has formed the backbone of environmental policy in Sweden to date (Hildingsson and Knaggård, 2022). The tax has been continuously redesigned over the past 30 years by the Swedish Government to reflect Sweden’s political, social, and economic situation. For example, the tax rate has incrementally increased over the last 30 years and the tax rate has been lowered by 50% on fossil fuels used by industry. These measures have ensured Sweden’s international competitiveness in energy exports have not been negatively impacted by the tax (Hildingsson and Knaggård, 2022). Sweden’s carbon tax was introduced at a time in which the country was undergoing a wider fiscal reform referred to as the ‘green tax shift’ where energy and CO2 taxes were introduced while labour taxes were reduced. Research by Shmelev and Speck (2018) suggests that in isolation the carbon tax would have been insufficient at reducing emissions and emission reductions were only achieved by a collective effort of the carbon tax, energy tax and investment into low carbon technology such as nuclear and hydro power. As evidence suggests, a carbon tax alone may not be effective enough in reducing Scotland’s emissions. Research by Carattini, Carvalho and Fankhauser (2018) reveals that the public’s support in increasing the Swedish carbon tax was strengthened by findings which demonstrated the effectiveness of the tax in reducing national emissions. Therefore, Scotland would need to consider the benefits of public awareness and information sources in incentivising support around any potential future carbon tax, should it be considered. Tax revenue recycling can be implemented to reduce potential distributional effects of carbon taxes. Thus, Scotland could explore revenue recycling options if it were to consider implementing a carbon tax to reduce any distributional effects such as income inequality. | ||
Case study 3
Lever type: National ETS (nETS)Jurisdiction: Austria
|
Context | ||
|
Population and GDP |
[A] |
Austria is a high-income country, however, there are differences in GDP. Austria’s was 537 billion USD in 2021, whereas Scotland was 181 billion in 2021). In per capita terms, this equates to $59,991 per capita for Austria in 2021 in comparison to Scotland’s $42,361 in the same year.[21].Austria also has almost double the population of Scotland – 9 million vs 5.4 million in 2022 (OECD, 2023a; OECD 2023b; Scottish Government, 2023a). |
|
Administrative and legal arrangement/ competencies |
[G] |
The Austrian nETS is administered at national level. However, it has been specifically designed to fit around and complement the EU ETS, a supranational cap and trade system. This could give valuable lessons for Scotland in terms of designing a similar scheme around the UK ETS. |
|
Shared challenges |
[A] |
Both Austria and Scotland are rapidly growing their renewable energy potential, although their situations are not necessarily comparable – Scotland had a target of 100% renewable electricity generation by 2020, however, the equivalent of 85% of gross energy consumption was from renewable sources in 2021. (Scottish Government, 2023b). Austria aims to reach 100% renewable electricity generation by 2030, and in 2021 Austria’s electricity mix was 71% renewable energy (Eurostat, 2023). Austria’s renewable energy is largely supplied by hydropower as a result of the many rivers and high rainfall, whereas Scotland’s is largely driven by onshore and offshore wind (Scottish Renewables, 2023). Austria has no island communities but does contain large rural population which could provide useful insights and comparators, in particular for the transport sector covered by the nETS. |
|
Climate ambition |
[G] |
The Austrian government has pledged to achieve Net Zero by 2040, however this has not been enshrined into national legislation and the IEA state that achieving this would require Austria to substantially enhance decarbonisation efforts across all energy sectors (IEA, 2023). Despite this, they have demonstrated climate ambition by implementing a novel fiscal lever to reduce GHG emissions in non-EU ETS sectors. Although Germany also has a nETS in place, neither have been in place long enough to generate significant evidence on effectiveness. |
|
Data and evidence |
[G] |
A lot of information is available on the lever design; however, the scheme is still in its initial implementation phase. An overall cap on emissions and trading of allowances, which will create a “market” price, will be initiated in 2026. Therefore, no ex-post evidence is available on effectiveness of the lever in practice as it has not yet reached the final stage of implementation. |
|
Diversity of approaches |
[G] |
This is the only national level ETS considered as a case study. Germany also operates a similar national level ETS but these are novel approaches. |
|
Lever design | ||
Austria launched its nETS as part of the Ecological Tax Reform Act on 1 October 2022 (Parliament Österreich, 2022). The reforms included many other pricing instruments, so was implemented as part of a wider policy package. The scheme was initially intended to be in place from 1 July 2022, but was postponed as part of an energy relief package intended to relieve cost of living pressures from increased energy prices resulting from the war in Ukraine. The nETS was designed to complement and exist alongside the EU ETS. It covers CO2 emissions from fossil fuels including transport fuels (petrol and diesel), fuel and heating oil, natural gas/liquified gas, coal and kerosene used in sectors which are not regulated under the EU ETS. The sectors in scope are small, non-EU ETS industry, transport, buildings, waste and agriculture. No data has been identified which set out the differences between the EU ETS and nETS in terms of GHG coverage. Designing the nETS to fit around the EU ETS, namely ensuring that EU ETS installations are not exposed to double counting, was one of the biggest challenges the Austrian government experienced when implementing this lever.[22] The ETS has a fixed price, which is designed to steadily increase from 2022-2025, before transitioning to a market price after that, which will operate as a standard cap and trade scheme. The scheme was designed to increase as a fixed price in this way to ensure there is security for market participants to plan ahead. The pricing scheme is as follows, for allowance which covers one tonne of CO₂e:
For comparison, the price under the EU ETS in September 2023 was ~85 EUR per tonne. Therefore, the price under the nETS is much lower than under the EU ETS, however, at the end of the transitional phase it will be closer. However, by nature of the market phase it is uncertain what the price will be after the fixed allowance prices cease. Phased implementation In the early phase of the scheme (2022-2023), there is a fixed price and a simplified procedure for registration and reporting – registered entities (the company/person liable for paying the tax) are not required to conduct monitoring and reporting at this stage, and the National Emissions Trading Information System is being established. Emission allowances do not need to be formally purchased or surrenders, so the scheme is more like a tax, although companies are preparing for full implementation. In the transitional phase (2024-2025), allowances will start being issued and surrendered and obligatory monitoring and reporting will be phased in. This will include independent verification of emission allowances. In 2026, an overall cap on emissions will be in place and allowances will shift to a market price. The scheme will eventually align with the EU ETS 2, which from 2027 will eventually price emissions in the same sectors at European level. Compliance, MRV and Enforcement (ICAP, 2023) The Austrian Federal Ministry for Finance (BMF) and its excess duty administration is responsible for the implementation of the scheme in Austria, which has eased administration burdens for implementing the scheme due to similarities with existing excise duties, although the process of surrendering allowances is new and has been a learning process (other departments handle this for EU ETS).[23] The compliance period runs per calendar year, and registered entities must submit an emissions report at the end of June for the previous year’s emissions, and then have until the end of July in the following year to surrender allowances to cover the reported emissions. Emissions reporting must be independently verified and be based on a pre-approved monitoring plan. Exemptions are in place for installations subject to the EU ETS to avoid double burdens, negligible cases (emitting less than one tonne CO₂e) or exemptions under energy taxes. Entities must pay an increased certificate price (at two times the fixed emissions price) for each tonne of CO₂e for which no allowance has been surrendered. Once the market phase has been reached, entities must pay an increased certificate price of EUR 125 per tonne CO2e. Fines can be issued for other instances of non-compliance, apart from those exempted outlined above. The Austrian Federal Ministry for Finance (BMF) is the authority responsible for establishing the regulatory framework of the nETS, and the Office for National Emissions Allowance Trading at the Austria Customs Office is the implementing authority, responsible for receiving emissions reports. Revenue The nETS was implemented as part of a wider policy package. Although revenue for the emissions allowances goes directly into the main budget and there is no hypothecation, ‘climate bonus’ payments are given directly back to households. This is paid as a set price per person, which means that relatively poorer households (who typically live a less carbon intensive lifestyle, hence pay less of the costs) gain relatively more back than richer households. Currently, in the fixed price phase, more money is given back to households and companies in ‘climate bonus’ payments than is received by the Austrian government in revenue. Revenue in 2022 was approximately €800 million and the government have provided rebates of around €1 billion.[24] | ||
|
Lever effectiveness | ||
|
There are no ex-post studies or evaluations available as the lever has not yet reached its full implementation stage. Emissions data for 2022 (although implementation only started in October 2022) will be available in due course. However, 2022 was an unusual year as energy prices were very high, affecting behaviour. The CO2 price was still relatively low in 2022 – a carbon price of €30 leads to no more than €0.08 per litre of diesel or gasoline). Therefore, the Austrian government do not think that this will be representative of a typical year. Ex ante modelling studies conducted by the Austrian government showed that the scheme was expected to reduce CO2 emissions from the sectors affected of around 800,000 tonnes by 2025.[25] During the fixed price scheme the price signal is not expected to result in a clear and significant change in behaviour, however, other parts of the policy package are designed to specifically change behaviour (such as subsidies for changing heating systems in households). | ||
|
Key lessons learned | ||
|
The case of the nETS in Austria could yield important lessons for any potential similar system in Scotland. The Austrian scheme is specifically designed to be complementary to the existing EU ETS and covers emissions from non-EU ETS sectors. A similar scheme in Scotland could be designed to complement and exist alongside the UK ETS, which currently has the same coverage as the EU ETS. This would be crucial to ensure there is no double counting, and this was a key area highlighted by interviewees. The sectors covered by the Austrian nETS are small industry, transport, agriculture and buildings, which are not covered by the EU ETS. Many effects of the scheme are yet to be realised as the scheme is still under phased implementation. This phased implementation has been crucial to give businesses certainty about the future. However, from experience, the Austrian government suggest that a period of mandatory monitoring and reporting, without implementing a carbon charge, would be a useful place to start.[26] | ||
Case study 4
Lever type: Proposed tax on agricultural emissionsJurisdiction: New Zealand
|
Context | ||
|
Population and GDP |
[G] |
Like Scotland, New Zealand is a high-income country. New Zealand’s economy is larger than Scotland ($231.7 billion in 2020, compared to £148 billion and GDP per capita is slightly higher ($47,982 in NZ and $42,362 in Scotland in 2021 (Scottish Government, 2023a))[27]. New Zealand is of comparable size to Scotland in terms of population (NZ 5.1 million in 2022 (OECD, 2023b) compared to 5.4 million in Scotland (Scottish Government, 2023c)). |
|
Administrative and legal arrangement/ competencies |
[A] |
The proposed tax on agricultural emissions in New Zealand would apply at a national level. |
|
Shared challenges |
[G] |
The agricultural sector plays a key role in New Zealand’s economy, being a net exporter of farm commodities. In 2020, the crop and livestock exported was worth $25 billion (Ministry for Primary Industries, New Zealand Government, 2022). Similarly, approximately 80% of Scotland’s land mass is currently being under agricultural production (National Farmers Union Scotland, 2023). Like Scotland, New Zealand has a high potential for transitioning its energy sector towards renewable sources. This is due to the high potential of its wind, solar and hydro energy sectors (Anon, 2021). |
|
Climate ambition |
[A] |
New Zealand is committed to achieving Net Zero by 2050. Scotland has committed to more ambitious targets of achieving a 75% reduction in its CO₂ emissions by 2030 and Net Zero by 2045. |
|
Data and evidence |
[R] |
There is limited evidence available on the tax and its exact design is still uncertain as the original design was revoked and is yet to be applied. However, it is the first tax which explicitly focusses on agricultural emissions. Lessons may be learned in terms of design, political acceptance and implementation. |
|
Diversity of approaches |
[G] |
Despite the exact format of the tax remaining uncertain, it is a novel concept that could provide valuable insight for Scotland. |
|
Lever design | ||
|
A government announcement in December 2020 declared a climate emergency that “demands a sufficiently ambitious, urgent, and coordinated response across government to meet the scale and complexity of the challenge”. Following this, an emissions reduction plan for the Agricultural sector was announced in May 2022. The aim was to meet emissions reduction targets set in New Zealand’s Nationally Determined Contribution under the Paris Agreement, and the domestic emission reduction targets laid out in the Climate Change Response Act 2002 (CCRA). Targets were set at both national and at sectoral scale. Particular attention was paid to the agricultural sector given it accounts for half of New Zealand’s total greenhouse gas emissions (New Zealand Government, 2023). Almost 20 years ago, the New Zealand government announced a ‘fart tax’, which taxed GHG emissions deriving from livestock and agricultural sources. The announcement resulted in protest amongst the farming community. The Government then retracted the proposal, demonstrating the strong political influence the agricultural industry holds (Pannett, 2023). More recently, in 2022, the government founded a partnership with the Māori government and primary industry. The partnership was known as the He Waka Eke Noa – the Primary Sector Climate Action Partnership. It proposed a ‘farm-level levy’ that would require farms to calculate their emissions and pay for them. The emissions pricing was set to use a split-gas approach by applying unique levy rates to long-lived gases, i.e., carbon dioxide and nitrous oxide. Note this would be alongside an ETS also introduced in New Zealand. In response to the proposal for a farm-level levy, the Government launched a consultation to gain feedback from a series of stakeholders on options to price agricultural emissions (New Zealand Government, 2022b). The results of the consultation highlighted public concerns for the impact of the levy on the cost and availability of agricultural produce to consumers as farmers, growers and the wider agricultural sector adjust to internalising the new cost on emissions (Ministry for the Environment and Ministry for Primary Industries, 2022). A series of media outlets, including the Washington Post, have reported on tensions between the agricultural sector in New Zealand and the government. Farmers expressed concerns regarding both the profitability and competitiveness of their business, with some expecting to have to reduce their herd size (Pannett, 2023). The concerns of the agricultural sector have been attributed to the government altering their proposal. A new, temporarily less-stringent proposal was made that shifted the Government’s focus from farm-level taxation towards tightening monitoring and permitting requirements. Instead of outlining farm-level emission pricing, this shifted the focus – at least in the short term – toward a phased approach to mandatory monitoring and reporting requirements, to be implemented by 2025. The proposal delays the implementation of a farm-level levy therefore, until 2027. This new proposed legislation has been better received by the agricultural sector, although some have suggested the involvement of farming lobby groups in the development process (Corlett, 2022). The first stage of the revised proposal outlines a standardised approach to measuring and reporting of on-farm emissions which would eventually transition into the mandatory reporting of all farm-related emissions. The second area involved the recognition and reward of scientifically valid forms of on-farm sequestration (New Zealand Government, 2023). The policy would require that all producers in the agricultural sector collate emission reports by the end of 2022 and develop a farm plan to be implemented by 2025 (New Zealand Government, 2022a). These requirements seek to ensure farmers are aware of their own on-farm emissions and can provide the government with detail on their practices and technologies, providing it with further detail into how best to reduce emissions borne from agricultural sources and how emission levels vary between farms (New Zealand Government, 2023). It is proposed that the mandatory requirements for reporting and monitoring would apply to Inland Revenue registered farms. The proposal also outlines financial incentives for farmers to use technologies recommended by the Government that reduce sheep and cow burps. It also commits to reinvest the revenue generated from the tax into the sector (Craymer, 2022). | ||
|
Lever effectiveness | ||
|
The lever is yet to be implemented; therefore, assessments of effectiveness or behavioural impacts are not available. The tax is thought to offer potential to reduce New Zealand’s emissions due to the contribution of the agriculture sector to New Zealand’s total GHG emissions (Craymer, 2022). The agricultural sector accounts for nearly half of New Zealand’s total GHG emissions, the majority of which are emissions of methane. These emissions are not covered in New Zealand’s ETS (Craymer, 2022). | ||
|
Key lessons learned | ||
|
The New Zealand Government’s transition from a policy which placed direct pricing on emissions at farm-level towards one that implemented monitoring and reporting requirements demonstrates the importance of introducing change in a staggered, cooperative manner. Whilst the initial proposal from 2002 was widely contested, the involvement of farming groups in the development of the policy has enabled the Government to implement measures that are a step towards the pricing mechanism they have committed to in 2027 (Corlett, 2022). The New Zealand case has demonstrated the importance of stakeholder engagement in the successful implementation of contentious policies. One of our interviewees Professor Lorraine Whitmarsh who specialises in behavioural change and public policy acceptance, highlighted the importance of stakeholder engagement in policy development to gain public acceptance more generally. She noted the Scottish Government had made progress in implementing these methods in its policymaking process. | ||
Case study 5
Lever type: Indirect tax (Bonus Malus scheme)
Jurisdiction: France
|
Context | ||
|
Population and GDP |
[A] |
France is a high-income country. According to WorId Bank estimates, it is the world’s seventh largest economy by nominal GDP. If this is calculated per inhabitant, France is 19th. GDP per capita was 55,064 US dollars in 2022,[28] higher than Scotland (42,362 US dollars in 2021 (Scottish Government, 2023a))[29]. The 2022 population of France was 68 million, based on OECD data. This is much larger than Scotland (5.4 million (Scottish Government, 2023c)). |
|
Administrative and legal arrangement/ competencies |
[A] |
The scheme is administered at national level. |
|
Shared challenges |
[G] |
To achieve its 2050 carbon neutrality objective, France has committed to reducing the use of fossil fuels in energy production (almost two-thirds of the French heating and cooling systems are powered by fossil fuels) while increasing the use of renewable energy. In addition to accelerated phase-out of coal, the government will ban the sale of petrol and diesel vehicles from 2040 onwards. French diesel taxes are also increasing to further incentivise diesel drivers to switch to petrol, hybrid, or electric cars (Monschauer et al. 2018). Note, a carbon tax is also in place in France (not the focus of the current case study). The country’s carbon tax is among the highest in the world and was scheduled to increase steeply in the coming years. It covers the transport, industry and buildings sectors. |
|
Climate ambition |
[A] |
In 2019, France passed the Law on Energy and Climate to introduce the objective of carbon neutrality by 2050 as part of its commitment to the 2015 Paris Agreement. The National Low-Carbon Strategy was updated in 2020 to reflect this objective. |
|
Data and evidence |
[G] |
A significant amount of information is available for the case study. |
|
Diversity of approaches |
[A] |
An “indirect” taxation instrument, administered at national level. |
|
Lever design | ||
|
The Bonus Malus system is one of the main instruments of climate policy in the French transport sector. It was introduced on January 1, 2008, by the Finance Law as amended for 2007 and Decree No. 2007-1873. This system combines fees and rebates for the purchase of new vehicles: vehicles purchased or leased whose emissions exceed certain limits pay a fee, whilst vehicles that do not exceed these limits are entitled to a bonus or rebate. Revenues from emission-intensive vehicle fees are used to finance these bonus payments for low-emission vehicles to incentivise car purchasing decisions. Since its inception in 2008, the French government has adjusted the system several times. Since 2017, only electric and hybrid vehicles have been eligible for bonuses. Since 2018, the fee must be paid for vehicles with CO₂ emissions equal to or greater than 120 g/km. For that threshold, the fee started at €50, but the fee function increases considerably (EUR 1,050 for 140 g/km and EUR 4050 for 160 g/km). For vehicles with CO₂ emissions equal to or above 185 g/km, car buyers must pay EUR 10,500. In parallel, vehicles specially equipped to run on E85 super ethanol can benefit from a 40% reduction in carbon dioxide emission levels if their CO₂ emissions are less than 250 g/km. In addition to the existing tax (’malus’), a ’super malus’ targeting luxury cars was introduced in January 2018. Car buyers must pay EUR 500 per “fiscal horsepower” for powerful vehicles with more than 35 fiscal horsepower and the tax is capped at EUR 8,000[30]. On the ’bonus ’ side, since January 2018, the bonus of up to EUR 6,000 (27% of the acquisition cost) is only granted for electric vehicles emitting less than 20 gCO₂/km. Vehicles with emissions between 20 and 120 gCO₂/km are not affected by the Bonus Malus System, i.e. hybrid vehicles with emissions between 20 and 60 gCO₂/km are no longer eligible for a EUR 1,000 bonus payment. The bonus is granted directly to the buyer by means of an application form or is deducted from the price of the vehicle, when agreements are in place with dealers. At the same time, an additional bonus of EUR 1,000 (EUR 2,000 for non-taxable households) is granted when an old diesel or gasoline vehicle is scrapped and a used electric vehicle or a vehicle with a more efficient internal combustion engine is purchased (CEDEF, 2018). In the case of new electric and plug-in hybrid vehicles, the bonus is EUR 2,500. Two and three-wheeled vehicles, as well as electric quads, are eligible for a 20% or 27% subsidy of their acquisition cost (EUR 100 or EUR 900 maximum), depending on their power. In addition, non-taxable households can receive a subsidy of 20% of the cost when purchasing electrically assisted bicycles. | ||
|
Lever effectiveness | ||
|
In terms of GHG emissions effectiveness, the scheme has successfully contributed to reducing average passenger car emissions since its implementation. The scheme has been very effective in shifting vehicle sales towards more environmentally friendly vehicles, thereby removing old vehicles from French roads (according to plans, the scrappage bonus is likely to remove around 100,000 old vehicles) and lowering average emissions. Though progress has slowed in recent years, average emissions have reduced significantly from 149 gCO₂/km in 2010 to 111 gCO₂/km in 2017. The current European target for emissions levels of new cars sold is set at 95 gCO₂/km by 2024. For 2025 onwards, the EU feet-wide CO₂ emission targets are defined as a percentage reduction from a 2021 starting point.
By promoting electric vehicles, the Bonus Malus scheme also contributes to improve local air quality in urban areas. Although it seems clear that the scheme has proven to be effective in reducing GHG emissions in France and local air conditions, the impact of this measure on GHG emissions is difficult to isolate. The scheme may have a rebound effect, as the lower fuel expenditure for consumers due to more efficient vehicles may lead to an increase in vehicle use and thus in petrol/diesel consumed (and thus on emissions). Based on projections of average annual vehicle kilometres and the number of new registrations, the French Ministry of Ecology estimates that measures to improve the performance of new passenger vehicles, including for example a CO₂ label for passenger cars, could lead to GHG emission savings of 5.4 million tonnes CO₂e (MtCO₂e) in 2020, 8.0 MtCO₂e in 2025 and 9.8 MtCO₂e in 2030. Compared to emissions from private cars, which in 2015 were around 66 MtCO₂e, the impact of the scheme could be substantial considering that the Bonus Malus system is likely to be the dominant driver of reductions. However, these figures also imply that additional measures would be necessary to significantly reduce emissions from the transport sector in the future. In terms of revenues generated, since 2014 the Bonus Malus scheme has generated surplus revenue for the French general budget. For 2018, the malus was set at a level that cover the costs of the bonus payments (EUR 261 million) and the additional bonus for scrapped vehicles (EUR 127 million). Note all data in this section taken from Monschauer, Y & Kotin-Förster, S 2018. | ||
|
Key lessons learned | ||
|
An important lesson was that incentives for new registrations were initially underestimated, leading to an overall increase in car sales and high costs for the bonuses paid at the beginning of the scheme. For example, during the first three years of implementation, the French state lost EUR 300 million (on average) per year because car manufacturers took advantage of the large steps between bonus payment categories in previous years. The instrument has been continuously adapted to meet efficiency and effectiveness criteria. It is also difficult to forecast the evolution of supply and demand. However, the establishment of a modelling function as a basis for malus rates has made it easier to predict the market reaction as a function of vehicle purchase cost elasticity. Consumers do not always understand how the system works and how it relates to air quality measures for passenger cars. Combining the Bonus Malus system with air quality criteria also remains a challenge, as the system is designed to be technologically neutral and it does not explicitly differentiate between petrol and diesel vehicles. Although diesel cars benefit slightly more from the system due to their lower average GHG emissions, they cause more particulate emissions than petrol cars. One success factor is the support of the French car industry, which has welcomed the bonus payments and acknowledges that they are financed by the malus charges. | ||
Case study 6
Lever type: Indirect tax (Environmental impacts of farming)Jurisdiction: Wallonia, Belgium
|
Context | ||||||||||||||||||||||||||||||||||||||||||||||||||||||||||||||||||
|
Population and GDP |
[A] |
Wallonia is a high-income region. According to the National Bank of Belgium, in 2021, the region’s GDP per capita was EUR 31,568, somewhat lower than Scotland (42,362 US dollars (Scottish Government, 2023a).[31] The 2022 population of Wallonia was 3.6 million, based on Iweps (Institute Walloon of L’évaluation, De La Prospective Et De La Statistique) data. This is slightly lower than in Scotland (5.4 million in 2022 (Scottish Government, 2023c)). | ||||||||||||||||||||||||||||||||||||||||||||||||||||||||||||||||
|
Administrative and legal arrangement/ competencies |
[G] |
Administered at sub-national level | ||||||||||||||||||||||||||||||||||||||||||||||||||||||||||||||||
|
Shared challenges |
[G] |
Wallonia is committed to transitioning towards a low carbon and environmentally friendly economy. It is also committed to increasing the use of renewable energy. For example, the region has decided to use Sustainable Capital Markets as a means of financing green projects and has created a Sustainability Bond Framework. One aim of the Bond is to help the region achieve its objectives in energy efficiency and low carbon buildings, sustainable mobility, resources/land use, and affordable housing. For the period 2019-2024, Wallonia has established an investment plan (in French PWI – Plan Wallon d’Investissement), which involves an investment budget of more than €5 billion to channel investments in social and environmental assets in several pillar sectors. The region has also established low emission zones to limit the most polluting vehicles and improve air quality. However, Wallonia must respond to several energy-related challenges, such as the planned closure of nuclear power plants and an ageing and energy inefficient residential building stock (Coppens et al., 2022). About 80% of Scotland`s total land area is under agricultural production, it is useful to focus a case study on this sector. | ||||||||||||||||||||||||||||||||||||||||||||||||||||||||||||||||
|
Climate ambition |
[A] |
The Walloon Region has made an ambitious commitment to reduce its GHG emissions by up to 55% by 2030 and by 80% to 95% by 2050 (compared to 1990). Moreover, on 4 February 2021, Wallonia adopted its first strategy for the Circular Economy, which shows ambitions for 2025, such as: (i) 50% of relevant public procurement contracts will integrate circular economy principles or circular criteria; (ii) 75% of public information and communications technology (ICT) contracts will be circular and ethical; (iii) All public demolition/deconstruction contracts and subsidised contracts will include a materials inventory and selective deconstruction; and (iv) Reuse materials will be used in all public works contracts and progressively in works subsidised by the Walloon Region (European Commission, 2022). | ||||||||||||||||||||||||||||||||||||||||||||||||||||||||||||||||
|
Data and evidence |
[R] |
There is limited data beyond the number of people affected and the annual revenue. However, there is detailed information on the coefficients applied by type of animal and crop. | ||||||||||||||||||||||||||||||||||||||||||||||||||||||||||||||||
|
Diversity of approaches |
[G] |
Indirect tax, administered at sub-national level | ||||||||||||||||||||||||||||||||||||||||||||||||||||||||||||||||
|
Lever design | ||||||||||||||||||||||||||||||||||||||||||||||||||||||||||||||||||
|
In Wallonia, agriculture represents about 40% of the total surface water abstractions. The main pressures on water resources are non-point source pollutions by nutrients and pesticides. Key pollutants from the agricultural sector are nutrients and pesticides as well as sediments from erosion. With the decrees of 12 December 2014 and 23 June 2016, the regional Parliament adopted measures aimed at financing water policy by optimising mechanisms for recovering the costs of services linked to water use, including costs for the environment and water resources, in application of Directive 2000/60/EC of the European Parliament and of the Council of 23 October 2000 establishing a framework for Community action in the field of water policy. Thus, the tax on environmental impacts from farming, in force since 2015, is intended to address the environmental costs associated with the impact of agricultural activities on water resources, in particular livestock manure and the use of fertilizers and phytosanitary on crops. In particular, the tax is based on the environmental charge, a tax base that considers not only the retained livestock, the “livestock” environmental charge, but also cultivation activities, the “land” environmental charge. Through the spreading of nitrogenous fertilisers and the use of plant protection products, these activities have a significant impact on water resources. The tax on environmental charges generated by farms in the Walloon Region is one of the key incentives in Wallonia’s environmental policy. The aim of the tax is to meet the requirements of the Water Framework Directive 2000/60 of 23 October 2000, the ultimate objective of which is to achieve good ecological and chemical status of all Community waters. As such, it is not directly related with GHG although it is useful as it encourages farmers to use water more efficiently.
Principles: This system is based on the environmental load generated by the farm and it takes into account: (i) retained livestock or environmental loads generated by run-off from livestock manure storage infrastructures on the farm reaching groundwater or surface water, as well as pollution due to effluent storage infrastructures that do not allow storage for at least 6 months; and (ii) cultivation activities that generate, through the application of nitrogen fertilisers and the use of plant protection products, damage to aquatic resources. Farmers concerned: Farmers who meet at least one of the following three conditions are subject to the tax: (1) Keep live more than three head of livestock stock with an environmental load of more than three units (this unit is not defined in the literature identified, but is assumed to relate to/the same as head of cattle); (2) Have an area of crops, other than grassland, of at least half hectare; and (3) Hold an area of grassland of at least 30 hectares. Calculation of environmental load (taxation formula): N = 2 + N1 + N2 where N is the number of environmental load units, N1 is the “livestock” environmental charge. The load is determined by summing the products resulting from multiplying the number of animals in each category by its nitrogen coefficient (shown in the table below). This coefficient reflects the value of annual nitrogen production per type of animal. N2 is the “land” environmental load. The charge is determined by summing the products resulting from multiplying the areas under crops and grassland by the following coefficients: – 1) crop coefficient: 0.3 – 2) organic farming coefficient: 0.15 – 3) “Grassland” coefficient: 0.06 – 4) “Organic grassland” coefficient: 0.03 These coefficients reflect the average nitrogen residue in the soil, the average use of pesticides and the erosive potential of crops and meadows. The Government may assimilate certain agricultural practices that preserve the quality and condition of groundwater and surface water to organic crops within the meaning of the coefficients. N2 = area per category x coefficient for the corresponding category.
Tax exemptions or reductions: The tax includes two exemptions: (1) “Livestock” environmental charge (N1): is zero when the farm holds a certificate of compliance for livestock effluent storage facilities or when this certificate is in the process of being used; and (2) “Land” environmental charge (N2): the first thirty hectares of a farm are exempt from the tax. This exemption is calculated by multiplying the farm’s average “land” environmental load unit by 30. The average “land” environmental charge unit for the farm is obtained by dividing the “land” environmental charge (N2) by the total surface area of the farm. Applicable rate: The basic rate of the tax per environmental load unit linked to the farm is set at €10 from 1 January 2015. This basic rate will be indexed based on the consumer price index in force six weeks before the indexation date. Taxation data: The data integrated into SIGEC (detailed agricultural data filled by each farmer for the purpose of compliance with EU Common Agricultural Policy) as part of the Wallonia Agriculture Code are used to establish the tax on environmental charges. Source for information in this section: Portail de wallonne, 2023; Interview. | ||||||||||||||||||||||||||||||||||||||||||||||||||||||||||||||||||
|
Lever effectiveness | ||||||||||||||||||||||||||||||||||||||||||||||||||||||||||||||||||
|
The tax concerns some 13,500 taxpayers and generates annual revenue of around €1.2 million. The view from an interviewee indicates the tax may not be as effective as it could be, as the rate of taxation is low and the polluting nature of certain types of crops is not considered in the tax calculation formula. Only the state of cultivation or grassland and whether it is organic are currently considered in the formula for determining the amount of tax. | ||||||||||||||||||||||||||||||||||||||||||||||||||||||||||||||||||
|
Key lessons learned | ||||||||||||||||||||||||||||||||||||||||||||||||||||||||||||||||||
|
This instrument is simple to apply and generate revenues. It sends a signal to the market that an increasingly scarce resource such as water needs to be better managed, otherwise a tax will have to be paid. This tax is applied in what is a key sector for Scotland and covers a large part of its territory, so it could feasibly have a significant effect. Moreover, it could potentially be applied without major legal/administrative complications. | ||||||||||||||||||||||||||||||||||||||||||||||||||||||||||||||||||
© The University of Edinburgh, 2024
Prepared by Logika Group and Metroeconomica on behalf of ClimateXChange, The University of Edinburgh. All rights reserved.
While every effort is made to ensure the information in this report is accurate, no legal responsibility is accepted for any errors, omissions or misleading statements. The views expressed represent those of the author(s), and do not necessarily represent those of the host institutions or funders.
Official data indicate that between 2013 and 2020, the increase was less than 1%, but 2020 emissions were affected by the restrictions associated with the COVID-19 pandemic. A more accurate comparison of underlying trends may be between 2013 and 2018, where global GHG emission increased by just under 5%. ↑
Note the evidence in this paper was drawn from peer reviewed academic research and grey literature published since 2000. The review focussed on emission reduction evidence, it did not consider the balance of costs and benefits, technological innovation or issues associated with equity, for example. It excluded national evaluation reports, reflecting the diversity in methodological approaches and a potential lack of independence in these sources. The latter critique is questionable, as third parties often conduct them. Our secondary review has also not identified such evaluations, which is an acknowledged limitation of the review. ↑
Defined as levies applied downstream to the emission of carbon dioxide and other GHGs or upstream to the sale of carbon intensive fuels. ↑
Note the two figures are not directly comparable, the 2016 review is based on a selection rather than an overall estimate of total revenues. Moreover, the two studies appear to use different definitions of “carbon taxes” and for example do not appear to treat e.g., fuel/excise taxes in the same way. ↑
£30,793 in 2021, converted to US dollars for consistency in jurisdictions, using the average exchange rate for 2021 of 1.3757. Source: https://www.exchangerates.org.uk/GBP-USD-spot-exchange-rates-history-2021.html ↑
i.e., it is managed, and revenues are collected by Revenue Scotland. In this context, partially devolved, is where instruments are managed and revenues collected by HMRC on behalf of the Scottish Government. ↑
Defined by the European Environment Agency as wastes that do not undergo any significant physical, chemical, or biological transformations when deposited in a landfill. ↑
The maximum mass at which the aircraft is certified for take-off due to structural or other limits ↑
The special rate applies to business jets with a take-off distance weight (MTOW) of more than 20 tons and a maximum seating capacity of less than 19 passengers. The Scottish standard rate applies if the aircraft does not qualify for the special rate and the seat pitch does not exceed 1,016 meters. Otherwise, passengers will be charged the premium rate. ↑
Prior to the introduction of the Climate Change Levy, a Fossil Fuel Levy introduced in 1990 existed. The tax was paid by suppliers of electricity from non-renewable energy sources and ended following the introduction of the Climate Change Levy. ↑
The United Kingdom Emissions Trading Scheme replaced the European Union Emissions Trading Scheme in 2021 following the UK’s exit from the EU. ↑
Up to 31 March 2023, there were 2 destination rate bands ↑
Based on the 2020 annual average exchange rate of CAD 1.7202 to 1 GBP. https://www.exchangerates.org.uk/GBP-CAD-spot-exchange-rates-history-2020.html ↑
£30,793 in 2021, converted to US dollars for consistency in jurisdictions, using the average exchange rate for 2021 of 1.3757. Source: https://www.exchangerates.org.uk/GBP-USD-spot-exchange-rates-history-2021.html ↑
Air and climate – Air and GHG emissions – OECD Data ↑
Information obtained during the case study expert interview phase of the stakeholder consultation ↑
Information obtained during the case study expert interview phase of the stakeholder consultation ↑
Information obtained during the case study expert interview phase of the stakeholder consultation ↑
https://www.seedyourfuture.org/greenhousegrower#:~:text=A%20greenhouse%20grower%20specializes%20in%20growing%20plants%20in%20a%20greenhouse%20environment ↑
£30,793 in 2021, converted to US dollars for consistency in jurisdictions, using the average exchange rate for 2021 of 1.3757. Source: https://www.exchangerates.org.uk/GBP-USD-spot-exchange-rates-history-2021.html ↑
£30,793 in 2021, converted to US dollars for consistency in jurisdictions, using the average exchange rate for 2021 of 1.3757. Source: https://www.exchangerates.org.uk/GBP-USD-spot-exchange-rates-history-2021.html ↑
Information obtained during the case study expert interview phase of the stakeholder consultation ↑
Information obtained during the case study expert interview phase of the stakeholder consultation ↑
Information obtained during the case study expert interview phase of the stakeholder consultation ↑
Information obtained during the case study expert interview phase of the stakeholder consultation ↑
Information obtained during the case study expert interview phase of the stakeholder consultation ↑
£30,793 in 2021, converted to US dollars for consistency in jurisdictions, using the average exchange rate for 2021 of 1.3757. Source: https://www.exchangerates.org.uk/GBP-USD-spot-exchange-rates-history-2021.html ↑
Provisional data ↑
£30,793 in 2021, converted to US dollars for consistency in jurisdictions, using the average exchange rate for 2021 of 1.3757. Source: https://www.exchangerates.org.uk/GBP-USD-spot-exchange-rates-history-2021.html ↑
Fiscal horsepower is a unit indicating the tax burden on a vehicle. In the past it was related to engine power, hence this measure is also referred to as “fiscal power”. In Spain, for example, it is usually obtained from the engine capacity. In France, the calculation is different: since July 1998 (Article 62 of Law n°98-546 of 2 July 1998), the fiscal power depends on the standardised CO₂ emission value in g/km and the maximum engine power in kW. ↑
£30,793 in 2021, converted to US dollars for consistency in jurisdictions, using the average exchange rate for 2021 of 1.3757. Source: https://www.exchangerates.org.uk/GBP-USD-spot-exchange-rates-history-2021.html ↑
Why it is important
Scotland’s buildings account for approximately a fifth of the nation’s emissions. Decarbonising homes and buildings will play a significant part in achieving net zero greenhouse gas emissions.
The Heat in Building Strategy, published in 2021, commits to regulating energy efficiency and reducing emissions from heating in existing homes from 2025. The New Build Heat Standard prohibits polluting oil and gas boilers in new buildings from April 2024.
Given this urgency, the Scottish Government asked ClimateXChange (CXC) to gather evidence on how other countries are approaching the challenge of decarbonising heating and improving energy efficiency in homes. The goal was to draw lessons for policy and implementation in Scotland.
How ClimateXChange supported policymakers
A study investigated regulations on home energy efficiency and heat decarbonisation from other countries, regions and cities. It aimed to understand what worked or failed and why.
Given the devolved legal powers of the Scottish Government, it was important to primarily focus on the effectiveness of policies that could be replicated in Scotland. This focus helped inform how regulations might best work in Scotland. We also asked for the research to be structured around the Heat in Buildings Strategy.
The findings opened the way to further research that provided policymakers with a comprehensive body of evidence. Follow-up CXC studies investigated personal circumstances that may make it more challenging for people to meet the requirements proposed; explored the practicality and cost of clean heating in challenging home types; and identified how compliance can be monitored. Researchers reviewed international regulations and case studies, and conducted surveys and expert interviews.
Impact
The lessons drawn from the international review have been so useful to the Scottish Government that they plan to connect with some of the countries identified in the research. One of those countries is Italy, where the mandatory share of renewable energy for domestic hot water and electricity has increased.
“For us at the Scottish Government, this was the first time we’ve had a comprehensive comparison with other countries on home energy efficiency and heat decarbonisation regulation. That is a key interest for ministers and often a focal point in policy briefings. The findings from the study provided us with a robust framework for identifying relevant international schemes.”
– Antonia Georgieva, Head of Heat in Buildings: Domestic regulations and clean heat in new buildings, Scottish Government
Furthermore, the Clean Heat Forum, an international collaboration between national governments, NGOs and companies to discuss confidence in emerging policies, is considering creating a live tracker or dashboard version of the project.
The tracker will show updated information on international regulations and policies relevant to heat and energy efficiency and their effectiveness. The Scottish Government is keen to support this given the value of understanding how clean heat interventions have helped other countries decarbonise. This value was demonstrated by the CxC project.
Fostering collaboration
Speaking about her experience of working with ClimateXChange on several projects, Antonia Georgieva said: “Our projects with ClimateXChange have been very well managed. Their process sets clear expectations and fosters an environment conducive to collaboration, serving as a link between us and the researchers.”
Related reports
International heat and energy efficiency policy review
Providing flexibility in heat and energy efficiency regulations – personal circumstances
The suitability of clean heating options for challenging dwelling types
An evidence review of data associated with non-domestic buildings
Costs of zero emissions heating in new buildings
Direct greenhouse gas emissions from low and zero carbon heating systems
Zero emissions heating in new buildings across Scottish Islands
Heat in buildings data for digital compliance
Related links
Why it is important
Hydrogen is expected to play a crucial role in Scotland’s energy future. It could be used to store and carry energy, with the potential to reduce emissions in sectors and industries traditionally reliant on fossil fuels such as long-haul transport, chemicals and steel. Hydrogen could address grid capacity issues by storing excess renewable energy, potentially saving up to £2.5bn by 2030 in extra payments to operators of wind farms.
In 2022, the Scottish Government’s Hydrogen Action Plan set forth Scotland’s ambition to become a leading producer and exporter of hydrogen.
It predicts that hydrogen will account for 15% of Scotland’s energy demand by 2030. By 2045, the installed hydrogen production capacity could be five times more than in 2030.
ClimateXChange work
To advance these ambitions, ClimateXChange commissioned several studies to identify the skills and workforce needed to support the hydrogen sector, evaluate Scotland’s export potential and explore options for energy storage.
ClimateXChange helped refine research questions from the Scottish Government. Studies focused particularly on green hydrogen, produced by electrolysis using electricity from renewable sources.
The studies:
- modelled the scale of economic activity in the hydrogen sector and, in consultation with key industry stakeholders and skills providers, defined skills needs in the emerging hydrogen economy
- explored the costs of producing green hydrogen in Scotland and a follow-up study compared these with costs of producing and exporting hydrogen to EU markets in other major exporting countries
- investigated whether hydrogen could be used to store excess renewable electricity through a literature review and stakeholder engagement
- assessed the value of electrolysis to manage network constraints through developing future scenarios.
Impact
ClimateXChange has built evidence across many and complex questions on the development of Scotland’s hydrogen economy. We ensured that policymakers were provided with the best, clear and timely answers, with our reports significantly influencing policy and strategic directions.
“The ClimateXChange report on hydrogen as a storage medium was an important first step for us in developing our policy positions on energy storage and hydrogen”
– Stuart McKay, Head of Hydrogen Policy at the Scottish Government
This study on hydrogen as a storage medium demonstrated hydrogen’s utility to store energy, which prompted a deeper investigation into the viability of hydrogen storage in different geological formations across Scotland. This could be crucial for the energy grid’s long-term storage solutions.
Findings from the study drove conversations with significant stakeholders such as the National Energy System Operator, and previously the National Grid Electricity System Operator, which is looking at a strategic network across the UK.
The study frequently informs briefings to ministers and contributes to responses in parliamentary questions about energy storage and hydrogen use.
Overall, our research highlights hydrogen’s potential value to Scotland’s economy. It informed strategic documents in Scotland and wider UK, including the hydrogen action plan, green industrial strategy and the upcoming hydrogen sector export plan.
Related reports
Mapping the hydrogen skills landscape
Hydrogen as a storage medium in Scotland
Redirecting excess renewable energy to produce hydrogen
Cost reduction pathways of green hydrogen production in Scotland
External publications
UK Parliament report: Hydrogen and carbon capture in Scotland
Policy Exchange report: Turning wasted wind into clean hydrogen
Only around 11% of occupied homes in Scotland have renewable or low-emission heating systems, with the majority still relying on high-emission sources like gas and oil. To meet Scotland’s net zero greenhouse gas emissions target by 2045, over 2 million homes will need to transition to clean heating systems.
Heat pumps and electric resistive heating are the main clean heating options available today and they are likely to work well in most homes. This project investigates the feasibility of clean heating, especially heat pumps, in challenging home types in Scotland, in terms of practicality and cost effectiveness.
We reviewed academic research, industry literature and case studies, and conducted a combination of surveys and semi-structured interviews with industry experts. We identified the advantages, disadvantages, contradictory evidence and research gaps surrounding the application of clean heating technology in Scotland.
We reviewed studies and identified the following challenging dwelling types:
- Older properties from before 1919
- Rural properties
- Small properties
- Flats and tenements.
Findings
Overall, while there are challenges to implementing heat pumps across different property types, innovative solutions and careful planning can facilitate their adoption and contribute to decarbonising heating systems in Scotland. We found:
- Older properties: Buildings from before 1919, often with solid walls and potentially holding protected status, may pose challenges for both insulation upgrades and heat pump installations due to planning constraints and preservation concerns. Whilst it is common to prioritise improving energy efficiency prior to the installation of heat pumps, recent studies have concluded that heat pumps can operate effectively when installed into homes that have not undergone energy efficiency upgrades. It is also important to note that while increasing energy efficiency stands as a crucial objective, the structural integrity and overall condition of the building need consideration. It is important to ensure a building is in good condition before installing new heating systems, in particular, repairing structural issues, water ingress and damage. Consequently, any new heating technologies will be more effective and contribute to the building’s overall energy performance.
- Rural properties: Rural areas can present unique challenges due to grid capacity limitations and vulnerability to power cuts. However, heat pump adoption rates are already highest in off-grid regions due to cost savings compared to existing off gas network fuel sources. Evidence shows that heat pumps can operate well in cold climates, with studies evidencing effective performance compared to gas boilers, even at extremely low temperatures. No significant barriers to heat pump adoption have been identified. Heat pumps with additional corrosion protection are available for coastal areas. However, a lack of local contractors, increased servicing costs and higher costs for energy efficiency improvements pose challenges in remote areas, particularly the Scottish islands.
- Small properties: Space constraints, such as limited room for hot water storage and radiator upgrades, present challenges for heat pump installations. No evidence of a quantitative threshold to define ‘small’ was identified. Innovative solutions like compact heat batteries or external hot water storage may offer alternatives.
- Flats and tenements: In addition to the challenges presented above, flats and tenements face difficulties due to constraints on external locations for air source fans, as well as coordinating changes with neighbours and building owners, due to differing tenancy arrangements. Case studies highlight the importance of careful planning and resident input in determining suitable locations. These are similar to the challenges to basic repairs and maintenance of blocks of flats and tenements and to fabric improvements, such as insulation. Fifth generation heat networks, with individual indoor heat pumps supplied by communal ground sources may provide a potential solution.
If you require the report in an alternative format, such as a Word document, please contact info@climatexchange.org.uk or 0131 651 4783.
Research completed in February 2024
DOI: http://dx.doi.org/10.7488/era/4864
Executive summary
Only around 11% of occupied homes in Scotland have renewable or low-emission heating systems, with the majority still relying on high-emission sources like gas and oil. To meet Scotland’s net zero greenhouse gas emissions target by 2045, over 2 million homes will need to transition to clean heating systems.
Heat pumps and electric resistive heating are the main clean heating options available today and they are likely to work well in most homes. This project investigates the feasibility of clean heating, especially heat pumps, in challenging home types in Scotland, in terms of practicality and cost effectiveness.
We reviewed academic research, industry literature and case studies, and conducted a combination of surveys and semi-structured interviews with industry experts. We identified the advantages, disadvantages, contradictory evidence and research gaps surrounding the application of clean heating technology in Scotland.
We reviewed previous studies and identified the following challenging dwelling types: older properties from before 1919, rural properties, small properties, and flats and tenements.
Findings
Overall, while there are challenges to implementing heat pumps across different property types, innovative solutions and careful planning can facilitate their adoption and contribute to decarbonising heating systems in Scotland. We found:
- Older properties: Buildings constructed before 1919, often characterised by solid walls and potentially holding protected status, may pose challenges for both insulation upgrades and heat pump installations due to planning constraints and preservation concerns. Whilst it is common to prioritise improving energy efficiency prior to the installation of heat pumps, recent studies have concluded that heat pumps can operate effectively when installed into dwellings that have not undergone energy efficiency upgrades. It is also important to note that while increasing energy efficiency stands as a crucial objective, the structural integrity and overall condition of the building need consideration. It is important to ensure a building is in good condition before installing new heating systems, in particular, repairing structural issues, water ingress and damage. Consequently, any new heating technologies will be more effective and contribute to the building’s overall energy performance.
- Rural properties: Rural areas can present unique challenges due to grid capacity limitations and vulnerability to power cuts. However, heat pump adoption rates are already highest in off-grid regions due to cost savings compared to existing off gas network fuel sources. Evidence shows that heat pumps can operate well in cold climates, with studies evidencing effective performance compared to gas boilers, even at extremely low temperatures. No significant barriers to heat pump adoption have been identified. Heat pumps with additional corrosion protection are available for coastal areas. However, a lack of local contractors, increased servicing costs and higher costs for energy efficiency improvements pose challenges in remote areas, particularly the Scottish islands.
- Small properties: Space constraints, such as limited room for hot water storage and radiator upgrades, present challenges for heat pump installations. No evidence of a quantitative threshold to define ‘small’ was identified. Innovative solutions like compact heat batteries or external hot water storage may offer alternatives.
- Flats and tenements: In addition to the challenges presented above, flats and tenements face difficulties due to constraints on external locations for air source fans, as well as coordinating changes with neighbours and building owners, due to differing tenancy arrangements. Case studies highlight the importance of careful planning and resident input in determining suitable locations. These are similar to the challenges to basic repairs and maintenance of blocks of flats and tenements and to fabric improvements, such as insulation. Fifth generation heat networks, with individual indoor heat pumps supplied by communal ground sources may provide a potential solution.
Recommendations
- Establish evidence for the suitability of air-to-air heating and, if found to be appropriate, provide policy support for certification and installation in homes where it is more cost effective than water-based space heating.
- Policymakers should monitor developments in thermoelectric heat pumps, which may provide radical space savings.
- Explore whether there is a role for hybrid heat pumps in certain circumstances, for hot water only.
Glossary
|
Air to air. A type of heat pump that sources heat from external air and distributes it internally by recirculating air through heat exchangers | |
|
Air-to-water (A2W) |
Air to water. A type of heat pump that sources heat from external air and distributes it internally using water in pipes and radiators or underfloor heating |
|
ASHP |
Air source heat pump |
|
Clean heating |
Defined by the Scottish Government as a system capable of providing heat without producing any greenhouse gas emissions at point of use (Scottish Government, 2023a) |
|
EPC |
Energy Performance Certificate |
|
Flats and tenements |
Any building that contains multiple dwellings. This includes, four-in-a-blocks, low rise blocks, high rise blocks and tenements. |
|
GSHP |
Ground source heat pump |
|
PV |
Solar photovoltaic panels |
|
Working fluid |
The fluid that is compressed and expanded in heat pumps to transfer heat. Also called the refrigerant. |
|
ZDEH |
Zero direct emissions heating (Also called ‘clean heating’ for short, throughout this document) |
Introduction
Of the 2.5 million occupied homes in Scotland, only around 11% currently have renewable or very low emission heating systems with the majority still reliant on high-emission energy sources like gas and oil (Scottish Government, 2021b). To meet net zero greenhouse gas emissions targets, over 2 million homes will have to transition to clean heating by 2045 (Scottish Government, 2021a). Clean heating systems have been defined within the consultation on a Heat in Buildings Bill by the Scottish government as:
“Systems – such as heat pumps and heat networks – that don’t produce any greenhouse gas emissions at the point of use” (Scottish Government, 2023b). Bioenergy is not included in this definition due to emissions at the point of use so were not included in this work.
As described, several technologies already exist, each at different stages of adoption. Electric heating was commonplace in homes throughout the 1960s and beyond, resulting in significant improvements over time to make them more efficient and streamline their design. Alternative technologies, such as heat pumps, which also first became commercially available in the 1960’s, are less mainstream in Scotland, but are expected to play a significant role in the decarbonisation of heat in Scotland. The Climate Change Committee has described them as a ‘low regrets’ option (CCC, 2020) and they feature prominently in Scotland’s Heat in Buildings Strategy (Scottish Government, 2021a).
While electricity provided from the grid is currently a mix of renewable and non-renewable energy, it is expected that as renewable power generation such as wind and solar power increases, the emissions associated with electricity will continue to reduce, rendering it an extremely low carbon energy option. To capitalise on this, it will be required that heat in homes provided by gas, oil, and other high emitting energy sources be phased out and replaced by electricity.
The Scottish Government’s Hydrogen Action Plan States “We do not consider that hydrogen will play a central role in the overall decarbonisation of domestic heat and therefore cannot afford to delay action to decarbonise homes this decade through other available technologies. The potential for hydrogen to play a role in heating buildings depends upon strategic decisions by the UK Government that will be made over the coming years and the Scottish Government will continue to urge the UK Government to accelerate decision-making on the role of hydrogen in the gas grid”.
Consequently, this report predominantly focusses on heating systems which utilise electricity as an energy source, specifically heat pumps and their applications. However, it should be recognised that heat networks and each of the clean heating technologies described may play a crucial role in addressing challenging dwelling types.
In this report, we investigate the feasibility, in terms of practical application and cost-effectiveness, of applying clean heating technologies in challenging dwelling types.
Additionally, we explore alternative clean heating options, considering their potential application to the archetypes and examine scenarios where hybrid fossil fuel heating systems may offer a transitional solution, particularly in contexts where the full adoption of renewable technologies poses challenges.
This research focussed on the following building types that we have considered upon review of previous studies as reflecting broadly those that are considered as difficult to decarbonise with clean heating:
- Older properties, especially those built before 1919
- Rural properties
- Small properties
- Flats and tenements of different forms
This project does not consider clean heating challenges that are relevant to all building types, such as skills shortages and capital costs. However, we acknowledge additional challenges such as temporary disruption to households who may need to decant. Particularly when households are without hot water while install work is on-going. This is more acute in winter when losing heating and hot water for a period of time is most impactful to households. This may be perceived as a barrier to adoption, however no evidence was found to corroborate this within this research. Presented below are the results of the evidence review. The research identifies gaps in the available evidence which may inform future research priorities. We also identify where there are best case examples relevant to Scotland.
The evidence reviewed was a combination of grey literature, published research, academic papers, case studies and industry expert feedback through interviews and a survey. For in-situ evidence of how heat pumps are likely to perform in Scotland, we reviewed both large-scale heat pump field trials and small-scale monitoring studies. Whilst, the scope of the research was for both domestic and non-domestic buildings, the majority of identified evidence relates to domestic settings.
Method
A Rapid Evidence Assessment (REA) is a systematic and streamlined approach to reviewing existing literature and evidence on a specific topic within a limited timeframe. This method is often employed when there is a need for quick insights and when a traditional comprehensive systematic review may take too long. The full method for the REA can be found in Appendix 10.1.
Using the keyword searches in relevant databases, 147 sources were identified. The results were screened according to the protocol. Each of the screened sources which were analysed further can be found in the references section of this work. The purpose of the deeper dive was to investigate what evidence was available that heat pumps are a practical, technically feasible and cost-effective clean heating option for hard-to-treat archetypes in Scotland. To enhance the literature review, surveys and interviews were carried out with industry professionals. These interactions aimed to determine whether the research gaps identified in existing literature were mirrored in industry and to explore any opportunities or strategies that the industry has developed to address the identified challenges. The survey and interview questions can be found in Appendices 10.2 and 10.3, respectively.
We received 16 survey responses from:
- Six retrofit advisory/consultancies
- Four registered social landlords
- Five architects/Designers
- One utility company
We conducted 10 structured interviews with:
Clean heating technologies
This section outlines the main technologies for heating free of emissions at the point of use. Various clean heating technologies are available, adaptable to specific building and occupant needs. Each technology presents unique opportunities and applications, catering to diverse requirements.
Direct electric
Direct electric, or electric resistive heating generates heat by passing electricity through a resistive element, in the same way a kettle works. Examples of direct electric heating are storage heaters, panel heaters, electric boilers, infrared heating, and electric underfloor heating. Direct electric heating is 100% efficient, delivering one unit of energy as heat for every unit of electricity consumed.
Direct electric heating has a low capital cost.
A significant barrier in the uptake of electric heating is the unit cost, which remains expensive when compared with gas (Nesta, 2023a, 2023b). To overcome this, there is the opportunity for UK Government to review the distribution of taxes by reducing the tax on electricity and increasing the tax on high emitting energy sources (Ahmad, 2023; Rosenow, 2022; Sevindik, 2023). This may encourage the uptake of heat pumps and also aid in the renewable energy transition.
Heat pumps
Heat pumps operate by transferring heat from one medium to another. Heat pumps are used in fridges, freezers and air conditioning, as well as in heating systems. Air-source heat pumps use the outside air, while ground-source heat pumps will use water preheated by the ground as the source medium. As the source medium passes through a heat exchanger inside the unit, it causes a refrigerant enclosed in a loop to evaporate into a gas. This gas is compressed, raising its temperature. It then passes through a second heat exchanger, transferring its heat to the inside air, or to water that circulates to radiators, underfloor heating, and to heat up water tanks and so on. The refrigerant, now in a liquid state, then passes through an expansion valve, reducing its pressure and temperature, completing the cycle.
Domestic heat pumps may source heat renewably from the air, ground or water sources such as rivers, lochs, and the sea. They may also use waste heat from industrial sources such as data centres and factories.
The most common form of domestic heat pump in Scotland sources heat from the outdoor air and delivers it through water-filled radiators. Heat is delivered to living spaces through conventional wall-mounted radiators or underfloor heating. This is commonly referred to as an air-source heat pump (ASHP), or air-to-water heat pump (A2W).
‘Air to air’ (A2A) heat pumps are common in commercial applications such as shops and are also installed in domestic settings. Heat is delivered to living spaces by blowing recirculated air over a heat exchanger. During warmer seasons, A2A heat pumps can also be used for cooling, extracting heat from indoor air and releasing it outside. This operates independently of piping and radiators, and one unit will generally service a single room/space.
Ground source heat pumps collect heat from boreholes up to 200 metres deep or from shallow coil collectors buried over large areas. They can achieve higher operating efficiencies because ground temperatures, which sit consistently between 5°C and 10°C, are warmer than air temperatures in the depths of winter. However, these operating efficiencies can be negated by the higher capital costs, especially in buildings with lower heat demands. The primary influence on heat pump efficiency is the difference in temperature between the source (the outside air temperature for ASHP’s), and that of the flow to the indoor emitters. The narrower the gap, the higher the efficiency. In other words, with radiators operating at lower temperatures, e.g., 45°C instead of 65°C, energy use and operating costs will be noticeably lower. Average in situ efficiencies of around 270-300% are reported (HeatpumpMonitor.org, n.d.)
To maintain comfortable room temperatures with this cost-efficient operation, new higher-output radiators and larger pipework may be required. Replacing pipework, if required, is likely to be particularly disruptive. Upgrades to radiators may also be required for condensing boilers to operate in energy efficiency condensing mode. Condensing boilers were mandated in 2005 as a carbon abatement strategy, but Building Standards were never adapted to enforce the changes to the radiators and controls required to achieve the energy efficiency savings. Consequently, boilers often operate significantly below manufacturers efficiency claims. Instead, the upgrades to radiators required for improved efficiency are now being enforced with the transition to heat pumps through the MCS Certification standard for publicly funded installations.
Heat networks
Heat networks distribute heat, and sometimes cooling, from a central origin to multiple properties. Several clean heat network technology options are currently available, for example, communal networks, which serve a single building, and district heating which covers a wider area. Fourth generation heat networks distribute heat in insulated pipes using water at around 65°C (Lund et al., 2021). Fifth generation district heating and cooling (5GDHC) distributes very low temperature heat, between 10°C and 20°C, from sources including boreholes, mine water and industrial waste heat. Individual heat pumps in each property transfer the heat to the home at high temperature or, in summer, transfer heat from the home to the network for cooling.
This variety of options means that individual building owners, as well as local authorities, may drive heat network adoption. This report will include consideration of communal, fifth generation networks as a clean heat option for some property types.
Heat networks are central to the Scottish Government’s Heat in Buildings Strategy with a capacity target of 2.6TWh of output by 2027 and 6TWh by 2030 (Scottish Government, 2021b). Currently heat networks supply 1.18TWh of heat in Scotland to 30,000 homes and 3,000 non-domestic properties (Scottish Government, 2022a). To operate effectively, be economically sustainable, and offer cost-effective solutions, heat networks must be strategically situated. This involves locating them in areas with ample heat demand and density to ensure optimal functionality.
Challenges for clean heating
The following section outlines the findings of this work in determining the suitability of clean heating technologies for challenging dwelling types. The primary findings are generated via the literature review, which are corroborated by the relevant findings in the semi-structured interviews, as highlighted. As discussed in Section 5, there are several low or zero carbon heating technologies available. The purpose of this work is to identify strategies that are both cost effective and practical to apply in the identified challenging dwelling types. Where heat pumps are not determined suitable, alternative technologies have been outlined.
Older properties
In the context of this report, older properties denote traditionally constructed buildings erected prior to 1919 (HES, n.d.). These structures are typically characterised by solid wall construction and may also be designated as protected buildings. This section applies to both houses and tenements.
Heritage and planning
Almost all properties built in Scotland before 1919 have solid walls and often have attractive facades in natural materials, principally sandstone and granite. Pre-1919 properties make up 19% of the Scottish housing stock (Scottish Government, 2023c). Regarding insulation improvements, older properties are often described as ‘hard to treat’ (HES, 2016), because readily available and cost-effective treatments such as cavity wall insulation are not suitable. Furthermore, heritage and planning constraints may prevent some measures such as external wall insulation or increase the cost of others, such as heritage-compliant double glazing.
Obstacles to implementing heat pump technology in older buildings have been identified in building regulations and planning consents, as in the example of a retrofit of a Glasgow tenement block, which was neither listed nor in a conservation area (K. Gibb et al., 2023). This four-story sandstone block, comprising eight small flats and built in 1895, is representative of a large proportion of tenements across Scotland. However, there are important qualifications about the transferability of findings from this project. This was an empty property wholly under the control of a social landlord aiming to fill a retrofitted empty property with social tenants. Planning officers raised concerns with designers on several fronts, such as the installation of external wall insulation, PV panels on the roof, and attaching air source heat pumps to the rear wall. Consequently, new gas boilers were installed in the top floor flats.
The challenges with planning consent outlined above were echoed in the industry survey and interviews. Interviews with installers and housing professionals identified challenges around gaining approval from local authorities and planning officers to proposed changes to increase energy efficiency and green technologies in existing homes, as well as a lack of consistency between different regions which make it difficult to develop repeatable solutions.
Fabric efficiency
Some sources asserted that building fabric efficiency is important for heat pumps to work effectively. However, the rationale for this assertion was often not explained, such as in Carroll et al. (2020). The innovation charity Nesta also made this assertion 2021 (Nesta, 2021), but reversed it 2024 stating:
“It is often claimed that homes need to be well insulated to have a heat pump, but this is largely untrue” (Nesta, 2024).
A WWF report focussed on decarbonisation pathways for Scotland’s housing stock stated that “it is technically possible to install heat pumps in solid wall properties without insulating the solid walls”. However, without insulation upgrades, the heating system upgrade can be more expensive due to the need for larger radiators, pipework and heat pump (Leveque, 2023).
Different household needs in the context of fuel poverty refer to the unique challenges fuel-poor households face in heating their homes due to financial constraints and inefficient systems. These challenges necessitate tailored solutions, like specialised heat pump installations, to ensure energy is used effectively and affordably. Addressing these needs is crucial for reducing overall heat demand, aligning with energy efficiency and sustainability efforts (London Economics, 2023; NEA, 2023a). Where literature describes inefficiencies in heat pump installations without solid wall insulation, this is sometimes referring to the total cost of ownership rather than the pure energy efficiency of the heat pump. For example, the WWF technical report on Scottish housing stock pathways considered capital costs of insulation and heating upgrades (excluding public subsidies), as well as the operating cost over 15 years. It found that the total cost of ownership of a heat pump in a solid walled detached house would be 8% lower over 15 years if solid wall insulation was included in the investment (Palmer and Terry, 2023a).
Total heat required to be delivered from the heating system can increase with heat pumps operating with radiators at lower temperatures, as compared with gas boilers. This is due to the reduced responsiveness of low temperature heating, resulting in the need to maintain temperatures within a narrower range. Essentially a right sized heating system heats up a building more slowly than an oversized boiler. For these reasons, households almost always need to change their heating schedule in order to achieve the same comfort as before (Terry and Galvin, 2023). Modelling found that this is especially important in homes with high thermal mass, such as brick internal walls or solid external walls without insulation on the interior face. Such homes may require up to 20% more heat be delivered from a heat pump, compared with turning off a gas boiler during periods of non-occupancy, such as in households that commute to work. The authors propose that an estimate of increased heating demand would be a useful measure of heat pump readiness, and that the parameters required to assess this should be provided on energy performance certificates.
The long-established ‘fabric first’ approach to energy upgrades prioritises reducing heating demand with insulation and draught proofing before installing clean heating. While the enhancement of energy efficiency stands as a crucial objective, the structural integrity and overall condition of the building necessitate simultaneous consideration. The advantage of this sequence, as opposed to the reverse order, has been to avoid some pipework and radiator upgrades and to reduce the size and cost of the required clean heat sources. However, there is an increasing recognition that, given fabric insulation levels do not influence operational energy efficiency, and depending on individual household needs, decarbonisation may be prioritised ahead of demand reduction to meet emissions targets (Nesta, 2024).
In much of the housing stock potentially no invasive demand reduction is required to meet emissions targets. Instead, the focus should be on electricity pricing and workforce education to enable good installation standards (Eyre et al., 2023). The UK Government’s Review of Electricity Market Arrangements (BEIS, 2022) is considering changes that would significantly reduce the cost of operating heat pumps, such as decoupling electricity pricing from volatile wholesale gas prices.
Rural properties
Within this work, rural refers to properties located off the gas grid which rely on alternative heat sources such as oil boilers to heat their homes.
Many off gas grid properties use electric resistive heating, which is a clean heating technology, but which partially accounts for higher rates of fuel poverty in rural areas (Scottish Government, 2023c) due to the higher unit cost of electricity compared to gas which leads to higher running costs. Therefore, more energy efficient heat pumps are a potential solution for fuel poverty in off gas grid areas.
Rural dwellings face a unique set of challenges compared to those found in urban settings.
Electricity network
The electricity network is vulnerable to extreme weather. In 2021, 40,000 households were left without power for three days in northern England and north east Scotland following Storm Arwen (OFGEM, 2023). This review did not find evidence establishing whether electric heating is more vulnerable in off gas grid area than on-gas areas. It should be noted that all types of heating – other than solid fuel burners require an electrical supply including gas, oil and biomass boilers.
Grid capacity is expected to be a potential constraint to the electrification of heat in all areas. The grid constraint is alleviated, and infrastructure investments can be postponed, if demand is reduced with insulation and if heat pump efficiency is improved, for example through the use of ground source heat (DELTA, 2018). Off gas grid housing often has the advantage of being built at low density, providing greater opportunity for the use of ground source heat pumps. However, ground source heat pump has a higher capital investment, and consideration should be given to share ground source networks also known as fifth generation heat networks.
Another strategy for reducing or postponing the need for network infrastructure investments is demand levelling. Time of use tariffs, the Demand Flexibility Service and the falling cost of domestic batteries provide incentives for consumer behaviour changes and automated smart demand response systems which can shift some electrical loads out of peak demand periods. Off gas grid areas have the same opportunity to benefit from these incentives as on gas areas.
Cold climates
Concerns have been raised about heat pump efficiency in cold climates (Simons, 2023). Field studies, however, demonstrate that with proper design, heat pumps maintain efficiency even at temperatures as low as -10°C, and can still be effective in conditions down to -30°C. (D. Gibb et al., 2023). It is crucial to understand that the effectiveness of heat pumps is not determined by the type of building or its insulation level. Efficiency is consistent across different environments and for buildings requiring more heat, due to size or less insulation, a larger heat pump can be employed to meet the demand effectively. This adaptability ensures heat pumps can provide efficient heating solutions in a wide range of settings and climates. This finding is applicable to all areas of Scotland but can be particularly relevant to rural areas which can face more severe winters and lower temperatures.
Evidence of adoption
Although challenges are present for rural homes, nevertheless the highest rates of heat pump installation are found in off gas grid areas (Nesta, 2023c). Analysis of the MCS installation database showed the UK’s highest adoption rates are in the Highlands & Islands, rural Wales and Cornwall. This is likely because significant operating cost savings are achieved with heat pumps, compared with oil and direct electric heating due to the high efficiencies of heat pumps (see Section 5.2).
Islands and Coastal areas
Research into clean heating for new housing in island communities found no consumer barriers or region-specific capital barriers to heat pump adoption (ClimateXChange, 2022). Additional anti-corrosion treatments are included in coastal locations. However, a lack of local specialist contractors was considered a constraint on installation rates and increased servicing costs were incurred due to mainland contractor travel costs.
Small properties
This section considers barriers to heat pump adoption related to indoor space, including both houses and flats. There is no formal definition of ‘small properties’ and categorisation differs in the literature so we have used a broad definition to include properties that are identified as having space limitations since this is what limits the uptake of heating technologies that require more space than existing systems.
Hot water storage
In Scotland, 80% of dwellings currently have boilers and most of these are combi type, producing hot water on demand. Homes with combi boilers do not have space committed to hot water storage. Unlike a combination (‘combi’) gas or oil boiler, heat pumps and direct electric systems generally do not supply instant hot water. Therefore, it is necessary to have a system in place for storing energy to meet the occupant’s hot water demand. The system usually takes the form of a hot water cylinder, the volume of which is driven by the size of the property and number of occupants. This calls for an evaluation of alternative hot water storage systems and a general evaluation of consumer barriers in terms hot water storage.
There is also the opportunity to think more broadly in terms of energy storage and review the viability of communal hot water storage externally.
Finding space for a hot water cylinder is one of the most significant consumer barriers in all homes and is particularly acute in small properties (Nesta, 2021; Palmer and Terry, 2023a; Scottish Government, 2022b).
In an analysis of the Scottish Building stock, homes with less than 18m2 of floor area per habitable room were assumed to be unsuitable for individual heat pump adoption due to the requirement for a hot water cylinder (Element Energy, 2020). This threshold, which equates to 90 m2 for a dwelling with 3 bedrooms and two reception rooms, was not explained. Since the average floor area of Scottish homes is 97m2 (Scottish Government, 2023c) this threshold, if significant, takes in a large proportion of the housing stock.
One technical solution for small properties is compact phase change material heat batteries, such as those produced by Sunamp. These contain a material which is melted when heated by a heat pump, solar thermal panels or internal resistive element. It heats water instantly when a tap is opened, eventually solidifying as it cools. Heat batteries can be up to four times smaller than equivalent hot water cylinders.
Another solution is to locate hot water storage outside. This strategy was trialled in seven small houses by National Energy Action (NEA, 2023b). In this system a compact heat battery is located outside in an insulated enclosure adjacent to the heat pump.
Electrical batteries in conjunction with instant hot water taps and electrical showers may be a feasible solution where hot water demand is relatively low. Lithium-ion batteries can have roughly double the energy density of water storage, so could be effective in space-constrained cases (Energy Saving Trust, 2017). The cost of lithium-ion batteries has reduced dramatically in recent years (BloombergNEF, 2023) new battery technologies such as flow batteries are now emerging in domestic applications (PV magazine, 2023).
An interim solution, highlighted in interviews with housing officers, is to enable decarbonisation of space heating would be to allow the retention of combis for hot water production only. Thus, a heat pump would cover 100% of the space heating requirement. Over time, households may find space for hot water storage, potentially incentivised by the high unit cost of hot water or further technical solutions may emerge.
Radiators
In most UK homes, radiators are currently undersized to meet industry convention comfort standards with efficient gas boiler operation (BEIS, 2021). Consequently, either boilers must heat radiators to higher temperatures or rooms are cold.
In order to meet comfort standards and achieve high operating efficiencies with heat pumps, heating water temperature is typically needs to be lower with a heat pump than with gas or oil boilers. This means larger radiators and changes to pipework are often part of a heat pump installation (BEIS, 2021; Nesta, 2021; Zhuang et al., 2023).
In some cases, dependent upon ease of access, replacing undersized radiators could be fairly trivial, (Leveque, 2023), however in some, space constraints such as the wish to preserve space for bookshelves, may present a consumer barrier (Nesta, 2021; Wade, 2020).
Designing the heating system to operate at a higher temperature can mitigate the need for radiator upgrades. The capital savings may balance out operational cost increases over the life of the system (Palmer and Terry, 2023). Nonetheless, with the availability of modern heat pumps, designers can specify operating temperatures similar to the outgoing heating system which could mitigate the need for radiator upgrades.
Cost effectiveness
In small properties with low heat demands the capital costs of an air-to-water heat pump may not be economic. Alternative technologies can be considered.
Air-to-air heat (A2A) pumps have significantly lower capital costs than air-to-water and may be an attractive solution where there is no existing water-based system (Lowes, 2023). They therefore provide an option for addressing fuel poverty in homes with existing direct electric systems.
A further benefit of A2A heat pumps is that they can also provide cooling from the same capital investment in homes that are at risk of overheating in summer (Khosravi et al., 2023). Air to air systems account for a large part of Europe’s lead over the UK in heat pump installation rates, although much of this is for heating in Southern Europe (Nesta, 2023d).
Infrared is proposed by manufacturers as a clean heat solution with low capital cost. Its use in industrial settings such as warehouses with high ceilings is well established (Anwar Jahid et al., 2022; Cao et al., 2023; Kylili et al., 2014). However, there is lack of evidence on energy efficiency benefits over simple resistive heating (Brown et al., 2016) with studies focussing on high ceilings (Roth et al., 2007). Other studies have identified discomfort concerns due to asymmetric temperatures (Corsten, 2021). By reducing the overall heat demand of a building and targeting only certain areas, while you may use less energy, overall, the building will be colder than if you maintained a constant air temperature. As a result, damp and mould could become more prevalent. In general, only things which are hit by the IR radiation will get hot although some heat will be emitted by the things which get hot and heat up the surroundings (Lowes Richard, 2022).
Where heat pumps remain impractical for small properties storage heaters are the most cost-effective option available today. In modelling of total cost of ownership, storage heaters are the optimal clean heating solution in some situations (Palmer and Terry, 2023a).
Flats and tenements
Flats and tenements are defined here as any building that contains multiple dwellings. This includes, four-in-a-blocks, low rise blocks, high rise blocks and tenements.
In the 2011 Census, it was found that 36% of the Scottish population lived in flats, making up the highest percentage among dwelling types (NRS, 2011). Around a third of tenement flats were built prior to 1919, another third between 1919-1982, and the final third after 1982. Many tenement flats are in a state of critical disrepair, particularly those built before 1919 (Built Environment Forum Scotland, 2019). The Scottish Parliamentary Working Group on Tenement Maintenance has been meeting since March 2018 with the purpose of establishing solutions to aid, assist and compel owners of tenement properties to maintain their buildings. Recommendations include establishing periodic inspections and maintenance sinking funds. This is important for energy efficiency and clean heating to be implemented in flats. (Scotland, n.d.)
Location of heat pump
Typically, air-source heat pumps are installed externally, such as in garden areas, driveways, or other outdoor spaces around the building. Unlike houses, flats and tenements often lack private gardens. Literature cited the lack of external space as a challenge when looking to install heat pumps (Nesta, 2021; Scottish Government, 2022b; Southside Housing Association, 2020).
The Scottish Government undertook a case study on the Dunbeg Phase 3 project in Oban which installed air source heat pumps into 74 flats (Scottish Government, 2022b). A primary finding highlighted the importance of considering a suitable external location for heat pumps specifically, relating to shared gardens. This challenge has not been expanded upon in the Dunbeg case study as it is likely a planning constraint similar to that experienced during the retrofit of a tenement block in Glasgow (K. Gibb et al., 2023). In this case, the aspiration was to utilise heat pumps that were attached to the external wall. However, planning officers determined that heat pumps could only be installed if they were located in the back communal garden on the ground and were fenced off. Consequently, gas boilers were installed in the top two floors.
Southside Housing Association trialled the installation of air source heat pumps to a selection of flats (Southside Housing Association, 2020). The installation work was informed by surveys and feedback from the residents. At the outset, the drying area within each floor of the flats was selected as the location for the heat pump. However, further consultation with residents determined that the preference was for the heat pumps to be installed on the individual flat balconies. This strategy presented some challenges in the beginning, such as difficulty pumping condensate water back to the main drain and heat loss through the external pipework. As a pilot project, the lessons learned should be applied to future projects, having successfully demonstrated alternative locations for flats with limited external space.
Air source heat pumps offer a versatile heating solution for multi-storey buildings. Ground-mounted units are ideal for efficiently heating ground-level and first-floor flats, using tailored circulation systems to distribute heat effectively. For higher floors, split system configurations are beneficial, allowing refrigerant lines to run vertically with greater ease and efficiency than insulated water lines, though this setup requires additional indoor equipment. Additionally, in buildings where rooftop access is available, heat pumps can be strategically installed on roofs or in loft spaces, providing effective heating coverage from the base to the top of the building.
Another option for flats is the adoption of either shared external heat pump units, such as at Hillpark in Glasgow (Star Renewable Energy, n.d.). Such systems have been demonstrated as being more cost effective than individual units whilst also consuming less space (Palmer and Terry, 2023). Agreement between different owners and tenants can be difficult to attain, especially where there are multiple owners and tenure types.
Options exist that enable an air source heat pump to be located fully within the building. Exhaust air heat pumps form part of the ventilation system and draw heat from exhausted stale air. Further heat is drawn directly from outside. They are most readily suited to energy efficient buildings (Energy Saving Trust, n.d.).
Individual room air to air heat pumps could provide further low capital, easy installation options. These systems are gaining popularity in some settings with existing ducted air systems, for example in flats in the United States (Gradient) and in UK hotel rooms (Powrmatic).
Clean hot water heating could be provided independently on the hot water system by using hot water heat pumps which either using excess internal heat or ventilation exhaust air or outdoor heat to generate hot water.
Shared ground source heat networks, also known as fifth generation heat networks, provide a clean heating solution that does not need equipment to be located above ground outdoors. Ground temperature heat drawn from boreholes is shared across homes through a network. Individual water to water heat pumps inside each property supply heat to space and to hot water storage.
In common with the challenges of addressing communal maintenance, the main remaining barrier to heat pump adoption in flats is the challenge of gaining agreement to, and coordinating works, between all owners of the building. These are similar to the challenges to basic repairs and maintenance blocks of flats and to fabric improvements such as insulation. An expert Short Life Working Group presented recommendations for addressing these barriers in 2023 (Scottish Government, 2023a). These centred on whole building approaches and further amendments to the Tenements Act.
Future Developments
This review has found that with careful consideration, clean heating technologies are available to suit challenging dwelling types, though there are factors to consider including running cost, space constraints and need for communal agreement. There remains the opportunity to address barriers and support delivery through further technical and policy development as well as sharing best practice by gathering more evidence from pilots on key aspects such as managing costs, disruption levels and post occupancy evaluations.
Application of existing technologies
This review has reported on a variety of technologies in different forms of application. It shows that there is no panacea, or one-size-fits-all solution for clean heating. Further consideration is required to support the finding that appropriate technologies are available for challenging dwelling types. These recommendations are provided as a cumulation of findings from the literature review, industry interviews and the report authors experience.
As described in section 6, air-to-air heat pumps may provide a cost-effective means of providing low-cost clean heat in small dwellings. However, there is only weak evidence for the energy efficiency of such systems. For related reasons, there is no certification standard to support publicly funded air-to-air installations. Policy makers should consider commissioning field or laboratory studies to clarify the effectiveness of air-to-air heat pumps.
The role of cascade heat pump systems such as exhaust air heat pump and hot water heat pumps should be considered further. These systems use both outdoor air and internal air to provide heating and hot water at different temperature levels. Further research is required to determine appropriate applications and the required skills and policy support.
There is also the opportunity to think more broadly in terms of energy storage and review the viability of communal hot water storage externally, this would be particularly well suited to flats and tenements or small homes in rural areas which may have limited internal area.
Fifth generation heat networks
Besides wide-area fourth generation heat networks, which operate at around 65°C, this report has covered other heat network configurations including communal air source heat pumps for flats. However, the potential for shared ambient loop networks, also known as fifth generation heating and cooling networks, to serve Scottish challenging dwelling types is not well reported in the independent literature. Further research in this area is merited.
Improving installed heat pump performance
As described in the context of older buildings in section 6, with some households and buildings it may be appropriate to decarbonise without any new insulation measures. However, while it’s possible to install any heating system at any time, it’s advised to first enhance the building’s fabric. Rather, it is more important to focus on design and installation standards to maximise in situ efficiency (Eyre et al, 2023).
Workforce education should be directed towards better system design. This concerns the right-sizing of heat pumps, radiators and pipework. This enables heat pumps to operate in their high efficiency ‘sweet spot’ for more of the heating season. This can often reduce capital costs and avoid unnecessary radiator and pipework upgrades.
Furthermore, a better understanding is needed about whether demand reduction and energy-saving measures can enable or speed up the deployment of technologies such as heat pumps, for example, by reducing the size and cost of equipment required, smoothing out peaks in electrical demand, and reducing operating costs.
Emerging technology
Domestic heat pumps use the vapour compression cycle. An alternative heat pump technology, the Peltier Effect is used in thermoelectric heat pumps. In these devices voltage applied to a semiconductor device creates a temperature difference between the two sides of the device, supporting thermal energy collection from renewable sources (Tritt, 2002). Thermoelectric heat pumps, known for their application in industries and portable devices like camping fridges, offer unique benefits for challenging building environments, especially smaller spaces such as flats or compact homes. Their key advantages include a lack of working fluid, eliminating concerns over global warming potential, absence of moving parts which ensures durability and minimal maintenance, and a compact size that allows for flexible installation options. Unlike traditional systems, thermoelectric units do not necessarily require external components, making them an ideal choice for locations where external installations are impractical. This makes thermoelectric heat pumps a versatile and eco-friendly option for urban living spaces where space constraints and building regulations might limit the use of conventional heating systems.
Developments in industry indicate that thermoelectric heat pumps may be suited to heating dwellings. TE Conversion, based in Glasgow, discussed with the author how they expect to test prototypes operationally in domestic settings in 2024.
Emerging technology once recognised as a ‘mature’ technology, service and maintenance costs are not anticipated to be any higher than for fossil fuel (or biomass) equipment as the intervention period should be longer. Annual service costs whether for gas boilers or heat pumps are likely to be comparable.
Conclusions
We conducted a review of existing literature and evidence to assess the feasibility of heat pumps as a clean heating option for building types considered difficult to decarbonise. We found that with careful consideration and effective design, clean heating technology can be applied to all types of challenging dwellings.
However, a key caveat of this report is the need to evaluate the cost-effectiveness of implementing clean heating technology in varied circumstances. Without a comprehensive cost analysis of comparable solutions, it is difficult to determine their economic viability. Therefore, future research should prioritise conducting whole-life cycle cost analyses of different heat pump applications and scenarios, ideally based on industry data wherever available.
The appendices include four key literature pieces that may complement the findings of this report, offering a comprehensive understanding of the challenges and opportunities associated with challenging dwelling types and clean heating technologies.
Recommendations
Based on the findings of the report, the authors recommend the Scottish Government explore the following:
- Conduct in-depth case studies, evaluations and surveys on the application of clean heating technology in challenging dwelling types to extract valuable socio-technical lessons learned and develop repeatable solutions.
- Future studies that facilitate consistent appraisal and comparison in heat pump evaluations.
- Investigate zero carbon back-up options for areas with vulnerable above ground distribution networks.
- Consider the recommendations of the Working Group on Tenements – mandatory owners associations, periodic inspections and maintenance sinking funds. This is important for energy efficiency and clean heating to be implemented in flats.
- Investigate alternatives to hot water storage in flats and small properties and a general evaluation of consumer barriers in terms of hot water storage systems. For example, Community Energy Storage systems.
- Establishing evidence for the energy efficiency of air-to-air heating and, if found to be appropriate, providing policy support for certification and installation in homes where it is more cost effective than water-based space heating.
In addition, the research team identified several financial and regulatory barriers for Scottish Government to consider:
- Monitoring developments in thermoelectric heat pumps, which may provide radical space savings.
- MCS certification for air-to-air heat pumps or support for communal ambient loops with individual water-to-water heat pumps for flats.
- Hybrid heat pumps where fossil fuels are used only for hot water.
- Resolving inconsistency in planning guidance for heritage buildings and conservation areas.
References
Ahmad, S., 2023. Motivations and Barriers Associated with Adopting Domestic Heat Pumps in the UK.
Anwar Jahid, M., Wang, J., Zhang, E., Duan, Q., Feng, Y., 2022. Energy savings potential of reversible photothermal windows with near infrared-selective plasmonic nanofilms. Energy Convers Manag 263, 115705.
BEIS, 2021. Domestic heat distribution systems: Evidence gathering.
BEIS, 2022. UK launches biggest electricity market reform in a generation [WWW Document]. URL https://www.gov.uk/government/news/uk-launches-biggest-electricity-market-reform-in-a-generation (accessed 2.16.24).
BloombergNEF, 2023. Lithium-Ion Battery Pack Prices Hit Record Low of $139/kWh.
Brown, K.J., Farrelly, R., O’Shaughnessy, S.M., Robinson, A.J., 2016. Energy efficiency of electrical infrared heating elements. Appl Energy 162, 581–588.
Built Environment Forum Scotland, 2019. Facts & Figures [WWW Document]. URL https://www.befs.org.uk/scotlands-historic-environment/facts-figures/ (accessed 3.27.24).
Cao, X., Li, N., Li, Y., Che, L., Yu, B., Liu, H., 2023. A review of photovoltaic/thermal (PV/T) technology applied in building environment control. Energy and Built Environment.
Carroll, P., Chesser, M., Lyons, P., 2020. Air Source Heat Pumps field studies: A systematic literature review. Renewable and Sustainable Energy Reviews.
CCC, 2020. Reducing emissions in Scotland Progress Report to Parliament.
ClimateXchange, 2022. Zero emissions heating in new buildings across Scottish Islands.
Corsten, A., 2021. A comparative performance assessment of infrared heating panels and conventional heating solutions in Dutch residential buildings.
DELTA, 2018. Technical feasibility of electric heating in rural off-gas grid dwellings.
Element Energy, 2020. Technical feasibility of Low Carbon Heating in Domestic Buildings.
Energy Saving Trust, 2017. A guide to energy storage.
Energy saving trust, n.d. Exhaust air heat pumps [WWW Document].
Eyre, N., Fawcett, T., Topouzi, M., Killip, G., Oreszczyn, T., Jenkinson, K., Rosenow, J., 2023. Fabric first: is it still the right approach? Buildings and Cities 4, 965–972.
Gibb, D., Rosenow, J., Lowes, R., Hewitt, N., 2023. Coming in from the cold: Heat pump efficiency at low temperatures. Joule 7.
Gibb, K., Sharpe, T., Morgan, C., Higney, A., Moreno-Rangel, A., Serin, B., White, J., Hoolachan, A., 2023. Niddrie Road, Glasgow: Tenement Retrofit Evaluation.
HeatpumpMonitor.org, n.d. HeatpumpMonitor.org. An open source initiative to share and compare heat pump performance data. [WWW Document]. URL https://heatpumpmonitor.org/ (accessed 2.8.24).
HES, 2016. Climate change adaptation for traditional buildings.
HES, n.d. Traditional buildings [Online] Available at: https://www.historicenvironment.scot/advice-and-support/your-property/owning-a-traditional-property/traditional-buildings/
Khosravi, F., Lowes, R., Ugalde-Loo, C.E., 2023. Cooling is hotting up in the UK. Energy Policy 174, 113456.
Kylili, A., Fokaides, P.A., Christou, P., Kalogirou, S.A., 2014. Infrared thermography (IRT) applications for building diagnostics: A review. Appl Energy 134, 531–549.
Leveque, F., 2023. Affordable warmth. Next steps for clean heat in Scotland.
London Economics, 2023. Understanding the challenges faced by fuel poor households.
Lowes, R., 2023. Blowing hot and cold: Reflecting the potential value of air-to-air heat pumps in UK energy policy.
Lowes, R., 2022. Infrared heating: don’t get excited.
Lund, H., Østergaard, P.A., Nielsen, T.B., Werner, S., Thorsen, J.E., Gudmundsson, O., Arabkoohsar, A., Mathiesen, B.V., 2021. Perspectives on fourth and fifth generation district heating. Energy 227.
NEA, 2023a. Making heat pumps work for fuel-poor households [WWW Document].
NEA, 2023b. Making heat cheaper, smarter and greener.
Nesta, 2021. How to Heat Scotland’s Homes.
Nesta, 2023a. The electricity-to-gas price ratio explained – how a ‘green ratio’ would make bills cheaper and greener [WWW Document]. URL https://www.nesta.org.uk/blog/the-electricity-to-gas-price-ratio-explained-how-a-green-ratio-would-make-bills-cheaper-and-greener/ (accessed 2.16.24).
Nesta, 2023b. How the UK compares to the rest of Europe on heat pump uptake [WWW Document]. URL https://www.nesta.org.uk/report/how-the-uk-compares-to-the-rest-of-europe-on-heat-pump-uptake/electricity-gas-and-other-fuel-prices-across-europe/#:~:text=Between%202011%20and%202021%2C%20in,times%20more%20expensive%20than%20gas. (accessed 2.16.24).
Nesta, 2023c. Do heat pumps work in rural areas? [WWW Document]. URL https://www.nesta.org.uk/blog/do-heat-pumps-work-in-rural-areas/#:~:text=The%20truth%20is%20that%20rural,to%20invest%20in%20heat%20pumps. (accessed 2.7.24).
Nesta, 2023d. How the UK compares to the rest of Europe on heat pump uptake.
Nesta, 2024. Insulation impact: how much do UK houses really need.
NRS, 2011. Scotland’s Census 2011.
Palmer, J., Terry, N., 2023a. Faster deployment of heat pumps in Scotland: Settling the figures.
Palmer, J., Terry, N., 2023b. Faster deployment of heat pumps in Scotland: Settling the figures.
PV magazine, 2023. German manufacturer unveils 10kWh residential redox flow battery.
Rosenow, J., 2022. Analysis: Running costs of heat pumps versus gas boilers.
Roth, K., Dieckmann, J., Brodrick, J., 2007. Emerging technologies: Infrared radiant heaters 49, 72–73.
Scottish Government, 2021a. Heat in buildings strategy: Achieving net zero emissions in Scotland’s buildings.
Scottish Government, 2021b. Heat in buildings strategy: Achieving net zero emissions in Scotland’s buildings.
Scottish Government, 2022a. Heat Networks Delivery Plan.
Scottish Government, 2022b. Case Study: Zero Direct Emissions Heat in New Build Affordable Homes.
Scottish Government, 2023a. Tenements Short Life Working Group – energy efficiency and zero emissions heating: final report.
Scottish Government, 2023b. Delivering Net Zero for Scotland’s Buildings. Changing the way we heat our homes and buildings. A Consultation on proposals for a Heat in Buildings Bill.
Scottish Government, 2023c. Scottish House Condition Survey: 2021 Key Findings.
Sevindik, S., 2023. Modelling Scenarios for Low Carbon Heating Technologies in the Domestic Sector Towards a Circular Economy.
Simons, P., 2023. Cold hard facts about the efficiency of heat pumps. The Times.
Southside Housing Association, 2020. 30 Invergyle: Drive Phase 1 – Performance study & review.
Star Renewable Energy, n.d. UK’s largest residential air -source heat pump halves the cost of energy for flats in hillpark.
Terry, N., Galvin, R., 2023. How do heat demand and energy consumption change when households transition from gas boilers to heat pumps in the UK. Energy Build 292.
Tritt, T.M., 2002. Thermoelectric Materials: Principles, Structure, Properties, and Applications. Encyclopedia of Materials: Science and Technology 1–11.
Wade, F., 2020. Routinised heating system installation: the immutability of home heating. Energy Effic 13, 971–989.
Zhuang, C., Choudhary, R., Mavrogianni, A., 2023. Uncertainty-based optimal energy retrofit methodology for building heat electrification with enhanced energy flexibility and climate adaptability. Appl Energy 341.
Appendix
Methodology
A Rapid Evidence Assessment (REA) is a methodology which enables a researcher(s) to undertake a systematic review of existing literature related to a specific research question and provides a method to search and critically appraise relevant literature. To further complement this, a deeper analysis of the gaps identified in the literature review was undertaken through a combination of surveys and semi-structured interviews with industry experts.
A rapid evidence assessment is split up into seven key stages:
- Protocol development
- Evidence search
- Search screening
- Evidence extraction
- Critical assessment of evidence
- Synthesis of results
- Communication of findings
Each of these stages and their methods have been discussed in more detail below.
Protocol development
The purpose of the protocol development is to develop a search strategy and formally detail the methodology. Developing a protocol distinguishes Rapid Evidence Assessments (REA’s) reviews with less structure. This ensures that the evidence review (ER) process is rigorous and transparent. It also facilitates communication among the User, Steering Group, and Review Team, laying out how the review will be carried out. The Review Team bears the responsibility for developing the review protocol, active input and approval from the User and Steering Group are essential components of the review process.
Background
Approximately 20% of Scotland’s total greenhouse gas emissions originate from homes and workplaces. In pursuit of climate objectives, the Scottish Government has established targets, aiming to transition over one million homes to clean heating systems by 2030, with the broader goal of achieving clean heating for all homes by 2045. Over one third of Scotland’s housing stock comprises tenement properties, characterised by factors such as accessibility issues, space limitations, ownership complexities, and structural challenges, which can pose difficulties in installing clean heating technology. Although several clean heat technologies exist, heat pumps are expected to play a significant role in the decarbonisation of heat in Scotland. The purpose of this work is to assess whether heat pumps represent a practical, technically viable, and cost-effective clean heating option for various dwelling types, including flats, tenements, and other hard-to-treat archetypes.
Primary question
What evidence is there that heat pumps are a practical, technically feasible and cost-effective clean heating option for Scottish flats, tenements, and other hard-to-treat archetypes?
Population: Flats, tenements, and other hard-to-treat buildings in climates like Scotland’s.
Impact: Clean heating technologies
Comparator: Existing fossil fuel heating system
Outcome: Practical, technically feasible, cost effective
Secondary question
What evidence is there that dwelling types may be suited to other ZDEH technology such as direct electric heating. Which dwellings are suited to non-ZDEH hybrid heating systems?
|
Scope of the work | ||
|
Boundaries |
Geography |
Scotland (and other countries with similar economies and policy drivers i.e., wider UK and Europe where applicable) |
|
Date |
Since 2010 We agreed that research carried out within the last 5 years would be the most relevant in terms of technology adoption and the regulatory/ policy framework with what is in place presently. We viewed research carried out in the last 5-10 years to be less relevant but may still be applicable and therefore has been included in this work. Research older than 10 years is anticipated to be the least relevant, using older technologies than available now, and adhering to different standards and policies that are currently in place. | |
|
Outcome |
Immediate cost/ benefit to occupants and building owner in terms of technical feasibility, practicality, user acceptance, capital cost and operating cost. | |
|
Keyword search | |
|
Population |
dwellings; homes; houses; hard to treat; flats; apartments; traditional; solid wall; heritage; small |
|
Intervention |
low carbon heat; heat pump; zero carbon heat; renewable heat |
|
Comparator |
(we are comparing vs business as usual) |
|
Outcome |
economics; costs; comfort; consumer; skills; supply chain |
|
Other |
case study; evaluation |
|
Search locations | |
|
Peer-reviewed literature |
Engineering, policy, and social science databases |
|
Grey literature |
Engineering, policy, and social science databases for conference proceedings and non-peer reviewed academic publications Search engines |
|
Unpublished data |
Members of Heat Source; professional contacts of review team; contacts of Steering Team. |
|
Secondary review |
Semi structured interviews with industry experts to further complement the findings of the literature review. |
Evidence search
The search strategy outlined above was utilised to carry out the evidence search. Boolean Operators, including words like AND, OR, NOT, or AND NOT allow the combination or exclusion of keywords, leading to more precise and productive results. This streamlined approach is designed to save time and effort by eliminating irrelevant hits that would otherwise need to be reviewed before being discarded.
Google searches are restricted to searching 32 words at a time; therefore 3 keyword searches were undertaken. As such the core searches performed across the three key databases can be seen in the table below. These were duplicated in each of the chosen search engines, Google, Google Scholar and Edinburgh Napier University academic library.
The keyword searches are outlined below:
|
Boolean operator | ||||||||||
|
AND | ||||||||||
|
Either (OR) |
dwellings |
hard to treat |
low carbon heat |
economics |
case study | |||||
|
homes |
flats |
heat pump |
costs |
evaluation | ||||||
|
houses |
apartments |
zero carbon heat |
comfort |
| ||||||
|
|
traditional |
renewable heat |
consumer |
| ||||||
|
|
solid wall |
zero emissions heat |
skills |
| ||||||
|
|
small |
|
supply chain |
| ||||||
|
|
traditional |
|
| |||||||
|
Search 1 |
Search 2 |
Search 3 | ||||||||
Search results were then exported to an excel file. Duplicate results between the three searches were removed.
Search screening
Search result screening ensures that only the most relevant results are taken forward to the evidence extraction phase. Inclusion and exclusion criteria, in this case RAG analysis, was utilised was then used to carry out this initial screening.
Table 2: boundary conditions
|
Category |
Thresholds |
Score |
|
Year |
2018 onwards |
Green |
|
2013-2018 |
Amber | |
|
Pre 2013 |
Red | |
|
Source |
Peer Reviewed publication OR Book |
Green |
|
Independent Research (not peer reviewed) OR Government Policy |
Amber | |
|
Industry grey literature |
Red | |
|
Location |
Scotland or UK |
Green |
|
Europe |
Amber | |
|
Rest of World |
Red | |
|
Restrictions |
Relevant to all 3 |
Green |
|
Relevant to 2 |
Amber | |
|
Relevant to 0 or 1 |
Red |
Evidence extraction
- Key observation/particular area of interest
- Evidence overview
- Key data
Once the initial search screening had been completed, we analysed the searches for further information to determine their alignment with clean heating in Scotland for challenging dwelling types. The following information was extracted or each piece of evidence:
Critical assessment
The critical assessment is the part of the REA which is used to determine the robustness and relevancy of the information that has been extracted in the preceding stages.
Assessing relevancy
The initial step in the critical assessment involves assessing the relevancy of evidence in connection to clean heating in hard-to-treat archetypes. The following has been considered:
- The appropriateness of the method employed in the evidence to clean heating in Scotland for hard-to-treat property types.
- The relevance of the evidence to hard-to-treat archetypes in Scotland.
- The relevance of the intervention under scrutiny.
- The relevance of the measured outcome.
Synthesis of results
This stage involves the systematic analysis and integration of findings from the gathered evidence to draw conclusions or make recommendations. This stage typically follows the data extraction phase and precedes the final reporting or dissemination of findings.
Communication of findings
The final step in the REA communicates the findings in a report and provides appropriate recommendations and conclusions.
Industry survey questions
The survey was conducted through Survey Monkey specifically targeting the HeatSource network, a collaborative low carbon heat knowledge hub, hosted by BE-ST on behalf of Scottish Enterprise. The survey was distributed to 311 people with a return rate of 16. The return of 5% although low provided some insights. The low return in part could be due to the timing, the survey was distributed in December.
Survey questions
- Provide your view on the suitability of electric heating for challenging property types based on your experience. If unsuitable, please provide the reasons why. As far as possible provide values or data to support your views.
- For which challenging property types have you considered, assessed, designed or installed clean heating systems? Select all which apply.
- Multi-storey flats
- Tenements (any age)
- Old/heritage properties pre-1919
- Four in a block
- Off gas grid properties
- Small properties of less than 80m2
- None of the above (please specify other)
- What experience do you have or have considered in retrofitting any of the following technologies?
- Instant electric heating systems, for example, electric boilers, CPSU, infrared, panel heaters
- Off peak direct electric, for example storage heaters
- Air source heat pumps
- Ground source heat pumps
- Other (please specify)
- None of the above
- Thinking about the heating projects you have been involved in, what was your desired outcome/ motivation for action? You can define this further in the space provided.
- Achieve a reduction in operating costs
- Achieve parity operating cost
- Reduction in fuel poverty
- Achieve reduction in carbon emissions
- Improving occupant thermal comfort
- Achieve a reduction in cost savings for periodic replacement
- Where possible provide supporting figures/data. (for example, reduce carbon emissions associated with a property by x%, increase thermal comfort for tenants) Define your desired outcome, ideally with numbers. Please specify below.
- Thinking about projects you have been involved in where clean heating systems were considered, did they go ahead?
- Yes
- No
- Did you achieve your desired outcomes? Where possible, provide figures or data citing actual versus target for outcomes.
- Yes – why?
- No – why?
- If you have abandoned attempts to install a clean heating system, why was this?
- Capital cost
- Expected operating cost
- Installation barriers
- Occupant/user barriers – e.g., concerns with heat pump controls
- Lack of supply chain
- Lack of occupier engagement/support
- Lack of funding
- Other
- Please use the space below to elaborate on the reasons and context for the decision to not proceed with a planned installation.
- If you are an installer, what is important to successful outcomes in clean heating installations in challenging property types?
- In your opinion, what additional evidence is needed to increase confidence in deploying clean heating in challenging property types?
- In your opinion what are the key barriers to increasing deployment of clean heating in challenging property types?
Semi-structured interviews
Interviewees were identified by the project report authors as key industry experts with experience of clean heating technology. In total ten interviews were conducted with installers, architects, and housing professionals. The interviews were an addition to the literature review process to help draw out key findings in areas such as barriers to adoption and potential solutions to deliver clean heating technology at scale.
Sample questions altered slightly dependent on background and job role.
1. What is your experience of retrofitting zero direct emissions heating systems?
2. What barriers do you perceive with difficult to treat archetypes?
3. What did your previous research reveal to you about ZDEH systems?
4. What is your opinion on alternative solutions (using a table of options)
5. Why do you think retrofitting ZDEH systems in difficult to treat homes is not being done at scale?
6. What are the key things you need to see to enable difficult to treat properties being retrofitted?
Case examples
Using our sources protocol and deeper dive the four sources below were identified as most insightful in terms of the research question. Although it must be stressed all four still have gaps in findings.
|
Title of source | ||||
|
Faster deployment of heat pumps in Scotland: Settling the figures | ||||
|
Year |
Type of research |
Country/Climate zone |
Contains hard to treat and clean heat research evidence |
Author/ For |
|
2023 |
Modelling |
Scotland |
Yes |
Cambridge Architectural Research/ WWF |
|
Note | ||||
|
The study emphasises integrating heat pumps with energy efficiency measures to reduce emissions in Scottish homes, focusing on the cost, energy efficiency needs, and impact on energy bills and fuel poverty. It leverages the ScotCODE model for dynamic, cost-effective strategies in low-carbon heating deployment. | ||||
|
Key observations/Implications | ||||
|
Evidence of technically feasibility (or not) | ||||
|
Title of source | ||||
|
Affordable warmth next steps for clean heat in Scotland | ||||
|
Year |
Type of research |
Country/Climate zone |
Contains hard to treat and clean heat research evidence |
Author/ For |
|
2023 |
Mixed |
Scotland |
Yes |
Fabrice Leveque/ |
|
Note | ||||
|
It shows that energy efficiency, electric heat pumps and heat networks can help cut energy bills and lower carbon emissions. With energy prices likely to remain elevated, these solutions are our best strategy to minimise fuel poverty and tackle climate change | ||||
|
Key observations/Implications | ||||
|
Evidence of technically feasibility (or not) Evidence of cost-effectiveness (or not) Evidence of other ZDEH tech Evidence of non-ZDEH tech | ||||
|
Title of source | ||||
|
How to Heat Scotland’s Homes An analysis of the suitability of properties types in Scotland for ground and air source heat pumps. | ||||
|
Year |
Type of research |
Country/Climate zone |
Contains hard to treat and clean heat research evidence |
Author/ For |
|
2021 |
Mixed |
Scotland |
Yes |
Energy Systems Catapult/Nesta Scotland |
|
Note | ||||
|
Narrative summary of barriers. Quantitative assessment of Scottish housing stock. Some view on flats for heat pumps ‘difficult’. ” It was found that installing a heat pump into a pre-1914 flat without retrofit measures would leave the house below acceptable comfort levels for more than 22% of the time during the coldest periods of the year. | ||||
|
Key observations/Implications | ||||
|
Evidence of technically feasibility (or not) | ||||
|
Title of source | ||||
|
Niddrie Road, Glasgow: Tenement Retrofit Evaluation | ||||
|
Year |
Type of research |
Country/Climate zone |
Contains hard to treat and clean heat research evidence |
Author/ For |
|
2023 |
Case Study |
Scotland |
Yes |
UK Collaborative Centre for Housing Evidence/ Scotland Funding Council |
|
Note | ||||
|
Evaluating the deep ‘green’ retrofit of a traditional, pre-1919, sandstone tenement in Niddrie Road, Glasgow. A partnership consisting of Southside Housing Association, Glasgow City Council, John Gilbert Architects and CCG Construction to deliver an Enerphit level retrofit. The report contains an evaluation and its wider lessons for retrofitting tenements and older building stock. | ||||
|
Key observations/Implications | ||||
|
Evidence of technically feasibility (or not) “ASHPs were constructed into the ground and first floor with gas boilers in the upper two floors. s. This was a direct result of the planning decisions – the hot water piping could only reach the first two floors from the back yard with sufficient heat distribution retained to meet the manufacturing warranty” Planning guidance initially ruled out external wall insulation (EWI) at the rear and partial gable end of the block. It also later argued that residential air source heat pumps could not be used if attached to the rear of the building at windows. It also ruled out photo-voltaic panels on the roof, and it did not approve proposed wider gutters. Tenement planning policy is critical to aligning the fabric first needs of the retrofit (air -tight insulation combining external wall insulation and internal wall insulation as well as mechanical ventilation with heat recovery and other specific components) alongside renewables to deliver low energy. Niddrie road is a standard sandstone tenement. Even so, planning permission for the retrofit was complex and challenging Evidence of cost-effectiveness (or not) “The decision to commit to an EnerPHit approach was made possible because the association had control of a complete (and empty) tenement block or close. On the other hand, this means that the approach and the standard are not suitable for most situations where ownership patterns are more fragmented.” “Like many other older tenements, 107 Niddrie Road had been poorly maintained and suffered from a wide range of long-term problems such as failing finishes and decayed floor structure which significantly impacted on time and costs” Evidence of other ZDEH tech When the space heating demand is reduced by as much as it is at Niddrie Road, then the biggest component of most peoples’ fuel bills are hot water costs. Wastewater heat recovery systems can reduce costs (and carbon emissions) of hot water can be reduced by around 40% | ||||
© Published by BE-ST, 2024 on behalf of ClimateXChange. All rights reserved.
While every effort is made to ensure the information in this report is accurate, no legal responsibility is accepted for any errors, omissions or misleading statements. The views expressed represent those of the author(s), and do not necessarily represent those of the host institutions or funders.
info@climatexchange.org.uk
+44(0)131 651 4783
@climatexchange_
www.climatexchange.org.uk
May 2024
DOI: http://dx.doi.org/10.7488/era/4854
Executive summary
Project aims
The Scottish Government’s Heat in Buildings (HiB) Strategy commits all Scottish homes to be net zero by 2045. However, in line with the commitment to a Just Transition, the Government recognises that personal circumstances may, in some cases, make it more challenging for people to meet the requirements of the proposed Heat in Buildings Standard. Personal circumstances include vulnerability criteria related to the occupiers of the dwelling, such as disability, age, or low-income.
This study reviewed how regulations, both in the UK and internationally, have accounted for personal circumstances. Provision made for vulnerable groups for these circumstances included exemptions, extensions or abeyances, support mechanisms such as financial support, amendments or alterations to the standard.
This research will support the Scottish Government’s development of the proposed standard, through considering personal circumstances in domestic buildings, specifically focusing on owner occupied homes and the private rented sector.
We also investigated the impact of including personal circumstances in the regulation. The review has covered relevant low-carbon heating, domestic energy efficiency, housing and transport regulations. Flexibility is often provided within operational regimes without it being explicitly specified within the legislation, and this flexibility was not captured by this study. We also highlight new emerging policy areas to support consideration of how similar regulations could work in Scotland.
Summary of key findings
The study identified 18 international examples of personal circumstances being included in regulations. Six stakeholders from consumer organisations, professional housing sector, government departments and policy groups were interviewed to provide insight on regulations identified through the study. Our key findings are:
- There is limited evidence of including personal circumstances in regulations.
- The most common personal circumstances identified relate to those with a low income. Several regulations across Europe and Canada offer additional financial support for low-income households to undertake energy efficiency renovations or to upgrade to clean heating systems.
- Similar examples from the Netherlands, Switzerland and the USA exempt properties from upgrading to a clean heating system if the cost of doing so is prohibitive or if the lifetime savings were too low.
- Germany allows exemptions for clean heating regulation for owner-occupiers over 80 years of age, if they live in a building of up to six flats.
- Most stakeholders were aware of funding or support for low-income households, but several noted they had not considered including other personal circumstances within regulations.
- A proposal in Flanders aims to introduce a decision tree for personal circumstances, which includes significant life events to excuse residents for not meeting the standard. If implemented, this could allow application for a time extension to meet energy efficiency and clean heat standards in properties based on specific personal circumstances such as divorce or death in the family.
- Stakeholders were concerned that including personal circumstances in the proposed HiB Standard would risk people losing out on the benefits of the energy transition such as reducing energy costs, greater energy efficiency and warmer homes.
- There were concerns regarding a lack of clarity on how including personal circumstances would work in practice and the potential for an additional administrative burden on both residents and those administering schemes.
- Further examples of personal circumstances within regulation include Low Emission Zones across the UK, which provide exemptions for vehicles owned by those with a disability. However, drawing direct parallels to energy efficiency and clean heating regulations is challenging due to the specifics of how the regulation works.
Recommendations and value to a policy audience
Should the Scottish Government decide to implement new regulations that include personal circumstances, the key recommendations are:
- More thorough consideration of the potential benefits and risks associated with including personal circumstances – The benefits have largely been assumed but they require further investigation. The impact of including personal circumstances requires further consideration to understand which groups are most likely to benefit. Additionally, the needs of different vulnerable groups require greater clarity to ensure that the introduction of any flexibilities best meet these needs. This includes owner-occupiers, tenants in the private rented sector and communities connecting to heat networks to determine the likely positive impact. The risks of losing out on the benefits of the transition should also be considered.
- Consider additional support and flexibility – In addition to providing financial support to cover the cost of the measure, consider providing further support or alternative accommodation for low-income households during disruptive works.
- Ongoing monitoring of policy and regulation developments in similar countries, particularly in Flanders.
Glossary
|
Clean heat |
A heating system with zero direct emissions, e.g. an air-source heat pump |
|
EE |
Energy efficiency |
|
EPC |
Energy Performance Certificate |
|
HiB |
Heat in Buildings |
|
HiB Standard/the standard |
A proposal for a Heat in Buildings Standard comprising a minimum energy efficiency standard and a prohibition on polluting heating systems recently consulted on by the Scottish Government. |
|
Personal Circumstances |
Multiple, different vulnerability criteria such as those with disabilities, elderly, low-income, etc; related to the occupiers of the dwelling |
Introduction
This report provides findings from review of a wide range of international regulations that include provision for personal circumstances. Some personal circumstances are legally protected characteristics such as age, disability and pregnancy. However, the definition of personal circumstances is broad and can include wide ranging factors such as income level, health conditions (including disabilities), ownership status of property, location (which can affect outside temperatures), household composition and different cultural practices. These characteristics could affect the ability of different groups to comply with regulations.
The aim of the review is to inform the Scottish Government’s decision-making on future regulations regarding decarbonising residential buildings in Scotland and what types of provisions could be made to take into account personal circumstances. The review covers a variety of regulations that make provision for personal circumstances within different countries and regions that are considered to have relevance for the Scottish Government.
Policy context
The Heat in Buildings (HiB) Strategy commits all of Scotland’s buildings, including residential, to net zero by 2045 (Scottish Government, 2021). A proposal for the HiB Standard (“the standard” for the purposes of this report), comprising a minimum energy efficiency standard and a prohibition on polluting heating systems, was recently consulted on by the Scottish Government (Scottish Government, 2023).
The consultation proposed a prohibition on polluting heating systems from 2045, thereby requiring all homes to switch to a clean heating system. A clean heating system is defined as one with zero direct emissions at the point of use. The Scottish Government’s consultation proposed that private landlords must meet the minimum energy efficiency standard by 2028 and owner occupiers by 2033. Owner occupiers that install a clean heating system will not be mandated to improve their energy efficiency, however it is preferable, for the reasons outlined below.
The benefits of improving the EE performance of homes, particularly regarding the insulation levels and the resulting improved thermal performance are well established. Residents are likely to experience improved comfort and lower bills. EE schemes have a long history in Scotland and the UK, with significant numbers of properties now having good levels of insulation. However, some properties are still behind, with over 37% of private sector homes in Scotland having minimal levels of loft insulation and 47% no form of wall insulation (Scottish Government, 2024).
Clean heating is essential to meet decarbonisation targets and for homes with an improved thermal performance (through meeting EE standards) the expectation is that residents will not experience higher bills following a change to their heating system. The consultation on a HiB Bill also proposed two early action triggers for upgrading a heating system ahead of 2045; these are after the purchase of a property (with a grace period of 2 to 5 years), and when a heat network becomes available (Scottish Government, 2023).
The Scottish Government recognises that there are numerous reasons why properties remain poorly insulated, including technical, cost, practical and personal circumstances. EE retrofit measures and clean heating system installations are sometimes associated with disruption in the home which can be a major barrier for residents. For example, a heat pump installation will typically take 2-4 days to complete (LCP Delta, 2022) and can be disruptive to residents. The associated disruption is the main barrier to upgrading to a heat pump (LCP Delta, Energy Systems Catapult, Oxford Computer Consultants, 2022). This disruption could potentially have a greater impact on those in vulnerable situations.
There is recognition that personal circumstances could make it more challenging for some people to meet the proposed standard due to real or perceived barriers. Personal circumstances are relevant for both energy efficiency (EE) and clean heating requirements.
To ensure fairness, the Scottish Government has proposed (in its consultation on a Heat in Buildings Bill) that the Bill (Scottish Government, 2023) will:
- Ahead of 2045, exempt those who can’t, or perhaps should not have to, meet the HiB Standard.
- Provide extra time for those who need it to meet the standard or require that people comply with a modified version of the standard which considers their building’s characteristics or unique circumstances.
- Make it simple for people to appeal where they believe the requirements are incorrect or unfair.
The new bill has been central to a consultation process which closed in March 2024 (Scottish Government, 2023)
Research aims and scope
This project sought to identify examples of regulation which incorporated personal circumstances from a broad range of international regulations, including energy efficiency and low carbon, housing and transport policies. Regulations were reviewed to determine how suitable alterations, extensions or exemptions have been included to accommodate personal circumstances in different types of regulation. This includes what measures have been used or proposed to provide support (such as financial, deadline extensions) to assist with full or partial compliance with the regulations. This will inform Scottish Government decision-making around future proposals, including if and how to incorporate personal circumstances into new retrofit policy.
Overview of methodology
The key focus of this project was to identify regulatory examples, both within the UK and internationally, that include personal circumstances as a basis for extensions, abeyances or exemptions. We anticipated the number of examples specific to heat and energy efficiency regulations would be low. Our approach therefore drew from a broad base that included other sectors. This approach ensured we cast a wide net to identify a diverse range of types of personal circumstances and different ways these have been accounted for in regulations. To ensure all relevant examples were identified, our approach included a comprehensive evidence search and multi-method approach:
- A desk-based study: We reviewed data from internal reports and databases, including a previous international review for ClimateXChange on heat and energy efficiency policy (LCP Delta, 2023). Additionally, we searched publicly available policy databases and conducted tailored internet searches to identify academic, policy and other research sources.
- Consulted with in-house expert colleagues: this supported our research and ensured we focused our searches in areas that were likely to provide value.
- An online call for evidence: This was posted to LinkedIn via our company page which has over 10,000 followers to encourage stakeholders to share relevant regulatory examples.
- Interviews with external stakeholders: We completed interviews with six external stakeholders to discuss how regulatory examples had been implemented and the impact of including personal circumstances. Stakeholders were from a broad range of sectors and countries including the UK, Europe and Canada. These are summarised in the table below.
Table 1: Interviewees by sector and country
|
Interviewee no. |
Interviewee sector |
Country |
|
1 |
Independent consumer organisation |
Belgium |
|
2 |
Professional housing sector body |
UK |
|
3 |
Government department (energy/decarbonisation) |
Canada |
|
4 |
Policy NGO |
UK |
|
5 |
Policy network organisation |
Belgium |
|
6 |
Policy and PA consultancy |
Italy |
In our research, personal circumstances refer to a variety of individual or household factors that may affect the ability to comply with or benefit from such regulations. Depending on the personal circumstance, they can be transient by their nature or permanent. Specifically, we considered the following aspects of personal circumstances:
- Income level: Financial status is crucial as it affects an individual’s or family’s ability to invest in energy-efficient technologies or renovations. Lower-income households may require subsidies or financial incentives to afford necessary upgrades. Low-income households may also struggle to deal with disruptive works in the house, particularly if they need to find alternative housing during the work.
- Health conditions and disability: Health issues, especially those related to respiratory problems or illnesses exacerbated by cold or damp conditions, can make certain regulations more urgent or necessary for specific individuals. They can also make it particularly difficult to deal with disruptive works in the house.
- Property type: The type of property one lives in (e.g., detached house, flat, listed building, etc) can influence the feasibility of certain energy-efficient solutions or decarbonisation methods. A separate piece of research investigated building characteristics that may require exemptions is ongoing at the time of writing.
- Ownership status: Whether a person owns or rents their home significantly impacts an individual’s ability to make substantial changes to their property, such as upgrading heating systems. Renters often lack the ability to implement these improvements, as landlords retain the final decision-making power. Landlords might impose modifications that do not align with tenants’ preferences or fail to consider their personal circumstances adequately. Additionally, tenants may face the risk of eviction if they push for changes that landlords find inconvenient. Thus, protecting the interests of tenants becomes crucial, ensuring that energy efficiency improvements and clean heat installations do not result in undue cost or disruption for them.
- Location: Geographic location affects climate-related needs; for example, homes in colder regions might prioritise heating efficiency more than homes in milder climates. The reliability of the heating system is also crucial in colder regions. Additionally, rural or urban settings can influence access to certain technologies or energy sources and logistics.
- Household composition: The size of the household and the presence of vulnerable individuals (such as children, elderly, or disabled members) can affect energy needs.
- Cultural practices: Cultural or lifestyle factors might affect energy consumption patterns and openness to certain technologies or changes.
The project team built an Excel database to log all relevant regulations identified through the project and to include key information for each one. The database was a valuable resource when completing the analysis of findings for the project. Relevant criteria collected for each regulation included the enforcing authority to determine the eligibility and type of personal circumstance within the regulation, as well as the method of support available – such as extension, financial support, etc, and redress options (if relevant). The full list of database criteria is available in the appendix.
Research limitations
We acknowledge that the number of regulatory examples that include personal circumstances we have identified is limited. The researchers have endeavoured to identify regulatory examples to the extent that is possible. However, we acknowledge the limitation of finding all relevant regulations given the breadth of the project and the fast-developing nature of the heat and energy efficiency policy space.
We have not conducted full research into the reasons why governments have not included personal circumstances within regulations but suggest the following potential reasons for limited examples:
- Not considered viable: Inclusion of personal circumstances may have been considered, but the government determined that doing so was not feasible. This could either be due to the potential to limit effectiveness of the regulation or challenges associated with how including personal circumstance would work in practice. There may be an assumption that appropriate flexibility will be offered within the overall regime, without it being explicit in the overarching legislation.
- Low priority: Countries may have considered including personal circumstances at some stage during regulation design but deemed this a low priority resulting in no further action.
- Oversight: Countries may have neglected to consider the significance of personal circumstances within key regulation and the potential benefit of including them.
As the research focused on identifying regulations, the research on the type of personal circumstances that affect people’s ability to meet a regulation is limited. Additionally, we have not researched in detail how government intervention could best help different people meet the regulations as this is beyond the scope.
A further limitation of the research is the focus on regulation. There is a possibility that some countries are open to considering exemptions or extensions in practice on a case-by-case basis. This would require residents to reach out to the enforcing authority or body to request some flexibility on the regulation that considers their personal situation. The interview data suggests this possibility, but this was not investigated in detail in this report. It is also possible that Government funding is provided to people in vulnerable circumstances that is not linked directly with regulation; this was also not covered within the scope of the research.
Key findings: Personal circumstances in energy efficiency and clean heat regulations
We undertook a comprehensive review of heat, energy efficiency and other home decarbonisation-related regulations to identify the most relevant examples of regulations including flexibility in enforcement for personal circumstances. Through desk-based research, we identified 18 existing regulations relevant to this study that consider personal circumstances.
We conducted six interviews for this project. Most interviewees were not aware of examples of regulations that include provision for personal circumstances and responses to the idea ranged from neutral to negative. One interviewee who works for a professional housing sector body confirmed that within the housing sector, regulation usually involves meeting a minimum standard with funding available for those who cannot do this themselves. There are no exemptions from electrical and gas safety standards, so the interviewee questioned why decarbonisation measures should be treated any differently as the regulation is in part intended to benefit the resident. Discussions regarding personal circumstances within regulations focused on low-income residents struggling to meet standards due to lack of finance; most interviewees were familiar with such regulation. Most interviewees agreed the solution to this would be provision of additional funding and confirmed that they were only aware of such examples. This tallied with our findings from the desk-based research.
To facilitate the analysis, we have grouped our findings into two categories based on the personal circumstance considered. Our first category considers income levels and highlights eight policies providing additional support to lower-income households, using different methods. Our second category considers the high cost of the work mandated by the policy / regulation and highlights three examples of policies supporting owner-occupiers with the costs incurred for energy efficiency improvements or replacing their heating system with the mandated clean and renewable technology. A third section focuses on other exemptions and considerations, in which we highlight three other policies. In our analysis, we have merged two policies (implemented in France) together as they effectively work together and left out other policies identified which related to legal requirements and were thus out of scope. At the end of this section, we provide a detailed summary and analysis of the six interviews we conducted for this project. Interviewees came from different sectors to ensure a wide range of views.
Income level
Overview
Out of the 18 regulations identified which considered personal circumstances, nine considered income level. More particularly, the regulations had a specific provision for low-income households. These regulations, covered in more detail below, focus on the renovation of existing residential buildings to increase their energy efficiency, and on the replacement of inefficient or high-carbon heating systems for hot water and space heating. These regulations were identified in Europe for the most part (France (3), Italy, the Netherlands, the UK and Poland) as well as in Canada. They include minimum standards setting out how renovation should be conducted and which appliances to install, as well as other regulations encouraging the uptake of energy efficiency measures.
In our research, we identified two distinct phases—initial and advanced— in the evolution of regulatory approaches aimed at promoting energy efficiency and reducing environmental impact. The initial phase is characterised by non-binding, voluntary measures designed to encourage the adoption of clean heat technologies. This phase relies heavily on incentives such as grants, subsidies, or tax rebates to motivate owner-occupiers to implement energy-efficient solutions without the pressure of legal mandates. Most of the regulations highlighted in this section are part of governments’ first step in driving the transformation of buildings on the way to decarbonisation and net zero objectives. In contrast, the advanced phase introduces legally binding regulations that include minimum standards setting out how renovation should be conducted and which appliances to install, as well as other regulations encouraging the uptake of energy efficiency measures. The Scottish Government is specifically interested in the regulations falling in the advanced phase, as funding (initial phase) has already been implemented in Scotland. Two of the regulations highlighted fit into this advanced phase as they include minimum standards, which could show a potential path for the evolution of existing or future clean heat measures. Minimum standards create a legal requirement for specific appliances or energy efficiency measures to be installed, which is then enforced by local planning authorities. The City of Vancouver’s Zoning and Development by-law (City of Vancouver, 2022) mandated the installation of zero emissions heating systems in all new low-rise residential buildings in 2022 and will extend this mandate to all new and replacement heating system installations in 2025. The second example is Poland’s Clean Air 2.0 (Ministry of Climate and Environment, 2022) in which Polish regions have implemented emissions standards for heating appliances in all new and existing single-family homes.
Policymakers across these six countries recognise the urgency in renovating their housing stock and turning them into clean, efficient and comfortable homes. However, they are also aware of the cost implications of these updates and retrofits. As a result, they have developed support schemes and policies to incentivise and help all households to undertake these works, with specific, additional support for low-income households. The definition of a low-income household depends on local economic conditions and is country specific. However, the support provided to low-income households has commonalities across the regulations identified:
- Grants and subsidies: the regulation offers a free contribution to owner-occupiers who undertake an energy efficiency renovation in their home. The contribution usually only covers a share of the total cost of the renovation and is capped up to a certain amount. As an example, the French PrimeRénov’ (Republique Francaise, 2024) is an incentive to help owner-occupiers replace their heating system; in addition to other incentives, it can cover up to 90% of eligible expenses for very modest households, 75% for low-income households, 60% for intermediary households and 40% for high-income households. Eligible expenses include a large-scale renovation of a home leading to an improvement of at least two EPC labels, a specific renovation of the heating system or insulation, or the renovation of a multiple occupancy building.
- Low-interest loans: the regulation offers access to a low-interest loan for owner-occupiers to undertake the renovation and / or retrofit. Depending on countries, the loan can cover part or the total of the renovation work. The Dutch Energy Saving Loan provides a 0% rate on the total cost of the renovation for owner-occupiers with an aggregate income below €60,000. (Nationaal Warmtefonds, 2024).
In our review, we did not identify examples of regulations providing exemptions or abeyances related to income levels. Similarly, redress options weren’t mentioned on the websites reviewed.
Analysis of effectiveness and success
All nine regulations accounting for income level as a personal circumstance proved effective in incentivising owner-occupiers to install energy efficiency measures. Across the countries identified, at least thousands of households had applied for the support schemes. These schemes are available to most households but provide additional support for low-income households. In France, the PrimeRénov’ has received over 1.7 million applications, distributed over €1.7 billion in grants between 2020 and 2023 (Carole-Anne Cornet, 2024). In the Netherlands, over €1.2 billion were provided as part of the Energy Savings Loans, resulting in the renovation of over 90,000 homes across the country (Nationaal Warmtefonds, 2024). One notable measure is the Italian Superbonus which was the only measure providing support up to 110% of the cost of the renovation for owner-occupiers. Whilst the initial objective of the regulation – incentivising owner-occupiers to undertake energy efficiency renovations – has been achieved, the policy had been much more popular than expected, as the take-up of incentives had hit €219 billion by the end of 2023, as opposed to the budgeted €35 billion (Balmer & Fonte, 2024).
Understanding the effectiveness of providing additional support when considering income level as a personal circumstance is more challenging, as governments don’t report such detailed information. Table 2 provides detailed uptake and spending information for all measures identified, when information was available.
Table 2: Income level-related measures and impact
|
Country |
Name |
Support available |
Impact and awareness |
|
France |
CEE |
Additional financial support up to €15,500 for low-income households for replacing their heating system with low-carbon options. |
In 2020, 1.3 million applications were approved for support. (Ministere de la Transition Ecologique, 2024) |
|
France |
Ma PrimeRenov’ |
All subsidies apply to energy efficiency and heating improvements and are claimed directly by the contractor / installer. At time of paying, the amount of the subsidy is taken off the bill by the contractor. |
Between 2020 and beginning of 2023, 1.7 million applicants with over 1 million renovation work undertaken, with €1.7B distributed. (Carole-Anne Cornet, 2024). |
|
France |
Heating Boost |
|
Between 2019 and 2022, 1.12 million heating systems were replaced thanks to the subsidies and 2.1 million insulation work completed, with grants totaling €4.8B. (Ministere de la Transition Ecologique, 2024) |
|
Italy |
Superbonus |
Subsidies and tax deduction covering between 60-110% of the expenses incurred, increasing based on the number of people in the household. These incentives can be applied to thermal insultation work, the replacement of a heating system or structural improvements. |
By August 2023, 425,350 energy efficiency projects had applied for the tax deduction through the Superbonus scheme. (Statista, 2023) |
|
England |
Sustainable Warmth |
Maximum of £10,000 grant for low-income households installing a heat pump or hybrid heating system. |
Under Sustainable Warmth (LAD Phase 3 and HUG Phase 1), almost 5,200 households have been upgraded up to December 2022. (Department for Energy Security and Net Zero, 2023) |
|
Netherlands |
Warmth Funds |
Interest rate of 0% on the Energy Savings Loan provided for owner-occupiers with aggregate income below €60,000. |
By December 2023, the Dutch Heat Fund had granted over €1.2B in Energy Savings Loans, resulting in the financing of more than 208,000 energy-saving measures for over 90,000 homes. (Nationaal Warmtefonds, 2024) |
|
British Columbia, Canada |
Zoning and Development By-law |
Additional support for low-income households mentioned but not implemented yet. Includes exemptions from building code and planning requirements following energy efficiency work. |
No data published |
|
Poland |
Clean Air 2.0 |
Most households can get a grant up to €5,000 when replacing their heating system to a low-emissions system. Low-income households can claim up to €7,000. |
By early 2022, over 384,000 applications had been submitted, totaling PLN 6.45B of co-financing (GBP 1.2B). (Ministry of Climate and Environment, 2022) |
High cost of work in the home
Overview
Out of the 18 regulations identified which considered personal circumstances, three specifically considered the high cost of work in the home, as a combination of property type and location personal circumstances. These regulations mandate the ban of fossil-fuelled heating systems and their replacement by clean or hybrid heating systems. These regulations were identified in the Netherlands, Switzerland and the United States of America (USA). For this exemption, these regulations consider the cost of replacing a fossil-fuelled heating system with a clean / hybrid one and the lifetime cost of running the clean / hybrid heating system. In the cases where the combined estimated installation and running costs of the clean / hybrid heating system are higher, owner-occupiers are exempt from the ban. The regulations in place do not mention a duration for this exemption. Denver City Council has implemented such a regulation banning the installation of natural gas furnaces and water heaters in new commercial and multi-occupancy buildings as part of its new building codes (Weiser, 2023). Additionally, they have earmarked $30 million in incentives to help building owners and homeowners install heat pumps instead.
Analysis of effectiveness and success
There is no published information available online on the effectiveness and / or success of these regulations. These regulations are rather recent, published in 2021 in Switzerland, 2023 in the USA and 2024 in the Netherlands. The Dutch regulation, which mandates a hybrid heat pump as the standard for residential heating, will be implemented from 2026. (Dutch Ministry of the Interior and Kingdom Relations, 2023)
Table 3: Measures considering high cost of work in the home
|
Country |
Name |
Exemption |
Impact and awareness |
|
Netherlands |
Hybrid heat pump standard |
Homes where installing a hybrid heating system would require too costly adjustments to the home affecting the payback period are exempt from the standard. (Dutch Ministry of the Interior and Kingdom Relations, 2023) |
No data published |
|
Switzerland |
Energy Act |
Climate-neutral heating system is mandatory only if it is technically possible and if the costs over the entire lifetime are no more than 5% higher than a new oil or gas heating system. |
No data published |
|
USA |
Building Code |
None mentioned but ban on natural gas furnaces is to be implemented in 2027. |
No data published |
Other exemptions: alternative clean heating considerations, location, age of residents and household composition
Overview
Our research uncovered two examples of regulations where an exemption was granted if an alternative clean heating system was already being implemented. This approach effectively ties compliance obligations to geographic location, making them dependent on local infrastructure rather than individual choice. As a result, whether a homeowner needs to adhere to these mandates becomes a matter of personal circumstance dictated by their residence’s location, which is typically a fixed factor unless the homeowner decides to move. This geographic-based exemption recognises the contributions of existing local initiatives and reduces redundancy in regulatory compliance.
These examples are both in the Netherlands, where gas-fired heating appliances were banned from all newbuild construction in 2018 and all replacement heating systems will need to meet a specific level of efficiency as per the standard for heating appliances implemented from 2026. The standard for heating appliances is a de facto ban on gas-fired heating appliances with the only alternative being hybrid systems and heat pumps. The Dutch Government grants exemptions to the construction of a new build development when green gas is used in the local and existing gas infrastructure, and if there is no alternative heating system available. From 2026, the Dutch Government plans to grant exemptions to the heating appliance efficiency standard only when homes are connected, or plan to be connected in the near future, to another alternative to natural gas, such as a heat network, to avoid duplication of costs.
Our research also uncovered a unique example of a regulation in Germany mandating all new heating system installations to be at least 65% renewable, effectively mandating hybrid systems or heat pumps. In addition to subsidies and wide-ranging transition periods applying to the whole population, this regulation includes an exemption for owner-occupiers aged 80 or older occupying a building of up to six properties, for new installations or replacement. There is no published explanation of the reasoning behind this exemption, however we understand it is meant to avoid any unnecessary stress and disruption on elderly people.
Analysis of effectiveness and success
The Dutch efficiency standard will be implemented from 2026 and thus can’t be assessed yet. However, we believe that the Dutch public is aware of this regulation as it attracted significant attention in the press and general media when it was voted on. Similarly, whilst the German building act is one of the most advanced clean heating legislations in Europe, there isn’t enough time to measure its impact since it was implemented in January 2024. The Dutch Gas Act has been implemented since 2018 and is estimated to support 1.5 million existing homes to change their heat source by 2030 (Cole, 2021).
Table 4: Other exemptions
|
Country |
Name |
Exemption |
Impact and awareness |
|
Netherlands |
Gaswet (Gas Act) |
Alternatives – includes exemptions when there is no alternative available, or when green gas is used in existing gas infrastructure. |
No data published. |
|
Netherlands |
Standard for heating appliances from 2026 (De facto ban of gas boilers) |
Alternatives – includes exemptions when homes are connected to another alternative to natural gas in the short term (heat network). |
No data published. |
|
Germany |
Gebaudesenergie-gesetz (Building Energy Act) |
Age – includes exemptions for owner-occupiers over 80 years of age who occupy a building with up to six flats. This exemption also applies to the replacement of storey heating systems for flat owners over 80 years. |
No data published. |
Interview findings
The following sections provide an overview of the responses and comments from interviewees. Where similar responses have been made, information has been grouped together thematically where appropriate.
Country specific examples
Flanders are looking to introduce a decision tree of personal circumstances
One interviewee shared a proposed policy change that relates to the Energieprestatie legislation in Flanders (Propriétés Im mobilières (PIM), 2022). This regulation mandates that for all property sales from 2023 onwards, properties with an EPC of E or F must be renovated to a level D or better within five years of purchase. Failure to do so will result in a fine. However, the Flemish energy minister recently announced that people struggling to comply due to personal circumstances would not necessarily face a fine. The proposed solution is a decision tree that could include personal circumstances such as divorces, a death in the family or financial difficulties to determine whether it is reasonable that an owner occupier has not met the standard (Baert, 2024). The decision tree announcement has not yet been followed up by an official change to the regulation. Therefore, currently the requirement to meet the regulatory requirement applies to everyone.
The interviewee was asked to comment on potential parameters for the decision tree; they stressed that all comments are highly speculative. It is likely that the decision tree will be for an extension rather than exemption to the standard, such as allowing the owner occupier an additional five years. The government recognises the importance of homes all meeting the standard so it is unlikely that many people will be granted an extension. It is not yet clear how the Flemish government will define valid personal circumstances but losing a job is unlikely to qualify as there is funding available for those on low incomes. However, a terminal illness diagnosis or the death of a partner could potentially be considered valid.
British Columbia is not actively looking to include personal circumstances but do include other exemptions
British Columbia has some significant differences in terms of policy and housing heating systems. Exemptions only apply in cases where the physical house cannot accommodate the change, such as lack of floor space. The interviewee also stated that in emergency situations, such as a heating system breakdown, the government will not insist that the homeowner upgrades the system. In Vancouver, there is a regulation that mandates upgrades to low-carbon hot water heating systems. This regulation was described as ‘soft’ with minimal levels of enforcement for the first five years; the regulation comes into effect from 2024 (City of Vancouver, 2024). The expectation is that this will be tightened and more stringently enforced in the future, but the current focus is on early adopters. The interviewee recognised the potential benefit of including personal circumstances, particularly to allow extensions in emergency situations or for right to repair. However, there was also a concern that this would increase the administrative burden.
Additional findings from the interviews
Challenges getting people to make changes in their homes
Several interviewees commented on the challenge in getting both owner occupiers and landlords to make changes to their properties. One interviewee commented that smoke alarms are now obligatory in all properties in Scotland, but compliance has been challenging despite this being affordable and less invasive than some decarbonisation measures. There was an acknowledgement that some people will struggle to meet the standard and that this was valid, for example for elderly or disabled people, as associated disruption would be harder for these groups. Likely reasons for lack of engagement relate to a lack of trust and in some cases, insufficient funding or access to finance. It is vital that these barriers are addressed as a priority where possible, before introducing regulation that allows exemptions or extensions.
Concerns raised regarding including personal circumstances in regulation
Including personal circumstances could risk some residents being ‘left behind’ and missing out on the benefits of the energy transition due to decarbonisation measures not being completed. This could be due to a lack of financial support (or lack of awareness that this is available), lack of understanding of the benefits (such as a warmer home) or due to some stakeholders, such as landlords, using personal circumstances as a loophole to avoid undertaking work. This point was raised in several interviews. Several stakeholders stated that the priority should be engaging and supporting people to meet the decarbonisation standards as it will benefit them overall. In circumstances where the cost of doing the work is prohibitive more funding should be made available. One interviewee commented that if a person on a low income cannot stay in their home during the retrofit work, then the funding should also cover the cost of them temporarily staying somewhere else.
Personal circumstances may be a valid reason for not meeting the standard, but regulation is not necessarily the right tool
Several interviewees noted that vulnerable people, particularly elderly and disabled people, are often already known to social services and there is potential to rely on their assessment of someone’s personal circumstances as they are on the front line. In some countries, people are sometimes exempted from meeting energy efficiency regulation informally. In cases where someone has a terminal illness then a decision can be made on the ground not to enforce. The focus should be on making delivery work in practice and not just meeting the regulation. One interviewee commented that personal circumstances do not always fall under precise criteria, for example having no social support from friends or family may make someone more vulnerable but regulation will usually not include such criteria. Some retrofit programmes have not sufficiently considered how to work with socially diverse groups, which creates issues for delivery. Addressing this problem would support better delivery of regulations on the ground and lead to better overall outcomes, instead of focusing on top-down regulation.
Unclear how including personal circumstances would work in practice
There is a risk that including personal circumstances in regulations will be overly bureaucratic. There would need to be clarity on how people apply for exemption or extension and how personal circumstances are monitored to determine if they are still relevant. Personal circumstances can change quickly, so the regulations need to be able to respond dynamically in a way that is not restrictive. There is still a risk that things will become confusing and difficult to manage. There are already challenges with the current data levels on standards within the domestic sector that need to be improved to ensure an accurate picture on compliance. Improving the quality of the data would be necessary to manage any exemptions or extensions under personal circumstances. Additionally, there needs to be clarity on how to handle situations such as mixed tenancy blocks of flats where there may be different personal circumstances in each dwelling.
If personal circumstances are to be included in regulation this should be minimal
Three interviews highlighted that if personal circumstances were to be included, it should be cautiously. One stated that there could be a place for extensions but highlighted that there are still concerns related to managing this in practice. Another interviewee stated that any exemptions should be kept to a minimum as there was concern that this could be deliberately used to stop change. There is a risk that those with personal circumstances are assumed to be unable to act, which is not necessarily correct. Most people will be able to act and those that cannot, due to financial issues should be provided with support. Several interviewees stated that this should include appropriate levels of finance, including through banks and mortgages so people can make the necessary improvements to meet the standard.
Key findings: Personal circumstances in other decarbonisation regulations
In an effort to identify as many examples as possible of decarbonisation regulations including flexibility for personal circumstances, we widened the scope of our research to transport and housing-related decarbonisation regulations. A few cities across the UK have implemented is at the forefront of decarbonising individual transport in measures to reduce the number of polluting cars in city centres. The regulation sets a standard for vehicle emissions, and drivers need to pay a fee if their vehicle doesn’t meet the standard. London’s Ultra Low Emission Zone (ULEZ) has been extended in 2023 to cover all of London’s boroughs. (Transport for London, 2023) It provides exemptions for vehicles for disabled people, because they might not be able to use alternative transportation options. ULEZ regulation also provides for a fee reimbursement for National Health Service (NHS) patients driving to a point of care. The second example is a similar and more recent regulation in Edinburgh, which offers a few more exemptions for specific types of vehicles, including vehicles for people with disabilities as well as historic vehicles, showman’s vehicles, emergency and military vehicles. (Edinburgh Council, 2024)
Whilst these regulations provide examples of decarbonisation regulations including blanket exemptions, it is challenging to draw specific learnings for heating and energy efficiency decarbonisation, particularly as the exemptions included are tied to vehicle types.
Table 5: Personal circumstances in other decarbonisation regulation
|
Country |
Name |
Exemptions |
|
Edinburgh, Scotland |
Low Emission Zone |
The following vehicles / drivers are exempt: – vehicles for people with disabilities, including Blue Badge holders. – historic vehicles – showman’s vehicles – emergency vehicles – military vehicles |
|
London, England |
Ultra Low Emission Zone |
The following vehicles / drivers are exempt: – vehicles for disabled people. – NHS patient reimbursement. |
Conclusions
Key findings for regulation development
Income level
Most of the regulations identified in our research focused on addressing the impact of the energy transition on low-income households. Policymakers seem to be aware of the high costs of the transition and provide financial support under different forms, including grants, subsidies or low interest loans and tax deduction. The financial support is usually tied to specific energy efficiency objectives in the home, or the installation of a specific heating technology. Low-income households can get access to more funding to cover the incurred costs, up to 110% in Italy.
No financial support is provided to deal with the disruption resulting from the replacement of the heating system. The interviews identified this as an important gap in policy, as vulnerable people, particularly those with ongoing health conditions will likely need additional support, during work that is particularly disruptive.
High cost of work in the home
A few of the regulations identified in our research provided exemptions to owner-occupiers where the cost of installing a clean heating system was significantly higher than the cost of installing a fossil-fuelled heating system. Whilst these regulations consider the installation cost as well as the lifetime cost of the appliance, it remains challenging to assess the lifetime cost of a new appliance and without careful implementation and enforcement, there is a risk that this type of regulation could be exploited to justify the continued use of fossil-fuelled heating systems.
Other exemptions: alternative clean heating and age
A few of the regulations identified in our research provided exemptions from clean heat standards where homes had access to alternative clean heating technologies (e.g. heat networks) or when green gas is used in the gas network. Our research also found an example which exempted owner-occupiers over 80 years of age from replacing their heating system with a system that is at least 65% renewable, to avoid significant disruption.
Stakeholder opinions on the inclusion of personal circumstances
The interviewees primarily consisted of those who had never considered including personal circumstances within regulations or who were sceptical about how this would be beneficial. There were also questions raised regarding how effective this would be in helping vulnerable groups while balancing the needs of the energy transition. This included a lack of clarity regarding who the introduction of personal circumstances was intended to support and additional concerns regarding the process becoming overly bureaucratic. One interviewee noted that the potential disruption associated with installing decarbonisation upgrades could potentially be alleviated by providing temporary accommodation for vulnerable residents during the works.
Overall conclusion
Our overall research concluded that there are limited examples of regulations that include exemptions, extensions or abeyances based on personal circumstances. Our recommendation to the Scottish Government is that blanket exemptions are not suitable for this policy area as it risks excluding some members of society from the benefits of the energy transition. We found a limited number of regulatory examples that consider personal circumstances. This could be a suitable amendment to the regulation provided there is clarity on how exemptions would be managed over time and that does not become overly bureaucratic for residents.
We recommend that the Scottish Government continues to monitor the situation in Flanders, as new policy announcements may provide greater clarity on the proposed decision tree. We also recommend further consideration is given to the suggestion by one interviewee, to provide alternative accommodation for those on a low-income during upgrade works to their homes, which can be highly disruptive.
Priorities for further research activity
We have found that the Scottish Government appears to be considering the impact of upgrading residential home on vulnerable groups more than other countries. This is an important consideration to ensure the energy transition is fair and does not negatively affect vulnerable groups. However, should the Scottish Government seek to include personal circumstances within energy efficiency and clean heat regulations we recommend further research. This includes investigating more precisely which vulnerable groups are most likely to benefit from an exemption, extension or abeyance through stakeholder engagement. Additionally, greater clarity is required regarding what the needs of different vulnerable groups are to determine how the inclusion of personal circumstances within regulations would potentially benefit them. Finally, there is a need to identify the potential risks and possible negative unintended consequences associated with including personal circumstances before any policy amendments are made.
The introduction of personal circumstances has the potential to provide different levels of benefit for different groups that may struggle to meet the HiB Standard. There was significant discussion during the project, with interviewees, the Scottish Government and the project delivery team regarding who is most likely to benefit from the inclusion of personal circumstances in regulation. However, this was not the key focus of the research, so any conclusions regarding who is most likely to benefit is highly speculative. We have outlined our assumptions below, but these would require further research to be conclusive.
The three groups that could benefit from the inclusion of personal circumstances relate to the proposed trigger points for action from Scottish Government. These are outlined below:
- New owner-occupied properties: One of the proposed trigger points to meet the standard is the point of sale of a property. The benefit of including personal circumstances is likely to be low for this group, as they have already encountered disruption when moving. The current proposal is to allow a grace period of 2-5 years for this trigger point; therefore, additional disruption associated with meeting the standard would likely be well tolerated. One interviewee commented that when some vulnerable people, particularly older people, move to a new property, they often move to sheltered or social housing rather than into a privately owned home. This would reduce the benefit of including personal circumstances as such housing is covered by separate legislation.
- Tenants in the private rented sector: Another proposal is for landlords to meet the standard, regardless of the circumstances of their tenants. The potential benefit of including personal circumstances of tenants could be high, as vulnerable people in this group have less agency than those in owner-occupied properties. However, there is also a risk that by including personal circumstances, landlords may see this as a loophole to avoid making improvements on their property that would benefit their tenants. The uncertainty regarding the levels of disruption and potential unintended consequences for tenants would benefit from further research.
- Opportunity to connect to a heat network: A final proposed trigger point is a new district heat network. Residents would not be obligated to connect but would be expected to adopt an alternative clean heating solution instead if they do not. The benefit of including personal circumstances for this group could also be high, as any community or neighbourhood that connects to a heat network is likely to be composed of a range of residents, including vulnerable people.
References
Baert, D. (2024, February 16). Those who are unable to comply with their obligation to renovate do not necessarily have to fear fines. Retrieved from VRT News: https://www.vrt.be/vrtnws/nl/2024/02/16/wie-renovatieplicht-niet-kan-nakomen-hoeft-niet-noodzakelijk-ee/
Balmer, C., & Fonte, G. (2024, April 9). Explainer: Why Italy’s Superbonus blew a hole in state accounts. Reuters, p. Published online. Retrieved from https://www.reuters.com/world/europe/why-italys-superbonus-blew-hole-state-accounts-2024-04-09/
Carole-Anne Cornet. (2024, Mars 22). MaPrimeRenov’: montants, conditions 2024, travaux … Tout savoir. Retrieved from MoneyVox: https://www.moneyvox.fr/immobilier/maprimerenov.php
City of Vancouver. (2022, January). Zoning amendments to support the Climate Emergency Response. Retrieved from City of Vancouver: https://vancouver.ca/green-vancouver/zoning-amendments-to-support-climate-emergency.aspx
City of Vancouver. (2024, April). Domestic hot water: improving the efficiency hot water heaters at home. Retrieved from https://syc.vancouver.ca/projects/hot-water-at-home/improving-hot-water-heaters-efficiency-at-home-english.pdf
Cole, L. (2021, October 27). How the Netherlands is turning its back on natural gas. Retrieved from BBC: https://www.bbc.com/future/article/20211025-netherlands-the-end-of-europes-largest-gas-field
Department for Energy Security and Net Zero. (2023, March 30). Household Energy Efficiency, Statistical Realease, Great Britian, Data to December 2022. Retrieved from GOV.UK: https://assets.publishing.service.gov.uk/media/64230bbd3d885d000cdadd20/HEE_Stats_Detailed_Release_-_Mar_23.pdf
Dutch Ministry of the Interior and Kingdom Relations. (2023, May 01). Heat pump the norm from 2026: good for the climate and energy bills. Retrieved from Government of the Netherlands: https://www.rijksoverheid.nl/onderwerpen/energie-thuis/nieuws/2023/05/01/warmtepomp-de-norm-vanaf-2026-goed-voor-klimaat-en-de-energierekening
Dutch Ministry of the Interior and Kingdom Relations. (2023). Heat pump to heat many homes and other buildings from 2026. Retrieved from Government of the Netherlands: https://www.rijksoverheid.nl/onderwerpen/energie-thuis/warmtepomp
Edinburgh Council. (2024). Low Emission Zones (LEZ) exemptions. Retrieved from The City of Edinburgh Council: https://www.edinburgh.gov.uk/low-emission-zone/lez-exemptions#:~:text=Low%20Emission%20Zones%20%28LEZ%29%20exemptions%201%20Blue%20Badge,4%20Emergency%20vehicles%20…%205%20Military%20vehicles%20
Energy Systems Catapult (ESC). (2024, May). Electrification of Heat – Home Surveys and Install Report. Retrieved from https://es.catapult.org.uk/report/electrification-of-heat-home-surveys-and-install-report/
LCP Delta. (2023, June). International heat and energy efficiency policy review. Retrieved from https://www.climatexchange.org.uk/projects/international-heat-and-energy-efficiency-policy-review/
Lips, M., & Frei, E. (2021, December 6). Zurich voters approve new rules for effective climate protection in building sector. Retrieved from International Law Office: https://pestalozzilaw.com/media/publications/documents/ILO_Switzerland_Environment_Climate_Change_December_2021.PDF#:~:text=climate-neutral%20heating%20system%20is%20mandatory%20only%20if%20it,than%20a%20new%20oil%20or%20gas%20heating%20system.
Ministere de la Transition Ecologique. (2024, April 10). 5 EME PERIODE DES CEE, 2022-2025: Rapport annuel. Retrieved from Dispositif des Certificats d’économies d’énergie: https://www.ecologie.gouv.fr/dispositif-des-certificats-deconomies-denergie
Ministry of Climate and Environment. (2022, January 24). New part of the „Clean Air” programme – support of up to PLN 69 thousand. Retrieved from GOV.PL: https://www.gov.pl/web/climate/new-part-of-the-clean-air-programme–support-of-up-to-pln-69-thousand
Nationaal Warmtefonds. (2024). About the National Heat Fund. Retrieved from Nationaal Warmtefonds: https://www.warmtefonds.nl/over-ons
Nationaal Warmtefonds. (2024). Warmtefonds. Retrieved April 22, 2024, from https://www.warmtefonds.nl/
Propriétés Im mobilières (PIM). (2022, October). “Energieprestatie” (EPB): Flanders imposes work on buyers from 1 January 2023. Retrieved from https://www.pim.be/energieprestatie-epb-la-flandre-impose-des-travaux-aux-acheteurs-a-compter-du-1er-janvier-2023/
Republique Francaise. (2024). France Rénov’ : le bon réflexe pour rénover son logement. Retrieved April 22, 2024, from France Rénov’: https://france-renov.gouv.fr/
Scottish Government. (2021, October). Heat in Buildings Strategy – achieving net zero emissions in Scotland’s buildings. Retrieved from https://www.gov.scot/publications/heat-buildings-strategy-achieving-net-zero-emissions-scotlands-buildings/
Scottish Government. (2023, November). Delivering Net Zero for Scotland’s Buildings – Changing the way we heat our homes and buildings. A consultation on progress for a Heat in Buildings Bill. Retrieved from https://www.gov.scot/binaries/content/documents/govscot/publications/consultation-paper/2023/11/delivering-net-zero-scotlands-buildings-consultation-proposals-heat-buildings-bill/documents/delivering-net-zero-scotlands-buildings-consultation-proposals-hea
Scottish Government. (2024, February). Scottish House Condition Survey: 2022 Key Findings. Retrieved from https://www.gov.scot/publications/scottish-house-condition-survey-2022-key-findings/pages/2-energy-efficiency/
Statista. (2023, October). Cumulative number of energy efficiency projects applying for the superbonus in Italy from August 2021 to August 2023. Retrieved from Statista: https://www.statista.com/statistics/1417675/number-of-superbonus-energy-efficiency-projects-in-italy/#:~:text=By%20August%202023%2C%20the%20cumulative%20number%20of%20energy,superbonus%20program%20since%20its%20creation%20in%20July%202020.
Transport for London. (2023). Discounts and exemptions. Retrieved from Transport for London – Ultra Low Emission Zone: https://tfl.gov.uk/modes/driving/ultra-low-emission-zone/discounts-and-exemptions
Weiser, S. (2023, February 27). Denver imposes natural gas ban on heating, cooling equipment in commercial buildings, multi-family housing. Retrieved from The Denver Gazette: https://denvergazette.com/news/business/denver-imposes-natural-gas-ban-on-heating-cooling-equipment-in-commercial-buildings-multi-family-housing/article_e8a5352c-b6f1-11ed-b6f5-2bbe6c6ff924.html
Appendix
The full list of criteria collected for each regulation and included in database:
- Country / Region where the policy is in force
- Type of regulation such as a national strategy, subsidy, standard, tax, etc
- Level of governance: municipal, regional or national
- Implementing body within relevant country
- Topic area: energy efficiency, clean heat or both of these or transport
- Name of regulation/policy
- Date first introduced
- Regulation objective
- Regulation description
- Personal circumstances provision in the regulation
- Support available – Financial
- Support available – abeyances or exemptions
- Redress options available
- Criteria used for assessment
- Link to the regulation
- Link to relevant case study (if available)
© The University of Edinburgh, 2024
Prepared by LCP Delta on behalf of ClimateXChange, The University of Edinburgh. All rights reserved.
While every effort is made to ensure the information in this report is accurate, no legal responsibility is accepted for any errors, omissions or misleading statements. The views expressed represent those of the author(s), and do not necessarily represent those of the host institutions or funders.
The Scottish Government is committed to reducing emissions from homes and buildings. The 2023/2024 consultation on the Heat in Buildings (HiB) Bill proposed standards covering heating and energy efficiency that all existing buildings will be required to meet.
This report explores the data sources that could be used to develop a digital compliance monitoring system for the proposed standards. Through desk-based investigation and stakeholder interviews, the researchers identified public and private repositories of information regarding buildings, which could be used to carry out compliance monitoring for domestic and non-domestic properties.
Findings
- There is no digital dataset that combines data relevant to the HiB Standard that is highly accurate and with full coverage of all buildings in Scotland.
- An optimal digital solution in terms of coverage and accuracy could be achieved in the near term by combining data from different sources and enriching it with new data. Relevant data sources are discussed in the report.
- There is an opportunity for Scotland to develop a comprehensive central database looking at many aspects related to buildings and property, including building materials, fabric condition, and energy use.
If you require the report in an alternative format, such as a Word document, please contact info@climatexchange.org.uk or 0131 651 4783.
February 2024
DOI: http://dx.doi.org/10.7488/era/4856
Executive summary
The 2023/2024 consultation on the Heat in Buildings (HiB) Bill proposed standards covering heating and energy efficiency that all existing buildings will be required to meet. This report explores the data sources that could be used in future to develop a digital compliance monitoring system for those standards. The standards require:
- In all buildings, including non-domestic premises: non-polluting heating from 2045.
- In owner occupied homes: a minimum energy efficiency standard by the end of 2033.
- In privately rented homes: a minimum energy efficiency standard by the end of 2028.
- Those purchasing a property to comply with the prohibition on polluting heating within a specified amount of time following completion of the sale.
- Providing local authorities and the Scottish Ministers with powers to require buildings within a Heat Network Zone to end their use of polluting heating systems by a certain date and with a minimum notice period.
Compliance with the standards can be met through:
- The presence of a clean heating system, including connection to a heat network.
- Meeting the energy efficiency standard through either installing a list of measures or meeting a fabric energy efficiency rating of 120kWh/m2/year or less.
Compliance with the standard creates a need to check on the progress of Scotland’s buildings. This may require a dedicated system. Through desk-based investigation and stakeholder interviews, we identified public and private repositories of information regarding buildings, which could be used to carry out compliance monitoring for domestic and non-domestic properties.
Findings
We found no digital dataset (or database comprising various datasets) that combines data relevant to the HiB Standard that is highly accurate and with full coverage of all buildings in Scotland. For instance, only 55% of Scottish domestic dwellings have an assessed EPC created following a domestic energy assessment, as opposed to a prediction based on similar nearby properties. As a result, no existing dataset could readily be used for compliance monitoring.
Ultimately, reliable digital compliance monitoring can only be achieved with a high degree of accuracy of the data being inserted and coverage across the whole built environment in Scotland. Our findings include observations around the role of data governance, property identification, professionals and professional indemnity insurance, data consistency, archetype approaches, and data sharing.
Conclusions
We suggest that an optimal digital solution in terms of coverage and accuracy could be achieved in the near term by combining data from different sources and enriching it with new data. We identify below which datasets are relevant to various aspects of the Standard. This review is on the basis that current update points for EPCs remain the same and that the process is able to adapt and update sufficiently quickly to the new clean heating systems coming onto the market.
|
Aspect of compliance |
Data source |
Gap analysis |
|
Heat network zone presence |
|
|
|
Clean heating system |
|
|
|
Various energy efficiency measures applied to building fabric or services controls |
|
|
|
Fabric based heating demand of 120kWh/m2/year or less |
|
|
Table 1 Existing datasets that could be used to measure compliance
Considering the above, the following options may be considered by the Scottish Government for the establishment of a compliance and monitoring tool. Each option has advantages and drawbacks as well as a set of actions required to enable successful implementation.
Option 1: Use existing data sources in their current locations
- Option 1a: Homeowner reporting into existing locations – 3 to 6 months to develop
- Homeowners are required to self-report into these locations and upload evidence. Government looks individually at these data sources.
- The responsibility to demonstrate compliance rests with the homeowner, who must generate, gather and upload the relevant information to the data sources to demonstrate compliance to the government.
- Option 1b: Professional reporting into existing locations (status quo)
- Government looks individually at these data sources, which can only be updated by professionals.
- The responsibility to demonstrate compliance rests with the homeowner, who must pay for generating, gathering and uploading the relevant information to the data sources to demonstrate compliance to the government.
Option 2: Professional reporting from linked databases – 3 to 6 months to develop
- Data sources listed above remain in their current locations.
- Government looks at a single portal, which in turn looks at existing sources that can only be updated by professionals.
- The responsibility to assess compliance rests with the government and the responsibility to demonstrate compliance rests with homeowners or their professional consultants. The government creates a means of collating the data on a per-property basis via a new portal.
Option 3: Professional reporting into a new central database – 12 to 18 months to develop
- Data is moved from existing data sources to a new government-managed platform.
- Government manages a combined dataset that can only be updated by professionals.
- The responsibility to assess compliance rests with the government, and the responsibility to demonstrate compliance rests with homeowners or their professional consultants. The government creates a means of collating the data on a per property basis on this new platform.
Opportunities
We highlight an opportunity for Scotland to develop a comprehensive central database looking at many aspects related to buildings and property, including building materials, fabric condition, and energy use. While this is out of scope of this project, such a database could bring many benefits, such as increased building safety, simpler conveyancing, smoother statutory consent processes, fewer vacant homes, improved building condition, and more resilient property value. The EU and various member states are legislating on the introduction of property logbooks (also called “green building passports”) to constitute such datasets from the ground up, starting at property level. The list of database tools provided by the private sector in our study is testament to the market’s confidence in their potential to positively impact comfort, affordability, and the environment through the provision of digital logbooks.
Glossary of terms and abbreviations
|
DEA |
Domestic Energy Assessors |
|
EPC |
Energy Performance Certificate |
|
EPC Data |
The information gathered by a Domestic energy Assessor during a survey which is entered into RdSAP to produce an EPC. |
|
EST |
Energy Savings Trust |
|
HiBS |
Heat in Building Strategy October 2021. |
|
HiB Bill |
Proposals for a Bill by the Scottish Government – the consultation has now closed. |
|
HA |
Home Analytics. A database relating only to domestic properties founded on EPC Data and augmented using assumptions and algorithms. Core or foundational to several other databases reviewed. |
|
LHEES |
Local Heat and Energy Efficiency Strategy |
|
MCS |
The Microgeneration Certification Scheme Service (MSC) creates and maintains standards that allow for the certification of products, installers and their installations where those products produce electricity and heat from renewable sources. |
|
MPRN |
Meter Point Reference Number. This is the number that is used to identify the gas service at each property, meaning there is a unique MPRN for every single gas service in every building. |
|
PAS2035 |
A UK Government standard for domestic retrofit. It sets out the management and coordination of the process, rather than the technical standards required. |
|
PII |
Professional Indemnity Insurance |
|
Professional |
A consultant with recognised training, qualifications, PII, and code of ethics giving them an obligation to protect the public. |
|
QA |
Quality Assurance. The maintenance of a desired level of quality in a service or product, especially by means of attention to every stage of the process of delivery or production. |
|
RdSAP |
Reduced Data Standard Assessment Procedure. Software which models the energy efficiency of domestic premises. A simplified version of SAP. |
|
RICS |
Royal Institute of Chartered Surveyors. |
|
RLBA |
The Residential Logbook Association (RLBA) is the DLUCH supported trade association and self-regulatory body for companies providing digital logbooks for the residential property market. |
|
SG |
Scottish Government |
|
SAP |
Standard Assessment Procedure. A software tool for modelling the energy performance of buildings. |
|
UPRN |
Unique Property Reference Number. |
Background and context
Introduction
Following the Scottish Government’s Climate Change (Emissions Reduction Targets) (Scotland) Act 2019, new strategies and policies have been published to provide a framework for reducing the emissions from our homes and buildings. One such key document is the ‘Heat in Buildings Strategy’, which aims to support the decarbonisation and retrofitting of existing buildings. Further to the Strategy, a consultation ran between November 2023 and March 2024 with proposals for a Heat in Buildings (HiB) Bill, designed to provide new regulations for the improvement of energy efficiency and transition to clean heating systems in homes and buildings in Scotland. At local authority level, Local Heat and Energy Efficiency Strategies (LHEES) and Delivery Plans have been published to identify opportunities and target funding for decarbonised heat at local council level.
The Scottish Government wishes to explore a digital system to monitor compliance of existing buildings with the upcoming Heat in Buildings Standard to be established by the proposed Bill. This paper reviews existing digital data sources that the Scottish Government could draw on in developing a future monitoring regime.
Data in property and construction
The real estate industry started to adopt digital technology, such as spreadsheets and accounting software, throughout the 1980s as personal computing became more common (Reed, 2021). At the same time, it became possible to model building performance using computers, leading the Building Research Establishment (BRE) to develop the Standard Assessment Procedure for the Energy Rating of Dwellings (SAP), based on the BRE Domestic Energy Model (BREDEM) and published by BRE and the Department of the Environment in 1992. It has now been adopted by the UK Government and Scottish Government as the official methodology for calculating the energy performance of dwellings (Scottish Government, 2023).
This approach was drawn into international environmental legislation through the European Union’s Energy Performance of Buildings Directive (EPBD), first enacted in 2002, and updated in 2010, 2012, 2018 and 2024. This Directive called for standard assessment procedures to analyse the energy performance of buildings, standard data inputs and outputs, and a means of communicating the findings of this process to the public through what became Energy Performance Certificates (EPCs). EPCs use building energy models to communicate modelled energy efficiency in buildings, from bands A (highest energy efficiency) to band G (lowest energy efficiency). Given the varying definitions of ‘energy efficiency’, these bands have changed over the years.
Heat in Buildings (HiB) Strategy (2021)
The HiB Strategy, published by the Scottish Government in October 2021 “provides an update to the 2018 Energy Efficient Scotland Route Map and the 2015 Heat Policy Statement, and brings together [Scottish Government’s] ambitions on energy efficiency and heat decarbonisation into a single framework.” It calls for all owner-occupied homes to reach EPC C by 2033 and all private rented homes by 2028, although it acknowledges that the more difficult homes in mixed tenure or mixed ownership blocks, and non-domestic premises, may take until 2045 to achieve it. Public Buildings should have zero emission heating sources as soon as possible, with a backstop of 2038.
The Strategy further acknowledges challenges around these targets, suggesting that “where it is not technically feasible or cost-effective to achieve the equivalent to EPC C rating, (…) a minimum level of fabric energy performance through improvement to walls, roof, floor and windows, as recommended in the EPC, would apply.”
Heat in Buildings Bill consultation
In December 2023 the Scottish Government published a consultation (Scottish Government, 2023) on the proposed Heat in Buildings Bill.
The consultation included the following proposals:
- Prohibit the use of polluting heating systems after 2045 across all buildings.
- Require those purchasing a home or business premises to end their use of polluting heating systems within a fixed period following completion of the sale.
- Require homeowners to make sure that their homes meet a reasonable minimum energy efficiency standard by 2033 only where no clean heating system has been installed.
- Require private landlords to meet this minimum energy efficiency standard by 2028 regardless of whether a clean heating system has been installed.
- Require property owners to connect to a Heat Network when it comes available, or change to another form of clean-heating of their choice
We consider the elements below, present in the consultation, to be of particular relevance to the data requirements for a compliance system.
Section 2 states:
“We propose to set a minimum energy efficiency standard that can be met by installing a straightforward list of measures. This list of measures would be developed to prioritise those that could have the most impact for homes with the lowest amount of cost and disruption. Any homeowner who had installed these measures – or as many of them as are feasible for the type of home they live in – would be considered to have reached a good level of energy efficiency and meet the new standard.
We think this list could be:
- loft insulation
- cavity wall insulation
- draught-proofing
- heating controls
- 80 mm hot water cylinder insulation
- suspended floor insulation”
“Alongside this straightforward list of measures, we propose an alternative option of meeting the standard based on the result of an EPC assessment. We have recently consulted on the addition of a new fabric efficiency metric to EPCs, which could be used to show that a property meets a good level of energy efficiency.”
“Owner occupied homes that have ended their use of polluting heating by 2033 will not be required to meet the minimum energy efficiency standard.”
“Private rented properties would still be required to meet the minimum energy efficiency standard, however, even if a clean heating system had already been installed.”
“We are not proposing to set a minimum energy efficiency standard for non-domestic buildings.”
“While we are also not proposing to apply this Heat in Buildings Standard to the social rented sector, the sector will still be on the same pathway.”
Section 4 states:
“We are proposing that any buildings within a Heat Network Zone will not need to meet the Heat in Buildings Standard following a property purchase.”
Section 5 states:
“This consultation has described five points in time at which we may be asked to meet the Heat in Buildings Standard:
- at the end of a grace period which follows the completion of a property purchase;
- following notice from a local authority to a building owner in a Heat Network Zone that they are required to end their use of polluting heating;
- at the end of 2028, private landlords will need to have met the minimum energy efficiency standard;
- at the end of 2033, owner occupiers will need to have met the minimum energy efficiency standard; and
- at the end of 2045, all building owners will need to have ended their use of polluting heating.”
A definition of HiB Standard compliance
We used a definition of HiB Standard compliance against which to compare existing digital datasets, databases, and tools.
- Presence of a clean heating system i.e., a heating system which does not emit CO2 at point of use.
- This includes connection to a Heat Network.
- Being in a heat network zone means that the property does not need to meet the Heat in Buildings Standard following a property purchase.
- Installing a list of measures (alterations to the building) or meeting a fabric-based heating demand of 120kWh/m2/year or less (as modelled by approved software).
The opportunity for Scotland
Scotland’s differentiated legislative, regulatory and policy regime affords it the opportunity to determine its own approach with regards to energy and heat in buildings, though with certain limitations around control over the gas grid or product standards. Furthermore, the Scottish building stock is different to the wider U.K. stock, calling for a specific approach. More people live in flats (National Records of Scotland, 2023), (Office for National Statistics, 2023), construction is of a lower quality generally (BRE Trust, 2020), it has a larger social housing sector (Serin, et al., 2018), and the climate is more challenging. Furthermore, traditional tenements, post-war non-traditional construction, and the greater prevalence of timber kit construction in the late 20th century (PBC Today, 2022) are all unique features of the Scottish building stock.
The gap between the current state of Scottish housing and the expectations set by the HiB Bill will stimulate economic activity. This positions retrofit as a key area of potential growth in the labour market.
Mapping the current situation
Buildings
The HiB Strategy (Scottish Government, 2021) and Scottish House Condition Survey (Scottish Government) contain statistics about the built environment and the people and communities living in them.
- The total domestic building stock in Scotland comprises around 2.7m homes.
- Following their introduction in 2009, as of 2023 around 1.5 million domestic EPCs currently exist (55% of the building stock).
- Following their introduction in 2009, as of 2023 around 49,000 non-domestic EPCs currently exist (25% of the building stock).
- In 2022-2023 there were 101,055 residential property sales in Scotland (Registers of Scotland, 2023), leading to as many updates to the EPC register.
Building data holders
We drew up a list of organisations known to be maintaining databases associated with the built environment. Other organisations were added upon suggestion by interviewees.
All organisations were contacted via email with a letter of introduction from the Scottish Government about the research study. A series of standard questions were posed, which are listed in Appendix A.
The array of different datasets and tools for buildings and energy data included within this study can be categorised as follows:
- Public databases – owned, funded or managed on behalf of the government.
- Public data analysis tools – owned, funded or managed on behalf of the government.
- Private datasets and analysis tools – owned and funded by third parties.
A summary of all databases contacted as part of this study is provided in Annex A. The following tables summarise the findings. Where “-” is used, there was no comment given in the interview relating to this category.
Public databases only
|
Organisation |
Name/Title |
Geography |
Coverage |
HiB compliance data (EPC data and/or presence of measures) |
Contains data about energy? |
Data ownership |
|
Registers of Scotland |
Sasine Register |
Scotland |
Domestic |
NO |
NO |
Registers of Scotland |
|
Energy Saving Trust |
EPC Register |
Scotland |
Domestic Non-domestic |
YES |
YES |
Scot Govt |
|
National Records of Scotland |
Valuation Database |
Scotland |
Domestic |
NO |
NO |
National Records of Scotland |
|
Scottish Government |
Scottish House Condition Survey |
Scotland |
Domestic |
YES |
YES |
Scot Govt |
|
Registers of Scotland |
Scotlis |
Scotland |
Domestic Non-domestic |
NO |
NO |
Registers of Scotland |
|
BE-ST |
Scottish Construction Industry Data Dashboard |
Scotland |
Industry |
NO |
NO |
Public |
|
Scottish Government |
Improvement Service |
Scotland |
Domestic Non-domestic |
YES |
YES |
Scot Govt; Local Authorities |
Table 2 Summary of information in public databases
Detailed commentary on each is in Appendix B.
Public databases with data analysis tool
|
Organisation |
Name/Title |
Geography |
Coverage |
HiB compliance data (EPC data and/or measures) |
Contains data about energy? |
Data ownership |
|
Scottish Government |
Scotland Heat Map |
Scotland |
Domestic Non-domestic |
YES |
YES |
Scot Govt |
|
Scottish Energy Officers Network |
Public Sector Benchmarking |
Scotland |
Public Buildings |
NO |
YES |
Scot Govt |
|
Energy Savings Trust |
Home Analytics |
Scotland |
Domestic |
YES |
YES |
Scot Govt |
|
Energy Savings Trust |
Non-Domestic Analytics |
Scotland |
Non-domestic |
YES |
YES |
Scot Govt |
|
IRT Surveys |
DREam |
U.K. |
Domestic |
YES |
YES |
Local Authorities |
|
National Grid ESO |
National Grid ESO |
U.K. |
All |
NO |
YES |
National Grid |
|
DESNZ |
National Household Model |
U.K. |
Domestic |
NO |
YES |
UK Govt |
Table 3 Summary of information in public databases with data analysis tools
Detailed commentary on each is in Appendix C.
Private database or data analysis tool
|
Organisation |
Name/Title |
Geography |
Coverage |
HiB compliance data (EPC data and/or measures) |
Contains data about energy? |
Data ownership |
|
Kuppa |
Kuppa |
U.K. |
Domestic |
YES |
– |
– |
|
Zoopla |
Zoopla |
U.K. |
Domestic |
YES |
– |
– |
|
RoomAgree Ltd |
Shedyt |
England |
Domestic |
– |
YES |
Developer |
|
The National Deeds Depository |
The Property Logbook Company |
U.K. |
Domestic |
NO |
YES |
Homeowner |
|
Shepherds |
Single Survey |
Scotland |
Domestic |
YES |
NO |
Surveyor |
|
PropEco |
PropEco |
U.K. |
Domestic |
YES |
YES |
Mixed |
|
Chimni |
Chimni |
U.K. |
Domestic |
YES |
YES |
Homeowner |
|
Kamma Data |
Kamma Data |
U.K. |
Domestic |
– |
YES |
Mixed |
|
Novoville |
Shared Works |
U.K. |
Domestic |
YES |
YES |
Mixed |
|
Kestrix |
Kestrix |
U.K. |
Domestic |
NO |
YES |
Developer |
|
Trustmark |
PAS2035 Data Warehouse |
U.K. |
Domestic |
YES |
YES |
Trustmark |
|
Parity Projects |
Portfolio / Pathway |
U.K. |
Domestic |
YES |
YES |
Developer |
Table 4 Summary of private databases or data analysis tools
Detailed commentary on each is in Appendix D.
Information required for HiB monitoring
The compliance criteria noted in section 3.5 are cross-referenced below with the datasets and tools reviewed in Table 5.
We haven’t distinguished between data which is assumed, predicted, observed, or modelled. See Section 5 below for commentary on this distinction. The databases are primarily split into two categories:
- Those which contain EPC data (beyond the EPC band).
- This includes data about all elements of the building.
- EPC data is the basis of “Home Analytics”
- Home Analytics is itself the basis of several other databases (see Appendices B, C and D for details)
- Those that don’t contain EPC data beyond the EPC band.
The only public data set with data of a higher quality on the individual building elements than the EPC data is the Scottish House Condition Survey (SHCS). The SHCS data is based on a small sample set of the housing stock and then extrapolated over the whole stock to generate the associated report. This level of quality and accuracy is also present in “Single Survey” data, which is present for a much larger percentage of the stock, though this is held privately at present.
One of the few databases which provide centralised and accessible information about Heat Network Zones is the Scotland Heat Map, providing that Local Authority LHEES data has been uploaded to it.
|
Organisation |
Name/title |
EPC band |
EPC data |
Heat network zone |
Roof insulation |
Floor insulation |
Windows |
Air leakage |
Controls |
Hot water generation |
Clean heating system |
|
Registers of Scotland |
Sasine Register |
NO |
NO |
NO |
NO |
NO |
NO |
NO |
NO |
NO |
NO |
|
Energy Saving Trust |
EPC Register |
YES |
YES |
NO |
YES |
YES |
YES |
NO |
NO |
YES |
YES |
|
National Records of Scotland |
Valuation Database |
NO |
NO |
NO |
NO |
NO |
NO |
NO |
NO |
NO |
NO |
|
Scottish Government |
Scottish House Condition Survey |
NO |
NO |
NO |
YES |
YES |
YES |
NO |
YES |
YES |
YES |
|
Registers of Scotland |
Scotlis |
NO |
NO |
NO |
NO |
NO |
NO |
NO |
NO |
NO |
NO |
|
Scottish Government |
Improvement Service |
NO |
NO |
NO |
NO |
NO |
NO |
NO |
NO |
NO |
NO |
|
Scottish Energy Officers Network |
Public Sector Benchmarking |
NO |
? |
NO |
NO |
NO |
NO |
NO |
NO |
NO |
NO |
|
Energy Savings Trust |
Home Analytics |
YES |
YES |
NO |
YES |
YES |
YES |
YES |
YES |
YES |
YES |
|
Energy Savings Trust |
Non-Domestic Analytics |
YES |
YES |
NO |
YES |
YES |
YES |
YES |
YES |
YES |
YES |
|
IRT Surveys |
DREam |
YES |
YES |
NO |
YES |
YES |
YES |
YES |
YES |
YES |
YES |
|
National Grid ESO |
National Grid ESO |
NO |
NO |
NO |
NO |
NO |
NO |
NO |
NO |
NO |
NO |
|
Scottish Government |
Scotland Heat Map |
NO |
NO |
YES |
NO |
NO |
NO |
NO |
NO |
NO |
NO |
|
DESNZ |
National Household Model |
YES |
NO |
NO |
NO |
NO |
NO |
NO |
NO |
NO |
NO |
|
Trustmark |
PAS2035 Data Warehouse |
YES |
YES |
NO |
YES |
YES |
YES |
YES |
YES |
YES |
YES |
Table 5 Databases cross-referenced with HiB compliance criteria
Data sharing and transferability
Data is held by various organisations in a mix of structured and unstructured databases. Some of them are publicly or privately accessible via APIs. Some of them require the export of data in usual formats (CSV or XLS). Some of them do not have any built-in connections, but this could be created on demand. More problematic is the lack of a common framework for what the data means, different ownership of data, the lack of data sharing agreements, and the rights that individuals and organisations have to make it available to others.
While SAP (upon which the EPCs are based) provides a useful definition and structure for each element it looks at, enabling comparisons across buildings, this is not an exhaustive way of looking at and analysing buildings. These gaps, and the lack of a common standard, are quickly filled by other assessment methods created by trade bodies or organisations for their own purposes, which results in a fragmented, hardly interoperable, and ultimately unactionable data universe. For instance, while SAP determines floor area in a certain way, Royal Institution of Chartered Surveyors (RICS) determines it differently. While RICS or RIAS leave it up to Chartered Professionals to prioritise fabric interventions, SAP provides a proscriptive way. While PAS2035 provides a specific list of possible interventions, these are not used across the board in all retrofit assessment software available.
In short, there is no commonly agreed way of fully describing the characteristics, condition, and work required of all buildings. Work is underway in the private sector to address some of these gaps and differences. For instance, we are aware that a study group within the National Retrofit Hub is working on creating a data scheme suitable for domestic properties. Such a scheme could then be adopted by Residential Logbook Association (RLBA) members to standardise the way in which data is recorded and presented in their platforms. This work could further be integrated into the emerging Property Data Trust Framework being developed by the Open Property Data Association in order to standardise access to various data points. As a whole, this work could provide a standard for the description of buildings, increase interoperability of platforms and databases, and pave the way for faster rollout of retrofit measures. There is also currently a small project being funded by BE-ST to investigate the opportunity of a national buildings ‘domestic’ database.
Before data can truly be transferable, however, other issues need to be considered as part of this work. These include data ownership and data sharing consent mechanisms. For instance, some of the data which a homeowner could make use of in order to plan retrofit, such as Home Analytics, belongs to the Scottish Government, is held by the Energy Saving Trust and can only be accessed by request from local authorities or registered social landlords, but not homeowners. This creates a barrier to access information which ultimately relates to the property in the ownership of the person trying to access it. Similarly, Trustmark logs information covering all past government-funded interventions, but this information isn’t readily accessible to the homeowners. Access to this would allow homeowners to have precise and up to date information of their property’s heat and energy installations, and the potential for further work. For consumer access to such information to be possible, such as through the medium of a property logbook (also called “green building passport”), a trusted means of verifying the identity of the person requesting the data needs to be agreed upon by all parties.
Particular attention should be paid to the data ownership and sharing provisions of data held by third-parties on behalf of the government. The study team recognises the commercial incentives that organisations holding data on behalf of the government have to restrict, and in some cases charge for, access to data which is in public (government) ownership. A review of the government’s data sharing agreements with third-party organisations holding data on its behalf could be conducted to ensure that:
- publicly-owned data can be made available to appropriate persons and organisations (such as the householder or their consultants);
- publicly-owned data is not privatised;
- only modelled data derived from third party organisations’ own investment and Intellectual Property can be commercialised.
Summary of existing energy & building data landscape
Our review showed that there is no single existing source of data which could readily be used as a compliance and monitoring tool for the Scottish Government for the aspects of building construction and performance set out in the HiB Bill consultation. The existing data landscape described above is patchy in its coverage, with even the most comprehensive data set (Domestic EPCs) covering just over 50% of the stock to which it applies[1]. Some databases, such as EPCs, have the potential to contribute an important proportion of the data required. However, they suffer from issues which preclude their wholesale adoption for the purpose of compliance and monitoring.
Furthermore, while the structure of EPC data is consistent, there are variations in the structure, unit of measurement and phraseology of the other data points gathered, held, and processed in other databases which could all be complimentary if this issue were resolved.
Two of the databases listed above – the Scotland Heat Map and the National Grid – bring together complementary datasets to provide a more holistic picture of the decarbonisation potential of building heat sources, but it is hard to use them for HiB compliance as they present data for groups of buildings, rather than individual buildings.
In conclusion, any solution for the monitoring and tracking of the HiB compliance will have to draw on several datasets and be enriched with additional data to close gaps where modelled/assumed data is currently relied upon.
Observations
The following section contains our more detailed observations of the datasets outlined in summary above in more detail with commentary arranged by topic.
Indexing
Accessing information about a given property across multiple databases would require searching indexed data according to a single unique identifier for the property.
There are several ways in which properties in the UK have been identified. These include Property Title numbers, Unique Property Reference Numbers (UPRN), Meter Point Reference Numbers (MPRN), and Postal Addresses. Unfortunately, these aren’t immediately usable: Property Titles can relate to more than one dwelling, UPRNs aren’t present for every building in the UK, MPRNs can relate to multiple properties at once, and Postal Addresses have multiple formats. A breakdown of the strengths and drawbacks of various identifiers is in Appendix E.
Heat network zones
The HiB Bill consultation refers to the Local Heat and Energy Efficiency Strategies (LHEES) published by each Local Authority. Each LHEES identifies potential Heat Network Zones, areas where a heat network appears to be viable. LHEES are to be updated every 5 years. The second round of LHEES will take into account designated heat network zones. Some LHEES data on Heat Network Zones is being uploaded to the Scottish Heat Map. The Scottish Government will update the Heat Map data and Local Authorities will report any inaccuracies/ ad hoc updates, making use of the Heat Map’s GIS framework to make them interactive and usable.
Given the high priority the HiB Bill consultation gives Heat Network Zones, knowing whether a property is in a Zone or not is a key piece of information for compliance monitoring. Having all LHEES potential heat network zone data and designated Heat Network Zone data digitised and accessible would provide a key plank of the SG monitoring and compliance framework. Potential zone data isn’t vital for compliance – but could help to communicate where zones might soon be.
EPCs, RdSAP, Home Analytics
Domestic buildings must have an Energy Performance Certificate (EPC) created on construction, sale, or lease (or marketing thereof). An EPC must be created through an approved modelling methodology called SAP, or RdSAP in its simplified version. The certificate must be lodged on a public register, which in Scotland is administered on behalf of the Scottish Government by the Energy Saving Trust (EST).
The base data that is collected and used for creating EPCs (EPC data) is collated and owned by the Scottish Government. This data is then enriched with socio-economic and spatial indicators, such as Local Authority Ward, topographical information, Scottish Index of Multiple Deprivation, and other indicators to create a data set called “Home Analytics” (HA). Predictive modelling is then used to:
- Close the gaps: of the 2.7m homes in Scotland, only around 1.5m of them have EPCs. To get a Scotland-wide picture, HA predicts EPCs using the EPCs of nearby properties.
- Identify decarbonisation opportunities. By looking at several other simple datasets (e.g., orientation, typology, nearby land) it can suggest measures which might be viable for each property (such as the installation of a wind turbine, or solar panels).
Where data has been assumed, or predicted based on an algorithm, confidence ratings applied to show that these data points were not produced via observation by an energy assessor. 100% confidence is given to original information, and lower ratings for derivative or modelled information. Home Analytics is available to public sector organisations and their subcontractors for specific projects.
Due in part to difficulties in accessing the Home Analytics dataset, many of the organisations we spoke to have constructed their own database based on the public EPC register, augmented by combining with various other data sources to generate more informed conclusions about either the country-wide picture, or smaller zones of stock.
Non-domestic analytics
Non-domestic buildings also must have an EPC on construction, sale or lease, or marketing thereof. SBEM or an approved Dynamic Simulation Model (DSM) can be used to produce the EPCs. In the same way as domestic EPCs, the input and output data is owned by the Scottish Government and is managed by EST. Our research did not extend into the non-domestic analytics database. However, from discussion with interviewees the study team were informed that the non-domestic analytics database contains less observed data, and more modelling than HA (due to bigger variance in non-domestic buildings).
Public Buildings Standards
Having spoken to several key managers within the public building portfolios sector, we found that the energy performance data held by the public sector about their buildings is variable and incomplete.
Scottish Futures Trust (an executive non-departmental public body of the Scottish Government, established to improve public infrastructure investment) are now onto the second revision of their Net Zero Public Buildings Standard, which “helps public bodies define objectives for their new or retrofit construction project in pursuit of a credible path to net zero operational energy”.
As noted above, HiB notes the target for public buildings is to have clean heating systems first and foremost, with achieving a broader level of energy efficiency a further implicit means of improving the efficiency of said heating system. Given this, the target for this stock may be purely to decarbonise heating systems.
PAS2035 and Trustmark
PAS2035 is the UK Government specification for the retrofit of domestic buildings. It establishes a complete process, creates new roles and responsibilities, and brings in checks and balances which aim to avoid the pitfalls of previous Government-funded home energy efficiency investments. It is currently mandated where the “ECO” funding stream is used for projects, and some public sector bodies in England and Wales mandate it for works funded by other streams. From the study team’s experience, standard PAS2035 practice relies heavily on EPCs as the tool to determine the energy efficiency of buildings before and after any work.
Trustmark is the organisation tasked with applying quality assurance (QA) to the PAS2035 process. A key element of this quality assurance is that installation data should be uploaded to a Trustmark-managed ‘data warehouse’ at the end of a PAS2035-compliant project. This data comprises the wider QA documentation generated, such as “before and after” EPCs, photographs, reports, drawings, and specifications.
The Scottish Government, and the wider construction industry in Scotland, have been debating the role of PAS2035 in retrofit activity for several years. As of the date of this study, there appears to be a mixed response to increasing use of the PAS2035 standard for retrofit work, in part due to the higher cost implications. This may be discounting the benefits of record-keeping and post-installation data lodging aspects which PAS2035 brings.
Trustmark notes that the data is considered publicly owned, and consequently private commercial organisations cannot easily access it, despite ongoing explorations into how to expose more of it. They also note that the vast majority of what is held relates to properties in England, given the small number of PAS2035 projects carried out in Scotland. Trustmark reported that only around 600,000 properties (2% of UK 27 million existing homes) have data lodged in the ‘data warehouse’.
Microgeneration Certification Scheme (MCS)
The MCS is a quality assurance scheme for small renewable energy, heat pump and Photovoltaic (PV) cell installations. It was created to improve the quality of work carried out by having a defined list of approved installers, and a methodology to track such installations. It was implemented by the UK Government from 2011 onwards. MCS requires registration of installers, standard methods of generating specifications and quotes, and guarantees for equipment installed and after-sales care. The documentation of each system installed is lodged with MCS and held centrally.
Lead vs lag
Many databases comprise data for buildings which can be described as “historic” or “stale” (i.e., not recent). We refer to them as ‘lag’ data. Others use this historic data as inputs into models which suggest what measures individual buildings, groups of buildings, whole estates, or the national stock could benefit from. This second type of data is considered ‘lead’ data.
For the purposes of tracking compliance, the lag data sources are more useful because though they might be stale, they are not predicted, which implies a lower confidence. But this raises the question of the point at which the lag data gets updated. These data update points are described as “update points” below.
Property Logbooks / Building Passports
Two of the organisations we spoke to provide property logbooks (sometimes referred to as “building passports”). These software applications are emerging digital tools which provide a comprehensive digital record of the building’s past. Some of them comment on fabric condition, occupancy patterns, and provide a ‘roadmap’ for work to be undertaken to the building into the future. The advent of these digitised data repositories and improvement plans is something the focus of this paper (accessing and synthesising building databases) could leverage.
Two-way connections between building logbooks produced by private companies and nationwide databases, such as Home Analytics and Scotland’s Heat Map, could create a joined up, dynamic and holistic data environment about buildings, and have positive impacts extending beyond the current aims of the Heat in Buildings Bill.
The provision of property logbooks is now mandatory in France for newbuilds and retrofitted properties (Today’s Conveyancer, 2023). A European research project (DemoBLog) is contributing to the evidence that a holistic and digital approach to building data can accelerate reduced environmental impact of buildings (European Commission, 2023).
A Scottish equivalent is the recommendations of the Scottish Parliamentary Working Group on Tenement Maintenance and their proposal for five-yearly inspection reports. These documents would include Building Passport-level information on the mutual parts of tenements and be mandated by statute. To be useful in the context of HiB compliance, they would have to then be digitised and accessible.
Modelled vs measured
Measured or observed data comprises data captured in-situ and reported directly without processing. However, we found that very few properties have had an in-situ performance measurement, and that sample sizes would be too small to extrapolate to the whole stock, or even to archetypes. While this data can be relied upon to measure compliance, this data is incomplete (more measurements should be made) or stale/lag (which can be addressed by update points described below).
Where it hasn’t been possible to measure data in situ, chiefly due to the cost of surveying, tools have sought to model (or predict) data based on a variety of criteria, such as similar typologies nearby and assumed occupant behaviours. As noted above, this is a core component of Home Analytics, but it is also used in some of the private sector databases.
This distinction becomes complex as EPCs use observed data as an input, and then use software to model energy usage and fabric based heating demand, making them a hybrid of both.
Compliance monitoring relying on modelled/predicted data may lead to disputed findings where the approved modelling is shown to conflict with real-world observed measurements. For instance, should an RdSAP-based EPC state that fabric based heat demand is over 120kw/sqm/year, but measured heat demand proves to be lower, would the property be deemed to be in compliance? This is an important matter for an upcoming Bill to make clear, with consequences for a digital compliance monitoring system.
Update points
As noted above, EPCs are required by regulations:
- When a domestic or non-domestic building is built, sold, or leased (when advertised for such).
- As a condition of receiving funding, such as grants for energy improvement works (Home Energy Scotland, Business Energy Scotland, or Local Energy Scotland), or ECO (which requires PAS2035).
These update points allow for the refresh of data, which, over a period of months trickles all the way through to various datasets, including Home Analytics, and others. Having more update points, such as at any intervention listed in the Standard, would help measure compliance using existing datasets.
Several key triggers are noted in the HiB Bill consultation, including one focussing on the property’s purchase. The chances of the HIB trigger points, and the trigger points for updating the other databases, aligning in a reasonable time frame should be considered. For instance, if an EPC is updated on purchase to show that the building is not on a clean heating system, and then one is installed without an obligation to have a new EPC created, and then the Scottish Government checks for compliance, the record would show that the building does not comply.
Confidence and risk
Variation in data quality and the widespread use of modelling to produce apparently complete datasets has led to lack of trust from practitioners, who like to rely on their own measurements prior to providing retrofit advice. This has been a primary driver behind the UK and Scottish Government’s recent work to ‘improve’ or ‘enhance’ areas such as the process and content of EPCs (Scottish Government, 2023). Concern over data quality is not unique to the construction and property sectors. A challenge for the Scottish Government is how any existing data source can be used to check for compliance if the data is of potential uncertain provenance and fidelity.
The traditional construction and property sectors used a structure of insurances, professional qualifications, and codes of ethics to provide a quality assurance system for work with buildings. Where advice and design is concerned, this system relies on professional indemnity insurance backed up with chartered professionals such as architects, surveyors and engineers. These structures are notably absent from the energy efficiency and retrofit sector, which contributes to a lower level of trust in the sector by the public.
There is some quality assurance built into some of the datasets the study team reviewed. For example, Trustmark, via the Scheme Providers, carries out sampling of EPCs to check for compliance against the standard process for producing EPCs. Some private operators align and utilise British Standards quality assurance or data management certifications.
Energy focus
A significant number of the datasets reviewed are focused on energy (kWh/sq.m/year), rather than building fabric, or connection to a heat network zone. The reasons for this are varied, though perhaps linked to the prevalence of EPC bands as a primary focus in recent years. EPC data includes building fabric information, which can be used for HiB Standard monitoring and compliance, though this is not present where just the EPC band itself is used in a given database. From this we observe that the EPC data is more useful for monitoring and compliance than just the EPC band itself.
The future of EPCs
An obvious challenge to basing a compliance scheme on EPC data modelling is the ongoing initiatives in the public sector that could result in changes to the methodology and outputs of the EPC over the next few years. The Scottish Government refer to their ambition to improve the EPC in the HiB Bill consultation and recently consulted on a range of options. In parallel, the UK Government is looking to replace SAP with the Home Energy Model (HEM).
Self-certification
In researching compliance against the Heat in Buildings Standard we considered the potential approaches involving either self-declaration (relying solely on the building owner/occupant), or the role of existing compliance and check mechanisms.
Below we have outlined examples of self-certification compliance approaches:
The census: it is mandatory for everyone to complete the census. There are fines for not doing so, or for giving false information. There is not, as far as we’re aware, a process for checking the validity of information given by respondents to the census. However, there is no gain or loss to the person completing the census for the information they provide, and so there is no particular pressure to report any given way.
Building Standards: Building Standards (the control over building regulation consent in Scotland) requires drawings to be submitted showing how the proposed works meet the building regulations. A Building Warrant is issued, enabling the works to be built legally by the local authority when they deem the proposals meet the Building Regulations. At the end of the works, the client or their representative issues a Completion Certificate, self-certifying that the works meet the drawings consented as part of the warrant. The Local Authority does spot-checks on the works to confirm that this is the case, and, if satisfied, will issue an Acceptance of Completion Certificate.
SER: the Structural Engineers Register is a limited company appointed by the Scottish Government’s Building Standards Division to administer a scheme for Certification of Design (Building Structures). This is one of only two areas where self-certification is allowed. The scheme requires structural engineering firms and individual engineers to maintain registration with SER though qualifications and audits of their work. This allows them to sign off the structural design of buildings and avoid review by the local authority. The oversight of the scheme is stringent and the structural calculation assessments are checked by a separate engineer. For Section 6 of the Building Regulations (Energy), there is an online submission procedure administered by RIAS.
EPCs: Domestic Energy Assessors (DEAs) undergo a 3-day training course, submit photo evidence of their inspections, and are checked on a percentage of their assessments. They carry Professional Indemnity Insurance (PII), they have a code of practice administered through Trustmark, and are required to carry out Continual Professional Development (CPD). Their obligation is to run the RdSAP process correctly, but they are not responsible for the result of the EPC, or for the recommendations given by the EPC (which are generated by algorithm).
MOTs: In the case of motor vehicles, cars must have an MOT annually and hold a certificate stating they meet the checklist of performance indicators. Qualified test centres check this, for which there is a nominal charge. Any factors not in compliance are notified to the vehicle owner/user. Using a car which has failed to pass a MOT certificate means it is illegal to drive the vehicle.
Competent person: A “competent person” is required to carry out processes mandated by organisations like RICS, and this level of qualification is set out in the relevant professional standard. BS7913 sets best practices for work with historic buildings and establishes the role of a “competent person” and what qualifies a person as such. In both cases, funders or clients of work to which this competence relates require this standard to be met to enable them to fund the work.
Self-reporting
Self-reporting may be suitable for reporting compliance with the clean heating system mandate, with checks being carried out at purchase (such as the Building Warrant used for new build, or for existing buildings where the assessment is included within the pre-sale survey of the building). If a statement has been made that a clean heating source is present, but this is found not to be the case on sale by the Home Report Surveyor, then the sale value is likely to be affected and may fall foul of the Sale of Goods Act (1979).
Self-reporting is however more complex for the energy efficiency standard, as the definition of something seemingly simple, such as the loft-roll being compliant, varies from standard to standard. Questions arise, such as whether it is evenly installed, pushed into corners, whether there is a vapour control layer under it, whether it is dressed around the cold-water storage tank, etc. A further challenge is that not everyone is able to access the loft, or sufficiently computer-literate to use the digital systems. It is our recommendation that some form of survey by an assessor with some level of training and consumer protection could undertake this work.
The energy efficiency metric (kW/m2) is more complex still, as it requires training in how to use a dedicated piece of software, and how to reliably enter data to get consistent results. Again, we propose that a competent assessor is best placed to carry out this work
Finally, homeowners must seek advice on what alterations to make to a property to make it compliant. At present, the RdSAP EPC is very clear that the recommendations are suggestions, and not “advice” to be followed without further checks. This distinction frequently escapes the public, which could lead to widespread failure of retrofit to deliver reliable improvement. However, this is where an ‘archetypes approach’ for retrofit guidance could assist homeowners and property managers.
An advantage is that self-reporting can lead to wide societal engagement, and more education and agency over the task at hand.
The challenge with self-reporting is to incentivise individuals to do it and to make the process easy to comply with. The quality of self-reporting will vary. Like the census process, the questions being asked and the possible answers need to be precisely determined (such as using multiple choice answers). There is a risk of false reporting to gain advantage unless there is some policing/checking if the answers given will lead to any gain or loss.
Consultant reporting
The challenge with consultant reporting is that there are significant differences behind the designation of ‘consultant’, with training ranging from 3 days to 7 years. Some consultants have legally protected status, codes of ethics and some have a code of practice. Some carry PII, some don’t. PII only insures the advice given for a certain area of competence. For instance, a structural engineer’s PII will not pay out if the advice was given on non-structural matters. Both the PII and the confirmed area of competence are therefore important. Without PII and a defined area of competence, there is no consumer protection for the advice given by the consultant.
There are differentiations between different specialisms. We suggest it would be useful to conduct further research assessing how HiB Standard compliance could be conducted by different disciplines and roles, their areas of competence required, and requirements for PII.
Reporting should show confidence rating linked to the qualifications/ability/consumer protection of the person making the statement. Red/Amber/Green ratings are used by some, others (Home Analytics for example) used percentages.
Options to consider
This study suggests three main options that may be considered by the Scottish Government for the establishment of a digital compliance and monitoring tool.
Option 1: Use existing data sources in their current locations
Data sources remain in their current locations, with two options:
- Option 1a. Homeowners are required to self-report into these locations and upload evidence.
- Option 1b. Professional reporting into existing locations (status quo).
For both options, the responsibility to demonstrate compliance rests with the homeowner with either self-reporting or professionals reporting.
Advantages
- Requires little investment from the government.
Drawbacks
- Would likely be difficult for homeowners due to the complexities of the Standard and the need to look for information in various places.
- It may be long-winded for owners who are not familiar with digital technology.
- Reduced consistency if homeowner reporting, rather than a professional with PII.
Requirements
- Create “how-to” guides to help homeowners understand where they can gather the information.
- Ensure that the appropriate data sharing mechanisms and identity verification mechanisms are in place so that information can be queried from data holders by homeowners.
- Ensure that non-digital means of accessing the information are available.
- Identify opportunities for market to engage; district heating providers to broker connections between public/commercial anchor load buildings and homes in heat zones, clean heat system providers provide support apps/websites, surveyors promote building assessment services.
Option 2: Professional reporting from linked databases
Data remains in its current locations. Government looks at a single portal, which in turn looks at existing sources. The responsibility to assess compliance could rest with the government or homeowners, but the government must first create a means of collating the relevant information on a per property basis.
Advantages
- Saves homeowners’ time.
- Gives the government a more comprehensive picture of any property in the country.
- Makes property data more actionable and consistent in reporting
- Public facing online data input platforms already exist, with confidence ratings, allowing self-monitoring at the front end. Back-end data logging to be linked by unique identifier.
- Consumer protection and consistency of data due to presence of PII.
Drawbacks
- Requires more technical investment from the government
- Medium risk to privacy infringements
Requirements
- Create or generalise the use a unique identifier per property
- Create more data update points
- Create or use an existing data nomenclature and phraseology
- Review and update existing data sharing agreements with relevant data holders
- Create APIs to enable data transfer
- Create a public facing ‘check if your building is compliant’ government portal such as Check vehicle tax
Option 3: Professional reporting into a new central database
Data is moved from existing data sources to a new government-managed platform. The responsibility to assess compliance could rest with the government or the homeowners, but the government must first gather all relevant information on all properties in a new data holding structure.
Advantages
- Saves homeowners’ time
- Gives the government a complete picture of every property in the country
- Makes property data more actionable and enhances consistency of reporting.
- Provides country-level insights on all property and energy needs
- Enables more modelling and place-based answers to decarbonisation needs.
- Consumer protection and consistency of data due to presence of PII
Drawbacks
- Requires significant government investment
- Could be construed as government overreach
- Existing data custodians could offer pushback
- Might slow down innovation if human resources are not devoted to exploiting data
- Higher risk to privacy infringements.
Requirements
- Create or generalise the use of an unique identifier per property
- Create a public facing ‘check if your building is compliant’ government portal such as Check vehicle tax
- Create more data update points
- Create or use an existing data nomenclature and phraseology
- Create technical infrastructure required to hold data
- Terminate existing data sharing agreements with relevant data holders and organise data handover
- Either create APIs to enable data transfer between existing data custodians and the government, or change the data lodging mechanisms to feed in directly into the government data lake
- Create a frontend dashboard to query information from all databases at once
- Identify opportunities to exploit data strategically.
Further Key Considerations
The following points should be considered alongside the options set out above.
Data governance
The industry suffers from a lack of commonly agreed standards and procedures which would allow data to flow between organisations and databases. While there exists virtually no technical difficulty in moving data across platforms, the legal basis for this, the format of the data, and the necessary safeguards in terms of data ownership, are absent.
This lack of such a data governance framework is a significant hurdle to the emergence of the retrofit industry, and ultimately, the decarbonisation agenda. To fill the gap, private sector actors have been forming associations and trade bodies, to formulate answers to these issues, such as the Open Property Data Association or Residential Logbooks Association. Our view based on our research and experience is that for real progress to be made, governments will need to take ownership of the data governance issue and standardisation of process and reporting structure, participate in industry work, and eventually endorse the outcomes of this work, as was done when the UK Government endorsed the SAP methodology for assessing buildings.
In general, providing that the ownership of a given property can be proven (such as through the Property Data Trust Framework), publicly-owned information about a property should be available free of charge to that property’s owner, and their consultants.
Identifying and indexing
There is currently no comprehensive way to identify every structure considered a separate building in Scotland. Several possibilities exist. UPRN would be a good way forward for domestic properties compliance, but less so for non-domestic buildings. A separate piece of work is required to find a way to identify and index all buildings to which the Standard and associated monitoring and compliance checking will apply.
Archetype approaches
An exercise to analyse how archetype approaches and interventions could support a compliance methodology may be useful, considering the high number of house and apartment types within an archetype construction (e.g., tenements, timber frame, no fines). Studies and reports have cited archetypes approaches [ (ZEST Taskforce, 2021), (Smith, 2021), (Bros-Williamson & Smith, 2024)] to retrofit, and archetype-specific list of measures to be applied to demonstrate compliance aligned to a specific EPC band.
Common Scheme Standardisation / nomenclature
A significant piece of work would be required to ensure that, once a building identifier has been produced, the data attached to this identifier is labelled according to a nomenclature shared across the industry. The work required would involve:
- Determining a common format in which input data pertinent to retrofit objectives can be collected to enable interoperability, transfer and actionability regardless of provenance and destination.
- Determining a common format for output data reflecting the resulting programme of works.
- Encouraging any relevant organisation to adopt the standard, starting with property logbook providers.
- Working with governments to publicise the scheme and insert it within the Property Data Trust Framework.
Data access and data sharing
Building data is the fundamental building block on which national retrofit efforts are planned and delivered. Without easy access to publicly-owned information about their property, homeowners may delay their investigations and home improvements. Without free access to publicly-owned information about their property, homeowners could be made to finance organisations that have no ownership of this data. The study team believes that a strict distinction should be made between publicly-owned and privately-owned data, and that the former be made readily available to appropriate persons.
Beyond operational energy
The primary emphasis of the HiB Bill consultation centres on promoting clean heating systems, such as heat networks or individual building systems powered by clean electricity, and on fabric improvements. The focus on building fabric does not include comment on the condition of the building, which is a factor of fabric performance. Factoring condition into the HiB Standard, on top of monitoring and compliance, could provide an opportunity to address the condition of the nation’s building stock as part of the retrofit agenda. We suggest that broadening the approach to compliance and monitoring to encompass building condition could offer an opportunity for synergistic improvement to fabric and energy and underpin a future legacy of a pan-Scotland built environment approach.
Appendices
Question List/Appendix A
|
Data Field |
Description of question |
|
Organisation |
name of the organisation interviewed. |
|
Name |
the name of the database or initiative. |
|
Status |
the status of the conversation with the organisation, whether they have been contacted, interviewed, |
|
Organisation ownership |
public or private, or a mix. |
|
Geography |
Geography covered by the data |
|
Description |
Description of the database |
|
Energy coverage |
whether the database includes energy data. |
|
Content |
a brief description of the content of the database. |
|
Data ownership |
who owns the data in the database. |
|
Access control |
who controls access to the database. |
|
Coverage |
what facets of the building the database covers. |
|
Gaps |
what gaps are acknowledged to be present in the data, from the perspective of its use as a HiBs compliance tool. |
|
Connections |
how the data can be exported/imported. |
|
Use |
the use of the data. |
|
Users |
the organisations, individuals or sectors who currently use the data. |
|
Cost |
the charging model, if any, for accessing the data. |
|
Contact name |
the name of the person responsible for the data. |
|
Contact details |
Contact details for the person responsible for the data. |
|
Link |
for any online interface or website for the database. |
Table 6 Areas of discussion with database owners
Detailed commentary to section 4.3/Appendix B
Sasine Register. Not spoken to. Information in the study is from publicly available data on what the register does.
EPC Register. The EPC register is a database of all EPCs created for domestic and non-domestic buildings in Scotland. It is managed by the Energy Savings Trust.
Valuation Database. Not spoken to. Information in the study is from publicly available data on what the Database does.
Scottish House Condition Survey. This is a subset of the Scottish Household Survey who survey 10,000 households a year, asking a huge range of demographic questions (age, disabilities, activities, etc.). They then re-survey 3,000 dwellings with a physical inspector (assessor, architect), who do a full physical survey, recording everything about the house in terms of energy efficiency (fuel, central heating, insulation, age and efficiency of boiler) and things like disrepair. The selection of buildings is intentionally representative of the wider housing stock.
Scotlis. The land register can be used to find property prices, view boundaries on a map, check if land or property is on the land register, and identify who owns the property. Not spoken to. Information in the study is from publicly available data on what the register does.
PAS2035 Data Warehouse. Trustmark hosts retrofit lodgement data (PAS2035) for buildings that have been retrofitted under government funded retrofit schemes. This includes information about the retrofit work done. Each home is lodged individually. Trustmark’s key role is quality assurance, so they test a sample of these installations using a risk-based approach for desktop and on-site audit using the information uploaded to the data warehouse.
Detailed commentary to section 4.4/Appendix C
Scotland Heat Map. It is a GIS tool, a collection of datasets, that primarily Local Authorities use to check for demand for heat, to help introduce policies to reduce CO2 from heat production. Are areas suitable for heat networks. It is one of the core datasets in LHEES. At the moment some Local Authority LHEES are being uploaded to it. It’s about bringing data together in a spatial way. The main metric is heat demand metrics generated from a range of sources. Based on UPRN, they have a strong relationship with the Ordnance Survey. Uses a layered approach, footprint on an OS map, and applying energy benchmarks. Different sources of subjective reliability. Indicative tool bringing together data generated for other purposes, have to make some gross assumptions based on not much information. It answers the question: does this area look promising for heat networks?
Improvement Service. This is a data sharing portal. It helps Local Authorities make data useable, standardised, and actionable. Their first big project was to put some order to the property address dataset.
Public Sector Benchmarking. They have performed energy benchmarking analysis for Scottish Public Sector assets. It shows data for a “typical” building of that type to compare against “best practice”. Public sector building managers can then compare their building to that. The point of this document was always to do comparisons. Highland Council have taken this data and analysed the whole estate and made the data public but that is yet to happen elsewhere.
Home Analytics. It’s an address level database with information on all properties in Scotland ranging from building characteristics to heating systems based on the RdSAP input and output data from domestic EPCs. It contains more or less half of all buildings as survey data and uses algorithms to create assumed EPCs for those which don’t exist. It is indexed by UPRN (which is produced by Ordnance Survey). Installations which require a new EPC due to funding rules will lead to this data ending up in Home Analytics, which is uploaded/updated every 6 months.
Non-Domestic Analytics. The EST team who run this were not spoken to, so the data in our report is based on publicly available information about non-domestic analytics. Like Home Analytics but for non-domestic buildings. It contains everything Home Analytics does, except there is less modelling behind it. Fewer non-domestic properties have an EPC, so there are more unknowns. Big exception is access.
DREam. Home analytics data augmented with IR survey results and asset management data provided by a private company IRT. The dataset remains the property of the Local Authority or RSL commissioning the study.
National Grid ESO. This tool cross-compares other datasets to provide long term energy forecasting for domestic and non-domestic demands, and potential opportunities as the nation decarbonises.
National Household Model. Not interviewed.
Detailed commentary to section 4.5/Appendix D
Kuppa. A modelling tool for options appraisal: “Kuppa gives you a holistic view of a home’s energy performance, now, and how it could be in the future.”
Zoopla. Not interviewed.
National Buildings Database. Emergency services and safety data, edging into climate resilience currently under development by Edinburgh University and others.
Shedyt. Shedyt is a digital homeowner manual which exists to simplify property management for occupiers in collaboration with a marketplace of real estate experts, starting with residential property developers. It’s a tech company first and foremost, offering a marketplace. They match property developers to the people who sell to them. When a newbuild goes up, everything is specced up: the aim is to not throw this away. Long term ambition being to help the occupier down the line. Up to now, the data wasn’t captured for the benefit of the homeowner, but only themselves & legislation. The idea is to offer one place to manage your home idea.
The Property Logbook Company. Their business came from the legal side of use cases. In 2003 the land registry went from analogue to electronic titles. All the analogue documents become irrelevant when things went digital. Going digital has actually slowed down conveyancing. PLC suggested making “the big warehouse” digital to overcome that – for the lawyer, it provided the certainty that a document existed. It’s a digital interpretation of a very analogue process. PLC built B2B business which the consumer accessed whenever they bought and sold properties. The homeowner has access to the system. When they put new windows in, for example, they can upload the document to evidence this
Single Survey. The single survey is a condition survey presented in a legislatively mandated format, standardised for all homes transacted in Scotland. The data gathering and report production is by proprietary software created by the individual providers. Quest (owned by Landmark) have a database. OneSurvey, in Scotland, is controlled by Allied Surveyors. MovMachine in Edinburgh (ESPC) is used as CRM. SurvPoint is used by Shepherds is also used as CRM and Project Management platform. Quest is £12/use. The data is owned by the surveying firm. Information gathered is given to Rightmove, Zoopla etc. this information could’ve been collated centrally, but RICS didn’t proceed with the idea. The richer data is in the Surveyor’s notes, but that’s difficult to access. It could be possible to strip out the condition codes from the online databases. Postal address is key identifier.
PropEco. Futureproofing home with advanced data and analytics
Chimni. A property logbook company. Secure digital record of all transactions (conveyancing), maintenance, DIY and certifications (such as connectivity with EPC register), Trustmark supporting retrofit. They provide an additional group of APIs which allows a homeowner to access the info that sits in the Trustmark Data Warehouse. Their aim is building API certifications with as many places as possible.
Kamma Data. Originally a geospatial map company. The first thing they do is attach UPRN to addresses. Their end product is data. They note that property data is poor quality, with no proper framework and thus inconsistent. They’ve built a machine learning module which helps match properties together and build a profile for property. They have a retrofit automation tool which takes pricing data and data from the national grid to make recommendations, making it an optimisation engine.
Novoville Shared Works. A property logbook/building passport looking at people, property and its constituent elements. Structured around RICS, RIBA and GFI frameworks for data and cross-compatible with RdSAP data structures, Shared Works can connect to thermal modelling engines such as Scene to provide retrofit optioneering to build a plan which is then audited by a construction professional such as an architect or surveyor. The Shared Works Building Passport can be looked at alongside other to form buying communities and so create community groups and cost efficiencies.
Kestrix. Similar to IRT’s DREam but coming at it from different direction. Kestrix’s premise is scalability of IR to the building energy efficiency market, and once scaled to work towards accuracy. The lack of accurate actionable data is the challenge they’re trying to solve. Their tool captures vision and thermal imagery to build 3D models. Their goal is to get to U Values from IR. They aim to create a more accurate than EPC building physics model to leverage and make retrofit recommendations for portfolio. The imagery is aerial, oblique shot from drones, thermal imagery shot at night, private mode right now, project based. They outsource the drone work. They are a software company.
Property Identifier Commentary/Appendix E
UPRNs
Of all the above, the Unique Property Reference Numbers (UPRNs) appear as the best way of identifying private residential buildings. This is because they are already used in many of the datasets reviewed, they are unique, and supported by the Ordnance Survey.
For those working with non-domestic buildings where different buildings may all reside on one campus, UPRNs were deemed insufficient by some of the interviewees since several buildings will share one UPRN yet may be very different.
Property Title Numbers
When HM Land Registry register a property, they give it a unique reference called a title number and prepare both a register and, in most cases, a title plan. Like the UPRN, this is connected to the legal property, and so would be the same for individual structures all on the same legal title and therefore present shortcomings when dealing with some non-domestic buildings.
MPRN
MPRNs act as unique identifiers for the gas meter in each building. However, with the ongoing decarbonisation of homes and considering the 16% of the Scottish housing stock not connected to the gas grid, the use of MPRNs related to gas would not provide adequate coverage and might over time become a redundant identifier.
MPAN
A meter point access number (MPAN) is used for electric meters in buildings. As with MPRNs, these identifiers are not suitable, as some buildings have several meters, and some meters serve more than one building.
VOA
In December 2023 the Dept for Net Zero and Energy Security established a research project to develop a National Buildings Database (commencing with non-domestic buildings). One of the potential identifier codes for each building that may be used is the Valuation Office Agency (VOA) registration for each building. The Property Details dataset was introduced in the 1970s and was originally known as the Dwelling House Coding guide. Its original purpose was to provide a simple system for understanding the main features and attributes of a property. VOA datasets do not contain information about individuals or households. The information VOA collects and holds about domestic properties supports statutory functions for valuation and maintenance of Council Tax lists under the Local Government Finance Act 1992. It’s the statutory requirement of VOA to maintain accurate valuation lists for Council Tax. However, VOA only collects data needed to place an accurate band on the property.
As council tax is operated separately in Scotland and given the separate laws and regulations for Scotland’s property, it may be useful to determine if there is a Scottish equivalent identifying code which could be utilised as part of the monitoring and tracking of HiBs.
Outside of Britain
Unique Building Identifier (UBID) is an initiative by the US Department of Energy (DOE) to establish a system for generating and maintaining unique ID’s for all buildings across the planet. The UBID algorithm generates a unique ID based on the geo-spatial location and form of a building footprint. A unique building ID will provide a universal indexing mechanism for the collection, linking and aggregation of building-centric data from disparate sources (see: GitHub – Open city model data for the United States).
References
BRE Trust, 2020. The Housing Stock of the United Kingdom. [Online]
Available at: https://www.gov.scot/publications/delivering-net-zero-scotlands-buildings-consultation-proposals-heat-buildings-bill/pages/1/
Bros-Williamson, J. & Smith, S., 2024. Applying a retrofit and low-carbon technology archetype approach to buildings in Scotland, Edinburgh: University of Edinburgh.
European Commission, 2023. Demo-BLog – Development and Demonstration of Digital Building Logbooks. [Online]
Available at: https://build-up.ec.europa.eu/en/resources-and-tools/links/demo-blog-development-and-demonstration-digital-building-logbooks
National Records of Scotland, 2023. Housing. [Online]
Available at: https://www.gov.scot/publications/delivering-net-zero-scotlands-buildings-consultation-proposals-heat-buildings-bill/pages/1/
Office for National Statistics, 2023. Housing, England and Wales: Census 2021. [Online]
Available at: https://www.gov.scot/publications/delivering-net-zero-scotlands-buildings-consultation-proposals-heat-buildings-bill/pages/1/
PBC Today, 2022. Timber frame homes UK market to rise by £70m. [Online]
Available at: https://www.pbctoday.co.uk/news/mmc-news/timber-frame-homes- uk/107522/#:~:text=In%20Scotland%20timber%20frame%20homes,%2C%20rising%20by%20almost%2060%25
Reed, R., 2021. Property Development. Abingdon: Routledge.
Registers of Scotland, 2023. Property market report 2022-23. [Online]
Available at: https://www.ros.gov.uk/data-and-statistics/property-market-report-2022-23#:~:text=In%202022%2D23%3A,when%20compared%20with%202021%2D22
Scottish Government, 2021. Heat in Buildings Strategy – achieving net zero emissions in Scotland’s buildings. [Online]
Available at: https://www.gov.scot/publications/heat-buildings-strategy-achieving-net-zero-emissions-scotlands-buildings/
Scottish Government, 2023. Building standards approved energy assessment software: guidance. [Online]
Available at: https://www.gov.scot/publications/building-standards-approved-energy-assessment-software-guidance/
Scottish Government, 2023. Delivering net zero for Scotland’s buildings – Heat in Buildings Bill consultation. [Online]
Available at: https://www.gov.scot/publications/delivering-net-zero-scotlands-buildings-consultation-proposals-heat-buildings-bill/pages/1/
Scottish Government, 2023. Energy Performance Certificate (EPC) reform: consultation. [Online]
Available at: https://www.gov.scot/publications/energy-performance-certificate-epc-reform-consultation/pages/2/
Scottish Government, nd. Scottish House Condition Survey: Collection. [Online]
Available at: https://www.gov.scot/collections/scottish-house-condition-survey/
Serin, B., Kintrea, K. & Gibb, K., 2018. Social housing in Scotland. [Online]
Available at: https://housingevidence.ac.uk/wp-content/uploads/2024/03/R2018_SHPWG_Scotland.pdf
Smith, S., 2021. Developing Net Zero Technical Solutions for Scotland’s Future Mass Retrofit Housing Programme, Edinburgh: Scottish Government.
Today’s Conveyancer, 2023. Property logbooks made compulsory in France. [Online]
Available at: https://todaysconveyancer.co.uk/property-logbooks-made-compulsory-france/
ZEST Taskforce, 2021. Achieving net zero in social housing: The Zero Emissions Social Housing Taskforce Report. [Online]
Available at: https://www.gov.scot/binaries/content/documents/govscot/publications/independent-report/2021/08/achieving-net-zero-social-housing-zero-emissions-social-housing-taskforce-report/documents/zero-emissions-social-housing-taskforce-report/zero-emissions-social
© The University of Edinburgh, 2024
Prepared by EALA Impacts CIC, Novoville and University of Edinburgh on behalf of ClimateXChange, The University of Edinburgh. All rights reserved.
While every effort is made to ensure the information in this report is accurate, no legal responsibility is accepted for any errors, omissions or misleading statements. The views expressed represent those of the author(s), and do not necessarily represent those of the host institutions or funders.
- https://epbd-ca.eu/wp-content/uploads/2021/07/Implementation-of-the-EPBD-in-the-United-Kingdom-%E2%80%93-Scotland-%E2%80%93-2020.pdf ↑
The Scottish Government’s Heat in Buildings (HiB) Strategy commits all Scottish homes to be net zero by 2045. However, in line with the commitment to a Just Transition, the Government recognises that personal circumstances may, in some cases, make it more challenging for people to meet the requirements of the proposed Heat in Buildings Standard. Personal circumstances include vulnerability criteria related to the occupiers of the dwelling, such as disability, age, or low income.
This study reviewed how regulations, both in the UK and internationally, have accounted for personal circumstances. The researchers also investigated the impact of including personal circumstances in the regulation. The report highlights new emerging policy areas to support consideration of how similar regulations could work in Scotland.
Findings
The study identified 18 examples of personal circumstances being included in international heat and energy efficiency regulations. Key findings include:
- There is limited evidence of including personal circumstances in regulations.
- The most common personal circumstances identified relate to those with a low income.
- Germany allows exemptions for clean heating regulation for owner-occupiers over 80 years of age, if they live in a building of up to six flats.
- Most stakeholders were aware of funding or support for low-income households, but several noted they had not considered including other personal circumstances within regulations.
- A proposal in Flanders aims to introduce a decision tree for personal circumstances, which includes significant life events to excuse residents for not meeting the standard.
- Stakeholders were concerned that including personal circumstances in the proposed HiB Standard would risk people losing out on the benefits of the energy transition such as reducing energy costs, greater energy efficiency and warmer homes.
For further details please read the report.
If you require the report in an alternative format, such as a Word document, please contact info@climatexchange.org.uk or 0131 651 4783.
July 2024
DOI: http://dx.doi.org/10.7488/era/4622
Executive summary
Scotland’s net zero 2045 ambition and updated Climate Change Plan require the rapid development of carbon capture and storage (CCS) and carbon dioxide removal (CDR). Current pathways to meeting statutory targets are dependent on large industrial clusters, funded by the UK Government.
Alternative pathways for the rapid decarbonisation of smaller, distributed biogenic sources of carbon dioxide (CO2) may be available, noting that these would be of an order of magnitude less than the industrial clusters, with the advantage of high-value CDR credits. This requires permits for storage sites within Scottish inshore waters which extend to 12 nautical miles from the coast, and policy coordination across capture, transport and storage.
This study explored the potential total CO2 storage capacity in Scottish inshore areas and the availability of onshore emissions originating from biomass, known as bio-CO2. The study also investigated if the distribution of potential sources and storage availability would make it possible to expedite Scotland’s CCS and CDR potential.
The capture of bio-CO2 is already a commercial success in Scotland, with an ambition to scale without subsidy to 1 million tonnes per year by 2030, which requires storage. Norway, Denmark and Iceland are selling CO2 storage at a premium, reflecting a supply-and-demand imbalance in regional storage availability.
Aims
This study aimed to assess the potential for developing CCS within 12 nautical miles of the Scottish shoreline – an area within Scottish Ministers’ competence. We explored the feasibility to deploy high-value capture and low-cost CO2 storage in Scotland and what the commercially viable total capacity for nearshore storage is likely to be. The outcomes also address the availability of bio-CO2, domestic CCS value chains, fit-for-purpose storage site licensing and high-value CDR certificates.
We propose that Scotland can make rapid progress by refocusing on domestic bio-CO2. These emissions are already being captured in Scotland at low cost and with simple technology.
We identified prospects within the 12 nm territorial waters. Developing secure storage of high value bio-CO2 within the Scottish jurisdiction can produce several financial benefits, including premium lease payments to Crown Estate Scotland, development of local skills and growth of new businesses. This has the potential to increase Scottish GDP by tens to hundreds of millions of pounds per year, as well as paying staff and corporate taxes.
Developing Scottish storage sites for CO2 provides elements of control over licensing and the pace of approval for carbon capture and storage. Developing secure storage of high value bio-CO2 within the Scottish jurisdiction can produce CO2 removals, equivalent to direct air capture but at much lower financial cost.
We reviewed the potential for the rapid licensing of inshore storage using a streamlined version of UK licensing. Four geographic areas of interest are ranked by maturity of evaluation. We examine when injection could start if all regulations were in place across the different authorities.
Findings
We addressed five elements of CCS: licensing, storage, sources, timeframes and cost. We found that it is theoretically possible to adopt a streamlined licensing framework; inshore storage is available for rapid appraisal, albeit at a very limited capacity compared to offshore; bio-CO2 sources are abundant across nine sectors with explosive growth potential driven by the global CDR market; timeframes can be measured in years with the potential to deliver operational injection of bio-CO2 before 2030; costs are competitive with UK clusters and export markets.
Licensing
- CO2 storage involves multiple activities under different licensing regimes.
- New regulations for CO2 storage are not required.
- Minor amendments to existing statutory instruments may be required.
- The amendments may be fast if based on existing UK regulations and the CCS Directive.
- A Crown Estate Scotland (CES) lease is also required.
- Consents may also be required from the Scottish Environmental Protection Agency (SEPA) and the Scottish Government’s Marine Directorate.
Storage
- Four areas have well data and seismic coverage.
- Only the Lybster oil field is a candidate for immediate development.
- The total expected nearshore capacity is 2 Mt without further extensive surveying.
- The Forth Basin is a low Technology Readiness Level research opportunity.
Sources
- We mapped 98 of the largest bio-CO2 sources in Scotland.
- Source emissions range from 2 to 360 kilotonnes per annum.
- Separation of CO2 from distilleries and biogas upgrading are low cost.
- Combustion sources are higher cost and are the largest sources and sectors.
- The source distribution across five clusters favours road transport to local storage.
Timeframes
- North Sea Transition Authority appraisal licences average five years and three months.
- Appraisal are followed by storage permits and 2 years of further site development.
- The fastest storage permits are issued in as little as three years.
- The fastest development of a site to first injection is around a year.
- Lybster permitting could be fast but requires further exploration of legal frameworks.
- Rapid progression is dependent on pre-existing data to confirm site suitability.
Costs
- Capture costs for separation sources are low, at £60 per tonne.
- Capture costs for combustion sources are higher, at £120 per tonne.
- Truck transport costs £20 per tonne per 100 miles, or £0.12/tonne/km.
- Storage costs for Lybster are £70 per tonne.
- The full chain CCS cost is £150 per tonne for separation within 100 miles of Lybster.
- Storage costs for sites further offshore are at least two to three times higher.
Revenue
- CDR credits on the European voluntary market are worth £297 per tonne.
- Taxing storage would be subject to further work by the Scottish Government.
- As a simple example, a 10% tax could yield between £7 and £30 per tonne per annum.
- Lybster tax revenue would be £30 million for a 2 Mt capacity and £15 per tonne tax.
- Further revenue is available if bio-CO2 is transported to Acorn via the Feeder 10 pipeline.
- Combined revenue for Lybster and Feeder 10 could total £250-500 million by 2045.
Next steps
In order to progress the potential benefits of CCS and CDR in Scotland, we recommend the following actions.
- The Scottish Government could conduct further work to fully understand the law around consenting and regulating storage and consider pursuing a streamlined regulatory framework for storage that builds on the structure established by the NSTA while emulating the accelerated approach taken by Denmark and Norway. This is relevant to Scottish policy, legislators, SEPA, and the Marine Directorate.
- The Scottish Government could consider supporting an appraisal of Lybster with the involvement of a compliant operator. This would require 3D seismic interpretation to build a static model and undertake reservoir simulation. This could be completed within one year with the intention of transitioning to a front-end engineering design study and development decision within three years. This requires a competent person’s report on the site, model outcomes, and risk analysis.
- The Forth Basin saturated water injection proposal could be considered as a potential research pilot to mature the concept and location from its current low TRL. This is relevant to the Scottish universities’ research community and British Geological Survey.
- Maturing the Fraserburgh and Solway Firth areas could proceed when market signals support the necessary investment in data acquisition and offshore development.
- The Scottish Government could seek mechanisms and policies to maximise the domestic benefits of full chain CCS, rather than exporting captured bio-CO2 to storage providers in other countries. The high concentration of bio-CO2 sources in the central belt raises the possibility of a gathering station for Feeder 10 access to Acorn.
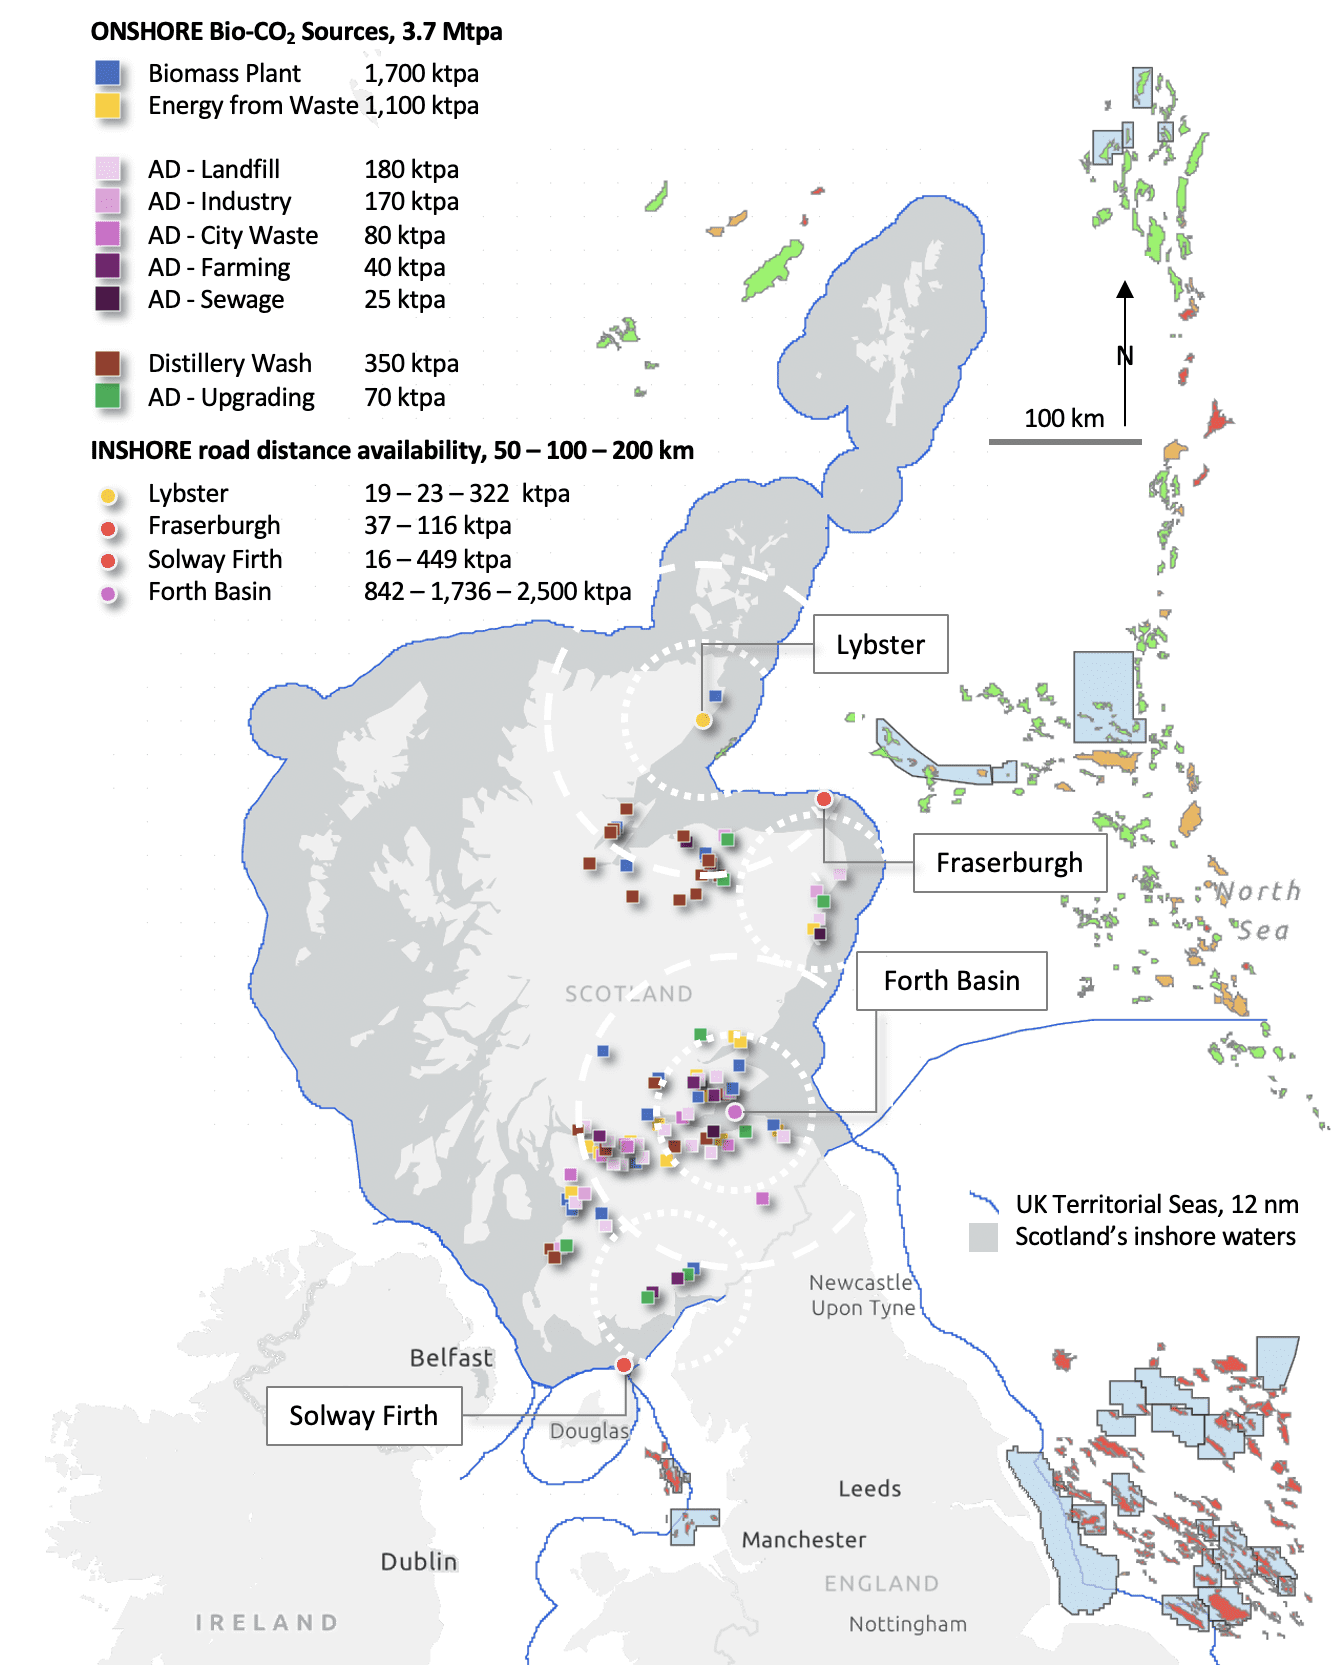
Onshore bio-CO2 sources located close to inshore CO2 storage prospects.
(Sources: SCCS, BGS, SNZR, NNFCC, NSTA)
List of abbreviations
|
AD |
Anaerobic Digester |
|
AOI |
Area of Interest |
|
BEIS |
Department for Business, Energy, and Industrial Strategy |
|
BSA |
Boston Square Analysis |
|
Bio-CO2 |
CO2 from decomposition, digestion, or combustion of biomass |
|
CCS |
Carbon Capture and Storage |
|
CDR |
Carbon Dioxide Removal |
|
CES |
Crown Estate Scotland |
|
DECC |
Department of Energy and Climate Change |
|
DESNZ |
Department for Energy Security and Net Zero |
|
DF |
Distillery Fermentation |
|
EfW |
Energy from Waste |
|
FEED |
Front End Engineering Design |
|
MD |
Marine Directorate |
|
Mtpa |
Million tonnes per annum, equal to 50 litres per second of CO2 |
|
NSTA |
North Sea Transition Authority |
|
OGA |
Oil & Gas Authority, the legal entity for the NSTA |
|
P90-P50-P10 |
Pessimistic-Expected-Optimistic range |
|
SEPA |
Scottish Environmental Protection Agency |
Glossary
|
Aquifer |
An aquifer is an underground layer of water-bearing rock, consisting of porous and permeable materials such as sandstone and chalk. |
|
Biomethane |
Biomethane is methane gas, CH4, that has been produced from the anaerobic digestion of organic matter such as manure, sewage, and organic waste. |
|
Biomethane Upgrader |
A biomethane upgrader is a piece of equipment that transforms biogas to biomethane by filtering out impurities such as other gases that are also generated during anaerobic digestion. |
|
Caprock |
A relatively impermeable rock, commonly shale, anhydrite, or salt, that forms a barrier or seal above and around reservoir rock so that fluids cannot migrate out of the reservoir. |
|
Inshore |
Inshore is a marine area adjacent to the coast of a state or jurisdiction. The inshore area for Scotland is synonymous with the territorial waters that extend 12 nm beyond the coastline. |
|
Regional Aquifer |
A regional aquifer is a water-bearing reservoir that extends laterally for 10s to 100s of km, reflecting a thick regional distribution of the reservoir rock such as a sandstone or chalk. |
|
Seismic |
Seismic in this context refers to the geophysical surveying technique of imaging the geologic structure of the subsurface by using vibrational waves and sonic reflections. |
|
Syncline |
A trough of stratified rock in which the beds dip toward each other from either side to form a u-shaped or v-shaped structure along a geometric axis. |
Introduction
The following report consists of five sections that cover CO2 storage licencing, inshore storage opportunities, available sources of bio-CO2, storage development timeframes, and a cost-revenue analysis of onshore capture, transport, and inshore storage. The report closes with six questions and answers that aim to synthesise the outcomes and propose ways forward.
Licensing
The Energy Act 2008 first enabled CO2 storage in the UK. The Carbon Dioxide Regulations 2010 adopted many requirements of the EU CCS Directive 2009 on the geological storage of carbon dioxide and came into force October 2010 – Appendix A. The regulations were extended in 2011 to address the termination of licences. The CCS Directive was transposed into UK law in 2012 by the adoption of secondary legislation under the authority of the Energy Act 2008.
CCS Directive
An EU regulatory framework for CCS was first proposed by the European Commission in 2007 (EC, 2007). The CCS Directive 2009 provides the framework for CO2 storage with only brief mentions of capture and transport. The CCS Directive is supported by a series of six guidance documents. The guidance covers: the storage complex, characterisation, risk management, stream composition, monitoring and corrective measures, criteria for the transfer of liability to the competent authority, and financial security and financial mechanisms. The Directorate-General for Climate Action (DG CLIMA) commissioned DNV in 2022 to revise the guidance documents to reflect the current understanding of CCS and remove ambiguities identified during the development of early CCS projects. The outcomes can be expected in Q3 2024.
Licensing in the UK
DESNZ currently leads UK government energy policy, preceded by BEIS (2016-2023) and DECC (2008-2016). UK energy policy is framed by HM Treasury budgeting and long-term planning. The Energy Act 2008 makes provision for gas storage, enabling the licensing of CO2 storage appraisals and CO2 storage permitting – Figure 1.
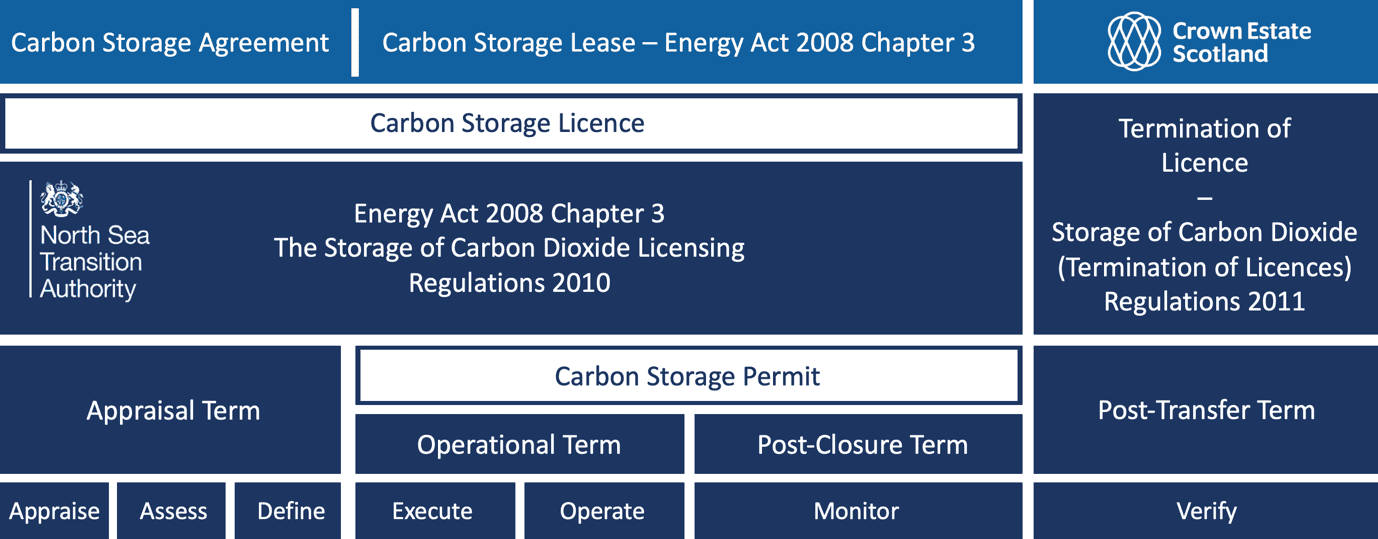
Figure 1. Current UK licensing framework for CO2 storage in Scotland for offshore areas such as Acorn.
UK licensing development
There are currently 27 UK appraisal licences open – see detail in Appendix B and Figure 2.
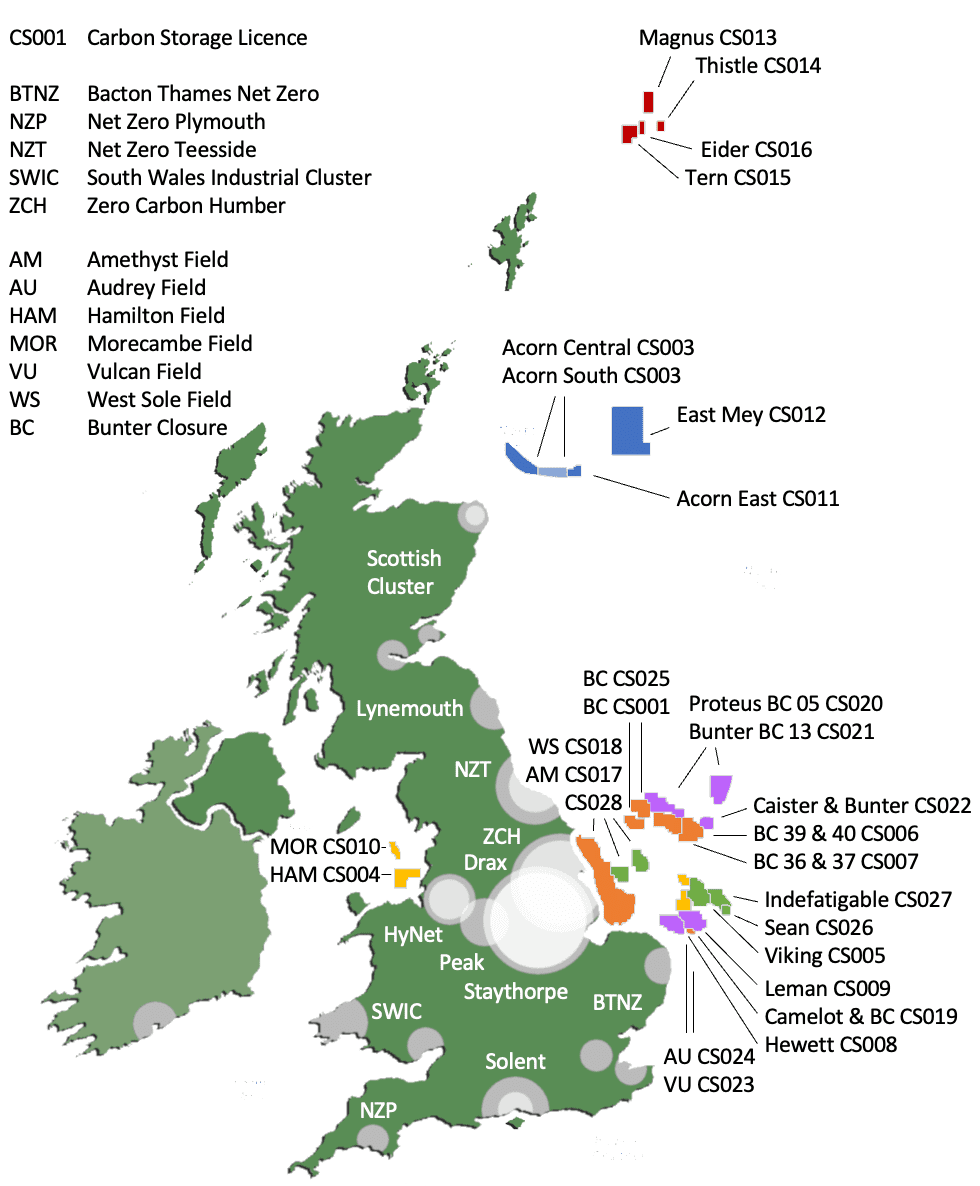
Figure 2. The location of offshore CO2 storage appraisal licences currently active in UK waters.
Licence CS001 and 1CS003-CS027). CS002 was reissued as CS003 in 2023.
Over a decade of policy engagement and early licensing experience has led to the current structure of appraisal licensing, storage permitting, and licence termination. The appraisal licence and storage permit terms both consist of three phases each:
- Appraisal licence phases: 1. Appraise 2. Assess 3. Define
- Storage permit phases: 4. Execute 5. Operate 6. Monitor
The seventh and final phase is a further monitoring period that occurs after the transfer of the site liability from the operator to the regulator with the termination of the storage permit. The seven phases are described in more detail below:
1. Appraise: This initial phase consists of an early risk assessment to establish storage feasibility and identify gaps which are then addressed by site characterisation. The characterisation of the trap structure may require 3D seismic acquisition over the site or reprocessing of an existing survey, and appraisal drilling.
2. Assess: This phase is a thorough evaluation of the site characterisation outcomes, and the operator’s proposed storage plan or need for further appraisal.
3. Define: This phase is a detailed proposal for site development commonly referred to as front end engineering and design (FEED). The design specification and required engineering informs a final investment decision and, if positive, an application for a storage permit.
4. Execute: On issuance of a storage permit, the operator executes the design plan. This entails the construction and commissioning of the engineering works necessary for CO2 injection into the target reservoir and for site conformance monitoring during the operational phase.
5. Operate: This phase commences with the first injection of CO2 and conformance to the operational plan. Any deviation from the planned operational conditions such as pressure excursions, flow impedance, or indications of out-of-zone migration are investigated and addressed to the satisfaction of the regulator, or otherwise promoted to a change in the operational plan up to and including a suspension of operations and early closure of the site.
6. Monitor: This phase commences with the end of injection and closure of the site and is a continuation of any preceding operational monitoring adapted to the specific requirements of conformance monitoring for the post-operational phase.
7. Verify: This phase commences with the end of the storage permit and transfer of site liability to the regulator. It consists of a sustained monitoring plan that verifies the long-term conformance of the site to expected outcomes.
The seven phases outline the structure of the current UK licensing regime – Table 1. In practice, each phase entails many elements that need to be negotiated between the operator and regulator. The negotiations are based on the specific requirements of a storage site and the evidence base of increasingly detailed assessments, characterisation, development proposals, and adaptation to conditions during the execution and operational phases.
Illustrating this, 17 of the 28 appraisal licences include between two and five additional requirements that apply during the initial appraisal phase to support characterisation – Table 2. These range from acquiring 3D seismic and drilling an appraisal well, to undertaking CO2 transport and topside installation studies, core sampling, and fault geomechanical analysis.
Table 1. Main stages of license progression
|
Main stages |
TLA |
Maturity |
|
Early Risk Assessment |
ERA |
Feasibility |
|
Characterise |
CH |
Appraisal |
|
Assess |
AS |
Pre-front-end engineering |
|
Define |
DF |
Front-end engineering design |
|
Permit Application |
PA |
FIP, firm intention to proceed |
|
Construct & Commission |
CX |
FID, final investment decision |
|
Operational |
OP |
OI, on injection |
|
Post-Closure |
PC |
Post-Closure monitoring |
|
Post-Transfer |
PT |
Post-Transfer monitoring |
Table 2. Additional licensing requirements.UK licensing structure
|
Additional Requirement |
Description of Requirement |
|
Seismic RP |
3D Survey reprocessing |
|
Seismic AQ |
3D Survey acquisition |
|
Well |
Appraisal drilling |
|
Injectivity |
Appraisal flow |
|
Wells VSP |
Vertical seismic profile |
|
Firm TR |
Transport study |
|
Firm TS |
Topside installation study |
|
Firm Geomech |
Geomechanical study |
|
Firm Cap |
Caprock seal study |
|
Firm Seal |
Fault seal study |
|
Firm Core |
Core analysis study |
Licensing in Scotland
Inshore developers in Scotland must first secure the appropriate rights to appraise and develop storage from the Crown Estate Scotland (CES). A CES agreement is required for a site appraisal. A CES lease is required for storage in accordance with the Energy Act 2008. The CES approach to managing storage assets is set out in the CCS Asset Profile (CES, 2022).
Onshore consent is covered by Scots law and is a matter for the local planning authority. Offshore consent for CO2 storage in territorial waters is also covered by Scots law, and requires coordination between the Scottish Environmental Protection Agency (SEPA), the Marine Directorate (MD) and the NSTA. The shared jurisdiction is discussed below.
Scots law
The territorial sea adjacent to Scotland is subject to both UK and Scots law. In terms of international law, the UK as the coastal state, enjoys sovereignty in the territorial sea which includes the seabed and subsurface. How the UK decides to exercise that sovereignty is a matter for the UK and this becomes complex in the context of devolution – Appendix C.
Licensing and regulation
Oil and gas fields under the territorial sea adjacent to Scotland are vested in the Crown. Although Scottish Ministers did receive licensing powers for oil and gas in the post-referendum settlement in the context of the Scotland Act 2016, this was explicitly only in relation to the onshore area, defined as lying within the baselines of the territorial sea – section 47. Licensing in relation to all offshore oil and gas, within the territorial sea and under the continental shelf, is a matter for the NSTA. This would be relevant to the closure of the oil production licence for Lybster in preparation for CO2 storage.
Scottish Ministers are established as the licensing for CO2 storage in the territorial sea by section 18 of the Energy Act 2008. The Storage of Carbon Dioxide Regulations 2010 went on to define a licence as granted by the authority, namely the NSTA – Regulation 1.3. However, the Storage of Carbon Dioxide Regulations 2011, a Scottish Statutory Instrument (SSI), transferred the powers to grant storage licences to Scottish Ministers, along with the associated powers to oversee the development, operation, monitoring, and closure of storage sites in Scottish territorial waters. This greatly simplifies the regulatory framework and requirements for licensing storage in Scottish waters.
Two points are worth noting. Firstly, the SSI precedes the 2012 transposition of the CCS Directive, and withdrawal of the UK from the EU in 2020. Very minor amendments to SSI 2011/24 may be required to reflect this. For example, the reporting authority named in the SSI is the European Commission.
Secondly, while the necessary powers sit with Scottish Ministers to oversee storage licensing, the competent authorities, and associated resources and procedures are not developed. Purchasing the services of the NSTA as regulator is an option that requires exploring. The long experience of the NSTA is an important supporting consideration. One option may be an agreement between an existing Scottish authority such as the Marine Directorate and the NSTA to deal with carbon licensing in territorial waters.
There is a precedent, the Memorandum of Understanding between the HSE and OPRED to form the Offshore Safety Directive Regulator, now OMAR, when that directive required a competent authority to deal with health, safety, and environmental risks under one roof (HSE, 2024). While that involved two regulators at UK level, there ought to be no objection to a similar arrangement between a UK and a Scottish regulator given the commonality of purpose and the desirability of a seamless approach.
Liability and ownership
Hydrocarbons in strata, even if residual and uneconomic, are vested in the Crown unless the Crown specifically transferred ownership, which it would be unlikely to do. Regarding liability for operational oil fields, the principal party is the licensee. In most cases, however, liability is joint and several with co-venturers under a joint operating agreement.
For decommissioning, it is a matter of anyone who holds a section 29 notice under the Petroleum Act 1998. Again, this will usually be co-venturers, but the list is lengthened to minimise the risk to the state if duty holders become insolvent. Things get more complicated in relation to any remaining infrastructure under an agreed derogation. Firstly, there is no specific legislation or regulation on this matter; rather it is dealt with in the context of guidance notes issued from time to time by OPRED. Leaving aside the apparent confusion in the guidance over ownership and section 29 notice holders – see Appendix C7. More fundamentally, there is an argument that the use of a Crown lease in relation to CCS constitutes an exercise of property rights. This raises the possibility that pre-existing infrastructure is a fixture in both jurisdictions. It follows that this belongs to the owner of the land or seabed to which it is attached. This has never been tested but is certainly arguable.
By contrast, this is a much easier proposition to establish within the territorial sea where the Crown Estate has habitually claimed property rights and the courts have readily confirmed them. Whatever is stated in the guidance notes and essentially accepted by duty holders in relation to decommissioning, property law may say something different.
Pore space
For Lybster, whereas the hydrocarbons in the field are vested in the Crown and those rights are exercised by the NSTA, the pore space is the property of the Crown. Property rights would be exercisable by the CES. For the Forth Basin, the pore space would also be owned by the Crown and the property rights would be exercisable by CES. Note that this property law analysis also implies that CO2 injected into depleted reservoirs beneath the territorial sea would be owned by the Crown on the basis of the principle of annexation. This has been more fully explored in the context of enhanced oil recovery (Patterson & Paisley, 2016).
Shared jurisdiction
The exploration and production licensing for Lybster at the time would have been a matter for the Secretary of State. Even now, as the reservoir lies within the territorial sea, the oil licensing would be a matter for NSTA. However, the CO2 storage licensing is a matter for Scottish Ministers. The siting and operation of the drilling rig onshore would then and now be a matter for the local planning authority. Thus, both UK law and Scots law are engaged as appropriate.
The Beatrice field presents a most interesting problem. The residual hydrocarbons in the field remain vested in the Crown. The pore space within 12 nm is owned by the Crown. The ownership of pore space beyond 12 nm is not clear, but from a practical perspective only the Crown has sovereign rights to act. The licensing authority within 12 nm is Scottish Ministers, and, beyond the 12 nm, NSTA. This may be resolved by some form of arrangement modelled on those for hydrocarbon reservoirs that cross boundaries.
Summary
CO2 storage involves multiple activities under different licensing regimes. These need to be explored further by the Scottish Government to fully understand what will be necessary to put in to law for CO2 storage within Scottish waters. New regulations will be required; it may well be, however, that insofar as existing regulations could be relied upon, the process of modifying SSI 2011/24 and drafting consents could be fast. This would really be a question for those with a better insight into the technical detail and political due process.
Inshore storage
Scotland’s territorial waters cover an area of 55,480 km2 with the potential for inshore storage. This includes a great deal of seismic data – Figure 3. While the 2D seismic coverage is extensive, only three areas have 3D seismic: Lybster, Fraserburgh, and the Solway Firth. 3D seismic is the most effective data for accurately characterising subsurface structures (Dee, et al., 2005). In its absence, 2D data may identify structures of interest in cross-section. The Forth Basin area is covered by a 2D survey – Appendix C. The availability of data allows the prospective areas to be ranked by maturity – Table 3. The exploration ranking of Fraserburgh and the Solway Firth is explained in the description of the areas of interest that follows below.
Areas of Interest
Figure 3 presents areas of interest for inshore CO2 storage.
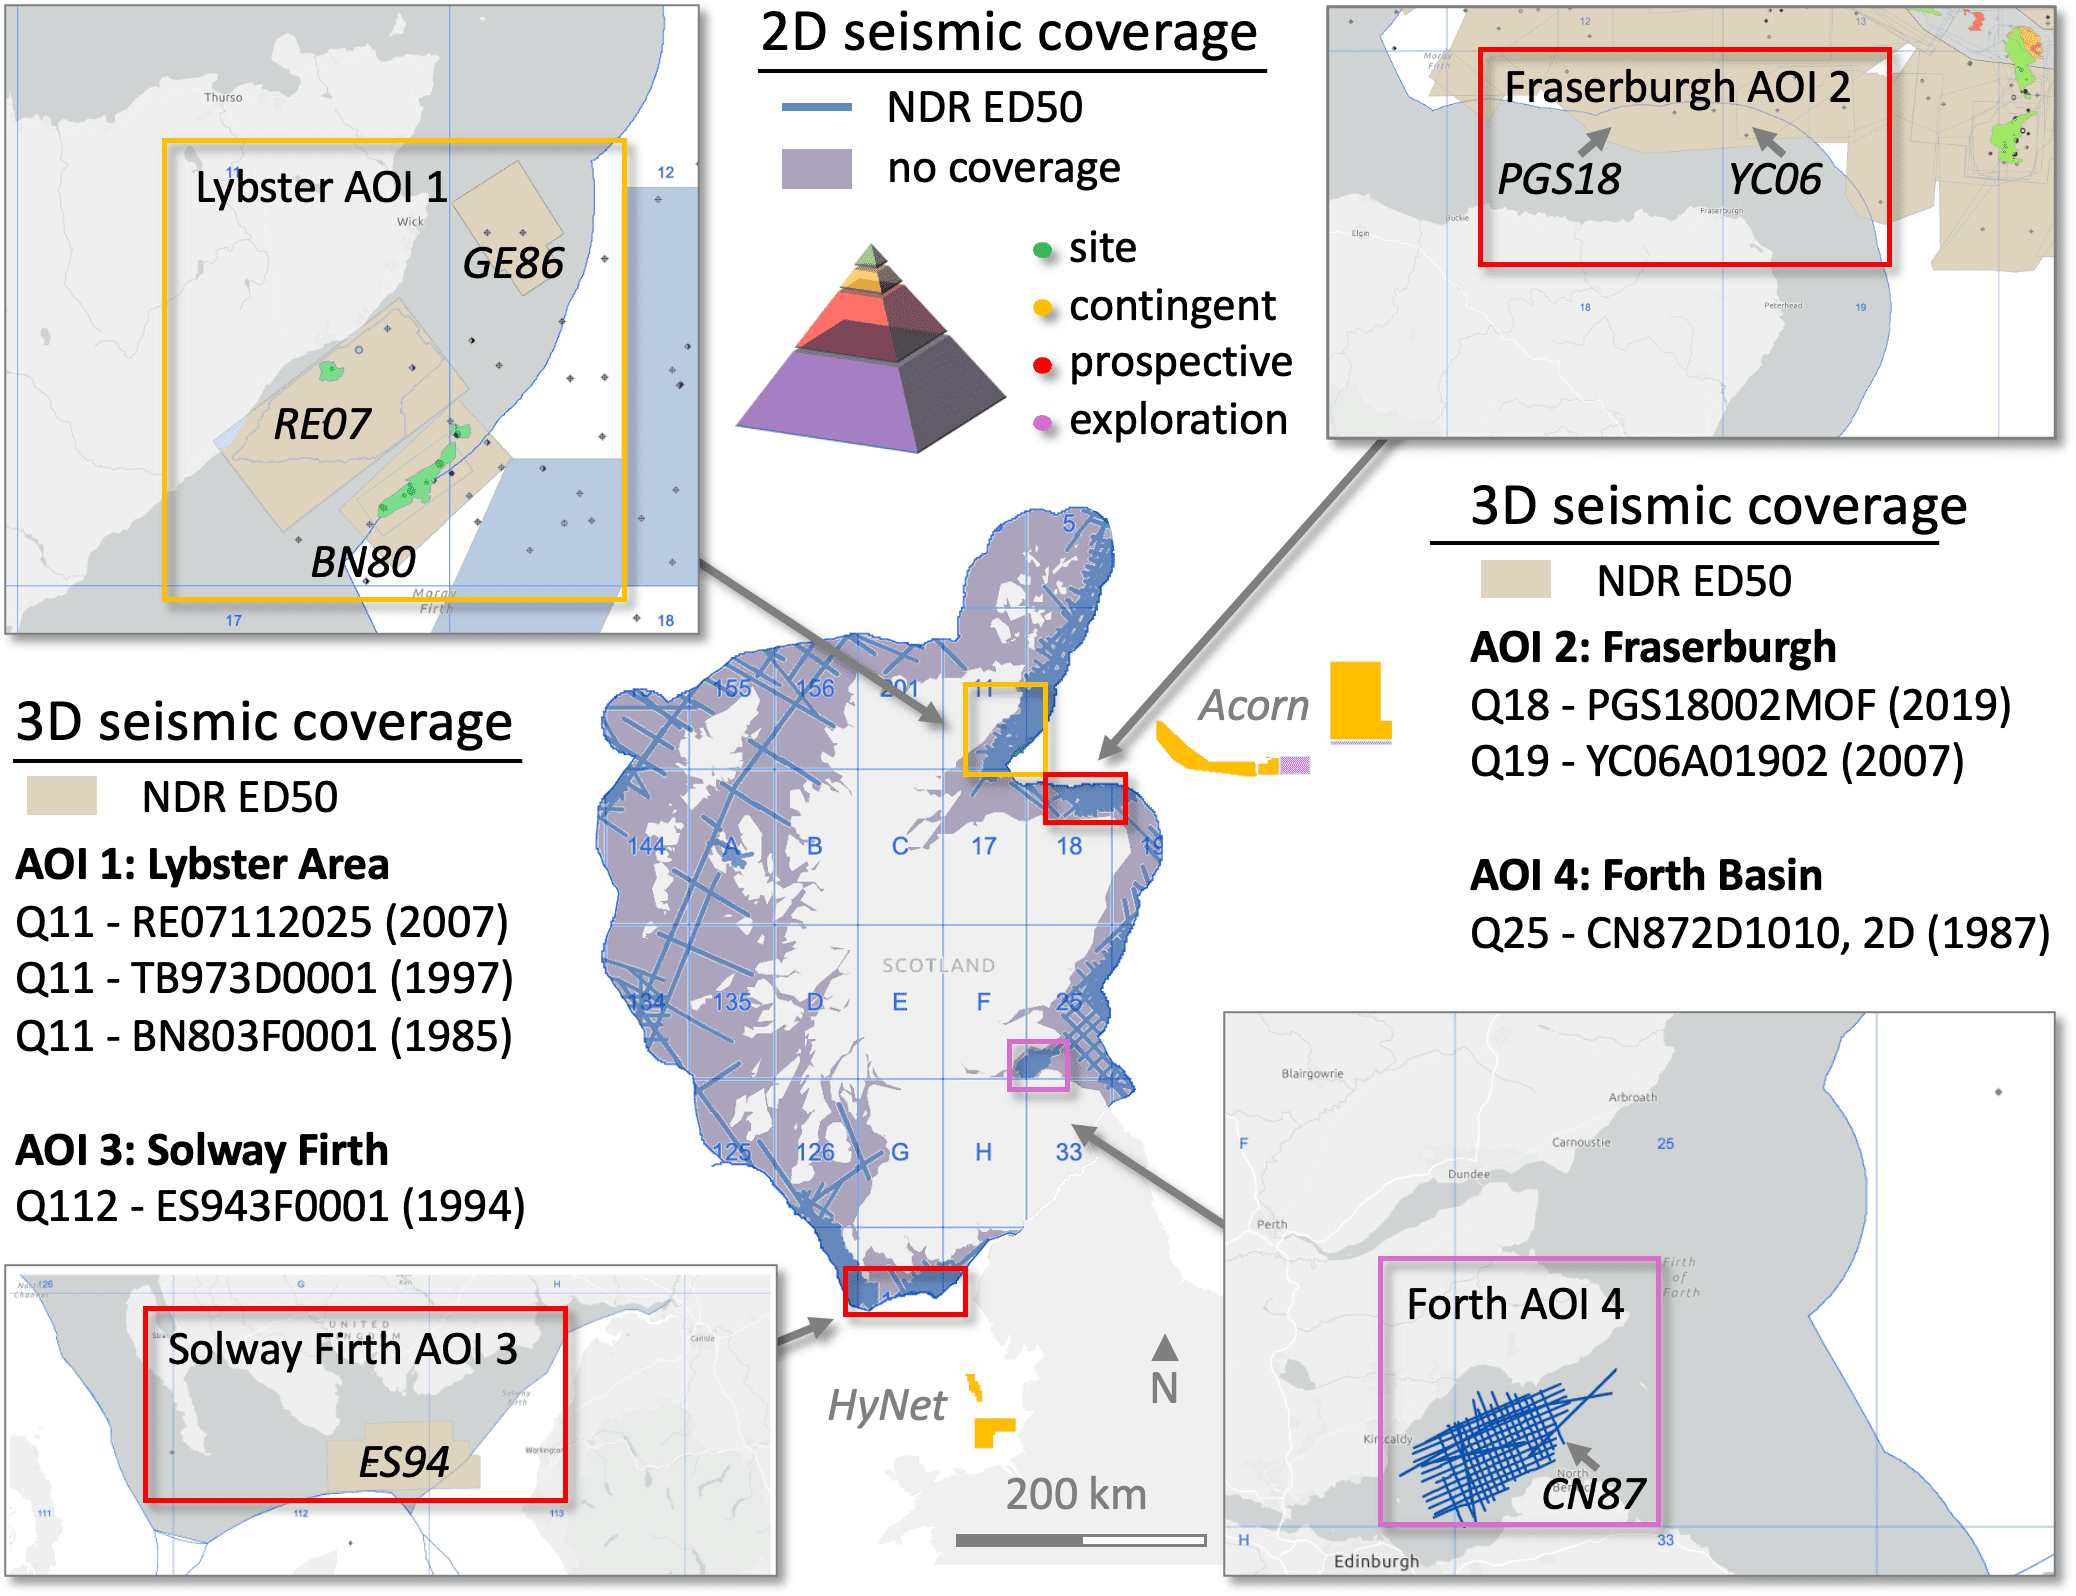
Figure 3. Areas of interest for inshore CO2 storage. Four areas are identified with seismic coverage and exploration well data – see Annex E for an inventory. Lybster has the best data coverage (contingent), followed by Fraserburgh and the Solway Firth (prospective), and the Forth Basin (exploration).
Table 3. Inshore areas of interest ranked by maturity and potential to progress rapidly.
|
Areas of Interest |
Area Name |
Seismic & Wells |
Maturity |
|---|---|---|---|
|
AOI 1 |
Lybster |
RE07 3D seismic + 5 wells + model |
Contingent |
|
AOI 2 |
Fraserburgh |
PGS18 3D seismic + 3 wells |
Prospective |
|
AOI 3 |
Solway Firth |
ES94 3D seismic + 2 wells |
Prospective |
|
AOI 4 |
Forth Basin |
CN87 2D seismic + 1 well |
Exploration |
Lybster Area
The Lybster oil field is ranked as contingent on the maturity pyramid where the maturity progresses from an exploration resource (large base) to a commercial reserve of sites (small top) via contingent prospects – Figure 3. The area of interest encompasses 306 km2 that include the field and exploration structures, Knockinnon and Braemore.
Two more oil fields, Beatrice and Jacky, are located at the 12 nm limit. Lybster is notable for three reasons: its proximity to the coast; a substantial amount of data and analysis; and an existing production well. These significantly reduce the potential cost and timeline to developing a storage site. The field needs to be screened for capacity and suitability to qualify the field for appraisal licensing. The initial capacity estimate and assessment of suitability are documented in Section 4.2, supported by Appendix D.
Knockinnon and Braemore are relatively immature with respect to storage analysis but noteworthy for potentially providing step-out capacity to Lybster. Beatrice has not been assessed for this report as the field is beyond a presumed technical limit for onshore development via extended reach wells. 12 nautical miles is equivalent to 22 km; the 2022 record for an extended reach well is 15 km. A reasonable economic limit of 10 km has been set for assuming offshore development. Beatrice, the largest field in the area, straddles the 12 nm boundary. Jacky is a small satellite field in territorial waters to the north of Beatrice.
Fraserburgh & Solway Firth
Both areas have 3D seismic survey coverage and exploration wells. The location of the 3 wells and seismic for Fraserburgh, approximately 16-20 km from shore, would require an offshore installation (pipeline, injection well, and monitoring equipment). Any prospects within the area would need to be identified from the existing seismic and well data and screened for suitable reservoir injectivity and caprock seal properties prior to appraisal licensing.
The Solway Firth area has two exploration wells and a 3D seismic survey in the southern half of the 12 nm territorial waters. One of the wells is within the seismic survey area. The location of the seismic and well 13 km from shore would require an offshore installation (pipeline, injection well, and monitoring equipment). As with Fraserburgh, prospects within the area would need to be identified from the existing seismic and well data and screened for suitable reservoir injectivity and caprock seal properties prior to appraisal licensing. As such, both areas are ranked as prospective on the maturity pyramid.
Forth Basin
The Forth Basin is close to a diverse cluster of bio-CO2 sources located in the Central Belt. The Forth was screened for prospective storage sites as part of the CASSEM project (SCCS, 2012). Trap structures were identified but rejected due to a lack of well data and poor control on the 2D seismic interpretation for caprock thickness and reservoir volume (Monaghan et al., 2012). The Forth also contains a large basin, the Leven syncline. The syncline may be suitable for an alternative strategy of CO2-brine surface mixing and injection of the CO2-rich mixture which is denser than the syncline’s porewaters (Eke et al., 2011). This approach to storage is examined in section 2.3. The low TRL of dissolved CO2 injection and need to mature the concept for the Forth Basin rank this area as exploration.
Lybster prospect
Lybster was drilled in 1996 just 3 km off the Caithness coast – Figure 4. Lybster is 3 km from the coast, with a vertical offshore discovery well, 11/24-1 (1996), onshore extended reach appraisal well, 11/24-3 (2008), 3D seismic coverage, and a reservoir model.
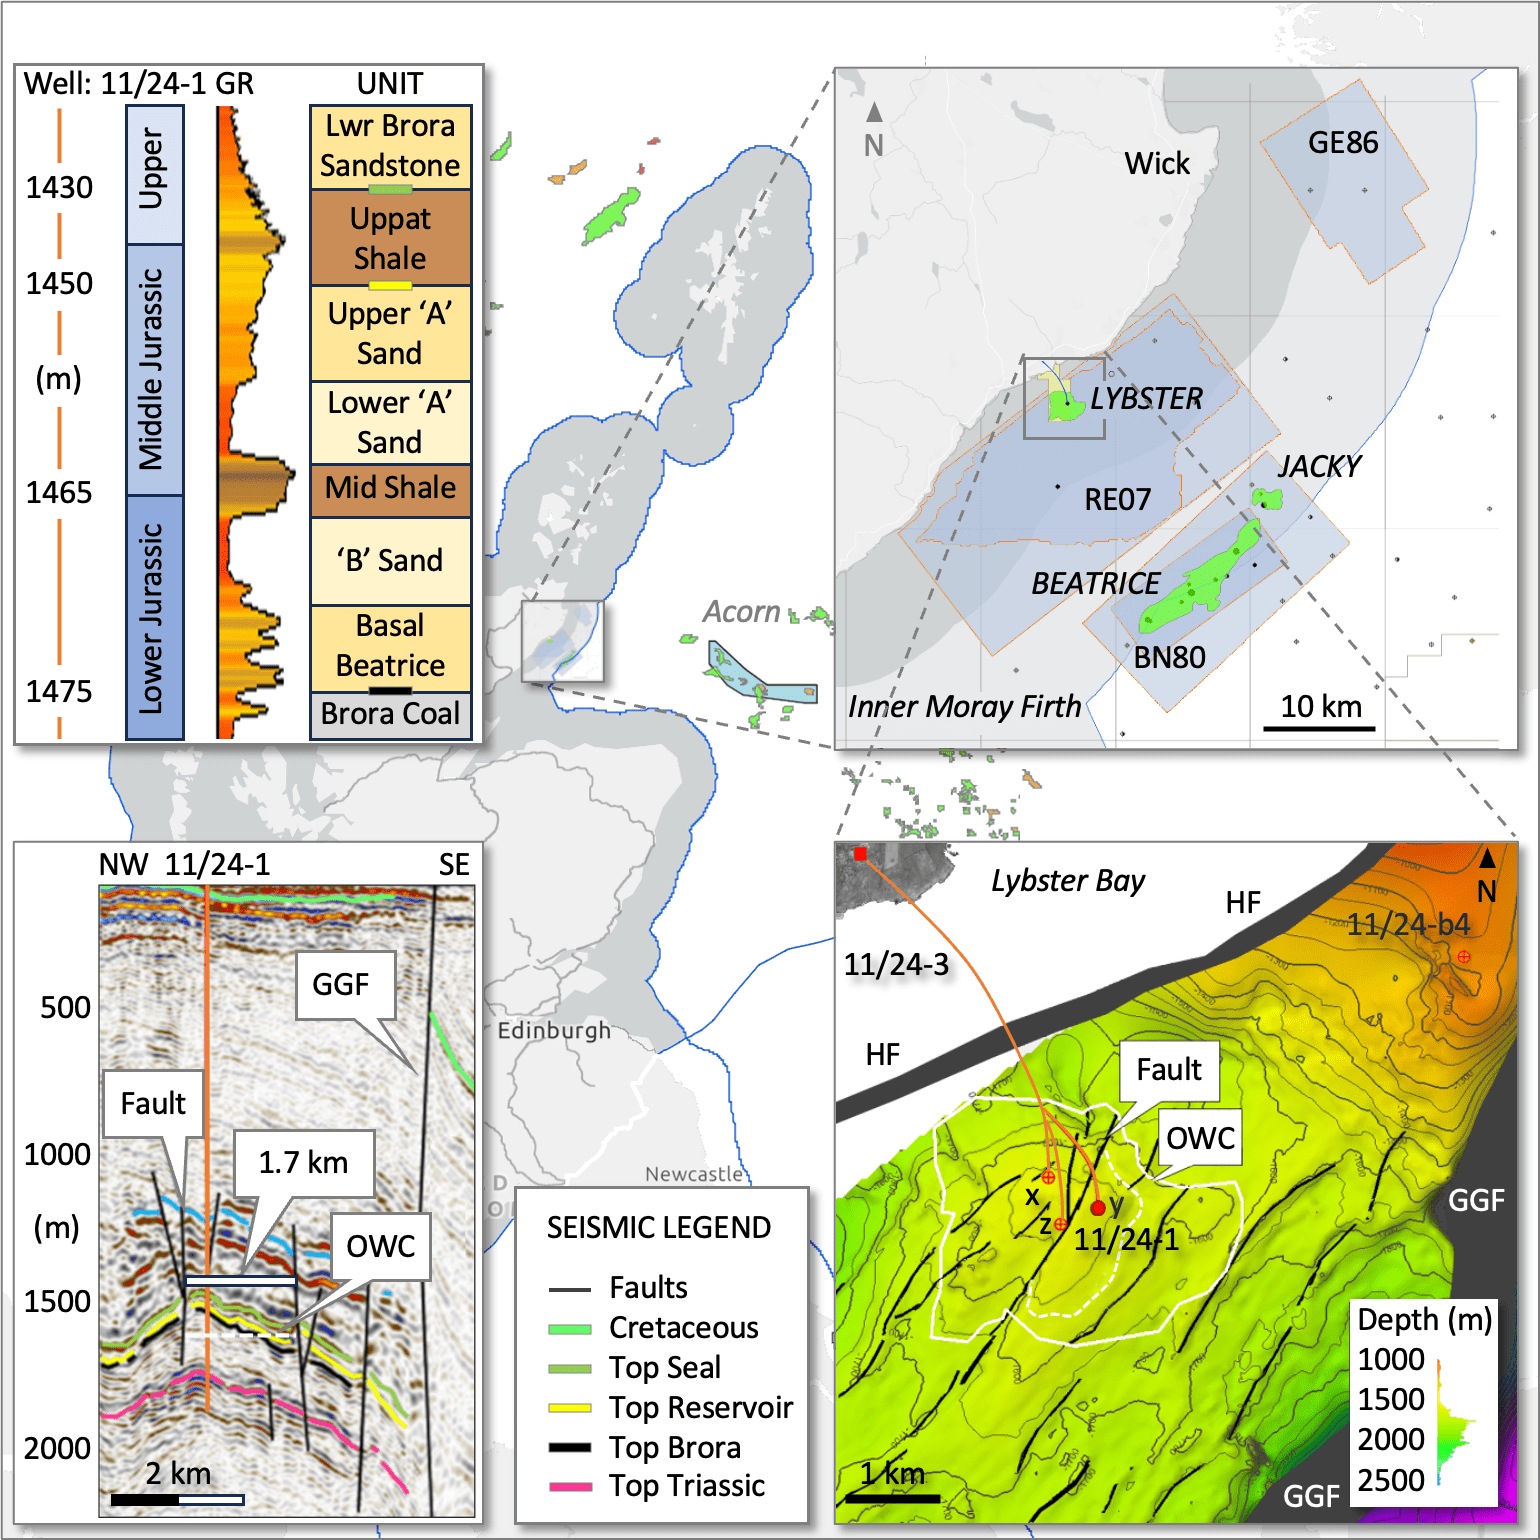
Figure 4. The Lybster prospect location, associated reservoir model, seismic section and well data.
The model (Figure 4, bottom right) is constructed from 3D seismic data (Figure 4, bottom left) and well data (Figure 4, top left). The field has two high quality reservoir units, the lower ‘A’ and ‘B’ sands, separated by a baffle, the mid-shale, and capped by the Uppat Shale seal. The field is divided into two halves by a fault that strikes NE-SW. Several small faults occur between the regional Great Glen Fault (GGF) and Helmsdale Fault (HF).
The discovery well for Lybster was plugged and abandoned. The field was then drilled from the shore in 2008 via a 3 km extended reach well; the only offshore UK field to be produced this way. Most North Sea fields are much further offshore. This makes Lybster an accessible and low-cost storage prospect that requires no expensive infrastructure. If suitable, the suspended production well could be repurposed for CO2 injection.
Lybster is a four-way closure, or small 6 km2 dome, that has trapped oil and gas beneath a mudstone caprock for tens of millions of years. This is a good indication of suitability for storing CO2. The structural volume or space available for storage is calculated from known properties of the field such as reservoir area, thickness, porosity, and fluid properties such as CO2 density at reservoir conditions. The expected capacity is 2 Mt, (low-high range: 0.3-9 Mt).
An appraisal licence requires an early risk assessment (ERA) to formally establish the expected capacity and technical suitability of a suite of attributes ranging from seal and reservoir quality to fault geomechanics, lateral migration risk, legacy wells, and more. The ERA is a gap analysis that identifies further data requirements and potential issues to address in the ‘Assess and Define’ phases of an appraisal term for a storage licence. A first-look analysis follows below.
Storage analysis
At least two attributes of the Lybster field require further analysis as part of an early risk assessment. Firstly, the production history deviated from expectations – Figure 5. Increasing gas and water cuts within a matter of months and declining oil production resulted in a well workover and then suspension. A dynamic reservoir model is needed to explain these outcomes and fully understand the flow and containment of fluids within the structure.
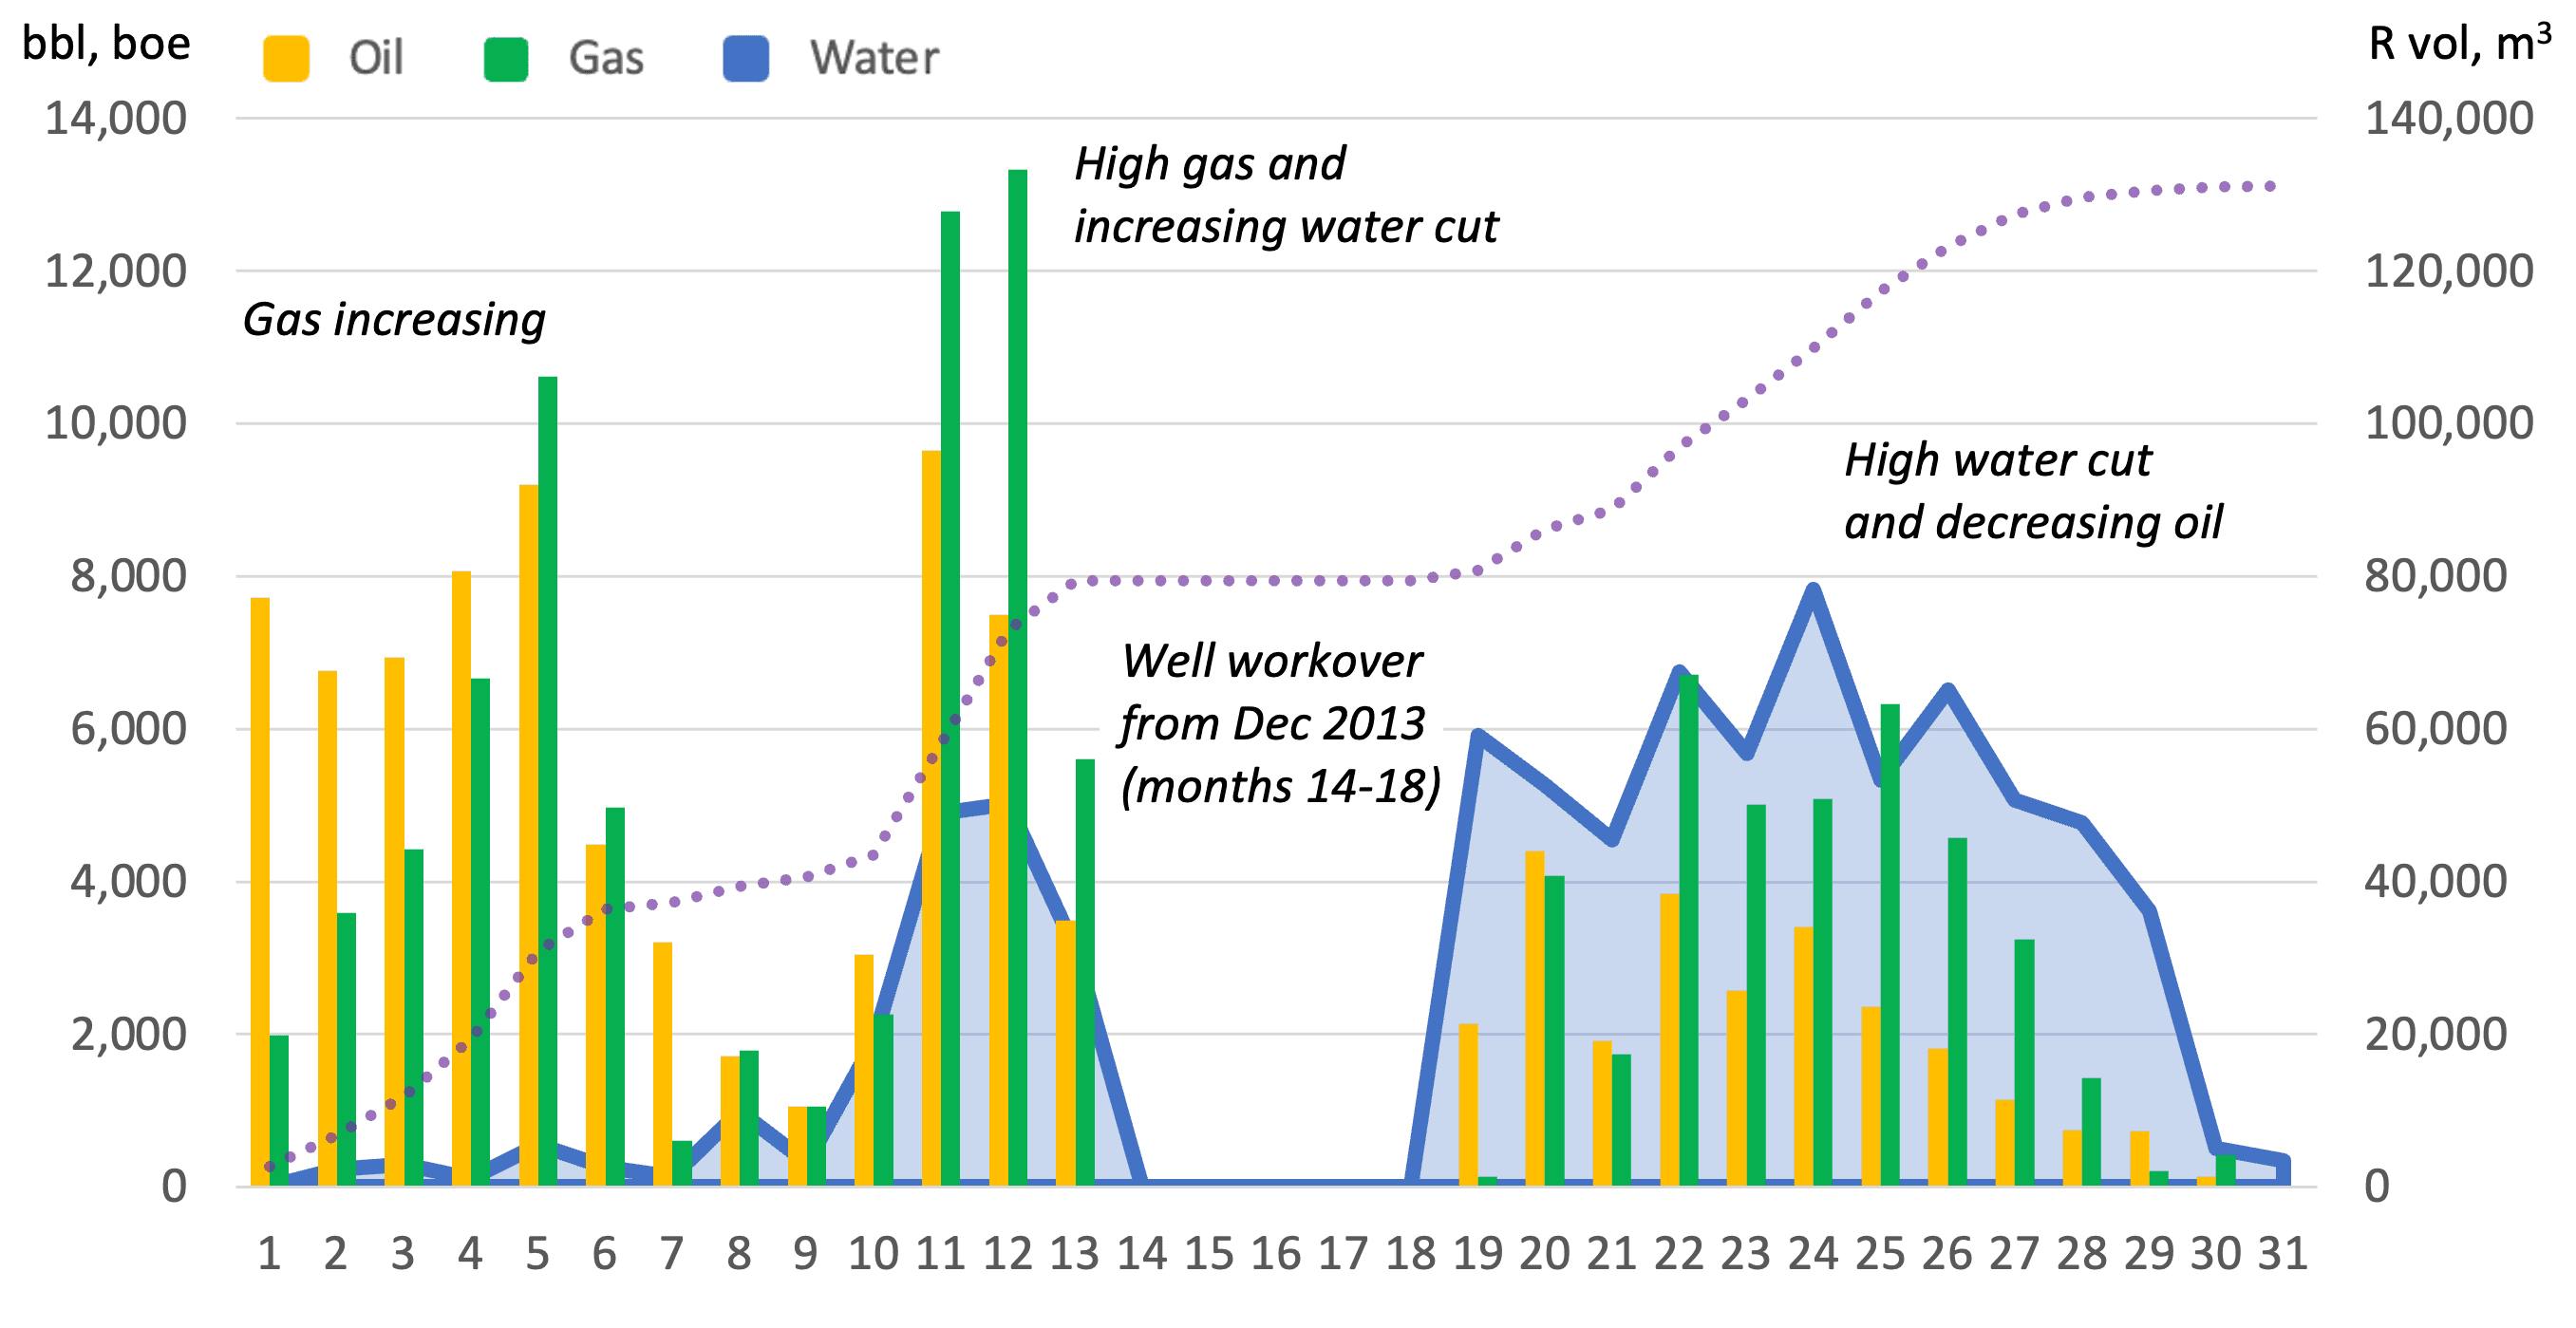
Figure 5. Production history in barrels of oil, water, equivalent gas, and produced reservoir volume.
Secondly, the field is located between two large faults, the Helmsdale Fault and Great Glen Fault, and has several smaller faults within the field boundary that segment the reservoir. These require a detailed geomechanical study to de-risk the prospect – Appendix F.
Capacity: The expected capacity of Lybster, based on the structural volume, is 2.1 Mt of CO2. – Table 4. This reasonable mid-range value assumes just half the field area, 3 km2, and an average reservoir thickness of 15 meters. A storage area of 3 km2 assumes the main fault for the field is sealing and CO2 storage is restricted to half the mapped field area. The full field area, 6.11 km2 (NSTA estimate), effectively doubles the capacity for mid-range values.
Combining the full-field area with high-range values for the other five variables quadruples the capacity. The full field area and high-range values for all variables furnishes an optimistic maximum capacity of 9.4 Mt. The low estimate, a pessimistic 0.35 Mt, uses low range values and halves the expected area again. The highly conservative minimum estimate of 100 kt is based on the produced volumes of oil, gas, and water.
Qualifying adjectives for capacity are as follows: ‘minimum’ is the lowest value calculated, a highly conservative production volume estimate. The structural volume estimates are defined as ‘low, ‘mid’, and ‘high’, based on reasonable range estimates for six variables; the dominant variable is the storage area. Note that while the outcomes resemble the common P90-P50-P10 approach, the data is too sparse to support a statistical analysis. This simply reflects the field’s short production history. The two methods are summarised in Appendix H.
Table 4. Structural volume variable range and applied values for capacity estimates
|
Variable |
Range |
Low, 0.35 Mt |
Mid, 2.1 Mt |
High, 9.4 Mt |
|---|---|---|---|---|
|
Storage area |
1.5 – 6 km2 |
1.5 |
3 |
6 |
|
Net thickness |
5 – 25 m |
9 |
15 |
21 |
|
Porosity |
8 – 22% |
0.11 |
0.15 |
0.19 |
|
Net to Gross |
56-80% |
0.6 |
0.68 |
0.76 |
|
CO2 Density |
700-750 kg/m3 |
710 |
725 |
740 |
|
Saturation |
50 – 75% |
0.55 |
0.625 |
0.70 |
Discussion
The Lybster field area has been intensively studied – Appendix H. While this report relies on Keenan’s detailed analysis of reservoir attributes such as porosity (Keenan, 2023), it corrects for the field area which was underestimated by an order of magnitude. The 2 Mt outcome is reasonable when compared to traps with a similar area such as Sleipner, Norway.
The alternative analysis, presented by Watt (Watt et al., in preparation), assumes a replacement volume for produced fluids. While this is a common approach to the capacity assessment of mature depleted fields such as Viking and Hamilton (Track-1 and Track-2 storage sites), the outcome is highly conservative for Lybster, a field with an unusually short production history. We favour the structural volume as a more reasonable indication.
The suite of suitability attributes also supports Lybster as a strong candidate for a licenced storage appraisal – Figure 6. This will apply the rigour necessary to mature the attribute scores from speculative to verified or identify gaps for further analysis. Our recommendation is that an appraisal licence include studies on fault integrity, geomechanics, and reservoir simulation.
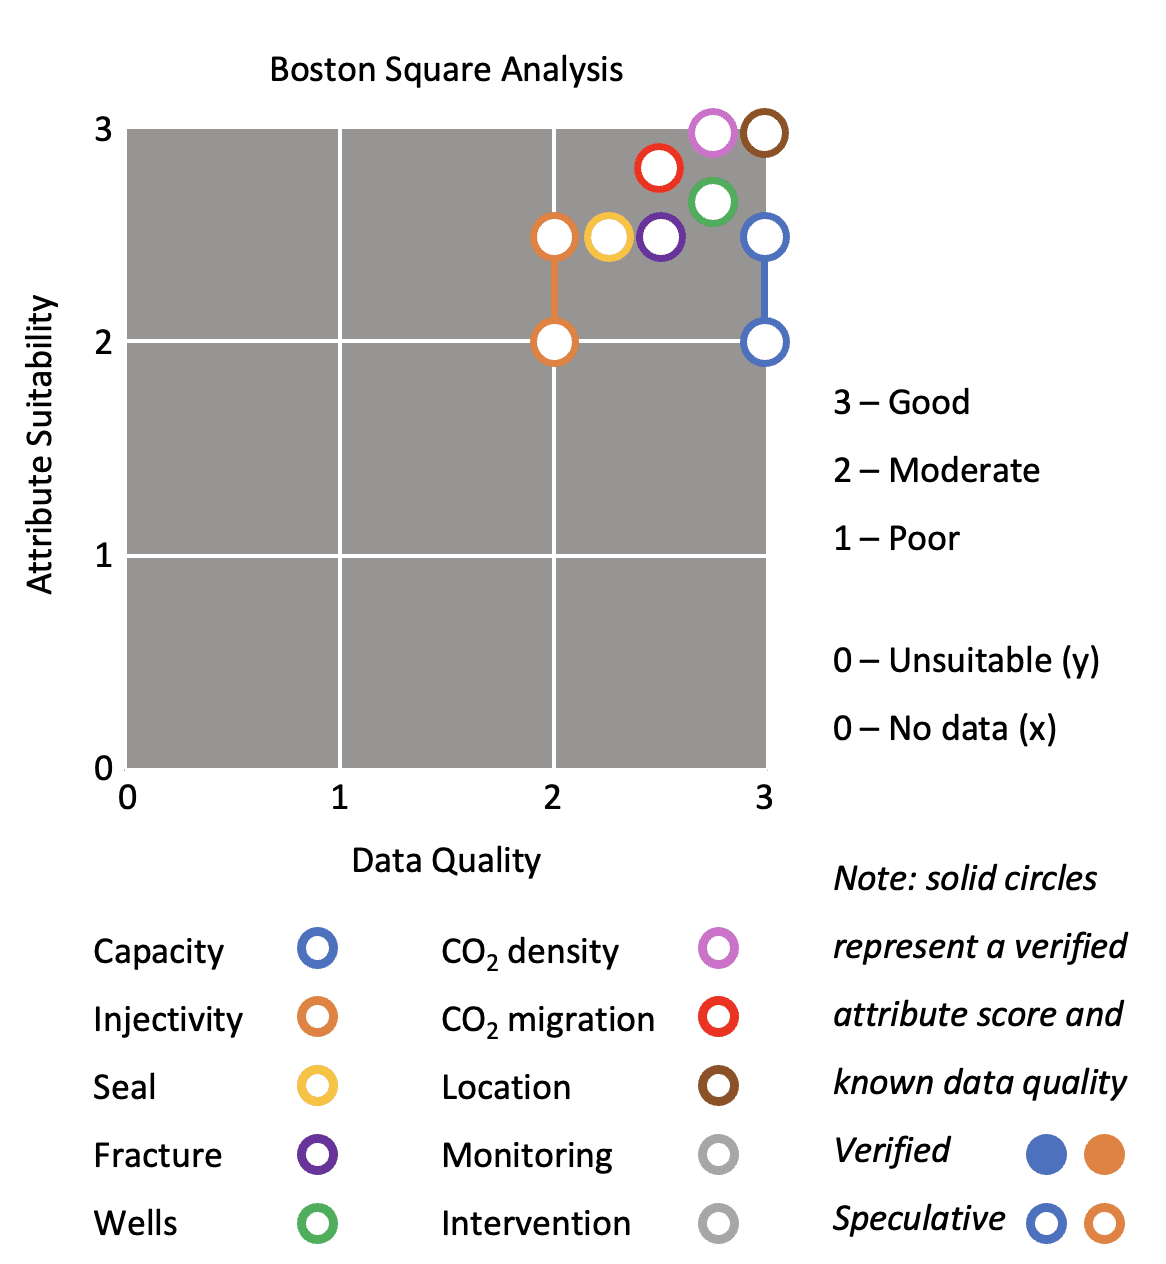
Figure 6. Boston Square analysis of attribute suitability for Lybster. A Boston Square is a simple scheme for scoring expert judgement from 1 to 3 devised by the Boston Consulting Group.
Forth Basin
The Forth Basin contains the Leven syncline, a geological structure in the Forth Estuary mapped on 2D seismic – Figures 7 and 8. Most proposals for CO2 storage assume injection of liquid CO2. This requires a geological seal above the reservoir to trap its buoyant rise. However, it is also possible to inject dissolved CO2 with large volumes of water, where the CO2-saturated water is denser than the porewater and sinks rather than rises. Research at the BGS and the University of Edinburgh shows that suitable geology to retain sinking dense CO2 may exist beneath the inshore waters of the Forth Estuary (Smith et al, 2011).
CO2-brine surface mixing
The CO2-brine dissolution approach was extensively modelled by Eke et al. (2011) and became a commercial reality in 2014 with the industrial-scale injection of 7 ktpa of CO2 from the Hellisheiði power plant, Iceland. While the physical limit for CO2 dissolution is 50 kg/m3, optimal chemical and physical parameters are controlled in the surface process facility. For Iceland, the outcome is 20 kg of dissolved CO2 per cubic meter of injected brine. This increases the volume of injected fluid by about 35x compared to a pure CO2 injection project like Sleipner. Reservoir pressure increases are minimised by extracting brine from the reservoir for mixing and return. This has worked for Iceland, with injection recently increasing from 7 ktpa to 12 ktpa. Future plans will scale to 40 ktpa before 2030. However, the geological setting, densely fractured young volcanic rocks, is quite different from the Leven Syncline.
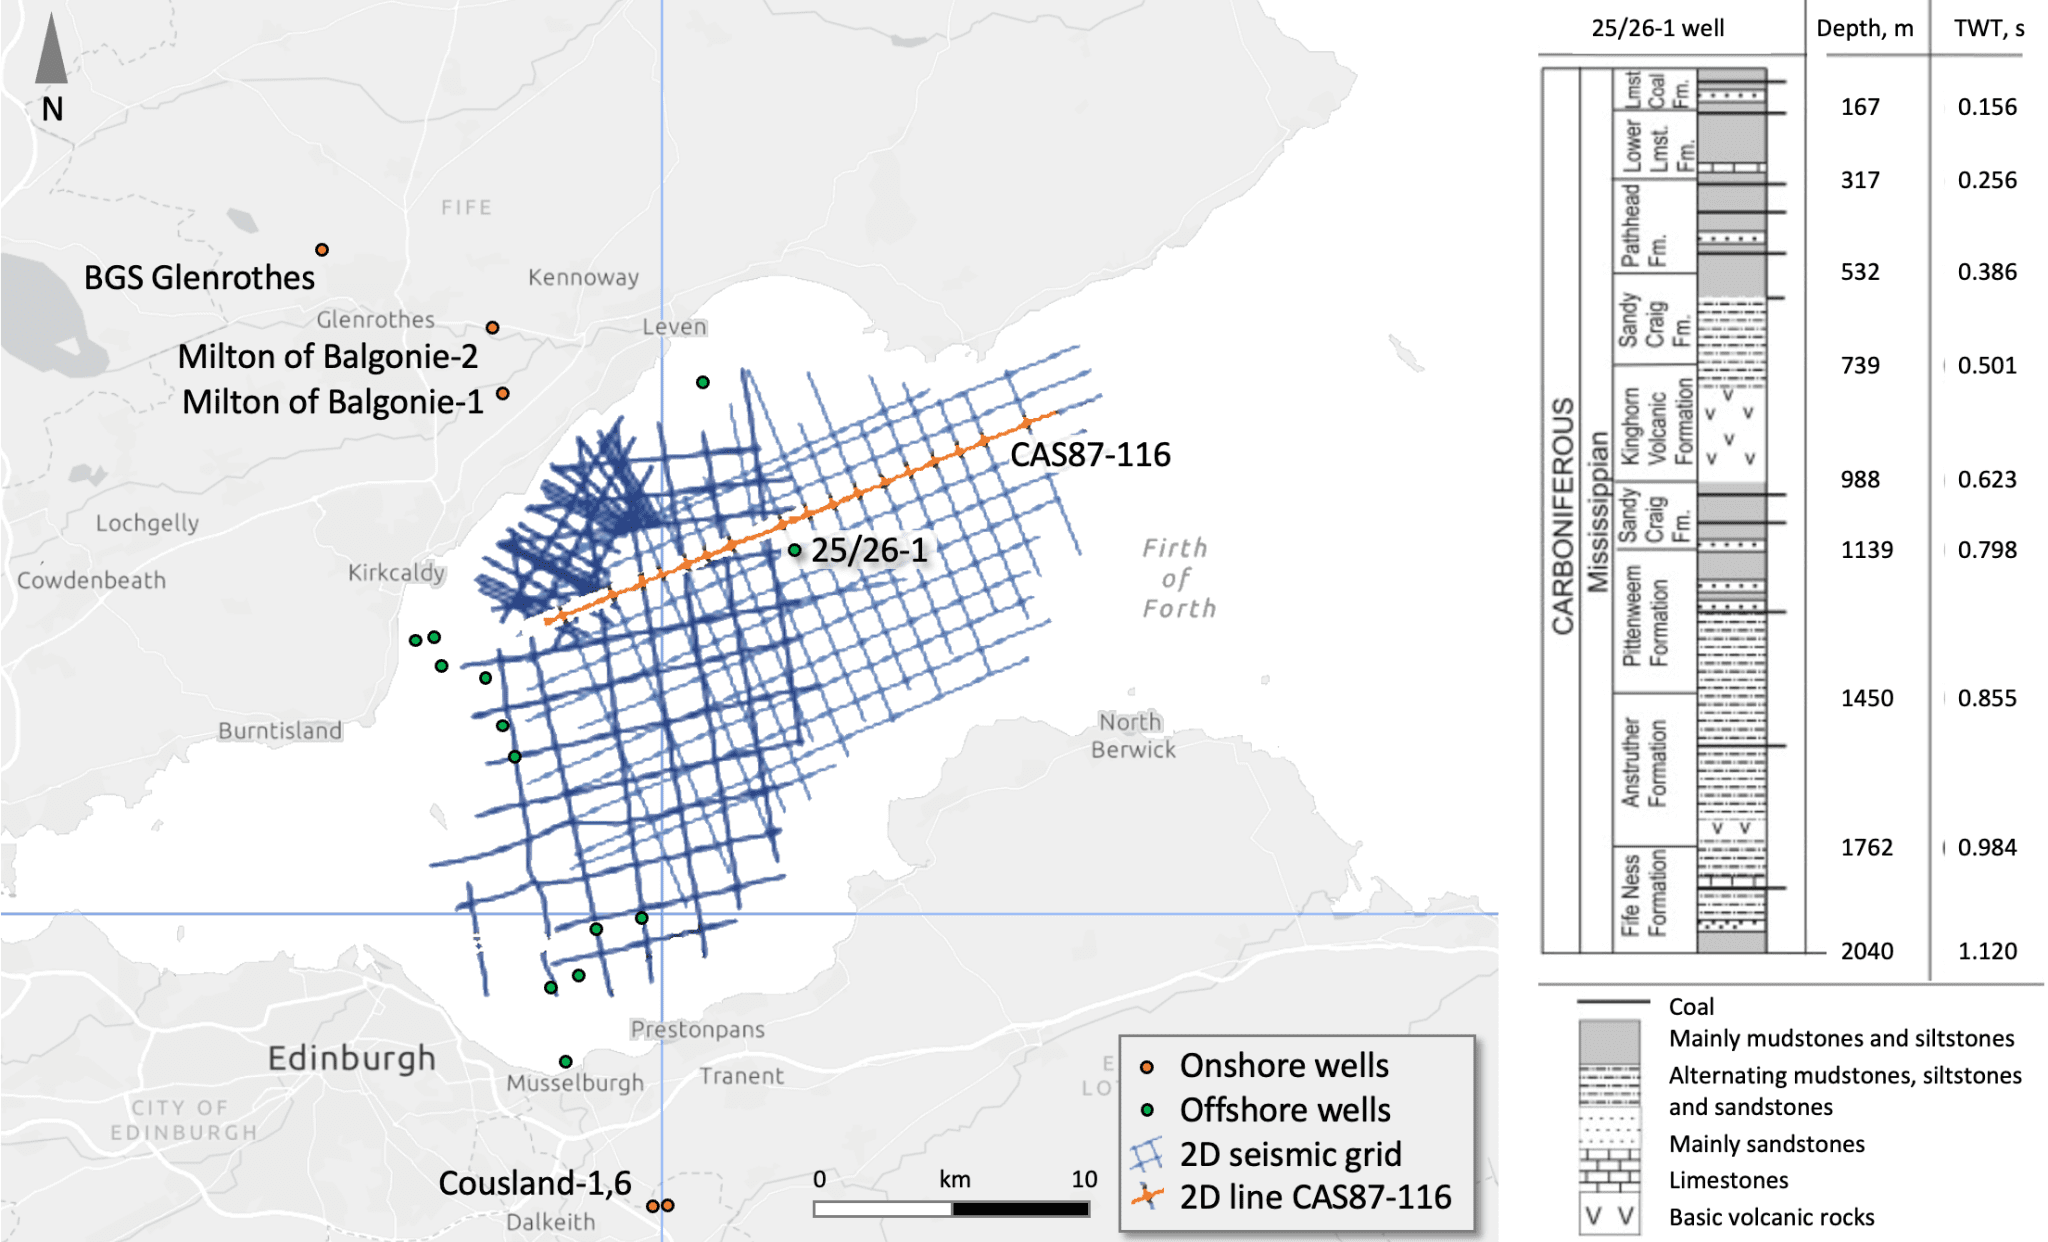
Figure 7. Forth Basin, location of 2D seismic data grid, interpreted line and exploration well 25/26-1.
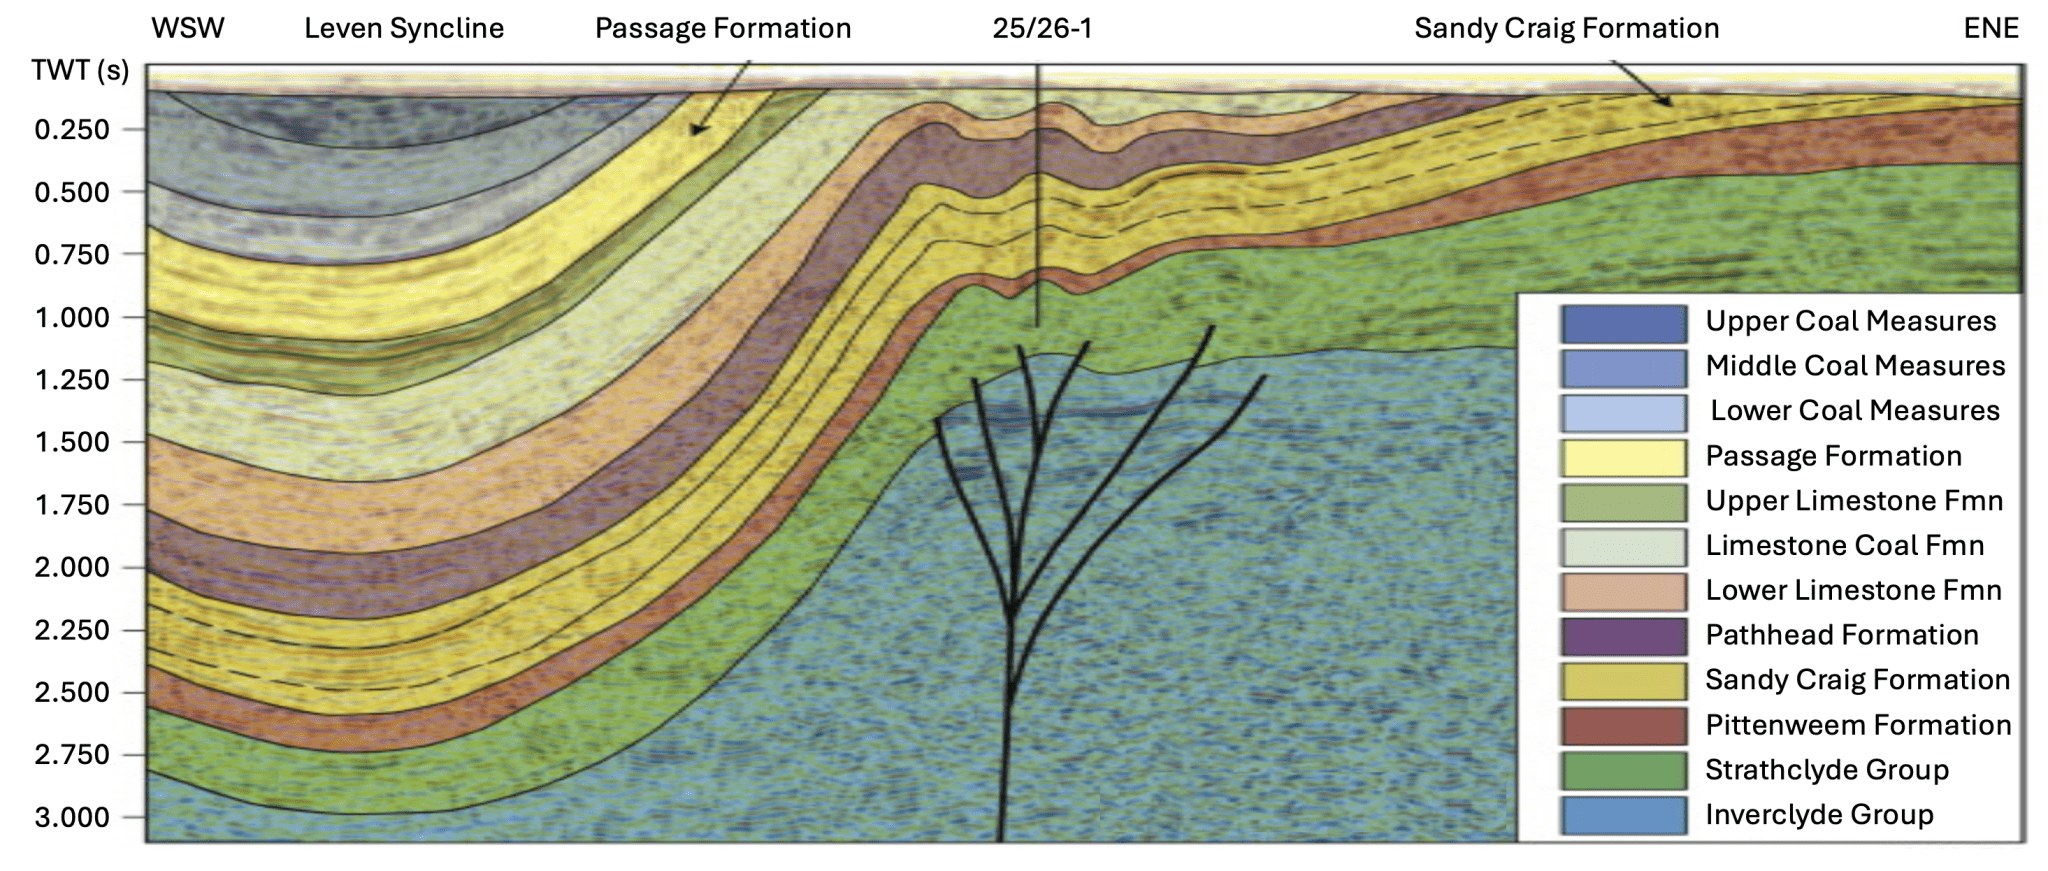
Figure 8. 2D seismic line CAS87-116, revealing the stratigraphy and structure of the Leven Syncline.
Suitability
The high volumes of brine injection associated with dissolved CO2 storage require a simple combination of a large regional aquifer with good reservoir quality and low structural complexity. The aquifer needs to provide a sufficient volume to help minimise pressure increases. Reservoir quality also minimises pressure increases. This implies above average porosity and permeability and thick continuous beds of high net-to-gross sandstones. Low structural complexity implies a simple geometry with a small number of faults that are transmissive, i.e. open to the lateral flow of brine, allowing the dissipation of injected fluids. These attributes are not clearly established for the Leven syncline – Figure 9.
A detailed analysis of the area (Monaghan et al. 2012) noted the poor data quality, lack of reservoir data, and structural complexity. These attributes are reflected in the low TRL status of the Forth Basin prospect.
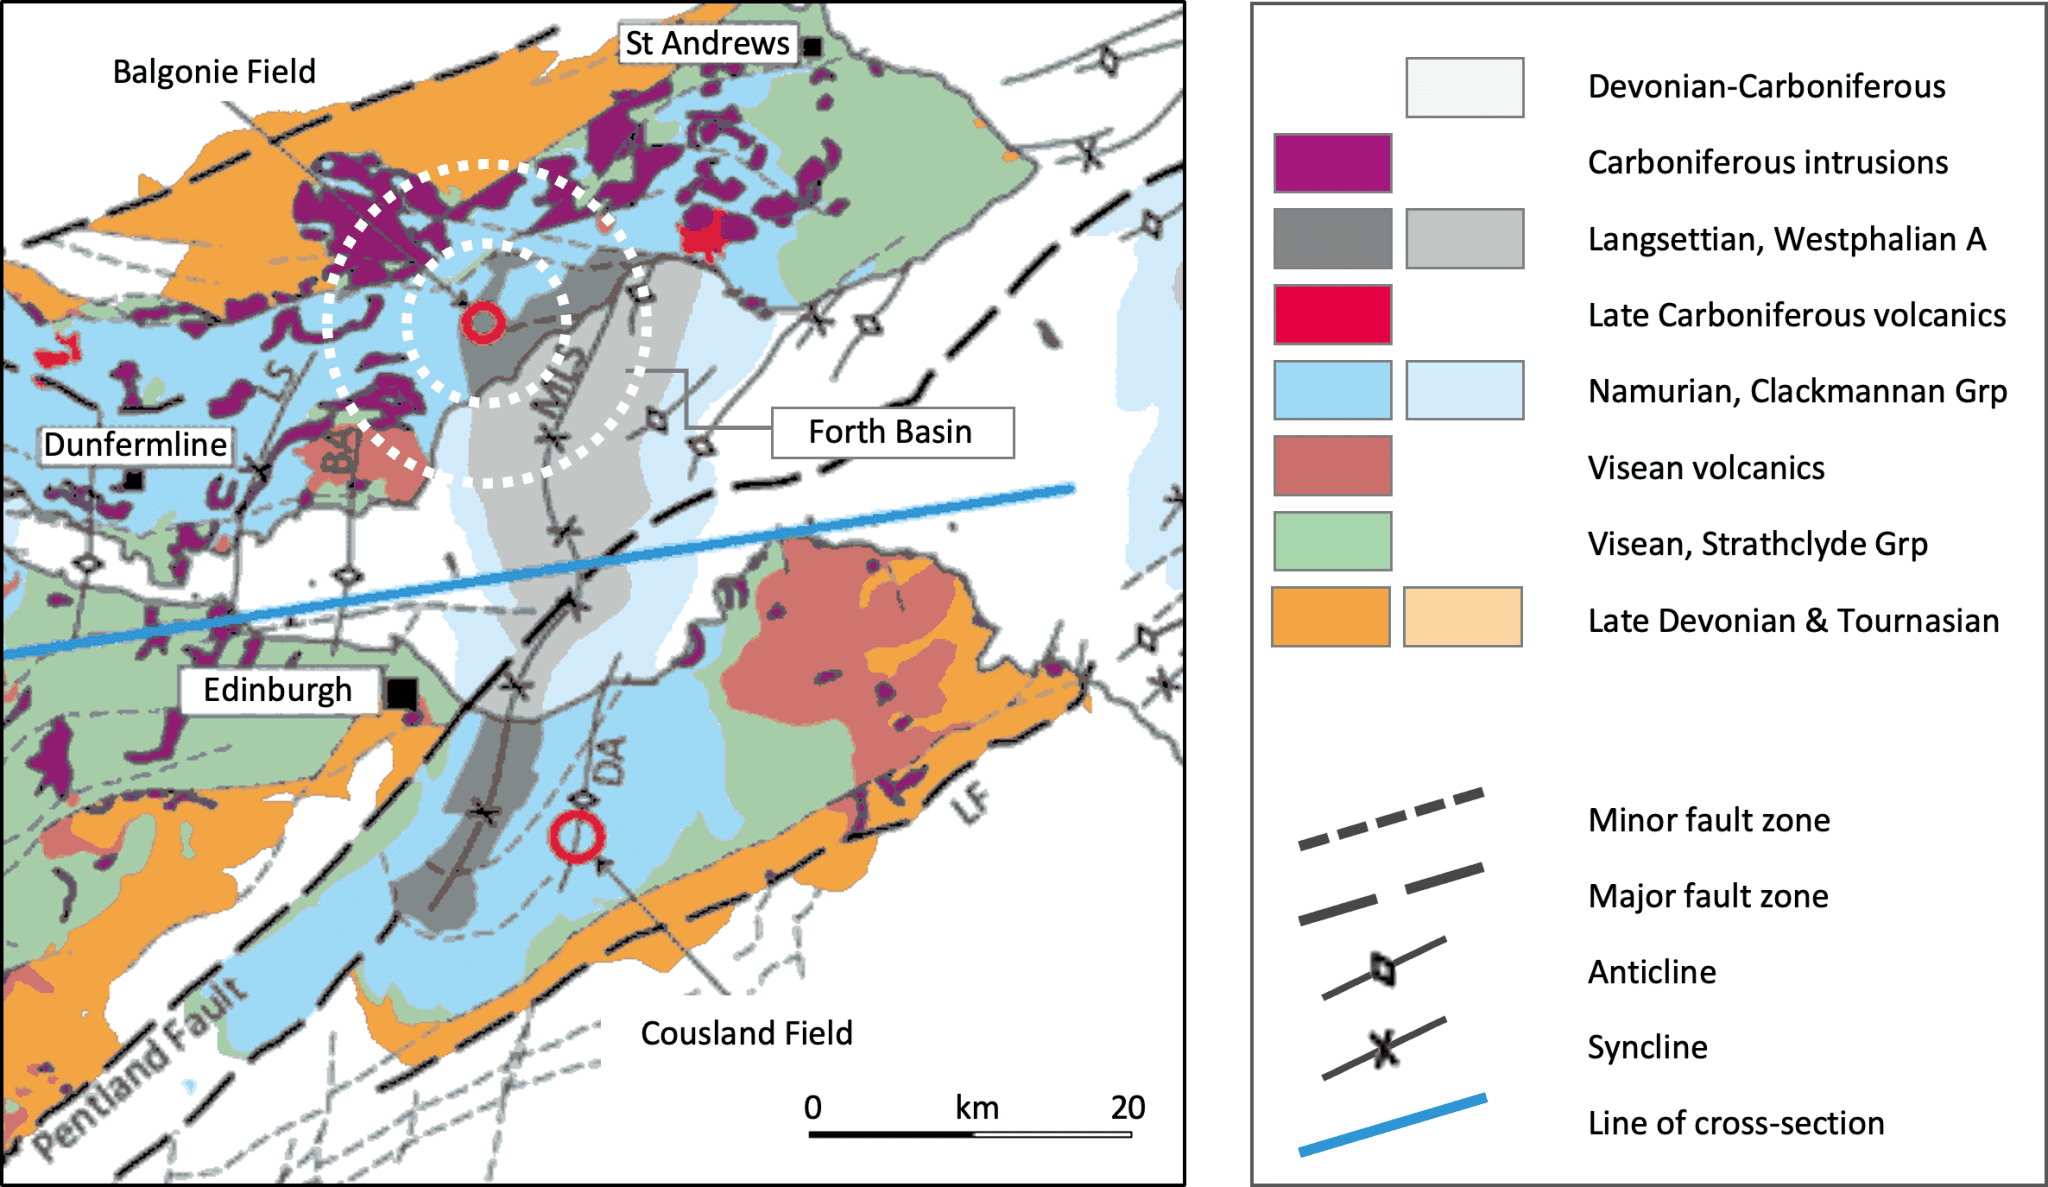
Figure 9. Forth Basin area regional geology, indicating the stratigraphic and structural complexity.
Sources of bio-CO2
Our analysis of over a hundred sources of bio-CO2 in Scotland produced a database of 98 sites with emissions that range from 3 to 360 ktpa – Figure 10. Four small distilleries, 1.6-2.8 ktpa, are included as these have already been selected for bio-CO2 capture. The total resource is 3.7 Mtpa. Almost all the sources, 91 sites, are grouped into five regional clusters – Figure 11.
Categories and Sectors
We have categorised the sources based on capture method: combustion, 89%, and separation, 11%. Separation at distilleries and anaerobic digesters is low-cost and high purity relative to post-combustion flue gas capture. The two categories are then split by process into nine sectors.
Biomass
Biomass, the largest sector at 46%, produces CO2 from the combustion of plant and animal waste. Biomass is often configured as combined heat and power (CHP). The 18 facilities in the database produce an average of 95 ktpa and total 1.7 Mtpa. The six largest sites, 150-360 ktpa, include Markinch, Steven’s Croft, and Morayhill. This accounts for 900 ktpa of bio-CO2 emissions. The smallest site, Gleneagles, emits 7 ktpa. Locations tend to be semi-rural.
Energy from Waste
Energy from Waste (EfW), the second largest sector, 29%, produces electricity and heat from the incineration of municipal waste, often in a CHP configuration. Roughly half of the emissions are bio-CO2 (Tolvik, 2024). The 13 sites emit a total of 1.1 Mtpa, average 84 ktpa. The five largest are amongst the top ten sources, total 0.6 Mtpa, average 126 ktpa. The largest, South Clyde Energy Centre, 158 ktpa, is planned for 2025. The smallest site, Binn, 38 ktpa, opens in 2026.
Anaerobic Digestion
Anaerobic digestion (AD) covers a range of dry and wet waste applications that produce raw biogas. AD tends to be small, with 39 sites in the database accounting for 0.5 Mtpa of bio-CO2, average 13 ktpa. The largest site, 44 ktpa, is the Girvan distillery. The smallest site, Crofthead farm, 3 ktpa. We identify five sectors where biogas is combusted on site:
- AD Landfill is the fourth largest sector overall after biomass, EfW, and distillery fermentation, with 18 facilities producing a total of 0.18 Mtpa, average 10 ktpa.
- AD Industrial is the second largest AD sector with 7 facilities producing 0.17 Mtpa, average 25 ktpa. Sites include distilleries, breweries, and pharma manufacturing.
- AD City Waste is the third largest AD sector with 6 facilities producing 0.08 Mtpa in total, average 14 ktpa. Sites process municipal wet streams such as food waste.
- AD Farming is the fifth largest AD sector with 6 facilities producing 0.04 Mtpa in total, average 7 ktpa. Sites process wet streams such as crop waste and silage.
- AD Sewage is the smallest bio-CO2 sector, with just 2 facilities in the database producing 0.02 Mtpa in total: Seafield, 16 ktpa, and Nigg, 8 ktpa.
Distillery Fermentation
Whisky distilleries produce CO2 during the mash fermentation stage. The CO2 can be easily separated using a simple wash process where pressurised water acts as a solvent. This generates a pure CO2 stream. Distillery fermentation (DF), 10%, is the third largest sector after biomass and EfW, with 20 sites producing 0.35 Mtpa in total, average 18 ktpa.
The three largest distilleries account for 0.2 Mtpa, average 66 ktpa; the remaining 17 sites account for 0.16 Mtpa, average 9 ktpa. The database includes four small distilleries: Tomatin, Speyburn, Tullibardine, and Balmenach, 1.6-2.8 ktpa. These are shortlisted along with Invergordon and North British for commercial bio-CO2 capture and storage (CCSL, 2024). Many of the 20 sites are located around Speyside as part of the Inverness cluster.
AD upgrading
AD biogas can be upgraded to biomethane by separating out the CO2 using a membrane filter. The biomethane is frequently sold directly into the natural gas grid. As with distilleries, this also generates a low-cost and high-purity stream of bio-CO2. AD upgrading is the seventh largest sector overall, 2%, with eight sites producing 0.07 Mtpa in total, average 8 ktpa. Sites include farms and industrial facilities located in semi-rural areas across the country.
Table 5. Bio-CO2 sources by sector. Note: the lowest cost sectors are highlighted in grey.
|
Sector, Bio-CO2 |
Category |
Sites |
Average |
Range, ktpa |
Total |
3.7 Mtpa |
|---|---|---|---|---|---|---|
|
Biomass |
Combustion |
18 |
95 ktpa |
7-360 |
1.70 Mtpa |
45.8% |
|
Energy from Waste |
Combustion |
13 |
84 ktpa |
38-158 |
1.10 Mtpa |
29.4% |
|
Distillery Wash |
Separation |
20 |
18 ktpa |
2-75 |
0.35 Mtpa |
9.52% |
|
AD Landfill |
Combustion |
18 |
10 ktpa |
4-32 |
0.18 Mtpa |
4.93% |
|
AD Industrial |
Combustion |
7 |
25 ktpa |
6-44 |
0.17 Mtpa |
4.67% |
|
AD City Waste |
Combustion |
6 |
14 ktpa |
6-24 |
0.08 Mtpa |
2.20% |
|
AD Upgrading |
Separation |
8 |
8 ktpa |
4-17 |
0.07 Mtpa |
1.76% |
|
AD Farming |
Combustion |
6 |
7 ktpa |
3-12 |
0.04 Mtpa |
1.08% |
|
AD Sewage |
Combustion |
2 |
12 ktpa |
8-16 |
0.02 Mtpa |
0.65% |
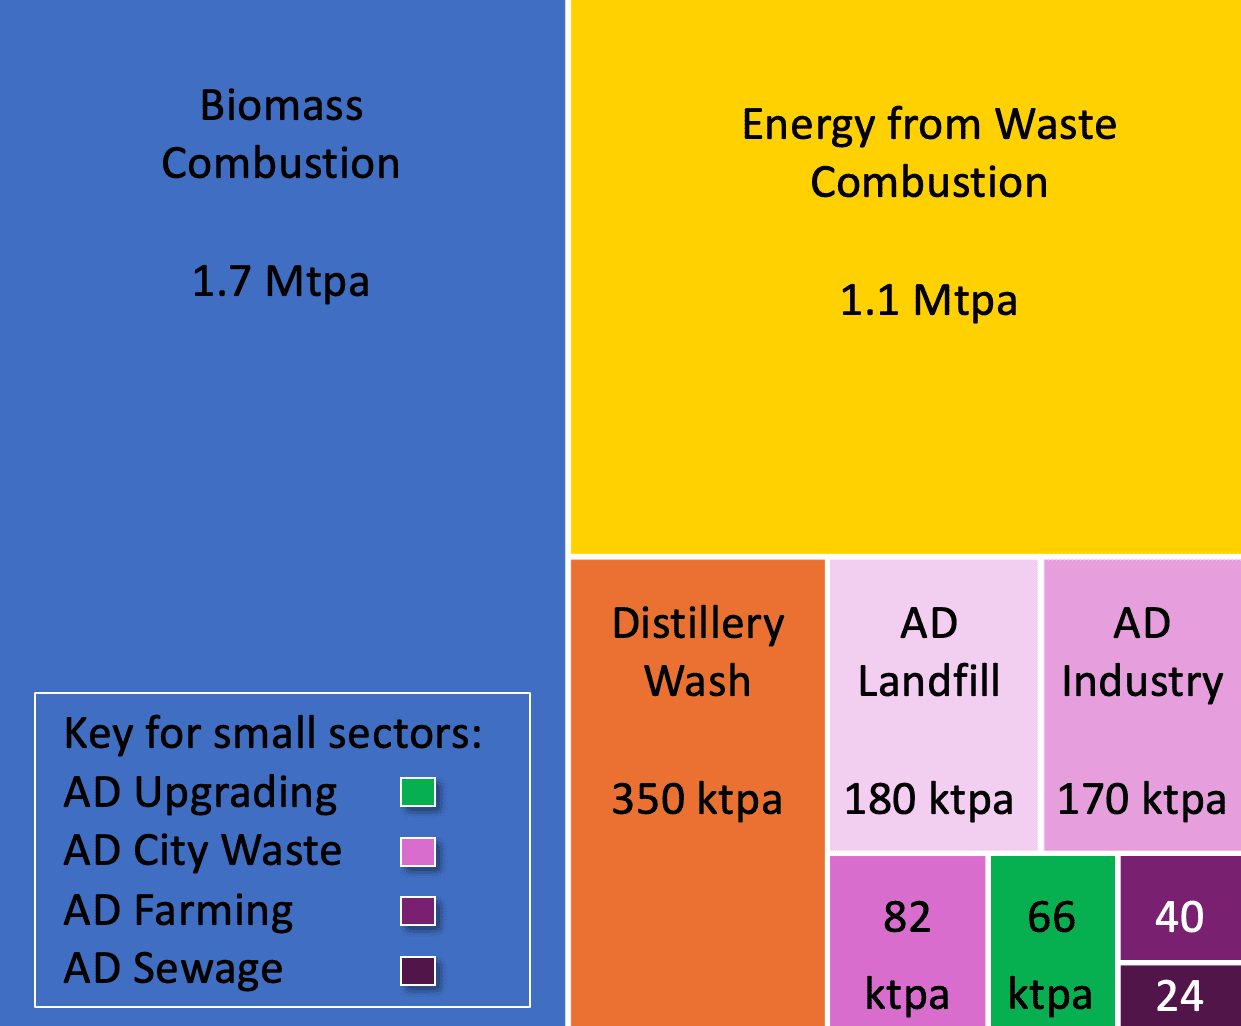
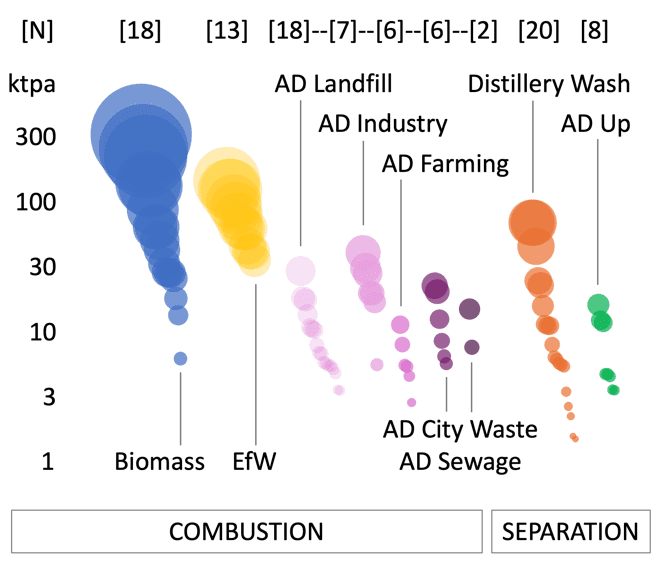
Figure 10. Bio-CO2 sectors. Distillery (orange) and AD Upgrading (green) are categorised as separation, yielding a low-cost CO2 source relative to post-combustion capture. Values in square brackets [18] represent the number of sources; area of circles represent the size of the source (ktpa).
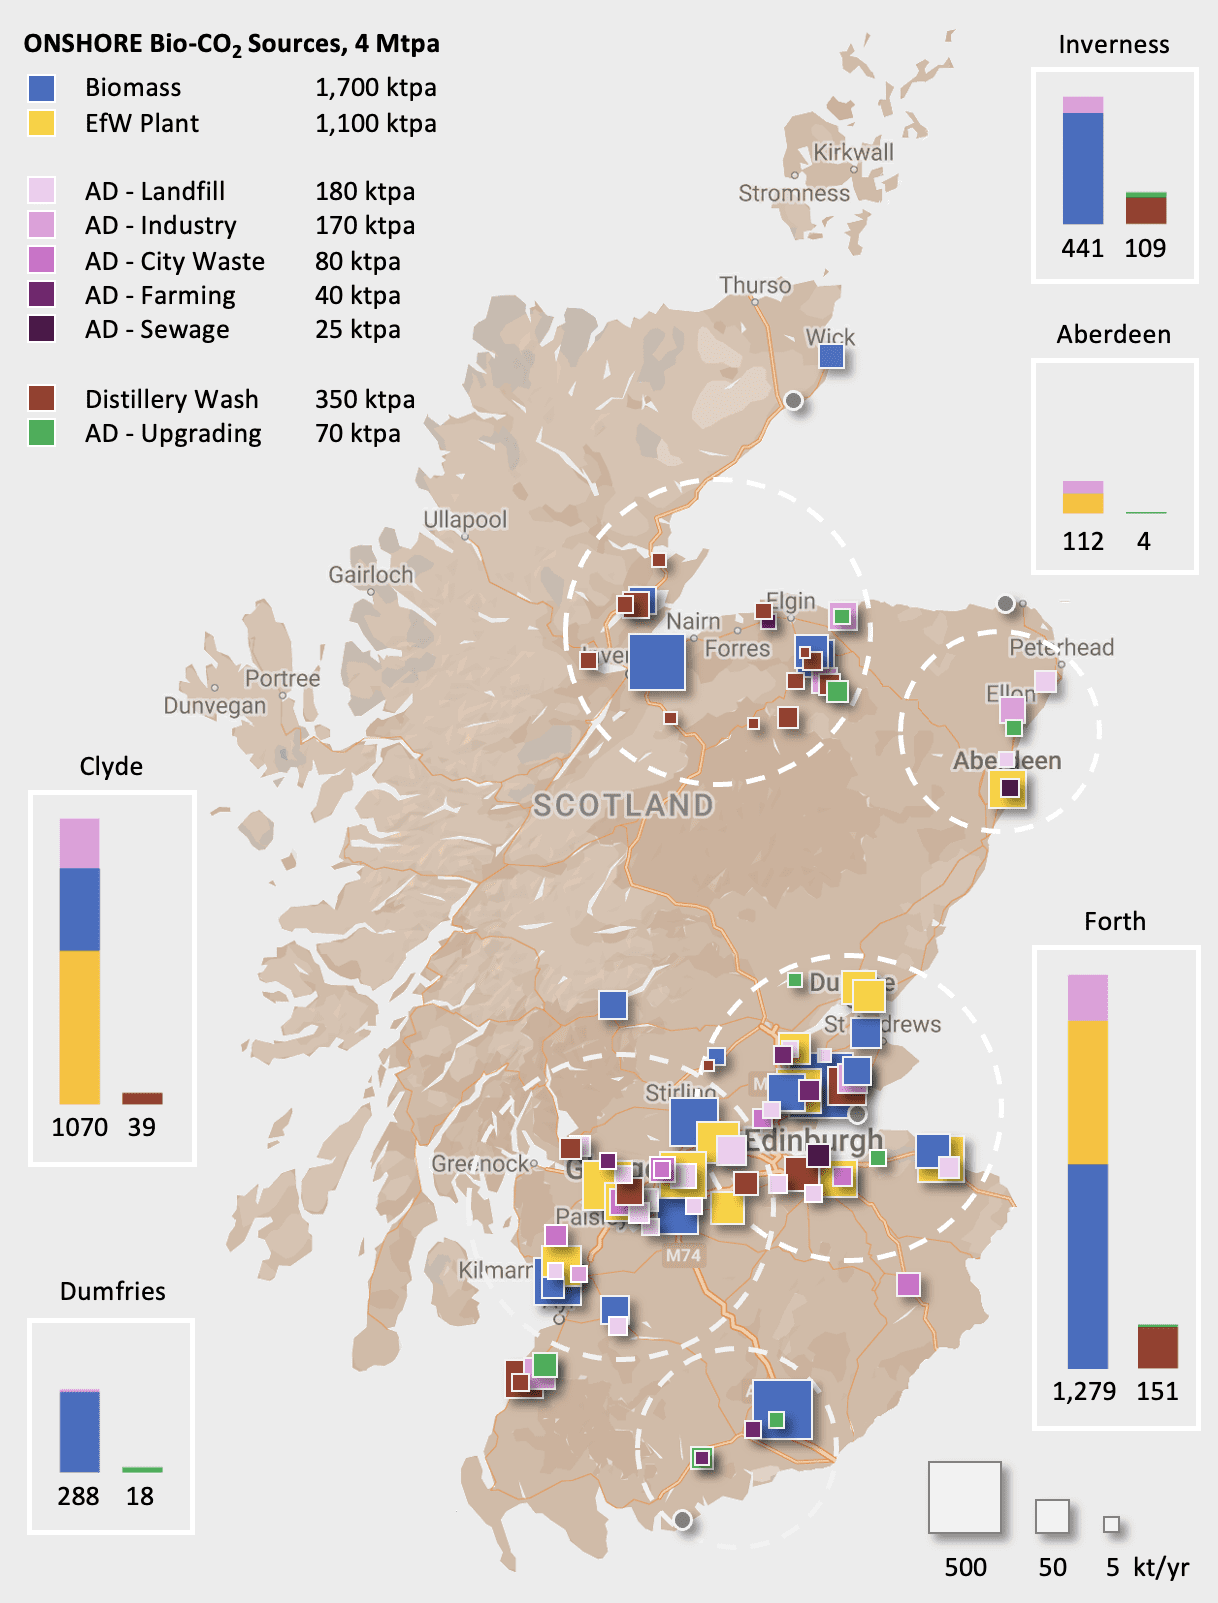
Figure 11. Onshore sources of bio-CO2 across Scotland. 91 of the 98 sites are located in five clusters.
Many low-cost distillery sources are located in the Inverness cluster, relatively close to the Lybster site. The five clusters are analysed by road distance from the nearest storage prospect in section 3.2. Also, note the overlap of the Forth and Clyde clusters at the terminus of the Feeder 10 pipeline. This highlights an interesting possible alternative to inshore storage, i.e. access to the Acorn offshore storage hub. This is discussed further in the summary.
Regional Clusters
We have grouped the sources into five clusters. The boundaries are marked by either a 100 km or 50 km diameter circle. Note, the sources east of Elgin are closer to Fraserburgh but included as part of the Inverness cluster given the primacy of Lybster as a storage candidate.
Inverness
The Inverness cluster, the third largest overall, falls within the Lybster catchment area. The cluster has 21 sites, producing 0.55 Mt of bio-CO2, and boasts a concentration of low-cost separation sources: 12 distilleries, 92 ktpa, and two AD upgraders, 18 ktpa. The average road distance to storage is high at 186 km. However, just over half of the cluster, 0.31 Mtpa, is within 150 km of Lybster: 5 distilleries, 43 ktpa, including the region’s largest distillery, Invergordon, 24 ktpa, which has been shortlisted for commercial CO2 capture; and 2 biomass plants: Morayhill, 323 ktpa, and Balcas, 28 ktpa, which is close to the Invergordon distillery. The remaining low-cost sources, 67 ktpa, are 200 to 240 km from Lybster by road.
Aberdeen
The Aberdeen cluster sits within the Fraserburgh catchment area, with six facilities producing 116 ktpa. The majority comes from five combustion facilities; the remainder from a small AD upgrading facility: Savock Farm, 4 ktpa. The largest source is the NESS EfW plant at 67 ktpa. The cluster has the third shortest average road distance to storage at 56 km.
Dumfries
The Dumfries cluster has five facilities producing 300 ktpa, mostly from the Steven’s Croft biomass plant, 0.28 Mtpa. The area includes two low-cost AD upgrading facilities producing a combined 18 ktpa. One of these, Crofthead, is already commercially capturing 13 ktpa, and has a separate CHP source, 3 ktpa, currently not captured. All the sites are within 70 km by road of the Solway Firth storage prospect. The cluster average at 48 km is the shortest overall.
Forth & Clyde
The Forth and Clyde clusters are closest to the Forth Basin storage prospect. These are the two largest clusters in our database, with a combined 59 sites producing 2.5 Mtpa. The area accounts for 69% of all combustion and 45% of all separation sources in the database; and includes some of the largest facilities including the Markinch and Caledonian biomass plants, 360 and 144 ktpa, and Cameronbridge distillery, 75 ktpa. Just over 0.84 Mtpa is within 50 km of the Forth Basin storage location, including Cameronbridge, 9 km, and Markinch, 10 km.
The North British distillery, 49 ktpa and 49 km by road from the storage location, is already commercially capturing CO2 for export to storage in Denmark. Low-cost separation sources account for 190 ktpa of bio-CO2 at an average road distance of 80 km from the storage location. It is worth noting the Feeder 10 terminus is located in the overlap of the two cluster boundary circles. Also of interest, are the significant local combustion clusters at Irvine, 290 ktpa, and Dunbar, 208 ktpa, which are 107 km and 109 km by road from the storage location.
Outliers
Seven outliers account for just 3% of all combustion, and 24% of all separation sources. The latter value reflects a concentration of low-costs sources in Ayrshire. This includes two facilities at the Girvan distillery: fermentation, 75 ktpa, and AD upgrading, 17 ktpa; and the neighbouring Ailsa Bay distillery, 7 ktpa. Combustion sources include Charlesfield AD, Borders, 18 ktpa, the Acharn biomass plant, Perthshire, 31 ktpa, and the Pulteney distillery, Wick, a small biomass plant, 19 ktpa. The latter is the closest source to Lybster.
Table 6. Bio-CO2 sources by cluster. Note: the sources outside clusters are highlighted in grey
|
Combustion |
Bio-CO2 |
Storage |
N |
Average |
Road |
Range, ktpa |
3.3 Mtpa |
|---|---|---|---|---|---|---|---|
|
Inverness |
441 ktpa |
Lybster |
7 |
63 ktpa |
197 km |
5-242 |
13% |
|
Aberdeen |
112 ktpa |
Fraserburgh |
5 |
22 ktpa |
57 km |
4-67 |
3% |
|
Forth |
1,362 ktpa |
Forth Basin |
25 |
51 ktpa |
46 km |
4-360 |
41% |
|
Clyde |
987 ktpa |
Forth Basin |
26 |
41 ktpa |
99 km |
5-158 |
32% |
|
Dumfries |
288 ktpa |
Solway Firth |
3 |
96 ktpa |
50 km |
3-279 |
9% |
|
Outliers |
112 ktpa |
Various |
4 |
28 ktpa |
86 km |
18-44 |
3% |
|
Separation |
Bio-CO2 |
Storage |
N |
Average |
Road |
Range, ktpa |
0.4 Mtpa |
|
Inverness |
109 ktpa |
Lybster |
14 |
8 ktpa |
181 km |
2-24 |
26 % |
|
Aberdeen |
4 ktpa |
Fraserburgh |
1 |
4 ktpa |
49 km |
4 |
1% |
|
Forth |
151 ktpa |
Forth Basin |
6 |
25 ktpa |
68 km |
2-75 |
36% |
|
Clyde |
39 ktpa |
Forth Basin |
2 |
19 ktpa |
114 km |
12-27 |
9% |
|
Dumfries |
18 ktpa |
Solway Firth |
2 |
9 ktpa |
46 km |
5-13 |
4% |
|
Outliers |
99 ktpa |
Various |
3 |
33 ktpa |
84 km |
7-75 |
24% |
Development timeframes
CCS is being rapidly deployed to meet demanding net zero targets. By our analysis, there are 32 projects across Europe with realistic timelines to storage by 2030 – Figure 12. Development timeframes have become crucial to delivering these targets, as policy makers seek to balance haste with due diligence. The exponential growth in demand for CDR credits is also exacerbating a supply imbalance for CO2 storage that early movers, notably Denmark (Stenlille), Iceland (Coda), and Norway (Northern Lights) are seeking to capitalise on. We observe that timeframes in these countries are the fastest in Europe at around five years.
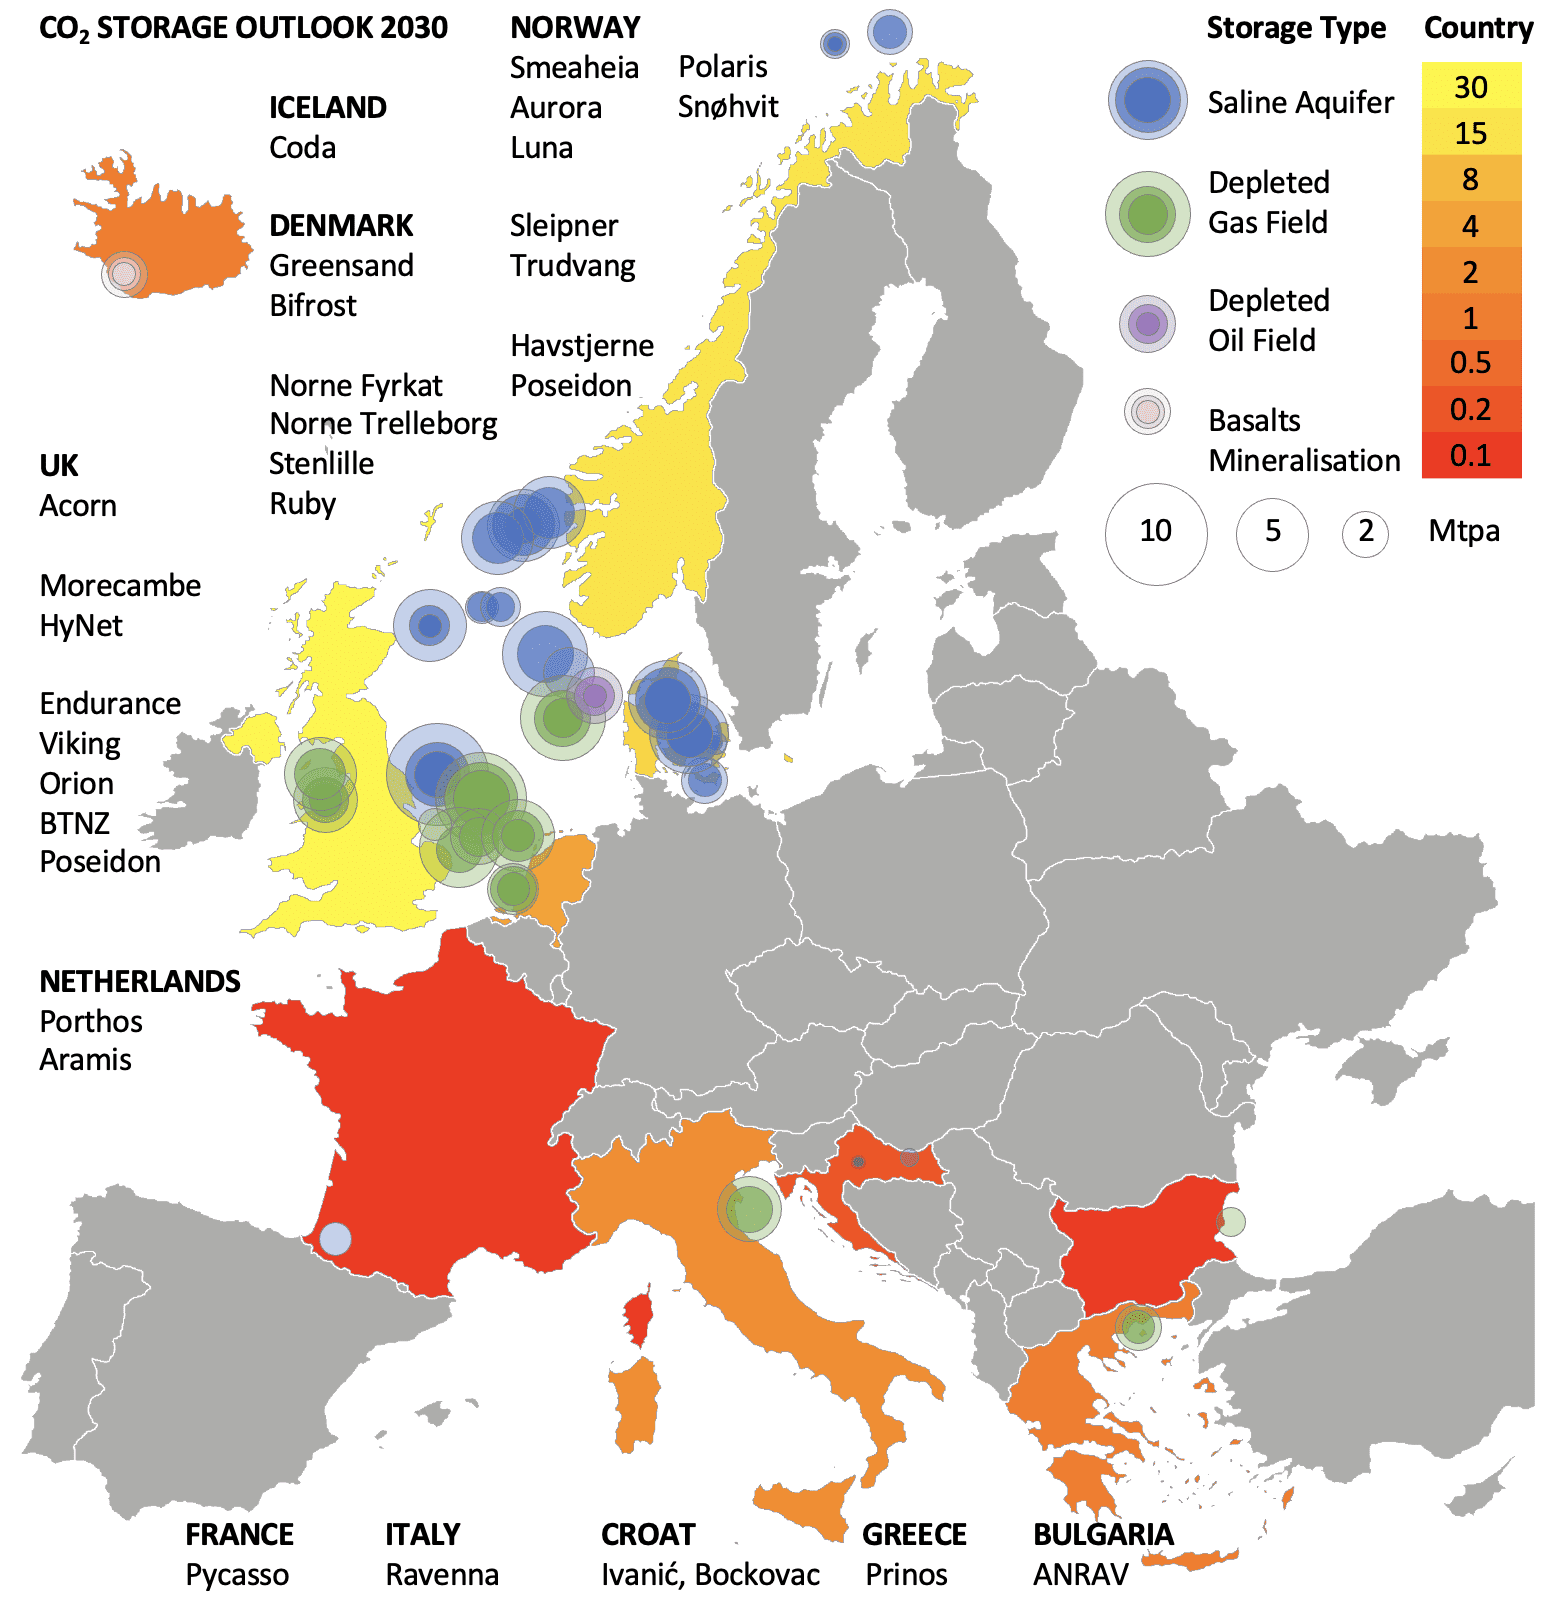
Figure 12. The outlook for European Storage, 2030. Seven countries have megatonne projects planned, with 64% of capacity in the North Sea. Countries in grey have no storage planned for 2030.
UK timelines
The NSTA, as the UK’s competent authority and carbon storage regulator, is instrumental in setting UK licensing timelines. The first UK carbon storage licensing round was held in 2022. The NSTA announced 21 accepted appraisal licences in September 2023, building on the experience of the previous seven licences. Each licence is tailored to the prospective storage site with a deadline for a storage permit application and specific requirements relating to the necessary maturation of the project for a permit application – Appendix D.
The first storage permits are expected no later than Q4 2024 for Endurance CS001 (East Coast Cluster) and Hamilton CS004 (HyNet North West). Assuming a two-year construction and commissioning period, first injection is expected no later than 2028 with minor delays possibly increasing that to 2030. It is worth noting that 21 of the appraisals are required to submit storage permit applications between 2026 and 2028, which may cause a significant bottleneck similar to Class VI well permitting delays at the Federal level in the USA – Appendix I.
Analysis of the 27 active licences indicates that the average appraisal time from early risk assessment to storage permit application is five years and three months. Examples of exceptionally short and long appraisals are the Scottish Cluster’s Acorn East licence (Storegga, two years) and the East Coast Cluster’s Bunter 42 expansion (BP, eight years). The former is supported by a decade of prior site characterisation. The latter is an exploration target that requires 3D seismic acquisition and an appraisal well. Allowing for construction and commissioning, storage projects expect to be operational, i.e. ‘on injection’, within eight years on average of an appraisal licence application.
EEA timeframes
Analysis for EEA projects is largely dependent on public statements of ambition. The outcomes are faster than the UK. The nine Norwegian projects average six years from initial application to expected operation. Denmark is relatively fast by comparison, averaging four years for its six projects. The two large Dutch projects, Porthos (2019) and Aramis (2021), expect to be operational within seven years. Pycasso, the French project launched in 2021, has the longest development period at ten years. The remaining projects for Bulgaria, Greece, Iceland, and Italy expect to be operational within five years of their start dates which range from 2021 to 2023. If the UK timings are indicative, ambitious EEA deadlines of less than six years for a third of the projects are likely optimistic and at risk of delays of one to five years. This may result a storage capacity substantially less than the EU target of 50 Mtpa.
Implications for inshore storage
Many storage projects are on timelines of around a decade characterised by three phases: a pre-licensing identification and application phase of approximately three years; an appraisal licensing phase that averages five years; a storage permit construction and commissioning phase of around two years. This is likely to hold true for Fraserburgh and the Solway Firth, the two less mature areas of interest identified in Chapter 2. Lybster is an exception, with several factors indicating a fast-track approach that could support a storage permit application within three years. This option is examined in the final chapter of this report.
Cost-revenue analysis
The following cost-revenue analysis for the capture, transport, and storage of bio-CO2 establishes to a good first approximation the potential value of developing onshore and inshore CCS in Scotland. The full chain cost is compared to available revenue from the recent emergence of a high-demand and low-supply voluntary CDR market.
Note that indicative costs for capture, transport, and storage are based on publicly available sources where possible. In the absence of published data, companies operating in Scotland, the UK, and Europe have been approached to provide a commercial estimate.
Capture
Capture is divided into two categories: combustion and separation. Combustion accounts for seven of the studied nine sectors and 89% of the bio-CO2, 3.3 Mtpa. This category costs more than separation as the capture is a post-combustion process on a low-purity and dilute flue gas stream, whereas separation from distilleries and biomethane upgraders is on a high-purity and concentrated CO2 stream that simply requires dehydration and compression.
The combustion sources in this study range from eight large biomass and EfW facilities, 130-360 ktpa, to twenty-five small AD sites, 3-12 ktpa. Post-combustion capture is sensitive to economies of scale, with many studies noting a wide range of capture costs that reflect the stream purity and size of the facility. For example, there is an average 43% increase in cost for an order of magnitude decrease in capture rate from megatonne to sub-megatonne projects (GCCSI, 2021).
The available literature focuses on large CCS applications, broadly defined as facilities emitting at least 100 ktpa (IEAGHG, 2024). A degree of generalisation is therefore necessary given that 89 of the 98 sources in this study emit less than 100 ktpa, with half the sources emitting less than 15 ktpa.
Where possible, we estimate a range for costs and assume the high cost given the predominance of small sources in our data.
Biomass is the largest sector in this study with sources averaging 95 ktpa. We estimate a low cost of £87 per tonne based on the levelised cost analysis of Lehtveer & Emanuelsson (2021) – Appendix J. We estimate a high cost of £128 per tonne based on analysis of emitters smaller than 100 ktpa by Beiron et al. (2022). We favour the high cost as representative – Table 5.
Energy from Waste is the second largest sector with average emissions of 84 ktpa. Two estimates were found with broadly similar costs: £81 and £109 per tonne (MVV, 2024; IEAGHG, 2024). We favour a high cost as the average plant capacity is small at under 200 ktpa of waste.
Anaerobic Digestion covers five sectors in the combustion category with low average emissions of 13 ktpa. We found no data on capture costs for AD combustion. We assume a low-cost of £128 per tonne from the biomass analysis, given the much smaller size of AD sources. In the absence of data, we conservatively assume a high cost of £136 per tonne based on a mean EfW cost, £95, multiplied by the order-of-magnitude scalar for combustion, 143%.
Separation produces highly concentrated streams of pure bio-CO2 (EBA, 2022). Distillery fermentation, average 18 ktpa, and AD upgrading, 8 ktpa, are the two sectors that use cryogenic distillation and membrane separation to capture the CO2. Global analyses provide a low-cost estimate of £30 (IEA 2021; NETL, 2023). In our opinion this reflects economies of scale for large bioethanol plants in the USA. A high-cost price of £60 per tonne is based on a commercial sales estimate for small emitters (E Nimmons, pers. comm., May 2024)[1].
Table 7. Estimated capture costs by sector, including % concentration of CO2 in emissions stream.
|
Sector, Bio-CO2 |
Category |
N |
Average |
Cost Range |
High Cost |
Stream |
|---|---|---|---|---|---|---|
|
Biomass Plant |
Combustion |
18 |
95 ktpa |
£87 – £128 |
£128 |
8-20% |
|
Energy from Waste |
Combustion |
13 |
84 ktpa |
£81 – £109 |
£109 |
6-12% |
|
AD Combustion |
Combustion |
39 |
13 ktpa |
£128 – £136 |
£136 |
10-20% |
|
Distillery |
Separation |
20 |
18 ktpa |
£30 – £60 |
£60 |
98% |
|
AD Upgrading |
Separation |
8 |
8 ktpa |
£30 – £60 |
£60 |
98% |
Transport
Truck transport is the simplest option, as rail transport of geographically dispersed sources would require onloading and offloading at rail heads with truck transport at both ends. A rail route north from Inverness, and clusters further south and east, terminates at Wick. No cost analysis of rail has been undertaken for this study.
Truck transport of CO2 is by a cryogenic T75 ISO tank as a liquid at -35°C and 22 bar. Each truck carries 20 tonnes. Assuming an injection rate of 100 ktpa and batch delivery over 6 days a week throughout the year, 16 truck loads per day are required. There is scarce literature on truck costs for Europe. However, a commercial estimate of £20 per tonne for a 100-mile round trip seems reasonable (E. Nimmons, pers. comm. May 2024) and is applied here – Appendix J. This is equivalent to £0.124 per tonne per km, which is similar to a recent cost estimate of £0.126 by Ricardo (2023) and $0.111 for the USA (Stolaroff et al., 2021). We presume that the slightly lower dollar estimate reflects lower fuel costs in America.
The average road distance to Lybster for the Inverness cluster is 191 km, with 87 ktpa available within 150 km. This includes 40 ktpa of low-cost CO2 from four distilleries; the remaining 47 ktpa are from two biomass sources, Balcas and Pulteney. The Inverness cluster has enough low-cost CO2 to supply 109 ktpa at an average road distance of 188 km, equivalent to £24/tonne.
With the exception of Savock Farm at Ellon, 4 ktpa and 300 km, the remaining low-cost sources are more than 360 km away. It follows that road transport costs for 100 ktpa over 10 years are £20-50 million with an opportunity to source all of the bio-CO2 from the Inverness cluster and low-cost sources at £24 million. It is worth mentioning that a hydrogen fleet would reduce life cycle emissions and road wear, being lighter than an electric vehicle equivalent (Low, 2024).
Storage
Three storage cost scenarios are considered. The most detailed is Lybster, outlined below. The second scenario is a first approximation for Fraserburgh and the Solway Firth. This is similar to Lybster but less mature and more challenging with respect to appraisal wells, seismic data, and location. The third scenario is a consideration of potential costs for the Forth Basin proposal, the least mature of the storage options.
Lybster
The cost analysis for Lybster assumes 100 ktpa of CO2 over a decade which would account for half of the expected capacity estimate of 2 million tonnes – section 2.2.1. This would potentially mature the understanding of the site towards a further decade of injection.
Buffer: The site will require tanks for the temporary storage of CO2 prior to injection. We assume four tanks with sufficient capacity for an injection rate of 100 ktpa, equivalent to an injection rate of 12 tonnes/hr. This allows for 10 days of well maintenance per year. While the production and injection of CO2 is continuous, transport occurs in discrete runs and is a batch process. Redundant capacity is required on-site to provide operational flexibility. Assuming 16 trucks a day and 125% capacity based on LNG shipping experience, 4 x 100 m3 onsite tanks would buffer flow to the wellhead. For comparison, the twelve Northern Lights tanks at Øygarden are 6 times the size to accommodate one shipload, 7,500 m3. The capital investment for the Lybster storage tanks and site works is assumed to be around £1 million.
Compression: The site will require a compressor to take the liquid CO2 to the required pipeline pressure of 150 bar for the well system and injection at reservoir conditions. We estimate this to require 120 kWh per tonne after Psarras et al. (2020) at an operational cost of £30 per tonne with no capital investment, assuming rental of the equipment from a service company. The operational cost over 10 years at 100 ktpa is estimated at £30 million.
Injection: The site also requires an injection well. The discovery well, 11/24-1, is unsuitable. The well is designated AB3 (NSTA, 2023), i.e. permanently abandoned and seabed cleared, with no infrastructure in place. Additionally, three cement barriers isolate the well. The re-purposing of 11/24-1 would be technically challenging and very expensive.
The production well, 11/24-3y, is currently suspended with the onshore surface infrastructure in place. The current drilling pad can be re-used and the well re-purposed. 11/24-3y is an extended reach well that has been designed to encounter a 173 m succession of the target reservoir sandstones compared to the 25 m of the vertical exploration well, 11/24-1. This favours good injectivity. It is estimated that the conversion cost of an onshore well to CO2 injection is approximately £1-2 million (IEAGHG, 2022). This is an order of magnitude cheaper than an offshore injection well at £10-15 million based on NSTA estimates of recent North Sea drilling costs at £5-10 thousand per meter (NSTA, 2023). We conservatively assume a combined conversion and maintenance cost for the well of £3 million.
Appraisal: The storage site requires an expert reinterpretation of the existing 3D seismic cube, including depth conversion and static model construction (three months) and dynamic simulation of the reservoir (nine months). This would match the known fluid production history and forward model the reservoir response to CO2 injection and storage (9 months). We estimate the cost of this appraisal study to be about £0.5 million. A related geomechanical study of similar duration and rigour is also estimated to cost £0.5 million. The budget for a two-year appraisal that includes both the modelling and geomechanical studies, a well repurposing study, and standard elements of the NSTA appraise-assess-define framework for appraisal licensing is estimated to cost approximately £3 million.
The cost estimates sum to a sub-total is £37 million. Assuming operational costs for the site of £250,000 per annum, the capital investment and operational costs sum to £40 million. Not addressed here are monitoring and verification, as these are highly dependent on the technologies chosen. The design of the monitoring programme is an important element of the appraisal licence. However, if we conservatively assume a monitoring cost of £20 million over the lifetime of storage and add £10 million for conformance and decommissioning, this indicates a storage cost of £70/tonne based on 100 ktpa over 10 years.
Fraserburgh and Solway Firth
These two prospective sites require an offshore installation and operation. Assuming suitable targets are discovered at 1,000-2,000 m depth, the well drilling cost would be £10-15 million. A compressor would need to be either located offshore on a small operational platform, or at the landfall end of a 16 km pipeline. While there is scant literature on short pipeline costs, we conservatively assume a cost of £50 per tonne based on the analysis of Johnsson et al. (2017). The 10 year 100 ktpa cost is £50 million. The cost of an offshore operational platform is tentatively estimated at £10 million. Note that no cost estimate was found for this element.
Appraisal costs reflect the need to reinterpret the existing seismic over the area at £2 million, plus the possibility of needing 100 km2 of new 3D seismic for exploration and appraisal at £5 million. Further appraisal requirements will likely increase the appraisal budget to at least £10 million. From the Lybster cost breakdown, we can add on the cost of temporary storage, £1 million, compression, £30 million, maintenance for the well, £3 million, and monitoring of the site, £20 million. It follows that the total cost for Fraserburgh and Solway Firth would be, to a very rough approximation, around £140/tonne, i.e. double the estimate for Lybster.
Forth Basin
No cost analysis is undertaken for the Forth Basin, as our recommendation is for this prospect to proceed as an experimental pilot study with a nominal injection rate of 10 ktpa. The site would require an injection well with the wellhead located onshore to reduce costs. However, the research budget would need to cover the cost of the well, and handling of the onshore dissolution of CO2 into brine extracted from the well. Any research proposal is likely to be costed at more than £10 million for the well alone. The brine extraction, mixing facility, and re-injection are likely to more than double the well cost. However, no data was found on the latter elements. As such, an accurate costing is beyond the scope of this study.
CDR market
The European Union and UK have yet to regulate a CO2 removal requirement. However, the voluntary market for carbon dioxide removal (CDR) is rapidly emerging, with rumours of Microsoft, Shopify, and Stripe buying credits valued at USD1,000 per tonne from Iceland’s Carbfix and Climeworks projects in 2021. Climeworks is offering public CDR subscriptions at USD1,500 per tonne (WP, 2024). These are based on direct air capture (DAC) and CO2 mineralisation in the young and reactive basalts of Hellisheiði, 20 km to the east of Reykjavik.
A different price signal for permanent storage has recently emerged in Europe. In 2023, the European Commission approved the Danish NECCS fund (DKK 2.6 billion, €350 million) for the permanent geological storage of CO2 from direct air capture and biogenic sources; the projects must be operational by 2026. In April 2024, Denmark awarded NECCS funding to three bio-CO2 companies to remove 1.1 Mt of CO2 between 2026 and 2032 – Table 8[2].
Table 8. Awarded NECCS funding for CDR and CCS in Denmark, April 2024.
|
Company, Country |
NECCS |
Storage |
Contract |
DKK / tonne |
GBP/tonne |
|---|---|---|---|---|---|
|
BioCirc biogas, DK |
2026-2032 |
Stenlille |
130.7 ktpa |
968.5 |
£110 |
|
Bioman biogas, DK |
2026-2032 |
Stenlille |
25 ktpa |
1,117.5 |
£127 |
|
Carbon Capture Scotland, UK |
2026-2032 |
Stenlille |
4.65 ktpa |
2,600 |
£297 |
These credits have been negotiated on the voluntary carbon market, and tentatively establish a low CDR value of £110. Ørsted, the Danish power company, are also contracted by Microsoft to capture 3.67 Mt of bio-CO2 over 10 years which will be exported to Northern Lights for a combined transport and storage cost of around €100 per tonne. The Ørsted credit value is unknown. However, given the much higher value of credits for geological storage in Iceland, we favour the high value of £297 as indicative of European CDR pricing in the near future.
Value proposition
Applying the high-cost prices for capture, transport, and storage, and assuming storage at Lybster, we can estimate a full chain cost. Low-cost bio-CO2 is sourced from the Inverness cluster. A combined capture and storage rate of 100 ktpa is assumed for a period of 10 years.
£60 per tonne for bio-CO2 from separation sources, primarily distilleries
£24 per tonne for transport for an average road distance of 188 km
£70 per tonne for storage from buffering tanks to decommissioning
- Full chain CCS cost estimate: £154 per tonne
- Voluntary market CDR credit revenue: £297 per tonne
- Net return on investment over 10 years: £143 million
Conclusions
The following section poses six questions that draw out the major themes and outcomes of our research. The answers are intended to highlight actionable policy directions that may support the rapid development of domestic CCS on small but lucrative bio-CO2 sources.
Can Scotland develop inshore bio-CO2 storage by 2030?
The short answer is yes. The key metrics are 3.7 Mtpa of available bio-CO2, including 109 ktpa of the lowest cost sources, mainly distilleries, within 188 km of the inshore Lybster prospect. This is a good source-sink match for a site that has an expected 2.1 Mt capacity. First injection by 2030 will require a rapid formal appraisal and regulated consents to permit storage.
The remaining prospects identified in this study are much less mature and characterised by locations that require a substantial investment to appraise. A realistic timeline for these prospects is 2035-2040 with no clear indication at this stage that the prospects are suitable.
How can this be funded?
There are several ways to fund the appraisal of Lybster, which we estimate will cost about £3 million and take three years. Commercial interest may be sufficient to raise capital. This may be through a capture company that is seeking storage, or as a joint venture between the capture company, whisky distilleries and their parent companies. A successful appraisal will lead to construction and commissioning, including site works such as tank installation and well engineering, which we estimate to cost £3-5 million. An approximate budget of £10 million is needed.
We note the strong narrative structure of decarbonising international brands within a cultural tradition. This may attract global corporations who wish to associate themselves with carbon dioxide removals that have a story to tell. As a strategic project for Scotland, the appraisal costs may be partly underwritten by government funding.
On commissioning, verified carbon storage certificates can be issued on the voluntary market at an estimated price of £300 per tonne. On injection, assuming a sustained injection rate of 100 ktpa and a 20% mark-down of storage to removal, the site would generate an annual revenue of £24 million. No subsidy would be needed once storage has commenced. This would contribute to both Scotland’s economic growth and a just transition to net zero.
How quickly can this be done?
The fastest appraisal-to-permit timelines in Europe are about three years. These fast-track appraisals rely on an aggressive pursuit of a commercial opportunity and a background of available data and mature understanding of the technical risk. Lybster has both the interest and the technical maturity. The missing piece is the necessary legislation to support a legal consent for the appraisal license and storage permit if successful. The legal advice is that the necessary consents may only require a transfer of existing UK regulations to Scottish law.
How much bio-CO2 capture is available?
In total, we have identified 3.7 Mtpa of available bio-CO2. This is far in excess of the initial requirement for inshore storage, which we estimate at 0.1 Mtpa. The 3.6 Mt surplus and its geographic concentration in the central belt suggests that offtake to Acorn via the Feeder 10 pipeline ought to be considered as a parallel strategy to inshore storage, noting that this could be a considerable time in the future – Figures 13 and 14.
Combustion source capture is relatively high cost at around £120 per tonne. Separation is much more valuable at £60 per tonne. Distilleries and AD upgraders are common at the low end of the range, making up nearly half of the smallest 27 sites that average 5 ktpa, and one-third of 22 sites that average 10 ktpa. Significantly, there are 14 separation sources near Inverness that may support 21 modular capture units assuming 3-5 ktpa per unit, i.e. sufficient to batch load 16 trucks at 20 tonnes per day for a 100 ktpa supply to Lybster.
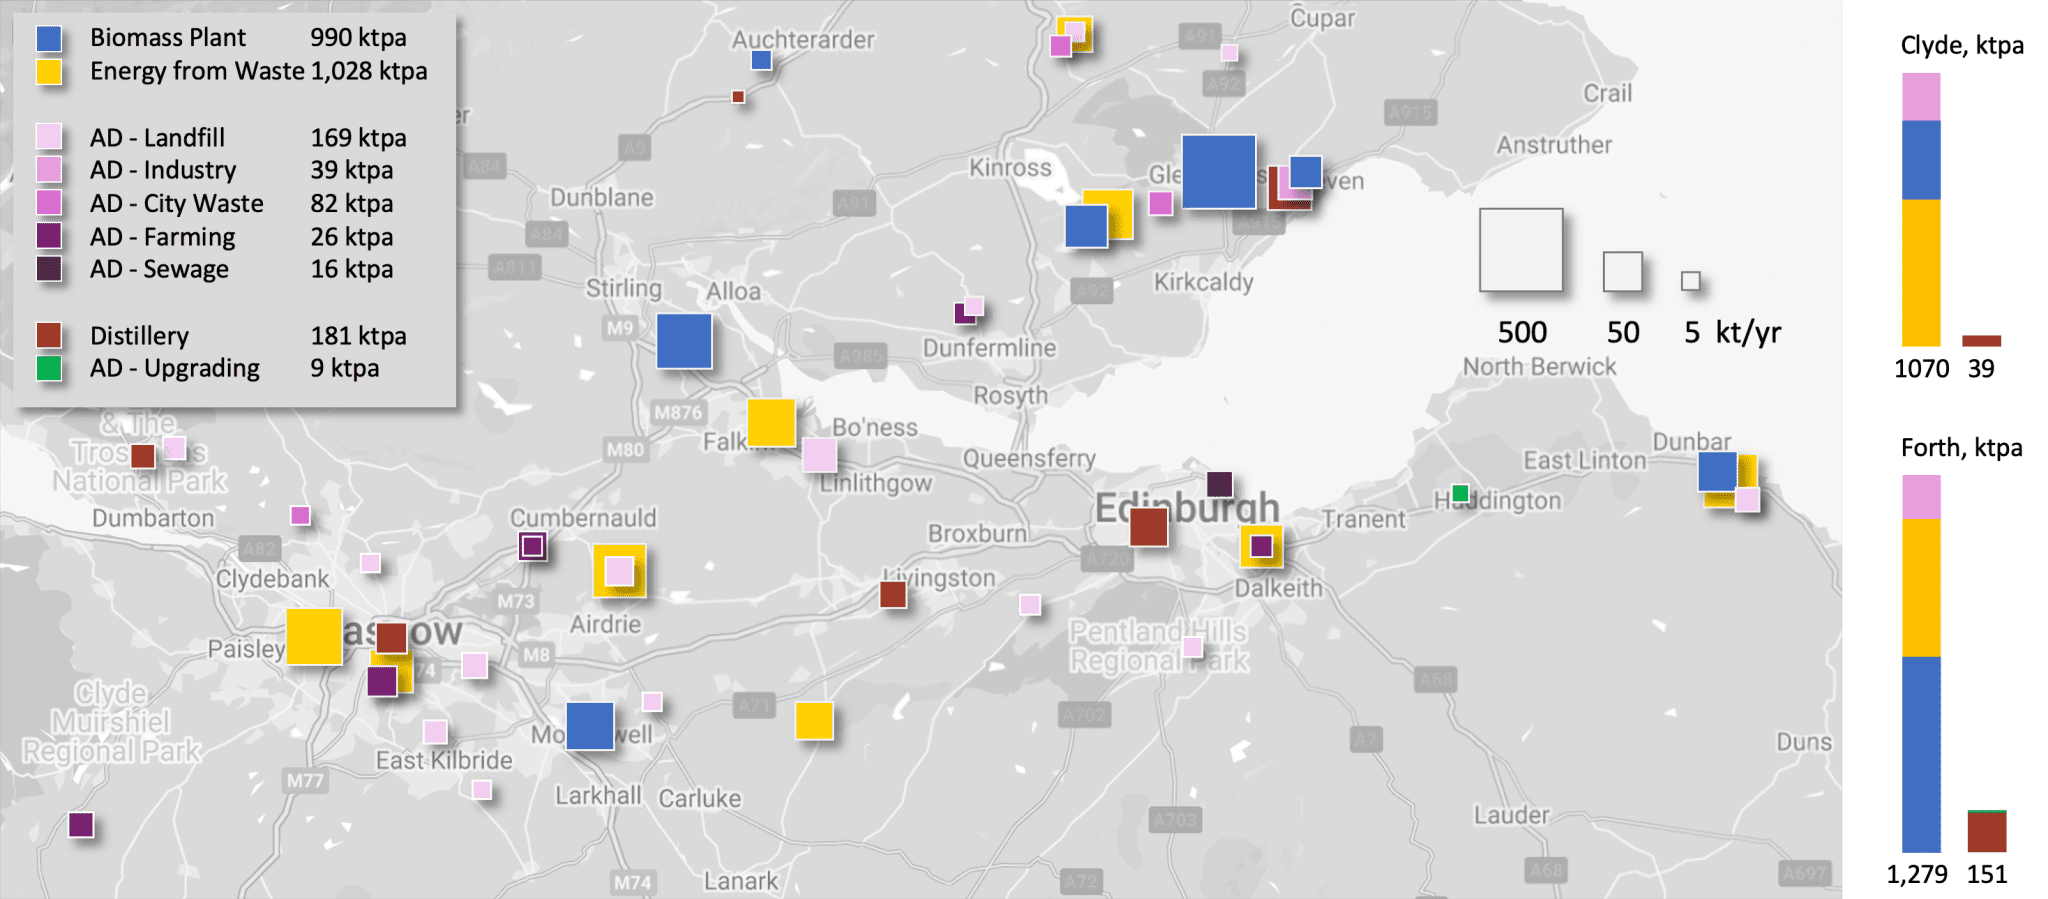
Figure 13. Central Belt sources: 2.3 Mt of combustion bio-CO2 is available, of which 0.3 Mt is from 28 small AD sites; another 190 ktpa of separation bio-CO2 from 6 distilleries and 2 AD biogas upgraders.
How much storage capacity is available?
Based on current data, our analysis found that only the Lybster prospect has potential commercially viable storage capacity – expected to be 2.1 Mt. This would be sufficient for 20 years of storage at an injection rate of 100 ktpa. This is not significant in terms of overall storage capacity in the North Sea or in terms of Scotland’s overall statutory climate targets but would provide an opportunity to showcase Scotland as a global frontrunner for CCUS technologies.
2.1 Mt of storage would generate £500 million in CDR revenue at 100 ktpa – an injection rate that is much lower than the technical limit for CO2 storage, which is generally thought to be around 700 ktpa. The low estimate is 0.35 Mt, which would result in only three to four years storage and a revenue of £72 million. The high estimate of 9.4 Mt would be more than sufficient to provide storage out to 2090 at a revenue in excess of £1.5 billion.
What policy actions need to be taken?
The legal opinion is that minor amendments to existing regulations are required to license storage appraisals and storage permits in the territorial waters of Scotland. To repeat the summary from Chapter 1: CO2 storage involves multiple activities under different licensing regimes. It may well be, however, that insofar as existing regulations could be relied upon, the process of modifying existing statutory instruments could be fast. This would really be a question for those with a better insight into the technical detail and political due process.
The government may also consider if it is helpful to fund the appraisal of Lybster partially or wholly, at an estimated cost of £3 million, which could commence immediately in anticipation of the required amendments being in place to sanction the outcomes and grant a storage permit. Assuming a construction and commissioning term of 1-2 years, the legislative changes would need to be in place by 2028 to support an on-injection outcome by 2030.
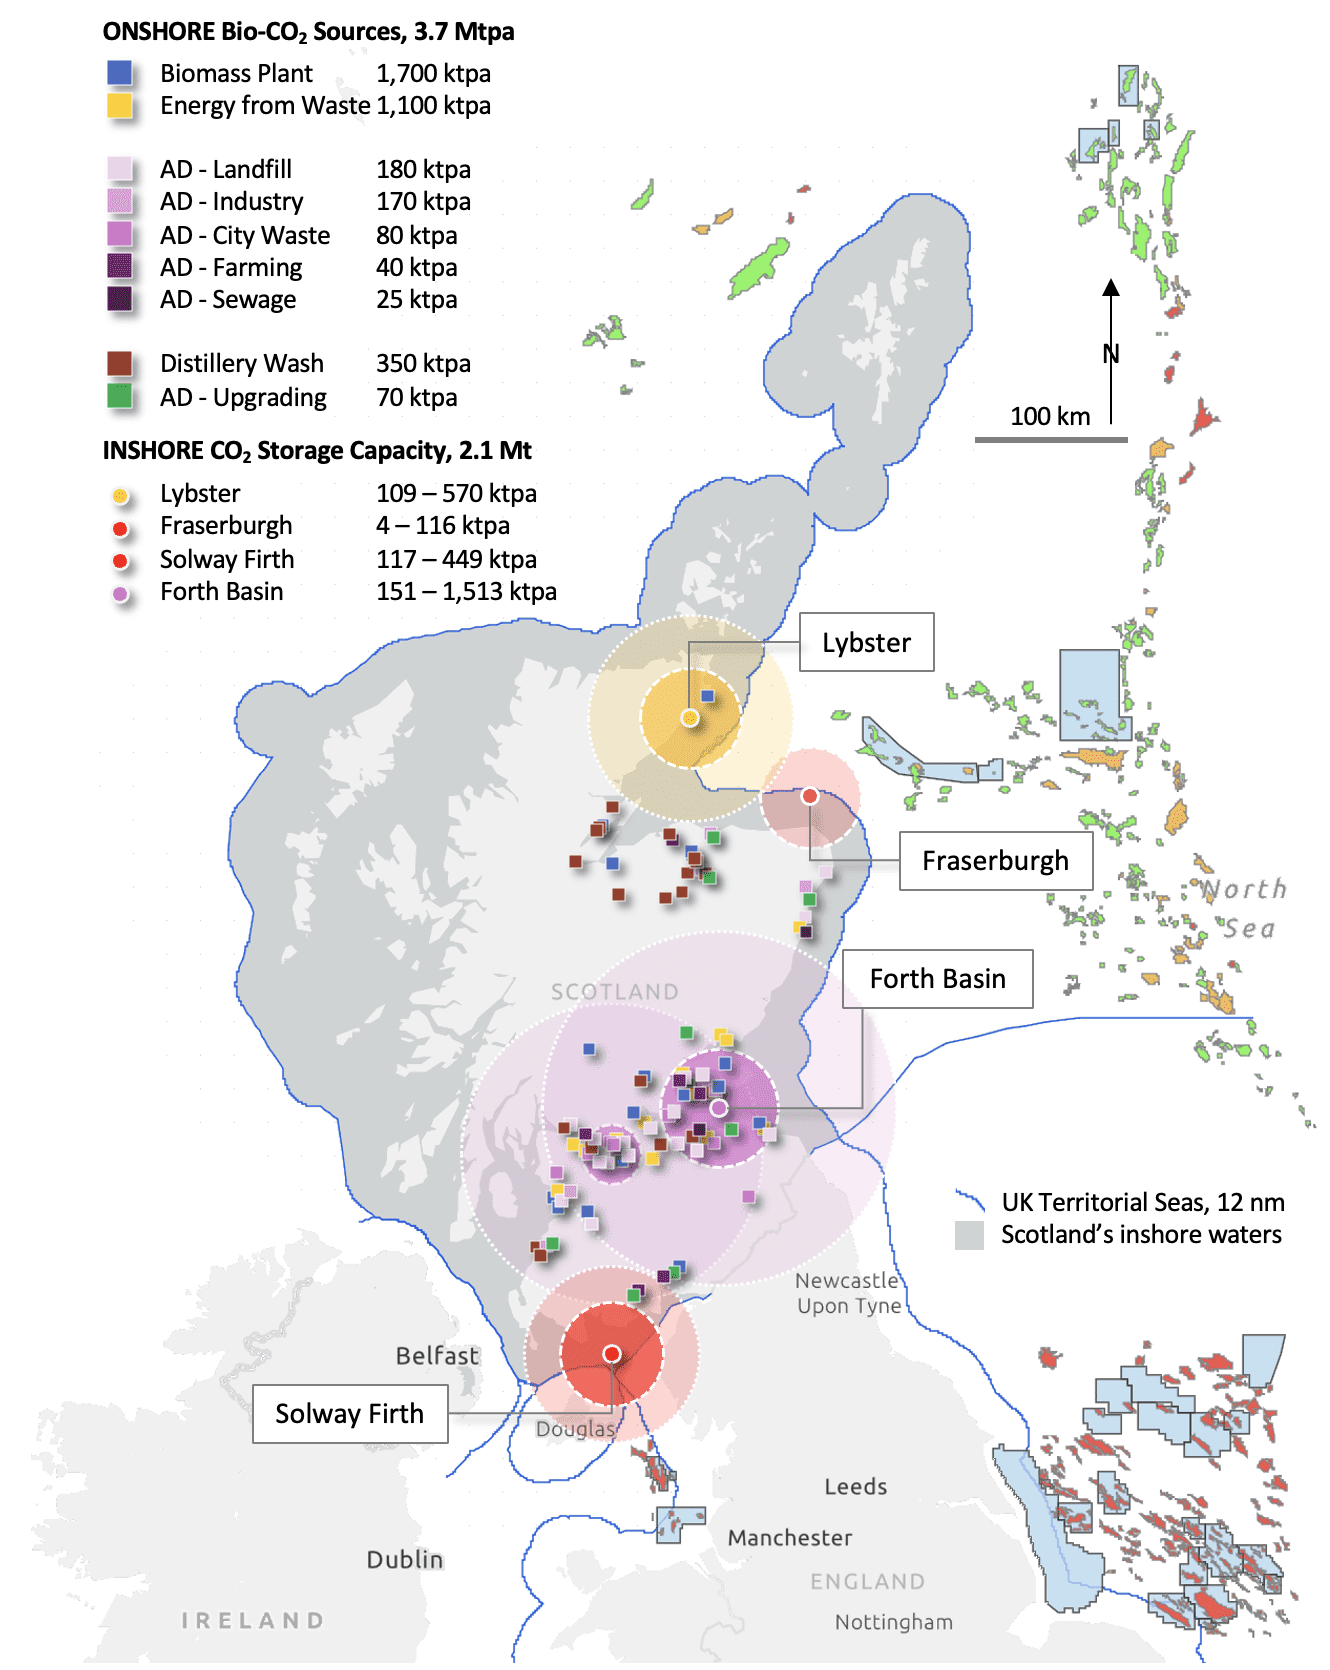
Figure 14. Storage prospects by maturity and available bio-CO2 from the 98 sources. The inner circle represents the available separation CO2; the lighter outer circle represents the combustion CO2. Note: the Clyde circles are not associated with a prospect but included for relevance to Feeder 10.
Vision
Storegga has proposed that Acorn will include a NET contribution (Storegga, 2022a). This was originally envisaged as a direct air capture project but timelines and capture costs for this technology suggest that bio-CO2 has a greater likelihood of supporting 2030 targets. We envision two bio-CO2 scenarios that potentially provide significant tax revenue to Scotland.
Scenario 1: Low-cost separation sources at £60 per tonne provide the highest profit and earliest opportunity for taxation. For Lybster, 100 ktpa is available from the Inverness cluster of distilleries. For Feeder 10 and Acorn, 200 ktpa is available from the central belt.
Scenario 2: More costly but larger combustion sources, primarily biomass and energy-from-waste plants at £120 per tonne provide 2 Mtpa of CO2 to Feeder 10. For Lybster, a large biomass plant, Morayhill, potentially doubles and then trebles the 100 ktpa injection rate if early well performance and capacity indications support expansion. This may include possible satellite prospects such as Knockinnon and Braemore.
Storage taxation: Assuming a 10% tax on storage only, this would harvest a nominal £7 per tonne on a storage cost of £70 per tonne – our estimate for Lybster; Storegga has published a transport and storage cost of £45 per tonne for Acorn (Storegga, 2022b). Taxing the full chain yields £15 on a CCS cost of £150. A tax on net profit would also yield £15 assuming a £300 credit.
Credit taxation: A yet more lucrative option would be to tax the CDR credit, yielding £30 on a nominal £300 per tonne – Figure 15. The supply-demand imbalance for permanent removals suggest high prices may be sustained for at least a decade as early storage capacity is primarily being booked to industrial clusters and fossil CO2, which is priced as a reduction on the ETS market.
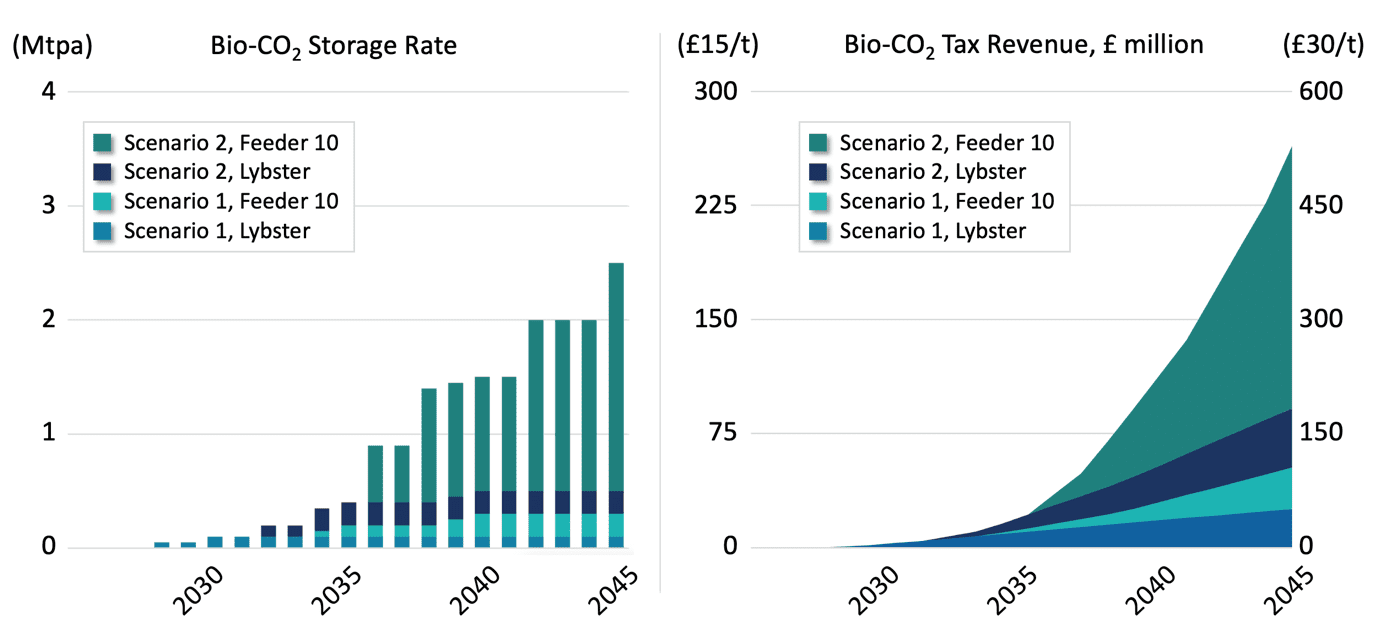
Figure 15. Storage rate and potential tax revenue for two described Lybster and Feeder 10 scenarios.
Worth noting is that a successful demonstration of profitable storage and permanent removals at Lybster would potentially catalyse a race to capture separation bio-CO2 from AD sources. This would drive decentralised farm-scale emissions control, upgrading of biogas to biomethane and displacing fossil methane from local energy networks and the grid where a connection is available.
A boutique demonstration of storage at Lybster also has the advantage of being driven by commercial incentives and timelines, with the possibility of positively disrupting the cluster timelines and NET outcomes, especially for the second scenario.
References
Beiron, J et al (2022). Carbon capture from combined heat and power plants – Impact on the supply and cost of electricity and district heating in cities. International Journal of Greenhouse Gas Control, 129.
BEIS (2024). BEIS: Heat Networks Planning Database (January 2024). Available at: www.data.gov.uk/dataset/8a5139b3-e49b-47bd-abba-d0199b624d8a/beis-heat-networks-planning-database (Accessed May 2024)
Brownsort, P (2018). Negative Emission Technology in Scotland: CCS for Biogenic CO2. SCCS. Available at: www.sccs.org.uk//Negative_Emission_Technology_in_Scotland.pdf
(Accessed May 2024)
CCSL (2024). Carbon Capture Sites. Carbon Capture Scotland Ltd. Available at: www.carboncapture.scot/capture-sites (Accessed May 2024)
CDR.fyi (2024). Trending on Track? 2023 Year in Review – CDR market continues to see explosive growth. Available at: www.cdr.fyi/blog/2023-year-in-review (Accessed Feb 2022)
Dee, S et al (2005). Best practice in structural geology analysis. First Break, 23, 4.
DESNZ (2024). Energy Trends: UK renewables – Renewable electricity capacity and generation for 2023. Available at: www.gov.uk/government/statistics/energy-trends-section-6-renewables (Accessed May 2024)
DUKES (2022). Digest of UK Energy Statistics (DUKES): Renewable Sources of Energy, DUKES Chapter 6: Statistics on Energy from Renewable Sources. Department for Energy Security and Net Zero. Available at: www.gov.uk/government/statistics/renewable-sources-of-energy-chapter-6-digest-of-united-kingdom-energy-statistics-dukes (Accessed May 2024)
EC (2007). Sustainable power generation from fossil fuels: aiming for near-zero emissions from coal after 2020. European Commission Communication, January 2007. Available at: eur-lex.europa.eu/legal-content/EN/TXT/?uri=celex:52006DC0843 (Accessed May 2024)
Eke, P et al (2011). CO2 brine dissolution and injection for storage. SPE Project F&C, 41-53.
ENDS (2024). ENDS Waste & Bioenergy. Available at: www.endswasteandbioenergy.com (Accessed May 2024)
Energyst (2023). Iona Capital invests in biogenic CO2 pioneers Carbon Capture Scotland. Available at: theenergyst.com/iona-capital-invests-in-biogenic-co2-pioneers-carbon-capture-scotland (Accessed May 2023)
GCCSI (2021). Technology Readiness and Costs Of CCS. Report. Available at: www.globalccsinstitute.com/wp-content/uploads/2021/03/Technology-Readiness-and-Costs-for-CCS-2021-1.pdf (Accessed May 2024)
Gibbins, J et al (2024). Evidence Review of Emerging Techniques for Carbon Dioxide Capture using Amine-Based and Hot Potassium Carbonate Technologies under the IED for the UK.
HSE (2024). Agency agreements, memoranda of understanding and concordats, and working arrangements protocols. Health and Safety Executive. Available at: www.hse.gov.uk/agency-agreements-memoranda-of-understanding-concordats/index.htm#pageContainer (Accessed May 2024)
IEAGHG (2024). Techno-Economic Assessment of Small-Scale Carbon Capture for Industrial and Power Systems. Report. Available at: ieaghg.org/publications/techno-economic-assessment-of-small-scale-carbon-capture-for-industrial-and-power-systems/ (Accessed May 2024)
Keenan, H (2023). The Lybster Field: A prospect for CO2 storage in the Inner Moray Firth, Scotland. MSc Thesis, Supervisor Gilfillan, S. School of GeoSciences, University of Edinburgh.
Lehtveer, M & Emanuelsson, A (2021). BECCS and DACCS as Negative Emission Providers in an Intermittent Electricity System: Why Levelized Cost of Carbon May Be a Misleading Measure for Policy Decisions. Frontiers in Climate, 3.
Low, J (2024). Pathways to decarbonising heat and transport in Scotland using hydrogen. PhD thesis, University of Edinburgh.
Monaghan, A et al (2012). New insights from 3D models at analogue CO2 storage sites in Lincolnshire and eastern Scotland, UK. Proceedings of the Yorkshire Geological Society, 59.
MVV (2024). Range €80-€110/tCO2 provided by MVV Environmental for a 700 ktpa capacity EfW in Mannheim, Germany. MVV Environmental pers comm.
NNFCC (2023). The Official Information Portal on Anaerobic Digestion. Available at: www.biogas-info.co.uk/resources/biogas-map/ (Accessed May 2024)
Ofgem (2024a). Renewables Obligation (RO) Annual Report 2022-23 – (Scheme Year 21). Available at: www.ofgem.gov.uk/publications/renewables-obligation-ro-annual-report-2022-23-scheme-year-21 (Accessed May 2024)
Ofgem (2024b). Renewables and CHP Register (2024). Accredited Stations. Available at: renewablesandchp.ofgem.gov.uk/Public/ReportManager.aspx (Accessed May 2024)
Patterson, J & Paisley, R (2016). CO2 EOR policy and regulations in Scotland, SCCS Report.
REPD (2024). Renewable Energy Planning Database (REPD): January 2024. DESNZ. Available at: www.gov.uk/government/publications/ (Accessed May 2024)
Ricardo (2023). Negative Emissions Technologies (NETS): Feasibility Study. Report. Available at: www.gov.scot/publications/negative-emissions-technologies-nets-feasibility-study/ (Accessed March 2024)
SEPA (2022). Scottish Pollutant Release Inventory 2022 Full data. Available at: www.sepa.org.uk/environment/environmental-data/spri/ (Accessed May 2024)
SG (2022). Securing a green recovery on a path to net zero: climate change plan 2018–2032 – update. Available at: www.gov.scot/publications/securing-green-recovery-path-net-zero-update-climate-change-plan-20182032/ (Accessed May 2024)
Smith, M et al (2011). CO2 aquifer storage site evaluation and monitoring. CASSEM Report.
Stolaroff et al (2021).
Statista (2024). Bioenergy. Available at: www.statista.com/outlook/io/energy/renewable-energy/bioenergy/worldwide (Accessed May 2024)
Storegga (2022a). Mitsui and Storegga Conclude Memorandum of Understanding on Commercialization of Direct Air Capture Technology. Press release, March 2022. Available at: storegga.earth/news/2022/press-releases/ (Accessed June 2024)
Storegga (2022b). Project Dreamcatcher – Low Carbon Direct Air Capture. Phase 1 Report. Available at: www.gov.uk/government/publications/direct-air-capture-and-other-greenhouse-gas-removal-technologies-competition (Accessed June 2024)
Su et al. (2023). Thermal integration of waste to energy plants with post-combustion CO2 capture. Available at: www.sciencedirect.com/science/article/pii/S0016236122028289 (Accessed May 2024)
Tolvik (2024). UK Energy from Waste Statistics – 2022. Available at: www.tolvik.com/published-reports/ (Accessed 4 June 2024)
UK Environment Agency (2021). Post-combustion carbon dioxide capture: emerging techniques. Available at: www.gov.uk/guidance/post-combustion-carbon-dioxide-capture-best-available-techniques-bat. Published: 2 July 2021, Last updated: 27 March 2024 (Accessed May 2024)
WP (2024). The world’s largest carbon-capture plant just switched on. Washington Post, 9 May 2024. Available at: www.washingtonpost.com/climeworks-mammoth-carbon-capture/ (Accessed 17 June 2024)
Watt, I et al (in preparation). Lybster CCS Prospect. Powerpoint summary presentation for Carbon Capture Scotland Limited. Supervisor Gilfillan, S. School of GeoSciences, University of Edinburgh.
Whisky Invest Direct (2024). Malt whisky distilleries in Scotland. Available at: www.whiskyinvestdirect.com/about-whisky/malt-whisky-distilleries-in-scotland
(Accessed: May 2024)
Appendices
Appendix A Background on the CCS Directive
Pioneering work on CCS legislation in the EU was undertaken by the UK with the implementation of the UK Energy Act 2008. The Energy Act established a national regulatory framework for offshore CO2 storage with sufficient flexibility to transpose the anticipated CCS Directive. Directive 2009/31/EC on the geological storage of carbon dioxide was adopted by the EU Council of Ministers in 2009. The CCS Directive was transposed to UK law in 2012 and also incorporated into the Agreement on the European Economic Area. The EEA includes significant storage activity in Norway and Iceland. Despite recent changes in EU membership, the CCS Directive provides a common framework across Europe for offshore CO2 storage.
The CCS Directive applies to onshore and offshore geological storage of CO2 within a country, including exclusive economic zones and continental shelves. Member States that choose to permit storage must carry out an assessment of their regional potential storage capacity. Member States retain the right not to allow storage in their territories. Member States are required to report to the Commission on the implementation of the CCS Directive every four years. The Commission shares the progress with the Parliament and the Council. The 3rd report noted that the CCS Directive had been transposed into the national law of sixteen Member States by 2017. As of the 4th report, released in October 2023, only nine countries, Germany, Estonia, Ireland, Cyprus, Latvia, Lithuania, Austria, Finland, and Slovenia, prohibit the geological storage of carbon dioxide. Germany, 23% of EU fossil CO2 emissions, announced a carbon management strategy in 2024 to support CCS and currently plans to export CO2 for storage, primarily via the Rhine-Delta Corridor. The 4th report concluded that the CCS Directive had been correctly applied from 2019 to 2023 across the EU, acknowledging progress in Europe on the development and exploration of CO2 storage sites, and support for storage projects in most European countries.
DG CLIMA have commissioned DNV to revise the CCS Directive guidance documents to reflect the current understanding of CCS and remove ambiguities identified during the development of the first CCS projects in the EEA. Outcomes of the revision can be expected in 2024. The revised guidance documents aim to support operators and competent authorities in the practical implementation of permitting storage.
Appendix B Analysis of UK licensing
The Energy Act 2016 assigned the role of regulator to the Oil & Gas Authority (OGA) including related infrastructure such as CO2 pipelines. The OGA issued seven CO2 storage appraisal licences between 2012 and 2022. The North Sea Transition Authority (NSTA) issued a further 21 appraisal licences in 2023.
The UK’s Oil & Gas Authority (OGA) has issued 28 storage appraisal licences since 2012[3], of which 27 are active, with most having been issued through the NSTA carbon storge licensing round in 2023. The OGA issued the first CO2 storage licence, CS001, in 2012[4]. The licence permitted BP to drill a single appraisal well in the Bunter aquifer, southern North Sea, to assess storage for White Rose, a post-combustion capture project on coal power at Drax. Prior to this, large CCS projects had been proposed for Scotland at Longannet (Scottish Power, coal, 2008) and Peterhead (BP, H2 and EOR, 2005). Neither progressed to a storage appraisal before funding support was withdrawn.
Licence CS002 was also issued in 2012, to Shell for the Goldeneye oil field and Peterhead project[5]. Both CS001 and CS002 progressed to FEED and were rumoured to be close to positive final investment decisions (FIDs) when funding was withdrawn with the cancellation of the £1bn CCS competition in 2015. These two licenses suggest an appraisal timeframe of around 4 years for these early projects. The publicly available CS001 and CS002 documents do not include a description of the technical requirements or staging of the appraisals.
The OGA extended CS001 in 2018 for the Endurance project and went on to issue CS003-CS007 by the end of 2021, prior to rebranding as the North Sea Transition Authority (NSTA) in March 2022[6]. The new licenses enabled storage appraisals for the Track-1 and Track-2 clusters, namely Endurance (BP), Acorn (Storegga), Hamilton (Eni), and Viking (Harbour Energy), as well as two Bunter prospects (BP). The latter, CS006 and CS007, appear to be build-out capacity for the Track-1 East Coast Cluster. We note that the Track licenses balance appraisals of saline aquifers, Bunter and Acorn, with appraisals of depleted gas fields, Hamilton and Viking. The second tranche of licences document the staging of appraisals, and the additional requirements associated with specific licenses – see Section 3 and Fig 6.2.
Overlooking the years of appraisal for Acorn and Endurance prior to 2021, the four storage appraisals associated with the Track-1 and Track-2 are identical at 4 years. The licence holders must apply for a storage permit or relinquish the area at the end of the appraisal. The less mature Bunter prospects, CS006 and CS007, are licensed for 6 and 8 years respectively. Both include 3D seismic acquisition and appraisal well drilling as additional requirements.
The NSTA became the UK competent authority and storage regulator in 2023. This extended the role of the NSTA to mentoring aspirant storage operators and stewarding offshore storage from the start of appraisal to the end of operational liability with the transfer of the site ownership to the state on closure, subject to meeting the terms of licence.
The seven early licenses prepared the ground for the NSTA to issue 21 licenses in 2023, CS008-CS028. Nominations closed in May 2022. The NSTA launched the licensing round in June 2022. Applications closed September 2022 and licences were offered in May 2023.
The outliers are CS011 (Storegga, Acorn East, 2 years) and CS025 (BP, Bunter Closure 42, 8 years). 25 of the licences are in the North Sea: 18 in the southern North Sea, 3 in the central North Sea, and 4 in the northern North Sea. There are 2 licences in the East Irish Sea.
Appendix C Questions and Answers on Scots Law
C1. How was the UK North Sea divided at devolution for the purpose of renewables?
There are essentially two boundaries between Scotland and England in the North Sea. One determines which courts would be responsible in the event of criminal or civil matters arising out of offshore oil and gas operations – the Civil Jurisdiction (Offshore Activities) Order 1987 and the Criminal Jurisdiction (Offshore Activities) Order 1987.
The other is derived from the arrangements made at the time of devolution to delineate those parts of the territorial sea and the EEZ that would be treated as waters adjacent to Scotland and those which would not for purposes of environmental protection and the regulation of fisheries – namely the Scottish Adjacent Waters Boundaries Order 1999.
The area subject to Scottish jurisdiction is less in the case of the 1999 Order. It is important to note, however, that the 1987 Orders were made under the Oil and Gas (Enterprise) Act 1982 (as well as under the Continental Shelf Act 1964) and confer jurisdiction on the civil and criminal courts respectively in relation to “relevant acts”, which are defined (now by s11(2) of the Petroleum Act 1998) as “activities connected with the exploration of, or the exploitation of the natural resources of…the [sea]bed…or the subsoil beneath it”. Note that section 11(3) is so worded as to make it clear that it applies to installations involved in CCS.
By contrast, the equivalent Orders dealing with civil and criminal jurisdiction in relation to offshore renewable installations which were passed in 2009 utilise the same boundaries as the 1999 Order insofar as they seek to reflect the division of powers in relation to such installations as between Westminster and the Scottish Ministers (see the Civil Jurisdiction (Application to Offshore Renewable Energy Installations etc) Order 2009, and the Criminal Jurisdiction (Application to Offshore Renewable Energy Installations etc) Order 2009).
One could argue that this arrangement is not very tidy, but there does not appear to be any active dispute about it. Were there ever to be Scottish independence, however, and the matter of the location of what would now become the international maritime boundary required to be resolved, existing boundaries drawn for internal administrative and jurisdictional purposes would not be determinative and could, indeed, provide arguments respectively for those seeking more northerly or southerly solutions—albeit interestingly that those specifically relating to offshore oil and gas installations would appear to suggest a more southerly boundary. It would essentially be a matter to be agreed between Scotland and the rest of the UK as part of an overall settlement involving the division of assets and liabilities.
C2. Is CO2 storage in Scottish territorial waters already in the Scottish competence under the Energy Act 2008? Does Scotland require additional legislation for storage, such as transposing or adopting the CCS Directive to Scots law?
Scottish Ministers are clearly established as the licensing authority in relation to CO2 storage for the territorial sea adjacent to Scotland by s18 of the Energy Act 2008. The Storage of Carbon Dioxide (Licensing etc.) Regulations 2010, however, do not apply to this area, insofar as they define a “licence” as a licence granted by the authority (now NSTA/OGA) in relation to “a controlled place which is not in, under or over the territorial sea adjacent to Scotland” (Reg. 1(3)). Further legislation would therefore be required were Scottish Ministers minded to operate as the licensing authority for this area, albeit that there would be good reasons simply to mirror the existing regulations.
C3. What are the Scottish Ministers responsible for within the 12 nm limit? Sea surface to seabed? All fish, water, and benthic quality from land outfalls into sea?
Given the way in which powers have been allocated between UK and Scottish bodies, it is not possible to give a once and for all answer to this question. In terms of international law, the UK as the coastal state, enjoys sovereignty in the territorial sea which includes the seabed, the subsurface and the water column (subject only to, for example, rights of innocent passage). How the UK decides to exercise that sovereignty, however, is a matter for it and this becomes complex in the context of devolution. Thus, while Scottish Ministers undoubtedly have responsibility for, say, environmental issues in the territorial sea adjacent to Scotland, this needs to be read in conjunction with the environmental responsibilities in the hands of OPRED in the context of oil and gas operations in the same space.
C4. Who has responsibility and rights for the sub-seabed, mineral oil and gas rights?
Oil and gas under the territorial sea adjacent to Scotland as with all such resources wheresoever located in the UK, onshore or offshore, are vested in the Crown. Whereas Scottish Ministers did receive licensing powers for oil and gas in the post-referendum settlement in the context of the Scotland Act 2016, this was explicitly only in relation to the “onshore area”, defined as lying “within the baselines” of the territorial sea (s47). Thus, licensing in relation to all offshore oil and gas, within the territorial sea and under the continental shelf, is a matter for the NSTA/OGA.
C5. Does Scotland need its own regulator and competent authority? Or can those services be purchased from the UK government?
Purchasing the services of the NSTA/OGA would still require there to be appropriate regulations covering the territorial sea adjacent to Scotland and may raise political considerations. For example, if it is seen as expedient to make use of the UK regulator for this function, the question would arise as to where else such an approach might be appropriate – industry generally would like to deal with fewer regulators and to have to adapt to fewer jurisdictional variations. This could, of course, be countered by pointing to the very specific nature of the issue at hand where the long experience of the NSTA/OGA and its predecessors is an important consideration. Another way of looking at this, however, would be to consider whether an agreement could be reached between, say, Marine Scotland and the NSTA/OGA to deal with carbon licensing in territorial waters adjacent to Scotland (again on the basis that appropriate regulations are in place for the territorial sea adjacent to Scotland). There is a precedent for such an approach, effected by Memorandum of Understanding between the HSE and OPRED[7] to form the Offshore Safety Directive Regulator (now OMAR) when that directive required a competent authority to deal with health and safety, and environmental risks under one roof. That, of course, involved two regulators at UK level, but there should be no objection to a similar arrangement between a UK and a Scottish regulator given the commonality of purpose and the desirability of a seamless approach.
C6. Is the natural fill of residual oil and gas in depleted gas fields owned by Scottish Ministers or retained by the Crown Estate?
Residual oil and gas remain vested in the Crown.
C7. Who holds liability for oil and gas field operations, for decommissioning, and for permanent abandonment within the 12 nm limit?
First and foremost, in the context of operations, attention will be focused on the licensee. In most cases, however, liability will be joint and several with co-venturers under a joint operating agreement. In relation to decommissioning, it is a matter of anyone who holds a section 29 notice under the Petroleum Act 1998 – again usually co-venturers, but the list is lengthened to minimise the risk that the state is left to tidy up if duty holders become insolvent. Things get more complicated in relation to any infrastructure left in place under an agreed derogation. There is no specific legislation or regulation on this matter; rather it is dealt with in the context of guidance notes issued from time to time by OPRED. Originally, the wording was as follows: “The persons who own an installation or pipeline at the time of its decommissioning will remain the owner of any residues”. More recently, it has been adapted to: “The persons/parties who own an installation or pipeline, or are a section 29 [notice] holder, at the time of its decommissioning will remain the owners of any residues and remains after decommissioning.” This is problematical on a couple of levels. For a start, either someone is the owner, or they are not. If they are merely a section 29 notice holder, they cannot without further ado suddenly become the owner. More fundamentally, there is an argument that the use of Crown Leases in the EEZ in relation to renewables and CCS constitutes an exercise of property rights in the seabed which raises the question of whether any infrastructure left in place is actually a fixture (in both Scots and English law) which belongs to the owner of the land (or seabed) to which it is attached. This has never been tested but is certainly arguable. By contrast, this would appear to be a much easier proposition to establish within the territorial sea where the Crown Estate has habitually claimed property rights and the courts have readily confirmed them. Thus, whatever is stated in the guidance notes (and, of course, essentially accepted by duty holders in the context of a decommissioning programme), property law may say something different.
C8. Does Scotland own the pore space for the Lybster field and Forth Basin?
If I am right in understanding that the Lybster field lies wholly within the 12 nm limit, then whereas the hydrocarbons in that field are vested in the Crown and those rights are exercised by the NSTA, the pore space is the property of the Crown, which property rights would be exercisable by the CES. Insofar as the Forth Basin aquifer is similarly located within the 12 nm limit, the pore space there would also be owned by the Crown and the property rights would be exercisable by CES. Note that this property law analysis also implies that CO2 injected into depleted reservoirs beneath the territorial sea would be owned by the Crown on the basis of the principle of annexation. Roddy Paisley and John Paterson wrote a report on CO2 in the context of EOR years ago in which the property dimension was more fully explored.
C9. Is Lybster administered under onshore or offshore regulation? UK or Scots law?
Insofar as the exploration for and production of hydrocarbons is involved, then the petroleum licensing at the time would have been a matter for the Secretary of State. Even now, insofar as the reservoir lies beyond the baselines for the territorial sea and thus within the territorial sea, the licensing in relation to such a reservoir would be a matter for NSTA/OGA. The siting and operation of the drilling rig onshore would then and now be a matter for the local planning authority. Thus, both UK law and Scots law are engaged as appropriate.
C10. Now that the Beatrice field is no longer in production, does Scotland own the field, which is partly in territorial waters and partly beyond the 12 nm limit?
This is a most interesting problem. The residual hydrocarbons in the field remain vested in the Crown. The pore space within 12 nm is owned by the Crown. The ownership of pore space beyond 12 nm is not clear, but from a practical perspective only the Crown has sovereign rights to act in respect of that pore space. The licensing authority within 12 nm is Scottish Ministers and beyond the NSTA/OGA. Ways forward? Some form of arrangement modelled on those for hydrocarbon reservoirs that cross boundaries. This returns us to the answer above where an MoU between Marine Scotland and NSTA/OGA was suggested.
C11. Are consents expected to be closely similar, or identical, to permissions and standards already enacted for offshore oil and gas licensing, appraisal, development, and production? Lybster must have already passed regulatory agencies inspections for oil production, water cut disposal, and gas flaring – will CO2 injection for storage be different or require a new inspection?
Given that different activities under different licensing regimes are involved, new consents would be required. It may well be, however, that insofar as existing data could be relied upon, the process would be faster. This would really be a question for those with a better insight into the technical processes.
Appendix D Timeframe analysis of European CO2 storage
Analysis of CO2 storage projects across Europe at various stages of development indicates that both the European Union’s 2030 CO2 storage target (50 Mtpa) and United Kingdom’s 2030 target (20-30 Mtpa) may be achieved if storage development deadlines are met and expected storage rates are slightly exceeded. The addition of large storage projects in Norway and Iceland will very likely be necessary to meet EU demand and provide a contingency against capacity shortfalls. Planned storage capacities for Norway, Denmark, and Iceland vastly exceed domestic emissions, indicating an ambition to establish large CO2 import markets.
On average, megaton-scale European projects store 2-4 Mtpa. At the national level, results range from Bulgaria (P10 optimistic, 0.8 Mtpa) and Greece (P50 expected, 1 Mtpa), to Iceland (P10 optimistic, 2 Mtpa) and Norway (P50 expected, 15 Mtpa). The data indicates that the European Economic Area (EEA) and United Kingdom are on track to deliver regional storage rates of 18-106 Mtpa by 2030, with an expected P50 forecast of 58 Mtpa, i.e. slightly less than the 70-80 Mtpa aggregated net zero target for the EU and UK. Regionally significant storage in the North Sea remains a mainstay for the Netherlands (P50 4.5 Mtpa), the UK (P50 22.5 Mtpa), and Denmark (P50 12.2 Mtpa, of which 3 Mtpa is offshore). The emergence of onshore storage ambitions for Denmark (4-14 Mtpa) is an interesting development. It is notable that the UK, Norway, and Denmark contribute 44% of total storage. Only six EU27 countries are planning megatonne-scale projects. Portugal, Spain, Germany, and Poland, 45% of EU CO2 emissions, have no large projects planned – Table D.1.
Table D.1. Storage rates for the 32 projects on track to potentially deliver storage by 2030.
|
NORWAY, EEA |
Start |
SRMS, Mtpa: |
P90 |
P50 |
P10 |
Storage |
Operator |
Type |
2040s, Mtpa |
|
Sleipner |
1996 |
On Injection |
0 |
0.8 |
1 |
Utsira Fmn |
Equinor |
SAQ |
0 |
|
Snøhvit |
2008 |
On Injection |
0.2 |
0.5 |
0.8 |
Stø Fmn |
Equinor |
SAQ |
0 |
|
Northern Lights |
2025 |
FID, PCI, CEF |
1.2 |
3.6 |
5 |
Johansen Fmn |
Equinor |
SAQ |
5 |
|
Smeaheia |
2028 |
EXP, EXL002 |
0 |
2.5 |
5 |
Sognefjord Fmn |
Equinor |
SAQ |
20 |
|
Havstjerne |
2029 |
EXP, EXL006 |
0 |
3 |
5 |
Sandnes, Bryne Fmns |
Wintershall DEA |
SAQ |
10 |
|
Trudvang |
2029 |
EXP, EXL007 |
0 |
0.8 |
1.5 |
Utsira Fmn |
Sval Energi |
SAQ |
10 |
|
Barents Blue |
2030 |
EXP, EXL003 |
0 |
1 |
2 |
Stø Fmn |
PUN |
SAQ |
9 |
|
Luna |
2030 |
EXP, EXL004 |
0 |
2.5 |
5 |
Johansen Fmn |
Wintershall DEA |
SAQ |
5 |
|
Poseidon |
2030 |
EXP, EXL005 |
0 |
0 |
2.5 |
Rødby Formation |
Aker BP |
SAQ |
5 |
|
UNITED KINGDOM |
Start |
SRMS, Mtpa: |
P90 |
P50 |
P10 |
Storage |
Operator |
Type |
2040s, Mtpa |
|
NEP, Endurance |
2027 |
FIP, Track 1 |
4 |
7 |
10 |
Bunter Fmn |
BP |
SAQ |
23 |
|
HyNet |
2027 |
FIP, Track 1 |
2 |
3 |
4 |
Hamilton Fields |
Eni |
DGF |
10 |
|
Acorn |
2027 |
FIP, Track 2 |
0.5 |
1 |
3 |
Captain, Wick Fmn |
Shell |
SAQ |
10 |
|
Viking |
2028 |
FIP, Track 2 |
3 |
5 |
8 |
Victor, Viking A Fields |
Harbour Energy |
DGF |
15 |
|
BTNZ |
2030 |
pre-FEED |
0 |
2 |
4 |
Hewett Field |
Eni |
DGF |
10 |
|
Morecambe |
2030 |
pre-FEED |
0 |
3 |
5 |
Morecambe Fields |
Spirit Energy |
DGF |
20 |
|
Poseidon |
2030 |
pre-FEED |
0 |
1.5 |
3 |
Leman Field |
Perenco |
DGF |
40 |
|
Orion |
2031 |
pre-FEED |
0 |
0 |
1 |
Amethyst, W Sole Fields |
Perenco |
DGF |
6 |
|
DENMARK, EU |
Start |
SRMS, Mtpa: |
P90 |
P50 |
P10 |
Storage |
Operator |
Type |
2040s, Mtpa |
|
Greensand |
2026 |
FIP |
0.5 |
1.5 |
3 |
Nini Fields |
INEOS Energy |
DOF |
8 |
|
CO2RYLUS |
2026 |
FIP |
0.1 |
0.2 |
0.5 |
Stenlille, Gassum Fmn |
GSD |
SAQ |
0.5 |
|
Bifrost |
2029 |
FEED, PCI |
0 |
1.5 |
3 |
Harald Fields |
TotalEnergies |
DGF |
10 |
|
Norne Fyrkat |
2027 |
pre-FEED, PCI |
2 |
4 |
6 |
Gassum, Gassum Fmn |
Fidelis, ROSS |
SAQ |
10 |
|
Norne Trelleborg |
2027 |
pre-FEED, PCI |
2 |
4 |
6 |
Havnsø, Gassum Fmn |
Fidelis, ROSS |
SAQ |
10 |
|
Ruby |
2028 |
EXP |
0 |
1 |
2 |
Rødby, Bunter Fmn |
BlueNord |
SAQ |
10 |
|
NETHERLANDS, EU |
Start |
SRMS, Mtpa: |
P90 |
P50 |
P10 |
Storage |
Operator |
Type |
2040s, Mtpa |
|
Porthos |
2026 |
FID, PCI, CEF |
1 |
2 |
2.5 |
P18-2,4,6 Fields |
TAQA |
DGF |
2.5 |
|
Aramis |
2028 |
FEED, PCI, CEF |
1 |
2.5 |
5 |
L10, L04-A, K14-FA |
Neptune |
DGF |
22 |
|
ITALY, EU |
Start |
SRMS, Mtpa: |
P90 |
P50 |
P10 |
Storage |
Operator |
Type |
2040s, Mtpa |
|
Callisto, Ravenna |
2027 |
FEED, PCI |
0 |
2 |
4 |
Porto Corsini Field |
Eni |
DGF |
16 |
|
ICELAND, EEA |
Start |
SRMS, Mtpa: |
P90 |
P50 |
P10 |
Storage |
Operator |
Type |
2040s, Mtpa |
|
Coda Terminal |
2026 |
FIP, IF |
0.5 |
1 |
2 |
Kapelluhraun lava field |
Carbfix |
BAS |
3 |
|
GREECE, EU |
Start |
SRMS, Mtpa: |
P90 |
P50 |
P10 |
Storage |
Operator |
Type |
2040s, Mtpa |
|
Prinos |
2026 |
FEED, PCI, IF |
0 |
1 |
2 |
Prinos, Epsilon Fields |
Energean |
DOF |
3 |
|
CROATIA, EU |
Start |
SRMS, Mtpa: |
P90 |
P50 |
P10 |
Storage |
Operator |
Type |
2040s, Mtpa |
|
GT CCS |
2031 |
pre-FEED, PCI |
0 |
0 |
0.3 |
Bockovac |
Nexe |
SAQ |
0.7 |
|
Ivanić Grad |
2026 |
Pre-FEED |
0 |
0.1 |
0.2 |
Ivanić Grad Field |
MOL Group |
EOR |
0 |
|
FRANCE, EU |
Start |
SRMS, Mtpa: |
P90 |
P50 |
P10 |
Storage |
Operator |
Type |
2040s, Mtpa |
|
Pycasso |
2030 |
Pre-FEED, PCI |
0 |
0 |
1 |
Lacq Gas Field |
Teréga |
DGF |
5 |
|
BULGARIA, EU |
Start |
SRMS, Mtpa: |
P90 |
P50 |
P10 |
Storage |
Operator |
Type |
2040s, Mtpa |
|
ANRAV |
2028 |
Pre-FEED, IF |
0 |
0 |
0.8 |
Galata Field |
Petroceltic |
DGF |
1.3 |
Appendix E UK Licensing timeframe
Table E.1. UK licence timing from CS001 to CS028 (2012-2023).
|
First proposed project | |||||||||||||||||||||||
|
2002 |
2003 |
2004 |
2005 |
2006 | |||||||||||||||||||
|
DTI: Energy White Paper 2003 |
| ||||||||||||||||||||||
|
|
|
|
|
| |||||||||||||||||||
|
BP “Beyond Petroleum” |
|
| |||||||||||||||||||||
|
Peterhead gas, Miller EOR |
|
| |||||||||||||||||||||
|
UK Competitions | |||||||||||||||||||||||
|
2008 |
2009 |
2010 |
2011 |
2012 |
2013 |
2014 |
2015 |
2016 |
2017 | ||||||||||||||
|
DECC: Energy Act 2008 |
|
CCS Directive 2009 transposed |
|
BEIS: Clean Growth Strategy | |||||||||||||||||||
|
|
|
|
|
OGA: Offshore Carbon Storage Licensing, Storage of Carbon Dioxide Licensing Regulations | |||||||||||||||||||
|
£1bn Competition #1 |
|
|
|
|
|
|
| ||||||||||||||||
|
Longannet coal |
£1bn Competition #2 |
|
| ||||||||||||||||||||
|
|
[Drax, Statoil] BP, CS001 |
White Rose, Bunter 42/25 & 43/21 | |||||||||||||||||||||
|
|
|
[SSE] Shell, CS002 |
Peterhead, Goldeneye: ERA – CH – AS |
| |||||||||||||||||||
|
First six licences | |||||||||||||||||||||||
|
2018 |
2019 |
2020 |
2021 |
2022 |
2023 |
2024 |
2025 |
2026 |
2027 |
2028 |
2029 |
2030 | |||||||||||
|
|
2050 Net Zero target 2019 |
|
DESNZ: Energy Act 2023, CCUS Market Creation 2023 |
|
|
| |||||||||||||||||
|
|
|
|
|
|
NSTA: Offshore Carbon Storage Regulator & Competent Authority | ||||||||||||||||||
|
Cluster Sequencing Process |
Track 1 |
|
Track 2 |
|
|
|
|
|
|
| |||||||||||||
|
CS001* NEP, Endurance: CH |
Endurance (T1): ERA – CH – AS- PA |
CX |
ENDURANCE OPERATIONAL | ||||||||||||||||||||
|
CS003* |
Acorn: CH |
Acorn (T2) South: ERA – CH – AS – DF – PA |
Central: CH – – PA |
ACORN SOUTH OP |
CENTRAL OP | ||||||||||||||||||
|
|
Eni, CS004 |
HyNet NW: Hamilton (T1): ERA – – DF – PA |
CX |
HAMILTON OPERATIONAL | |||||||||||||||||||
|
|
|
[BP] Harbour, CS005 |
Viking (T2): ERA – CH – AS – DF – PA |
CX |
VICTOR OPERATIONAL | ||||||||||||||||||
|
[TotalEnergies, Equinor] BP, CS006 |
Bunter Closures 39 & 40: ERA – Seismic AQ – Well – CH – AS – DF – PA |
CX |
39 & 40 OP | ||||||||||||||||||||
|
[TotalEnergies, Equinor] BP, CS007 |
Bunter Closures 36 & 37: ERA – Well – Seismic AQ – Well – CH – AS – DF – PA |
CX | |||||||||||||||||||||
NSTA Carbon Storage Licensing Round #1
|
|
|
|
|
2023 |
2024 |
2025 |
2026 |
2027 |
2028 |
2029 |
2030 | |
|
|
|
|
|
DESNZ: Energy Act 2023, CCUS Market Creation 2023 | ||||||||
|
|
|
|
|
NSTA: Offshore Carbon Storage Regulator & Competent Authority | ||||||||
|
|
|
|
| |||||||||
|
|
|
Eni, CS008 |
BTNZ, Hewett: ERA – Seismic RP & AQ – Well – CH – AS – DF – PA |
CX |
HEWETT OP | |||||||
|
[Wintershall Dea, CCL] Perenco, CS009 |
Poseidon, Leman: ERA – Seismic RP – Injectivity – Wells VSP – – PA |
CX |
LEMAN OP | |||||||||
|
|
[Centrica] Spirit, CS010 |
Morecambe: ERA – Seismic AQ – – Injectivity – Firm TR & TS – – PA |
CX |
MOR’E OP | ||||||||
|
|
[Harbour, Shell] Storegga, CS011 |
Acorn East: ERA – – PA |
CX |
ACORN EAST OPERATIONAL | ||||||||
|
|
[Harbour, Shell] Storegga, CS012 |
East Mey Sub Areas 1 & 2: ERA – CH – AS – DF – Sub Area 1 PA |
SA2 PA |
CX | ||||||||
|
|
|
EnQuest, CS013 |
Magnus: ERA – CH – Assess – Define – Permit Application |
CX |
MAGNUS OP | |||||||
|
|
|
EnQuest, CS014 |
Thistle: ERA – CH – Assess – Define – Permit Application |
CX |
THISTLE OP | |||||||
|
|
|
EnQuest, CS015 |
Tern: ERA – CH – Assess – Define – Permit Application |
CX |
TERN OP | |||||||
|
|
|
EnQuest, CS016 |
Eider: ERA – CH – Assess – Define – Permit Application |
CX |
EIDER OP | |||||||
|
|
[SEEL, CCL] Perenco, CS017 |
Orion, Amethyst East: ERA – Seismic RP & AQ – Firm TR & TS – CH – AS – DF – PA |
CX | |||||||||
|
|
[SEEL, CCL] Perenco, CS018 |
Orion, West Sole: ERA – Seismic RP & AQ – Firm TR & TS – Injectivity – CH – – PA |
CX | |||||||||
|
|
|
[W’Dea] Synergia, CS019 |
Camelot, Bunter Closure 18: ERA – Seismic RP & AQ – Well – – PA |
CX |
CAMELOT OP | |||||||
|
|
|
Neptune, CS020 |
Proteus, Bunter Closure 05: ERA – Seismic RP – Well – CH – PA |
CX |
PROTEUS OP | |||||||
|
|
[Exxon] Neptune, CS021 |
Bunter Closure 13: ERA – Seismic AQ & RP – Well – Firm TR & TS – CH – – PA |
CX | |||||||||
|
|
|
Neptune, CS022 |
Caister, Bunter Closure: ERA – Seismic AQ & RP – Well – Firm TR & TS – CH – – PA |
CX | ||||||||
|
|
|
[BP] Harbour, CS023 |
Vulcan: ERA – Seismic RP – Firm Geomech & Fault & Core – CH – AS – DF – PA |
CX | ||||||||
|
|
|
[BP] Harbour, CS024 |
Audrey: ERA – Seismic RP – Firm Geomech & Fault & Core – CH – AS – DF – PA |
CX | ||||||||
|
|
|
[Equinor] BP, CS025 |
Bunter Closure 42: ERA – Seismic RP & AQ -Well – Characterise – Assess – Define – Permit Application | |||||||||
|
|
|
[Exxon] Shell, CS026 |
Sean: ERA – Seismic RP – Well – Characterise – Assess – Define – PA |
CX | ||||||||
|
|
|
[Exxon] Shell, CS027 |
Indefatigable: ERA – Seismic RP – Well – Characterise – Assess – Define – PA |
CX | ||||||||
|
|
|
[Exxon] Shell, CS028 |
Bunter Area 3S & N:ERA – Seismic RP & AQ -Well S (N) – CH S (N) – AS – – PA |
CX | ||||||||
Appendix F AOI inventory of 3D seismic and wells
AOI 1 – Lybster field area
Q11: 3D RE07112025 2007
(Proprietary, IGas PLC)
- 11/25-2 1986 dry hole 3713 m
- 11/25-1 1984 dry hole 3307 m
- 11/24b-4 2019 dry hole 963 m
- 11/24-3z,y,x,w,v, producing well
- 11/24a-2z 2004 dry hole 2098 m
- 11/24-1 1996 oil well 1884 m
AOI 1 – Beatrice area
Q11: 3D TB973D0001 1997
Q11: 3D BN803F0001 1985
(Proprietary, Repsol Sinopec)
- 11/30a-B9Z 1984 oil well 2398 m
- 11/30-7 1978 oil show 2192 m
- 11/30a-10 1990 dry hole 3461 m
- 11/30-5 1977 oil well 2372 m
- 11/30a-A26Z 1988 producer 2083 m
- 11/30-2 1976 oil well 2220 m
- 11/30a-8 1982 oil well 2495 m
- 11/30z-C2 1985 oil well 2266 m
- 11/30-4 1981 dry hole 2391 m
AOI 1 – Jacky area
- 12/21-5 1987 dry hole 2722 m
- 12/21-2 1983 oil show 3459 m
- 12/21c-6 2007 oil well 2233 m
AOI 1 – Wick area
Q12: 3D GE863F0001 1986
(Speculative, Schlumberger)
- 12/16-1 1988 dry hole 3659 m
- 12/16-2 1993 dry hole 1554 m
AOI 1, South of GE86
- 12/21-3 1984 oil show 4174 m
- 2D: 12-81-145 NW-SE
- 2D: BN/12-81-126 SW-NE
- 12/21-1 1969 dry hole 1590 m
- 2D: 12-81-144 NW-SE
- 2D: 12-86-10 SW-NE
- 12/22-3 1986 dry hole 2190 m
- 2D: A12-85-03 NWW-SEE
- 2D: A12-85-10 NW-SE
AOI 1 S of Lybster, W of Beatrice
- 11/29-1 2008 dry hole 2483 m
- 2D: 302A NW-SE
- 2D: 105A SW-NE
AOI 2 – Forth Basin area
Q25: 2D CN872D1010 1987
(Proprietary, ConocoPhillips)
- 25/26-1 1990 dry hole 2040 m
AOI 3 – Fraserburgh area
Q18: 3D PGS18002MOF 2019, Release 2029
(Speculative, PGS Exploration Ltd)
- 18/05a-1 1982 dry hole 1984
- 2D: CNS-83-125 NW-SE
- 2D: A18,19-82-25A W-E
- 18/05-2 2007 dry hole 1763 m
- 2D: A18,19-82-25 W-E
- 2D: A18,19-82-20 N-S
- Q19: 3D YC06A01902 2007
- (Proprietary, CENTURY Exploration Ltd)
- 19/01-1 1992 dry hole 3425 m
- 2D: A18,19-82-31 E-W
- 2D: A18,19-82-28A N-S
AOI 4 – Solway Firth area
Q112: 3D ES943F0001 1994
(Proprietary, ExxonMobil)
- 112/15-1 1996 dry hole 2715 m
- 2D WG932D0001 Line 151 NW-SE 1993
- 2D WG932D0001 Line 149 SW-NE 1993
- 111/15-1 1995 dry hole 1981 m
- 2D: BG942-13 SW-NE
- 2D: BG96-112-19 NW-SE
Lybster is Old Norse for “slope farmstead”. The field was named after the local village, an important herring port in the 19th Century. Premier Oil drilled the discovery well, 11/24-1, in 1996. This was one of a series of exploration successes in the 1980s and 1990s including the Fife and Angus fields, Central North Sea. The vertical discovery well tested up to 2,000 bopd of 36°API oil and was suspended. Premier was also party to the offshore extension of Wytch Farm in 1994. This made the Dorset oil field the largest onshore asset in Western Europe. The development required a five km extended reach well, the first of its kind in the UK.
Lybster was acquired by Caithness Petroleum in 2008 and, like Wytch Farm, developed from land with a 5 km extended reach well, 11/24-3z – Figure F.1. Lybster and Wytch Farm are the only onshore-offshore extended reach well developments in the UK. The Lybster structure is crossed by a northeast-southwest trending fault. The appraisal well and a short side-track tested the western half of the field which proved uncommercial. The well was re-entered in 2010 and side-tracked across the fault to twin the discovery well.
The assessment of oil fields, like storage prospects, require high quality subsurface data, with 3D seismic and well data being commonly cited as key datasets for the suitability and capacity assessment of a site. The Lybster field, in addition to its near-shore location, has both.
The well plan and production strategy for the oil field were based on a 3D reservoir model built from the RE07 seismic survey. Multiple interpretations are possible depending on the wells chosen for depth conversion of the seismic. For example, compare Figure F1 with Figure F2. While the models are similar, depths differ for the field area by as much as 60 metres.
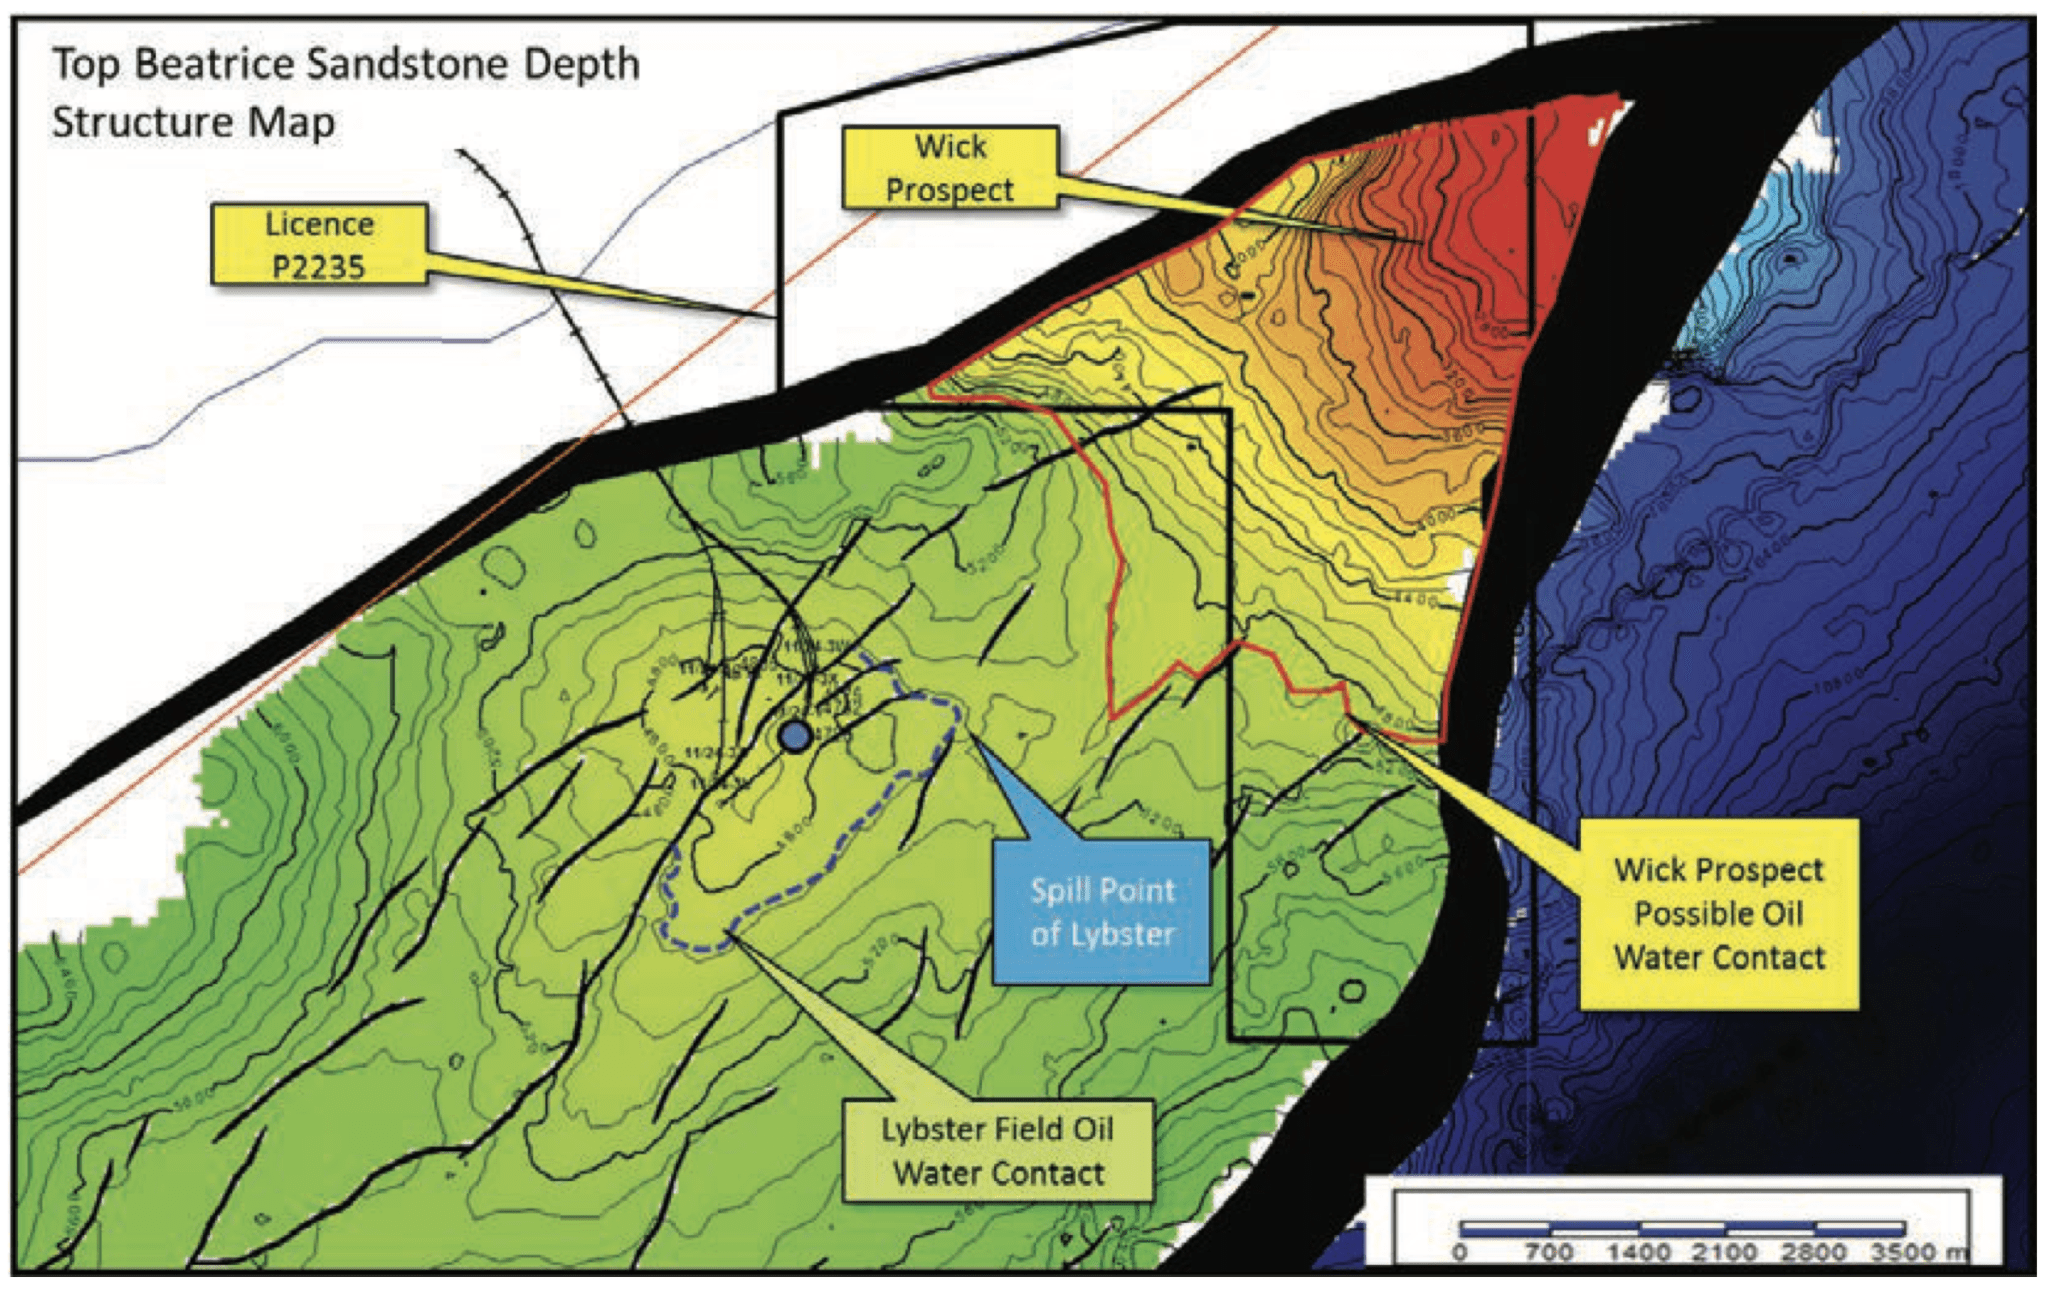
Figure F.1. A ‘top surface’ model for the RE07 3D survey by an oil company (Corallian Resources, 2018).
In the model below, the inferred oil-water contact (white line, dashed) differs from the field outline (red line). This suggests the depth conversion of the Keenan model differs from the oil company interpretation. The Keenan depth conversion of seismic two-way-time is based on a single well log and challenging, as noted by Keenan (2023). The depth uncertainty was not estimated but is likely to be of the order of tens of meters which would impact on an accurate geometric assessment of capacity and precise location of the spill point to the north.
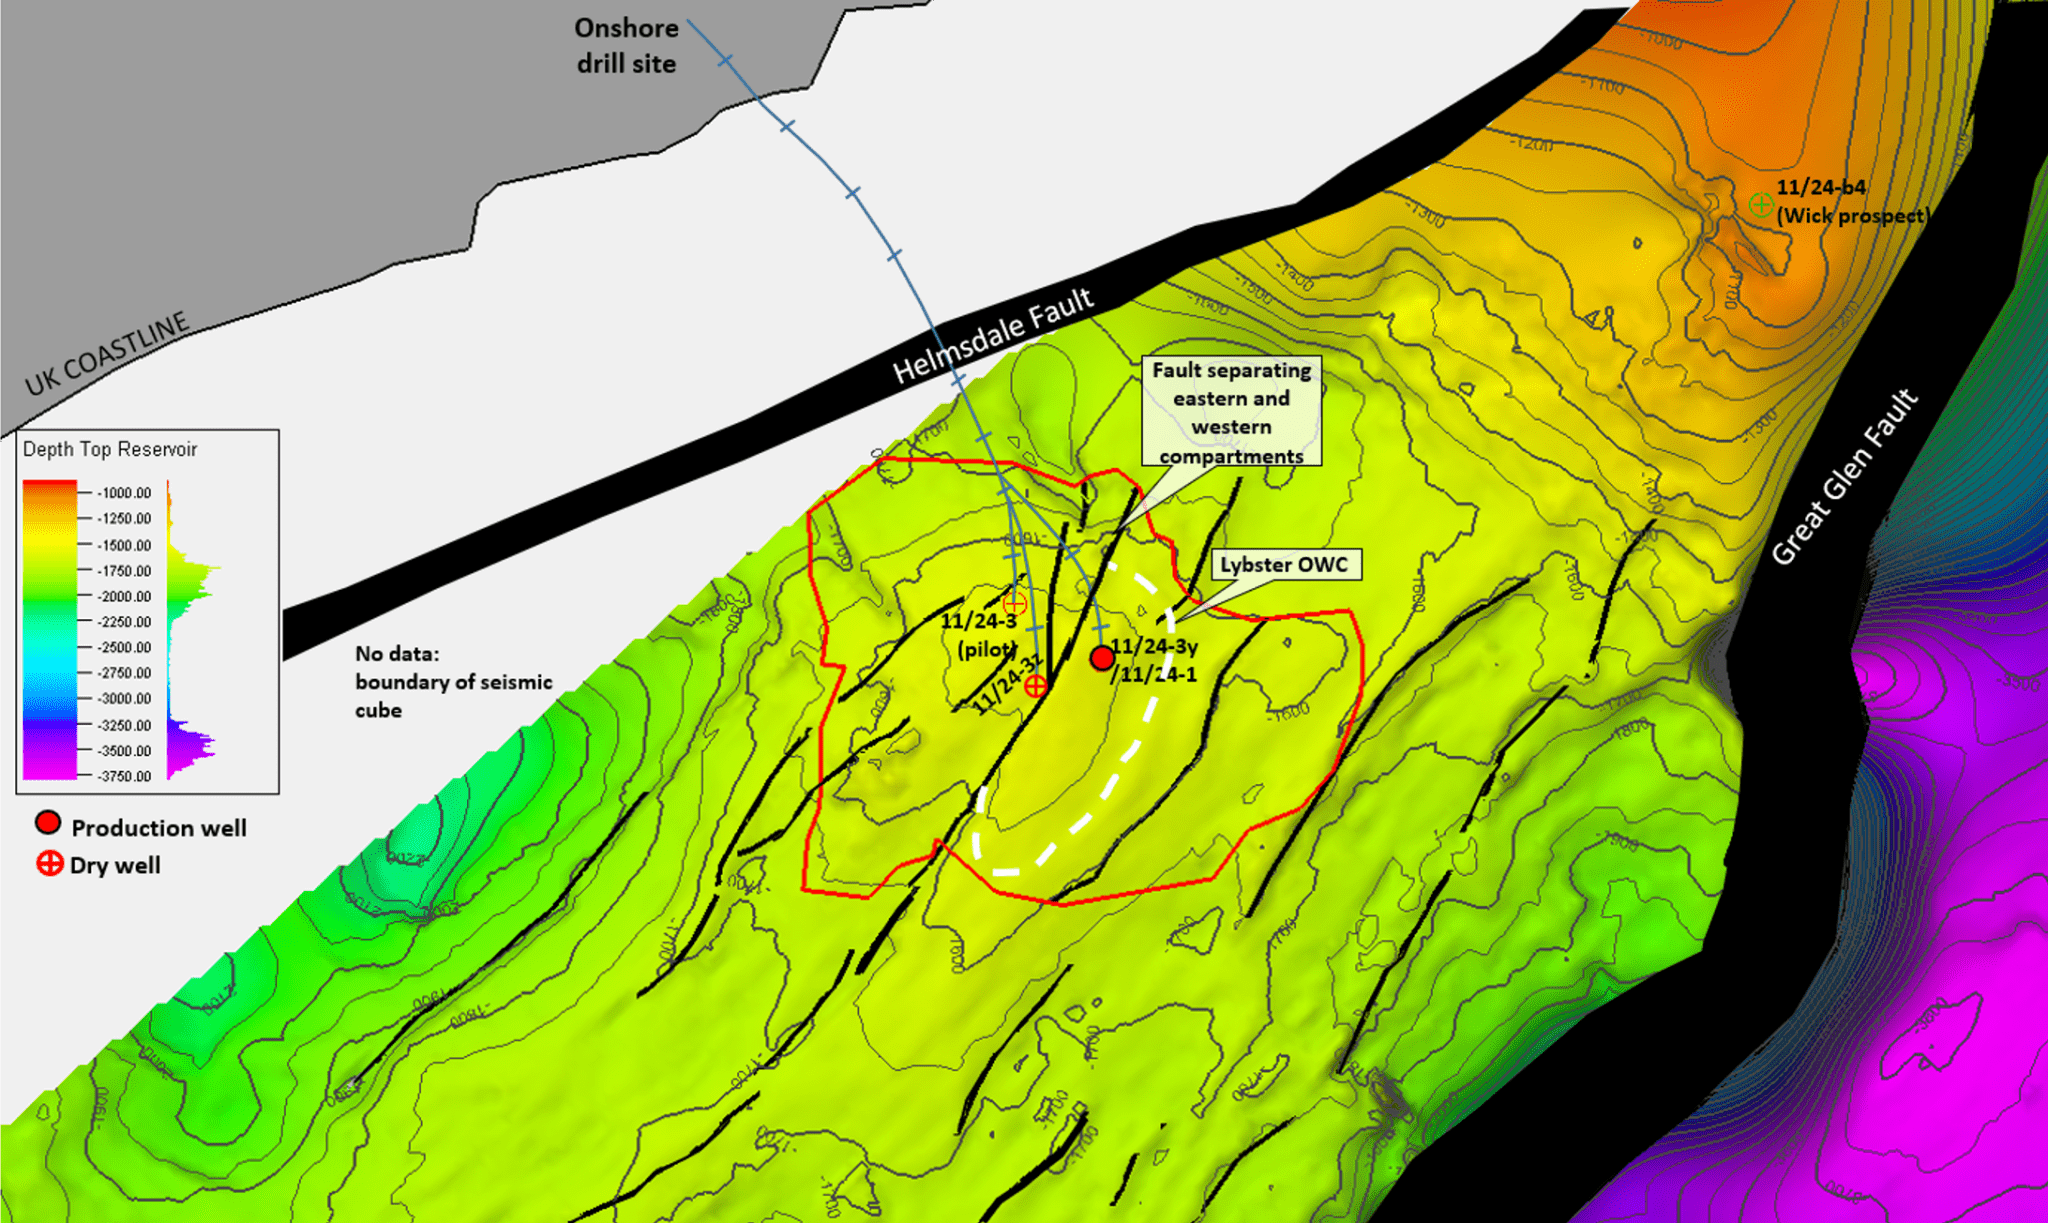
Figure F.2. A ‘top surface’ reservoir model for the RE07 3D seismic survey area by Keenan (2023).
Geological setting: The onshore Lybster area is unconformably overlain by Middle Devonian flagstones. These extremely hard, thinly interbedded siltstones and sandstones form a top to the more prospective and younger Jurassic formations below. The flagstones caused the 11/24-3 well drillers significant challenges in 2008, slowing the early hole progress, as documented in the well completion report.
The Devonian flagstones are underlain by Cretaceous carbonates and calcareous mudstones, organic rich Jurassic mudstones, coals and siltstones, Triassic sandstones and Permian sandstones, mudstones, and minor salts. Late Jurassic rifting in the North Sea resulted in large normal faults and relatively deep marine basins. At the time of this tectonic activity the Great Glen Fault and Helmsdale Fault were active as normal faults. The field is a four-way dip closed structural trap that formed at a flexure point in response to tectonic inversion of the Inner Moray Firth area. A fault separates the field into an unproductive western compartment and a proven oil-bearing eastern compartment.
The main reservoir, the Beatrice Formation, is 10-20 m thick and composed of a shallow marine sandstone sequence that lies between the Brora Coal Formation and the Heather Formation, which is of Middle Jurassic age. The upward-coarsening sandstones of the Beatrice Formation have been interpreted as marine barrier-bar and offshore-bar environments. The ‘B’ Sand is interpreted as distributary channel environment.
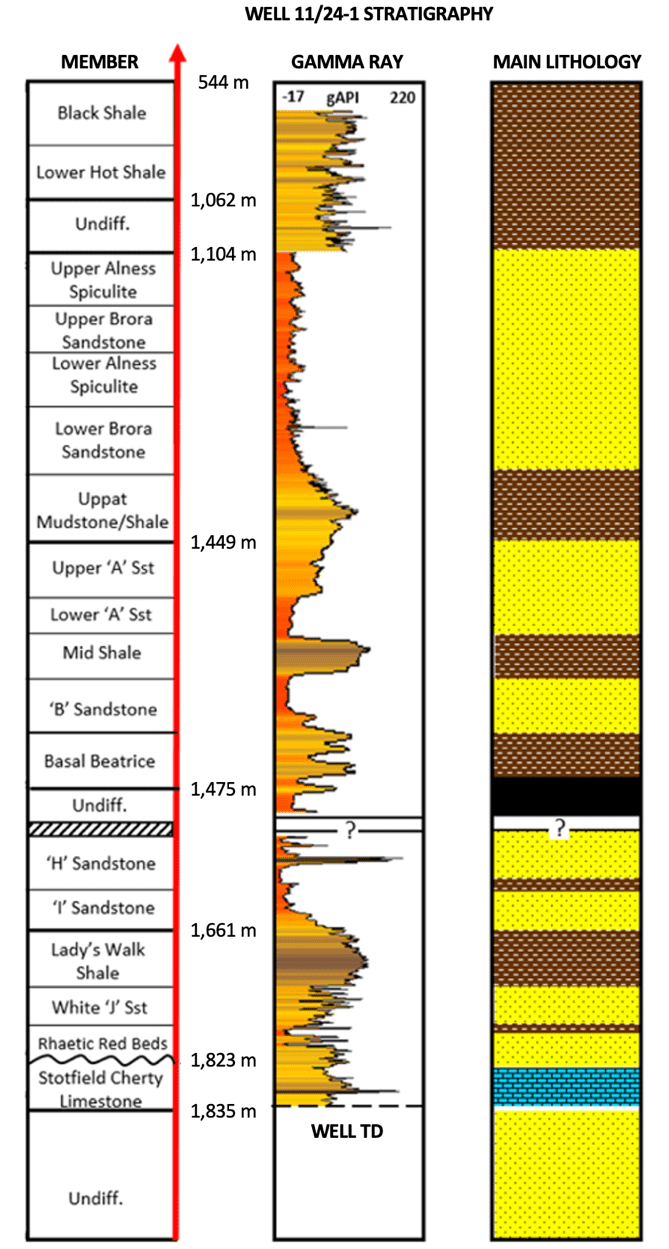 Appendix H Production history
Lybster was in production from June 2012-December 2014, with a five month pause from July-November 2013. Production averaged 184 bopd for the first 13 months, and 64 bopd for the last 13 months. Oil was transported by road tanker to Immingham for sale. An average of 0.989 mmscfpd of associated gas was flared. The field was sold to IGas in 2013. A rapidly changing production profile in Q2 2013 saw the gas cut double and water cut increase more than ten-fold from an average daily 57 m3 to over 690 m3. This led to the July 2013 well intervention. Oil production resumed in December 2013 with a declining profile from 142 bopd in January to 25 bopd in September 2014. Associated gas dropped to an average of 0.883 mmscfpd. The daily water cut doubled, increasing to 1,244 m3 in May 2014.
Field: Lybster oil field
Operator: IGas, 2013 – present
Location: Inner Moray Firth, North Sea
Category: Small, 250k barrels OOIP
Discovery: 11/24-1
Water Depth: 39 m
Discovered: Premier Oil, Repsol
Discovery: 20 Sep – 22 Oct 1996
Reservoir: Beatrice formation
Trap 4-way dip closure, 1-2°
Res Lithology Sandstones, thin shales
Reservoir Top 1,433 m / 4,700 feet
OOIP GIIP 250 kbbl, 2000 mmscf
OWC, FWL 1493 m / 4,898 feet
Quadrant/ block: 11/24
Area: 6.11 km2
Discovery: 1 exploration well
Appraisal: 1 ERW + 2 side-track
First Production: 11/24-3z, Aug 2011
Liquids: oil + flare + water
Reservoir: Mesozoic sandstones
Primary: A and B Sands
Figure G.1. Discovery well 11/24-1 summary
Poro-Perm: 15%, 200 mD
Reserves: proven – probable – possible
Oil & Condensate: 147-62-48 kbbl
Sales Gas: 734-310-243 mmscf
Oil equivalent: 274-115-90 kboe
Produced volumes
Oil (sold): 97,992 bbl
Gas (flared): 108,582 boe
Water (treated): 79,940 bbl
CO2 storage
Seal, primary: Uppat Shale, 23 m thick
Seal complex: KCF Shale, 1065 m thick
Capacity (min) – produced volume: 95 kt
Capacity (low) – structural volume: 0.35 Mt
Capacity (mid) – structural volume: 2.1 Mt
Capacity (high) – structural volume: 9.4 M
Figure G.2. Well 11/24-1 log for reservoir section and overlying seal.
Appendix I Lybster CO2 Storage Assessment
A series of interpretation techniques have been applied to establish the storage capacity and storage suitability of Lybster. The North Sea Transition Authority (NSTA) and British Geological Survey (BGS) are the primary sources for the seismic and well data that inform the analysis.
The study area is defined by the boundary of RE07112025, a 3D seismic survey acquired in 2007 across quadrant-blocks 11/24 and 11/25, encompassing an area of 306 km2 – Fig 4.1. 3D seismic is the most effective data for accurately characterising subsurface structures and reservoir connectivity (Dee, et al., 2005). The survey defines the Lybster study area as it represents the limit of the subsurface that can be geologically mapped with confidence. Site characterisation also relies on existing well data from the field and surrounding area. These provide depth-conversion calibration points for 3D models based on the seismic. Well data are provided by the North Sea Transition Authority (NSTA) and British Geological Survey (BGS) through their open access data resources.
Table I.1: Summary of wells in area and available data.
G, S, D stands for gamma, sonic, density; CS for check shot.
|
Well ID |
Type |
Depth, m |
Bottom hole Fm |
Composite |
G, S, D |
Core |
CS |
|---|---|---|---|---|---|---|---|
|
11/24-1 |
Vertical |
1920 |
Lossiemouth Fm |
Yes |
Yes |
Yes |
No |
|
11/24a-2 |
Vertical |
2111 |
Lossiemouth Fm |
Yes |
Yes |
Yes |
Yes |
|
11/24a-2z |
Deviated |
2190 |
Lossiemouth Fm |
Yes |
Yes |
No |
No |
|
11/24b-4 |
Vertical |
1000 |
Brora Coal |
Yes |
Yes |
No |
No |
|
11/25-1 |
Vertical |
3347 |
Old Red Sstn (Devonian) |
Yes |
Yes |
Yes |
No |
|
11/25-2 |
Vertical |
3749 |
Old Red Sstn (Devonian) |
Yes |
Yes |
Yes |
No |
|
11/29-1 |
Vertical |
2626 |
Top Lady’s Walk Shale (L Jurassic) |
Yes |
Yes |
No |
N/A |
|
11/30-7 |
Vertical |
2250 |
Lossiemouth Fm (Top Triassic) |
Yes |
Yes |
Yes |
N/A |
|
12/16-2 |
Deviated |
1583 |
Brora Coal |
Yes |
Yes |
No |
N/A |
|
12/21-3 |
Deviated |
4236 |
Old Red Sstn (Devonian) |
Yes |
Yes |
Yes |
N/A |
|
12/21-5 |
Deviated |
2760 |
Stotfield Chert |
Yes |
Yes |
No |
N/A |
|
12/26-2 |
Deviated |
1706 |
Base Kimmeridge Clay (U Jurassic) |
Yes |
Yes |
Yes |
N/A |
|
12/26-3 |
Deviated |
3156 |
Old Red Sstn (Devonian) |
Yes |
Yes |
No |
N/A |
Five exploration wells are located within the study area, including the Lybster discovery well, 11/24-1. A further seven wells were selected from the surrounding region, based on location and data quality, to establish the stratigraphic and structural relationship between the field and its surrounding geology. Table I.1 documents the studied wells. Each of the wells penetrate beyond the mid Jurassic strata that contains the oil field reservoir. However, few wells extend beyond the Upper Triassic, setting the stratigraphic floor for the evaluation above the Permian basement.
Premier Oil drilled the ‘wildcat’ discovery well, 11/24-1, in 1996. Production tests flowed 415-1850 barrels of oil per day from the Jurassic Beatrice Sandstones. The field was further developed in 2008 when Caithness Petroleum drilled an extended reach well, L11/24-3 and side-track, L11/24-3Z from onshore.
Both the well and side-track showed minimal oil. Caithness Petroleum re-entered L11/24-3 and drilled a second side-track, L11/24-3y, to intersect 11/24-1, the discovery well – Fig 3.2. The new side-track successfully proved hydrocarbon reserves, and in 2011 Caithness Petroleum re-entered the well to start production in 2012. The field was purchased by IGas in 2013, followed by a 5-month workover period to improve the well. However, the workover failed to prevent an increasing gas-oil ratio, and increasing water cut. IGas suspended production from the well in 2014 during a period of low oil prices.
I1 Site characterisation | Attribute suitability
Injectivity: The production history suggests good injectivity – Figure 6. The field area is in hydraulic connection with the regional aquifer. The measured permeability, 200 mD (range 10-4,000 mD) reflects the observed reservoir lithologies which are predominantly darcy-permeability sandstones with minor interbedded siltstones. Reservoir thickness is adequate at 5-25 m and the reservoir units, the Beatrice A and B Sands, extend across the basin.
Seal: The history of oil and gas retention for many millions of years at Lybster and Beatrice is evidence for a highly suitable seal. The Uppat Shale is 23 m thick in well 11/24-1. The caprock was not sampled at Lybster but a 13 m core is available from Beatrice, well 11/30a-8. The shale was described as homogeneous but not tested for permeability – Appendix F.
Faults: The main fault that bisects the field is considered to be sealing as the western half of the field contains no hydrocarbons. A number of smaller associated faults lie within the field boundary. Two risks associated with faults, leakage and seismic reactivation, need to be de-risked at appraisal with a fault analysis study including a geomechanical assessment.
Wells: The discovery well, 11/24-1, was plugged with three cement isolation barriers, abandoned, and cleared to seabed in 1996. As such, it does not represent a leakage risk but cannot be repurposed for CO2 injection. The production well, 11/24-3y, is suspended with its surface infrastructure in place. A dedicated study on the suitability for repurpose as a CO2 injector needs to be to a condition of an appraisal licence.
CO2 density: The field depth, 1,430 m, is ideal for dense phase CO2 storage. The reservoir temperature and pressure, 47 °C and 15 MPa, mean that the reservoir CO2 density will be 725 kg/m3. This will make it highly miscible with the residual oil, 726 kg/m3. The CO2 will trap between the existing natural gas cap, 110 kg/m3, and porewater below, 1030 kgm3. This sandwich configuration is an ideal fluid trap for a depleted oil field. The oil-free area to the west of the fault will function as saline aquifer store with about 90% of the supercritical CO2 rising to trap beneath the caprock, and about 10% dissolving into the surrounding porewater.
Migration: The four-way dip trap geometry is ideal for preventing lateral migration. The structural spill point is to the northeast of the field at 1,500 m: a saddle to the up-dip Braemore prospect. The expected capacity, 2 Mt, assumes no fill beyond the oil-water contact at 1490 m. The appraisal licence will require a site boundary that is likely to be defined by the structural spill point and dynamic simulation of the expected plume extent.
Location: The near-shore location and proximity to sources of high-value bio-CO2, primarily from local distilleries, makes the location exceptional. Access by road places requirements and limits on annual injection rates relating to trucked loads and on-site temporary storage.
Monitoring: Not assessed. The monitoring location for the storage area is in shallow waters of around 40 m depth. This will require a suite of geophysical equipment suited to the local environment. The appraisal licence will require a plan for monitoring storage that focuses on the injection well and remote monitoring from the surface.
Intervention: Not assessed. The requirements and cost of intervening in the case of poor well performance or unexpected migration out of the storage complex has not been assessed.
I2 Site characterisation | Capacity estimate
Structural Volume
Storage area 3 km2 (Assumes only half the field area of 6 km2 is available)
Net thickness 15 m (Assumes an average value from the range: 5-25 m)
Porosity 15% (Assumes an average value from the range: 8-22%)
Net to Gross 68% (Estimated from the gamma ray log for 11/24-1)
CO2 density 725 kg/m3 (Dense phase at ambient reservoir conditions)
Saturation 62.5% (Assume an average value from the range: 50-75%)
High CO2 capacity, optimistic: 9.4 Mt = 6E06 x 21 x 0.19 x 0.76 x 740 x 0.70 kg
Mid CO2 capacity, expected: 2.1 Mt = 3E06 x 15 x 0.15 x 0.68 x 725 x 0.625 kg
Low CO2 capacity, pessimistic: 0.35 Mt = 1.5E06 x 9 x 0.11 x 0.6 x 710 x 0.55 kg
Produced Volume
Produced reservoir fluids 131,227 m3 (Oil: 14%, Gas: 76%, Water: 10%)
CO2 density, reservoir conditions 725 kg/m3 (Pressure: 15 MPa, Temp: °47 C)
Minimum and highly conservative: 95.1 kt = 131,227 m3 x 725 kg/m3
STRUCTURAL VOLUME: A structural volume estimate of storage capacity assumes the pore space is available for CO2. A mid-range value of 2.1 Mt indicates the potential for a reasonably sized CO2 storage project. The limitations and range assumptions for the pore volume estimate should be accounted for within the low estimate which assumes the smallest area and poorest reservoir quality, representing a minimum capacity of 350,000 tonnes of CO2.
PRODUCED VOLUME: The fluid replacement capacity for a produced field is often useful in establishing a reliable ‘proven’ storage capacity estimate, based on known volumes which have been produced from the reservoir. However, the Lybster field was in production for a surprisingly brief period, which means that a production volume estimate will be extremely low, and hardly representative of the available pore volume. A storage capacity of 95,100 tonnes is estimated from produced volumes of oil, gas, and water using this method.
I3 Site characterisation | Stratigraphic analysis
An assessment of the stratigraphy was completed using composite logs, geophysical logs, core photographs, and published studies (Thomson & Underhill, 1993; Richards, et al., 1993; Tamas, et al., 2022). Where data gaps existed within the study area, wells from the surrounding region with a similar stratigraphy were looked at as analogues for Lybster.
The Lybster site assessment uses standard criteria established in previous CO2 storage projects (Chadwick, et al., 2008; Alcade, et al., 2021; IEAGHG, 2022). Lybster attributes are assessed using a traffic light, where green indicates favourable properties, red indicates unfavourable properties, and orange indicates intermediate values. Table I2 documents the outcomes for storage criteria.
Table I.2: Traffic light assessment of reservoir and seal attributes for CO2 storage
|
Parameter |
Value |
Aspect of storage |
|
Depth |
1433 m |
Storage capacity |
|
Thickness (net) |
15 m, 5 – 25 m |
Storage capacity, injectivity |
|
Porosity |
15%, 8 – 22% |
Storage capacity |
|
Permeability |
200 mD, 10 – 4000 mD |
Injectivity |
|
CO2 density |
725 kg/m3, supercritical |
Storage capacity |
|
Rock type |
Sandstone with siltstones |
Storage efficiency |
|
Seal lithology |
Low permeability mudstone |
Containment |
|
Seal thickness |
23 m in well 11/24-1 |
Containment |
Secondary reservoir: The Brora Sandstone and Alness Spiculite members display good reservoir characteristics as indicated by their low-gamma ray values and lithologies, but poor permeability within the two formations suggests a reservoir quality unsuitable for CO2 storage.
Secondary seal: The Kimmeridge Clay Formation exists as a thick regional succession of fine siltstones and mudstones above the Uppat Mudstones. A stable gamma-ray curve in all well logs is indicative of a homogenous, low-porosity formation, suitable for a secondary seal.
I4 Site characterisation | Structural analysis
A four-way dip closure, or dome, associated with an anticlinal structural deformation traps buoyant CO2 and tightly constrains the migration of CO2 within the crest of the structure. The main fault which crosscuts the field area is identified as a potential leakage pathway and requires further investigation to de-risk the site, but its proven history of trapping hydrocarbons is a positive indicator.
The Lybster structure formed at a flexure point during tectonic inversion of the Inner Moray Firth area. A fault segments the field roughly in half: a western compartment with no oil as proven by wells 11/24-3 and 11/24-3z; and an eastern compartment where the Beatrice Sandstones are oil bearing.
The Uppat Mudstones are an effective top seal, preventing upward migration. The adjacent structural high at the Braemore prospect, and patterns identified across the in-line seismic profile, suggest a series of anticline-syncline pairs along strike, parallel to the coastline.
The continuation of the reservoir along strike presents the possibility of increased storage capacity. Injecting down-dip of the trap and into the water-leg of the reservoir on the migration path but outside the structural closure increases the storage capacity with a proven trap at the end of the migration path.
I5 Site characterisation | Production Data
Existing exploration and production well data from Lybster allows for a detailed analysis of the reservoir pressure conditions and residual fluids within the field, both of which are significant for CO2 storage capacity calculations. The Lybster field is hydrostatically pressured with open boundaries to a regional aquifer, the Beatrice Formation. This is as a positive indicator for CO2 storage as a reservoir with open boundaries allows for the displacement of pore fluids and the dispersion of injected-related pressure. This increases the storage capacity compared to a field with closed boundaries.
Production data suggests the field contains a column of residual natural gas. This is also favourable for CO2 storage as gas is more compressible than oil or water, increasing storage capacity. As CO2 is denser than natural gas at reservoir conditions, 724 kg/m3 vs 110 kg/m3, the CO2 will occupy the bottom of the reservoir when injection stops with the remaining natural gas at the top of the reservoir. This acts as a gas barrier which reduces the risk of CO2 leakage through the top seal.
Table I.3: Historic production data for Lybster oil field.
|
Year |
Month |
Oil, bbl |
Reservoir, m^3 |
Gas, mscf |
Gas, boe |
Reservoir, m^3 |
Water, m^3 |
Water, bbl |
Reservoir, m^3 |
Reservoir, m^3 |
|---|---|---|---|---|---|---|---|---|---|---|
|
2012 |
June |
7,724 |
1,424 |
11,160 |
1,983 |
1,196 |
0 |
0 |
0 |
2,620 |
|
2012 |
July |
6,762 |
1,247 |
20,235 |
3,596 |
2,945 |
37 |
233 |
37 |
6,849 |
|
2012 |
August |
6,938 |
1,279 |
24,862 |
4,418 |
3,765 |
47 |
296 |
47 |
11,941 |
|
2012 |
September |
8,064 |
1,487 |
37,505 |
6,665 |
5,937 |
17 |
107 |
17 |
19,381 |
|
2012 |
October |
9,202 |
1,697 |
59,753 |
10,618 |
9,849 |
88 |
554 |
88 |
31,016 |
|
2012 |
November |
4,491 |
828 |
27,969 |
4,970 |
4,590 |
41 |
258 |
41 |
36,476 |
|
2012 |
December |
3,202 |
590 |
3,390 |
602 |
272 |
21 |
132 |
21 |
37,359 |
|
2013 |
January |
1,717 |
317 |
10,065 |
1,789 |
1,641 |
157 |
988 |
158 |
39,474 |
|
2013 |
February |
1,057 |
195 |
5,933 |
1,054 |
963 |
50 |
314 |
50 |
40,682 |
|
2013 |
March |
3,038 |
560 |
12,713 |
2,259 |
1,980 |
302 |
1,900 |
303 |
43,525 |
|
2013 |
April |
9,649 |
1,779 |
71,901 |
12,777 |
12,004 |
778 |
4,894 |
781 |
58,090 |
|
2013 |
May |
7,491 |
1,382 |
74,974 |
13,323 |
12,792 |
798 |
5,019 |
802 |
73,066 |
|
2013 |
June |
3,485 |
643 |
31,536 |
5,604 |
5,345 |
493 |
3,101 |
495 |
79,549 |
|
2013 |
Jul-Nov |
0 |
0 |
0 |
0 |
0 |
0 |
0 |
0 |
79,549 |
|
2013 |
December |
2,132 |
393 |
742 |
132 |
0 |
940 |
5,913 |
944 |
80,886 |
|
2014 |
January |
4,403 |
812 |
22,919 |
4,073 |
3,684 |
838 |
5,271 |
842 |
86,224 |
|
2014 |
February |
1,912 |
353 |
9,747 |
1,732 |
1,563 |
724 |
4,554 |
727 |
88,866 |
|
2014 |
March |
3,837 |
708 |
37,752 |
6,708 |
6,434 |
1073 |
6,749 |
1078 |
97,086 |
|
2014 |
April |
2,573 |
474 |
28,181 |
5,008 |
4,835 |
903 |
5,680 |
907 |
103,302 |
|
2014 |
May |
3,403 |
628 |
28,605 |
5,083 |
4,822 |
1244 |
7,825 |
1250 |
110,001 |
|
2014 |
June |
2,359 |
435 |
35,598 |
6,326 |
6,202 |
848 |
5,334 |
852 |
117,490 |
|
2014 |
July |
1,812 |
334 |
25,709 |
4,569 |
4,468 |
1035 |
6,510 |
1040 |
123,332 |
|
2014 |
August |
1,138 |
210 |
18,223 |
3,238 |
3,182 |
807 |
5,076 |
811 |
127,535 |
|
2014 |
September |
742 |
137 |
8,052 |
1,431 |
1,381 |
759 |
4,774 |
762 |
129,815 |
|
2014 |
October |
730 |
135 |
1,165 |
207 |
133 |
575 |
3,617 |
578 |
130,660 |
|
2014 |
November |
132 |
24 |
2,331 |
414 |
408 |
80 |
503 |
80 |
131,173 |
|
2014 |
December |
0 |
0 |
0 |
0 |
0 |
54 |
340 |
54 |
131,227 |
Appendix J Sources methodology
The database comprises a list of candidate bio-CO2 sources. The methodology calculates CO2 emissions for these sites based on publicly available data[8] (see below). Facilities include those that are already operational, under construction, or at FID and expected to come online before 2030. Facilities from across the various sources and source types are identified from a combination of the following publicly available sources:
• Renewable Energy Planning Database (REPD, 2024)
• BEIS Heat Networks Planning Database (BEIS, 2024)
• Ofgem Renewables Obligation Annual Report (Ofgem, 2024a)
• Ofgem Accredited Stations (Ofgem, 2024b)
• Whisky Invest Direct (WID, 2024)
• The Official Information Portal on Anaerobic Digestion (NNFCC, 2023)
• UK Energy from Waste Statistics 2022 (Tolvik, 2023)
• Scottish Environment Protection Agency SPRI (SEPA, 2022)
• ENDS Waste & Bioenergy (ENDS, 2024)
• Project and facility websites
• Local authority planning portals
Estimating the amount of bio-CO2
The threshold for inclusion is 3 ktpa of bio-CO2. This is based on consultation with current commercial bio-CO2 capture operations in Scotland (Carbon Capture Scotland Ltd, 2024). The methodology follows a top-down calculation similar to Brownsort (2018), using installed or generating capacity, and assumptions to estimate total CO2 emissions from biogenic sources. The following section outline the methodology and key assumptions for each source type.
Biomass combustion
Biomass combustion is determined from three sources and categorised into two groups: biomass combustion for heat and Combined Heat and Power (CHP). The REPD (2024) is updated quarterly and includes data on installed capacity for all UK renewable electricity and CHP projects. For heat provision, a capacity factor of 56.7% (Dukes, 2022) and a heat efficiency of 80% are used. For CHP, the same capacity factor of 56.7% and an electrical conversion efficiency of 35% are used. All biomass feedstock is assumed to be wood with a specific CO2 emission of 0.39kg/kW, despite chicken litter being the main feedstock for one site, Lochgelly.
Energy from Waste
EfW facilities are calculated based on plant waste processing capacity data collected from project or facility websites, ENDS Waste & Bioenergy (ENDS, 2024), and, where necessary, local authority planning portals. Emissions arising are modelled on a ratio of 0.944:1 tCO2 per tonne of waste processing capacity, i.e. 0.944 tCO2 produced for every tonne of waste. Plants are assumed to operate at 50% of plated capacity during the first year of operation and at 95% for the rest of their operational lifetime. It is assumed that 50% of emissions arising from EfW is biogenic in origin following the generally accepted UK industry baseline, although it is accepted that this figure could be conservative and is certainly subject to change.
Fermentation
Two factors are considered: firstly, the production of pure alcohol intended for use in beverages; and secondly, the ratio of CO2 to pure alcohol produced during fermentation.
Actual volumes of alcohol produced by specific breweries and distilleries are not publicly available. Hence, plant capacity data are used to estimate bio-CO2 emissions. Figures for the amount of pure alcohol produced at grain whisky distilleries in Scotland is derived from distillery capacity data and by applying a process capacity factor of 90%. Malt whisky production is similarly assessed, with the difference of applying a capacity factor of 75%, reflecting the smaller scale and less industrial nature of this production.
To estimate the ratio of CO2 to alcohol that is produced, the methodology assumes that fermentation of one molecule of glucose produces two molecules of ethanol and two molecules of CO2 in a 1:1 molar ratio. By adjusting this ratio for the molecular weights of ethanol (46g/mol) and CO2 (44g/mol), and for the density of ethanol (0.789kg/litre), it is determined that 0.755kg CO2 is produced per litre of pure ethanol.
Biogas and biomethane
Plant capacity data for AD biogas and biomethane upgrading are acquired from the NNFCC AD portal (NNFCC, 2023). This provides comprehensive information on the CHP generation capacity and biomethane injection capacity of AD biogas plants. Emissions are estimated assuming maximum capacity from generation capacity data, with a presumed capacity utilisation factor of 80% for AD plants – a high-capacity factor suggested by the NNFCC (2023).
For AD biogas combustion, emissions are calculated based on an assumed mid-range energy conversion efficiency of 37.5%. Efficiency is typically 35-40% for electricity and 40-45% for heat. A typical biogas composition with a CH4/CO2 ratio of 55:45 by volume is assumed. The methane energy content is presumed to be the higher heating value (HHV), 55.53 GJ/t, while gas densities were determined from values reported in the literature, 0.668 kg/m3.
Biomethane upgrading emissions are calculated using the same assumptions and sources as for biogas above but with a separate capacity factor of 47.7%. The calculations for biomethane upgrading provide two values: the first value is for the CO2 that is separated from the raw biogas, which would typically be discharged at the upgrading site. The second value is for the CO2 from the combustion of the upgraded biomethane, which would usually be released downstream where the biomethane is ultimately burnt. Only the CO2 discharged at the upgrading facility is within the scope of this study.
Landfill and sewage
CO2 emissions are calculated based on the installed capacity data for each plant over the period 2022-2023 (Ofgem, 2024a). Average Scottish capacity factors (DESNZ, 2024) are 33% for landfill gas and 53% for sewage gas. The same assumptions and methodology as outlined for biogas above are used for a landfill gas composition ratio of 50:50 of CH4/CO2 by volume.
Scotland’s bio-CO2 resource 2024-2035
The total amount of bio-CO2 in Scotland averages 3.7 Mtpa between 2027-2035 – Table J.1.These projections are based on facilities that are known to have reached at least the FID stage and they assume unchanged operational profiles based on the most recent publicly available data. Given Scotland and the UK’s ambitions for bioenergy, coupled with global forecasts for the sector (an annual growth rate of 3.56% is expected (CAGR 2024-2028) (Statista, 2024)), available volumes of bio-CO2 could increase.
Table J.1: Bio-CO2 forecast. The increase to 2027 is due to 6 new energy-from-waste plants coming online. The reduction post-2030 is due to Baldovie 1, an EfW plant, coming offline.
|
Year |
2024 |
2025 |
2026 |
2027 |
2028 |
2029 |
2030 |
2031 |
2032 |
2033 |
2034 |
2035 |
|
Mtpa |
3.15 |
3.38 |
3.64 |
3.72 |
3.72 |
3.72 |
3.72 |
3.68 |
3.68 |
3.68 |
3.68 |
3.68 |
Post-combustion adjustment factor
A minimum capture rate of 95% applies across all sources. This follows the UK Environment Agency Best Available Technique (BAT) (UK Environment Agency, 2021) guidance for post-combustion capture plants, although it should be noted that capture rates higher than 95% are achievable. High rates can be economically viable and are desirable from a climate mitigation perspective (Gibbins et al., 2024). For EfW, this can be as high as 99.72% with only a marginal cost penalty (Su et al., 2023). A 95% capture rate applies to biomethane upgrading facilities and distilleries. This is likely to be conservative for distillery capture, which achieves around 97% [9].
North America and the EU both enacted net zero by 2050 in 2021. Canada and the USA share similar 2030 ambitions to decarbonise by 40-to-50% from 2005 levels. This is much less ambitious than the EU (55%) and UK (68%) 2030 targets which are from 1990 levels. The USA and Canada saw peak annual emissions in the mid 2000s at 6 Gt and 0.8 Gt respectively, whereas the EU and UK emissions peaked at 5 Gt and 0.8 Gt in the early 1990s.
Carbon capture in North America is characterised by early regional movers but slow overall progress on storage. This has resulted in legislation to accelerate the deployment of CCS in response to the enacted net zero targets. The following section briefly reviews the region to highlight relevant projects and policy actions. As with Europe, the early regional projects have been vertically integrated and located in states and provinces strongly associated with fossil fuel extraction: Alberta, Saskatchewan, North Dakota, Louisiana, and Texas.
USA
In 2021, the Biden administration set a goal of 500 million tonnes of annual carbon abatement by 2050. The intermediate target is 85-170 million tonnes of annual carbon capture and storage by 2030. This new target is incentivised by the Infrastructure Investment and Jobs Act 2021 (IIJA) and Inflation Reduction Act 2022 (IRA). IIJA and IRA are intended to support investment decisions on 6 large commercial capture projects and 4 DAC hubs by 2030. The new incentives have created a rush for storage that has resulted in a bottleneck of Class VI permits applications for CO2 injection wells. As of April 2024, there are 128 applications under review, 56% of which were submitted in the previous 12 months. The EPA has issued 4 permits since 2010.
The IRA increases pre-existing credits under Section 45Q of the Internal Revenue Code from $50 to $85 per ton for CCS, and from $50 to $180 per ton for DAC with permanent storage. The 45Q tax credits expire after 12 years of operational capture and only apply to projects that begin construction before 2033. The credits are transferable between the capture entity and another entity, creating a carbon trading market.
In addition to 45Q, IIJA provides $12bn of funding for capture (30%), DAC hubs (30%), storage testing and validation (20%), transport infrastructure (17.5%), and 1% for storage permitting. The funds potentially reduce the CAPEX of large DAC and CCS projects by up to 75%.
In the USA, CO2 storage requires an Environmental Protection Agency (EPA) Class VI permit for an injection well under the federal Underground Injection Control (UIC) program[10]. States can apply for UIC primacy to expedite the licensing process. This may take years but transfers the primary enforcement authority from the EPA to the State. Only two States have been granted primacy. North Dakota applied for primacy in 2013 and was approved in 2018. Wyoming formally applied in 2019 and was approved in 2020, but that process was preceded by years of dialogue with EPA.
As of April 2024, the EPA have issued four Class VI permits, two of which are active, both at the Archer Daniels Midland ethanol plant, Illinois. For both, the time from application submission to issuance was three years, though the entire permitting process took around six years. There are currently 128 applications under review, 56% of which were submitted within the last 12 months.
Pursuant to the UIC program, EPA has promulgated regulations and established minimum federal requirements for six classes of injection wells (Class I to Class VI). Each well class is based on the type and depth of the injection activity and the potential for the injection activity to impact underground sources of drinking water.
In 2010, EPA established Class VI, the most recently created UIC well class, for wells used to inject CO2 into deep subsurface geologic formations for long-term underground storage—a process known as “geologic sequestration.” By comparison, Class II wells inject fluids associated with oil and natural gas production for enhanced oil recovery. Currently, there are approximately 180,000 active Class II wells but only two active Class VI wells in the United States as of 2022. 80% of Class II wells are used for enhanced oil recovery.
Thus, project proponents seeking to inject CO2 for permanent geologic sequestration must obtain a permit from EPA to drill and operate a Class VI well. A geologic sequestration project is defined by the extent of the area of review (AoR), which is the region surrounding the well where underground sources of drinking water may be impacted by the injection activity. A permit applicant must delineate the AoR to predict the movement of the injected CO2 and displaced fluids using a model that considers the geologic conditions and operations.
The permit application must present a detailed evaluation of site geology, the AoR, and how the modelling inputs reflect site-specific geologic and operational conditions, well construction design, plans to monitor the site, and other required activities. Permit applications are multifaceted and address all aspects of the geologic sequestration project to ensure that underground sources of drinking water are protected. They are comprehensive, and contain maps and cross sections, modelling results, water quality data, analyses of core samples and well logs, engineering schematics, and financial information.
All of the permit application information submitted and reviewed is interrelated, and the information collected to meet one requirement may inform or be informed by other submittals or analyses. Therefore, project proponents need to ensure that, collectively, all of the information submitted is consistent, supports a determination of site-suitability, and affords protection to underground sources of drinking water.
Appendix L Cost-revenue analysis
Cost of trucking
£20 per tonne estimate for 320 km round-trip from Carbon Capture Scotland Ltd.
A, annual 100,000 tonnes
P, payload 20 tonnes
L, distance 160 km
T, trip = 2L 320 km
N, trucks per day 16
D, drivers 16
F, fuel diesel 152 pence per litre
C, fuel consumption 33 litres per 100 km
B, fuel burn per km £0.50 per km
Cost per year of 16 trucks amortised over 10 years: £25,000 x 16 = £400,000
Cost of fuel at £0.50/km for one year: 100,000/20 x 320 x 0.5 = £800,000
Wages for 16 drivers over one year: 50,000 x 16 = £800,000
Total = £2,000,000
Cost per tonne for 100,000 tonne annual payload = £20
Cost of biomass capture
Based on the levelised cost analysis by Lehtveer & Emanuelsson (2021):
LCOC = ((CAPEX×CRF) / FLH) + OPEXfix + OPEXvar + CFuel + CTransportation + CStorage – CElectricity
By neglecting the cost of electricity, and determining the transport and storage costs separately, the LCOC simplifies to the cost of capture:
CCapture = (CAPEX×CRF)/FLH + OPEXfix + OPEXvar + CFuel
- CAPEX, capital expenditure €3.31 million per MW
- OPEXfix, fixed operating expense €105,000 per MW per year
- OPEXvar, variable operating expense €2.1 per MWh
- CRF, Capital Recovery Factor CRF = (i*(1 + i)*n) / ((1 + i)*(n – 1)
- i, interest rate 5%
- n, lifetime of the technology 40 years
- FLH, Full Load Hours 8000 hours per year
- CFuel,th , fuel cost for biomass €30 per MWhth
- Carbon intensity 0.4 tonne/MWhth
- η, plant efficiency 27%
CRF = (0.05*(1+0.05)40) / ((1+0.05)40−1) = 0.0583
CAPEX and OPEX
Annualized CAPEX: CAPEXannual = (CAPEX×CRF)/FLH = 3.31×106 × 0.0583/8000 = 24.12 €/ MWh
Fixed OPEX per MWh: OPEXfix = 105,000€/MW/FLH = 105,000/8000 = 13.125 €/MWh
Total OPEX per MWh: OPEXtotal = OPEXfix + OPEXvar = 13.125+2.1 = 15.225 €/MWh
Biomass energy needed to produce 1 MWh
Biomass input per MWh = 1 / η = 1/0.27 ≈ 3.7 MWhth / MWh electricity
CO2 produced per MWh of electricity produced
CO2 per MWh = Biomass per MWh × carbon intensity = 3.7 × 0.4 = 1.48 tCO2 / MWh electricity
Cost of fuel
CFuel = CFuel,th * Biomass per MWh = 30 *3.7 = 111 €/ MWh electricity
Cost of capture for biomass combustion
CoCBECCS = CAPEXannual + OPEXtotal + CFuel = (24.12+15.225+111) = 150.345 €/MWh
Cost of capture for biomass combustion
CCapture, Biomass = (CAPEXannual + OPEXtotal + CFuel) / CO2 per MWh = 150.345/1.48 = 101.58 €/ tCO2
Total cost per tonne
- /tCO2 = £86.50/tCO2 1 EUR = 0.851 GBP
Table M.1 Sources by sector; average bin size (ktpa), and potential number of capture units per site for all low-cost sites (NxU), assuming a unit is 3-5 ktpa.
|
8 x 1 |
N x U = Sites x Units, low-cost (Nx U) = Sites x Units, high cost |
|
|
|
ktpa |
| |||
|
6 |
|
Biomass |
7-360 |
| |||||
|
– 6 – |
|
|
|
|
| ||||
|
6 |
|
|
|
|
Energy from Waste |
38-158 |
| ||
|
6 |
|
|
|
|
|
|
| ||
|
– 6 – |
7 x 2 |
|
|
|
AD Combustion |
3-44 |
| ||
|
6 |
14 |
|
|
|
|
|
| ||
|
6 |
13 |
|
|
|
Distillery Wash |
2-75 |
| ||
|
6 |
13 |
|
|
|
|
|
| ||
|
6 |
– 13 – |
3 x 4 |
|
|
AD Upgrading |
5-13 |
| ||
|
– 6 – |
12 |
30 |
|
|
|
|
| ||
|
6 |
12 |
30 |
|
|
|
|
| ||
|
6 |
– 12 – |
– 30 – |
|
|
|
|
| ||
|
5 |
– 12 – |
– 28 – |
|
|
|
|
| ||
|
5 |
12 |
27 |
|
|
|
|
| ||
|
5 |
11 |
– 24 – |
1 x 8 |
|
|
|
| ||
|
– 5 – |
11 |
24 |
55 |
2 x 16 |
|
|
| ||
|
– 5 – |
9 |
22 |
49 |
108 |
|
|
| ||
|
4 |
– 8 – |
21 |
49 |
97 |
|
|
| ||
|
4 |
8 |
– 21 – |
– 46 – |
94 |
|
|
| ||
|
4 |
8 |
20 |
45 |
83 |
|
|
| ||
|
4 |
8 |
19 |
44 |
75 |
[6 x 32] |
|
| ||
|
– 4 – |
7 |
19 |
44 |
75 |
– 242 – |
|
| ||
|
3 |
7 |
18 |
38 |
70 |
158 |
|
| ||
|
– 3 – |
7 |
17 |
36 |
69 |
150 |
|
| ||
|
2 |
7 |
17 |
33 |
– 69 – |
144 |
[2 x 64] |
| ||
|
– 2 – |
7 |
16 |
32 |
67 |
135 |
360 |
| ||
|
– 2 – |
– 7 – |
15 |
31 |
67 |
135 |
279 |
| ||
|
Ave: 5 ktpa |
10 ktpa |
20 ktpa |
40 ktpa |
80 ktpa |
160 ktpa |
320 ktpa |
| ||
Table M.2: Sources by sector, location, road distance from nearest storage (km), process of capture, and annual potential capture rate (ktpa).
|
Biomass |
|
|
|
|
|
|
|
| |||||||
|
LOC |
ID |
Short name |
Post code |
Latitude |
Longitude |
km |
Sector |
Process |
ktpa | ||||||
|
F |
1001 |
Markinch |
KY7 5PZ |
56.20017 |
-3.15669 |
10 |
Biomass |
Combustion |
360 | ||||||
|
S |
1002 |
Croft |
DG11 2SQ |
55.15298 |
-3.38013 |
69 |
Biomass |
Combustion |
279 | ||||||
|
N |
1003 |
Morayhill |
IV2 7JQ |
57.51775 |
-4.08378 |
151 |
Biomass |
Combustion |
242 | ||||||
|
G |
1004 |
Cowie |
FK7 7BQ |
56.07768 |
-3.86212 |
74 |
Biomass |
Combustion |
150 | ||||||
|
C |
1005 |
Caledonian |
KA11 5AT |
55.58462 |
-4.64174 |
112 |
Biomass |
Combustion |
144 | ||||||
|
C |
1006 |
Liberty |
ML1 1PU |
55.78842 |
-3.98196 |
87 |
Biomass |
Combustion |
94 | ||||||
|
F |
1007 |
Lochgelly |
KY5 0HR |
56.16862 |
-3.30545 |
18 |
Biomass |
Combustion |
69 | ||||||
|
N |
1008 |
Speyside |
AB38 9RX |
57.49494 |
-3.20666 |
224 |
Biomass |
Combustion |
69 | ||||||
|
F |
1009 |
Tarmac |
EH42 1SL |
55.98063 |
-2.47298 |
108 |
Biomass |
Combustion |
55 | ||||||
|
N |
1010 |
Rothes |
AB38 7BW |
57.53307 |
-3.20761 |
225 |
Biomass |
Combustion |
46 | ||||||
|
F |
1011 |
Guardbridge |
KY16 0US |
56.36482 |
-2.89013 |
38 |
Biomass |
Combustion |
36 | ||||||
|
H |
1012 |
Acharn |
FK21 8RA |
56.44734 |
-4.34494 |
116 |
Biomass |
Combustion |
31 | ||||||
|
F |
1013 |
Diageo |
KY8 5RL |
56.18953 |
-3.05583 |
9 |
Biomass |
Combustion |
30 | ||||||
|
C |
1014 |
Egger |
KA18 2LL |
55.47011 |
-4.32728 |
98 |
Biomass |
Combustion |
30 | ||||||
|
N |
1015 |
Balcas |
IV18 0LT |
57.70219 |
-4.15645 |
109 |
Biomass |
Combustion |
28 | ||||||
|
O |
1016 |
Pulteney |
KW1 5BA |
58.43514 |
-3.08414 |
24 |
Biomass |
Combustion |
19 | ||||||
|
C |
1017 |
Glennon |
KA10 6DJ |
55.54741 |
-4.68127 |
109 |
Biomass |
Combustion |
14 | ||||||
|
F |
1018 |
Gleneagles |
PH3 1NF |
56.28626 |
-3.75079 |
64 |
Biomass |
Combustion |
7 | ||||||
|
EfW |
|
|
|
|
|
|
|
| |||||||
|
LOC |
ID |
Short name |
Post code |
Latitude |
Longitude |
km |
Sector |
Process |
ktpa | ||||||
|
C |
1019 |
SCEC |
G51 4SJ |
55.86136 |
-4.35344 |
111 |
EfW Plant |
Combustion |
158 | ||||||
|
C |
1020 |
Drumgray |
ML6 7TD |
55.90592 |
-3.94183 |
87 |
EfW Plant |
Combustion |
135 | ||||||
|
C |
1021 |
Dunbar |
EH42 1SW |
55.97478 |
-2.46485 |
109 |
EfW Plant |
Combustion |
135 | ||||||
|
F |
1022 |
Westfield |
KY5 0HR |
56.16993 |
-3.29276 |
21 |
EfW Plant |
Combustion |
108 | ||||||
|
G |
1023 |
Earls Gate |
FK3 8XG |
56.01194 |
-3.73653 |
55 |
EfW Plant |
Combustion |
97 | ||||||
|
F |
1024 |
Oldhall |
KA11 5DG |
55.59488 |
-4.64028 |
113 |
EfW Plant |
Combustion |
83 | ||||||
|
F |
1025 |
Millerhill |
EH22 1SX |
55.92459 |
-3.08624 |
72 |
EfW Plant |
Combustion |
70 | ||||||
|
C |
1026 |
GRREC |
G42 0PJ |
55.83439 |
-4.24446 |
101 |
EfW Plant |
Combustion |
67 | ||||||
|
E |
1027 |
NESS |
AB12 3BG |
57.12652 |
-2.07786 |
73 |
EfW Plant |
Combustion |
67 | ||||||
|
F |
1028 |
Baldovie 2 |
DD4 0NS |
56.48495 |
-2.90174 |
53 |
EfW Plant |
Combustion |
49 | ||||||
|
G |
1029 |
Levenseat |
ML11 8TS |
55.79743 |
-3.68852 |
73 |
EfW Plant |
Combustion |
45 | ||||||
|
F |
1030 |
Baldovie 1 |
DD4 0NS |
56.48495 |
-2.90174 |
53 |
EfW Plant |
Combustion |
44 | ||||||
|
C |
1031 |
Binn |
PH2 9PX |
56.30246 |
-3.34516 |
33 |
EfW Plant |
Combustion |
38 | ||||||
|
Distillery |
|
|
|
|
|
|
|
| |||||||
|
LOC |
ID |
Short name |
Post code |
Latitude |
Longitude |
km |
Sector |
Process |
ktpa | ||||||
|
F |
1032 |
Cameronbridge |
KY8 5RL |
56.18951 |
-3.0558 |
9 |
Distillery |
Separation |
75 | ||||||
|
A |
1033 |
Girvan |
KA26 9PT |
55.25928 |
-4.83023 |
84 |
Distillery |
Separation |
75 | ||||||
|
F |
1034 |
North British |
EH11 2PX |
55.93922 |
-3.23654 |
49 |
Distillery |
Separation |
49 | ||||||
|
C |
1035 |
Strathclyde |
G5 0QB |
55.84846 |
-4.23995 |
102 |
Distillery |
Separation |
27 | ||||||
|
N |
1036 |
Invergordon |
IV18 0HP |
57.69546 |
-4.16491 |
109 |
Distillery |
Separation |
24 | ||||||
|
G |
1037 |
Starlaw |
EH47 7BW |
55.88934 |
-3.5785 |
59 |
Distillery |
Separation |
17 | ||||||
|
C |
1038 |
Loch Lomond |
G83 0TL |
55.99241 |
-4.57636 |
126 |
Distillery |
Separation |
12 | ||||||
|
N |
1039 |
Glenlivet |
AB37 9DB |
57.34351 |
-3.3376 |
231 |
Distillery |
Separation |
12 | ||||||
|
N |
1040 |
Glenfiddich |
AB55 4DH |
57.45485 |
-3.12795 |
236 |
Distillery |
Separation |
12 | ||||||
|
LOC |
ID |
Short name |
Post code |
Latitude |
Longitude |
km |
Sector |
Process |
ktpa | ||||||
|
N |
1041 |
Macallan |
AB38 9RX |
57.48488 |
-3.20614 |
231 |
Distillery |
Separation |
8 | ||||||
|
A |
1042 |
Ailsa Bay |
KA26 9PF |
55.26118 |
-4.83495 |
84 |
Distillery |
Separation |
7 | ||||||
|
N |
1043 |
Glen Ord |
IV6 7UJ |
57.5223 |
-4.47397 |
139 |
Distillery |
Separation |
7 | ||||||
|
N |
1044 |
Roseisle |
IV30 5YP |
57.66883 |
-3.47425 |
202 |
Distillery |
Separation |
6 | ||||||
|
N |
1045 |
Dalmunach |
AB38 7RE |
57.45479 |
-3.30027 |
221 |
Distillery |
Separation |
6 | ||||||
|
N |
1046 |
Teaninich |
IV17 0XB |
57.69154 |
-4.26051 |
114 |
Distillery |
Separation |
6 | ||||||
|
N |
1047 |
Glenmorangie |
IV19 1PZ |
57.82658 |
-4.07743 |
88 |
Distillery |
Separation |
4 | ||||||
|
N |
1048 |
Tomatin |
IV13 7YT |
57.34149 |
-4.01045 |
166 |
Distillery |
Separation |
3 | ||||||
|
N |
1049 |
Speyburn |
AB38 7AG |
57.53646 |
-3.21595 |
225 |
Distillery |
Separation |
2 | ||||||
|
F |
1050 |
Tullibardine |
PH4 1QG |
56.25815 |
-3.7851 |
123 |
Distillery |
Separation |
2 | ||||||
|
N |
1051 |
Balmenach |
PH26 3PF |
57.32546 |
-3.53212 |
208 |
Distillery |
Separation |
2 | ||||||
|
Landfill |
|
|
|
|
|
|
|
| |||||||
|
LOC |
ID |
Short name |
Post code |
Latitude |
Longitude |
km |
Sector |
Process |
ktpa | ||||||
|
G |
1052 |
Avondale |
FK2 0YG |
55.99067 |
-3.67843 |
51 |
Landfill |
Combustion |
32 | ||||||
|
C |
1053 |
Greengairs |
ML6 7TD |
55.90502 |
-3.94501 |
87 |
Landfill |
Combustion |
20 | ||||||
|
F |
1054 |
Dunbar |
EH42 1SW |
55.97169 |
-2.46156 |
109 |
Landfill |
Combustion |
19 | ||||||
|
C |
1055 |
Greenoakhill |
G71 7SQ |
55.83865 |
-4.13733 |
94 |
Landfill |
Combustion |
15 | ||||||
|
E |
1056 |
Stoneyhill |
AB42 0PR |
57.45897 |
-1.87237 |
36 |
Landfill |
Combustion |
12 | ||||||
|
C |
1057 |
Cathkin |
G73 3RE |
55.78877 |
-4.1898 |
102 |
Landfill |
Combustion |
11 | ||||||
|
C |
1058 |
Auchencarroch |
G83 9EY |
55.99891 |
-4.53778 |
127 |
Landfill |
Combustion |
11 | ||||||
|
C |
1059 |
Garlaff |
KA18 2RB |
55.42964 |
-4.30544 |
93 |
Landfill |
Combustion |
8 | ||||||
|
C |
1060 |
Oatslie |
EH25 9QN |
55.85126 |
-3.18402 |
64 |
Landfill |
Combustion |
7 | ||||||
|
F |
1061 |
Kaimes |
EH27 8EF |
55.88372 |
-3.39556 |
52 |
Landfill |
Combustion |
7 | ||||||
|
F |
1062 |
Binn |
PH2 9PX |
56.30514 |
-3.33799 |
34 |
Landfill |
Combustion |
6 | ||||||
|
LOC |
ID |
Short name |
Post code |
Latitude |
Longitude |
km |
Sector |
Process |
ktpa | ||||||
|
F |
1063 |
Lochhead |
KY12 0RX |
56.09775 |
-3.47311 |
29 |
Landfill |
Combustion |
6 | ||||||
|
C |
1064 |
Auchinlea |
ML1 5LR |
55.80956 |
-3.90035 |
82 |
Landfill |
Combustion |
6 | ||||||
|
C |
1065 |
Summerston |
G23 5HD |
55.9119 |
-4.27466 |
106 |
Landfill |
Combustion |
6 | ||||||
|
C |
1066 |
Rigmuir |
G75 0QZ |
55.74302 |
-4.12468 |
105 |
Landfill |
Combustion |
6 | ||||||
|
C |
1067 |
Shewalton |
KA11 5DF |
55.59493 |
-4.64203 |
113 |
Landfill |
Combustion |
5 | ||||||
|
F |
1068 |
Cireco |
KY15 7UL |
56.2926 |
-3.13048 |
22 |
Landfill |
Combustion |
4 | ||||||
|
E |
1069 |
Tramaud |
AB23 8BQ |
57.2111 |
-2.08733 |
62 |
Landfill |
Combustion |
4 | ||||||
|
Industrial |
|
|
|
|
|
| |||||||||
|
LOC |
ID |
Short name |
Post code |
Latitude |
Longitude |
km |
Sector |
Process |
ktpa | ||||||
|
A |
1070 |
Girvan |
KA26 9PT |
55.26386 |
-4.82595 |
85 |
Industrial |
Combustion |
44 | ||||||
|
F |
1071 |
Cameronbridge |
KY8 5RL |
56.18953 |
-3.05583 |
9 |
Industrial |
Combustion |
33 | ||||||
|
N |
1072 |
Portgordon |
AB56 5BU |
57.65558 |
-3.02453 |
231 |
Industrial |
Combustion |
30 | ||||||
|
N |
1073 |
Glenfiddich |
AB55 4DH |
57.45601 |
-3.12411 |
236 |
Industrial |
Combustion |
21 | ||||||
|
E |
1074 |
Brewdog |
AB41 8BX |
57.36964 |
-2.05049 |
43 |
Industrial |
Combustion |
21 | ||||||
|
B |
1075 |
Charlesfield |
TD6 0HH |
55.56084 |
-2.65219 |
119 |
Industrial |
Combustion |
18 | ||||||
|
C |
1076 |
GSK |
KA11 5AP |
55.59496 |
-4.62817 |
113 |
Industrial |
Combustion |
6 | ||||||
|
City Waste |
|
|
|
|
|
|
|
| |||||||
|
LOC |
ID |
Short name |
Post code |
Latitude |
Longitude |
km |
Sector |
Process |
ktpa | ||||||
|
C |
1077 |
Polmadie |
G42 0PJ |
55.83434 |
-4.24477 |
101 |
City Waste |
Combustion |
24 | ||||||
|
C |
1078 |
Energen |
G67 3EN |
55.92553 |
-4.05769 |
85 |
City Waste |
Combustion |
22 | ||||||
|
C |
1079 |
Barkip |
KA24 4JJ |
55.71786 |
-4.65683 |
130 |
City Waste |
Combustion |
13 | ||||||
|
F |
1080 |
Millerhill |
EH21 8RZ |
55.92612 |
-3.08608 |
71 |
City Waste |
Combustion |
9 | ||||||
|
F |
1081 |
Lochhead AD |
KY12 0RX |
56.09775 |
-3.47311 |
29 |
City Waste |
Combustion |
7 | ||||||
|
C |
1082 |
Deerdykes |
G68 9NB |
55.92671 |
-4.0568 |
85 |
City Waste |
Combustion |
6 | ||||||
|
Farming | |||||||||||||||
|
LOC |
ID |
Short name |
Post code |
Latitude |
Longitude |
km |
Sector |
Process |
ktpa | ||||||
|
F |
1091 |
Inchdairnie |
KY5 0UL |
56.17697 |
-3.22284 |
14 |
Farming |
Combustion |
12 | ||||||
|
F |
1092 |
Binn Farm |
PH2 9PX |
56.30482 |
-3.33923 |
34 |
Farming |
Combustion |
8 | ||||||
|
C |
1093 |
Tambowie |
G62 7HN |
55.94956 |
-4.36302 |
114 |
Farming |
Combustion |
6 | ||||||
|
S |
1094 |
West Roucan |
DG1 3QG |
55.09372 |
-3.5339 |
53 |
Farming |
Combustion |
6 | ||||||
|
N |
1095 |
Wester Alves |
IV30 8XD |
57.64396 |
-3.45841 |
201 |
Farming |
Combustion |
5 | ||||||
|
S |
1096 |
Crofthead |
DG2 8QW |
54.99901 |
-3.839 |
27 |
Farming |
Combustion |
3 | ||||||
|
Sewage |
|
|
|
|
|
|
|
|
| ||||||
|
LOC |
ID |
Short name |
Post code |
Latitude |
Longitude |
km |
Sector |
Process |
ktpa | ||||||
|
F |
1097 |
Seafield |
EH6 7RF |
55.97112 |
-3.1444 |
53 |
Sewage |
Combustion |
16 | ||||||
|
E |
1098 |
Nigg |
AB12 3LT |
57.13236 |
-2.06023 |
72 |
Sewage |
Combustion |
8 | ||||||
|
Upgrading |
|
|
|
|
|
|
|
| |||||||
|
LOC |
ID |
Short name |
Post code |
Latitude |
Longitude |
km |
Sector |
Process |
ktpa | ||||||
|
A |
1083 |
Girvan |
KA26 9PT |
55.26386 |
-4.82595 |
85 |
Upgrading |
Separation |
17 | ||||||
|
S |
1084 |
Crofthead |
DG2 8QW |
54.99901 |
-3.839 |
27 |
Upgrading |
Separation |
13 | ||||||
|
N |
1085 |
Glenfiddich |
AB55 4DH |
57.45601 |
-3.12411 |
236 |
Upgrading |
Separation |
13 | ||||||
|
N |
1086 |
Portgordon |
AB56 5BU |
57.65558 |
-3.02453 |
231 |
Upgrading |
Separation |
5 | ||||||
|
F |
1087 |
Bangley |
EH41 3SN |
55.96642 |
-2.82347 |
86 |
Upgrading |
Separation |
5 | ||||||
|
S |
1088 |
Lockerbie |
DG11 1LW |
55.12065 |
-3.40844 |
64 |
Upgrading |
Separation |
5 | ||||||
|
F |
1089 |
Keithick |
PH13 9NF |
56.5321 |
-3.29713 |
83 |
Upgrading |
Separation |
4 | ||||||
|
E |
1090 |
Savock |
AB41 6AL |
57.31676 |
-2.04657 |
49 |
Upgrading |
Separation |
4 | ||||||
© The University of Edinburgh, 2024.
Prepared by SCCS on behalf of ClimateXChange, The University of Edinburgh. All rights reserved.
While every effort is made to ensure the information in this report is accurate, no legal responsibility is accepted for any errors, omissions, or misleading statements. The views expressed represent those of the author(s), and do not necessarily represent those of the host institutions or funders.
Note that this estimate does not include associated costs such as financing and contingency. ↑
Note that at the time of going to press the Stenlille storage permit has not been issued. ↑
All NSTA licenses continue to be issued by the OGA as a legal entity under the Energy Act 2008. ↑
Storage appraisals are regulated by the CCS Directive 2009, transposed to UK law in 2012. ↑
Licenses CS001 and CS002 were both issued by the OGA under the Energy Act 2008. ↑
The HSE-OPRED MoU is a relatively brief document, available at: www.hse.gov.uk/agency-agreements-memoranda-of-understanding-concordats/assets/docs/opred-hse.pdf ↑
Data for the Cowie and Morayhill biomass facilities came directly from the operator, West Fraser (formerly Norbord). Personal communication with Nick Fedo, General Manager (March 2023). ↑
95-96% CO2 from biogas using membrane technology and sending the CO2 stream straight to CO2 recovery. The 4-5% loss occurs during the purification of CO2 in the recovery stage. Personal communication with Richard Nimmons, Carbon Capture Scotland (March 2023). ↑
www.mayerbrown.com: storage-class-vi-wells-and-us-state-primacy ↑