

Climate change adaptation investment need across five sectors in Scotland
Research completed: March 2026
DOI: https://doi.org/10.7488/era/7087
Executive summary
Background and purpose
Scotland’s businesses, infrastructure, communities and natural environment face increasingly severe climate change impacts. Yet, the required adaptation actions – how they will evolve over time, what they will cost, and who should pay – remain poorly understood.
This report provides the first estimate of Scotland’s climate adaptation investment needs through to 2040 across five sectors (and eight subsectors):
- agriculture;
- communities (flooding);
- the natural environment (woodland creation, peatland, nature restoration);
- transport (trunk roads, motorways, railways); and
- water (public water and wastewater services).
It then presents two further discrete analyses: macroeconomic modelling to estimate the wider economic effects of similar levels of adaptation spending, The five sectors were chosen to reflect the diverse approaches required to assess indicative adaptation costs. We examine four aspects of climate adaptation investment: required investment, its macroeconomic impacts, public-private funding splits, and the potential to mobilise private capital. This work is intended to support the Scottish Government in building an evidence based ahead of the fourth Scottish National Adaptation Plan (SNAP4).
Estimating future adaptation cost is inherently challenging. It requires assumptions about future warming, the level of climate risk that society are willing to tolerate, and the associated scale of adaptation and residual damages. Deep uncertainty in climate projections, socioeconomic change, asset vulnerability, and political priorities make precise modelling both challenging and resource intensive. As a result, the findings in this report should be treated as pragmatic, evidence-based approximations that indicate the order of magnitude of investment needs—not definitive targets.
Why adaptation investment matters
Failing to invest in mitigation and adaptation carries significant economic costs. Estimates for this study suggest climate change could reduce GDP by 0.3-0.4% a year in the 2030s, rising to 1.2-1.6% by the 2050s and 1.6-3.3% by the 2070s. Other studies project higher impacts but these depend on the models and assumptions used. The Scottish Environment Protection Agency estimate that flooding alone already costs Scotland an estimated £500 million per year. Adaptation can reduce these damages, but it also requires upfront investment, is rarely fully effective, and involves trade‑offs between expenditure and residual risk. The key question is therefore not whether to invest in adaptation, but how much and who should pay.
Adaptation investment also delivers wider benefits, often described as the “triple dividend”: avoided losses, economic gains, and social and environmental co-benefits such as biodiversity improvements, carbon sequestration, and better mental health. These co-benefits further strengthen the economic case for adaptation.
Climate costs are projected to rise significantly beyond 2040. The research and strategic priorities below are therefore time-sensitive: early action on adaptation can reduce long-run costs and delivers benefits that delayed investment may not recover.
Estimated climate adaptation investment need for Scotland in five sectors
Adaptation investment needs across the five sectors and eight subsectors assessed in this study are estimated at £7.8–£14.2 billion between 2026 and 2040, or £566–£1,027 million per year. Sector and subsector level results are shown in Table 1.
Previous estimates from the Climate Emergency Response Group, Paul Watkiss Associates, and the Office for Budget Responsibility – based on UK wide analyses and international benchmarks – suggested Scotland’s total adaptation costs would range from £196 million to £1,340 million per year from 2030 onwards. The sector specific estimates in this study fall within that range. However, because this analysis covers fewer sectors than the Scottish National Adaptation Plan, the findings suggest that Scotland’s full adaptation investment needs may be higher than previously anticipated.
The study also compared the estimated annual adaptation investment needs to current allocations in the Scottish budget. It found that only the agriculture sector is likely meeting its adaptation needs. The communities (flooding), transport, and nature sectors will likely require additional investment to maintain current risk levels. We could not assess the water sector due to a lack of available information on existing adaptation spending.
The results in this report carry low confidence and should be viewed as indicative, not precise. Confidence levels vary by sector (Table 1) due to fragmented data, limited understanding of asset vulnerability, and the lack of clear adaptation targets to scale investment needs. Where Scottish specific data was unavailable, we crosschecked estimates with international comparisons, which also have limitations because of differing risks and institutional contexts. These figures therefore represent order of magnitude estimates designed to inform policy discussion and future research, rather than definitive costings.
|
Sector |
Sub-sector / approach |
Investment estimate (£m) |
Investment estimate (£m/yr) |
2026/27 budget (£m/yr) |
Confidence |
Investment estimate source |
|---|---|---|---|---|---|---|
|
Agriculture |
£2,347m – £3,091m |
£167.6m– £220.8m | £167.6m – £220.8m | Low |
Scottish Government Budget | |
|
Communities |
Capacity building |
£102m |
£7.3m | £6.9m |
Medium |
Scottish Government Budget |
|
Property flood protection |
£885m – £1,102m |
£63.2m – £78.7m | £42m |
Low |
Scottish Government & DEFRA, HM Government | |
|
Property flood resilience |
£10.5m – £52m |
£0.8m – £3.7m |
Unknown |
Medium |
JBA Risk Management2025 | |
|
Natural environment |
Woodland creation |
£115m |
£8.2m | £2.3m |
Low – Medium |
Scottish Government Draft Climate Change Plan |
|
Peatland restoration |
£236m |
£16.8m | £5.6m |
Low – Medium |
Scottish Government Draft Climate Change Plan | |
|
Natural restoration |
£73m |
£5.2m | £5.2m |
Low – Medium |
NatureScot | |
|
Transport |
Rail[1] |
£1,582m – £4,734m |
£113m- £338.1m | ≈ £87.8m |
Medium |
Network Rail Scotland |
|
Trunk roads and motorways |
£1,418m – £2,213m |
£101.3m – £158.1m | £82.3m |
Very low |
Scottish Government Budget | |
|
Water |
Scottish Water[2] |
£1,067m – £2,466m |
£82.1m – £189.7m |
Unknown |
Medium |
Scottish Water |
|
Total |
£7,835.5m – £14,182.8m |
£565.5m – £1,026.6m |
The macroeconomic effects of investing in climate adaptation
A full assessment of the macroeconomic costs and benefits of adaptation were beyond the scope of the study. However, the study did model the direct economic effects of adaptation spending across sectors. It also explored how different approaches to cost recovery affect economic activity, employment, and household incomes.
The modelling consistently shows that adaptation spending generates a positive economic stimulus during the investment period, supporting jobs and output particularly in construction, engineering, and land-based supply chains. However, the way costs are recovered matters considerably. Income-tax-based recovery is progressive but dampens household consumption and reduces activity in consumer-facing sectors. Charging-based approaches – such as higher food prices in agriculture or water bills in the water sector – tend to be regressive, falling disproportionately on lower-income households for whom essential goods represent a larger share of budgets. Recovery through public spending cuts generates the most widespread economic losses, particularly across service sectors. Funding design is therefore important to consider alongside investment scale.
These results should not be interpreted as a full cost-benefit assessment of adaptation. The modelling captures the demand-side effects of spending and cost recovery, but does not account for avoided climate damages, residual risks, or the broader triple dividend of adaptation.
How will costs be borne by households, businesses, and the public sector?
The study investigated how adaptation is currently funded in each of the sectors. Climate adaptation in Scotland is currently funded predominantly by the public sector. Central and local government fund and finance most adaptation-relevant expenditure across transport, flood management, water infrastructure, agriculture, and the natural environment. This is largely through existing budget lines that deliver multiple objectives alongside adaptation. However, households and businesses pay more than previously understood, through Council Tax and Non-domestic rates. Households and businesses also bear some costs directly, for example through property-level insurance and on-farm investments, but this remains modest in most sectors.
This balance is unlikely to shift fundamentally. Most of the adaptation investment – including flood protection, transport resilience, and natural flood management – generates little or no direct financial return and is therefore structurally dependent on public funding. Analysis suggests that approximately three-quarters of adaptation investment needs will require public financing regardless of innovations in private finance mechanisms.
Scope to boost private sector participation
The study reviewed the innovative funding and financing models being used internationally and within Scotland. Analysis found that there is modest potential to increase private sector participation in adaptation funding and financing across all five sectors, and a range of innovative mechanisms are emerging. These include parametric insurance in agriculture, biodiversity credits and voluntary carbon markets in the natural environment, green and resilience bonds for flood and transport infrastructure, and catchment co-investment models in water. However, several important caveats apply:
- Scaling private investment will not happen through market forces alone. It will require concerted public policy action, enabling conditions, and in many cases public co-financing to de-risk private investment. The private sector’s role is best understood as complementary to, rather than a substitute for, public adaptation finance.
- There is a critical distinction between private financing (where private capital provides upfront funding) and private funding (where costs are ultimately borne by the private sector rather than transferred back to government or consumers). Many instruments that appear to increase private participation in practice shift the funding burden, rather than share it. Policy ambitions to mobilise private capital should be assessed against this distinction.
- High benefit-cost ratios in the adaptation literature typically reflect societal and environmental returns, including non-market values that generate no cash flow. Private investors assess financial returns, incremental revenues and recoverable costs, which are considerably lower. Treating strong societal co-benefit ratios as evidence of private investment attractiveness risks generating unrealistic expectations about the scale of private finance that can realistically be mobilised.
Recommendations
The report lays out the following key recommendations, in no particular order:
Table 2: Key recommendations for further research and strategic priorities.
|
Theme |
Research priority |
Strategic priority |
|---|---|---|
|
Adaptation targets, objectives & risk tolerance |
|
|
|
Asset level vulnerability & investment pipelines |
|
|
|
Financial transparency & attribution |
|
|
|
Triple dividend evidence base |
|
|
|
Distributional impacts |
|
|
|
Cross‑sector collaboration |
|
|
|
Prioritisation |
| |
|
Private finance mobilisation |
| |
|
Monitoring and evaluation |
|
Glossary
|
Annual Average Loss (AAL) |
The expected average financial loss from flood events in any given year, calculated across all possible flood scenarios weighted by their probability of occurrence. |
|
Adaptation pathways |
A planning approach that sequences adaptation actions over time, allowing for adjustments as climate change and its impacts become better understood. |
|
Bottom-up costing |
An approach to estimating adaptation investment needs that builds cost estimates from detailed, project-level information gathered from engineers, contractors and technical specialists, or from specific policy objectives where budget lines can be scaled up. |
|
Computable General Equilibrium model (CGE model) |
An economic modelling framework that simulates the interactions between different sectors of an economy to assess the broader macroeconomic impacts of policy changes or external shocks, such as climate change. |
|
2026/27 Climate Taxonomy |
A classification system, published alongside the Scottish Government budget, that identifies budget lines according to their impact on climate change mitigation and adaptation. |
|
Community Benefit Funds (CBFs) |
A community benefit fund is a voluntary, typically annual, financial contribution provided by developers to local communities hosting major projects, such as renewable energy sites. |
|
Consumer Price Index (CPI) |
Presents the percentage change in prices that consumers pay for goods and services. |
|
Control Period (CP) |
Network Rail’s fixed five-year funding and planning cycle that sets budgets and outputs for the railway (e.g. CP7: 1 April 2024 – 31 March 2029). |
|
Expected Annual Damages (EAD) |
The average annual financial cost of flood damage calculated across return periods, accounting for both the likelihood and severity of events. |
|
Gross Value Added (GVA) |
A measure of the value of goods and services produced in an area, industry or sector of an economy, used here as a proxy for scaling adaptation investment estimates across countries. |
|
Major Capital Investment (MCI) |
Large-scale, transformational infrastructure schemes where continued operations would otherwise become impossible as a result of a changing climate. |
|
Natural Flood Management (NFM) |
An approach to reducing flood risk that works with natural processes, for example through wetland creation, tree planting or river restoration, to slow the flow of water and reduce peak flood levels. |
|
Organisation for Economic Co-operation and Development (OECD) |
An international, intergovernmental forum of 38 developed market-based economies established in 1961 to stimulate economic progress and world trade. Headquartered in Paris, it provides data, policy analysis, and standards to promote prosperity, equality, and well-being. |
|
Office for Budget Responsibility (OBR) |
The Office for Budget Responsibility was created in 2010 to provide independent and authoritative analysis of the UK’s public finances. |
|
Operations, Support, Maintenance and Renewals (OSMR) |
The category of Network Rail Scotland investment covering day-to-day operational response to weather, preventative and reactive maintenance, and asset renewals. |
|
Property Flood Resilience (PFR) |
Measures applied at the individual property level to reduce the risk of flooding or minimise flood damage, such as flood doors, air brick covers, or non-return valves. |
|
Potential Vulnerable Areas (PVAs) |
Areas identified by SEPA as being at significant risk from flooding, which form the basis for Flood Risk Management Planning in Scotland. |
|
Representative Concentration Pathway (RCP) |
A greenhouse gas concentration trajectory used in climate modelling to represent different possible futures based on varying levels of emissions (e.g. RCP 4.5 is a moderate emissions scenario; RCP 8.5 is a high emissions scenario). |
|
Residual damage |
The climate-related losses or damages that remain even after adaptation measures have been implemented, reflecting the limits of adaptation effectiveness. |
|
Scottish Environment Protection Agency (SEPA) |
Scotland’s environmental regulator, responsible for flood risk assessment, flood warning, and producing Scotland’s Flood Risk Management Plans. |
|
Scottish National Adaptation Plan 3 (SNAP3) |
The third Scottish National Adaptation Plan, covering 2024–2029, setting out actions to achieve five national outcomes for climate resilience across society, the economy and the environment. |
|
Scottish National Adaptation Plan 4 (SNAP4) |
The fourth Scottish National Adaptation Plan will cover 2029 – 2034, setting out actions to better adapt Scotland to the changing climate. |
|
Strategic Review 27 (SR27) |
Scottish Water’s regulatory investment planning period covering 2027–2032, within which adaptation investment needs are assessed and costed. |
|
Sustainable Urban Drainage Systems (SUDS) |
Drainage infrastructure designed to manage surface water in a way that mimics natural drainage, reducing flood risk, improving water quality and enhancing the urban environment. |
|
Top-down costing |
An approach to estimating adaptation investment needs that uses economic models and sector-level damage assessments to derive aggregate cost estimates, typically without detailed project-level information. |
|
Triple dividend |
The three categories of benefit that adaptation investment can deliver: (1) avoided climate losses; (2) wider induced economic benefits such as infrastructure investment stimulus; and (3) social and environmental co-benefits such as biodiversity gains and improved mental health. |
|
UK Climate Projections 2018 (UKCP18) |
The most recent set of probabilistic climate projections for the UK, produced by the Met Office, used to inform climate risk assessments and adaptation planning across multiple sectors. |
|
Value transfer |
A method of estimating costs or benefits by applying findings from existing studies in comparable contexts (e.g. other countries or regions) to a new setting, adjusted for relevant differences such as economic scale or population. |
Introduction
Overview, aim and scope
Tackling the climate emergency is a priority area for the Scottish Government – alongside eradicating child poverty and growing the economy and delivering high quality sustainable public services (Scottish Government, 2025a). As part of tackling the climate emergency, three questions have emerged associated with the need to better understand:
- The costs of the Scottish Government climate change ambitions for adaptation and the residual damage of necessary trade-offs.
- The macroeconomic effects of climate impacts and adaptation.
- How these costs are being met today, and options for how these costs will be met by different groups, including public and private sectors.
This project provides an initial exploration of some of these issues. In doing so, it supports the Scottish Government in developing an evidence base on the potential costs of climate adaptation across a range of sectors. This is important information to assist in strategically planning and driving forward future adaptation action, in line with Scotland’s National Adaptation Plan.
The analysis focuses on three interconnected research objectives:
- Estimate adaptation investment needs for five sectors – agriculture, communities (focusing on flooding), natural environment (woodland creation, peatland restoration and nature restoration), transport (trunk roads and motorways and railways), and water (supply and treatment) – until 2040. This should be aligned with the with adaptation objectives defined in the Scottish National Adaptation Plan 3 (SNAP3) 2024–2029;
- Assess the likely investment split, over time, between the public sector, private sector businesses and individuals for each sector; and
- For each sector, identify the potential to support private sector participation in funding and financing adaptation, highlighting barriers to scale, and recommending policy instruments to mobilise private capital.
Context: climate risks in Scotland
Scotland’s businesses, infrastructure, communities and environment are becoming increasingly exposed to climate change. These impacts carry serious economic consequences.
The estimated impact of climate change on the UK’s economy differs depending on the climate scenarios used and wider socio-economic assumptions made within modelling. This study assessed the results for Scotland using results from a major EU project (Bosello et al., 2020). Across several climate scenarios, these suggests that from 2030 Scotland’s economy could be 0.3 – 0.5% smaller each year. By 2050, losses could rise to 1.2 – 1.6%, increasing further to 1.5 –3.3% by the 2070s. These are shown in Figure 1, and have been used as the basis for supporting subnational assessments of economic impacts in Scotland (e.g. Climate Ready Clyde, Highland Adapts, South East Scotland and Forth Valley).
Figure 1: Projected impact of climate change on GVA in Scotland for a range of future climate scenarios using Shared Socioeconomic Pathways 2 (SSP2). High Investment Mobility. SSP2 is also known as ‘middle of the road’ and assumes the world follows a path in which social, economic and technological trends to not shift markedly from historical patterns…
A second study, Rising et al. (2022), included additional risks, such as low-probability high-impact events, projecting that under current policies – and compared to a 2000 baseline – the total cost of climate change damages to the UK are projected to increase from 1.1% of GDP at present to 3.3% by 2050 and up to 7.4% by 2100 (Rising et al., 2022). Furthermore, the Office for Budget Responsibility (OBR) estimate that the cost of climate change could even reduce the UK level of GDP by 8% by 2070 if the world was to warm by 3oC by the end of the century (Office for Budget Responsibility, 2025).
While adaptation can significantly limit climate related damages, fully eliminating climate risk is neither technically feasible nor economically rationale (Rexer & Sharmer, 2024). This means that even robust adaptation actions will leave some residual risk, highlighting the need to target measures that deliver the greatest benefit relative to their cost.
The Climate Change (Scotland) Act 2009 requires a National Adaptation Plan to be published every five years, aligned with the latest UK Climate Change Risk Assessment (CCRA). The latest, SNAP3, covers 2024 – 2029. SNAP3 sets out outcomes, delivery objectives and policy actions. It the first UK Adaptation Plan to also be supported by a monitoring and evaluation framework to track progress. However, specific objectives around risk reduction, as well as associated costs or budgetary allocations remain undefined in Scotland and across the UK.
As the Scottish Government prepares to receive the upcoming fourth UK Climate Change Risk Assessment (CCRA4) and Well Adapted UK report, there is growing recognition of the need to be more specific about the assumptions underpinning adaptation planning, and the costs and benefits. The Climate Change Committee (CCC) recommends that the Scottish Government introduce quantified, timebound adaptation targets to better track progress and strengthen accountability, consistent with preparing for +2°C warming by 2050 while managing risks associated with up to +4°C by the end of the century (Scottish Government, 2025b). However, setting such targets requires clarity on the level of climate risk that government and society are willing to tolerate.
This raises the important question of the acceptable level of risk, and for whom. Different communities, sectors and social groups will be affected in different ways. Given these complexities, developing adaptation targets will likely require broader engagement, including opportunities for the public and stakeholders to contribute to discussions about acceptable levels of risk. It also involves considering who pays – raising questions of equity and risk ownership. As such, adaptation target setting can be closely linked to Just Transition principles.
Defining the level of climate risk that is acceptable is therefore closely associated with the question of how much adaptation investment is needed, and who should pay for it.
Yet current evidence on these questions for Scotland is limited. There are partial estimates of adaptation investment need within the literature, but no agreed sector-specific adaptation targets, no systematic estimates of the investment required to meet them, and no established framework for understanding how costs should be shared between the public sector, private sector, and individuals.
This gap matters: without a clearer picture of adaptation investment needs, it is difficult to plan strategically, allocate budgets effectively, or make the case to mobilise private capital alongside public expenditure. But it is also challenging due to the deep uncertainty of climate change – including our warming trajectories and socioeconomic change.
This report seeks to begin closing that gap. Drawing on a range of analytical methods and the best available evidence across five sectors – agriculture, communities (flooding), transport, water, and the natural environment – it provides indicative estimates of Scotland’s adaptation investment needs to 2040, an assessment of public-private investment splits, and an exploration of opportunities to increase private sector participation in financing Scotland’s adaptation.
This report is structured as follows:
- Section 2 sets out a general account of the economics of adaptation. This sets out the conceptual framework for estimating investment needs, and approaches exploring the public-private investment split. It also positions the existing evidence base for Scotland.
- Section 3 presents our approach and methods.
- Section 4 provides sector-specific results for agriculture, communities (floods), the natural environment, transport, and water. It explores adaptation investment needs, macroeconomic effects and wider impacts, and funding and financing arrangements across all five sectors.
- Section 5 presents a summary of our analysis
- Section 6 outlines recommended research and strategic priorities.
The economics, costing and financing of adaptation
The economics of adaptation
In simple terms, adaptation costs and benefits can be estimated by first assessing the current and future impacts of climate change, then evaluating how much these impacts can be reduced and at what cost (Boyd and Hunt, 2004; UNFCCC, 2009). Adaptation measures can substantially reduce damages, but even well-designed strategies involve trade-offs: investing more in adaptation may deliver greater risk reduction but also increases cost. As a result, reducing risk to zero is neither technically feasible nor economically desirable, and some residual risk will always remain (Rexer & Sharma, 2024).
The scale of costs and benefits depends heavily on chosen objectives. For example, whether aiming for economic efficiency, reducing risks to acceptable levels, or maintaining today’s relative level of climate risk despite worsening conditions. In practice, estimating adaptation costs is highly complex because of deep uncertainty, with issues of socioeconomic change, future emissions, climate models, regional scenarios, impacts, adaptation responses, and political priorities combining to make modelling challenging (Wilby and Dessai, 2010; Taylor et al., 2025; Valverde et al., 2022). These uncertainties make it challenging to assess costs and benefits, creating the potential for over or underestimation of investment.
Despite this, there are some examples. These include national design standards for flood risk (e.g.to a 1-in-200-year event in Scotland, or up to 1-in-10,000-year in the Netherlands (Westerhof et al., 2023)), and emerging work on resilience in warming trajectories more broadly. The UK Government’s Long Term Investment Scenarios explore the optimum levels of investment under different climate scenarios and then use that to guide the spending envelope in the UK’s Flood and Coastal Erosion Risk Management (Environment Agency, 2021). And on reference scenarios, the Climate Change Committee has advised the UK Government to plan for 2 degrees of warming and prepare for 4, while in France the French Government has adopted a reference trajectory of four degrees.
Furthermore, adaptation investment can deliver multiple co-benefits, collectively known as the ‘triple dividend’ (Global Commission on Adaptation, 2019):
- The first dividend relates to avoided losses from successful adaptation. For example, a home that doesn’t flood because flood defences were built.
- The second relates to induced economic benefits such as the stimulus to the economy. For example, from capital investment in infrastructure development projects.
- The third includes social and environmental benefits. For example, afforestation projects that slow water runoff to rivers provide flood mitigation but also deliver biodiversity gains, carbon sequestration, and mental health benefits through green space access.
Considering all three dividends has the potential to improve the economic rationale of investing in climate change adaptation (Figure 2). In this report, while our analyses partially explore triple dividend benefits, it is beyond the scope of work to comprehensively consider wider savings made on triple dividends (see Section 8 on next steps).
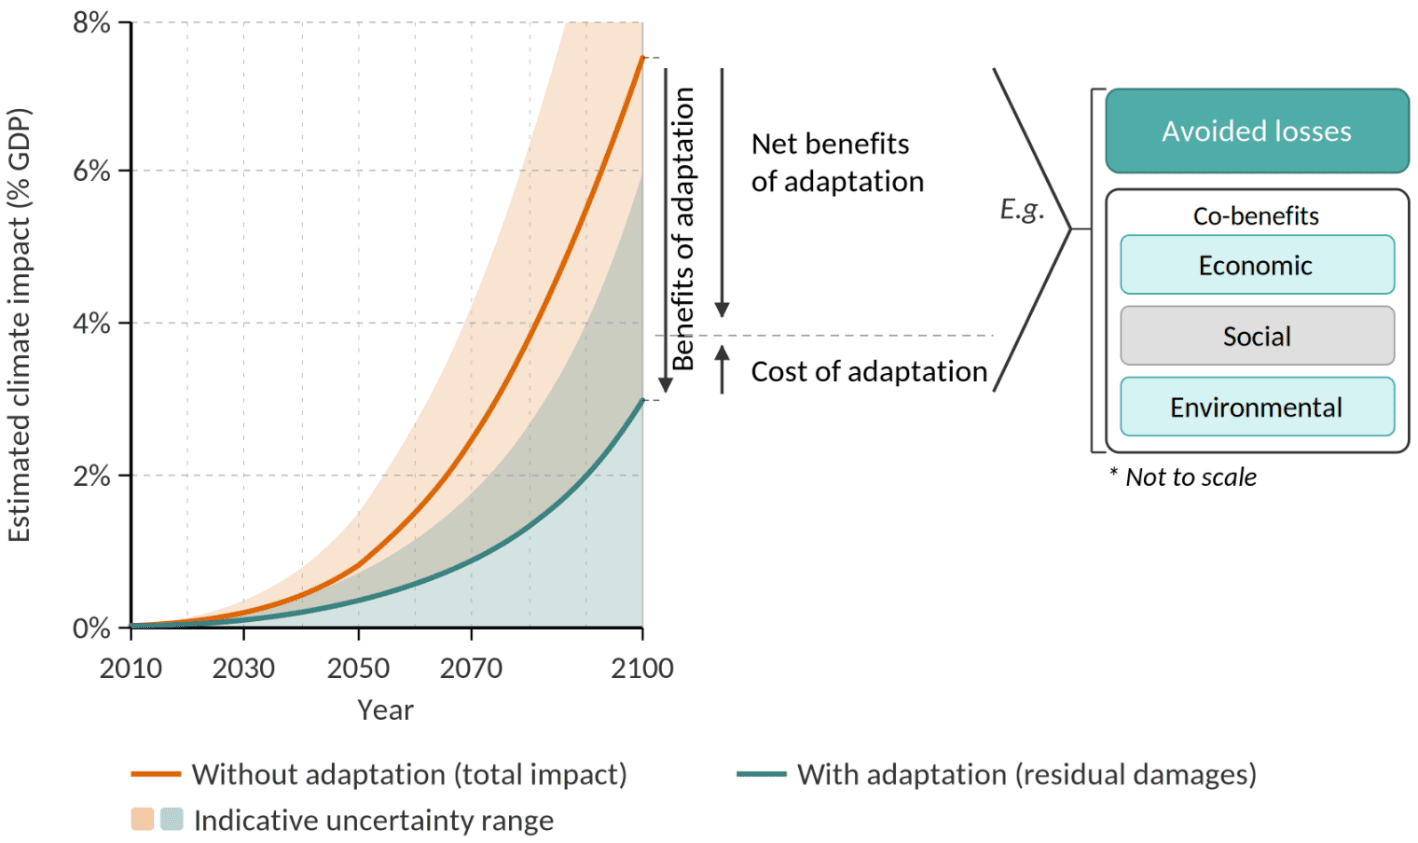
Figure 2: The economics of adaptation. The orange line shows projected climate change impacts on GDP (%) without adaptation; the teal line shows residual damages with adaptation. The gap between them represents the gross benefits of adaptation – subtracting the cost of adaptation yields the net benefits, comprising components such as avoided losses and economic, social and environmental co-benefits. Shaded areas indicate indicative uncertainty ranges only. The benefit breakdown is illustrative and not to scale. Adapted from Boyd and Hunt (2004), Global Commission on Adaptation (2019), and Watkiss et al. (2026a).
Apportioning adaptation costs
A key challenge in estimating adaptation investment needs is defining what constitutes ‘adaptation’ and how to attribute costs when activities serve multiple purposes. Climate adaptation rarely occurs in isolation – it is typically integrated into broader investment programmes, delivered alongside other policy objectives, or embedded within routine infrastructure maintenance and renewal. This raises practical questions for cost estimation: should we count the full cost of a project that includes adaptation as one of several objectives, or only the incremental cost of climate-proofing measures above a baseline investment?
To address this, the study adopted the adaptation cost taxonomy developed by the Multilateral Development Banks (MDBs), which has been widely applied internationally to track adaptation finance and compare investment needs across countries (MDB, 2022). This taxonomy categorises adaptation investments into three types based on the role adaptation plays in the overall investment (Figure 3):
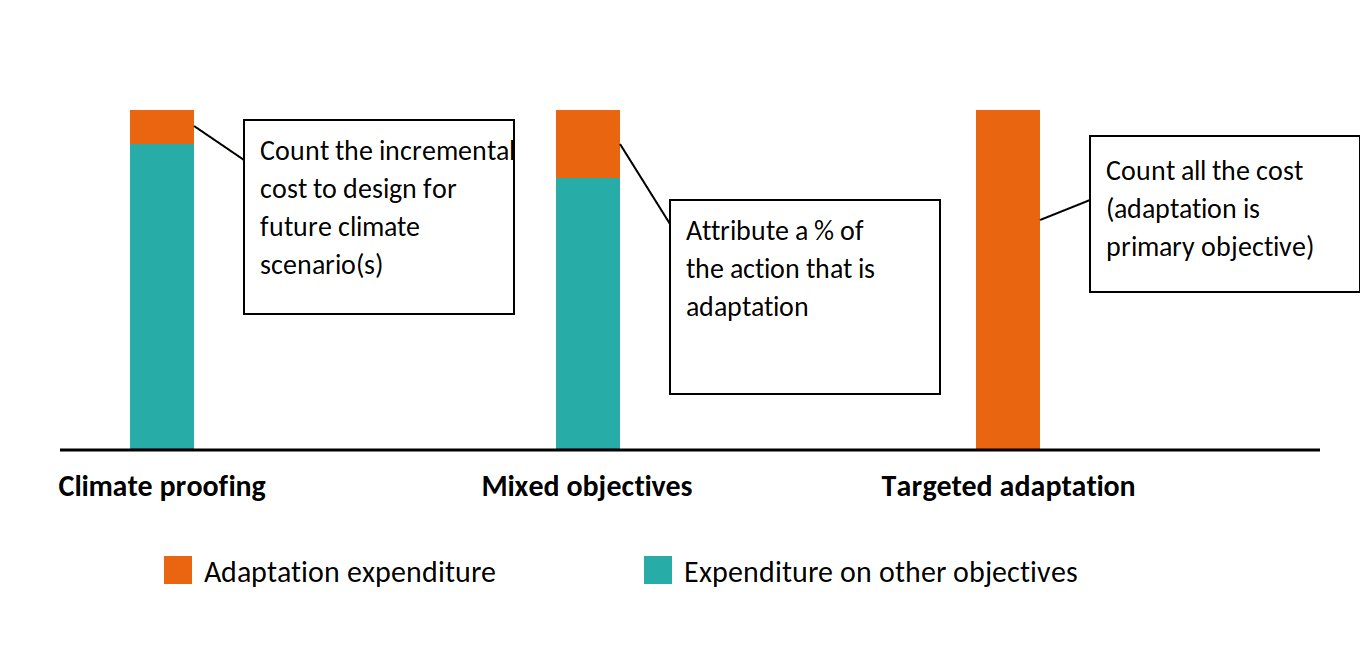
Figure 3 Taxonomy of adaptation costs. Adapted from Watkiss et al. (2026a) based on Multilateral Development Banks (2023).
- Building climate adaptation into proposed programmes and investments (climate proofing). For example, to include climate change in the design standards for new road investments. In this case, adaptation is not a major objective. Instead, assessments investigate the incremental costs of adaptation, over and above the core programme / investment costs.
- Targeted/pure adaptation programmes and investments (targeted adaptation). In this case, the primary objective of the policy, programme or project is adaptation to climate change. For example, investing in coastal flood protection to address sea-level rise. In this case, the total costs of the investment are counted as adaptation.
- Investments with multiple benefits that include adaptation (mixed objectives). Sitting between the two extremes above are a set of cases where adaptation is one of several objectives of the policy, programme or project (a secondary or significant objective). For example, investing in peatland restoration will lead to greater resilience of the peatland (to climate change) as well as off-site benefits (water management) but this investment is primarily associated with biodiversity and ecosystem services. In this case a proportion of the cost is attributed to adaptation, but this is often difficult to do accurately and involves more subjective decisions.
These distinctions are important for climate adaptation investment estimation and the economic rationale for investment. However, this categorisation can create potential for confusion in practice. Activities that might have been pursued primarily for economic development, environmental restoration, or other policy goals can be classified as ‘adaptation’ if they deliver climate resilience benefits – even when adaptation was not the original or primary driver. This raises important questions about additionality: would the investment have proceeded anyway without climate considerations?
Approaches to costing adaptation investment
International approaches
There is no single ‘correct’ method for costing climate adaptation. Instead, there are a variety of approaches, and the most appropriate approach depends on the context. Factors such as specific objectives, analysis level, measure types, and critically, the available data and resources all influence the choice (World Bank, 2024; Taylor et al., 2025).
Climate adaptation objectives can be framed in several ways – by setting targets based on future warming levels, engineering resilience standards, specific risk reduction goals, economic thresholds, or process-based requirements (World Bank, 2024). Each framing influences the scale of action, investment needs, and acceptable levels of residual risk. These choices shape how ambitious adaptation efforts must be, the types of projects prioritised, and the balance between public, private, and household responsibilities. Higher resilience standards typically require greater upfront investment, while economic optimal or process-based approaches may lower costs but leave more risk unaddressed (Taylor et al., 2025).
Costing methodologies exist on a spectrum: ‘top-down, science-first’ approaches use economic models and sector-level damage assessments to estimate aggregate costs, while ‘bottom-up, policy-first’ approaches build estimates from detailed project-level information gathered from contractors, engineers, and technical specialists, focused on answering specific near-term questions. There are also hybrid methods that blend top-down and bottom-up approaches. The World Bank identifies various tools and approaches for both sets of methods including top-down sector integrated assessment models (IAMs), computable general equilibrium (CGE) models, through to bottom-up sector-based costing, climate adaptation markups, and budget tagging approaches at the more granular level (World Bank, 2024).
The most accurate estimates for appraisal or project delivery come from bottom-up costing based on detailed contractor quotes. However, this approach requires substantial resources, data availability, time, and technical capacity to progress projects through to a level of maturity which can provide this, and this is not always available (Taylor et al., 2025).
European estimates
Multiple European countries have recently attempted to quantify their national adaptation investment needs, each developing similar, yet distinct, methodologies suited to their institutional context and data landscape. To inform the approach to Scotland, this study reviewed literature from these studies and drew key lessons from each, as follows:
Austria took a parallel approach (Knittel et al. 2017), adopting a top-down budget review using expert interviews to assign flexible apportionments of current spending to climate adaptation (such as 60% for flood infrastructure for example) and bottom-up costing of 67 National Adaptation Strategy measures grouped into cost bands. The two methods produced different results, €488m/yr versus €385m/yr respectively, revealing they measured fundamentally different things: current government activity versus strategic intent (Knittel et al., 2017).
France compiled existing estimates across 15 policy areas, gathering what stakeholders had already produced and providing unit-cost benchmarks from completed projects. It was openly acknowledged this represented ‘what exists’ in planning discussions rather than rigorous comprehensive costing (Dolques et al., 2025).
Spain aggregated funding from multiple sources, historical environmental spending, COVID recovery allocations, and department budgets, applying different percentages based on how directly measures addressed adaptation (100% for flood defences, 40% for ecosystem restoration, 10% for co-benefits). This reached €1.55bn for 2021-2025, though many costs remained undefined and excluded (MITECO, 2020).
Bulgaria grouped measures into Low/Medium/High-cost bands (up to €1m, €1-100m, over €100m) but using specific figures where detailed studies existed, such as €347.81m for irrigation from cost-benefit analysis (Dale & Zhekova, 2019).
Croatia took a strategic approach, developing a prioritised 20-year portfolio of adaptation investments (€3.6bn) through climate modelling and stakeholder workshops, then justifying the annual cost (€183m) by showing it was less than current average damages from extreme weather (€295m) (Croatian Parliament, 2020).
EU level analysis by Neumann et al. (2025) compiled national studies, adjusted them for different emission scenarios and hazards, then extrapolated to countries lacking data using sector economic output as a proxy. Transport estimates drew on seven national studies while agriculture relied on only three, highlighting persistent data gaps (Neumann et al., 2025). A separate EU level study (European Commission, 2026) conducted a bottom-up analysis, which reviewed member state risk assessments, identified and costed relevant measures and then scaled them to the EU. This suggests annual investment needs of €69bn/year to 2050, dominated by infrastructure and ecosystem investments.
There have also been estimates for the UK. These have focused on the costs of adaptation today by categorising actions in the National Adaptation Plan (NAP) in line with Multilateral Development Bank (MDB) taxonomies and estimating investment needs (Watkiss et al., 2026a), though there have been some estimates for future costs as part of the forthcoming Well Adapted UK report (e.g. in Watkiss et al, 2026b and others).
All these studies were transparent about the limitations of the methods used, acknowledging uncertainty rather than presenting false precision. They demonstrated that pragmatic, evidence-led approaches are essential given current data constraints, and framed estimates as ‘evolving documents’ requiring iterative refinement, not as definitive adaptation investment estimates.
Existing estimates for adaptation investment need
Globally, climate finance flows have grown significantly, with total flows reaching US$1.9 trillion in 2023 and private contributions exceeding US$1 trillion for the first time. However, the vast majority of this is directed towards mitigation, with Climate Policy Initiative (2025) estimating only 3.4% is going towards adaptation. The latest United Nations Environment Programme (UNEP) estimates show that developing countries will need at least US$320bn/yr – $400bn/yr for adaptation by 2035, which is roughly ten times higher than today’s international public adaptation finance flows (Watkiss and England, 2025).
To date, there has been limited research specific to Scotland on climate change adaptation investment need. Estimates are instead deduced from broader studies, ranging from £196–£1,340m per year:
- A recent World Bank study suggests that near-term adaptation investment for the EU27 could amount to 0.1% – 0.4% of GDP annually by 2030 (World Bank, 2024). Scotland’s Climate Emergency Response Group (CERG) applied these values to Scotland, estimating £196 – £784m per year by 2030 (CERG, 2024).
- Indicative estimates for the UK suggest adaptation costs of around £5bn/yr to 2030 for a subset of priority risks, rising to £10bn/yr or more when all 61 CCRA3 risks and proactive adaptation measures are included (Watkiss, 2022). These figures are expected to increase significantly after 2030 as the number of high magnitude climate risks grows from 12 to 21 by the 2050s. Yet these estimates remain partial and indicative, with substantial gaps in sectoral coverage, inconsistent assumptions, and a bias toward engineering solutions rather than social or institutional adaptation (Watkiss, 2022). Using Watkiss (2022) values, and assuming Scotland accounts for 7.5% share of UK economic output as a proxy (Harari & Murray, 2024), implies adaptation costs of approximately £375 – £750m per year.
- Analysis by the Office for Budget Responsibility (OBR) suggests adaptation costs of around 0.3% of GDP per degree of warming (OBR, 2021). The OBR also highlights that adaptation costs are likely to rise unevenly over time, with larger and more frequent economic shocks expected later in the century. Using 2024 prices, these costs are equivalent to £670 – £1,340m per year for Scotland under 1 – 2°C of warming respectively.
Scotland’s specific vulnerabilities and policy landscape mean these broader UK estimates may not accurately reflect Scotland’s climate adaptation investment need. For example, Scotland faces a distinctive combination of climate hazards and geographic contexts. This includes a higher proportion of woodland and peatland, topographic challenges, and 93 inhabited islands, that may not be captured by downscaling UK-wide estimates based on Scotland’s share of GDP. The CCRA3 Scotland summary is also the only national summary to identify flooding as the most severe and costliest hazard to businesses, further highlighting the limitations of direct comparison to UK-level estimates.
Investment need will also vary within Scotland, with some regions more vulnerable to climate risks. Nascent estimates of the public sector adaptation gap in Glasgow City Region (Climate Ready Clyde, 2021) suggested a gap of £187m in 2018/19 alone for the region’s local authorities and the health board, equivalent to around 2% of combined local authority and NHS expenditure across the region’s eight councils and two health boards. No other regional estimates in Scotland have been published.
While national climate adaptation investment estimates are lacking, some public bodies, such as Scottish Water and Network Rail Scotland, have conducted bespoke asset climate vulnerability assessments and initial adaptation cost estimates to facilitate strategic business planning (e.g., Network Rail Scotland, 2024; Scottish Water, 2025). Others have more limited research on specific adaptation investment need. Therefore, while some sector specific information exists, it is fragmented.
As well as absence of Scotland-wide adaptation estimates, there is a lack of robust estimates of the wider returns from adaptation investment. These include avoided climate damages, economic benefits, and broader socio-environmental gains that comprise the ‘triple dividend’ of adaptation.
Who pays for adaptation?
Financing versus funding
A critical but often overlooked distinction in climate adaptation investment is the difference between financing and funding (Watkiss and England, 2025). Financing refers to where the upfront money comes from, whether public grants, government borrowing, sovereign green bonds, or private capital, and the financial instruments and terms involved. Funding, by contrast, refers to who ultimately pays for the adaptation over the lifetime of the investment, whether through public budgets, taxation, or user charges. This distinction matters because private sector involvement can help close the financing gap without necessarily closing the funding gap: costs may simply be transferred back to governments or households rather than genuinely shared.
This is illustrated in Figure 4, which shows options for delivery of a programme of coastal flood protection in a developing country context. Here, the delivery is provided by the private sector, who build the contract. The financing can be provided in many ways, including from public budget, tax rises, or private sector financing through the capital markets. These are important since there is much greater potential for private sector financing than for developing business. For example, it is possible to attract significant amounts of private sector financing to support public sector investment, but ultimately government repays with interest. Therefore, it is important to consider whether we are seeking to boost private sector funding (i.e. the proportion of companies and businesses that actually contribute to the costs of adaptation), or merely the financing.
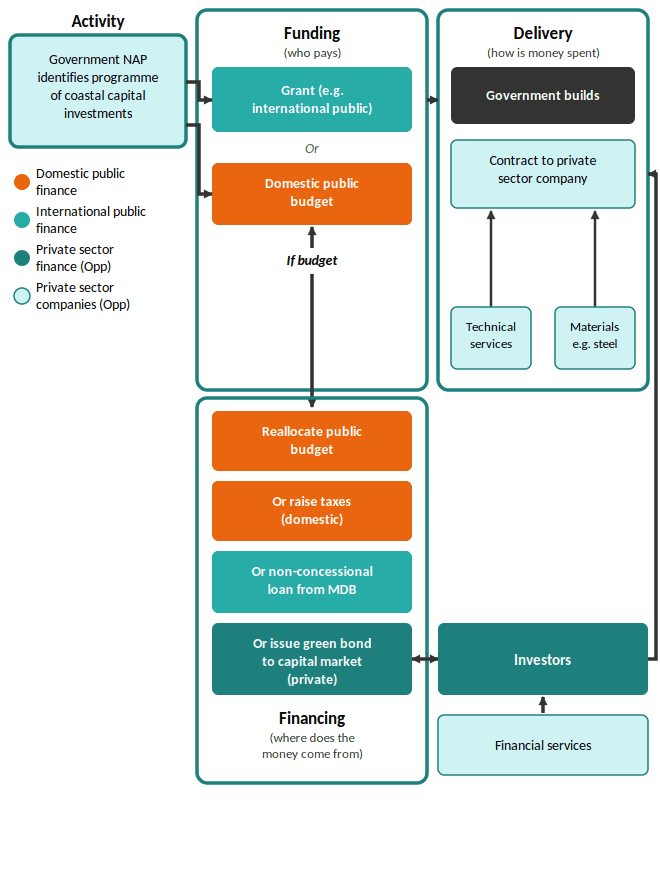
Figure 4: A simple example of the financing, funding, and delivery of adaptation for coastal protection. Source: Watkiss and England. 2025.
The role of public and private sectors
In recent years, there have been substantial efforts to better understand the factors which can inform whether such activities should be funded by the private or public sectors. These include whether the costs and benefits of activities are public or private as well as the level of financial returns they offer. These can be none/limited (and are therefore typically public), below-market or market level returns (OECD, 2023). The level of market returns for many adaptation options have been classified in Table 3, and these have been reviewed and updated to be relevant to the sectors in scope of this study:
Table 3 – Adaptation activities and potential returns in developed countries for the sectors explored in the study. Updated from Watkiss and England, 2025 and OECD, 2023.
|
Sector and activity |
Typical nature of investment |
Typical level of return | ||
|
Public |
Below market |
Market | ||
|
Coastal, river and surface water flood | ||||
|
Protection (coastal and river floods) |
Public |
ü | ||
|
Early warning services |
Public |
ü | ||
|
Natural flood risk management / NbS |
Public |
ü | ||
|
Property Level Flood Resilience and Resistance |
Private |
ü |
ü |
ü |
|
Water | ||||
|
Integrated water resources management (IWRM) |
Public |
ü | ||
|
Supply and distribution |
Mixed |
ü |
ü |
ü |
|
Demand management, inc. efficiency measures |
Mixed |
ü |
ü |
ü |
|
Agriculture | ||||
|
Research and Development |
Mixed |
ü |
ü |
ü |
|
Extension services |
Mixed |
ü |
ü |
ü |
|
Climate-smart agriculture |
Mixed |
ü |
ü |
ü |
|
Irrigation |
Mixed |
ü |
ü |
ü |
|
Trade and trade infrastructure |
Mixed |
ü |
ü |
ü |
|
Infrastructure | ||||
|
Transport (road and rail) |
Mixed |
ü |
ü | |
|
Biodiversity and Ecosystems | ||||
|
Protected areas |
Public |
ü |
ü | |
|
Capacity building, institutional strengthening, awareness |
Public |
ü |
ü | |
|
Forestry |
Mixed |
ü |
ü |
ü |
Building on this approach, UNEP (2025) outline a useful typology (adapted into Figure 5) for understanding where public and private actors are best placed to act, based on the combination of level of returns and whether the costs and benefits are public, private or joint. These can be used to help classify a broad range of activities which are funded by either the public sector, private sector, or a mix of both.
Type A actions are public goods, such as major flood protection schemes, that generate little or no financial return and are therefore typically initiated and funded by government. Type B actions involve a mix of public and private costs and benefits, and where returns are typically below market. For example, supporting climate-smart agriculture. These typically involve blended finance arrangements. Type C actions sit within existing well-functioning markets and generate commercial returns, such as industrial cooling systems, and would be expected to be entirely privately financed and funded.
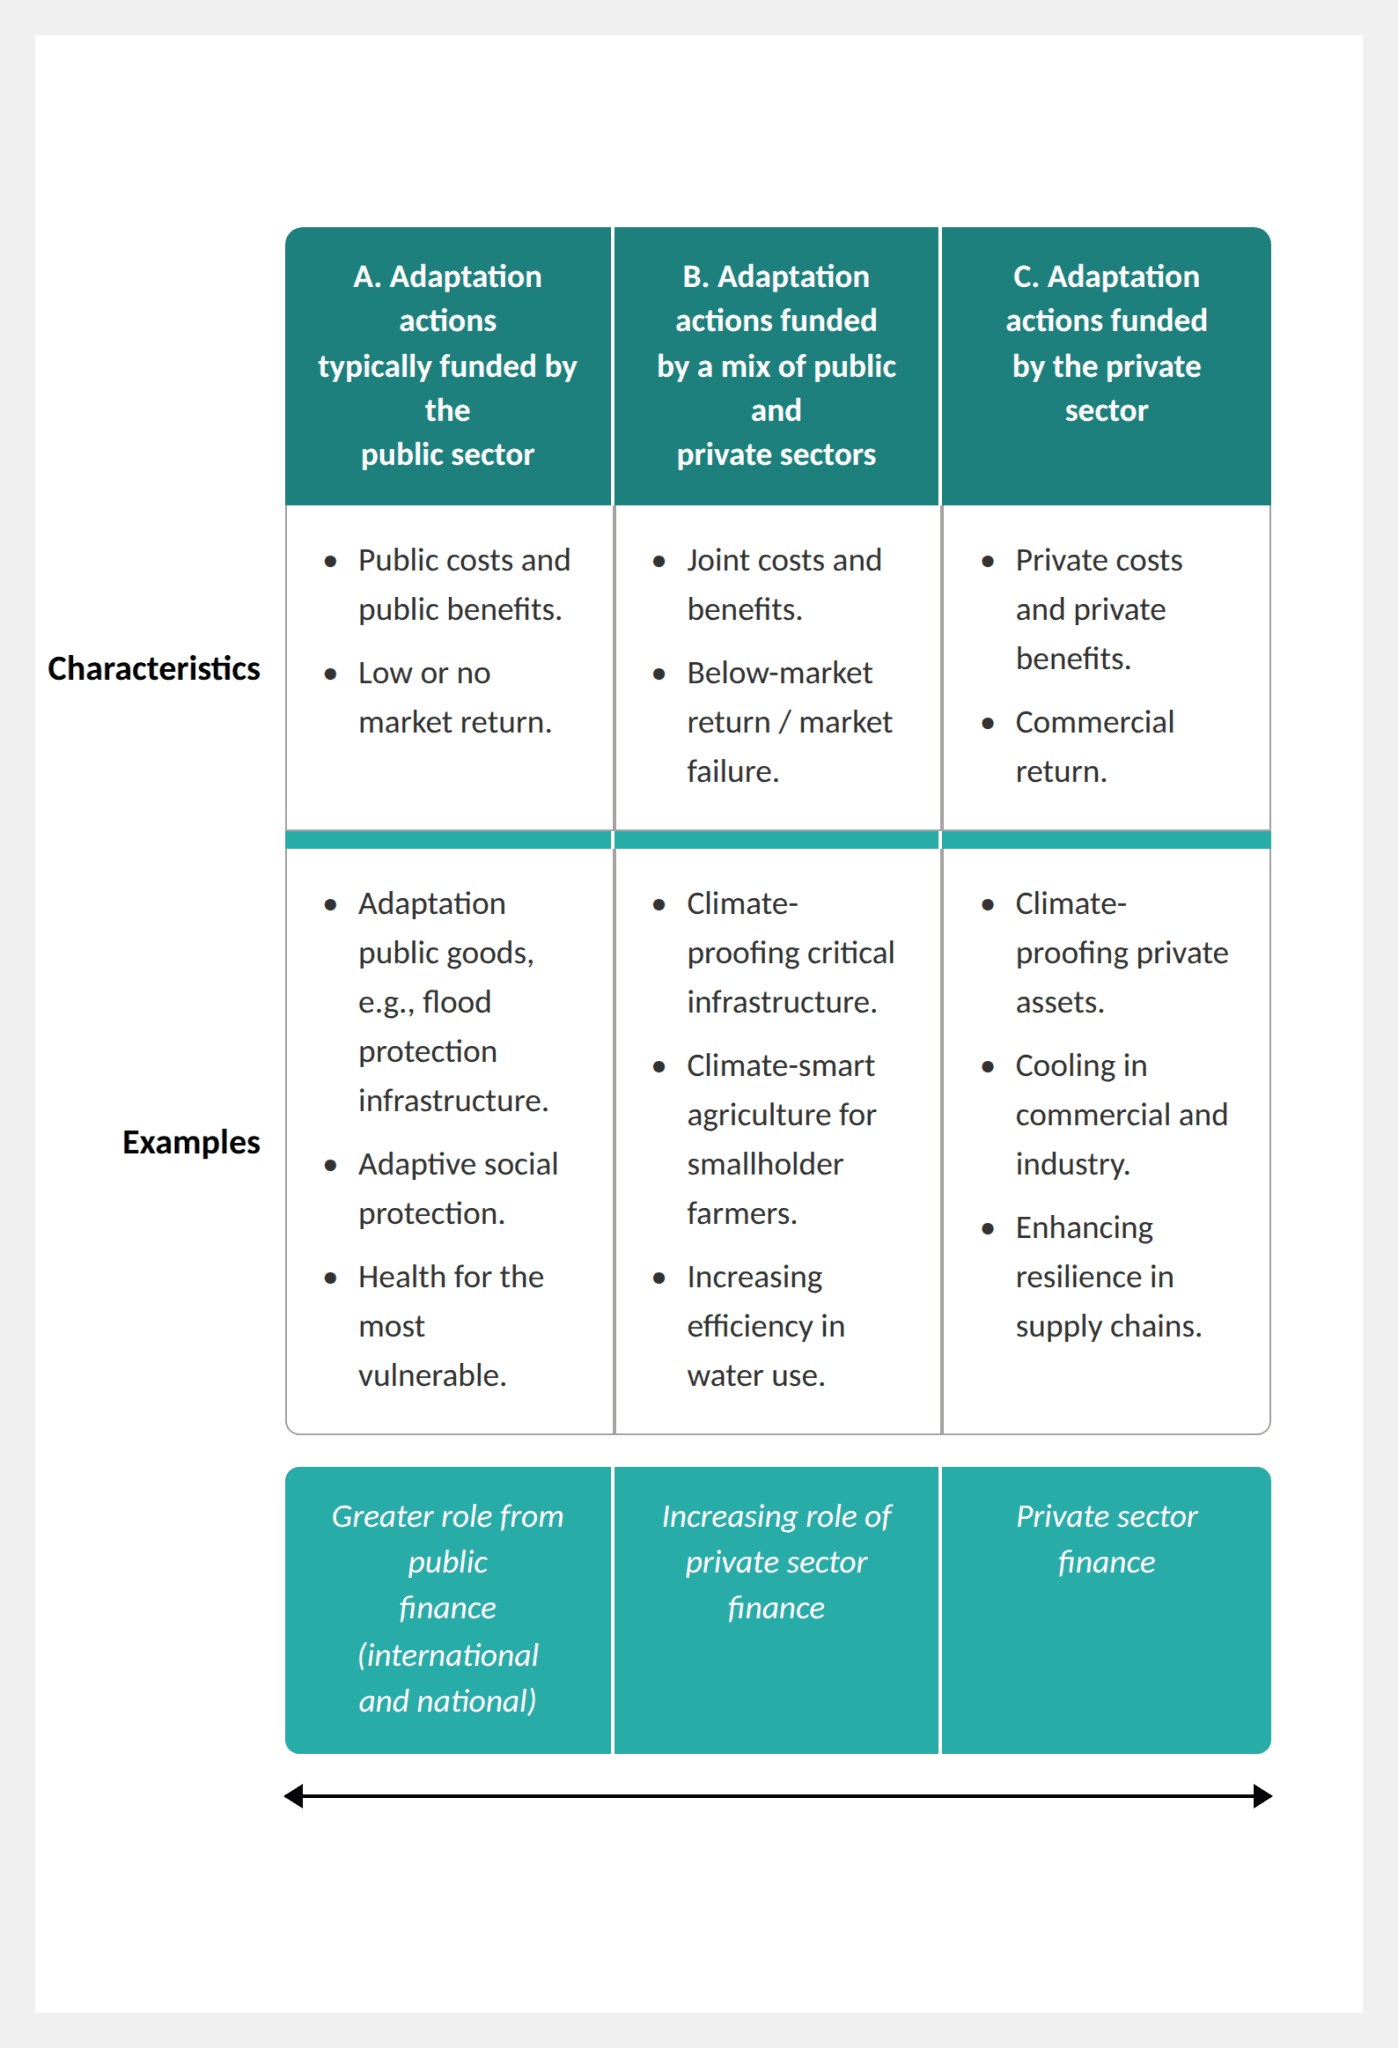
Figure 5: Simplified categorisation of adaptation types (A-C) and opportunities for private sector engagement. Adapted from UNEP (2025).
Barriers to adaptation finance
Private sector investment in climate adaptation remains persistently low, despite adaptation often delivering high economic returns for society (World Bank, 2024).
The core problem is that while the societal benefits of adaptation can be substantial, the financial returns that matter to private investors are much lower. Adaptation frequently reduces losses or damages and generates limited revenues, making it difficult to construct a viable business case for private finance. This is especially the case, given the opportunity cost of capital, and difficulties of modelling climate-related disruption in cashflows and returns (Watkiss and England, 2025). There are also issues of discounting, where costs arise today, but benefits occur far in the future and are therefore higher. The private sector also uses higher discount rates than the 3% in the public sector (HM Treasury, 2026), compounding this issue.
Many studies reporting high benefit-to-cost ratios for adaptation are measuring economic or societal returns, which include non-market benefits such as environmental value. Private investors, however, assess financial returns, incremental revenues and cash flows, which are considerably lower. This distinction is frequently misunderstood and leads to unrealistic expectations about the role private finance can play (Watkiss and England, 2025).
Watkiss and England (2025) identify five main categories of barrier to adaptation finance:
- Information barriers, including insufficient data on climate risks and limited investor understanding of adaptation as an asset class.
- Market failures, including public good characteristics and underdeveloped adaptation markets.
- Behavioural barriers, including low perceived urgency and limited willingness to pay for risk reduction.
- Policy and governance barriers, including weak or conflicting regulation and poor cross-sector coordination.
- Financial and bankability barriers, including long payback periods, small project sizes, high complexity, and limited replicability.
Scaling private investment into publicly identified adaptation priorities remains a significant challenge, particularly for smaller, fragmented projects involving many actors and beneficiaries.
Boosting private sector opportunities
Globally, current private sector contributions to climate adaptation are very small (approximately 3% of total needs). Even with substantial innovation and concerted effort, the private sector is expected to deliver only around 15% of required adaptation by 2035, with even less in least developed countries and small island developing states (Watkiss & England, 2025). However, this varies significantly based on country and sector structure. Recent analysis of the UK’s third National Adaptation Plan finds much higher numbers, suggesting around 45% of total adaptation costs are borne by private households and businesses (Watkiss et al., 2026a), in part driven by the privatised nature of the water sector in England. As Scottish Water is publicly owned, the equivalent figure for Scotland is likely to be lower, with a greater share of adaptation costs falling to the public sector.
As a result, climate adaptation is currently funded predominantly by the public sector, both globally and within the Scotland. Central and local government fund most adaptation-relevant expenditure across transport, flood management, water infrastructure, agriculture and the natural environment, largely through existing budget lines that deliver multiple objectives alongside adaptation, climate-proofing, or pure adaptation investment (e.g. for flood protection). Across all sectors, households and businesses also bear some adaptation costs directly. For example, through property level insurance or on-farm investments. However, this remains modest.
Crucially, scaling up private sector participation will not happen through market forces alone. It will require concerted public policy action, enabling conditions, and in many cases public co-financing to de-risk private investment. The private sector’s role is therefore best understood as being complementary to, rather than a substitute for, public adaptation finance (Watkiss and England, 2025).
Governments can adjust the financial characteristics of adaptation activities to increase private sector participation, either at the market level or at the level of individual investments. At the market level, this can include improving existing markets (e.g. through better provision of climate risk information), creating new markets (e.g. through water credits), or supporting public provision where markets fail (Greenhill et al., 2026). At the level of individual investments, policy and regulation or blended finance arrangements can be used to alter financial characteristics and improve commercial viability (World Bank, 2019; Watkiss and Ward, 2025). Where neither approach is sufficient, there remains scope to diversify the range of public financing sources and instruments. This is illustrated in the decision tree in Appendix A.
Climate justice considerations
Another significant consideration within the costs of adaptation are the distributional aspects, and the need for a “just resilience”. The CCC report to Scottish Government on climate adaptation and just transition in 2022 highlighted that fairness in adaptation is strongly linked to just transition concepts, and it is crucial to consider distributional effects to ensure effective and fair adaptation (CCC, 2022). Several characteristics that lead to increased vulnerability and reduced adaptive capacity to climate risk were identified, and include low-income groups, the very young and the elderly, and those in rural regions. The CCC recommended that policy to help address adverse distributional impacts should be routed in an understanding of the distributional effects of climate risks and opportunities.
While climate risks are unevenly distributed and demand equitable responses (European Environment Agency, 2025), they also involve costs. Such costs can be explored from several perspectives. A simplified set of approaches is shown in Table 4, ranging from most targeted to those most socialised, though in reality the approach may be context specific.
Table 4: Indicative approaches to guide who should pay for adaptation: Adapted from Paul Watkiss Associates.
|
Approach |
Description and examples |
Justification |
|
Costs borne by those at risk |
Those directly exposed to risks bear the costs of adaptation (e.g. PFR) |
Beneficiaries should pay costs |
|
Costs socialised amongst users |
Investment in water / rail networks for adaptation through water bills and ticket sales |
Efficiency, user pays |
|
Maximise social welfare – prioritise dense population |
Use of Cost-Benefit analysis to maximise (e.g. flood defences in England) |
Social welfare, cost effectiveness |
|
Costs socialised across society |
Adaptation of nature and biodiversity, flood protection |
Public goods, fairness or equity |
|
Adaptation responsibility based on historic and current emissions |
Highest emitters pay for adaptation (e.g. Green Climate Fund, Adaptation Fund) |
Adaptation costs driven by historic emissions / most wealthy |
The CCC recommended that policy to help address adverse distributional impacts should be rooted in an understanding of the distributional effects of climate risks and opportunities.
Early work underway globally is considering some of the principles behind the costs of adaptation. The Government of New Zealand (2025), set out some early principles in its National Adaptation Framework such as ensuring pre-and post-climate event costs are shared across society and over time, and that the public sector is used to incentivise private sector action, and to take market-based approaches that adjust over time. While beyond the scope of this report, it is noted that such considerations may have the potential to significantly vary relative distribution of costs.
Knowledge gaps and challenges
Evidence gaps in Scotland’s adaptation investment landscape
It is important to note here that adaptation investment, globally, is poorly understood, and many countries are, like Scotland, working to quantify their national adaptation investment needs. Scotland faces multiple knowledge gaps around climate adaptation investment. These include:
- No clear understanding of the total investment required across sectors, including whether this will involve millions or billions of pounds, or how this spending will be distributed with time.
- No detailed picture of what climate adaptation investment could deliver for different sectors.
- No specific, measurable, achievable, relevant and time-bound (SMART) adaptation objectives under SNAP3.
- No assessment of associated costs of not adapting, and/or expected residual damages.
- No budget allocation for each SNAP3 objective.
These knowledge gaps make it difficult to determine whether a financing gap exists or how large that gap might be in Scotland.
Broader knowledge gaps in Scotland and beyond include:
- Lack of robust estimates of the wider returns from adaptation investment, including avoided climate damages, economic benefits, and broader social and environmental gains that comprise the ‘triple dividend’ of adaptation.
- Limited research exploring opportunities for blended public-private funding partnerships to support climate change adaptation spending.
Further research on these broader topics is key to ensuring and prioritising just and equitable climate adaptation solutions in Scotland.
Box 1: Challenges and limitations
Estimating Scotland’s climate adaptation investment need is inherently challenging. This work provides an initial method, approach, and set of assumptions to estimate climate adaptation spending across sectors. It is intended as a first step that will require further development. The figures presented should therefore be treated as indicative, order of magnitude estimates rather than precise calculations. Readers and peers are encouraged to build on this analysis by adding new assumptions, incorporating additional sub-sectors or hazards, or testing alternative scenarios and risk-tolerance thresholds.
The key data limitations and challenges underlying these estimates include:
Baseline spending: Incomplete information on current adaptation expenditure across Scotland makes it difficult to establish a reliable baseline from which to measure progress or scale up investment.
Asset vulnerability: Comprehensive inventories of climate-vulnerable assets are lacking in most sectors, and there is limited understanding of how vulnerability will evolve as the climate changes.
Climate and socio-economic uncertainty: Projections of how Scotland’s climate will change over the coming decades remain uncertain, as does the evolution of the broader socio-economic and political landscape.
Risk tolerance: Without clearly defined government risk tolerance thresholds or adaptation objectives for each sector, it is difficult to establish an ‘end goal’ against which investment needs can be scaled.
Scope limitations: The analysis focuses on selected sub-sectors and key hazards; many relevant adaptation actions and climate risks across Scotland’s wider economy are not included.
Methodological assumptions: Estimates rely on assumptions regarding appropriate adaptation objectives for 2040 and whether spending continues at current levels or scales up in line with growing climate risks.
Study methods
Our approach
Scotland faces similar challenges in estimating climate adaptation investment need to those across Europe, and the fragmented data landscape means no single method could be applied consistently across all sectors. The study therefore adopted a pragmatic, multi-stage and multi-method approach:
- estimating adaptation costs for each sector using the most appropriate costing method given available evidence;
- feeding these into a macroeconomic model to explore the economic impacts of different financing routes;
- mapping current governance arrangements to understand how adaptation is being paid for today; and,
- exploring the potential to increase private sector participation.
Due to resource and data limitations, the three analyses were conducted separately, with differing underlying assumptions. The cost estimates, macroeconomic modelling, and funding analysis are therefore not directly comparable with one another. Each is intended as a broad exploratory assessment, and further integrated analysis would be needed to draw firm conclusions across all three components.
Throughout, developing robust estimates also required identifying which SNAP3 targets and objectives are relevant to each sector and considering wider socio-economic context beyond climate risk alone. The detailed steps are shown below.
Step 1: Adaptation costing
Adaptation objective setting
We adopted 14 of the 23 objectives set out in SNAP3 (Scottish Government, 2024a). The selected objectives covered four of the five broader SNAP3 outcome areas identified by the Scottish Government: Public Services (PS), Economy, Business & Industry (B), Nature Connects (NC), and Communities (C) (Scottish Government, 2024a). Objectives relevant to the fifth SNAP3 outcome area, Connected and Engaged Society (CE), were not included in the scope of this analysis. The specific sectors, objectives and corresponding outcome explored within our analysis area are summarised in Table 5.
Table 5: Climate change adaptation outcome area and objectives from SNAP3 that align with the five sectors considered in our work were selected and, where relevant, amended. Sectors not explored – due to resource constraints – are crossed through in the objectives below.
|
Sector |
SNAP3 outcome area and objectives |
|---|---|
|
Agriculture |
B2: Farming, |
|
Communities |
C1: Regional collaborations are driving inclusive, effective and place-based adaptation across all of Scotland. |
|
C2: Communities and individuals are supported, informed, and able to take locally led adaptation action, supporting local priorities and resilient, healthy, and equitable places. | |
|
C3: Communities and individuals are able to prepare for, respond to and recover from emergencies in a way that builds future climate resilience, complements the work of emergency responders and protects those with vulnerabilities to multiple risks. | |
|
C4: New buildings are designed for a future climate, and opportunities for adaptation in existing buildings are taken during maintenance or retrofit. | |
|
C6: Coastal communities are preparing for and adapting to coastal erosion and sea level rise. | |
|
PS2: People can access the public services they need, and critical assets, systems and networks are resilient to the impacts of the changing climate. | |
|
Natural environment |
B2: Nature-based solutions are protected and enhanced to enable healthier, cooler, water resilient and nature-rich places. |
|
NC1: Landscape scale solutions are implemented for sustainable and collaborative land use including protecting and enhancing Scotland’s soils. | |
|
NC3: Development planning (including Local Development Plans and associated delivery programmes) takes current and future climate risks into account and is a key lever in enabling places to adapt. | |
|
NC4: Nature networks across every local authority area are improving ecological connectivity and climate resilience, alongside other transformative national actions to halt biodiversity loss by 2030. | |
|
NC6: Resilient natural carbon stores and sinks (such as peatland, forests and blue carbon) are supporting Scotland’s net zero pathway, alongside timber production, biodiversity gains, flood resilience and the priorities of local communities. | |
|
Transport |
PS4: The transport system (trunk roads, rail, |
|
PS2: People can access the public services they need, and critical assets, systems and networks are resilient to the impacts of the changing climate. | |
|
Water |
PS2: People can access the public services they need, and critical assets, systems and networks are resilient to the impacts of the changing climate. |
|
PS3: Partnerships for water resource planning and rainwater drainage networks are active in prioritised catchments to support climate resilient places and drought and flooding resilience. |
The sectors and sub-sectors included in our study are defined as follows:
Table 6 Sectors and sub-sectors explored within this analysis
|
Sector |
Sub-sector |
|---|---|
|
Agriculture |
|
|
Communities |
|
|
Natural environment |
|
|
Transport |
|
|
Water |
|
Note that, due to resource constraints, a range of other key sectors – for example, energy, telecommunications, and health – have not been explored in this report. Furthermore, even within the sectors we have examined, we have not conducted full sectoral analyses. For example, within transport, adapting ferries, aviation, and canals was not included in the analysis due to resource constraints. Consequently, the results should be interpreted accordingly.
Context setting
To estimate the uplift or scaling factors for adaptation investment needs to 2040, we considered how wider socio‑economic conditions, such as population change, economic growth and sectoral investment trends, might evolve over time. These factors can be important. For example, estimating future flood defence needs can require assumptions about future population distribution, while economic growth and inflation trajectories influence both the cost of adaptation measures and the scale of potential economic losses.
In practice, this broader socioeconomic context was only relevant to a limited part of our analysis. Most estimates relied on sector specific data and updated risk information – such as SEPA’s revised flood risk mapping or current housing stock – rather than the national socioeconomic scenarios developed for CCRA3. As a result, although we originally intended to use the central CCRA3 socioeconomic scenarios to inform investment scaling, these were largely not required in the final workflow.
If needed for future updates, this contextual information can be revisited, but for the purposes of this assessment it played only a minor supporting role.
Apportioning adaptation spend
Following the MDB taxonomy introduced in Section 2.2, this study applied different cost attribution approaches across the five sectors depending on the type of adaptation investment and available evidence. The specific methods used for each sector are detailed below and further elaborated in the sector-specific analyses (Section 4).
Climate-Proofing (Incremental Costs)
For infrastructure investments where adaptation is integrated into planned programmes but not the primary objective, we estimated incremental costs above baseline investment, for example:
- Transport (trunk roads and motorways): We applied relevant climate-proofing uplifts from the literature to Scottish Government 2026/27 budget lines for road maintenance and renewal. These uplifts reflect the additional investment required to design infrastructure for future climate conditions rather than historical baselines. For example, upgraded drainage capacity to handle more intense rainfall, enhanced slope stabilisation for increased landslide risk, or heat-resistant surfacing materials. The baseline represents the investment that would proceed regardless of climate change; the uplift captures the incremental adaptation cost.
Mixed Objectives (Apportioned Costs)
For investments delivering multiple benefits including adaptation, we apportioned costs based on expert judgment in consultation with Paul Watkiss Associates, who have extensive experience applying the MDB taxonomy internationally. For example:
- Woodland creation: Forestry investment delivers multiple benefits including timber production, carbon sequestration (mitigation), biodiversity, recreation, and climate adaptation (ecosystem resilience, water regulation, reducing downstream flood risk). We reviewed stated objectives in Scottish Government forestry programmes and applied expert judgment from Paul Watkiss Associates, aligned with on-going UK level adaptation investment need research, to determine what proportion of woodland creation costs should be attributed to adaptation.
- Peatland restoration: Peatland restoration similarly delivers carbon sequestration, biodiversity recovery, water quality improvements, and adaptation benefits (enhanced water storage and flow regulation reducing flood peaks, maintaining ecosystem function under climate stress). We assessed the relative emphasis on these objectives in Scotland’s peatland restoration programmes and apportioned costs, accordingly. These apportionments were cross-checked through expert review with Paul Watkiss Associates.
- Nature restoration: We applied similar logic to wider nature restoration funding, examining whether investments prioritise climate resilience objectives (e.g., creating ecological corridors to enable species migration under climate change, restoring coastal habitats for natural flood defence) or primarily target biodiversity and ecosystem health goals, and attributed costs proportionally.
Different analysts might reasonably apply different attribution percentages to the same mixed-objective investments, as there is no objectively correct answer to how investment should be apportioned across multiple objectives, including the distinction between climate adaptation and mitigation. The percentages applied in this study are therefore documented transparently in the sector-specific analyses (Section 4) and supplementary data.
Targeted adaptation (pure adaptation)
For dedicated adaptation investments where climate risk reduction is the primary or sole objective, we counted total programme costs:
- Flood protection schemes: We examined historic budget allocations from Scottish Government expenditure data and uplifted these to current construction prices using appropriate indices. Estimates drew on SEPA’s updated flood risk mapping and UK-wide research on flood defence costs, scaled to Scotland’s exposure and asset base.
- Property-level flood resilience (PFR): We scaled recent UK research on PFR costs and uptake rates in proportion to Scotland’s residential and non-residential building stock at flood risk, using SEPA flood risk data to estimate the exposed population.
- Capacity building (communities): We engaged with Scottish Government policy teams to identify planned and potential future investment in community-level adaptation capacity, resilience planning, and climate literacy programmes where adaptation is the primary objective.
Sector-specific considerations
A pragmatic, multi method strategy was adopted that used the most appropriate costing approach for each sector, determined by data availability and evidence maturity. The core approaches drawn upon were:
- Drawing on existing sectoral analysis of initial adaptation investment estimates for specific plausible future scenarios (e.g., water and rail).
- Applying relevant climate proofing uplifts from the literature to relevant Scottish Government 2026/27 budget lines (Scottish Government 2026b), reflecting changing climate risks (e.g., trunk roads and motorways).
- For each plan or budget line, including the Scottish Government Draft Climate Change Plan (CCP) (2025) and the Scottish Government 2026/27 budget (Scottish Government, 2026b), the multiple objectives were examined to identify the proportion of investment directly related to adaptation (e.g., agriculture, woodland creation, peatland restoration, and nature restoration).
- Examining and uplifting historic budget allocations to current construction index prices (e.g., flood protection schemes).
- Drawing on wider UK research and scaling estimates in proportion to Scotland’s building stock or relevant assets (e.g., flood-protection schemes and property level flood resilience).
- Engaging with Scottish Government policy teams to discuss likely investment changes for spending with adaptation relevance (capacity building within communities).
- Applying value transfer methods by exploring how adaptation cost estimates compare when scaled to the Scottish context, drawing on Neumann et al. (2025) as an international benchmark for agriculture and transport infrastructure, and on UK Government (2025) analysis for flood protection schemes.
- Undertaking expert review to cross-check estimates against parallel analysis being undertaken for the Climate Change Committee’s Well Adapted UK report, due for publication in Spring 2026.
For further detail on methodological approach used, please see the sector-specific analyses, the appendices B and C (for additional information on Network Rail Scotland and Scottish Water’s analysis respectively), and supplementary data.
Step 2: Estimating macro-economic effects of spending
Macro-economic effects
Fully modelling the costs and benefits of adaptation, including all potential avoided damages, productivity improvements, health gains, and environmental co-benefits, is extremely resource intensive and was beyond the scope of this project. Instead, the Centre for Energy Policy at the University of Strathclyde used a Computable General Equilibrium (CGE) model of the Scottish economy to explore one deliberately narrow but important question: what are the direct economic effects of additional climate adaptation investment in Scotland, and what economic activity does this spending stimulate?
CGE models are widely used by governments and research institutions, including HM Treasury and the Scottish Government, to understand how changes in one part of the economy ripple through the rest. For this study, a model was used that represents the Scottish economy across 30 broad sectors and is built on Scottish Government Input-Output tables from 2019, chosen to reflect the structure of the economy before the disruptions of Covid-19 and the war in Ukraine. The model traces how adaptation spending affects prices, production, employment, and incomes across sectors, and how these effects in turn influence government revenues and public finances. It also accounts for how wages and employment interact. It allows for migration in and out of Scotland depending on relative economic conditions. Finally, it divides households into five income groups to understand how different parts of society might be affected.
For this research, we assumed that climate change adaptation is a form of capital spending that does not create additional production capital for production sectors. Instead, it allows them to maintain the same production capacity, which would be at risk in the face of climate change.
Understanding the modelling approach: spending and cost recovery
To make the modelling approach clearer, it is helpful to think of adaptation in two phases:
Phase 1: Sectoral spending for climate adaptation measures
In Phase 1 the scope of the work is to model how the spending flows through the Scottish supply chains. We model how the sector makes additional purchases of goods and services to deliver adaptation measures (for example, construction materials, engineering services, flood defences, or restoration work). This spending initially flows through Scottish supply chains, creating economic activity in the sectors that deliver the work and in households that benefit from the associated wages and employment.
Phase 2: Cost recovery
Over time, the sectors and/or government need to recover the costs of adaptation. Each sector may have a different cost recovery approach, depending on its business models and economic structure. We modelled three stylised approaches to illustrate the broad channels through which different funding choices affect the economy:
(1) “Government pays, funded through income tax” (used for Communities, Rail and Trunk roads) may have the following implications:
- Income tax rates rise to cover adaptation costs.
- Household disposable incomes fall, especially for higher earners.
- Consumer spending is dampened across society.
- This approach is typically progressive, as those earning more pay a larger share.
- Government spending in other areas (health, education, etc.) is preserved.
(2) “Government pays, funded through government spending cuts” (used for Natural environment) may have the following implications:
- Public spending declines towards all sectors to cover adaptation costs.
- Public administration/defence, education, and tertiary sectors suffer most.
- This approach tends to be mixed.
(3) “Industry pays, funded through higher prices” (used for Agriculture and Water) may have the following implications:
- The adapting sector faces a cost they have to cover, which firms pass on to consumers through higher prices.
- Higher prices reduce export competitiveness (assuming similar price increases are not also happening abroad), which reduces demand for Scottish goods.
- This approach tends to be regressive, as lower-income households spend a relatively larger share of their budgets on essential goods and services.
Important caveats
All approaches are highly stylised and are used to illustrate the broad economic channels and trade-offs that different funding choices create. In reality, adaptation funding is likely to involve a blend of government and industry contributions, as well as other mechanisms such as borrowing, grants, or targeted levies. The scenarios presented here should be treated as illustrative, helping to understand the direction and scale of potential impacts rather than precise forecasts.
More detail on the methodological approach and more detailed analysis of selected sectors can be found in Appendix D.
Note: The macroeconomic modelling cannot be taken as an assessment of the costs and benefits of adaptation. While the modelling captures the direct economic stimulus of adaptation spending and the effects of cost recovery, it does not model residual damages. Neither does it quantify the full range of avoided climate damages, increased resilience, reduced disruption to businesses and households, improved business continuity, health gains, long-term productivity benefits, or environmental co-benefits that underpin the wider “triple dividend” of adaptation. The results should therefore be interpreted as a conservative and partial estimate, representing only one dimension of the economic effects – the demand-side impacts of the spending and its financing – rather than the full spectrum of costs and benefits of adaptation.
Steps 3 and 4: Estimating current and future private sector contributions
In each of the sectors represented in the report, there are existing models which are being used to cover the costs of adaptation today. To explore the current and future potential splits, the project documented the broad governance models of each sector today. We then carried out a qualitative evaluation of the potential use of blended finance, regulation and policy and innovative models. We note that these vary significantly based on the broad structure of the sector, and appetite for change.
Our focus has been on the theoretical potential to increase private sector contributions (noting that this may not be ultimately desirable). This is based on the need to prioritise public sector expenditure on those areas which cannot be met by private sector or households directly. The range of models explored includes:
- Innovative models using private finance to provide upfront capital
- Models which increase private sector funding for adaptation
- Provision of adaptation goods and services (which ultimately reduce costs for public and private sector activities
To identify potential innovations, we drew on the Paul Watkiss Associate database of innovative accelerators (England et al., 2023; United Nations Environment Programme, 2024), as well as recent wider work exploring financing options (Watkiss and England, 2025). Further supplemental models were identified through desk-based searches during this project. We undertook a rapid review and used expert judgement to extract innovative approaches that they felt were potentially relevant in a Scottish context.
Due to the limited resources available for the project, the review has inevitably been ‘light touch’ but serves as the basis for further exploration and discussion to inform the development of SNAP4, as well as the future business models of public bodies such as Scottish Water or Network Rail.
Prices
All prices in the report are presented in 2026/27 prices. For the period 2025/26 to 2026/27, a nominal growth rate of 2% per annum has been applied, consistent with the Bank of England’s long-run inflation target. See the supplementary data for further detail.
Sector-specific analysis
The results derived are detailed below. For each sector – agriculture, communities (flooding), transport, water and natural environment – we highlight (1) key risks and adaptation opportunities, (2) information regarding current investment in climate adaptation, (3) the estimates of adaptation investment need, (4) the wider (co)-benefits of such spend, (5) the current governance, and (6) funding and financing arrangements.
Agriculture
Key climate risks and adaptation opportunities
Agriculture in Scotland faces a complex and intensifying range of climate-driven pressures. More frequent extreme rainfall events are already causing excess waterlogging, which has been shown to be a greater current risk to wheat yields than heat or water stress (risk N6 in CCRA3). Hotter, drier summers are reducing the suitability of high-quality arable land due to drought risk. The 2018 drought illustrated how quickly these pressures cascade through supply chains, with reduced malt barley yields and distilleries halting production due to low river flows. Fluvial flooding on major river catchments such as the Tay and Tweed continue to damage agricultural land, and projections suggest the area of Scotland’s best-quality farmland at risk from flooding could rise by over 30% by the 2080s under a +2°C scenario. Warmer conditions are also driving increases in pests, pathogens and invasive species (CCRA3 risk N7), from potato blight and cyst nematodes to Bluetongue virus, posing escalating threats to crops, livestock and soil health (Sniffer, 2021). Together, these pressures are expected to push agricultural climate risk, as stated in the CCRA3, from medium to high in the coming decades (Sniffer, 2021).
Addressing these risks requires an integrated, forward-looking approach to land-use planning and farm management. Key priorities identified by CCRA3 (2021) include updated land capability assessments using UKCP18 data to guide decisions on where agricultural systems remain viable, alongside improved skills and knowledge exchange, crop diversification, and better soil and water management. Expanded pest and disease monitoring, stronger biosecurity, and wider uptake of integrated pest management are also highlighted, as is the need to align adaptation with net zero strategies to avoid introducing new vulnerabilities. Stronger research, improved coordination between government and land managers, and a more strategic cross-sector approach will be essential to safeguard Scotland’s long-term agricultural productivity as climate pressures intensify (Sniffer, 2021).
Current spending and context
It is not possible to outline how much capital the Scottish Government currently allocates specifically toward climate adaptation of agriculture. This is because climate adaptation investment is currently folded into budget lines with multiple other objectives such as emissions reductions, increased biodiversity and wider farm support. However, the Scottish Government 2026/27 Climate Taxonomy highlights that £221m worth of allocated budget within agriculture have a positive impact on adaptation. Similarly, to our knowledge, there is no available evidence on private sector investment for adaptation of agriculture within Scotland.
Adaptation investment need
Budget lines from the Scottish Government’s 2026/27 Climate Taxonomy with a positive impact on adaptation were used as the primary basis for estimating mixed-objective investment need for agriculture (Table 7). Spending was assumed to continue in nominal terms to 2040, with no uplift applied for increasing climate risk over the period. It should also be noted that some budget lines with positive adaptation impacts may not have been captured, for example, the Farm Advisory Service and Knowledge Transfer and Innovation Service sits under ‘Business Development’ in the Scottish Budget and has not been included, despite likely supporting adaptation through improved uptake of resilient practices.
It is important to note that these budget lines deliver multiple benefits alongside adaptation, including climate mitigation, soil health improvements, biodiversity gains, and wider farm business productivity. Disentangling the proportion of each line attributable specifically to adaptation is particularly challenging in agriculture, where weather and climate resilience – and therefore adaptation – are integral to sectoral success. For this reason, no specific proportion of any budget line was allocated to adaptation in isolation; instead, the whole budget line was included. Estimated costs should therefore be understood as representing a bundle of co-benefits of which adaptation is one component.
Table 7: Budget lines from the Scottish Government Climate Taxonomy 2026/27 that were included in adaptation investment need analysis for agriculture, and associated adaptation rating (Positive – High or Positive – Low) which represents the likely impact (and extent of impact) of the budget line on adaptation, e.g. ‘Positive – High’ is a positive impact that is likely to be highly beneficial.
|
Budget lines included in analysis |
2026/27 budget (£m) |
Adaptation rating |
|---|---|---|
|
Pillar 1 – Greening Payments |
£142m |
Positive – High |
|
Agricultural Modernisation Fund |
£26m |
Positive – Low |
|
Scottish Rural Network |
£0.87m |
Positive – Low |
|
Agri Environmental Measures Resources |
£21m |
Positive – High |
|
Agri Environmental Measures Capital |
£4.7m |
Positive – High |
|
Public Good Advice |
£2m |
Positive – Low |
|
Veterinary Grants |
£0.8m |
Positive – Low |
|
Animal Diseases |
£23.5m |
Positive – Low |
Table 8 outlines our estimate of mixed objective investment need – including adaptation – for agriculture. This estimate ranges from £168m/yr for budget lines associated with a high positive impact on adaptation to £221m/yr where budget lines with a low positive impact on adaptation are also included.
We cannot give an estimate of adaptation investment need for agriculture in isolation. However, if the current level of spend is maintained out to 2040, total investment in budget lines associated with a positive impact on adaptation in agriculture would amount to between £2,347m – £3,091m, or equivalent to £167.6m – £221m per year over the period 2026–2040 (Table 8).
Table 8: Lower and upper estimates of the mixed-objective investment need (including climate adaptation) for agriculture, based on budget lines in the Climate Taxonomy 2026/27 with a positive impact on adaptation. Values are in 2026/27 prices.
|
Lower estimate |
Upper estimate | ||
|---|---|---|---|
|
Cost p.a. (£m/yr) |
Total up to 2039/40 (£m) |
Cost p.a. (£m/yr) |
Total up to 2039/40 (£m) |
|
£167.6m/yr |
£2,347m |
£221m/yr |
£3,091m |
These estimates were triangulated by scaling adaptation cost estimates from Neumann et al. (2025) to the Scottish context as an international benchmark. Neumann et al. (2025) estimated EU agricultural adaptation costs at approximately 0.04% – 0.06% of GDP per year under moderate to high emissions scenarios. Applying this range to Scotland’s GDP yields an indicative figure of £90m – 142m/yr (2026/27 prices). Scotland’s agricultural GVA (approximately £2.2bn, around 1% of GDP) is broadly comparable to the EU average (approximately 1.2% of EU GDP), supporting the plausibility of this transfer as a cross-check (Scottish Government, 2025c; Eurostat, 2026). However, this comparison should be treated with caution: the nature and projected intensification of climate hazards vary considerably across EU member states and diverges from Scotland’s risk profile in important respects. These figures were therefore used as an indicative benchmark to assess how our estimates compare at an international level, and are not included in our reported adaptation investment need figures.
We also conducted separate exploratory research to highlight the challenges and opportunities of using bottom-up analysis to cost climate change adaptation investment need for specific agriculture actions (see Case study 1).
Case study 1: Exploratory bottom-up analysis of agricultural adaptation actions
While budget tagging reveals how much is being spent, it does not indicate what this delivers for climate resilience or whether current levels are sufficient. As an exploratory supplement to the primary budget-line estimates, indicative cost estimates were developed for 33 adaptation actions identified in a Scottish Government RESAS report, to showcase how investment need estimates could iteratively improve to become asset- and action-based going forward. This analysis should be regarded as a proof-of-concept; further data collection and expert elicitation would be needed to improve future estimates and develop associated adaptation pathways.
Costs were sourced from academic and grey literature, with confidence ratings assigned to each source, and scaled to Scotland’s agricultural land area using land-use archetypes from the CCC’s Rural Land Use Types report (Thomson et al., 2025). Complete scaled cost estimates were produced for 19 of the 33 actions. Where data permitted, an exploratory cost-benefit analysis was undertaken for selected actions, including diversified crop rotations, examining potential impacts on yields, soil erosion, and fertiliser use.
The exploratory CBA for diversified crop rotations suggests potential monetised benefits totalling £856m–1.1bn between 2026 and 2040 for reduced soil erosion, increased crop yields and reduced fertiliser usage. Relative to an estimated total action cost of £3.5bn, this represents 25–31% of the potential investment directly benefiting agricultural productivity. Furthermore, other public good benefits not explored from diversified crop rotations could include other benefits such as increased biodiversity and improved water retention that were not explored here.
These figures assume each action is applied across all eligible land, which is an over estimation. Further information on the results, assumptions made, confidence ratings, and recommended further research steps are provided in Appendix E and the supplementary data.
Macroeconomic effects and wider impacts
Macro-economic impacts
We assumed the agriculture sector requires approximately £2.3bn of adaptation investment between 2026 and 2040, around £150m/yr (based on rounding down the analysis in Section 4.1.3). This spending is distributed across construction, the agriculture sector itself, all other manufacturing, and wholesale/retail (vehicles).
Without cost recovery (a modelling device to isolate the spending effect): The programme generates GDP and employment gains during the spending period, with around 80% concentrated in the sectors directly delivering the works – construction, all other manufacturing, wholesale/retail (vehicles), and agriculture itself. Positive spillovers reach consumer services as household incomes rise. Employment and GDP impacts track each other closely because the agriculture adaptation supply chain involves relatively capital-intensive activities such as specialised equipment and infrastructure. As with other sectors, these benefits fade after spending concludes.
With “industry pays” cost recovery (a stylised scenario): When farmers bear adaptation costs and pass them to consumers via higher food prices, the effects are regressive. By 2040, the lowest-income households face price increases of 0.09%, compared with 0.07% for the highest-income households, because food represents a much larger share of poor households’ budgets. Higher food prices erode real incomes and household consumption across all income groups, while reduced export competitiveness further dampens GDP and employment. Because agriculture is one of Scotland’s most labour-intensive sectors – employing 8.5 workers per £1m of output, well above the economy-wide average of 6.6 – the concentrated negative impacts trigger significant job losses that spill across the wider economy. Scotland’s labour mobility means workers leave rather than accept wage cuts, prolonging the employment losses.
Policy implications: An “industry pays” approach financed through higher food prices risks regressive impacts on low-income households and substantial employment losses. While adaptation spending itself stimulates construction and manufacturing, the method of cost recovery determines whether these gains are preserved or eroded, and which parts of society bear the burden.
Current governance, funding and financing arrangements
Agriculture is a market sector but is heavily supported by the public sector (Figure 6). See Appendix F for further information on how this support is planned to change.
A key challenge in the agriculture sector is disentangling the adaptation costs from the other objectives, as the sector involves a mix of activities. There are some dedicated adaptation activities, but other agri-environment objectives include actions to improve productivity, with private costs and benefits, but supported by public activities. Furthermore, it is also challenging to differentiate adaptation actions from wider activities to boost yields or achieve other objectives.
Therefore, rather than looking at activities, the study took an alternative approach which explored the relative income sources for farms. Scottish Government produces estimates on the annual income from farms, including their makeup (Scottish Government, 2025d) shown in Appendix F. These show that agricultural activity in Scotland is typically lossmaking, except for dairy and general cropping, and that agricultural support payments make up a significant share of all farm income. The survey excludes sectors which do not receive support, such as pigs, poultry and horticulture.
The results suggest that loss-making farms may struggle to invest in adaptation measures and that the majority of the ability to invest in adaptation is likely to come through support payment income. We assume that adaptation action is mainstreamed into general agricultural support.
To derive estimates of private sector contribution we started by assuming that for farm types where agriculture is not profitable, all agricultural adaptation is paid for by the public sector. For those sectors where agricultural income is profitable, we assume 50% co-investment, assuming farmers can contribute to those areas which support adaptation. For those sectors excluded for support payments, we assume adaptation costs are 100% private. These assumptions were then applied to output of holdings by farm type from the 2025 Scottish Agricultural Survey. The results suggests that 33% of investment in adaptation is likely to be from the private sector. However, given the overlap with many other objectives and activities (including flood management), the uncertainty on the types of interventions and how they vary by farm type, as well as the fact that many of the grant schemes require co-investment from farmers. the confidence in such apportionment is low.
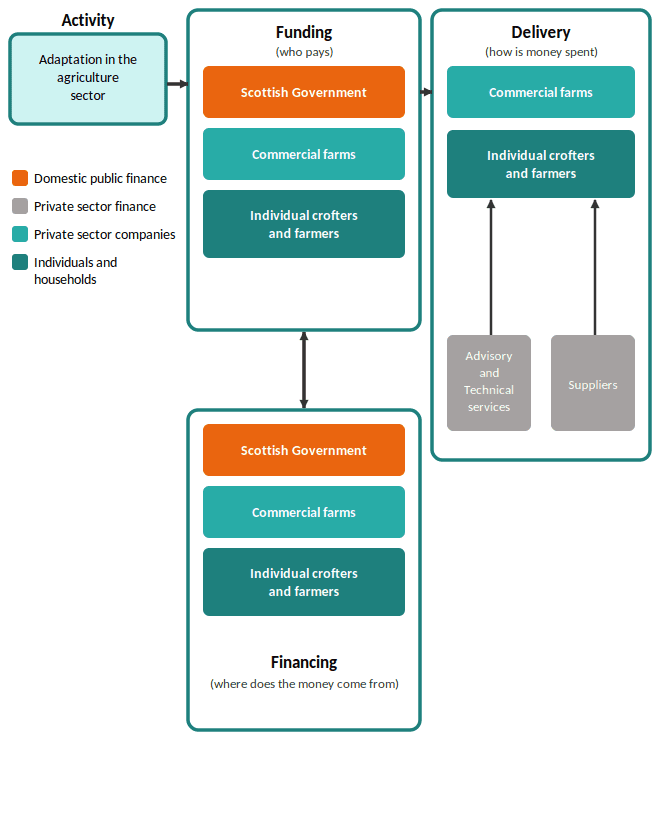
Figure 6 Financing, funding, and delivery arrangements for adaptation in agriculture.
Innovation that could boost private sector participation
Agriculture is one of the sectors where there is the greatest amount of innovation. There are a range of opportunities to leverage private finance for agriculture adaptation – especially as part of the wider agricultural reform programme. In general, blended finance offers a significant opportunity to incentivise further opportunities for investment in adaptation. For example, it can mainstream adaptation into loan requirements for agricultural investment, or support investment in dedicated adaptation activities. In Scotland, elements of nature restoration on farmland could be financed through biodiversity credits. Blended public-private models such as the Scottish Government £1m Agritourism Investment Scheme – offering grants of up to £50,000 covering 40% of eligible capital costs – can support farm diversification and rural resilience (Savills, 2026).
These can also be complemented by other models which support investment, including from suppliers interested in value chain resilience, or using offtaker agreements.
There are also specific models for investment that target particular activities or parts of the supply chain. For example, use of Public Private Partnership (PPPs) for climate resilient seeds, or the use of digital platforms to provide weather and advisory services) to support farm activities. In addition, parametric insurance offers faster, more transparent cover for systemic risks including drought, flooding, frost and yield shortfalls. It pays out automatically when pre-agreed environmental thresholds are met, rather than requiring loss assessment (Descartes, 2026). Parameters must be carefully designed to avoid leaving farmers exposed to events that fall outside agreed trigger conditions.
Shared rural infrastructure offers a further avenue for cost-effective private investment. Co-operative models – for example, shared grain stores and drying equipment – spread capital costs across multiple businesses while building collective resilience to weather-related yield losses. Similarly, investment in commercial deer carcass processing infrastructure, including improved Approved Game Handling Establishments (AGHEs), could support the economic viability of deer management, which delivers biodiversity, habitat restoration, and natural flood risk management benefits alongside commercial returns. Where shared infrastructure generates both adaptation outcomes and commercial revenues across multiple beneficiaries, blended public-private financing is well suited and could be supported through existing rural development funding mechanisms (World Bank, 2019).
Finally, there are newer and more experimental models being developed, such as the use of Resilience Credits; summarised in Table 9. While conceptually similar to carbon credits, they are more challenging to operationalise due to the conceptual challenges of adaptation, such as avoided future losses and the local place-based context of adaptation and resilience.
Table 9: Examples of innovative models for private participation in agriculture, with cost recovery model. Source: Updated from Watkiss and England (2025).
|
Model |
Examples |
Cost recovery model |
|
Blended finance |
Many examples of public and private investment, e.g. World Bank (2019), Scottish Government Agri-Environment schemes |
User pays but can generate value addition through financial return (adaptation goods and services) |
|
Concessional Credit Lines (e.g. SNIB) |
Many examples of below-market loans and guarantees | |
|
Offtaker agreements / Supply chain finance |
AMRU Rice (McNally et al., 2024) | |
|
Ex-post proof sharing Warehouse receipt financing Value chain integration |
International Finance Corporation’s (IFC’s) Global Warehouse Finance Program (IFC, n.d.) | |
|
Digital platforms (weather and advisory |
GeoKrishi (GeoKrishi, n.d.) | |
|
Resilience credits (reward investment in adaptation) |
IFAD (Puri and Chowdhury, 2023) | |
|
Seed value chain |
Tolerant seed multiplication (IFC, 2019) | |
|
PPPs for seed companies |
FAO public–private blended finance facility for climate-resilient rice landscapes (Damon, 2023) |
Communities
Key climate risks and adaptation opportunities
Flooding is the largest climate-driven threats to communities and the built environment in Scotland, with exposure increasing across riverine, coastal and surface water systems (SEPA, 2025). Surface water flooding is the most widespread form of flooding as more frequent extreme rainfall events are overwhelming drainage networks and intensifying surface water flooding. Approximately 400,000 properties are currently at risk from a 1-in-200-year flood event (SEPA, 2025). Flooding already costs Scotland an estimated £500m every year – and that figure will likely grow (SEPA, 2025). Beyond physical damage, flood events trigger persistent mental health impacts, particularly where households face prolonged displacement or repeated flooding. In addition, the burden falls disproportionately on socially vulnerable coastal, urban and rural communities (Sayers et al., 2018; Song et al., 2025). As climate change and population growth converge, exposure is projected to extend into areas with no historical flooding experience.
Addressing these risks requires a coordinated, forward-looking approach to spatial planning, infrastructure design and community-level adaptation. Key priorities identified by CCRA3 (2021) include stricter controls on development in flood-exposed areas, greater enforcement of Sustainable Drainage Systems (SuDS), wider uptake of Property Flood Resilience (PFR) measures, and better integration of natural flood management alongside traditional defences. CCRA3 (2021) also highlight improved flood forecasting, public warning systems and more targeted investment in vulnerable communities, alongside updated planning policies that embed climate-ready design principles. As surface water flooding is projected to increase under all climate scenarios, a strategic approach combining planning, infrastructure, social policy and community engagement will be critical to safeguarding people and places (Sniffer, 2021).
Current spending and context
Flood protection schemes
The Scottish Government has maintained a long-term baseline of £42m/yr for flood protection schemes since at least 2015/16, supplemented by a one-off top-up of £150m. Together this totals £570m invested in flood resilience over 2016–2026 (Scottish Government, 2024a; Scottish Government, 2025e). Local authorities also contribute to the cost of building major flood schemes. In the national ‘cycle 1’ scheme, it is estimated that the Scottish Government pays for 80% of the costs and local authorities pay for the remaining 20% of the costs. If costs increase after a specific point in the process, local authorities must pay for those increases. Local authorities also pay for ongoing maintenance once the flood schemes have been built (Audit Scotland, 2025).
Of the 40 flood protection schemes in ‘cycle 1’ (2016–2021) originally deemed eligible for funding, eight were subsequently abandoned and one was separated into a dedicated taskforce, leaving 31 viable schemes. As of early 2026, 21 of these have been completed. One is currently under construction, and a further six schemes are expected to have main construction contracts in place by March 2026. Three remain eligible for funding. However, projected costs across the programme have escalated significantly. For example, the Hawick scheme rose from £37.4m to £78.6m, Musselburgh from £8.9m to £106m, and Dumfries Whitesands from £18.9m to £68.6m (Internal Scottish Government Data – collected from local authorities in November 2024).
On average this investment has protected approximately 600 additional homes per year from flooding between 2016–2026 (Scottish Government, 2025e). However, climate change is exposing an estimated additional 3,000 properties to flood risk each year (SEPA, 2025), meaning that even if the flood protection scheme cycle was fully delivered, it would struggle to keep pace with the scale of need.
Property flood resilience
Property flood resilience (PFR) measures are an important complement to wider flood protection schemes, with particular suitability for managing surface water flooding (Pettit et al., 2020). PFR measures include resistance measures that prevent water entry and resilience measures that reduce damage and speed recovery. Currently, only a small share of Scotland’s flood protection budget is directed towards PFR, despite its potential to provide cost-effective protection for properties exposed to frequent flooding. JBA Risk Management (2025) identifies 4,679 PFR-eligible properties in Scotland with a payback period of 3–5 years, drawn from a wider total of 116,073 properties considering Great Britain, England, Wales and Scotland. However, this represents only a fraction of the likely need – at least 81,000 homes have been identified as suitable for PFR more broadly (Petitt et al., 2020). This figure predates SEPA’s updated flood risk assessment and may therefore underestimate current exposure. This suggests that the near-term investment requirement for properties where PFR is highly cost-effective is relatively modest and well-defined. However, the investment need across the broader pool of suitable properties is considerably less certain, requiring further research.
Capacity building
Climate Action Hubs, Adaptation Scotland, and Climate Ready Regions are the three main Scottish Government programmes delivering systemic capacity building for adaptation beyond infrastructure interventions. These programmes are intended to support communities, businesses, and public bodies to understand and respond to a wide range of climate hazards including flooding, heat, drought, sea level rise, and storms. The Adaptation Scotland Programme works across a broad range of sectors beyond communities. A proportion of Climate Action Hubs activity relates to mitigation rather than adaptation. In both cases, full budget allocations have been retained as spending cannot be reliably disaggregated between adaptation, mitigation, and other functions.
Drainage partnership funding – representing important capacity building at the catchment level – is included within adaptation cost estimates for the water sector and is not included here to avoid double-counting.
Adaptation investment need
This analysis focuses on flood risk management to assess climate adaptation investment needs for communities, covering flood protection schemes, property flood resilience (PFR), natural flood risk management, and wider capacity building. Some flood adaptation measures, such as improved hydrological modelling and early warning systems, have not been costed here and would add to the overall investment need. Other hazards affecting communities – including coastal erosion, drought, heatwaves and wind – fall outside the scope of this analysis and could be explored in further work.
Flood risk management entails a wide range of activities. Our research sought to cover expenditure across four main spending lines: (a) flood protection schemes, (b) property flood resilience (PFR), (c) natural flood risk management (implicitly included in the natural environment budget), and (d) wider capacity building.
This was challenging for two reasons: firstly, it was difficult to establish how Scotland’s current budget is allocated across these spending lines. Secondly, there was an absence of quantified targets or risk-tolerance levels against which investment needs could be scaled. For example, if the Scottish Government were to commit to protecting all high flood risk social housing, it would be possible to identify the number of eligible properties and estimate protection costs accordingly, but without such targets, scaling investment needs requires assumptions that introduce additional uncertainty. As a result, multiple complementary methods were used to assess investment need, with the caveat that there may be a small degree of double-counting between individual estimates. Estimating potential avoided losses from flood risk investment was also particularly challenging in this sector.
Flood protection schemes
To estimate future investment requirements for flood protection schemes, we take two approaches:
- We uplift the historic baseline funding of £42m/yr, in place from at least 2015/16 (Audit Scotland, 2025), using the ONS construction price index. This yields an estimated £63m/yr and a total projected requirement of £882m for the period 2026 to 2040 (Table 5).
- We take DEFRA flood protection commitments of £7.9bn for England between 2025 and 2035 (UK Government, 2025) and scale to Scotland based on dwelling stock. This yields an equivalent figure of £79m/yr, or £1,102m over 2026–2040. This value-transfer approach rests on assumptions of comparable housing stock, property type, and flood risk exposure with the wider UK and should be treated with appropriate caution.
Both figures are presented in Table 10 to reflect the inherent uncertainty in projecting long-term flood protection expenditure. Together, these approaches indicate an adaptation investment need for communities via flood protection schemes of £885m – £1,102m over the period 2026–2040.
Table 10: Property flood protection scheme climate adaptation estimates 2026–2040, assuming uplift of Scotland’s historic £42m/yr guaranteed spend for the historic Scottish budget scaled, and 10% of wider UK pledge to be proportionate to Scottish dwellings.
|
Flood protection schemes | |||
|---|---|---|---|
|
Historic Scottish budget scaled |
DEFRA pledge (Scotland equivalent) | ||
|
Cost p.a. (£m/yr) |
Total up to 2039/40 (£m) |
Cost p.a. (£m/yr) |
Total up to 2039/40 (£m) |
|
£63.2m/yr |
£885m |
£78.7m/yr |
£1,102m |
This estimate is likely conservative, as it captures only Scottish Government central funding. Local authorities also contribute toward flood protection investment. For example, within ‘cycle 1’ local authorities contributed an estimated 20% of the investment need and the cost of maintenance (Audit Scotland, 2025).
Property flood resilience
Investment need for property flood resilience (PFR) was estimated by applying unit costs from JBA Risk Management (2025) to the 4,679 PFR-eligible properties in Scotland identified as having a payback period of approximately 3–5 years. This focus on properties with the strongest return on investment reduces the risk of double-counting with the wider flood protection budget, while reflecting the economic case for targeted intervention. Unit costs of approximately £2,250 per property for limited PFR measures (e.g., temporary flood barriers for doors, air brick covers, toilet bungs) and £11,000 for standard measures (e.g., permanent flood doors, extensive waterproofing / re-pointing of external walls) were applied accordingly.
By multiplying the average cost per property for limited measures (£2,250) and for standard measures (£11,000) by properties eligible with a short payback period (4,679 properties), calculations indicate an adaptation investment need for communities via property flood resilience measures of £10.5m – £51.5m over the period 2026–2040, equivalent to £0.75m/yr – £3.68m/yr (Table 11).
Table 11: Property flood resilience climate adaptation investment need where payback time is likely approximately 5 years, using JBA Risk Management (2025) data
|
Property flood resilience | |||
|---|---|---|---|
|
Limited measures |
Standard measures | ||
|
Cost p.a. (£m/yr) |
Total up to 2039/40 (£m) |
Cost p.a. (£m/yr) |
Total up to 2039/40 (£m) |
|
£0.75m/yr |
£10.5m |
£3.68m/yr |
£51.5m |
The economic case for investment is reinforced by JBA Risk Management (2025) analysis of Annual Average Losses (AAL), which indicates that delivering standard PFR measures across all 4,679 eligible properties could reduce AAL from £22.8m to £11.1m – a saving of £11.7m per year, suggesting the full cost of standard intervention would be recovered through avoided flood damages within approximately five years.
Capacity building activities
Capacity building investment need was estimated by reviewing expected funding pathways for three programmes, in consultation with Scottish Government policy teams. Climate Action Hubs are estimated at £6m/yr (£84m to 2039/40); Adaptation Scotland at £0.4m/yr (£6m to 2039/40); and Climate Ready Regions at £0.55m/yr rising to £0.9m/yr between 2026 and 2029, remaining at £0.9m/yr through to 2039/40 (£12m to 2039/40). Case study 2 highlights one of the Climate Ready regions funded initiatives. Furthermore, it should be noted that capacity building investment need spans risks beyond flooding – including storms, drought, wildfires, and heatwaves – and encompasses some capacity building for climate mitigation that could not be disentangled from adaptation spend. Together, our calculations indicate adaptation investment need for communities via capacity building amount to £102m between 2026–2040 (Table 12).
Table 12: Estimated climate adaptation investment need for capacity building activities within the communities’ sector between 2026–2040. Costs in 2026/27 prices.
|
Capacity building activities | ||
|---|---|---|
|
Standard measures | ||
|
Action |
Cost p.a. (£m/yr) |
Total up to 2039/40 (£m) |
|
Climate action hubs |
£6m/yr |
£84m |
|
Adaptation Scotland |
£0.4m/yr |
£6m |
|
Climate ready regions |
£0.55m – £0.9m/yr |
£12m |
|
Total: |
£102m | |
These figures assume current spending levels, increasing nominally, are sufficient to meet future adaptation capacity building needs – an assumption that may warrant revisiting as Scotland’s adaptation requirements become better understood.
Case Study 2: University of Strathclyde Raingarden Parklet Case Study
The Raingarden Parklet, led by Hope in Place CIC and supported by Civic, is an innovative piece of green urban infrastructure designed, created, and built in Glasgow. It represents a new approach to sustainable urban drainage systems (SuDs). It aims to reduce peak run off during intense rainfall. while simultaneously creating social value through education, training, and pathways into green jobs.
The modular unit measures 4.5m × 1.5m × 1.2m and costs approximately £10,000 to design and manufacture. The University of Strathclyde secured £15,000 through Climate Ready Regions funding via Climate Ready Clyde, covering the parklet and a proportion of the £15,000 – £20,000 installation costs.
The final location outside the Andersonian Library was selected through stakeholder consultation against criteria including flood risk, footfall, and connection to local drainage infrastructure. It demonstrates what can be achieved in a single car parking space and offering a visible symbol of Glasgow’s shift towards greener, healthier streets.
Beyond flood resilience, the pilot delivers co-benefits across public realm enhancement, green skills and employment, and justice system reform. The parklet was constructed in HMP Barlinnie using recycled materials, with profits funding a training pathway towards a ‘Green Skills Factory’ at the new HMP Glasgow and the project fostering broader community-university collaboration. This has the potential to act as a catalyst for further investment in modular, scalable adaptation solutions that deliver integrated benefits for society, the environment, and the economy.

Example of a raingarden parklet. Image credit: Ben Raw.
Total adaptation investment need for communities through flood measures.
In total, the adaptation investment need estimate for communities – focusing predominantly on flood management – is £997.5m – £1,256m between 2026–2040, equivalent to £71.2m/yr – £89.7m/yr (Table 13).
Table 13: Estimated climate adaptation investment need for flood protection schemes, property flood resilience and capacity building between 2026 – 2040. 2026/27 prices.
|
Sub-sector |
Cost p.a. (£m/yr) |
Total up to 2039/40 (£m) |
|---|---|---|
|
Flood protection schemes |
£63.2 – £78.7m/yr |
£885 – £1,102m |
|
Property flood resilience |
£0.75 – £3.68m/yr |
£10.5 – £52m |
|
Capacity building |
Approx. £7.29m/yr |
£102m |
|
Total |
£71.2 – £89.7m/yr |
£997.5 – £1,256m |
Macroeconomic effects and wider impacts
Macroeconomic impacts
The communities sector adaptation package, covering regional hubs, property flood resilience and flood protection schemes, amounts to around £978m between 2026 and 2040, approximately £65m/yr. This is slightly lower than the figures quoted in section 4.2.3.4 because of rounding and the pricing being in different years.
Without cost recovery (a modelling device to isolate the spending effect): By 2040, Construction records an output gain of £38m and roughly 575 jobs, while architectural services and “all other services” add £9m in output and 120 jobs. Modest positive impacts appear in wholesale and retail trade, fabricated metals, manufacturing and primary sectors, reflecting supply-chain linkages. The overall effect is a modest but broadly positive local economic boost centred on construction, professional services and local services.
With “government pays” cost recovery (a stylised scenario): When the Scottish Government recovers costs through higher income tax, construction retains most of its gains, recording £35m in output and around 530 jobs. Architectural services and supply-chain activities such as fabricated metals and steel also remain positive. However, consumer-facing sectors reverse direction. Retail (excluding vehicles) shifts from a £1.7m gain and 36 jobs in the no-recovery case to a £2.8m loss and 59 fewer jobs once taxes rise. Similarly, “all other services” flips from an £8.6m gain and 114 jobs to a £15m loss and 187 fewer jobs. Financial services, travel, transport, manufacturing and energy sectors also turn negative as squeezed household incomes reduce demand. In simple terms, higher income taxes reduce disposable incomes, which reduces consumer spending, putting pressure on retail, hospitality and service jobs.
Policy implications: Even relatively modest adaptation programmes provide meaningful local benefits in construction and professional services. However, income-tax recovery dampens broader gains: it is more progressive than raising prices for essential goods, but it still reduces household budgets and activity in consumer-facing sectors. Policymakers need to weigh these short-term sectoral effects against the long-term flood protection and community resilience benefits.
Wider impacts
The economic case for adaptation investment in flood resilience for communities is strong. Defra estimates that every £1 spent on flood defences prevents around £8 in economic damage (UK Government, 2025). Furthermore, the expected annual cost of flooding impacts in Scotland is now approximately £260m/yr (Scottish Government, 2025e), with multi-hazard events, such as the associated flooding from 11 named storms between November 2015 and March 2016, negatively impacting the UK economy by 0.08% of GDP (Office for Budget Responsibility, 2024). Consequently, the potential avoided losses from sustained investment in flood protection schemes remain substantial. Note, further research is required to develop a full understanding of the wider co-benefits associated with investing in flood protection schemes, PFR and wider capacity building.
Current governance, funding and financing arrangements
Flood risk management is currently predominantly funded by the public sector as illustrated in Figure 7. This includes direct funding from Scottish government for schemes. Responsibilities are set out under the Flood Risk Management (Scotland) Act 2009. Most flood investment is provided by Scottish Government, who provide £42m/yr. However, this is provided at an intervention rate of 80%, with an additional 20% from local authorities from general ringfenced funding. Assuming this is spent, an additional £8.4m a year is provided by local authorities. Allocating the same percentage of private sector contribution (37%) as for transport, suggests that around £3.1m (37% of £8.4m) a year is contributed by households and businesses.
Some levels of PFR are funded by households, both domestically and through Flood Re’s Build Back Better scheme (a joint initiative between the UK insurance industry, see Innovation section, below), but this is relatively low. Details of the number of properties ceded to flood Re, or properties provided with PFR, are not publicly available. The Flood Re market study assumes around 500 – 550 residential properties a year going through (Borio and Kassian, 2023). This suggests around £540,000 a year in contributions, though both the Borio and Kassian (2023) study and Pettit et al. (2020) highlight most of these schemes are publicly funded or subsidised. Therefore, for the purposes of the study, we assume the total contribution to floods indirectly via Council Tax and Non-Domestic Rates to be roughly 7%.
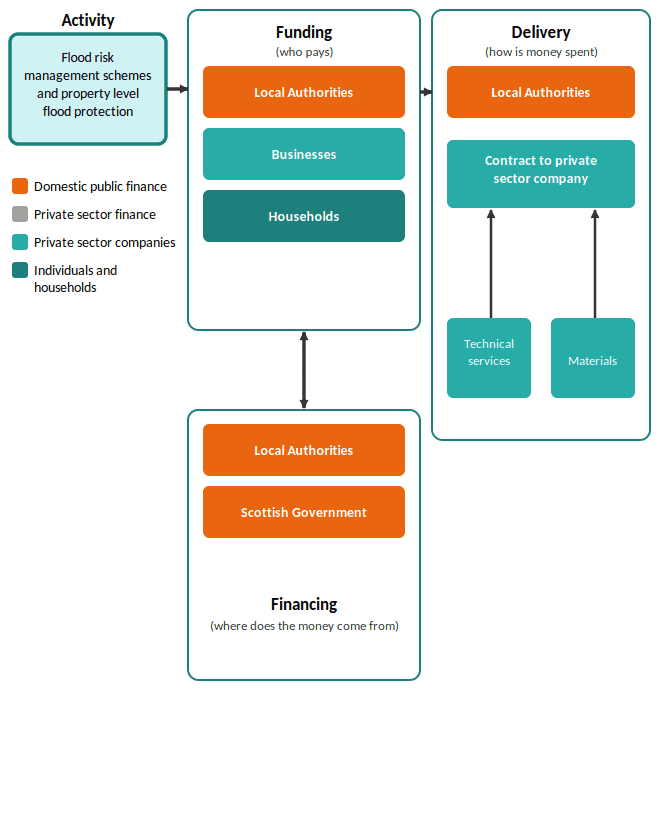
Figure 7: Financing, funding, and delivery arrangements for adaptation in flood protection schemes and property flood resilience.
Innovation that could boost private sector participation
Opportunities to leverage private investment in adapting to changing flood risk in Scotland could include:
Scotland Bond Issuance programme: Scottish Government is in the process of putting in place the mechanisms to facilitate the issuance of bonds, having obtained a credit rating and appointing banks and legal advisors (Scottish Government, 2026a). This has been used in the UK to provide upfront financing for Flood and Coastal Erosion Risk Management, with UK Government reporting on use of proceeds. Similar mechanisms could be used to provide a significant boost to available capital investment.
The FloodRe ‘build back better’ scheme: For communities impacted by flooding, it is likely their properties will be eligible for the FloodRe ‘build back better’ scheme, a joint initiative between the UK insurance industry and the UK Government, which offers householders the chance to install property flood resilience measures up to the value of £10,000 when repairing their properties after a flood (FloodRe, 2023). No data is currently published on use, but uptake is thought to be low.
Scotland’s current resilience organisations: These span Regional and Local Resilience Partnerships, Community Resilience Committees, and Category 1 and 2 responders (Brett et al., 2026). They represent a cost-effective foundation for building adaptation capacity without requiring entirely new delivery structures. Embedding adaptation within local authority contingency planners, local resilience partnerships, and community councils offers a pragmatic route to scaling capacity building across Scotland’s communities and institutions. Private sector organisations, particularly utility and transport operators operating as Category 2 responders, are well positioned to potentially contribute co-funding and expertise to this capacity building as part of their existing statutory obligations and business continuity responsibilities.
There are multiple opportunities to increase both private sector funding and financing. Financing opportunities relate to the use of a range of debt financing instruments, such as green bonds, to support adaptation. There have also been examples where development banks have provided commercial funds to help local authorities address fiscal space constraints. In addition, there have been some examples in England where the use of PPPs has been used to unlock private sector financing for flood defences. In a similar vein, Land Value Capture and Tax Increment Financing provides an option to unlock future revenue streams through increases in land value or development through investment in flood defences. Parametric insurance has also been used to provide upfront protection for coral reefs which serve as flood defences as well as payouts for recovery.
There are also schemes which encourage private sector funding (summarised in Table 14), such as direct contributions to flood risk management schemes. Evidence from the National Audit Office suggests that around 9% of total contributions to flood defences in England came from businesses (National Audit Office, 2023) – but also from more local schemes, such as the use of climate resilience districts or water funds. There is also the potential for the use of tourism taxes and levies, as well as dedicated levies for climate resilience, such as those in Greece or Italy (Venice). There are also models which leverage revenue streams from co-investment such as in the Netherlands where revenues from wind turbines have been used to partially fund dikes.
Table 14: Examples of innovative models for private participation in flood protection, with cost recovery model. Source: Authors, updated from Watkiss and England, 2025.
|
Model |
Examples |
Cost recovery model |
|
Green bonds / resilience bonds |
UK green bonds (gilts) include coastal projects (UK Debt Management Office, n.d.) European Bank for Reconstruction and Development climate resilience bonds (Bennett, 2019) |
Government pays |
|
Public Private Partnership (PPPs) |
UK Broadlands (Jacobs, n.d.) / US Fargo |
Mixed |
|
Parametric insurance |
Quintana Roo (Green Finance Institute, 2024a) |
User pays (public and private sources) |
|
Local water use charges or taxes |
Copenhagen Cloudburst (City of Copenhagen, 2012) |
User pays (local public and private) |
|
Land Value Capture / Tax Increment Financing |
Mission Rock Bhutan Phuentsholing Township Development (ADB, 2018) |
User pays |
|
Mitigation co-benefits |
RWE wind turbines on dikes, Netherlands (Windpowernl, 2022) |
Co-benefit streams – energy sales |
|
Private co-funding of flood defences |
UK Flood and Coastal Erosion Risk Management Strategy |
Business pays |
|
Increased private contribution to PFR |
UK assessment (Wood Environment & Infrastructure Solutions UK Limited, 2019) |
User pays (private) (Possible insurance benefit). |
|
Climate resilience districts |
US (California, Connetticut), |
Businesses pay |
|
Tourist taxes / Levies |
Hawaii (Jacobo, 2025), Venice, Greece |
User pays |
|
Concessional Finance |
National Wealth Fund, Wales |
Government pays |
Natural environment
Key climate risks and adaptation opportunities
Peatland
Scotland’s peatlands face serious and accelerating degradation from multiple climate pressures. Heavier rainfall increases erosion and carbon-rich sediment loss, while warmer, drier summers accelerate oxidation and peat loss – with degraded lowland peatlands already losing 1–2 cm of soil depth annually. Heightened wildfire risk adds further pressure, and many peatlands remain inadequately monitored, meaning the true extent of degradation may be underestimated. Climate risk is projected to rise from medium to high, with the potential for irreversible loss of peatland functions including carbon storage, biodiversity support and water regulation (Sniffer, 2021).
Reversing this degradation requires more comprehensive monitoring of peat condition, integrated land-use policies prioritising protection and restoration, and targeted guidance for land managers on re-wetting, water management and erosion prevention. Peatland adaptation must also align closely with mitigation strategies. For example, directing woodland expansion onto mineral soils rather than peat, and stress-testing net zero measures against future climate risks. Better research on climate impacts to carbon stores, more systematic soil carbon monitoring, and strategic cross-sector land-use planning across agriculture, forestry and coastal zones will be essential to safeguard water quality, flood regulation and the reliability of Scotland’s greenhouse gas projections as the climate shifts (Sniffer, 2021).
Forestry
Scotland’s forestry sector faces serious and interconnected climate threats (risks N6, N8 and N9 in CCRA3). Rising temperatures and increasing drought, particularly in central and eastern regions, are reducing growth rates, affecting timber quality and shifting species viability. Commercially important species such as Sitka spruce are losing ground to more drought-tolerant alternatives. Broadleaved species face severe stress from more frequent extreme weather. Warmer conditions are also accelerating the arrival and spread of pests, pathogens and invasive species, including Phytophthora ramorum, Dothistroma needle blight and bark beetles, compounded by increasing deer damage. Overall risk is projected to rise from medium to high under future warming, while potential opportunities from longer growing seasons and expanded species suitability remain largely unrealised due to adaptation barriers (Sniffer, 2021).
Building forestry resilience requires integrated action across several fronts. Strategic land-use planning must embed both adaptation and mitigation objectives, with clearer decisions about which forest types and locations remain viable as conditions change. Improved surveillance and biosecurity at ports of entry, better soil and water management, strengthened wildfire preparedness, and diversified woodland species and structures will all help spread risk and improve long-term productivity. Warmer temperatures do create opportunities for previously unsuitable species such as Douglas fir and fast-growing bioenergy trees, but realising these benefits requires deliberate research and field trials. Enhanced cross-sector coordination, better knowledge exchange with land managers, and targeted research into future-adapted management systems will be essential to maintain carbon storage, support Net Zero transitions, and preserve the ecological and economic value of Scotland’s woodlands as the climate shifts (Sniffer, 2021).
Nature restoration
There are also multiple adaptation opportunities within the nature restoration that align with wider biodiversity and carbon mitigation targets. Case study 3 outlines on-going research NatureScot is conducting to explore catchment scale nature restoration cost estimates.
Case study 3: Catchment scale nature restoration, NatureScot
Context
- NatureScot is working with SEPA, Scottish Water, FLS and Scottish Forestry to review and prioritise landscape / catchment scale nature restoration projects across Scotland (Scottish Biodiversity Strategy Action 2.1) and align this with SNAP3 objective NC2 on landscape scale approaches to climate adaptation and river basin management planning.
Preliminary cost estimates
NatureScot have started to estimate the costs of restoring catchments across Scotland and work is underway to refine these. Early in financial year 2026/27 they hope to have indicative costs for catchment scale restoration across Scotland, likely to be in the region of £5bn. Through 2026/27 they will develop a costed pipeline of projects out to 2045, refining the cost estimates at project scale to inform an Investment Plan for delivery.
Current methods use GIS analysis and cost assumptions based on existing projects. During 2026/27, the projects themselves will estimate costs to inform a more accurate cost estimate.
Key challenges and opportunities for climate adaptation at a catchment scale:
- Lack of evidence on the costs of natural flood management
- Lack of evidence to support quantification of benefits and to inform a business case
- Lack of long-term commitments to the funding streams that currently pay for restoration and insufficient funding for the scale of the challenge
- Immature nature finance market which is not yet delivering private investment at the scale required.
Current spending and context
Current Scottish Government spending includes specific investment in nature based climate solutions. For 2026/27, the Scottish Budget allocates £28m for peatland restoration, supporting the restoration of over 10,000 hectares of degraded peatland. A further £37m is committed to woodland creation, aimed at delivering more than 12,000 hectares of new woodland (Scottish Government, 2026b). In addition, £26m is allocated through the Climate Taxonomy for nature restoration activities, supporting wider ecological recovery and contributing to long-term climate adaptation and resilience objectives (Scottish Government, 2026c).
Adaptation investment need
Cost estimates for the natural environment draw on the Scottish Government’s draft Climate Change Plan (CCP) and Scottish Budget Climate Taxonomy (2026/27), with expert-elicited proportions assigned to reflect the share of costs attributable to adaptation. These proportions, 25% for peatland restoration, 6.25% for woodland creation, and 20% for wider nature restoration, were derived by examining the mixed objectives of each budget line and assigning a share to adaptation relative to co-benefits such as carbon mitigation, biodiversity gain, and flood alleviation. For peatland restoration, for example, carbon mitigation is the primary objective of the CCP spend, with flood reduction and biodiversity functioning as secondary objectives; the adaptation proportion reflects this hierarchy. These proportions were cross-checked through expert review with Paul Watkiss Associates, drawing on comparable apportionment approaches used in parallel Climate Change Committee analysis for England (Watkiss et al., 2026a). No uplift for increasing climate risk was applied to these estimates up to 2040. It should be noted that other relevant actions – including wildfire management and enhanced monitoring of peatland and woodland restoration – have not been costed here and would add to the overall investment need.
Peatland
Scotland’s draft CCP projects peatland restoration ramping up from approximately 15,400 ha/yr in 2026 to just over 22,500 ha/yr from 2030 onwards, totalling 319,489 ha by 2040, contributing toward the wider Scottish Government target of 400,000 ha of peatland restoration by 2040. Total peatland restoration costs were estimated using the draft CCP central estimate of £2,894/ha (capital and resource combined), assuming a mix of peat types restored across 2026 – 2040, with capital costs derived from Glenk et al. (2025) using 2022 grant data uplifted to current prices using ONS GDP deflators. Applied to the CCP’s restoration target, this yields a total cost of £925m (£66m/yr) in 2025/26 prices for 2026–2040. A 25% adaptation apportionment was applied on the basis that, while the off-site adaptation benefits of peatland restoration represent a relatively modest share of overall benefits, there are also meaningful on-site benefits to the peatlands themselves. The UK National Adaptation Plan similarly cites climate resilience as one of four core benefits of restoration (Watkiss et al., 2026a).
We estimate climate adaptation investment need for peatland restoration at £236m to 2040, equivalent to £16.8m/yr. It is important to note that peatland restoration costs are subject to considerable uncertainty, varying significantly by peat type, depth, location, site accessibility, and contracting arrangements. Okumah et al. (2019) report a median restoration cost of £1,009/ha, with a range of £3,707 between minimum and maximum estimates. Glenk et al. (2025) report costs ranging from £191/ha at the 5th percentile to £4,483/ha at the 95th percentile. This wide cost distribution means peatland restoration estimates should be treated with particular caution. Further research to better constrain unit costs would meaningfully improve the robustness of future investment needs assessments.
Woodland creation
Scotland’s draft CCP projects woodland creation ramping up from 12000 ha/yr in 2026 to 18,000 ha/yr from 2029 onwards, totalling 258,000 ha between 2026–2040. For woodland the study used the central estimates of total costs provided by the Scottish Government. These estimates include the total capital, maintenance and administration costs between Scottish Government and businesses at a total of £1,799m to 2040.
Apportioning a share of this expenditure to climate adaptation is not straightforward. The primary objective of woodland creation is carbon mitigation, and woodlands can in some cases increase certain climate risks. For example, this can be through disease spread, fallen trees from storms, and increased vegetation growth affecting critical infrastructure (e.g., Bebber et al., 2025; Network Rail Scotland, 2024). Identifying the adaptation-specific component therefore required an evidence-based approach.
To apportion a share of expenditure, we drew on the Economic and Natural Capital Assessment (ENCA) database to compare the economic value of flood control benefits delivered by woodland creation and peatland restoration, expressed in £/ha/yr. Flood control was the only comparable adaptation benefit available to us in consistent monetary terms across both habitat types. The evidence indicates that flood control benefits from woodland creation are approximately four times lower than those from peatland restoration per hectare (Broadmeadow et al., 2023; Morris and Camino, 2011). Having assigned a 25% adaptation apportionment to peatland restoration on this basis, we therefore applied a proportionally scaled figure of 6.25% to woodland creation. This apportionment was cross-checked through expert review with Paul Watkiss Associates.
We recognise that this approach captures only one dimension of adaptation value – flood control – and that other potential adaptation benefits of woodland creation, such as shade provision, slope stabilisation, and reduced surface runoff, are not reflected in the apportionment. This figure should therefore be treated as a conservative estimate and is identified as a priority area for further research and methodological development.
We estimate climate adaptation investment need for woodland creation at £8.2m per year or £115m between 2026–2040.
Nature restoration
Finally, there is an additional budget line in the Scottish Budget 2026/27 (Scottish Government, 2026b) relating to nature restoration. The Climate Taxonomy identifies a nature restoration budget line of £26m/year, relating to policy development and implementation to manage and restore Scotland’s biodiversity and landscapes. This also includes provision of the Nature Restoration Fund and continued commitment to the Central Scotland Green Network (Scottish Government, 2026c), at a consistent level of funding. By assessing the multiple objectives of nature restoration, we assume 20% of these benefits are related to adaptation. We estimate climate adaptation investment need for nature restoration at £5.2m/yr for a total of £73m between 2026–2040.
Total adaptation investment need for natural environment
We estimate climate adaptation investment need for peatland restoration, woodland creation and nature restoration at £16.8m/yr, £8.2m/yr and £5.3m/yr respectively, totalling £30.2m/yr, or approximately £423.8m between 2026–2040 (Table 15).
Table 15: Estimated climate adaptation investment need for peatland restoration, woodland creation and nature restoration between 2026–2040. These costs represent a proportion of the total spend from the Climate Change Plan or the Scottish Budget that is related to adaptation for woodland creation (6.25%), peatland restoration (25%) and nature restoration (20%) accordingly. In 2026/27 prices.
|
Sector |
% Apportionment |
Cost p.a. (£m/yr) |
Total up to 2039/40 (£m) |
|---|---|---|---|
|
Peatland restoration |
25% |
£16.8m/yr |
£236m |
|
Woodland creation |
6.25% |
£8.2m/yr |
£114.7m |
|
Nature restoration |
20% |
£5.2m/yr |
£73.1m |
|
Total |
£30.2m/yr |
£423.8m |
Macroeconomic effects and wider impacts
Macroeconomic impacts
For natural environment, we’ve modelled the total spending outlined in the Climate Change Plan and nature restoration budget (as opposed to the adaptation portion of £423.8m – see Section 4.3.3.4). This totals just over £3bn between 2026–2040, around £200m/yr.
Without cost recovery (a modelling device to isolate the spending effect): The programme generates substantial gains in “other primary” activities – forestry and land-use sectors – where output rises by around £92m and employment by roughly 1,050 jobs by 2040. Agriculture adds £1m in output and 14 jobs. Construction gains £11m in output and 170 jobs, while “all other services” contributes around £29m and 380 jobs. The overall effect is a broad-based but especially land-focused expansion, reflecting the labour-intensive and locally embedded nature of restoration activities.
With “government pays” via expenditure cuts in all areas (a stylised scenario): When costs are recovered through public spending cuts, widespread reversals occur, particularly in service sectors. “All other services” shifts from a gain of £29m and nearly 380 jobs to a loss of roughly £102m and around 1,300 jobs. Education moves from a gain of £2.8m and 60 jobs to a loss of nearly £25m and over 520 jobs. Public administration records a decline of about £43m and nearly 480 jobs. Retail, financial services and transport flip from modest gains to losses. Even the core land-use sectors are affected: “Other primary” moves from a gain of around £92m to a small loss, and construction swings from a gain of £11m and 170 jobs to a loss of around £14m and 200 jobs. Manufacturing gains are largely erased. The aggregate effect under income-tax funding is contractionary by 2040, meaning that while restoration work still channels activity into land-use sectors, the broader economic impact turns negative once cost recovery is factored in.
Policy implications: Land-based adaptation can boost rural employment and supply chains significantly, but spending-cut recovery creates widespread service-sector losses that outweigh the direct stimulus. This highlights an acute trade-off between using spending cut and preserving activity in consumption-dependent and public-service sectors. The results exclude long-term ecosystem, carbon sequestration, flood risk reduction and recreation benefits, which are particularly important for Scotland’s climate and biodiversity goals.
Wider impacts
Woodland creation and peatland restoration generate multiple co-benefits beyond direct climate adaptation. These include carbon storage, biodiversity gain, water quality improvement, air quality, temperature regulation, flood regulation, recreation, and physical health. Resource constraints prevented a comprehensive review of all co-benefits; however, we have estimated the value of a selected range, assuming that the peatland restoration and woodland creation targets for 2026 –2040 set out in the draft CCP (see section 4.3.3) are successfully completed, to current climate resilience standards, and established by 2050.
Should the 319,488 ha of peatland targeted under the draft CCP be successfully restored between 2026 and 2040, this could generate approximately £267m/yr in flood control and storm buffering benefits, £191m/yr in water quality benefits, and £199m/yr in biodiversity benefits (Table 16).
Should the 258,000 ha of woodland targeted for creation between 2026 and 2040 be successfully established to climate-resilient standards, a range of co-benefits could be realised by 2050, once the woodland has had time to develop. These include flood storage (£29m/yr–£54m/yr), recreation and health benefits (£383m/yr), biodiversity benefits (£46m/yr), and avoided mental health costs (£48m/yr) (Table 16).
These figures carry considerable uncertainty, reflecting both the pace of establishment and the assumptions underpinning each co-benefit category. They nonetheless demonstrate that the economic case for woodland creation as a climate adaptation investment strengthens substantially when co-benefits are considered. It also demonstrates that the investment need estimates presented above likely understate the full economic value of this expenditure.
Table 16 Estimated value of a range of co-benefits (£m/yr) for 258,000ha of established woodland, and 319,488ha of established peatland restoration in 2026/27 prices.
|
Sub-sector |
Co-benefit |
Total benefits (£m/yr) |
Source |
|---|---|---|---|
|
Woodland creation |
Flood storage |
£29m/yr – £54m/yr |
Broadmeadow et al. 2023 |
|
Additional recreation and health |
£391m/yr |
Scarpa, 2003 | |
|
Biodiversity |
£46m/yr |
Willis et al., 2003 | |
|
Avoided mental health costs |
£50m/yr |
Shanahan et al., 2016 | |
|
Peatland restoration |
Flood control and storm buffering |
£267m/yr |
Morris and Camino, 2011 |
|
Water quality |
£191m/yr |
Morris and Camino, 2011 | |
|
Biodiversity |
£199m/yr |
Morris and Camino, 2011 |
Current governance, funding and financing arrangements
Peatland restoration
To deliver the Scottish Government targets for peatland restoration, Scottish Government funds five delivery partners to undertake peatland restoration to meet these targets: NatureScot, Loch Lomond and Trossachs National Park Authority, Cairngorms National Park Authority, Forestry and Land Scotland and Scottish Water seen in Figure 8 (Scottish Government 2023a). There have been some elements to crowd fund in private sector finance but for now this investment is presumed to be purely public. Beyond public funding, there has been minimal investment in peatland restoration from private sources to date, including through voluntary carbon markets (Scottish Government, 2023a).
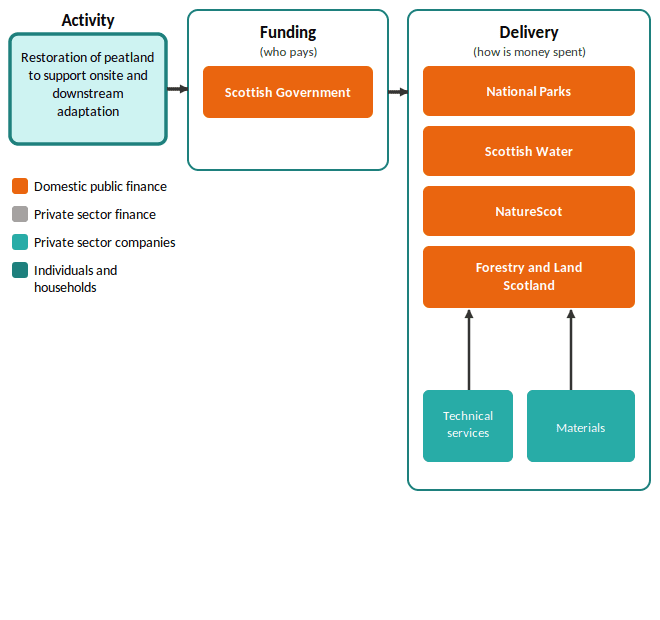
Figure 8: Financing, funding, and delivery arrangements for adaptation in peatland restoration. Adapted from Paul Watkiss Associates.
Woodland creation
The governance landscape for woodland creation is complicated, summarised in Figure 9. It is overseen and delivered by two executive agencies – Scottish Forestry and Forest and Land Scotland. Scottish Forestry is the government agency responsible for forestry policy, regulation and grant schemes. Forestry and Land Scotland are the operational land-management agency for the forest estate. However, much planting occurs on private land and for commercial purposes. Investment in new woodland creation is supported by grants through the Forestry Grant Scheme. This supports the creation of new woodland, as well as management of existing woodlands and investments in forest infrastructure such as protection.
An evaluation of the previous phase of the Forestry Grant Scheme for Scotland highlighted that the grants are unlikely to cover the total cost of the investment (Scottish Forestry, 2025). This means there will be residual costs associated with long term management and felling that will need to be met by the private sector. However, there is no data on the proportion of this investment. Given this, we have not been able to generate reliable investments in the split of public and private sector investment in adaptation. The governance arrangements for nature restoration more broadly have not been mapped in detail due to the limited resources for the study.
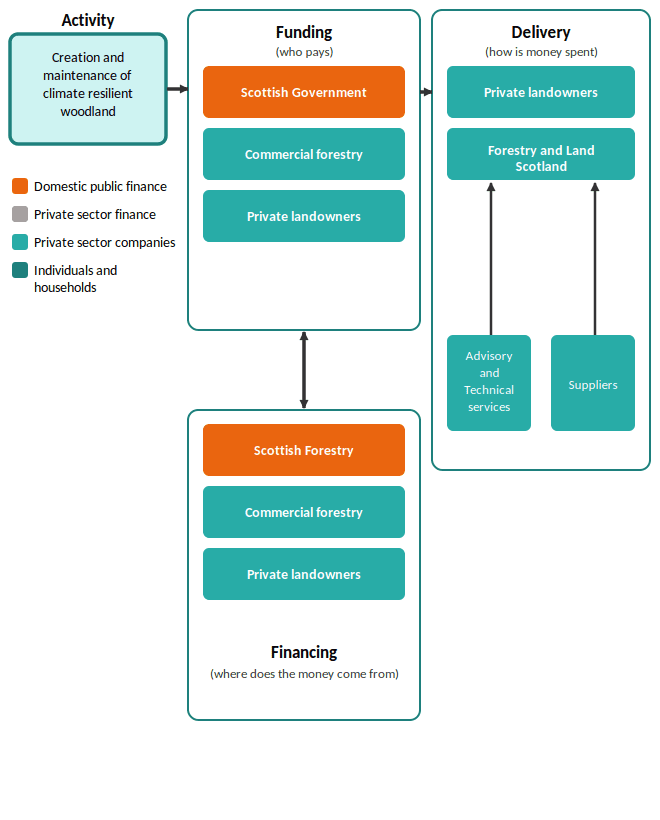
Figure 9: Financing, funding, and delivery arrangements for adaptation in woodland creation.
Innovation that could boost private sector participation
While nature and ecosystems have broadly public characteristics, there are a range of mechanisms (see Table 17) that can support private sector involvement in adaptation and provision of ecosystem services.
The first cluster relate to the benefits derived from ecosystems. These include dedicated payment for ecosystem services schemes, but also carbon and biodiversity credits, or for loss reduction, noting that these are co-benefits and that the locations of planting need to coincide with those needed for risk reduction, and that in such schemes the revenues are too small and benefits arise (Watkiss and Hunt, 2024; England et al., 2025). The Scottish Government, NatureScot and SEPA are supporting CreditNature, selected through the CivTech innovation accelerator, to develop a voluntary biodiversity credit market for Scotland. This will be guided by the British Standards Institute’s Nature Investment Standards programme and the Scottish Government’s Natural Capital Markets Framework (Scottish Government, 2023b; Scottish Government, 2024b; NatureScot, 2026). Similarly, in England, the introduction of Biodiversity net gain is also supporting the development of a market and is beginning to unlock new investment in ecosystem restoration (e.g. Avon Needs Trees).
There are some examples of private and corporate investment. Philanthropic investment has included around £50m over three years for rewilding across privately managed Scottish estates (BBC, 2019). Diageo has committed up to £5m over five years to restore up to 3,000 hectares of degraded peatland by 2030 – illustrating how businesses with supply chain dependencies on healthy ecosystems can become adaptation co-funders (Diageo, 2026). However, these are likely to be relatively modest and opportunistic.
A second cluster relates to investment based on sustainability outcomes, whereby the terms of financing are preferential based on the impact. This includes payment for ecosystem services, sustainability linked loans, as well as direct investments in nature-positive businesses and redeemable equity. There have been efforts by the Scottish National Investment Bank to provide concessional credit lines to support. For example, the SNIB recently provided a £50m cornerstone investment to the Gresham House Forestry Fund, 60% of which will be invested in Scotland, and which includes commitment to climate resilience (Scottish National Investment Bank, 2026).
Finally, there are also a cluster of insurance-based innovations. For example, in Colombia, the City of Bogota has extended previous work by The Nature Conservancy (TNC) on Water Funds. This provides a proactive fund where beneficiaries pay into funds which support proactive risk reduction as well as offering parametric insurance for response and recovery. In Mexico, the Quintana Roo coral reef scheme sees local businesses and tourists paying in alongside government to support reef protection and receive parametric insurance. In addition, the NATURANCE and PIISA Horizon Europe projects examining how disaster risk financing can be combined with nature-based solutions to develop scalable insurance products (Climate-ADAPT, 2026).
Table 17: Examples of innovative models for private participation in natural environment, with cost recovery model. Source: Authors, updated from Watkiss and England, 2025.
|
Model |
Examples |
Cost recovery model |
|
Anticipatory parametric insurance for damage reduction |
Paramos Wildfire Facility, Colombia |
User pays |
|
Blockchain carbon credits for ecosystem services |
AirEco (Indonesia) (SEED, n.d.) |
User pays |
|
Online platform with blockchain tokens, and enhanced Monitoring, Reporting, and Verification |
Global Mangrove Trust (Thailand) (SEED, 2018) |
User pays |
|
Voluntary carbon markets (with NbS projects) |
REDD+ examples, such as Mai Ndombe REDD+ project (Democratic Republic of Congo) and Lariba REDD+ project (Zimbabwe) Reforestation/afforestation projects such as CommuniTree Carbon Program (Nicaragua) Regenerative agriculture projects such as Nature Carbon (Cerrado Biome) (Brazil) |
Private sector pays |
|
Biodiversity credits/offsets |
Ambatovy Minerals Project (Madagascar) (World Bank Group, 2016) Lom Pangar Hydropower Project (Cameroon) Savimbo (Colombia, Colombian Amazon) (Dasgupta, 2024) WWF Pilot Projects (Tanzania) (WWF, n.d.) |
Private sector pays but can generate value addition through financial return |
|
Payment for Loss Reduction |
Restoration Insurance Service Company (RISCO) (Philippines, Mexico, Brazil, Malaysia) – mangroves (CPI, n.d.) |
User pays |
|
Sustainability premium and traceability app |
Monsoon Tea Company (Thailand) (GSMA, 2024) |
User pays |
|
Investment fund for nature-positive businesses |
Tropical Resilience Fund (Africa, Latin America, East/Southeast Asia) (Global Innovation Lab for Climate Finance, n.d., a) |
Private sector pays |
|
Payment for ecosystem services |
The Nature Conservancy (TNC) Water Funds Portfolio (TNC, 2024) BIOFIN – capacity building in identifying and implementing relevant ecosystem services payments (BIOFIN, 2024a) Forest Resilience Bond (California, US) (Green Finance Institute, 2024b) UN-REDD Programme Initiatives |
User pays |
|
Sustainability Linked Loans |
ING’s Nature Framework and SLLs (Europe) (ING, 2025) |
User pays |
|
Direct investment in NbS-generating businesses/ projects (equity-based) |
Cacao Oro de Nicaragua (sustainable agroforestry for cacao production) (GIZ, 2023) African Conservation and Communities Tourism (ACCT) Fund (eco-tourism supporting conservation) (GIZ, 2023) |
User pays |
|
Impact bonds (e.g. conservation impact bonds) |
Deshkan Ziibi Conservation Impact Bond (DZCIB) (Canada) (Arjaliès, 2024) |
Government or philanthropic organization pays |
|
Blended Finance for NbS |
SNIB FORESTRY Amazon Biodiversity Fund (Brazil) (Ivory, 2025) Tropical Forest Forever Facility (Brazil/World Bank) (weADAPT 2025) |
Consumer/end user pays and gets access to better services, cost savings, or enhanced ecosystem benefits. |
|
Redeemable equity |
Regenera Ventures Fund (Mexico) (Brasil-Leigh et al., 2024) |
User pays |
|
Certification and Standardization |
Certification of NbS portfolios (Morocco, Senegal) (GEF, 2021) |
Government and businesses pay |
|
Insurance and risk-transfer mechanisms |
Quintana Roo Coral Reef Insurance (Mexico) (GIZ, 2023) |
Consumers pay via tourism, and taxpayers via government, while benefiting from public goods – tourism assets, reduced disaster risk, and ecosystem health. |
|
Platform / ecosystem development |
SCALE (global) |
Government pays |
Transport
Key climate risks and adaptation opportunities
Road networks
Scotland’s road network faces a complex and intensifying set of climate-driven pressures threatening long-term reliability, safety and connectivity. More intense rainfall is accelerating surface water flooding, overwhelming drainage systems and causing recurring closures on trunk and local roads alike. In upland and rural areas, where single-access routes are common, even short-lived disruptions can isolate communities and disrupt supply chains. Saturated soils and steep topography are heightening landslide risk, most visible along routes such as the A83 at the Rest and Be Thankful, where repeated slope failures have led to long detours and escalating maintenance costs. Extreme temperatures add further stress, damaging pavements and bridges in summer while winter storms bring wind hazards, fallen debris and ice-related disruption (Sniffer, 2021).
Strengthening resilience will require a more strategic, forward-looking approach to maintenance, planning and design. Key priorities include identifying road corridors most vulnerable to flooding and slope failure, scaling up green-blue infrastructure and Sustainable Drainage Systems, improving drainage capacity, and applying soft-engineering approaches such as vegetation management to stabilise slopes. Better condition monitoring, data sharing and early-warning systems for rainfall, wind and landslide risk can support more proactive hazard management. For new infrastructure, mainstreaming climate adaptation into design standards will be essential to avoid costly retrofits, while stronger resilience indicators and more consistent climate risk assessment across local road authorities will be critical to closing Scotland’s current adaptation gap (Sniffer, 2021).
Rail networks
Scotland’s rail network, spanning over 1,700 miles and 360 stations across diverse and challenging terrain, is already experiencing the impacts of a changing climate, with risks projected to intensify over the coming decades (Network Rail Scotland, 2024). Observed changes include warmer average temperatures, altered rainfall patterns, and an increase in the frequency and severity of extreme weather events.
More intense and prolonged rainfall increases the likelihood of surface water and river flooding, as well as saturated ground conditions, contributing to earthwork instability. Embankments and cuttings, many of which are Victorian era assets, are becoming increasingly vulnerable to failure, leading to disruption, safety risk and higher maintenance demand. Storms and high winds continue to cause disruption through fallen trees, debris and damage to exposed assets, while coastal routes face longer term risks from erosion, sea level rise and increased wave action (Network Rail Scotland, 2024).
Higher temperatures are an emerging and growing risk, with hotter and more frequent heat events increasing the incidence of rail buckling, overhead line sag and emergency speed restrictions, affecting network performance and reliability (Network Rail Scotland, 2024).
Wind, flooding and snow are consistently the most disruptive and costly weather hazards on the Scottish network, with weather related disruption incurring significant Schedule 8 compensation costs (payments made to train operators following unplanned disruption) over the past decade (Network Rail, 2024). Around 90% of Network Rail assets are as they were when installed before the year 2000 and were not designed to contend with the more aggressive weather conditions now being experienced or forecast for the future under climate change (Network Rail, 2024).
Network Rail Scotland’s key adaptation priorities include delivering revised climate change risk assessments to identify future vulnerable locations, developing a long-term adaptation strategy using an adaptation pathways approach, and enhancing monitoring and assurance of resilience actions across the network (Network Rail Scotland, 2024).
In addition to spending on infrastructure, there may be some spending being undertaken on rolling stock companies (ROSCOs), but this is not available and therefore excluded from estimates of adaptation investment need.
Current spending and context
Specific information on the cost of climate proofing trunk roads and motorways within Scotland is currently not available. However, the Scottish Budget 2026/27 allocates approximately £82m to adaptation and resilience for trunk roads and motorways (Scottish Government, 2026c). This budget line covers trunk road adaptation schemes to improve network resilience to climate change and severe weather, casualty reduction measures, and Traffic Scotland operational commitments.
Furthermore, Network Rail Scotland has already spent £103.1m of primary resilience interventions to date in control period 7 2024–2029 (CP7). The largest shares have been directed at earthworks (£59.8m) and drainage (£27.7m), reflecting the priority placed on managing slope instability and flood risk across the network.
Adaptation investment need
Transport adaptation investment need was assessed across two sub-sectors: trunk roads and motorways, and rail. Other transport modes, including ferries, canals, aviation, and active travel, have not been included in this analysis and would add to the overall investment need.
Road networks
There is limited information regarding future investment need for climate adaptation on the road network. Strategic Transport Projects Review 2 (STPR2) estimates indicate a capital cost banding of £1bn – £2.5bn over the life of the review from 2022–2042 (Jacobs & AECOM, 2022), reflecting the anticipated scale of investment required to adapt the trunk road and motorway network to climate change. However, this figure was explicitly indicative rather than a precise cost estimate, based primarily on adaptation to flooding at highly exposed locations and not accounting for the full range of relevant climate hazards, including landslides, high winds, scour, and high temperatures. Transport Scotland anticipated that a dedicated Trunk Roads Climate Change Adaptation Plan would establish more robust costs in due course and does not consider the STPR2 figures sufficiently reliable for planning purposes.
To estimate adaptation investment need for trunk roads and motorways, we explored current Scottish Government budget lines with a neutral or positive adaptation influence were identified from the Scottish Budget 2026/27 and associated Climate Taxonomy (Scottish Government, 2026b; 2026c). The Transport Portfolio contains 15 budget lines associated with the Trunk Road Network, of which four, relating to network depreciation and PPP payments, were excluded as not relevant to climate adaptation, leaving 11 budget lines for analysis (Table 18).
Table 18: Budget lines from the Scottish Government Climate Taxonomy 2026/27 that we included in adaptation investment need analysis via exploring the additional ‘climate proofing’ spend or the whole budget.
|
Budget lines included in analysis |
2026/27 budget (£m) |
Climate proofing / whole budget |
|---|---|---|
|
Capital Land and works |
£223.26m |
Climate proofing |
|
Tay Road Bridge Capital Grant |
£3.09m |
Climate proofing |
|
Tay Road Bridge Resource Grant |
£2.2m |
Climate proofing |
|
Adaptation and resilience |
£82.32m |
Whole budget |
|
Bridge Strengthening and Repairs |
£149m |
Climate proofing |
|
Woodside Viaduct |
£23.7m |
Climate proofing |
|
Trunk Roads Structural Repairs |
£142m |
Climate proofing |
|
Routine and Winter Maintenance |
£172.34m |
Climate proofing |
|
Safety Camera |
£8.2m |
Climate proofing |
|
Other Trunk Road Expenditure |
£14.28m |
Climate proofing |
|
Road Safety |
£19.36m |
Climate proofing |
Two approaches were applied to these budget lines. For ten of the eleven lines, a climate-proofing uplift was applied to estimate the additional investment required to maintain network resilience under a changing climate. Uplift factors of 2.5% and 10%, representing the lower and upper bounds of the additional cost of climate-proofing infrastructure, were drawn from scaling factors in the Asian Development Bank (2014) and World Bank (2019). Crucially, the uplift itself – that is, the difference between the original and uplifted budget – represents the estimated additional spend attributable to climate-proofing, rather than the total uplifted budget. For the adaptation and resilience budget line, the full budget allocation was retained, as this line is wholly directed at adaptation activity.
Applying the climate proofing approach and budget lines outlined in Table 17, the estimated adaptation investment needed for trunk roads and motorways is between £101.2m–£158.06m/yr, amounting to approximately £1,417.52m–£2,212.82m over the period 2026–2040 (Table 19).
Table 19: Climate change adaptation investment need for trunk roads and motorways between 2026-2040. Presented in 2026/27 prices.
|
Transport (road) | ||
|---|---|---|
|
Period |
Lower estimate (2.5% uplift) (£m) |
Upper estimate (10% uplift) (£m) |
|
Total (2026– 2040) (£m) |
£1,417.52m |
£2,212.82m |
|
Total (2026–2040 p.a.) (£m/yr) |
£101.25m |
£158.06m |
Local road networks, maintained by local authorities rather than Transport Scotland, are not captured in this analysis. These represent an additional and likely material cost that is expected to grow as climate risk intensifies but fell beyond the scope of the present study. Several methodological limitations are also worth noting. Some budget line descriptions overlap, introducing a degree of potential double-counting (see supplementary data for more detail). The 2.5% and 10% uplift range is derived from international infrastructure literature and may not fully capture the specific risk profile of Scotland’s trunk road network. Applying a larger uplift – as some international studies have suggested may be appropriate for higher emissions scenarios – would yield considerably higher estimates, suggesting the figures presented here may be conservative.
These estimates were triangulated by scaling adaptation cost estimates from Neumann et al. (2025) to the Scottish context as an international benchmark. Neumann et al. (2025) estimated EU transport adaptation costs at approximately 0.04%–0.06% of GDP per year under moderate to high emissions scenarios. Applying this range to Scotland’s GDP yields an indicative figure of £90m – £142m/yr (2026/27 prices), which is broadly consistent with the trunk roads and motorways estimate presented above. However, this comparison should be treated with caution: the nature and projected intensification of climate hazards vary considerably across EU member states and diverges from Scotland’s risk profile in important respects. Furthermore, Neumann et al. (2025) does not provide a breakdown between road and rail spending, limiting the precision of this transfer. These figures were therefore used as an indicative benchmark to assess how our estimates compare at an international level, and are not included in our reported adaptation investment need figures.
Transport Scotland is also actively working to better understand the scale of investment needed for adapting trunk roads to be resilient to climate change. For example, they are developing the Vulnerable Locations Operational Group (VLOG) prioritisation tool to identify climate-vulnerable locations across the trunk road network and better constrain the costs of necessary upgrades and renewals (see case study 4). Consequently, the indicative adaptation investment estimates outlined in this report are expected to be further refined as this ongoing analysis matures.
Case Study 4: Vulnerable Locations Operational Group (VLOG) prioritisation tool
The Vulnerable Locations Operational Group (VLOG) prioritisation tool, developed by Transport Scotland, identifies which parts of Scotland’s trunk road network are most vulnerable to climate change and where investment is most needed. By bringing together asset information to assess exposure, sensitivity, and adaptive capacity, the tool provides a consistent, evidence-based approach to understanding climate risks and prioritising funding across the wide range of geotechnical and geometric challenges throughout Scotland’s network.
The tool uses a scoring and ranking system that evaluates locations against a range of factors including whole-life asset costs, effectiveness of risk reduction, environmental benefits, social impacts, and economic consequences of route disruption. This allows different locations and interventions to be compared fairly and transparently, with quality checks, peer review, and alignment with existing appraisal and business case processes built in to ensure decisions can be reviewed and approved through established governance structures.
Over time, the VLOG tool will help Transport Scotland baseline and monitor how climate-related risks evolve as projects progress and conditions change. For adaptation planning specifically, understanding which locations are most vulnerable and what interventions deliver the greatest risk reduction is essential for ensuring investment is targeted where it will have most impact – moving beyond reactive maintenance towards proactive, planned adaptation. Critically, the tool will enable more asset-based adaptation investment need estimates, moving beyond the indicative budget-line approach used in this report towards a robust, location-specific evidence base for future climate resilience planning across Scotland’s trunk road network.
Image: Example of VLOG prioritisation tool dashboard outlining climate-vulnerable sites.
Rail networks
Interpretation of Network Rail Scotland Investment estimates
The rail investment figures presented here represent indicative, scenario‑based estimates developed by Network Rail Scotland to explore the potential scale of climate adaptation investment required to maintain current levels of service and safety under future climate conditions.
The upper end of the range reflects a plausible future pathway that includes what are currently hypothetical transformational capital interventions at particularly vulnerable locations, which may or may not be required depending on how climate risks evolve over time, and how Network Rail chooses to sequence interventions that are required based on its adaptation pathways programme.
As with other sectors, the absence of agreed levels of service and climate risk‑tolerance targets means these figures are best understood as order‑of‑magnitude planning assumptions, intended to inform strategic discussion rather than define investment requirements.
Investment need estimates
Investment need estimates for the Scottish rail network were drawn directly from high-level analysis Network Rail Scotland’s internal climate adaptation assessment. This draws on climate-based modelling, expert judgement, and current spending patterns to project costs across two categories of spend: (a) operations, support, maintenance and renewals (OSMR), which covers the ongoing costs of maintaining a climate-resilient network; and (b) major capital interventions (MCI), which covers larger-scale infrastructure investment at vulnerable locations. Full details of the underlying methods, assumptions, and calculations are provided in Appendix B.
Total potential adaptation investment requirements for the Scottish rail network are estimated at between £113m–£338.1m/yr, amounting to £1,581.8m–£4,733.6m when operations, support, maintenance and renewals (OSMR) and major capital interventions (MCI) are included over the period 2026–2040 (all figures in 2026/27 prices) (Table 20). This spend would cover increased operational and maintenance activity in response to more frequent severe weather. Such activity includes additional seasonal treatment trains, emergency speed restrictions, and reactive repairs following weather-induced failures, targeted renewals to address accelerated asset degradation across drainage, earthworks, and track. At the upper end, it includes hypothetical transformational capital schemes at locations where incremental intervention alone cannot sustain current service levels, such as infrastructure re-alignment in response to coastal erosion.
The wide range between lower and upper bounds, particularly for MCI, reflects the inherent difficulty of projecting major capital requirements over long time horizons. Network Rail Scotland note that ongoing work under their Adaptation Pathways Programme is expected to narrow these ranges as vulnerable locations become better characterised. These figures represent one plausible investment scenario focused on continued service delivery; alternative investment scenarios could reasonably be explored.
Table 20: Estimated climate change adaptation investment need for Network Rail Scotland, 2026–2040, based on CP7 remaining spend, CP8 and CP9 allocations under a continued service scenario, and pro-rated 2039/40 spend. All figures uplifted to 2026/27 prices (assuming 2% nominal growth per annum) from 2023/24 base prices provided by Network Rail Scotland.
|
Transport (rail) | ||||
|---|---|---|---|---|
|
Operations, support, maintenance and renewals (OSMR) |
Operations, support, maintenance and renewals (OSMR) + major capital interventions (MCI) | |||
|
Period |
Lower estimate (£m) |
Upper estimate (£m) |
Lower estimate (£m) |
Upper estimate (£m) |
|
Total (£m) |
£998.2m |
£1,815.3m |
£1,581.8m |
£4,733.6m |
|
Total (£m/yr) |
£71.3m/yr |
£129.7m/yr |
£113m/yr |
£338.1m/yr |
Case Study 5: Extreme rainfall and landslides at the Falls of Cruachan
The Oban branch of the West Highland Line plays a vital role connecting rural communities around Oban with the rest of Scotland, running alongside the A85 trunk road through mountainous terrain with limited diversionary routes when disruption occurs. The Northwest Highlands are the wettest area of Great Britain. Parts of the railway line – particularly near the Falls of Cruachan – are highly susceptible to landslides due to prolonged heavy rainfall, steep topography, and proximity to unstable slopes. In December 2022, approximately 100 tonnes of material moved down Ben Cruachan’s slopes onto the railway and A85, caused by a blocked culvert overtopped during adverse weather.
Temporary repairs to reopen the railway, including slope stabilisation, signalling repairs, and new track, cost approximately £0.5m. A more permanent fix is now underway at a cost of £3m, encompassing drainage renewal, soil nailing, erosion protection, and lightweight catch fences. Control period 7* plans also include approximately £5m for ongoing vegetation removal and maintenance of the line’s stone signals, which date to 1882 and are approaching life expiry.
Further investment will be required in later years to provide a longer-term solution as increasing frequency of adverse weather events heightens landslide risk. Network Rail Scotland’s current view is that resilience work will combine low-to-medium capacity catch fences with modern instrumented barrier technology along the four-mile length. This is at an estimated cost of circa. £5m in CP8, alongside continued improvement of drainage asset maintenance to better manage water movement during heavy rainfall events. Longer-term options under consideration through Network Rail Scotland’s climate change adaptation pathways programme include a combination of nature-based solutions, such as enhanced vegetation management to stabilise slopes, alongside engineered interventions, reflecting a broader shift towards integrated, pathway-based approaches to managing climate risk on vulnerable parts of the network.
*A control period is Network Rail’s fixed five-year funding and planning cycle that sets budgets and outputs for the railway (e.g., CP7 1 April 2024 – 31 Mar 2029).
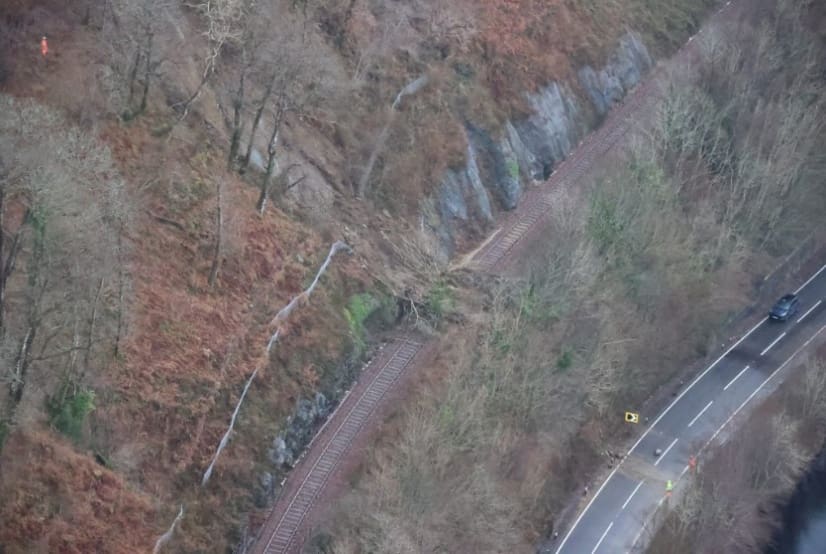
Image: Landslide over railway at Falls of Cruachan.
Macroeconomic effects and wider impacts
Macro-economic impacts
Trunk roads and motorways
For macroeconomic modelling we assume trunk roads and motorways require the adaptation investment between 2026–2040 of approximately £90m/yr. These have differing pricing years compared to section 4.4.3.1. This spending flows primarily to construction and wholesale/retail (vehicles), with significant additional activity in public administration, architectural services and a wide range of supply-chain sectors.
Without cost recovery (a modelling device to isolate the spending effect): By 2040, construction gains £12.7m in output and 191 jobs, while wholesale/retail (vehicles) adds £29m in output and 516 jobs. Supply-chain effects spread to fabricated metals, manufacturing, energy and primary sectors, and household consumption spillovers boost retail, financial and travel services. No major sector is worse off during the construction period; the programme delivers broad-based increases in output and employment across the economy.
With “government pays” cost recovery (a stylised scenario): When costs are recovered through higher income tax, the core delivery sectors retain net gains. Construction still adds £3.6m in output and 43 jobs, wholesale/retail (vehicles) retains £26.6m in output and 472 jobs, and public administration adds £5.5m and 55 jobs – because they remain central to the works. However, many consumer-facing sectors flip to losses. Retail (excluding vehicles) loses £3.7m in output and 88 jobs, while “all other services” records a loss of £24.3m and 385 jobs. Manufacturing and primary sectors similarly shift from gains to losses as higher income tax squeezes household spending and raises labour costs, reducing demand and competitiveness.
Policy implications: Without cost recovery, roads adaptation delivers a strong temporary stimulus across the economy. With income-tax funding, construction and vehicle-related sectors still gain, but many consumer and trade-exposed sectors lose activity and jobs. Policymakers must balance fiscal sustainability against these short-term economic effects and against the long-term resilience benefits of climate-ready road infrastructure.
Rail Network
Using the lower estimate for investment in operations, support, maintenance and renewals (OSMR) and major capital interventions (MCI), rail network climate adaptation requires approximately £100m/yr of investment from 2026–2040. The spending flows primarily to wholesale/retail (vehicles) for rolling stock maintenance and replacement, construction for network reinforcement, and public administration for programme management.
Without cost recovery (a modelling device to isolate the spending effect): The programme creates a demand stimulus that peaks at 0.5% GDP growth (around £100m) and 1,500 FTE jobs by 2040. The sectors delivering the works experience the largest gains, with positive spillovers to consumer services as higher household incomes boost spending. Prices rise only modestly as workers migrate to Scotland to meet labour demand, easing wage pressures. All sectors benefit or remain unaffected during the investment period, though these impacts fade roughly 15 years after spending ends.
With “government pays” cost recovery (a stylised scenario): When the Scottish Government recovers costs through higher income tax, the GDP and employment gains are largely eroded and turn temporarily negative in many sectors. Higher income tax reduces household disposable incomes, particularly for higher earners, dampening the consumption that drove much of the initial stimulus. At the same time, employers partly absorb the tax rise through wage bargaining, raising their production costs and pushing prices higher for longer, which weakens Scotland’s export competitiveness. The core delivery sectors – wholesale/retail (vehicles), construction, and public administration – retain smaller gains because they remain central to the works, but consumer-facing services such as “all other services” experience significant job and output losses.
Policy implications: Income-tax funding can protect long-term rail resilience, but it imposes short- to medium-term costs in terms of growth, employment and real incomes, particularly for higher-income households. Policymakers need to weigh these costs against the avoided disruption and economic losses from climate-damaged rail infrastructure.
Current governance, funding and financing arrangements
Road networks
Delivery arrangements for road infrastructure investment are shown in Figure 10, the majority of which is funded through the public sector. Transport Scotland pays for investment on the trunk road network and contracts a range of companies to ensure Scottish trunk roads are safe, efficient and well management (Transport Scotland n.d). This includes both maintenance contracts (provided by Amey and Bear Scotland), but also a range of Design, Build, Finance and Operations (DBFO) contracts. Local roads are managed by local authorities, who pay for investment in the local road network. Scottish Government (including Transport Scotland) spent £3bn on transport in 2023/24. Local Authorities spent £1.17bn in 2023/24 (Transport Scotland, 2025).
While all adaptation costs for the trunk road network are met from government, local costs are met by local government from a mix of sources. Local Government spent £27bn in 2024/25 from four sources of income. Excluding service income (which is ringfenced for uses such as early learning and childcare but not transport) the remaining £16bn came from Scottish Government grant (63%), council tax (18%) and non-domestic rates (19%) (Scottish Government, 2026d). Assuming that adaptation costs are evenly apportioned across funding sources, applying these shares to the relative share of the total investment, we estimate that private sector contributes around 10% of the costs of adaptation, split evenly between households and businesses.
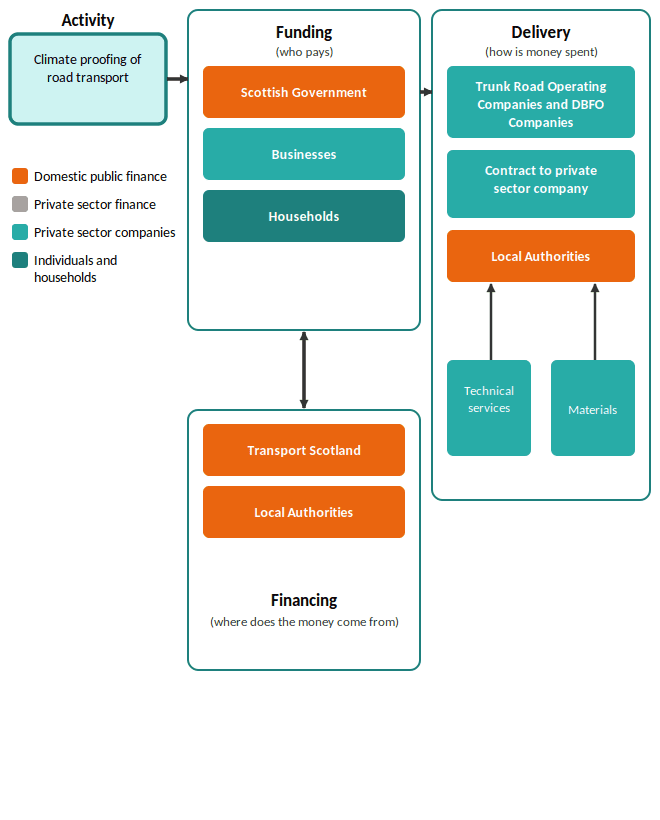
Figure 10: Financing, funding, and delivery arrangements for adaptation in road networks.
Rail networks
The rail sector is a complicated set of governance arrangements (summarised in Figure 11), since rail infrastructure, services and rolling stock are managed by separate organisations. Network Rail manages railway infrastructure. It generates a range of income from access charges, commercial income and an electricity for traction programme. The majority of rail services in Scotland are publicly provided by ScotRail through Scottish Rail Holdings Ltd (SRH Limited), an arm’s length company owned and controlled by Scottish Government (Transport Scotland, n.d), though other franchise operators (e.g. Avanti) run services serving the wider UK.
Whilst the study has not generated estimates of required adaptation spend for rolling stock, this is also important. Rolling stock is privately owned and leased from Rolling Stock Operating Companies (ROSCOs), who have invested over £20bn in rolling stock since 1995 (Mather, 2025). Payments are made from the train operating companies to ROSCOs for the lease of the stock – in 2024/25 these totalled about £2.7bn in the UK (Office of Road and Rail, 2025). Scotland intends to also continue securing financing for the stock, and a lease model (Scotrail, 2026).
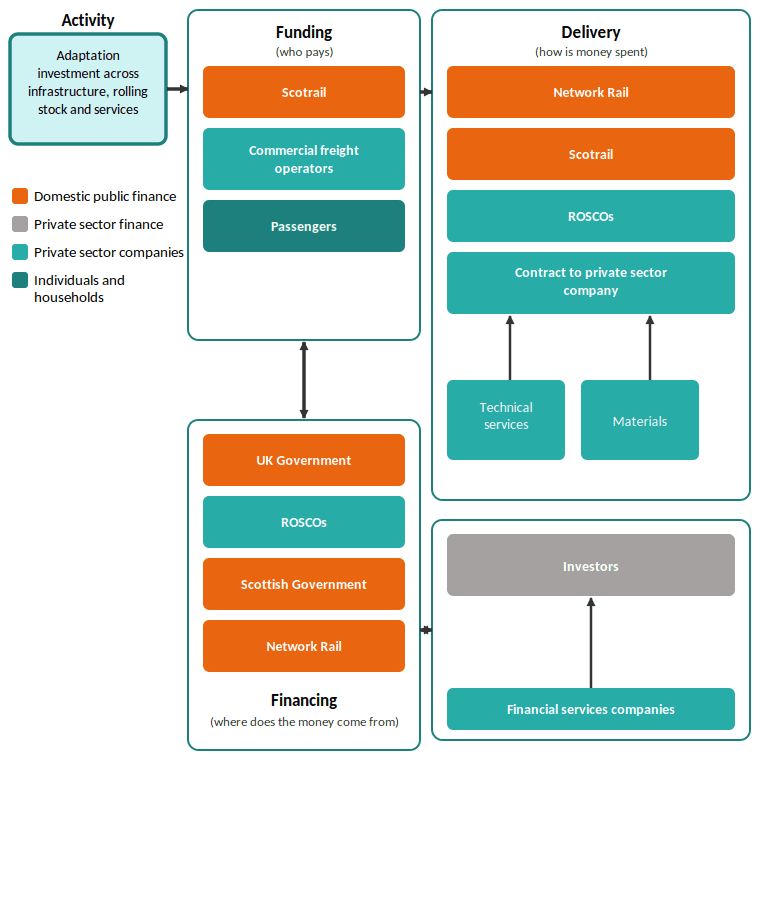
Figure 11: Financing, funding, and delivery arrangements for adaptation in the Scottish rail sector.
There are already significant efforts ongoing to consolidate the sector. The UK Government is bringing franchises into public ownership as contracts expire, it is consolidating track management and rail services under Great British Rail to provide overall coordination of track and timetable franchising under one guiding arm. All franchises are expected to be due back in public ownership by the end of 2027. Under this model, Scottish ministers will set a rail strategy for Scotland and fund GBR to provide Infrastructure in Scotland (Department for Transport, 2025), while ScotRail will continue to deliver services. The government expects the leasing of rolling stock from ROSCOs to continue where such investments offer value for money (Mather, K., 2025). Figure 11 represents the funding arrangements following this transition.
To provide an initial view on the split of funding for adaptation, the study used the aggregate income and expenditure for the UK Rail Sector for Scotland (ORR, 2025). This breaks down the relative total income from different sources for the overall sector, and the expenditure, excluding internal money flows. This shows that in 2024/25, government funding made up 66% of all rail sector income, with the remainder coming from passenger income (29.6%) and the remainder coming from industry (1.8%) and freight industry (2.8%). However, looking over time, there has been significant variation in this split, with 50% of income at one point coming from private income. At present, it is assumed Network Rail does not apportion or ringfence income, meaning that adaptation costs are assumed to be split between public and private sector in the same proportions.
Innovation that could boost private sector participation
For transport, road user charging, including city centre congestion charging and expanded parking zones, could generate revenues to help fund climate-resilient infrastructure upgrades. Toll financing on major road networks or adaptation projects offers a further avenue, with potential for private operators to contribute to or co-finance expensive resilience interventions in exchange for revenue streams from infrastructure users. Similarly, there is the potential to mainstream adaptation costs into rail ticket prices. This could be to fund maintenance but can also be blended into PPPs to provide support to capital investment.
There is also the potential to leverage wider infrastructure investment. SSEN Transmission’s commitment of over £200m to Highland roads and bridges demonstrates how major private infrastructure developers can contribute meaningfully to transport resilience as a condition of their wider operations (SSE, 2026).
Finally, there are a typical spread of debt financing models which could be used, such as the use of green bonds or sustainability linked loans. There also more innovative investment approaches such as Collective Investment Vehicles (CIVs), which enable diversification of risk and attract private capital for adaptation investments. One prominent example is the Urban Resilience Fund. Managed by Meridiam and supported by the Rockefeller Foundation, this is a €500m investment fund, split between Africa and OECD countries, and includes a €20m catalytic capital fund for project preparation. Other examples are given in Table 21.
Table 21: Examples of innovative models for private participation in Transport, with cost recovery model. Source: Authors, updated from Watkiss and England, 2025.
|
Model |
Examples |
Cost recovery model |
|
Collective Investment Vehicles |
Urban Resilience Fund, Meridam |
Government pays |
|
Climate-smart PPPs for Roads |
Kuala Lumpur Smart Tunnel, Malaysia |
Government pays |
|
Tolls |
World Bank PPP guidance |
User pays |
|
Hypothecated taxes (e.g. Congestion charging, road user charging) |
London |
User pays |
|
Climate Insurance-linked Infrastructure Financing |
Climate Insurance-Linked Resilient Infrastructure Financing (CILRIF) |
User pays |
|
Sustainability-linked bonds / debt finance |
Song and Medda, 2021 |
Government pays |
|
Climate resilience districts / Business Improvement districts |
US (California and Connetticut) |
Local businesses and households pay |
Water
Key climate risks and adaptation opportunities
Scotland’s water supply systems face increasing climate-driven pressures. Rising temperatures, shifting rainfall patterns and growing demand are placing new stresses on water resources (Sniffer, 2021). Projections indicate that under +2°C and +4°C scenarios, several regions could experience supply-demand deficits by mid-century (Scottish Water, 2024). Reservoirs in Scotland are increasingly vulnerable to extreme rainfall, high inflows and warmer temperatures, which can erode embankment integrity and reduce water quality. While current adaptation measures keep public water supply risk in the low category, more than half of Scotland’s population could be at risk of water scarcity by 2050 during very dry periods (Scottish Government, 2023c). River flooding currently affects 279 Scottish Water assets during frequent storm conditions, with a further 11 Scottish Water assets projected to face increased fluvial exposure beyond 2050. Surface water flood risk is also set to grow, with 8 Scottish Water assets at increased risk by 2050, rising to 171 by 2080 (Scottish Water, 2024).
The wastewater system faces similar pressures, with more intense rainfall driving sewer overflows, inundating treatment works and raising pollution risk (Sniffer, 2021). River flooding already affects 720 of Scottish Water’s wastewater assets during frequent storm conditions, with a further 194 projected to face increased fluvial exposure beyond 2050 (Scottish Water, 2024). Surface water flood risk is set to escalate further, from 65 wastewater assets at increased risk by 2050 to 463 by 2080 (Scottish Water, 2024).
Reducing these risks requires maintaining and strengthening Scotland’s proactive approach to water management through long-term, evidence-based investment. Future resilience will depend on integrating climate projections into reservoir inspection regimes, infrastructure planning and risk assessments, ensuring systems are designed for higher peak flows and more volatile conditions. Demand-side measures, including leakage control, metering and behavioural change, will be increasingly critical, as CCRA3 shows that only scenarios incorporating additional adaptation result in sustained supply-demand surpluses. For wastewater, targeted investment in flood-exposed sites, expansion of green-blue infrastructure, and upgrades integrating SUDs and nature-based solutions will be essential. A more systematic approach aligning water resource planning with climate risk modelling, alongside strategic catchment-wide thinking, will be critical to ensuring Scotland’s water systems remain robust and secure as climate pressures intensify (Sniffer, 2021).
Private water supplies (Lawson and Davies, 2025) serve approximately 3.5% of Scotland’s population, mostly in more remote rural areas. Risk to private supplies is less well understood, but they are likely to be particularly vulnerable to water scarcity events (DWQR, 2024). Requirements and effective measures to support climate resilient private water supplies are far less understood than public water systems, even though private water supplies are more vulnerable. At a supply-level, private water supply owners are responsible for investment to upgrade the system – and they are responsible for reporting issues such as water availability to their local authority. Private water supply owners may be eligible for a Scottish Government grant of up to £800 to improve their existing private water supply (mygov.scot, 2025), though this initiative is not focused on climate resilience. For example, a switch from surface to bore supply is considered to offer climate resilience (Rivington et al., 2020).
Climate adaptation in the water sector can also overlap with initiatives in the natural environment, particularly nature-based solutions aiming to slow run-off and increase water quality like the Loch Katrine programme (see case study 6).
Case Study 6: Loch Katrine Catchment Management, Scottish Water
Loch Katrine, located within the Loch Lomond and Trossachs National Park, is the primary source of drinking water for Glasgow. Climate modelling of key water quality parameters, under 2050 and 2080 scenarios, projects a deterioration in raw water quality beyond the treatment capacity of existing works, driven by the warmer, drier summers and more intense rainfall events associated with climate change. Without intervention, this trajectory would necessitate significant capital upgrades to Glasgow’s water treatment infrastructure.
Scottish Water, in partnership with long-term tenant Forestry and Land Scotland (FLS), has developed a 10-year Land Management Plan (LMP) for the 9,500-hectare Loch Katrine catchment, approved by Scottish Forestry in 2024 (Forestry and Land Scotland, 2023). Scottish Water will invest £11m across multiple investment periods in two core programmes: (1) 4,600 hectares of native woodland creation, largely through rewilding and natural regeneration, expanding woodland from the loch shores into higher elevations; (2) up to 2,000 hectares of peatland restoration and management – through rewetting, reprofiling, and encouraging sphagnum moss to restore the peatland’s capacity to retain water and slow surface runoff.
Peatland restoration receives co-funding through Peatland ACTION, the Scottish Government’s national programme backed by a £250m commitment to restore 250,000 hectares of peatland by 2030.
Image: Loch Katrine. Taken from Scottish Water: Loch Katrine Woodland Creation and Peatland Restoration – Scottish Water.
By stabilising soils and locking carbon into the landscape rather than allowing it to run off into the water environment, the catchment management measures aim to halt the modelled deterioration in raw water quality. Healthy woodland and functioning peatland slow surface runoff, reduce the volume of organic matter reaching the loch, and improve the resilience of the catchment to both drought and extreme rainfall. In doing so, the LMP is expected to offset the need for significant capital investment in treatment process upgrades that would otherwise be required, making it a proactive, nature-based alternative to reactive infrastructure expenditure. Beyond the water quality rationale, the LMP is projected to deliver over 700,000 tonnes of CO₂e sequestered over 60 years and a 40% improvement in biodiversity across the site (Scottish Water, 2026d).
Loch Katrine illustrates how proactive catchment management can function as a cost-effective climate adaptation strategy, deferring capital infrastructure costs while delivering carbon, biodiversity, and water quality co-benefits.
Current spending and context
We do not have specific information on Scottish Water’s current climate adaptation investment. However, several ongoing programmes demonstrate adaptation relevant investment. For example, Scottish Water is developing a major demand reduction programme in response to projected summer water shortages, including an estimated 260Ml/d deficit by 2050 under a 1-in-150-year drought scenario. A £1.8m domestic smart monitoring trial launched in Dundee in 2025 (2,300 monitors) is testing whether providing households with real time usage data can reduce consumption, with results expected in 2028 (Scottish Water, 2026b). This builds on a successful pilot with 3,000 business users in Inverness and Orkney and underpins a planned £60m national rollout of smart meters for 130,000 business customers (Scottish Water, 2026a). The rollout aims to achieve an 80Ml/d reduction by 2039 through reduced customer side leakage, improved network leakage detection, and behaviour change. These initiatives help reduce pressure on water resources during hotter, drier summers and strengthen overall system resilience.
Adaptation investment need
Investment need estimates were drawn from Scottish Water’s Strategic Review (SR)27 of Charges Business Plan (2027/28–2032/33) and associated technical appendix, combined with their longer-term indicative adaptation investment estimate of £2 – 5bn to 2050 (Scottish Water, 2026a; Scottish Water, 2026c). The portion of the longer-term estimate falling within the 2033–2040 research window was incorporated alongside the SR27 allocation. Note that 2026/27 is not included as these data were not available. Full details of these underlying methods, assumptions, and calculations can be found in Appendix C.
Total climate change adaptation investment requirements for Scottish Water over 2027– 2040 are estimated at between £82.1m – £189.7m per year, equivalent to £1,067.3m –£2,465.9m in 2026/27 prices (Table 22). We do not include 2026/27 as this information is not available. For SR27 (2027/28 – 2032/33), the lower estimate is £357.9m and upper estimate is £471.3m. This SR27 investment spans operational resilience (including standby generators at 52 sites to guard against storm-related power outages); asset resilience measures to address drought pressure on water supply and sewer flood risk from increasingly extreme rainfall; and catchment-scale transformation through pioneer catchment pilots and drainage partnerships. The upper estimate for SR27 also includes retained risks such as water quality and the water environment (Scottish Water, 2026a). Scottish Water has developed a long-term indicative adaptation investment estimate of £2 – 5bn to 2050. Deducting the SR27 allocation, the remaining estimate of required investment is distributed equally across annual periods from 2033/34 to 2049/50, with the portion falling within the research window (2033/34–2039/40) incorporated here.
The widening range between lower and upper adaptation estimates in later periods reflects the inherent uncertainty in projecting long-term adaptation investment need as climate risks intensify. It should also be noted that there is potential for some double counting with peatland-related climate adaptation grants for Scottish Water catchments possibly also included elsewhere in this analysis.
Table 22: Climate change adaptation investment need estimate for Scottish Water 2027– 2040 using the information from the draft SR27 business plan (including the technical annex on adaptation). All figures uplifted to 2026/27 prices (assuming 2% nominal growth per annum) from 2024/25 base prices provided by Scottish Water.
|
Period |
Lower estimate (£m) |
Upper estimate (£m) |
|---|---|---|
|
2026/27 |
Not included in analysis |
Not included in analysis |
|
2027/28 – 2032/33 |
£357.9m |
£471.3m |
|
2033/34 – 2039/40 |
£709.4m |
£1,994.6m |
|
Total (£m) |
£1,067.3m |
£2,465.9m |
|
Total (£m/yr) |
£82.1m/yr |
£189.7m/yr |
Macroeconomic effects and wider impacts
Macro-economic stimulus
For macroeconomic modelling, we assumed there is £1bn adaptation investment between 2026 and 2040, approximately £67m/yr. The spending flows primarily to construction for infrastructure upgrades, with additional demand for engineering services, fabricated materials manufacturing and equipment suppliers. Note, this modelling was developed by Centre for Energy Policy at the University of Strathclyde, Scottish Water have not provided these figures.
Without cost recovery (a modelling device to isolate the spending effect): By 2040, construction gains £36m in output and 536 jobs, while architectural services add £1.8m and 27 jobs. Fabricated metals, manufacturing and wholesale/retail (vehicles) see modest supply-chain gains. The water/sewerage sector itself records a small direct gain of £1.1m and 5 jobs, and “all other services” benefits from household income spillovers, adding £10.5m and 140 jobs. The overall effect is a modest but broadly positive stimulus centred on construction and engineering supply chains.
With “industry pays” cost recovery (a stylised scenario): When Scottish Water recovers costs through higher water charges, the water/sewerage sector experiences the largest proportional loss across all scenarios examined. It shifts from a gain of £1.1m and 5 jobs to a loss of £37.5m and 156 jobs. Construction retains a reduced gain of £22m and 332 jobs because it remains central to delivering the infrastructure works, but most other sectors flip to negative impacts. “All other services” loses £24m and 345 jobs, while retail (excluding vehicles), financial services, education, manufacturing and electricity all record output and employment losses. In the CGE model, higher water charges raise business costs economy-wide, reducing competitiveness, while also acting as a regressive consumption tax on households since water is an essential service that low-income households cannot avoid.
Policy implications: An “industry pays” approach via water charges concentrates severe impacts on the water/sewerage sector itself and raises costs across all businesses and households, with regressive effects. Alternative or blended funding approaches merit serious consideration to avoid undermining both the sector and the broader economy, while recognising that these results exclude the substantial avoided benefits in terms of water security, public health and climate resilience.
Wider impacts
The economic case for adaptation investment in the water sector is strong. Evidence reviewed as part of the third UK Climate Change Risk Assessment (CCRA3) finds high benefit-to-cost ratios (BCRs) across a range of water sector measures (Watkiss, 2022). Water efficiency measures deliver the highest returns, with an average BCR of just over 10:1. So every £1 invested in water efficiency measures returns over £10 in net economic benefits. Upland peatland restoration shows similarly high but more variable returns, reflecting the site-specific nature of these investments. This is directly relevant to catchment management approaches such as the Loch Katrine Land Management Plan outlined in Case Study 6. Furthermore, flood preparedness and protection average a BCR of around 5:1, while making new infrastructure resilient averages 4:1 (Watkiss, 2022). Beyond these direct economic returns, adaptation investments frequently generate important co benefits. As well as reducing potential losses from climate change, they often deliver direct economic gains and social or environmental benefits. It is important to note that these BCRs are indicative. Actual returns are highly site and context specific, and uncertainty around the future scale of climate change means quantification of benefits remains challenging.
Current governance, funding and financing arrangements
Water provision in Scotland is in public ownership, Scottish Water is a public corporation providing potable water to 97% of households and businesses in Scotland and wastewater services to 93% (Scottish Government, 2026e). The Scottish Water business plan indicates that around 90% of all the cost of providing water and wastewater services is met by customer charges, with the remainder (£170m a year) met by Scottish Government (Scottish Water, 2025a).
Scottish Water’s regulated business supplies water and wastewater services to households and is also the wholesaler to the water retail market for businesses in Scotland. For the financial year 2024/25, around 73% of the total income was from households, with the remainder from wholesale businesses (Scottish Water, 2025b). See Table 23 for recent regulated business revenue.
Table 23: Scottish Water regulated business revenue. Decreases shown in brackets. Source: Scottish Water (2025b)
|
FY25 (£m) |
FY24 (£m) |
Increase/(decrease) (£m) | |
|---|---|---|---|
|
Household |
£1,154m |
£1,050m |
£104m |
|
Wholesale |
£410m |
£382m |
£28m |
|
Other |
£15m |
£17m |
£(2)m |
|
Total revenue |
£1,579m |
£1,449m |
£130m |
Beyond its core regulated business, Business Stream, Scottish Water’s retail subsidiary, competes as a licensed provider in both the Scottish and English markets, holding around a 20% share of the English market. It operates under a Governance Code agreed with the Water Industry Commission for Scotland and has its own independent board and management team. Non-regulated commercial activities, including renewable energy and innovative water technologies, are undertaken separately through Scottish Water Horizons (Scottish Water, 2025b).
The organisation has previously used Private Finance Initiative (PFI) models to finance infrastructure investment. However, these have run their course and over the next SR period, all but one of the PFI contracts will return to public ownership. The intention in the business plan is to keep all lending the same, and for additional investments in the network to be covered by user charges.
For the purposes of this study, we assume that the majority of the costs of adaptation are paid through Scottish Households and businesses, since the relative surplus from the other activities are relatively low (Business stream group had an £18m surplus before tax). The arrangements are set out Figure 12.
Going forward, Scottish Water expects the nominal borrowing from Scottish Government to stay the same, and the increased expenditure to be funded through households and businesses. The current business plan projects the proportion of expenditure to rise from 90% to 94% (Scottish Water, 2026c).
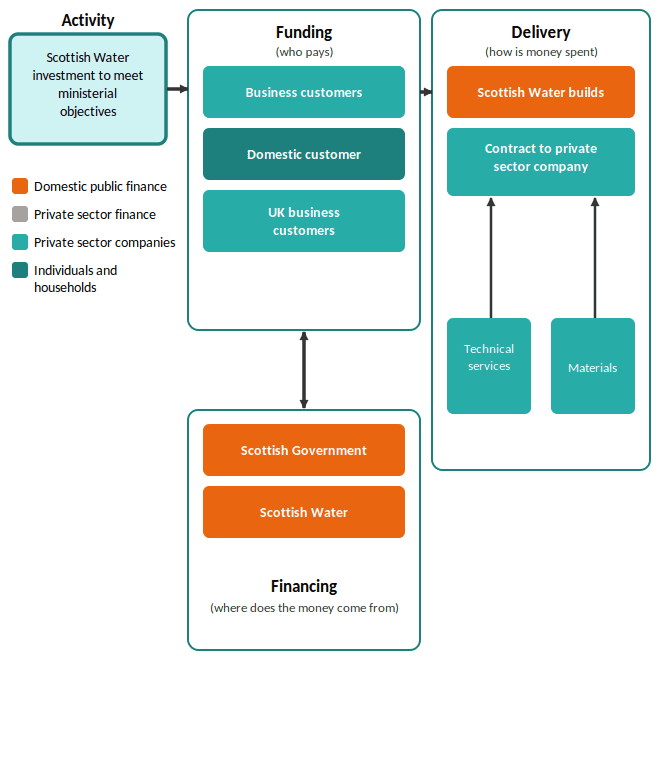
Figure 12: Financing, funding, and delivery arrangements for water and wastewater adaptation investment in Scotland.
Innovation that could boost private sector participation
In the water sector, options to boost private sector participation are more constrained given that Scottish Water operates as a publicly owned utility and the majority of investment is already funded through consumer bills.
There are also a spectrum of options relating to private financing (Table 24). The first is a basket of financing arrangements (Sustainability linked finance, Collective Investment Vehicles) that can be used but require long-term commitments to repayment or creation of revenue streams. However, in reality, their potential is likely to be limited since borrowing terms from Scottish Government are likely to be highly attractive, and future investment may also be linked to the plans for a new Scottish government bond. Full privatisation, while theoretically a financing option, is not considered a realistic or desirable pathway in the Scottish context.
There are also models which support private financing of specific assets, such as Public private partnerships (PPPs). However, while PPPs have previously been used to finance investment in Scottish Water infrastructure, the current direction of travel, bringing such infrastructure into public use, suggests limited appetite in practice.
Finally, there are alternatives which enhance contributions from businesses and consumers due to water-related benefits. In relation to billing, there are also alternative options for enhancing cost recovery through water tariffs. Many households in Scotland do not have water meters and are charged for installation, so such a programme could incentivise use and more accurately reflect usage. There is also the potential to enhance contributions from large businesses and landowners. For example, in Scotland, Diageo are already investing in upstream peatland restoration for flood management at their distillery. These may be able to be extended to cover akin to water funds which co-invest to improve efficiency and costs. It also noted that the hydrogen and digital sectors are also likely to increase water demand, and so may offer further potential. Developing clearer frameworks for how such investments are valued and attributed across multiple beneficiaries would help unlock this potential at greater scale.
Table 24: Examples of innovative models for private participation in water with cost recovery model. Source: authors, updated from Watkiss and England (2025).
|
Model |
Examples |
Cost recovery model |
|
PFI/ PPP |
Kigali Bulk Water Project (Rwanda) (Blended Finance Taskforce and Systemiq, n.d.) |
User pays and government pays |
|
Water Funds |
Norfolk Water Fund TNC |
User pays |
|
Collective Investment Vehicles |
Water Equity Global Access Fund IV (Heading For Change, n.d.) |
User pays |
|
Sustainability-linked finance |
Pennon Group Green Finance Framework (UK) (Pennon, 2024) |
User pays |
|
Syndicated Loans |
Enhancing Water and Sanitation Resilience with IDB Invest and partners (Brazil) (IDB Invest, 2025 |
User pays |
|
Securitization, Guarantees and Credit Enhancement |
Water Finance Facility (Kenya) Pooled Water Fund (Blended Finance Taskforce and Systemiq, n.d.) |
User pays |
|
Project aggregation |
Climate Adaptation Notes |
User pays |
|
Micro finance |
Water Credit Initiative (Water.org, n.d.) |
User pays |
|
Supply chain finance |
Sanivation (Africa) (Sanivation, n.d.) |
Government pays and private sector pays / new revenue model |
|
Metering |
CityTaps (Kenya) (The Global Innovation Fun, n.d.) |
User pays through more accurate charging |
Summary of findings
The evidence base on the cost of climate adaption in Scotland -and how this will change with time – is limited.
This study aimed to develop and test a preliminary approach that could be used to inform the potential indicative costs of climate adaptation across a range of sectors in Scotland.
We use a multi method approach to explore four dimensions: investment needs, the macroeconomic effects of such needs, public-private funding splits, and scope to mobilise private capital. Here, we present the key findings from the work which focussed on areas within five sectors: agriculture, communities (flooding), natural environment (woodland creation, peatland restoration and nature restoration), transport (trunk roads and motorways and railways), and water (public water and wastewater services).
Investigating climate change adaptation investment need
Investment needs were estimated using a pragmatic, multi-method approach tailored to the data availability and evidence maturity of each sector. Methods included drawing on existing sectoral analyses, applying climate-proofing uplifts to Scottish Government budget lines, scaling from UK-wide research, and using expert judgement to apportion investment with mixed objectives directly to adaptation.
We find that climate adaptation investment need for the five analysed sectors totals £7.8–£14.2 billion for 2026–2040, or £566–£1,027 million per year (Table 25).
Table 25: Summary of estimated climate change adaptation investment need for areas within the five sectors included in our study, for the period 2026 – 2040 (2026/27 prices). Where available, current budget (or estimates) are presented alongside estimated investment need, with a RAG rating indicating whether current spend meets the estimated need (green), falls within 20% below it (amber), or is more than 20% below it (red). An expert-elicited investment need estimate confidence rating is assigned to each sector/sub-sector estimate, alongside the primary source from which it was derived. *Note Scottish Water estimates are for 13 years from 2027– 2040.
|
Sector |
Sub-sector / approach |
Investment estimate (£m) |
Investment estimate (£m/yr) |
2026/27 budget (£m/yr) |
Investment estimate confidence |
Investment Estimate Source |
|---|---|---|---|---|---|---|
|
Agriculture |
£2,347m – £3,091m |
£167.6m/yr – £220.8m/yr |
£167.6m/yr – £220.8m/yr |
Low |
Scottish Government Budget | |
|
Communities |
Capacity building |
£102m |
£7.3m |
£6.9m |
Medium |
Scottish Government Budget |
|
Property flood protection |
£885m – £1,102m |
£63.2m – £78.7m |
£42m |
Low |
Scottish Government & DEFRA, HM Government | |
|
Property flood resilience |
£10.5m –£52m |
£0.8m- £3.7m |
Unknown |
Medium |
JBA Risk Management 2025 | |
|
Natural environment |
Woodland creation |
£115m |
£8.2m |
£2.3m |
Low – Medium |
Scottish Government Draft Climate Change Plan |
|
Peatland restoration |
£236m |
£16.8m |
£5.6m |
Low – Medium |
Scottish Government Draft Climate Change Plan | |
|
Natural restoration |
£73m |
£5.2m |
£5.2m |
Low – Medium |
NatureScot | |
|
Transport |
Rail[3] |
£1,582m –£4,734m |
£113m –£338.1m |
≈ £87.8m |
Medium |
Network Rail Scotland |
|
Trunk roads and motorways |
£1,418m –£2,213m |
£101.3m – £158.1m |
£82.32m |
Very low |
Scottish Government Budget | |
|
Water* |
Scottish Water[4] |
£1,067m –£2,466m |
£82.1m – £189.7m |
Unknown |
Medium |
Scottish Water |
|
Total |
£7,835.5m – £14,182.8m |
£565.5m – £1,026.6m |
The macroeconomic effects of investing in climate adaptation
While a full assessment of the macroeconomic costs and benefits of adaptation was beyond the scope of this report, the study used a Computable General Equilibrium (CGE) model of the Scottish economy to explore the direct economic effects of adaptation spending across sectors and consider how different approaches to cost recovery affect economic activity, employment, and household incomes.
The modelling shows that adaptation spending can generate a positive economic stimulus during the investment period across all sectors studied. However, the way costs are recovered matters considerably, with effects varying by sector and recovery mechanism:
- Agriculture: Adaptation spending would stimulate construction, manufacturing, and agricultural supply chains. However, recovering costs through higher food prices would disproportionately affect lower-income households and risk significant job losses given agriculture’s labour-intensive nature.
- Communities: Flood adaptation would generate meaningful local gains in construction and professional services. If costs were recovered through income tax, broader consumer spending would be dampened, with retail and service sectors potentially flipping from gains to losses.
- Natural environment: Land-based restoration would generate substantial rural employment gains, particularly in forestry and land-use sectors. Recovery through public spending cuts could produce widespread losses across service, education, and public administration sectors that outweigh the direct stimulus.
- Transport (roads and rail): Adaptation spending would deliver broad-based construction and supply-chain gains. Income-tax recovery could erode much of this stimulus, particularly affecting consumer-facing sectors and export competitiveness.
- Water: Recovering costs through higher water charges would concentrate severe impacts on the water sector itself and could act as a regressive tax on households and businesses for whom water is an unavoidable essential service.
These results should not be interpreted as a full cost-benefit assessment of adaptation. The modelling captures the demand-side effects of spending and cost recovery, but does not account for avoided climate damages, residual risks, or the broader triple dividend of adaptation.
Current funding and financing arrangements
For each of the areas within the five sectors included in our study, we calculated indicative estimates of the current and future contributions from the private sector towards adaptation investment. These are highly speculative and represent a first pass attempt at quantifying the current and potential contributions of the private sector to adaptation costs.
We find that currently investment is predominantly public across most sectors and sub-sectors. Private contributions range from negligible (peatland restoration) to around a third (agriculture). Water represents a notable exception where approximately 90% of costs are met through household and business customer charges. These are shown below, alongside the typical levels of financial returns for the activities (Table 26).
Table 26: Current and future maximum potential of private sector contributions to adaptation. Private sector contributions include households, businesses and financial institutions. Source: Updated from Watkiss and England, 2025.
|
Sector |
Nature of Investment in baseline (Scotland) |
Typical level of financial returns without innovation |
Private sector contributions (funding and finance) | |||
|
Public |
Below-market |
Commercial Returns |
Current |
Future (Potential) | ||
|
Agriculture |
Mixed |
X |
X |
X |
33% |
35% |
|
Communities – Flood protection. |
Mixed (Public for protection, early warning and NBS, private for household measures) |
X |
7% |
15% | ||
|
Natural environment – Peatland |
Public |
X |
0% |
5 – 10% | ||
|
Natural environment – Forestry |
Mixed |
X |
X |
x |
Not quantified |
Not quantified |
|
Natural environment – Nature restoration |
Public |
X |
0% |
10% | ||
|
Transport – Rail |
Mixed |
X |
X |
40% |
45% | |
|
Transport – Road |
Mixed |
X |
X |
10% |
15% | |
|
Water |
Private |
X |
X |
90% |
100% | |
Innovations that could boost private sector participation
Opportunities to increase private sector contributions vary considerably by sector (Table 25). They include blended finance and parametric insurance in agriculture; green bonds, land value capture, and property-level flood resilience schemes for flooding; biodiversity and carbon credits alongside payment for ecosystem services in the natural environment; road user charging, tolls, and collective investment vehicles in transport; and water funds and sustainability-linked finance in the water sector, though options here are more constrained given Scottish Water’s public ownership model.
It was not possible to apply these estimates to the total figures for adaptation spend due to methodological differences in scope. However, the results suggest that for the five sectors explored, there is modest potential to boost private sector participation in adaptation funding and financing. While the numbers are modest in percentage terms, this nonetheless highlights real opportunity to increase private contributions, which will become increasingly important as costs are projected to rise significantly. Scottish Government and associated non-departmental public bodies should therefore consider this as part of the development of SNAP4.
Who pays for adaptation?
A clear structural tension running through all five sectors is the question of who pays for adaptation. Private finance can help meet upfront costs but rarely reduces the underlying funding burden. Costs are frequently transferred back to government or consumers, meaning private sector participation should be understood as complementary to, rather than a substitute for, public funding. This is reinforced by the nature of Scotland’s adaptation priorities. The majority of these fall within Type A and B categories (see Section 2.2 and Figure 3), implying that approximately three-quarters of investment needs must be publicly funded. Scaling private participation will therefore require active policy intervention, enabling conditions, and public co-financing to de-risk investment – it will not emerge through market forces alone.
How adaptation costs are ultimately recovered also has significant distributional consequences: income-tax funding spreads cost progressively but suppresses household consumption, while price-based approaches risk being regressive in essential sectors such as agriculture. Funding design is therefore as consequential as investment scale.
Across all sectors, the co-benefits of adaptation investment – avoided losses, economic stimulus, and socio-environmental gains – can substantially strengthen the economic rationale for action, particularly from a public sector perspective. However, these benefits are rarely fully monetised, meaning investment cases are systematically understated. Crucially, while co-benefits reinforce the public sector case for sustained funding, they do not necessarily translate into financial returns for private investors. This distinction helps explain the persistent gap between headline benefit-cost ratios and the limited appetite of private capital for adaptation investment.
Uncertainties and challenges
Our findings are a first attempt to quantify Scotland’s climate adaptation investment need across five sectors and should be interpreted accordingly. Significant uncertainties and methodological limitations attach to each dimension of the analysis.
Adaptation investment need estimates
Costing approaches vary considerably, from detailed sector/subsector assessments (rail, water), to climate-proofing uplifts on budget lines (roads), to apportionment of mixed-objective spend (natural environment), to value transfer approaches (communities – flood protection schemes). The breadth of approaches limits comparability across sectors and introduces varying degrees of uncertainty, as reflected in the confidence ratings in Table 23. The investment estimates presented in this report are indicative and order-of-magnitude in nature.
Key challenges and wider sources of uncertainty include:
Undefined risk tolerance thresholds
- Without agreed adaptation objectives or acceptable risk levels for each sector, investment need cannot be scaled against a definitive end-goal. The figures we present reflect assumptions about continued or modestly scaled-up spending rather than what might be required to meet specific resilience outcomes.
Partial sectoral coverage
- Many sectors such as energy, telecommunications, and health were not included in our analysis due to resource constraints. Furthermore, the sectors included in our analysis are only partially covered. For example, for transport, we included only rail infrastructure and motorway and trunk roads, we did not include local road networks, ferries, aviation, canals, and active travel. The communities sectoral analysis focused on flood risk management only. Adaptation investment needs for storm, drought, coastal erosion, heat risks and other factors that will affect communities were not considered.
Deep uncertainty in underlying drivers
- Future climate trajectories, socio-economic and geopolitical change all remain uncertain.
Mixed objective apportionment
- Apportionment fractions, (for example, the adaptation share attached to peatland restoration, woodland creation, and agricultural support) carry considerable uncertainty. They were derived through exploring the listed multiple objectives of each investment area and then using expert elicitation to attach an estimate apportionment, rather than empirical evidence.
Risk of double-counting
- In some areas, the same expenditure may be captured under more than one sector. For example, peatland grants administered through Scottish Water catchment programmes may overlap with peatland restoration budgets counted within the natural environment sector.
Public-private investment split
The estimates of current and potential private sector contributions to adaptation funding are highly speculative and should be treated as illustrative rather than definitive. This relates to the following challenges:
Limited baseline data
- Private sector adaptation expenditure is largely unrecorded across all five sectors. In agriculture, it is folded into support payment income streams; in transport, it is estimated from aggregate local government finance data; in water, it reflects consumer billing structures rather than genuine private risk-bearing. These limitations make cross-sector comparisons unreliable.
Definitional ambiguity between financing and funding
- Instruments such as green bonds, sustainability-linked loans, or PPP arrangements can mobilise upfront private capital, but costs are typically repaid through public budgets, regulated consumer charges, or government guarantees. Private participation therefore tends to alter the timing and vehicle of finance without necessarily reducing the public funding burden.
Rapidly shifting governance landscape
- The consolidation of rail services under Great British Rail, development of Scottish Government bond issuance mechanisms, and evolving frameworks for biodiversity and carbon credits could all materially alter funding arrangements over the period to 2040, making future contribution estimates uncertain.
Structural limits on private participation
- Most of Scotland’s adaptation priorities fall within Type A or B categories (public goods or mixed-benefit activities with below-market returns). This means the majority of climate adaptation investment needs are likely to require public funding regardless of innovation in finance mechanisms.
Capturing wider co-benefits
The economic case for adaptation investment is substantially strengthened when the full triple dividend is considered. However, this report’s treatment of co-benefits is partial:
Limited co-benefits quantification in several sectors
- Across all sectors, we have not explored the avoided losses of adaptation due to resource constraints.
- Excluding economic stimulus, we have provided minimal evidence for the wider social, economic and environmental co-benefits of adaptation.
- Where estimates are provided, notably for peatland restoration and woodland creation, these draw on literature values that carry their own uncertainty ranges and depend heavily on the pace and scale of successful delivery. More research is needed to capture the co-benefits of adaptation investment across Scotland.
Attribution challenges
- Where adaptation investment delivers multiple outcomes, assigning economic value to the adaptation-specific component requires further subjective apportionment. The same hectare of restored peatland contributes to carbon sequestration, biodiversity gain, flood management, and water quality improvement simultaneously, making clean attribution inherently imprecise.
Conflation of societal and financial returns
- High benefit-cost ratios in the literature typically reflect economic and environmental returns measured at a societal level, including non-market values that generate no cash flow. Private investors assess financial returns, incremental revenues and recoverable costs, which are considerably lower. Consequently, treating strong societal co-benefit ratios as evidence of private investment attractiveness risks overstating the potential for private finance mobilisation.
Recommended priorities
Recommended research priorities
While this project provides a first estimate of Scotland’s adaptation investment needs, it has identified significant gaps that require further data, research and analysis.
- Adaptation objectives and risk tolerance
- Develop specific, quantified adaptation targets and sector-specific risk tolerance thresholds aligned with climate scenarios and socioeconomic assumptions.
- Use these objectives to enable meaningful gap analysis between current spending and investment need, and to support the development of SNAP4.
- Asset-level vulnerability and investment pipelines
- Develop comprehensive, spatially referenced vulnerability inventories across all five sectors included in this analysis.
- Move from broad climate vulnerability assessments to spatially specific prioritisation of sites, assets, and interventions, building on existing work such as the Transport Scotland VLOG prioritisation tool and the Network Rail Scotland Adaptation Pathways Programme.
- Integrate existing data sources, including Coastal Climate Adaptation Plans, SEPA flood risk assessments, and emerging sectoral tools, into the development of future adaptation investment plans.
- Financial transparency and attribution
- Improve the granularity in public budget reporting, including clearer disaggregation of adaptation spend from mitigation, and other objectives.
- Undertake dedicated methodological work in agriculture to isolate the adaptation-specific component of spending and assess whether current budgets levels are appropriate for changing climate risks.
- Triple dividend
- Avoided losses: build the evidence base on avoided losses associated with adaptation investment across all sectors in Scotland, drawing on top-down modelling approaches and/or sector-specific data sources where available.
- Economic stimulus: quantify the economic stimulus effects of adaptation investment, including employment, supply chain, and distributional impacts. CGE modelling offers a promising approach for capturing these macroeconomic and regional effects.
- Social and environmental co-benefits: assess the wider social and environmental co-benefits of adaptation investment across sectors. This research could include a combination of reviewing existing literature and associated data, wider stakeholder engagement and/or practical field-based research for sectors such as natural environment and agriculture.
- Distributional impacts
- Conduct targeted research on the distributional consequences of different financing approaches – income-tax, price-based, and charge-based – and on compensating policy measures to support more equitable funding design.
- Cross-sector collaboration
- Develop mechanisms and spaces to share adaptation research and delivery across sectors, building on existing forums such as the Climate Ready Infrastructure Scotland (CRIS) Forum.
- Further explore efficiency gains from catchment-scale management approaches, where investment simultaneously delivers water quality, biodiversity, flood management, and carbon sequestration benefits.
- Map how adaptation priorities can be embedded within existing cross-cutting frameworks spanning civil contingencies, biodiversity governance, spatial planning, and infrastructure regulation, with Local Resilience Partnerships and the Scottish Wildfire Forum as existing entry points.
Prioritisation
A further challenge that cuts across all sectors is how to prioritise adaptation investment when resources are constrained. Standard cost-benefit frameworks tend to favour investment in areas of dense population, maximising the number of beneficiaries per pound spent, for example directing flood protection spending towards urban centres. However, several of the sectors and sub-sectors assessed in this report are most acutely exposed to climate risk in rural and remote areas. This includes transport routes, agricultural land, peatland, and water supplies serving dispersed communities. This creates a structural tension between economic efficiency and equity and raises important questions about who adaptation investment is designed to protect. Future work should explore how prioritisation frameworks can be developed that explicitly account for rural vulnerability, social equity, and Just Transition principles alongside conventional cost-benefit criteria ensuring that investment decisions do not systematically disadvantage the people and environment that face the greatest climate exposure.
Recommended strategic priorities for adaptation investment
A national strategy for adaptation investment must begin by recognising that different sectors are at different stages of the adaptation investment cycle. For example, in communities, the priority is shifting from capacity building towards delivery, mobilising resources for property flood resilience and scaling flood protection schemes at pace. In transport, the immediate need is moving from risk assessment and vulnerability mapping towards robust costing and prioritised investment programmes. In the natural environment, the strategic focus could be to further develop the private finance ecosystem, accelerating the maturity of biodiversity credit and voluntary carbon markets to draw in private capital at scale.
Across all sectors, there is value in ensuring that adaptation objectives are embedded within existing spending programmes. For example, infrastructure maintenance, rural development funding, housing retrofit, and land management schemes. This requires improved budget tagging, clearer apportionment guidance, and stronger policy levers to ensure that co-funded programmes deliver credible adaptation outcomes alongside their primary objectives.
Private finance mobilisation also requires a more coherent national approach. While opportunities exist across all five sectors, they are currently fragmented, small-scale, and unevenly distributed. A clearer national strategy should identify which mechanisms are most appropriate for each sector, what enabling conditions are required, and how public co-financing can be used most effectively to de-risk private investment. This could include drawing on international experience with blended finance, green bonds, and nature finance markets, while remaining realistic about the fundamental limits of private capital in funding what are, in most cases, public goods. Underpinning all of this is the need for an improved monitoring and evaluation framework for adaptation investment specifically. As adaptation investment programmes scale up, a consistent and transparent approach to tracking expenditure, outputs, and outcomes across sectors will be essential for accountability, learning, and iterative improvement, aligned with the SNAP3 requirements but going further to capture financial flows and asset-level progress.
A summary of the recommended strategic priorities for adaptation investment is provided in Box 2 below.
Box 2: Summary of strategic priorities for adaptation investment
- The development of quantified adaptation targets and asset-level vulnerability inventories are the most important near-term research priorities, providing the foundations for robust investment need estimates and long-term adaptation pathways.
- The improvement of financial attribution through improved budget tagging, clearer disaggregation of adaptation from co-objectives, and fuller quantification of the triple dividend, is important for making a credible and comprehensive economic case for sustained public investment.
- Cross-sector collaboration, both in sharing research and delivery costs and in embedding adaptation within existing governance networks, offers significant efficiency gains that are currently underexploited.
- Investment strategies must be sector-differentiated, reflecting where each sector sits in the adaptation cycle, and focused on building investment-ready pipelines capable of attracting both public and private finance at scale.
- A shared monitoring and evaluation framework, specifically focused on adaptation investment, aligned with SNAP3, but capturing financial flows and asset-level outcomes, is a precondition for accountability and iterative improvement as the Scottish adaptation programme expands.
Acknowledgements
We would firstly like to thank the Scottish Government and ClimateXChange for their continued support with this project.
We would also like to thank the organisations and individuals that contributed information and/or case studies to this report, including: Scottish Water, Network Rail Scotland, Transport Scotland, FloodRe, University of Strathclyde, Hope in Place CIC and NatureScot.
Additionally, we would like to thank the individuals that contributed to preparing this report and analysis, including David Sturgess and Adam Hughes-Buchanan (both University of Strathclyde) and Andrew Moxey and Paul Watkiss (both Paul Watkiss Associates).
Finally, we would like to acknowledge the support from ATTENUATE project for their contributions on the conceptual framing, costing and financing (funded by UK Research & Innovation; grant number UKRI282). ATTENUATE is a collaborative project focused on unlocking private sector funding for climate adaptation, building the case for greater public sector investment, and addressing governance barriers to investment and is supported by the UKRI-Defra ‘Maximising UK Adaptation to Climate Change’ programme. For more information, see www.lse.ac.uk/granthaminstitute/projects/attenuate.
References
Asian Development Bank (2026) Climate Adaptation Investment Plan for the Water Sector in Bhutan.
Audit Scotland (2025) Flooding in Communities: Moving Towards Flood Resilience. Edinburgh: Audit Scotland. Available at: https://audit.scot/uploads/2025-08/nr_250828_flooding_in_communities.pdf (Accessed: 10/02/26).
BBC (2019). Anders Povlsen: Why a Danish billionaire bought the Highlands. Available at: https://www.bbc.co.uk/news/uk-scotland-47803110#:~:text=They%20have%20embarked%20on%20an,100m%20is%20far%20from%20understated (Accessed 24/02/26, 13:00).
Bebber, D. P., Maclean, I. M., Mosedale, J. R., & Youngman, B. D. (2025). Potential impacts of plant pests and diseases on trees and forests in the United Kingdom. Plants, People, Planet, 7(5), 1538-1550.
Bosello, F., Standardi, G., Parrado, R., Dasgupta, S., Guastella, G., Rizzati, M., Pareglio, S., Schleypen, J., Boere, E., Batka, M., Valin, H., Bodirsky, B., Lincke, D., Tiggeloven, T., & van Ginkel, K. (2020). D2.7: Macroeconomic, spatially‑resolved impact assessment (Version 0.6, revised March 2022). COACCH Project, Horizon 2020 Grant Agreement No. 776479. https://www.coacch.eu/wp-content/uploads/2018/03/D2.7_revMAR2022.pdf
Borio, I., & Kassian, J. (2023). Property flood resilience: Market study. Flood Re. https://www.floodre.co.uk/wp-content/uploads/20759_Flood_Re_PFR-Report_2023.pdf
Boyd, R., and A. Hunt. (2004). “Costing the Impacts of Climate Change in the UK: Overview Guidelines. (Metroeconomica).” UK Climate Impacts Programme Technical Report. http://www.ukcip.org.uk/images/stories/Pub_pdfs/Costings%20overview.pdf.
Brett, L., Cha, Y., & White, C. J. (2026). Impactful Weather and Multi‐Hazard Events: Lived Experiences From Rural Scotland. Climate Resilience and Sustainability, 5(1), e70035.
Broadmeadow, S., Nisbet, T., Valatin, G. (2023). Revised valuation of flood regulation services of existing forest cover to inform natural capital accounts. Forest Research. Available at: https://cdn.forestresearch.gov.uk/2023/01/Revised-valuation-of-flood-regulation-services-of-existing-forest-cover-2023.pdf
Climate-ADAPT, 2026. Nature for Insurance, insurance for nature (NATURANCE). Available at:https://climate-adapt.eea.europa.eu/en/metadata/projects/nature-for-insurance-insurance-for-nature (Accessed 24/02/26, 13:25).
Climate Change Committee (CCC) (2022). The just transition and climate change adaptation.
Available at: https://www.theccc.org.uk/wp-content/uploads/2022/03/CCC-The-just-transition-and-climate-change-adaptation.pdf (Accessed: 09/03/2026).
Climate Ready Clyde (2021). Glasgow City Region Climate Adaptation Strategy and Action Plan: Finance Adaptation Gap Estimates 2018/19. Climate Ready Clyde Secretariat, supported by Paul Watkiss Associates. Available at: https://climatereadyclyde.org.uk/wp-content/uploads/2021/06/15-Finance-Adaptation-Gap-Estimates.pdf
Climate Policy Initiative (CPI) (2025) ‘Global Landscape of Climate Finance 2024. Insights for COP29’. Available at: https://www.climatepolicyinitiative. org/publication/global-landscape-of-climate-finance-2024/
Croatian Parliament (2020) Strategy for Adaptation to Climate Change in the Republic of Croatia for the Period up to 2040 with a View to 2070. Zagreb: Hrvatski sabor. Available at: https://narodne-novine.nn.hr/clanci/sluzbeni/2020_04_46_921.html (Accessed: 10/11/25, 15:00).
Dale, N., & Zhekova, S.(2019). National Climate Change Adaptation Strategy and Action Plan. Republic of Bulgaria. Available at: https://www.moew.government.bg/static/media/ups/categories/attachments/Strategy%20and%20Action%20Plan%20-%20Full%20Report%20-%20%20ENd3b215dfec16a8be016bfa529bcb6936.pdf
Department for Environment, Food & Rural Affairs (DEFRA) and Environment Agency (2025) Hundreds of Thousands of Homes and Businesses to Benefit from Largest Flood Defence Investment Programme in History. London: HM Government. Available at: https://www.gov.uk/government/news/hundreds-of-thousands-of-homes-and-businesses-to-benefit-from-largest-flood-defence-investment-programme-in-history (Accessed 10/02/26, 10:00).
Department for Transport (2025) Railways Bill factsheet: introducing and designing Great British Railways. Published 5 November 2025. Available at: https://www.gov.uk/government/publications/railways-bill/railways-bill-introducing-and-designing-great-british-railways (Accessed: 23/03/2026).
Descartes (2026). Parametric Insurance for the Agricultural Industry. Available at: https://descartesunderwriting.com/industries/agriculture (Accessed 24/02/26).
Diageo (2026). Peatlands. Available at: https://www.diageo.com/en/esg/sustainability/peatlands (Accessed 24/02/26, 16:00).
Dolques, G., Dépoues, V. and Thomazeau, F. (2026) Adapting France to +4°C: Current Resources, Additional Needs, and Funding Options. Paris: Institute for Climate Economics (I4CE). Available at: https://www.i4ce.org/wp-content/uploads/2025/10/Adapting-France-to-4%C2%B0C.pdf (Accessed: 06/11/25, 10:00).
Drinking Water Quality Regulator for Scotland (DWQR) (2024) Private Water Supplies: Drinking Water Quality in Scotland 2023. Published September 2024. Available at: https://dwqr.scot/media/xpxnhhxz/private-water-supply-annual-report-2023.pdf
England, K., Watkiss, P., & Hunt, A. (2023). Adaptation finance case study 2023: Craigleith Retail Park demonstrator. Adaptation Scotland. https://adaptation.scot/app/uploads/2024/09/adaptation-finance-case-study-2023.pdf
England K., Moxey, A. and Watkiss, P. (2024) Economic assessment of climate risks and opportunities for South East Scotland. Task 1: High level analysis of economic impacts and costs of adaptation. Available at: https://climatereadyses.org.uk/wp-content/uploads/2025/06/2a-PWA-2025-Economic-Implications-of-Climate-Change-for-ESES-Part-1.pdf
Environment Agency (2021) Long‑term Investment Scenarios (LTIS) 2019. Updated 1 July 2021. Available at: https://www.gov.uk/government/publications/flood-and-coastal-risk-management-in-england-long-term-investment/long-term-investment-scenarios-ltis-2019
Eurostat, 2026. Gross domestic product at market prices (Updated 20/02/2026). Available at:https://ec.europa.eu/eurostat/databrowser/view/TEC00001/bookmark/table?lang=en&bookmarkId=e3030c9f-8b66-48ae-b1be-43199d1060eb&c=1622804233798 (Accessed 10/01/2026).
FloodRe (2023). What is Build Back Better? Available at: https://www.floodre.co.uk/faq/what-is-build-back-better/ (Accessed 15/01/2026)
Forestry and Land Scotland (2023) Loch Katrine Land Management Plan 2023–2033: Central Region. Forestry and Land Scotland. Available at: https://forestryandland.gov.scot/media/ehcnlz1v/loch-katrine-central-land-management-plan-2023-33.pdf (Accessed: 31/03/2026)
Global Commission on Adaptation (GCA) (2019). Adapt Now: A Global Call for Leadership on Climate Resilience. Global Centre on Adaptation and World Resources. Available at: https://gca.org/reports/adapt-now-a-global-call-for-leadership-on-climate-resilience/
Government of New Zealand (2025) National Adaptation Framework. Available at: https://environment.govt.nz/publications/national-adaptation-framework/
Greenhill, S., Hsiang, S., Balboni, C., Barrage, Bolliger I. W., , Boomhower, J., Diaz, D., Hannah Druckenmiller, Teevrat Garg, Miyuki Hino, Harrison Hong, Carolyn Kousky, Jeremy Martinich, Ishan Nath, Kimberly L. Oremus, R. Jisung Park, Toan Phan, Jonathan Proctor, Will Rafey, Marcus C. Sarofim, Schlenker, W., and Simon, B. (2026) Using markets to adapt to climate change. Science 391,662-664.DOI:10.1126/science.aea7431 https://www.science.org/doi/10.1126/science.aea7431
Harari, D. and Murray, A. (2024) Scotland’s Economy. Debate Pack CDP-2024-0126. London: House of Commons Library. Available at: https://researchbriefings.files.parliament.uk/documents/CDP-2024-0126/CDP-2024-0126.pdf (Accessed: 12/12/26, 11:00).
HM Treasury (2026) The Green Book: Appraisal and Evaluation in Central Government. Updated 5 February 2026. Available at: https://www.gov.uk/government/publications/the-green-book-appraisal-and-evaluation-in-central-government/the-green-book-2026
Jacobs and AECOM (2022) Strategic Transport Projects Review: Protecting out climate and improving lives. Appendix I: Recommendation Appraisal Summary Tables. December 2022. Available at: recommendation-31-trunk-road-and-motorway-network-climate-change-adaptation-and-resilience.pdf
JBA Risk Management (2025). Reducing Flood Risk: Which Homes Are Most Suitable for PFR? Phase 1: National‑Level Analysis. 2025. Flood Re. Available at: https://www.floodre.co.uk/wp-content/uploads/JBA-Flood-Re-Phase-1-Report.pdf
Knittel, N. et al. (2017) The Costs of Climate Change Adaptation for the Austrian Federal Budget. PACINAS Working Paper #04. Available at: http://anpassung.ccca.at/pacinas/wp-content/uploads/sites/3/2017/07/10_Knittel-et-al-WP4-2017.pdf (Accessed: 06/11/25, 9:30).
Lawson, E. and Davies, D. (2025) Scotland’s water industry: overview of regulation and key challenges. SPICe Briefing SB 25‑52. 28 October 2025. Available at:https://bprcdn.parliament.scot/published/2025/10/28/50cd1cc7-b177-4564-b032-afc96aeeebc7/SB%2025-52.pdf
Mather, K. (2025) Rolling Stock: Procurement. Written question 92441, tabled on 18 November 2025. Available at: https://questions-statements.parliament.uk/written-questions/detail/2025-11-18/92441/ (Accessed: 23/03/2026).
Multilateral Development Bank (2023). 2022 Joint Report on Multilateral Development Banks’ Climate Finance. Available at: https://doi.org/10.18235/0005182
Ministry for Ecological Transition and the Demographic Challenge (MITECO) (2020) National Climate Change Adaptation Plan: Work Programme 2021–2025. Madrid: MITECO. Available at: https://www.miteco.gob.es/content/dam/miteco/es/cambio-climatico/temas/impactos-vulnerabilidad-y-adaptacion/pt1-pnacc_tcm30-535273.pdf
Morris, J., & Camino, M. (2011). Economic assessment of freshwater, wetland and floodplain (FWF) ecosystem services. UK National Ecosystem Assessment Working Paper, Cranfield University.
mygov.scot. (2025). Apply for a private water supply grant. Available at: https://www.mygov.scot/private-water-supplies/apply-for-grant (Accessed 20/03/2026, 15:00)
National Audit Office. (2023). Resilience to flooding [Press release]. Available at: https://www.nao.org.uk/press-releases/resilience-to-flooding/ (Accessed 23/03/2026 at 10:00).
NatureScot (2026) FIRNS – The Facility for Investment Ready Nature in Scotland. Available at: https://www.nature.scot/funding-and-projects/firns-facility-investment-ready-nature-scotland (Accessed: 24/02/26, 17:00).
Network Rail (2024) Weather Resilience and Climate Change Adaptation (WRCCA): Summary of Regional Plans for 2024–2029. Available at: https://www.networkrail.co.uk/wp-content/uploads/2024/04/CP7-WRCCA-Plans-combined-summary-of-all-regions-April-2024.pdf (Accessed 01/04/2026).
Network Rail Scotland (2024). Climate Ready Plan 2024–2029. Scotland’s Railway. Available at: https://www.networkrail.co.uk/wp-content/uploads/2024/04/Scotlands-Railway-CP7-Climate-Ready-WRCCA-Plan.pdf (Accessed:09/03/2026).
Neumann, T., Martinez Botia, L., de Goër de Herve, M., Zink, V., Tröltzsch, J. & Tarpey, J. (2025). Knowledge development and application concerning costs of adaptation compared to costs of inaction: Final report. European Environment Agency.
Available at: https://www.ecologic.eu/sites/default/files/publication/2026/Knowledge-adaptation-costs-70812.pdf (Accessed: 07/01/2026).
OECD (2023) ‘Scaling Up Adaptation Finance in Developing Countries: Challenges and Opportunities for International Providers, Green Finance and Investment’, OECD Publishing, Paris, https://doi.org/10.1787/b0878862-en.
Office for Budget Responsibility (OBR) (2021) Fiscal Risks Report. CP 453. London: HM Treasury. Available at: https://obr.uk/docs/dlm_uploads/Fiscal_risks_report_July_2021.pdf
Office for Budget Responsibility. (2024). Estimating the direct fiscal costs of flooding. Available at: https://obr.uk/box/estimating-the-direct-fiscal-costs-of-flooding/ (Accessed 23/03/2026).
Office for Budget Responsibility. (2025). Fiscal risks and sustainability (CP 1343). Presented to Parliament by the Exchequer Secretary to the Treasury, July 2025. ISBN 978‑1‑5286‑5653‑5. Available at: https://obr.uk/docs/dlm_uploads/Fiscal-risks-and-sustainability-report-July-2025.pdf
Office of Rail and Road (2025) Rail industry finance (UK): April 2024 to March 2025. Available at: https://dataportal.orr.gov.uk/media/ptafpcco/uk-rail-industry-finance-2425.pdf (Accessed: 23 March 2026).
Pettit, A., Kerr, H., JBA Consulting (2020). Property Flood Resilience – Scottish Baseline Study. ClimateXChange. Available at: https://doi.org/10.7488/era/493.
Rexer, Jonah Matthew & Sharma, Siddharth (2024). “Climate Change Adaptation : What Does the Evidence Say ?,” Policy Research Working Paper Series 10729, The World Bank.
Rising J, Dietz S, Dumas M, Khurana R, Kikstra J, Lenton T, Linsenmeier M, Smith C, Taylor C, Ward B (2022) What will climate change cost the UK? Risks, impacts and mitigation for the net zero transition. London: Grantham Research Institute on Climate Change and the Environment, London School of Economics and Political Science. Available at: https://www.lse.ac.uk/granthaminstitute/wp-content/uploads/2022/05/What-will-climate-change-cost-the-UK-risks-impacts-mitigation-1.pdf.
Sayers, P., Penning-Rowsell, E. C., & Horritt, M. (2018). Flood vulnerability, risk, and social disadvantage: current and future patterns in the UK. Regional environmental change, 18(2), 339-352.
Rivington, M., Akoumianaki, I and Coull, M. (2020). Private Water Supplies and Climate Change The likely impacts of climate change (amount, frequency and distribution of precipitation), and the resilience of private water supplies. CRW2018_05. Scotland’s Centre of Expertise for Waters (CREW). Available online at: crew.ac.uk/publications.
Savills (2026) Savills Welcomes Launch of Scotland’s Agritourism Investment Scheme as Timely Catalyst for Rural Diversification. Available at: https://www.savills.co.uk/insight-and-opinion/savills-news/388031/savills-welcomes-launch-of-scotland-s-agritourism-investment-scheme-as-timely-catalyst-for-rural-diversification (Accessed: 23/02/26, 14:00)
ScotRail (n.d.) About ScotRail. Available at: https://www.scotrail.co.uk/about-scotrail (Accessed: 23/03/2026).
ScotRail (2026) ScotRail launches finance procurement phase for new trains, Last updated: 27 February 2026. Available at: https://www.scotrail.co.uk/about-scotrail/news/scotrail-launches-finance-procurement-phase-new-trains-0 (Accessed: 23/03/2026).
Scottish Environment Protection Agency (SEPA) (2025). National Flood Risk Assessment 2025: Understanding Current and Future Flood Risk in a Changing Climate. December 2025. Available at: https://beta.sepa.scot/media/2kliy0j5/national-flood-risk-assessment-2025.pdf
Scottish Forestry (2025) An evaluation of the Forestry Grant Scheme 2015–2021. Available at: https://www.forestry.gov.scot/sites/default/files/pub-documents/PDF_Grants_and_Funding_Reviews_and_Evaluation_FGS_13082025_V1.0.pdf
Scottish Government. (2023a). £250 million funding package spend for peatland restoration: EIR release. Available at: https://www.gov.scot/publications/gbp250-million-funding-package-spend-for-peatland-restoration-eir-release/ (Accessed 15/03/2026).
Scottish Government (2023b). Mobilising private investment in natural capital. Available at: https://www.gov.scot/binaries/content/documents/govscot/publications/research-and-analysis/2023/04/mobilising-private-investment-natural-capital/documents/mobilising-private-investment-natural-capital/mobilising-private-investment-natural-capital/govscot:document/mobilising-private-investment-natural-capital.pdf
Scottish Government. (2023c). Tackling the impacts of climate change and water scarcity. Available at: https://www.gov.scot/news/tackling-the-impacts-of-climate-change-and-water-scarcity/
Scottish Government. (2024a). Scottish National Adaptation Plan 2024–2029. Available at:
https://www.gov.scot/publications/scottish-national-adaptation-plan-2024-2029-2/documents/
Scottish Government. (2024b). Natural capital market framework. Available at: https://www.gov.scot/binaries/content/documents/govscot/publications/advice-and-guidance/2024/11/natural-capital-market-framework/documents/natural-capital-market-framework/natural-capital-market-framework/govscot:document/natural-capital-market-framework.pdf
Scottish Government (2025a). Programme for Government 2025 to 2026. Available at: https://www.gov.scot/publications/programme-government-2025-26/pages/5/ (Accessed 09/03/2026).
Scottish Government (2025b) Scottish National Adaptation Plan Annual Progress Report 2024–2025. SG/2025/108. Edinburgh: Scottish Government. Available at: https://www.gov.scot/binaries/content/documents/govscot/publications/progress-report/2025/06/scottish-national-adaptation-plan-annual-progress-report-2024-2025/documents/scottish-national-adaptation-plan-annual-progress-report-2024-2025/scottish-national-adaptation-plan-annual-progress-report-2024-2025/govscot%3Adocument/scottish-national-adaptation-plan-annual-progress-report-2024-2025.pdf
Scottish Government (2025c) GDP Quarterly National Accounts, Scotland: 2024 Quarter 4 (October to December). Edinburgh: Scottish Government. Available at: https://www.gov.scot/binaries/content/documents/govscot/publications/statistics/2025/04/gdp-quarterly-national-accounts-2024-q4/documents/publication-download/publication-download/govscot%3Adocument/GDP%2BQNAS%2B-%2BPublication%2B-%2B2024Q4.pdf
Scottish Government (2025d). Scottish farm business income: Annual estimates 2023–2024. Available at: https://www.gov.scot/publications/scottish-farm-business-income-annual-estimates-2023-2024/pages/breakdown-of-farm-income/ (Accessed 23/03/2026).
Scottish Government (2025e) National Flood Resilience Strategy. Edinburgh: Scottish Government. Available at: https://www.gov.scot/binaries/content/documents/govscot/publications/strategy-plan/2024/12/national-flood-resilience-strategy-3/documents/national-flood-resilience-strategy/national-flood-resilience-strategy/govscot%3Adocument/national-flood-resilience-strategy.pdf
Scottish Government (2026a) Next step on bonds plan. Available at: https://www.gov.scot/news/next-steps-on-bonds-plan/
Scottish Government (2026b) Scottish Budget 2026 to 2027. Edinburgh: Scottish Government. Available at: https://www.gov.scot/publications/scottish-budget-2026-2027/ https://www.gov.scot/publications/scottish-budget-2026-2027/documents/
Scottish Government (2026c) Scottish Budget 2026 to 2027: climate change taxonomy. Edinburgh: Scottish Government. Available at: https://www.gov.scot/publications/scottish-budget-2026-2027-climate-change-taxonomy/documents/ (Accessed: 13/01/26)
Scottish Government. (2026d). The funding of local government in Scotland, 2026–2027. Available at: https://www.gov.scot/publications/funding-local-government-scotland-2026-27/pages/2/
Scottish Government (2026e) Water services – investing in and paying from 2027: consultation. Published 6 January 2026. Available at: https://www.gov.scot/publications/water-services-investing-paying-2027/pages/2/ (Accessed: 23/03/2026).
Scottish National Investment Bank. (2026). Gresham House Forestry Fund. Available at: https://www.thebank.scot/portfolio/gresham-house-forestry-fund (Accessed 23/03/26).
Scottish Water (2024) Scottish Water Climate Change Adaptation Plan. Available at: 290224ScottishWaterAdaptationPlan.pdf (Accessed 31/03/2026).
Scottish Water (2025b) 2024/25 Scottish Annual Report and Accounts. Performance and prospects. Available at: https://www.scottishwater.co.uk/-/media/ScottishWater/Document-Hub/Key-Publications/Annual-Reports/SCW2799-Annual-Report-2025_Interactive-FULL-V12-NOT-Signed-AG.pdf
Scottish Water (2026a) SR27 Business Plan 2027-2033 Technical Appendices. Dunfermline: Scottish Water. Available at: https://www.scottishwater.co.uk/help-and-resources/document-hub/key-publications/delivery-and-business-plans (Accessed: 23/03/2026).
Scottish Water (2026b). Dundee domestic smart monitoring trial. Available at: https://www.scottishwater.co.uk/In-Your-Area/Investments-in-Your-Area/150125-Dundee-Smart-Monitoring (Accessed 12/02/2026, 16:00).
Scottish Water (2026c) Final Business Plan 2027–2033: Investing in Scotland’s Future. Available at: https://www.scottishwater.co.uk/-/media/scottishwater/document-hub/key-publications/delivery-and-business-plans/business-plan-sr27/260226scottishwaterfinalbusinessplan2027to033.pdf (Accessed: 23/03/2026).
Scottish Water (2026d) Loch Katrine Woodland Creation and Peatland Restoration. Available at: https://www.scottishwater.co.uk/In-Your-Area/Investments-in-Your-Area/070125-Loch-Katrine-woodland-creation (Accessed 31/03/2026).
Shanahan, D., Bush, R., Gaston, K. et al. (2016) Health Benefits from Nature Experiences Depend on Dose. Sci Rep 6, 28551. Available at: https://doi.org/10.1038/srep28551.
Sniffer (2021). Evidence for the third UK Climate Change Risk Assessment (CCRA3) – Summary for Scotland. Available at: CCRA-Evidence-Report-Scotland-Summary-Final-1.pdf
Song, C., Atun, F., Blanford, J. I., & Anthony, C. (2025). Impact of flooding on the social and mental health of older adults-A scoping review. Water Security, 25, 100190.
SSE (2025) SSEN Transmission First Business to Sign the Highland Social Value Charter. Available at: https://www.sse.com/news-and-views/2025/11/ssen-transmission-first-business-to-sign-the-highland-social-value-charter/ (Accessed: 24/02/26, 15:00).
Taylor, R., England, K. and Eggert, A. L. (2025) Developing an Adaptation Investment Plan. Guidance for facilitators. Deliverable 3.1 of the CLIMATEFIT project.
Thomson, A. et al. (2025) UK Rural Land Use Archetypes – Part 2: Transforming Rural UK Land-Use to High-Carbon Store, Climate Resilient, Nature Rich and Economically Productive Systems. Prepared for the Climate Change Committee. Wallingford: UK Centre for Ecology & Hydrology (UKCEH). Available at: https://www.theccc.org.uk/wp-content/uploads/2025/05/UK-Rural-Land-Use-Archetypes-%E2%80%93-Part-2.pdf
Transport Scotland. (n.d.). The trunk road network. Available at: https://www.transport.gov.scot/transport-network/roads/the-trunk-road-network/#64509
Transport Scotland (n.d.) Scotrail Franchise. Available at: https://www.transport.gov.scot/public-transport/rail/scotrail-trains-limited-and-caledonian-sleeper-limited/
Transport Scotland (2025) Scottish Transport Statistics 2024. Chapter 10 Finance. Available at: https://www.transport.gov.scot/publication/scottish-transport-statistics-2024/
United Nations Environment Programme (2024). Adaptation Gap Report 2024: Come hell and high water — As fires and floods hit the poor hardest, it is time for the world to step up adaptation actions. Nairobi. Available at: https://doi.org/10.59117 /20.500.11822/46497.
Valverde, M.J., Tamayo Tabares, E., Umana, G., Neumann, T., Arvis, B., Cauchy, A., Bourkane, I., Tarpey, J., McDonald, H. & Tröltszch, J. (2022). Costs of Adaptation vs Costs of Inaction. Final Report. Prepared for the European Environment Agency. Ecologic Institute, 24 February 2022. Available at: https://www.ecologic.eu/sites/default/files/publication/2024/2633-10-Cost-of-Adaptation-vs-Cost-of-Inaction-web.pdf
Watkiss, P (2022). The Costs of Adaptation, and the Economic Costs and Benefits of Adaptation in the UK. Policy Paper.
Watkiss and England (2025): Adaptation finance and the private sector: opportunities and challenges for developing countries. Zurich Climate Resilience Alliance. Available at: https://www.mercycorps.org/sites/default/files/2025-09/zcra-private-finance-evidence.pdf
Watkiss, P., England., K., Hunt, A., Watkiss, O and Sayer. P. (2026a) The Costs of Adaptation: Analysis of the National Adaptation Programme 3. Supporting research to the Climate Change Committee. March 2026
Watkiss, P., England., K., Hunt, A., Watkiss, O and Sayer. P. (2026b) The Costs of Adaptation for UK Transport and Land Systems. Supporting research to the Climate Change Committee. March 2026
Westerhof, S. G., Booij, M. J., Van den Berg, M. C. J., Huting, R. J. M., & Warmink, J. J. (2023). Uncertainty analysis of risk-based flood safety standards in the Netherlands through a scenario-based approach. International Journal of River Basin Management, 21(3), 559–574. https://doi.org/10.1080/15715124.2022.2060243
Willis, K.G. et al. (2003) The Social and Environmental Benefits of Forests in Great Britain. Report to Forestry Commission Edinburgh. Newcastle: Centre for Research in Environmental Appraisal & Management (CREAM), University of Newcastle. Available at: https://www.forestry.gov.scot/sites/default/files/pub-documents/PDFReport_EconomicResearch_Social_Environment_Benefits_Forests_Main_Report_01072003.pdf
Woodland Carbon Code (2026) The Quality Assurance Standard for UK Woodland Carbon Projects. Available at: https://www.woodlandcarboncode.org.uk/ (Accessed: 09/12/26, 10:00)
World Bank (2019). Bangladesh Climate-Smart Agriculture Investment Plan: Investment Opportunities in the Agriculture Sector’s Transition to a Climate Resilient Growth Path. World Bank. Available at: http://hdl.handle.net/10986/32742
World Bank (2024). Climate Adaptation Costing in a Changing World. Washington, DC: World Bank. Available at:
https://documents1.worldbank.org/curated/en/099050224072021662/pdf/P179070140a07209a1b5d012d978862b4ff.pdf
Appendices
Decision tree for assessing private sector potential in adaptation. Image source: ADB, 2026.
Detailed methods: Network Rail Scotland
Network Rail Scotland calculated future adaptation investment needs using UKCP18 climate projections under two scenarios: RCP 6.0 (medium emissions, ~2°C warming by c.2055) and RCP 8.5 (high emissions, ~2°C by c.2045, ~4°C by c.2080). The analysis assumed maintaining current service levels and asset condition at Control Period 7 (CP7) * exit levels, aligned with CCC guidance from October 2025. However, it is important to note that this represents just one potential ‘investment future’. Ultimately there are multiple other plausible futures (including changes to service provision targets, transport modal shift, prioritisation of investment in rail, changes to safety tolerance levels, or other external factors) that would all likely have different adaptation investment needs associated with them.
Currently, Network Rail Scotland uses two complementary approaches to track weather and climate resilience investment for CP7. The top-down approach assesses standardised intervention types and applies nationally agreed percentages to reflect their contribution to resilience (e.g., 100% of cost attributed to drainage renewals would count towards ‘resilience’, recognising that this type of intervention is fundamentally about the management of water on their infrastructure. Whereas only 50% of the cost associated with overhead line renewals would contribute to resilience, recognising that the driver of renewal is likely condition of asset, but that the renewed asset is inherently more resilient to hot weather). A bottom-up approach uses expert-led qualitative engineering assessment to identify specific schemes contributing to network resilience. Together, the two approaches established a CP7 baseline of £400m total in asset interventions that deliver a weather and/or climate resilience benefit (2024/25–2028/29).
Network Rail Scotland’s future potential adaptation investment calculations are structured across multiple cost categories: operations and support (operational response to extreme weather, seasonal treatment trains, emergency speed restrictions); maintenance (preventative and reactive maintenance, inspections, monitoring); network resilience renewals catch-up (addressing current renewal backlog); network resilience renewals additional (business-as-usual renewals responding to enhanced asset degradation from climate change); and location-specific renewals (targeted interventions at sites with specific weather and climate challenges). Furthermore, estimates for major capital interventions – large-scale transformational schemes where continued operations would otherwise be impossible as a result of changing climate – are also calculated, though with a large uncertainty range.
For each category, subject matter experts developed cost ranges based on considerations such as historical data, operational experience, climate projections, asset models maintained by Network Rail Technical Authority, and anticipated increases in weather event frequency and severity. Estimates were produced for both operations, support, maintenance, and renewals (OSMR), as well as OSMR combined with the additional inclusion of major capital interventions. The estimates produced represent additional investment required in each of CP8 (2029/30–2033/34) and CP9 (2034/35–2038/39) above CP7 baseline levels.
For our research period 2026/27–2039/40, we assumed the following: CP7 remaining spend from 2026/27 onwards; full CP8 investment estimates; full CP9 investment estimates; and, a pro-rated single year for 2039/40 (one-fifth of CP9 costs). All figures from Network Rail Scotland were quoted in 2023/24 prices and uplifted to 2026/27 prices. These figures assume maintaining a broadly similar service level and asset condition to that of CP7 and should be interpreted as one plausible investment future only.
Network Rail Scotland are undertaking active work to refine and improve these cost estimates. As part of their Adaptation Pathways Programme, they are working at pace to understand what potentially vulnerable locations may require future adaptation investment – the outputs of this work will allow them to narrow the indicative investment cost ranges included in this study.
* A Control Period is Network Rail’s fixed five‑year funding and planning cycle that sets budgets and outputs for the railway (e.g., CP7: 1 Apr 2024 – 31 Mar 2029).
Detailed methods: Scottish Water
Scottish Water uses a wide range of climate and operational models to understand how future weather will affect its services in the Strategic Review (SR) SR27. This includes UKCP18 climate projections, water-resource models to assess drought impacts, catchment-deterioration models to understand future water-quality risks, rainfall-uplift and flood-modelling tools developed with UKWIR, Newcastle University and the Met Office, and mapping of flood and coastal-erosion exposure using SEPA flood maps and Dynamic Coast. Together, these tools allow Scottish Water to test resilience under both +2°C and +4°C global-warming scenarios.
Using these models, Scottish Water assessed 126 climate-related risks. Each risk was evaluated for both likelihood and impact, covering potential effects on customers, compliance, finances, health and the environment. This structured assessment helps the organisation prioritise where adaptation is most urgent and where investment will deliver the greatest resilience benefits.
Scottish Water’s adaptation actions fall into three categories: operational resilience, asset resilience, and service transformation. Most adaptation is embedded within core investment programmes, for example upgrading water-supply systems, wastewater networks and treatment works to cope with future rainfall and drought conditions. Some actions are key-driver investments where climate change is the primary reason for action, while others are retained risks where climate impacts are recognised but investment is not yet justified. A smaller set of actions are transformational, such as blue-green infrastructure, catchment-scale nature-based solutions and customer behaviour-change programmes.
For long-term planning, Scottish Water planning experts and technical consultants used early qualitative risk assessments to develop an indicative £2–5bn investment estimate for climate adaptation up to 2050. For the research period 2027/28–2039/40, SR27 spend (2027/28–2032/33) is taken directly from Scottish Water’s draft SR27 business plan. For the period 2033/34 onwards, the remaining budget — calculated by deducting the SR27 allocation from the lower and upper bounds of the £2–5bn long-term estimate — is distributed equally across annual periods from 2033/34 to 2049/50, with only the portion falling within the research window (2033/34–2039/40) included in the totals presented here. All figures provided by Scottish Water in 2024/25 prices have been uplifted to 2026/27 prices assuming 2% nominal growth per annum
Detailed methods and analysis: Modelling the economy-wide impacts of climate change adaptation spending.
Methodology:
For this work we have used the AMOSENVI, computable general equilibrium (CGE) model of the Scottish economy. The model captures all the sectors of the Scottish economy, aggregated into 30 broader sectors to allow us to trace the interactions between sectors and identify the drivers behind the results we observe. This is one of the key strengths of CGE modelling; it allows us to capture how the spending of different sectors to adapt to climate change affect prices and through that the wider Scottish economy.
Our model uses the 2019 edition of the Scottish Input-Output (IO) tables, published annually by the Scottish Government. This version is the latest currently available, where the Scottish economy is not affected by the Covid-19 pandemic or the Russian invasion of Ukraine and the impact it had on international energy prices. This way, 2019 data allow us to study how climate change adaptation spending might impact a version of the Scottish economy unaffected by major international incidents.
In our model, we assume that Scottish workers have the power to bargain for their wages, which is inversely related to the unemployment rate in the Scottish economy. This way, when unemployment is low, workers have the ability to bargain for higher wages and vice versa. However, we also assume that Scotland is an open economy, meaning that workers can freely migrate in and out of Scotland. When Scottish unemployment is lower and real wages are higher compared to the rest of UK (RUK) and the rest of the world (ROW), workers migrate to Scotland, increasing the labour supply. The opposite is true when Scotland experiences high unemployment and low real wages.
Wages are mostly important for the consumption of households. In this version of AMOSENVI, households are disaggregated to quintiles based on their gross income, with HG1 including 20% of the lowest income households and HG5 including 20% of the highest income households. Not all households are affected in the same way from changes in the economy, such as the climate adaptation spending, so this disaggregation allows us to capture the distributional impacts across the different household income groups. Households consume based on their disposable income, which is affected, apart from the wage and employment levels, from taxation such as income tax.
Income tax is a key, but not the only, source of revenue for the Scottish Government, which our model also includes. The income tax rate is normally fixed, but we also include scenarios where the income tax rate is adjusted to cover the cost of climate change adaptations in different sectors. Apart from raising revenue, the government also purchases goods and services from Scotland, RUK and abroad. Typically, government spending is fixed in real terms. However, for this work we use the government spending as a mechanism to model the adaptation spending.
Modelling adaptation spending
For the purpose of this work, we assume that climate change adaptation is a form of capital spending that does not create additional production capital for production sectors. Instead, it allows them to maintain the same production capacity, which would be at risk in the face of climate change.
This assumption has two main implications:
- The breakdown of each sector’s spending matches where they would spend their investments to create new capital or to maintain their existing capital.
- Climate change adaptation is a one-off spending. Once it is concluded and the associated cost is recovered, there is not further impact to the Scottish economy, which is gradually returning to its pre-spending level.
The latter assumption can be altered to assume the need for recurring spendings to address the challenges of climate change on an ongoing basis. However, to model the ongoing spending, more information is necessary to estimate how the adaptation cost might change over time and as climate change intensifies. Hence, we have opted to model a one-off spending based on the information currently available to us.
In terms of the spending, we model it as additional government purchases by the Scottish Government. Subsequently, we model the cost recovery in two main ways, depending on the sector that is adapting to climate change. We model a ‘government pays’ approach, where government covers the adaptation cost and raises the income tax to raise the necessary funds. Alternatively, we model an ‘industry pays’ approach, where the government still makes the necessary purchases of goods and services and then increases the indirect business tax rate of the adapting sectors so that they cover the adaptation cost.
Table D1: Climate adaptation spending in different parts of the Scottish economy (in 2025 prices).
|
Sector |
Sub-sector |
Investment estimate 2026-2040 (£m) |
Investment estimate 2026-2040 (£m/yr) |
|
Agriculture |
|
£2,269m |
£151m/yr |
|
Communities |
Regional hubs |
£98m |
£6.6m/yr |
|
Property flood resilience |
£867m |
£58m/yr | |
|
Flood protection schemes |
£578m |
£39m/yr | |
|
Natural environment c |
Woodland creation |
£1,769m |
£118m/yr |
|
Peatland restoration |
£909m |
£61m | |
|
Nature restoration |
£358m |
£24m/yr | |
|
Transport |
Rail |
£1,538m |
£103m/yr |
|
Trunk roads and motorways |
£8,170m |
£545m/yr | |
|
Water |
Scottish Water |
£1,009m |
£67m/yr |
We model the adaptation cost for 5 production sectors, as well as some more generic adaptation spending that is not linked to any specific production sector. The sectors, as well as the cost and who pays for it are reflected on Table D1. Please note that our original information included estimates in different price years. To improve the comparability between the different results, we adjust all the values in Table 1 and the values reported in our results to 2025 prices, using the UK GDP deflators.
Adaptation of Rail transportation
Constantly exposed to the elements, transportation services and their necessary equipment are facing the implications of climate change more than other sectors in the Scottish economy. Updates in different parts of the network and the trains themselves will be necessary to ensure that disruptions and safety concerns are kept to a minimum. Figure D1 presents how the adaptation spending of ‘Rail transportation’ is distributed across different Scottish sectors.
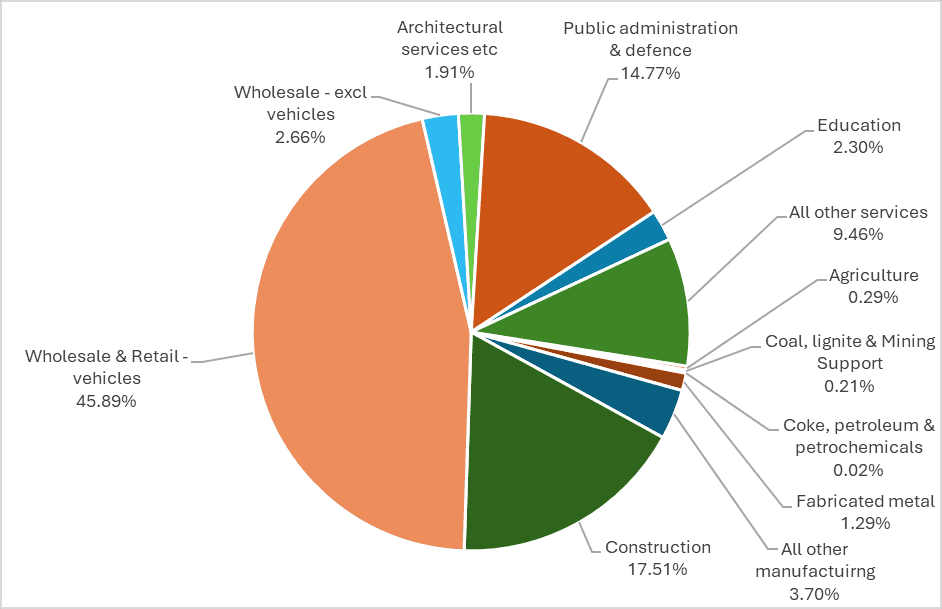 Figure D1. Breakdown of ‘Rail transportation’ adaptation spending
As we can see in Figure D1, ‘Rail transportation’ needs to spend a significant amount on construction services, to maintain and reinforce the rail network to cope with the effects of climate change. The most significant share of the spending though is directed to ‘Wholesale & Retail – vehicles’. This sector is most focused on the sales, maintenance and repair of vehicles, including trains and carriages, which is obviously crucially important for the expansion of the and maintenance of the trains. It is reasonable to expect then that similarly large spendings will be required in adapting to climate change. Besides those two sectors, some spending on engineering and relevant specialised services is expected, currently included in ‘All other services’.
The impacts in the absence of cost recovery
Climate adaptation spending introduces a demand shock to the Scottish economy that leads to gross domestic product (GDP) and employment gains. The gains are originally observed in the sectors delivering the rail adaptation activity. Shortly after, the additional employment required to deliver the adaptation and the wage gains that this employment requirements drive, trigger an increase in household consumption that fuels further GDP and employment gains. See Figure D2.
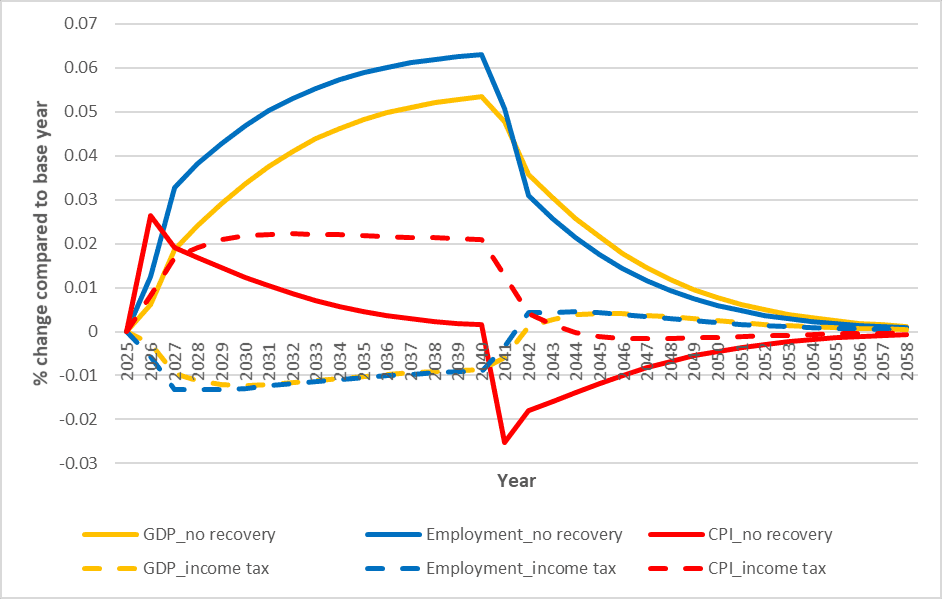
Figure D2. Scottish GDP, employment and CPI impacts from climate change adaptation spending in Rail Transportation
The GDP gains peak at the end of the spending period in 2040[5], as are the employment gains. By 2040, the Scottish GDP grows by 0.54% (£99m in 2025 prices) along with the creation of 1,490 full-time equivalent (FTE) jobs (0.063% employment gains). Interestingly, the economy-wide prices, reflected by the consumer price index (CPI) are peaking in the first year of the adaptation spending, when we observe the Scottish CPI increasing by 0.026%. This price increase is fuelled by the demand for workers, which pushes the cost of workers upwards. Subsequently, more workers migrate to Scotland to benefit from the increased employment opportunities and the higher wages. The expansion of the labour force eases the pressures on wages, so we observe smaller price increases despite the increased employment and household consumption.
The gross value added (GVA) and employment impacts are not distributed uniformly across all the sectors. As shown in Figure D3 for 2040, most GVA is generated in sectors heavily involved in delivering the climate adaptation of ‘Rail transportation’. Further gains are achieved in sectors where households spend their additional income, such as ‘All other services’. In all other sectors the gains are negligible.
Figure D3. 2040 gross value-added impacts per sector due to climate adaptation spending in Rail Transportation
We observe a similar picture in relation to employment (see Figure D4). Some small differences are present, depending on the labour intensity of each sector, but broadly the picture resembles what we see for GVA. An important thing to point out is that in the absence of cost recovery considerations, all Scottish sectors benefit, or at least are unaffected, by the climate adaptation spending for ‘Rail transportation’.
However, all these impacts are temporary. Figure D2 indicates that shortly after the end of the climate adaptation spending, the gains are eroded with the economy returning to the original levels[6]. Approximately 15 years after the end of the spending period, almost none of the benefits from the adaptation spending can be observed.
Figure D4. 2040 employment impacts per sector due to climate adaptation spending in Rail Transportation
The effect of cost recovery via the income tax
The results change both qualitatively and quantitatively if we also consider how the costs will be recovered. For ‘Rail transportation’, because of the nature of the infrastructure that will need to be adjusted, we assume that it will be the government paying for the adaptation and therefore recovering the cost. We have considered the adjustment of the income tax rate as a mechanism to raise the funds required to deliver climate change adaptation in ‘Rail transportation’.
Figure D2 demonstrates that when the adaptation costs are recovered via increases in the income tax, the GDP and employment gains are reversed and the Scottish economy is, temporarily, negatively affected. Income tax increases affect the economy in two main ways. First, a higher income tax restricts the disposable income of households. The lowest income quintile, HG1, is largely unaffected by the income tax increase, while the highest income households of HG5 are observing the highest, in both percentage and absolute terms, real income losses. This reduction in households’ real disposable income, erodes any potential gains emerging from increased household consumption.
Second, the income tax increase is to some extent internalised by the employers as part of the wage bargaining process. Therefore, even though the real take home wage of employees decreases due to increased unemployment, the labour cost to businesses increases, pushing their production cost upwards. This is reflected in the higher, and longer-lasting, CPI impacts when the costs are recovered via the income tax. The higher economy-wide prices further erode household consumption, while also reducing the competitiveness, and by extension the exports, of Scottish sectors, further contributing to the negative economy-wide outcomes.
Of course, similarly to the ‘no recovery’ case, the impacts are not distributed evenly across all the sectors (see Figure D3 and Figure D4). The heavy involvement of ‘Wholesale/Retail – vehicles’, ‘Construction’ and ‘Public admin/defence’ in delivering the adaptation spending, somewhat insulates them against the effects of the income tax increases and allows them to still achieve, smaller scale, GVA and employment gains. Other sectors like ‘All other services’ experience a radical reversal of their GVA and employment impacts, reflecting the combined effects of higher labour costs and lower household consumption.
Adaptation of the Agriculture sector
Undoubtedly, one of the sectors that are most likely to be affected by climate change, and therefore requiring significant spending to adapt to the potential changes, is agriculture. However, it is an umbrella sector encompassing a wide range of products, farming techniques and technologies. Hence, the range sectors involved in adapting agriculture production to the challenges of climate change is expected to be broad. Figure D5 demonstrates this wide range of sectors.
Figure D5. Breakdown of ‘Agriculture’ adaptation spending
The breakdown for ‘Agriculture’ adaptation spending is quite different to the spending for ‘Rail transportation’. Here, ‘Construction’ is expected to play a more significant role, which is to be expected as new infrastructure will be required to ensure the ongoing agricultural production. Other large spendings are expected in part of the ‘Agriculture’ sector itself, as well as on ‘All other manufacturing’ and ‘Wholesale/Retail – vehicles’.
Agriculture adaptation without cost recovery
In may ways, the climate adaptation spending for ‘Agriculture’ leads, qualitatively, to the same impacts as in the ‘Rail transportation’ case, in the absence of cost recovery. Quantitatively though the impacts are different, driven in part by the large spending required for the adaptation of ‘Agriculture’ and the different composition of sectors involved. The qualitative similarities of the two adaptation cases can be visually confirmed by comparing Figure D6 to Figure D2.
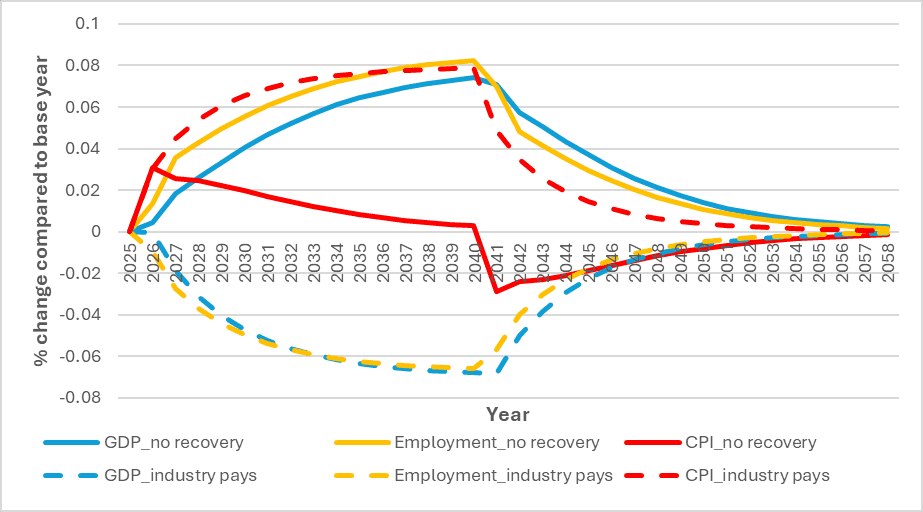
Figure D6. Scottish GDP, employment and CPI impacts from climate change adaptation spending in Agriculture
One notable difference between the two cases is that employment more closely tracks the GDP impacts, both time-wise and as a percentage change. The smaller gap between the employment and GDP impacts in the ‘Agriculture’ case suggests that the sectors involved in the adaptation spending of this sector are more capital- and less labour-intensive compared to the sectors involved in the adaptation of ‘Rail transportation’.
Furthermore, the distribution of the GVA and employment gains across the different sectors is also different to the ‘Rail transportation’ case (see Figure D7 and Figure D8), as is greatly influenced by the breakdown of the sectors that deliver the ‘Agriculture’ adaptation (shown in Figure D5). Despite the differences in the distribution, some qualitative characteristics remain the same, in that a small number of sectors contribute around 80% of the total GDP gains and that again 80% of the employment gains are concentrated in the same small number of sectors.
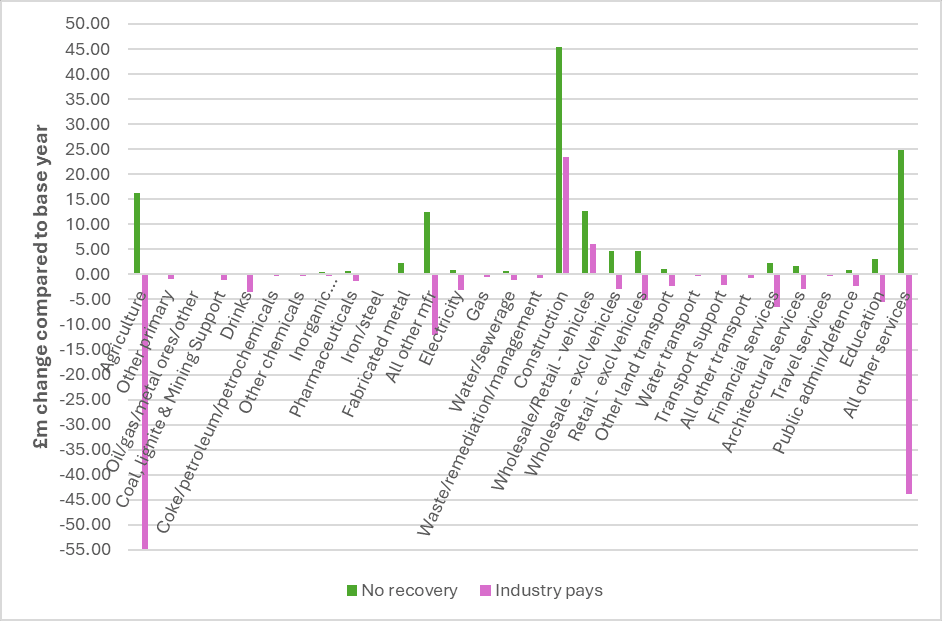
Figure D7. 2040 gross value-added impacts per sector due to climate adaptation spending in Agriculture
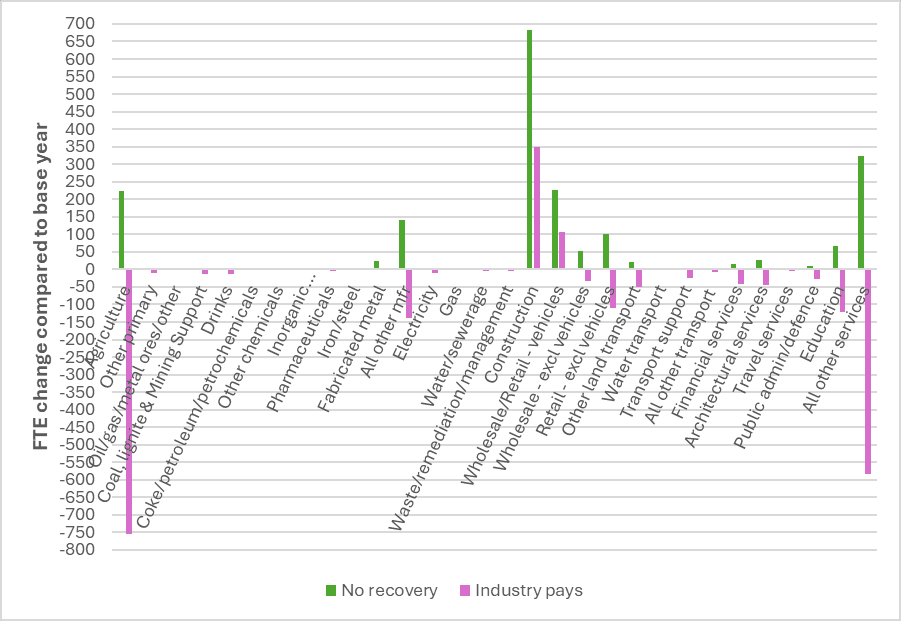
Figure D8. 2040 employment impacts per sector due to climate adaptation spending in Agriculture
Accounting for ‘who pays’ for the ‘Agriculture’ adaptation
In the ‘Rail transportation’ case we assumed that the sector itself, and the infrastructure developments that may be required, meant that the government was likely to pay the adaptation cost and recover it via fiscal instruments, such as changes in the income tax rate.
‘Agriculture’ though is different, with many small producers contributing to the sector rather than consisting of a handful of firms. This being the case, it is very likely that the farmers themselves will have to cover the adaptation cost and subsequently pass it to the consumers via the price of their farming goods. This ‘industry pays’ approach leads to different impacts across the wider economy. A key difference is that an ‘industry pays’ approach is regressive in nature. Indeed, looking at the CPI for each household group we can see that, by 2040, the lowest income households in HG1 experience broader price increases of 0.088%, while the highest income households in HG5 experience price increases of 0.073%. The difference is driven in part by the spending in agricultural produce, which is a larger share of the total consumption of low-income households; hence, any price increases in agriculture products leads to greater CPI pressures to this specific income quintile.
Generally, agriculture products are an important component of the consumption of all households and a price increase to recover the adaptation spending can trigger the significant economy-wide CPI pressures observed in Figure D6. These economy-wide price increases erode the purchasing power of all households and lead to reduced household consumption, reduced GDP and employment. Coupled with the export losses that increased prices trigger, lead to the negative picture presented in dashes in Figure D6.
A further important implication of the ‘industry pays’ approach here is that it affects one of the most labour-intensive sectors in the Scottish economy, employing 8.5 FTE workers per £m of output. With concentrated impacts on the sector, we see in Figure D8 that significant employment losses are triggered, contributing to the larger net employment losses across the Scottish economy.
In an economy where movement of labour in and out of the economy is challenging, the unemployment increase associated with job losses would trigger labour cost reduction processes that would help cushion the negative impacts to the economy. However, we assume that workers can move freely in and out of Scotland. Increased unemployment and reductions in the real wage, fuelled by the CPI increase, incentivise workers to leave Scotland, ultimately easing the changes in the unemployment rate. But this prevents the cushioning labour cost reductions from materialising, leading to reduced employment, reduced purchasing power per worker, but also higher labour costs for the businesses. The combination of all these effects leads to the significant economy-wide losses, throughout the cost recovery period.
Agriculture: Climate adaptation exploratory analysis
This case study presents an exploratory analysis of the costs associated with climate adaptation actions for Scottish agriculture. It draws on thirty-three actions identified as suitable for the Scottish context in a report published for the Scottish Government’s Rural and Environment Science and Analytical Services (RESAS). Available evidence, targets, and contextual information – see supplementary data – were used to estimate the potential deployment of each action across Scotland. Costs were scaled using land use archetypes from the Climate Change Committee’s Rural Land Use Types report (Thomson et al., 2025). The resulting estimates should be regarded as first-pass figures requiring further expert elicitation to be refined. Where the scope of the analysis permitted, an exploratory cost-benefit analysis was undertaken for selected actions, examining potential impacts on yields, soil erosion, disease risk, productivity, and biodiversity.
Action Identification
The thirty-three adaptation actions drawn from the RESAS report span arable, pastoral, and universal categories, and carry ratings for both impact and complexity across three levels: low, medium, and high. Prior to costing, two actions were excluded on the grounds that they are implicitly captured within the overarching action ‘diversifying Ccrop rotations’: namely, ‘crop introductions and diversification’ and ‘use of more resistant crop varieties’.
Cost information
Cost information was sourced from academic and grey literature, with a confidence rating (low, medium, or high) assigned to each source. Of the thirty-three actions, cost estimates were successfully obtained for twenty-one. The remaining twelve could not be costed due to an absence of relevant literature with associated expenditure data. In addition, two further actions identified during the literature review process — biocontrol and organic conversion — were incorporated into the analysis on the basis that sufficient cost data were available. Both were considered of material relevance to Scottish agriculture. All costs were adjusted to 2026/27 prices and converted to pound sterling where necessary. Further detail regarding the specific assumptions underpinning individual cost estimates is provided in the supplementary data.
Scaling costs
To scale unit adaptation costs (typically expressed in £/ha) to the applicable Scottish agricultural land area, the Climate Change Committee’s Rural Land Use Types report was employed (Thomson et al., 2025). This report disaggregates Scotland’s total agricultural land stock into ten archetypes, of which the six largest were selected for this analysis, together accounting for 97.9% of Scottish agricultural land: highly degraded lowland organic soils (117,300 ha); degraded upland grazing land and forest on organic soils (619,900 ha); hilly farmland on improved and semi-natural grassland on non-organic soils (106,400 ha); open pasture on the upland fringe (814,300 ha); acid grasslands on hilly uplands (767,400 ha); and arable on sandy soils (511,900 ha).
The report further disaggregates each archetype by land cover, as illustrated in Figure E1, across categories including arable and horticulture, acidic grassland, and coniferous woodland. These breakdowns were used to delineate the proportion of each archetype applicable to the scaling of adaptation action categories: arable, livestock, grassland, and universal.
Where data on the current extent of action deployment were available, this was deducted from the target area prior to scaling, ensuring that cost estimates reflect remaining deployment requirements rather than total potential coverage. The general scaling methodology proceeded as follows: the per-hectare cost of each action was multiplied by the applicable target area and, where actions were costed on an annual basis, further multiplied by the fourteen-year adaptation period to produce a total cost estimate covering 2026/27 to 2039/40. In certain cases, e.g., the application of green pesticides, the number of applications per year was incorporated into the calculation before extrapolation across the full period. Full details of the assumptions and methodologies applied to individual actions are provided in the supplementary data.
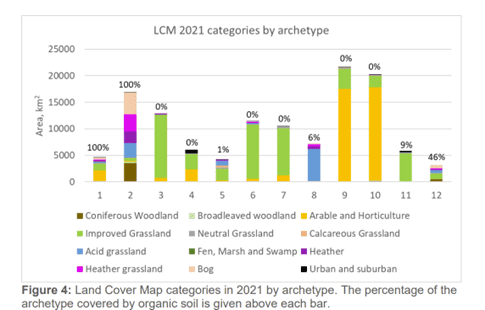
Figure E1: Land Cover Map categories in 2021 by archetype. The percentage of the archetype covered by organic soil is given above each bar – fig.4 from Thomson et al. (2025) – used to assist adaptation action cost scaling.
Complete scaled exploratory cost estimates for the fourteen-year period were produced for nineteen adaptation actions in total, presented in full in Supplementary Table X with associated confidence ratings and contextual information. A subset of six illustrative actions is excerpted in Table E1.
Table E1: Six example adaptation actions with associated scaled costs.
|
RESAS action |
RESAS category |
Action cost estimate |
Target area (ha) |
Scaled cost (2026-40) |
|
Diversified crop rotations – Impact: HIGH, complexity: LOW |
Arable | £254/ha implementation and £495/ha/yr running [7] |
482035 |
£3,462,939,440 |
|
Alterative tillage techniques – Impact: HIGH, complexity: MEDIUM |
Arable | £814/ha implementation and £42/ha/yr running[8] |
431272 |
£604,643,344 |
|
Adjusting or reducing stocking rates – Impact: HIGH, complexity: LOW |
Livestock | £69.46/ha/yr [9] |
1755415 |
£1,707,035,763 |
|
Virtual fencing technology – Impact: MEDIUM, Complexity: MEDIUM |
Livestock | £3791 set up + £57 per collar [10] |
N/A |
£531,990,570 |
|
Enhanced production on marginal land – Impact: LOW, complexity: HIGH |
Grassland | Government budget for LFA is £65.5M for 2026/27 [11]LFA is 86% of total agricultural land (5.16M ha12]) = 4.44M haCost per hectare of LFA: £14.76/ha/yr13 |
1419739.6 |
£293,374,991 |
|
Agrivoltaics – Impacts: MEDIUM, Complexity: HIGH |
Universal | Capital expenditure £7950/ha AND operational expenditure: £4300.96/ha/yr 14 |
3237 |
£220,645,055 |
Exploratory cost-benefit analysis
Exploratory cost-benefit analysis (CBA) was undertaken for the adaptation action ‘diversified crop rotations’, examining potential monetary benefits resulting from this action. These included increased crop yields of between 10% and 25%; reduced losses from soil erosion of up to 90%; and fertililser usage savings of 30%.
The result, shown in Table E2,outlines the potential monetised benefits between 2026 and 2040 of £1.1bn- £856M. This means that 24.7% to 31.4% of the total could be returned by increased crop yields, reduced losses and reduced fertiliser cost.
This is not an exhaustive CBA but indicative of the potential of these actions relative to a do-nothing scenario.
Table E2: Exploratory cost benefit analysis for diversified crop rotation
|
Cost benefit description |
+25% yield value |
+10% yield value |
Crop yield increase of 10-25% [15]1.53B total crop output (2024) [16] |
£382,500,000.00 |
£153,000,000.00 |
Reduced losses of up to 90% in yield value from soil erosion (calculated using +10% and +25% yield value)Approx 19.2% of Scottish arable land at risk of soil erosion[17]Assume therefore, that 19.2% of crop output value (1.53B) at risk consequently.Soil erosion causes losses in crop productivity of 0.43% [18] |
£19,894,896.00 |
£17,507,508.48 |
30% fertilizer cost saving relative to cost of fertilizers currently widely in use.19Total UK spend on fertilizer 2023 = £1.36 Billion 20Scotland share of UK agricultural land = ~12% |
£685,440,000.00 |
£685,440,000.00 |
|
Total monetised benefits |
£1,087,834,896.00 |
£855,947,508.48 |
|
Diversified crop rotations scaled cost (base) |
£3,462,939,440.00 | |
|
NET COST of diversified crop rotations after accounting for savings in fertilizer usage, reduced losses from soil erosion and increased yield value, all as a direct result of this action (= Base cost – Total monetised benefits) |
£2,375,104,544.00 |
£2,606,991,931.52 |
Several important limitations should be noted when interpreting these results:
- Cost estimates assume that each action is applied across all land eligible for that measure, which is likely to overestimate real-world uptake; results should therefore be interpreted as upper-bound estimates.
- In practice, interventions would be carefully selected and targeted, and not all actions would necessarily be deployed across the full eligible area.
- Limited data on the current extent of adaptation adoption makes it difficult to accurately determine the remaining deployment gap for individual actions.
- Cost data were unavailable for several actions that are nonetheless considered significant for Scottish agricultural adaptation; these would benefit from dedicated expert costing exercises.
- The analysis does not account for the potential impact of increasing climate risk on the cost or effectiveness of adaptation actions over the period.
Scaling was not feasible for certain actions due to data limitations. Costing shelterbelts, for example, would require data on the total perimeter of agricultural land. Costing enhanced livestock housing design would require detailed information on existing infrastructure and the degree of upgrade required. In the latter case, the only cost data identified were sourced from European literature, providing a range of €5,000 to €100,000 per unit — figures that may not be directly transferable to the Scottish context.
Wider policy and economic context for agriculture:
Policy context
The Agricultural and Rural Communities (Scotland) Act 2024 set out the legal framework for transforming Scotland’s farm support system, replacing former Common Agricultural Policy (CAP) schemes with a four‑tier framework by 2027. The reforms aim to shift agricultural support toward delivering environmental and climate outcomes while still underpinning food production and rural livelihoods. Central to this shift is the Whole Farm Plan, which requires farmers to baseline their environmental performance and adopt practices that reduce emissions, restore nature, and improve efficiency. Implementation will be gradual: initial changes begin in 2025, consolidation of payments and “Enhanced Greening” follow in 2026, and by 2027-28 the full framework, alongside new agri‑environment, forestry, and capital support measures, will be in place.
Overall, the new system moves from unconditional payments to support linked to specific outcomes across Tiers 1–4, balancing farm productivity with climate adaptation, mitigation, and biodiversity goals. Tier 1 provides core direct income support, evolving from the Basic Payment Scheme but tied to meeting baseline environmental and regulatory standards. Tier 2 rewards enhanced environmental delivery, including greening measures and likely future integration of the Less Favourable Area Support Scheme (LFASS). Tier 3 offers elective, targeted support for specific environmental or land‑management actions, replacing schemes like AECS and FGS. Tier 4 delivers complementary capital grants, skills development, and advisory services to help businesses adopt new practices. While the approach builds on what many farms already do, Tier 2 and Tier 3 are expected to drive the greatest climate‑adaptation impacts – though separating adaptation from mitigation remains a challenge in practice. The subsidy landscape is likely to continue evolving as budgets and schemes consolidate under the new structure. More information available at: 0624 Future Support Briefing.pdf
Economic context
Figure F1: Breakdown of contributions to farm income by farm type, 2023-24. Source: Scottish Government, 2025d.
How to cite this publication:
Brett, L., White, C.J., England, K., Calvillo Munoz, C., Roberts, J.J. (2026) ‘Investigating climate change adaptation investment need across five sectors in Scotland (2026 – 2040)’, ClimateXChange. DOI: https://doi.org/10.7488/era/7087
© The University of Edinburgh, 2026
Prepared by the University of Strathclyde on behalf of ClimateXChange, The University of Edinburgh. All rights reserved.
While every effort is made to ensure the information in this report is accurate as at the date of the report, no legal responsibility is accepted for any errors, omissions or misleading statements. The views expressed represent those of the author(s), and do not necessarily represent those of the host institutions or funders.
This work was supported by the Rural and Environment Science and Analytical Services Division of the Scottish Government (CoE – CXC).
ClimateXChange
Edinburgh Climate Change Institute
High School Yards
Edinburgh EH1 1LZ
+44 (0) 131 651 4783
The figures represent one scenario-based estimate of potential adaptation-related spend required to maintain current service levels under future climate conditions – there are many potential future scenarios, each returning different potential investment requirements. ↑
Note Scottish Water estimates are for 13 years from 2027/28 – 2039/40. ↑
The figures represent one scenario-based estimate of potential adaptation-related spend required to maintain current service levels under future climate conditions – there are many potential future scenarios, each returning different potential investment requirements. ↑
Note Scottish Water estimates are for 13 years from 2027/28 – 2039/40. ↑
We have modelled the impacts based on the available estimates on adaptation spending over the next 15 years, until 2040. If further adaptation spending is required then the economy-wide impacts will continue. In that case more analyses will be needed to explore the implications of extended adaptation spending. ↑
The modelled shock to the economy has completed, so in the absence of a shock the economy returns back to the baseline. ↑
https://ieep.eu/wp-content/uploads/2024/07/The-costs-and-benefits-of-transitioning-to-sustainable-agriculture-IEEP-2024.pdf ↑
- https://ieep.eu/wp-content/uploads/2024/07/The-costs-and-benefits-of-transitioning-to-sustainable-agriculture-IEEP-2024.pdf
- https://www.gov.wales/sites/default/files/publications/2023-12/atisn19234doc1.pdf ↑
10. https://doi.org/10.33988/auvfd.837485 ↑
11. https://www.gov.scot/publications/scottish-rural-development-programme-2014-2020-ex-post-evaluation-annex-scheme-summary-report/pages/11/ ↑
12. https://www.gov.scot/publications/results-from-the-scottish-agricultural-census-june-2024/pages/most-of-scotlands-area-is-used-for-agriculture/ ↑
13. https://www.gov.scot/binaries/content/documents/govscot/publications/corporate-report/2026/03/scottish-budget-2026-2027/documents/scottish-budget-2026-2027/scottish-budget-2026-2027/govscot%3Adocument/scottish-budget-2026-2027.pdf (Table 11/02) ↑
14. https://www.sciencedirect.com/science/article/pii/S0038092X24004390 ↑
15 (PDF) Benefits of Crop Rotation (UK Scenario) 25032025 ↑
16. Value of output remains stable – Total income from farming estimates: 2018-2024 – gov.scot ↑
17. https://www.gov.scot/publications/developing-method-estimate-costs-soil-erosion-high-risk-scottish-catchments/pages/8/ ↑
18. https://onlinelibrary.wiley.com/doi/full/10.1002/ldr.2879 ↑
19 (PDF) Benefits of Crop Rotation (UK Scenario) 25032025 ↑
20. Value of output remains stable – Total income from farming estimates: 2018-2024 – gov.scot ↑