
Approaches to measuring greenhouse gas emissions in Scotland’s tourism sector
Research completed: October 2025
DOI: http://dx.doi.org/10.7488/era/6761
Executive summary
Aims
This report sets out how the Scottish Government and its delivery partners can develop an approach to measure greenhouse gas (GHG) emissions from Scotland’s tourism sector in a way that is credible, repeatable and useful for policy. It considers approaches used elsewhere and tests them against Scotland’s data landscape and potential policy needs. The primary aim is to identify a practical methodology that can deliver a reliable national‑level estimate and enable tracking of the impact of actions taken to reduce emissions over time.
The report also examines the scope for meaningful disaggregation so that results can inform place‑based policy and operational decisions. For example, by geography, subsector or activity, visitor type and accommodation type.
The approach identified must balance coverage, granularity, cost, and capacity, align with established GHG measurement practices used elsewhere in the Scottish Government, and be maintainable through routine updates.
Findings
There is a great deal of consensus on the definition of “tourism” and GHG measurement frameworks. Studies were found to adopt definitions of tourism set out in the International Recommendations for Tourism Statistics (IRTS) (UN Statistics Division, 2008) and organise indicators according to the United Nations World Tourism Organisation’s (UNWTO) Measuring the Sustainability of Tourism (MST) framework (UN Tourism, 2024). This understanding of the tourism sector sets out what is counted, enables disaggregation of results and supports comparability across time and place.
To accurately define the economic boundary of tourism, studies used statistical accounting tools called Tourism Satellite Accounts (TSA). A TSA matches visitor expenditure by product – such as accommodation, food and drink, passenger transport – to the industries that produce them. The share of each product or industry’s total output purchased by visitors, rather than residents, is isolated using established “tourism ratios”. This method allows for both production‑based (territorial) reporting, which counts emissions where they physically occur within a nation’s borders, and consumption‑based (footprint) reporting, which counts emissions driven by visitor demand, including supply chains and international transport. Both perspectives appear in advanced studies, especially where transport and imported goods are significant.
We identified four major methodology types for assessing GHG emissions in tourism:
- Environmentally‑Extended Input-Output (EEIO) analysis, including Multi‑Regional Input-Output (MRIO) analysis, links visitor expenditure to a nation’s Input-Output (IO) tables and environmental extensions, to produce economy‑wide carbon footprints that are repeatable and compatible with national accounts. An IO table is a map of the economy which shows how industries buy from and sell to each other. EEIO analysis links that IO map to environmental data to estimate GHG emissions. MRIO extends this analysis to multiple regions, capturing emissions from international supply chains and imports.
- A Life Cycle Assessment (LCA) provides fine‑grained, bottom‑up evidence for assets and services (per guest‑night or per passenger‑kilometre), which is powerful for operational decisions but, on its own, is rarely used to provide a complete national footprint.
- Hybrid EEIO-LCA approaches blend coverage with granularity, pairing macro coverage with site‑level diagnostics.
- Survey‑based methods offer rapid, first‑hand behavioural evidence that can be used alone or to improve assumptions in other models.
EEIO is commonly recommended when robust economic accounts are available. LCA is often preferred for detailed, site-level action planning. EEIO/LCA hybrid models are complex but emerging as they combine completeness with granularity. Survey-based methodologies are useful for capturing regional behaviour and supplementing other approaches. These four methodology types are colour-coded by their ability to meet the aims of this project in Table 1 below. While Scotland has good survey infrastructure in the form of the International Passenger Survey (IPS) (Office for National Statistics, 2025a) and Great Britain Tourism Survey (GBTS) (UK Government, 2025), these are not currently set up to facilitate the calculation of a carbon footprint.
Table 1: Summary of the four methodology groups identified in this study and their ability to meet the aims of this project.
Methodology | Current data availability in Scotland | Ability to provide national overview | Disaggregation potential | Ease of replication/ update | Effort required |
Environmentally Extended or Multi-Regional Input-Output analysis (EEIO/MRIO) | Somewhat suitable | Most suitable | Most suitable | Most suitable | Somewhat suitable |
Life Cycle Assessment (LCA) | Somewhat suitable | Least suitable | Most suitable | Somewhat suitable | Least suitable |
EEIO/LCA hybrid | Somewhat suitable | Most suitable | Most suitable | Least suitable | Least suitable |
Survey-based methods | Least suitable | Somewhat suitable | Most suitable | Most suitable | Somewhat suitable |
Recommendations
The distinctive nature of Scotland’s tourism sector requires a tailored measurement approach. Visitor activity spans accommodation, food and drink, passenger transport, attractions and leisure services, each with distinctive energy sources and supply chains. Clearly identifying the share of these activities undertaken by visitors, as opposed to residents, is essential for accurately measuring tourism’s impact, differentiating it from other sectors of the economy.
Scotland’s geography and emphasis on rural tourism amplify the importance of transport emissions – such as those released through connecting flights via other UK hubs, ferries, short‑haul aviation and heavy private‑vehicle use – while workforce seasonality and shared facilities also complicate attribution of both emissions and economic impact. Post‑COVID dynamics add further complexity: domestic demand and operating conditions have shifted, and behaviours such as length of stay and transport mode may not have fully stabilised. These factors make pragmatic boundary‑setting, baseline selection and assumption clarification critical.
In the main body of the report, we make a number of recommendations about the general approach and relevant considerations for each of the methodology types shown above. Our headline recommendation is to take a proportionate, staged pathway that matches effort to ambition:
- Conduct a thorough audit of the available data for Scotland, including but not limited to the Scottish Input-Output tables and their environmental extensions (Scottish Government, 2024), the Air and Energy accounts (ClimateXChange, 2020), key surveys such as the International Passenger Survey (IPS) (Office for National Statistics, 2025a) and the Great Britain Tourism Survey (GBTS) (UK Government, 2025) for information on expenditure and mode shares, and associated datasets for key sectors such as transport and hospitality.
- Establish an EEIO baseline, which should serve as the analytical backbone. Regular updates derived from repeated survey data can be used to refine this model, ensuring transparency and continuity while acknowledging the technical complexities involved.
- Plan for a Scotland‑specific Tourism Satellite Account where greater precision or international comparability is required. This could strengthen sector splits and, where evidence allows, add geographical disaggregation to support place‑based policy.
- LCA pilots could be run for selected assets or services, if more operational insight is needed. The findings could be used to validate and refine baseline assumptions.
Over time, these elements could be integrated into a hybrid framework under formal governance and quality assurance, reporting both production‑ and consumption‑based perspectives for clarity.
Future measurement should be grounded in shared definitions, transparent boundaries and a practical choice of method. Beginning with an EEIO baseline based on what is possible with current data availability, and building capability in phases, we can provide a clear, low‑risk route to a baseline and repeatable evidence base which would allow policy and industry needs to track emissions over time.
Glossary/Abbreviations table
|
CAA |
Civil Aviation Authority |
|
CRT |
Centre for Regional and Tourism Research |
|
CXC |
ClimateXChange |
|
DfT |
Department for Transport |
|
EEIO |
Environmentally-Extended Input-Output |
|
GBTS |
Great Britain Tourism Survey |
|
GHG(s) |
Greenhouse gas(es) |
|
IO |
Input-Output |
|
IPCC |
Inter-Governmental Panel on Climate Change |
|
IPS |
International Passenger Survey |
|
IRTS |
International Recommendations for Tourism Statistics |
|
ISO |
International Standards Organisation |
|
LCA |
Life Cycle Assessment |
|
MRIO |
Multi-Regional Input-Output |
|
MST |
Measuring the Sustainability of Tourism |
|
ONS |
Office for National Statistics |
|
SEEA |
System of Environmental Economic Accounting |
|
SNA |
Systems of National Accounts |
|
THILG |
Tourism and Hospitality Industry Leadership Group |
|
TSA |
Tourism Satellite Account |
|
UNEP |
United Nations Environment Programme |
|
UNWTO |
United Nations World Tourism Organisation |
|
WTTC |
World Travel and Tourism Council |
Introduction
Background and context
The Scottish Government has set a legally binding target to reach net-zero greenhouse gas (GHG) emissions by 2045. Scotland’s tourism sector features prominently in this ambition: Scotland Outlook 2030 (Scotland Outlook 2030 – Scotland’s national tourism strategy, 2024) frames climate action as a core principle of the visitor economy, and the industry’s signature of the Glasgow Declaration on Climate Action in Tourism (One Planet Sustainable Tourism Programme, 2021) underlines a shared commitment to measurable progress. The Tourism and Hospitality Industry Leadership Group (THILG) has therefore asked its Net Zero Mission Group to define a pathway that will align the sector with Scotland’s broader carbon-reduction trajectory.
A robust pathway starts with reliable data on tourism GHG emissions, yet current inventories report emissions only for broad categories such as transport or buildings and do not isolate the contribution of visitor activity. Tourism cuts across passenger transport, accommodation, food and drink, culture, retail and outdoor recreation, each with distinctive supply chains and energy profiles. A tailored methodology to measure GHG emissions in Scotland is therefore required. This should capture the sector’s diversity, reflect the country’s dispersed geography and island networks and align where feasible with international guidelines and comparative studies. It should also consider the extent to which it complements accounting frameworks used elsewhere in Scotland’s economy. Selecting an appropriate method also raises practical questions; it should suit plausible timeframes, budgets, and analytical capacity, make fullest use of existing resources, and flag where new data collection would be needed.
Report aims and measurement approach
This report aims to identify a practical methodology that can deliver a reliable national‑level estimate of GHG emissions from Scotland’s tourism sector and support robust tracking of the impact of actions taken to reduce those emissions over time. The approach should be feasible within realistic timeframes, budgets and analytical capacity.
To meet this aim, we assess approaches identified in the literature, testing each against Scotland’s data landscape and policy needs. For each option, we set out how it could be implemented in practice, the data inputs required, the trade‑offs between accuracy, granularity and cost, and the implications for policy use. The assessment considers how well each approach can support consistent, repeatable estimates suitable for establishing a baseline and monitoring progress.
A further objective is to understand the scope for meaningful disaggregation under each approach. We examine the potential to break down emissions by geography (e.g., region or urban/rural contexts, including the mainland and islands), by subsector or visitor activity (e.g., accommodation, transport, food and drink), by visitor type (e.g., domestic day vs overnight or international), and by accommodation type. We also consider separating transport modes and the feasibility of per‑visit or per‑night indicators that can inform policy appraisal.
The report concludes with recommendations for a proportionate, replicable framework that provides clear options related to scope and resolution, and identifies priority data requirements. In doing so, we present options for the subsequent calculation of a baseline and routine reporting on tourism‑related GHG emissions in Scotland.
Scotland’s tourism sector profile and implications for greenhouse gas measurement
Several features of Scotland’s tourism sector translate into measurement challenges, particularly for transport. Many long‑haul tourists travel through other UK hubs such as London, complicating the allocation of aviation emissions specifically to Scotland. Once in Scotland, overseas visitors often hire cars to reach rural and island destinations, while many domestic tourists rely on private vehicles, making road transport a notable source of sector emissions. Islands and sparsely populated Highland areas depend on ferries and, in some cases, short‑haul flights to maintain connectivity; these modes carry relatively high emissions per passenger compared with rail or scheduled coach services more common elsewhere in the UK. Any credible estimate will therefore need reliable origin-destination data to isolate tourism travel, clear rules for allocating connecting flights, and geographic disaggregation between mainland and island destinations.
Post‑COVID dynamics also affect both demand and the emissions baseline. Domestic (Scottish and other UK) travellers account for most trips, yet spending by international visitors remains significant and has generally rebounded strongly since the pandemic. At the same time, parts of the industry report lower domestic demand, higher operating costs and reduced profitability (Scottish Tourism Alliance, 2024). Visitor behaviours have shifted in ways that matter for emissions accounting; changes in the balance between domestic and international travel, typical length of stay, and mode choice (car vs public transport) have not returned to pre‑COVID patterns. Methods should therefore be sensitive to these effects and avoid embedding an atypical year as the baseline.
On the production side, workforce seasonality and multi‑job working complicate attribution of GHG emissions. Many workers hold more than one job across hospitality, transport and retail, which can cause head‑count statistics to overstate full‑time‑equivalent (FTE) employment. This makes it difficult to apportion energy use and associated emissions where premises and staff serve multiple sectors and mixed customer bases (visitors and residents). A credible GHG‑measurement framework will need to address these mixed‑employment and shared‑facility issues, for example, by combining business energy data with tourism intensity indicators such as occupancy or visitor spend to avoid misallocation.
International experience provides useful reference points but no single blueprint. Denmark now publishes a government‑endorsed tourism carbon account using an environmentally extended input-output model linked to a tourism satellite account (Lindahl, J. et al., 2024). Finland estimates visitor footprints through its Matkailijamittari border survey (VisitFinland.com, 2025), while one‑off studies in Barcelona (Rico, A. et al., 2024) and Wales (Jones, C., 2023) test techniques suited to smaller destinations. These examples show what is possible but also highlight the importance of adapting methods to local data and geography: many international studies concentrate on specific activities (notably aviation) or rely on datasets that differ from those available in Scotland.
Taken together, these factors mean that boundary‑setting, mode‑specific transport accounting, careful baseline selection and production‑side allocation of emissions are critical to producing reliable, policy‑relevant estimates of tourism‑related GHG emissions.
Methodology
The project was completed via four distinct stages: Scoping and Conceptual Framework, Desktop-based Literature Review, Systematic Assessment, and Reporting and Recommendations. Stakeholder engagement was conducted throughout to support and guide the project. These steps, including the stakeholders engaged, are explained in more detail in Appendix A.
Literature review – long list
Following an initial scoping stage, systematic search terms were used in a literature review stage to identify a long list of 51 documents. These documents, which included region- or country-wide case studies, sector-wide or specific methodology reviews, and international framework/guidance documents, were assessed for their primary details (link, type, organisation, year, size in pages, geographic coverage, scope, and summary). For a breakdown of literature source types, see Appendix A.
Separately, 24 data sources were identified through a combination of systematic search terms and discussions with relevant stakeholders. These were also assessed for primary details (link, publisher, last updated, coverage/years), Scotland specificity and originality (rated on a red, amber, green scale), and description. RAG ratings were also generated for key tourism data, including: visitor numbers, visitor spend, aviation data, train data, car data, hospitality data, energy use data, input-output (IO)/supply chain data, and more.
Prioritised short list
The third stage comprised a more in-depth assessment of the most relevant sources. 30 documents, comprising both case study and wider review documents, were analysed for the following parameters:
- scope and context
- methodology and tools
- data inputs and assumptions
- outputs and findings
- strengths, caveats and transferability
Further detail on how each of these parameters were assessed, as well as the types of documents assessed in the shortlist, is described in Appendix A. Data sources were also assessed in more depth during Stage 3. This followed continuous engagement with stakeholders and is described in further detail in Section 5.4.
Literature review findings
The literature review aimed to understand how tourism emissions are defined and measured internationally, and which approaches are most transferable to Scotland’s context. Findings from the documents and data sources identified are presented in this section, which is set out as follows. Section 5.1 below summarises how the assessed literature defines “tourism” and sets boundaries around what counts as tourism activity and expenditure (decisions that determine comparability, what is included in an emissions account and how results can be disaggregated). Subsequent sections describe the key methodological approaches identified, and their observed strengths and limitations related to the specific Scottish context.
The international definition of tourism
Foundations for defining and measuring tourism
A clear, standardised definition sets the boundary for any tourism GHG account. It determines which trips, activities and expenditures are counted, enables comparability across countries and over time, and allows results to be integrated with national accounts. Studies that adopt common definitions are easier to repeat, benchmark and adapt for policy use. We found strong convergence on the key sources discussed below.
The International Recommendations for Tourism Statistics (IRTS) (UN Statistics Division, 2008) provide the definitive parameters for tourism. These set out who qualifies as a visitor (those travelling outside the “usual environment” for less than a year and not for paid work at the destination), what constitutes a trip, the main types of tourism (inbound, domestic, outbound) and purposes of travel (leisure, business). Using IRTS ensures that the measurement boundary for any tourism GHG account is clear, consistent and comparable across time and countries. All studies assessed in the shortlist used the definitions and indicators of the IRTS, either strictly or with minor revisions driven by data availability.
Two complementary frameworks then organise how these defined activities are measured and reported. The UNWTO’s Measuring the Sustainability of Tourism (MST) framework (UN Tourism, 2024) structures indicators across the economy, society and environment. While the framework does not prescribe a single calculation method, it explains what to measure for international comparability by outlining key indicators within topics such as tourism expenditure, production accounts, and employment within tourism industries. In doing so, the MST framework lays the to implement these metrics within a coherent economic accounting system. The Tourism Satellite Account (TSA) can act as this economic accounting system by matching visitor expenditure by product (e.g., accommodation, food and drink, passenger transport, cultural services) to the industries that produce them and using “tourism ratios” to isolate the share of each product or industry’s total output that is purchased by visitors rather than residents. The TSA does not calculate emissions; however, it does provide the expenditure and industry structure that calculation methods can link to environmental extensions and emission factors to estimate tourism GHGs. Scotland does not currently have a dedicated TSA, but the UK TSA (Office for National Statistics, 2025b) offers a sector-allocation framework that can be mapped to Scotland with local adaptation to remain consistent with IRTS/MST.
How studies we reviewed set the boundaries around tourism
Building on the foundational definitions and frameworks, we examined how the shortlisted studies defined what counted as tourism for measurement purposes. To keep results comparable and avoid double counting, studies made several practical choices about the scope of trips, spending and activities. The main patterns identified are set out below.
- Purpose of trip (leisure vs business)
Most studies separated trips by purpose where data allowed. Leisure and business were reported separately or combined with a clear note where samples were small. This followed IRTS categories and supported policy‑relevant disaggregation. - Visitor spending vs local (resident) consumption
Studies distinguished visitor spending from local (resident) consumption using the “usual environment” principle. TSA‑based studies calculated “tourism ratios” so that only the visitor share of mixed industries such as restaurants and retail was counted. City‑level assessments – such as “Carbon footprint of tourism in Barcelona” (Rico, A. et al., 2019) – used observable proxies such as ticket sales, footfall, nights stayed or metered energy to apportion shared services so that only the visitor portion was included. - Accommodation types and commercial vs non-commercial stays Accommodation was typically grouped into serviced stays (e.g., hotels and guest houses), self‑catering or holiday homes, short‑term lets, camping, and “visits to friends and relatives” (VFR). TSA‑aligned work included commercial and non‑commercial stays, and day visits where data existed. Denmark’s national account – “Measuring the Carbon Footprint of Tourism in Denmark” (Lindahl, J. et al., 2024) – explicitly covered commercial stays, non‑commercial/VFR and day‑based activities, using surveys and administrative sources to estimate volumes and spending by category.
- Transport modes and trip components
Transport was split by mode (road, rail, water and air, including rental vehicles) using TSA/IRTS categories. For aviation, national accounts (e.g., the Danish case study “Measuring the Carbon Footprint of Tourism in Denmark”, Lindahl, J. et al., 2024) estimated international transport emissions using distance, passenger counts and mode shares, then applied clear allocation rules (for example, assigning inbound legs to the destination); connecting flights were handled via explicit assumptions to avoid double counting. For road and rail, studies combined survey‑reported distances and mode shares with official emission factors – as in the Welsh case study “The carbon footprint of regional tourism trips: insights from environmentally extended regional input-output analysis” (Jones, C., 2023) – or, in city LCAs, linked activity diaries and ticketing to local transport statistics (Rico, A. et al., 2019). - Retail and “country-specific” goods
Retail was typically treated cautiously to avoid overstating emissions. TSA‑based work either limited totals to “tourism‑characteristic goods” or applied a tourism ratio to retail turnover. Some city studies excluded broad retail and catering categories where a reliable split between residents and visitors was not possible, noting the limitation transparently. - Day visits vs overnight stays
Day visitors were included where surveys or administrative data could credibly identify volumes and spending; emissions were then allocated using the same sectoral ratios and transport‑mode methods as for overnight visitors, while recognising their different activity mix. This approach was also reflected in Finland’s Matkailijamittari border survey (VisitFinland.com, 2025), which provided segment‑specific insights to support allocation.
Summary of definition practice
Overall, the literature largely adopted IRTS/MST definitions, embedded into national economic accounts via a TSA where available. Adaptations to this approach were limited and driven by local data realities rather than alternative concepts. This enabled disaggregation by visitor type, geography, subsector/activity and accommodation category, and helped align tourism GHG accounts with national economic statistics. Case studies such as Denmark (Lindahl, J. et al., 2024), Wales (Jones, C., 2023) and Barcelona (Rico, A. et al., 2019) illustrated these practices in different settings. These studies, as well as the overall methodology types within which they sit, are explored further in Section 5.2 below.
How studies report emissions: production vs consumption
Before introducing the specific methodologies identified, it is helpful to summarise the two accounting perspectives used to report tourism emissions, as they shape what is counted and how results are compared.
Production‑based (territorial) reporting counts emissions where they are physically produced (within a country or region’s borders), regardless of who the end-user is. For tourism, this means emissions generated within Scotland from services and products for all tourists, both local and foreign. For example, this would include emissions from fossil fuel-combusting vehicles, irrespective of whether they were being driven by Scottish or international visitors. The emissions from combusting the fuel are accounted for, i.e. those directly caused by and occurring when driving the vehicle.
Consumption‑based (footprint) reporting counts emissions related to consumption, occurring both directly and indirectly. For tourism, this includes all emissions from goods/services consumed by Scottish tourists or by all tourists within Scotland, including imported goods, aviation, and supply-chain impacts. Using the vehicle example, this would mean including emissions associated with the transport of the fuel to the gas station. Accounted emissions would be both the direct emissions from fuel combustion plus the indirect emissions from transporting the fuel to the gas station.
This choice of perspective matters: it changes totals and sector splits – especially where international transport and imported goods are significant – and determines how results align with other statistics. Production‑based reporting aligns with national inventory rules and is relatively straightforward where territorial data are robust, but it does not capture upstream or imported impacts. In this context, upstream impacts refer to emissions generated at various stages of production, such as raw material extraction and manufacturing, that occur outside Scotland. Imported impacts include the emissions embodied in goods and services that are produced abroad and brought into Scotland for consumption. Consumption‑based reporting is more comprehensive, reflecting the full footprint of tourism demand, though it is methodologically more complex and relies on high‑quality economic and environmental data.
We observed that advanced national and regional studies – See Denmark case study in Section 9.1.5– (Lindahl, J. et al., 2024) typically reported both production‑ and consumption‑based results to highlight the disparity between emissions generated within a destination and those ultimately demanded by visitors, a gap that is especially relevant in places with significant international travel or traded goods. International guidance from the UNWTO and WTTC also recommends reporting both perspectives where feasible for clarity, policy alignment and comparability. The Appendices summarise, in table form, each perspective’s implications for system boundaries, policy relevance and methodological strengths and weaknesses. Keeping both production-based and consumption-based in mind helps to frame why the methodologies that follow organise and report results as they do, and helps to interpret differences across methodologies presented in Section 5.3 below.
Methodologies identified in the shortlist
The assessment of short-listed sources conducted in Stage 3 compared the principal approaches identified across the literature and grouped them into four: Environmentally-Extended Input-Output (EEIO) including multi-regional IO, analysis; Life Cycle Assessments (LCA); Hybrid EEIO-LCA studies; and Survey-based methods. The key characteristics of each of these methodology categories, including their advantages, disadvantages, and case study examples, are detailed below. Note at this stage, the focus is on the characteristics of each methodology – implications for Scotland will be explored further in Section 6, Considerations and Recommendations.
Environmentally Extended and Multi-Regional Input-Output analysis
An Input-Output (IO) table is an accounting map of the economy showing how industries buy from and sell to each other. By integrating Air Emissions Accounts, which contain emissions data across different sectors, these IO charts become Environmentally Extended Input-Output (EEIO) tables, translating economic activity into GHG emissions. EEIO links that map to environmental data (emission factors per unit of economic output) so that spending can be translated into GHG emissions. To build a whole-economy carbon footprint, EEIO analysis can be extended to multiple regions (MRIO), encompassing imports and global supply chains, reflecting the international dimension of tourism demand.
Studies observed using the EEIO or MRIO approach (for example Lindahl, J. et al., 2024 and Jones, C., 2023) linked visitor expenditure (from TSA or TSA‑inspired categories) to IO sectors (e.g., accommodation, food services, transport). These studies also applied environmental extensions to estimate direct and indirect emissions, and, where needed, added a separate transport module, which quantifies emissions associated with different transportation modes (e.g., road, rail, and air travel) by integrating data on travel distances and mode splits. This is particularly important for accurately capturing aviation-related emissions.
- Advantages: the EEIO/MRIO approach’s strengths lie in coverage and coherence. It provides a comprehensive, economy‑wide footprint of tourism demand that is consistent with national accounts, making it suitable for establishing and repeating a national baseline. It can therefore support disaggregation by geography, visitor type, accommodation category, subsector/activity, and transport mode–and can report both production‑ and consumption‑based perspectives in a single framework. In addition, this approach is updateable as IO tables, emission factors, and tourism surveys are refreshed, enabling progress tracking and scenario analysis aligned with policy needs.
- Disadvantages: EEIO/MRIO studies rely on assumptions to allocate or distribute sections of national tourism data to regions within the country. This means using average values for sectors, which can hide specific areas that may have higher or lower emissions, making it less detailed for local hotspots. Building and maintaining the model also requires specialist skills, robust governance and data‑sharing agreements, and there is a lead time before credible results are available. Handling transport – especially aviation – requires careful allocation rules to avoid double-counting or misattribution across boundaries.
- Case study signpost: the EEIO/MRIO approach was the most commonly observed in the literature. Perhaps the most advanced study, most suited to Scotland’s needs, was that conducted by Denmark (Lindahl, J. et al., 2024) (see Section 9.1.5). Published in 2024 and led by the Centre for Regional and Tourism Research (CRT) on behalf of VisitDenmark, “Measuring the Carbon Footprint of Tourism in Denmark” lays the foundation of a case study in line with the UN Tourism guidelines and builds on prior investment in data infrastructure such as TSAs and IO modelling. As the first official, government-backed full-tourism sector GHG baseline, the Danish study’s strength lies in combining international frameworks with national data systems, producing a comprehensive and granular footprint of both domestic and inbound tourism.
- For a closer-to-home application of the EEIO/MRIO approach, a Welsh (Jones, C., 2023) study demonstrates how an EEIO approach can be used to estimate tourism emissions consistently with national accounts. Both Danish and Welsh case studies are further detailed in Sections 9.1.5 and 9.1.6 of the Appendix D.
Life Cycle Assessment
LCAs provide the fine‑grained, bottom‑up evidence needed to examine individual assets or services. They follow a cradle‑to‑grave line of sight across materials, energy, transport, use and waste, using concrete activity data such as metered energy, occupancy and passenger‑kilometres.
LCA studies from Barcelona (Rico, A. et al., 2024) and Switzerland (Perch-Nielsen et al., 2010) show how detailed energy, materials and waste data can be translated into per‑visitor or per‑night emission factors. This depth is valuable for operational decision‑making, although it covers only a fraction of the wider supply chain. In tourism applications, LCAs typically allocate shared services between visitors and residents (for example, using ticket sales or nights stayed) and then map the resulting activities back to IRTS/TSA categories to stay consistent with tourism statistics
- Advantages: LCA provides high‑resolution insight into the specific technologies, processes and behaviours driving emissions, making it powerful for identifying hotspots and designing targeted interventions. It produces per‑unit metrics (per guest‑night, per meal, per event) that operators can use for operational management, procurement and visitor communications. While LCAs are often applied at the site or city level, they can scale to wider destination programmes where data infrastructure and participation are sufficient, offering decision‑relevant detail that complements national accounting approaches.
- Disadvantages: LCA approaches are data-intensive and time-consuming, and results can be less representative if smaller businesses do not participate or lack metered data. On its own, LCA typically does not yield an economy-wide, consumption-based footprint because upstream supply chains and imported goods may be incomplete unless explicitly modelled. As a result, LCA alone is insufficient for the purposes of this study as it fails to capture the broader scope needed for national reporting. Scaling LCAs to a national figure requires extensive data collection, strong governance and integration rules, which is why most national footprints rely on EEIO or hybrid frameworks rather than pure LCA.
- Case study signpost: Barcelona (Rico, A. et al., 2019) (explore in Section 9.1.7) illustrates the application of LCA at the city scale, with explicit rules to allocate shared activities between visitors and residents; details are provided in Appendix D.
Hybrid Environmentally Extended Input-Output/Life Cycle Assessment approaches
EEIO/LCA Hybrid approaches combine EEIO’s complete, system‑wide coverage with LCA’s granular diagnostics. Studies first derive the overall footprint by linking TSA/IO structures to environmental extensions, then layer targeted LCAs for high‑impact subsectors, assets, or capital investments, using integration rules to avoid double-counting and reconcile site‑level findings with the macro account.
- Advantages: EEIO/LCA hybrid methods pair completeness with actionability: EEIO captures total demand and supply chains, while LCAs reveal operational hotspots and technology choices, strengthening credibility with both policymakers and industry. They support reporting under production and consumption perspectives, enable scenario analysis (macro shifts via EEIO; technology or behaviour changes via LCA modules), and help prioritise investments by showing where improvements deliver the greatest impact. This dual evidence base is well‑suited to policy design and sector engagement.
- Disadvantages: EEIO/LCA hybrid approaches are the most complex and resource‑intensive to build and maintain, demanding sustained funding, in‑house expertise and strong governance for data exchange and model integration. Lead times are longer before a fully operational model is delivered, and methodological inconsistency or double counting can arise without clear reconciliation rules. Regular updates require coordinated workflows across multiple agencies and data owners.
- Case study signpost: a Spanish application (Cadarso et al., 2016) (see Section 9.1.8) shows how adding capital‑investment LCAs to a TSA/IO framework can materially change the total tourism footprint. For further information see Appendix D.
Survey-based methods
Survey approaches collect information directly from visitors or operators about how trips are taken (modes and distances), where people stay, what they do, and what they spend. These data are then translated into emissions using simple emission factors for the reported activities and travel. In the studies we reviewed, surveys were used either on their own to produce destination‑level estimates, or alongside other methods (for example, to supply behaviour and mode‑share inputs to broader models).
- Advantages: survey-based methods provide first‑hand evidence about real behaviours, which makes the results immediately relevant for policy questions such as mode choice, length of stay, and activity patterns. They are flexible: questionnaires can be tailored to different visitor segments, seasons and places, and new questions can be added as issues emerge (e.g., uptake of electric vehicles or interest in low‑carbon activities). They also have a comparatively light modelling burden compared with economy‑wide approaches and can be deployed more quickly to fill specific evidence gaps or to validate assumptions used in other methods.
- Disadvantages: results of survey-based studies depend on who responds and what they can accurately recall; non‑response and recall bias are common and require careful sampling, weighting and quality control. Additionally, response rates are never 100% and are often substantially lower, so even well‑designed surveys may leave residual uncertainty that needs to be acknowledged in reporting. Costs scale with the scope of fieldwork: large, nationally representative samples across regions, seasons and visitor types can be expensive to run and to repeat regularly. On their own, surveys do not capture upstream supply‑chain emissions (for example, emissions embedded in goods and services bought by visitors) unless additional modelling is added, and comparability with other international studies is limited if survey instruments are not harmonised.
- Case study signpost: San Sebastián (Pousa-Unanue et al., 2025) (explored in Section 9.1.9) shows how a survey‑led approach can generate granular insights into activities, accommodation and travel modes at the destination level. A deep dive of this study is again provided in the appendix.
Summary of methodologies observed
Across the literature, the same themes recur. EEIO (and multi-regional IO) is repeatedly recommended when robust economic accounts are available. LCA is preferred for detailed, site-level action planning, and its headline results are generally consistent with EEIO outputs when scopes overlap. EEIO/LCA hybrid models are complex but emerging as they combine completeness with granularity, while survey-based methodologies remain valuable for capturing regional behaviour and supplementing model assumptions.
Together, these findings provide a clear starting point for Scotland to select – or combine – the most appropriate tools for a credible, policy-relevant GHG inventory of its tourism sector. Assessing the suitability of each methodology for the Scottish context, however, necessitates an overview of the specific data available to Scotland and its reporting capabilities.
Scotland’s data landscape
This section summarises the data sources available to Scotland that could form the basis for a GHG assessment.
Scotland benefits from a rich ecosystem of tourism, mobility, and environmental data, which provides a solid starting point for robust visitor analysis and GHG footprinting. However, there are gaps in local granularity and in harmonisation with standardised economic data such as Scotland’s IO tables. Based on our research and meetings with the Scottish Government, VisitScotland, VisitBritain and VisitEngland, and CRT/Visit Denmark, the primary data sources, which Scotland currently has, are outlined in Table 2 below.
Table 2: Data available to Scotland for its tourism GHG footprint calculation.
| Visitor-based data | |
|
International Passenger Survey (IPS) (Office for National Statistics, 2025a) |
A UK-wide survey which includes samples from Scottish ports and airports, with VisitScotland involved in its oversight. It provides comprehensive coverage of around 40,000 international visitors, detailing their modes of transport, motivations for travel, and regions visited throughout the year. This is most useful at the UK or national level, given the sample size limitations of its regional breakdowns. |
|
Great Britain Tourism Survey (GBTS) (Office for National Statistics, VisitEngland, VisitScotland and Visit Wales, 2025) |
A collaborative survey for Great Britain, which acts as the primary source for domestic Scottish trips, detailing modes of transport, expenditure, and weighting to the GB/Scotland population. However, its in-home design (whereby the survey is sent to households, regardless of whether trips have been taken) can result in relatively weak local authority/local granularity level data, similar to the IPS. Additionally, due to methodology changes post-2019, data from 2022* onwards cannot be compared to results up to 2019 (data for 2020 and 2021 are not published, as due to COVID-19 pandemic lockdowns, the complete calendar year is not available). |
|
Scotland Visitor Survey (VisitScotland, 2025a) |
Commissioned by VisitScotland every few years, this survey provides high-value regional experience data on travel methods within Scotland and visitor behaviours. However, it does not offer a consistent time series or direct visitor count/spend, relying instead on IPS/GBTS for scaling frameworks. |
|
Supplementary Contextual Data |
This includes data from sources like VISA (Office for National Statistics, 2024 and VisitBritain, 2025a), the Short-Term Rentals Dashboard (VisitBritain, 2025b), and the Domestic Sentiment Tracker (VisitScotland, 2025b), which provide near real-time tracking of expenditure, accommodation, and sentiment (prospective demand), respectively. These supplementary sources enable triangulation and can enhance data reliability. |
Non-visitor based data | |
|
Scottish GHG Statistics (Scottish Government, 2025) |
Renowned for sectoral rigour in emissions modelling, these statistics are widely used for travel, energy, and fuel disaggregation. |
|
Scotland’s Carbon Footprint and Air and Energy Accounts (ClimateXChange, 2020) |
Strong for identifying trends but less precise for detailed destination/expenditure splits. While useful, these data involve averages and complex modelling. |
|
Supply, Use, and Input-Output Tables (IO Tables) (Scottish Government, 2024) |
Scotland-specific and independently maintained with statutory continuity, these tables are now environmentally extended and greatly beneficial for this exercise. |
|
Scottish Transport Statistics (Transport Scotland, 2025) |
With the ability to understand Scotland’s transport flows, mode share, and infrastructure, these statistics are important to contextualise and validate survey-reported travel patterns. |
|
UK (not Scottish) TSA (Office for National Statistics, 2025) |
The UK TSA provides a sector allocation framework but mapping it to Scotland requires additional local expert adaptation. |
The data in Table 2 present an overview of the data available to Scotland for its tourism GHG footprint calculation. However, effectively using these data necessitates a comprehensive mapping exercise to establish the primary data source(s) for each of the key elements of a potential assessment. While a full mapping is beyond the scope of this project (see considerations and recommendations), a preliminary mapping is presented in Table 3 below.
Table 3: Scotland’s Tourism GHG Footprint Indicator-to-Source- Mapping
|
Data input |
Primary data source(s) |
Rationale/assumptions |
Completeness for Scotland GHG footprint assessment |
|---|---|---|---|
|
Visitor numbers |
GBTS (Overnight and Day Visits Annual Reports), IPS |
GBTS provides the most representative data for domestic visitors; IPS samples all international arrivals/departures at Scottish ports/airports |
High: reliable, Scotland-specific for domestic and inbound |
|
Visitor spend |
IPS, GBTS, VISA Card Spending Dashboard |
IPS tracks spend for international visitors; GBTS tracks domestic spend and breakdowns; VISA adds near-real time spend, including origin/destination |
High: good for both domestic and international segments |
|
Aviation data |
CAA UK Airport Data (CAA, 2025); IPS |
CAA provides original Scottish airport-level flights/passenger data; IPS adds travel mode for visitors |
High: airport-level Scottish data available |
|
Train data |
Scottish Transport Statistics; GBTS; National Travel Survey (Scotland) |
Scottish Transport Statistics track train use; GBTS and NTS adds modal choices and trip characteristics |
Medium: detailed modal and passenger journey data, but does not provide specific info on visitor usage; sample-limited at regional and visitor-specific level |
|
Car data |
Scottish Transport Statistics; GBTS; National Travel Survey (Scotland) |
Official car use statistics; trips by car from survey sources |
Medium: robust for overall flows in Scotland; does not specifically identify visitor car usage within the published statistics |
|
Hospitality data |
GBTS (expenditure categories), Short Term Rentals Dashboard |
GBTS gives spend on food/drink/ accommodation; Short Term Rentals Dashboard adds detail to the self-catering/STR sector |
Medium: good sectoral breakdown; limited business-level GHG/emissions directly |
|
Energy use data |
Scottish Greenhouse Gas Statistics; Air and Energy Accounts |
Original, sector-specific Scottish energy/emissions data via GHG Statistics and Air and Energy Accounts |
Medium: detailed sectoral figures for Scotland, but no easy or standard method to directly split out tourism’s contribution; significant modelling/ estimation required |
|
IO/supply chain data |
Supply, Use and IO Tables; UK TSA |
Scottish IO tables provide direct and indirect impact modelling, but only UK TSA gives sector composition for tourism; local adaptation used |
Medium-High: complete EEIO for Scotland; tourism split may require UK allocations/mapping |
|
Other tourism GHG specific data |
Scottish Tourism Observatory; Scotland Visitor Survey; Domestic Sentiment Tracker |
Observatory synthesises, validates, models GHG from above; Visitor Survey adds experimental and modal details; DST is forward-looking |
Medium: useful for trend analysis and scenario- building, not for core footprint arithmetic. |
Methodology overviews
The four types of methodologies identified in the literature are colour-coded by the ability to meet the aims laid out in this report in Table 4 below. This table considers both the inputs (data needed) and outputs of each methodology, Scotland’s capacity to currently provide this data according to the nation’s data landscape outlined in Section 5.5, and the methodologies’ ease of replication and effort required. Methodologies are presented on a standalone basis; for example, surveys are likely to supplement each methodology type in practice, but their row in Table 4 relates to only using survey-based methods. While Scotland has good survey infrastructure in the form of the International Passenger Survey (IPS, Office for National Statistics, 2025a) and Great Britain Tourism Survey (GBTS, Office for National Statistics, VisitEngland, VisitScotland and Visit Wales, 2025), these are not currently set up to facilitate the calculation of a carbon footprint. These methodologies are explored in further detail in Section 6.
Table 4: The four methodology types identified.
The following terms denote each methodology’s suitability for the purposes of this assessment: ‘Most suitable’, ‘Somewhat suitable’ and ‘Least suitable’.
| Method | |||||
| Environmentally Extended or Multi-Regional Input-Output analysis (EEIO/MRIO) | Life Cycle Assessment (LCA) | EEIO/LCA hybrid | Survey-based methodologies (purely survey-led studies; no TSA/EEIO) | ||
| Data needed (core) | Input-Output tables; Tourism Satellite Account (or adapted UK TSA); environmental extensions and emission factors; visitor expenditure splits (IPS/GBTS); transport mode shares; accommodation nights/occupancy. | Primary site/asset data (energy, fuels, materials, waste, water, logistics); activity data (occupancy, covers, passenger‑km); life‑cycle inventory factors; industry-standardised (ISO) methods; optional survey inputs. | EEIO inputs as above plus targeted LCA datasets for high‑impact subsectors/sites; reconciliation rules to avoid double counting; governance for data exchange and updates. | Visitor/operator surveys capturing spend, modes, distances, activities, accommodation type/nights, party size; sampling frames and weighting; linkage to simple emission factors where used. | |
| Outputs (core) | Macro-level, economy-wide footprint of tourism demand; consumption-based totals by default (with production-based reporting also possible); suitable for national baselines and MST-aligned reporting. | Granular, bottom-up, facility or product-level footprints (e.g. per guest night, per service); strong hotspot analysis; primarily production-based unless wider travel/supply chains are explicitly modelled. | National, consumption-based totals with site-level production-oriented detail for hotspots; combines system coverage with actionable granularity; MST/IRTS compatible. | Behavioural and expenditure evidence; can estimate emissions for specific segments using applied factors; useful for regional or pilot settings and to fill gaps in other methods; not a full supply-chain account. | |
| Data availability in Scotland | Somewhat suitable | Somewhat suitable | Somewhat suitable | Least suitable | |
| Ability to provide national overview | Most suitable | Least suitable | Most suitable | Somewhat suitable | |
| Disaggregation potential | Travel | Most suitable | Most suitable | Most suitable | Most suitable |
| Region | Somewhat suitable | Somewhat suitable | Most suitable | Most suitable | |
| Subsector/activity | Most suitable | Most suitable | Most suitable | Somewhat suitable | |
| Visitor type | Most suitable | Somewhat suitable | Most suitable | Most suitable | |
| Accommodation type | Most suitable | Most suitable | Most suitable | Most suitable | |
| Per visit/night | Most suitable | Most suitable | Most suitable | Somewhat suitable | |
| Ease of replication/update | Most suitable | Somewhat suitable | Least suitable | Somewhat suitable | |
| Effort required | Somewhat suitable | Least suitable | Least suitable | Somewhat suitable | |
Considerations and recommendations
Preceding sections have outlined the concept of tourism’s GHG impact measurement, primary methodologies identified in the literature for estimating the GHG emissions of tourism, and Scotland’s data landscape. This section combines the learnings from those sections and presents our specific considerations and recommendations for Scotland.
Essential groundwork
Before a methodology is chosen – and during its subsequent development – it is crucial to identify and build on the current data, studies, and operational knowledge which have been developed as part of this project. Several organisations will be key to this exercise – among them various Scottish Government research and policy teams, VisitScotland and VisitBritain, Transport Scotland, the ONS, local authorities, sector associations and academic research institutes. By involving these bodies early and maintaining regular contact, the project team can provide continuous and structured stakeholder engagement to:
- catalogue the data and models that already exist
- understand confidentiality or licensing constraints
- avoid duplicating effort
- agree on practical arrangements for updating and sharing information once a methodology is in place.
As such, a clear engagement plan will help ensure that the eventual GHG methodology makes the best use of existing evidence and remains maintainable over time.
Overall recommendations for the methodology framework
The following recommendations outline the steps that we suggest should be taken, regardless of the final methodology chosen.
First, we suggest adoption of the IRTS definition of tourism and structure the GHG account within the UNWTO MST framework (UN Tourism, 2024). Using the IRTS-defined terms (e.g. visitor, trip, inbound, domestic, outbound) would also provide a universally recognised boundary for what counts as tourism activity, while the MST offers the overarching economic, social, and environmental structure in which the Scottish GHG methodology would sit. This would secure international comparability, complement the UK TSA (Office for National Statistics, 2025b), and reduce ambiguity when separating resident travel from visitor activity.
Second, maintenance of active links with those that are further advanced, such as Denmark,is recommended (Lindahl, J. et al., 2024) to learn from best practice, including potential data sharing and quality assurance procedures. These relationships can shorten development time, lower costs and help avoid common pitfalls.
Third, building the methodology around a mix of data sources and keeping data management central to project governance are both suggested. The recommended process for this is expanded below:
- A detailed mapping of existing datasets and the underlying data architecture should be an early task. This exercise, anticipated to be a more in-depth version of that presented in Table 3, will clarify what is already available, where licensing or confidentiality limits apply, and how much additional effort (or new primary data collection) will be needed to meet the chosen level of detail. Core quantitative inputs are likely to include Scotland’s environmentally extended IO tables (Scottish Government, 2024), Scottish Transport Statistics (Transport Scotland, 2025), accommodation occupancy records, energy-use statistics and emission factors, digital mobility data and project-specific studies.
- Surveys can supplement other methodologies through qualitative input and narrative, even if they are not relied upon to be the core of the approach chosen. In this regard, Scotland has two rich sources of longstanding data – the IPS (Office for National Statistics, 2025a) and GBTS (Office for National Statistics, VisitEngland, VisitScotland and Visit Wales, 2025). While this study has engaged with both VisitScotland and VisitBritain, it is recommended that further coordination is undertaken to evaluate in more depth the potential of these surveys, and others including those conducted by tourism operators, to support the assessment.
- Mapping should pay particular attention to economic data, and to the links required between financial, physical-flow and survey sources. The distinction between consumption-based metrics (capturing full supply-chain impacts) and production-based metrics (territorial emissions) within each dataset should be explored, as should the feasibility to report both to maximise policy relevance and consistency with Scotland’s national inventory.
- Throughout development and subsequent updates, data considerations need to remain at the centre of the project so that the account provides information that is both reliable and sufficiently granular to inform decision-making.
Finally, the approach should be designed for regular repetition and secure the resources needed for scheduled updates. Assumptions should be transparent and implementation placed in software that is possible for government analysts to maintain and update.
Roadmap of practical options for Scotland
Once the guiding principles above are agreed upon, three broad decision pathways are recommended as potential options for Scotland. Each can be phased or combined, but they differ in cost, timescale, data requirements and the type of insight they deliver. These options, with option one further split, are summarised in Table 5 and expanded upon below.
* Indicative cost bands caveat: Cost bands indicate approximate FTE‑months – Very Low (<3), Low (3-10), Medium (10-25), High (25-60), Very High (>60). Timelines to first credible results (and any cost bands referenced elsewhere in the report) are high-level estimates to support budgeting and phasing; actual effort, duration and costs depend on scope, data access and sharing, governance/approvals and procurement, and should be validated with delivery partners. These estimates reflect typical workloads and the capabilities described in this report.
|
Option |
Purpose/ deliverable |
What can be done now |
Timeline to first credible results and indicative cost band* |
Key caveats |
|
1A. EEIO baseline using existing data |
A national, repeatable, consumption-based estimate using Scotland’s environmentally-extended IO tables linked to visitor spend and mode shares. |
Build with current IO tables, Air and Energy Accounts, IPS/GBTS splits, transparent transport and sector allocation rules. |
~6 months to first release (at medium cost), then ~3 months per update (at low cost). |
Requires clear boundary rules (especially transport) and documented assumptions, granularity limited by available spend splits and sector aggregation. |
|
1B. Scotland-specific TSA then EEIO |
A Scottish TSA to strengthen tourism sector splits; integrated into EEIO for improved accuracy and comparability. |
Preparatory design and feasibility can start; full TSA requires new compilation and agreements |
18-30 months to first TSA (at very high cost); updates thereafter faster (at medium cost). |
Relies on cross-agency collaboration and sustained funding; high start-up effort before benefits realised. |
|
1C. Spatial granularity (regional/ LA focus) |
Disaggregation by place (e.g. island/ mainland; priority regions) using best-available data and proxies. Recommended for individual regions rather than splitting a national level figure by region. |
Audit existing spatial data; develop proxy indicators (guest-nights, occupancy, card spend) to support model splits. |
12-24 months to first release (at medium-high cost depending on regions covered and validation depth), phased by data availability (cost variable). |
Coverage will vary by region; validation needed to avoid misallocation. This approach may not provide a national level figure; therefore, regional variations must be carefully managed. |
|
2. LCA pilots (project/ facility focus) |
Detailed and site-specific per-unit metrics (e.g. per guest-night; per passenger-km) and hotspot evidence for operations/ investment can provide valuable granular insights that can be used for future carbon impact assessments. |
Pilot 2-3 sites/sub-sectors (e.g. ferries, a major event, representative accommodation). |
3-6 months per pilot (at low-medium cost); 6-12 months for a small programme thereafter (cost dependent on size). |
Data intensive; participation risk; results are local unless scaled systematically. |
|
3. Hybrid (EEIO backbone + targeted LCAs) |
Economy-wide totals plus site-level granularity within one coherent framework. |
Contingent on a stable EEIO baseline (1A) and selected LCA pilots (2); benefits grow if TSA/spatial layers are added (1B/1C). |
12-18 months after baseline is established (high to very high cost, depending on scope of integration and number of LCAs. |
Highest complexity; needs strong governance and QA to avoid inconsistency and double counting. |
Option 1 – Strategic, economy-wide coverage built on Environmentally Extended Input-Output analysis
This pathway is designed to give ministers and industry bodies a consistent, national-level picture of tourism emissions and their drivers. Three implementation routes are identified, moving from quickest/least resource-intensive to most sophisticated/most resource intensive.
Option 1A. Environmentally Extended Input-Output baseline using existing data
If the aim is to establish a credible national estimate quickly and replicate it at intervals, Option 1A builds a consumption‑based footprint using Scotland’s environmentally‑extended Input-Output (IO) tables linked to visitor spending and transport patterns. It can also present production‑based figures alongside the footprint for transparency. With existing sources – IO tables and environmental extensions (Scottish Government, 2024), Air and Energy Accounts (ClimateXChange, 2020), IPS (Office for National Statistics, 2025a)/GBTS (Office for National Statistics, VisitEngland, VisitScotland and Visit Wales, 2025) splits for spend and modes, accommodation occupancy, and Scottish transport statistics (Transport Scotland, 2025) – development of an initial baseline is feasible now. Clear boundary rules (for example, how to treat inbound aviation legs, ferries and car hire) and transparent assumptions are essential, together with published sensitivity tests to show how totals change under reasonable alternative allocations.
The core steps are to map visitor expenditure categories to IO sectors, apply environmental extensions to capture direct and supply‑chain emissions, and implement documented allocation rules for transport and shared sectors (e.g., food and drink, retail). Quality assurance should include reconciling model outputs to known totals in the Air and Energy Accounts (ClimateXChange, 2020) and Scottish Transport Statistics (Transport Scotland, 2025), and sense‑checking mode splits against survey evidence. We recommend governance includes version controls, an update timetable and a process for resolving changes in data sources or coefficients. A first release is considered achievable in ~6 months, with subsequent updates taking ~3 months thereafter. The main risks are assumption sensitivity and misattribution of transport; these could be mitigated by publishing boundary rules, running sensitivity analysis and seeking stakeholder review before publication.
Option 1B. Scotland-specific Tourism Satellite Account, then Environmentally Extended Input-Output analysis
If the aim is greater accuracy, international comparability and stronger disaggregation of tourism demand, a Scotland-specific Tourism Satellite Account (TSA) provides the economic “spine” that can then be integrated with the EEIO model. A TSA structures visitor spending and production accounts in line with international tourism definitions, allowing more precise tourism ratios (the share of each product/industry purchased by visitors) and clearer separation of visitor spending from resident consumption. With a TSA in place, the subsequent EEIO footprint inherits a more robust sector split and becomes easier to repeat and compare internationally.
The practical sequence is to commission a feasibility and design phase, secure data‑sharing agreements, compile and reconcile expenditure and production data to TSA classifications and then connect the TSA to the EEIO model. This requires cross‑agency collaboration (statistics, tourism, and transport teams), sustained funding and a clear update calendar. Because the TSA is a statistical product, quality assurance, documentation and sign‑off processes are critical, as is a plan for periodic revisions. Our estimation is that a first TSA would take 18-30 months to produce, after which updates would be faster. The principal risks are long lead times and scope creep; phased delivery with interim checkpoints and a tightly defined scope help manage these risks.
Option 1C. Spatial granularity (regional/local focus)
If the aim is to support place-based policy – for example, distinguishing island and mainland contexts or prioritising key tourism regions – Option 1C develops spatial disaggregation of the national totals. This can be phased and may rely on proxy indicators where direct data are limited, such as guest night distributions, accommodation occupancy, card spend dashboards and selected survey evidence, combined with Scotland’s IO and environmental accounts. The objective is not perfect granularity everywhere on day one, but a defensible, progressively improving spatial layer where data allows.
The practical work starts with a spatial data audit and agreement on the target geography (e.g., regional groupings, local authorities, island/mainland). The EEIO totals are then apportioned using the best‑available indicators, calibrated and validated against independent sources (for example, accommodation occupancy or transport flows). Special attention is needed for cross‑boundary travel (e.g., ferry routes) to avoid double-counting. Governance should specify how spatial splits are updated and reviewed, and how uncertainty ranges are communicated. It is considered that a phased programme would take 12-24 months, depending on regions covered and validation depth, with early outputs prioritising data‑rich regions. Risks include uneven coverage and misallocation, including the risk of missing important areas due to a lack of data; publishing uncertainty ranges may help manage these risks.
Option 2 – Project or facility focus using Life Cycle Analysis
This option is for decision-makers who need highly granular information on specific assets, developments or supply chains rather than (or before) an economy-wide view.
If the aim is to obtain practical, per-unit metrics and identify operational hotspots for targeted action, Life Cycle Assessment (LCA) pilots provide fine-grained, bottom-up evidence at the level of a service, asset, or event. LCAs follow a cradle-to-grave line of sight across materials, energy, transport, use and waste, producing outputs such as “kg CO2e per guest night” or “per passenger kilometre”. In tourism, pilots can focus on strategically important or high-impact areas-such as ferry services, a marquee event or a representative accommodation type-and allocate shared services between visitors and residents using observable proxies (e.g., ticket sales or nights stayed). Findings can then be mapped back to standard tourism categories to align with the broader account.
Delivering pilots requires recruiting willing operators, agreeing on simple data templates, collecting primary data (energy, fuel, materials, waste, activity), and modelling emissions with established lifecycle factors. It is considered that pilots could be completed within approximately 3-6 months; a small programme of 2-3 pilots could run over 6-12 months. The main risks are participation and data quality; clear confidentiality protocols, targeted technical support and carefully chosen pilots (where data availability is reasonably strong) could manage these risks. LCAs are typically not used to produce a national footprint on their own, but they provide valuable diagnostics and can validate assumptions used in the EEIO baseline.
Option 3. Hybrid approach
If the aim is a comprehensive and actionable evidence system, a hybrid approach combines the economy-wide coverage of EEIO with the granularity of targeted LCAs. In practice, the EEIO baseline (Option 1A) provides national totals and consistent reporting under production and consumption perspectives; LCAs add detail for priority subsectors or assets, including capital investments where relevant. Integration rules are needed to avoid double-counting and to reconcile site-level findings with the macro account. The hybrid model is particularly useful for scenario analysis: economy-wide changes (e.g., shifts in visitor mix) are handled in the EEIO framework, while specific technology or operational changes (e.g., vessel upgrades, building retrofits) are quantified through LCAs and fed back into the broader account.
Progressing to a hybrid system depends on a stable EEIO baseline and on lessons from initial LCA pilots. If further precision or comparability is required, layering in a Scotland‑specific TSA (Option 1B) and/or a spatial disaggregation (Option 1C) strengthens the backbone. Formal governance is essential, covering data exchange, boundary rules, integration protocols and publication standards. A pragmatic timeline is 12-18 months after the baseline is established, depending on the scope of integration and the number of LCAs and recognising that this is a multi‑year investment. The principal risks are methodological inconsistency and double counting, which can be mitigated through clear reconciliation rules, staged delivery and routine quality assurance.
Recommended pathway
If the immediate aim is to obtain a reliable national‑level estimate that can be updated routinely, a pragmatic “now/next/later” sequence helps align effort with ambition and available resources.
- Now (first 6-12 months). If the priority is a credible estimate quickly, Scotland can begin with an EEIO baseline using existing environmentally‑extended Input-Output tables (Scottish Government, 2024), Air and Energy Accounts (ClimateXChange, 2020), and visitor spend/mode shares from IPS (Office for National Statistics, 2025a) /GBTS (Office for National Statistics, VisitEngland, VisitScotland and Visit Wales, 2025). Accounting perspective(s) to be reported (consumption, and production where feasible) should be published, as well as boundary rules for transport and shared sectors (for example, inbound aviation legs, ferries, car hire, and allocation in food/retail), and an update plan.
- Next (6-24 months). If the ambition is greater precision and international comparability, Scotland should consider commissioning a Scotland‑specific Tourism Satellite Account (TSA) to strengthen sector splits and visitor‑spend mapping, and/or investing in spatial disaggregation to support place‑based policy (for example, island/mainland distinctions or priority regional clusters). Developing a TSA would require feasibility/design, data agreements and compilation; benefits accrue once the TSA is produced and linked to the EEIO backbone. Spatial disaggregation could then begin with a data audit and the use of best‑available indicators (guest‑nights, occupancy, card spend) to apportion totals, calibrated and validated for priority regions.
- Later (24+ months). If the ambition is a comprehensive and granular evidence system, Scotland could progress toward a hybrid set‑up. This could be done by integrating the EEIO backbone with targeted LCAs, under formal governance and quality‑assurance arrangements, to obtain detailed per-unit metrics such as “per guest-night” or “per passenger-km” which complement the broader economy-wide insights from the EEIO model. If approved, the Scotland‑specific TSA and/or a spatial layer could be published to strengthen the backbone. This hybrid model could be developed to support dual reporting (production and consumption perspectives), economy‑wide tracking and site‑level diagnostics for investment planning and enables scenario analysis that combines macroeconomic shifts with specific technology or behaviour changes. It should be noted that this is a multi‑year investment; staged delivery, documented boundaries and reconciliation rules will keep the programme manageable and transparent.
This pathway is intended to be proportionate and conditional: if national coverage is needed soon, Scotland should begin with the EEIO baseline; if finer granularity or comparability is desired, a TSA and spatial elements can be added; if operational insight is required, detailed LCA pilots can be run and integrated to provide per-unit metrics essential for future carbon impact assessments. A subsequent phase of work can refine costs, confirm data‑sharing arrangements and formalise governance before long‑term commitments are made.
Implications for Scotland
This review has shown that robust measurement starts with shared definitions (IRTS/MST), transparent system boundaries (production vs consumption perspectives), and a practical choice of method that balances coverage, granularity, cost, and capacity. International practice converges on an EEIO approach to deliver economy‑wide, repeatable footprints, with LCAs providing fine‑grained operational evidence where it is most useful. Scotland’s unique demand mix, transport realities, seasonal labour market and island geographies mean that boundary‑setting, mode‑specific transport accounting, careful baseline selection and pragmatic production‑side allocation are critical to producing reliable, policy‑relevant estimates.
Four implications are especially relevant for Scotland.
- First, transport accounting materially affects totals and category splits. Clear rules are needed for inbound aviation connections, ferries, car hire and shared services. This should be supported by origin-destination evidence and sensitivity testing so stakeholders understand how allocation choices influence results.
- Second, baseline selection matters in a post‑COVID context. Domestic demand, operating costs and behaviours, such as length of stay or mode choice, have shifted. If trend tracking is the aim, a two-year baseline or explicit comparisons to pre‑COVID patterns will help avoid embedding atypical years as the norm.
- Third, production‑side attribution is complicated by seasonal employment and mixed‑use facilities. Where premises serve both residents and visitors, apportioning energy and emissions with tourism‑intensity indicators, such as occupancy, guest‑nights or visitor spend, improves accuracy and avoids misallocation.
- Fourth, reporting perspective shapes interpretation and policy levers. Consumption‑based reporting reveals the full footprint of tourism demand (including supply chains and imported impacts) and is well‑suited to scenario testing. Production‑based reporting, on the other hand, aligns with national inventories and territorial interventions. Presenting both perspectives, where feasible, brings clarity to responsibilities and choices.
In practical terms, if the ambition is a repeatable national estimate that can track change, an EEIO baseline built from existing data provides a proportionate starting point, with clear transport and shared‑sector rules and published assumptions. If precision or comparability is sought, a Scotland‑specific TSA and/or spatial disaggregation can be planned, recognising their higher cost and longer lead times. If decision‑makers require fine‑grained operational evidence to target interventions, LCA pilots can run in parallel and feed insights back into the baseline. Over time, if the goal is a comprehensive system that serves both strategic reporting and operational action, these elements can be integrated into a hybrid framework under strong governance.
This phased approach brings the key findings together, acknowledges Scotland’s distinctive context, and sets out conditional steps. In this way, short‑term action can be weighed against future ambition and resource constraints, while preparing for a second phase of work that will further inform the final methodological choices.
References
Cadarso, M. et al. (2016). ‘Calculating tourism’s carbon footprint: Measuring the impact of Investments’, Journal of Cleaner Production, 111, pp. 529–537. doi:10.1016/j.jclepro.2014.09.019.
Civil Aviation Authority (2025). UK airport data. Available at: https://www.caa.co.uk/data-and-analysis/uk-aviation-market/airports/uk-airport-data/ (Accessed: 15 October 2025).
ClimateXChange (2020). Air and energy accounts for Scotland. Available at: https://www.climatexchange.org.uk/projects/air-and-energy-accounts-for-scotland/ (Accessed: 15 October 2025).
Jones, C. (2023). ‘The carbon footprint of regional tourism trips: insights from environmentally extended regional input output analysis’, Journal of Sustainable Tourism, 32(8), pp. 1605–1620. doi: 10.1080/09669582.2023.2254949.
Lindahl, J. et al. (2024). Measuring the Carbon Footprint of Tourism in Denmark. Centre for Regional and Tourism Research. Available at: Measuring the Carbon Footprint of Tourism in Denmark.
Office for National Statistics (2024). Consumer card spending in UK tourism-related sectors. Available at: https://www.ons.gov.uk/economy/economicoutputandproductivity/output/bulletins/consumercardspendinguktourismrelatedsectors/latest (Accessed: 15 October 2025).
Office for National Statistics (2025a). International Passenger Survey. Available at: https://www.ons.gov.uk/surveys/informationforhouseholdsandindividuals/householdandindividualsurveys/internationalpassengersurvey (Accessed: 15 October 2025).
Office for National Statistics (2025b). UK Tourism Satellite Account (TSA) tables. Available at: https://www.ons.gov.uk/economy/nationalaccounts/satelliteaccounts/datasets/uktourismsatelliteaccounttsatables (Accessed: 15 October 2025).
Perch-Nielsen, S., Sesartic, A. and Stucki, M. (2010). ‘The greenhouse gas intensity of the tourism sector: The case of Switzerland’, Environmental Science & Policy, 13(2), pp. 131–140. doi:10.1016/j.envsci.2009.12.002.
Pousa-Unanue, A. et al. (2025). ‘Calculating the carbon footprint of urban tourism destinations: A methodological approach based on tourists’ spatiotemporal behaviour’, Land, 14(3), p. 534. doi:10.3390/land14030534.
Rico, A. et al. (2019). ‘Carbon footprint of tourism in Barcelona’, Tourism Management, 70, pp. 491–-504. doi:10.1016/j.tourman.2018.09.012.
Scottish Government (2024). Supply, Use and Input–Output tables for Scotland: latest release. Available at: https://www.gov.scot/publications/input-output-latest/ (Accessed: 15 October 2025).
Scottish Government (2025). Scottish Greenhouse Gas Statistics 2023. Available at: https://www.gov.scot/publications/scottish-greenhouse-gas-statistics-2023/ (Accessed: 15 October 2025).
Scottish Tourism Alliance (2024). ‘Scotland Outlook 2030 – Scotland’s tourism strategy’, Available at: https://scottishtourismalliance.co.uk/scotland-outlook-2030-overview/ (Accessed: 13 October 2025).
Scottish Tourism Alliance (2024). Scottish Tourism Alliance Industry Survey [Preprint]. Available at: https://scottishtourismalliance.co.uk/wp-content/uploads/2024/11/Scottish-Tourism-Alliance-Industry-Survey-Report-October-2024-27th-November-2024.pdf.
Transport Scotland (2025). Statistics: data and publications. Available at: https://www.transport.gov.scot/our-approach/statistics/ (Accessed: 15 October 2025).
UK Government (2025). Great Britain Tourism Survey (GB Tourist) 2024: statistical release announcement. Available at: https://www.gov.uk/government/statistics/announcements/great-britain-tourism-survey-gb-tourist-2024 (Accessed: 15 October 2025).
UN Tourism (2021). The Glasgow Declaration on Climate Action in Tourism (2021) The Glasgow declaration on climate action in tourism. Available at: https://www.untourism.int/the-glasgow-declaration-on-climate-action-in-tourism (Accessed: 13 October 2025).
UN Tourism (2024). Measuring the sustainability of tourism (MST), On measuring the sustainability of tourism: MST. Available at: https://www.untourism.int/tourism-statistics/measuring-sustainability-tourism (Accessed: 13 October 2025).
UN Statistics Division (2008). International Recommendations for Tourism Statistics 2008 (Series M, No. 83/Rev. 1). New York: United Nations. Available at: http://unstats.un.org/unsd/publication/Seriesm/SeriesM_83rev1e.pdf (Accessed: 15 October 2025).
Visit Finland.com (2025). Border Survey. Travel Trade Visit Finland. Retrieved October 14, 2025, from https://travel-trade.visitfinland.com/en/border-survey/
VisitBritain (2025a). Card spending data. Available at: https://www.visitbritain.org/research-insights/card-spending-data (Accessed 28 October 2025).
VisitBritain (2025b). UK short-term rentals dashboard. Available at: https://www.visitbritain.org/research-insights/uk-short-term-rentals (Accessed: 15 October 2025).
VisitScotland (2025a). Scotland Visitor Survey: who our visitors are and what they do. Available at: https://www.visitscotland.org/research-insights/about-our-visitors/visitor-survey (Accessed: 15 October 2025).
VisitScotland (2025b). UK sentiment tracker: visitor intentions and attitudes. Available at: https://www.visitscotland.org/research-insights/about-our-visitors/uk/sentiment-tracker (Accessed: 15 October 2025).UN Tourism (2008).
Appendices
The project was conducted across four stages, summarised below:
Stage 1. Scoping and conceptual framework
During Stage 1, we established the context, use, and need for this research with THILG and Scottish Government. We established and refined a project delivery plan, and developed a theoretical framework which established the priorities and focus areas for the research, and aligned the project with both immediate policy needs and long-term evidence goals.
Stage 2. Desktop-based literature review
Stage 2 involved the compilation of literature sources. We undertook a desktop-based literature review, evaluating a long list of potential sources in line with a set of inclusion criteria. A shortlist of up to 30 relevant documents was identified for further assessment.
Stage 3. Systematic assessment of the applicability of methods to Scotland
In Stage 3, we systematically assessed the applicability of methods to Scotland. Stage 3a involved a critical evaluation of the shortlisted literature sources, where we analysed their strengths, weaknesses, and gaps. This provided a clear understanding of which sources were most applicable to the Scottish tourism sector and which methodological aspects could be adapted for future application. Further, we evaluated each source for its applicability to the tourism sector in Scotland.
Stage 4. Reporting and recommendations
Stage 4 focused on reporting and recommendations. This written report communicates the results of the critical evaluation, providing CXC, the Scottish Government, and THILG with an understanding of the existing information on quantifying the GHG emissions footprint of Scotland’s tourism industry. We have also provided recommendations for applying and strengthening existing methodologies, in order to set up an intended subsequent Phase 2 of this research, which focuses on developing a Scotland-specific approach.
Continuous Stages. Stakeholder engagement and data compilation
Initiating from the project’s outset, we engaged with several stakeholders comprising Scottish Government analysts, industry representatives, and tourism research organisations VisitScotland, VisitBritain, Visit Denmark and the Centre for Regional and Tourism Research (CRT). These engagements helped to focus the research and highlighted key data sources for analysis, providing further context into the data capacity of both Scotland and the UK. A separate meeting with the CRT provided insights into the in-depth exercise undertaken in Denmark (see Section 9.1.5).
Literature review – long list and short list composition and initial review
As described in section 4, our methodology involved the identification of a long list of literature consisting of both documents and data sources (Stage 2) which were then shortlisted and assessed in further detail (Stage 3). The following figures portray the composition of the long list and short list assessed, respectively.
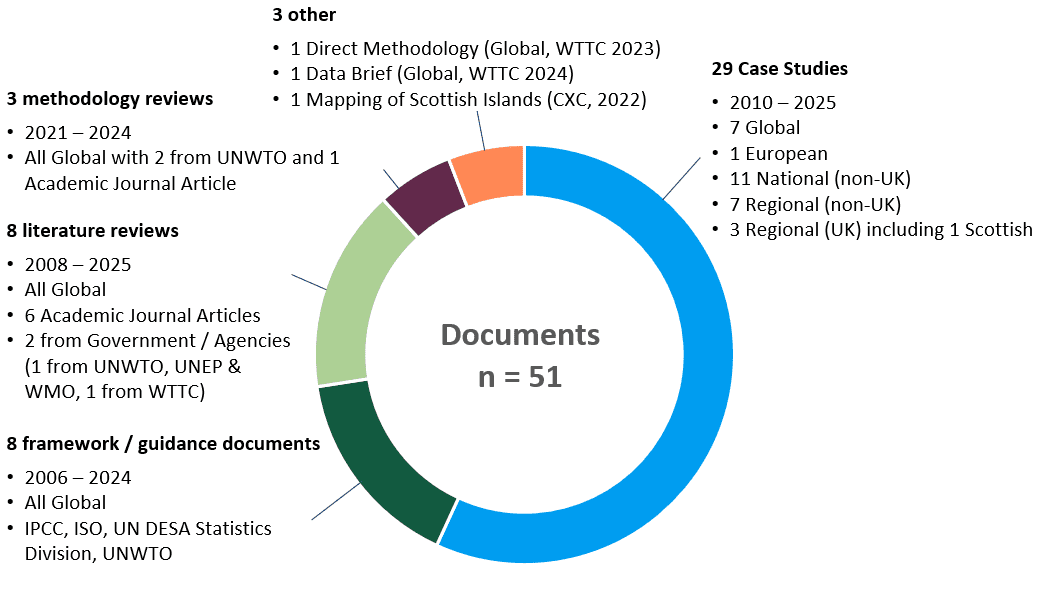
Figure 1: The composition and key characteristics of the documents assessed in the long list literature review process (Stage 2).
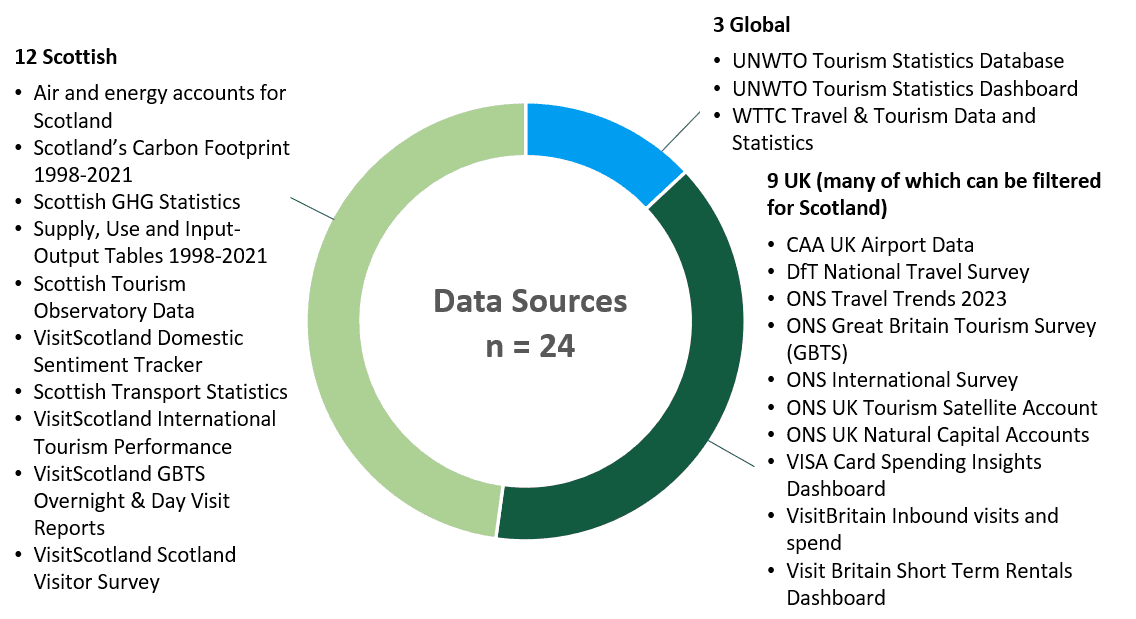
Figure 2: The composition and key characteristics of the data sources assessed in the long list literature review process (Stage 2).
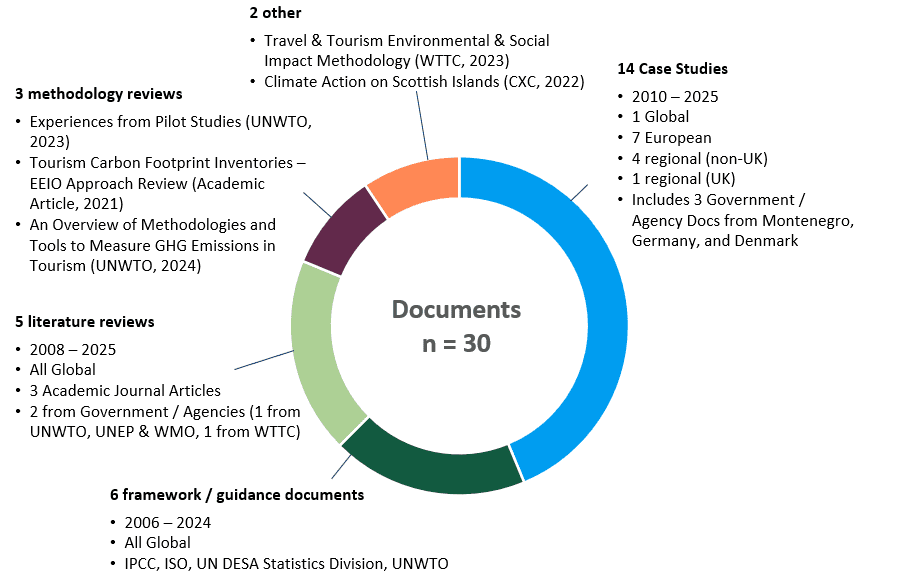
Figure 3: The composition and key characteristics of the documents assessed in the prioritised short list literature review process (Stage 3).
Short list analysis
The following sub-sections describe in further detail the five parameters against which the short list of 30 documents was analysed in further detail, according to the parameters listed in Section 4.2.
- Scope and context
- First, we assessed each study on the extent to which their geographic, policy, and sectoral focus (e.g. International, European, or Scottish tourism) was relevant or adaptable to Scotland’s unique context. This included the level at which the approach operates (national, regional, destination) and its consideration of Scotland’s tourism characteristics, climate, and market structure. It also included how much of the tourism sector was covered (inbound/domestic, transport, accommodation, activities, etc.).
- Methodology and tools
- We then assessed studies for the main analytical framework(s), statistical tools, and approaches (e.g. Tourism Satellite Accounts (TSA), Environmental Footprint models, hybrid environmental-economic models) employed. This helped us identify practical models or frameworks that could be replicated, referenced, or adapted for Scotland.
- Data inputs and assumptions
- Our third assessment focus was the data needed for the study (empirical, modelled, national accounts, surveys, emission factors), the nature of those data (primary/raw data or secondary/readily available data, granularity (quantitative/qualitative), timeframe), and any core assumptions (e.g. GHG emission factors, sector boundaries, tourist behaviour). This assessment indicated both the feasibility and the risk of data-related gaps for Scottish replication.
- Outputs and findings
- Next, we assessed the studies for their main outputs produced (GHG estimates, sectoral breakdowns, environmental/social indicators etc.), including detail on supply and demand-side results and any quantified impacts. This clarifies what actionable insights/data each approach yields and its value for Scottish policy or sector management.
- Strengths, caveats and transferability
- Finally, we assessed the observed strengths and limitations (e.g. robustness, transparency, granularity, sector completeness, replicability, coverage of GHG scopes 1-3) of each study. This analysis provided commentary on ease of use, data availability in Scotland, and the overall transferability/adaptability of the approach to the Scottish tourism context.
Data sources were also systematically assessed. This process is explained in the main body of text, section 5.4.
The International Recommendations for Tourism Statistics (IRTS)
Based on international standards, tourism is defined by the activities of visitors, encompassing their trips and all related consumption and economic activities. The definitions and measurement methods are detailed in the International Recommendations on Tourism Statistic (IRTS, 2008). Key definitions in the IRTS are below, with Table 6 providing the products and activities/industries included:
- Visitor: a traveller taking a trip for less than a year to a main destination outside their usual environment for any purpose other than to be employed by a resident entity in the place visited.
- Usual environment: this refers to the geographical area where a person conducts their regular life routines. Travel within this area isn’t considered tourism.
- Visitor classification: a visitor is a tourist if their trip includes an overnight stay. If there’s no overnight stay, they’re considered a same-day visitor.
- Types of tourism:
- Domestic tourism: trips by residents within their own country.
- Inbound tourism: trips by non-residents to a given country.
- Outbound tourism: trips by residents to another country.
- Internal tourism: the sum of domestic and inbound tourism.
- National tourism: the sum of domestic and outbound tourism.
- International tourism: the sum of inbound and outbound tourism.
Table 6: Categories of tourism-characteristic products and tourism-characteristic activities (tourism industries) (IRTS).
|
Products |
Activities/industries |
|---|---|
|
1. Accommodation services for visitors |
1. Accommodation for visitors |
|
2. Food and beverage serving services |
2. Food and beverage serving activities |
|
3-6. Railway, Road, Water, and Air passenger transport services, respectively |
3-6. Railway, Road, Water, and Air passenger transport, respectively |
|
7. Transport equipment rental services |
7. Transport equipment rental |
|
8. Travel agencies and other reservation services |
8. Travel agencies and other reservation service activities |
|
9. Cultural services |
9. Cultural activities |
|
10. Sports and recreational services |
10. Sports and recreational activities |
|
11. Country-specific tourism-characteristic goods |
11. Retail trade of country-specific tourism-characteristic goods |
|
12. Country-specific tourism-characteristics |
12. Other country-specific tourism-characteristics activities |
Applying the International Recommendations for Tourism Statistics definitions
The IRTS (2008) definitions are collated in the UNWTO’s Measuring the Sustainability of Tourism (MST) framework (2024), a global guide for countries to measure and monitor tourism’s impact on the economy, society, and environment. The MST helps nations to produce reliable and comparable data to make informed decisions about sustainable tourism development, providing the “why” and the “what” of measuring the sustainability of tourism. However, it does not specify which methodology to use – the “how”, and previous studies also note there is no consensus. All studies assessed in the shortlist used the definitions and indicators of the IRTS, either strictly or with minor revisions driven by data availability.
Sourcing the economic data – the Tourism Satellite Account
“There is, fortunately, an internationally agreed methodology for understanding the economic scale, nature and impacts of tourism within a destination economy, consistent with systems of national-accounts (SNA) – The Tourism Satellite Account (or TSA).” (Jones 2023).
The TSA is a central part of the MST framework. It is an internationally recognised accounting tool that helps a country isolate and measure tourism’s economic activity. The TSA pulls together data from various sectors (hotels, airlines, restaurants, etc) to paint a picture of tourism’s direct economic contribution to a nation’s GDP. The MST framework references the TSA to ensure a consistent and comparable way to define and measure the economic boundaries of the tourism sector.
The TSA measures:
- Tourism expenditure (inbound, outbound, domestic, internal)
- Production accounts of tourism industries
- Employment in tourism industries
- Gross fixed capital formation
- Tourism collective consumption (e.g. government spending on tourism promotion)
- Non-monetary indicators (e.g. number of visitors and nights spent).
As such, the TSA provides the economic data that defines the tourism sector. While Scotland does not have a regional TSA, the ONS maintains one at the UK level.
Production vs consumption approaches: summary table
Table 7: Production, consumption, and hybrid approaches, their definitions, advantages and disadvantages with respect to this study’s scope.
|
Approach |
Production |
Consumption |
Hybrid |
|
Definition | Counts emissions where they physically occur within Scotland’s borders (territorial) for in‑scope tourism activity. Includes direct in‑destination emissions (e.g., energy use in accommodation, local transport, on‑site activities). Excludes upstream/embodied emissions in imported goods/services and international travel occurring outside Scotland. | Counts emissions caused by tourism activity within Scotland (domestic trips within Scotland and inbound international visitors), regardless of where they physically occur. Includes indirect/embodied emissions in supply chains and imports associated with in‑scope tourism demand. Outbound trips by Scottish residents are excluded from scope. | Reports both production‑ and consumption‑based results side‑by‑side for the same in‑scope tourism activity. Provides territorial totals and full demand footprints within one framework. Uses transparent boundary rules to avoid confusion and double counting. |
|
Pros | Aligns with national inventory rules and territorial emissions statistics; straightforward where data are robust. Clear jurisdictional responsibility for mitigation actions within Scotland. Easier to compile and explain to non‑technical audiences. | Provides a more complete footprint of in‑scope tourism demand (direct + supply chain + imported), supporting policy appraisal. Enables comparisons of total climate impact across activities, visitor types, and transport modes. Suits scenario analysis and demand‑side measures (e.g., shifts in mode choice or spending patterns). | Offers the most complete and comparable view; clarifies differences between “generated in Scotland” and “demand‑driven” totals. Supports both compliance (territorial) and policy design (footprint), improving relevance to decision‑makers. Enhances international comparability and communication by showing both perspectives. |
|
Cons | Does not capture indirect/embodied emissions from imported goods/services or international transport linked to visitors. Likely to understate the full climate impact of tourism demand. Limited usefulness for supply‑chain or demand‑side intervention design. | More complex and data‑intensive; depends on high‑quality economic/environmental accounts. May attribute emissions outside Scotland’s jurisdiction for in‑scope trips (e.g., inbound aviation legs), requiring clear boundary rules. Results can be harder to communicate and reconcile with territorial inventories. | Highest complexity and resource requirement; needs strong governance and clear communication to prevent misinterpretation. Requires robust integration of datasets and methods to maintain consistency over time. Longer lead‑in and ongoing maintenance effort compared with single‑perspective reporting. |
Appendix D: Case studies
EEIO/MRIO example case study 1 – Denmark (Lindahl et al., 2024)
Denmark provides a strong example of how to measure the carbon footprint of tourism at the national level, using a mix of established methodologies. The following case study summarises the study’s scope, methodology, involvement and key takeaways.
Scope
The Danish case study follows the international standardised definition of tourism and:
- Covers the domestic and inbound visitors’ data, leaving aside outbound travelling information.
- Includes commercial stays in hotels, cruises, holiday homes, and smaller accommodations; non-commercial stays such as personal or borrowed vacation homes as well as visits to family and friends; day-based activities such as festivals and events visits.
- Accounts for direct, indirect, imported, and international transport emissions, covering international transport emissions.
The methodology disaggregates tourism data across 19 municipalities in Denmark proper; the Faroe Islands and Greenland, as self‑governing territories, produce separate statistics and national inventories; as such, they were outside its scope.
Methodology
The Danish methodology relies on two main branches of data exploration: domestic consumption data and international transport data.
The Danish assessment is built on an integrated framework that combines multiple international and national tools. The starting point is the Tourism Satellite Account (TSA) data, which categorises visitor spending across different categories of consumption. Matching these categories to the Danish System of Environmental-Economic Accounting (SEEA), this data provides the emission intensity for each type of tourist expenditure. The model then layers a coupled multi-regional input-output (MRIO) model combining a Danish interregional input-output model with the global EXIOBASE database. This ensures the model represents both domestic and international supply-chain impacts. Additional sources, such as survey data, further enrich the model by providing detailed information on spending across visitor types.
To provide an exhaustive methodology, international transport is covered via a separate calculation. Following UN Tourism guidance, and a methodology first applied in Norway, emissions were calculated using the distance travelled, average emissions per passenger kilometre and the number of inbound visitors by mode of transport and leveraged sources such as Google Maps routing and the ICAO carbon calculator.
Involvement
The study was funded by the Danish Board of Business Development and comprised multiple partners and contributors. Amongst the main actors, the following entities contributed largely:
- Statistics Denmark (national accounts, SEEA, EXIOBASE coupling)
- Danish Energy Agency (emission inventories and energy data
- Copenhagen Airport and Aalborg University (aviation data)
- Danish Road Directorate (domestic transport data)
- Technical University of Denmark
- DREAM (company providing insights on the Danish economy)
Key takeaways
Denmark’s account is a leading, mature example rather than a single “gold standard”; comparable components – TSA‑linked EEIO/MRIO with dual production/consumption reporting and explicit treatment of international transport – have also been implemented or tested elsewhere (for example, in Australia and Germany).
The Danish case study is a good example of best practice in tourism emission measurement but also illustrates the resource and governance challenges of such a study. The use of a detailed TSA, an interregional input‑output model, comprehensive visitor survey data, and cooperation between multiple agencies created a successful environment for the study. Replicating this level of detail in Scotland could require significant investment in data and statistical resources.
Financially, the model requires sustained funding and regular updating. The setup of a strong governance and coordination model is also key to ensuring smooth collaboration across the different entities cited above. The model is also based on several assumptions, especially relating to international transport.
Overall, Denmark shows what is possible when the statistical foundations, governance set up and resources are in place but also highlights the scale of effort required to replicate such approach. However, it is important to note this case study is the product of a long process of capacity-building rather than a stand-alone project.
EEIO/MRIO example case study 2 – Wales (Jones, 2023)
Wales provides a geographically-relevant example of how Environmentally-Extended Input-Output (EEIO) methods can be used at a regional level to measure tourism’s carbon footprint. The study uses Wales-specific economic tables, linked to the Tourism Satellite Account (TSA), to capture the spending of three types of visitors: international tourists, UK overnight visitors, and day-trippers. This spending is then linked to the industries in Wales’s Input-Output (IO) tables, which describe how each sector of the economy is connected to others (for example, a hotel not only consumes energy directly, but also buys food, cleaning services, and construction). Next, emissions intensities are applied to each industry using environmental extensions, which translate the level of economic activity into tonnes of CO2e.
To capture the global picture, the model extends beyond Wales using a multi-regional IO framework, so imported goods and services (such as food or manufactured products) also carry their upstream emissions. Because visitor travel is a major source of emissions but not fully captured in IO tables, the study adds a separate transport module based on visitor survey data on distances and modes travelled (cars, flights, trains), applying official emission factors and then attributing the resulting emissions to Wales when it is the destination.
This case study is a good illustration of the EEIO/MRIO approach because it shows clearly how visitor spending is converted into industry categories such as accommodation, food services, and transport, and then linked to their associated emissions. This makes the approach practical and policy-relevant, providing a whole-economy footprint of tourism emissions. Results are broken down by visitor type and by responsibility, for example, showing the share from supply chains in Wales, travel to and from the country, and energy use within Wales. This helps decision-makers identify the main levers for action, such as reducing the emissions from travel compared to those from in-destination supply chains.
The study is also transparent about the limits to this methodology, mentioning survey inconsistencies between 2007 and 2019, IO aggregation loss in hospitality detail, and assumptions in the travel module. It is also a good example signalling practicality and cost by reusing existing IO/EEIO infrastructure, TSA tables, and visitor surveys, with the main incremental effort in tourism disaggregation and the travel module, making it a realistic path for regions that already maintain IO tables and tourism statistics.
LCA example case study – Barcelona (Rico et al., 2019)
Rico et al. (2019) provides an example of how the Life Cycle Assessment (LCA) approach can be applied at a city scale to measure the carbon footprint of Barcelona’s >30 million annual visitors. The study defines clear activity boundaries, such as the arrival/departure transports used, accommodation, leisure/professional activities undertaken, and intra-urban transports used, and applies Ecoinvent v3.2 and DEFRA 2015 emission factors to survey-based data on visitor numbers, energy use, and distances travelled.
Unlike TSA/IO approaches, which trace spending through economic accounts, the method used in Barcelona links emissions directly to tourism activities, allocating only the share attributable to visitors when services were shared with residents. Using surveys and spending data, the assessment thus makes a useful case study for understanding how LCA can produce detailed, per-visitor and per-activity emission metrics, while being transparent about limitations (e.g., excluding catering/retail due to allocation issues).
This case is a good example of how cities can apply established LCA methods to tourism, what kind of data is required (large visitor surveys, attraction energy data, transport usage), and highlights both the strengths (activity-level insight, Scope 1-3 coverage) and challenges (aviation dominance, data gaps). It is interesting as it shows how a local authority can make carbon accounting decision-relevant and complement more national economic accounting approaches.
EEIO/LCA example case study – Spanish investment (Cadarso et al., 2016)
This Spanish case study provides an example of a hybrid LCA-IO methodology, as it combines the detail of life cycle approaches with the broad coverage of input-output analysis. It uses Spain’s Tourism Satellite Account (TSA) and input-output tables, which track how spending flows through different parts of the economy, and links them to environmental accounts that provide emission factors. What makes this study stand out is that it goes further by including the emissions linked to capital investments, i.e. the building of hotels, the construction of transport infrastructure, and the production of equipment needed to serve tourists. By doing this, the study shows not only the emissions from everyday visitor spending, but also the longer-term climate costs of maintaining and expanding the tourism sector.
The scope is also very clear – it includes both goods and services bought by tourists (from food to accommodation and transport) and the investments needed to provide these services in the first place. Visitor spending is matched to the relevant industries and can thus be translated into emissions transparently and systematically. One of the most important insights is that when capital investments are added, the total carbon footprint of tourism in Spain increases by more than a third. This shows why this capital investment LCA approach is vital to compose an exhaustive interpretation of the tourism sector carbon footprint.
The study is open about its limitations, such as relying on standard assumptions about technology use, not spreading capital emissions over the lifetime of infrastructure, and excluding household fuel use, which enhances the overall credibility of the results. Additionally, because it is built on well-established economic and environmental statistics (TSA, IO tables, and emissions accounts), the approach is relatively cost-efficient and can be replicated in other countries with similar data systems. Overall, this example of a hybrid case study combines the strengths of detailed activity-based approaches and economy-wide modelling to produce a fuller, more accurate picture of tourism’s carbon footprint.
Survey-based example case study – San Sebastián (Pousa-Unanue et al., 2025)
The San Sebastián case study offers a clear example of a survey-based approach to measuring the carbon footprint of tourism. The assessment relies on direct surveys of visitors (301 valid responses collected under ISO and ESOMAR standards), which provide data on motivations, activities, accommodation, length of stay, transport modes, and points of interest visited. This allows the methodology to directly translate visitor behaviour into emissions by categorising activities such as gastronomy, beach visits, cultural sites, or nature trips, and linking these to corresponding energy and transport use.
This case study is a good example of how survey methods can generate granular insights into the “how” and “why” of tourist emissions, going beyond expenditure data to capture spatiotemporal patterns of mobility and behaviour. This makes it particularly valuable for decision-making, as it highlights which visitor segments (e.g. cultural tourists vs. nature tourists) and which itineraries create higher emissions, helping policymakers prioritise interventions.
The study is also explicit about its limitations, noting that results are extrapolated from sample surveys and that seasonal events (such as festivals) are excluded. At the same time, it is transparent in showing how activities and categories are defined and how emissions are calculated for accommodation, transport, and activities. Because the data collection follows standardised protocols and builds directly on visitor surveys rather than complex statistical infrastructures, this approach is both replicable and cost-feasible, making it a useful option for cities that want actionable insights without the heavy investment of IO or hybrid models.
How to cite this publication:
Pritchard, A., Miller, B., Bey, N., Fernandez, E. and OGorman, S. (2025) ‘Approaches to measuring greenhouse gas emissions in Scotland’s tourism sector’, ClimateXChange. DOI
© The University of Edinburgh, 2025
Prepared by Ramboll on behalf of ClimateXChange, The University of Edinburgh. All rights reserved.
While every effort is made to ensure the information in this report is accurate as at the date of the report, no legal responsibility is accepted for any errors, omissions or misleading statements. The views expressed represent those of the author(s), and do not necessarily represent those of the host institutions or funders.
This work was supported by the Rural and Environment Science and Analytical Services Division of the Scottish Government (CoE – CXC).
ClimateXChange
Edinburgh Climate Change Institute
High School Yards
Edinburgh EH1 1LZ
+44 (0) 131 651 4783
If you require the report in an alternative format such as a Word document, please contact info@climatexchange.org.uk or 0131 651 4783.
See section 5.3 for further details on the life cycle assessment approach. ↑