
DOI: http://dx.doi.org/10.7488/era/3892
Executive summary
Aims
The Scottish Government’s draft Energy Strategy and Just Transition Plan emphasises the importance of local and community energy projects for supporting Scotland’s net zero and just transition ambitions.
This study aimed to understand how those projects can help deliver against these ambitions within devolved powers. The research explored developments in local and community energy and assessed key innovations, opportunities and barriers, and how to leverage those projects to support Scotland’s National Just Transition Outcomes (NJTOs).
The methodology included a literature review, interviews with citizens, local and community energy practitioners and other key energy and just transition stakeholders (including just transition experts and researchers; local authorities; fuel poverty and third sector charities; energy finance and investment stakeholders; energy developers and networks; and those working in local energy innovation initiatives such as the Prospering from the Energy Revolution programme and a deliberative ‘People’s Panel’ with Scottish citizens.
Findings
- Looking at evidence from Scotland and across the UK, we have found that local and community energy can directly contribute to all eight of Scotland’s National Just Transition Outcomes.
- There are key barriers to delivering against these outcomes across sectors: limited resources to build capacity for local and community energy projects in underserved areas; challenges around skills and project delivery processes particularly within local authorities; justice and equity issues within projects themselves; and lack of appropriate finance and business models.
Recommendations
We set out six overarching recommendations to help increase the contribution of the local and community energy sectors to Scotland’s Just Transition, and provide a set of 19 evidence-based actions to increase local and community energy as the Scottish Government develops the final version of its flagship Energy Strategy and Just Transition Plan.
The recommendations are designed for Scottish Government policymakers and other key partners, including local government, delivery bodies, the energy industry, communities and wider stakeholders working across energy, heat in buildings, transport, land use and planning, economic development, communities and fuel poverty. There are also wider lessons for those developing local and community energy approaches across the UK and Europe with a just transition in mind.
- Increase community capacity and outreach, including resource for and awareness of the local and community energy sectors to support capacity-building, effective project development and outreach, particularly in typically excluded communities.
- Support the development of new local and community energy models, including the skills, resource and networks required for communities and local authorities to fully embrace them.
- Enhance community ownership of energy and governance of projects, ensuring these are accessible, accountable and transparent, with proactive inclusion of marginalised and excluded groups.
- Increase participation and engagement, ensuring that all groups and communities have a fair opportunity to engage with local and community energy projects, to help participate in governance and decision making, and shape projects from the beginning.
- Develop sustainable finance, funding and investment models that ensure those who can’t afford to pay are not excluded and that maximum value is retained locally, with just transition outcomes explicitly prioritised.
- Open up benefits of local and community energy projects to as wide a range of people and places as possible, from decarbonisation and bill savings, to skills, through to supply chains.
Abbreviations table
| CARES | Community and Renewable Energy Scheme |
| ESJTP | Energy Strategy and Just Transition Plan |
| LAEP | Local Area Energy Planning |
| LCE | Local and Community Energy |
| LHEES | Local Heat and Energy Efficiency Strategies |
| NJTO | National Just Transition Outcomes |
| PPA | Power Purchase Agreement |
| RESOP | Regional Energy System Optimisation Planning |
| SSEN | Scottish and Southern Electricity Networks |
| SPEN | Scottish Power Energy Networks |
| DNO | District Network Operator |
Introduction
Community energy in Scotland
For over a decade, Scotland has strived to lead the way in local and community energy, with a Scottish Government target to reach two gigawatts of installed local and community-owned capacity by 2030 (Scottish Government, 2021a).
While aspects of energy policy and regulation in the UK are reserved, limiting the work that Scottish Government can do to fully enable local and community energy in Scotland, the Scottish Government has fostered a favourable policy environment for this sector. This is mainly through providing funding via the Community and Renewables Energy Scheme (CARES) to support the development and delivery of local and community energy projects. CARES has supported over 800 projects and 1000 organisations with over £61 million in funding (Scottish Government 2023b).
More recently, the Scottish Government has supported local authorities to deliver their own Local Heat and Energy Efficiency Strategies, which will set the foundation for more local energy systems and initiatives (2022a). Alongside this, there has been the announcement of the Onshore Wind Sector Deal (Scottish Government 2023c) – a shared commitment between the Scottish Government and industry to deliver against Scotland’s ambition of 20 gigawatts of onshore wind by 2030, in a way that aligns with the principles of a just transition.
Within this positive context, there are clear opportunities to further accelerate Scotland’s good work on local and community energy so far. Local and community energy, such as community-owned wind and solar, or district heat projects led by local authorities, can provide substantial social, economic and environmental benefits to people, places and a range of other stakeholders.
The benefits of local and community energy include: new revenue streams for local areas; new business and investment opportunities; reduced emissions; climate education and outreach; climate adaptation and resilience; improved capacity in local communities; new skills and job creation; and reduced fuel poverty (Ford et al., 2019; Gooding et al., 2020; PwC, 2022). Community and local energy also provides an opportunity to make Scotland’s net zero transition more local, democratic and inclusive, with energy projects and solutions better tailored to local needs.
These diverse benefits mean that local and community energy is well placed to contribute to achieving against Scotland’s eight National Just Transition Outcomes (NJTO) (Box 1). The National Just Transition Outcomes are a set of goals designed by Scottish Government, informed by the Just Transition Commission (2023), to help mitigate the risks of climate action and unlock the opportunities that a just transition presents across sectors and policy areas (Scottish Government 2022b). Within the context of the finalisation of the Energy Strategy and Just Transition Plan (ESJTP) and aligned policies such as the Heat in Buildings Strategy, local and community energy could thus have a significant role to play.
Methodology
In this report, we outline how to develop the local and community energy sector in Scotland in such a way that it delivers against Scotland’s NJTOs. To do so, we conducted a three-step research approach (these are detailed in appendices A and B). First, we conducted an extensive review of academic, policy and project literature and case studies. This allowed us to understand the most recent thinking and developments in the local and community energy space, and identify key just transition trends and issues.
Second, we interviewed 22 expert stakeholders. These included: community energy organisations; just transition experts and researchers; local authorities; fuel poverty and third sector charities; energy finance and investment; energy developers and networks; and those working in local energy innovation initiatives such as the Prospering from the Energy Revolution programme (UKRI, 2023). These stakeholders were chosen to give a breadth of perspectives on leveraging local and community energy for just transition outcomes beyond energy specialists alone, and to understand any key points of conflict between sectors and stakeholders.
Third, we conducted a “People’s Panel” with 22 Scottish citizens, most of whom were from lower income areas of the country. This helped to understand the opportunities and barriers people faced to participating in local and community energy projects, and how these sectors could best be opened up to improve buy-in from communities and provide diverse NJTO benefits to people and places.
There was higher representation from both citizens and local and community energy practitioners than renewable energy developers and businesses in this process. This was deliberate, because citizens and local and community organisations, particularly those working on just transition issues, have not always been involved in such discussions, yet can provide crucial insights on how to best open up local and community energy for a wider range of just transition outcomes. This means that our findings in turn reflect the perspective of those stakeholders more. Further engagement with energy developers and businesses would help make recommendations more robust.
| Box 1: Scotland’s eight National Just Transition Outcomes1. Citizens, communities and place: empowering and invigorating communities and strengthening local economies
2. Jobs, skills and education: equipping people with the skills, education and retraining required; providing access to green, fair and high-value work 3. Fair distribution of costs and benefits 4. Business and economy: supporting a strong, dynamic and productive economy, making Scotland a great place to do business 5. Adaptation and resilience: identifying risks and planning for long-term resilience against climate risks 6. Environmental protection and restoration 7. Decarbonisation and efficiencies 8. Further equality and human rights implementation and preventing new inequalities from arising |
What is local and community energy?
The Local Energy Policy Statement (Scottish Government 2021a) outlines three main categories of community and local energy projects (Table 1).
Across these categories, 908 megawatts of Scotland’s 2 gigawatt target for local and community energy has been delivered. This includes a mix of community energy projects, local authority energy projects, social and housing association developments, public sector investments, as well as initiatives in businesses and on farms and estates.
Table 1. Three categories of local and community energy per the Local Energy Policy Statement (2021)
| Model | Definition |
| Community energy | The delivery of community-led renewable energy projects, whether wholly owned and/or controlled by communities, or through partnerships with commercial or public sector partners. The Scottish Government views community-led energy projects as a priority within the wider local energy landscape. |
| Local energy | More wide ranging, involving a variety of different organisations (public, private, and community sector), who can deliver an energy service/project for the benefit of local people operating within a defined geographical area. |
| Local energy systems | Local energy systems find ways to link the supply and demand of energy services within an area across electricity, heat and transport, deliver real value to everyone in local areas, and support the growth of vibrant, net zero local economies. |
Although they share a number of key features, community energy, local energy and local energy systems do have distinct differences.
Community energy is typically characterised by grassroots action, where a community (either a community of place or of shared interest) comes together to design, implement, and manage a renewable energy asset or project. This might be a community energy generation project, such as a wind turbine or solar panels, or a heat, retrofit or transport scheme. These are often driven by a shared mission to deliver environmental, social and economic value for a specific place, with democratic input and governance (Brummer 2018; Creamer et al. 2020; Stewart 2021; Hanke et al. 2021).
Local energy and local energy systems are more diverse. They tend to have less of a primary focus on communities, and can be delivered though multi-stakeholder collaborations, often led by local authorities or the public sector, or through public-private collaborations (Ford et al., 2019; UKRI and Regen, 2022). They are less like the grassroots model seen in community energy and more akin to local authority-led or partnership approaches (Devine-Wright, 2019).
Value against Scotland’s NJTOs
Table 2. Value from local and community energy across National Just Transition Outcomes
| National Just Transition Outcome | Advantage of local and community energy |
| 1. Citizens, communities and place | Stronger inclusion of citizens in energy decision making and design; retention of value through local ownership; social and economic benefit such as new revenue and skills opportunities; local development and investment; energy projects reflective of local need. |
| 2. Jobs, skills and education | New job opportunities in installation, fitting, retrofit, and energy advice; grassroots education and upskilling; maximising local supply chains. |
| 3. Fair distribution of costs and benefits | Benefits for typically excluded communities through collective, public or private funding; new models to support uptake of low carbon technologies. |
| 4. Business and economy | Role for businesses and investors, particularly in local energy systems; new business models and opportunities in areas such as data, flexibility and innovation. |
| 5. Adaptation and resilience | Community-led responses to climate adaptation and resilience; holistic local climate and energy planning. |
| 6. Environmental protection and restoration | Community-led responses to protection and restoration; holistic local climate and energy planning. |
| 7. Decarbonisation and efficiencies | Local, tailored approach to energy and buildings decarbonisation; grassroots outreach and education; local network building and knowledge-sharing. |
| 8. Equality and human rights | Inclusive engagement; advocacy and representation; more democratic ownership and governance; locally-tailored solutions targeted at addressing e.g. fuel poverty. |
Different models of local and community energy will have different implications for Scotland’s NJTOs. Community-owned energy generation, for instance, is particularly strong on citizens, communities and place, by bringing people together to deliver projects and generating new revenues for local economic development. Community-owned energy generation projects also tend to be strongly motivated by climate and environmental outcomes (Community Energy Scotland, 2022; Community Energy England, 2022; Stewart, 2021).
Local energy and local energy systems tend to focus more on delivering economic value, such as a larger-scale return on investment for stakeholders, and new jobs and skills in retrofit, system installation, maintenance, etc. (Ford et al., 2019; Gooding et al., 2020; PwC 2022).
- Table 2 above outlines the high-level opportunity of local and community energy approaches for Scotland’s NJTOs. Table 3 illustrates the value that each main category has had so far for each of the NJTOs (Low = low value for NJTO) based on our review of empirical research and engagement with local and community energy stakeholders. A detailed qualitative analysis of these relationships across community energy, local energy, and local energy systems can be found in Appendix C
Appendix C: Local and community energy just transition outcome impacts.
Table 3. Illustration of how priorities for local and community energy vary against the eight NJTOs
| Community energy | Local energy | Local energy systems | |
| 1. Citizens, communities, place | High | Medium | Medium |
| 2. Jobs, skills, education | Medium | High | High |
| 3. Distribution of costs | Medium | Low | Low |
| 4. Business & economy | Low | Medium | High |
| 5. Adaptation & resilience | Low | Low | Medium |
| 6. Environment protection & restoration | High | Low | Low |
| 7. Decarbonise & efficiencies | High | High | High |
| 8. Equality and human rights | Medium | Medium | Low |
Table 3 and Appendix C highlight important qualitative differences in how community energy, local energy, and local energy systems deliver value against different NJTOs. However, projects can vary substantially within these broad categories. This also leads to variations in impact on NJTOs.
For example, a local energy project that focuses on decarbonising council buildings, such as leisure centres or commercial properties, will contribute less to NJTOs 1, 3 and 8 than one that supports council housing tenants to decarbonise their homes. A community energy project which uses generation assets to provide new revenues to deliver energy advice and local environmental protection will also contribute more towards NJTOs 1, 2, 6 and 7 than wind turbines installed on a farm or estate.
As such, supporting a balance of different types of projects across regions and areas can help contribute to all of Scotland’s just transition outcomes, allowing projects to meet local need. Projects themselves can also be supported to become fairer and more inclusive, which we deal with later in this report.
Just transition: processes and outcomes
Outcomes are only one part of the picture. As the Scottish Government (2021b) highlights, a just transition is also about process. This means that projects should be designed to enable people to take part in decision-making around the project. Who owns, gets a say, participates in, pays for and benefits from local and community energy projects all have implications for how just projects are considered to be by communities.
From our review of academic evidence and stakeholder engagement, we identified four key dimensions along which projects vary, with implications for how just they are considered to be. These dimensions are applicable to all types of local and community energy and should be considered together (Table 4).
Table 4: Key dimensions for ‘just’ local and community energy projects
| Dimension | Best practise for “just” outcomes |
| Ownership and governance | Democratic, accessible, and accountable ownership, with proactive involvement of diverse citizens and stakeholders in decision making. |
| Participation and engagement | Meaningful, proactive engagement with a diverse range of citizens and communities, people supported to help co-design projects from early stages and on an ongoing basis. |
| Finance, funding and investment | Transparent financial models that prioritise multiple just transition outcomes and do not exclude based on ability-to-pay. |
| Benefit and beneficiaries | Benefits realised socially, economically and environmentally for people and places first and foremost (including in jobs and skills, healthier homes and environmental protection), both individually and collectively where possible. Diverse opportunities for businesses, investors and industry. |
From this analysis, leveraging local and community energy for a just transition means: expanding local and community energy across regions as a whole; and creating the right policy and delivery environment to enable projects to be more just in their processes and outcomes.
In the next section, we provide a high-level overview of key models and developments in each sector. The remainder of the report then provides recommendations for Scottish and Local Government policymakers and delivery bodies working across energy, heat in buildings, transport, land use and planning, economics, local government, communities and fuel poverty.
While this report does not represent Scottish Government policy, it makes recommendations to inform the role of local and community energy in key national policies, including the forthcoming final ESJTP as well as delivery of adjacent strategies such as implementation of Local Heat and Energy Efficiency Strategies (LHEES) and wider Heat in Buildings Strategy, Community Wealth Building, and Local Development Plans under National Planning Framework 4.
Community energy
Community energy has flourished in Scotland during the last decade, with 101 megawatts of community-owned generation capacity reported to be in operation or in-development as of December 2022 (Scottish Energy Statistics Hub 2023). Many other projects are also in motion e.g. decarbonisation of heat and transport. This is illustrated in the illustration opposite which shows a community using renewable energy.
The Community and Renewable Energy Scheme (CARES), administered by Local Energy Scotland, has provided over £60 million development and capital support. Community energy has thus enjoyed a favourable devolved policy ecosystem. Key developments in the community energy sector are as follows:
‘Traditional’ community ownership and community shared ownership generation projects; Rooftop solar and ‘traditional’ wind projects on community land and buildings; many-to-many power purchase agreements with public sector and commercial offtakers; exploring opportunities to link with community-owned land and housing
Community-owned electric vehicle charging, sometimes paired with car sharing.
Generation and supply
Heat and energy efficiency
Transport
Decarbonisation of community buildings using heat pumps and energy efficiency, providing lower bills to help keep social spaces open and warm hubs over winter; exploring potential for district heat networks and bulk purchase of heat pumps; community-led efficiency and retrofit programmes.
Just transition outcome contribution: citizens, communities and place; climate adaptation and resilience; environmental protection and restoration; decarbonisation and efficiencies; equality and human rights.
Key developments
Generation and supply
Since the winding down of the UK Government Feed-In Tariff – replaced by the less lucrative Smart Export Guarantee – community energy generation in Scotland and the UK has been forced to rely on other models.
This has often taken the form of Power Purchase Agreements (PPAs) with local stakeholders such as councils, colleges, businesses and hospitals – or directly with utility companies (Community Energy England 2022; Crown Commercial Services 2020).
PPA’s are arrangements where either utilities or local bodies can purchase energy from community-owned generation for a fixed term at a fixed price. In the case of Edinburgh Solar Cooperative, for instance, the Cooperative installed solar panels on a number of City of Edinburgh Council buildings (City of Edinburgh Council 2014). The solar panels provide some of the electricity generated to the buildings on which they are installed at a reduced rate compared to typical market tariffs. This is facilitated by a Power Purchase Agreement.
The traditional model of selling energy to the national grid is also still used, particularly with larger-scale wind and solar projects using local or community land which are better-placed to make a return than smaller installations (Community Energy England, Scotland, Wales 2022). This in turn provides community benefit funding which can be used to deliver against just transition outcomes. In particular, state of the sector reports show that this has been used for:
- Building capacity in communities through social gathering, engagement, and outreach
- Delivering energy advice and advocacy and helping people in fuel poverty
- Promoting climate education through hosting workshops, events and cafes
- Developing climate adaptation measures, such as investing in green spaces or nature restoration
Heat and energy efficiency
Decarbonisation of community buildings has been the predominant form of community heat progress in Scotland (Local Energy Scotland, 2023a). This includes installing efficiency measures and heat pumps to reduce bills for public and shared use buildings e.g. community centres. This can help reduce costs for running community spaces, provide sustainable and warm social centres for local residents and support education around new technologies or initiatives.
More ambitious heat projects are being explored, such as bulk purchase of heat pumps for local homes and district heat networks, for instance by Local Energy Scotland’s CARES-funded Community Heat Development Programme (2023b).
However, these remain expensive and complex undertakings for community organisations at present. The legal, financial and technical expertise required is significant, meaning organisations that rely on volunteers and limited resource struggle to deliver them effectively. Within Local Heat and Energy Efficiency Strategies (LHEES), there is scope for communities to work with local authorities to identify opportunities and deliver such projects in partnership. Projects elsewhere in the UK, such as Swaffham Prior, show how community heat and community energy generation can work together in partnership with local authorities and the private sector to deliver such projects successfully (Cambridgeshire Country Council, 2023).
There have also been advances in community approaches to energy efficiency and retrofit. Community organisations such as the Carbon Coop in Manchester (People Powered Retrofit, 2021), Loco Home Retrofit in Glasgow (2023), and the Heat Project Blairgowrie (2023) have been supporting homeowners to install energy efficiency measures along with low carbon technologies such as heat pumps and solar panels.
This provides new opportunities to support people in often disadvantaged or excluded communities to decarbonise, and jobs, skills and education opportunities for local businesses and tradespeople.
Transport
Local and community transport projects have broadly taken the form of electric vehicle (EV) charging points, either supplied by local generation assets as funded by Brighton Energy Coop’s Community Solar Accelerator Grant scheme (2021), or as assets themselves, creating revenue through subscription and pay-as-you-go tariffs as with the Charge My Street initiative (2023).
EV charging is seen as a relatively low-risk project by community energy stakeholders spoken to as part of this research. However, installing chargers does rely on locational factors such as the availability of network capacity and parking facilities, as well as people using the chargers themselves to generate revenue (typically more affluent groups – see Hopkins et al., 2023).
Local energy
Local energy has experienced considerable growth in recent years, and has become increasingly salient in energy policy thinking.
Recent research estimates that 1 in 5 UK local authorities now have some form of local energy project, which can take various forms across a range of scales (Arvanitopoulos et al. 2022).
Similar to community energy, local energy tends to encompass generation and supply projects,
heat and energy efficiency schemes, and transport solutions. This is illustrated in the image opposite which shows a variety of buildings being served by the same energy source in a community. Local energy includes:
Local authorities delivering e-bikes, EV charging etc., EV charging in social and housing and associations.
Local authorities delivering Community Wealth Building-style (CWB) projects (North Ayrshire) and solar in council housing; solar and storage in social/housing associations; commercial and business properties installing own technologies.
Generation and supply
Heat and energy efficiency
Transport
Local authority and commercial district heat networks (Edinburgh Vattenfall) and heat pumps, including in leisure centres; place-based energy efficiency approaches; commercial and business properties installing own technologies.
Just transition outcome contribution: citizens, communities and place; jobs, skills and education; fair distribution of costs and benefits; decarbonisation and efficiencies; equality and human rights (when targeted at lower income households).
Key developments
Generation and supply
At a local level, local authorities, housing associations and social housing providers are increasingly decarbonising their electricity supply (UKRI and Regen 2022). This has mostly taken the form of installing solar panels (often with battery storage) in their housing stock to reduce bills for tenants, and in a wider decarbonisation of public, commercial and industrial buildings.
Often working with low income social housing tenants directly, this has created value for decarbonisation and efficiencies, and had a further impact on equality and human rights through tackling fuel poverty. Compared to community energy, local authorities have direct access to their own housing stock, making installation of measures for lower income groups more straightforward. Delivering measures is still challenging for the private rented or owner-occupier sectors, however.
Some local authorities such as North Ayrshire Council (2020) have been leading the way to deliver just transition value, through advancing plans for using council-owned energy generation to fund work addressing fuel poverty, as well as energy efficiency and Community Wealth Building programmes (Figure 1). In addition to contributions to the just energy transition, this also has the potential to deliver jobs, skills and education, as well as provide a strong boost to citizens, communities and place through enabling local value generation, retention, and more open decision making.
Revenues reinvested in local economy, eg:
- Tackling fuel poverty
- New jobs and skills
- Local business and economic development
- Other energy projects
- As per local need
Money generated predominantly from exporting to the grid, or supplying energy to local public and commercial buildings.
Local authority sources investment to develop municipal electricity generation assets, such as a wind or solar farm (or both).
Figure 1. Local authority-led generation for community wealth building example
Heat and energy efficiency
Alongside generation, the same organisations have been installing heat pumps, often in housing stock but more often to serve larger commercial and public sector buildings. Local authorities have been leading on place-based energy efficiency schemes, with LHEES underway and due to be delivered in late 2023.
As with community energy, these carry benefits for decarbonisation and efficiencies, taking a more tailored, place-based approach to reducing housing stock emissions, while supporting lower income and excluded groups to transition to low carbon technologies (Regen 2022).
Several local authorities, such as Midlothian Council (2022) and Stirling (FES, 2023), are also delivering larger heat network projects to serve a mix of domestic, industrial and commercial properties. This can create wider business and economy opportunities for investors and developers, generating new work and business for local places.
Transport
Beyond coordinating public transport and decarbonising their own transport fleets, local energy transport initiatives today typically take the form of e-bike services led by local authorities, charging in social and housing association properties, or public electric vehicle charging and car clubs. The Plugged-in Communities Scotland Fund (Energy Savings Trust, 2023), for instance, provides funding for community transport organisations – often housing associations – to deliver car clubs and charging for their tenants and the wider community. In terms of value for just transition outcomes, this can support decarbonisation and efficiencies through encouraging more active and public travel, although can be restrictive for those outside of city centres or without driving licenses.
Local energy systems
Often known as ‘integrated’ or ‘smart’ local energy systems, local energy systems have become increasingly prominent in the local energy landscape.
Spearheaded largely by the Prospering from the Energy Revolution programme (2023), local energy systems bring together a combination of generation, storage, heat, transport and demand at a local level. This is done using physical infrastructure, digital platforms and local energy markets.
These have generally taken trial form at a town or city level and are usually led by local authorities, in conjunction with a wide consortium including communities, academia, businesses and developers. This is illustrated in an image below which shows how solar, wind and heat pump energy sources can be integrated into community energy supplies.
This has been the case in the landmark Bristol City Leap project, for instance, delivered in partnership with Bristol City Council, industrial partners Amaresco, community organisations, and developers Vattenfall (Bristol City Leap, 2022). The project will install and operate new solar, wind, heat pumps and networks, EV charging and energy efficiency measures in homes and businesses across the city to help meet their 2030 climate targets.
’Integrated’ or ’smart’ local energy systems, largely at innovation stage, now moving more into business-as-usual. Bringing together a combination of electricity, heat, transport, storage and demand at a local level, using smart technologies and digital platforms.
Just transition outcome contribution: jobs, skills and education; business and economy; decarbonisation and efficiencies.
Key developments
Still in their early stages, integrated local energy systems provide a range of opportunities against each of Scotland’s NJTOs, particularly on jobs, skills and education and business and economy. They also provide opportunities for installers, energy businesses and developers, data scientists, engineers and project managers (UKRI and Regen 2022; Chitchyan and Bird 2022).
Within integrated local energy systems, there is also scope to build community benefit and ownership of generation or district heat assets. As part of the current Bristol City LEAP project, a £1.5 million Community Energy Fund has been included as part of the deal to help communities develop their own local energy solutions and hold a stake in the wider initiative (in addition to the LEAP project creating an estimated 1,000 jobs across planning, design, data, installation and retrofit, and deliver £2.8 million to local community projects).
However, these systems can be big undertakings, requiring significant public and private finance to deliver. Given their novelty, they can be seen as risky, and some policy and regulatory issues still remain at UK level (see Section 1.128).
Local energy planning
Local energy planning is becoming a key function of local authorities in Scotland and across the UK. In Scotland, this has at least partly been driven by Scottish Government requiring Councils to develop their Local Heat and Energy Efficiency Strategies (LHEES), setting out the long-term plan for decarbonising heat in buildings and improving their energy efficiency across an entire local authority area (Scottish Government, 2022a).
Some local authorities, such as Dundee City Council with their Regional Energy System Optimisation Planning (RESOP) project (Scottish and Southern Electricity Networks, 2022), have voluntarily broadened out into local area energy planning (LAEP) to include generation, transport and storage as well as heat and efficiency. Stirling and Clackmannanshire have also delivered a Regional Energy Masterplan which covers a similar scope (Engage Stirling, 2023).
Distribution network operators play a key part in this, supporting local stakeholders to develop plans for network investment and system design, with an increased focus on local planning and delivery under their new funding obligations. Ofgem’s Review of Local Energy Institutions and Governance, and Regional System Planning consultations are now exploring what is likely to be a prominent future role for local and community energy in the energy system (Ofgem 2023).
This new prominence of local energy planning can support the development of local energy projects and systems, in close tandem with communities and citizens. It can also allow local authorities to better plan their decarbonisation efforts, and begin to mobilise necessary local skills and finance.
Outside of LHEES, there is no set standard for the level of energy planning local authorities or stakeholders are currently expected to deliver – in Scotland or across the UK. The level of skills and resource that local authorities have in-house can also vary substantially, making it difficult to deliver more ambitious projects consistently across the country.
Recommendations
It is clear that different forms of local and community energy can make a significant contribution to Scotland’s eight National Just Transition Outcomes. New developments, particularly in community heat and efficiency, local energy systems and local energy planning, also present new opportunities.
However, key barriers remain to realising these at scale. Local or community-owned energy is also not automatically more ‘just’ than larger-scale developments. Who owns, governs, participates in, funds and benefits from local and community energy projects will impact how ‘just’ they ultimately are. Leveraging local and community energy for just transition outcomes thus means:
- Better enabling the delivery of more projects in more places
- Making sure projects embed just transition principles throughout
To support this, we have developed the following six key overarching recommendations for Scottish policymakers and delivery bodies, energy industries, communities and wider stakeholders, which can help unlock local and community energy going forward:
- Increase community capacity and outreach: Increase resource for and awareness of local and community energy, to support capacity-building and effective project engagement – particularly in underserved communities.
- Support delivery and innovation: Support the development of new local and community energy models, including the skills and networks required for community and local authorities to fully embrace them.
- Enhance ownership and governance: Expand community and local ownership of energy, ensuring that ownership and governance of projects are accessible, accountable and transparent, with proactive inclusion of marginalised or excluded groups.
- Increase participation and engagement: Ensure that all groups and communities can realistically engage with local and community energy projects, to participate in governance and decision making, and shape ideas from the beginning.
- Develop finance, funding and investment: Develop sustainable finance and business models that ensure those who can’t afford to pay are not excluded from participation or benefit and that maximum value is retained locally, with just transition outcomes explicitly prioritised.
- Open up benefits to beneficiaries: Open the benefits of local and community energy projects to as wide a range of people and places as possible, including everything from household decarbonisation and bill savings, to skills and supply chains.
These recommendations are applicable across community energy, local energy, and local energy systems. The following sections give specific actions to realise these, and explain how these suggested actions are supported by research.
Increase community capacity and outreach
Recommendation 1: Increase resource for and awareness of local and community energy, to support capacity-building and effective project engagement – particularly in underserved communities.
Community energy projects often aim to target lower income areas, to challenge fuel poverty and deliver benefits to often disadvantaged places (Stewart 2021; Community Energy Scotland 2022; Community Energy England 2022; Cairns et al 2023). However, projects in lower income areas can still be few and far between. Community energy literature highlights that in Scotland, the UK and more broadly, areas of higher deprivation and places without strong existing development associations or community energy groups can struggle to develop and participate in community energy projects (Hanke et al 2021; Brummer 2018).
Although Scotland has fostered a favourable policy environment for community energy, community energy organisations and third sector stakeholders recognise this issue, and note that there remains a lack of consistent capacity and resource within communities to deliver or participate in projects at a wider scale.
This makes it challenging for more communities to participate in community energy, local energy developments, or to pursue shared ownership arrangements. Expanding resource for capacity building and raising awareness for local and community energy would help develop National Just Transition Outcomes in these areas.
Action: Run a large-scale awareness-raising campaign around community energy, the potential benefits it brings, and entry points for communities
Our research with community energy stakeholders, third sector organisations working directly with the public, and citizens in our People’s Panel has shown that awareness of community energy among the general public remains low. Of the 22 participants in our People’s Panel, only one had heard of community energy prior to this engagement. Community energy groups and wider community organisations also reported encountering a lack of awareness when they engage in new areas.
To deliver more community energy projects for just transition outcomes, there is a need to improve awareness of the sector, and its possibilities, across the board.
Action: Support the hiring of local and community energy development officers at a more consistent local level
Research from Slee (2020) highlights that the success of community energy projects largely depends on there being skilled and knowledgeable actors with local as well as business and technical knowledge in a particular community. At present, Local Energy Scotland have eight regional development officers. However, this is not seen by local, community or energy innovation stakeholders as granular enough to build meaningful local capacity in diverse communities across the country.
Local and community energy stakeholders (again highlighted by Slee, 2020) likewise cited that it is often the same organisations, groups and development trusts which apply for funding because they know the process and have some capacity and expertise already, with limited applications from new groups or areas.
To better unlock new projects in new areas for just transition outcomes, skilled development officers employed at a more granular spatial scale, such as local authority for instance, could allow for more targeted local development and encourage better links between local authorities and communities.
Action: Expand CARES funding to provide a wider range of support, such as capacity building and more substantial core staff resource for community energy organisations
The CARES programme, managed by Local Energy Scotland, successfully supports community energy projects in Scotland with loans, grants, and procedural assistance. To date, it has been one of the first ports-of-call for community energy. However, local and community energy stakeholders called for two key improvements to be made to the CARES programme.
Firstly, local and community energy stakeholders argue that CARES may benefit from being more flexible in its funding criteria across calls and programmes. Organisations involved in our research noted there is not enough funding available to build capacity or pay community energy volunteers for their time without there first being a project in place, which makes it difficult to develop sustainable projects, particularly in new areas, or retain people to drive projects forward. Enabling more funding for capacity building and core community energy staff in particular would allow existing projects to expand, explore new models and options and help more projects to come to fruition in new and different places.
Action: Develop a roadmap of the support that CARES provides throughout the project process to make it clearer to local and community organisations
Second, our research participants commented that the support that CARES can offer to community organisations, particularly once a project has been established, is not always clear. Signposting to the website is useful but once there, community organisations note that specifics on the support available at different project stages is lacking in detail. An accessible, easy-to-navigate roadmap outlining precisely the support available at each stage of different types of project (wind, solar, hydro, generation, heat, transport, etc.) would help demystify this for prospective new community energy organisations.
Support delivery and innovation
Recommendation 2: Support the development of new local and community energy models, including the skills and networks required for community and local authorities to fully embrace them.
Innovation has been a cornerstone for both local and community energy. Community energy has often innovated by necessity, while local energy systems such as those trialled under the Prospering from the Energy Revolution programme have pushed innovation at the nexus of technology, business models and regulation in recent years. These innovations present new opportunities to deliver against just transition outcomes which the Scottish Government can more effectively support.
Action: Build on Heat in Buildings and Net Zero Skills Strategies to include training around local energy systems for local authorities and interested industry stakeholders
A wealth of evidence already exists on the opportunity, barriers and operationalisation of local energy systems across the UK (Regen 2023; Energy Systems Catapult 2022).
A key challenge that remains relates to the lack of skills within local authorities to spearhead local energy system developments (Chitchyan and Bird, 2022). While LHEES has improved local energy understanding, local authority stakeholders note that there is still often a lack of skills (and resource) for local energy projects in general. These skills gaps include creating appropriate partnerships, engaging the community, knowledge-sharing and developing successful business models and governance structures within current regulatory frameworks.
Developing flexible, modular training with bodies such as Skills Development Scotland or the Improvement Service, or learning from knowledge-sharing initiatives such as the GreenSCIES local energy Centre for Excellence (UKRI and Regen 2022) could help to overcome this issue, and help contribute to the capacity within local authorities to take local energy projects forward.
Action: Work with prospective public and commercial sector stakeholders to promote community energy as an option for their energy supply
In the absence of a steady revenue stream for community energy generation projects, some are increasingly exploring Power Purchase Agreements (PPAs) with public and commercial organisations.
These PPAs can help to provide revenues through which community energy can deliver across all NJTOs to some degree (depending on local need and ambition). Bringing several PPAs together (i.e. selling community generated electricity across several sites to feed a single community benefit fund) can also make projects more attractive to local businesses and investors.
However, community organisations within our research noted they often struggle to find suitable organisations or to explain to key individuals within the organisation why this would benefit them and their local community.
The Scottish Government could support this process by convening public and commercial sector energy users to raise wider awareness of local or community energy power purchase arrangements, and highlight the option of partnership with community energy in public and commercial sector procurement guidance.
Action: Develop new funding models for local and community approaches to energy efficiency, retrofit and advice
Energy efficiency and retrofit services have been a rapid growth area for community energy. However, stakeholders note that community-led efficiency and retrofit relies heavily on short-term competitive grant funding, with business models still in early stages. This makes it challenging to develop effective, sustainable community-led solutions.
To enable this value, community organisations working in this space note there is a need to support them to develop new business and delivery models, potentially in partnership with local authorities. Building on existing funding routes such as CARES, the future National Public Energy Agency could work with community and local partners to support the coordination of investment and development of new community efficiency and retrofit funding arrangements.
Action: Work with the Convention of Scottish Local Authorities (COSLA) and local authorities directly to identify and address key friction points within the local energy planning, approval and delivery processes
In our People’s Panel, participants noted that communities and local authorities should face a minimum of red tape in getting projects up-and-running, allowing them to innovate, demonstrate and deliver value sooner. Local authority stakeholders also noted that this is a key issue.
Because projects must navigate a range of local authority departments and sign-off processes (not including wider processes such as securing grid connections and meeting regulatory requirements), they can be held-up or fail due to political timeframes and pressures such as local or Scottish Government elections. There is thus a need to ensure that projects can progress more efficiently within and alongside these democratic processes. Local authority stakeholders and examples from other local energy projects such as GreenSCIES in London suggest that streamlined project processes within local authorities (potentially with a single embedded local energy officer) would help to ensure projects can progress overall, both within election cycles and in the longer-term.
Enhance ownership and governance
Recommendation 3: Expand community and local ownership of energy, ensuring that ownership and governance of projects are accessible, accountable and transparent, with proactive inclusion of marginalised or excluded groups.
Who owns local and community energy projects can have a direct impact on how much they contribute to just transition outcomes. Research from Aquatera (2021) compared 9 community owned winds farms against 4 commercial wind farms and found that the community-owned wind turbines in Scotland have generated, on average, 34x more in community benefit payments than the developer-led projects.
Where projects are locally or community owned – particularly by communities and local authorities – evidence suggests that the main outcomes tend to be aligned with just transition principles (Stewart 2021; Creamer et al 2019; Hanke et al 2021). This can also enable more value to be captured locally overall than, say, projects led by developers alone. As such, enabling more local and community ownership of energy can help to deliver greater value against just transition outcomes.
Community and local ownership is not fairer by default, however, with a need to ensure that ownership and governance structures are fair, accessible, and transparent (see Section 1.14).
Action: Develop clear targets for community energy
Although cited as a priority for Scottish Government in the Local Energy Policy Statement, community-owned projects account for only 11.1% – 101 megawatts – of total operational local and community energy capacity as of December 2023 (Scottish Government Energy Statistics Hub, 2023). Scottish Government does have a target of 2 gigawatts operational local and community energy by 2030. However, this target also includes non-community owned projects such as public sector and local authority projects, and projects led by farms and estates.
Research shows that clarity in government targets can provide a signal to stakeholders to help stimulate innovation and action among businesses, developers, and communities towards net zero – including in community energy when paired with wider measures and support (Hewitt et al 2019; Yeow et al 2017). Community energy and just transition stakeholders similarly note that making clear how much of the 2030 target is expected to be community-owned would set a clearer vision for communities overall.
As a means to stimulating more community ownership and innovation and redoubling this ambition within the final ESJTP, the Scottish Government could outline how much of the remaining 2 gigawatt target is to be met by new community-owned projects specifically.
Action: Enable greater community ownership through local energy planning
Identified by both local authority and wider local energy stakeholders, local energy planning presents a new opportunity to support community ownership and more democratic input on local energy ambitions overall. Within local energy planning processes, such as LHEES, LAEP or heat network zoning, local authorities can identify sites that would be appropriate for community energy projects, particularly generation and heat, and work with community organisations to develop them.
In theory, this is a win-win situation: community energy organisations have a wider scope of potential projects, while local authorities can be supported by community organisations to deliver against their energy ambitions.
Action: Develop the potential for local authority shared ownership
While the Scottish Government has set out its principles for community shared ownership of renewable energy developments (2019), there is no similar guidance at present for local authorities. With the development of the Regional System Planner at UK-level and other trends towards greater local authority participation in energy decision making and projects (Ofgem, 2023; PwC, 2022; Green Finance Institute, 2022), local energy and finance stakeholders highlight that this could be a useful vehicle for establishing more local ownership of energy assets.
Where communities are deemed less-well equipped to participate in shared ownership, providing guidance for local authorities to invest in shared ownership projects could create a new avenue to capture value from larger developments, potentially creating new local authority revenue streams or community benefit funds. This is already included in shared ownership guidance in Wales, for instance (Welsh Government, 2022). Building on Scottish Government’s existing Community Shared Ownership Best Practice Principles (Scottish Government, 2019), working with COSLA to understand the potential role and opportunity for local authorities in shared ownership arrangements could be a useful undertaking.
Participation and engagement
Recommendation 4: Ensure that all groups and communities can realistically engage with local and community energy projects, to participate in governance and decision making, and shape ideas from the beginning.
Often those groups typically already excluded or disadvantaged in society also face risk of exclusion within local and community projects (Knox et al 2022). Without ensuring that those most at-risk of exclusion can engage and participate directly, there is a risk that projects do not reflect the needs of those groups and people, and that those people are in turn excluded from wider benefit. Table 6 illustrates key barriers for specific excluded groups as identified in our academic literature review.
Expanding capacity and outreach as outlined in Recommendation 1 can go some way to overcoming this issue. However, it is important to consider the specific needs of these groups to ensure they can participate in, and benefit from local and community energy projects. This includes paying attention to project design, engagement, decision making, governance and benefit allocation (Knox et al 2022; Huggins 2022).
Table 6: Groups with additional barriers to engagement and participation
| Group | Key barrier(s) | Need |
| Low income | Upfront financial cost of share-based community energy; material time and resources. | Exemption from up-front costs; tailored, rewarding and inclusive engagement; alleviated responsibility for legal, procedural or technical issues. |
| Disabled people | Additional/unique energy needs; material time and resources. | Tailored, rewarding and inclusive engagement; deeper understanding of need; alleviated responsibility for legal, procedural or technical issues by qualified or experienced actors. |
| Migrant and ethnic minority communities | Language, communication and engagement; ownership and legal rights. | Tailored, rewarding and inclusive engagement; multilingual and accessible resources (on energy but also in housing and legal rights). |
| Older people | Understanding of new technologies or systems; communication and engagement. | Tailored, rewarding engagement and support; alleviated responsibility for legal, procedural or technical issues by qualified or experienced actors. |
| Private rented sector | Ownership and legal rights. | Clear outlining of responsibilities; working with PRS landlords and tenants to shape potential project frameworks. |
| Residents of flats and tenements | Ownership and legal rights; physical and housing. | Multi-occupancy building solutions; projects with more holistic local benefit; working with PRS landlords and tenants to shape potential project frameworks. |
| Rural and off-gas grid | Physical and housing. | Tailored solutions; support with local energy infrastructure. |
| Young people | Ownership and legal rights; finance and governance. | Tailored engagement; consideration of future generations in project and policy planning. |
Action: Ensure best practice principles for co-design and engagement
Ensuring as many people as possible can help to shape, participate in and benefit from local and community energy requires proactive, targeted and meaningful engagement with all groups within a community or area – particularly those most disadvantaged or at risk of exclusion already.
To do so, our People’s Panel echoed that there is a need for a shared standard of best practice in community engagement across local and community energy projects, starting at the earliest possible stage with broad promotion, to allow citizens and communities to meaningfully co-design projects from the very beginning. As highlighted above, using trusted intermediaries can be one effective way of reaching groups most at-risk of exclusion, although other methods such as targeted doorstep or community engagement may be more appropriate in some circumstances.
Several organisations such as the Scottish Community Development Centre and Project LEO in Oxfordshire have already created standards for community engagement and local energy respectively (Huggins 2022). For example, the Scottish Government and COSLA recently delivered their own ‘Planning With People’ initiative which outlines best practice for community engagement on local health and social policy. The Scottish Government has also been leading a trial of green participatory budgeting. This activity can provide useful groundwork for increasing local and community energy.
Our research therefore suggests that the Scottish Government should build on other examples of best practice, such as the Good Practice Principles for Community Benefit in Onshore Wind Developments (2019) and encourage local authorities, community energy groups, developers and relevant stakeholders to adopt a shared best practice standard for citizen and community engagement in all new local and community energy projects.
Action: Make governance of projects more transparent, inclusive and accountable
Once projects are established, how they are then governed (who makes decisions, what the processes for decision making look like) has key justice implications. Issues have been noted in the energy justice literature (see Hanke et al 2021), for instance, with community benefit funds that are determined by developers and spent largely by those more active and engaged members of a community, excluding those more socially isolated, meaning outcomes could fail to reflect their needs.
Likewise, experience from previous innovation projects shows that local projects can be decided by leading partners and organisations, with limited local or community direction. Ensuring proactive engagement with communities and inclusive, accountable governance structures that do not rely on people paying money to participate can help increase public support and promote fairer outcomes and processes.
Action: Formalise the role of third sector and advocacy organisations as trusted intermediaries
Trusted intermediary organisations such as fuel poverty charities, community groups, mutual aid initiatives, faith groups and third sector more generally are crucial to supporting people into local and community energy projects, and net zero more widely (Slee, 2020; Stewart, 2021). Such organisations can support engagement and outreach with often-excluded communities, and help to advocate for their needs within policy, project and development processes.
However, third sector and fuel poverty stakeholders note consistently that these organisations are under resourced – an issue made especially acute during the recent energy crisis (Citizens Advice, 2023). This means that although many organisations are open to supporting energy and just transition projects, they are severely limited in their capacity to do so. Funding for these organisations tends to be competitive on an annual basis, meaning that staff spend a lot of time applying for the next round of support. This also means that longer-term capacity building, upskilling, and working with people and places is difficult.
Third sector stakeholders working in equalities and fuel poverty in particular, along with just transition researchers, highlight that more stable, longer-term resourcing for trusted intermediary organisations such as their own (including established community energy groups) would help to enable better capacity building and representation of excluded communities, along with clarifying the role Scottish Government expects these organisations to play across the ESJTP. The Climate Policy Engagement Network could provide one forum for engagement with these partners.
Develop finance, funding and investment
Recommendation 5: Develop sustainable finance and business models that ensure those who can’t afford to pay are not excluded from participation or benefit, and that maximum value is retained locally with just transition outcomes explicitly prioritised.
Local and community energy projects rely on a range of finance and funding sources (Cairns et al. 2023). Where this funding comes from, who pays, and what happens to the revenues are all important just transition questions.
All funding types can support NJTOs and a wider just transition in theory, but not necessarily by default (as discussed in section 3).
Table 7 outlines the key issues with different funding models. As such, supporting a just transition means ensuring that finance, funding and investment are fundamentally aligned with just transition outcomes first and foremost.
Table 7. Overview of finance and funding sources for local and community energy
| Type | Overview | Types of projects | Risks and barriers |
| Share offer | Citizens buy shares in a community or shared project, for a small return on investment (proportionate to size of share) and say in decision making. | Community energy (generation, supply, heat, transport, services); shared ownership. | Only people with money to invest get a share of ownership or say in decision making; investors are not always local. |
| Grant and innovation | Innovation funders such as UKRI provide grant funding for new projects. | Partnership; research, innovation and demonstration; development. | Often focussed on ’cutting edge’ tech innovations with limited consideration of social, replicability or more incremental changes; can prioritise innovation-first with just transition impacts secondary; limited accountability or legacy. |
| Public | Government or similar, such as CARES or the Low Carbon Infrastructure Transition Programme (the latter now closed). | Community energy; local authority. | Limited amounts available; funding can be designed for a specific or narrow purpose. |
| Public-private finance | Public sector such as a local authority (or community group) works with private investors or businesses to raise capital for projects. | Integrated local energy systems (local authority-led, see Bristol City LEAP); larger community energy projects. | Projects often need to be larger-scale; just transition may be a secondary consideration. |
| Community benefit payments | Community benefit payments, either from developers, networks, or via private philanthropy. | Community energy predominantly, although could be leveraged by public bodies such as local authorities. | More active community members decide how funds are spent; risk of prescribing what communities should do with their funds; potential for some communities to lose out. |
From this analysis, there are four key issues for just transition outcomes:
- Share offers are often exclusionary of lower income groups within community or shared ownership. However, individual projects can stipulate exemptions to ensure people can still participate, with a need to encourage this on a consistent basis.
- Grant and innovation funding is often short-term and overly innovation-focussed, with a lack of support for scaling-up or more social and business model innovation. It can also prioritise innovation first with just transition value treated as secondary, while projects often wind down with no lasting legacy for communities.
- Public funds are available and welcome, such as in the recent Heat Networks Fund, although there is a strong sense that these are not adequate at present for local authorities to fully deliver LHEES, for instance, or for community energy projects to be established at scale.
- Private finance is playing an increasing role in local authority and larger-scale integrated projects, such as Bristol City LEAP. However, stakeholders interviewed across different sectors are cautious about previous experiences with the Public Finance Initiative and the risk that private investment may lead to value leaving local areas.
Action: Explore new private sector funding models for local and community energy
With more public-private finance models, there are various opportunities for businesses and organisations to invest in local and community energy projects, which in turn can support other just transition outcomes (such as decarbonisation & efficiencies, and citizens, communities & place). Many already do invest in community energy share offers, via community or municipal bonds, or through partners such as Triodos Bank and Abundance Investment.
However, stakeholders in the finance and investment space note that without the Feed-In Tariff, the return for local or community projects is generally less attractive unless projects get to a larger scale (e.g. a high number of aggregated PPA agreements or more ambitious integrated local energy systems).
Closer working between the Scottish Government and the Scottish National Investment Bank (SNIB) on community and local energy is one viable option to help to overcome this issue. While the SNIB typically invests in £1 million+ projects, it could begin to work closely with local and community sectors to develop new models and instruments and help build better financial networks. It could also help aggregate projects to create a larger, packaged proposition which is more lucrative to investors. 3Ci’s (2022) regional net zero investment forum, which brings together the finance community, local authorities, policymakers, developers, businesses and community enterprises in different regions across the UK, has already made some progress on this.
Action: Incentivise just transition outcomes in policy, procurement, and funding decisions around local energy projects or systems – especially where commercial, innovation or private finance are involved
There is also general understanding across stakeholders that private investment has a strong role to play in reaching net zero and delivering more ambitious local projects (Green Finance Institute 2022; UKRI and Regen, 2022a). Our People’s Panel participants likewise told us that it does not strictly matter where money comes from, so long as the primary beneficiaries are people and places first, with strong consideration of just transition outcomes and an offer of shared ownership as standard.
To ensure this, where innovation or private finance is involved in local and community energy projects, there is a need for just transition guidance in funding and procurement processes. This should also be considered together with Community Wealth Building and relevant National Planning Framework legislation.
Action: Ensure adequate strategic funding for local energy delivery (and beyond)
Beyond project funding models, local authorities note that short-term annual budget cycles make it difficult to develop longer-term projects or strategies. Local authority and wider UK local energy stakeholders note that this current model of funding has led to a disparity across local authorities in energy efficiency schemes in particular, with many drastically underspending on their allocated budgets.
This makes it difficult to mobilise local jobs and skills to meet decarbonisation and efficiency plans (and fuel poverty targets), limiting the appetite for businesses to emerge, upskill, or retrain to deliver on these ambitions – and for investors. Skills and jobs for the delivery of energy projects are a well-cited and evidenced barrier to progress here more generally (Chitchyan and Bird, 2022; UKRI and Regen, 2022b). This was also highlighted in the Scottish Parliament’s ’Role of local government and its cross sectoral partners in and delivering a net-zero Scotland’ report (Scottish Parliament, 2023).
Our research shows the importance of reviewing funding required for the on-the-ground delivery of local energy plans and projects such as LHEES, and reforming existing budgets and processes to allow for more strategic, longer-term planning and investment. Much of this work is already underway in the delivery of the Heat in Buildings Strategy. As such, there is a need for the Scottish Government to accelerate efforts with local authorities to develop more appropriate funding models, and deliver long-term budgetary plans as a signal to investors, and to industry, to mobilise skills and supply chains.
Open up benefits and beneficiaries
Recommendation 6: Open the benefits of local and community energy projects to as wide a range of people and places as possible, including everything from household decarbonisation and bill savings to skills and supply chains.
As evidenced throughout this report, local and community energy can carry substantial benefit against Scotland’s NJTOs and for local people and places more broadly.
However, not everyone can currently experience those benefits directly, due to financial, physical or other reasons. For instance, people on low incomes will struggle to buy in to community share offers and so will not receive any financial return from projects, nor have a say in project governance.
Similarly, people in the private rented sector or multi-occupancy buildings will struggle to benefit from initiatives which include new technologies or energy efficiency measures due to legal and physical challenges.
In addition, some of the benefits identified in previous sections of this report have yet to be fully enabled. This includes the realisation of new jobs and skills, which is a common issue in net zero energy delivery more broadly (Chitchyan and Bird, 2022; UKRI and Regen 2022b).
Beyond the recommendations already provided, there is thus a need to consider how to enable benefits of all kinds that reach a wider number of people, and that carry impact against Scotland’s net zero, energy and just transition ambitions at scale.
Action: Conduct policy engagement with identified groups (e.g. low incomes, those in the private rented sector and multi-occupancy buildings) to establish new ways for them to participate in and benefit from local and community energy projects
Where local or community energy projects include installing measures in people’s homes which deliver financial, health or environmental value – such as solar and storage, heat pumps, heat networks, efficiency or as part of wider local energy systems – certain groups face key barriers to benefitting directly.
Research such as that by Knox et al (2022) outline how people living in the private rented sector in particular will struggle to participate and experience benefit due to legal questions over ownership and responsibility. This is also true of those living in flats with different housing tenures.
People living on lower incomes will likewise struggle to invest in community share offers, meaning they have limited opportunity to gain individual returns or participate in the governance of projects that require up-front investment as a result.
As such, there is a need to work directly with these groups, tenant associations such as Living Rent, landlords and local authorities to develop frameworks that allow people living in those situations to also participate and benefit. As outlined by our People’s Panel, this should also encourage projects to deliver wide benefits to the local community, not based solely on ability to pay or invest.
Action: Work with education and training providers, industry, and local energy stakeholders to set out the skills and business opportunities for local and community energy
Local jobs and skills are often slated as a key opportunity from local and community energy, including within the Scottish Government’s Local Energy Policy Statement (2021). However, these opportunities are still to materialise at scale in Scotland and the UK more broadly, with a stubborn reliance on volunteers in the community sector in particular (Institute for Public Policy Research, 2023; UKRI and Regen, 2022; Community Energy Scotland 2022; Climate Change Committee 2023).
Reviewing the Heat in Buildings Supply Chain Delivery Plans and Climate Emergency Skills Action Plan (CESAP) could provide an opportunity to outline requirements for local energy skills specifically. This could include working with energy and training organisations such as Skills Development Scotland and local and community energy partners including industry and local authorities, to provide a clear analysis of opportunities within the local and community energy sectors.
This could also include specific assessment of the jobs and skills needed to deliver on the 2 gigawatt target (and to enable local and community energy at scale more broadly), and an articulation of pathways for people and businesses to access new opportunities.
Policy dependencies and responsibilities
Policy dependencies
Outside of the immediate local and community energy policy space, there are some key policy interdependencies that should be considered when aiming to better enable local and community energy approaches. Working across these areas will be crucial to ensuring effective delivery of local and community energy going forward.
Based on the research covered in this report and Regen’s own critical analysis, Table 8 sets out potential additional actions for a (non-exhaustive) list of key dependencies that could help move local and community energy forwards for just transition outcomes.
Table 8: Policy dependencies and suggested actions
| Policy/area | Suggested action(s) |
| Community Wealth Building | Explore the specific findings from the current Community Wealth Building consultation (2023) around local and community energy, in light of the analysis and recommendations presented within this work. |
| Heat in Buildings (HiB) Strategy | Identify opportunities for local and community models to formally support a more inclusive heat and efficiency transition within LHEES, including reaching those in the private rented sector.Develop local and community demonstration projects targeted to support those in fuel poverty and assess their scalability, in line with Scottish Government statutory targets to eradicate fuel poverty by 2040. |
| National Public Energy Agency | Establish role of NPEA in supporting community energy, heat and efficiency approaches, and expected role in supporting local authority project delivery, including potential for coordinating investment. |
| National Planning Framework 4 | Prioritise community projects and ensure consideration of community ownership opportunities in planning decisions, particularly which speak to just transition outcomes and key climate adaptation, resilience, and environmental protection standards. |
| Land reform and community right-to-buy | Research the viability of community-owned land and energy together, with a focus on the business model and widening access to identify suitable sites both rurally and in towns and cities.This should include local authorities as a potential buyer/seller of land, and discussions with partners such as Crown Estate Scotland. |
| Heat Networks (Scotland) Act (2021) | Ensure timely delivery of the regulatory provisions set out in the Heat Networks Act within the 2024 timeframe to enable rollout and acceleration of heat networks across Scotland, particularly for local authorities.Encourage consideration of local and community approaches that can enable better just transition outcomes and benefits for other key dependencies, such as in tackling fuel poverty. |
Reserved policy areas
As aspects of energy policy and regulation in the UK are reserved, there are limitations to the work that Scottish Government can do to fully enable local and community energy. Many of the policies required to support local and community energy – particularly in energy market regulations which govern electricity supply, Feed-in Tariffs or Contracts for Difference, and recognising the value that local energy systems can offer to the energy system more widely within regulatory incentives – are not within the Scottish Government’s remit.
However, there are a number of key reform packages and opportunities currently open to the Scottish Government to seek to influence the UK Government to promote Scotland’s local and community energy and just transition ambitions. These include but are not limited to:
- Review of Electricity Market Arrangements (DESNZ, REMA)
- Contracts for Difference (DESNZ, separately and under REMA)
- Review of Local Governance and Institutions and the development of the regional energy strategic planner (Ofgem)
- Grid connections reform (Ofgem, National Grid ESO)
Table 9 gives a high-level overview of key reserved issues. This sets out some of the primary issues, how primed each currently is for delivery, and some suggestions for what is required to meet Scotland’s local and community energy and just transition ambitions at once.
Table 9: Reserved issues
| Issue | Issue | Need | Opportunities for influence | Benefit |
| Revenue certainty | Absence of Feed-in Tariff and comparatively low Smart Export Guarantee makes for challenging financial proposition. | Predictable revenue stream for local and community generators, potentially through a Contracts for Difference scheme or similar. | Reform of Contracts for Difference and Review of Electricity Market Arrangements. | Revenue certainty for new projects, allowing for expansion of LCE overall and new income for JT outcomes. |
| Grid connections | LCE struggling to compete with established developers for grid connections, long delays in queue management. | Priority (or parity) within grid connections process, recognising value of LCE; more proactive collaboration from DNOs to support LCE in the process. | Ofgem grid connections review, ongoing engagement with DNOs (particularly SPEN and SSEN with Just Transition strategies). | LCE can connect to the grid more easily, allowing projects to come online faster and generate benefit. |
| Centralised planning of energy system | Energy system planning still very centralised in the UK, with limited local input at present. | Energy system planning that recognises opportunity of LCE and includes local and community partners within the process directly. | Regional Energy Strategic Planner consultation and detailed design phase (next step of review of Local Governance and Institutions), DNO move towards system optimiser role; Consultation on Distributed Flex. | More localised thinking in energy system planning, with more locally-minded solutions and value. |
Conclusions
This report has analysed the potential role of local and community energy in delivering against Scotland’s National Just Transition Outcomes. This analysis and the subsequent recommendations have been informed by extensive review of literature and research, stakeholder engagement and discussion with citizens directly via our People’s Panel.
From this analysis, it is clear that local and community energy can be a critical part of Scotland’s just transition ambitions, contributing across all of Scotland’s National Just Transition Outcomes. This contribution could be supported through locally-tailored solutions and maximising inclusive ownership, participation, governance and benefit captured from Scotland’s immense energy landscape.
Enabling this requires supporting the growth of the local and community sectors overall, and building just transition principles into those projects and processes. The ambitions and recommendations throughout this report set out how to achieve this in practise, with key actions for Scottish policymakers and delivery partners.
Our research has also found key barriers to delivering against these outcomes across sectors: limited resources to build capacity for local and community energy projects in underserved areas; challenges around skills and project delivery processes particularly within local authorities; justice and equity issues within projects themselves; and lack of appropriate finance and business models.
Beyond the research and recommendations presented here, we identified other areas that would benefit from further, specific exploration within the local and community energy and wider energy sectors. These are:
- community ownership of land and housing, the role of local authorities in supporting these and how energy can be brought together within that; and,
- repowering and end-of-life onshore wind projects, and how local authorities and communities can start to take ownership of these; as many wind farms come to the end of their first contracts, there is a need to work with local energy stakeholders and developers to fully understand the potential for community ownership.
While relevant, more detailed analysis of these two issues would help shine a light on potential further opportunities for the local and community energy sectors, and on the delivery of even further value against Scotland’s National Just Transition Outcomes.
References
3Ci (2022). Regional investment forum https://www.3ci.org.uk/3ci-and-third-party-events/regional-net-zero-investment-forum-glasgow Accessed May 2023
Aquatera (2021). Community owned wind farms have paid their communities 34 times more than commercial counterparts https://www.aquatera.co.uk/news/community-owned-wind-farms-have-paid-their-communities-34-times-more-than-commercial-counterparts Accessed May 2023
Arvanitopoulos, T., Wilson, C. and Ferrini, S. (2022). Local conditions for the decentralization of energy systems, Regional Studies https://doi.org/10.1080/00343404.2022.2131756
Bird, C. and Chitchyan, R. (2023). Smart local energy systems: Training needs and provision. EnergyREV, University of Strathclyde Publishing: Glasgow, UK. ISBN 978-1-914241-36-9
Brighton Energy Coop (2021). Community solar accelerator https://www.brightonenergy.org.uk/2021/10/bec-launches-community-solar-accelerator-grant-scheme/ Accessed October 2023
Bristol City LEAP (2022). https://www.bristolcityleap.co.uk/ Accessed June 2023
Brummer, V. (2018). Community energy – benefits and barriers: A comparative literature review of community energy in UK, Germany and the USA: the benefits it provides for society, and the barriers it faces. Renewable and Sustainable Energy Reviews, 94, 187-196 https://doi.org/10.1016/j.rser.2018.06.013
Cairns, I., Hannon, M., Braunholtz-Speight, T., McLachlan, C., Mander, S., Hardy, J., Sharmina, M. and Manderson, E. (2023). Financing grassroots innovation diffusion pathways: the case of UK community energy https://doi.org/10.1016/j.eist.2022.11.004
Cambridgeshire County Council (2023). About Swaffham Prior’s Heat Network. https://www.cambridgeshire.gov.uk/residents/climate-change-energy-and-environment/climate-change-action/low-carbon-energy/community-heating/swaffham-prior-heat-network/about-swaffham-priors-heat-network Accessed October 2023
Charge My Street (2023). Charge My Street https://chargemystreet.co.uk/ Accessed October 2023
Chitchyan, R. and Bird, C. (2022). Skills for Smart Local Energy System: Integrated case study report. EnergyREV, University of Strathclyde Publishing: Glasgow, UK. ISBN 978-1-914241-10-9
Citizens Advice (2023). “Our bleakest-ever start to the year” – number of people helped by Citizens Advice at record high. https://www.citizensadvice.org.uk/about-us/about-us1/media/press-releases/our-bleakest-ever-start-to-the-year-number-of-people-helped-by-citizens-advice-at-record-high/#:~:text=The%20number%20of%20people%20helped,the%20enormous%20pressures%20facing%20households. Accessed August 2023
City of Edinburgh Council (2014). Edinburgh Community Solar Cooperative Proposal – referral from Corporate Policy and Strategy Committee. https://democracy.edinburgh.gov.uk/Data/Transport%20and%20Environment%20Committee/20140114/Agenda/item_no_84_-_edinburgh_community_solar_co-operative_proposal_-_referral_from_the_corporate_policy_and_strategy_comm.pdf
Climate Change Committee (2023). A Net Zero Workforce. https://www.theccc.org.uk/wp-content/uploads/2023/05/CCC-A-Net-Zero-Workforce-Web.pdf Accessed 3rd October 2023
Community Energy Scotland (2022). State of the Sector report. https://communityenergyscotland.org.uk/wp-content/uploads/2022/06/UK-State-of-the-Sector-Report-2022_Full_Version.pdf Accessed May 2023
Community Energy England (2022). State of the Sector report. https://communityenergyengland.org/files/document/626/1655376945_CommunityEnergyStateoftheSectorUKReport2022.pdf Accessed May 2023
Creamer, E., Taylor Aiken, G., van Veelen, B., Walker, G., and Devine-Wright, P. (2019). Community renewable energy: What does it do? In Walker and Devine-Wright (2008) Ten years on. Energy Research and Social Science, 57 https://doi.org/10.1016/j.erss.2019.101223
Crown Commercial Services (2020). Introduction to Power Purchase Agreements. https://assets.crowncommercial.gov.uk/wp-content/uploads/Power-Purchase-Agreements-PPA-An-Introduction-to-PPAs.pdf Accessed November 2022
Devine-Wright, P. (2019). Community versus local energy in a time of climate emergency, Nature Energy, 4, 894-896 https://doi.org/10.1038/s41560-019-0459-2
Energy Savings Trust (2023. Plugged-in communities Scotland https://energysavingtrust.org.uk/grants-and-loans/plugged-communities-grant-fund/ Accessed October 2023
Energy Systems Catapult (2023). Smart local energy systems https://es.catapult.org.uk/tools-and-labs/our-place-based-net-zero-toolkit/smart-local-energy-systems/#:~:text=A%20Smart%20Local%20Energy%20System,quickly%20and%20more%20cost%20effectively. Accessed May 2023
Engage Stirling (2023). Stirling and Clackmannanshire Regional Energy Masterplan https://engage.stirling.gov.uk/en-GB/projects/regional-energy-masterplan Accessed June 2023
FES (2023). Stirling Renewable Heat Project. https://www.fes-group.co.uk/project/stirling-energy-centre-and-district-heating-scheme/ Accessed October 2023
Ford, R., Maidment, C., Fell, M., Vigurs, C. and Morris, M. (2019). A framework for understanding and conceptualizing smart local energy systems https://www.energyrev.org.uk/media/1298/energyrev-sles-frameworkv4.pdf
Gooding, L., Ford, R. and Bray, R. (2020). 40 benefits of smart local energy systems https://www.energyrev.org.uk/news-events/blogs/40-benefits-of-smart-local-energy-systems-highlighting-diversity-of-impacts-on-stakeholders/ Accessed May 2023
Green Finance Institute (2022). Mobilising local net zero investments: challenges and opportunities for local authority financing https://www.ukri.org/wp-content/uploads/2022/07/IUK-18082022-MobilisingNetZeroInvestments.pdf Accessed 3rd October 2023
Hanke, F., Guyet, R., and Feenstra, M. (2021). Do renewable energy communities deliver energy justice? Exploring insights from 71 European cases https://doi.org/10.1016/j.erss.2021.102244
Hewitt, R. J., Bradley, N., Compangucci, A. B., Barlagne, C., Ceglarz, A., Cremades, R., McKeen, M., Otto, I. M. and Slee, B. (2019). Social Innovation in Community Energy in Europe: A Review of the Evidence. Frontiers in Energy Research, Vol. 7. https://doi.org/10.3389/fenrg.2019.00031
Hopkins, E., Potoglou, D., Orford, S. and Cipcigan, L. (2023). Can the equitable rollout of electric vehicle charging infrastructure be achieved? Renewable and Sustainable Energy Reviews https://doi.org/10.1016/j.rser.2023.113398
Huggins, S. (2020). Developing and ethical framework for local energy approaches https://project-leo.co.uk/wp-content/uploads/2020/11/Project-LEO-ethical-framework-2020-final_ext.pdf
Institute for Public Policy Research (2023). From missed chances to green advances: the case for a green industrial strategy. https://www.ippr.org/research/publications/from-missed-chances-to-green-advances Accessed 5th October 2023
Just Transition Commission (2023). https://www.justtransition.scot/ Accessed October 2023
Knox, S., Hannon, M., Stewart, F., and Ford, R. (2022). The (in)justices of smart local energy systems: A systematic review, integrated framework, and research agenda. Energy Research and Social Science https://doi.org/10.1016/j.erss.2021.102333
Local Energy Scotland (2023a). Heat https://localenergy.scot/hub/heat Accessed May 2023
Local Energy Scotland (2023b). Community heat development programme https://localenergy.scot/funding/community-heat-development-programme/ Accessed May 2023
Loco Home Retrofit (2023). https://locohome.coop/about/ Accessed May 2023
Midlothian Council (2022). From waste to low carbon heating for Midlothian homes https://www.midlothian.gov.uk/news/article/3449/from_waste_to_low-carbon_heating_for_midlothian_homes
North Ayrshire council (2020). Community Wealth Building strategy https://www.north-ayrshire.gov.uk/Documents/nac-cwb-strategy-brochure.pdf Accessed May 2023
Ofgem (2023). Local energy system governance for a net zero future. https://www.ofgem.gov.uk/news-and-views/blog/local-energy-system-governance-net-zero-future Accessed 3rd October 2023
People Powered Retrofit (2021). https://carbon.coop/portfolio/people-powered-retrofit/ Accessed June 2023
PwC (2022). Accelerating Net Zero Delivery: Unlocking the benefits of climate action in UK city-regions https://www.ukri.org/wp-content/uploads/2022/03/IUK-090322-AcceleratingNetZeroDelivery-UnlockingBenefitsClimateActionUKCityRegions.pdf Accessed May 2023
Regen (2022). The local delivery of clean heat https://regensw.wpenginepowered.com/wp-content/uploads/Regen-Local-Delivery-of-Heat.pdf Accessed May 2023
Regen (2022). Delivering local benefit from offshore renewables https://regensw.wpenginepowered.com/wp-content/uploads/Delivering-local-benefit-from-offshore-renewables.pdf Accessed May 2023
Regen (2023). Community Energy. https://www.regen.co.uk/community-energy/ Accessed December 2023
Scottish and Southern Electricity Networks (2022). SSEN partners with visionary Dundee City Council on £343,000 RESOP project https://www.ssen.co.uk/news-views/2020/2020-ssen-partners-with-dundee-city-council-resop-project/ Accessed May 2023
Scottish Energy Statistics Hub (2023). Local Energy https://scotland.shinyapps.io/sg-scottish-energy-statistics/?Section=LocalEnergy&Chart=LocalRenewables Accessed May 2023
Scottish Government (2019). Good Practice Principles for Shared Ownership of Onshore Renewable Energy Developments https://www.gov.scot/publications/scottish-government-good-practice-principles-shared-ownership-onshore-renewable-energy-developments/ Accessed May 2023
Scottish Government (2021a). Local energy policy statement https://www.gov.scot/publications/local-energy-policy-statement/ Accessed May 2023
Scottish Government (2021b). Just Transition – a Fairer, Greener Scotland: Scottish Government response https://www.gov.scot/publications/transition-fairer-greener-scotland/ Accessed May 2023
Scottish Government (2021c). Heat in Buildings Strategy https://www.gov.scot/publications/heat-buildings-strategy-achieving-net-zero-emissions-scotlands-buildings/ Accessed May 2023
Scottish Government (2022a). Local Heat and Energy Efficiency Strategies and delivery plans – guidance https://www.gov.scot/publications/local-heat-energy-efficiency-strategies-delivery-plans-guidance/pages/2/ Accessed March 2023
Scottish Government (2022b). Scottish Government, 2022. What are Scotland’s National Just Transition Outcomes? https://consult.gov.scot/just-transition/scotlands-just-transition-outcomes/ Accessed January 2023
Scottish Government (2023a). Draft energy strategy and just transition plan https://www.gov.scot/publications/draft-energy-strategy-transition-plan/ Accessed May 2023
Scottish Government (2023b). Renewable and low carbon energy. https://www.gov.scot/policies/renewable-and-low-carbon-energy/local-and-small-scale-renewables/ Accessed May 2023
Scottish Government (2023c). Onshore wind sector deal https://www.gov.scot/publications/onshore-wind-sector-deal-scotland/ Accessed September 2023
Scottish Government (2023d). Cities and regions: community wealth building https://www.gov.scot/policies/cities-regions/community-wealth-building/ Accessed May 2023
Scottish Parliament (2023). The role of local government and its cross-sectoral partners in delivering a net zero Scotland https://digitalpublications.parliament.scot/Committees/Report/NZET/2023/1/23/2c9752ff-eb3f-4273-8f78-e726676a3b6e#Introduction Accessed May 2023
Slee, B. (2020). Social innovation in community energy in Scotland: Institutional form and sustainability outcomes. Global Transitions, Vol. 2, https://doi.org/10.1016/j.glt.2020.07.001
Stewart, F. (2021). All for sun, sun for all: Can community energy help overcome socioeconomic inequalities in the uptake of low carbon technologies? Energy Policy, 157 https://doi.org/10.1016/j.enpol.2021.112512
Sustainable Energy Futures Led (2023). Enabling decentralized energy innovation. Available at: https://www.ukri.org/wp-content/uploads/2023/02/IUK-03022023-Enabling-Decentralised-Energy-Innovation.pdf Accessed May 2023
The Heat Project Blairgowrie (2023). https://www.theheatproject.org/ Accessed October 2023
UKRI (2023). Prospering from the Energy Revolution https://www.ukri.org/what-we-do/our-main-funds-and-areas-of-support/browse-our-areas-of-investment-and-support/prospering-from-the-energy-revolution/#:~:text=The%20’prospering%20from%20the%20energy,and%20creating%20high%2Dvalue%20jobs. Accessed 10th October 2023
UKRI and Regen (2022a). Smart local energy systems: finance and investment https://www.ukri.org/publications/smart-local-energy-systems-finance-and-investment/ Accessed October 3rd 2023
UKRI and Regen (2022b). Smart local energy systems: skills and capabilities https://www.ukri.org/publications/smart-local-energy-systems-skills-and-capabilities/ Accessed May 2023
Welsh Government (2022). Local and shared ownership of energy projects in Wales. https://www.gov.wales/sites/default/files/publications/2022-06/guidance-local-and-shared-ownership-of-energy-projects-in-wales_0.pdf Accessed 3rd October 2023
Yeow, J., Rigby, J. and Li, Y. (2017). The Effect of a Government Target for the Procurement of Innovation: The Case of the UK’s Small Business Research Initiative. In: Thai, K. (eds) Global Public Procurement Theories and Practices. Public Administration, Governance and Globalization, vol 18. Springer, Cham. https://doi.org/10.1007/978-3-319-49280-3_7
Appendices
Appendix A: Methodology
We used three key methods in the delivery of this project. These were:
- Systematic review of academic and policy literature
- Interviews with key stakeholders
- Deliberative “People’s Panel” with Scottish citizens (Appendix B)
These methods were selected to give us as rounded a view of the opportunities and barriers for local and community energy as possible. More details on review and interviews are given below, with a more extensive overview of the People’s Panel in Appendix B.
Systematic review of academic and policy literature
Leveraging previous academic expertise of the project team, we conducted a review of relevant literature in the field of local and community energy with reference to a just transition. In total, we reviewed nearly 100 documents, including peer-reviewed journal articles, consultant reports, case studies, and policy documents from the Scottish and UK Governments.
Articles were sourced using search terms in Google Scholar. We first searched “local energy”, “community energy”, and “just transition”. We then expanded our search to include local/community energy and the different just transition outcomes.
Policy documents were sourced from the Scottish and UK Government websites, online search engine searches, and early informal interviews with key local and community energy policy experts. Within Regen we have vast experience of the local and community energy space, including developing the Community Energy England, Scotland and Wales state of the sector reports for 2021; delivering ongoing engagement and convening with community energy organisations and the wider energy sector via our network-funded communities programme (Regen 2023); and advocating for community energy within policy and regulatory consultations such as delivering benefits from offshore wind (and supporting community organisations to do the same). Finally, we sourced cases by reviewing innovation projects such as Prospering from the Energy Revolution, and through asking stakeholders for recent developments.
Once documents were sourced, they were reviewed for evidence and analysis around the eight NJTOs specifically, as well as lessons for delivering more just processes and outcomes. These were collated within a single spreadsheet, with this spreadsheet then discussed by the project team to establish key themes and content.
Interviews with key stakeholders
Once this review was complete, we interviewed 22 key expert stakeholders working across local and community energy, community energy organisations, local authorities, innovation, renewable energy businesses, equalities and social justice, just transitions, and third sector. This diverse base of people was chosen to help give a rounded view not just of local and community energy, but to glean insights from relevant sectors to help shape a future look at local and community energy to ensure it works for NJTOs. These were identified through existing Regen, Scottish Government and industry networks.
It is worth noting that there was higher representation from both citizens and local and community energy practitioners than e.g. renewable energy developers and businesses in this process. This was deliberate – citizens and local and community organisations, particularly those working on just transition issues, have been less often engaged in such discussions yet can provide crucial insights on how to best open up local and community energy for a wider range of just transition outcomes. However, recommendations in turn reflect more the perspective of those stakeholders. Further engagement with energy developers and businesses would help make recommendations more robust.
These interviews took place online during the months of February-April 2023. Each lasted between 45 minutes and 1 hour. Feedback was anonymised during the analysis process. We asked specifically where people had seen local and community energy working for just transition outcomes already, the key issues that local and community energy might face in working for just transition outcomes or processes, where they felt local and community energy could add more JT value with the right support, and how we could best enable this (relevant to people’s area of expertise). Questions were developed from a combination of evidence from the literature review, and to target the key research aims of the work agreed at project inception.
To supplement, we also held an informal online workshop of local and community energy stakeholders in the UK, to discuss these themes in an open forum with experts from a more technical and specialist perspective. In this workshop, stakeholders included some of those interviewed, but were mostly made up of local and community energy stakeholders from outside Scotland, allowing us to glean a more rounded view of the sector and recent developments elsewhere in the UK. This workshop did not influence recommendations directly, but rather helped us track any new and emerging trends in this space identify key just transition questions (particularly around local project processes, innovation, system operation and governance) for further investigation in the Scottish context.
Appendix B: People’s Panel
To fully understand how local and community energy can support all communities and regions across Scotland, Regen commissioned Shared Future to co-design and run a People’s Panel.
A People’s Panel is a deliberative process, bringing together citizens from a sample of the population to learn about a topic and ‘co-design’ policy recommendations. People’s Panels, and other types of deliberative processes, are particularly powerful tools for addressing policy issues that impact and involve people. They allow for ideas – such as different models of community and local energy – to be tested amongst the target population, they help explore barriers around engagement and participation, and they add democratic legitimacy to policy development. The goal of our People’s Panel was to answer the question:
“The way we use energy in our homes and communities is changing, with many communities and councils developing their own solutions.
How should this be done so that it involves and benefits people in a fair way?”
To address this question, Shared Future recruited 22 people from across Scotland to participate in four online sessions over the course of three weeks. In these sessions, participants hear from ‘expert witnesses’ who present on the relevant topic of the day in clear terms, with participants discussing what they’ve heard and questioning witnesses for more information.
Expert witnesses were chosen by the wider project team (including our academic steering group) as people who either (a) were considered experts or leading practitioners in their field, and/or (b) led an interesting real-world case study. This did not include a “traditional” commercial renewable energy developer. Experts were briefed extensively by the Shared Future team as an impartial partner, to eliminate biases and ensure that presentations were as clear and understandable as possible. The aim was not to promote local and community energy, but to present participants with different models, examples and ideas to understand their perspectives. We had two expert witnesses per each session, covering:
- How the energy system works and how it is changing to become more local and renewable (energy systems expert Calum Watkins – Smarter Grid Solutions, and local energy expert Rebecca Windermere – Regen)
- Community energy (Glasgow Community Energy; Local Energy Scotland who replaced Community Energy Scotland due to scheduling clashes)
- Local energy (North Ayrshire Council; the Blairgowrie Heat Project; smart local energy expert Jess Britton – UKERC) and
- Larger developments and shared ownership (Ripple Energy, Local Energy Scotland)
From these sessions with witnesses and wider discussions, participants then deliberated and worked together to identify 20 key principles for developing local and community energy such that it involves and benefits people in a fair way. These are grouped into 7 key themes (below).
Of these participants, only 1 had heard of local or community energy before. A stratified random sample of the population was used to gain perspectives from people who had not worked in this space before, and from diverse social and economic backgrounds. The same 22 participants attended each session, and were paid £110 each in vouchers of their choosing for their time.
Theme 1) Definitions
This theme relates to clarity of definitions surrounding the energy project itself, the roles and responsibilities of those involved, and the budget.
It includes three principles:
- How the project will work is clear; how long it will last, what are the personal and community benefits of being involved etc. This is made easy to understand.
- It has been agreed and is clear what roles and responsibilities there are and how much time commitment is needed by people who want to take part. This will enable people to play to their strengths and feel ownership.
- Transparency of the budget is clear to all.
Theme 2) Goals and outcomes
This theme brings focus to how aims, success metrics, shared values, priorities, and benefits are established within local and community energy developments.
It includes four principles:
- The aims of the project and what success looks like is clear to all and has been agreed by consensus.
- Shared values are agreed by all involved.
- Priorities are set but, not everything at once, start small and scale it up as more people get interested.
- Fairness: everyone has to benefit, with benefits being evenly distributed.
Theme 3) Participation
This theme takes a very broad view of issues related to participation, including raising awareness of local and community energy generally, engagement and promotion within the community itself, participation opportunities across the whole community, and routes for democratic governance structures.
This theme includes six principles:
- There must be large-scale awareness-raising of the concept of community/local energy so that everyone understands its benefits and what your individual / community entry point might be.
- Developers should be mandated to engage with communities at the earliest possible stage (before planning) to ensure that benefits are relevant to the community and to ensure that there is forward planning so that the community is happy with how the land, and any infrastructure, will be developed or left at the end of the project.
- The project is well promoted to everyone within the community.
- Collaboration is encouraged so that lots of people can get involved and work together sharing lots of ideas.
- Flexibility means that input can be heard from all parts of the community.
- The way that decisions are made is clear and agreed. It is democratic so people are able to express views, and misgivings, it is not controlled by one person and all who have a share (no matter how small) have a vote. At least a proportion of shares must be affordable for those on a low income. Changes are consulted on.
Theme 4) Support and risk
This theme talks to the processes of delivering local and community energy developments, ensuring that support is provided to the community to support project engagement or delivery, and that risks to the community are minimised.
It includes two principles:
- There is support in place all the way through the project so that no-one feels left alone and appropriate extra training is provided. Funding for community-sourced leadership roles should be mandated where it supports equitable and consistent involvement.
- No unnecessary risks are taken.
Theme 5) Local use of energy
This theme relates to Panel members’ perspectives that energy generated locally should also be used locally. It includes one principle:
- Wherever possible the energy generated should be used by the local community.
Theme 6) Shared ownership opportunities
This theme focuses specifically on shared ownership energy models and talks to the mechanisms through which people can get involved with shared ownership projects.
It includes two principles:
- In a shared ownership project, there must be the opportunity to invest throughout the lifetime of the project and a clearly defined timeframe for how long it will remain publicly owned.
- In shared ownership projects, developers should have profits capped at a percentage level to ensure they are not making excessive profits whilst there are any households left sitting in the cold.
Theme 7) Roles for government
This theme speaks to the structures that need to be put in place to support the fair growth of community and local energy across Scotland. While many of the other principles and themes relate to specific instances of community and local energy development, this theme is more focussed on widespread action and equality of opportunity across the country.
It includes two principles:
- There has to be conclusive and resounding support (investment and policy) from all levels of government that mean widespread community and local energy is a reality across all our communities.
- To help ensure fairness, national government needs to ensure that all councils are a) able to invest in community energy projects and be held to account if they don’t do so and b) face a minimum of red tape in achieving innovation.
Support for Principles by theme
This theme
Figure 1 depicts the degree of support held by Panel members for each principle, grouped according to the seven themes outlines above.
Across all themes and principles, the average ratio of support (strongly support and support) to opposition (oppose and strongly oppose) is 52:1. For every vote of opposition, there were 52 votes in support, with only 6 total votes opposing principles in total, showing overwhelming agreement with almost all principles developed.
Appendix C: Local and community energy just transition outcome impacts
Table: Community energy
| Local and community energy approach | Generation and supply | Heat and energy efficiency | Transport |
| Overview | Community owned wind turbines or solar panels, usually on shared buildings or land. | Clean heating technologies in local buildings or community centres; district heating networks; collective | Community electric vehicle car sharing, charging, and active travel initiatives. |
| Citizens, communities and place | Democratic ownership and governance for local interest. Revenues used to develop local places and bring people together around a collective, locally owned good. | Locally tailored solutions; ’warm spaces’, reduced bills for community hubs; learning and dissemination; bringing people together around a collective local good. | Travel solutions reflective of local places, access to vehicles and infrastructure. |
| Jobs, skills and education | New roles in capacity building and development; potential for using community benefit to deliver training or employment opportunities, CE groups often conduct climate education and outreach. | Installation of new technologies requires jobs in trades and engineering; training for those shifting from gas to clean heating, and providing EE solutions, sharing lessons from decarbonised community spaces. | Can support switch to new climate-friendly behaviours, such as active travel or electric vehicle use. |
| Fair distribution of costs and benefits | Money raised from public funds and by those with capital, with benefit then realised in the community. However, typically only those who contribute financially get a say, plus a direct return on investment. | Benefits depend on type of project. Scope to raise substantial capital but technical barriers such as location of demand, building type, housing tenure etc. Can help link people to support, improving health and social outcomes. | Access to new modes of transport for people who otherwise may not be able to afford it; social and health benefits funded by community share offer or public funds. |
| Business and economy | Limited business and economy impact, although opportunities for businesses to benefit through decarbonisation and investment. | Opportunity for new clean heat businesses to deliver projects on-the-ground. | EV charging and infrastructure providers, better connected places opening new opportunities for people in work and leisure. |
| Adaptation and resilience | Revenues used for climate adaption such as defences in flood-prone areas, or making buildings more efficient to deal with extreme temperatures. | Less reliance on fossil fuels for heating; more efficient and comfortable buildings. | Less dependence on fossil-based transport; improved health outcomes through reduced emissions and greater mobility. |
| Environmental protection and restoration | CE volunteers often tie-in work with local climate and environmental action, such as tending to communal green spaces and community gardening. | Less direct benefit here. | Less direct benefit here. |
| Decarbonisation and efficiencies | Directly contributing to decarbonising of electricity supply, revenues can be used to decarbonise local buildings. | Direct decarbonisation of heat, often paired with energy efficiency, improved health and social outcomes. | Direct decarbonisation of transport and increased use of active alternatives. |
| Equality and human rights | Democratic ownership of renewable energy redistributes power from large companies to local people. Scope to redress inequalities locally and support e.g. child and fuel poverty. | Potential to deliver clean heat at a local level, overcoming some of the financial and social barriers faced by particularly lower income groups | Better connected people and places; reduced rates of ‘transport poverty’; more options for people to travel locally. |
Table: Local energy
| Local and community energy approach | Generation and supply | Heat and energy efficiency | Transport |
| Overview | Wind turbines, solar PV and hydro projects led predominantly by local authorities, social housing providers, or the public sector. | Clean heating technologies (e.g., heat pumps, district heat networks) and efficiency measures (e.g., insulation) delivered in social or council housing stock. | Electric vehicle charging infrastructure, active travel initiatives such as e-bikes. |
| Citizens, communities and place | Locally owned energy projects, generating revenue for e.g. fuel poverty alleviation and Community Wealth Building. | Heat pumps and efficiency in council, social, or public sector buildings and district heat networks serving local houses, businesses and industry. | Travel solutions reflective of local places, access to vehicles and infrastructure. |
| Jobs, skills and education | Typically larger-scale revenues compared to community model for e.g. delivering energy efficiency, requiring skills in trades and installation. | Can require significant numbers of workers to deliver – training opportunities for trades and gas engineers. | Can support switch to new climate-friendly behaviours, such as active travel or electric vehicle use. |
| Fair distribution of costs and benefits | Public or private finance leveraged for more ’just’ outcomes such as addressing fuel poverty. Risk that benefits to the community are limited — need for meaningful community input/ownership/just transition value to maximise benefits. | Public or private finance leveraged for more ’just’ outcomes, often delivering clean heating directly. Can help link people to support, improving health and social outcomes However, can be exclusive of those in the private rented sector, and reliant on grant support / limited local coverage. | Public or private finance to fund initiatives for public, although can often be limited to central urban areas. |
| Business and economy | Opportunity for renewable energy developers and businesses to deliver projects, improved local development leading to more active economic participation. | Opportunities for clean heat developers on heat networks in particular, and for heat pump developers. | Opportunities for e.g. e-bike companies or EV charging providers. |
| Adaptation and resilience | Dependant on how revenues are spent. | Less reliant on fossil fuels for heating, more efficient and comfortable buildings. | Less direct benefit here. |
| Environmental protection and restoration | Dependant on how revenues are spent. | Less direct benefit here. | Less direct benefit here. |
| Decarbonisation and efficiencies | Direct decarbonisation of electricity supply in council or social building stock. | Direct decarbonisation of heat, often paired with energy efficiency, improved health and social outcomes. | Direct decarbonisation of transport and increased use of active alternatives. |
| Equality and human rights | Less direct equalities impact, but can use strong engagement and CWB principles to deliver against e.g. child poverty or develop more inclusive projects. | Opportunity to deliver clean heat at a local level, tailoring to local need, overcoming some of the financial and social barriers faced by particularly lower income groups. | Better connected people and places; reduced rates of ‘transport poverty’. |
Table: Integrated local energy systems
| Overview | Typically larger-scale (town or city-wide) interconnected electricity generation, supply, demand, storage, transport, heat, and efficiency. Brought together at a local level using data and digitalisation. |
| Citizens, communities and place | Well-connected energy systems across all energy vectors, tailored to local need and maximising local value through optimised energy sharing, smart supply and demand. |
| Jobs, skills and education | Range of jobs and skills required, from project management to data science to trades, installers, legal support and policy expertise. |
| Fair distribution of costs and benefits | Public or private finance leveraged for more ’just’ outcomes. Risk that benefits to the4 community are limited. Also exclusive of private rented sector. Need for meaningful community input/ownership. |
| Business and economy | Range of business opportunities in: energy innovation and optimisation, data science, software development, trades and installation, renewable energy developers, transport and service providers. |
| Adaptation and resilience | Less direct benefit here, although can be matched up with local adaptation and resilience ambitions. |
| Environmental protection and restoration | Less direct benefit here, although can be matched up with local environmental protection and restoration ambitions. |
| Decarbonisation and efficiencies | Direct decarbonisation of energy, more efficient buildings, and cleaner transport. Can also support cost-effective grid decarbonisation. |
| Equality and human rights | Less direct benefit here. |
© The University of Edinburgh
Prepared by Regen on behalf of ClimateXChange, The University of Edinburgh. All rights reserved.
While every effort is made to ensure the information in this report is accurate, no legal responsibility is accepted for any errors, omissions or misleading statements. The views expressed represent those of the author(s), and do not necessarily represent those of the host institutions or funders.
www.climatexchange.org.uk
If you require the report in an alternative format such as a Word document, please contact info@climatexchange.org.uk or 0131 651 4783.
DOI: http://dx.doi.org/10.7488/era/3737
Executive Summary
Overview
Scotland’s electricity system is undergoing a transformation with rapid increases in installed wind and solar electricity generating capacity. This is coupled with the phase out of nuclear and unabated gas power stations.
This will impact on Scotland’s electricity system security of supply, which has historically relied on large, centralised fossil fuel power plants. These can ramp power production to meet demand, in addition to grid network connection to the rest of Great Britain. Here ‘security of supply’ refers to the ability of the system to reliably and continuously provide a sufficient amount of electricity to meet the demands of consumers.
In this report, we explore issues around security of supply in Scotland’s electricity system in the transition to net zero by 2045. We examine international examples of national and regional electricity systems transitioning to net zero and review the potential impact of electricity market reform. We use scenario modelling to quantify security of supply and import/export metrics for the expected technology pathway in Scotland.
The future security of supply of Scotland is subjected to stress tests, including disconnection of offshore wind farms; low variable renewable power output; unavailable gas power generation in Scotland; unavailable interconnectors; battery storage failures; and an unavailable connection to the rest of GB. The report also looks at the security of supply of a self-sufficient Scotland, with no interconnection to Europe or the rest of Great Britain, in addition to a low capacity and high demand scenario to further test Scotland’s future electricity system.
Key findings
- Examples of national and regional electricity systems operating with high proportions, in excess of 100%, of renewable electricity are typically dominated by hydropower and pumped hydro storage reservoirs. These are dispatchable and offer high levels of security of supply.
- Scotland and Denmark are leading examples of national electricity systems integrating large shares of variable renewable energy sources, but rely on imports with neighbouring countries.
- Potential changes to electricity market arrangements such as splitting the wholesale market, locational pricing and an enhanced capacity market could have impacts on future investment in renewables and flexibility technologies in Scotland.
- Under the System Transformation scenario there will be a reduction in traditional firm generation capacities in Scotland. This includes no nuclear and reduced gas power plant generation when changing to carbon capture and storage technology. However, these losses will be offset by vast increases in wind and solar installed capacity, as well as increasing low-carbon firm generation capacity in the form of biomass, hydrogen and abated gas power plants.
- Security of supply metrics for Scotland in the System Transformation scenario for the years up to 2045 were found to be within the current GB reliability standards and comparable to current levels. Security of supply in Scotland improves in the transition towards net zero by 2045 due to large increases in generation capacity and storage.
- Peak demand in Scotland is expected to rise from around 5000 MW in 2021 to around 9000 MW by 2045 but is exceeded by generation, even when considering expected availability in real time. While the generation capacity in Scotland may seem excessive in the context of security of supply in this scenario, it is utilised to decarbonise and provide security of supply to GB as a whole.
- Scotland will continue to be a net electricity exporter to the rest of GB and net exports will increase from current levels. There will be an increase in the level of import from the rest of GB due to increased demand, coupled with increased reliance on variable wind power generation, which leads to more imports during low wind periods.
- Testing of the future Scottish electricity system, assuming low installed capacity for thermal power plants, low B6 boundary expansion and high future peak demand, shows lower security of supply in 2030 than the GB reliability standard.
- In 2025 and 2030 disconnection with the rest of GB has the highest impact of all of the stress tests conducted, followed by unavailable interconnectors and gas supply issues. This implies that there is a high reliance on imports from and exports to the rest of GB in maintaining the capacity adequacy in Scotland. However, its significance is negligible from 2035, when there is a large increase in offshore wind capacity and additional capacity of battery storage, pumped hydro, hydrogen power plant and biomass.
- A self-sufficient Scotland with no connection to the rest of GB and no interconnector capacity would violate the GB reliability standard in the years 2025 and 2030, mainly due to periods of low wind and renewables output without sufficient dispatchable supply capacity. However, by 2035 the security of supply metrics are within historical values and improve further in the following years. We find 250 MW and 1000 MW of additional equivalent firm capacity would be needed in 2025 and 2030 to meet minimum reliability standards and historically typical standards respectively. This would be the equivalent of an additional 1,553 MW to 6,211 MW installed capacity of offshore wind.
Glossary
|
Black Start |
The procedure used to restore power in the event of a total or partial shutdown of the national electricity transmission system. |
|
CT (Community Transformation Scenario) |
A scenario from the FES that achieves the 2050 decarbonisation target in a decentralised energy landscape. |
|
De-rated Generation Capacity |
The amount of power that can be produced by a generation source after a reduction factor is applied to the installed capacity to reflect what is expected to be available in real time. |
|
Equivalent Firm Capacity (EFC) |
An assessment of the entire wind and solar PV fleet’s contribution to capacity adequacy, representing how much of 100% available conventional plant could theoretically replace the entire wind fleet and leave security of supply unchanged. |
|
FES (Future Energy Scenarios) |
A set of energy system scenarios for the UK, covering the period from now to 2050, developed in conjunction with the energy industry, to frame discussions and perform stress tests. They form the starting point for all transmission network and investment planning and are used to identify future operability challenges and potential solutions. |
|
Load Factor (or Capacity Factor) |
The amount of electricity generated by a plant or technology type across the year, expressed as a percentage of maximum possible generation. Load factors are calculated by dividing the total electricity output across the year by the maximum possible generation for each plant or technology type. |
|
Loss of Load Expectation (LOLE) |
The expected number of hours in a year when demand exceeds available generation before any emergency actions are taken. LOLE is calculated after all system warnings and System Operator (SO) balancing contracts have been exhausted. It is important to note that a certain level of loss of load does not necessarily result in blackouts, as actions can be taken without significant impacts on consumers. The UK Government’s Reliability Standard requires an LOLE of no more than 3 hours per year. |
|
Peak Demand |
The highest level of electricity demand in a fiscal year, which typically occurs around 5:30pm on a weekday between November and February. |
|
Security of Supply (SoS) |
A general term used to describe the maintenance of required energy flows to consumers at all times. Specific criteria are used across different fuels, and SoS can cover network resilience as well as adequacy more generally. |
|
ST (System Transformation Scenario) |
A scenario from the FES where the target of reaching net zero is achieved by a moderate level of societal change and a low-moderate level of decarbonisation. |
|
Variable Generation |
Types of generation that can only produce electricity when their primary energy source is available and driven by weather. For example, wind turbines can only generate when the wind is blowing. |
Introduction
Background and aims
Scotland is committed to net zero greenhouse gas emissions by 2045 through the Climate Change (Emissions Reduction Targets) (Scotland) Act 2019 [1]. This means net zero emissions across all sectors of the economy, including from the energy system. In the power sector, traditional thermal generation, such as nuclear power and gas power plants are being retired and there are ambitions for realising 8-11 GW offshore wind capacity by 2030 [2]. Under some net zero scenarios this could increase to more than 35 GW by 2045 in Scotland [3]. Additionally, under National Grid’s ‘Leading the Way’ scenario in Scotland solar PV rises from 0.5 GW in 2021 to 6 GW in 2045, and onshore wind rises from 9 GW in 2021 to 27 GW in 2045.
This raises the importance of security of supply in Scotland with an electrical system that has high levels of weather-dependent wind and solar energy. The transition to net zero brings new challenges to Scotland’s electricity system security of supply:
- Torness nuclear power plant is due to close before the end of this decade resulting in the loss of the baseload output from this electricity generator.
- Peterhead gas power station may close as an unabated gas power plant and be replaced by a gas power plant fitted with carbon capture and storage technology. It is uncertain whether new carbon capture power plants can be operated flexibly or will be required to produce electricity round-the-clock.
- Increased reliance on intermittent renewable energy sources causing greater disparity between generation and demand on hourly, daily, monthly, and seasonal timescales.
- Increased need for electrical network expansion and reinforcement to transport renewable electricity to high demand areas.
The emissions reduction pathway shown in the 2020 climate change plan update [4] accordingly sets out a vision for net zero emissions from the electricity sector by 2029.
- Investigate international examples of national electricity systems operating/moving towards reliance on renewables.
- Review expected/planned policy or regulatory developments, such as locational pricing, which could impact the future system.
- Assess technology developments needed in Scotland to ensure a secure and reliable supply of low and zero carbon electricity to 2045.
- Assess the likely impacts on transfers of electricity from/to Scotland and the rest of GB, in a Scottish electricity system powered almost entirely by intermittent renewables.
- Calculate additional volume and type of generation that would be required for Scotland to have an entirely self-sufficient system (also including black start capability).
Security of supply
Security of supply in electrical power systems is the ability to match supply and demand with high probability, both under normal and unexpected conditions. This includes the coldest periods when peak demand often occurs; during outages of large power plants or interconnectors; and dark, windless periods when there is low renewable generation.
Challenges for future security of supply
Meeting the peaks in electrical demand is key in determining security of supply. If this demand can be met with high probability, then it is likely that all other periods with lower demand can also met. However, in systems where a high proportion of generation is from variable renewable sources then there will also be periods when high generation coincides with lower demand, which can lead to excess generation. Periods of excess generation is not the focus of this report but it is recognised that this can also provide challenges in an electrical system, such as costs of constraints, and that these periods require reliance on flexibility technologies such as storage and interconnection.
Peak electrical demand is expected to grow in the UK[1] from around 60 GW seen for the past decade to 100 – 115 GW in 2050 [Figure 1]. These rises are strongly driven by electrification of heat and transport.
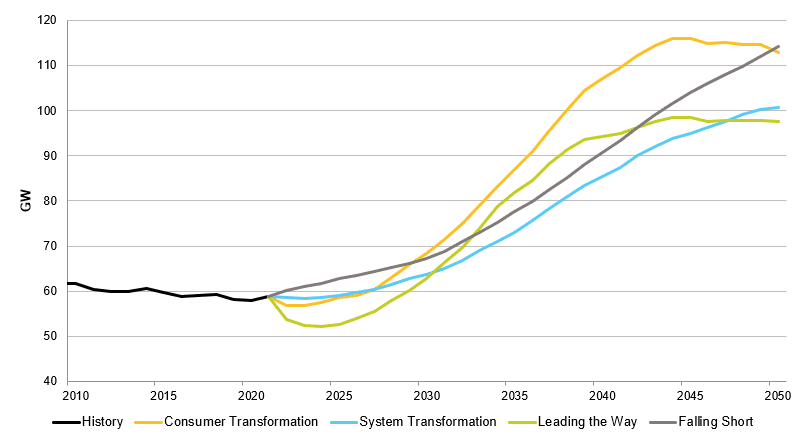
Figure 1 Peak demand during average cold spell increasing according to Future Energy Scenarios
In the future, it is expected that there will be increasing flows of power between Scotland and the rest of GB. The extensive wind resources, both onshore and offshore in Scotland, offer high and consistent wind speeds which makes Scotland an attractive place to build wind farms. However, electricity demand is far greater in England than in Scotland. In 2021 peak electricity demand was around 11 times higher across the rest of GB (55 GW) compared with Scotland (5 GW). National Grid’s ‘System Transformation’ scenario from the Future Energy Scenarios (FES) predicts broadly similar levels of installed wind capacity by 2050 (onshore and offshore) in the rest of GB (around 71 GW) and in Scotland (around 59 GW) [3]. This will lead to more reliance on the electrical network for transmitting the necessary electricity to ensure security of supply on both sides of the Scotland/England power system boundary.
Security of supply in the UK in National Grid’s Winter Outlook
Peak electricity demand often occurs during cold weather, and National Grid publish a winter outlook on security of supply every year. The report provides analyses of forecasted weather, expected power plant issues, and estimated import and export capabilities of interconnectors to Europe. The impacts on probability of the UK electricity system to be able to reliably meet electricity demand are also assessed. For more information on the 2022/23 winter outlook see Appendix 12.1.
Under normal conditions the electrical power system at present meets security of supply thresholds, but wider geopolitical issues have shown that it is vital to consider ‘unlikely’ stress events to the system. The winter outlook gives the current view on security of supply in the short-term but given that it takes years to build electrical power infrastructure it is important to consider how security of supply will evolve in the future.
The transition to net zero is informed by creating scenarios for the expansion of capacities of generation, demand, flexible technologies such as batteries and pumped hydro, and electrical networks.
Issues around operability
Black starts are the process for recovering the entire power grid following a highly unlikely[2] complete shutdown. However, not all generators have black-start capability. Conventionally, it is provided by a limited number of large coal, gas, and diesel generators. Following a highly unlikely event of a total or partial shutdown of the national electricity transmission network, black start plants can start independently, by using on-site equipment and fuel. They are independent of wider system input or specific weather conditions and can set up a skeleton network. Gradually different components can be reconnected to re-establish normal operation.
Wind turbines were previously viewed as unsuitable for black start due to dependence on external electricity before they can begin generating power. However, some of the latest designs are capable of self-starting. For example, in 2020, the 69 MW Dersalloch wind farm provided a black-start function through alternative control of power electronics using a virtual synchronous machine approach to restart part of the Scotland grid [5]. Battery storage, which has seen fast growth in UK, can also contribute to a black start. National Grid has committed to consider the provision of black start from non‑traditional generation technologies to facilitate the restoration of the future GB power system [6].
Aspects of security of supply also include the sufficient provision of ancillary services to stabilise power system operation. Ancillary services are not within the scope of our work, but a short commentary can be found in Appendix 12.2.
Scotland’s electricity system
Scotland’s electricity system operates as a part of the wider GB power system meaning electricity supply and demand must be always equal across the whole of GB. Generators anywhere in the GB power system can sell electricity to any demand, regardless of distances, through bilateral agreements and power exchange markets. It is then the responsibility of the energy system operator, National Grid ESO, to redispatch generation and demand to ensure that the physical electrical network can cope with the trades.
In the north of Scotland, the transmission and distribution network are operated and owned by Scottish & Southern Electricity Networks (SSEN). In the south of Scotland the transmission and distribution network are operated and owned by Scottish Power Transmission (SPT) and Scottish Power Energy Networks (SPEN) respectively. These transmission networks interface with the transmission network operated by National Grid Electricity Transmission which covers England and Wales, see Figure 2.
The boundary between Scotland and the rest of GB will be subject to future increased power transfer requirements due to additional onshore and offshore wind generation locating in Scotland. When there is low generation output in Scotland there may be power flowing from the rest of GB to Scotland to meet demand. However, these flows will be low compared to the flow from Scotland to the south so there is unlikely to be further requirements for network extension to support this on top of those for flows from Scotland. According to National Grids ETYS21 [7] there is currently a total of 6,100 MW transfer capability between Scotland and the rest of GB[3].
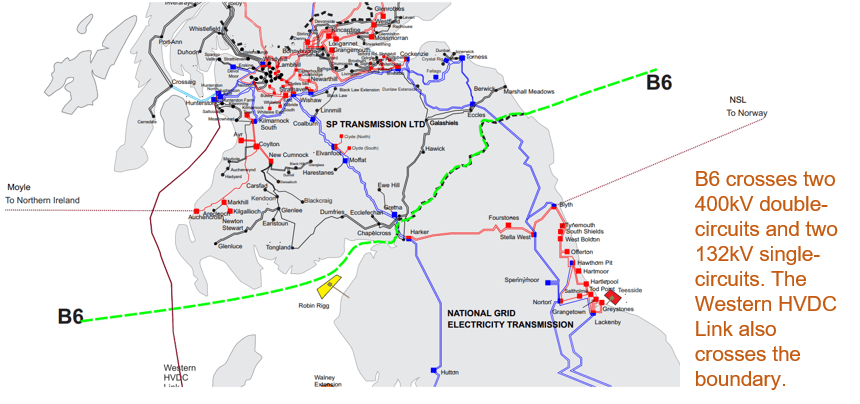
Figure 2 Network infrastructure in 2022 across the B6 boundary [7]
Table 1 outlines the installed firm generation and the corresponding de-rated capacity in Scotland for the year 2021. Firm generation is defined here as generation types which can generate when required, and independently of external factors such as weather conditions. We also account for “de-rated” capacities where aspects such as outage rates are incorporated. Table 1 shows the de-rated firm generation and interconnector capacity in Scotland in 2021 was 8,489 MW while peak demand was 4,890 MW. Peak demand as a percentage of total firm de-rated capacity in Scotland was therefore 58%, meaning that there was secure installed firm capacity which is likely to meet demand in 2021. Therefore, the current generation mix in Scotland’s electricity system provides sufficient security of supply.
In the next sections, we will investigate scenarios for what the future electricity system in Scotland will look like and undertake more detailed analysis into how security of supply may evolve.
Table 1 Total and de-rated firm generation and interconnector capacity (MW) in Scotland in 2021 (see Appendix 12.13 for de-rating factors)
|
Total (MW) |
De-rated (MW) | |
|
1,750[4] |
1,302 | |
|
Hydro |
1,779 |
1,621 |
|
Gas |
1,238 |
1,130 |
|
Pumped hydro |
740 |
704 |
|
Interconnector |
160[5] |
80[6] |
|
England and Wales grid connection |
6,100 |
3,0506 |
|
Biomass |
208 |
183 |
|
Sum of generation and interconnector firm capacity |
11,975 |
8,070 |
|
Peak demand in Scotland |
4,890 | |
|
Peak demand as percentage of sum of firm generation and interconnector capacity in Scotland |
41% |
61% |
|
System margin (Total rated or de-rated minus peak demand) |
7,085 |
3,180 |
100% renewable electricity systems
Renewable electricity generation technologies can be split into two categories related to the challenges of accommodating them into power grid [8] [9]:
- Variable Renewable Energy (VRE): dependent on short-term weather conditions, and typically use invertors to interface to the grid, for example, wind and solar; and
- Non-VRE technologies: dispatchable generation using synchronous generators including hydro with reservoir, biomass, geothermal, and concentrating solar power with thermal storage.
For VRE, additional flexible technologies such as dispatchable generation and energy storage are required to compensate intermittency. For non-VRE generation, the timing and volume of production can be adjusted to follow demands and market developments.
In this work, a 100% renewable electricity system is defined as: a system that operates exclusively on renewable energy sources, such as wind, solar, hydro, geothermal, and bioenergy. It does not rely on non-renewable sources such as fossil fuels, nuclear energy, or other non-sustainable sources of energy. The renewable sources can be instantaneous outputs from renewable generation, discharged energy stored previously from renewable electricity, or even imported renewable electricity from connections with neighbouring systems. 100% renewable electricity system is technically achievable, and this section explores countries and regions where they exist. However, there are exponentially increasing costs to reach 100% [10] [11] [12].
Several national electricity systems in the world already operate with, or close to, 100% renewable electricity. Details can be found in Appendix 12.3. Further detail on national electricity systems with high shares of VRE generation (operating with less than 100% renewable energy) can be found in Appendix 12.4. Details of regional electricity systems operating with near to 100% renewable electricity can be found in Appendix 12.5.
Table 2 summarises key features in countries and regions with high share of renewables in power production. For countries already operating with (or very close to) 100% renewable electricity supply, the share of VRE is actually very low. For countries and regions with a high share of VRE generation, despite future 100% renewable electricity targets, fossil fuel dispatchable generation is still playing a major role to provide flexibility – either from gas and coal plants within its system or imported through connections.
Table 2 Comparison between counties and regions with high share of renewable power production (2020 data, see Appendices 12.3 – 12.5)
|
Country or region |
Overall share of renewables in power production |
Share of VRE |
Main source of flexibility |
Main renewable type |
Total renewable generation exceeding annual electrical demand? |
|
Iceland |
100% |
None |
Hydropower plants with dams and reservoirs; |
Hydro (76%) |
No |
|
Paraguay |
99% |
<1% |
Hydropower plants with dams and reservoirs |
Hydro (99%) |
No |
|
Norway |
98% |
6.4% |
Hydropower plants with dams and reservoirs |
Hydro (92%) |
Over 109% in 2022 |
|
Denmark |
84% |
60% |
Coal, gas power plants and dispatchable CHP |
Wind |
No |
|
Ireland |
43% |
37.2% |
Gas power plant (51%) |
Wind |
No |
|
UK |
43% |
28% |
Gas power plant (36%) |
Wind |
No |
|
Germany |
44% |
37.5% |
Gas (12%) and coal (24%) power plant |
Wind solar PV (10%) |
No |
|
Orkney |
100% |
100% |
Interconnection with UK mainland |
Wind |
Over 130% |
|
Mecklenburg-Vorpommern in Germany |
87% |
87% |
Coal power plant and connection to neighbouring states |
Wind |
Over 170% |
|
Scotland |
57.0% |
82% |
Gas power plants, hydro and import/ export from the rest of UK (exports 20.3 TWh, imports 1.5 TWh in 2022) |
Wind |
No – 85% in 2021 (98% in 2020) Mild weather affecting generation |
Renewable electricity in Scotland
In 2020, the generation of renewable electricity in Scotland was equivalent to 97.4% of its gross electricity consumption. However, as shown in Figure 3, fossil fuel generation accounted for 15.6% and nuclear for 16.9% of the total electricity consumption in Scotland.

Figure 3 Proportion of electricity consumption by fuel in Scotland 2022 [13]
Scotland also exchanges large quantities of electricity with England, Wales, and Northern Ireland, mainly exporting rather than importing. To achieve a reliable and resilient 100% renewable electricity system in Scotland will require a set of low-carbon solutions to fill the increasing gap of flexibility requirement when more renewables are set to connect but fossil fuel and nuclear generation are phased out.
Changes to electricity markets
The transition to a net zero energy system requires large-scale building of new power infrastructure. For example, upgraded and new transmission lines to meet increasing power demands; large onshore and offshore wind farms in remote areas; dispatchable power plants running on Hydrogen or fitted with carbon capture and storage (CCS) technology; and flexible technologies which can respond at different timescales to increasingly variability such as pumped hydro storage.
The need for reform is exemplified by curtailment costs in the UK doubling in just one year, from £145 million in 2019 to £282 million 2020 [14]. Well-designed electricity markets should efficiently incentivise capacity investment as well as dispatch of generation and network assets to facilitate the net zero transition.
Significant reforms of electricity markets in the UK are required to enable the transition to a net zero energy system at low cost while ensuring security of supply. Potential changes to electricity market arrangements were outlined in a consultation document on potential reforms published by BEIS in July 2022, ‘Review of electricity market arrangements’, referred to as REMA [15]. The aim of REMA is to establish the electricity market reform necessary for a fully decarbonised electricity system by 2035, which supports the transition to an economy-wide net zero energy system by 2050. The reforms are intended to form the final critical step towards supporting the net zero transition.
The main approaches outlined in REMA are reforming to a net zero wholesale market; markets suited to the roll out of mass low-carbon power; incentivising investment in flexibility technologies such as by introducing locational pricing; ensuring capacity adequacy; and reforming ancillary services which enable operability. There is significant debate around the advantages and disadvantages of these potential reform measures. These approaches and potential impacts on the Scottish electricity system are outlined below. More background information on these reforms can be found in Appendix 12.6.
Technology development in Scotland to 2045
Scotland pathway using FES22
We use National Grid’s FES [3] as the baseline for technology development in Scotland to 2045. Based on FES pathways, we extracted and scrutinised data specifically for Scotland. FES is external to the Scottish Government and takes a UK-wide approach and may not necessarily be consistent with Scotland’s annual emission targets. However, it has a high level of detail including a regional breakdown which means that Scotland specific data can be extracted. We modelled metrics that provide a measure of security of supply and investigate this with an extended set of stress tests applied.
Four scenarios are presented in FES with three pathways meeting net zero targets and one pathway that falls short (see Appendix 12.7). This report uses the System Transformation scenario as the baseline for installed firm generation capacity, installed VRE generation capacity, peak demand, installed storage capacity, network connection to England and Wales and interconnectors to Northern Ireland and Norway. The System Transmission scenario was chosen because it represents a middle-ground in terms of the expansion of technologies compared to the Leading the Way and Falling Short scenarios. It is recognised that the System Transformation scenario is not aligned with Scottish Government policy with a high usage of hydrogen for heating. The following modifications were made to the System Transformation scenario:
- Offshore wind installed capacity by 2030 was changed from 7,000MW to 9,500 MW in line with Scottish Government targets.
- Interconnector capacity was extended from solely the 500 MW Moyle interconnector to this plus 700 MW interconnection to Norway (1200 MW overall) from 2035 which is in line with the Consumer Transformation scenario.
We used the PyPSA-GB model of the electrical power system for modelling FES data and for calculating power flow, see [16] and Appendix 12.9 for more details. Data is included for the years 2021, 2030, 2035, 2040, and 2045.
Installed firm generation
Figure 4 shows the installed firm generation capacity in Scotland for the System Transformation scenario.
- The last remaining nuclear power station in Scotland, Torness, closes in 2028.
- The existing Peterhead Combined Cycle Gas Turbine (CCGT) power plant is assumed to close in 2026 and open as Peterhead 2 with reduced capacity (1,200 MW CCGT to 910 MW CCGT + CCS) in 2027. The CCS Gas generation capacity is then doubled between 2040 and 2045 to 1,800 MW.
- Hydrogen powered generation capacity is also added with 690 MW by 2040 and 1,924 MW by 2045.
- Hydro power plants see moderate increases out to 2045.
- Significant increases in biomass generation capacity to around 1,900 MW in 2045.


Figure 4 Installed firm generation capacity (GW) in Scotland under the System Transformation scenario
Installed variable renewable generation
 Figure 5 shows the installed VRE generation capacity in Scotland for the System Transformation scenario.
Figure 5 Installed VRE generation capacity (GW) in Scotland under the System Transformation scenario. Offshore wind in 2030 has been changed to 9.5 GW to reflect Scottish Government ambitions of 8-11 GW
- Solar Photovoltaics capacity consistently grows from 462 MW in 2021 to almost 4,000 MW in 2045.
- Wind offshore is projected to grow from 1,700 MW in 2021 to 33,900 MW in 2045. The Scottish Government ambitions for 8,000-11,000 MW of offshore wind capacity by 2030 is not met in the System Transformation scenario. We modified the scenario to meet this target by inserting an installed capacity of 9,500 MW for offshore wind by 2030, in order to test the system under the conditions that this target is achieved.
- Wind onshore is projected to grow from 8,900 MW in 2021 to 23,900 MW in 2045.
Installed storage capacity

Figure 6 Installed storage capacity in Scotland under the System Transformation scenario.
- Pumped storage hydroelectric installed capacity forms the majority of installed storage capacity in Scotland in 2021. It is projected to rise to above 2,000 MW by 2040. There are several potential pumped storage projects in the pipeline: Coire Glas 1,500 MW [17], Red John 450 MW [18], and Corrievarkie 600 MW [19].
- Battery storage is projected to increase substantially from 124 MW in 2021 to 1,800 MW in 2030, followed by more modest growth to 2,100 MW by 2045.
- Compressed air energy storage (CAES) and liquid air energy storage (LAES) are also projected to have increasing capacity from 0.9 MW of CAES and 1.4 MW of LAES in 2021 to 1,100 MW of CAES and 553 MW of LAES in 2045.
The timescale of usage of these electrical storage types is constrained by the time it takes for each technology to fully discharge at full power. Batteries in FES are assumed to be suited to intra-day charging/discharging cycles. Pumped storage, CAES, and LAES are assumed to be capable of charging or discharging at maximum output for a longer period of time. These storage types are suited to system balancing on seconds, hours, and days timescales but these, bar pumped storage, are unlikely to be used for long-duration storage where balancing is required on weeks and months timescales due to a prolonged period of low VRE output. The FES scenarios mainly rely on hydrogen as a storage medium for these longer timescales.
Peak demand
Figure 7 shows the projected peak electricity demand in Scotland under the System Transformation scenario. There is a steady increase in peak demand from 4,600 MW[7] in 2021 to 8,700 MW in 2045.

Figure 7 Peak electrical demand during GB-wide average cold spell in Scotland under the System Transformation scenario.
The System Transformation scenario assumes that most heating is met by Hydrogen[8] (see Appendix 12.8), which results in a lower peak demand than in Consumer Transformation (heating is primarily electrified). The Consumer Transformation peak electricity demand for Scotland in 2045 is 11,300 MW due to most heating being met by electrification through heat pumps. This peak is 2,600 MW higher than the System Transformation assumption.
The peak demand shown here does not include electrical demand from electrolysers producing hydrogen. FES analysis assumes that electrolysers can be turned off during peak demand, and therefore, do not need to be included in calculations for security of supply metrics. However, our analysis does include this demand for power flow analysis and import and export calculations.
Transfer capability and interconnectors
The only interconnector from Scotland to outside GB is currently the Moyle interconnector to Northern Ireland. The Moyle interconnector was limited in transfer capability to 160 MW in 2021, but from 2022 has increased to its full capacity of 500 MW. We used the Consumer Transformation projections for interconnection expansion which includes a 700 MW connection to Norway by 2035 in addition to the 500 MW Moyle interconnector. This modification was made to ensure the baseline includes a higher interconnection for Scotland, and then a stress test on the unavailability of interconnectors could explore the impact on security of supply of no connection with Northern Ireland and Norway.
Transfer capability across the B6 boundary is projected to increase about four-fold from 6,100 MW in 2021 to 24,700 MW in 2040 for the System Transformation scenario. This increase is to enable power flow from the increased wind generation in Scotland to the rest of GB. Power flow to Scotland will be lower than from Scotland, so does not affect the transfer capability requirements. This scenario projection is substantially higher than increases in the Network Options Assessment (NOA) due to higher projections for installed capacity of renewable generation in Scotland. National Grid’s Electricity Ten Year Statement [7] includes more details on the future boundary transfer capability requirements for the B6 boundary which connects Scotland’s transmission network to the rest of GB.
Measuring security of supply
This report focuses on capacity adequacy as a measure of security of supply, which ensures that we always have enough energy to meet our needs. National Grid ESO publish capacity adequacy analysis for the GB system, often in its winter outlooks and FES reports. Given the scope of this work, a similar standard approach is used, with a focus on the Scotland system. The interaction with the rest of the GB system is modelled as flow across the boundaries.
The GB standard for generation adequacy uses the Loss of Load Expectation (LOLE) as the indicator of supply reliability, complemented by other relevant risk metrics which are detailed in Appendix 12.10. LOLE is defined as the expected number of hours over a period in which supply resources are insufficient to meet demand. It provides a measure of security of supply over a statistically long-term period, such as a year. The current reliability standard for LOLE in GB is set to no more than three hours in a year.
De-rated system margin is used as a proxy for risk of loss of supply. It is more useful as a measure of security of supply than installed capacity, as it accounts for the probability of a forced outage.
Security of supply metrics for System Transformation
De-rated system margin
An overview of the forecasted de-rated margin for Scottish system in the System Transformation scenario is shown in Figure 8. While peak demand sees steady growth, it is exceeded by the increase in available firm capacity (including the equivalent firm capacity of VRE) that can serve peak demand with high probability.

Figure 8 of de-rated supply capacity, peak demand and supply margin of Scotland for System Transformation from 2025 – 2045
The de-rated system margin increases from 2,200 MW in 2025 up to 12,200 MW in 2045. The capacity of wind shown in Figure 8 are de-rated using equivalent firm capacity factors (ranging between 13-17% in recent NG reports [20] [21] [22]). This represents the wind generators contribution to security of supply at stress events. Due to the significant amount of onshore and offshore wind added into the system, from 2035 onwards the de-rated wind capacity alone is higher than the peak demand. This ensures a very high level of de-rated system margin.
The GB supply margin under System Transformation can be found in Appendix 12.11.
Loss of load expectation

Figure 9 LOLE results for System Transformation in Scotland from 2021 – 2045
In line with the high de-rated system margin the calculated LOLE of Scotland’s electrical system stays at a very low level for the System Transformation scenario in all modelled years. The lower the LOLE number, the lower the risk of insufficient generation to meet demand. From our results, the LOLE increases marginally from 0.020 hours per year in 2025 to 0.023 in 2030. The increase is due to the anticipated closure of nuclear power stations over the 5-year period. This is still significantly below the 3 hours currently allowed in the GB reliability standard. The rise in LOLE between 2025 and 2030 could be higher but the addition of 7,870 MW wind capacity during this period helps to mitigate the effects of phasing out nuclear generation.
LOLE values from 2035 onwards are less than 0.0001, and so low that statistically the loss of load can be considered highly unlikely. This very low LOLE from 2035 is attributed to the significant influx of new electricity generation of various types in the Scottish system in the System Transformation scenario, e.g., Scotland’s wind capacity is projected to increase by over 25,000 MW, reaching 49,400 MW in 2035[9], the largest increase over a 5-year period in the scenario. Even with an Equivalent Firm Capacity (EPC) factor of 16.1%, wind energy alone is enough to provide reliable generation equivalent to 8,400 MW, enough to meet Scotland’s peak demand of 6,000 MW in 2035. The addition of biomass, Hydrogen, and pumped storage capacity from 1,223 MW in 2035 to 4,648 MW in 2040 significantly increases the dispatchable electricity sources in Scotland. This also exceeds the Scottish demand growth (1,500 MW) during that period, further enhancing supply security.
In practice, the actual target LOLE for the GB system operator has been less than 3 hours. The LOLE reported in National Grid’s Winter Outlook in 2021 and 2022 was 0.3 and 0.2 hrs/year for the GB system. The Scottish electrical system is modelled to have a lower LOLE than the GB system. In 2021 the Scottish LOLE was modelled as 0.108 hrs/year and this is expected to further decrease in the future.
Power dispatch
Power dispatch is the cost-optimised mechanism by which power needs and demands are balanced. Power dispatch modelling can be used to illustrate security of supply by demonstrating how generation and storage are being used to meet demand. Power dispatch modelling outputs are for the same 2-day peak period in 2045[10]. Interconnectors are included in the power flow calculation but excluded from modelled output figures to provide focus on the role of generators and storage.
Figure 10 shows the power dispatch of the Scottish electricity system for generation, storage, and export at the B6 boundary (where Scotland connects with the rest of GB) for the System Transformation scenario. Offshore and onshore wind power dominate generation, and there are large power export flows across the B6 boundary to the rest of GB. Storage technologies and biomass are dispatched, while exports continue to the rest of GB, during this high demand period. The equivalent power dispatch at the same peak period for GB[11] can be found in Appendix 12.11.

Figure 10 Power dispatch of Scotland for System Transformation in 2045 over 2-day peak period.
Imports and exports
Scotland supports the overall GB system with net exports of power across the B6 boundary. Figure 11 and Figure 12 show the monthly import (from rest of GB to Scotland) and exports (from Scotland to rest of GB) across the B6 boundary. Outputs were obtained by running the model with historical data for 2021 and the System Transformation scenario for 2045. Scotland is a net exporter to the rest of GB and exports will increase in future[12]. There will also be an increase in the level of import from the rest of GB to Scotland which could be due to increased demand coupled with increased reliance on intermittent power generation. The level of import and export have a seasonal pattern, with higher imports in the summer and higher exports in the winter. This is due to higher wind generation and demand in winter than in summer which results in more opportunities to export to the rest of GB.

Figure 11 B6 monthly import in 2021 and 2045 under the System Transformation scenario

Figure 12 B6 monthly export in 2021 and 2045 under the System Transformation scenario
Stress testing Scotland’s security of supply
Our modelling has shown that Scotland’s electricity system has a low probability of being unable to meet demand in the modelled years. However, the assumptions are based on a particular set of conditions and do not account for the full range of possible situations. Stress tests were used to test the security of supply of the Scottish electricity system beyond the original scenario conditions (Figure 13).
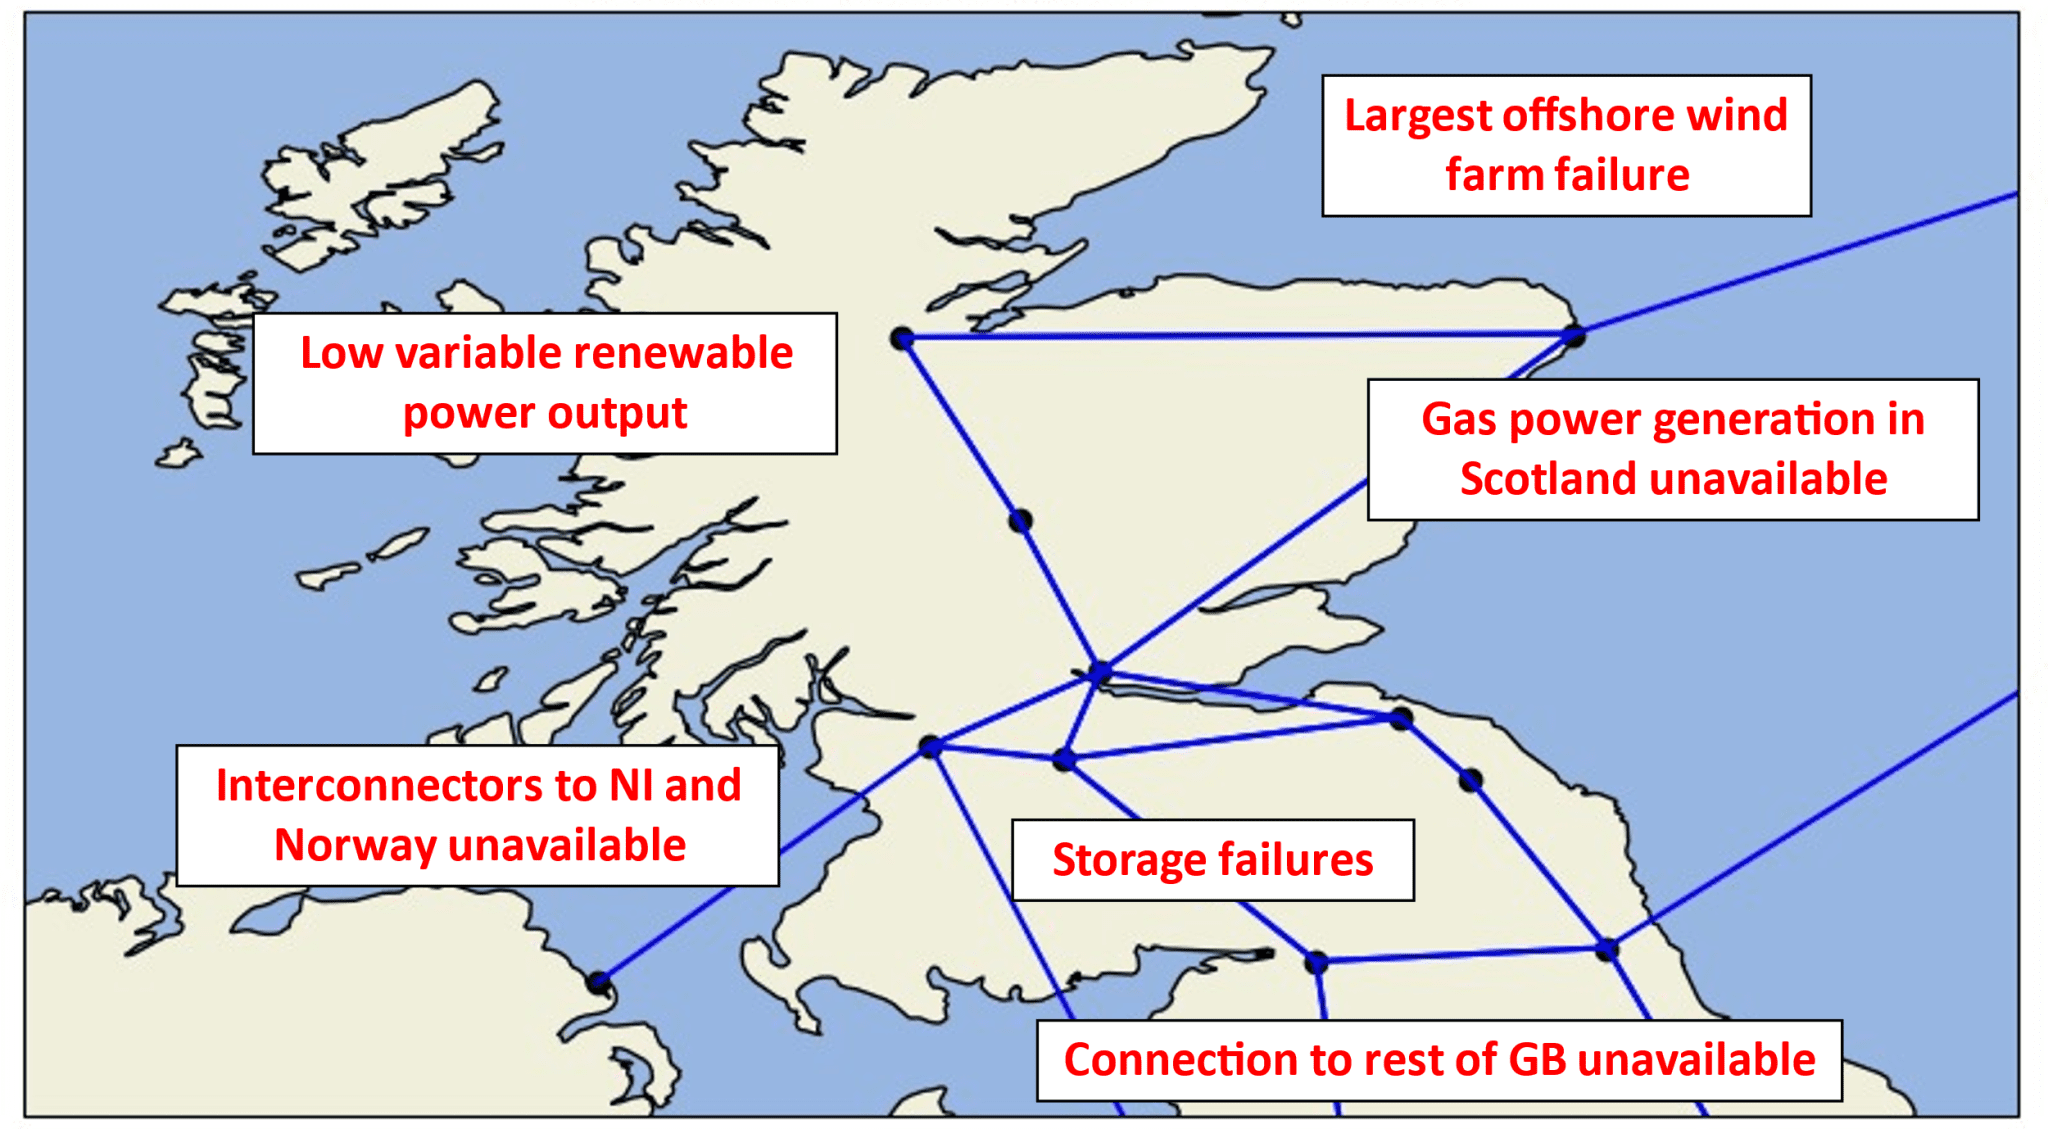
Figure 13 Network map of Scotland and stress tests scenarios
These are summarised relative to the System Transformation scenario base case in Table 3.
Table 3 Summary of assumptions used in stress testing scenarios
|
Scenario |
Description |
|
Base case |
The System Transformation scenario. |
|
Offshore wind farm failures |
Removes the contribution from offshore wind farms in Scotland with a worst-case assumption of 21,000 MW loss. |
|
Low VRES power output |
The contribution of VRE generators (onshore and offshore wind, PV, and hydro) in Scotland is limited to 20% of their potential outputs. |
|
Gas power generation in Scotland unavailable |
The generation capacity of CCGT, including CCS, in Scotland are set to zero. |
|
Interconnectors to NI and Norway unavailable |
Interconnector failure including both Scottish links to Norway and Northern Ireland. |
|
Storage failures |
The installed capacity of batteries in Scotland are set to zero. |
|
Connection to rest of GB unavailable |
The connection of Scotland to rest of GB across the B6 boundary is unavailable. |
We investigate the power flow for each of the stress tests and the security of supply metrics up to 2045. We also analyse the impact on imports and exports from/to Scotland. All stress tests are applied for 3 days either side of peak demand. All the stress events are applied to the base case independently, and are assumed to last the whole week in which the peak demand occurs.
Security of supply for the stress tests
Full outputs from stress tests can be found in Appendix 12.12. Figure 14 summarises the LOLE for all the stress test cases. During peak demand periods, the impact of unavailability of supply are higher than other times of the year. The LOLE for all stress tests is within the three hours/year reliability standard, and are below the modelled 2021 Scottish LOLE of 0.108 hrs/year, except for B6 failure in 2025 and 2030 and interconnector failure in 2030. The system from 2035 onwards is very secure with a low LOLE.
In 2025 and 2030 the stress test of disconnection with the rest of GB has the highest impact on the security of supply as measured by LOLE, followed by unavailable interconnectors and gas supply issues. This implies that the reliance of import from the rest of GB in maintaining the capacity adequacy in Scotland is more than the other supply types. However, its significance becomes negligible from 2035 due to a large increase in offshore wind capacity in the Scottish system and additional capacity from battery storage, pumped hydro, Hydrogen power plant, and biomass in subsequent years.

(a)
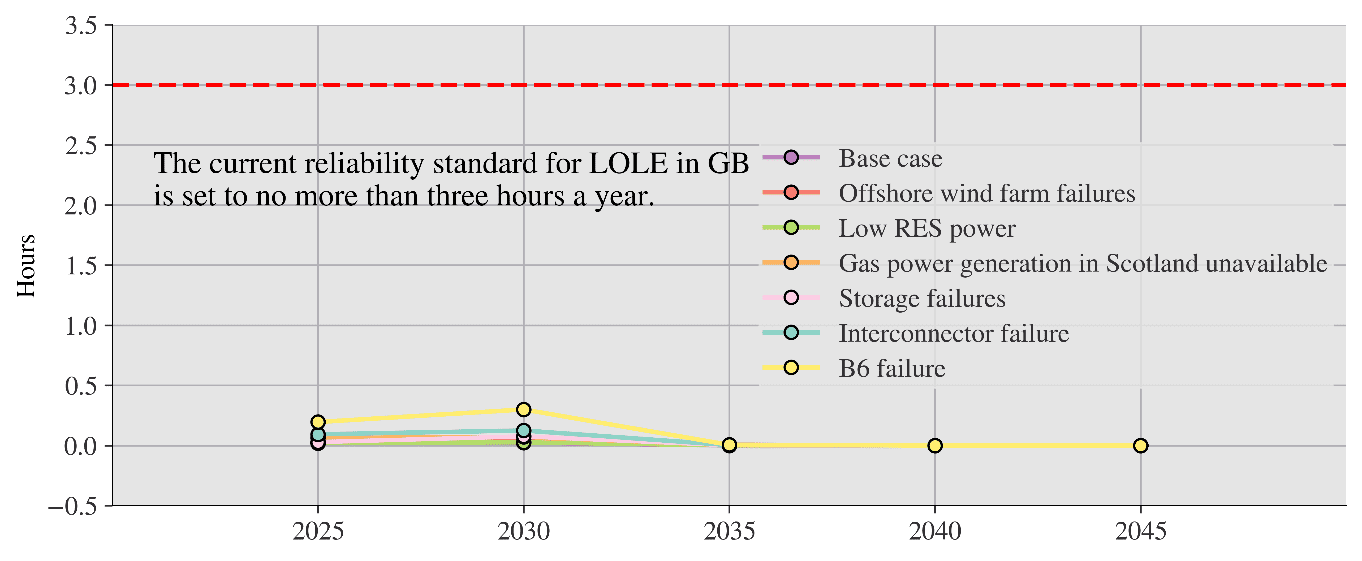
(b)
Figure 14 (a) LOLE for Scotland in the stress test cases (2025–2045); (b) GB 3h/yr limit added for comparison
Import and export for the stress tests
The stress tests have impacts on the imports and exports across the B6 boundary between Scotland and the rest of GB. Countries in Europe increasingly exchange power with each other, particularly to share cheap abundant electricity, as has been the case historically with France exporting nuclear power to central Europe and Denmark exporting wind power to Norway who can store this in their large pumped hydro schemes. Scotland shares an electricity market with the rest of GB but imports and exports are a useful measure of the dependence on the power exchange across the B6 boundary.
Figure 15 shows for each stress test the total import and export across the B6 boundary over the 6-day period the stress tests are applied, including the peak GB demand period in the middle of the 6 days. The base case in 2045 sees increases in imports due to closure of Torness nuclear power plant and reduced capacity of Peterhead.

Figure 15 Import and export for the stress tests across the B6 boundary
The stress tests for offshore wind farm failures, gas power generation in Scotland unavailability, battery failures, and interconnector issues result in increased imports into Scotland. The low VRES output stress test sees Scotland become a net importer over the 6-day period modelled. The following findings are identified:
- Offshore wind farm failures reduce total wind generation over the period resulting in higher imports and lower exports.
- The low VRES period reduces total wind generation by a greater degree than the offshore wind farm failure meaning that there are more imports than exports.
- Gas supply issues reduce the capability of Scotland to provide firm generation over the 6-day period, resulting in more periods where imports from the rest of GB are required, typically when there is low wind generation. This has minimal impact on imports and exports during the modelled period.
- Battery failure decreases the ability of the system to store excess renewable power generation to be utilised later during low VRES periods. This has minimal impact on imports and exports during the modelled period.
- Interconnector issues reduces exports of excess wind generation to Norway or Northern Ireland, at the same time as reducing imports from these countries to meet demand when there are higher electricity prices in Scotland. The result is slightly increased imports, and increased exports which are exported to the rest of GB rather than to Norway or NI.
Overall, the low VRES output period has the largest impact on imports and exports from/to Scotland, followed by the offshore wind farm failures. This highlights the importance of wind power generation in the future Scotland electricity system. Interconnectors to NI and Norway have the next biggest impact, but this will likely be more impactful under other FES scenarios which see larger increases in interconnector capacity. The battery failure and gas supply issues have minimal impact on the imports and exports in the modelled period.
Self-sufficient Scotland
In this section we assess the impacts of Scotland having an entirely self-sufficient future electrical system. We modified our original model (Table 3) to consider Scotland as an isolated electrical network in the self-sufficient base case. All interconnections to Northern Ireland and Norway and all transmission links to the rest of GB across B6 were removed. After calculating the LOLE in this new base case, we conducted a stress test. We also stress test with low VRES power[13] and examine the additional capacity required to reduce LOLE to the 3-hour GB reliability standard.

Figure 16 LOLE of self-sufficient Scotland system in base case, low renewable output stress case and with additional firm capacities
The changes in level of capacity adequacy for a self-sufficient Scotland is given in Figure 16. Violation of the 3 hours GB standard occurs in the base case in the years 2025 and 2030, but the LOLE is less than 0.18 hours in 2035 and decreases in the following years. Figure 16 also shows the additional firm capacity needed to reduce the LOLE in 2030 to within the minimum required 3 hours, and to a more conservative range, for example, the 0.3 hours reported in the 2022 Winter Outlook[14].
To achieve LOLE of 3 or 0.3 hours an additional 250 MW or 1000 MW equivalent firm capacity is needed respectively. Several alternative supply types can each provide an equivalent (de-rated) 250 MW of additional firm capacity:
- 274 MW installed capacity of CCGT with CSS.
- 380 MW battery storage 3 hours storage duration of 1140 MWh.
- 1,553 MW of installed capacity of offshore wind.
For 1000 MW additional firm capacity:
- 1,095 MW installed capacity of CCGT with CCS.
- 1,510 MW battery storage with 3 hours storage duration of 4,530 MWh.
- 6,211 MW of installed capacity of offshore wind.
The increase in offshore wind capacity in the base case is much higher than the additional installed capacity of wind required above. Therefore, as shown in Figure 17, the LOLE in 2035 is well within the acceptable range.
In a self-sufficient Scotland the share of wind in the total supply mix becomes more significant. Under the low VRES power output stress test, the LOLE increases to 6.8 hours in 2025 and 5.6 in 2030 but decreases to 0.32 hours in 2035 and reduces further in 2040 and 2045. The low LOLE in 2035 is due to a 25,000 MW increase in installed wind capacity from 2030.
Even after scaling down to 20% of VRES potential power output, there is still enough contribution from wind generation to serve the peak demand. Increases in biomass, hydrogen, and pumped storage capacity in 2040 and 2050 make non-variable supply alone sufficient to meet peak demand, further reducing the LOLE in the later years under the low VRES stress case. With 400 MW additional firm capacity can bring the LOLE to within 3 hours in 2025 and 2030. This is 150 MW more than is needed in the self-sufficient base case.
Black start capability
Removing interconnections and links to England may result in the loss of access to generators that are capable of providing black start. However, it does not necessarily imply that the black start capacity in Scotland is insufficient. The System Transformation scenario projects a significant increase in the capacity of hydro, battery storage, and pump-hydro storage in Scotland, which offer good black start capabilities. These sources have a combined capacity of 4,368 MW in 2030, which will increase to 6,023 MW in 2045, accounting for more than half of peak demand. Whether these assets are sufficient for black start depends on conducting simulations or tests of the system under various scenarios. It is also crucial to regularly review and update the black start procedures to ensure that they remain effective and relevant.
Low capacity and high demand scenario
We further tested the system, modifying the base case (System Transformation) scenario by removing future thermal power plants (i.e., hydrogen, gas and biomass CCS); using the more conservative ETYS21 [7] assumptions on B6 boundary expansion; and increasing peak demand to those in the Consumer Transformation Scenario. Table 4 shows the resulting modifications to the base case (see Appendix 12.18 for full dataset). We then show results for the de-rated system margin, LOLE, stress tests, and imports and exports.
Table 4 Modifications to System Transformation Base Case for the low capacity and high demand scenario
(Base Case capacities in brackets)
|
Installed capacity (MW) |
2021 |
2030 |
2035 |
2040 |
2045 |
|
Gas (including CCS) |
1,238 |
0 (969) |
0 (969) |
0 (910) |
0 (1,810) |
|
Biomass |
208 |
251 |
230 |
230 (1,946) |
230 (1,894) |
|
Hydrogen |
0 |
0 (43) |
0 (43) |
0 (690) |
0 (1,924) |
|
B6 connection |
6,100 |
11,500 (17,604) |
16,900 (22,238) |
16,900 (24,662) |
16,900 (24,662) |
|
Peak demand in Scotland |
4,600 |
5,900 (5,200) |
8,000 (6,000) |
10,200 (7,500) |
11,300 (8,700) |
De-rated system margin
In the low capacity and high demand scenario, the de-rated system margin increases from 1,400 MW in 2025 to 4,500 MW in 2045, with a decrease in 2030 due to the assumed closure of all gas and nuclear generation in Scotland between 2025 and 2030. In the base case scenario, the gas CCS generation would have provided an additional de-rated capacity of approximately 1,600 MW in 2045.
The de-rated margin as a percentage of peak demand under the low capacity and high demand scenario between 2025 and 2045 is on average 32%. This is lower than the average 90% under the original base case scenario.

Figure 17 Installed firm generation capacity (GW) in Scotland under the low capacity and high demand scenario.
Loss of load expectation

Figure 18 LOLE results for low capacity and high demand scenario in Scotland from 2021 – 2045. GB Reliability standard 3hrs/y
The LOLE of the low capacity and high demand scenario, as illustrated in Figure 18, is considerably higher than the base case scenario (Figure 9) in all future years.
The year 2030 shows a significant increase in LOLE due to the closure of all gas and nuclear power stations, resulting in a LOLE of 6.3 hours/year which is higher than the GB reliability standard of 3 hours/year. Potential options for addressing this include keeping gas generation running for additional years while waiting for further renewable generation deployment or incentivising the development of additional storage and renewable generation before 2030.
By 2035 the subsequent strong growth of renewable generation capacity brings the LOLE back below the GB reliability standard. This is particularly due to an additional offshore capacity of approximately 17,300 MW from 2030 to 2035. As wind generation and storage capacity continue to increase, LOLE drops further from 2 hours in 2035 to 1.2 hours in 2045.
The lowest LOLE in the low capacity and high demand scenario is 1.2 hours/year in 2045, while in the original base case scenario, it is 0.0001 hours/year. This difference can be attributed to the exclusion of natural gas, hydrogen, and biomass, as well as higher demand. LOLE after 2030 in the low capacity and high demand scenario is relatively high compared to historical Scottish LOLE, such as 0.108 hrs/year in 2021. While this shows an increased risk of interruption to supply, it does not necessarily imply that such a shortage event will occur as it is still below the GB reliability standard.
Security of supply for the stress tests

Figure 19 LOLE for Scotland in the stress test cases under the low capacity and high demand scenario (2025–2045). GB Reliability standard 3hrs/y. LOLE 0.108 hrs/y of 2021 Scottish system
Except for the year of 2030 and the case of B6 failure in 2030-2045, all stress tests are within the GB reliability standard of three hours per year, but still greatly exceed the historical Scottish and GB LOLE in 2021, as presented in Figure 19. The disconnection from the rest of the GB stress test as illustrated using the ‘B6 Failure’ case has the most significant impact on the security of supply as measured by LOLE, far more than other test cases. LOLE of the other stress test cases are not significantly different from each other, with the offshore wind farm failure test highest, followed by unavailable interconnectors. This suggests that maintaining capacity adequacy in Scotland is highly dependent on imports from the rest of GB in this scenario.
The role of the B6 connecting Scotland to the rest of GB is more significant for security of supply in the low capacity and high demand scenario compared to the base case (System Transformation) scenario. The import capacity capability to Scotland across the B6 boundary is the main supply source after the renewable generation capacity in Scotland. In contrast, in the base case scenario, there is considerable capacity of CCS gas, biomass, and hydrogen generation, along with the B6 import capability, which can contribute to the security of supply.
Imports and exports
Imports (from rest of GB to Scotland) are higher and exports (from Scotland to rest of GB) are lower for the low capacity and high demand scenario compared to the base case scenario. This trend is consistent to 2045, which is shown in Figure 20 for imports and Figure 21 for exports. Over the year both scenarios have net exports of power across the B6 boundary. These results are due to the decreased generation and B6 boundary transfer capacity, and further highlight the greater importance of the B6 boundary in the low capacity and high demand scenario for security of supply.
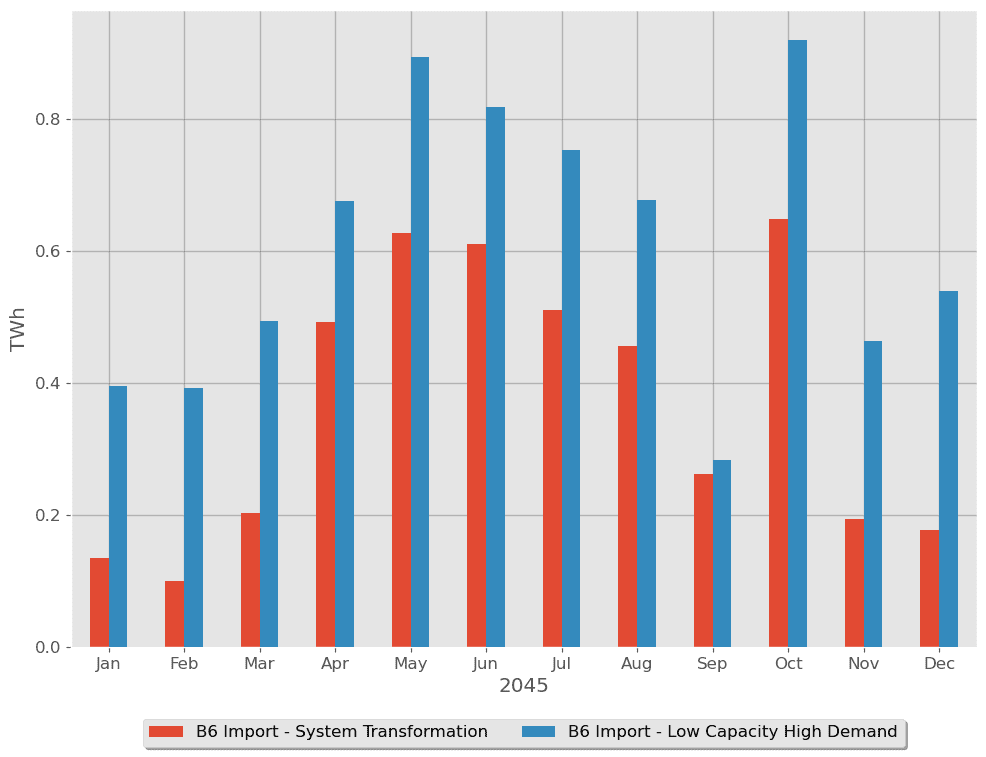
Figure 20 B6 monthly import in 2045 under the base case and low capacity and high demand scenario
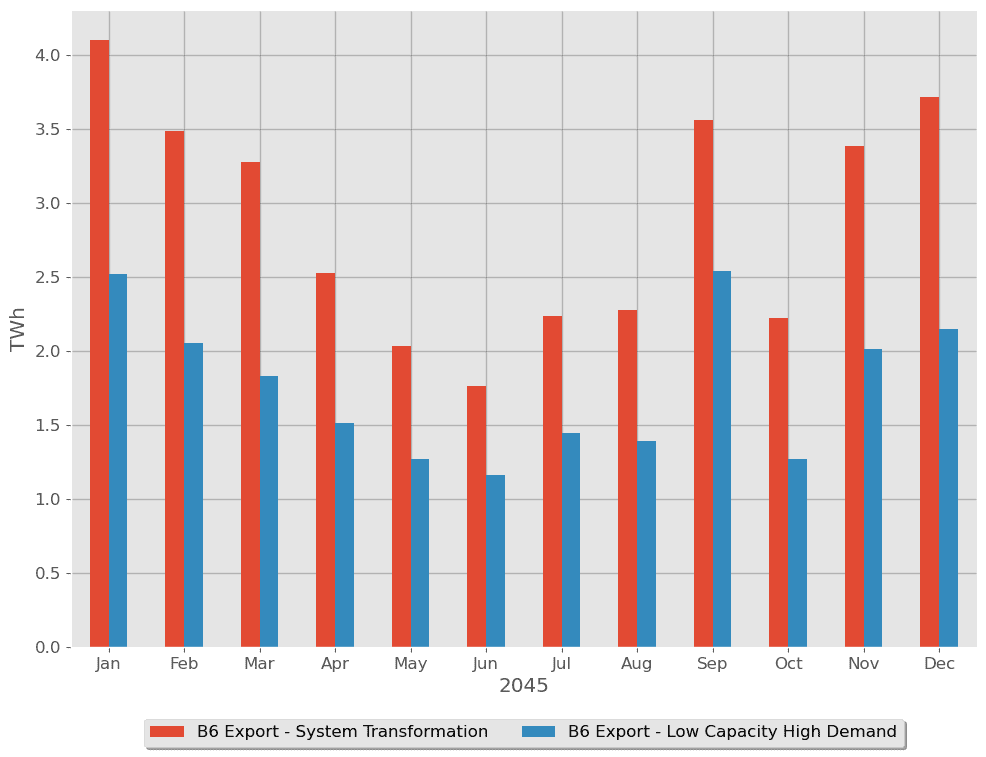 Figure 21 B6 monthly export in 2045 under the base case and low capacity and high demand scenario
Figure 22 shows the import and exports for the stress tests for the low capacity and high demand scenario. There is a reduced level of exports in these stress periods compared to the System Transformation base case, due to the lower generation capacity from hydrogen, gas CCS, and biomass. The greater reliance on VRES and the B6 boundary is highlighted by the high levels of import required for the low RES output stress test.
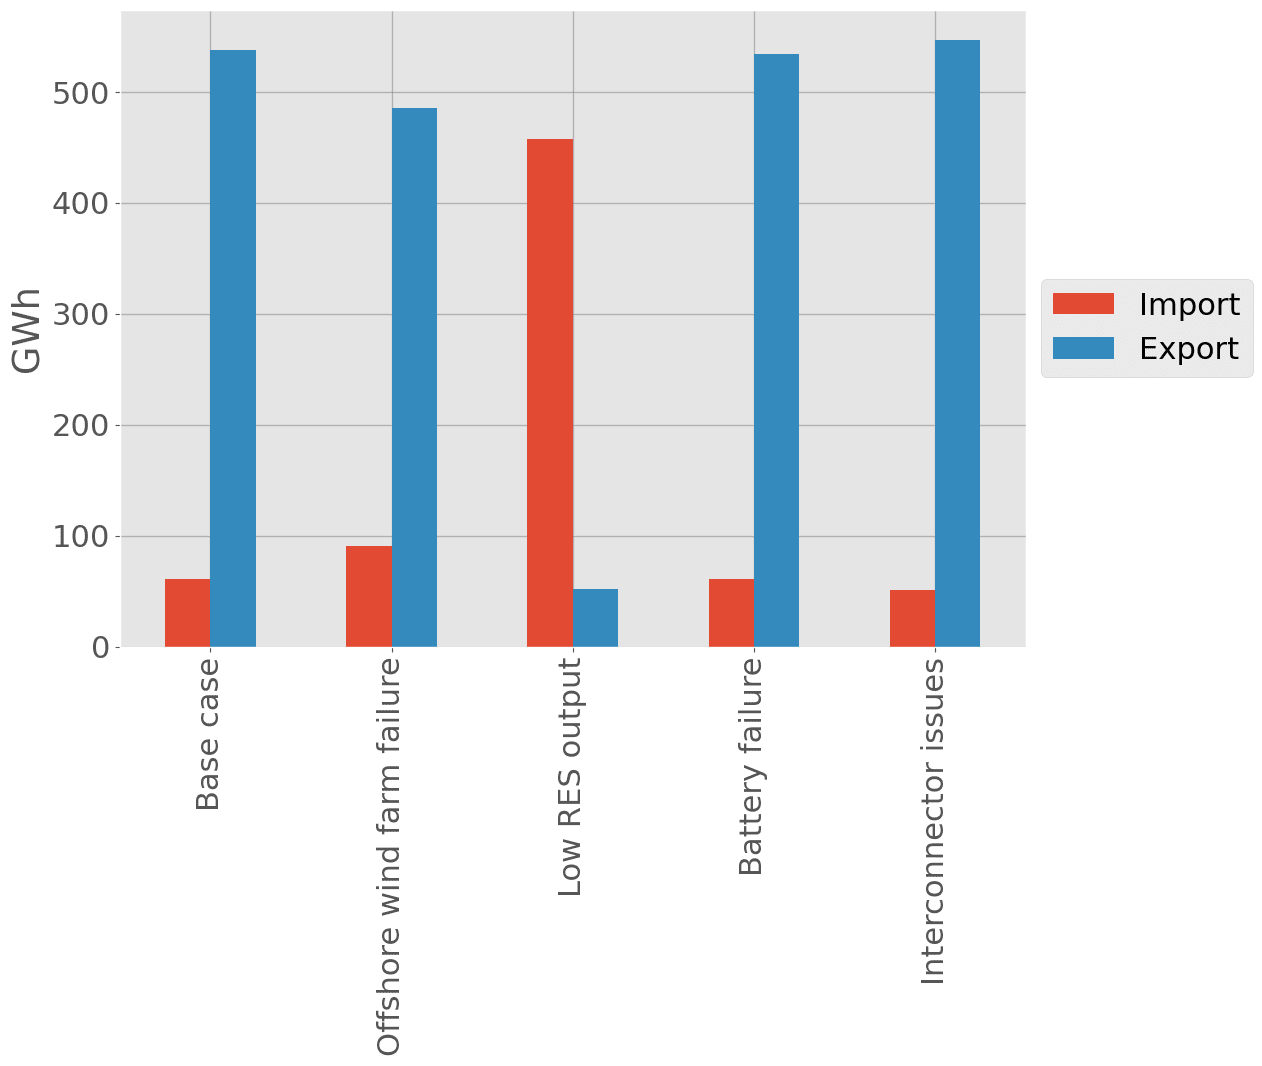
Figure 22 Import and exports in 2045 for 6-day period for stress tests in low capacity and high demand scenario
Conclusions
Lessons learned from national and regional electricity systems operating with close to 100% renewable energy sources:
- Several national and regional electricity systems operate at, or close to, 100% renewable electricity. However, these countries typically rely on dispatchable (non-VRE) renewable sources such as hydropower and storage reservoirs to generate and store electricity. These dispatchable renewable resources are only available at the required scale in a few countries. In Scotland, the most available renewable resource is wind, which is a variable source of energy.
- There are fewer examples of national electricity systems that operate with a high proportion of variable wind and solar energy shares. Denmark has the highest overall share of renewable electricity at 84%, with a high proportion from variable renewable sources and wind at 60% of total electricity production.
- Scotland has high wind generation, which makes up around 49% of total electricity generation, and relies on imports and exports with the rest of GB. It is most closely comparable to Denmark, which also makes extensive use of connection to neighbouring countries.
Changes to electricity market arrangements:
- Current GB electricity market arrangements are not suited to the net zero transition and potential reforms have been set out, which can enable a fully decarbonised electricity system by 2035. It is too early in the process to see a path for which reforms will be implemented and specify the impact they will have on security of supply.
- Splitting the wholesale market could improve the long-term sustainability of investing in renewable power in Scotland. However, it is possible that other reform proposals can provide the benefits outlined, and there could be a lack of additionality.
- Locational pricing might have the impact of depressing prices received by generators in Scotland as locational prices could be higher in England than in Scotland. Wind farms may require additional subsidy to be built in Scotland under locational pricing.
- A potential enhanced capacity market should take account of the issues specific to Scotland, while the Scottish Government should be an important stakeholder in strategic reserve decisions.
Technology pathway to net zero in Scotland in 2045:
- We have analysed the technology pathway according to the System Transformation scenario out to 2045 for Scotland. We found that security of supply metrics for Scotland in this scenario is well within the current GB reliability standards and comparable to current levels.
- There will be a reduction in traditional firm generation capacities (no nuclear and CCGT power plant generation capacity reduced when changing to CCS technology). However, these losses are offset by vast increases in wind and solar installed capacity, which can still provide security of supply, as well as increasing low-carbon firm generation capacity in the form of biomass, hydrogen and CCGT, with CCS power plants closer to 2045. Security of supply is further enhanced by the installation of battery, pumped hydro, liquid air and compressed air energy storage.
- Peak demand in Scotland is expected to rise to around 9,000 MW by 2045 but the de-rated system margin still increases from 2,200 MW in 2025 up to 12,200 MW in 2045, which shows there is sufficient firm generation. This was further verified by power dispatch simulation.
- The future Scottish electricity system has security of supply under the System Transformation scenario, but this cannot be directly assumed for the rest of GB supply and demand will likely continue to be balanced at GB-level by National Grid as the energy system operator. Therefore, while the generation capacity in Scotland may seem excessive in the context of security of supply, it will be utilised to decarbonise the rest of GB’s electrical system.
- We have further tested the future Scottish electricity system by modifying the System Transformation scenario: removing future thermal power plants; using more conservative B6 boundary expansion assumptions; and increasing peak demand. In this low capacity and high demand scenario security of supply in 2030 is worse (LOLE of 6.3 hours/year) than the GB reliability standard (LOLE of 3 hours/year).
- Beyond 2030 security of supply increases in the low capacity and high demand scenario but is relatively high compared to historical Scottish security of supply.
- Except for the year of 2030 and B6 failure in 2030-2045, all stress tests are within the GB reliability standard of three hours per year, but still greatly exceed the historical Scottish and GB security of supply in 2021.
Imports and exports between Scotland and the rest of GB:
- The System Transformation scenario requires a four-fold increase in transfer capability between Scotland and the rest of GB, from 6,100 MW in 2021 to 24,700 MW in 2045.
- Scotland will continue to be a net exporter to the rest of GB, and both total and net exports will increase. There are periods when Scotland will import only because it is economic to do so, rather than due to lack of local supply. There will be an increase in the level of import from the rest of GB due to increased demand coupled with the increased reliance on wind power generation.
- A period of low wind and solar generation has the largest impact on imports and exports from/to Scotland, followed by offshore wind farm failures. This highlights the importance of wind power generation in the future Scotland electricity system.
- Problems with interconnectors to Northern Ireland and Norway have the next biggest impact, but this will likely be more impactful if we see larger increases in interconnector capacity. Battery failure and gas supply issues have minimal impact on the imports and exports in the modelled period.
- Imports from rest of GB to Scotland are higher and exports from Scotland to rest of GB are lower for the low capacity and high demand scenario than for the System Transformation scenario. High levels of import are required for the low RES output stress test, illustrating the greater reliance on VRES and the B6 boundary in this scenario.
A self-sufficient Scotland:
- A self-sufficient Scotland with no connection to the rest of GB and no interconnector capacity to Northern Ireland or Norway was found to violate the 3 hours GB reliability standard in the years 2025 and 2030. However, by 2035 the reliability is within historical values and decreases in the following years.
- We find 250 MW and 1000 MW of additional equivalent firm capacity is needed in 2025 and 2030 to meet the reliability standard of 3 hours or recent values of 0.3 hours respectively. This can be achieved with the addition of 1,553 MW (to meet 3 hours) and 6,211 MW (to meet 0.3 hour) of installed capacity of offshore wind.
- The projected system beyond 2040 can meet reliability standards even after scaling down wind and solar generation to 20% of its potential output around the peak demand period. 400 MW additional equivalent firm capacity can bring the reliability standard to within 3 hours in 2025 and 2030, which is only 150 MW more than is needed in the self-sufficient System Transformation base case.
References
|
[1] |
Scottish Parliament, “Climate Change (Scotland) Act,” 2009 (Amended 2019). [Online]. Available: https://www.legislation.gov.uk/asp/2009/12. [Accessed February 2023]. |
|
[2] |
“Offshore wind policy statement,” 2020. [Online]. Available: https://www.gov.scot/publications/offshore-wind-policy-statement/. |
|
[3] |
National Grid ESO, “Future Energy Scenarios (FES 2022),” 2022. [Online]. Available: https://www.nationalgrideso.com/future-energy/future-energy-scenarios. |
|
[4] |
“Climate Change Plan update 2020,” [Online]. Available: https://www.gov.scot/publications/securing-green-recovery-path-net-zero-update-climate-change-plan-20182032/. |
|
[5] |
“ScottishPower completes black start project using 69-MW wind farm,” 2020. [Online]. Available: https://renewablesnow.com/news/scottishpower-completes-black-start-project-using-69-mw-wind-farm-719904/. |
|
[6] |
National Grid ESO, “Black Start from Non‑Traditional Generation Technologies,” [Online]. Available: https://www.nationalgrideso.com/document/148201/download. |
|
[7] |
National Grid ESO, “Electricity Ten Year Statement,” 2021. [Online]. Available: https://www.nationalgrideso.com/research-publications/etys. |
|
[8] |
P. Denholm and D. J. Arent, “The challenges of achieving a 100% renewable electricity system in the United States,” Joule, vol. 5, no. 6, 2021. |
|
[9] |
B. Kroposki and B. Johnson, “Achieving a 100% Renewable Grid: Operating Electric Power Systems with Extremely High Levels of Variable Renewable Energy,” IEEE Power and Energy Magazine, vol. 15, no. 2, pp. 61-73, 2017. |
|
[10] |
T. Mai, P. Denholm, P. Brown and W. Cole, “Getting to 100%: Six strategies for the challenging last 10%,” Joule, vol. 9, p. 6, 2022. |
|
[11] |
W. Zappa, M. Junginger and M. van den Broek, “Is a 100% renewable European power system feasible by 2050?,” Applied Energy, no. 233-234, 2019. |
|
[12] |
D. Bogdanov, J. Farfan and K. Sadovskaia, “Radical transformation pathway towards sustainable electricity via evolutionary steps,” Nature Communications, 2019. |
|
[13] |
“Energy Statistics for Scotland Q1 2021 Figures,” [Online]. Available: https://www.gov.scot/binaries/content/documents/govscot/publications/statistics/2018/10/quarterly-energy-statistics-bulletins/documents/energy-statistics-summary—june-2021/energy-statistics-summary—june-2021/govscot%3Adocument/Scotland%2BEnergy%2BStat. |
|
[14] |
“Q4 2020: Record Wind Output And Curtailment,” [Online]. Available: https://reports.electricinsights.co.uk/q4-2020/record-wind-output-and-curtailment/#:~:text=3.8%20TWh%20of%20electricity%20was,power%20every%20home%20in%20Wales.&text=Between%202015%20and%202019%2C%20curtailment,around%20%C2%A310%20per%20household.. |
|
[15] |
BEIS, “Review of electricity market arrangements,” [Online]. Available: https://www.gov.uk/government/consultations/review-of-electricity-market-arrangements. |
|
[16] |
“ PyPSA-GB:: An open source model of the GB power system for simulating future energy scenarios,” 2022. [Online]. Available: https://pypsa-gb.netlify.app/. |
|
[17] |
Coire Glas, “The Case for Pumped Hydro Storage,” [Online]. Available: https://www.coireglas.com/. |
|
[18] |
“Red John Pumped Storage Hydro Scheme,” [Online]. Available: https://www.redjohnpsh.co.uk/. |
|
[19] |
“Corrievarkie Pump Storage Hydro Scheme,” [Online]. Available: http://www.corrievarkiepsh.co.uk/. |
|
[20] |
National Grid ESO, “De-rating Factor Methodology for Renewables Participation in the Capacity Market,” 2019. [Online]. Available: https://www.emrdeliverybody.com/Prequalification/EMR%20DB%20Consultation%20response%20-%20De-rating%20Factor%20Methodology%20for%20Renewables%20Participation%20in%20the%20CM.pdf. |
|
[21] |
National Grid ESO, “ Electricity Capacity Report 2021,” [Online]. Available: https://www.emrdeliverybody.com/Capacity%20Markets%20Document%20Library/Electricity%20Capacity%20Report%202021.pdf. |
|
[22] |
National Grid ESO, “Winter Outlook 2022/23,” [Online]. Available: https://www.nationalgrideso.com/research-publications/winter-outlook. |
|
[23] |
International Energy Agency (IEA), “IEA Global energy review 2021,” [Online]. Available: https://www.iea.org/reports/global-energy-review-2021. |
|
[24] |
IRENA, “Renewable energy statistics 2021,” [Online]. Available: https://www.irena.org/publications/2021/Aug/Renewable-energy-statistics-2021. |
|
[25] |
Royal Norwegian Ministry of Petroleum and Energy, “Security of electricity supply,” 2019. [Online]. Available: https://energifaktanorge.no/en/norsk-energiforsyning/forsyningssikkerhet/#operational-security. |
|
[26] |
eurostat, “Production of electricity by source 2020 in the EU,” [Online]. Available: https://ec.europa.eu/eurostat/cache/infographs/energy/bloc-3b.html?lang=en. |
|
[27] |
Danish Energy Agency, “Development and Role of Flexibility in the Danish Power System,” 2022. [Online]. Available: https://ens.dk/sites/ens.dk/files/Globalcooperation/development_and_role_of_flexibility_in_the_danish_power_system.pdf. |
|
[28] |
“ReFLEX Orkney,” [Online]. Available: https://www.reflexorkney.co.uk/. |
|
[29] |
“’Postcode Pricing’ threatens GB renewable energy growth,” [Online]. Available: https://www.scottishrenewables.com/news/1049-postcode-pricing-threatens-gb-renewable-energy-growth. |
|
[30] |
National Grid ESO, “New ESO report finds electricity market reform critical for delivery of future system that is affordable, secure and clean,” [Online]. Available: https://www.nationalgrideso.com/news/new-eso-report-finds-electricity-market-reform-critical-delivery-future-system-affordable. |
|
[31] |
Energy System Catapult, “Locational energy pricing in the GB power market,” [Online]. Available: https://es.catapult.org.uk/report/locational-energy-pricing-in-the-gb-power-market/. |
|
[32] |
Climate Change Committee, “Delivering a reliable decarbonised power system,” CCC, 2023. |
|
[33] |
National Grid, “Regional insights from the Future Energy Scenarios,” 2022. [Online]. Available: https://www.nationalgrideso.com/document/266366/download. [Accessed February 2023]. |
|
[34] |
Scottish Government, “Hydrogen Action Plan,” 2022. [Online]. Available: https://www.gov.scot/publications/hydrogen-action-plan/. [Accessed February 2023]. |
|
[35] |
R. Billinton and R. N. Allan, “Reliability Evaluation of Power Systems,” [Online]. Available: https://link.springer.com/book/10.1007/978-1-4899-1860-4. |
|
[36] |
“Scottish energy statistics hub,” [Online]. Available: https://www.gov.scot/publications/scottish-energy-statistics-hub-index/. |
|
[37] |
“Orkney Islands Use Renewables to Generate 103% of Power Needs,” [Online]. Available: https://www.engineering.com/story/orkney-islands-use-renewables-to-generate-103-of-power-needs. |
|
[38] |
Open Energy Modelling Initiative, 2022. [Online]. Available: https://openmod-initiative.org/. |
|
[39] |
National Grid ESO, “Electricity Ten Year Statement (ETYS) 2022 Appendix B Supplementary Technical Data,” 2022. [Online]. Available: https://www.nationalgrideso.com/document/275586/download. |
|
[40] |
Department for Energy Security and Net Zero, “National statistics – Energy Trends: UK renewables,” 2022. [Online]. Available: https://www.gov.uk/government/statistics/energy-trends-section-6-renewables. |
Appendices
2022/23 Winter Outlook
The 2022/23 winter outlook was developed amid unprecedented volatility in energy markets and concerns around shortfalls in gas supply. Additional scenarios were added to explore the potential impact of reductions in available electrical capacity from gas power plants and import capability through interconnectors. The National Grid report found that under the base case that there will be adequate security of supply with a de-rated margin of 3,700 MW (6.3%) in GB system which is in line with recent years (see Figure 23).
Two additional scenarios were presented in the 2022/23 winter outlook: 1) no electrical imports from continental Europe (Ireland and Norway interconnectors remained available); and 2) in addition to this, 10GW of CCGT being unavailable. Scenario 2 led to security of supply concerns and as a result 2GW of coal power plants and a 2GW novel demand flexibility service were brought into contingency planning.

Figure 23 De-rated margins from National Grid’s recent Winter Outlooks showing the figures for the Winter Outlook 22/23 are in line with historical margins
Ancillary services and system operability
Ancillary services are essential for ensuring the stability and reliability of power system operations, as they maintain frequency and voltage within acceptable ranges and prevent disruptions and blackouts. Unlike fossil-fuel generators, wind turbines and PV panels don’t provide the same level of inertia required to stabilise the system frequency changes following a loss of generation or demand. Ancillary services are not within the scope of the report but are important in understanding the impact of the changing electricity mix on power system operability. To compensate for the lack of inertia in renewable energy sources, modern wind turbines can be equipped with power electronics and control systems that provide synthetic or virtual inertia to the grid. Energy storage systems and other advanced grid technologies can also help balance the system and maintain stability.
National electricity systems with near 100% renewable
Several national electricity systems in the world already operate with, or close to, 100% renewable electricity. For example, Iceland generates all its electricity from either geothermal or hydropower. Other countries with high share of renewable generation include Paraguay (99%), Norway (98%), Uruguay (95%), and Costa Rica (93%) [23] [24]. Despite these impressive levels of renewable generation, there is still some non-renewable electricity generation in each of these countries. In Paraguay, small-scale industrial power plants using sources such as oil, natural gas, and coal contribute to the non-renewable part. In Norway, thermal power plants are the primary source of non-renewable electricity. Both Uruguay and Costa Rica rely on oil-fuelled power plants to support renewables.
The common feature of these countries is that generation from hydropower plants and storage reservoirs dominates the renewable supply. In Norway, many hydropower plants have storage reservoirs. With reservoirs, hydropower production can be adjusted within the constraints set by the watercourse itself. Therefore, they have flexibility which makes it possible to follow the variation of demands, even during periods when there is little rainfall or river inflow.
Blåsjø, Norway’s largest reservoir, has a capacity of 7.8 TWh[15], which is equivalent to three years’ normal river inflow, and can store water for a long period to meet high electricity demand during the heating season in winter or support electricity supply in a dry year [25]. In addition, other hydropower plants with small reservoirs offer short-term flexibility, and can be operated to provide both baseload and peak load due to their ability to be shut down and started up at short notice. Overall, these reservoir storages help to smooth out production over days, weeks, months or between years.
Reservoirs also make it possible to manage output to maximise income through both export and import power to or from neighbouring countries when there is a price difference. Electricity is exchanged with Sweden, Denmark, and Finland through an integrated market called Nord Pool, which is in turn connected to the wider European market through interconnectors to the UK, Netherlands, Germany, the Baltic states, Poland, and Russia
More than 75% of Norway’s renewable generation is dispatchable [26], which ensures the electricity system operates with high levels of reliability and security.
Electricity systems with very high VRE share
The leading national electricity systems with high shares of wind generation (VRE) are Denmark (56% of total electricity production from wind in 2020), Uruguay (40%), Lithuania (36%), Ireland (35%), the UK (24%), Portugal and Germany (both around 23%). For solar energy, the top countries are Honduras (12.9%), Australia (10.7%) and Germany (9.7%) [23] [24] [26].
Countries which rely on VRE have lower overall shares of renewable electricity than countries that benefit from abundant hydropower resources. Of the countries with high VRE share, Denmark has the highest overall share of non-fossil fuel generation at 84%, including 20% from biofuel electricity which is mainly produced in CHPs, and 4% from Solar PV. Since biofuel CHP can be dispatchable, it provides valuable flexibility in helping the operation of the Danish system with over 50% VRE.
The Danish Energy Agency has summarized the successful measures it has implemented to increase the share of variable renewable energy (VRE) while maintaining high security of supply over the past two decades. During this time, various technical and institutional solutions were introduced, as shown Figure 24:
- 2000-2009 (VRE shares <20%): Limited investments in flexibility were made, but the supply was met through more flexible operation of existing thermal power plants and better utilization of interconnectors. Flexible thermal power plants, interconnectors, and forecasting and scheduling systems were the primary sources of flexibility.
- 2010-2015 (VRE shares 20-44%): As the VRE share grew, larger investments in flexibility were made. Solutions included complete turbine bypass, electric boilers, heat pumps, and joining the Nordic power exchange for cross-border trading. The ability for VRE to self-balance was improved through the European cross-border intraday market.
- 2016-2020 (VRE shares 44-50%) and beyond: The focus shifted towards demand-side flexibility and increased sector coupling. Aggregators were introduced to encourage active consumer participation in balancing the system, and the market remained the main driver of flexibility.
The importance of different categories of power system flexibility in Figure 24 has varied over time for integrating renewables in Denmark. The generation side was the main source of flexibility until 2020, but these measures alone will not be able to accommodate the increasing amounts of VRE economically or technically. To continuously develop towards a 100% renewable Danish power system by 2030, Denmark sees increased sector coupling and demand-side flexibility as key providers of new flexibility measures in the future [27]. The focus of sector coupling has also changed from power and heating generation to using surplus electricity and decarbonizing difficult to electrify sectors.
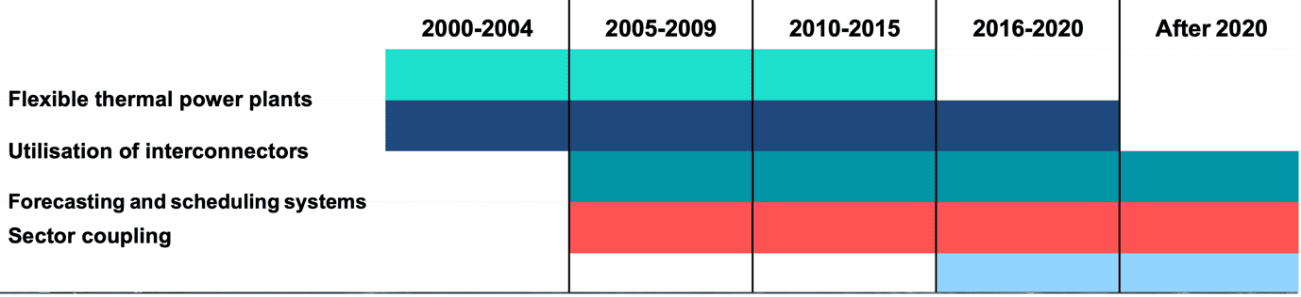
Figure 24 Flexibility measures being implemented in different periods in Denmark power system. Note this indicates where new efforts are being focussed – e.g., interconnectors are still widely used after 2020
Regional electricity systems with near 100% renewable
In some countries, annual renewable energy production from certain regions is already reaching or exceeding local demand, e.g., Mecklenburg-Vorpommern, Schleswig-Hostein in Germany, Orkney in Scotland, and Samsø in Denmark.
The challenge Orkney faces is an interesting example of a regional electricity system with more than 100% VRE. Despite the excessive locally generated green energy (more than 130% over its local annual electricity demand), there are still periods when the wind speed is low, and Orkney needs to import electricity from the UK mainland. To find a non-fossil fuel based solution to tackle the issue of intermittency, a recent smart grid demonstration project – ReFLEX (Responsive Flexibility) Orkney [28] – has set the aim of fully decarbonising Orkney by 2030 through deploying smart controlled battery systems and electric vehicles, and enhancing demand response by interlinking electricity, heat and transport assets.
Background on proposals in REMA
Current arrangements
Under current electricity market arrangements electricity is traded through bilateral long-term contracts, and short-term power exchange marketplaces. Generators sell electricity to end-users often through energy retailers. Generators and suppliers then declare how much electricity they are expecting to generate or use to NG ESO. Based on these declarations a national electricity price is formed which informs power exchange markets on the prices to sell electricity in the short-term. This national price formation is often what is referred to as the wholesale price.
Generators and end-users are free to trade anywhere across Great Britain. For example, a wind farm in the north of Scotland can sell its generated electricity to an industrial end-user in London as easily as it can sell to supply the houses in a nearby town. However, these trades do not account for spatial considerations such as limits in the transmission network. Generators and demands must inform National Grid of their actions on a half-hour basis, where the balancing mechanism is used to ensure balance between supply and end-users. The balancing mechanism may ask generators to increase or reduce, and/or end-users to reduce, in return for additional payments. National Grid also procure additional services in ancillary markets to ensure safe and reliable operation of the grid. There are increasing costs to use the balancing mechanism as the proportion of renewables increases (Figure 25). This is a driving factor in the need for new market arrangements.

Figure 25 Left hand graph shows rising costs of curtailment of wind farms. Right hand graph shows points which represent the years from 2010 to 2020 relating to wind generation and annual cost, in addition to lines which plot out the cost of curtailment per MWh of wind energy produced. The points are rising through the years from £1/MWh to above £4/MWh showing that the cost of each MWh of curtailment is increasing.
Splitting the wholesale market
A proposal gaining traction is splitting of the wholesale market. The idea is to decouple low marginal cost renewable power from high marginal cost dispatchable power, e.g., by splitting the market based on technology type into separate markets for variable and firm power. This avoids the wholesale market price primarily being set by gas prices. It could also help stabilise prices in future when there is a greater proportion of renewable power, and prices would otherwise swing between high prices set by gas generation and low prices set by high renewable output.
Potential advantages:
- Encourage investment in renewable power by helping alleviate issues of price volatility and price cannibalisation[16].
- Incentivise flexibility as more demands would look to buy from the lower cost, but less available, ‘variable’ market. Additionally, flexible technologies like batteries could benefit from access to both markets and shifting demand for price difference opportunities.
- Reduce need for long-term government support, e.g., through contracts for difference (discussed later).
Potential disadvantages:
- Uncertain implementation as this type of market has not been adopted by any major power market, and many variants have been suggested.
- Competition with other reform proposals as most of the benefits can likely be delivered through other ways.
- Lack of protection for end-users to the complexity and increased cost of not engaging with both markets.
- Lower liquidity (volumes which can be traded) in each individual market resulting in reduced competition between technologies.
Splitting the wholesale market could improve the long-term sustainability of investing in renewable power in Scotland. There would be a long-term market in which profits can be made, with more stable prices, and a reduced reliance on government support. However, it is possible that other reform proposals can provide the benefits outlined, and there could be a lack of additionality.
The wholesale market price is currently set by the last generator to turn on to meet demand. This is determined by the free market nature of the GB electricity market where bilateral trades can be made between any generator and demand, or through short-term power exchange markets. The flexibility of the current power system is primarily through flexing gas-fired power plants which means that these are the last generator to meet demand. Therefore, the wholesale electricity price is usually tied to gas prices.
As the proportion of electricity generation from wind and solar sources increases, there have been increasing concerns around the lack of effect of the high proportion of low-marginal cost renewable power on electricity prices. This non-effect on prices is a consequence of the liberalized electricity market. This has led to calls for reform on the wholesale market to better suit the net zero transition and to provide investment and operational signals to support the roll-out of mass renewable power. The current gas crisis with huge increases in the prices of gas has exacerbated this issue, increasing the voices supporting reform.
An alternative to the wholesale price formation is to move to pay-as-bid pricing where generators would receive what they bid, rather than the highest bid. This could decouple gas prices and electricity prices. However, it is likely that generators will bid higher than marginal cost to close the gap to the highest bid, resulting in a market price just below the price of electricity produced by gas power plants. Market intervention by limiting bids could mitigate this, but it is unclear how this could be implemented in practice.
Locational pricing
Locational pricing sets prices at a more granular spatial level than current national pricing. In nodal pricing there are prices at each location in the transmission network; and in zonal pricing the network is split into zones, each with a price, where it is assumed there are negligible network constraints. In both structures the prices incorporate the physical constraints of the network and includes both the cost of the energy and the cost of delivering it.
Potential benefits of locational pricing:
- Reduce whole system costs by incorporating network costs, such as the balancing mechanism, into wholesale costs.
- Nodal system would resolve network congestion inherently and remove the additional costs of the balancing mechanism. Zonal pricing would still likely require a balancing mechanism but could substantially lower costs.
- Strong signal for investing in technologies in the locations which can reduce whole system costs.
- More efficient network investment, as greater integration of network constraints in the electricity markets.
Potential disadvantages:
- Mismatch between where the greatest renewable energy sources are and where the congestion issues are for the network. For example, offshore wind offers greater capacity factors but is physically on the edge of the network.
- Potential for increased payments to existing CfD contracts as these generators are likely already existing in areas where the locational price will be lower than national price.
- Benefits of locational pricing can be greater for fossil fuel power plants (for issues such as ramp up rates and start-up costs), but with the net zero transition these benefits will be diminished.
- Greater consumer exposure based on location.
- Low liquidity in zones or nodes.
- Greater infrastructure requirements to manage the more complex system.
- For zonal pricing there is uncertainty in defining zonal areas and actual returns.
Scottish Renewables has spoken out against location pricing with a central argument being the difference in planning systems across the UK with different stakeholders holding varying interests [29]. They argue for reform of the TNUoS, the current network charge, which is locational based, as an alternative.
There would be a large impact on the Scottish power system with reform to locational pricing. Scotland has substantial wind resource with a large proportion of onshore wind farms and with large capacities of offshore wind in the pipeline. Locational pricing might have the impact of depressing prices received by these generators as locational pricing could be higher in England than in Scotland. This is because the main network congestion is currently delivering renewable generation from Scotland to England.
The motivation of locational pricing is to encourage generators and flexibility operators to take account of the real physical constraints in the network. This can result in investing and operating in areas which have higher value to the whole system and should provide higher rewards for generation and flexibility technologies. This can lead to more efficient location of new resources and efficient expansion of the network. Generators are provided with an incentive to locate to areas of high demand to access higher electricity prices. It also incentivises increased demand in areas which high renewable resources, but lower existing demands (and therefore prices). Since new and recent renewable generation often use contracts for difference this needs to be accounted for in any locational pricing design. Nodal pricing has recently been advocated by the National Grid [30] and the Energy Systems Catapult [31].
There is also interest in extending the granularity to local markets at the distribution level where there is responsibility for a distribution network operator to balance a local market. These local markets would interface with the existing national wholesale market.
Contracts for difference
Contracts for Difference (CfD) is the primary mechanism currently used by the UK government to support deployment of mass low-carbon power. A CfD contract guarantees a ‘strike price’ for generation. When market prices are below the strike price generator income is topped up and when market prices are above the strike price generators must pay back into the scheme. The scheme has seen the cost of renewables drop, by providing long-term certainty which reduces the cost of capital, as well as attracting investors. Strike prices are set through competitive auctions via pots for different technologies with set levels of government support.
Reform of CfDs is being considered since a greater proportion of total generation could end up being CfD supported in the transition to a net zero energy system. This raises issues around the lack of incentives to operate flexibly, locate in areas which help the network, and in competition with other generation technologies. Potential reforms are centred around increasing market exposure, such as a strike range, as opposed to a single price, to increase market exposure, and topping up payments based on comparison to wholesale prices over a week rather the current method of comparing prices in each half-hour pricing period.
Revenue cap and floor
Revenue cap and floor contracts would guarantee generators a minimum revenue over a contracted period. Their application to generators is inspired by contracts offered to 11,000 MW of interconnectors. An advantage is guarantees to investors of minimum revenue levels which helps minimise risk. Generators then have the freedom to participate in all the different electricity markets and attempt to maximise revenue. A cap is also implemented which if revenue exceeds, then the difference is paid back to the government.
Flexibility
Flexibility in the current electricity system comes from dispatchable fossil fuel power stations which can respond to demand changes and variable output from renewable power sources. In the net zero transition there will be a need to increase low carbon flexibility technologies. This includes renewable generation which can respond in different timeframes; and storage including batteries and long duration storage (see CCC report for more details [32]). Compressed air energy storage, Hydrogen, interconnectors offering firm low carbon power from countries like France (nuclear) and Norway (hydro), and demand-side flexibility such as electric vehicles and heat pumps could all have a role.
The UK government currently envisions that flexibility should be incentivised through pricing signals in the wholesale and balancing markets. There have been proposals to ensure these signals better reflect the need of the whole energy system, and therefore ensure flexibility is built in the right locations:
- Revenue cap and floor (similar as for low-carbon generation described earlier) so that flexibility technologies can participate in the full range of markets, but with the safety net of a minimum revenue which can strengthen investor confidence and interest.
- Supplier obligation where suppliers are required to achieve a set target for procuring flexibility.
- Reforming the capacity market to encourage technologies with different flexible characteristics (e.g., response time, duration of response, and location).
Capacity adequacy
It is of vital importance that market arrangements enable secure investment in the required capacity to ensure that electricity supply and demand are matched, and the ‘lights do not go out’. This is most difficult to achieve in extreme cases, such as during demand peaks (often a winter peak) and, very importantly in future, during long periods of low wind. These periods are currently primarily met through fossil fuel power plants such as gas CCGTs. However, many of these power plants are set to retire in the transition to net zero. Additionally, low marginal cost renewable power will displace high marginal cost fossil fuel power plants in the wholesale markets reducing revenues for these firm sources of electricity.
Proposed reforms for capacity adequacy are:
- Enhanced capacity market: Currently, the capacity market is the mechanism for topping up revenues for generators who can provide capacity adequacy. However, the majority of support has gone towards fossil fuel generators, highlighting the need for mechanisms which support low-carbon firm capacity. An enhanced capacity market would target low-carbon technologies which can provide flexibility and support capacity adequacy. Essentially, the capacity market would become more targeted and selective. This could be done through separate auctions or multiple clearing prices, with a careful balance of avoiding target setting which can supress competition.
- Strategic reserve: In this proposal a central authority auctions for reserve capacity on top of the capacity which is built through other markets. This would essentially act as a backstop to ensure security of supply without further intervention in existing markets.
- Operability: A number of proposals for reform around operability have been put forward. Capacity adequacy is an issue related to ensuring that extreme cases which the market does not account for does not result in system failure. Operability is how these assets then perform to ensure power grid stability. These involve evolving the existing suite of ancillary markets to increase the level of low-carbon technologies.
The issue of capacity adequacy is important for the Scottish electricity system, particularly as Torness nuclear power plant is due to close, and the gas CCGT at Peterhead needs to change to carbon capture and storage technology to be compatible with the net zero future. A potential enhanced capacity market should take account of the issues specific to Scotland and this has been highlighted as location is a characteristic which has been described as important to consider.
Contracts for difference
The CfD looks set to continue as the primary support mechanism for the roll out of mass low-carbon power [15]. This means that renewables in the Scottish energy system will continue to receive long-term contracts to provide stable income. It has also been suggested that older renewable generators, previously supported through ROCs or independently, could be offered a CfD contract.
Revenue cap and floor
Revenue cap and floor contracts could accelerate the roll out of wind power in the Scottish electricity system, while also incentivising flexibility such as batteries. This option could help improve the security of supply for Scotland, but it is not clear if this option would perform better than CfDs.
Flexibility
In Scotland there is likely to be an increased need for flexibility given the increasingly high penetrations of VRE generation. Therefore, it is important that changes to electricity markets incentivise situating flexibility technologies in Scotland. Current markets are not suited to delivering the flexibility required and while there are options being explored, it is not clear that the proposed reforms will deliver the required levels of flexibility in Scotland.
Future Energy Scenarios
The FES is widely recognized as a comprehensive and authoritative source of information and analysis on the future of GB electricity system. The data released as part of FES22 includes regionalised breakdowns of generation capacity, storage capacity, and demand for each grid supply point[17] and transmission network area. National Grid use a combined bottom-up and top-down modelling approach[18], and a series of stakeholder engagements to determine the regional data [33]. The four scenarios in FES are:
- Leading the Way is the fastest credible decarbonisation pathway of the four scenarios and includes significant lifestyle change and a mixture of Hydrogen and electrification for heating.
- Consumer Transformation has a lower speed of decarbonisation than leading the way but includes high societal change with consumers willing to significantly change behaviour. This scenario assumes electrified heating, high energy efficiency, and demand side flexibility.
- System Transformation has the same speed of decarbonisation as Consumer Transformation but with fewer changes in consumer behaviour and higher reliance on system-level development. This scenario assumes Hydrogen for heating, lower energy efficiency, and supply side flexibility.
- Falling Short is the slowest credible decarbonisation pathway and the only scenario which falls short of net zero by 2050. It assumes minimal behaviour change and decarbonisation in only power and transport, not in heat.
Heat demand and Hydrogen in FES
The System Transformation scenario assumes that most heating is met by Hydrogen, which results in a lower peak demand than in Consumer Transformation (heating is primarily electrified) and Leading the Way (mixed approach to heating). It should be noted that this perspective is not consistent with the Scottish Government’s Hydrogen Action Plan [34], which states that Hydrogen is intended to support a portion of domestic heating systems while also having potential for various alternative market opportunities.
Despite this difference, both plans share similar levels of ambition in promoting Hydrogen production capacity and usage. The Hydrogen Action Plan for Scotland projects a renewable Hydrogen production capacity of 5 GW by 2030 and 25 GW by 2045 within Scotland, which is comparable to the projections in the System Transformation plan (6 GW by 2030 and 69 GW by 2045 for the entire UK). Hydrogen produced by electrolysers are assumed in FES to not operate during the peak demand period. This assumes large-scale infrastructure including Hydrogen storage is connected to a distribution network which can deliver Hydrogen to end users.
PyPSA-GB details
PyPSA-GB[19] has been developed to simulate the GB power system in high spatial and temporal resolution for both historical and future years [16]. The data included in the model has been sourced from openly available datasets found online. Code for PyPSA-GB is written in Python and Jupyter Notebooks are used to showcase data, functionality, and analysis.
For the historical years, 2010-2020 inclusive, PyPSA-GB includes data on generators, marginal prices, demand, renewable power, and storage. Simulating historical years can provide insight into the operation of the GB power system, e.g., dispatch of thermal power plants and curtailed renewable generation. It is also useful in order to compare to historical data and build confidence in the model.
For future years, PyPSA-GB includes data to simulate future years based on National Grid’s FES2021 and FES2022 for all four scenarios which go up to 2050. Steady Progression represents business as usual with low level of both societal change and speed of decarbonisation and is the only scenario which fails to meet the net zero target. Leading the Way represents the highest speed of decarbonisation coupled with a high level of societal change. Consumer Transformation and System Transformation represent the same speed of decarbonisation, but Consumer Transformation requires higher level of societal change than System Transformation.
The power dispatch functionality utilises the open-source PyPSA (Python for Power Systems Analysis) to perform network-constrained linear optimal power flow calculations. PyPSA can calculate linear optimal power flow by least-cost optimisation of power plant and storage dispatch within network constraints, using the linear network equations, over several snapshots. In this study, models and data in PyPSA have been used: meshed multiply-connected AC and DC networks, with controllable converters between AC and DC networks; standard types for lines; conventional dispatchable generators; generators with time-varying power availability, such as wind and solar generators; storage units with efficiency losses; simple hydroelectricity with inflow and spillage. In this work simulations were carried out in hourly timesteps over a year.
Security of supply metric calculations
Listed below are the formulae for calculating loss-of-load expectation (LOLE), loss-of-load probability (LOLP) and de-rated system margin:
where the LOLP for a particular period is defined as the probability that available generation is unable to meet demand:
where Xt is the available generation and Dt is the system demand, both of which are random variables. A typical example for T and t is a time horizon of one year with periods of one hour.
The de-rated capacity margin measures the amount of excess supply above peak demand. De-rating means that the supply is adjusted to take account of the availability of plant, specific to each type of generation technology. The technology-specific de-rate factors are given in Table 5 and Table 6 [22] in Appendix 12.13.
De-rated system margin is used as a proxy for risk of loss of supply. It is calculated as the difference between the peak demand and the de-rated supply capacity. The de-rated supply capacity is calculated by scaling down installed capacity by the expected availability at peak demand, and by converting variable generation capacity using an equivalent firm capacity (EFC) factor. The EFC is a measure of the capacity adequacy contribution provided by wind and solar. It refers to the amount of power that a wind or solar farm can consistently deliver over time, which is useful to translate the variable output into an equivalent amount of firm capacity in the calculation of security of supply. EFC can be much lower than capacity factor, as the capacity factor reflects the average output of a wind farm, while the EFC reflects the reliability and consistency of that output. For example, the latest winter outlook, 16.1% is used as the EFC factor for wind generation.
GB supply under System Transformation
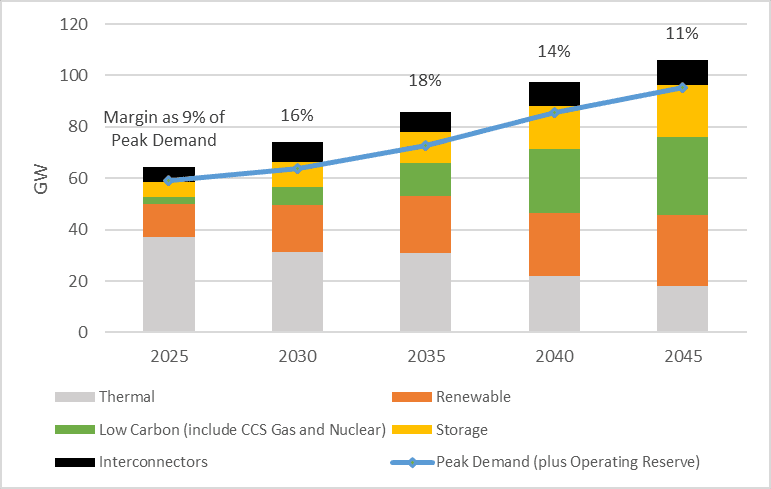
Figure 26 Plot of de-rated supply capacity, peak demand and supply margin of GB for System Transformation from 2025 – 2045
Figure 26 shows de-rated capacity and system margin results for the entire GB system, which includes the Scottish electricity system. The overall system margins of GB also vary in the future, peaking at 18% by 2035 after a rapid increase in generation capacity from 2025, and then falling back to 11% by 2045 when the rising demand catches up. It is evident from these results that the GB system margin is substantially less than that of the Scottish system alone. While the generation capacity in Scotland may seem excessive in the context of security of supply for only Scotland, it will be utilised to decarbonise and provide security of supply to the rest of GB.
Figure 27 shows power dispatch for all of GB for the System Transformation scenario and includes time of peak GB demand. The majority of generation is from variable renewable energy sources (VRES) – solar photovoltaics, wind offshore, and wind onshore – while nuclear slowly increases to the peak demand period. Firm generation – a combination of Hydrogen, CCS gas, hydro, and biomass and storage (pumped storage hydroelectric, batteries, compressed air, and liquid air) – are dispatched around the peak demand and at times of low VRES generation. It is notable that the period of highest use of firm generation and storage is at a period of low VRES and high demand which happens after the peak GB demand.

Figure 27 Power dispatch of whole of GB for System Transformation in 2045 over 2-day period, excluding interconnectors to Europe.
Security of supply stress tests
Base case
The base case shows the power dispatch for the System Transformation scenario over a 6-day period from 5 December to 10 December, and can be used as a comparison to the stress test power flow figures.

Figure 28: Power dispatch modelled over the 6-day period for base case.
Offshore wind farm failures
In security planning, the ability of an electrical power system to handle failure of its largest generator is tested. Historically this has been a large, centralised fossil fuel power plant. However, in 2045, the largest single generator in Scotland will be from the network of offshore wind farms.

Figure 29 Power dispatch modelled over the 6-day period the stress event of the failure of offshore wind farms.
Figure 29 is the power dispatch modelled over the 6-day stress event of the failure of offshore wind farms[20]. The power dispatch shows use of hydrogen power plants which were not dispatched in the base case. It is notable that CCS gas is not dispatched. The reason hydrogen is dispatched first is due to modelling assumptions with the marginal cost of hydrogen being lower than CCS gas. Despite the dispatch of hydrogen there is still export to the rest of GB. The effect of the failure of offshore wind farms is increased use of hydrogen generation, storage discharging, and imports from the rest of GB.
Low VRES power output
Scotland will be increasingly reliant on VRE in the form of wind power. This stress test analyses how the electricity system copes with a prolonged period of low VRES power output.

Figure 30 Power dispatch modelled over the 6-day period the stress event of low-VRES power output. Not lower scale on GW y-axis than other power flow figures
Figure 30 is the power dispatch modelled over the 6-day period the stress event of low-VRES power output during the peak demand period. There are substantially more periods of import to make up for the reduction in renewable power generation in Scotland, while hydrogen and biomass power plants are at full output, aided by dispatch of all storage types (pumped storage, battery, compressed air, and liquid air). As with the offshore wind farm failure, there are still exports to the rest of GB, however this does result in periods when Scotland is a net importer of electricity.
Gas power generation in Scotland unavailable

Figure 31 Power dispatch modelled over the 6-day period for the stress event of unavailable gas power generation.
Figure 31 shows power dispatch modelled over the 6-day period for the stress event of gas power generation not being available in Scotland. This has a much smaller impact on power dispatch compared to the wind power issues of the previous two stress tests, even with the dispatchability of the CCS gas. This is because the CCS gas is 1,800 MW in 2045 compared to the 21,000 MW wind farm failure in the first stress test.
Interconnectors to NI and Norway unavailable

Figure 32 Power dispatch modelled over the 6-day period the stress event of interconnector to Norway and Northern Ireland being unavailable.
Figure 32 shows the power dispatch for the stress event where both the interconnectors to Norway and Northern Ireland are unavailable. This results in some wind generation being reduced, or curtailed, as there is less capacity to export.
Connection to rest of GB unavailable
There will be more reliance on the connection between Scotland and the rest of GB in the future to accommodate increases in power flow. Increased imports to Scotland will be required to meet demand when there is low wind generation, and exports to the rest of GB will increase due to large installed capacities of wind generation in Scotland and to decarbonise demands in the rest of GB.

Figure 33 Power dispatch modelled over the 6-day period the stress event of no connection between Scotland the rest of GB
Figure 33 shows the power dispatch modelled over the 6-day period for the event of no connection at all between Scotland and the rest of GB. This results in power dispatch which is almost entirely reliant on wind generation coupled with charging and discharging of pumped storage plus other storage types. Wind generation over this period is enough to meet the demand of Scotland, however, there is no ability to export to the rest of GB which means that lots of potential wind generation is curtailed.
Storage failures
Flexibility in the electricity system will increasingly come from storage, as opposed to the dispatchability of traditional fossil fuel power plants. While large, centralised fossil fuel power plants offer a single source of failure, storage technology such as batteries, pumped hydro, compressed air energy storage, and liquid air energy storage will likely be distributed through the electrical network in a larger number of individual units. Therefore, storage will likely offer a higher degree of reliability, but this may be offset by uncertainty around the state of charge, i.e., how much electricity can be discharged from the storage unit.

Figure 34 Power dispatch modelled over the 6-day period the stress event of no battery storage in Scotland.
Figure 34 shows the power dispatch modelled for the stress event of no battery storage in Scotland. This has minimal impact compared to the base case but does decrease the utilisation of wind generation resulting in less import and export. The pumped hydro appears suited to making up for the loss of battery storage.
Security of supply data requirements
Probabilistic data is required to calculate the LOLE, LOLP, and de-rated system margin. An important input is the probability that each generator will be available at any time. This is characterised by the rate at which a unit is likely to experience forced outages, and will vary between generators depending on the technology, age and operating regime. With the outage rate (or given as availability factor = 1 – outage rate), the probability distribution for available supply capacity can be constructed using the Capacity Outage Probability Table method developed by Billinton and Allan [35].
The approach taken in this report is to use generation data from the FES22 scenario for technology capacities, and to use expected availability factors assumed in the latest 2022 National Grid’s Winter Outlook [22] and National Grid’s ESO Electricity Capacity Report [21]. This data of outage rate per type is summarised in Table 5. The de-rating factor applied for duration-limited storage (i.e. battery), is directly linked to the duration, as shown in Table 6. For instance, a storage system with a power rating of 100MW and a duration of 3 hours (equivalent to an energy capacity of 300MWh) would have a de-rating factor of 66.18%. The aggregate cumulative distribution function (cdf) for available generation, using 2030 in the System Transformation scenario as an example, are displayed in Figure 35.
Table 5 Generation de-rate factors and outage rate used in this study
|
Generation Type |
Outage rate |
De-rate factor |
|
CCGT |
0.06 |
0.913 |
|
Nuclear |
0.1 |
0.744 |
|
OCGT |
0.07 |
0.952 |
|
Biomass |
0.06 |
0.88 |
|
Hydro |
0.08 |
0.911 |
|
Wind |
– |
0.161 (EFC)[21] |
|
Pumped storage |
0.03 |
0.952 |
|
Hydrogen |
As CCGT |
As CCGT |
Table 6 De-rate factors for duration limited storage
|
Duration (hours) |
De-rate factor |
|
0.5 |
12.38% |
|
1.0 |
24.77% |
|
1.5 |
36.97% |
|
2.0 |
48.62% |
|
2.5 |
58.78% |
|
3.0 |
66.18% |
|
3.5 |
70.98% |
|
4.0 |
73.76% |
|
4.5 |
75.79% |
|
5.0 |
94.64% |
|
5.5+ |

Figure 35: Cumulative distribution function (CDF) for available generation in 2030 ST scenario. For illustrative purposes, an indictive peak demand of 10 GW is shown as a vertical line, and probability for not meeting the level of demand is 0.25. For peak demand around 5.5 GW, which is what is forecasted in Scotland, the probability for not meeting the level of demand would be statistically zero based on the CDF curve.
Data for Scotland under Leading the Way
|
“Firm” Generation Capacity (MW) in Scotland in FES22 |
2021 |
2030 |
2035 |
2040 |
2045 |
|
Nuclear |
1,750 |
0 |
0 |
0 |
0 |
|
Hydro |
1,779 |
1,835 |
1,857 |
1,880 |
1,911 |
|
Gas |
1,238 |
920 |
910 |
910 |
910 |
|
Pumped hydro |
740 |
2,696 |
3,296 |
3,896 |
3,896 |
|
Interconnector |
160 |
1,900 |
2,600 |
2,600 |
2,600 |
|
England and Wales connection (derated by 50%) |
3,050 |
10,709 |
14,841 |
15,110 |
15,110 |
|
Biomass |
208 |
238 |
196 |
84 |
39 |
|
Hydrogen |
0 |
9 |
688 |
693 |
713 |
|
Total firm capacity |
8,925 |
18,307 |
24,388 |
25,173 |
25,179 |
|
“Non-Firm” Generation Capacity (MW) in Scotland in FES22 |
2021 |
2030 |
2035 |
2040 |
2045 |
|
Wind offshore |
1,663 |
13,426 |
31,251 |
34,701 |
34,701 |
|
Wind onshore |
8,929 |
22,741 |
24,799 |
26,129 |
27,219 |
|
PV |
462 |
2,034 |
3,530 |
4,833 |
6,337 |
|
Marine |
41 |
55 |
62 |
200 |
199 |
|
Storage Capacity (MW) in Scotland in FES22 |
2021 |
2030 |
2035 |
2040 |
2045 |
|
Batteries |
124 |
3,201 |
3,435 |
3,792 |
3,792 |
|
Domestic batteries |
2 |
61 |
141 |
254 |
404 |
|
Pumped hydro |
740 |
2,696 |
3,296 |
3,896 |
3,896 |
|
Peak demand FES22 (MW) |
2021 |
2030 |
2035 |
2040 |
2045 |
|
GB projection |
58,800 |
62,700 |
81,800 |
94,200 |
98,400 |
|
Scotland (FES22 regional breakdown) |
4,890 |
5,660 |
7,470 |
8,910 |
9,680 |
|
Total firm capacity in Scotland |
8,925 |
18,307 |
24,388 |
25,173 |
25,179 |
|
Peak demand as percentage of total firm capacity in Scotland |
52% |
31% |
31% |
35% |
38% |
Data for Scotland under System Transformation
|
“Firm” Generation Capacity (MW) in Scotland in FES22 |
2021 |
2030 |
2035 |
2040 |
2045 |
|
Nuclear |
1,750 |
0 |
0 |
0 |
0 |
|
Hydro |
1,779 |
1,857 |
1,857 |
1,880 |
1,902 |
|
Gas |
1,238 |
969 |
969 |
910 |
1,810 |
|
Pumped hydro |
740 |
740 |
950 |
2,010 |
2,010 |
|
Interconnector |
160 |
500 |
500 |
500 |
500 |
|
England and Wales connection (derated by 50%) |
3,050 |
8,802 |
11,119 |
12,331 |
12,331 |
|
Biomass |
208 |
251 |
230 |
1,946 |
1,894 |
|
Hydrogen |
0 |
43 |
43 |
690 |
1,924 |
|
Total firm capacity |
8,925 |
13,162 |
15,668 |
20,267 |
22,371 |
|
“Non-Firm” Generation Capacity (MW) in Scotland in FES22 |
2021 |
2030 |
2035 |
2040 |
2045 |
|
Wind offshore |
1,663 |
5,136 |
27,031 |
31,401 |
33,901 |
|
Wind onshore |
8,929 |
18,978 |
22,453 |
23,325 |
23,891 |
|
PV |
462 |
1,400 |
2,269 |
3,010 |
3,947 |
|
Marine |
41 |
67 |
157 |
182 |
265 |
|
Storage Capacity (MW) in Scotland in FES22 |
2021 |
2030 |
2035 |
2040 |
2045 |
|
Batteries |
124 |
1,771 |
1,936 |
1,985 |
2,111 |
|
Domestic batteries |
2 |
17 |
36 |
61 |
93 |
|
Pumped hydro |
740 |
740 |
950 |
2,012 |
2,012 |
|
Peak demand FES22 (MW) |
2021 |
2030 |
2035 |
2040 |
2045 |
|
GB |
58,800 |
63,800 |
73,000 |
85,500 |
95,000 |
|
Scotland (FES22 regional breakdown) |
4,600 |
5,200 |
6,000 |
7,500 |
8,700 |
|
Total firm capacity in Scotland |
8,925 |
13,162 |
15,668 |
20,267 |
22,371 |
|
Peak demand as percentage of total firm capacity in Scotland |
52% |
40% |
38% |
37% |
39% |
Data for Scotland under Consumer Transformation
|
“Firm” Generation Capacity (MW) in Scotland in FES22 |
2021 |
2030 |
2035 |
2040 |
2045 |
|
Nuclear |
1,750 |
0 |
0 |
0 |
0 |
|
Hydro |
1,779 |
1,921 |
1,997 |
2,066 |
2,124 |
|
Gas |
1,238 |
967 |
959 |
910 |
910 |
|
Pumped hydro |
740 |
950 |
2,696 |
2,696 |
2,696 |
|
Interconnector |
160 |
500 |
1,200 |
1,200 |
1,200 |
|
England and Wales connection (derated by 50%) |
3,050 |
9,211 |
13,570 |
13,957 |
13,957 |
|
Biomass |
208 |
238 |
1,414 |
3,782 |
3,691 |
|
Hydrogen |
0 |
0 |
7 |
19.7 |
2,435 |
|
Total firm capacity |
8,925 |
13,787 |
21,843 |
24,631 |
27,013 |
|
“Non-Firm” Generation Capacity (MW) in Scotland in FES22 |
2021 |
2030 |
2035 |
2040 |
2045 |
|
Wind offshore |
1,663 |
7,686 |
30,951 |
36,001 |
36,501 |
|
Wind onshore |
8,929 |
21,192 |
23,603 |
26,094 |
27,372 |
|
PV |
462 |
1,880 |
3,099 |
4,139 |
5,338 |
|
Marine |
41 |
138 |
145 |
169 |
168 |
|
Storage Capacity (MW) in Scotland in FES22 |
2021 |
2030 |
2035 |
2040 |
2045 |
|
Batteries |
124 |
2,371 |
2,766 |
3,050 |
3,143 |
|
Domestic batteries |
2 |
53 |
121 |
219 |
347 |
|
Pumped hydro |
740 |
950 |
2,696 |
2,696 |
2,696 |
|
Peak demand FES22 (MW) |
2021 |
2030 |
2035 |
2040 |
2045 |
|
GB |
58,800 |
68,400 |
86,900 |
107,100 |
116,000 |
|
Scotland (FES22 regional breakdown) |
4,600 |
5,900 |
8,000 |
10,200 |
11,300 |
|
Total firm capacity in Scotland |
8,925 |
13,787 |
21,843 |
24,631 |
27,013 |
|
Peak demand as percentage of total firm capacity in Scotland |
52% |
43% |
37% |
41% |
42% |
Data for Scotland under Falling Short
|
“Firm” Generation Capacity (MW) in Scotland in FES22 |
2021 |
2030 |
2035 |
2040 |
2045 |
|
Nuclear |
1,750 |
0 |
0 |
0 |
0 |
|
Hydro |
1,779 |
1,807 |
1,811 |
1,815 |
1,819 |
|
Gas |
1,238 |
1,259 |
989 |
2,779 |
3,679 |
|
Pumped hydro |
740 |
740 |
740 |
1,400 |
1,400 |
|
Interconnector |
160 |
500 |
500 |
500 |
500 |
|
England and Wales connection (derated by 50%) |
3,050 |
7,688 |
8,735 |
8,977 |
8,977 |
|
Biomass |
208 |
271 |
271 |
271 |
271 |
|
Hydrogen |
0 |
0 |
0 |
0 |
0 |
|
Total firm capacity |
8,925 |
12,265 |
13,046 |
15,742 |
16,646 |
|
“Non-Firm” Generation Capacity (MW) in Scotland in FES22 |
2021 |
2030 |
2035 |
2040 |
2045 |
|
Wind offshore |
1,663 |
5,066 |
9,256 |
22,911 |
25,831 |
|
Wind onshore |
8,929 |
16,385 |
19,807 |
21,324 |
21,561 |
|
PV |
462 |
1,006 |
1,584 |
1,970 |
2,469 |
|
Marine |
41 |
48 |
53 |
53 |
53 |
|
Storage Capacity (MW) in Scotland in FES22 |
2021 |
2030 |
2035 |
2040 |
2045 |
|
Batteries |
124 |
1,474 |
1,886 |
1,941 |
1,971 |
|
Domestic batteries |
2 |
12 |
22 |
34 |
49 |
|
Pumped hydro |
740 |
740 |
740 |
1,400 |
1,400 |
|
Peak demand FES22 (MW) |
2021 |
2030 |
2035 |
2040 |
2045 |
|
GB |
58,800 |
67,300 |
77,600 |
90,700 |
104,000 |
|
Scotland (FES22 regional breakdown) |
4,600 |
5,300 |
6,400 |
7,800 |
9,200 |
|
Total firm capacity in Scotland |
8,925 |
12,265 |
13,046 |
15,742 |
16,646 |
|
Peak demand as percentage of total firm capacity in Scotland |
52% |
43% |
49% |
50% |
55% |
Data for a low capacity and high demand scenario
This data is specific to Scotland. Highlighted orange indicates modification to the System Transformation scenario. B6 connection is based on National Grid’s ETYS21 [7]. Peak demand is based on the Consumer Transformation scenario which has the highest peak demand of the four FES scenarios.
|
Generation, Interconnection, and Storage Capacity (MW) in Scotland in “Low Cap, High Dem Scenario” |
2021 |
2030 |
2035 |
2040 |
2045 |
|
(De-rated capacity below rated capacity) | |||||
|
Nuclear |
1,750 |
0 |
0 |
0 |
0 |
|
1,302 | |||||
|
Hydro |
1,779 |
1,857 |
1,857 |
1,880 |
1,902 |
|
1,601 |
1,692 |
1,692 |
1,713 |
1,733 | |
|
Gas |
1,238 |
0 |
0 |
0 |
0 |
|
1,130 | |||||
|
Pumped hydro |
740 |
740 |
950 |
2,010 |
2,010 |
|
704 |
704 |
904 |
1,914 |
1,914 | |
|
Interconnector |
160 |
500 |
500 |
500 |
500 |
|
B6 connection |
6,100 |
11,500 |
16,900 |
16,900 |
16,900 |
|
3,050 |
5,750 |
8,450 |
8,450 |
8,450 | |
|
Biomass |
208 |
251 |
230 |
230 |
230 |
|
183 |
221 |
202 |
202 |
202 | |
|
Hydrogen |
0 |
0 |
0 |
0 |
0 |
|
Wind offshore
|
1,663 |
5,136 |
27,031 |
31,401 |
33,901 |
|
268 |
827 |
4,352 |
5,056 |
5,458 | |
|
Wind onshore
|
8,929 |
18,978 |
22,453 |
23,325 |
23,891 |
|
1,438 |
3,055 |
3,615 |
3,755 |
3,846 | |
|
PV |
462 |
1,400 |
2,269 |
3,010 |
3,947 |
|
0 |
0 |
0 |
0 |
0 | |
|
Marine |
41 |
67 |
157 |
182 |
265 |
|
0 |
0 |
0 |
0 |
0 |
|
Sum of firm generation and interconnector capacity |
11,975 |
14,848 |
20,437 |
21,520 |
21,542 |
|
8,130 |
8,867 |
11,748 |
12,779 |
12,799 | |
|
Sum of firm and VRES generation and interconnector capacity |
23,070 |
40,429 |
72,347 |
79,438 |
83,546 |
|
9,836 |
12,749 |
19,715 |
21,590 |
22,103 | |
|
Peak demand in Scotland |
4,600 |
5,900 |
8,000 |
10,200 |
11,300 |
|
Peak demand as percentage of sum of firm generation and interconnector capacity in Scotland |
38.4% |
39.7% |
39.1% |
47.4% |
52.5% |
|
56.6% |
66.5% |
68.1% |
79.8% |
88.3% | |
|
Peak demand as percentage of sum of firm and VRES generation and interconnector capacity in Scotland |
19.9% |
14.6% |
11.1% |
12.8% |
13.5% |
|
46.8% |
46.3% |
40.6% |
47.2% |
51.1% | |
|
System margin without VRES (Total rated or de-rated minus peak demand) |
7,375 |
8,948 |
12,437 |
11,320 |
10,242 |
|
3,530 |
2,967 |
3,748 |
2,579 |
1,499 | |
|
System margin with VRES (Total rated or de-rated minus peak demand) |
18,470 |
34,529 |
64,347 |
69,238 |
72,246 |
|
5,236 |
6,849 |
11,715 |
11,390 |
10,803 |
|
Batteries |
124 |
1,771 |
1,936 |
1,985 |
2,111 |
© Published by University of Edinburgh, 2023 on behalf of ClimateXChange. All rights reserved.
While every effort is made to ensure the information in this report is accurate, no legal responsibility is accepted for any errors, omissions or misleading statements. The views expressed represent those of the author(s), and do not necessarily represent those of the host institutions or funders.
-
This report focusses on the Scottish electrical system but it sometimes refers to GB or UK statistics. ↑
-
To date, there has never been a complete blackout of the power grid in the UK ↑
-
In theory the transfer capability is 7200 MW (2770 MW + 2210 MW + 2200 MW). However, National Grid applies a thermal constraint that limits this to approximately 6100 MW ( [39]). ↑
-
1,290MW from Torness, and 460MW from last reduced output reactor to operate at Hunterston which fully shut down in Jan 2022. ↑
-
Moyle interconnector was limited to 160MW in 2021, but up to full transfer capability of 500MW by 2022. ↑
-
National Grid does not have a method for de-rating capacities of network internal to GB, and while this will be examined in more detail later. For this table we have assumed a de-rating factor of 50% to reflect that it will not always be available dependent on demand and generation in the rest of GB. ↑
-
This peak of 4,600 MW is less than the 5,000 MW figure reported on the Scottish Energy Statistics Hub [36] due to the method of mapping grid supply point to demand zone in PyPSA-GB. This results in a small proportion of demand in Scotland being modelled as part of England. ↑
-
System Transformation FES scenario percentage breakdown of heating in homes in GB by technology in 2050 is: 35% from hydrogen boilers, 22% from hybrid hydrogen/heat pump systems, 16% from district heating, 12% from air source heat pumps, 7% from air source heat pump and biofuel/direct electric hybrids, 3% from ground source heat pumps, 2% from biofuels, and 2% from direct electric. ↑
-
The total increased wind capacity from 2012-2022 in the UK is approximately 20,000MW [40]. This report acknowledges the challenges of achieving such significant capacity growth within a short timeframe. However, the FES scenario has been chosen as it was developed by the ESO and is applicable nationwide in Great Britain. ↑
-
Peak demand for GB and Scotland occurs at the same time in the model. ↑
-
Note that dispatch charts are shown on different scales to allow a more detailed visualisation of the situation in Scotland. ↑
-
In 2021 net exports are 13.7 TWh and in 2045 net exports are 30.4 TWh. In 2021 imports are 0.5 TWh and exports are 14.2 TWh, in 2045 imports are 4.3 TWh and exports are 34.7 TWh. ↑
-
Same stress test as previous section where the contribution of VRE generators (onshore and offshore wind, PV, and hydro) in Scotland is limited to 20% of their potential outputs. ↑
-
An iterative process is used. The same self-sufficient Scottish system is simulated with additional 50MW firm capacity each time, until the targeted LOLE is reached. ↑
-
Cruachan Reservoir is capable of holding 7 GWh. Blåsjø has more than 1000x Cruachan’s storage capacity. ↑
-
Price cannibalisation is when low marginal cost renewables may lower electricity prices to the extent that generators do not make a return on investment. ↑
-
Grid supply points are where the distribution network connects to the transmission network. ↑
-
Top-down approaches use high-level aggregated data/models while bottom-up approaches use more detailed data/models for individual components which can then be aggregated together. ↑
-
The figure also shows that hydrogen and biomass power plants have low load factors, i.e., they generate a small amount of electricity relative to their capacity. Financing of these types of generation will require revenues through non-energy markets such as capacity markets. These plants are unlikely to be sustained by selling electricity, unless peak periods in the future have very high prices. ↑
-
National Grid’s winter outlook reports have consistently applied the same de-rate factor in the capacity adequacy calculation for both onshore and offshore wind farms, as evidenced in all of the recent years’ reports. ↑
Kairsty Topp1, Lorna Cole2, Henry Creissen1, Sascha Grierson2, Marie Haskell1, Robin Walker1, Christine Watson1
1SRUC, 2SAC Consulting
August 2023
DOI: http://dx.doi.org/10.7488/era/3970
Executive summary
Aims
The Scottish Government is committed to support the transition to net zero, whilst restoring and regenerating biodiversity. Organic farming practices have the potential to deliver to both agendas.
This Rapid Evidence Assessment (REA) and stakeholder engagement assesses the evidence for organic farming practices that contribute to the Biodiversity Strategy targets, a reduction in greenhouse gas emissions and making Scottish agricultural systems more resilient to the projected climatic conditions of 2045 (adaptation).
The review assessed greenhouse gas emissions in terms of both a reduction in emissions and an increase in soil carbon.
Key Findings
The stakeholders emphasised that organic farming is a holistic approach to farming the land, and benefits arise from the combination of management practices adopted. The literature review supported the holistic nature of organic farming.
We found that:
- Organic farming practices offer benefits to biodiversity, greenhouse gas emissions (GHGs), soil carbon, and how organic farming practices might help farmers adapt to a changing climate in Scotland over the next two decades to 2045 (termed adaptability) (Table 1).
- The inclusion of specific measures such as leys and cover crops, organic bulky materials and crop residue management in organic systems tends to increase the soil carbon.
- In terms of reducing GHGs, these can be achieved through potential reductions of on-farm emissions, although these are variable, and reductions of purchased inputs and the transport associated with these inputs.
- However, the cost of these benefits is a reduction in yield, potentially increasing global emissions due to the requirement for increased food production elsewhere (Smith et al. 2019).
- Organic systems are typically more diverse than conventional systems (Reumaux et al. 2023).
- At the farm level, the wider range of crops creates a mosaic of habitats, while at the field level, intercropping, varietal mixes and a greater prevalence of weeds creates a variety of microhabitats.
- Diversity at the farm, field and microhabitat level has positive implications for biodiversity.
- Organic management practices tend to increase resilience making the farming systems more capable of dealing with the weather conditions projected for 2045.
Table 1. Summary of impacts of practices on biodiversity, soil carbon, GHGs and adaptation gathered from the Rapid Evidence Assessment (REA) and the Stakeholder workshops (S/H); green indicates a positive response (+), yellow neutral (n) and red negative (-). Blank cells indicate insufficient evidence.
Gaps
- There is lack of evidence on the trade-offs between the individual organic management practices and the ecosystem services delivered.
- Although there is evidence that organic management practices can increase soil carbon, there is a need for better quantification of the long-term potential.
- There is a lack of evidence of the cumulative benefits of organic management practices on GHGs coming from the multi-year application of crop and livestock rotations.
- Continual development of carbon calculators to better incorporate updated science and data is required to help support the farming community make informed decisions.
- There is a need to increase the focus on developing systems that have the resilience to cope with the projected climate change.
Conclusions
The wider adoption of organic farming practices will benefit the environment. This would require support for the industry to transition and maintain the system. Advice and training would be required.
Introduction
The Scottish Government programme for a fairer, green Scotland, 2021-2022 is committed to doubling the land area devoted to organic farming by 2026, and supporting the growth of organic food production in Scotland. The Scottish Government is also committed to reducing greenhouse gas emissions (GHGs) and supporting the transition to net zero.
Climate is changing and we are likely to experience more extreme weather events including droughts and flooding. Therefore, it is crucial that agriculture takes steps to adapt their management practices to be fit for purpose in the face of the changing climate. At the same time, the Agricultural Reform Route Map sets out Scotland’s commitment to deliver biodiversity conditionality in the future agricultural payments framework with wider targets including creating Nature Networks across Scotland connecting people with the natural environment. To achieve these targets, and increase the resilience of Scotland’s food production systems, there is a need to enhance both above and below-ground biodiversity from our farmland.
The adoption of management practices associated with organic farming by the wider farming sector, and expansion of the organic sector has potential to deliver to the net zero targets for Scotland, enable farming to adapt to climate change and contribute to the Biodiversity Strategy.
This Rapid Evidence Assessment (REA) delves deeper into the specific agroecological practices that underpin organic farming systems in Scotland to assess the evidence for the contribution a wider adoption of organic farming practices can make to achieving these targets. This work therefore complements previous work undertaken for Climate X Change that explored the potential for a range of agroecological based farming approaches (including organic farming) to tackle the biodiversity and climate emergency (Cole et al. 2021).
What is ‘organic’ farming?
Organic farming, as defined by the EU council regulation 834/2007 is “a holistic production management system which promotes and enhances agro-ecosystem health, including biodiversity, biological cycles, and soil biological activity. It emphasizes the use of management practices in preference to the use of off-farm inputs, taking into account that regional conditions require locally adapted systems”.
In Great Britain, organic farming is certified by Defra using the “Retained Council Regulation (EC) 834/2007” which sets out rules for labelling agricultural products and foodstuffs as ‘organic’. Through the Windsor Framework, the EU organic regulations continue to apply in Northern Ireland. These rules certify the process of organic production rather than the actual product. As such they tend to deal with elements of the farming system that can be easily measured and controlled rather than dealing with more complex issues such as energy use or biodiversity. All food which is sold with the organic label must originate from producers or processors who are certified as organic and regularly inspected by an approved body (Chapter 12: Organic farming – GOV.UK (www.gov.uk))
Some producers adopt the agroecological principles of organic production but without engaging with the certification process, meaning they cannot label their produce as organic. Organic farmers are agricultural practitioners that do not use synthetic pesticides or synthetic fertilisers, and instead rely on cultural methods for weed and pest control as well as plant nutrient supply. Some farmers adopt the principles of organic farming but are not certified. Typically, organic farmers have mixed systems incorporating both animal and crop enterprises, including the use of crops and livestock bred without using genetic modification technology, that are adapted to local conditions wherever possible. However, there has been an increase in stockless (i.e. systems which do not rely on manure or other inputs from farmed livestock) organic systems in recent years.
Organic farming systems utilise diverse crop rotations, with carefully selected sequences of crops (both species and varieties), to help control pests, weeds and diseases. Nitrogen fixing crops such as clovers or grain legumes form an integral part of the system to sustain the fertility of the soils in the long-term (Watson et al. 2017). Organic farmers aim to utilise home grown, or locally grown, livestock feed. They will apply careful timing to all their field and animal care procedures, and other management practices. The latter includes the use of cover crops, green manures, timeliness and timing of field operations linked to soil and weather conditions, and practices such as composting of animal manure to aid weed control (Stockdale et al. 2001). Although organic farmers typically plough their field to control weeds, they do aim to minimise soil disturbance. Thus, reduced tillage has been included as a farm management option to be assessed.
Organic farming typically increases diversity within the crop (e.g. through intercropping and increased weed abundances) and at the wider farm level (e.g. through supporting a greater diversity of crops within the rotation) (Hardman, et al. 2016; Reumaux et al. 2023). With loss of habitat diversity identified as a major driver of biodiversity decline (Benton et al. 2003) this highlights the potential for organic farming to deliver biodiversity goals. In addition, the practices associated with organic farming tend to have positive effects on many supporting and regulating ecosystems services including water and soil quality, water regulation, pollination and pest and disease management (Tamburini et al. 2020; Beillouin et al. 2021). The focus of organic farm management practices to maintain soil fertility and exclude synthetic inputs offers the potential to increase soil carbon and reduce GHGs on a land area basis. However, organic management practices typically lead to a reduction in yield which may lead to the emissions per unit of product being similar or slightly higher than conventional systems (Smith et al. 2015). In addition, due to the lower yield, global emissions may increase due to the requirement for increased food production elsewhere to offset the lower yield (Smith et al. 2019).
Report focus
Organic farming is an holistic system with the promotion of biological processes and ecosystems at its core. Many of the individual practices or components of organic farming systems are slowly being adopted by some conventional farmers (e.g. the use of herbal leys and clovers in grassland).
This report focuses on individual organic farming practices. The range of practices assessed is based on Cole et al. (2021) and excludes the synergistic effects resulting from the adoption of multiple practices seen within commercial organic farming systems.
The focus of the report is on assessing the benefits and disbenefits of individual organic management practices on biodiversity, soil carbon, GHG mitigation, and adaptation to climate change. Consequently, documents that do not specifically focus on organic farming practices and the means to encourage or support the adoption of these practices by conventional and regenerative farmers are outside the scope of this report. A glossary of terms is provided in Section 9.
The evidence for benefits and disbenefits of organic management practices
The organic management practices that were selected for review were identified by Cole et al. (2021) as being typically adopted by organic farmers (Table 1). These included rotations, reliance on legumes, species and variety mixes, cover crops, crop residue management, use of organic fertiliser, no synthetic inputs, cultivation practices, livestock grazing management and the restricted use of veterinary products. The contribution of these selected organic management practices to deliver the climate change and biodiversity targets was assessed through a Rapid Evidence Assessment (REA), and stakeholder workshops. The impact of organic management practices on climate change has been considered in terms of both mitigation and adaptation. The mitigation contribution has been described in terms of the effects on soil carbon storage and GHG, where GHGs include nitrous oxide and methane emissions from crop, soil and livestock management and carbon dioxide from energy use. Six of the management practices were presented in the stakeholder workshops, although the stakeholders comments covered a broader range. Details of the methodology are set out in Annex 1.
An overview of the effects of organic management practices on biodiversity, soil carbon, GHGs and how organic farming practices might help farmers adapt to a changing climate in Scotland over the next two decades to 2045 (termed adaptability) as found in this project are shown in Table 1. The evidence assessed indicates that organic management practices tend to be beneficial for biodiversity and soil carbon. With respect to GHGs, Eory et al. (2023) identified that cover crops, and legume grass mixtures, practices associated with organic farming, reduced emissions, although this is expressed on a per area basis. Nevertheless, crop residue management may be a hot spot for nitrous oxide emissions while mechanical weeding increases fuel use. Organic management practices also tend to make the system more resilient, and hence better able to adapt to the projected weather conditions of 2045.
Table 1. Summary of impacts of practices on biodiversity, soil carbon, GHGs and adaptation gathered from the Rapid Evidence Assessment (REA) and the Stakeholder workshops (SHolder); green (+) indicates a positive response, yellow (n) neutral and red (-) negative. Blank cells indicate insufficient evidence.
| Management Practices | Biodiversity | Soil Carbon | GHGs | Adaptability | ||||
| REA | S/H | REA | S/H | REA | S/H | REA | S/H | |
| Organic farming | + | + | + | + | + | + | + | + |
| Rotation management | + | + | n | |||||
| Reliance on legumes | + | + | + | + | + | + | ||
| Increasing in field crop diversity | n | + | ||||||
| Cover crops | n | + | n | |||||
| Crop residues | + | + | - | n | ||||
| Use of bulky organic materials | n | n | + | + | n | + | ||
| No synthetic inputs – weed control | + | + | + | - | + | + | ||
| No synthetic inputs – pest control | + | + | + | + | + | + | ||
| No synthetic inputs – disease control | + | + | + | + | + | + | ||
| Tillage – reduced | n | n | + | n | n | + | n | |
| Grazing practices | + | n | + | – | ||||
| Veterinary products | + | |||||||
| Animal health management | + | |||||||
Organic Farming – holistic assessment
Organic farming is a systems approach to farming the land, and hence the environmental goods and services delivered are not easily attributable to individual practices. Consequently, rather than investigating specific practices in organic farming, most of the literature takes a systems approach when exploring differences between conventional and organic farming systems. This section summarises the key impacts on the holistic assessment of organic farming.
The literature therefore focusses on comparing a combination of management actions that characterise organic systems, typically investigating the consequences of:
- the exclusion of agrochemical inputs (e.g. inorganic fertilisers, herbicides, fungicides, and insecticides)
- reliance on organic manures
- the inclusion of pasture and legumes within the rotation
Furthermore, organic farms also tend to have higher habitat diversity (Hardman, et al. 2016). In a limited range of studies, lower water run-off and greater water infiltration was observed in organically managed treatments (encompassing a range of factors indicated above) compared to conventionally managed ones. A combination of management strategies is also used on organic livestock farms (e.g. lower concentrate feeding, more robust breeds, more use of pasture etc.) which also makes identification of the key causative factors difficult. Moreover, many of these practices are not exclusive to organic farm management and several are increasingly utilised in systems that are not certified as organic, and therefore arguably labelled conventional. This makes it difficult to determine the key factors exclusive to organic management that drive impacts.
Biodiversity
When comparing organic and conventional farming systems, impacts of organic farming on biodiversity were typically positive or neutral, with negative impacts rarely observed. Impacts differed depending on context (e.g. arable versus grassland, landscape type) and group of organisms (taxa).
Typically, plants benefitted from organic farming practices (Rotchés‐Ribalta et al. 2020; Dobben, et al. 2019; Happe et al. 2018; Albrecht et al. 2020), and this was more pronounced in arable situations (Gabriel et al. 2010; Gibson et al. 2007; Schumacher et al. 2018) and for insect pollinated plants (Happe et al. 2018; Geppert et al. 2020; Gabriel and Tscharntke 2007).
Impacts on plant communities, were strongest within fields, but effects were often found to spill over to adjacent field margins and hedgerows (Happe et al. 2018; Gabriel and Tscharntke 2007; Boinot et al. 2022; Rundlöf et al. 2010; Gabriel et al. 2010). The greater abundance and diversity of crops and weeds in organic systems often result in a greater abundance and diversity of both pest insects, e.g. aphids, as well as their enemies; aphid-parasitoids and predators such as ladybirds (Puech et al. 2014; Sidauruk and Sipayung 2018; Birkhofer et al. 2016; Caballero-López et al. 2012).
The higher abundance and richness of flowers both in the crop and in the field margins typically attracted more pollinating insects including butterflies (Hardman et al. 2016; Feber et al. 2007; Gabriel et al. 2010), solitary bees (Happe et al. 2018), hoverflies (Geppert et al. 2020; Power, et al. 2016) and bumblebees (Sidemo‐Holm et al. 2021, Geppert al. 2020) with threatened bumblebees particularly benefitting (Marja et al. 2018). Impacts on pollinators were, however, context specific with some studies detecting no impacts on bumblebees (Happe et al. 2018; Hardman et al. 2016) and solitary bees (Gabriel et al. 2010; Hardman et al. 2016). Only one study found negative effects of organic farming on pollinators, specifically hoverfly adults. This trend was not found for larvae and was attributed to spill over, where organic farms acted as a source of adults that spilled over to neighbouring conventional farms (Gabriel et al. 2010).
Assessments of the impact of organic farming on organisms that feed on dead and decaying material (for example, earthworms) showed inconclusive results. Studies on earthworms found both positive (Pelosi et al. 2015) and neutral effects (Pelosi et al. 2009). For organisms that kill other organisms, and which could be considered natural predators for the control of pests (natural enemies), impacts varied across functional groups with characteristics such as food preferences, ability to move location and how they hunt prey coming into play (Boeraeve et al. 2022; Chemlik et al. 2019; Gallé et al. 2019). For example, ground hunting spiders which typically have low dispersal capabilities were favoured in organic systems (Boeraeve et al. 2022; Feber et al. 2015) while impacts on more mobile web building species were neutral (Boeraeve et al. 2022; Feber et al. 2015). Organic farms, particularly if conservation tillage is adopted and/or grass leys are included in the rotation, are likely to provide greater opportunities for less mobile spiders to overwinter in field. Mobile species, such as money spiders, are less impacted by infield disturbances as they quickly disperse from surrounding habitats by ballooning. Due to their presence in fields early in the season, ground beetles were found to be sensitive to spring cultivation which is more frequent in organic systems (Chemlik et al. 2019).
Studies exploring the impacts of organic farming on bird communities typically report positive (Marja et al. 2014) or neutral (Hardman et al. 2016) impacts. Most species had similar abundances in organic and conventional systems (Moorcroft et al. 2002; Henderson, et al. 2012). Positive impacts of organic farming were found for lapwing and woodpigeon with both species showing a strong association with pulses, common in organic rotation. Lapwings were also associated with grasslands and spring cereals, while woodpigeons were favoured by the higher area of uncropped land (Henderson, et al. 2012). Skylarks were also favoured by the presence of uncropped land, potentially due to a greater availability of insects during the breeding season (Henderson, et al. 2012). Only one study found negative impacts of organic farming on birds (Moorcroft et al. 2002). Skylarks were found to prefer conventional barley stubble over undersown organic wheat and the more open structure of barley increased seed accessibility and supported a higher abundance of broad-leaved weeds increasing the diversity of forage (Moorcroft et al. 2002). The experimental design, however, made it difficult to tease apart impacts of crop type, undersowing and organic farming.
Organic systems typically increase the diversity of weeds (Madsen et al. 2020). However, the abundance of weeds is influenced by the choice of crop, cover crop, cropping sequence and the application of farm-yard manure (Kuht et al. 2016; Madsen et al. 2016; Madsen et al. 2020).
Soil carbon
Long-term studies indicate that the soil carbon in organic systems is higher than in conventional systems (Leifield and Fuhrer 2010; Gattinger et al. 2012; Colombi et al. 2019). There is conflicting evidence as to the cause of the increase in soil carbon in organic systems. In the meta-analyses by Leifield and Fuhrer (2010) and Gattinger et al. (2012), the increase in soil carbon was attributed to the increased level carbon in the organic material added to organic systems. The composition of the rotation is also influential, although the incorporation of forage legumes in the rotation was not a contributing factor (Gattinger et al. 2012). However, a recent study showed that the differences were not due to the quantity of carbon returned as manures or crop residues but were influenced by improved soil structure (Colombi et al. 2019). Nevertheless, the organic conventionally ploughed soils had higher soil carbon contents than either the conventionally ploughed or reduced till farmland. In organic systems, the inclusion of green manures, farm-yard manure, residue management and the inclusion of cover crops in the rotation all potentially contribute to the enhancement of soil carbon stocks (Gattinger et al. 2012; Hu et al. 2020). Their inclusion is crucial for maintaining the fertility of organic systems (Córdoba et al. 2018).
Greenhouse gas emissions
Agriculture has a significant impact on climate change through the emission of GHGs in the form of nitrous oxide, methane and carbon dioxide. Nitrous oxide results from the use of organic and synthetic fertilisers, crop residue management, and manure management. Methane emissions are also affected by manure management and by livestock production efficiency which is influenced by animal genetics, animal feeding practices and animal health and welfare status. The energy use on-farm is the primary cause of the emissions of carbon dioxide. Emissions arise from the transportation of inputs and outputs and those embedded in the production of inputs.
Nitrous oxide emissions were generally lower in organic treatments than conventional ones when based on output per unit land area (Autret et al. 2019; Biernat et al. 2020). However, the emissions on a yield-scaled basis tend to be similar or higher for organic systems (Pugesgaard et al. 2017; Skinner et al. 2019). Methane emissions from livestock were increased by converting to an organic system, but these were offset by the reduction in emissions from feed production (Gross et al. 2022).
The impact of the energy use on GHGs from organic systems compared to conventional systems was a function of the enterprise type (Smith et al. 2015). Arable crops were either negative or neutral, and livestock enterprises had positive, neutral, and negative responses. At the farm level, the energy use for mechanical weeding is higher for organic systems though this is offset by the reduction in energy use associated with the application and production of agrochemicals (Mäder et al. 2002; Aggestam and Buick 2017). The off-farm energy use was also a function of the enterprise type (Smith et al. 2015). Thus, the GHGs per unit of product for organic systems may be lower or higher than observed in conventional system depending on both the specific management practices and the type of product produced (e.g. Haas et al. 2001; Bos et al. 2007). However, because organic systems are lower yielding, the total global emissions may increase due to increased food production elsewhere (Smith et al. 2019).
Adaptability
The soil organic carbon and the water holding capacity of soils that were managed organically but were conventionally ploughed tended to be greater than conventionally managed soils that were either ploughed or were not tilled (Colombi et al. 2019).
Stakeholder views
The view that organic farming is a holistic approach was supported by the stakeholders. There were strong views that organic farming is an holistic approach and should not be decomposed into individual practices, as this conflicts with the ethos of organic farming. Unlike regenerative agriculture, organic farming is defined by specified standards.
The stakeholders reported that the current carbon calculators do not take account of the holistic approach, and in particular the role of legume-based grasslands on soil carbon. Stakeholders considered that organic farms are less intensive than conventional farms which makes them more resilient to environmental shocks, e.g. weather extremes.
Specific management practices
This section will examine the evidence for benefits and disbenefits of individual farm management practices on biodiversity, soil carbon, GHGs and adaptability. Where the stakeholders have expressed views on the specific management practices, these have also been included in each sub-section.
Rotation management
A crop rotation is the sequence of different crops that are grown over a number of years. Typically, in organic systems, the rotation is more diverse than conventional farming and contains plants from different families, e.g. cereals, oilseeds, legumes. The organic rotation design is fundamental to maintaining soil fertility, and controlling pests, diseases and weeds (Watson et al. 2006). The rotation will typically include legumes to build soil nitrogen, and the application of livestock manures and crop residues will be carefully managed to recycle nutrients within the system.
Biodiversity
The simplification of landscape structure (e.g. loss of hedges and walls, and simplification of crop rotations) is a key driver of declines in farmland biodiversity (Benton et al. 2003). Crop rotations support a patchwork of different infield landcovers (e.g. oilseed rape, field beans), and creates temporal diversity (e.g. spring sown and winter sown crops), thus enhancing landscape diversity. Diverse landscapes, with a range of different habitats provide a variety of different resources (diverse food resources, nesting habitat, overwintering sites) which not only support different species, but also help ensure that individuals can meet their resource requirements through their lifespan. New evidence has found that crop rotation diversity is higher in organic farming particularly in more productive land (Reumaux et al. 2023). The wider research indicates that more diverse crop rotations are likely to have positive impacts on biodiversity, however, research in this area is lacking (Dicks et al. 2020).
Soil carbon
There is evidence from an international meta-analysis that suggests that diverse rotations result in a small but significant increase in the soil carbon relative to a cereal monoculture (McDaniel et al. 2014, cited in Smith et al. 2018). The inclusions of leys in an arable rotation also increases the soil carbon stocks (Jordon et al. 2022).
Greenhouse gas emissions
From the REA, no relevant papers were found.
Adaptability
Organic crop rotations are frequently more diverse which builds resilience into the system by reducing the overall impact of crop failures due to abiotic and biotic factors. Such crop losses can have dire consequences for systems reliant on the yields of a few crop species. Organic systems also provide more niches for weeds than conventional rotations which reduces the chance of single weed species dominating (Ulber et al. 2009; Benaragama et al. 2019; Seipel et al. 2022). The combination of less diverse rotations and herbicides results in conventional rotations having lower weed species diversity and richness when compared to organic crop rotations (Ulber et al. 2009; Schumacher et al. 2018). Including species (e.g. plantain or chicory) with tap roots in the rotation can help to alleviate compaction and improve the drainage (Lynch and Wojciechowski 2015 cited in Smith et al. 2018).
Reliance on legumes
Organic systems are heavily reliant on legumes within the crop rotation or incorporated into grass leys. This is because legumes can fix nitrogen from the atmosphere, and hence they build fertility and provide nitrogen to the other crops in the rotation. Legumes typically used in Scottish organic systems include clovers, vetches, peas and beans.
Most of the organic land in Scotland is grassland. White clover is the most common legume incorporated into grassland seed mixtures alongside grasses and herbs and is used for both grazing and silage. For silage production red clover/ryegrass leys are also used. Grass/legume leys are typically established by undersowing the seed into a preceding arable crop (e.g. oats).
In stockless organic systems, legume based green manures (a crop which is grown to incorporate into the soil) are typically included in the rotation, while in stocked systems, grass-legume leys (generally multi-species including one or more clovers but sometimes other forage legumes too) are part of the rotation, which are grazed by ruminant livestock.
Biodiversity
The use of legumes in both grassland and arable systems will enhance heterogeneity at the micro-habitat and farm scale which is likely to have positive implications for biodiversity (Benton et al. 2003). Legumes provide profitable sources of nectar and pollen, and the loss of legume-rich habitats is linked to pollinator declines (Goulson et al. 2008; Kleijn and Raemakers 2008). The wider research exploring the inclusion of grass clover leys in arable systems has found lower levels of pest and positive benefits to spider but not ground beetles (Dicks et al. 2020).
Soil carbon
Increasing the proportion of legumes in the rotation has a positive impact on soil carbon, with perennial legumes having a larger effect than annual legumes (Feiziene et al. 2015).
Greenhouse gas emissions
The nitrous oxide released by legumes is lower than crops receiving synthetic fertiliser (Stagnari et al. 2017 as cited by Smith et al. 2018). There is also a reduction in GHGs associated with the transport and the production of synthetic fertiliser.
Adaptability
From the REA, no relevant papers were found.
Stakeholder views
The benefits of legumes for both above and belowground biodiversity was supported by the stakeholders. The inclusion of legumes in organic systems reduces GHGs due to the reduction in the requirement for synthetic fertilisers, providing soil cover, and by reducing the need for bought in feed for livestock. The stakeholders also identified that forage legumes enhance the soil organic matter content, which will improve the ability of the soil to retain water in drought conditions. Grain legumes, and in particular peas can be difficult to grow in Scottish conditions. There is a need to develop cultivars and mixtures that are appropriate to Scottish conditions, this is particularly important for grain legumes. This constraint is coupled with a limited market for the product.
Increasing in-field crop diversity (e.g. intercropping, varietal mixes)
Field crop diversity means that more than one variety or species are grown together in the same field. In some cases, they may be mixed together, in other cases they may be sown separately in strips. In organic systems, undersowing an arable crop with clover or grass-clover is a standard practice. A form of field crop diversity is intercropping (e.g. growing a legume and a cereal together which may be harvested as a whole crop for feed or harvested and separated for the grain). Varietal mixes, where multiple varieties of the same species (e.g. barley) are sown in combination in a field is also a form of increasing field crop diversity. However, there may issues about the acceptability of mixtures by the food and drink industries.
Biodiversity
Increasing crop genetic diversity through intercropping or varietal mixes is likely to increase the diversity of food resources for above and below ground biota. Intercropping is also likely to enhance the structural diversity of a field, resulting in a broader array of microhabitats with positive implications to biodiversity. A study exploring varietal mixes found no impacts on wild plant diversity but did find positive impacts on above (spiders and carabids) and below ground (Collembola) arthropods (Chateil et al. 2013). These findings support wider research which illustrates positive impacts of intercropping and under-sowing cereals across a range of organisms (taxa) (Dicks et al. 2020). There is, however, evidence that while undersown and conventional stubble fields have similar seed densities, that the more open structure of conventional stubble increases the accessibility of seeds for granivorous birds (Moorcroft et al. 2002). The experimental design, however, made it difficult to tease apart impacts of crop type, undersowing and organic practices indicating a potential area for future research.
Soil carbon
From the REA, there was no evidence of increasing in-field crop diversity impacting on soil carbon. Wider research has found a reduction in soil carbon in intercropped systems, and this was attributed to a higher diversity of below ground activity stimulating soil processes such as the decomposition of organic matter (Brooker et al. 2023).
Greenhouse gas emissions
From the REA, no relevant papers were found. Nevertheless, in varietal mixes, the risk of disease is reduced and therefore the need for the application of synthetic pesticides is reduced. In addition, for legume-based intercrops, the requirement for synthetic fertiliser is reduced. The reduction in application of synthetic inputs will reduce GHG emissions.
Adaptability
Productivity and stability of the yield between years often increases with diversity, due to the increased resilience of the system (Johnson et al. 1996) which is vital in adapting to future climate conditions. Broader research has highlighted that in Scotland that the benefits of intercropping compared to sole crops might increase if summers become warmer and drier as predicted by climate models (Brooker et al. 2023). Genetically diverse plant material (e.g. composite cross populations or varietal mixtures) often perform best under organic systems whereas genetically uniform material (e.g. varieties) often do best under conventional farm management systems for which they have been bred (Legzdiņa et al. 2022). Conventional crop varieties are genetic monocultures bred for high input conventional systems in which synthetic inputs (fertiliser and pesticides) are used to maintain the growing environment. Without access to such inputs organic cropping materials must be diverse in character to suit the more diverse growing environment (Legzdiņa et al. 2022). Trials for new varieties are typically conducted in conventional systems with high levels of synthetic inputs. As a result, varietal selection focuses solely on yield optimisation and disease resistance. Additional focus to determine varieties that perform well in low input systems would help advance efficiency in organic, and other low input, systems.
Stakeholder views
Companion cropping are alternatives to the application of synthetic pesticides as these reduce the risk of a reduction in yield due to plant diseases. This is because of the genetic variation associated with the different species and varieties sown.
Cover crops
Cover crops are grown seasonally between the main arable crops and are not normally used to produce a product for sale. The inclusion of cover crops in the rotation avoids bare soil being exposed, and reduces the risk of soil erosion, and nutrient losses. In organic systems the cover crop may be grazed off by livestock before the residues (roots and stubble) are incorporated into soil as the ground is prepared for the next crop. This practice also occurs on conventional farms growing spring crops, although it is more commonly found on organic systems. In conventional systems, cover crops are often destroyed with herbicide prior to sowing of the following crop.
Biodiversity
Research exploring the impact of cover crops on biodiversity in organic systems was lacking, although the wider literature indicates positive impacts on earthworms (Pelosi 2009). Cover crops will reduce soil erosion, and therefore, they are likely to improve the ecological status of waterbodies. The impact of cover crops is likely to be dependent on both the method of destruction (e.g. cultivation versus grazing it bare and overseeding, or application of glyphosate to kill off the cover by conventional farmers) and the alternative land use. For example, winter stubble benefits a wide range of groups of organisms (taxa) (Dicks et al. 2020), and its destruction to establish cover crops could adversely impact on some species (e.g. seed eating birds). Comparing potential trade-offs across taxa provides an interesting area for future research. Cover crops tend to reduce weed growth (Madsen et al. 2016), although the weeds and weedbank are affected by the species included in the cover crop mixtures (Madsen et al. 2017).
Soil carbon
The result from a European meta-analysis of long-term studies indicates that the inclusion of cover crops do not lead to an increase in the soil carbon stocks (Jordon et al. 2021). The results of three long-term experiments in Denmark support this observation (Hu et al. 2018). In contrast, the results from a long-term organic trial in Estonia showed variability in the response of the soil carbon to the inclusion of cover crops in the rotation (Eremeev et al. 2020; Are et al. 2021; Kauer et al. 2021). This was influenced by the phase(s) in the rotation assessed.
Greenhouse gas emissions
There is limited evidence that indicates that the inclusion of a cover crop does not affect the nitrous oxide emission, although the choice of cover crop can influence the emissions, and the subsequent nitrogen benefit to the following crop (Li et al. 2015). Although the total emissions were not affected, the distribution of the emissions during the season were affected by whether the crop was harvested in the autumn or ploughed in just before sowing the following crop (Li et al. 2015).
Adaptability
Bare ground is more exposed to abiotic stresses such as wind erosion and rain compaction. Climatic changes may result in greater, and less predictable, changes and levels of abiotic stresses related to temperature, solar radiation and rainfall patterns. Cover crops offer protection from these stressors, but they also offer refuge for pathogens (e.g. clubroot), pests (e.g. slugs), and natural enemies (e.g. predatory beetles (Sereda et al. 2015). The challenge is achieving the right balance of crop species included in the cover crop and the timing of the operation to minimise pest damage. The choice of species included in the cover crop mix will also influence both the weed abundance and the diversity of weeds (Madsen et al. 2017). The inclusion of cover crops in the rotation may also reduce the water holding capacity of the soil (Are et al. 2021), putting the main crop at greater risk of drought. However, this is mitigated by the inclusion of bulky organic materials in the rotation (Are et al. 2021).
Crop residues
In organic farming, the crop residues (stubble) are typically left on the field after the crop has been harvested. The residues include straw that is chopped and returned but excludes straw which is harvested and used for bedding. Crop residues reduce the risk of erosion and are typically incorporated into the soil before planting the following crop. Their return supports the fertility of the organic system. In stockless organic systems, green manures (which contain legumes to build fertility) are typically included in the rotation. During the growing season, they will be cut several times with the residue left on the field. They will be incorporated before planting the following crop.
Biodiversity
The wider literature indicates that winter stubble provides a variety of resources for a range of organisms (taxa) including plants, insects, spiders, mammals and farmland birds (Dicks et al. 2020). Perhaps most notable is the potential for stubble to provide winter forage for seed eating birds such as yellowhammer and skylarks. Undersowing, a practice common in organic systems, however, can reduce the accessibility and diversity of seeds (Moorcroft et al. 2002). Although research exploring the impact of incorporating crop residues is limited, benefits on natural predators (natural enemies), specifically spiders and carabids, have been found (Sereda et al. 2015). It is likely that through benefitting soil health, the retention of residues will also benefit soil biodiversity.
Soil carbon
The inclusion of a cut and mulched green manure tends to increase the soil carbon stocks (Hu et al. 2018). Global meta-analysis indicate that the addition of crop residues enhances soil carbon stocks (Poeplau & Don 2014; Mcclelland et al. 2020). Nevertheless, the stability of the carbon will be dependent on the management practices adopted.
Greenhouse gas emissions
Crop residue nitrogen content is a major driver of nitrous oxide emissions (Pugesgaard et al. 2017).
Adaptability
Similarly to cover crops, crop residues offer protection from erosion and soil compaction. Crop residues such as straw/litter from previous crops help protect the soil from such stresses. They also offer refuge for pests, such as slugs, and predators, such as beetles (Sereda et al. 2015).
Use of bulky organic materials
Bulky organic materials include farmyard manure, compost, digestate and green waste. Farmyard manure might be produced on stocked farms and redistributed within the farm to crops or grassland destined for silage. Those without their own stock might import manures, or other bulky materials such as digestate or green waste compost (e.g. the manure from organic poultry units must be returned to organic land). As well as providing nitrogen, phosphorus and potassium, bulky manures also provide micronutrients to the crop. The nutrient content of the bulky organic material is a function of manure type (including livestock species), and the treatment of the bulky organic material. Again, these practices are not exclusive to organic farms. However, these approaches to nutrient and soil organic (carbon) management are predominant on organic farms where many conventional systems will combine bulky organic manures and synthetic fertilisers. Sewage sludge application is not permitted in organic production.
Biodiversity
The use of bulky organic materials is thought to enhance soil invertebrates that feed on dead and decaying material which in turn increases food supply for predatory arthropods in organic systems (Pfiffner and Luka 2003). The impact also varied with group of organisms (taxa), with wolf spiders and carabids typically having higher densities in organically fertilised plots, while money spiders and rove beetles had higher densities in plots receiving inorganic fertilisers, impacts however varied with crop type and year (Eyre et al. 2009). Exploration of the wider literature comparing inorganic fertilisers with organic materials, found organic fertilisers typically benefitted a range of organisms (taxa) including plants, collembola, earthworms, and predatory beetles (Dicks et al. 2020). Impacts, however, varied between taxa and effects were not always consistent with impacts on ground beetles, ranging from positive (Hance and Gregoirewibo 1987) to neutral (Birkhofer, et al. 2008). Animal dung can be contaminated with veterinary medicines and residues of wormers (i.e. ivermectin) can retain toxic effects to terrestrial and freshwater invertebrates (Sands and Noll 2022). Research comparing nutrient run-off from organic and inorganic fertilisers is inconclusive with some studies finding no impact, while another found greater runoff in plots receiving organic fertilisers (Dicks et al. 2020).
Soil carbon
The modelled estimates of the inclusion of bulky organic material in the rotations suggests that soil carbon will increase (Knudsen et al. 2014). The application of farmyard manure almost always improved soil carbon (e.g. Fließbach et al. 2007; Heinze et al. 2010; Are et al. 2021; Kauer et al. 2021; Alvarez 2022; Krause et al. 2022; Sosulski et al. 2023). The change in the soil carbon pools is influenced by the type of organic bulky material applied (Boldrini et al. 2007). For example, composting the manure before application is likely to have a greater impact on the soil carbon than uncomposted manure (Fließbach and Mäder 2000, cited in Smith et al. 2018). In addition, the crop may also influence the impact (e.g. there was no difference in the soil carbon for potatoes receiving either farm-yard manure or fertilisers (Eremeev et al. 2020)).
Greenhouse gas emissions
Replacing fertiliser inputs with organic manures had no significant effect on the on-farm emissions of nitrous oxide and methane in conventional systems (Skinner et al. 2019). Nevertheless, although the N inputs in the organic systems were approximately half of those applied in a similar conventional system, there was no impact on the yield-scaled emission (Skinner et al. 2019). As bulky manures have high concentrations of carbon and nitrogen there is an increased risk of nitrous oxide emissions when they are applied in wet conditions (Rodrigues 2006, cited in Smith et al. 2018).
Adaptability
From the REA, there was no evidence of bulky organic material on adaptability. However, treatment of manure can influence adaptability. The high temperatures achieved when manure is composted are known to kill plant disease and weed seeds (Litterick et al. 2003) and thus this practice is encouraged in organic farming.
Stakeholder views
The types of bulky organic manures and composted waste (e.g. sewage sludge) that can be used on organic farms are restricted. The addition of bulky manures has benefits for soil biodiversity, which provides feed for the birds. However, applying bulky manures which contain veterinary medicines can also have negative consequences for biodiversity, and their use has to be carefully managed to avoid pollution. Their application improves the soil structure, increases the soil organic matter, improves drainage and increases the water holding capacity of the soil. Consequently, the soil is more resilient to both drought and extreme rainfall events. With climate change, the risk of pests and diseases is likely to increase, and the use of bulky organic manures may reduce the risk. However, there is a huge knowledge gap in the interplay between crop nutrition and crop health.
No synthetic fertilisers, pesticides, herbicides
In organic systems the application of synthetic fertilisers, pesticides and herbicides is prohibited. Natural compounds can be used when there is a specific threat to the crop. Records which demonstrate the need for such an application must be kept.
Biodiversity
The use of inorganic fertilisers can result in nutrient leaching and run-off adversely impacting on freshwater biodiversity. A reduction in inorganic inputs can also benefit plant diversity (Koch and Meister 2000; Rotchés‐Ribalta et al. 2020; Fonderflick et al. 2020; Dobben, et al. 2019) with positive implications to invertebrates. For example, unfertilised grasslands have been found to support more rare specialist moths (larvae associated with a limited number of plant species) (Mangels et al. 2017).
Reduction/or avoidance of herbicide applications results in richer, more abundant, plant assemblages (Fonderflick et al. 2020). Studies comparing plant communities in organic and conventional systems, typically identify that the lack of herbicides has a positive impact on biodiversity (Carrié et al. 2022; Sidemo‐Holm et al. 2021) with effects most prevalent in arable fields. The positive impacts often extended to field margins due to lack of spray drift (Happe et al. 2018; Marja et al. 2018).
A reduction of pesticide use was found to have a positive impact on bats (Barré et al. 2018) and earthworm populations (Pélosi et al. 2013). Earthworms closest to the surface were particularly vulnerable to the application of synthetic products and impacts of insecticides were greater than either herbicides or fungicides (Pélosi et al. 2013). Impacts of plant protection products on ground beetles varied depending on diet and size (Eyre et al. 2012) and while the removal of insecticides did not impact on the density of natural predators of pests (e.g. ladybirds, lacewings and hoverflies), it increased the predator prey ratio suggesting that natural pest control is more effective in the absence of insecticides. Drawing from the wider literature, there is strong evidence that a reduction in synthetic fungicides, herbicides and insecticides benefits a range of groups of organisms (taxa) including invertebrates, plants and birds, although neutral and negative impacts are sometimes detected (Dicks et al. 2020).
Soil carbon
From the REA, no relevant papers were found.
Greenhouse gas emissions
The reduction in GHGs is due to the reduction in the number of tractor operations and the amount of agrochemicals and fertilisers applied as well as emissions associated with their manufacture. However, this reduction in emissions can be offset by an increased requirement for mechanical weeding and / or the application of bulk organic materials.
Adaptability
Resistant crop varieties and crop protection products currently form a significant component of crop protection programmes. However, crop breeding and the development of new pesticidal active ingredients takes many years. Although modelled projections of yield are expected to increase under climate change in high latitudes (Chaloner et al. 2021), the relative pressure from pests, weeds and disease could increase at such a rate that plant breeding and pesticidal development will not be able to keep pace (Chaloner et al. 2021; Steinberg and Gurr 2020). Biological approaches to crop protection confer adaptation to future pest and disease threats. Invertebrate pests are often more prevalent in organic systems (Krey et al. 2019) as is biological control through natural process such as predation and parasitism (Birkhofer et al. 2016; Caballero-López et al. 2012; Chabert and Sarthou 2020; Inclán et al. 2015; Sereda et al. 2015; Muneret et al. 2018; Sidauruk and Sipayung 2018). Reasons for this include a lack of synthetic insecticides which would kill beneficial insects and prey, and the greater food and habitat provision through the increased plant diversity in organic systems, which is achieved through more diverse rotations and the omission of herbicides. System (conventional, new and old organic fields) and landscape complexity (amount of pasture and the area of field borders, wild flower strips) affect pests, natural predators for the control of pests (natural enemies), and biological control services (Birkhofer et al. 2016; Török et al. 2021).
Stakeholder views
This is fundamental to organic farming as it supports biodiversity. The restrictions on synthetic products are defined. However, this is not the case for agroecological or regenerative systems. The restrictions imposed by the organic standards limit the ability of farmers to deal with weeds and pests, and therefore alternative methods are required. There was a view that additional research and sharing of good practice would help support farmers in dealing with these challenges. The lack of synthetic inputs helps to maintain healthy farm ecosystems which has benefits for the soil, and soil carbon storage as well as for above and belowground biodiversity. Healthy ecosystems also help buffer against unexpected fluctuations in weather and pest and disease pressures. However, although organic farmers cannot apply synthetic pesticides, they are able to apply a limited range of products in specific situations (e.g. copper oxychloride for blight control) that are damaging to nature. Application of these products are restricted in amount and only allowed where there is no successful alternative control mechanism (e.g. in the case of potato blight).
Tillage
Minimum till or zero till systems reduces the degree to which the soil is disturbed when the crop is sown. Stocked organic systems generally contain a ley phase established by undersowing the main crop with a grass-clover ley which reduces the amount of tillage compared with an all arable system. This ley is then left following harvest. Many arable crops can also be established by minimum till or zero till methods. Nevertheless, because of the need to control pests and weeds in organic systems through cultivation, minimum till or zero till systems are more often observed in non-organic systems.
Biodiversity
Research exploring the impact of reduced tillage (e.g. direct drill, and methods to reduce the depth of cultivations) on biodiversity in organic systems was inconclusive and dependant on the group of organisms (taxa) and context. Positive impacts were detected for bats (Barré et al. 2018). Effects on earthworms varied with crop type and tillage practice and ranged from negative to neutral (Metzke et al. 2007). The population of predators such as ladybirds and carabid beetles are often influenced by tillage frequency, whereas the population of parasitoids are rarely affected (Puech et al. 2014). Impacts of tillage on soil invertebrates may take years to develop, and short-term studies are unlikely to accurately reflect impacts. Nevertheless, there is evidence to suggest that nematodes are increased in reduced tillage systems (Schmidt et al. 2017, cited in Junge et al. 2020). The wider literature indicates that reduced tillage is likely to be beneficial with positive effects found for invertebrates, weeds and farmland birds. Effects however varied with taxa, crop type and tillage practice (Dicks et al. 2022).
In organic systems reduced tillage has been found to increase weed abundance (Armengot et al. 2015; Gronle et al. 2015; Benaragama et al. 2019; Seipel et al. 2022) with a particular increase in perennial weeds thus shifting the community composition of perennial and arable species, although not impacting species diversity itself (Armengot et al. 2015). Reduced/no till land often experiences more grass weed issues (typically low levels of dormancy) and sometimes less broad leaf weed problems as those seeds remain deep within the soil profile.
Soil carbon
Reduced tillage increases the soil carbon in the topsoil (Jordon et al. 2022; Szostek et al. 2022; Fotana et al. 2015). However, the effect is moderated by the soil texture (Fotana et al. 2015, Krauss et al. 2022), and the inclusion of green manures (Emmerling 2007) or composted manures (Krauss et al. 2017) in the rotation. Although the effect is reduced with soil depth (Jordon et al. 2022), the soil carbon in the total soil profile tends to increase (Krauss et al. 2022).
Greenhouse gas emissions
Tillage did not significantly affect either nitrous oxide or methane emissions (Krauss et al. 2017). The reduction in GHGs associated with organic production is due to the reduction in the number of tractor operations.
Adaptability
In reduced tillage systems, the organic matter in the topsoil increases, and hence increases the water holding capacity of the soil (Gronle et al. 2015). Drought, flooding and elevated temperatures have less effect on the soil microbial communities and plant health in reduced tillage systems (Kaurin et al. 2018).
Stakeholder views
Reduced tillage improves the soil structure and the soil biodiversity. However, the views of the viability of reduced tillage as a practice differed. They ranged from introducing tillage as a compulsory practice in organic systems to the requirement of organic farmers to use the plough at some points in the rotation to control the weeds. There were also concerns raised that promoting reduced tillage with conventional farmers would increase the use of glyphosate, which is used to kill the weeds, and therefore have negative consequences for biodiversity. It was also raised that there is evidence that pesticide and fertiliser use has increased in reduced tillage systems in the US. Some stakeholders held the view that the applicability of using reduced tillage methods was dependent on the soil type, weather conditions and the crop to be planted (e.g. it was also stated that spring barley is a difficult crop to establish using reduced tillage methods).
The benefits for GHGs are due to the reduced fuel use, and potentially a reduction in soil related GHGs which the stakeholders attributed to reduced leaching. It was also highlighted that the soil carbon sequestration may be short-term, and only affect the topsoil.
Grazing practices
The grazing practices adopted by the organic farmer are not just about maximising production. It is also imperative that the organic farmers consider the nutrient status of the soil, the botanical composition of the sward or forage and animal health and welfare is maintained. Organic certification in the UK requires that at least 60% of livestock diet is produced on farm, and there is a strong push towards pasture grazing. Consequently, organic systems often involve lower stocking densities, and/or more regenerative grazing management to optimise pasture use (e.g. rotational and mob grazing strategies). Mob grazing means that the field or part of the field is grazed very heavily for a short space of time (1-few days) till the grass height is approximately 10-20 cm. After grazing, the field is left for a considerable time to allow the field to recover (e.g. 60-80 days) meaning that the livestock are grazing tall, mature grass when they do return to the field (i.e. 30-60 cm). Short term leys are typically incorporated into organic systems, which improve soil fertility. Rotational grazing also involves moving animals from field to field, but typically the animals remain longer in each field (e.g. 3 – 7 days), and graze the grass sward down to a lower level (e.g. 5 cm). Rotational grazing involves a much shorter rest period (e.g. 15-30 days) and the grass is shorter when livestock re-enter (e.g. 8-10 cm). In addition to the traditional grazing of grasslands, farmers are also utilising cover crops, winter cereals and other forage crops to provide feed for ruminant livestock. Silvopastoralism (where trees and grazing systems are combined) is not commonly practised in Scotland.
Biodiversity
Grazing management influences the structure and composition of vegetation with both overgrazing and under-grazing having deleterious impacts on biodiversity (Pulungan et al. 2019). Site conditions (e.g. soil type, hydrology and topography) alongside management actions (i.e. timing, frequency, intensity and species of livestock) all have a role to play in determining impacts. When compared to continually grazed organic pastures, extensively mown meadows (i.e. two cuts annually), and to a lesser extent rotationally grazed pastures, supported higher densities of butterflies and more plant species indicative of species-rich grasslands (Kruse, et al. 2016). Mowing, however, is contrary to the push to prolong the grazing period to reduce the need for supplementary feeding and rotational grazing may provide a suitable compromise. The wider literature indicates positive impacts of agroecological grazing regimes (e.g. mob grazing, adaptive multi-paddock grazing) on micro and macro arthropod communities. Impacts on plants were found to vary with grasses tending to be favoured at the expense of shrubs and forbs (Morris 2021). Mob grazing regimes will enhance the structural diversity at the farm level such that flowers and seeds are more present at any one point in time, and this is likely to favour a range of species including seed eating birds and insect pollinators.
Soil carbon
The inclusion of short-term leys into the crop rotation increases the soil stocks with the impact increasing with the length of the ley (Jordon et al. 2022).
Greenhouse gas emissions
Animal growth can be promoted by providing access to good quality pasture (Pottier 2009; Keifer et al. 2014). There is some evidence that giving animals access to pasture when the grass is in a strong growth phase benefits animal growth (Novak and Fiorelli 2011). Grazing parasite-naïve animals on clean pasture reduces parasite loads, promoting animal health and therefore efficiency of growth (Cabaret et al. 2002). Factors that promote efficient growth will reduce GHGs/kg product.
Adaptability
Productivity and stability often increase with diversity, resulting in increased resilience of the system (Johnson et al. 1996). This is vital for adapting to future climate conditions. Weed communities from no-tillage and grazed/reduced-till organic systems are often distinct from the tilled organic community, underscoring the effect that tillage has on the assembly of weed communities (Seipel et al. 2022). Higher weed biomass is often observed in grazed/reduced-till organic systems (Seipel et al. 2022).
Stakeholder views
The ethos of organic ruminant livestock systems is the use of home-grown grazed and conserved forage with a minimum use of purchased concentrates. This reduces the GHGs associated with the transport and production of purchased concentrates.
Rotational or mob grazing of grasslands helps supports soil health and protects the soil from erosion, particularly during periods of heavy rain. This type of grazing contributes to plant diversity due to the rest periods. However, heavy stocking can have benefits as it allows the sward to open-up, permitting the dormant native species to re-emerge. This needs to be very carefully managed to be successful.
Innovative farmers are practicing these alternative grazing practices and believe there are benefits to soil carbon. Nevertheless, the conclusive evidence for the benefits was questioned by some stakeholders, and they identified that there is a need for scientific evidence of the benefits, disbenefits and unintended consequences of these practices.
Financial pressures on farms in 1980s led to specialisation and a reduction in the traditional mixed systems. There is increasing interest among specialist arable farmers to reintroduce some ruminant livestock back into their systems. For example, grazing of autumn sown arable crops (e.g. winter wheat). This reduces the risk of a yield loss that can result from frost damage over winter. There is also the potential to include herbal leys, which are more resilient to extreme weather and enhance above and belowground biodiversity. The introduction of grazing ruminant livestock into arable systems can improve the soil carbon due to the incorporation of a ley, the return of excreta and trampling of the ground. Nevertheless, there is a need to investigate the long-term consequences of reintegration of livestock on the environment.
Veterinary products
The use of veterinary products is restricted in organic farms. Organic farmers aim to treat their animals as little as possible without impacts on animal welfare. The impact of veterinary products on the environment is due to both the application of and the disposal of the product.
Biodiversity
Research into the use of veterinary products focusses on the adverse effects that wormer residues (e.g. avermectin) can have on dung communities (e.g. flies, dung beetles). Organic farms had higher abundances and richer communities of dung beetles and this was attributed to both a reduction in the use of avermectin and differences in landscape structure (Hutton and Giller 2003). Adverse impacts of wormer residues on invertebrates, are likely to have knock on effects for birds that feed on dung insects (e.g. starlings and choughs) (McCracken 1993).
Soil carbon
From the REA, no relevant papers were found.
Greenhouse gas emissions
From the REA, no relevant papers were found.
Adaptability
From the REA, no relevant papers were found.
Stakeholder views
This management practice reduces the antibiotics found in food.
Animal health
The principle of organic farming is that good care, housing and management of animals results in animals that are less susceptible to disease. Under IFOAM regulations, there are no limitations on the use of medicines (other than a longer withdrawal period for sale of milk/meat) so antibiotics can be used to treat disease and thus safeguard animal welfare. However, the use of alternative remedies is actively encouraged. Therefore, organic farming has the potential to reduce anti-microbial resistance in the human population (Mendes Costa et al. 2023). Housing and management practices such as the use of lower stocking densities and the use of feed-faces designed to allow all animals good access to feed, water and comfortable lying areas during housing periods is promoted. An extended period of grazing is also encouraged. While there is a great deal of variation between farms in the standards of animal welfare, studies have typically shown that these regulations will improve animal experience. Typically, also, the use of breeds and strains of animals that are somewhat less productive, but more ‘robust’ to environmental and other stressors is encouraged.
Biodiversity
From the REA, there was no evidence of better animal health impacting on biodiversity although the relationship has not been directly explored. However, yield reductions could result in offshoring biodiversity impacts.
Soil carbon
From the REA, there was no evidence of animal health impacting on soil carbon.
Greenhouse gas emissions
When animals are healthy, they are more likely to be more productive in terms of growth in beef or sheep and in milk yield for dairy cattle. While good animal health is equally possible on conventional farms, the lower intensity of management systems, such as the use of more ‘robust’ breeds, and the use of lower stocking densities and more dietary forage, means that animals in organic systems may be less susceptible to disease than animals on conventional farms (Bareille et al. 2022 commenting on studies on extensive ruminant systems in France). As episodes of disease or ill health reduce growth in beef and sheep animals, animals that have experienced disease will be at an older age when they reach slaughter weight than non-diseased counterparts. Given that the daily GHGs/animal/day is roughly the same irrespective of disease status, a higher age at slaughter means higher emissions per kg of output (Novak and Fiorelli 2011). Similarly, disease in dairy cattle is associated with reductions in milk yield, which equates to a higher emissions per kg of milk across the animal’s lactation and lifetime.
Adaptability
From the REA, there was no evidence of animal health impacting on adaptability, but this relationship has not been formally addressed. A study considering extensive and intensive systems suggested that grazing animals may be more susceptible to parasitic infestations (Skuce et al. 2013).
Stakeholder views
The use of herd/flock health plans which incorporate herd / flock breeding objectives and management of the livestock has improved animal health, a principle which applies to organic farming as well as conventional systems. However, the restrictions on buying non-organic breeding stock and the ban on embryo transfer in organic farming has limited the opportunity to improve the genetic potential of the herds/flocks.
Additional relevant information raised by the stakeholders.
Buffer strips, field margins, hedges and trees were practices that were identified as having key benefits on organic farms for biodiversity, protecting watercourses, and providing wildlife corridors. Hedges and trees also provide shelter from extreme weather conditions for livestock.
There is a need for better engagement between science, practice and policy. The stakeholders also raised concerns about the feasibility of organic systems being part of the “less but better meat movement” due to the scalability and costs of production.
Gaps
The REA has illustrated that there is a body of work that assess the holistic nature of the benefits and disbenefits of organic farm management. However, the literature identified in the REA does not assess the trade-offs between the individual organic management practices and the ecosystem services delivered.
Although there is clear evidence that there are biodiversity benefits associated with organic farming, much of this has focussed on insect pollinators, predatory arthropods (particularly spiders and carabid beetles) and plants. Research on soil micro-arthropods, parasitoids, and mammals is comparatively scarce. This is most likely due to lack of expertise in taxonomy (e.g. parasitoids, springtails and soil mites) and difficulty in surveying (e.g. small mammals). Advancements in technology (e.g. soundscape analyses, metabarcoding and eDNA) may help to alleviate this bias.
Although there is evidence of organic management practices benefitting soil carbon, there is a need to have better quantification of the potential for these practices to sequester carbon. The influence of the practices needs to be studied on a long-term basis to ensure that the carbon added is not transient. There is also a lack of good studies that provide solid evidence of the impact of organic management practices on GHGs. It is also important that carbon calculators are further developed to fully account for the adoption of organic management practices.
In terms of the wider promotion of organic farming, there is a need to change the focus of plant breeding to produce varieties that will yield well under varied and less nutrient rich conditions, while also considering pest and disease resistance. There also needs to be more focus on breeding for novel and minor crops. This would help improve yields in organic farming and reduce losses due to weeds, pests and diseases. Improved yields would improve nutrient use efficiency and reduce nutrient losses as well as reduce GHGs per tonne of product.
Although there is evidence for the positive impact of organic management practices on the ability of Scottish agriculture to cope with projected climate change, the evidence is weak. Thus, there needs to be an increased focus on identifying the likely pressures on agriculture, and systems that have the resilience to cope with these stressors.
Limitations of the approach
Any REA or other type of review is limited by the date on which it is carried out. While in the review no evidence was found to indicate that crop diversity is higher in organic farming, a recent paper by Reumaux et al. (2023) indicates that crop rotation diversity is higher in organic farming particularly in more productive land. This is because conventional farming can utilise simpler crop sequences on good land due to the use of fertilisers and pesticides where organic production still requires diversity in the crop sequence to provide fertility via legumes and using crops with different susceptibilities to weeds, pests and diseases to manage crop health.
Undoubtedly the REA approach will not pick up all relevant literature because it uses title and keywords. If the authors do not use the term “organic farming” in the title and keywords, valuable literature can be missed. An example of this is the paper by Beillouin et al. (2021) entitled Positive but variable effects of crop diversification on biodiversity and ecosystem services.
A further limitation is that much evidence on, for example, the soil carbon benefits of grass/legumes leys has not been done in a specifically organic context although in reality the management of such leys is likely to be very similar whether organic or conventional.
PESTLE and SWOT Analysis
The PESTLE summary (Table 2) is informed by the current business and political environment. The SWOT (Table 3) summary is based on the literature review and the stakeholder engagement informed and has been informed by the PESTLE summary.
Table 2. PESTLE summary on the wider adoption of organic farm management practices
| P | Clarity between a growth in certified organic systems and the adoption of selective organic farm management practices on a wider scale
Support from government will be required to ensure economic stability of farmers adopting the practices. Complying with the climate change action plan, net zero Targets and the Biodiversity Action Plan Understanding of trade-offs related to implementation of different policies on biodiversity and climate change:
|
| E | Farm viability
Cost of support for transition to organic Cost of support for maintaining the farms as organic Cost of administering potential support and certification packages Cost of supporting knowledge exchange and skills development Cost to the farmer of changing their production systems both in terms of the costs of inputs and the value of the output. |
| S | Acceptance by the farming community of the benefits to their businesses of adopting all or some organic farm management practices
Peer group acceptance of the adoption of the practices by a farmer. The development of social networks amongst farmers due to skill development and knowledge exchange requirement |
| T | The adoption of precision farm techniques to manage inputs, separate intercrop outputs
The adoption of early warning animal disease technology National list trials for plant breeding for low input systems Organic Advisory support Training courses, modern apprenticeships, FE and HE level education |
| L | Legal framework for a support system which incorporates target metrics for support structures.
Legal framework that specifies target metrics that have to be achieved for compliance. |
| E | Establish metrics that evaluate performance against biodiversity and net zero targets. |
Table 3. SWOT summary on the wider adoption of organic farm management practices
| Strengths | Weaknesses |
| Holistic systems that focus on agro-ecosystem health | Reduction in yield |
| Supports ecosystem resilience | Emissions intensity of production may increase |
| Benefits soil health | Constrained by regulation |
| Benefits biodiversity | Dependent on niche market which lacks infrastructure, e.g. abattoirs |
| Reducing industrial inputs and fossil fuel use– which reduces transport and the GHGs associated with production | The impact of the measures of GHG reduction may not be measured in C calculators |
| The impact of the measures of GHG reduction may not be measured in the inventory process | |
| Lack of available training in organic agriculture and horticulture in Scotland | |
| Lack of knowledge on trade-offs between management practices | |
| Opportunities | Threats |
| Wider adoption of organic management practices | Increased costs |
| Increase adoption of the practices will build biodiversity | Main streaming the niche a market which reduces the premium in the market place |
| Increase adoption of the practices will build soil health | Risk of reduced domestic production of key food products causing a food security issue |
| Increase adoption of the practices will builds the ability of the soil to cope with both drought and extreme rainfall events | Due to yield reductions, there is a risk of exporting emissions |
| Increased adoption of a range of practices could improve the matrix of landscape features | The pressure to reduce livestock numbers leads to a risk of insufficient livestock manure to maintain the system |
| Training and knowledge exchange will be required for successful uptake of the practice. This could include further development and role out of BASIS type qualifications | Accounting for the improvement in greenhouse gas emissions may not be tractable, and will be split between industrial, agriculture and LULUCF inventories |
| Co-operation between farmers may develop due to need for infrastructure and skills | The current c calculator methodologies cannot account for the effect some practices can have on emissions. This may be because there is insufficient quantitative information to parameterise the calculators. |
| Further development of Carbon Calculators to better describe the farm systems | Economic resilience is not supported |
| Regional demonstration hubs/farms for peer-to-peer learning | Risk of converting natural habitats to farmland to maintain production |
| Plant breeding focused on low input systems | Lack of skills and knowledge among the farming community to successfully incorporate the changed practices |
| Investment in necessary capital and infrastructure by the farmers may be required to implement some of the practices | |
| Current plant breeding programmes are aimed at high input systems |
Discussion
Organic farming is an holistic system, and this was emphasised through the stakeholder workshops. There was a strong view that it can be hard to disentangle the known and documented benefits of organic systems and attributes that impact on biodiversity and emissions to a specific management practice. This makes it challenging to adopt recommendations on specific practices at farm-scale. The holistic nature of organic systems was also evident from the REA.
Nevertheless, the REA and stakeholders identified that individual practices tend to be beneficial for the environment in their own right. The adoption of these practices will help to support the Biodiversity Strategy and contribute to net zero. There is concrete evidence to support the reduction in off-farm emissions. Due to the high variability in soil derived emissions, the evidence for a reduction in nitrous oxide emissions is less certain. Equally, at the systems level for ruminants, there are trade-offs in emissions due to an increased reliance on forage versus improved animal health.
Taking a more holistic approach, it is important to consider that while organic farming tends to positively impact on biodiversity, that yields are typically lower due to the restrictions in the use of synthetic agrochemicals. Based on European data, and assuming existing patterns of food production and food waste, it is estimated that the organic yield gap is 35%, which would require 50% more land to produce the same yields as obtained from a conventional system (Kirchmann 2019). The widespread conversion to organic farming is likely to result in the conversion of semi-natural habitats to agricultural land. An alternative approach could involve measures that can be implemented without significant impact on yield for example the diversification of productive habitats, reduction in field size, integration of semi-natural habitats within farmed landscapes and the use of precision agriculture techniques to improve efficiency of agrochemical use (Tscharntke et al. 2021).
The adoption of organic farming practices by the wider farming community will require support for the industry for the transition, and maintenance of the systems. In addition, advice and training will be required to ensure the successful implementation of the practices.
Acknowledgements
The authors are grateful to Dr Sarah Govan for valuable advice throughout the project. The team thank members of the Steering Group for comments on the report. The team also wish to thank the participants of the stakeholder events for their valuable contributions and insights.
Annex
Methodology
Rapid Evidence Assessment
A Rapid Evidence Assessment (REA) approach was adopted to assess the current state of the evidence of the benefits and disbenefits of organic farming practices on GHGs, biodiversity, and the potential of these practices to help farmers to adapt to the projected changes in weather that are likely to be experienced in 2045. While a REA is not as comprehensive as a systematic review, the REA is designed to be rigorous, transparent and minimise bias (Barends et al. 2017).
The search used to identify the literature was constrained to post 1999, and was:
(TITLE-ABS-KEY((organic* OR biodynamic* OR regenerativ* OR biologisch* OR oekologic*) W/0 (farm* OR field* OR agricultur* OR horticult*)) AND
TITLE-ABS-KEY(biodiversity OR “climate change” OR mitigat* OR adaptation OR “nitrous oxide” OR n2o OR “methane” OR ch4 OR sequestr* OR drought OR waterlog* OR flood* OR “heat stress” OR “cold stress” OR “greenhouse gas*” OR “soil carb” OR “soil organic carb*” OR soc OR “soil C” OR “soil organic c”) AND
TITLE-ABS-KEY(rotation* OR variet* OR “species mix*” OR variet* OR “cultivar mix*” OR “fixing ley” OR tillage OR “soil cultiv*” OR “cover crop*” OR “living mulch” OR intercrop* OR undersow* OR “companion crop” OR “break crop*” OR manure* OR compost* OR biofert* OR irrigation OR pollinat* OR “crop resid*” OR “soil health” OR “soil fertilit*” OR “conservation area*” OR biostimulant OR “bio stimulant” OR “pre crop” OR precrop OR “soil amend*” OR IPM OR ICW OR IWM OR IDM OR “integrated pest” OR “integrated crop” OR “integrated weed” OR “integrated disease” OR fungicid* OR pesticid* OR herbicid* OR insecticid* OR molluscicid* OR nematicid* OR biofungicid* OR biopesticid* OR bioherbicid* OR bioinsecticid* OR biocontrol OR bioprotect* OR biofumig* OR “natural enem*” OR “plant protection product*” OR ppp OR graz* OR cattle OR sheep OR “veterinary treatment” OR “additives aid” OR “bioactive forage” OR “animal health”) AND NOT
TITLE-ABS-KEY(chin* OR asia* OR africa OR brazil OR “south america” OR india* OR mediterran* OR subtropi* OR tropi* OR Thailand OR agroforestry OR “ecological status” OR model* OR lab* OR “sewage sludge*” OR biochar OR fish* OR aqua* OR viticul* OR rice OR vine* OR olive*)) AND
(EXCLUDE ( PUBYEAR,1975) OR EXCLUDE ( PUBYEAR,1987) OR EXCLUDE ( PUBYEAR,1990) OR EXCLUDE ( PUBYEAR,1991) OR EXCLUDE ( PUBYEAR,1995) OR EXCLUDE ( PUBYEAR,1996) OR EXCLUDE ( PUBYEAR,1997) OR EXCLUDE ( PUBYEAR,1998) OR EXCLUDE ( PUBYEAR,1999) )
The search was conducted on 18 May 2023 in two online databases; Web of Science (1885 hits) and Scopus (1190 hits). The searches were combined using mergeDBSources function in the bibliometrix package (Aria and Cuccurulllo 2017), giving a total of 1544 hits. It was subsequently noted that the keyword legume* had been excluded from the search. This was then added to the search string. By re-running the original string and using AND NOT those paper which specified legume* were added. After combining the WOK and the Scopus searches, this added 20 references. Sources were screened firstly on the basis of title and abstract, then secondly by scanning the full text. At each stage, sources were progressed unless it was apparent that an objective reason existed for it to be excluded from the study (exclusion rule). Sources were subsequently assessed for suitability. A total of 145 papers were assessed as sufficiently relevant for data extraction and inclusion in the review.
As a funder of organic projects, the Defra Research databases was searched for relevant projects. This added Smith et al 2018 to the information assessed. Organic Eprints – Welcome to Organic Eprints (orgprints.org) is a repository for results from Organic Projects. The results in OrgPrints for the QLIF and FertilCrop were extracted and assessed for relevance. This gave a total of nine and eleven papers respectively. In addition, relevant papers known to the authors that met the scope were also used to compile the review.
The REA has focused on assessing the direction of change and has not quantified absolute values.
Stakeholder Engagement
Aim
The aim of the stakeholder engagement was to gauge the level of knowledge and understanding across Scotland’s agricultural industry stakeholders of the management practices commonly found on organic farms with reference to their impact on GHG emissions, both beneficial and not, and also their contribution to augmenting biodiversity on the land managed by farm businesses that undertake them.
To reach as wide a representation as possible of stakeholders in Scottish agriculture
To gather their opinions and views, evidence led or otherwise.
Approach
To ensure we were able to engage with farmers and the wider agricultural industry we held two stakeholder meetings.
- July 27th 2023, 12.30-2pm
- August 2nd 2023, 5-6.30pm
We compiled an internal list of industry representatives from our inventory of previous research studies performed for CXC and other organisations allied to Scotland’s agriculture industry. This was augmented by crosschecking with the Agriculture and Rural Development (ARD) stakeholder group run by Scottish Government and stakeholder representatives were added as appropriate.
We augmented this list of industry representatives with commercial stakeholders across the supply chain including red meat processors, food service, auctioneers, large retailers, and small independent retailers.
We also drew upon our internal network of SRUC researchers, and SAC Consulting agricultural advisors with a range of experience of farming scenarios.
Both organic and conventional farmers were contacted through SOPA, and through the NFUS. In addition, we contacted all 8500+ subscribers to SAC Consulting’s advisory service which is a direct reach to many farmers in Scotland.
Method of contact
The invitations to a choice of 2 x Zoom meetings were sent out 3 weeks prior to the first stakeholder engagement meeting in the following places:
- NFUS weekly newsletters for 2 weeks reaching all NFUS farming members and stakeholders.
- Social Media via SAC Consulting channels Twitter / FB.
- Direct mailing list of licensors of Scottish Organic Producers Association (SOPA).
- Direct invitation via internal mailing list of industry representatives, and SRUC / SAC personnel as outlined above.
- Included in SAC Consulting’s subscriber publication Unearthed that reaches over 8500 farming businesses.
Method of engagement
We started the stakeholder engagement session with a brief overview of the project and an explicit explanation of what we wish attendees to do.
We used padlet boards and asked for comments on the benefits or disbenefits or each of 6 management practices for climate and biodiversity outcomes. We interspersed the time allowed for attendees to note comments with overarching discussion, without guiding their views, but adding information where appropriate.
We then picked up on gaps in commentary and asked attendees their views on why that was.
Management practices
- Reliance on legumes
- Using organic manures/bulky organic material
- Reduced synthetic inputs
- Integrating grazing in arable system
- Rotational/Mob grazing
- Minimum tillage
- Other
We asked for comments on the impact of organic farming using each particular practice on the following climate and nature outcomes. It was stressed that this was not a call to support organic farming more a call to unpick the impacts both good and bad on these outcomes.
- Reducing GHG emissions
- Soil Carbon storage
- Biodiversity
- Ability to deal with weather conditions, pests and diseases in 2045 .
Summary of the stakeholders involved in the online workshops
- 5 organic farmers
- 1 farmer with no organic land
- 4 advisors
- 8 industry representatives
- 1 charity representative
- 2 academics
- 4 “other”
REA results
Table A1 summarises the results of the REA. Based on the literature, the scores of 1, 0, -1 represent whether the organic management practices have a positive, neutral, or negative impact on the categories of GHGs, soil carbon, adaptation, and biodiversity. The confidence indicator gives an indication whether the body of the literature examined has a low, medium or high confidence of the likely outcome.
Table A1 Summarised results for organic management practices relative to conventional management practices for GHGs, soil carbon, adaptation potential and biodiversity
| Management practice | Taxa | Biodiversity | Soil C | GHGs | Adaptation | ||||
|---|---|---|---|---|---|---|---|---|---|
| Indicator | Confidence | Indicator | Confidence | Indicator | Confidence | Indicator | Confidence | ||
| Organic farming | 1 | Medium | 1 | High | 1 | Moderate | 1 | Medium | |
| Rotation management | 1 | Low | 1 | Medium | 0 | ||||
| Organic FYM inputs | 1 | High | -1 | Medium | |||||
| Cover crop | 1 | Low | 1 | Medium | |||||
| Crop residues | 1 | Medium | 1 | Medium | 1 | Medium | |||
| Intraspecific crop diversification | 0 | Low | 0 | Medium | |||||
| Intercropping (more than 2 species grown together) | 0 | Medium | |||||||
| Tillage intensity | 1 | Medium | |||||||
| Tillage frequency | 0 | Medium | -1 | High | |||||
| Flower strips | 1 | High | 1 | High | |||||
| Organic weed management | 1 | High | -1 | High | |||||
| Organic pest management | 1 | Medium | -1 | Medium | |||||
| Organic disease management | 1 | Medium | 1 | Medium | |||||
| Legumes | 1 | Medium | |||||||
| Biocontrol agents | 1 | Low | |||||||
| Rotation | 1 | Medium | |||||||
| Improving animal health | 1 | High | |||||||
| Low/med stocking density during grazing | 1 | Medium | |||||||
| Mid spp grazing | 0 | Low | |||||||
| Good pasture management | 1 | Medium | |||||||
| Slurry tank management | 0 | ||||||||
| Organic v conv livestock | -1 | High | |||||||
| Livestock integration | 0 | Low | |||||||
| Cover crops | Decomposers | 1 | Low | ||||||
| Livestock integration | Decomposers | 0 | Low | ||||||
| Organic | Birds and mammals | 0 | Medium | ||||||
| Organic | Arthropods general | 1 | Medium | ||||||
| Organic | Decomposers | 0 | Low | ||||||
| Organic | Plants | 1 | High | ||||||
| Organic | Natural enemies | 0 | Low | ||||||
| Organic | Pollinators | 1 | Medium | ||||||
| Varietal mix | Decomposers | 0 | Low | ||||||
| Varietal mix | All plants | 0 | Low | ||||||
| Varietal mix | Arthropods general | 0 | Low | ||||||
| Varietal mix | Natural enemies | 0 | Low | ||||||
| Reduced tillage | Mammals | 1 | Low | ||||||
| Reduced tillage | Decomposers | 0 | Low | ||||||
| Organic weed management | Birds and mammals | 1 | Low | ||||||
| Organic weed management | Plants | 1 | Low | ||||||
| Organic weed management | Decomposers | 1 | Low | ||||||
| Organic disease management | Pollinators | 1 | Low | ||||||
| Organic disease management | Natural enemies | 1 | Low | ||||||
| Organic disease management | Decomposers | 1 | Low | ||||||
| Organic pest management | Natural enemies | 1 | Low | ||||||
| Organic pest management | Decomposers | 1 | Low | ||||||
| No artificial fertilisers | Natural enemies | 0 | Low | ||||||
| No artificial fertilisers | All plants | 1 | Low | ||||||
| No artificial fertilisers | Seed eating arthropods | 1 | Low | ||||||
Glossary of Terms
| GHGs | Greenhouse gas emissions (nitrous oxide, methane, carbon dioxide) |
| Intercropping | Intercropping (more than 2 species grown together) |
| Natural enemies | natural predators for the control of pests |
| Rapid Evidence Assessment (REA) | Rapid Evidence Assessment (REA) “provides a balanced assessment of what is known (and not known) in the scientific literature about an intervention, problem or practical issue by using a systematic methodology to search and critically appraise empirical studies.” (Barends, et al. 2017) |
| Taxa | group of organisms |
References
Aggestam, V., & Buick, J. (2017). A comparative analysis of vehicle-related greenhouse gas emissions between organic and conventional dairy production. Journal of Dairy Research, 84(3), 360–369. https://doi.org/10.1017/S0022029917000322
Albrecht, H., Mademann, S., & Weikl, H. (2020). Development of the arable vegetation 23 years after conversion from conventional to organic farming-experiences from a farm-scale case study in southern Germany Entwicklung der Ackerwildkrautvegetation 23 Jahre nach der Umstellung auf ökologischen Landbau-Ergebnisse einer Fallstudie aus Süddeutschland. Tuexenia, 40, 291–308. https://doi.org/10.14471/2020.40.005
Alvarez, R. (2022). Comparing Productivity of Organic and Conventional Farming Systems: A Quantitative Review. Archives of Agronomy and Soil Science, 68(14), 1947–1958. https://doi.org/10.1080/03650340.2021.1946040
Are, M., Kaart, T., Selge, A., & Reintam, E. (2021). The effects of crops together with winter cover crops on the content of soil water-stable aggregates in organic farming. Agriculture (Switzerland), 11(11), 1035. https://doi.org/10.3390/agriculture11111035
Aria, M. & Cuccurulllo, C (2017) bibliometrix: An R-tool for comprehensive science mapping analysis. Journal of Informetrics, 11, 959-975.
Armengot, L., Berner, A., Blanco-Moreno, J.M., Mäder, P., & Sans, F.X. (2015). Long-term feasibility of reduced tillage in organic farming. Agronomy for Sustainable Development, 35(1), 339–346. https://doi.org/10.1007/s13593-014-0249-y
Autret, B., Beaudoin, N., Rakotovololona, L., Bertrand, M., Grandeau, G., Gréhan, E., Ferchaud, F. & Mary, B. (2019). Can alternative cropping systems mitigate nitrogen losses and improve GHG balance? Results from a 19-yr experiment in Northern France. Geoderma, 342, 20–33. https://doi.org/10.1016/j.geoderma.2019.01.039.
Bareille, N., Duval, J., Experton, C., Ferchaud, S., Hellec, F. & Manoli, C. (2022). Animal health management concepts and practices in livestock production under organic farming specifications. INRAE Prod. Anim., 35 (4), 357e-368e
Barends, E., Rousseau, D.M. & Briner, R.B. (Eds). (2017). CEBMa Guideline for Rapid Evidence Assessments in Management and Organizations, Version 1.0. Center for Evidence Based Management, Amsterdam. Available from www.cebma.org/guidelines/.
Barré, K., Le Viol, I., Julliard, R., Chiron, F. & Kerbiriou, C. (2018). Tillage and herbicide reduction mitigate the gap between conventional and organic farming effects on foraging activity of insectivorous bats. Ecology and Evolution, 8(3), 1496-1506.
Beillouin, D., Ben-Ari, T., Malézieux, E., Seufert, V., & Makowski, D. (2021). Positive but variable effects of crop diversification on biodiversity and ecosystem services. Global Change Biology, 27(19), 4697–4710. https://doi.org/10.1111/GCB.15747
Benaragama, D., Leeson, J.L., & Shirtliffe, S.J. (2019). Understanding the Long-Term Weed Community Dynamics in Organic and Conventional Crop Rotations Using the Principal Response Curve Method. Weed Science, 67(2), 195–204. https://doi.org/10.1017/wsc.2018.64
Benton, T.G., Vickery, J.A. & Wilson, J.D. (2003). Farmland biodiversity: is habitat heterogeneity the key? Trends in ecology & evolution, 18(4), 182-188.
Biernat, L., Taube, F., Loges, R., Kluß, C. & Reinsch, T. (2020). Nitrous oxide emissions and methane uptake from organic and conventionally managed arable crop rotations on farms in Northwest Germany. Sustainability (Switzerland), 12(8). https://doi.org/10.3390/SU12083240
Birkhofer, K., Arvidsson, F., Ehlers, D., Mader, V.L., Bengtsson, J. & Smith, H.G. (2016). Organic farming affects the biological control of hemipteran pests and yields in spring barley independent of landscape complexity. Landscape Ecology, 31(3), 567–579. https://doi.org/10.1007/s10980-015-0263-8
Birkhofer, K., Fließbach, A., Wise, D.H. & Scheu, S. (2008). Generalist predators in organically and conventionally managed grass-clover fields: Implications for conservation biological control. Annals of Applied Biology, 153(2), 271–280. https://doi.org/10.1111/j.1744-7348.2008.00257.x
Boeraeve, F., Vialatte, A., Sirami, C., Caro, G., Thenard, J., Francis, F. & Dufrêne, M. (2022). Combining organic and conservation agriculture to restore biodiversity? Insights from innovative farms in Belgium and their impacts on carabids and spiders. Frontiers in Sustainable Food Systems, 6, 1003637.
Boinot, S. & Alignier, A. (2022). On the restoration of hedgerow ground vegetation: Local and landscape drivers of plant diversity and weed colonization. Journal of Environmental Management, 307, 114530.
Boldrini, A., Benincasa, P., Tosti, G., Tei, F. & Guiducci, M. (2007). Apparent N balance in organic and conventional low input cropping systems. 3rd QLIF Congress, Hohenheim, Germany, March 20-23, 2007. Archived at http://orgprints.org/view/projects/int_conf_qlif2007.html
Bos, J.F.F.P., De Haan, J.J., Sukkel, W. & Schils, R.L.M. (2007). Comparing energy use and greenhouse gas emissions in organic and conventional farming systems in the Netherlands. 3rd QLIF Congress, Hohenheim, Germany, pp. 1-4.
Brooker, R., Hewison, R., Karley, A.J., Mitchell, C., Neilson, R., Newton, A.C., Pakeman, R.J., Raubach, S., Shaw, S. & Verrall, S. (2023). SEAMS – Sustainability in Education and Agriculture Using Mixtures: Final Report. James Hutton Institute and the SEAMS partnership.
Caballero-López, B., Blanco-Moreno, J.M., Pérez-Hidalgo, N., Michelena-Saval, J.M., Pujade-Villar, J., Guerrieri, E., Sánchez-Espigares, J.A. & Sans, F.X. (2012). Weeds, aphids, and specialist parasitoids and predators benefit differently from organic and conventional cropping of winter cereals. Journal of Pest Science, 85(1), 81–88. https://doi.org/10.1007/s10340-011-0409-7
Cabaret, J., Bouilhol, M. & Mage, C. (2002). Managing helminths of ruminants in organic farming. Veterinary Research, 33(5), 625-640. https://doi.org/10.1051/vetres:2002043
Carrié, R., Ekroos, J. & Smith, H.G. (2022). Turnover and nestedness drive plant diversity benefits of organic farming from local to landscape scales. Ecological Applications, 32(4), e2576.
Chabert, A. & Sarthou, J.-P. (2020). Conservation agriculture as a promising trade-off between conventional and organic agriculture in bundling ecosystem services. Agriculture, Ecosystems & Environment, 292, 106815. https://doi.org/10.1016/j.agee.2019.106815
Chaloner, T.M., Gurr, S.J. & Bebber, D.P. (2021). Plant pathogen infection risk tracks global crop yields under climate change. Nat. Clim. Chang. 11, 710–715. https://doi.org/10.1038/s41558-021-01104-8
Chateil, C., Goldringer, I., Tarallo, L., Kerbiriou, C., Le Viol, I., Ponge, J.F., Salmon, S., Gachet, S. & Porcher, E. (2013). Crop genetic diversity benefits farmland biodiversity in cultivated fields. Agriculture, Ecosystems & Environment, 171, 25-32.
Chemlik, V., Šarapatka, B., Machac, O., Mikula, J., Laska, V. & Tuf, I.H. (2019). The effect of farming system and management practices on surface-dwelling soil macrofauna. Zemdirbyste-Agriculture, 106(4), 291–296.
Cole, L.J., Eory, V., Karley, A., Hawes, C., Walker, R.L. & Watson, C.A. (2021). The potential for an agroecological approach in Scotland: policy brief. Climate X Change. Available at: The potential for an agroecological approach in Scotland: policy brief (climatexchange.org.uk). [Accessed 15/05/2023].
Colombi, T., Walder, F., Büchi, L., Sommer, M., Liu, K., Six, J., van der Heijden, M.G.A., Charles, R. & Keller, T. (2019). On-farm study reveals positive relationship between gas transport capacity and organic carbon content in arable soil. Soil, 5(1), 91–105. https://doi.org/10.5194/soil-5-91-2019
Córdoba, E.M., Chirinda, N., Li, F., & Olesen, J.E. (2018). Contributions from carbon and nitrogen in roots to closing the yield gap between conventional and organic cropping systems. Soil Use and Management, 34(3), 335–342. https://doi.org/10.1111/SUM.12427
Dicks, L.V., Ashpole, J.E., Dänhardt, J., James, K., Jönsson, A., Randall, N., Showler, D.A., Smith, R.K., Turpie, S., Williams, D.R. & Sutherland, W.J. (2020) Farmland Conservation, in: W.J. Sutherland, L.V. Dicks, S.O. Petrovan & R.K. Smith (eds) What Works in Conservation 2020. Cambridge: Open Book Publishers. pp 283-321.
Dobben, Van, H.F., Quik, C., Wamelink, G.W. & Lantinga, E.A. (2019). Vegetation composition of Lolium perenne-dominated grasslands under organic and conventional farming. Basic and Applied Ecology, 36, 45-53.
Eory, V., Topp, K., Rees, B., Jones, S., Barnes, A., Smith, P., MacLeod, M. & Wall, E. (2023) Scenarios for emission reduction targets in Scottish agriculture. Climate X Change. Available at: Scenarios for emissions reduction targets in Scottish agriculture (climatexchange.org.uk). [Accessed 31/10/2023].
Emmerling, C. (2007). Reduced and conservation tillage effects on soil ecological properties in an organic farming system. Biological Agriculture and Horticulture, 24(4), 363–377. https://doi.org/10.1080/01448765.2007.9755033
Eremeev, V., Talgre, L., Kuht, J., Mäeorg, E., Esmaeilzadeh-Salestani, K., Alaru, M., Loit, E., Runno-Paurson, E. & Luik, A. (2020). The soil microbial hydrolytic activity, content of nitrogen and organic carbon were enhanced by organic farming management using cover crops and composts in potato cultivation. Acta Agriculturae Scandinavica Section B: Soil and Plant Science, 70(1), 87–94. https://doi.org/10.1080/09064710.2019.1673475
Eyre M.D., Sanderson R.A., Shotton P.N. & Leifert C. (2009). Investigating the effects of crop type, fertility management and crop protection on the activity of beneficial invertebrates in an extensive farm management comparison trial. Annals of Applied Biology, 155, 267-276.
Eyre, M.D., Luff, M.L., Atlihan, R. & Leifert, C. (2012). Ground beetle species (Carabidae, Coleoptera) activity and richness in relation to crop type, fertility management and crop protection in a farm management comparison trial. Annals of Applied Biology, 161(2), 169-179.
Feber, R.E., Johnson, P.J., Firbank, L.G., Hopkins, A. & Macdonald, D.W. (2007). A comparison of butterfly populations on organically and conventionally managed farmland. Journal of Zoology, 273(1), 30-39.
Feber, R.E., Johnson, P.J., Bell, J.R., Chamberlain, D.E., Firbank, L.G., Fuller, R.J., Manley, W., Mathews, F., Norton, L.R., Townsend, M. & Macdonald, D.W. (2015). Organic farming: Biodiversity impacts can depend on dispersal characteristics and landscape context. PLoS One, 10(8), e0135921.
Feiziene, D., Feiza, V., Povilaitis, V., Putramentaite, A., Janusauskaite, D., Seibutis, V. & Slepetys, J. (2016). Soil sustainability changes in organic crop rotations with diverse crop species and the share of legumes. Acta Agriculturae Scandinavica, Section B — Soil & Plant Science, 66(1), 36–51. https://doi.org/10.1080/09064710.2015.1063683
Fließbach, A., Oberholzer, H.-R., Gunst, L. & Mäder, P. (2007). Soil organic matter and biological soil quality indicators after 21 years of organic and conventional farming. Agriculture, Ecosystems & Environment, 118(1–4), 273–284. https://doi.org/10.1016/j.agee.2006.05.022
Fonderflick, J., Besnard, A., Chardès, M.C., Lanuzel, L., Thill, C. & Pointereau, P. (2020). Impacts of agricultural intensification on arable plants in extensive mixed crop-livestock systems. Agriculture, Ecosystems & Environment, 290, 106778.
Fontana, M., Berner, A., Mäder, P., Lamy, F. & Boivin, P. (2015). Soil Organic Carbon and Soil Bio-Physicochemical Properties as Co-Influenced by Tillage Treatment. Soil Science Society of America Journal, 79(5), 1435–1445. https://doi.org/10.2136/sssaj2014.07.0288
Gabriel, D. & Tscharntke, T. (2007). Insect pollinated plants benefit from organic farming. Agriculture, Ecosystems & Environment, 118(1-4), 43-48.
Gabriel, D., Sait, S.M., Hodgson, J.A., Schmutz, U., Kunin, W.E. & Benton, T.G. (2010). Scale matters: the impact of organic farming on biodiversity at different spatial scales. Ecology letters, 13(7), 858-869.
Gallé, R., Happe, A.K., Baillod, A.B., Tscharntke, T. & Batáry, P. (2019). Landscape configuration, organic management, and within‐field position drive functional diversity of spiders and carabids. Journal of Applied Ecology, 56(1), 63-72.
Gattinger, A., Muller, A., Haeni, M., Skinner, C., Fliessbach, A., Buchmann, N., Mäder, P., Stolze, M., Smith, P., Scialabba, N.E.H. & Niggli, U. (2012). Enhanced top soil carbon stocks under organic farming. Proceedings of the National Academy of Sciences of the United States of America, 109(44), 18226–18231. https://doi.org/10.1073/PNAS.1209429109/-/DCSUPPLEMENTAL/SD01.XLSX
Geppert, C., Hass, A., Földesi, R., Donkó, B., Akter, A., Tscharntke, T. & Batáry, P. (2020). Agri‐environment schemes enhance pollinator richness and abundance but bumblebee reproduction depends on field size. Journal of Applied Ecology, 57(9), 1818-1828.
Gibson, R.H., Pearce, S., Morris, R.J., Symondson, W.O.C. & Memmott, J. (2007). Plant diversity and land use under organic and conventional agriculture: a whole‐farm approach. Journal of Applied Ecology, 44(4), 792-803.
Goulson, D., Lye, G.C. & Darvill, B. (2008). Decline and conservation of bumble bees. Annual Review of Entomology, 53, 191-208.
Gronle, A., Lux, G., Böhm, H., Schmidtke, K., Wild, M., Demmel, M., Brandhuber, R., Wilbois, K.-P. & Heß, J. (2015). Effect of ploughing depth and mechanical soil loading on soil physical properties, weed infestation, yield performance and grain quality in sole and intercrops of pea and oat in organic farming. Soil and Tillage Research, 148, 59–73. https://doi.org/10.1016/j.still.2014.12.004
Gross, A., Bromm, T., Polifka, S. & Schierhorn, F. (2022). The carbon footprint of milk during the conversion from conventional to organic production on a dairy farm in central Germany. Agronomy for Sustainable Development, 42(3), 37. https://doi.org/10.1007/s13593-022-00775-7
Haas, G., Wetterich, F. & Köpke, U. (2001). Comparing intensive, extensified and organic grassland farming in southern Germany by process life cycle assessment. Ecosystems and Environment, 83, 43–53.
Hance T. & Gregoirewibo C. (1987). Effect of agricultural practices on carabid populations. Acta Phytopathologica Et Entomologica Hungarica, 22, 147-160.
Happe, A.K., Riesch, F., Rösch, V., Gallé, R., Tscharntke, T. & Batáry, P. (2018). Small-scale agricultural landscapes and organic management support wild bee communities of cereal field boundaries. Agriculture, Ecosystems & Environment, 254, 92-98.
Hardman, C.J., Harrison, D.P., Shaw, P.J., Nevard, T.D., Hughes, B., Potts, S.G. & Norris, K. (2016). Supporting local diversity of habitats and species on farmland: a comparison of three wildlife‐friendly schemes. Journal of Applied Ecology, 53(1), 171-180.
Heinze, S., Raupp, J. & Joergensen, R. G. (2010). Effects of fertilizer and spatial heterogeneity in soil pH on microbial biomass indices in a long-term field trial of organic agriculture. Plant and Soil, 328(1–2), 203–215. https://doi.org/10.1007/s11104-009-0102-2
Henderson, I.G., Holland, J.M., Storkey, J., Lutman, P., Orson, J. & Simper, J. (2012). Effects of the proportion and spatial arrangement of un‐cropped land on breeding bird abundance in arable rotations. Journal of Applied Ecology, 49(4), 883-891.
Hu, T., Sørensen, P. & Olesen, J. E. (2018). Soil carbon varies between different organic and conventional management schemes in arable agriculture. European Journal of Agronomy, 94, 79–88. https://doi.org/10.1016/j.eja.2018.01.010
Hutton, S.A. & Giller, P.S. (2003). The effects of the intensification of agriculture on northern temperate dung beetle communities. Journal of Applied Ecology, 40(6), 994-1007.
Inclán, D.J., Cerretti, P., Gabriel, D., Benton, T.G., Sait, S.M., Kunin, W.E., Gillespie, M.A.K. & Marini, L. (2015). Organic farming enhances parasitoid diversity at the local and landscape scales. Journal of Applied Ecology, 52(4), 1102–1109. https://doi.org/10.1111/1365-2664.12457
Johnson, K.H., Vogt, K.A., Clark, H.J., Schmitz, O. J. & Vogt, D.J. (1996). Biodiversity and the productivity and stability of ecosystems. Trends in Ecology & Evolution, 11(9), 372–377. https://doi.org/10.1016/0169-5347(96)10040-9
Jordon, M.W., Willis, K.J., Bürkner, P.C., Haddaway, N.R., Smith, P. & Petrokofsky, G. (2022). Temperate Regenerative Agriculture practices increase soil carbon but not crop yield—a meta-analysis. Environmental Research Letters, 17(9), 093001. https://doi.org/10.1088/1748-9326/ac8609
Junge, S.M., Storch, J., Finckh, M.R. & Schmidt, J.H. (2020). Developing Organic Minimum Tillage Farming Systems for Central and Northern European Conditions. In: Y. Dang, R. Dalal, N. Menzies (eds). No-till Farming Systems for Sustainable Agriculture. Cham, Switzerland: Springer. https://doi.org/10.1007/978-3-030-46409-7_11.
Kauer, K., Pärnpuu, S., Talgre, L., Eremeev, V. & Luik, A. (2021). Soil particulate and mineral-associated organic matter increases in organic farming under cover cropping and manure addition. Agriculture (Switzerland), 11(9), 903. https://doi.org/10.3390/agriculture11090903
Kaurin, A., Mihelič, R., Kastelec, D., Grčman, H., Bru, D., Philippot, L. & Suhadolc, M. (2018). Resilience of bacteria, archaea, fungi and N-cycling microbial guilds under plough and conservation tillage, to agricultural drought. Soil Biology and Biochemistry, 120, 233–245. https://doi.org/10.1016/J.SOILBIO.2018.02.007
Kiefer, L., Menzel, F. & Bahrs, E. (2014). The effect of feed demand on greenhouse gas emissions and farm profitability for organic and conventional dairy farms. Journal of Dairy Science, 97(12), 7564–7574. https://doi.org/10.3168/jds.2014-8284
Kirchmann, H. (2019). Why organic farming is not the way forward. Outlook on Agriculture, 48(1), 22–27. https://doi.org/10.1177/0030727019831702/ASSET/IMAGES/LARGE/10.1177_0030727019831702-FIG3.JPEG
Kleijn, D. & Raemakers, I. (2008). A retrospective analysis of pollen host plant use by stable and declining bumble bee species. Ecology, 89(7), 1811-1823.
Knudsen, M.T., Meyer-Aurich, A., Olesen, J.E., Chirinda, N. & Hermansen, J. E. (2014). Carbon footprints of crops from organic and conventional arable crop rotations – using a life cycle assessment approach. Journal of Cleaner Production, 64, 609–618. https://doi.org/10.1016/j.jclepro.2013.07.009
Koch B. & Meister E. (2000) Graded management intensity of grassland systems for enhancing floristic diversity. In: D. Gagnaux & J. R. Poffet (eds) Livestock farming systems: integrating animal science advances in the search of sustainability. Proceedings of the fifth international symposium on livestock farming systems, Posieux, Fribourg, Switzerland, 19-20 August, 1999 (pp. 176-178). Wageningen Pers.
Krause, H.-M., Stehle, B., Mayer, J., Mayer, M., Steffens, M., Mäder, P. & Fliessbach, A. (2022). Biological soil quality and soil organic carbon change in biodynamic, organic, and conventional farming systems after 42 years. Agronomy for Sustainable Development, 42, 117. https://doi.org/10.1007/s13593-022-00843-y
Krauss, M., Ruser, R., Müller, T., Hansen, S., Mäder, P. & Gattinger, A. (2017). Impact of reduced tillage on greenhouse gas emissions and soil carbon stocks in an organic grass-clover ley – winter wheat cropping sequence. Agriculture, Ecosystems & Environment, 239, 324–333. https://doi.org/10.1016/j.agee.2017.01.029
Krauss, M., Wiesmeier, M., Don, A., Cuperus, F., Gattinger, A., Gruber, S., Haagsma, W.K., Peigné, J., Palazzoli, M.C., Schulz, F., van der Heijden, M.G.A., Vincent-Caboud, L., Wittwer, R.A., Zikeli, S. & Steffens, M. (2022). Reduced tillage in organic farming affects soil organic carbon stocks in temperate Europe. Soil and Tillage Research, 216, 105262. https://doi.org/10.1016/J.STILL.2021.105262
Krey, K.L., Blubaugh, C.K., Van Leuven, J.T. & Snyder, W.E. (2019). Organic Soils Control Beetle Survival While Competitors Limit Aphid Population Growth. Environmental Entomology, 48(6), 1323–1330. https://doi.org/10.1093/ee/nvz100
Kromp B. (1999) Carabid beetles in sustainable agriculture: a review on pest control efficacy, cultivation impacts and enhancement. Agriculture, Ecosystems & Environment, 74, 187-228.
Kruse, M., Stein-Bachinger, K., Gottwald, F., Schmidt, E. & Heinken, T. (2016). Influence of grassland management on the biodiversity of plants and butterflies on organic suckler cow farms. Tuexenia, 36, 97-119.
Kuht, J., Eremeev, V., Talgre, L., Madsen, H., Toom, M., Mäeorg, E. & Luik, A. (2016). Soil weed seed bank and factors influencing the number of weeds at the end of conversion period to organic production. Agronomy Research, 14(4), 1372–1379.
Legzdiņa, L., Bleidere, M., Piliksere, D., & Ločmele, I. (2022). Agronomic Performance of Heterogeneous Spring Barley Populations Compared with Mixtures of Their Parents and Homogeneous Varieties. Sustainability (Switzerland), 14(15), 9697. https://doi.org/10.3390/su14159697
Leifeld, J. & Fuhrer, J. (2010). Organic Farming and Soil Carbon Sequestration: What Do We Really Know About the Benefits? Ambio, 39(8), 585–599. https://doi.org/10.1007/s13280-010-0082-8
Li, X., Petersen, S.O., Sørensen, P. & Olesen, J.E. (2015). Effects of contrasting catch crops on nitrogen availability and nitrous oxide emissions in an organic cropping system. Agriculture, Ecosystems & Environment, 199, 382–393. https://doi.org/10.1016/J.AGEE.2014.10.016
Litterick, A.; Harrier, L.; Wallace, P.; Watson, C.A. & Wood, M. (2003) Effects of composting manures and other organic wastes on soil processes and pest and disease interactions (CTE0203). Defra Final Report OF0313. Available at: Organic Eprints – Effects of composting manures and other organic wastes on soil processes and pest and disease interactions (orgprints.org). or Science Search (defra.gov.uk) (Accessed 15 August 2023)
Mäder, P., Fließbach, A., Dubois, D., Gunst, L., Fried, P. & Niggli, U. (2002). Soil Fertility and Biodiversity in Organic Farming. Science, 296(5573), 1694–1697. https://doi.org/10.1126/science.1071148
Madsen, H., Talgre, L., Eremeev, V., Alaru, M., Kauer, K. & Luik, A. (2016). Do green manures as winter cover crops impact the weediness and crop yield in an organic crop rotation? Biological agriculture & horticulture, 32(3), 182-191.
Madsen, H., Talgre, L., Eremeev, V., Alaru, M., Maeorg, E. & Luik, A. (2017). Winter cover crops decrease weediness in organic cropping systems. In: NJF Seminar 495-4th organic Conference: Organics for tomorrow’s food systems, 19-21 June 2017, Mikkeli, Finland (Vol. 13, No. 1, pp. 35-37).
Madsen, H., Talgre, L., Kuht, J., Alaru, M., Eremeev, V., Mäeorg, E., Loit, E. & Luik, A. (2020). Organic Cropping Systems do not Increase Weed Seed Numbers but do Increase Weed Diversity. Agri Res & Tech: Open Access J, 23(4), 44-51. https://doi.org/10.19080/ARTOAJ.2020.23.556244
Mangels J., Fiedler K., Schneider F.D. & Bluthgen N. (2017) Diversity and trait composition of moths respond to land-use intensification in grasslands: Generalists replace specialists. Biodiversity and Conservation, 26, 3385-3405.
Marja, R., Herzon, I., Viik, E., Elts, J., Mänd, M., Tscharntke, T. & Batáry, P. (2014). Environmentally friendly management as an intermediate strategy between organic and conventional agriculture to support biodiversity. Biological Conservation, 178, 146-154.
Marja, R., Viik, E., Mänd, M., Phillips, J., Klein, A.M. & Batáry, P. (2018). Crop rotation and agri‐environment schemes determine bumblebee communities via flower resources. Journal of Applied Ecology, 55(4), 1714-1724.
Mcclelland, S.C., Paustian, K. & Schipanski, M.E. (2020). Management of cover crops in temperate climates influences soil organic carbon stocks: a meta-analysis. Ecological Applications, 31(3), e02278. https://doi.org/10.1002/eap.2278
McCracken, D.I. (1993). The potential for avermectins to affect wildlife. Veterinary parasitology, 48(1-4), 273-280.
Mendes Costa, M., Cardo, M., Ruano, Z., Alho, A.M., Dinis-Teixeira, J., Aguiar, P. & Leite, A. (2023). Effectiveness of antimicrobial interventions directed at tackling antimicrobial resistance in animal production: A systematic review and meta-analysis. Preventive Veterinary Medicine, 218, 106002. https://doi.org/10.1016/j.prevetmed.2023.106002
Metzke, M., Potthoff, M., Quintern, M., Heß, J. & Joergensen, R.G. (2007). Effect of reduced tillage systems on earthworm communities in a 6-year organic rotation. European Journal of Soil Biology, 43, S209-S215.
Moorcroft, D., Whittingham, M.J., Bradbury, R.B. & Wilson, J.D. (2002). The Selection of Stubble Fields by Wintering Granivorous Birds Reflects Vegetation Cover and Food Abundance. Journal of Applied Ecology, 39(3), 535–547. http://www.jstor.org/stable/827145
Morris, C.D. (2021). How Biodiversity-Friendly Is Regenerative Grazing? Frontiers in Ecology and Evolution, 9, 816374.
Muneret, L., Mitchell, M., Seufert, V., Aviron, S., Djoudi, E.A., Pétillon, J., Plantegenest, M., Thiéry, D. & Rusch, A. (2018). Evidence that organic farming promotes pest control. Nature Sustainability, 1(7), 361–368. https://doi.org/10.1038/s41893-018-0102-4
Novak, S.M. & Fiorelli, J.L. (2011). Greenhouse Gases and Ammonia Emissions from Organic Mixed Crop-Dairy Systems: A Critical Review of Mitigation Options. In: E. Lichtfouse, M. Hamelin, M. Navarrete, P. Debaeke (eds) Sustainable Agriculture Volume 2. Dordrecht: Springer, pp.529-556. https://doi.org/10.1007/978-94-007-0394-0_24
Poeplau, C. & Don, A. (2015). Carbon sequestration in agricultural soils via cultivation of cover crops – A meta-analysis. Agriculture, Ecosystems & Environment, 200, 33–41. https://doi.org/10.1016/j.agee.2014.10.024
Pelosi, C., Bertrand, M. & Roger-Estrade, J. (2009). Earthworm community in conventional, organic and direct seeding with living mulch cropping systems. Agronomy for Sustainable Development, 29, 287-295.
Pelosi, C., Bertrand, M., Thénard, J. & Mougin, C. (2015). Earthworms in a 15 years agricultural trial. Applied Soil Ecology, 88, 1-8.
Pélosi, C., Toutous, L., Chiron, F., Dubs, F., Hedde, M., Muratet, A., Ponge, J.F., Salmon, S. & Makowski, D. (2013). Reduction of pesticide use can increase earthworm populations in wheat crops in a European temperate region. Agriculture, Ecosystems & Environment, 181, 223-230.
Pfiffner, L. & Luka, H. (2003). Effects of low-input farming systems on carabids and epigeal spiders–a paired farm approach. Basic and Applied Ecology, 4(2), 117-127.
Pottier, E., Tournadre, H., Benoit, M. & Prache, S. (2009). Maximizing the share of grazing in the feeding of sheep: advantages for feed self-sufficiency, for the environment, and for the quality of the products. Fourrages, 199, 349-371.
Power, E.F., Jackson, Z. & Stout, J.C. (2016). Organic farming and landscape factors affect abundance and richness of hoverflies (Diptera, Syrphidae) in grasslands. Insect Conservation and Diversity, 9(3), 244–253. https://doi.org/10.1111/ICAD.12163
Puech, C., Baudry, J., Joannon, A., Poggi, S. & Aviron, S. (2014). Organic vs. conventional farming dichotomy: Does it make sense for natural enemies? Agriculture, Ecosystems & Environment, 194, 48–57. https://doi.org/10.1016/J.AGEE.2014.05.002
Pugesgaard, S., Petersen, S.O., Chirinda, N. & Olesen, J.E. (2017). Crop residues as driver for N2O emissions from a sandy loam soil. Agricultural and Forest Meteorology, 233, 45–54. https://doi.org/10.1016/J.AGRFORMET.2016.11.007
Pulungan, M.A., Suzuki, S., Gavina, M.K.A., Tubay, J.M., Ito, H., Nii, M., Ichinose, G., Okabe, T., Ishida, A., Shiyomi, M. & Togashi, T. (2019). Grazing enhances species diversity in grassland communities. Scientific Reports, 9(1), 11201.
Reumaux, R., Chopin, P., Bergkvist, G., Watson, C. A. & Öborn, I. (2023). Land Parcel Identification System (LPIS) data allows identification of crop sequence patterns and diversity in organic and conventional farming systems. European Journal of Agronomy, 149, 126916. https://doi.org/10.1016/J.EJA.2023.126916
Rotchés‐Ribalta, R., Sans, F.X., Mayer, J. & Mäder, P. (2020). Long‐term farming systems and last crop sown shape the species and functional composition of the arable weed seed bank. Applied Vegetation Science, 23(3), 428-440.
Rundlöf, M., Edlund, M. & Smith, H.G. (2010). Organic farming at local and landscape scales benefits plant diversity. Ecography, 33(3), 514-522.
Rusch, A., Birkhofer, K., Bommarco, R., Smith, H.G. & Ekbom, B. (2014). Management intensity at field and landscape levels affects the structure of generalist predator communities. Oecologia, 175, 971-983.
Sands, B. & Noll, M. (2022). Toxicity of ivermectin residues in aged farmyard manure to terrestrial and freshwater invertebrates. Insect Conservation and Diversity, 15(1), 9-18.
Schumacher, M., Ohnmacht, S., Rosenstein, R. & Gerhards, R. (2018). How Management Factors Influence Weed Communities of Cereals, Their Diversity and Endangered Weed Species in Central Europe. Agriculture, 8(11), 172. https://doi.org/10.3390/AGRICULTURE8110172
Seipel, T., Ishaq, S.L., Larson, C. & Menalled, F.D. (2022). Weed Communities in Winter Wheat: Responses to Cropping Systems under Different Climatic Conditions. Sustainability (Switzerland), 14(11), 6880. https://doi.org/10.3390/su14116880
Sereda, E., Wolters, V. & Birkhofer, K. (2015). Addition of crop residues affects a detritus-based food chain depending on litter type and farming system. Basic and Applied Ecology, 16, 746–754. https://doi.org/10.1016/j.baae.2015.07.005
Sidauruk, L. & Sipayung, P. (2018). Cropping management on potato field, a strategy to suppress pest by increasing insect diversity and natural enemies. IOP Conference Series: Earth and Environmental Science, 205(1), 012026. https://doi.org/10.1088/1755-1315/205/1/012026
Sidemo‐Holm, W., Carrié, R., Ekroos, J., Lindström, S.A. & Smith, H.G. (2021). Reduced crop density increases floral resources to pollinators without affecting crop yield in organic and conventional fields. Journal of Applied Ecology, 58(7), 1421-1430.
Skinner, C., Gattinger, A., Krauss, M., Krause, H.-M., Mayer, J., van der Heijden, M.G.A. & Mäder, P. (2019). The impact of long-term organic farming on soil-derived greenhouse gas emissions. Scientific Reports, 9(1), 1702. https://doi.org/10.1038/s41598-018-38207-w
Skuce, P.J., Morgan, E.R., van Dijk, J. & Mitchell, M. (2013). Animal health aspects of adaptation to climate change: beating the heat and parasites in a warming Europe. Animal, 7(s2), 333–345.
Smith, L.G., Williams, A.G. & Pearce, B.D. (2015). The energy efficiency of organic agriculture: A review. Renewable Agriculture and Food Systems, 30(3), 280–301. https://doi.org/10.1017/S1742170513000471
Smith, L., Egan, J., Woolford, A., Orsini, S., Mullender, S. & Padel S. (2018) Reviewing Opportunities, Barriers and Constraints for Organic Management Techniques to Improve Sustainability of Conventional Farming. Defra Final Report OF03111. Available at: Science Search (defra.gov.uk) (Accessed 15 August 2023).
Smith, L.G., Kirk, G.J.D., Jones, P.J. & Williams, A.G. (2019). The greenhouse gas impacts of converting food production in England and Wales to organic methods. Nature Communications, 10(1), 1–10. https://doi.org/10.1038/s41467-019-12622-7
Sosulski, T., Srivastava, A.K., Ahrends, H.E., Smreczak, B. & Szymańska, M. (2023). Carbon Storage Potential and Carbon Dioxide Emissions from Mineral-Fertilized and Manured Soil. Applied Sciences (Switzerland), 13(7). https://doi.org/10.3390/app13074620
Steinberg, G. & Gurr, S.J. (2020). Fungi, fungicide discovery and global food security. Fungal Genet Biol, 144, 103476. https://doi.org/10.1016/j.fgb.2020.103476.
Stockdale, E.A., Lampkin, N.H., Hovi, M., Keatinge, R., Lennartsson, E.K.M., Macdonald, D.W., Padel, S., Tattersall, F.H., Wolfe, M.S. & Watson, C.A. (2001). Agronomic and environmental implications of organic farming systems. Advances in Agronomy, 70, 261–327. https://doi.org/10.1016/S0065-2113(01)70007-7
Sun, H.Y., Koal, P., Gerl, G., Schroll, R., Joergensen, R.G. & Munch, J.C. (2017). Water-extractable organic matter and its fluorescence fractions in response to minimum tillage and organic farming in a Cambisol. Chemical and Biological Technologies in Agriculture, 4(1), 1-11. https://doi.org/10.1186/s40538-017-0097-5
Szostek, M., Szpunar-Krok, E., Pawlak, R., Stanek-Tarkowska, J. & Ilek, A. (2022). Effect of Different Tillage Systems on Soil Organic Carbon and Enzymatic Activity. Agronomy, 12(1), 208. https://doi.org/10.3390/agronomy12010208
Tamburini, G., Bommarco, R., Wanger, T.C., Kremen, C., van der Heijden, M.G.A., Liebman, M. & Hallin, S. (2020). Agricultural diversification promotes multiple ecosystem services without compromising yield. Science Advances, 6(45), eaba1715. https://doi.org/10.1126/SCIADV.ABA1715/SUPPL_FILE/ABA1715_SM.PDF
Timberlake, T.P., Vaughan, I.P. & Memmott, J. (2019). Phenology of farmland floral resources reveals seasonal gaps in nectar availability for bumblebees. Journal of Applied Ecology, 56(7), 1585-1596.
Török, E., Zieger, S., Rosenthal, J., Földesi, R., Gallé, R., Tscharntke, T. & Batáry, P. (2021). Organic farming supports lower pest infestation, but less natural enemies than flower strips. Journal of Applied Ecology, 58(10), 2277–2286. https://doi.org/10.1111/1365-2664.13946
Tscharntke, T., Grass, I., Wanger, T.C., Westphal, C. & Batáry, P. (2021). Beyond organic farming–harnessing biodiversity-friendly landscapes. Trends in Ecology & Evolution, 36(10), 919-930.
Ulber, L., Steinmann, H., Klimek, S. & Isselstein, J. (2009). An on‐farm approach to investigate the impact of diversified crop rotations on weed species richness and composition in winter wheat. Weed Research, 49(5), 534–543. https://doi.org/10.1111/j.1365-3180.2009.00722.x
Watson, C.A., Atkinson, D., Gosling, P., Jackson, L.R. & Rayns, F.W. (2006). Managing soil fertility in organic farming systems. Soil Use and Management, 18, 239–247. https://doi.org/10.1111/J.1475-2743.2002.TB00265.X
Watson, C.A., Reckling, M., Preissel, S., Bachinger, J., Bergkvist, G., Kuhlman, T., Lindström, K., Nemecek, T., Topp, C.F.E., Vanhatalo, A., Zander, P., Murphy-Bokern, D., & Stoddard, F.L. (2017). Grain Legume Production and Use in European Agricultural Systems. In: Advances in Agronomy, 144, 235–303. https://doi.org/10.1016/bs.agron.2017.03.003.
If you require the report in an alternative format such as a Word document, please contact info@climatexchange.org.uk or 0131 651 4783.
© Published by SRUC 2023 on behalf of ClimateXChange. All rights reserved.
While every effort is made to ensure the information in this report is accurate, no legal responsibility is accepted for any errors, omissions or misleading statements. The views expressed represent those of the author(s), and do not necessarily represent those of the host institutions or funders.
info@climatexchange.org.uk
+44(0)131 651 4783
@climatexchange_
www.climatexchange.org.uk
![]()
Applying interlinked practices to enhance the effectiveness of net zero policymaking in Scotland
 Rhona Pringle, Lucy Harbor and Louise Marix Evans, CAG Consultants
March 2023
DOI: http://dx.doi.org/10.7488/era/3774
Executive summary
Aims
The concept of interlinked practices (Black and Eiseman 2019) views lifestyles as a network of interrelated practices consisting of competencies (knowledge, skills), materials (objects, infrastructure) and meaning (expectations, shared meaning). The authors suggested that these practices could provide the targets of interventions aiming to change unsustainable behaviours or parts of them.
The aim of this research was to explore how the Scottish Government can apply the concept of interlinked practices to improve net zero policy development and enact societal change. The ultimate aim of interlinked practices is to identify some critical shared elements that can be changed to catalyse greater societal change across a range of behaviours.
Findings
During the early stages of this study, we found that the interlinked practices concept (Black and Eisemann, 2019) is untested and theoretical in terms of policy development and implementation. Therefore, this project focused on research with Scottish Government staff and external stakeholders, including a literature and evidence review, interviews, exploratory and testing workshops, and a mapping exercise.
- We have identified policy interdependencies and interlinked practices in the following sectors: Transport, Agriculture and Land Use Change and Forestry (LULUCF), Waste and Circular Economy, and Buildings. These are key pillars of the Climate Change Plan (CCP) and have significant powers devolved to the Scottish Government. These sectors have practice-based elements, and are crucial in making progress towards net zero targets in key areas.
- Interlinked practices can help to reframe a behaviour problem and help policymakers and practitioners work towards positive societal shift. However, the end point of using social practice related tools is to identify the factors influencing behaviours or practices rather than to prescribe a policy or intervention.
- Of the three social practice elements, material and competencies were often considered in policy development, but meaning was not.
- An interlinked practices approach could be beneficial, but policymakers would need support with developing and implementing it.
Recommendations for implementation
- Using existing tools: A low-cost gateway for Scottish Government policy teams to consider how practices are interlinked across sectors and other organisations could be using tools such as the individual, social and material (ISM) tool, Place Standard with a climate lens, or 20-minute neighbourhoods concept.
- Early adopters: CCP sectors that could be early adopters of an interlinked practices approach to net zero policy development are Transport and Waste and Circular Economy. These have significant powers devolved to the Scottish Government, have practice-based elements that need to make progress towards net zero targets in key areas (Scottish Government, 2022; Climate Change Committee, 2022) and already have interlinked practices.
- Other sectors, such as Agriculture and LULUCF and Buildings, have all of these elements, but we did not find interlinked practices. These other sectors could consider interlinked practices after the mapping work in recommendation 4.
- Local level: Apply a place-based lens to consider how practices interlink at a local level. This could be done as part of place-based engagement and testing, as interlinked practices are likely to vary depending on place (eg trip chaining in an urban setting is likely to differ from that in a rural setting).
- Mapping from the start: Research with expert practitioners, citizens, communities, regulators, policymakers and businesses can help identify and map how practices interlink at the start of a policymaking process in each of the CCP sectors, and which of these should be prioritised in terms of delivering significant emission reductions.
- Time and resources: Using, monitoring, evaluating and promoting the tools mentioned here requires time and resources from the team responsible for supporting sector teams, eg the Behaviours team, and from the sector staff.
- Case studies: Case studies to share learning across the Scottish Government could be developed of policies/strategies that have used social practice theory and considered interlinked practices, such as the ‘Routemap to achieve a 20 per cent reduction in car kilometres by 2030’ (Transport Scotland, 2022) and Home Energy Efficiency Programmes for Scotland (Scottish Government, 2019) or provided a framework for consideration of these, such as 20-minute neighbourhoods and the Place Principle (Scottish Government, 2019).
- Guide: A facilitator could use the flowchart in figure 5 as part of a suite of support measures for policymakers, to help understand how and when to use interlinked practices.
- Plain English: Social practice theory can be challenging to comprehend. Plain English needs to be used when discussing these.
This report was co-produced with the Scottish Government and ClimateXChange client steering group.
Contents
1 Executive summary 2
1.1 Aims 2
1.2 Findings 2
1.3 Recommendations for implementation 3
2 Introduction 5
2.1 Theories informing the research 5
3 Methodology 9
3.1 Approach 9
3.2 Limitations 11
4 Mapping policy interdependencies and interlinked practices 12
4.1 Policy interdependencies and interlinked practices of particular relevance to the Climate Change Plan 12
5 Applying an interlinked practices approach to net zero 16
5.1 Tools 16
5.2 Policy examples that build on, or make use of, interlinked and/or social practices theory 19
5.3 Benefits and challenges of applying an interlinked practices approach 21
6 Conclusions and recommendations 25
6.1 Conclusions 25
6.2 Recommendations 27
7 References 29
8 Appendix 1: Literature and evidence review 31
8.1 Introduction 31
8.2 Social practice theory 32
8.3 Tools and concepts 36
8.4 Policy literature review 47
8.5 Summary of findings 53
8.6 Key findings regarding the opportunities 54
8.7 Literature review references 54
9 Appendix 2: Methodology 57
9.1 Scoping stage 57
10 Appendix 3 Mapping summary 61
Introduction
Previous research for ClimateXChange has introduced the concept of interlinked practices (Black and Eiseman 2019). This views lifestyles as a network of interrelated practices consisting of competencies (knowledge, skills), materials (objects, infrastructure) and meaning (expectations, shared meaning). The authors suggested that these practices could provide the targets of interventions aiming to change unsustainable practices (or parts of them).
An interlinked practices lens could therefore be more effective at guiding the interventions required to achieve Scotland’s net zero target than an individual behaviour change approach.
The aim of this research by CAG Consultants is to answer the question: ‘How can the Scottish Government apply the concept of interlinked practices to improve net zero policy development and enact societal change?’
There were three main objectives of the research:
- To identify the interlinked practices of most relevance for the Scottish Government’s next Climate Change Plan, including any policy interdependencies with the greatest positive influence on the societal shift to net zero.
- To assess the feasibility of translating the concept of interlinked practices into a practical approach able to inform the development of the Climate Change Plan.
- Evaluate the benefits and limitations of applying the interlinked practices lens to the next Climate Change Plan.
According to the Climate Change Committee (2020) over 60% of the emissions reductions needed to meet net zero require societal change. These emissions cannot be achieved solely through supply-side policy such as decarbonising the electricity grid or improving energy efficiency standards of items we purchase and use.
Individuals, households, communities and organisations will have to replace or substitute the high emission ways they perform practices in their lives with low/zero emission practices. This is a significant and transformative shift that society needs to make at pace and as affordably and inclusively as possible. It requires a new way of making policy and of engaging with people. The research examines if interlinked practices could play a role in this in a Scottish policy context.
Theories informing the research
Social practice theory
It is acknowledged that if we focus purely on individual behaviour, the wider societal change required to achieve net zero will not happen. To get transformative change, the focus needs to be on social practice change and technological change (Environment and Climate Change Committee, 2022).
Social practice theory is a well-developed research field. The theory moves beyond traditional framings of behaviour change as primarily a product of individual choice or rational decision-making, by suggesting that our daily lives are better understood as the performance of a series of social practices. Social practices are performed and reinforced in society through the combination of three elements, shown in figure 1:
- Material: the materials needed are accessible (eg having a bike and safe cycle routes)
- Competence: the person is able to engage in the behaviour (eg they know how to ride a bike safely)
- Meaning: it fits within social norms and within the person’s schedule (eg riding is an acceptable way to commute to work and I can get there on time).

Figure 1: The three elements that compose social practices
Social practice theory also recognises people’s agency; that the collective performance of practices alters social structures, social norms and effects change through infrastructure improvements or demand for services. Similarly, social and physical structures can reinforce practices. This is how to achieve societal change (Shove et al. 2012) and is illustrated in figure 2.

Figure 2: Social practice (image based on Conquer Imagination, 2020)
While social practice theory has been written about extensively in academic papers, it should be noted that there are few real-world examples of social practice being used in policy development.
Interlinked practices
Interlinked practices is a concept developed by Black and Eiseman (2019) in a report for ClimateXChange. This concept was informed by social practice theory, including Shove et al (2012) who explore how practices link to and shape each other, and Spurling et al (2013) who explore interlocking practices and the role that infrastructure plays in this.
An interlinked practices approach recognises the complexity of our lifestyles and requires greater consideration of multiple practices. Black and Eiseman (2019) argue that, because many practices are carried out in sequence in people’s lives, when trying to change how one activity is performed, other linked practices need to be considered. For instance, when trying to transition from commuting by car to commuting by bicycle or bus, a person considers how that affects picking up children after school, or doing the shopping on the way home. They ask if: it is safe to cycle with the children; there is time; the bus goes near the school and workplace; the bus service is reliable; it is possible to carry all the shopping.
An interlinked practices approach is intended to move away from a behaviour change approach with the onus on the individual to change their behaviour almost regardless of how easy or difficult this is to do.
The approach aims to map out how complex sets of interrelated actions can be addressed holistically by identifying the common elements that link practices. For this, it uses categories of material, meaning and competence, to then identify changes that need to be made to these elements (eg in structures, institutions, regulations, services) to enable people to live lower emissions lives. The ultimate aim of interlinked practices is to identify some critical shared elements that can be changed to catalyse greater societal change across a range of behaviours.
A nine-step guide was developed by Black and Eiseman (2019), outlining how interlinked practice concepts might be implemented in a checklist/workshop approach. However, it is untested to date, and there is just one incomplete example provided in their report.
Reframing behaviour change
Reflecting on how practices are interlinked enables identification of opportunities or constraints that can impact uptake of net zero practices. There is evidence of limitations with interventions targeted solely at motivating the individual to act, as there are many barriers that block intention to act from being converted into action (Black and Eiseman, 2019). These barriers include social norms (eg not cycling to work because you do not think it is acceptable to turn up to work sweaty) as well as lack of available infrastructure (eg lack of safe routes for cycling and secure bike parking). Furthermore, the interlinkages with other daily practices may also pose some challenges (eg taking children to nursery on the way to work) (ibid).
By adopting a traditional behaviour change approach, climate change policy has often focussed on individuals and their choices, and often involves using campaigns to raise awareness and change attitudes (United Nations, 2022; Shove, 2011), so that people might make more sustainable choices. Social practice theory moves beyond focusing on influencing individual decision-making by suggesting that the right combination of elements (shown in Figure 1 above) must be in place for a person to engage in certain practices.
With daily social practices, people rarely choose to consume resources such as water or energy, nor do they often consider the consequences of this everyday action. Rather, the resources are used within these practices, such as cleaning, showering or cooking to achieve certain ends, for example feeding the family or getting ready for work (Hoolohan et al., 2018).
Many unsustainable routines remain unaffected by interventions that seek to change them, perhaps as a result of lock-in. The more people participate in unsustainable practices and the more regularly they do so, the stronger the lock-in (ibid.). An example of this lock-in is car reliance, whereby our norms of car use mean we may live far from places of work or education for example, meaning it is normal to expect people to drive to work and school. Or we may undertake many interlinked practices in our day, such as picking up the shopping on the way back from work, and so our car use becomes locked-in.
According to Black and Eiseman (2019), the rationale for an interlinked practices approach is that lifestyles are complex and achieving the more ambitious changes needed to reach net zero will require greater consideration of both behaviours and practices. This needs to include greater consideration of social and material influences on behaviour, not just a focus on the aspects of an individual’s behaviour.
Methodology
Approach
The research used a mixed methodology approach, summarised in table 1. The process has been an iterative one, co-produced with the project steering group. Findings from each stage of the research informed the subsequent stages. The detailed methodology is in Appendix 1.
| Stage | Aim | Method |
|---|---|---|
| Scoping | To understand what literature and evidence there was on Interlinked Practices and explore what the opportunities and obstacles might be for applying an Interlinked Practices approach to the development of the next Climate Change Plan. | Background research conducted:
Tasks Literature and evidence review, including: review of social practice and interlinked practices literature , and review of relevant Scottish Government Policy . (The full literature and evidence review can be found in Appendix 2)
|
| To investigate whether an Interlinked Practice approach could help develop more effective policies to deliver the societal change/social cultural change needed to achieve net zero | Exploratory workshops with Scottish Government sector/cross cutting team representatives and external stakeholders to explore:
Tasks
|
|
| Mapping | To identify, where possible, which policy interdependencies and interlinked practices, if any, could be of most relevance to the next Climate Change Plan. | Categorising and mapping, informed by the scoping work,
this mapping included the different sectors used in the Climate Change Plan, considering the UK Climate Change Committee’s four progress monitoring elements: (i) outcomes (ii) enablers (iii) policy (iv) contextual factors as well as progress data from the Scottish Government’s Climate Change Plan monitoring report. Task Desk-based, online mapping |
| Testing | To explore and test processes for identifying/developing an interlinked practices approach for the Climate Change Plan. | Testing workshops with Scottish Government sector and cross cutting team representatives and external stakeholders.
Using either a newly-developed flowchart or the existing Change Points approach, workshops tested applying a social practice theory, ILP concept and policy dependencies journey to real-life sector specific or spatial policy-making challenges. The challenges included home heating infrastructure retrofit, reducing car use by 20%, 20-minute neighbourhoods and reducing emissions from livestock production Task Online workshops |
| Examining | To review and analyse research data/evidence to answer the research questions | Analysis of research data collected through the literature and data review (Appendix 2), exploratory workshops, mapping summary (Appendix 3) and testing workshops.
Analysis addressed the three research aims: 1. Identify the interlinked practices of most relevance for the Scottish Government’s next Climate Change Plan; including any policy interdependencies with the greatest positive influence on the societal shift to net zero. 2. Assess the feasibility of translating the concept of ‘interlinked practices’ into a practical approach able to inform the development of the Climate Change Plan in a way which will positively influence interlinked practices, and link policy development and implementation to enhance uptake, spill overs and increase emissions reductions. 3. Evaluate the benefits and limitations of applying the interlinked practices lens to the next Climate Change Plan |
Table 1: Summary of research methodology
Limitations
There was a lack of evidence and case studies on the effectiveness of a social practice theory and interlinked practice approach being used in policy-making. Research findings are therefore heavily based on primary research through workshops with sector policy staff.
Not all Climate Change Plan sector leads were available for interview or involvement in the workshops. It was therefore not possible to gather contributions on developing an interlinked practices approach for the Climate Change Plan from all sector teams.
The number of participants contributing to the research through interviews and workshops is relatively small, so contributions provided may not reflect all views across the Scottish Government or stakeholder organisations.
Mapping policy interdependencies and interlinked practices
The mapping work identified some policy interdependencies, as described in section 4.1, but analysis top-down, starting with national policies, was not able to identify interlinked practices. Reasons for this are described below.
However, mapping policies, initiatives, outcomes, enablers, policy and contextual factors, as well as progress data from within and across the sectors did enable identification of potential cross-sectoral approaches and considerations.
We highlighted in the mapping where the three social practice elements (materials, competencies and meanings) appeared to be present in current policies and initiatives for the Climate Change Plan sectors. This indicated which sectors and potential policy areas might have the underpinning elements in place necessary for low-carbon practices.
Policy interdependencies and interlinked practices of particular relevance to the Climate Change Plan
Our analysis assessed policy areas or sectors where the Scottish Government has power in relation to the application of interlinked practices for a net zero transition. Policy interdependencies were identified in sectors with significant powers devolved to the Scottish Government, which have more practice-based elements and which need to make more progress towards net zero targets in key areas (Scottish Government, 2022; Climate Change Committee, 2022). These sectors are Transport, Waste and Circular Economy, Agriculture and Land Use Land Use Change and Forestry (LULUCF), and Buildings.
It has not been possible to identify a comprehensive list of interlinked practices across the Climate Change Plan sectors to inform net zero policy development through the mapping work. Further detailed work, informed by sector experts and a wide range of practitioner stakeholders (i.e. people doing the practices), would be required to understand how daily practices interlink, as it is likely to differ depending on many factors, such as people’s age and where they live.
The interlinked practices of relevance to the Climate Change Plan were identified through the scoping stage and testing workshops and were based on work already undertaken (see below). These are in the Transport, and Waste and Circular Economy Climate Change Plan sectors, and are set out below.
Transport
Policy interdependencies
There are a number of policy interdependencies aiming to reduce the need to travel by car and addressing car trip linkages. These include:
- Location: Planning policy – both local plans and the National Planning Framework 4 (NPF4) – on the location of facilities/services, such as employment, education, leisure and retail centres, and how these can be accessed through active travel and public transport infrastructure. This can be informed by consideration of trip-chaining (linked trips for different purposes, or, in other words, interlinked practices) to understand individual travel patterns and the reasons for these.
- Broadband coverage: The provision of 100% superfast broadband coverage to facilitate good digital connectivity will help reduce car use by enabling increased digital access to services, such as employment, health and education. This also links to the Industry sector, which will have a key role in delivering 100% broadband coverage.
- Sustainable transport: Modal transport shifts will be required and these link to other policy areas. For example, increased uptake of active travel links to health improvements through increased exercise, and reductions in air pollution and road traffic accidents. The modal shift to electric vehicles has links to policies in the electricity sector, such as location, type and scale of low carbon electricity generation/distribution and infrastructure, including local energy systems and community energy.
- Aviation pricing and flexibility: Flying is often much cheaper than train travel and when combined with school holiday dates and employment limits on annual leave, flying is often preferred. This is an example of where material conditions need to be considered, as well as meaning and social norms.
Interlinked practices
We have identified the following interlinked practices related to transport:
- Reducing car use: The Transport Scotland Routemap to achieve a 20 per cent reduction in car kilometres by 2030 (Transport Scotland, 2022) identified some system-level interventions needed to enable this reduction. Interlinked practices that were identified and link to this include commuting to work and undertaking work functions, accessing goods and services (such as shopping and medical facilities), accessing leisure facilities/pursuits (such as sports centres), and accessing schools and education facilities.
- High-carbon practices, including flying: There are some social shifts in attitudes to flying, including frequent flying, which may help support reductions in flights (Gössling et al, 2020). There are also moves by progressive employers to provide extra holiday days to enable staff to travel without flying[1], providing a material contribution to the matter, whilst still getting the norm or meaning of a full week in the destination. So, notwithstanding that half of people in the UK do not fly, the way we are employed is an example of interlocking practices, where the institutions that employ us, plus the social norm that travelling to go on holiday is not part of the holiday fun itself, lock us into high-carbon practices.
Waste and Circular Economy
Policy interdependencies
The policy interdependencies for waste, particularly food waste, are complex and multiple.
- Legislation: spans waste legislation and food labelling, new initiatives like the Deposit Return Scheme[2] and Extended Produce Responsibility[3], investment in waste and recycling collections and disposal, as well as linking into standards and industry and manufacturing practices, which further link out to global markets.
- Retail and food management: links through supermarket and retailer-related policies such as pricing, portion sizes, packaging material choices, as well as linking further down national and global food supply chains. Indeed, food waste links to education and training policies covering competencies around personal, household and food management, as well as cooking skills.
- Planning: Circular Economy policy interdependencies regarding buildings raised concerns in one of the workshops about whether a drive towards low-carbon heating would result in boiler scrappage. This highlighted the point that considering interlinkages may highlight where progress towards net zero in one sector (in this case reducing building emissions) may have a negative impact on another (waste and circular economy) and so may avoid any unintended consequences.
Interlinked practices
We have identified interlinked practices for the Waste and Circular Economy sector related to food waste.
- Food waste at home: According to WRAP[4], 70% of the food that is wasted in the UK is wasted by citizens in their own homes. That’s 4.5 million tonnes of food that could have been eaten being thrown away every year. Households and consumers are responsible for 61% of food waste in Scotland[5]. While not linked in a sequential manner, evidence suggests that there are links between food practices such as managing and buying food (eg planning meals, checking the fridge, making a list, buying food eg vegetable and fruit boxes, ready-made food kits), preparing food (eg cooking meals, portion sizes, batch cooking, freezing and defrosting, using up leftovers), and practices such as disposing of food waste (eg disposing of food that has passed its ‘best before date’, leftovers, take away meals)[6].
These practices vary according to the age profile of households, with younger people and people with children wasting higher quantities of food. They also depend on the wider context including time pressure, which in turn links to work, commuting, leisure, caring duties and cooking skills.
Agriculture and LULUCF
Policy interdependencies
A number of policy interdependencies were identified for Agriculture and LULUCF, but for the reasons given above, it was not possible within the research to identify interlinked practices. Policy interdependencies include:
- Biomass: An interdependency between agriculture and Net Zero Emissions Technologies (NETS) for agriculture and LULUCF policies to ensure the availability of home-grown sustainable biomass to supply large-scale power bioenergy with carbon capture and storage.
- Business models: This in turn links to practices in agriculture and land use sectors, with farmers and landowners integrating biomass crops into their business models, having the competence and know-how as well as equipment and financial incentives to grow such crops and, critically, for the meaning of such a crop to align with the meaning of what it is to farm, or be a landowner.
- Timber production: An interdependency between LULUCF and the buildings sector target to increase Scottish-grown timber to support the construction industry in using more sustainably-sourced wood fibre to increase its use of wood products. As above, this would link back into understanding the practices of farmers and landowners in producing more timber.
Buildings
Policy interdependencies
As with agriculture and LULUCF, a number of policy interdependencies, but not interlinked practices, were identified relating to retrofitting buildings. These include:
- Construction: An increase in the use of sustainably-sourced wood fibre to reduce emissions by encouraging the construction industry to increase its use of wood products where appropriate (as mentioned above).
- Bioenergy: The availability of home-grown sustainable biomass to supply large-scale power bioenergy with carbon capture and storage.
This highlights the need for multiple stakeholders to tackle the challenge of retrofit and decarbonising heating, which may require a different type of systems thinking that brings in all actors. There are a number of organisations already addressing this, including Carbon Co-op[7], Dark Matter Labs[8] and 3Ci[9].
Use of buildings, for example increased homeworking, may increase energy use due to increased electricity use to power IT equipment and lighting, increased requirement for heating to warm the home while working and more cooking in the home[10]. This has a policy interdependency with low carbon generation and supply by the electricity sector.
Applying an interlinked practices approach to net zero
Tools
In the course of the research we identified a number of tools that could facilitate consideration of interlinked practices.
ISM tool
The first of these is the ISM tool[11], which was developed in 2013 for the Scottish Government (Darnton and Horne, 2013) and was identified through our scoping work as a potentially important basis for policymakers and practitioners in the development of thinking on interlinked practices.
The ISM tool was developed to design policy interventions in the context of sustainability. Taking insights from social psychology, behavioural economics as well as sociology theories of practice, ISM is based on moving beyond the individual to consider all the contexts that shape people’s behaviours – the Individual, the Social and the Material (ISM). In 2013, the ISM tool was adopted by the Scottish Government and a subsequent user guide was written (Scottish Government, 2013).
The tool enables stakeholders to consider a shared behavioural challenge and work together to map the factors influencing that behaviour onto the ISM model. Through the process, stakeholders develop a shared understanding of the behaviour and identify their respective roles in bringing about change.
Given that the factors on the model span multiple levels of influence and that multiple stakeholders convene around the model to co-design solutions, it offers an approach to behaviour change that begins to address the system (or ‘causal web’) within which the behaviour sits.
As such, ISM offers a way to bring about behaviour change that is durable and far reaching, being grounded in system change. This means it can address complex policy challenges.
The ten steps of the ISM tool are shown in figure 3 below and include:
- Target behaviour: specify in advance which behaviour you are targeting
- Good mix of people: invite a diverse group, with depth and breadth of understanding
- Introduce or recap ISM tool
- Existing content: briefly outline the existing policy and practice context
- ISM behaviour mapping: start mapping the target behaviour using the ISM tool
- Cover all ISM factors
- Immediate observations: note priority factors, key insights and initial ideas
- Policy mapping: chart existing policies and interventions against ISM
- Identify gaps and ideas: generate ideas where ISM factors are not addressed by existing work
- Take action: develop a coherent package of interventions spanning I, S and M
Figure 3: Step-by-step approach to using the ISM tool (Darnton and Horne 2013, p. 12)
Place Standard tool with a climate lens
The Place Standard tool with a climate lens[12] (Our Place Scotland, 2022) is a tool that was developed to help people understand how climate change might play out in a local area and support them to design their future place with climate in mind.
It builds on the core Place Standard (Our Place Scotland, 2022a) and takes a cross-sectoral approach to considering issues across 14 place-based themes.
It includes a suite of tools for facilitators to help develop productive conversations focused on the important relationship between climate and place, and it can enable consideration of interlinked practices at the local level.
Workshop participants suggested that the Place Standard can be a useful tool to get cross-sectoral conversations going about climate change, and can also be used at the city, town, village or street level. Given that some interlinked practices are likely to vary depending on place, this tool will help to identify interlinked practices of relevance to the residents of a particular place.
Change Points
Change Points[13] is a toolkit developed by a team led by Claire Hoolohan from the Tyndall Centre and the University of Manchester, and Alison Browne from the University of Manchester (Hoolohan et al. 2018). It was developed with Defra and other industry and policy stakeholders, particularly on the issues of water and food, and was informed by the ISM tool.
The toolkit is a six-step consensus-based workshop for multi-stakeholders to facilitate consideration of day-to-day practices and how these relate to a key problem. The aim is to design interventions that unlock unsustainable practices. For instance, with regard to food waste, the tool looks at different types of people who are carrying out high waste or high emissions actions and works through potential forms of intervention that consider social and material dimensions in their lives. This includes systems mapping.
Change Points is described by one of the Change Points team members in interview as “a workshop process designed to get beyond individual action to achieve social change. Insights from the workshop allow diversity to inform design, so that interventions work for different people. It also allows the connections between what people do in their homes and all the other things they do in the course of their everyday life. In these ways, Change Points helps re-think responsibility and agency for unsustainable consumption, catch stereotypes, resist passing on the burden of action to future generations and get beyond messaging.”
It can also be used to explore how to increase the uptake and impact of technological interventions (e.g. increase the uptake of water or energy efficient devices and encourage the switch to smart meters) and to consider the wider influences on technological uptake and the routines in which technologies are embroiled.
This workshop takes a whole day to implement or can be carried out in modules. The toolkit is designed to be easy to use by a facilitator and has pre-designed worksheets.
It is currently in use by a wide circle of academics, but the results of its application are yet to be seen.
COM-B model
The COM-B model[14] identifies three components to any behaviour (B): Capability (C), Opportunity (O) and Motivation (M). It sets out that for an individual to undertake a particular behaviour, they must have: the psychological and physical capability to do so (C), the social and physical opportunity for the behaviour (O), and be motivated to carry out a particular behaviour more than other competing behaviours (M).
The model proposes that in order to deliver and maintain effective behaviour change, interventions must target one or more of these interacting components. It can help policy makers and anyone interested in facilitating behaviour change understand drivers of behaviours and how decisions are made.
Policy examples that build on, or make use of, interlinked and/or social practices theory
A number of examples were found of Scottish policy and/or strategy that demonstrated some elements of an interlinked practices approach.
Routemap to achieve a 20 per cent reduction in car kilometres by 2030
Transport Scotland and the Convention of Scottish Local Authorities (COSLA) used a number of tools to inform the development of their ‘Routemap to achieve a 20 per cent reduction in car kilometres by 2030’ (Transport Scotland, 2022), including the COM-B model and the Scottish Government’s ISM Tool (Darnton and Horne, 2013).
In developing the policy on car use reduction, a cause-and-effect fish-bone diagram similar to Figure 4 was developed, which illustrates the process of theorising the root causes of a car-dependent transport system. The diagram categorises the causes by individual, socioeconomic, cultural, community and environmental themes. This is similar to describing the individual, social and material contexts in which people are behaving when using their cars, following the ISM model depicted in the bottom left of the figure 4. This includes the following factors:
- Individual: values, beliefs, attitudes, costs and benefits, emotions, agency skills and habit
- Social: opinion leaders, institutions, norms, roles and identity, tastes, meanings, networks and relationships
- Material: rules and regulations, technologies, infrastructure, objects, time and schedules
Figure 4: Example of a fishbone cause-and-effect diagram using the ISM tool in the development of the ‘Routemap to achieve a 20 per cent reduction in car kilometres by 2030’ (Transport Scotland, 2022). Diagram extracted from the University of Edinburgh Master of Public Health’s dissertation and reproduced with the authorisation of Abigail Johnston.
20-minute neighbourhood
Another policy example relevant to interlinked practices is the 20-minute neighbourhood concept, which aims for residents to meet their day-to-day needs within a 20-minute walk of their home. Research for ClimateXChange on 20-minute neighbourhoods in a Scottish context (O’Gorman and Dillon-Robinson, 2021) identifies 14 categories needed for a thriving 20-minute neighbourhood. This requires consideration of how practices are interlinked and cross-sectoral working at a local and potentially wider level to achieve the aim of a 20-minute neighbourhood. Some local authorities in Scotland have already started work on developing 20-minute neighbourhoods.[15]
Both the ‘Place Standard tool with a Climate Lens’ (Our Place Scotland, 2022) and the 20-minute neighbourhoods concept align with the Scottish Government’s Place Principle (Scottish Government, 2019). Applying the Place Principle and delivering 20-minute-neighbourhoods are both included in the National Planning Framework 4 (NPF4) as having important roles to play in improving local living. The Place Principle requires that ‘all those responsible for providing services and looking after assets in a place need to work and plan together and with local communities, to improve the lives of people, support inclusive and sustainable economic growth and create more successful places’. It promotes a collaborative, place-based approach to deliver better outcomes for people and, as with the Place Standard tool and 20-minute-neighborhood concept, it can facilitate consideration of how practices can interlink to deliver benefits for the local population.
Home Energy Efficiency Programme Scotland
The Home Energy Efficiency Programme Scotland (HEEPS) is an end-to-end support programme to enable householders to make their homes more energy efficient and to install renewable or low carbon energy and heat (Scottish Government, 2019a).
It has a service design that tackles the social practice theory materials, meaning and competences elements to support the system to enable actions by homeowners, landlords and contractors (Atkinson et al., 2019). The HEEPS programme development was supported by a Community Analysis Team.
Benefits and challenges of applying an interlinked practices approach
Potential benefits
There was recognition in workshops and interviews of the need for the Scottish Government to try different approaches to policymaking in order to increase the pace and scale of emission reductions. The potential for an interlinked practices approach to be applied to the development of the Climate Change Plan was discussed in workshops with Scottish Government staff and external stakeholders.
Part of the interlinked practices approach is that materials, meaning and competencies all need to be considered for practices to become more sustainable.
Potential benefits identified include:
- Increasing engagement by highlighting positive meaning: They identified that consideration of meaning was often missing in policymaking and it could perhaps transform the way policymakers think; rather than focussing on how to reduce an unwanted behaviour (eg reduce driving), they could perhaps work towards positive societal shift (eg more active travel, cleaner air, healthier population). In other words, it can help to reframe the problem. A workshop participant commented that, for many people, driving means freedom, and that perhaps consideration of meaning may allow us to reframe the problem as thinking about how we can shift perceptions towards an idea that active travel is freedom.
- Understanding social and material context: The ‘Routemap to achieve a 20 per cent reduction in car kilometres by 2030’ (Transport Scotland, 2022) example showed that using tools that incorporate elements of social practice theory can help identify the social and material factors that influence individual behaviours. The resulting routemap sets out the interventions that will enable people to adopt better ways of living by creating a social and material context where reduced car use is a normal, easy, attractive and routine behaviour to adopt.
- Capitalising on societal shifts: These approaches can enable governments to capitalise on societal shifts. An example of this was the increase in cycling in cities during the Covid-19 pandemic.
- The recent Climate Change Committee report to the Scottish Parliament (Climate Change Committee, 2022) identified that the emission reduction targets achieved in Scotland in 2020 were due in a large part to changes in practice as a result of the pandemic.
- Research into why there was a significant increase in cycling in cities during the Covid-19 pandemic showed that material elements that facilitated this increase were the rapid introduction of cycle lanes in 2020 (material), for example London expanded the length of bike lanes/paths by 100km in 2020. A meaning element that facilitated people taking up cycling was that they could achieve the purpose of their desire to travel (eg travel for leisure or work) and by cycling this enabled them to maintain social distancing to reduce the risk of Covid-19 contagion (Beuhler and Pucher, 2021), and also follow advice to avoid using public transport where possible.
- This demonstrates that there can sometimes be opportunities to rapidly capitalise on societal shifts, using an interlinked practices approach to contribute to net zero targets, although individuals can revert to ‘old way’, despite an expressed desire to continue a new practice, such as cycling (Mulholland et al., 2022).
- Cross-sectoral/departmental approach: Workshop participants identified that there is currently a lack of cross-sectoral/departmental working and this is a potential obstacle to achieving the Scottish Government’s emission targets. Adopting an interlinked practices approach could help identification of opportunities for policymakers if a cross-sectoral/departmental approach was introduced in the early stages of policymaking.
Potential challenges
One of the biggest challenges is that the interlinked practices concept is untested and therefore not proven to be effective. Therefore there is a risk that applying this untested theory to the development of the Climate Change Plan may not necessarily result in lower carbon behaviours.
Time and resources would be required to support staff in implementing an interlinked practices approach in policymaking. Lessons should be learned from the ISM tool, which saw a reduction in use over time as the resource available to support staff with using ISM reduced.
It was also identified in our workshops that the Scottish Government approach of providing individual sectors with an emissions envelope[16],[17] poses a challenge to implementing an interlinked practices approach, which requires a cross-sector approach.
Feedback from participants in the scoping workshops was that social practice and interlinked practices theories are complex and challenging to understand. Many of the workshop participants did not have previous knowledge of social practice theory or interlinked practices, however, many had ‘lightbulb’ moments in terms of their understanding of what interlinked practices is when this was explained in the workshops.
Overcoming challenges
In response to this, and recognising that support would be needed to aid understanding of interlinked practices, a flowchart was created by the project team (see figure 5), which shows what needs to be considered and when, acting as a prompt for consideration of interlinked practices in Climate Change Plan policy development. This includes identifying current high emissions practices, the alternative net zero practices, how these practices link to other things people do to identify opportunities for shared outcomes; and identify linked policies impacting the practices.
Use of the flowchart to aid understanding of interlinked practices and social practice theory was explored in the testing workshops. Feedback from the workshops was that the flowchart aided participants’ understanding of how interlinked practices could be considered in a policy context. A facilitator could use the flowchart in workshops, as part of a suite of support measures for policymakers in developing an interlinked practices approach to net zero policymaking.
Figure 5: Flowchart to guide implementation of an interlinked practices approach for policymaking
Conclusions and recommendations
Conclusions
Our research found that the Black and Eisemann (2019) interlinked practices concept and guide is an untested, theoretical concept in terms of policy development and implementation. However, when we explained the concept to Scottish Government policy staff in workshops, the group agreed that it made sense as a concept and identified potential benefits and challenges of applying this approach.
The research also found that there is no silver bullet that is guaranteed to increase the pace and scale of emission reductions through applying an interlinked practices approach to the Climate Change Plan.
Interdependencies and interlinked practices of relevance for the Climate Change Plan
We have identified policy interdependencies and interlinked practices in the following sectors: Transport, Agriculture and Land Use Land Use Change and Forestry (LULUCF), Waste and Circular Economy, and Buildings. These are key pillars of the Climate Change Plan and have significant powers devolved to the Scottish Government. These sectors have more practice-based elements, and are crucial in making progress towards net zero targets in key areas (Climate Scottish Government, 2022; Climate Change Committee, 2022).
It was not possible, within the scope of this research, to identify all interlinked practices and potential policy interdependencies that may be relevant to the Climate Change Plan. Further work is needed to do this and would require the input of expert practitioners and policymakers. For example, farmers could help identify and map the detailed practices that are interlinked and which of these should be prioritised in terms of delivering significant carbon emission reductions related to food and agriculture.
Whilst interlinked practices and policy interdependencies were not explored in detail for the Electricity, Industry and Negative Emissions Technologies sectors, they do form a key aspect of the supply side actions to help deliver the material shared elements underpinning our practices. For example, initiatives taken by Industry can support wider societal change through product labelling; design and manufacture of reusable, repairable and recyclable products and technologies; innovations for products and services that affect the material elements of home energy efficiency and, to an extent, transport innovations. Supply side actions in the food and drink industry are relevant to our daily practices around eating, food waste and disposal of food packaging. Therefore, consideration could be given to how sectors and cross-cutting teams could contribute to underpinning material, meaning and competencies elements.
Interlinked practices are also likely to depend on where people live and work. A local, place-based approach may be a more effective way to start an interlinked practices approach, rather than at the national level. The first stage of such approach would be to engage with people and understand how their practices interlink.
Benefits and challenges of an interlinked practices approach for policymakers
Benefits of applying an interlinked practice approach include the following:
- Where policymakers are struggling to change unsustainable behaviours, it can help to reframe the behaviour problem and help policymakers and practitioners work towards positive societal shift.
- It can help identify the social and material environments in which people live that influence individual behaviour change.
- It can enable governments to capitalise on societal shifts to introduce measures that lead to sustained lower carbon practices (eg extending bike paths during the Covid-19 pandemic, when people were encouraged to not drive or use public transportation, led to an increase in the number of people cycling[18]).
The following challenges would need to be considered:
- The need to build monitoring and evaluation systems in from the start, to gather data to provide evidence of impact of an interlinked practices approach.
- Use of tools and models, such as the ISM tool, will not identify a particular lever to deliver an outcome; they can help identify factors that influence a behaviour or practice, which can inform development of policies and interventions.
- Scottish Government policymaking may not have direct control over many factors/levers that are identified through use of the ISM or other tools, such as social contexts.
- Using tools such as the ISM tool does not prescribe what the next steps are, i.e. what policy or intervention should be implemented. The end point of using these tools is to identify the factors influencing behaviours or practices.
- A more integrated, cross-sector interlinked practice approach to distribution of emissions envelopes from the TIMES model[19] should be considered at the start of policy development, as the process of assigning emissions envelopes to individual sectors appears to conflict with cross-sector working.
- Applying interlinked practices to policymaking requires a long-term approach.
The research identified some high-carbon practices and issues emerging from these that were not identified as interlinked practices, but had some elements of social practice theory that are relevant in terms of net zero policy development and societal shifts to lower carbon practices. Consideration of these, such as the flying example provided in section 4.1.1, may help inform work on interlinked practices.
Feasibility of translating the concept of interlinked practices into a practical approach
The research found no studies that have explored the impact of adopting an interlinked practices approach on increasing the pace and scale of emission reductions. However, when reviewing contributions from policymakers and stakeholders, and examples of policies and tools, it is clear that some policymakers think that an interlinked practices approach could be useful in developing a more holistic approach to policymaking. This more holistic approach may assist the Scottish Government in moving towards its net zero target and enact social change. This will require acknowledgement of the limitations and support needed identified in this report.
Support would be needed for implementing an interlinked practices approach, as described below:
- Social practice theory and interlinked practices can be challenging concepts to understand. In order to grasp the interlinked practices concept, an understanding of the underpinning social practice theory is required.
- Research participants recognised that, of the three social practice elements, material and competencies were often considered in policy development. However, they also recognised that consideration of meaning was often missing in policymaking and, if that were considered too, it could perhaps transform the way policymakers think.
- Research participants thought an interlinked practices approach could be beneficial, but they would need support with developing and implementing it. This support could be a facilitator or workshop instruction, as is done with the ISM tool, assistance from the Climate Change Behaviours team and/or worked-up examples of how it could be used in practice with the Climate Change Plan.
- For example, they mentioned they would require meetings with sector and the Climate Change Behaviours teams to discuss issues / interlinked practices and identify which other sector and cross-cutting teams within the Scottish Government they should talk to. The Climate Change Behaviours network, which involves all sector teams, could play an important role in facilitating this more cross-sectoral approach to linking practices.
- The flowchart created for this project (figure 5) was found to be useful for helping Scottish Government policymakers and external stakeholders understand how and when in a policymaking cycle to consider interlinked practices. It could also be applied in part to do the same when using the ISM tool.
Recommendations
Implementing an interlinked practices approach
- Using existing tools: A low-cost gateway for Scottish Government policy teams to consider how practices are interlinked across sectors and other organisations, could be using existing tools, such as the ISM tool, Place Standard with a climate lens, or 20-minute neighbourhoods concept to inform their net zero policy development.
- Early adopters: Climate Change Plan sectors that could be early adopters of an interlinked practices approach to net zero policy development are Transport and Waste and Circular Economy. These are both sectors with significant powers devolved to the Scottish Government, have practice-based elements, need to make progress towards net zero targets in key areas (Scottish Government, 2022; Change Committee, 2022) and where some interlinked practices have been identified in this research.
- There are some other sectors, such as Agriculture and LULUCF and Buildings, that have all of these elements, but where we did not find interlinked practices. They could also consider adopting an interlinked practices approach to net zero policy development once mapping work in recommendation 4 has been undertaken.
- Local level: We recommend applying a place-based lens for considering how practices interlink at a local level. An interlinked practices approach could be implemented at a local level as part of place-based engagement and testing, as interlinked practices are likely to vary depending on place (eg trip chaining in an urban setting is likely to differ from that in a rural setting).
- Mapping from the start: Research with expert practitioners, citizens, communities, regulators, policymakers and businesses should be undertaken to help identify and map how practices interlink at the start of a policymaking process in each of the Climate Change sectors, and which of these should be prioritised in terms of delivering significant carbon emission reductions. This could also be done on a cross-sectoral place basis.
Support for implementing an interlinked practices approach
- Time and resources: Using, monitoring, evaluating and promoting the ISM tool, Place Standard with a climate lens, or 20-minute neighbourhoods concept in the Climate Change Plan and net zero policy development context requires time and resources. This would be both from the team responsible for supporting sector teams, eg the Behaviours team, and from the sector staff to use the tools.
- Case studies: Case studies could be developed of Scottish Government policies/strategies that have used social practice theory and considered interlinked practices, such as the ‘Routemap to achieve a 20 per cent reduction in car kilometres by 2030’ (Transport Scotland, 2022) and HEEPS (Scottish Government, 2019) or provided a framework for consideration of these, such as 20-minute-neighbourhoods and the Place Principle (Scottish Government, 2019). This could help promote and share learning across the Scottish Government of how interlinked practices can be considered in net zero policy development.
- Guide: The flowchart in figure 5 could be used by a facilitator as part of a suite of support measures for policymakers to aid understanding of how and when to use interlinked practices in net zero policymaking.
- Plain English: Social practice theory, which underpins the ISM tool and the interlinked practices concept, can be challenging to comprehend, particularly in the initial stages of exposure to the approach. Plain English terminology needs to be used when discussing these.
Further research
If an interlinked practices approach is to be developed further, more research would be needed on:
- developing a monitoring and evaluation approach for interlinked practices that can be embedded in the early stages of its application in net zero policymaking
- a taxonomy of behaviours and practices.
References
Atkinson, J., Heaslip, M., Grimshaw, H., O’Brien, J., Fawcett, M., Marix-Evans, L., Taylor, B.
(2019). People Powered Retrofit: A community led model for owner occupier retrofit – Project Report [Online]. Available at: PPR-Report-June-2019.pdf (cc-site-media.s3.amazonaws.com) (Accessed 28.09.22)
Black, I. and Eiseman, D. (2019). Climate Change Behaviours – Segmentation study. [Online] Available at: https://www.climatexchange.org.uk/media/3664/climate-change-behaviours-segmentation-study.pdf (Accessed 29.09.22)
Buehler, R. & Pucher, J (2021) COVID-19 Impacts on Cycling, 2019–2020, Transport Reviews, 41:4, 393-400
Climate Change Committee (2022) Scottish Emission Targets – first five-yearly review & Progress in reducing emissions in Scotland – 2022 Report to Parliament [Online] Available at: https://www.theccc.org.uk/publication/scottish-emission-targets-progress-in-reducing-emissions-in-scotland-2022-report-to-parliament/ (Accessed 08.12.22)
Conquer Imagination, (2020). Social Practice Theory (Praxeology) | Animated Introduction [Online]. Available at: https://www.youtube.com/watch?v=RPvW98ZXVPU (Accessed 01.10.22)
Darnton, A. and Horne, J. (2013) ‘Influencing behaviours – moving beyond the individual: ISM user guide’ [Online] Available at: https://www.gov.scot/publications/influencing-behaviours-moving-beyond-individual-user-guide-ism-tool/documents/ (Accessed: 05.09.22)
Environment and Climate Change Committee, 2022. In our hands: behaviour change for climate and environmental goals, 2022/23 (HL 64, 2022-23) [Online]. Authority of the House of Lords [Accessed 6 March 2023]. Available at: https://committees.parliament.uk/publications/30146/documents/174873/default/ (Accessed 03.03.23)
Gössling, S., Humpe, A. and Bausch, T. (2020) Does ‘flight shame’ affect social norms? Changing perspectives on the desirability of air travel in Germany [Online] Available at: https://www.sciencedirect.com/science/article/pii/S095965262032062X#sec6 (Accessed 12.02.22)
Hampton, S. and Adams, R. (2016). Behavioural economics vs social practice theory: Perspectives from inside the United Kingdom government. [Online] Available at: https://www.sciencedirect.com/science/article/pii/S2214629618300550 (Accessed 22.09.22)
Hoolohan et al. (2018) Change Points: A toolkit for designing interventions that unlock unsustainable practices. [Online] Available at: https://socialdesign.de/wp-content/uploads/2020/02/change-points1-3.pdf (Accessed 03.10.22)
McLouchlin, N, Corner, A., Clarke, J., Whitmarsh, L., Capstick, S. and Nash, N. (2019) Mainstreaming low-carbon lifestyles. Oxford: Climate Outreach [Online] Available at: https://climateoutreach.org/reports/mainstreaming-low-carbon-lifestyles/ (Accessed 20.01.23)
Mulholland, C., Millar, C, Gray, E., Whitmarsh, L. (2022) ClimateXChange – Net zero behaviours in the recovery from COVID-19 [Online] Available at: https://www.climatexchange.org.uk/research/projects/net-zero-behaviours-in-the-recovery-from-covid-19/ (Accessed 03.03.23)
O’Gorman, S and Dillon-Robinson, R. 2021) 20-minute neighbourhoods in a Scottish context for ClimateXChange [Online] Available at: https://www.climatexchange.org.uk/research/projects/20-minute-neighbourhoods-in-a-scottish-context/ (Accessed 01.10.22)
Our Place Scotland, (2022) Place Standard tool with a climate lens [Online] Available at: https://www.ourplace.scot/Place-Standard-Climate (Accessed 22.9.22)
Our Place Scotland (2022a) Place Standard tool [Online] Available at: https://www.ourplace.scot/About-Place-Standard (accessed 22.9.22)
Shove, E., Pantzar, M., & Watson, M. (2012). The Dynamics of Social Practice: Everyday Life and How it Changes. p3. Sage Publications.
Shove, E. (2011). How the social sciences can help climate change policy [Online]. Available at: https://www.lancaster.ac.uk/staff/shove/exhibits/transcript.pdf (Accessed 03.10.22)
Scottish Government (2022) Climate Change Plan: monitoring report 2022 [Online] Available at: www.gov.scot/publications/climate-change-plan-monitoring-reports-2022/ (Accessed 20.09.22)
Scottish Government (2022a) Good Food Nation – programme of measures: interim update 2022 [Online] Available at: https://www.gov.scot/publications/good-food-nation-programme-measures-2022-interim-update/ (Accessed 02.12.22)
Scottish Government (2019) Home Energy Efficiency Programme for Scotland: delivery report 2017/18 [Online] Available at: https://www.gov.scot/publications/home-energy-efficiency-programmes-scotland-delivery-report-2017-18/ (Accessed 12.01.23)
Scottish Government, (2019a) Place Principle – Introduction [Online] Available at: https://www.gov.scot/publications/place-principle-introduction/ (Accessed 02.12.22)
Scottish Government (2013) Influencing behaviours – moving beyond the individual: ISM user guide [Online] Available at: https://www.gov.scot/publications/influencing-behaviours-moving-beyond-individual-user-guide-ism-tool/ (Accessed 12.10.22)
Shove et al (2015) Conceptualizing connections: Energy demand, infrastructures and social practices, European Journal of Social Theory, 18(3) 274–287
Shove, E., Pantzar, M., & Watson, M. (2012). The Dynamics of Social Practice: Everyday Life and How it Changes. P3. Sage Publications.
Spurling, N., McMeekin, A., Shove, E., Southerton, D., & Welch, D. (2013). Interventions in practice: re-framing policy approaches to consumer behaviour. University of Manchester, Sustainable Practices Research Group [Online]. Available at: https://www.research.manchester.ac.uk/portal/files/32468813/FULL_TEXT.PDF%22%20/t%20%22_blank
Transport Scotland (2022) A route map to achieve a 20 per cent reduction in car kilometres by 2030 [Online] Available at: https://www.transport.gov.scot/publication/a-route-map-to-achieve-a-20-per-cent-reduction-in-car-kilometres-by-2030/ (Accessed: 12.09.22)
United Nations 2022. Act Now [Online]. Available at: https://www.un.org/en/actnow (Accessed 04.10.22)
Appendix 1: Literature and evidence review
Introduction
This appendix includes all elements from the full literature and evidence review that aren’t contained in the main report. The literature and evidence review formed the first stage of research being undertaken by CAG Consultants for ClimateXChange to address the question: ‘How can the Scottish Government apply the concept of interlinked practices to improve net zero policy development and enact social change?’, recognising that a focus on nudging the population to make behaviour changes has not delivered the pace or scale of emissions savings required to achieve the 2045 net zero (NZ) target for Scotland.
It includes a review of social practice theory, case studies and tools and Scottish Government policy documents and has been supplemented by interviews with social practice theory specialists.
Whilst the review finds limited evidence of social practice theory use in policy development, it suggests that it may be possible to develop an interlinked practice approach to NZ policy making in Scotland to deliver the NZ goals and highlights some areas to explore in more detail through the subsequent stages of the research.
This literature and evidence review has been undertaken by CAG Consultants as part of a research project for ClimateXChange. Previous research for ClimateXChange has suggested that an interrelated practice lens would be more effective at guiding the interventions required to achieve the net zero target, as opposed to the current individual behaviour change approach (Black and Eiseman 2019).
The aim of this research by CAG Consultants is to answer the question: ‘How can the Scottish Government apply the concept of interlinked practices to improve net zero policy development and enact social change?’, recognising that nudging the population to make behaviour changes has not delivered the pace or scale of emissions savings required to achieve the 2045 net zero (NZ) target for Scotland.
The research findings will inform the Scottish Government’s approach to developing the next Climate Change Plan to most effectively enable the transformative, socio-cultural change to achieve a just transition to NZ, and ensure policies and interventions help to facilitate the lifestyle transitions required.
This literature review has been undertaken at the start of the research project, and will be updated as the project progresses to include contributions from stakeholders through interviews, which are still in progress at the time of writing.
In the first section of this literature review, social practice theory, case studies and tools are reviewed. Interviews were also conducted with individuals who have been involved in attempting to put the theory into practice.
In the second section, Scottish Government policy documents are reviewed, and our team has identified:
- where behaviour and societal change was described and made up a significant part of policy; where a combination of technology and societal change was identified; and the kind of policies or engagement that were planned to drive down emissions in these two categories
- where social practice and interlinked practices approaches could be applied
- key areas/sectors the Scottish Government is seeking and has power to influence in relation to the application of interlinked practices for a net zero transition in Scotland.
The findings of this literature review will be used to inform the workshops, focus groups and mapping of interlinked processes.
Interlinked practices
An interview was conducted with Iain Black, one of the authors of the segmentation study. He said that the idea behind the ‘interlinked practices’ concept is to move away from an agency-based behaviour change approach, and towards a more interventionist approach by government based on a more human and community-based understanding of how we all perform (and are supported to perform) the many practices that make up daily lives (Iain Black, Interview 2022).
Black (Interview 2022) went on to explain that “The key part is what replaces the idea that consumers can be expected to make better pro-environmental decisions and that the focus should be on infrastructure and institutional change with the consumer citizens brought along with and influencing these changes.”
Iain Black confirmed that there has been no further research or trialling of the concept since the segmentation study was published, due to his research partner moving Institutions and
Social practice theory
How does social practice theory work?
Table 2, adapted from Keller et al. (2016), summarises the differences between different theories: individual behaviour change, behavioural economics (nudge), social practice change, and technological approach.
If the focus is just on individual behaviour, the wider societal change required to achieve net zero will not happen. To get transformative change the focus needs to be on the social practice change and technological change.
| Individual behaviour change | Behavioural economics (‘nudge’) | Social practice change | Technological approach | |
|---|---|---|---|---|
| Basic unit of social change | Individual | Individual | Social practice as a collective pattern | Organisation, institution, technology |
| Ways and means of effecting change | Texts and symbols that raise awareness and shape attitudes that induce behaviour | ‘choice architecture’ and ‘choice editing’ (default settings, design of material and virtual environment) | Shaping of all practice elements (meanings, things, skills and interaction), re-designing their relations as well as relations between practices within systems of practices; acknowledgement that even a very complex intervention may not guarantee desired results | Regulation, technological innovation |
| Nature of human action | Rational, calculated and reflective | Bounded rationality that often prevails over rationality | Often non-rational, ambivalent, habitual, embodied | Not explicit, consumers often reduced to passive recipients of innovation |
| Relation between the components of action | Linear (knowledge and attitudes drive behaviour) | Linear: ‘edited choices’ bring about the desired behaviour | No linear relation, ‘value-action gap’; relations are complex and often unpredictable; often behaviours precede values and attitudes (not vice versa) | Linear (with institutional drivers), technological / structural innovation to ensure changed behaviours |
| Actor | Most often individual | Individual | Collective actors (individuals viewed as carriers of practices); emphasis on relational networks btw. people | Organisation, institution, technology |
| Impetus of action | Individual decision, choice | Stimulus from outside environment (that the actor may be unaware of) | A nexus of various practice-related factors (social relations, material objects etc…) that re-shape the configuration of practice elements and relations between practices) | For individuals (end-consumer), new technology, innovation or regulation; for institution, regulation, external or internal directive or collective decision, power |
| The role of environment (infrastructure and other aspects) | Environment as an external barrier or driver towards desired behaviour | Environment as an external barrier or driver towards desired behaviour | Environment as a network within which a practice is embedded, part of practice; constant interaction between socio-technical systems and everyday life of consumers | (renewed) infrastructure and technological environment as the guarantor and driver of change |
| Driver of social change | Individual calculated choice that changes behaviour | Individual choices that have been ‘edited’ by external experts | Change of social practices (changed links between practice elements and across different practices) | Institutions, organisations that implement new structures and technologies |
| Position of interventions | An external force targeted at factors shaping behaviours | External force that provides a ‘choice architecture’ | Embedded in practices and their change, practices are implicated in policy and governance and vice versa | Creator of new structures, technologies |
| Transfer of experience and lessons | Clear universal problems and solutions; power of experts | Clear universal questions and solutions; power of experts | All cases are socio-culturally and historically specific, the potential of transference is very limited | Technological determinism as a universal mechanism |
| Mechanism for adoption of change and the role of (public) communication | Individuals are persuaded to make a ‘better’ choice (usually one-way communication between the intervention designers and their target audiences) | Choices are ‘edited and consumers make them by default; one-way or non-existent communication between the intervention designers and their audiences) | Change is appropriated (if it is: there is no guarantee) through collective learning, embodied experience and re-skilling over time; communication as one element in a more complex package of tools and governance responses | A changed structure brings about (forces?) changed behaviour; communication itself is outside this stream of thinking, or if touched upon leads back into the behaviour change model (raising awareness) |

Table 2. The differences between theories, adapted from Keller et al. (2016)
How can social practice and interlinked practice theories be used?
The challenge for the policymaker is to try to influence the elements of the practice so that they become more sustainable, whilst also thinking about how many daily practices are interlinked (Shove 2011).
Social practice theory involves looking at Meanings (expectations, shared meaning), Materials (objects, infrastructure) and Competencies (knowledge, skills), with each one being considered as a key thread that connects the practices.
It is suggested that social practice theory and interrelated practices can provide a fresh way of framing problems such as sustainable consumption (Keller et al. 2016) and working from home (Hampton and Adams 2018), in order to acknowledge the complexities and connections between systems of practice.
A social practice theory lens can be used in evaluation to identify key elements to changed and sustained practices. The tip of the iceberg image (adapted from Spurling et al. 2013 by O’Brien, 2019) is helpful in showing the underpinning elements of Materials, Competencies and Meanings for use by evaluators or policy-makers to see below the practice as observable behaviours.
This figure was adapted for further exploration in the workshops stage of the research project as shown in figure 6.
Figure 6. O’Brien 2019. Highlighting that physical activity behaviours are the tip of the iceberg.
Figure 7. Spurling and O’Brien adapted for workshops to demonstrate the conditions for behaviours / practices must be in place in order to achieve wider update.
However, our literature review and interviews have found that social practice theory is very rarely used by policy makers.
In fact, one academic who has written extensively on the subject suggested that they do not believe that social practice theories should be translated into a ‘policy-amenable form’, stating that: “to do so is to ‘miss the point, and to misunderstand what makes practice theories distinctive, and distinctively valuable” (Shove 2015, p.45). There are differences between those conceptualising energy demand or water and food consumption – some (as the Times tool used by the Scottish Government) depict energy demand as an outcome of drivers which can be adjusted using policy levers; while others say that “energy-demanding practices are continually on the move and that intervention is more like… navigating through an also changing environment.” (Cass and Shove, 2017) In fact, policy-makers have to do both these things.
Social practice theory also offers some models for policy intervention:
- Recrafting practices
- Substituting practices
- Changing how practices interlock (Spurling et al. 2013)
First we discuss some of the tools have been created to help put these theories into practice and then we outline the opportunities and challenges with using the theory in practice.
Tools and concepts
The review of tools and guides included a literature review, interviews and desk-based scenario testing of checklists, to assess how applicable they are to key challenges.
Table 2 below provides an overview of the tools that were reviewed. Each tool is then discussed in more detail after the table.
| ISM | Change points | Interlinked practices step by step guide | |
| Who developed | Andrew Darnton and Jackie Horne | Claire Hoolohan (Tyndall Centre and Manchester University), Alison Browne (Manchester University) and David Evans (Bristol University) | Professor Iain Black, University of Stirling, and Dr. Danielle Eiseman, The Cornell Institute for Climate Smart Solutions |
| When | 2013 | 2018 | 2019 |
| Who for | Scottish Government | Defra and other industry and policy stakeholders | Scottish Government and ClimateXChange |
| Key features | User guide (tool and workshop outline) and technical guide
Support provided to staff in early years through facilitation and training but no longer available. |
Toolkit which is a 6-step consensus-based workshop process, designed to get beyond ‘individual action’ to achieve social change – includes system mapping
Designed to be used by a facilitator with pre-designed worksheets. |
9-step guide, provided in a one-page written list.
Builds of Scottish Government’s 4 emission themes and 10KBAs (approach which has now changed) to focus on high carbon behaviour area. User identifies the ILPs associated with the theme and key behavioural areas, and works through the elements (meanings, materials and competencies of social practice theory). Considers the connections that need to be addressed to alter the lifestyle. |
| Who used + when | Intended to be helpful when facing policy problems where significant levels of social change are needed – consider all contexts that shape people’s behaviours. | Defra, water industry, academics.
Used on water and food. |
Not been tried and tested. |
| What it can work well for | Useful for engaging with policy makers and identifying barriers | Thinking about the connections between what people do in their homes and all the other things they do it the course of their everyday life. | Would need to be tested to identify where it may work well. |
| Challenges | Perceived as being a behaviour change tool rather than a systems tool.
Not been effective in helping to develop actions or policy options, |
Does not fit with contemporary evaluation frameworks.
Requires a facilitator and staff time to participate in workshops. |
Seems to focus on ‘campaigns’ as its output |
| Conclusions about tool | Only been used for fairly simple problems to date, rather than for large-scale ‘wicked problems’.
May be potential for ISM to pick up interlinked practices (perhaps with facilitation support) – test in workshops. |
There is potential for Scottish Government policy-makers and stakeholders working on food waste within the CCP development to explore this tool to see how useful they find it. | Could be tested in a workshop. |
Table 3: Overview of the tools reviewed
The ISM tool
The ISM tool sets out that by understanding the different contexts and the multiple factors within them that influence the way people act every day, more effective policies and interventions are expected to be developed. The factors that influence behaviour are illustrated in figure 5 below.
 Figure 8: Factors that influence behaviour in the individual, social and material contexts (Darnton and Horne 2013, p.4)
“The ability to frame and explore difficult and complex issues dispassionately and systemically can help introduce aspects of a problem that would not normally be considered or even acknowledged. ISM can really help evolve a systemic view of complex issues but it needs to be built in early in the process as it can throw up issues which may be seen as disruptive. This will not be well-received if a plan has already been formulated and there is an urgency to deliver on time.” Clive Mitchell, Programme Office Manager, Strategic Development, Scottish Natural Heritage (SSN, 2016)
Despite early support for the tool, and its use by various public sector organisations across Scotland, its use has waned. This is because resource was provided to support it in the early years, through workshop facilitation and training. This hands-on support is no longer available. June Graham, SSN, was tasked with enabling adoption of ISM by public sector organisations but reported that being perceived as a behaviour change tool rather than a systems change tool hindered its effective application.
The Scottish Government has learned that while ISM is useful for engaging with policy makers and identifying barriers, it has been less effective in helping to develop actions or policy options, and needs to be embedded into the policy making process. The Scottish Net Zero Engagement Strategy states that the Government is committed to embedding the ISM tool into the policy making process.
As for Change Points (see below) the tool works best when decision makers or those with the ability to unblock barriers are participating. If more junior staff are those in the workshop, they can identify barriers, but must go away and address this later. Therefore, as with so many attempts at system change, feedback loops, a culture of trust and willingness to act are key. The tool does not provide the answers, and efforts to tackle the barriers must still be made.
According to June Graham, the ISM tool been used only for fairly simple problems, rather than for the large scale ‘wicked’ systems problems, so has not perhaps demonstrated what it can achieve in terms of transformation. However, June recalled that people who “got it” almost immediately could see the benefits of using it for complex issues.
ISM can not only be used to encourage creative and divergent thinking and to identify the points of blockage, it can also be used to carry out a pre-mortem on policy – to identify and tackle unintended consequences. ISM can also be used as a desk-based tool or mind-set approach by an individual.
There may be potential for ISM to pick up interlinked practices in section 5 of the workshop steps (see Figure 5 above, Behaviour Mapping) and to explore re-branding and re-positioning the tool as a systems change tool in the CCP process, perhaps with facilitation support.
The Change Points Toolkit
Change Points was developed with Defra and multiple other industry and policy stakeholders, particularly on water and food. It is currently in use by a wider circle of academics but the results are yet to be seen.
Change Points faces the same problem as other social practice tools in that it does not fit with contemporary evaluation frameworks – when we think in different ways we need different evaluation (not just attitude surveys).
The Change Points Toolkit is a six-step consensus-based workshop for multi-stakeholders. It takes what we are doing day-to-day and looks at a key problem, e.g. food waste. We are not all busy wasting food; but rather we are working, travelling, going to the gym and carrying out a string of routines.
The tool looks at different types of people who are carrying out high waste or high emissions actions, and works through what they are doing. This includes systems mapping.
The questions the tool was designed to address included:
- How can we reduce domestic demand for energy and water?
- How can we reduce food waste whilst ensuring food safety?
- How can we encourage people to take shorter / fewer showers?
- How can we reduce the volume of fats, oils and grease disposed of down the drain?
- How can we make hair care less water (and energy) intensive?
- How can we tackle invisible waste streams (e.g. plastics from the bathroom)?
This workshop takes a whole day to implement, or can be carried out in modules. The toolkit is designed to be easy to use by a facilitator and has pre-designed worksheets (see Figure 7 below). (Hoolohan et al. 2018)

Figure 9: Problem Scoping (Hoolohan et al. 2018)
In an interview for this project, Claire Hoolohan reported that David Evans (Bristol University) was a co-author of Change Points and was a lead academic on projects that fed into it, including ISM. As such, he may be a useful person to invite to share his insights in a workshop or focus group session.
Insights from the workshop process include how to handle blame, catching stereotypes, challenging ‘resist, pause, transfer’ – when the problem is handed on to future generations and lastly, if participants begin to talk about messaging as the sole solution, then they are steered back towards other interventions.
There is potential for Scottish Government policy-makers and stakeholders working on food waste within the CCP development to explore this tool to see how useful they find it.
Interlinked Practices: Step by Step Guide
The concept of interlinked practices was developed further into a ‘Step by Step Guide) by Black and Eiseman (2019). This is a nine-step guide, provided in a written list on a single page. It builds on the Scottish Government’s four emission themes and the ten Key Behavioural Areas (reportedly this has since changed) to focus on a high carbon behaviour approach. The user identifies the interlinked practices associated with the theme and key behavioural areas and works through the elements (Meanings, Materials and Competencies of social practice theory) and then identifies the shared elements of these practices. It works on where, when, how and why high carbon behaviours are performed and then considers the connections that need to be broken or pulled to alter the lifestyle.
By working through the changes to Materials, Meaning and Competences it begins to generate a bigger picture.
This seems to be a theoretical checklist with no worked examples or additional facilitation guidance or information on participants required. As such it appears to be untested. This was confirmed by Iain Black in his interview with CAG Consultants.
A desk-based trial to apply it was difficult and frustrating and for it to be effectively used it would need a lot of investment and testing to make it into an effective toolkit.
There could be an opportunity to test the guide, or to develop it into a more usable workshop model, however, it seems to focus on ‘campaigns’ as its output perhaps rather than addressing deeper infrastructure or societal issues.
Deep Demonstrations Design Process
A logical progression of social practice theory is systems mapping, which leads into complexity theory. Climate KIC’s Deep Demonstrations Design Process is a workshop series that maps systems, points of ‘convergence’ i.e. points to unblock just as seen in the tools above. See: Deep Demonstrations – Climate-KIC
The Deep Demonstrations Design Process was used to bring the Climate Ready Clyde partners and stakeholders together to produce Glasgow City Region’s first Adaptation Strategy and Action Plan (Climate Ready Clyde, 2021). The tool includes investment – which is important, as often money and finance is not referenced in these approaches and it is vital for policy-making to consider funding and investment.
Initial thoughts on toolkits
It has to be remembered that a toolkit is just that – a set of tools to be used by people with the time, capacity, permission and willingness to use the tools. There can be an expectation amongst busy policy makers that a tool might produce answers for them, when it is simply another way of framing a problem, or checking that all issues are covered. As such, introducing new concepts or tools need clearly explained and offered as a useful activity within the wider process. The same expectation should be applied to the research question about interlinked practices and the extent to which it can help deliver policy making for societal change towards NZ.
The job is not done at the end of the workshop process – it will produce challenging outputs and may need revisiting at different times in the policy cycle.
The ISM and Change Points tools appear to be very useful at the start of the policy making process, providing creative space for divergent thinking and potentially transformational and unexpected ideas. The tools can also, but tend not to, be used to develop more specific policy and programmes. There is not a clear reason for this, and the tools are under-used, wasting their potential.
If societal change, and transformation for NZ is to be delivered, flexing the muscle of these tools is worth a try.
Ideally the toolkits should be used in a workshop setting with a range of people in the room, from different sectors, and these should include people with agency to make changes. They should also include people with cross-cutting and policy-enabling roles such as finance, legal and Just Transition.
ISM does not appear to be used extensively at present; but could be if rebranded/re positioned as a system change tool; and it could absorb the concept of interlinked practices in the mapping stage.
Change Points is easily accessible and could be run in any group with someone skilled in facilitation.
The Deep Demonstration workshop looks like a much bigger undertaking, but it has certainly been successful in a city-region wide partnership and in developing policy and investment plans. A serious, funded commitment that was staffed and supported was in place to deliver this initiative. The Climate Ready Clyde partners who participated in this may be well-placed to replicate the process to address another challenge. Could this be a method to unlock systems change around transport and buildings decarbonisation in a city-region familiar with systems thinking? This could be further investigated with Ben Twist and Kit England.
The Interlinked Practices Step by Step Guide is the least developed of the tools examined (there is only one research paper that proposes it). This could be investigated further through the research, possibly in a focus group, however, it is not workshop-ready without further investment and testing.
Given that time is short and the challenge urgent, re-booting and using existing tools under a Systems Change brand, going beyond behaviour change to systems change would be a sensible idea.
Examples of interlinked and social practice approaches
Even with these tools and their promotion by high profile organisations, there has been minimal practical action. There are several examples of campaigns or initiatives that can be used to illustrate how the practice-based or interlinked approaches could be used. However, it should be noted that, in most of these case studies, practice theory and interlinked practices approaches were not actually used to develop these projects.
Table 3 below provides an overview of the case studies that were reviewed. Each case study is then discussed in more detail after the table.
| GM Moving | HEEPS | London on Tap | Cool Biz | Inglorious fruit | |
| Aim: | Create a whole-systems approach to changing the way people move around. | Enable householders to make their homes more energy efficient and to install renewable or low carbon energy and heat | Promote the consumption of tap water as opposed to bottled water in a fine dining situation; ordering tap water was seen by many as being socially unacceptable in this situation | To reduce energy consumption in government buildings by raising the level of acceptable indoor temperature up to 28oC, below which the air-conditioning would not operate. | To raise awareness about Europe’s 100 million metric tonnes of wasted food every year, much of which is discarded due to them not being aesthetically perfect. |
| Who | Greater Manchester | Scottish Government | Mayor of London and Thames Water | Japanese Government | Created by an advertising agency in response to a request from a supermarket in France |
| When | 2017 | 2013 | 2008 | 2005 | 2014 |
| Approach | Used Sport England’s Social Ecological approach – individual, social and physical (rather than material) and policy elements. | End-to-end approach providing advice, funding support, access to suppliers to enable householders to reduce energy consumption. May have used ISM tool, but not verified. | A multi-dimensional campaign addressing the materials (water, glass packaging), meanings (conventions around proper behaviour in restaurants), and competences. | Widely promoted as multi-elemental policy. | Demonstrates what a campaign with an interlinked practice could look like. |
Table 4: Summary of case studies
Greater Manchester – Manchester Moving and Made to Move
GM Moving: The Plan for Physical Activity and Sport (Greater Manchester, 2017) sets its person-centred, behaviour change approaches firmly within a Whole Systems Approach drawing on Sport England’s social ecological approach (see Figure 8).
Figure 10 Population Level Change Diagram (Greater Manchester 2017, p.60)
This went on to inform the newly appointed GM Mayor’s Cycling and Walking Commissioner, Chris Boardman, in his report Made to Move: 15 steps to transform Greater Manchester by changing the way we get around (Boardman, 2017) – see figure 9. His plan took an interlinked approach to developing a whole active travel system that was suitable for a 12-year-old to use. It reads as if it is based on practice theory but on investigation, it was found that the authors had not consciously applied the material, competence and meanings of practice theory. It is possible that the GM Moving approach, based on the Sport England Social Ecological approach which covers the main elements of practice theory laid the foundations for the newer plan. The plan is comprehensive and they appear to have ‘thought of everything’. The Bee Network, Greater Manchester’s cycling and walking network is now under development through Transport for Greater Manchester.
Figure 11: Our 15 steps to transform Greater Manchester by changing the way we get around (Boardman 2017, p.2-3)
HEEPS (Home Energy Efficiency Programme Scotland)
The HEEPS programme is an end-to-end support programme to enable householders to make their homes more energy efficient and to install renewable or low carbon energy and heat. It has a service design that is thorough and tackles the Materials, Meaning and Competences to support the system to enable actions by homeowners, landlords and contractors (Atkinson, J. et al. 2019). The HEEPS programme development was supported by a Community Analysis Team, and it has been reported that the ISM tool may have also been used, however this is not clear. This will be investigated further if we can make contact with the original team leader, as it has not been found in our searches for evaluations of the ISM tool’s impact.
London on Tap
This initiative was launched by the Mayor of London and Thames Water, to promote the consumption of tap water as opposed to bottled water in a fine dining situation; ordering tap water was seen by many as being socially unacceptable in this situation (Sahakian and Wilhite 2014).
Rather than targeting individuals with an awareness-raising campaign and providing them with information that would change their behaviour, this initiative sought to change the practice of consuming bottled water alongside an expensive meal by addressing multiple elements simultaneously, by normalising the ordering of tap water in a re-usable carafe. A multi-dimensional campaign was devised to address the materials (water, glass packaging), meanings (conventions around proper behaviour in restaurants), and competences (the performance of fine dining) (Hampton and Adams 2018). A design competition resulted in new material object, ‘the carafe’, which was launched to replace the bottled water.
Bottled water consumption reduced by 8% in the summer of 2008 (Sahakian and Wilhite 2014), however as no evaluation of the project has been published, it is not clear if this reduction was purely the result of the London on Tap project and whether this 8% reduction was sustained long term. However this can be seen as an example of how practice-informed policy could be used to influence more sustainable forms of consumption.
Cool Biz, Japan
In an initiative designed to reduce energy consumption in government buildings in 2005, a policy decision was made to raise the level of acceptable indoor temperature up to 28oC, below which the air-conditioning would not operate (Hampton and Adams 2018).
Through the Cool Biz campaign, the summer thermostats in government offices were set to 28oC in workplaces and a ‘cool biz summer dress code’ was issued, suggesting wearing looser clothes, short sleeves and breathable fabrics (Sahakian and Wilhite 2014), thus making the warmer office temperatures more bearable. The initiative was supported by clothing store, Uniqlo, which stocked a new range of professional clothing. The initiative was not devised using theories of practice, however it has been widely promoted as an example of multi-elemental policy (Hampton and Adams 2018).
Figure 12: Super CoolBiz poster (Deaver 2016)
Policy literature review
Introduction
As mentioned above, key Scottish Government policies and strategies were reviewed with two things in mind, to identify:
- Where behaviour and societal change was described and made up a significant part of policy; where a combination of technology and societal change was identified; and the kind of policies or engagement that were planned to drive down emissions in these two categories.
- Where social practice and interlinked practices lens could be applied.
- Key areas/sectors the Scottish Government is seeking and has power to influence in relation to the application of interlinked practices for a NZ transition in Scotland.
Climate Change Plan Update
The Scottish Government’s Climate Change Plan Update (Scottish Government 2018) recognises that delivering NZ by 2045 will be an iterative process and will require learning while doing. It acknowledges uncertainty and that “many of the solutions rely on further technological innovation, market development and wider take-up and adoption as well as action by others.” The plan update sets out policy measures to embed behaviour change in each of the sectors. It also recognises the support individuals and businesses will need to adapt their choices and behaviours. Greater emphasis is placed on behaviour change than wider societal change; mentioning behaviour change 53 times while only referring to societal change seven times (most often in reference to Climate Change Committee recommendations).
The plan update refers to “Positive Behaviour Change”, and that “behaviours are interlinked and context-dependent, and takes account of all the factors that shape people’s lifestyles: the social, material and individual.” It then talks about acceptance and adoption of low carbon technologies and support for policies. There is a frequent change in the framing of behaviour change, referring at times to facilitating it through policy, or influencing it to implement policy.
The actions used in relation to behaviour change are expressed as increasing awareness and understanding” of climate change, of “messages and support”, “promoting use”, “helping to change behaviours through parking regulations or education campaigns” and “encouraging people to shift towards reusable products [through charges]”. The plan’s buildings and transport sector sections address the context for behaviour change for example, referring to material support through Home Energy Scotland and robust quality assurance, and material infrastructure investments, for example improved bus services and priority bus lanes, and material enablers such as discounted bus travel for young people.
Although the plan recognises that what happens in one sector can have a knock-on effect in another, and puts forward a coordinated approach, picked up in a commitment to ‘Place Based Investment’ and ‘20-minute neighbourhoods’, behaviours referred to are still very much about individuals and sectoral emissions, and the information and incentives to change specific behaviours, rather than the people’s routines and lives. However, the section on shared mobility does refer to a plan to further “understanding of how and why people travel” which could be an opportunity to use an interlinked practices lens. The section on 20-minute neighbourhoods refers to better quality of life and health as well as net zero. [Further reading (Thornton, 2022; Scotland RTPI 2021) on 20-minute neighbourhoods does not refer to interlinked practices and rather focuses on a set of services that should be accessible through walking within 20-minutes or 800m. This is problematic because if interlinked practices or multi-task stops are required to move shopping, children or goods, 800m is a long way. This is an opportunity to explore in the workshops.]
Food waste is an area in which ‘everyday behaviours’ are mentioned and reference to helping “make the right choices easier for householders”.
There are also references to corporate behaviour in business and behavioural change in the agricultural industry.
There is a varied tone used to refer to behaviour change throughout the plan which does not reflect the principles outlined in the Net Zero Engagement Strategy (see below) or the ISM tool. Sometimes it seems supportive of helping people to make the ‘right’ choice when they keep making the ‘wrong’ choice; sometimes it is about helping people become aware of climate change and be supported in tackling home energy, transport, waste and food waste emissions. Interlinked practices and daily routines and the things people do regardless of climate change, and the co-benefits that can be realised for them in living a positive net zero life do not come to the fore.
This is something that can be considered in the workshops and perhaps be addressed more coherently in the new plan through a different practice-based approach.
Net Zero Engagement Strategy
The Scottish Government’s Net Zero Engagement Strategy is now moving away from encouraging incremental changes in attitudes and behaviours, and is instead supporting a society-wide transformation (Scottish Government 2020). The strategy acknowledges the Scottish Government will need to create the necessary conditions for action to be taken, which includes ‘material’ changes including legislation and infrastructure, as well as requiring the shifting of social norms and increased ‘climate literacy’ across the population (Scottish Government 2021).
The actions by which this will be achieved are categorised into three objectives:
- Understand – communicating climate change.
- Participate – enabling participation in policy design including through design and delivery at a community level, particularly for those affected by the transition and co-design as well as traditional consultation and deliberative approaches.
- Act – encouraging action which includes championing and funding community-led action and through Arts, Creative and Heritage [sectors?] to inspire and empower.
There is an emphasis on ‘meaningful’ and ‘genuine’ in the language used here.
Although the strategy acknowledges that public engagement “must be supported by policies and programmes that facilitate the required reconfiguration of societies, institutions and infrastructure to create an enabling environment for net zero lifestyles” there is no ‘feedback’ loop mechanism clearly identified here to say how barriers and blocks to action will be identified and how the Scottish Government will address these. Stating this more explicitly in the document to support the intention to change legislation and infrastructure could be key to avoiding slippage back into putting the onus on people to change their behaviour. This could come up in the engagement but it would be interesting to see who holds the power or levers to assist the required change (see below: Change Points and Deep Demonstrations Design Process).
There is an acknowledgement of the importance of community action ‘as a major driver in bringing about positive change with wide-ranging co benefits’; and a place-based approach including the 20-minute neighbourhood concept where interlinked practices could be used to add value.
And positively there is a change to the evidence being collected for evaluation to include community-led methods and data collection as well as attitudes surveys (see below for why this is important in terms of using a practice-based approach to delivering societal change).
‘Engagement’ is a loose term often used as shorthand by policy-makers for ‘communication’ or ‘consultation’ and it is important to outline the types of engagement that policy-makers can carry out. The Strategy states that it organises its activities and initiatives according to the five categories of participation in the Public Participation Spectrum – Inform; Consult; Involve; Collaborate; Empower. However, it actually does not then do this. It also states that it will use principles for engagement based on the Scottish Government’s Participation Framework (Demsoc 2018; Scottish Government 2021) the implementation of this Framework across government is in progress but it could represent an opportunity to combine using practice-based concepts in engagement on Net Zero. This could be explored in the workshops.
Finally, the Theory of Change for the Strategy offers some opportunities in which practice-based or interlinked practice approaches might be used. For example, where strong stakeholder partnerships are built, action is encouraged through Place Based Approaches and engagement through culture and heritage.
Heat in Buildings Strategy
Buildings account for around a fifth of Scotland’s total greenhouse gas emissions. The Heat in Buildings Strategy (Scottish Government, 2021) recognises that “transforming our homes and workplaces will be immensely challenging, requiring action from all of us, right across society and the economy” and that a fundamental shift for most people and businesses is required.
The strategy maintains a focus on a just transition and on tackling fuel poverty and addressing both capital and running costs of heating our homes. It takes a two-pronged approach to reduce energy demand through improved building energy efficiency and to decarbonise heat through converting fossil fuel heating to zero carbon heat technologies.
The scale of the task is immense: currently 45% of Scottish homes achieve EPC ‘C’ or better and the remaining 55% must achieve this by 2030. By 2030 over 1 million homes and 550,000 buildings must be converted to net zero heat.
The strategy includes a commitment to increase public engagement, building on existing advice services and taking steps to raise awareness and understanding of these new technologies. It plans to establish a National Public Energy Agency to provide leadership and harness the potential of scaled-up programmes to decarbonise heat – with a virtual agency established within the coming year and a dedicated physical agency by September 2025.
Interestingly, for a strategy that relies on people taking decisions about their homes and properties, including considerable expense, disruption and unfamiliar technologies, it only mentions ‘behaviour’ five times. This shows an understanding that the ‘nudge’ or behaviour approach is not a tool to deliver these big decisions; nudge perhaps being used for behaviours where people have agency, such as turning a thermostat down by a degree.
Analysis of the Strategy through a social practice lens shows that the conditions to support people to do something different are being put in place. Material elements such as funding and supply chains are included; Competence elements are present in the form of awareness, education, advice services, and developing skills in supply chains; ‘Meaning’ or social norms is harder to locate – however, developing Local Heat and Energy Efficiency Strategies developed with communities may be an element of this. The strategy does not suggest reverting to historic norms of the past, when colder homes were socially accepted, which is positive, as these had impacts on health for example.
The social and physical infrastructure is also being changed, with strengthened regulation and standards including an end to installing gas boilers from 2025 and a planned 2024 Zero Emissions Heat Standard for new buildings and the future reform of domestic EPCs; preparing the energy infrastructure for decarbonised heat and putting in place a market framework for decarbonised heat.
There are implications for practices in this transition, including how we budget, our perceptions of heat and cosiness at home and how we cook if moving off gas. The use of practice theory or interlinked practices in assessing the transition from an energy demand-side could help identify barriers and solutions, ensure diverse views are understood and aid engagement and communications plans. This is something to consider in the mapping and workshop stages.
National Transport Strategy
The National Transport Strategy (Scottish Government, 2020) takes a systems approach and clearly picks up practices and interlinked practices, although it refers to behaviours and routines. In its first pages it states that it is a strategy for “the whole transport system (people and freight) and it considers why we travel and how those trips are made, by including walking, wheeling, cycling, and travelling by bus, train, ferry, car, lorry and aeroplane. It is a Strategy for all users: those travelling to, from and within Scotland.”
It has a focus on ‘travel choices’ referring people taking part in the decision-making process and to empowering people and businesses to play a vital part in delivering the strategy. It also places a responsibility on people to deliver the strategy: “We all also need to take responsibility for our actions, ensuring that our travel choices make a positive contribution to delivering the Strategy over the next 20 years.”
Critically the Strategy recognises gender inequality and the need to understand women’s complex travel behaviour which reflects the gendered division of labour meaning women make more multi-stop, multi-purpose trips.
Practices, interlinked practices and travel or transport demand is a strong candidate for exploring how an interlinked practices lens might improve net zero policy and enact social change.
Scotland’s Climate Assembly
In line with its Climate Change Act 2019, Scotland held its citizens assembly in 2020/21 bringing 100 citizens together to hear expert evidence, discuss and deliberate on the question: How should Scotland change to tackle the climate emergency in an effective and fair way? The assembly developed an ambition, 16 goals and 81 recommendations. (Scotland’s Climate Assembly. 2021)
The ambition recognises that ‘urgent cultural change is needed across society – from governments, businesses, communities and individuals’ and that action is needed at all levels of society. It recognises that entire society will have to change and adapt.
It calls for strong leadership to drive ‘fundamental behaviour change across society’ and points to the pandemic as demonstrating that this rapid transformation is possible.
The recommendations cover a range of interventions from the regulatory, material – putting in infrastructure and services – to the personal and collective, with individuals taking responsibility for their emissions, for example, by changing diets. “we all need to take responsibility for reducing the carbon footprint caused by consumption (e.g. eating less meat and dairy, buying fewer new goods, reuse and repair) and become a critical mass of people transforming these changed behaviours into the new normal.”
These ambitions reference the individual and collective actions that can create social shifts towards a lower carbon society. Areas for such change relate to consumption, travel and localised lifestyles.
The recommendations cover a range of issues that reflect elements outlined in social practice theory, without referencing it, such as Carbon Labelling which increases competence and know-how to enable decision-making and Education on Sustainable Transport and a range of education programmes for children and adults on sustainable food, climate change and supporting nature; they explicitly name ‘business practices’, ‘working practices’ and ‘sustainable practices’ and ‘sustainable land management practices’ taking a more systems based approach than focusing on individual behaviour changes. The recommendations also include 20 minute neighbourhoods which put in place the material conditions for localised living.
Overall, Scotland’s Climate Assembly calls for a range of interventions that indicate that it expects the government to act in a wide-ranging, holistic and comprehensive way across the material, competence and meaning elements required to drive social change.
Just Transition Commission
Scotland has an independent Just Transition Commission, established to support the ambition that the transition to a net zero and climate resilient economy takes place in a way that delivers fairness and tackles inequality and injustice.
The Scottish Government has committed to lead the production of key just transition plans, in a way that is co-designed and co-delivered by communities, businesses, unions and workers, and all society. The Just Transition Commission will support the production and monitoring of the plans, providing expert advice on their development.
The Scottish Government has developed a National Just Transition Planning Framework which will go beyond high-emitting industrial sectors to consider all sectors of the economy.
TIMES
The Scottish Government uses an emissions model which provides emissions data to policy-makers. The TIMES (The Integrated MARKAL-EFOM System) model generator is an open-source tool used across the world for policy formulation, and was developed as part of the IEA-ETSAP’s methodology for energy scenarios to conduct in-depth energy and environmental analyses (Loulou et al., 2004). TIMES is used by the Scottish Government as a tool for policy formulation.
According to the Scottish Government team using the tool, it is good at interlinking scenarios, and providing insight to help achieve good policy. The downsides are that it is only as robust as the assumptions put in, and it is not very effective for behaviour change.
Summary of findings
The research suggests that current approaches to behaviour change will not achieve the level of change required to achieve net zero targets, and that more transformative societal change is required. It has been suggested that approaches such as social practice and interlinked practices could enable greater societal change.
Key findings regarding the challenges of using social practice / interlinked practices
- The concept of ‘interlinked practices’ has never been trialled, and social practice theory (from which it is derived) has rarely been used in practice to date, despite the growing interest in this topic.
- There is therefore no evidence that can suggest interlinked practices and social practice theory work in practice. Furthermore, the lack of real-world evidence is seen as a barrier to it being taken up and used by policy makers.
- This situation is perhaps not unique to practice theory; turning desired practices, which make sense in theory, into reality, is acknowledged in the research as a challenge.
- Several tools have been developed with the aim of enabling people to put it into practice, but the literature review has found that the tools have not been fully used or adopted. This is despite Scottish Government support for the ISM tool.
- A social practice approach is demanding for policy professionals and institutions which face resource constraints and where policy-makers have busy workloads and deadlines to meet. It needs to be carried out in a workshop environment and must include the people with power to make the changes needed.
The ISM tool has been used to engage with policy makers and identify barriers, but has been less effective in developing policy options, although it may have been used in the development of HEEPs. It has been suggested that certain case studies exemplify how the social practice approach could be used in future, however those case studies did not actually use the social practice approach in the design of the initiatives.
“We have to do something different, what else have we got?” Ben Twist, Director, Creative Carbon Scotland (2022).
Key findings regarding the opportunities
- Social practice theory and interlinked practices could provide a better approach to achieving societal change through the CCP, as they shift the focus from how an individual’s behaviour can be changed, to how social practices can be altered to become more sustainable.
- An interlinked practice approach provides a greater level of understanding about the interrelated nature of our actions, as opposed to just looking at individual actions.
- It has been suggested that social practice theory, and interlinked practices, can be a useful way of reframing a problem, removing the ‘blame’ and transfer of responsibility onto individual ‘consumers’ who do not do the ‘right’ behaviour.
- In one of the few examples in the literature review of the tools being used, Claire Hoolohan explained that using Change Points led to Defra introducing qualitative research and it helped a water company to have a completely new conversation enabling them to consider actions that were not even thought of before using the tool.
- It has been suggested that, even if social practice theories are not able to be translated into the day-to-day processes of policy-making, they can inform and inspire.
Literature review references
Atkinson, J. et al. (2019). People Powered Retrofit: A community led model for owner occupier retrofit – Project Report [Online]. Available at: PPR-Report-June-2019.pdf (cc-site-media.s3.amazonaws.com)
Black, I. and Eiseman, D. (2019). Climate Change Behaviours – Segmentation study. Available at [Online]: https://www.climatexchange.org.uk/media/3664/climate-change-behaviours-segmentation-study.pdf (Accessed 29.09.22)
Boardman, C., (2017). Made to Move: 15 steps to transform Greater Manchester, by changing the way we get around [Online]. Available at https://www.greatermanchester-ca.gov.uk/media/1176/made-to-move.pdf
Cass, N. and Shove, E. (2017). Changing Energy demand: Concepts, metaphors and implications for policy [Online]. Available at: http://www.demand.ac.uk/wp-content/uploads/2016/07/Changing-energy-demand.pdf%22%20/t%20%22_blank
Climate Ready Clyde (2021), Sniffer, Deep Demonstration City Regions, Glasgow City Region. Glasgow City Region Climate Adaptation Strategy and Action Plan [Online]. Available at: [Online] http://climatereadyclyde.org.uk/gcr-adaptation-strategy-and-action-plan/
Conquer Imagination, (2020). Social Practice Theory (Praxeology) | Animated Introduction [Online]. Available at: https://www.youtube.com/watch?v=RPvW98ZXVPU (Accessed 01.10.22)
Darnton, A., and Horne J., (2013). Influencing Behaviours Moving Beyond the Individual: A user guide to the ISM tool [Online]. Available at: https://www.gov.scot/publications/influencing-behaviours-moving-beyond-individual-user-guide-ism-tool/ (Accessed 04.10.22)
Darnton, A., and Evans, D., (2013). Influencing Behaviours: A technical guide to the ISM tool [Online]. Available at: https://www.gov.scot/binaries/content/documents/govscot/publications/advice-and-guidance/2013/06/influencing-behaviours-technical-guide-ism-tool/documents/00423531-pdf/00423531-pdf/govscot%3Adocument/00423531.pdf. (Accessed 04.10.22)
Defra (2018). Water Efficiency and Behaviour Change Rapid Evidence Assessment (2018) [Online]. Available at: https://www.waterwise.org.uk/knowledge-base/water-efficiency-and-behaviour-change-rapid-evidence-assessment-2018/. Accessed (04.10.22)
Demsoc (2018). Scottish Participation Framework: From model to practice [Online]. Available at: https://blogs.gov.scot/open-government-partnership/wp-content/uploads/sites/43/2018/08/Demsoc-SPF-Implementation-Options-Paper.pdf
Greater Manchester (2017). Greater Manchester Moving [Online]. Available at: https://issuu.com/greatersport/docs/gm_moving_2017-21 (Accessed 01.10.22)
Hampton, S. and Adams, R. (2018). Behavioural economics vs social practice theory: perspectives from inside the United Kingdom government. Energy Res. Soc. Sci., 46
Hoolohan et al. (2018) Change Points: A toolkit for designing interventions that unlock unsustainable practices. The University of Manchester, Manchester, UK [Online]. Available at: https://changepoints.net/ (Accessed 03.10.22)
Hoolohan, C. and Browne, A. (2020) Design thinking for practice-based intervention: Co-producing the change points toolkit to unlock (un)sustainable practices. The University of Manchester [Online]. Available at: (PDF) Design thinking for practice-based intervention: Co-producing the change points toolkit to unlock (un)sustainable practices (researchgate.net) (Accessed 22.09.22)
Institute for Government (2011). Policy Making in the Real World [Online]. Available at: https://www.instituteforgovernment.org.uk/sites/default/files/publications/Policy%20making%20in%20the%20real%20world.pdf (Accessed 29.09.22)
Keller, M. ,Halkier, B., Wilska, T.-.A. (2016). Policy and governance for sustainable consumption at the crossroads of theories and concepts. Environ. Policy Gov., 26, 10.1002/eet.1702
Loulou, R., Goldstein, G., Noble, K., 2004. Documentation for the MARKAL Family of Models [Online]. Available at: https://iea-etsap.org/MrklDoc-III_SAGE.pdf (Accessed 29.09.22)
O’Brien, L., 2019. Carrying out Physical Activity as Part of the Active Forests Programme in England: What Encourages, Supports and Sustains Activity?—A Qualitative Study. International Journal of Environmental Research and Public Health. https://www.researchgate.net/publication/337970568_Carrying_out_Physical_Activity_as_Part_of_the_Active_Forests_Programme_in_England_What_Encourages_Supports_and_Sustains_Activity-A_Qualitative_Study (Accessed 16/11/22)
Sahakian, M., and Wilhite, H., (2014): Making practice theory practicable: Towards more sustainable forms of consumption. Journal of Consumer Culture. 14(1):25-44
Scotland’s Climate Assembly, (2021) Scotland’s Climate Assembly, Recommendations for Action. 620640_SCT0521502140-001_Scotland’s Climate Assembly_Final Report Goals_WEB ONLY VERSION.pdf (nrscotland.gov.uk) (Accessed 21.11.22)
Scottish Government (2022). Open Government Action Plan commitment 2: participation framework [Online]. Available at: https://www.gov.scot/publications/open-government-action-plan-commitment-2/ (Accessed 04.10.22)
Scottish Government (2021). Net Zero Nation – Public Engagement Strategy for Climate Change [Online]. Available at: https://www.gov.scot/publications/net-zero-nation-public-engagement-strategy-climate-change/ (Accessed 29.09.22)
Scottish Government (2021). Heat in Buildings Strategy – achieving net zero emissions in Scotland’s buildings [Online]. Available at: https://www.gov.scot/publications/heat-buildings-strategy-achieving-net-zero-emissions-scotlands-buildings/ (Accessed 03.10.22)
Scottish Government, (2020). Update to the Climate Change Plan 2018 – 2032. [Online] Available at: https://www.gov.scot/publications/securing-green-recovery-path-net-zero-update-climate-change-plan-20182032/ (Accessed 29.09.22)
Scottish Government, (2020). The National Transport Strategy [Online]. Available at: https://www.transport.gov.scot/our-approach/national-transport-strategy/ (Accessed 04.10.22)
Shove, E. (2015) ‘Linking low carbon policy and social practice’ in Strengers, Y. and Maller, C. (Eds), Social Practices, Intervention and Sustainability: Beyond behaviour change, London: Routledge. P31-45.
Shove, E. (2011). How the social sciences can help climate change policy [Online]. Available at: https://www.lancaster.ac.uk/staff/shove/exhibits/transcript.pdf (Accessed 3.10.22)
Shove, E., Pantzar, M., & Watson, M. (2012). The Dynamics of Social Practice: Everyday Life and How it Changes. P3. Sage Publications.
Spurling, N., McMeekin, A., Shove, E., Southerton, D., & Welch, D. (2013). Interventions in practice: re-framing policy approaches to consumer behaviour. University of Manchester, Sustainable Practices Research Group [Online]. Available at: https://www.research.manchester.ac.uk/portal/files/32468813/FULL_TEXT.PDF%22%20/t%20%22_blank
Sustainable Scotland Network/Keep Scotland Beautiful, Climate Changing
Behaviours, Climate Changing Behaviours: Behaviours, ISM and the public sector 2015/16 [Online]. Available at: ISM Yr2 climatechanging-behaviours-low-res.pdf (sustainablescotlandnetwork.org) (Accessed 01.10.22)
Transport Scotland, 2020. National Transport Strategy – Protecting our Climate and Improving Lives [Online]. Available at: https://www.transport.gov.scot/media/47052/national-transport-strategy.pdf (Accessed 29.09.22)
UN 2022. Act Now [Online]. Available at: https://www.un.org/en/actnow. (Accessed 04.10.22)
Watson, M., Browne, A., Evans, D., Foden, M., Hoolohan, C., Sharp, L. 2020. Challenges and opportunities for re-framing resource use policy with practice theories: The change points approach. Global Environmental Change, Volume 62, ISSN 0959-3780, https://doi.org/10.1016/j.gloenvcha.2020.102072.
Welch, D. 2017. Behaviour change and theories of practice: Contributions, limitations and developments. Available at: https://www.researchgate.net/publication/322097815_Behaviour_change_and_theories_of_practice_Contributions_limitations_and_developments (Accessed 04.10.22)
Appendix 2: Methodology
A mixed methodology approach was used for the data gathering elements of the research, across three stages, described below
Scoping stage
Background research
A literature review was undertaken at the start of the research project, and each stage of the project built on the findings of the previous stage s the project progressed to include contributions from stakeholders through interviews.
Firstly, research was undertaken into the practical application of a practice-based approach to behaviour change policy. Theory, case studies and tools were researched using internet searches and academic journal databases. Relevant papers and reports were reviewed.
Alongside the literature review we undertook semi-structured interviews with the following four social practice theory experts:
- Ben Twist, Director, Creative Carbon Scotland
- Claire Hoolohan, Presidential Research Fellow, Tyndall Centre for Climate Research, University of Manchester
- Iain Black, Professor of Practice at University of Strathclyde
- June Graham, Sustainable Scotland Network, Edinburgh Climate Change Institute
We incorporated their insights into the detailed literature review provided to ClimateXChange and used them to design the workshops.
Search terms
Search terms included terms below plus combinations of the terms:
- Social Practice Theory
- Behaviour and Practice Theory
- Interlinked practices
- Social Theory
- Behaviour Change
- Policy-making
Further searches were made, building on authors and subsequent links:
- Elizabeth Shove
- Matt Watson
- Fiona Spotwood
- Iain Black
- Claire Hoolohan
Some search terms were not particularly successful; combinations were more effective and further searches were made based on references made in academic publications.
Scottish Policy document review
Secondly, Scottish Government policy papers to be reviewed were suggested by ClimateXChange and Scottish Government staff, and further searches were undertaken by the research team Scottish Government policy documents were reviewed in order to identify:
- Where behaviour and societal change was described and made up a significant part of policy; where a combination of technology and societal change was identified; and the kind of policies or engagement that were planned to drive down emissions in these two categories.
- Where social practice and ILP approaches could be applied.
- Key areas/sectors the Scottish Government is seeking and has power to influence in relation to the application of ILP for a NZ transition in Scotland.
Inclusion criteria
- Does it relate to climate change emissions? E.g. transport, buildings, waste, energy, economic development etc
- Is it too detailed? Focus on strategies, what about policy (we don’t want to get right down into policy analysis unless indicated by practice theory analysis)?
- Does Scottish Government/CXC want us to review it? If yes, we review it for interlinks
- Does it relate to ‘behind the line of visibility’? If yes, it’s not relevant to our project because it does not require any behaviours/practices to change
- Does it relate to a combination of tech/behaviour? If yes – that is what we need to test out a practice theory/interlinked practices lens on so include it
- Does it relate just to behaviour change? If yes – it might be more complicated than we think – so we test out the practice theory/interlinked practices lens on it.
- Does it relate to emissions out of Scottish Government control? If yes, note and ‘park’
In order to get an understanding of how the Scottish Government develops its Climate Change Plan, we held meetings with relevant cross-cutting teams at the Scottish Government, including:
- The Climate Change Plan team who explained the steps they follow over the timeframe of its development.
- The TIMES model team who develop the emissions envelopes for each sector.
- The behaviour change and engagement team who lead on the Scottish Government’s NZ public engagement strategy; and
- The Place Outcomes Lead, Planning and Architecture Division, who work on the Place Standard tool with the climate lens.
All sectors were asked to nominate one staff member for an interview with the research team. These interviews gave the research team an insight into how policy is developed within their sector team, including tools and approaches used (e.g. Theory of Change), what expertise was used (e.g. social research expertise), and the role of ministers in setting policy.
The interviews also enabled a discussion about where social policy could fit into their strategy.
Issues emerging from the literature review and interviews relating to an interlinked practice approach in the context of the Climate Change Plan development, were explored in more detail through the workshop with Scottish Governments sector staff and external stakeholders. These included: what practices participants would change to deliver the Scottish Government net zero target, which Climate Change Plan sectors and challenges could be improved using and interlinked practices approach and obstacles and opportunities to doing this.
First set or workshops
We held two online workshops in November 2022 entitled: How can new behaviour change concepts shape the next Climate Change Plan?
- Tuesday 1st November with seven Scottish Government sector staff; and
- Friday 4th November with five stakeholders and Scottish Government sector staff.
The workshops aimed to:
- Investigate whether an ILP approach could help design more effective behaviour change interventions, and where it could help to enable the step change required to meet NZ targets.
- Share findings from the literature and policy review into practice-based approaches.
- Facilitate a group discussion about how theories, principles and models can be used in developing the next Scottish Climate Change Plan.
- Unpick the pros and cons of using practice-based approaches.
Mapping Stage
In order to identify which sectors could potentially benefit from an interlinked approach, a mapping exercise was undertaken using an online whiteboard tool. This was a desk-based exercise and looked at each sector in the updated CCP, and categorised and mapped a large range of factors, including:
- Sector policy outcomes from the CCP update and related policies;
- CCC’s Monitoring Framework consisting of outcomes, enablers, policy and contextual factors;
- Progress against policy outcome indicators; and
- Cross cutting themes.
For each emissions sector we identified outcomes and policies that relied on people doing something and then labelled policies as ‘material’, ‘competence’ and ‘meaning’ to assess whether the full conditions for change were being addressed. We also made links within and between sectors where things people do overlap across sectors, for example, within a place.
Testing Stage
Flowchart
We developed a process flowchart or checklist that aimed to test if and how Interlinked Practice could be used in making the new Climate Change Plan. The flowchart was reviewed by the steering group, and then tested out at the second set of workshops.
Workshops
We held four more workshops with government and stakeholder participants, to test whether the interlinked practices concept and the flowchart were useful. Each workshop focused on a different theme as follows:
- The route map to achieve a 20 per cent reduction in car kilometres by 2030
- 20-minute neighbourhoods
- Use of the Change points tool and reducing emissions from livestock production
- Retrofit
Appendix 3 Mapping summary
Mapping Summary: Text version
Agriculture
Opportunities /links for ILP:
Peer learning (see Farm Net Zero below) Competencies
20 minute neighbourhoods Meaning, Materials
NETs: Availability of home grown sustainable biomass to supply large scale power bioenergy with carbon capture and storage Materials
Sources of support/Case studies: Competencies, Meaning
Farm Net Zero: https://farmcarbontoolkit.org.uk/farm-net-zero/
LULUCF
Opportunities/links for ILP:
Increasing Scottish Grown timber
Buildings & heat: policy outcome 2 – Construction industry sourcing more sustainably sourced wood fibre to increase its use of wood products where appropriate (Link to industry as well) Materials
NETs: Availability of home grown sustainable biomass to supply large scale power bioenergy with carbon capture and storage Materials
Sources of support/Case studies: Competencies, Meaning
Farm Net Zero: https://farmcarbontoolkit.org.uk/farm-net-zero/
Transport
Opportunities/links for ILP:
20 minute neighbourhood
Links to Electricity: Local communities
Local energy model – one that supports local solutions to meet local need, and links to local generation and use.
Community- led renewables.
Sources of support/case studies: Competencies, Meaning
Transport Scotland/COSLA Routemap:
Manchester Moving and Made to Move: https://beeactive.tfgm.com/made-to-move/
Waste
Opportunities/links for ILP:
Household Food waste – largest emissions of sector. Link to changing purchase/consumption/storage of food. Potential links to Agriculture and 20 minute neighbourhoods
Sources of support/Case studies: Competencies, Meaning
Buildings and Heat
Opportunities/Links for ILP:
Link to LULUCF Policy Outcome 2: Increase the use of sustainably sourced wood fibre to reduce emissions by encouraging the construction industry to increase its use of wood products where appropriate. Materials
Decarbonisation of heat linked to LULUCF and NETS
Availability of home grown sustainable biomass to supply large scale power bioenergy with carbon capture and storage. Materials
Community energy – district heating, 20 minute
Neighbourhoods. Materials, Meaning
Industry
Opportunities/links for ILP:
Industry emissions linked to hydrogen production which has links to other sectors e.g. heat, transport and electricity.
Link to NETs – CCS
Manufacturing innovation will support delivery of low carbon energy, transport and buildings to society Materials, as well as transition to circular economy.
How industry can change our practices (top down). Materials
But also how our practices (e.g. consumption and demand for green products and services) can influence industry. Consumer demand for low carbon productions and services: investigate opportunities for green labelling to inform purchasing decisions. Competencies, Meaning
Electricity
Opportunities/links for ILP:
Links to buildings and transport decarbonisation.
Potential for NETs to deliver negative emissions from electricity, e.g. through use of bioenergy for electricity generation combined with CCS. Materials
NETs
Opportunities/links for ILP:
Less of a priority for ILP, as is a response to carbon emissions that cannot be completely eliminated, but links to:
Industry: manufacturing innovation. Materials
LULUCF/Agriculture: availability of home grown sustainable biomass for BECCS. Materials
Electricity: use of bioenergy for electricity generation combined with CCS
info@climatexchange.org.uk
+44(0)131 651 4783
@climatexchange_
www.climatexchange.org.uk
© Published by CAG Consultants, 2023 on behalf of ClimateXChange. All rights reserved.
While every effort is made to ensure the information in this report is accurate, no legal responsibility is accepted for any errors, omissions or misleading statements. The views expressed represent those of the author(s), and do not necessarily represent those of the host institutions or funders.
- https://www.naturesave.co.uk/why-we-offer-our-staff-extra-paid-holiday-if-they-dont-fly/ ↑
- https://www.gov.scot/policies/managing-waste/deposit-return-scheme/ ↑
- https://www.gov.uk/guidance/packaging-waste-prepare-for-extended-producer-responsibility ↑
- https://wrap.org.uk/taking-action/citizen-behaviour-change/love-food-hate-waste ↑
- https://www.gov.scot/publications/food-waste-reduction-action-plan/pages/10/ ↑
- https://wrap.org.uk/resources/report/food-waste-trends-survey-2021 (accessed 23/02/23) ↑
- https://carbon.coop/portfolio/people-powered-retrofit/ ↑
- https://provocations.darkmatterlabs.org/the-system-challenges-to-retrofit-3913efd718a3 ↑
- https://www.3ci.org.uk/ ↑
- https://blogs.lse.ac.uk/covid19/2021/09/21/does-working-from-home-cut-carbon-emissions-not-necessarily-in-fact-it-can-have-the-opposite-effect/ ↑
- https://www.gov.scot/publications/influencing-behaviours-moving-beyond-individual-user-guide-ism-tool/ ↑
- https://www.ourplace.scot/Place-Standard-Climate ↑
- https://socialdesign.de/wp-content/uploads/2020/02/change-points1-3.pdf ↑
- COM-B model of behaviour change https://social-change.co.uk/files/02.09.19_COM-B_and_changing_behaviour_.pdf ↑
- 20-minute neighbourhoods City of Edinburgh Council https://www.edinburgh.gov.uk/future-council/need-20-minute-neighbourhoods ↑
- The Scottish TIMES model provides each policy area with their share of total decarbonisation effort and the changes to existing technologies and processes, which might enable them to meet their share of effort in the most cost-effective way. ↑
- TIMES teach in presentation to research team September 2022 ↑
- https://www.bbc.co.uk/news/uk-england-london-62811206 ↑
- The Climate Change Act (Scotland) mandates the sector split in the Climate Change Plan. The Scottish TIMES model is used to provide each policy area with their emissions envelopes. Information on TIMES provided in presentation to research team September 2022 ↑
December 2023
DOI: http://dx.doi.org/10.7488/era/3889
Executive summary
Aims and findings
Scotland is part of the UK Emissions Trading Scheme (UK ETS), the United Kingdom’s carbon emissions trading scheme. The scheme places an overall limit on emissions from large industrial sites and airlines, and facilitates the trading of emissions allowances within this limit.
The Scottish Government would like to understand how emissions from sites subject to the UK ETS are likely to evolve over the transition to net zero greenhouse gas emissions and the implications of steadily reducing the number of permits in the emissions trading scheme.
This study introduced a UK ETS accounting mechanism to the Scottish TIMES model, which is a diagnostic tool to help understand the key inter-relationships across the energy system. This will enable the Scottish Government to investigate these questions.
The Scottish TIMES model is being used by the Government to produce a new net zero pathway for Scotland to support its new Climate Change Plan.
Scottish TIMES does not distinguish between ETS and non-ETS emissions. By adding this capability, ETS emissions can be constrained separately to the overall Scottish emissions target.
The proportion of emissions subject to ETS was estimated for each sub-sector of Scottish TIMES and used to calculate ETS emissions in the model. A flexible mechanism was created to try to enable future changes to the UK ETS to be easily implemented. We created example scenarios with emission constraints and taxes for ETS emissions. A series of tests demonstrated that the model was working correctly.
Recommendations
Based on our research, we recommend that the Scottish Government consider:
- reviewing the ETS sites against the Scottish Greenhouse Gas Statistics to ensure that the data in both are accurate and consistent.
- cross-referencing the ETS site emissions and energy consumption, the Scottish Greenhouse Gas Statistics and the Scottish energy balance, to ensure that all sites in Scotland that are required to participate in the ETS are registered.
- ensuring the representation of gas networks in Scottish TIMES is consistent across the model and that the emission coefficients reflect all gas system losses.
- reviewing modelled emissions against actual emissions for the year 2020 to identify sectors of the economy where unrealistic decarbonisation pathways might have been created, and constrain those pathways appropriately.
Abbreviations
| AR4 | Assessment Report 4 from the IPCC |
| AR5 | Assessment Report 5 from the IPCC |
| CCP | Climate Change Plan |
| CHP | Combined heat and power |
| EU ETS | European Union Emissions Trading Scheme |
| GHG | Greenhouse gas |
| IEA | International Energy Agency |
| IPCC | Intergovernmental Panel on Climate Change |
| MW | Megawatts |
| OPRED | Offshore Petroleum Regulator for Environment and Decommissioning |
| PFC | Perfluorocarbons |
| SEPA | Scottish Environment Protection Agency |
| TIMES | An energy system model generator developed by the Energy Technology Systems Analysis Program (ETSAP), which is an International Energy Agency technology collaboration programme. |
| UK ETS | United Kingdom Emissions Trading Scheme |
| UNFCCC | United Nations Framework Convention on Climate Change |
Introduction
Scotland is part of the UK Emissions Trading Scheme (UK ETS). The Scottish Government wishes to: (i) understand how emissions from sites subject to ETS are likely to evolve over the transition to net zero; and, (ii) understand the implications of steadily reducing the number of permits in the emissions trading scheme on the transition.
The Scottish TIMES model is being used as part of a suite of analyses to inform a new net zero pathway for Scotland to support a new Climate Change Plan. The Scottish TIMES energy system model is built using the TIMES platform, which is developed by an International Energy Agency (IEA) technology collaboration programme and used in 63 countries. It contains a detailed and up-to-date depiction of all Scottish energy flows and greenhouse gas (GHG) emissions. It explores the potential future benefits of a wide range of low-carbon fuels and technologies.
Scottish TIMES currently does not distinguish between ETS and non-ETS emissions. Adding this capability to Scottish TIMES would enable ETS emissions to be constrained separately to the overall Scottish emissions target, or for different targets to be used for ETS and non-ETS emissions.
UK emissions accounting
The United Kingdom (UK) uses a range of approaches to emissions accounting for different applications:
- The United Nations Framework Convention on Climate Change (UNFCCC) accounting follows UNFCCC guidelines (e.g. moving from Assessment Report 4 (AR4) to Assessment Report 5 (AR5) global warming potentials by the end of 2024; counting F-gases separately).
- UK Climate Change Act 2008: restricts emissions of 6 GHGs/groups of GHGs.[1] The Scottish emissions budget includes all international aviation and shipping, and the UK Government has agreed to include international aviation and shipping from Carbon Budget 6 (2033–2037).
- The UK ETS applies to regulated activities that result in greenhouse gas emissions, including combustion of fuels on a site where combustion units with a total rated thermal input exceeding 20 megawatts (MW) are operated (except in installations where the primary purpose is the incineration of hazardous or municipal waste) (UK Government, 2023). Sites in Northern Ireland are excluded as these are part of the EU ETS instead. The UK ETS also includes domestic aviation and flights to Gibraltar and the European Economic Area. Other international aviation and all shipping are not included but could be in the future. Scottish participants can trade with the rest of the UK and might be able to trade with other non-UK ETSs in future.
- Some other schemes include non-UK emissions, for example for biomass sustainability.
We aimed to develop an emissions aggregation structure in Scottish TIMES in which all of these applications could be accounted for easily and transparently. We designed the approach to be relatively flexible to changes in these schemes (e.g. for shipping to be added to the ETS in the future).
Scottish UK ETS emissions
The UK ETS replaced the UK’s participation in the European Union Emissions Trading Scheme (EU ETS) on 1 January 2021. It covers emissions from two broad parts of the economy (UK Government, 2023a):
- Large industrial sites and power stations.
- Domestic aviation and flights to Gibraltar and the European Economic Area.
Each static site in the UK is treated individually. Regulation is devolved, with the Scottish Environment Protection Agency (SEPA) regulating Scottish sites. There are 72 sites in total in Scotland. Table 1 shows that most emissions are from a small number of power stations and large industrial plants.
All UK offshore oil and gas sites are regulated by the Offshore Petroleum Regulator for Environment and Decommissioning (OPRED) rather than SEPA. Many of these sites will be in Scottish waters. As Scottish TIMES does not cover offshore emissions, these were not included in this study. Offshore emissions are not part of Scottish territorial emissions and therefore are not included in Scotland’s Climate Change Plan either.
Aviation emissions are regulated in the country in which the operator is registered. Only one airline (Loganair) is registered in Scotland but many more aviation emissions involve Scotland.
Structure of this report
The methodology we used is discussed in Section 4. Section 5 analyses Scottish emissions covered by the ETS and derives ETS fractions for each Scottish TIMES sub-sector. Section 6 describes how we implemented ETS emissions accounting in Scottish TIMES. Section 6 discusses our quality assurance approach.
Method
The analytical approach we used is summarised in Figure 1.
The key challenges were estimating the fraction of emissions from each Scottish TIMES sub-sector that are covered by the UK ETS, or might be covered in future, and then to implement an accounting system for these emissions in Scottish TIMES.
The fraction of emissions covered by the UK ETS was estimated using two approaches. First, all ETS emission stationary sites and each overall emission category was assigned to a Scottish TIMES sub-sector (Sections 5.1 and 5.2). The total emissions in each sub-sector were then compared to estimate the fraction of emissions in the sub-sector covered by the UK ETS. A separate analysis was carried out for international aviation emissions, as only international flights to the EU are included in the UK ETS and only UK-wide statistics on flights were available from ETS statistics. Instead, an analysis of flights from Scottish airports was used to estimate the fraction of fuel use for EU destinations (Section 5.3).
A detailed accounting system for ETS and non-ETS emissions was implemented in the “ets_ucl” branch of Scottish TIMES by sub-sector (Section Error! Reference source not found.). A number of wider model changes were required to implement this accounting system. New example scenarios were created to separately limit ETS emissions from total emissions (Section Error! Reference source not found.) and to apply a carbon tax on ETS emissions (Section Error! Reference source not found.). The revised model was checked carefully to ensure that all emissions were covered (Section Error! Reference source not found.).
Table 1: Summary of Scottish sites subject to the UK ETS and their associated GHG emissions
| Description | Number of sites | GHG emissions (ktCO2e) | |
|---|---|---|---|
| 2021 | 2022 | ||
| Production of electricity | 16 | 1973 | 2181 |
| Manufacture of other organic basic chemicals | 2 | 1289 | 1304 |
| Manufacture of refined petroleum products | 2 | 910 | 1149 |
| Extraction of natural gas | 5 | 552 | 574 |
| Steam and air conditioning supply | 1 | 564 | 530 |
| Manufacture of cement | 1 | 459 | 444 |
| Extraction of crude petroleum | 2 | 350 | 322 |
| Distilling, rectifying and blending of spirits | 10 | 246 | 267 |
| Distribution of gaseous fuels through mains | 6 | 203 | 215 |
| Manufacture of hollow glass | 2 | 189 | 199 |
| Manufacture of basic pharmaceutical products | 2 | 136 | 130 |
| Manufacture of veneer sheets and wood-based panels | 3 | 96 | 77 |
| Aluminium production | 1 | 61 | 51 |
| Manufacture of other rubber products | 1 | 57 | 45 |
| Manufacture of paper and paperboard | 2 | 57 | 39 |
| Tertiary education | 2 | 33 | 32 |
| Manufacture of other food products | 1 | 30 | 27 |
| Treatment and disposal of non-hazardous waste | 1 | 20 | 22 |
| Defence activities | 2 | 24 | 21 |
| Manufacture of plastics in primary forms | 1 | 18 | 16 |
| Operation of dairies and cheese making | 1 | 11 | 10 |
| Manufacture of other non-metallic mineral products | 2 | 8 | 8 |
| Manufacture of basic iron and steel and of ferro-alloys | 2 | 10 | 7 |
| Manufacture of bricks, tiles and construction products, in baked clay | 1 | 6 | 6 |
| Quarrying of ornamental and building stone, limestone, gypsum, chalk and slate | 1 | 7 | 6 |
| Forging, pressing, stamping and roll-forming of metal; powder metallurgy | 1 | 9 | 4 |
| Engineering activities and related technical consultancy | 1 | 2 | 1 |
Figure 1. Analytical approach taken by this project
Analysis of emissions covered by the UK ETS
In Scottish TIMES, emissions accounting could be implemented at the level of sectors (e.g. industry; transport), sub-sectors or individual technologies. Sectors can be quite broad in nature so applying the scheme across a whole sector would be inappropriate as emissions could be cut in areas not subject to the ETS. As individual technologies require a level of detail for the real-world economy that is not available in the model (e.g. categorising all food and drink industries in what is a very diverse sector), this was not a practical option. We therefore estimated fractions by sub-sector and where possible chose our sub-sectors to reflect sites that were likely or not to be part of the ETS.
Table 2 shows the Scottish TIMES sub-sectors that were used to categorise ETS activities and Scottish Greenhouse Gas Statistics data. Sites with larger emissions such as refineries, upstream oil and gas and chemical plants are in sub-sectors where most emissions are subject to the ETS.
Table 2: Scottish TIMES sectors, sub-sectors, and descriptions
| Sector | Description | Sub-sector | Description |
|---|---|---|---|
| AGR | Agriculture | Crops & livestock | Crops & livestock |
| Energy | Energy | ||
| Land use | Land use and forestry | ||
| All | Gas distribution | Gas distribution networks | |
| ELC | Electricity generation and power grids | EfW | Energy from waste plants |
| Other | All other generation | ||
| IND | Industry | ICH | Chemicals |
| ICM | Cement | ||
| IFD | Food, drink, and tobacco | ||
| IIS | Iron & steel | ||
| INF | Non-ferrous metals | ||
| INM | Non-metallic minerals | ||
| IPP | Paper | ||
| IOFFD | Off-road mobile machinery | ||
| IOI | Other industry | ||
| PRC | Processing and infrastructure | Bioenergy | All bioenergy processes |
| Uranium | Nuclear fuel production | ||
| Refineries | Oil refinery | ||
| Waste | Waste processes | ||
| Other fossil | e.g. coke manufacturing | ||
| RES | Residential | RH | All heating |
| Other | Other | ||
| RSR | Resources and trade | Mining | UK resource extraction |
| Upstream oil and gas | Upstream processing | ||
| SER | Services | SH | High-consumption heating |
| Other | Other | ||
| TRA | Transport | TAD | Domestic aviation |
| TAI | International aviation | ||
| TB | Buses | ||
| TC | Cars | ||
| TH | Heavy goods vehicles | ||
| TL | Light goods vehicles | ||
| TR, TF | Rail passengers and freight | ||
| TSD | Domestic shipping | ||
| TSI | International shipping | ||
| TW | Two-wheel vehicles | ||
| Other | Other |
Scottish Emissions Inventory
Scotland publishes Scottish Greenhouse Gas Statistics annually (hereafter “Emissions Inventory”). For each entry in the Emissions Inventory (Scottish Government, 2023), we added two fields representing the most appropriate Scottish TIMES sector and sub-sector from Table 2. Sectors and sub-sectors were allocated according to the following fields in the Emissions Inventory: Climate Change Plan (CCP) category, Intergovernmental Panel on Climate Change (IPCC) codes and source name.
Some emissions are not explicitly represented in Scottish TIMES and were categorised as “None”. The sources of these emissions are listed in Table 4 summarises the allocation of Scottish GHG emissions in 2021 to each of the Scottish TIMES sub-sectors. One of the challenges is that the IPCC codes used in the inventory do not map easily onto technologies in the energy system. In some cases, a technology produces emissions that map onto more than one IPCC code. For example, industrial plants with process emissions map to both combustion and process emissions codes. Another challenge is that some IPCC codes aggregate emissions from a diverse set of plants, particularly “Other industrial combustion” (IPCC code 1A2gviii) and “Miscellaneous industrial/commercial combustion” (1A4ai), which together accounted for almost 7% of Scottish emissions in 2021. These codes were both allocated to the “industrial other (IOI)” sub-sector.
It is likely that emissions from some of the other industrial sectors, and possibly also the service sector, are included in these two codes and hence allocated to the IOI sub-sector.
Scottish ETS emissions for stationary sites
The UK ETS publishes a compliance report containing emissions for each site and each airline. We used the 2023 publication (UK Government, 2023b).
We assigned each of the 72 sites in Scotland subject to the ETS individually to a Scottish TIMES sub-sector. One challenge was that the NACE description did not always accurately describe the plant operation. For example, the Sullom Voe Terminal description is extraction of natural gas, but it is primarily an oil terminal. The Shell UK Limited Fife NGL Plant description is manufacture of refined petroleum products, but plant best fits into the chemical industry rather than the oil refining sector.
Matching Scottish ETS emissions to Inventory emissions
We checked this designation and also assigned IPCC codes that were consistent with the Emissions Inventory where possible. This is challenging for oil and gas upstream and downstream sectors in particular as these are broad and complex in Scotland, so a good understanding of the sector is required to properly assign the plants to the Inventory. For example, Grangemouth combined heat and power (CHP) plant is counted under chemicals in the Inventory, while Grangemouth Infrastructure is counted under refineries, despite both being CHP plants at the same site.
One approach we used was to compare site emissions against the NAEI “Large Point Sources” emissions dataset for the year 2021 (UK Government, 2023c). However, there were notable errors and omissions in the version of the data source we consulted, with several sites having CO2 emissions missing and many sites having incorrect location data (e.g. Scottish sites categorised in other UK countries, and vice versa), so not all sites could be identified in the Inventory.
Table 3. In total, they comprised only 0.5% of Scottish emissions in 2021.
Table 4 summarises the allocation of Scottish GHG emissions in 2021 to each of the Scottish TIMES sub-sectors. One of the challenges is that the IPCC codes used in the inventory do not map easily onto technologies in the energy system. In some cases, a technology produces emissions that map onto more than one IPCC code. For example, industrial plants with process emissions map to both combustion and process emissions codes. Another challenge is that some IPCC codes aggregate emissions from a diverse set of plants, particularly “Other industrial combustion” (IPCC code 1A2gviii) and “Miscellaneous industrial/commercial combustion” (1A4ai), which together accounted for almost 7% of Scottish emissions in 2021. These codes were both allocated to the “industrial other (IOI)” sub-sector.
It is likely that emissions from some of the other industrial sectors, and possibly also the service sector, are included in these two codes and hence allocated to the IOI sub-sector.
Scottish ETS emissions for stationary sites
The UK ETS publishes a compliance report containing emissions for each site and each airline. We used the 2023 publication (UK Government, 2023b).
We assigned each of the 72 sites in Scotland subject to the ETS individually to a Scottish TIMES sub-sector. One challenge was that the NACE[2] description did not always accurately describe the plant operation. For example, the Sullom Voe Terminal description is extraction of natural gas, but it is primarily an oil terminal. The Shell UK Limited Fife NGL Plant description is manufacture of refined petroleum products, but plant best fits into the chemical industry rather than the oil refining sector.
Matching Scottish ETS emissions to Inventory emissions
We checked this designation and also assigned IPCC codes that were consistent with the Emissions Inventory where possible. This is challenging for oil and gas upstream and downstream sectors in particular as these are broad and complex in Scotland, so a good understanding of the sector is required to properly assign the plants to the Inventory. For example, Grangemouth combined heat and power (CHP) plant is counted under chemicals in the Inventory, while Grangemouth Infrastructure is counted under refineries, despite both being CHP plants at the same site.
One approach we used was to compare site emissions against the NAEI “Large Point Sources” emissions dataset for the year 2021 (UK Government, 2023c). However, there were notable errors and omissions in the version of the data source we consulted, with several sites having CO2 emissions missing and many sites having incorrect location data (e.g. Scottish sites categorised in other UK countries, and vice versa), so not all sites could be identified in the Inventory.
Table 3: Emission sources in the Scottish Inventory not represented in Scottish TIMES
| Source | Source (continued) |
| Abandoned oil wells (offshore) | Oil Terminal: Venting |
| Abandoned oil wells (onshore) | Oil transport fugitives: pipelines (onshore) |
| Accidental fires – dwellings | Oil transport fugitives: pipelines (to shore) |
| Accidental fires – other buildings | Oil transport fugitives: road tankers |
| Accidental fires – vehicles | Onshore natural gas gathering |
| Agricultural engines | Onshore natural gas production (conventional) |
| Anaerobic Digestion (other) | Onshore oil production (conventional) |
| Closed Coal Mines | Onshore oil production: gas flaring |
| Coal storage and transport | Onshore oil well exploration (conventional) |
| Composting (at household) | Open-cast coal |
| Deep-mined coal | Petroleum processes |
| Domestic Closed Stove – Basic | Recreational use of N2O |
| Domestic Closed Stove – EcoDesign | Road vehicle engines |
| Domestic Closed Stove – Upgraded | Sewage sludge decomposition |
| Domestic Fireplace – Standard | Sewage sludge decomposition in private systems |
| Domestic Outdoor | Small-scale waste burning |
| Gas Terminal: Gas Flaring | Total composting (non-household) |
| Gas Terminal: Other Fugitives | Upstream Gas Production – flaring |
| Gas Terminal: Venting | Upstream Gas Production – fugitive emissions |
| Incineration | Upstream Gas Production – Offshore Well Testing |
| Incineration – chemical waste | Upstream Gas Production – venting |
| Incineration – clinical waste | Upstream Gas Production: direct process emissions |
| Incineration – sewage sludge | Upstream Oil Production – flaring |
| Industrial engines | Upstream Oil Production – fugitive emissions |
| Industrial Waste Water Treatment | Upstream Oil Production – Offshore Oil Loading |
| Marine engines | Upstream Oil Production – Offshore Well Testing |
| Mechanical Biological Treatment – Anaerobic Digestion | Upstream Oil Production – Onshore Oil Loading |
| Mechanical Biological Treatment – Composting | Upstream Oil Production – venting |
| N2O use as an anaesthetic | Upstream Oil Production: direct process emissions |
| Oil Terminal: Gas Flaring | Well exploration (unconventional gas): all sources |
| Oil Terminal: Other Fugitives |
Table 4. Allocated Scottish GHG emissions in each Scottish TIMES sub-sector in the year 2021. Units: MtCO2e
| Sector | Sub-sector | GHG | Sector | Sub-sector | GHG | |
| AGR | Crops & livestock | 6.9 | RES | Other | 0.2 | |
| AGR | Energy | 0.9 | RES | RH | 5.8 | |
| AGR | Land use | 0.4 | RSR | Mining | 0.0 | |
| All | Gas distribution | 0.2 | RSR | Upstream oil and gas | 1.6 | |
| ELC | EfW | 0.3 | SER | Other | 0.4 | |
| ELC | Other | 1.3 | SER | SH | 1.1 | |
| IND | ICH | 2.3 | TRA | Other | 0.2 | |
| IND | ICM | 0.5 | TRA | TAD | 0.2 | |
| IND | IFD | 0.6 | TRA | TAI | 0.4 | |
| IND | IIS | 0.0 | TRA | TB | 0.3 | |
| IND | INF | 0.1 | TRA | TC | 4.7 | |
| IND | INM | 0.1 | TRA | TH | 1.9 | |
| IND | IOFFD | 0.5 | TRA | TL | 1.8 | |
| IND | IOI | 3.5 | TRA | TR, TF | 0.1 | |
| IND | IPP | 0.1 | TRA | TSD | 1.7 | |
| PRC | Bioenergy | 0.0 | TRA | TSI | 0.3 | |
| PRC | Other fossil | 0.1 | TRA | TW | 0.0 | |
| PRC | Uranium | 0.0 | None | 0.2 | ||
| PRC | Refineries | 1.3 | Total | 41.6 | ||
| PRC | Waste | 1.5 |
We encountered similar challenges as those for the Emissions Inventory described in Section 5.1. For example, glass manufacturers have process emissions (2A3: “glass production”) but most of their emissions are from combustion and are aggregated with many other industries in “Other industrial combustion” (1A2gviii). Some of these sites did not have CO2 emissions recorded in the NAEI “Large Point Sources” emissions dataset (UK Government, 2023c), perhaps because they are split across IPCC codes. We could not find some other Scottish industrial plants included in the ETS in the NAEI “Large Point Sources” emissions dataset at all.
Recommendation: review the ETS site emissions against the NAEI “Large Point Sources” emissions dataset to ensure that the data in both are accurate and consistent, and investigate causes of any discrepancies.
Only three of eighteen plants[3] generating electricity using waste as a feedstock in Scotland are included in the ETS. Installations where the primary purpose is the incineration of hazardous or municipal waste are currently excluded from the ETS.
ETS fractions by sub-sector for Scottish TIMES
We added GHG emissions by sub-sector and calculated the fraction of ETS emissions over the total emissions reported in the inventory. For this, we only considered the GHG emissions that are reported in the current ETS – CO2 and F-gases for aluminium production.[4]
Table 5 shows the fractions for each of the Scottish TIMES sectors/subsectors. In two sub-sectors, ETS emissions exceeded total emissions. For INM (non-metallic minerals), this resulted from combustion emissions from glass production being recorded in “Other industrial combustion”, as discussed above. The discrepancy for waste was for a single plant with negligible emissions.
The ETS fractions used in Scottish TIMES were mostly the same or similar to the fractions calculated from emissions statistics. No fractions exceeded 1 (i.e. total emissions). We reallocated IOI (industrial other) total emissions to other industrial sectors where the emission statistics fraction exceeded 1 as we assumed that the discrepancy was caused by emissions being erroneously recorded in IOI. The lower total emissions caused the IOI fraction to increase slightly. We assumed that all fossil fuel resource extraction is subject to the ETS. Offshore extraction is counted in a special category outside of Scotland in the ETS and is not included in Scottish TIMES.
It was necessary to choose ETS fractions for low-carbon technologies that have not been constructed in Scotland but might be in the future. We assumed:
- All plants with carbon capture and storage (CCS) will be subject to the ETS as we expect them to be large to benefit from economies of scale to capture and sequester CO2.
- All large hydrogen production plants will be subject to the ETS. Small electrolysers at refuelling stations were excluded.
- All negative emission technologies, including biomass with CCS and direct air capture, are counted using a separate negative emissions category. These could be included in the ETS in future.
Table 5: Fraction of Scottish ETS sites over total reported emissions by Scottish TIMES sector/sub-sector. All emission data have units MtCO2e. * See Section 5.4 for the calculation of the international aviation fraction
| Scottish TIMES code | ETS sites | Included in UK ETS? | Total Scottish emissions 2021 | ETS/Total Emissions | |||||
|---|---|---|---|---|---|---|---|---|---|
| Sector | Sub-sector | Number | Emissions | CO2 | PFC | CO2 | PFC | Stats | Model |
| AGR | Crops & livestock | 0 | Yes | 0.3 | 0 | 0.00 | |||
| AGR | Energy | 0 | Yes | 0.9 | 0 | 0.00 | |||
| AGR | Land use | 0 | Yes | -4.0 | 0 | 0.00 | |||
| All | Gas distribution | 0 | Yes | 0.0 | 0 | 0.00 | |||
| ELC | EfW | 3 | 0.0 | Yes | 0.3 | 0.06 | 0.06 | ||
| ELC | Other | 11 | 1.3 | Yes | 1.3 | 0.99 | 1.00 | ||
| IND | ICH | 6 | 2.1 | Yes | 2.3 | 0.90 | 0.90 | ||
| IND | ICM | 1 | 0.5 | Yes | 0.5 | 1.00 | 1.00 | ||
| IND | IFD | 12 | 0.3 | Yes | 0.5 | 0.52 | 0.52 | ||
| IND | IIS | 3 | 0.0 | Yes | 0.0 | 0.85 | 0.85 | ||
| IND | INF | 1 | 0.1 | Yes | Yes | 0.1 | 0.004 | 0.83 | 0.83 |
| IND | INM | 6 | 0.2 | Yes | 0.1 | 4.07 | 1.00 | ||
| IND | IPP | 2 | 0.1 | Yes | 0.1 | 0.74 | 0.74 | ||
| IND | IOFFD | 0 | Yes | 0.5 | 0 | 0.00 | |||
| IND | IOI | 6 | 0.2 | Yes | 3.2 | 0.05 | 0.06 | ||
| PRC | Refineries | 2 | 1.3 | Yes | 1.3 | 1.00 | 1.00 | ||
| PRC | Waste | 1 | 0.0 | Yes | 0.0 | 3.51 | 0.00 | ||
| PRC | Other | 0 | Yes | 0.0 | 1.00 | ||||
| PRC | DAC | 0 | Yes | 0.0 | 1.00 | ||||
| RES | Other | 0 | Yes | 0.2 | 0 | 0.00 | |||
| RES | RH | 0 | Yes | 5.8 | 0 | 0.00 | |||
| RSR | Fossil supply | 0 | Yes | 0.0 | 0 | 1.00 | |||
| RSR | Upstream oil and gas | 14 | 1.3 | Yes | 1.5 | 0.84 | 0.84 | ||
| SER | Other | 0 | Yes | 0.0 | 0 | 0.00 | |||
| SER | SH | 4 | 0.1 | Yes | 0.9 | 0.06 | 0.06 | ||
| TRA | TAD | 0 | Yes | 0.2 | 0 | 1.00 | |||
| TRA | TAI | 0 | Yes | 0.4 | 0 | 0.68* | |||
| TRA | TB | 0 | Yes | 0.3 | 0 | 0.00 | |||
| TRA | TC | 0 | Yes | 4.7 | 0 | 0.00 | |||
| TRA | Other | 0 | Yes | 0.2 | 0 | 0.00 | |||
| TRA | TH | 0 | Yes | 1.8 | 0 | 0.00 | |||
| TRA | TL | 0 | Yes | 1.8 | 0 | 0.00 | |||
| TRA | TR, TF | 0 | Yes | 0.1 | 0 | 0.00 | |||
| TRA | TSD | 0 | Yes | 1.7 | 0 | 0.00 | |||
| TRA | TSI | 0 | Yes | 0.3 | 0 | 0.00 | |||
| TRA | TW | 0 | Yes | 0.0 | 0 | 0.00 | |||
| Total | 72 | 7.3 | 41.3 | 0.004 | 0.18 | 0.18 | |||
Scottish ETS aviation emissions
Aviation ETS emissions are regulated in the UK country in which the operator is registered. Only one operator is registered in Scotland – Loganair – but many operators registered elsewhere operate in Scotland.
All domestic flights are included in the ETS. International flights to EU destinations are also included but flights to other destinations are currently excluded. It was therefore necessary to estimate the proportion of international flight emissions to EU destinations.
Bunker fuel consumption is an appropriate proxy for emissions, but no data are available on fuel use to EU and non-EU destinations. Instead, we used airport passenger statistics from the Civil Aviation Authority (CAA), Table 12.1, which contains the number of passengers flying from each UK airport to each overseas airport (CAA, 2023). One flight from a Scottish airport had destination “Unknown”. It was removed from the statistics as the small number of passengers would have negligible impact on the analysis.
Since non-EU destinations are generally more distant than EU destinations, we used the number of passengers multiplied by the distance to each overseas airport as a proxy for fuel use. This approach implicitly assumed that aeroplanes to EU and non-EU destinations have similar fuel use efficiencies. We calculated each flight distance from the coordinates of the Scottish and overseas airports using the Haversine formula (assuming the Earth is a perfect sphere) with airport location data from openflights.[5]
We carried out the analysis for the years 2015-2022. Figure 2 shows the fraction of passengers and the fraction of passengers multiplied by distance (proxy fuel use) travelling from Scotland to EU destinations. Prior to the COVID-19 pandemic, around 68% of proxy fuel use was for EU destinations, with a small upward trend over time. In 2021, when there were many international travel restrictions, EU fuel use increased to more than 80% of the total, but this reduced towards the long-term average in 2022. We therefore assumed a fraction of 68% in Scottish TIMES in line with the average excluding the year 2022.
Figure 2. Fraction of international passengers and fraction of (international passengers x distance) to EU destinations from Scotland. Only EU flights are included in the UK ETS. The graph shows the proportion of passengers flying to the EU each year from 2015–2022, and also the distance-weighted proportion as this is likely a better proxy for fuel consumption and hence emissions.
Scottish TIMES UK ETS implementation
We implemented a new ETS emission accounting scheme in Scottish TIMES. This was designed to count all emissions, including those subject and not subject to the ETS, as a quality assurance step to ensure that all emissions were counted appropriately.
We added nine new emission counters categories to Scottish TIMES to account for the ETS and non-ETS emissions. These are described in Table 6. Five categories cover aviation and shipping, with domestic and international travel counted separately and EU and non-EU aviation counted separately. Emissions from stationary sites covered by the ETS or likely to be covered in the future are in SITE-ETS, while those not covered by the ETS are in NON-ETS. SITE-NEG-EMIS is used for future technology-based negative emissions (i.e. excluding nature-based solutions). Finally, LULUCF counts land-use and forestry emissions, including nature-based negative emissions.
For each of these categories, we defined separate emissions counters for CO2, CH4 and N2O. For example, for AIR-UK, we defined AIR-UK-CO2, AIR-UK-CH4 and AIR-UK-N2O. For SITE-ETS and NON-ETS, we additionally defined counters for HFCs. Defining separate counters enables future changes to the UK ETS in which GHGs other than CO2 are added to the scheme to be easily represented in Scottish TIMES.
We created two new model scenarios:
- “GHG_Targets_ETS_non-ETS” demonstrates how emissions subject to the ETS could be limited separately from other emissions. The inclusion and role of negative emissions should be considered carefully when setting fixed or upper limits on ETS emissions and choosing the level of those emissions each year.
- “GHG_ETS_tax” demonstrates how a tax could be applied to emissions subject to the ETS. This would be the equivalent of a minimum traded carbon price for the market.
The revised model produces no errors. Our testing concluded that all ETS and non-ETS emissions are accounted for correctly.
Table 6. ETS emission counters added to Scottish TIMES
| Name | Description |
|---|---|
| SHIP-UK | Domestic shipping (always outside the UK ETS) |
| SHIP-INT | International shipping (always outside the UK ETS) |
| AIR-INT-NON-EU | International aviation outside the UK and EU |
| AIR-INT-EU | International aviation in the EU that is currently included in the ETS |
| AIR-UK | Domestic aviation |
| SITE-ETS | Emissions from a site subject to the ETS |
| NON-ETS | Emissions not subject to the ETS |
| SITE-NEG-EMIS | A plant producing negative emissions (BECCS or DACCS); excludes plants in industry using biomass and any plants co-firing or using waste as a feedstock |
| LULUCF | Land use, land use change and forestry emissions |
Quality assurance
Emissions attribution to Scottish TIMES sub-sectors for the ETS and the Scottish Inventory was carried out by Francisca Jalil-Vega and reviewed by Paul Dodds. Issues were discussed with experts from the Scottish Government.
Our testing of the revised Scottish TIMES model identified no implementation issues.
The international aviation analysis and all model analysis spreadsheets were created by Paul Dodds and checked by Francisca Jalil-Vega.
Conclusions and recommendations
The Scottish Government wants to understand how emissions from sites subject to the UK ETS are likely to evolve over the transition to net zero. We added ETS accounting to the Scottish TIMES model and created example scenarios with emission constraints and taxes for ETS emissions. Scottish TIMES is being used to produce a new net zero pathway for Scotland to support its new Climate Change Plan, but did not previously distinguish between ETS and non-ETS emissions.
ETS emissions accounting required an estimate of the proportion of emissions subject to ETS for each sector and sub-sector of the model. We analysed ETS and overall emission data for the year 2021 to assess these proportions. We also estimated the proportion of international aviation fuel used for flights to EU destinations as these are included in the UK ETS while destinations outside the EU are not.
We noted some unusual trends in the statistics and so we recommend that the Scottish Government:
- reviews ETS sites against the Emissions Inventory to ensure that the data in both are accurate and consistent
- cross-references the ETS site emissions and energy consumption, the Scottish emissions inventory and the Scottish energy balance to ensure that all sites in Scotland that are required to participate in the ETS are registered.
We implemented a branched version of the Scottish TIMES model at a sub-sector resolution using a flexible mechanism to try to enable future changes to the UK ETS to be easily implemented. A number of model changes were required to enable ETS accounting to function correctly, particularly to the representation of gas networks, which would benefit from a review to ensure they are modelled consistently across Scottish TIMES and that the assumptions used are reflected in the gas emission intensities.
Our comparison of the outputs identified some unexpected discrepancies between modelled emissions in 2020 and actual emissions in 2021, so we recommend that these are compared to identify sectors of the economy where unrealistic decarbonisation pathways might have been projected, and to constrain those pathways appropriately.
References
CAA (2023) UK airport data. Civil Aviation Authority. https://www.caa.co.uk/data-and-analysis/uk-aviation-market/airports/uk-airport-data/. Accessed 23 August 2023.
Dodds, P. E. (2021) Review of the Scottish TIMES energy system model. http://dx.doi.org/10.7488/era/793
Scottish Government (2023) Scottish Greenhouse Gas Statistics 2021. https://www.gov.scot/publications/scottish-greenhouse-gas-statistics-2021. Accessed 13 August 2023.
UK Government (2023a) Guidance: Participating in the UK ETS. https://www.gov.uk/government/publications/participating-in-the-uk-ets/participating-in-the-uk-ets. Accessed 20 July 2023.
UK Government (2023b) UK ETS Recorded Emissions and Surrendered Allowances Data. https://reports.view-emissions-trading-registry.service.gov.uk/ets-reports/section5/20230601_Compliance_Report_Emissions_and_Surrenders.xlsx. Accessed 13 August 2023.
UK Government (2023c) Emissions from NAEI large point sources. https://naei.beis.gov.uk/data/map-large-source. Accessed 20 July 2023.
If you require the report in an alternative format such as a Word document, please contact info@climatexchange.org.uk or 0131 651 4783.
© Produced by UCL Consulting 2023 on behalf of ClimateXChange. All rights reserved.
While every effort is made to ensure the information in this report is accurate, no legal responsibility is accepted for any errors, omissions or misleading statements. The views expressed represent those of the author(s), and do not necessarily represent
those of the host institutions or funders.
- The Climate Change Act 2008 covers CO2, CH4, N2O, HFCs, PFCs, SF6 and NF3. NF3 was added in 2023. The base year for CO2, CH4 and N2O is 1990, and for the other gases it is 1995. ↑
- NACE is “Nomenclature of Economic Activities”, the European statistical classification of economic activities. ↑
- List of Scottish Energy from Waste plants from SEPA: https://www.sepa.org.uk/regulations/waste/energy-from-waste/energy-from-waste-sites/ ↑
- https://www.legislation.gov.uk/eudr/2003/87/annex/I ↑
- https://openflights.org/data.html ↑