
Research completed: July 2024
Non-technical summary
This is a non-technical summary to a report published separately as GB wholesale electricity market reform: impacts and opportunities for Scotland. The reader is invited to refer to the full report for detail.
Context
This study assesses the impact that the introduction of locational marginal pricing (LMP) to the Great Britain (GB) wholesale electricity market would have for Scotland, as well as the impact of potential alternatives. LMP has been proposed as a potential reform in the UK Government’s Review of Electricity Market Arrangements (REMA) consultation, which aims to reform electricity markets to enable a net zero energy system. LMP would be a significant reform and is of particular interest to Scotland, as the country is likely to be affected differently to other parts of GB.
We conducted a literature review and assessment of LMP and its alternatives between September 2023 and January 2024. It is an independent review and is not the view of the Scottish Government. This included a detailed assessment of quantitative and qualitative literature, as well as input from an expert advisory panel. The panel was invited to attend two 2-hour discussions, commented on, and reviewed interim findings. It consisted of stakeholders across government, energy research centres, renewables developers, flexibility providers, industry and business representatives, energy suppliers, large consumers of electricity in Scotland, a community energy group, and a consumer protection and advocacy body. Its views have been considered and included in the development of this review. This is the non-technical summary, with a detailed report published separately.
Locational marginal pricing
The wholesale electricity market is where electricity is bought and sold before it is delivered to consumers. Its main participants are electricity generators and suppliers. The current wholesale market is national and marginal. This means that electricity can be bought and sold anywhere in GB at a single national price[1], regardless of the physical constraints, or bottlenecks, on the transmission network. An example of this can be found at the B6 boundary that separates the transmission network between Scotland and England. Constraints arising here limit power flow (typically southward). Generators and consumers are not directly incentivised by the wholesale market to place and operate physical assets that generate or consume electricity in a way that is efficient for their specific location on the electricity network.
Electricity is traded in advance based on a predicted amount of electricity demand. The amount of electricity generated in real-time is adjusted by the electricity system operator (National Grid ESO) to meet the actual, rather than the predicted demand. The cost incurred by National Grid ESO is then passed on to consumers through their electricity bills. When traded generation is expected to exceed the maximum power flow of the network (creating a constraint), additional trades need to be made by National Grid ESO in affected areas to change the expected operating schedules of generators or consumers. With network build not keeping up with the growth in renewables, this inefficiency is accelerating and contributing to higher electricity bills for consumers (National Grid ESO, 2022a).
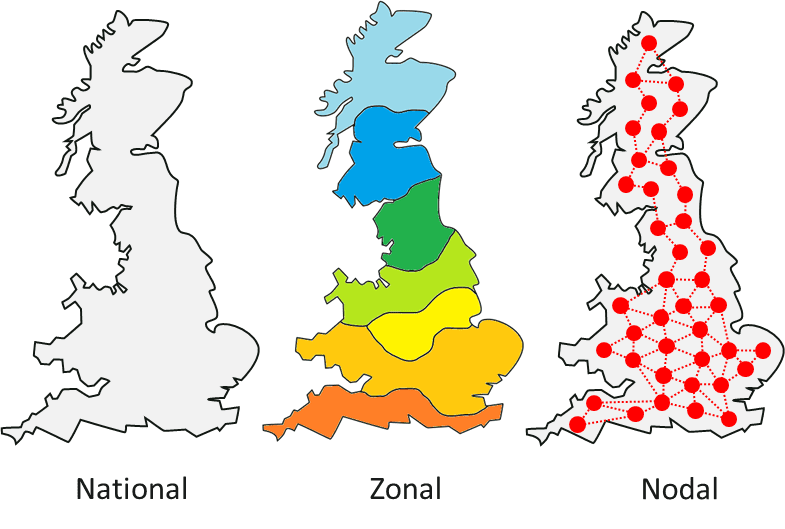
LMP could help reduce this inefficiency by splitting the national market into smaller geographic areas called zones or nodes (see Figure 1). This creates smaller markets that reflect the supply and demand in an area, and the constraints of the network. Areas where the supply is higher than demand will see prices fall, and areas with higher demand will see prices rise. This could incentivise generation and demand to locate where they do not exacerbate constraints. However, it is necessary to consider the wider, non-price factors that also influence decisions by generators and consumers on where to locate. These include the availability and quality of renewable resources (e.g. wind speed or seabed space), supply chains, skills, planning and consenting.
Additionally, the daily variation in price within these locational markets would reflect the instantaneous state of the local network. The result of this would be to create better signals that indicate how to operate flexible assets such as battery storage, international interconnectors, demand side response and dispatchable low-carbon generation (such as hydrogen or biomass) more efficiently. This helps to balance generation and demand and reduce constraints on the network. This further reduces operating costs for National Grid ESO, which are passed directly to consumers.
LMP could, however, make investment in renewable electricity generation less attractive in certain areas of the UK. Without appropriate investment support, it would place additional risks on market participants and create market uncertainty due to the radical nature of the reform. This could have positive impacts on investment in new sources of flexibility (such as storage), but negative impacts on renewables ambitions, particularly in Scotland. Policies could be put in place to mitigate these risks. The impact of LMP on renewable energy development in Scotland will be highly sensitive to whether such policies are implemented effectively.
Objectives of the Scottish Government
The Scottish Government outlined key ambitions in the Draft Energy Strategy and Just Transition Plan (ESJTP 2023), amongst other strategy papers. This review was completed before the publication of the final Energy Strategy and Just Transition Plan in 2024.
The review aims to discuss how LMP could impact the Scottish Government in achieving these ambitions. They have been summarised using four broad categories most relevant to wholesale market reform:
- Support ambitions to scale up low-cost renewable energy.
- 8-11GW of offshore wind by 2030 (ambitions from draft ESJTP).
- 20GW of onshore wind by 2030 (ambitions from draft ESJTP).
- Adhere to the principles of a fair and just transition.
- Deliver affordable energy that isn’t subject to global fossil fuel price volatility.
- Enable community participation.
- Incentivise wider economic benefit including jobs, skills, supply chains and investment.
- Support accelerated decarbonisation of heat, transport and industry, including through carbon capture and hydrogen.
- Decarbonise heat and transport using renewable electricity/hydrogen.
- Scale hydrogen generation and develop carbon capture in Scotland.
- Enable a secure and flexible net zero energy system, which is not dependent on fossil fuels.
- Enable energy security through the development of own resources and energy storage.
- Invest in grid infrastructure at pace to allow for a net zero transition.
Key outcomes for wholesale market reform
Wholesale market reform will have widespread impacts on Scotland’s energy strategy, as well as wider social and economic implications. By reviewing Scottish Government strategy papers and assessing where wholesale market reform has significant impact, the authors have developed key outcomes that need to be prioritised for electricity market reform to align with Scotland’s ambitions:
- Strategic coordination of renewable development and network investment is required to ensure that renewables stay in Scotland and net zero is achieved.
- Local price signals are necessary to encourage investment in and optimise the use of flexible assets, such as batteries, and enable an efficient use of renewables.
- Mechanisms that allow electricity users to benefit from low-cost renewable generation are required.
- Benefits and costs of a green transition need to be shared fairly to consumers, communities, and businesses.
Findings
In this section we present the key findings on how LMP and its alternatives could impact Scotland’s energy transition ambitions. This is split into four broad categories:
- The scale up of low-cost renewable energy.
- The fair and just transition.
- The decarbonisation of heat, transport, and industry.
- Enabling a secure and flexible net zero energy system.
Scale up of low-cost renewable energy
LMP would create regional differences in wholesale prices across GB, which depend on local levels of generation and demand. Areas such as the south of England, where demand is higher than supply, would likely see wholesale prices rise. Areas with an oversupply of renewable generation, such as Scotland, would see wholesale prices fall. The primary purpose of LMP is to create a market that is more reflective of the cost of delivering electricity to specific locations on the grid. In doing so, this encourages the placement of generation and demand where it is most suitable and cost-effective for the energy system. The wholesale price signal seen by renewables developers in Scotland could disincentivise investment, as market revenues would decline. Modelling by Aurora (2023) and FTI Consulting (2023) suggest a general southern shift in solar generation, away from Scotland. Changes in the buildout of on- and off-shore wind are more contested due other non-price factors such as the effective on-shore wind ban in England, as well as limited off-shore site availability due to leasing rounds from the Crown Estate. Certain market arrangements could be developed to help shield generators from excessively low local wholesale prices, however this would somewhat diminish the benefit of LMP.
Additionally, LMP introduces a change to the rights of access participants have to the market. Currently, electricity generators can sell electricity on the wholesale market regardless of transmission network constraints. They have firm access rights to the market. Under LMP, generators lose their firm access to the network. As a result, they can only sell their electricity within their zone/node or when it can be transmitted to consumers. This introduces a significant risk for generators in Scotland, as there are times when more electricity is produced from wind in Scotland than can be transmitted to domestic and commercial consumers within Scotland and to the rest of the UK. National Grid has proposed to significantly upgrade the network to 2035, however some excess flows from Scotland are likely to persist even after the new transmission is built.
The new risks created by LMP, combined with additional implementation uncertainty (as a result of reforming wholesale market arrangements), could lead to increases in the cost of capital. The cost of capital reflects the cost of money (e.g. interest on debt) required to finance projects. It represents the return required for an investment to be worthwhile and increases with project risk. As renewables require major upfront investment, the cost of capital has a significant impact on investment levels and the final cost of electricity for consumers. Overall, modelling completed by Aurora (2023), FTI Consulting (2023) and AFRY (2023) shows that small increases in the cost of capital caused by introducing LMP could wipe out any benefits linked to cost savings resulting from LMP.
UK decarbonisation relies on significant renewables capacity in Scotland. As such, the introduction of LMP alone would risk Scottish renewables deployment and therefore GB decarbonisation ambitions. To mitigate this, a possible solution is to reform the renewables support scheme, referred to as Contracts for Difference, to reduce risk in low carbon electricity generation development. This solution must be explored further for possible options and feasibility. Alternatively, improved Transmission Use of System Charges (TNUoS) could provide similar locational investment signals to LMP. These charges are paid by generators and suppliers to recover the cost of installing and maintaining the transmission network. However, reformed TNUoS would lack the operational incentives for flexible assets that LMP could provide.
Fair and just transition
If LMP benefits are realised, the total cost of running the electricity system should decrease moderately as a more efficient electricity system is developed. If these benefits are not offset by increases in the cost of capital for renewables, the modelled annual net economic benefit to the cost of the electricity system lies between £0.2bn-1.6bn (AFRY, 2023; Aurora, 2023).
Due to significant existing renewables capacity, LMP could see Scottish consumers benefitting from wholesale electricity prices lower than current prices as well as prices in other regions of GB. This benefit would reduce over time, though according to one study, Scottish prices would remain as some of the lowest in Europe (FTI Consulting, 2023). As transmission network is reinforced to 2035 and more electricity generation facilities are built closer to where they are needed, prices across GB will converge.
However, initially prices would rise in some areas in GB, although not as much as they would decrease in Scotland (FTI Consulting, 2023). It is possible that some consumer groups, e.g. domestic customers, would be shielded from wholesale prices through arrangements with their electricity retail companies, or UK Government policy design. Additionally, energy suppliers may not pass savings directly to customers, as their costs may rise in other regions. As wholesale electricity prices only constitute a proportion of the domestic electricity bill, with other components including network charges and green levies, the impact of LMP on overall domestic electricity bills will depend on the proportion of the bill that wholesale prices make up at any given time.
Overall, the benefits are more likely to be seen by commercial and industrial consumers in Scotland, who are less likely to be shielded from wholesale prices. The extent to which these benefits are realised depends on when LMP is implemented. The modelling shows the earlier it is implemented, the greater the benefit, as networks are reinforced and become less constrained to 2035 and beyond. However, National Grid ESO suggests LMP will take at least four to eight years for implementation (National Grid ESO, 2022a), limiting the benefits that can be attained.
The development of employment opportunities and other wider economic benefits due to accelerated renewables development is a significant benefit for Scotland. To ensure this, continued development of renewables is necessary through supporting policy. LMP also provides a significant economic opportunity through investment in new demand and industrial sectors. Lower electricity prices could attract investment in sectors such as green hydrogen, data centres or green steel – though none of the reviewed studies directly model this. The Fraser of Allander Institute study (FAI, 2023) shows that the renewable energy sector already supported more than 42,000 jobs across the Scottish economy and generated over £10.1 billion of output in 2021. With decarbonisation seeing the decline of the Scottish oil & gas industry, renewable energy and new demand sectors could provide significant employment opportunities and economic growth.
Decarbonisation of heat, transport and industry
Overall, the modelling in reports published by Aurora (2023) and FTI Consulting (2023) suggests that even if LMP is implemented successfully, it would not significantly affect the pace of decarbonisation of the electricity system. In fact, implementation of LMP without appropriate accompanying mitigations could risk UK decarbonisation efforts through a hiatus in renewable generation investment. The main benefit of LMP is that it could reduce the cost of decarbonisation, especially in Scotland, where the price of electricity could decrease the most.
The electrification of heat and transport is a significant aspect of decarbonisation. Lower wholesale costs under LMP in Scotland can contribute to heat pump and electric vehicle (EV) uptake. This is more likely for heat pumps, as electricity cost is a larger proportion of the total lifetime cost compared to EVs. Analysis by the authors indicates that a 35% reduction in wholesale cost in Scotland would reduce the total cost of ownership of an EV (in years 1-4) by 2%, and 10% for heat pumps. Both still have significant upfront costs that would need to be addressed.
LMP could make the development of green hydrogen more attractive in Scotland. Aurora’s modelling (2023) suggests hydrogen produced in Northern Scotland could have some of the lowest costs in Europe. This is because electricity is one of the main cost components of hydrogen electrolysis. This could generate a hydrogen export economy that could also benefit the decarbonisation of other industrial processes.
Carbon capture on the other hand is not likely to benefit from LMP. The implementation of carbon capture is linked to identifying industrial sites with good transport and carbon storage opportunities.
Enable a secure and flexible net zero energy system
LMP incentivises the optimal location and operation of flexible assets. Flexible assets can shift the consumption or generation of electricity in time or location. The significant capacity of renewable generation in Scotland means that prices in the wholesale market would show significant variation. This would attract investment of flexible assets in Scotland, as operators can access higher revenues. A system with a large proportion of renewable generation requires greater capacity of flexible assets. Such assets relieve network constraints and reduce the overall requirement for generation capacity and network build. Both Aurora (2023) and FTI (2023) show a significant increase in the capacity of battery storage in Scotland due to the implementation of LMP.
Under LMP, the operation of flexible assets is more efficient. A national wholesale market sends the same price signal to all flexible assets, anywhere in the country, regardless of local constraints. This would be improved under LMP, as flexible assets would respond to wholesale price variation, which would reflect local grid requirements. A particular benefit seen is the improved use of interconnectors to other countries. Overall, this enables a cheaper, more secure power system.
Local constraint markets (LCMs) could provide alternative locational signals for flexibility in this respect. LCMs are new electricity markets designed around network constraints. They provide incentives for operators to change their generation/consumption schedules, so that limits on the network are not exceeded. LCMs could, to an extent, replicate LMP market signals for flexibility. However, they would likely create additional barriers and be more complex by creating multiple markets and signals for flexibility to respond to.
Conclusions
The conclusions are based on the authors full independent assessment of the opportunities and threats that LMP and wider electricity market reform could have on the Scottish Government’s ambitions. Based on the findings of this study, the Scottish Government should support the development of a GB-wide strategic plan for renewables and network investment. The Scottish Government should fully explore the implementation of LMP with accompanying reformed support for renewable generation, specifically Contracts for Difference, to ensure continued investment in Scotland.
On the basis of this assessment, the following conclusions are presented in order of importance.
- Scotland must prioritise and coordinate a strategic plan for renewable generation and network reinforcement with the UK Government.
Without support mechanisms for renewables that shield energy generators from LMP, there would be additional risks that disincentivise renewables development in Scotland. Delays to transmission network reinforcement would exacerbate this. Long-term locational signals to strategically locate investment is essential to achieve a low-cost net zero power system. LMP, alongside support mechanisms for renewables, could provide these signals and continue to enable renewables development in Scotland. It is essential that mechanisms such as reformed Contracts for Difference are tested for feasibility before implementation. Alternatively, improved Transmission Network Use of System charges could provide the market with similar signals that indicate the best locations to invest, although this will not improve dispatch signals in the way LMP would.
- LMP would provide the clearest dispatch signal for flexibility, delivering efficient investment in and operation of flexibility.
Maximising the use of renewables can only be done with significant electricity system flexibility. LMP can provide effective investment signals for its development in Scotland and improve operational signals to optimise its use. This would reduce whole system investment requirements in generation capacity and network, reducing bills for consumers. LCMs could be an alternative in this regard, however, could also result in more complex markets and are unlikely to fully replicate the benefits created by LMP.
- The potential benefits of LMP for consumers are greater the earlier it is introduced.
LMP would create the most significant benefit for Scottish consumers before the transmission network is reinforced to 2035, and therefore, would need to be implemented quickly to maximise benefits. The extent to which this can be achieved is limited, as National Grid assumes implementation may take 4-8 years. A well-developed plan to implement LMP is required that accounts for the creation of support mechanisms which protect renewable generation, ensuring benefits are realised.
- Careful implementation of LMP is required to address regional differences in price.
Scottish consumers benefitting from lower wholesale prices would be a clear winner of LMP. However, this is not evenly spread across the rest of GB and must be considered.
Scotland has a clear opportunity to benefit from a net zero power system by making the most of low-cost renewable energy and distributing those benefits to consumers. Proposed changes to wholesale electricity markets could improve system-wide efficiency and offer cheaper electricity in Scotland. However, it could increase risk associated with investment in Scottish renewables, increasing costs. The Scottish Government needs to engage carefully with the electricity market reform process to ensure that prospective benefits are realised, and that potential disbenefits are avoided or mitigated.
© The University of Edinburgh, 2024
Prepared by Environmental Resources Management Ltd. on behalf of ClimateXChange, The University of Edinburgh. All rights reserved.
While every effort is made to ensure the information in this report is accurate, no legal responsibility is accepted for any errors, omissions or misleading statements. The views expressed represent those of the author(s), and do not necessarily represent those of the host institutions or funders.
If you require the report in an alternative format such as a Word document, please contact info@climatexchange.org.uk or 0131 651 4783.
The national price for all generators is set by the most expensive generation selling power on the wholesale market in the period (marginal). ↑
Research completed in April 2024
DOI: http://dx.doi.org/10.7488/era/4747
Executive summary
To deliver climate change mitigation and adaptation, nature restoration and high quality food production, the Scottish Government produced their vision for agriculture, along with the next steps, to encourage sustainable and regenerative farming in Scotland. A programme of work is underway to reform agricultural payments with a greater emphasis placed on delivering environmental outcomes with a proposed structure of four payment tiers tied to a suite of potential measures that will deliver tangible outcomes.
This study identified the most suitable metrics that could be used to monitor the success of the proposed measures in the agricultural reform programme against environmental outcomes. This includes consideration of cost-effectiveness, practicalities and the skills and capabilities of those tasked with monitoring.
Findings
We found potential metrics for assessing the success of the measures for all outcomes. Most metrics can already be applied as the methods are available, whilst a small number are under development and could be applied in the near to medium term. These metrics fell into several categories:
- Emissions cannot be measured directly, so we suggest using current farm-level tools to assess GHG emissions, known as carbon audits. A field level, real time GHG emission model is in development as well as a tool for doing this for ammonia.
- Many metrics depend on direct sampling of soil or biodiversity and can’t be realistically replaced by proxies or existing data. However, well designed sampling programmes can maximise the efficiency of sampling, e.g. sampling for soil carbon, nutrients, pH and eDNA can be done at the same time.
- The outcomes associated with animal health, nutrition and breeding must be largely monitored through proxy metrics. These are relatively easy to measure and provide useful information directly to the land manager.
- A few metrics, such as pesticide usage data or area under permanent habitat, collected as part of the agricultural census, can be derived from existing data.
- Some of the metrics in development could take advantage of samples/data collected at the start of any monitoring programme (e.g. soil eDNA, acoustic monitoring) and others would come online later (e.g. LIDAR-derived hedge data).
- The measure ‘retain traditional cattle’ could not be related to the outcomes.
- Deciding on a suitable suite of metrics to assess the benefits of the Agriculture Reform Programme is only one step as there are issues related to design, sample size and data to be considered.
Recommendations
A full list of suitable metrics for each measure from the Agricultural Reform list of measures is supplied in an accompanying spreadsheet “MeasuresXMetrics.xlsx”. The spreadsheet can be filtered to look at what metrics are suitable for each measure, which outcome they relate to, whether the metric is suitable for direct assessment, if it provides additional useful information or if the metric is still in development, whether the metric is suitable against multiple outcomes and who can carry out the monitoring.
Table 1 summarises the spreadsheet by showing which metrics relate to each outcome. The final choice of which metrics to collect will depend on two main factors:
- The availability of resources to carry out any monitoring programme
- The sampling philosophy adopted; whether widespread collection of a few metrics, where data collection could be partly done by land managers, versus a programme designed to give accurate data at the national level by sampling intensely from a representative sample of locations with mainly expert-led sampling.
Combining information on who can do the monitoring and potential likely costs of expert-led monitoring, we suggest the following monitoring philosophy is appropriate:
- All enterprises to assess soil erosion and buffer strip effectiveness.
- All livestock enterprises to record growth rate, milk yields, mortality, conception rates, replacement rates, age at slaughter for sheep and cattle.
- ScotEID to require information on sires.
- All enterprises to use farm tool calculators (carbon audits) to model GHG emissions. Livestock enterprises to model ammonia emissions when a suitable tool is available. The requirement to model might be limited to enterprises above a certain size to reduce costs.
- The remaining outcomes would be best assessed using expert-led monitoring in a sample-based programme similar in philosophy to the Welsh approach. The resources available for monitoring and statistical power analysis would be key inputs into developing a sampling approach with decisions about the trade-off between number of metrics recorded versus sample size needing to be made.
Table 1. Metrics identified as worthy of adoption in future monitoring, listed by outcome – a full list of which metrics are suitable to assess each measure are shown in the spreadsheet. Metrics are divided into three categories: Suggested metric – a suitable metric for monitoring the relevant outcome(s) that can be applied now; Additional metric – a useful set of additional information or approaches; and Metric in development – analytical methods are still in development, but samples/data can be collected and archived for future analysis. Metrics suitable for use for multiple outcomes are shown in bold.
|
Outcome |
Suitable metric |
Additional metric |
Metric in development |
|---|---|---|---|
|
Reducing Soil GHG emissions |
Modelled farm emissions of CH4, CO2, N2O |
Field level, real time emission models. | |
|
Increasing soil carbon/organic matter content |
Soil carbon stock (C content and bulk density) Area under permanent vegetation or other carbon positive management |
Soil clay content |
Indicators based on soil FTIR spectroscopy |
|
Increasing resilience to weather events |
Soil carbon stock Water stable aggregates Soil bulk density and porosity Erosion monitoring |
Visual Evaluation of Soil Structure (VESS) |
Indicators based on soil FTIR spectroscopy |
|
Improving soil nutrient content |
Mineralisable nitrogen and available phosphorus |
Indicators based on soil FTIR spectroscopy | |
|
Reducing diffuse pollution |
Mineralisable nitrogen, available phosphorus and pH Soil bulk density and porosity Erosion monitoring and effectiveness of buffer strips |
Visual Evaluation of Soil Structure Detailed monitoring in SEPA catchments to include water quality (nitrate, phosphate etc.) |
Runoff evaluation using LIDAR derived fine resolution topographic data. |
|
Improving water and air quality |
Mineralisable nitrogen, available phosphorus and pH SEPA regulatory monitoring Erosion monitoring and effectiveness of buffer strips |
Detailed monitoring in SEPA catchments to include water quality (nitrate, phosphate etc.) Intensive farm-scale monitoring of ammonia emissions in livestock intensive areas |
Modelled farm emissions of ammonia |
|
Improving soil water retention and flow |
Sub-soil bulk density and porosity Water stable aggregates Erosion monitoring |
Visual Evaluation of Soil Structure | |
|
Improving soil biodiversity |
Soil surface invertebrates Earthworm functional group abundance |
Pesticide Usage Survey data |
Archive sample for eDNA |
|
Removing drivers for biodiversity loss |
Bird, pollinator and plant composition and diversity |
Farmland habitat diversity Pesticide Usage Survey data |
Archive acoustic monitoring files LIDAR derived hedge data |
|
Livestock health |
Growth rate, Milk yields, Mortality, Conception rates, Replacement rates, Age at slaughter | ||
|
Livestock nutrition |
Growth rate, Milk yields, Mortality, Conception rates, Replacement rates, Age at slaughter |
Feed analysis for digestibility/protein | |
|
Livestock genetics |
Applications to ScotEID for calf/lamb passports, with requirement for sire details to be included |
Growth rate, Milk yield, Conception rates, Age at slaughter. | |
|
Livestock methane emissions |
Modelled farm emissions of CH4, CO2, N2O | ||
|
Nutrient management |
Mineralisable nitrogen and available phosphorus Effectiveness of buffer strips Modelled farm emissions of CH4, CO2, N2O |
Modelled farm emissions of ammonia |
Glossary / Abbreviations table
|
Citizen scientist |
Usually used to denote a non-professional scientist. Can range from the public (including land managers) to highly proficient amateur scientists. |
|
FTIR |
Fourier-transformed infrared spectroscopy – an analytical technique using infra-red light to identify the chemical composition of materials. |
|
GHG |
Greenhouse gases such as CH4 methane, CO2 carbon dioxide and N2O nitrous oxide. |
|
LIDAR |
Light Detection and Ranging, is a remote sensing method that uses light in the form of a pulsed laser to measure ranges and hence vegetation structure. |
|
Measure |
An action or set of actions employed to reach the outcomes of the Vision for Agriculture. |
|
Method |
The processes followed to obtain the data required to produce metrics. |
|
Metric |
A quantifiable set of data that can be used to track, compare and assess performance or processes. |
|
RPID |
Scottish Government’s Rural Payments and Inspections Division |
Introduction
This report examines the potential metrics for assessing the environmental outcomes of measures identified in the Scottish Agricultural Reform Programme.
Policy environment
Agriculture is a major contributor to Scottish greenhouse gas (GHG) emissions; currently, it is responsible for c. 20 % of countrywide emissions (Brodie 2023). Agricultural management has also been a major driver of the declines in above- and belowground biodiversity (Walton et al. 2023) and puts significant pressure on Scottish water bodies, preventing them from reaching Good Ecological Status (Environmental Standards Scotland 2022).
Following on from the Scottish Government’s Vision for Agriculture, a new Agriculture and Rural Communities (Scotland) Bill has been passed, which will allow for a new framework for future support payments for farmers (“farmer” is used in this report to cover both farmers and crofters), including for environmental goods. This will encourage sustainable and regenerative farming practices that will help Scotland transition towards net zero, reverse the decline in biodiversity, and improve soil health and water quality.
It is anticipated that there will be a new framework for agricultural payments focused on key outcomes of high-quality food production; climate mitigation and adaptation; nature restoration; and wider rural development alongside a just transition. Greater conditionality will be key, with a transition towards shifting 50% of direct payments to climate action and funding for on-farm nature restoration and enhancement by 2025.
At present a draft list of measures (Appendix A) is being appraised by Scottish Government that covers both land-based and animal-based actions that should lead to improvements in biodiversity, climate, flooding, soil health, water quality and animal health and welfare. However, a system of monitoring and verification is needed to ensure compliance and that the measures are delivering the desired outcomes.
Aims
The aims of this project were:
- To identify potential metrics that could be used to monitor the success of the proposed measures in delivering the desired environmental outcomes (Appendix B). Those metrics that could be used in practice will have to be cost-effective, practical and within the skills and capabilities of those tasked with the monitoring.
- To take an overview across all the metrics and outcomes to refine the list of metrics to avoid duplication and maximise the usefulness of information collected.
Considerations for selecting appropriate metrics
Introduction
To determine whether any changes over time are the result of direct action through applied measures, it is important to be able to compare areas where measures have been applied with other similar areas that are not in the scheme (control sites). Without this, it is not possible to determine whether any change detected is due to the measures or to other drivers.
It is also possible that even if an improvement is not detected on sites where measures have been applied, the measures might mean that a negative change, that would otherwise have occurred, has been avoided.
A Before-After-Control-Impact (BACI) design is commonly used for monitoring the effect of environmental interventions. However, a difficulty is that areas which are originally selected as controls may join the scheme later. Also, as pointed out by Emmett et al. (2014), it can be difficult to select appropriate controls given the numerous other factors, including field contents, size, and boundary characteristics that would need to be held constant across matched pairs. Even if the areas selected as controls are not part of the current scheme, they may not be true controls as they may have benefitted from similar environmental measures under legacy schemes.
As a result of these issues, it can be difficult and costly to assess outcomes at the level of individual farms, though overall performance of measures can be assessed through an appropriate monitoring scheme.
Requirements
Effective monitoring requires an appropriate baseline for measuring outcomes against (Pakeman et al. 2020). A proper baseline gives power to any analysis, as it is detecting change against known values for indicators. For example, agricultural soil monitoring as part of scheme monitoring will need to align with the national soil monitoring programme that is in development.
Similarly, identifying an appropriate sampling design is critical. It needs to cover enterprises in different situations and localities and have the appropriate statistical power to give good evidence on the performance of each measure in at least the medium-term (i.e., to inform revisions to agricultural support schemes). Some outcomes may be detectable quickly, but others, like soil carbon, may take longer to be detectable within realistic sampling regimes (Saby et al. 2008). For other measures it may be difficult to separate the effects of the scheme from market-driven effects, such as the breeding of livestock for reduced methane production, which could be driven by the price of carbon rather than the support from any scheme (Cottle & Conington 2012, 2013).
Selecting metrics
The selection of metrics depends on several factors, including the design of any monitoring scheme, what is being monitored, for whom and for what purpose, and needs to take account of the trade-offs associated with the approach taken. These can be seen as different aspects of taking either a “broad and shallow” or a “narrow and deep” approach to data gathering for the same amount of effort. Data gathered from a “narrow and shallow” approach will be less detailed and likely less robust, whereas a “broad and deep” approach may be too costly to deploy widely.
Sample or population
Taking a sample of the population and focussing monitoring has the benefit of concentrating resources if it is understood that any sampling design has some measure of uncertainty built in. This type of approach has been adopted in monitoring programmes such as Countryside Survey (e.g., Carey et al. 2008) and the monitoring of the Welsh agri-environment scheme Environment and Rural Affairs Monitoring and Modelling Programme (ERAMMP), which focusses monitoring on 300 1 km x 1 km grid squares and assesses the impact of the scheme using information on how much land in each square is under Glastir funded management (see Section 8.1.1). The approach allows for efficient linkage between changes in different outcomes, but with the proviso that there is uncertainty and that it can only give a national-level picture.
Citizen scientist or specialist
For agriculture, options will include asking the farmer or land manager to gather information, drawing data from wider datasets, or drawing in specialists to sample and process data. There are advantages and disadvantages to asking land managers, as opposed to specialists, to carry out the monitoring. Land managers differ from citizen scientists in other monitoring, e.g., the British Trust for Ornithology’s Breeding Bird Survey, which is undertaken by volunteers with a high degree of skill at bird recognition. Expectations would have to be tempered in terms of what can be provided.
Consequently, the advantage of monitoring by the land manager is that it is effectively free, it can be repeated frequently and provides information direct to the land manager. This must be viewed against the benefits of sampling with more accuracy and precision by specialists.
It may be possible to develop hybrid monitoring strategies using the advantages of the different groups, either using land managers to take samples (e.g., soils), which are then sent away for analysis, or deploying monitoring equipment, with the specialists undertaking data analysis. Specialist data analysis is preferable from the point of view of scientific robustness, although monitoring equipment does need expert maintenance, calibration and quality control and is more costly. Alternatively, a tiered approach to monitoring could be followed, with land managers collecting some data whilst more specialised data collection is undertaken on a sample of farms.
Meaningful scales of monitoring
The appropriate scale of monitoring is inherent in what is being monitored. For plants, relatively small areas (a few square metres) tend to be monitored, whilst for butterflies and bees, the area might be a transect 100 m long and 5 m wide, and for birds, the British Trust for Ornithology uses 1 km x 1 km grid squares as the basis of their Breeding Bird Survey.
In consequence, the scale of monitoring for different aspects of the environment and biodiversity will not be the same for all outcomes. There is, therefore, some constraint on the overall approach as it is dependent on finding the most appropriate scale for each outcome.
Who is the monitoring for?
The vision for agriculture includes provision for payments that deliver to defined outcomes. If the aim is to inform management at the farm-scale or smaller, in effect using the results of monitoring in adaptive management, then there may be a benefit to a broad and shallow approach. There is also value in aligning monitoring with appropriate advice and resources for decision making. However, if the monitoring is just aimed at showing which measures are value for money, then a national level focus is more appropriate.
Understanding what is driving change
If measured changes can be linked directly to the impact of targeted funding, or with conditions for an agri-environment scheme, then this is a direct demonstration of the efficacy of the scheme.
However, a narrower set of more detailed monitoring may be better placed to understand more precisely what is driving change as a greater range of measured parameters can be used to examine the processes that lead to change. This improved knowledge might be more useful in developing future schemes and inform adaptive management. A tiered approach to monitoring may deliver the best information.
Can you monitor outcomes, or just activity?
It is possible that suitable methods to measure outcomes at the desired scale are not available or practical. Consequently, it may be that measuring actions or activity remain the only option to assess whether management is driving change in the desired direction. However, there would need to be some form of outcome monitoring at a wider scale to assess overall performance of the scheme.
Does land manager-led monitoring need supervision?
This is a contentious issue, but in other spheres such as sampling for water industry and fish farm compliance there are quality assurance assessments of ‘operator collected data’. Some are targeted based on evidence of some kind, but there is a random element to create pressure to conform.
There is a need to consider whether an inspection system is required to ensure there is pressure to maintain high standards of monitoring. Northern Ireland has decided that the best way to obtain robust data for monitoring is to employ people to do the measurement and use techniques such as GPS monitoring to check sample collection protocols are being followed (https://www.afbini.gov.uk/articles/soil-nutrient-health-scheme).
Methodology
We used an expert led rapid evidence assessment to look for different ways of assessing the success of each measure against environmental outcomes. This involved a multistep approach to developing appropriate metric recommendations to monitor the environmental outcomes of the new agricultural support system.
Step 1
For the land-based proposed measures only, we assessed each proposed measure (Appendix B) to identify which of the outcomes it was relevant to. For example, there are nine outcomes listed for In Field – Cultivated Soils, but not all outcomes are relevant for each measure. For example, the outcomes Reducing Soil Greenhouse Gas (GHG) emissions and Increasing soil carbon/organic matter content are unlikely to be affected by Efficient/Reduced use of synthetic pesticides so it would not be useful to monitor those if this was the sole measure in place.
This step was undertaken by individuals with expertise in each outcome.
Step 2
For each combination of relevant outcomes and measures, we used expert knowledge and a search of relevant literature to identify potential metrics that could be employed to assess compliance and/or the success of the measure in reaching the desired outcome (Appendix C). These were categorised in the following ways:
- Compliance or outcome-based
- Already collected under the current payment scheme, by agencies or third parties, or if novel data metrics will be required
- Practical for field-level monitoring, holding-based monitoring or for national-scale monitoring only, or unsuitable for routine monitoring.
This step was undertaken with the expertise of the research team backed up by literature searches. However, for the land-based measures, one individual was tasked with identifying appropriate metrics across all measures relevant to a particular outcome to ensure a consistency of approach. In contrast, the livestock-based measures are more holistic and required an expert to consider the actions around these in the round to identify appropriate metrics.
Step 3
The assessment in Step 2 generated a large list of metrics with associated methods that could be employed to assess the success of the scheme. A series of three workshops was used to consolidate these to ensure that where possible the same method can be employed across as many measures as possible for simplicity and to help in scaling up from individual measures to the success of the whole scheme. This stage delivered a shortlist of metrics that could be used to assess the success of the measures in delivering the desired outcomes, i.e., cost-effective, practical and within the skills and capabilities of those tasked with implementing the metric(s).
Step 4
This step focussed on identifying data collection approaches for consideration, as well as considering requirements for establishing an initial baseline and for future data collection to assess both compliance/activity and outcomes. Data collected could be integrated into existing data sets, such as the National Soil Inventory of Scotland, to give a longer perspective of change.
Potential metrics for each outcome
The outputs from Steps 1 and 2 are presented in Appendices B and C but are summarised below. Step 3 identified a set of metrics that could be employed in monitoring outcomes. This section identifies those metrics that would provide practical and cost-effective information. Potential metrics are categorised into three levels:
- Suitable metric – a suitable and available metric for monitoring the relevant outcome(s).
- Additional metric – a useful set of additional information or approach.
- Metric in development – analytical methods are still in development, but samples/data can be collected for future analysis.
Reducing soil greenhouse gas (GHG) emissions
The outcome
Greenhouse gas emissions from agriculture are a significant part of the national total. Reducing these emissions is a key goal of the Agricultural Reform Programme and the Climate Change Plan.
Considerations with a metric
Current methods required for direct measurement of GHG fluxes are not suitable for wide-scale use as they are dependent on relatively expensive equipment and a high degree of specialist knowledge to run the equipment.
We suggest that instead of this a modelling approach, based on existing or in development farm/field GHG calculators, is used that would estimate CO2, N2O and CH4 emissions. These are also known as Carbon Audits and are currently funded as part of the Preparing for Sustainable Farming initiative. However, several issues would need considering:
- There are several modelling tools on the market (see section “Reducing Soil Greenhouse Gas (GHG) emissions” in the Appendix), so an updated review (see Leinonen et al. 2019) of their capabilities would be needed to ensure that only suitable products were used, and to ensure consistency of outputs.
- Assistance may be needed, and hence need paying for, in setting up the calculators in the first instance, as in the Carbon Audits in the Preparing for Sustainable Farming initiative.
- Outputs from the calculator depend on the quality of the primary data gathered, which means data quality checks may be a requirement.
- Feed and forage quality might be useful information to feed into the calculators – see section below on Animal health and nutrition.
Land managers will benefit from these whole farm or field-level calculators with the potential to identify cost reductions or increases in productivity through improved forage and manure management. This could be supported by the soil organic matter and nutrient data collected.
Suggested metrics
Suitable metric: Modelled farm emissions of CH4, CO2, N2O
Metric in development: Modelled gas fluxes in real time at the field scale.
Increasing soil carbon/organic matter content
The outcome
Increasing the levels of soil carbon through regenerative agriculture can make agricultural land a sink for carbon and facilitate the journey to net zero.
Issues with a metric
Soil organic carbon can be routinely measured. There are different laboratory methods available, all of which work well, but a standardised approach would need to be selected for any scheme. Dry combustion (Dumas method) is widespread in its application and thought of as the best chemical method for soil carbon determination (Chatterjee et al. 2009). In addition, some consideration needs to be given to dealing with soil samples from calcareous soils where inorganic carbon levels are high (mainly carbonates), which though rare do include soils like machair soils. Additionally, by linking soil carbon to clay content (measured when characterising soil texture) a measure of the land parcel’s status regarding storing carbon is produced. Thresholds of 13:1, 10:1, and 8:1 clay to soil organic carbon could potentially be applied to arable, arable ley, and woodland systems (Prout et al., 2022).
Laboratory measurement is straightforward, but to calculate stocks, there also needs to be a measurement of soil bulk density (total dry mass per unit volume). Consideration of sampling depth(s) is important as some changes, such as a switch to deeper rooting crops may increase subsoil carbon, while changes in soil tillage might affect the vertical distribution of soil carbon. A standardised sampling protocol needs to take this into account. The approach being taken in Northern Ireland is informative. Every farm and every field are being sampled for carbon and nutrients and soil testing is a precondition of eligibility for environmental payments. Soil carbon stocks are large and are heterogeneously distributed, meaning that quantifying changes over short time periods is seldom possible. For instance, the proposal for a directive on Soil Monitoring and Resilience (Soil Monitoring Law) will require samples to be taken every five years. However, to ensure agronomic management changes will deliver and to identify which ones deliver, actions such as the employment of minimum tillage, use of winter cover crops, inputs of organic wastes and increases in permanent vegetation cover (woodland, hedges, grassland) need to be recorded at the field level alongside actions that will reduce soil carbon such as the removal of permanent vegetation cover and ploughing of grasslands.
Further considerations in developing this sampling include:
• Sampling to be carried out by land manager or by experts. There is a trade-off between cost and reliability but given the range of other soil metrics that need to be sampled to assess other outcomes, we suggest that soil sampling is expert led.
• Should samples from the same field be bulked to reduce costs or should they be analysed separately (expensive) to provide measures of error/heterogeneity and the possibility to statistically assess change at the field level rather than at the farm or national level? For instance, the Soil Nutrient Health Scheme in Northern Ireland analyses a bulked sample of 25 cores but this can miss coldspots and hotspots of nutrients (Hayes et al. 2023). The Welsh Soil Project splits each field into three before the W-shaped sampling is done. There is a direct trade-off between the number of fields that can be sampled and the number of samples per field. We suggest that the most useful information comes from sampling as many fields as possible, so a bulked sample per field would be an appropriate sample to measure. Some within field stratification could be done if there was a clear internal boundary, e.g., between dry slope and wetter flat ground.
• Collecting additional information such as the current and past management and cropping at field level would enhance interpretation.
• Several companies already operate soil testing services. In a competitive market, there is a question regarding how consistency is guaranteed and whether a consistency check should be carried out by a third party. United Kingdom Accreditation Service (UKAS) accreditation would be a minimum standard for participating laboratories.
• Sampling of enclosed land with a single habitat per field is straightforward. However, consideration needs to be given on how to sample from unenclosed land which may contain multiple habitats and a wide range of soil types.
Suggested metrics
- Suitable metric: Soil carbon stock, Area under permanent vegetation or other carbon positive management
- Additional metrics: Soil clay content
- Metric in development: Indicators based on soil FTIR spectroscopy.
Increasing resilience to weather events
The outcome
Soils are vulnerable to runoff and erosion after heavy rain and to drought. Improving the resilience of soils will safeguard their continuing productivity, reduce their susceptibility to the runoff of water and nutrients, and subsequent downstream impacts on flooding and water quality.
Issues with a metric
Resilience is a synthetic metric and can be best seen as a multi-dimensional concept. In addition, the thresholds for resilience will depend on soil type. Regarding improving soil resilience, mineral soils that have greater soil carbon concentrations tend to retain water and have better soil structure, allowing water flow through them rather than across them. Soils that show water percolating (high permeability) rather than flow across the surface are at lesser risk of runoff and erosion, whereas compacted soils with lesser porosity and greater bulk densities are much more vulnerable to weather events. Compacted soils also restrict water availability and nutrient dynamics impacting crop growth. The presence of water stable aggregates also helps prevent water and wind breaking down the soil and hence lower the risk of erosion. These indicators are covered elsewhere in this report (see sections Increasing soil carbon/organic matter content, Improving soil nutrient content and Reducing diffuse pollution) and hence not covered here in detail.
Suggested metrics
- Suitable metric: Soil carbon stock, Water stable aggregates, Soil bulk density and porosity, Erosion monitoring
- Additional metric: Visual Evaluation of Soil Structure (VESS)
- Metric in development: Indicators based on soil FTIR spectroscopy
Improving soil nutrient content
The outcome
Maintaining soil nutrient supply to ensure high levels of productivity is important for efficient farming. However, an oversupply of nutrients can lead to losses as emissions of ammonia and nitrous oxide, or as increased nutrient loadings of freshwaters. While Scotland has no widespread and high impact nutrient issues such as Lough Neagh in Northern Ireland, there are localised issues that have been identified through designations such as Nitrate Vulnerable Zones that might be more cost effective/appropriate to measure.
Issues with a metric
The total concentrations of the various soil nutrients are relatively straightforward to sample and analyse and could be combined with sampling for soil carbon. Analysis methods depend on whether a restricted set of macro-nutrients is the focus, or whether micronutrients and heavy metals are also of interest.
Total nutrient levels work well for some nutrients, but there may be an interest in looking at available nutrients where there is an extraction/exchange step to assess what is available to plants and leaching processes. There are standard laboratory methods for this, particularly for nutrients such as potassium and calcium, but phosphate extraction methods have been developed to be specific for different soil acidity levels (pH).
Unfortunately, neither total nutrient levels nor extractable/exchangeable levels work well for nitrogen, as nitrate is very quickly absorbed by roots, leached, or transformed (e.g., to nitrous oxide). Here, an incubation step is needed, meaning that getting a good understanding of available nitrogen requires sampling, dividing the sample, extracting immediately from one half of the sample, incubating the other half for a set time under standard conditions, and then calculating the release of nitrogen by the soil.
There is an immediate trade-off with adding fertiliser to raise nutrient levels, as excess nutrients can be leached and end up in the aquatic environment, or excess nitrogen can be lost as N2O. Hence, a balance must be reached where inputs meet plant requirements, while also fostering accumulation of soil organic matter to maximise intrinsic soil nutrient cycling. Current agronomic practice is to apply inorganic fertiliser at rates based on an understanding of plant uptake, but application rates often exceed those which are required as soil-specific variability in supply of nutrients from soil organic matter is usually not accounted for. Tools such as PLANET (Planning Land Applications of Nutrients for Efficiency and the environmenT), a nutrient management decision support tool for farmers and advisers to carry out field level nutrient planning and for demonstrating compliance with the Nitrate Vulnerable Zone (NVZ) rules, could be useful in this regard.
Maintaining optimal pH for crop growth also appears to reduce soil greenhouse gas emissions (Wang et al., 2021; Zhang et al, 2022), but there is a degree of context specificity, and this may not be appropriate for soils of high organic matter content.
Suggested metrics
- Suitable metric: Mineralisable N and available P, Soil pH
- Metric in development: Indicators based on soil FTIR spectroscopy
Reducing diffuse pollution
The outcome
Diffuse pollution has severe impacts on freshwater biodiversity and water quality with risks that climate change (low and high flow extreme increases, warmer temperatures) exacerbates effects such that moderate nutrient loading improvements may not lead to improved water quality.
Issues with a metric
Monitoring of diffuse pollution operates across scales, from the field scale, to highlight local improvements, to the catchment scale to understand cumulative effects and impacts (Bieroza et al. 2021). Field-scale predictions and observations of runoff prevalence and pathways, monitoring of soil compaction (measured by soil porosity) and soil chemistry (particularly nitrogen and phosphorus levels) provides an idea of risk, as does monitoring of in-field erosion (Hayes et al. 2023). Management at the edge of fields, e.g., buffer strips are designed to reduce diffuse pollution, but for best effectiveness, their location and design need to be targeted to ensure that they effectively treat converging runoff pathways and critical delivery points to the channel network (Stutter et al. 2021). Similarly, nutrient losses from field drains also need to be monitored as these can only be mitigated by specially designed and strategically located buffer strips.
Water sampling provides integrative evidence of the effectiveness of measures as it reflects management upstream in the catchment. Whilst monitoring of chemistry, biodiversity (invertebrates) and sediment will provide an understanding of upstream issues, it may be difficult to attribute impacts to diffuse or point source pollution (Glendell et al. 2019).
Water quality is closely linked with soil nutrient status, particularly nitrogen and phosphorus status of the soils, so relevant information can be acquired by soil sampling. However, there is also the need to monitor runoff generation and pathways, soil erosion, sediment flows and drainage waters. Monitoring is especially useful during extreme events, including high and low flows. An understanding of pollutant concentration changes over differing flow stages (e.g., inter-storm sampling) brings a wealth of information beneficial to management about source and transport behaviours at field to catchment scales.
We suggest that land managers are given responsibility for assessing erosion and water flow pathways and the subsequent monitoring of erosion and sediment flows, and potentially taking water samples of drainage waters for analysis by specialist laboratories. This would mean farmers assessing whether individual buffer strips were effective at preventing water flows, or whether their design allowed for flow around their edges by visiting them during periods of heavy rain. Future erosion pathways could be identified using fine-scale elevation data from LIDAR to model the flow of water across the surface of land (e.g. Reaney et al. 2019. Aquatic biodiversity requires specialist surveyors and could be done at the same time as the above-ground biodiversity assessment (Section 6.9).
SEPA currently collect a wide range of data from multiple sites. We suggest that it would be of benefit to use the current SEPA monitoring of agricultural catchments as the basis for studies linking agricultural management and water quality, by ensuring studies are joined up. This may mean enhancing the range and/or frequency of measures taken. A nested design could be followed, whereby field- and farm-scale sampling are nested within these catchments representing different land use typologies in Scotland, with water quality being monitored at the catchment outlet. The detailed knowledge from these catchments could be linked to farm-level data to make national estimates of benefits.
Farm-level models for looking at nutrient inputs and losses have been developed for England and Wales, e.g., FARMSCOPER. However, the extent to which it can be applied to the soils, climate and farming systems in Scotland has not been tested and this would need carrying out before it could be recommended as a metric for use in assessing the efficacy of measures.
Suggested metrics
- Suitable metric: Mineralisable nitrogen, available phosphorus and pH, Soil bulk density and porosity, Erosion monitoring and effectiveness of buffer strips (including other enhancements e.g., wetlands, wet woodland, sediment traps)
- Additional metric: Visual Evaluation of Soil Structure (VESS), Detailed monitoring in representative SEPA and other research catchments for process-based understanding on management impacts
- Metric in development: Runoff evaluation using LIDAR derived fine resolution topographic data
Improving water and air quality
The outcome
Water quality is tightly linked to freshwater biodiversity. However, it also has implications for the cost of water treatment downstream. Air pollution, particularly of ammonia, can also severely impact local biodiversity.
Issues with a metric
There can be a disconnect between actions at the field scale to reduce nutrient loss and water quality as actions can be poorly sited, poorly implemented and miss important routes of pollutant movement. However, there is clear evidence that reduction in soil nutrient status is the most likely route to deliver improvements in water quality, so monitoring for water quality is intrinsically linked to monitoring of soil nutrient status (Hayes et al. 2023).
High-resolution water quality monitoring that would represent the temporal and spatial variability is expensive and the movement of water in catchments may make linking it to the actions of individual farms problematic. Consequently, we suggest a combination of field/farm-level monitoring of soil nutrient status (i.e., soil organic matter, plant available (mineralisable) N, biologically available P and pH) and detailed monitoring of several representative catchment outlets to improve the understanding of processes. These could be based around SEPA’s existing catchment observation platforms, with additional investment to maximise the robustness of collected evidence.
Further action to reduce point source pollution, such as slurry pit overflow, farmyards and septic tanks, should not be overlooked (Harrison et al. 2019). Monitoring of this would be in the form of capital spend. Best practice should be followed for digestate and slurry application to land.
Currently available sensors for monitoring ammonia emissions tend to be expensive, require technical expertise and are sensitive to meteorological conditions and other atmospheric gases. Lower cost passive samplers, which could be deployed by non-specialists are less accurate, have lower temporal resolution, and require laboratory analysis (Insausti et al., 2020). A similar approach to that proposed for water quality could be implemented, with intensive monitoring of key areas with intensive livestock production systems, coupled with national scale monitoring utilising the National Ammonia Monitoring Network which monitors atmospheric ammonia concentrations monthly. A farm-level calculator for ammonia emissions is in development as part of the Scottish Government’s Strategic Research Programme. This would be the most cost-effective way forward for wide deployment of monitoring.
Suggested metrics
- Suitable metric: Mineralisable nitrogen, available P and pH, Soil bulk density and porosity, Erosion monitoring and effectiveness of buffer strips
- Additional metric: Intensive farm-scale monitoring of ammonia emissions in livestock intensive areas, Visual Evaluation of Soil Structure (VESS), Detailed monitoring in SEPA catchments for process-based understanding on management impacts
- Metric in development: Modelled farm emissions of ammonia
Improving soil water retention and flow
The outcome
Soil water retention is important in reducing soil erosion and diffuse pollution. If water flows through the soil it is slowed, reducing flood peaks, and there is greater interaction between the soil and water reducing the risk of nutrient loss. In contrast, water flowing across the surface of soils leads to erosion and nutrient runoff.
Issues with a metric
There are several detailed methods available to understand water retention and flow through soils, but they are not appropriate for wide-scale monitoring, apart from their potential use in the detailed monitoring of test catchments. These include detailed measures of soil texture, as well as laboratory measures of hydraulic conductivity. Direct measures of soil compaction with penetrometers suffer from variability due to soil water content, stoniness of the soil and differences between manufacturers. They are not suitable for wide-scale monitoring.
However, a set of straightforward measures are available to assess how soil water behaves. As part of the sampling of soil for soil carbon measurements, bulk density is measured to calculate carbon stocks from carbon concentrations. However, topsoil bulk density can vary seasonally and with respect to management. Subsoil bulk density is an indicator in the draft EU soil monitoring and resilience law and provides a more consistent measure of how the soil is behaving. This is a key parameter for understanding the effect of management on this outcome. However, the additional effort of also recording specific gravity of the soil will allow the calculation of soil porosity, another key parameter that is important for assessing soil water retention.
The Visual Evaluation of Soil Structure (VESS) is a qualitative metric that could also be used to supplement other measures and provide land managers with direct information at the field level on the degree of soil compaction, especially if this included both topsoil and subsoil. For quantitative measures of soil structure, the measurement of Water stable aggregates (WSA) should be considered and removes the potential for subjectivity.
Suggested metric
- Suitable metric: Sub-soil bulk density and porosity, Water stable aggregates, Erosion monitoring
- Additional metric: Visual Evaluation of Soil Structure (VESS)
Improving soil biodiversity
The outcome
Maintaining a healthy soil ecosystem is critical to the regulation of key processes, as soil organisms are critical to the cycling of nutrients and to plant growth. For instance, soil animals like earthworms are highly important to water movement in soils.
Issues with a metric
Soil biodiversity, whilst a key soil health indicator (Neilson et al. 2021), is unlikely to be practically assessed by the land manager. Identification of surface-dwelling invertebrates, such as beetles and earthworms, requires specialist taxonomic skills; even for earthworms a total count does not work as all functional groups need to be present for good soil health. Existing data is not available for surface dwelling invertebrates, but data collection methods with pitfall traps are standardised, for example by the Environmental Change Network. However, these methods require at least two visits, so may not be cost-effective. Previous earthworm surveys have been carried out (Boag et al. 1997, Carpenter et al. 2012), we suggest that methodologies should be kept consistent.
Molecular methods have been employed for bacteria, fungi and nematodes. However, methods to characterise complete soil biodiversity using eDNA (environmental DNA) are now emerging. As is typical with emerging technologies, there are issues surrounding data interpretation, thresholds and developing and/or defining baseline comparators. It is, perhaps, too early to suggest using this as a monitoring method, as the science relating molecular data to improvements in soil health is in its infancy. However, as soil sampling is likely to be used to monitor other outcomes, samples could be taken and archived for future use as a baseline to assess change.
Pesticide usage could be a proxy for the pressure on biodiversity, and hence pesticide usage data would be a useful addition to direct monitoring. It is already collected in Scotland, but refining the data to consider impacts on soil organisms and the different application rates would be necessary.
Further consideration needs to be given to:
- Collecting contextual information such as the current and previous crops.
- Whether the optimum times for sampling in spring and autumn coincide with the optimum times for sampling soil carbon and nutrients.
Suggested metrics
- Suitable metric: Surface dwelling invertebrates and earthworm functional group abundance
- Additional metric: Pesticide usage data
- Metric in development: eDNA samples archived as interpretation needs to improve
Removing drivers for biodiversity loss
The outcome
As much of Scotland is affected by agriculture, sensitive agricultural management is important to delivering the goals of the Scottish Biodiversity Strategy.
Issues with a metric
Biodiversity is intrinsically multi-dimensional, but typical agri-environmental monitoring targets habitat diversity, birds, pollinators and plants, as they give information at different scales.
In most schemes, biodiversity monitoring is done by specialists, as it is the status of priority species that has been the driver for the development of the scheme. However, that is not practical in terms of cost at the farm level, so a choice must be made between:
- Land manager-led monitoring aided by tools such as report cards and identification guides. Bird surveys could allow different levels of precision from individual species to groups (e.g., finches). Similarly, pollinator surveys could record at the level of group (bumblebee, honeybee, butterfly, hoverfly) or plant surveys, by numbers of different types of flower (e.g., daisy, pea types) in a set area. Alternatively, there is the possibility of sub-contracting to specialists if grant payments included money for monitoring. Land managers setting out acoustic recording devices also fits into this space. The resulting files could be uploaded to a central organisation responsible for analysis. The methodologies for data analysis are still in development, but sound files could be archived for later analysis when the methodologies have matured to deal with high levels of false positive identifications. The biodiversity audit as part of the whole farm plan also falls into this category.
- Specialist surveys on samples of farms with the sampling design considering the implementation of measures (Pakeman et al. 2020) or being large enough to assess change for most measures, however, they are distributed across the landscape (e.g., the Welsh approach to monitoring Glastir).
There is a clear trade-off here between broad and shallow versus narrow and deep approaches. To enable adaptive management at the farm level, then land manager-led monitoring is important, but there is the risk that the measures deliver higher numbers of generalist species, do not benefit species that are a conservation priority, but the data is incapable of showing this. It may be that a hybrid approach is necessary, so that field/farm-level data is complemented by detailed measures on a sample of land holdings. However, sample sizes need to be sufficient to confidently assess change. Previous monitoring studies, e.g., Perry et al. (2003), could be used to identify appropriate levels of sampling needed.
Currently collected biodiversity data is not appropriate for agri-environment monitoring for a range of reasons, mainly due to mismatches in scale between land holdings and the specific sampling method used. In the case of breeding bird data, it has been used as a measure of general farmland diversity against which the performance of in-scheme farms has been judged.
Proxies for habitat diversity currently collected by RPID would be useful data, but it only characterises area and has no measure of quality associated. Alternatives include using remote sensing data (e.g., habitat maps or LIDAR derived information on hedgerow extent and conditions) that provides information on land cover and structure, but these are only proxies for biodiversity.
Finally, pesticide usage is a clear driver of biodiversity loss. Usage statistics are already collected using a sampling approach to assess a Scotland-level picture. However, the diversity of chemicals applied, and their different application rates would require methodological developments to combine their usage into meaningful statistics.
Suggested metrics
- Suitable metric: Bird, pollinator and plant composition and diversity
- Additional metric: Farmland habitat diversity, pesticide usage survey data
- Metric in development: Acoustic diversity, LIDAR derived hedge data
Improving animal nutrition
The outcome
Improving animal nutrition will reduce the time taken to deliver animals to market. This reduces lifetime emissions especially of methane.
Issues with a metric
Improving livestock nutrition leads to increased animal performance and reduced methane, nitrous oxide and ammonia emissions. Monitoring of nutrition can be undertaken through laboratory analysis of feedstuffs. The key analyses are forage digestibility – which can easily be undertaken by many feed companies – and dietary crude protein. There is also an important trade-off already mentioned between optimising nutrition and the increased fertiliser use, leading to greenhouse gas emissions and/or pollution of water courses. However, these are very much business-related metrics, and their collection may not be informative as a means of national monitoring, particularly as silage quality varies between fields, time of year and across years. The need for its collection as part of a national monitoring scheme is, therefore, debateable.
Instead, we suggest that simple measures of animal performance are collected and form part of routine monitoring of flock/herd status. These reflect actual performance rather than inputs into the system and are easier to record.
Suggested metrics
- Suitable metrics: Growth rates, Milk yields (Dairy cattle only), Mortality, Conception rates, Replacement rates, Age at slaughter
- Additional metric: Feed analysis for digestibility/protein
Improving animal breeding
The outcome
Focusing on animal breeding can improve the productivity of farming systems and, also, increase the quality of products like meat and milk. In terms of reducing methane production, breeding can directly reduce emissions, but also quicker growing animals will release less over their lifetimes.
Issues with a metric
Selective breeding for improved productivity, improved efficiency or reduced methane emissions could drive permanent and cumulative improvement in performance and/or reductions in methane emissions. Monitoring of selective cattle breeding for specific traits could be undertaken through applications for calf passports to ScotEID, but this would rely upon sire details being recorded on passports (which is currently not mandatory) and on the sire’s genetic potential for selected traits being known.
Proxy measures such as growth rates, milk production, conception rates and days to slaughter could also be used to monitor improvements over longer time periods but could be confounded with improvements in nutrition and health.
Suggested metrics
- Suitable metric: Sire details included on applications to ScotEID for calf/lamb passports
- Additional metric: Growth rates, Milk production, Conception rates, Age at slaughter
Improving animal health
The outcome
Improved animal health has a direct benefit to animal welfare. However, it also reduces losses during the production process, improving productivity and reducing methane emissions on a lifetime basis.
Issues with a metric
Several endemic (and exotic) diseases and syndromes can impact on the production efficiency and associated GHG emissions of farmed livestock. Some diseases have a direct impact on individual animals and metrics such as growth rates, reproductive success, and replacement rates. Others have a more indirect impact at herd/flock and national level, through how diseased animals are managed following diagnosis. Data and metrics on the prevalence of key priority diseases and health conditions at a national level are currently not collected, but would be invaluable, if logistically challenging. Eradication may be feasible for some diseases, e.g., Bovine Viral Diarrhoea (BVD), but requires the relevant tools, e.g., vaccines, and diagnostics to be available, in addition to coordination and buy-in across the industry.
The most straightforward was to assess animal health would be to collect a common set of proxy measures, e.g., growth rates, age at slaughter, conception rates, replacement rates and mortality rates will be the most feasible approach to measuring progress on animal health. This approach could also be applied to animal breeding and nutrition.
Recording all these metrics would be useful to both national-level monitoring of performance and for the land manager’s care for their livestock. This could also include records of veterinary medicines used to gauge movement towards sustainable prescribing, though this complex topic (Humphry et al. 2021) is outwith the scope of this report.
Suggested metrics
- Suitable metrics: Growth rate, Milk yields (Dairy cattle only), Mortality, Conception rates, Replacement rates, age at slaughter
Methane suppression
The outcome
Methane is a greenhouse gas with much higher global warming potential than carbon dioxide (methane from non-fossil fuel sources has a global warming potential of 27 times that of C02 with a 100-year time horizon, IPCC 2021). Enteric methane is released by ruminants such as cattle and sheep as part of the natural digestion of plant material by their associated microbiota. Methane is a significant part of agricultural emissions and so reducing it is key to reaching net zero emissions.
Issues with a metric
Selective breeding for reduced enteric methane emissions/increased animal efficiency (section 6.11) is a long-term strategy. In the short term, feed supplements designed to suppress enteric methane production could be used to drive down emissions. Sexed semen could be used to optimise herd dynamics by reducing numbers of male dairy calves and increasing male beef and dairy-beef calves. Direct measurement of methane emissions depends upon specialised equipment and is therefore not practical at the herd or flock level.
Two potential options are available. Firstly, to monitor the usage of methane-reducing feed supplements and calculate emission reductions based on their reduction factors. However, appropriate reduction factors for all feed products may not be available for all systems. The other option is to use current carbon footprinting tools (e.g., Agrecalc, Cool Farm Tool), but these need a subscription, may need the help of a consultant to set up and would benefit from information on forage quality and the impacts of feed supplements (so in effect replacing the need for providing information separately on feed supplements). The use of a standard tool across herds/flocks would allow for comparison.
Suggested metrics
- Suitable metric: Modelled farm emissions of CH4, CO2, N2O
Nutrient management
The outcome
Poor nutrient management can lead to the emissions of nitrous oxide, methane and ammonia. It also runs the risk of point source and diffuse pollution into watercourses.
Issues with a metric
Organic manures help recycle nutrients and build soil organic matter. However, there is the potential for them to be a source of ammonia, methane and nitrous oxide, as well as nutrient runoff in water courses. Much can be done to alleviate this, with well-designed and covered manure stores as well as appropriate application techniques. Gaseous emissions are difficult to monitor directly, so these would have to be modelled using a farm calculator. Impacts on soil nutrients and water quality are dealt with in previous sections so a separate metric for nutrient management is not necessary.
Suggested metrics
- Suitable metric: Modelled farm emissions of CH4, CO2, N2O, Mineralisable nitrogen and available phosphorus, Effectiveness of buffer strips
- Metric in development: Modelled farm emissions of ammonia
Coordinated metric collection
This section examines opportunities to synthesise across the required outcomes to minimise the number of metrics to be collected.
Why is this important?
Any monitoring must be as cost-effective as possible. Consequently, during the design phase decisions should be focussed on making the recording of metrics as straightforward as possible and to build efficiency into any monitoring programme, for example, by sampling multiple metrics on the same visit.
Greenhouse gas emissions
Gas emissions cannot be realistically measured directly. Using current farm-level tools to assess GHG emissions will deliver against multiple outcomes [Reducing Soil Greenhouse Gas (GHG) emissions, Livestock emissions, Nutrient management]. In addition, a tool for estimating ammonia emissions [Improving water and air quality] is in development, as is a field-level, real time emission model. These will further enhance capability in this area.
Coordinated sampling strategies
Many metrics depend on the direct sampling of soil or biodiversity and can’t be realistically replaced by proxies or existing data. However, well designed sampling programmes can maximise the efficiency of sampling, e.g., sampling for soil carbon, nutrients, pH and eDNA can be done at the same time. Even if this were not possible, sampling of soil nutrients, particularly mineralisable nitrogen and available phosphorus, would deliver against multiple outcomes [Improving soil nutrient content, Reducing diffuse pollution, Improving water and air quality, Nutrient management]. Similarly, monitoring soil bulk density is important for multiple outcomes [Increasing soil carbon/organic matter content, Improving soil water retention and flow], as is Water stable aggregates.
Soil monitoring
A range of soil monitoring is already being carried out for different purposes. There is a need to consider how future monitoring could supplement or replace existing work in this area, including:
- Scottish Government’s National Test Programme’s includes soil carbon measurement in Preparing for Sustainable Farming (PSF).
- The Agriculture and Horticulture Development Board Scorecard for soil health which includes soil structure (using VESS Visual Evaluation of Soil Structure), pH, extractable nutrients (phosphorus, potassium and magnesium), earthworms, soil organic matter.
- Linking Environment And Farming (LEAF).
- Red Tractor.
- Soil Association.
Livestock
The outcomes associated with animal health, nutrition and breeding must be largely monitored through proxy metrics, but these are relatively easy to measure and provide useful information direct to the land manager. However, it would be difficult to disentangle the differing contributions of nutrition, health and breeding on the overall performance of the flock/herd. At present, the separate contributions of improving animal nutrition, improving animal health and improving the genetics of the flock/herd are not easily separated but offer three routes for livestock managers to improve performance and consequently reduce emissions, one or more of which can be followed.
National level data
A few metrics can be based on existing data such as data collected as part of the agricultural census or can be derived from existing data such as satellite habitat maps. These are useful additional data, but do not provide the best metrics to assess the success of outcomes. They include: Area under permanent vegetation or other carbon positive management, Detailed monitoring in SEPA catchments to include water quality (nitrate, phosphate etc.), SEPA regulatory monitoring, Pesticide Usage Survey data, Farmland habitat diversity. They can be identified by filtering column I in the terrestrial sheet of MeasuresXMetrics.xlsx file.
Metrics currently in development
There are a range of metrics that are in development, some of which could take advantage of samples/data collected at the start of any monitoring programme (e.g., soil eDNA, acoustic monitoring) but others would come online later (e.g., LIDAR derived hedge data).
Cost-effective data acquisition strategies
Where this report recommends farmer-led metric recording, then this would provide a whole population value that can be followed through time. However, where only a proportion of the population of farms/fields can be sampled there has to be a statistically sound design adopted. This would include a comparison between areas where measures have been applied with other similar areas that are not in the scheme (control sites). A Before-After-Control-Impact (BACI) design is commonly used for monitoring the effect of environmental interventions. One issue to be addressed is that areas which are originally selected as controls may join the scheme later, so starting with a larger control population may guard against this.
An example – Wales
In Wales, the Glastir Monitoring and Evaluation Programme (GMEP) sample consisted of a stratified random sample 150 “Wider Wales” 1 km squares and 150 targeted at priority areas for the agri-environment scheme. It should be noted, however, that the “Wider Wales” squares do include land which is in the scheme, and that even the targeted 1 km squares contain differing amounts of land where specific management options have been applied. As it was found that the “Wider Wales” squares had considerable coverage of the scheme, in the more recent ERAMMP National Field Survey the aim has been to capture as much in-scheme and counterfactual land as possible within the full set of 300 squares.
To allow sampling effort to be spread across years and provide both temporal and spatial coverage, a rolling monitoring programme was followed by GMEP, in which sites are revisited, for example, every four or five years but different sites are sampled in years two and three. This allows better spatial coverage than if each site was revisited every year, while at the same time providing a more powerful estimate of change over say a five-year period, than not revisiting sites at all. The GMEP scheme uses a four-year rolling monitoring programme. Countryside Survey is also now following a rolling programme. Power analysis for the GMEP scheme (Emmett et al., 2014) suggested that across a variety of metrics, around 45 squares per year was the minimum number that need to be monitored before losing significant power to detect change over a period of 8 years (two cycles of the rolling programme).
Other considerations
Soil nutrients and soil carbon would be most appropriately measured at the scale of fields within farms, as this is the level at which relevant measures are applied. On the other hand, surveys of birds and pollinators, which are mobile over a larger area, might be more appropriately recorded for parcels of land, such as 1 km squares, although it is unlikely that the same measures will have been applied consistently across a whole 1 km square. To provide a common spatial unit across different metrics, the GMEP survey used 1 km squares, but, as it is not possible to sample vegetation and soils over the entire square, five randomly placed plots in each square were used for vegetation monitoring and soil samples were taken from the same plots. Vegetation was also recorded in other plot types, for example, along boundaries and field margins.
If fields rather than squares are to be used for soil monitoring, a representative sample for a particular field or part of a larger field can be obtained by bulking individual cores. For example, in the Soil Nutrient Health Scheme in Northern Ireland samplers follow a ‘W’ shaped track and take 25 cores. This should give a good estimate of the mean for an individual field but unless replicate cores are analysed individually it does not provide an estimate of the variability within the field. As a result, it is not possible to determine whether a change in a particular field between two sampling occasions is statistically significant. Under the Scottish Government’s National Test Programme 20% of arable and improved grassland can claim funding for soil testing each year. If this scheme is continued, it could mean complete coverage of all arable and improved grassland fields after five years. The recommendation of Scotland’s Farm Advisory Service (FAS) is that larger fields should be divided into 4 ha units, potentially with the help of the 1:25000 soil map. This approach might provide sufficient replicate samples across a farm as a whole to allow a change to be detected on a specific farm, although it should be noted that unless a suitable control is available it may not be possible to attribute any change to particular measures and that soil carbon changes in response to measures might take longer than five years to be detectable.
A note on data
Monitoring across a range of outcomes and metrics will generate a considerable volume of data. This will require a significant investment in design and development of the databases and in the staff required for data curation.
Alongside the technical aspects of database curation and management, consideration should be given to who owns the data – whether the land manager as it concerns their land holding or the taxpayer as they paid for it, who has access to it? – a narrow access regime provides increased security, especially around GDPR, but wider access allows for a broader range of analyses to be carried out. Furthermore, an overall data controller/owner would likely need to be appointed to comply with GDPR. It should be possible to develop data frameworks, where analysis without direct access to locations is possible (similar to medical data where analysis is separated from any data identifying subjects) and comply with Freedom of Information requests. Arguably, data should follow FAIR data principles and be open access as it has been funded from the public purse, as in the European Soil Observatory.
Conclusions
Some metrics will clearly be valuable in identifying the benefits of future agri-environmental management. For example, the collection of data on soil carbon and methane emissions clearly supports the Scottish Government’s climate ambitions. Others will support policies regarding sustainability (soil erosion) and the health of Scotland’s freshwater resources (reducing diffuse pollution). There is a mix of field data collection, farmer-collected data and modelled information with some usage of existing data.
It should be noted that several metrics have been identified that may only be proxies of the outcome they relate to, such as area of non-farmed habitats or pesticide usage, but they have the advantage of being based on already collected data with the cost savings this brings. Other metrics are still in development but should either be available by the start of the scheme or where samples can be collected for future analysis.
There are several outcomes that are closely related and need consideration together. Improving animal nutrition requires maintaining soil nutrients at a level where protein is not limiting growth. This may require the application of organic and/or inorganic fertilisers. However, excess nutrients can end up as N2O and ammonia emissions from slurry and the leaching of nitrates into freshwater. Careful management to optimise nutrient use is, therefore, required to reach all the desired outcomes: improving soil nutrient content, reducing diffuse pollution, improving water and air quality, livestock nutrition and nutrient management.
A second set of outcomes are also closely related, those dealing with livestock genetics, health and nutrition, alongside reducing methane emissions. Improved efficiency across the livestock sector should increase margins but at the same time reduce the methane footprint of meat.
Some metrics are not useful in isolation and need to be collected as a set to be useful. This is particularly true for animal health, nutrition and genetics where a range of data on growth rates, milk yields, mortality, conception rates and replacement rates are needed to get a full picture.
The final choice of which metrics to collect will depend on the availability of resources to carry out the monitoring and the type of sampling philosophy adopted. Assembly, curation and analysis of the data will all add costs to metric collection but it is important to get the most out of the data. Data ownership is also a key consideration.
Given the division between farmer-led and expert-led monitoring highlighted in the spreadsheet and in Section 6, we suggest the following:
- All enterprises to assess soil erosion and buffer strip effectiveness as this is highly site specific.
- All livestock enterprises to record growth rate, milk yields, mortality, conception rates, replacement rates, age at slaughter for sheep and cattle.
- ScotEID to require information on sires.
- All enterprises to use farm tool calculators to model GHG emissions. Livestock enterprises to model ammonia emissions when a suitable tool is available. The requirement to model might be limited to enterprises above a certain size to reduce costs.
- The remaining outcomes are best assessed using expert-led monitoring in a sample-based programme similar in philosophy to the Welsh approach. Resources available for monitoring and statistical power analysis would be a key part of how to structure this monitoring. They would also determine whether to focus on a small number of metrics and outcomes and cover a larger sample size, or to cover all outcomes on a smaller sample size. The outcomes monitored in this way include those focused on soils, waters and biodiversity.
References
Bieroza, M.Z., Bol, R. & Glendell, M. (2021) What is the deal with the Green Deal: Will the new strategy help to improve European freshwater quality beyond the Water Framework Directive? Science of The Total Environment, 791, 148080. https://doi.org/10.1016/j.scitotenv.2021.148080
Boag, B., Palmer, L.F., Neilson, R., Legg, R. & Chambers, S.J. (1997). Distribution, prevalence and intensity of earthworm populations in arable land and grassland in Scotland. Annals of Applied Biology, 130, 153-165. https://doi.org/10.1111/j.1744-7348.1997.tb05791.x
Brodie, E. (2023) Farm for Scotland’s Future: the case for change. A report for Scottish Environment LINK. https://farmforscotlandsfuture.scot/wp-content/uploads/2023/04/Farm-for-Scotlands-Future-full-report.pdf
Carey, P.D., Wallis, S., Chamberlain, P.M., Cooper, A., Emmett, B.A., Maskell, L.C., McCann, T., Murphy, J., Norton, L.R., Reynolds, B., Scott, W.A., Simpson, I.C., Smart, S.M. & Ullyett, J.M. (2008) Countryside Survey: UK Results from 2007. NERC/Centre for Ecology & Hydrology, 105pp. (CEH Project Number: C03259) https://nora.nerc.ac.uk/id/eprint/5191/
Carpenter, D., Sherlock, E., Jones, D.T., Chiminoides, J., Writer, T., Neilson, R., Boag, B., Keith, A.M. & Eggleton, P. (2012). Mapping of earthworm distribution for the British Isles and Eire highlights the under-recording of an ecologically important group. Biodiversity and Conservation, 21, 475-485. https://doi.org/10.1007/s10531-011-0194-x
Chatterjee, A., Lal, R., Wielopolski, L., Martin, M.Z. & Ebinger, M.H. (2009) Evaluation of different soil carbon determination methods. Critical Reviews in Plant Science, 28, 164-178. https://doi.org/10.1080/07352680902776556
Cottle, D.J. & Conington, J. (2012) Breeding for reduced methane emissions in extensive UK sheep systems. Journal of Agricultural Science, 150, 570-583. doi:10.1017/S0021859611000967
Cottle, D.J. & Conington, J. (2013) Reducing methane emissions by including methane production or feed intake in genetic selection programmes for Suffolk sheep. Journal of Agricultural Science, 151, 6, 872-888. doi:10.1017/S0021859612001037
Emmett, B.E., Abdalla, M., Anthony, S., Astbury, S., August, T., Barrett, G., Biggs, J., Botham, M., Bradley, D., Brown, M., Carter, H., Chadwick, D., Cigna, F., Cooper, D., Cooper, J., Cosby, BJ., Creer, S Cross, P., Edwards, F., Edwards, M., Evans, C., Ewald, N., Fitton, A., Garbutt, A., Grebby, S., Greene, S., Halfpenney, I., Hall, J., Harrison, S., Harrower, C., Henrys, P., Hobson, R., Hughes, S., Isaac, N., Jackson, B., Jarvis, S., Jones, D., Keith, A., Kelly, M., Korenko, J., Lallias, D., Leaver, D., Lebron, I., Malcolm, H., Maskell, L., McDonald, J., Moxley, J., Norton, L., O’Hare, M., Owen, A., Pereira, M., Peyton, J., Powney, G., Pywell, R., Rawlins, B., Robinson, D.A., Rorke, S., Rowland, C., Roy, D., Scarlett, P., Scholefield, P., Scott, A., Scott, L., Scott, R., Siriwardena, G., Smart, S., Smith, P., Swetnam, R., Taylor, R., Tordoff, G., Van Breda, J., Vincent, H., Wagner, M., Waters, E., Watkins, J., White, J., Williams, B., Wood, C. & Wright, S. (2014) Glastir Monitoring & Evaluation Programme. First Year Annual Report to Welsh Government (Contract reference: C147/2010/11). NERC/Centre for Ecology & Hydrology (CEH Project: NEC04780), pp.442. https://gmep.wales/sites/default/files/GMEP-First-Year-Annual-Report-2014-05-17.pdf
Environmental Standards Scotland (2022) Baseline Evidence Review – Water (Strategy and Analysis). https://www.environmentalstandards.scot/wp-content/uploads/2022/09/Baseline-Evidence-Review-Water-2022-09.pdf
Estrada-Carmona, N., Sánchez, A.C., Remans, R. & Jones, S.K. (2022) Complex agricultural landscapes host more biodiversity than simple ones: A global meta-analysis. Proceedings of the National Academy of Sciences, 119, e2203385119. https://doi.org/10.1073/pnas.2203385119
Giles, M.E., Caul, S., King, D., Mitchell, S., Sim, A., Neilson, R. & Paterson, E. (2023). Grass variety selection of microbial community composition is associated with differences in soil CO2 emissions. Applied Soil Ecology, 190, 104968.
Glendell, M., Palarea‐Albaladejo, J., Pohle, I., Marrero, S., McCreadie, B., Cameron, G. & Stutter, M. (2019) Modeling the ecological impact of phosphorus in catchments with multiple environmental stressors. Journal of Environmental Quality, 48, 1336-1346. https://doi.org/10.2134/jeq2019.05.0195
Harrison, S., McAree, C., Mulville, W. & Sullivan, T. (2019) The problem of agricultural ‘diffuse’ pollution: Getting to the point. Science of the Total Environment, 677, 700-717. https://doi.org/10.1016/j.scitotenv.2019.04.169
Hayes, E., Higgins, S., Geris, J., Nicholl, G. & Mullan, D. (2023) Weighted risk assessment of critical source areas for soil phosphorus losses through surface runoff mechanisms. Catena, 225, 107027. https://doi.org/10.1016/j.catena.2023.107027
Humphry, R., Skuce, P., Hayward, A., Henry, M., Hutchinson, I., Gunn, G. & Costa, M. (2021) Measurement of antimicrobial usage: what can we learn across Livestock Sectors? https://sefari.scot/research/measurement-of-antimicrobial-usage-what-can-we-learn-across-livestock-sectors
Insausti, M., Timmis, R., Kinnersley, R. & Rufino, M.C. (2020) Advances in sensing ammonia from agricultural sources. Science of The Total Environment, 706, 135124. https://doi.org/10.1016/j.scitotenv.2019.135124
IPCC (2021) Climate Change 2021: The Physical Science Basis. Contribution of Working Group I to the Sixth Assessment Report of the Intergovernmental Panel on Climate Change. Eds Masson-Delmotte, V., P. Zhai, A. Pirani, S.L. Connors, C. Péan, S. Berger, N. Caud, Y. Chen, L. Goldfarb, M.I. Gomis, M. Huang, K. Leitzell, E. Lonnoy, J.B.R., Matthews, T.K. Maycock, T. Waterfield, O. Yelekçi, R. Yu, and B. Zhou. Cambridge University Press, Cambridge, United Kingdom and New York, NY, USA, 2391 pp. doi:10.1017/9781009157896.
Leinonen, I., Eory, V., MacLeod, M., Sykes, AS., Glenk, K., & Rees, RM. (2019). Comparative analysis of farm-based carbon audits. ClimateXChange. https://www.climatexchange.org.uk/media/3584/farm-based-carbon-audits-final.pdf
Neilson, R., Aitkenhead, M., Lilly, A. & Loades, K. (2021) Monitoring soil health in Scotland by land use category – a scoping study. James Hutton Institute. https://doi.org/10.7488/era/1293
Pakeman, R.J., Beaton, J., Fielding, D., Hewison, R., McKeen, M., Potts, J., Quinzo-Ortega, L., Stephen, T. & Stockan, J. (2020) Evaluation of the Biodiversity outcomes of the 2014-20 SRDP Agri-Environment Climate Scheme through a selection of case studies. Report to NatureScot. https://www.nature.scot/doc/naturescot-research-report-1254-evaluation-biodiversity-outcomes-2014-20-srdp-agri-environment.
Perry, J.N., Rothery, P., Clark, S.J., Heard, M.S. & Hawes, C. (2003) Design, analysis and statistical power of the Farm‐Scale Evaluations of genetically modified herbicide‐tolerant crops. Journal of Applied Ecology, 40, 17-31. https://doi.org/10.1046/j.1365-2664.2003.00786.x
Prout, J.M., Shepherd, K.D., McGrath, S.P., Kirk, G.J.D., Hassall, K.L. & Haefele, S.M. (2022) Changes in organic carbon to clay ratios in different soils and land uses in England and Wales over time. Scientific Reports, 12, 5162. https://doi.org/10.1038/s41598-022-09101-3.
Reaney, S.M., Mackay, E.B., Haygarth, P.M., Fisher, M., Molineux, A., Potts, M. & Benskin, C.M.H. (2019) Identifying critical source areas using multiple methods for effective diffuse pollution mitigation. Journal of Environmental Management, 250, 109366. https://doi.org/10.1016/j.jenvman.2019.109366
Saby, N.P., Bellamy, P.H., Morvan, X., Arrouays, D., Jones, R.J., Verheijen, F.G., Kibblewhite, M.G., Verdoodt, A.N.N., Üveges, J.B., Freudenschuss, A. & Simota, C. (2008) Will European soil‐monitoring networks be able to detect changes in topsoil organic carbon content? Global Change Biology, 14, 2432-2442. https://doi.org/10.1111/j.1365-2486.2008.01658.x
Skuce, P., Holland, J., Kenyon, F., Wells, B., McCracken, D., Neilson, R. & Bartley, D. (2022) Anthelmintics and the Environment – opening a whole can of worms? https://sefari.scot/research/anthelmintics-and-the-environment-%E2%80%93-opening-a-whole-can-of-worms
Staggenborg, J. & Anthes, N. (2022) Long‐term fallows rate best among agri‐environment scheme effects on farmland birds—A meta‐analysis. Conservation Letters, 15, e12904. https://doi.org/10.1111/conl.12904
Stutter, M., Costa, F.B. & Ó hUallacháin, D. (2021) The interactions of site-specific factors on riparian buffer effectiveness across multiple pollutants: A review. Science of the Total Environment, 798, 149238. https://doi.org/10.1016/j.scitotenv.2021.149238
Walton, P., O’Brien, D., Smart, J., Burns, F., Basset, D., Bradfer-Lawrence, T., Foster, S., James, B.D., Mancini, F., Mordue, S., Pakeman, R.J., Pescott, O.L., Simkin, J., Stanbury, A.J. & Towers, M. (2023) State of Nature Scotland 2023. The State of Nature Partnership. https://stateofnature.org.uk/wp-content/uploads/2023/09/TP26056-SoN-Scotland-summary-report-v5-1.pdf.pagespeed.ce.EIp-TYaoGQ.pdf
Wang, Y., Yao, Z., Zhan, Y., Zheng, X., Zhou, M., Yan, G., Wang, L., Werner, C. & Butterbach‐Bahl, K. (2021) Potential benefits of liming to acid soils on climate change mitigation and food security. Global Change Biology, 27, 2807-2821. https://doi.org/10.1111/gcb.15607
Zhang, H.M., Liang, Z., Li, Y., Chen, Z.X., Zhang, J.B., Cai, Z.C., Elsgaard, L., Cheng, Y., van Groenigen, K.J. & Abalos, D. (2022) Liming modifies greenhouse gas fluxes from soils: A meta-analysis of biological drivers. Agriculture, Ecosystems & Environment, 340, 108182. https://doi.org/10.1016/j.agee.2022.108182
List of Appendices
Appendix A. List of measures under consideration
Appendix B. Correspondence between land-based measures and relevant outcomes
Appendix C. Potential monitoring metrics and methods
Measures and metrics spreadsheet
© Published by The James Hutton Institute, 2024 on behalf of ClimateXChange. All rights reserved.
While every effort is made to ensure the information in this report is accurate, no legal responsibility is accepted for any errors, omissions or misleading statements. The views expressed represent those of the author(s), and do not necessarily represent those of the host institutions or funders.
DOI: http://dx.doi.org/10.7488/era/4346
Executive summary
Aims
This research is a rapid review, presenting and examining evidence relating to climate change and digital connectivity such as:
- whether investment in digital connectivity can support reductions of greenhouse gas (GHG) emissions and, if so, how
- examples of relevant policies and impacts
- the best options for assessing emissions from digital connectivity and services in Scotland
- key evidence gaps in these areas.
The review was undertaken between October and the middle of December 2023 and was focused on and bounded by specific criteria set out by the Scottish Government and ClimateXChange steering group. The study team were asked to only include information and projects that were current and operating, not theoretical. Search terms were selected and agreed with the steering group.
We used a methodology known as “claim, argument, evidence” to assess whether claims made within certain arguments were true or false. We classified evidence as having low, moderate or good confidence levels, based on its volume and quality, and the level of agreement in the literature reviewed.
Findings
We have found mixed evidence of the decarbonisation impact of digital connectivity and whether it contributes to adaptation and a just transition. Our main findings on basis of the literature reviewed are:
- The Information Communications Technology (ICT) sector is a source of GHG emissions. The sector’s energy consumption and generation of electronic waste (e-waste) generates GHG emissions directly. This is despite the possibility that it can reduce emissions indirectly by increasing efficiency and through behaviour changes like reduced travel due to remote meetings. Studies point out a need for a holistic approach in calculating GHG emissions of the ICT sector, to fully account for indirect emissions and emissions from end-of-life.
- ICT technology and digitalisation reduce GHG emissions in other industries. Heavy industry and the energy sector would benefit the most from digitalisation. To achieve this, there would need to be widespread high-speed internet coverage, which would likely generate further GHG emissions. On their own, digital connectivity infrastructures do not support emissions reduction. They provide a mechanism to support decarbonisation of other sectors.
- The GHG emissions associated with e-waste are of growing concern internationally. Even though ICT use could help reduce GHG emissions in other sectors, it is uncertain whether this can outweigh the direct emissions of the ITC sector. It gives us only moderate confidence that the ICT sector can help reduce more emissions than are inherent in the manufacture, use and disposal of the equipment used.
- The indirect impact of ICT technologies can either lead to a net reduction in carbon emissions or to a net increase. The overall effects depend on context. Rebound effects can lead to increases in emissions. Policy and measurement do not usually account for these effects. Human behaviour plays a part in whether the indirect impacts on emissions are positive or negative. This means that it is not solely down to technology and therefore we are only moderately confident that the challenge of emissions reduction can solely be met by utilising digital technology.
- We are unable to say whether digital connectivity supports climate adaptation because of the small number of ex-post studies in this area. With regard to a just transition, digital connectivity and ICT can have either a positive or a negative effect, either addressing or exacerbating existing inequalities such as access to digital connectivity and skills. Studies repeat the need for strong policy in this area.
Within the literature reviewed as part of the study, we identified gaps in knowledge, including:
- Lack of evidence on whether investment in digital connectivity directly reduces GHG emissions, or contributes to a just transition and how.
- There are varying approaches to quantifying direct and indirect emissions of ICT and to comparing the GHG emissions of digital and non-digital practices and solutions.
- Climate adaptation in relation to ICT is either an afterthought or future looking, with few real-world examples.
- Case studies of digital technologies saving money, power or water in municipalities focused on the GHG emissions reduced or averted, with no acknowledgment of rebound effects, which literature states is important.
- The GHG emissions of data collection and use necessary to digitalisation are opaque and limited to specific studies on data centres.
- Lack of evidence of policy to address GHG emissions of e-waste or the embedded emissions from extraction of raw materials and production of ICT equipment.
- Lack of best practice for measuring, monitoring and assessing the GHG footprint of electronic communications services.
Glossary
|
Term |
Description |
|---|---|
|
Backhaul |
The set of copper, fibre or wireless links that connect the core (or backbone) telecommunications networks with smaller subnetworks, such as private internet networks. |
|
Co-located or edge data centres |
In co-location, an organisation rents space within a data centre owned by others and located off premises. |
|
Data Over Cable Service Interface Specification (DOCSIS) |
DOCSIS delivers high-speed network or internet access through cable television. |
|
Digital economy |
The economic activities that emerge from connecting individuals, businesses, devices, data and operations through computers and connectivity. |
|
Digital productivity paradox or Solow computer paradox |
The observation that as more investment is made in information technology, worker productivity may go down instead of up (Dreyfuss, et al., n.d.). |
|
Direct emissions |
Emissions from energy consumption and generation of electronic waste (e-waste). |
|
Direct Subscriber Line (DSL) |
DSL technologies deliver high-speed network or internet access over voice line. |
|
Electronic waste, e-waste |
Waste from end of life, broken or obsolete ICT equipment. |
|
Embedded or embodied carbon |
The carbon footprint, i.e. the GHG emissions, from producing and manufacturing a product or service. |
|
Energy Management System, ISO 50001 |
An international standard organisation system for managing energy use. |
|
Global warming potential, GWP |
Relative potency, molecule for molecule, of a greenhouse gas, taking account of how long it remains active in the atmosphere. Global warming potentials (GWPs) are calculated over 100 years. Carbon dioxide is the gas of reference, with a 100-year GWP of 1 (Eurostat, n.d.). |
|
Hyperscale data centre |
A hyperscale data centre is a large offsite facility housing servers which exceeds 5,000 servers and 10,000 square feet. |
|
Information and Communications Technology (ICT) sector |
The ICT sector combines manufacturing and services industries whose products primarily fulfil or enable the function of information processing and communication by electronic means, including transmission and display (OECD Library, 2023). |
|
Indirect emissions |
Emissions not directly related to ICT but influenced by its use, e.g. decreased or increased emissions from working from home. |
|
Internal datacentre |
An organisation uses in-house servers that are located onsite. |
|
Internet of Things (IoT) |
Connected devices pooling data, often in real time, for decision-making. |
|
Just Transition Score (JTS) |
Measures the carbon efficiency of social progress of each country, based on the ratio of consumption-based CO2 emissions per capita to the Social Progress Index (Social Progress Imperative, 2022). |
|
Life Cycle Assessment (LCA) |
A technique to systematically analyse the potential environmental impacts of products or services over their entire lifecycle, including on human health, land use, resources and acid rain formation. |
|
Power usage effectiveness (PUE) |
The metric used to determine the energy efficiency of a data centre. A PUE value of 1.0 indicates that all energy consumed by a data centre is used to power computing devices. As some wastage is inevitable, the most efficient data centres in the world achieve a PUE of 1.2 (Lavi, 2022). |
|
Rebound effect |
Increase in energy demand due to efficiency savings, such as cost savings, that might be used for other energy consumption purposes (Lin & Huang, 2023). |
|
Workload |
Amount of computing resources and time it takes to complete a task or generate an outcome. Any application or program running on a computer can be considered a workload (HP Enterprise, n.d.). |
Introduction
Need for this research
The extent to which the development and deployment of digital and data solutions supports the reduction of a country’s greenhouse gas footprint, assists in adaptation, and contributes to a just transition is unclear. Digital technologies have become an integral part of our lives, but they also have an environmental impact, including the production of greenhouse gas emissions (GHG) during their manufacturing, use and disposal.
In recent years, over £1 billion has been invested in programmes to enhance digital connectivity in Scotland, for a variety of anticipated outcomes relating to regional equity and opportunity. These include Digital Scotland Superfast Broadband (DSSB), Reaching 100% (R100), Scottish 4G Infill (S4GI), and the Scotland 5G Centre, with a regional network of 5G Innovation Hubs to facilitate widespread deployment of 5G.
Digital connectivity, and increasing access to it, is the focus of many Scottish Government policies. The Digital Strategy, ‘A changing nation: how Scotland will thrive in a digital world,’ is the policy backbone, setting out actions on: broadband and connectivity; data and statistics; digital inclusion and ethics; digital, data and technology profession, skills and capability; Transforming public services; and the Technology Assurance Framework. Enhancing Scotland’s digital infrastructure, both nationally and internationally, has also been a stated priority in successive Programmes for Government and the 10-year National Strategy for Economic Transformation (NSET) published in 2022. There is a lack of current evidence on the extent of the potential contribution of digital connectivity to Scotland’s climate change goals, not least of achieving net zero by 2045.
Project aim
The aim of the project is to examine recent research on climate change and digital connectivity to answer the following questions:
- To what extent is there evidence that investment in digital connectivity can support emissions reduction, climate adaptation and a just transition?
- If so, what are the key mechanisms by which this could occur (for example, reduction in travel, investment in green data centres or other mechanisms suggested in the evidence)?
- What are key examples of existing policies (in Scotland, such as in Local Authorities, the UK and/or international examples from comparable countries) designed to support emission reductions, adaptation, and/ or just transition through digital connectivity? Is there any evidence for the impact of such policies?
- What are the different options suggested within the literature for Scotland to provide a baseline assessment of, and monitor carbon emissions from digital infrastructure, technologies, and associated activities?
- What are the other key gaps in existing knowledge where further research is required to support digital connectivity and Scotland’s climate change goals?
These questions are answered in Sections 5, 6, 7, 8 and 9. By better understanding the mechanisms in which digital connectivity supports Scotland reaching net zero, policy makers will know how to influence what they want to occur.
Key terms used throughout the report are explained in the Glossary in Section 2.
Components of the digital landscape covered by this research
The focus of the research is digital connectivity. This can encompass a wide range of products and services. Figure 1 sets out the boundaries of the research undertaken to inform this paper, including:
- infrastructure such as fixed broadband, mobile connectivity and data centres
- application, use and behaviours such as artificial intelligence and the Internet of Things, data driven products and services, and practices such as home working
- the list of countries with applicable learning for Scotland.
Figure 1 – The landscape of digital connectivity defined as within scope of this research.
Approach to the research
This section provides an overview of the research approach. Our full methodology is outlined in Appendix 1.
Methodology for collecting evidence
Frazer-Nash Consultancy (Frazer-Nash) was tasked with completing this research for ClimateXChange (CxC) on behalf of the Scottish Government Digital Connectivity Division. A steering group was set up consisting of representatives from Scottish Government, CxC and Frazer-Nash.
We followed an approach based on the Double Diamond approach of Discovery and Define[1], including literature gathering, revising and providing initial conclusions, and further developing conclusions before developing the report. We socialised the initial and final conclusions with the steering group. Keywords for the literature search were also agreed with the steering group. The literature reviewed was identified through google and google scholar searches. The review was focused on and limited by specific criteria, such as the non-inclusion of theoretical studies around “what is possible”, with an emphasis on current and recent experience.
Methodology for policy review
One of our research questions requests a review of policies which were designed to support emission reductions, adaptation or just transition through digital connectivity. To determine the geographic scope of the research, we chose countries analogous to Scotland facing similar digital connectivity challenges, that is, large landmasses with areas of low population density, and a number of isolated and rural remote communities. This list was agreed with the steering group and consists of: Finland, Wales, Portugal, Norway, Sweden, Estonia, Canada (Ontario), New Zealand, Denmark, and Iceland.
We use a star key (Table 3) to rate the extent that digital connectivity and emissions reduction are linked within a country’s policy.
Section 7 sets out the policies we found and reviewed.
How we have presented our findings
By following this methodology, we came up with a series of statements based on the findings from our research. These are presented in Section 5 and 6 with a structure as follows:
- Claim: a conclusion formatted in bold and accompanied by a statement of confidence in our conclusion.
- Argument: concise statements explaining how we arrived at the conclusion.
- Evidence: synthesis of literature in support of our argument.
We have provided a confidence level based on the extent of agreement in the literature and the robustness of evidence. We follow a methodology similar to the one developed by the Intergovernmental Panel on Climate Change for the fifth assessment report and used for the sixth for the consistent treatment of uncertainties.
Figure 2 sets out what constitutes low, moderate, and good confidence in our claims.
Low agreement is where sources do not agree.
Medium agreement is where sources make broadly similar conclusions but the data or evidence they use to support their conclusions are very different.
High agreement is where sources independently make similar conclusions and underlying data are similar despite being independent.
Limited evidence is some evidence available but largely anecdotal and not from recognised peer reviewed sources. Availability of data was low.
Medium evidence is information from peer reviewed sources or official sources.
Robust evidence is a greater volume of information from peer reviewed sources and official sources.
The combination of low agreement and limited evidence provides the lowest level of confidence and the combination of high agreement and robust evidence provides a good level of confidence, with combinations in-between generating moderate confidence.
Our definitions for “limited”, “medium” and “robust” evidence are described in Appendix 1: Detailed Methodology & Approach to the Research. This means that when we say we have “good confidence” in a finding, we are content that there is medium to high agreement in the literature and medium to robust evidence provided for that claim.

Figure 2 – How extent of literature agreement and evidence robustness combines into our stated confidence level.
Investment in digital connectivity and emissions reduction
Digital connectivity, technologies and GHG emissions
We have good confidence in the evidence that, taken on its own, digital connectivity and digital technologies are sources of GHG emissions.
Digital connectivity enables a range of ICT applications. The underlying infrastructure that makes it all work often gives rise to GHG emissions. It depends on the structure of the primary energy and electricity generation sectors of the countries where ICT goods are produced and used, as well as the materials used, such as plastic. These emissions arise across communication equipment such as fixed and mobile broadband, datacentres, cables, and the computers or devices themselves.
The ICT sector is responsible for around 3% to 4% of global greenhouse gas emissions (UNEP, 2021). In Scotland, using domestic output and supply and the environmental input-output model greenhouse gas effects data, the sector contributes around 2% of direct and indirect emissions of carbon dioxide equivalent[2]. It is also true that regions and countries with higher levels of digital economy development have higher GHG emissions (Wang, et al., 2023). Between 1995 and 2015, GHG emissions of ICT manufacturing have doubled and demand for materials to develop more ICT equipment has quadrupled in the same time period (Itten, et al., 2020).
Besides the high-energy consumption of ICT and electronic equipment, many energy-intensive infrastructures such as backhaul and data centres need to be built to achieve digital connectivity (Lin & Huang, 2023). This means that GHG emissions will increase as a country or region digitalises, up to a certain point (explored further in section 5.1.2). On their own, digital connectivity infrastructures do not support emissions reduction. They provide a mechanism to support decarbonisation of other sectors.
Digital connectivity, emissions reduction and other economic sectors
We have good confidence in the evidence that digital connectivity can only support emissions reduction when paired with other economic sectors.
Digital connectivity is hailed as an enabler for decarbonisation. Despite being a source of GHG emissions themselves, they enable other sectors to digitise in ways that improve productivity and efficiency. The mechanisms by which this is achieved are explored more in Section 6. Essentially, ICT products and services allow traditional industry to change their methodologies to curb GHG emissions (Wang, et al., 2023). Many policymakers hope that the reduction in GHG emissions achieved by these sectors will outweigh the ICT sector’s emissions, as suggested by the European Commission, which states: “If properly governed, digital technologies can help create a climate neutral, resource-efficient economy and society, cutting the use of energy and resources in key economic sectors and becoming more resource-efficient themselves. When implemented under the right conditions, digital solutions have demonstrated significant reduction in greenhouse gas emissions, increased resource efficiency and improved environmental monitoring.” (European Commission, 2022)
Many policies are reliant upon a viewpoint that, on balance, digital innovation to reduce GHG emissions will outweigh the emissions cost of producing and maintaining the necessary ICT networks and components. It is less common for papers to acknowledge there is an initial increase in GHG emissions (particularly from energy use) at the onset of digitalisation. Nor are there many papers discussing the point at which digitalisation starts to reduce emissions.
Lin &Huag is another paper that does address this issue (Lin & Huang, 2023). They state that with increased digitalisation, the resulting increased digital connectivity meant that an energy saving effect could be scaled up across the economy. This marginal energy saving effect exceeds energy consumption of the system – this could be seen as the point at which the GHG savings which result from efficiencies outweigh the GHG emissions from the energy use, production of devices and so on involved in digitalisation. Lin and Huang refer to this point as ‘digitalisation level 0.43’ (Lin & Huang, 2023). The digitalisation level indicator used in the paper is based on data on digital infrastructure, such as internet access and bandwidth, digital application, e.g. fixed and mobile subscription and digital skills and on aggregate ranges from 0 to 100%, using a weighted average for the component elements of the indicator. The paper stipulates that most developed countries have passed the 0.43 point, and it is reasonable to assume that this is the case for Scotland. The assumption of the inverted U-shaped relationship is well tested in the paper, see image in Figure 4. However, the slope of the downward curve is not specified and therefore the applicability of the analysis to Scotland is uncertain, however it is likely to depend on other factors such as the structure of the economy. (Lin & Huang, 2023) make no comment on obsolescence or upgrades to physical equipment.
Figure 4 – Country-level energy intensity against digitalisation; adapted from (Lin & Huang, 2023).
Paired with industrial sectors, there is therefore good evidence that digital connectivity supports emission reductions.
Indirect impacts from ICT use on GHG emissions
We have good confidence in the evidence that indirect impacts from ICT use can be both positive and negative for GHG emissions.
ICT can have both increasing and decreasing effects on GHG emissions. These can be direct or indirect. Direct impacts include energy consumption while the device is in use. Indirect impacts include secondary benefits such as more people being able to work from home and associated reduction in commuting emissions. While digital connectivity can reduce transport through, for example, hosting virtual meetings, some studies postulate that it could also increase emissions from transport by creating the desire to travel to places seen on the internet (Bieser and Hilty, 2018; Hilty and Bieser, 2017; Wang, et al, 2023). Many studies which look at quantifying both, the direct and indirect effects of ICT use, often conclude that the indirect effects are favourable (i.e., reducing GHG emissions) and far outweigh direct effects of energy use. However, these studies often neglect factors such as stimulating transport demand, rebound effects, behaviour changes of humans using these systems, or the embedded carbon of the product or service (Itten, et al., 2020).
The CxC study on emissions impact of home working in Scotland found a small reduction in commuting and office emissions and an increase in home emissions. However, how these changes in emissions balance for each individual defines the net emissions impact from homeworking (Riley, et al., 2021).
Therefore, we conclude from the literature reviewed, that the evidence remains divided in which is more significant: increasing or decreasing effects on GHG emissions.
Emissions reduction and digital technologies that rely on connectivity
We have good confidence in the evidence that the challenge of emissions reduction cannot be met without digital technologies that rely on connectivity.
A great number of the studies and policies we read stated strongly that the challenge of emissions reduction and climate adaptation will not be met without the intervention or use of digital technology and tools (including Royal Society, 2020; Exponential Roadmap Initiative, 2023). The three technologies most often hailed as transformative to all sectors of the economy are 5G, the Internet of Things (IoT, connected devices pooling data often in real time for decision-making) and artificial intelligence (AI, computer-based machine learning).
Many papers assert that digital technology has the potential to assist the transition to a low carbon world, enabling global emission reductions while limiting the emissions created by ICT use (Royal Society, 2020). Some claim that if the currently available digital solutions were used at scale, there would be the potential to reduce GHG emissions in the three highest-emitting global sectors (energy, materials, and mobility) by 20% by 2050 (World Economic Forum, 2022). There was no concrete evidence in these papers that connectivity would enable these goals to be met, only claims.
Sectors that will benefit the most from digital connectivity
We have good confidence in the evidence that suggests that the sectors that will most benefit from digital connectivity are industrial in nature and will vary from country to country.
The sources above state the energy sector would benefit the most from digital solutions. In Scotland, the energy sector is the fourth highest emitter at 4.9 million tonnes of CO2e in 2021 (Scottish Government, 2021). With regards to electricity in particular, the complexity and scale of integrating more renewable energy generation and increasing the distribution capacity of the electricity grid will not be possible without digital technologies (Energy Systems Catapult, 2023), especially with increasing requirements for data sharing and more effective system planning and operation. Renewable generation is intermittent and requires active grid management. Digital technologies can help balance the supply side (electricity producers) and the demand side (consumers) management for a more agile, stable and reliable electricity grid for industrial, commercial and household users.
The industry sector is globally responsible for 37% of total final energy consumption and about 20% of GHG emissions. In Scotland, industrial processes and business account for 20% of CO2e in 2021.
As described in 5.1.4, digital technologies will be important to manage the supply and demand of large industrial energy users in a system with diverse sources and feedstock (European Commission, 2022).
The effective use of these digital technologies relies on connectivity. Without it, none of the claims explored in literature can come to fruition.
The emissions intensity of digital connectivity
We have moderate confidence in the evidence that the lowest emissions form of digital connectivity is currently fibre.
One study has found that fibre is the most energy efficient technology for broadband access networks, compared with the family of Direct Subscriber Line (DSL) technologies delivering network access through voice lines and Data Over Cable Service Interface Specification (DOCSIS) which delivers network access through cable television (European Commission, 2020). Studies brought together by Europacable also demonstrated that fibre is the most energy efficient technology for internet access compared to microwave, millimetre wave, copper, satellite, and laser (Europacable, 2022). This is because there are fewer intermediate devices and amplifiers, and glass fibre is largely passive and requires little energy to function.
Although 5G networks are touted to be more energy efficient than 4G networks, the overall energy and emissions impacts are still uncertain. 5G antennas use three times as much energy as a 4G antennae, and a higher network density will be required (International Energy Agency, 2023). Literature on the energy use of 5G is found to be dominated by small-scale, single technology assessments. Embedded energy use and indirect energy use effects are largely overlooked (Williams, et al., 2022).
Satellite broadband is a less disruptive approach to connect rural areas to the internet, requiring less work on land to lay cables, however the GHG emissions of Low Earth Orbit (LEO) satellites are only recently being explored. An October 2023 study estimates worst-case emissions to be 31-91 times higher than equivalent terrestrial mobile broadband (Osoro, et al., 2023). It is unclear whether the terrestrial mobile broadband used in this comparison is sufficiently representative of a rural broadband connection or fixed broadband.
The World Bank identified a strong statistical connection between the capacity of the network (the number of users and the amount of data they require) and the level of GHG emissions (World Bank, 2022). Fibre has a high data capacity, but is only one component of a network. There are other critical parts of the network infrastructure such as data centres which drive this trend.
The most efficient data centres and emissions reduction
We have moderate confidence in the evidence that hyperscale and co-located data centres are the most efficient and offer a high potential for reducing emissions.
Data centres and data transmission networks account for approximately 1-1.5% of global electricity use, making them responsible for 1% of energy-related GHG emissions (IEA, 2023). Rapid growth in demand at large data centres has resulted in a substantial increase in energy use in this sector, growing 20-40% annually over the past several years (IEA, 2023). As a result of this, the International Energy Agency (IEA) has given data centres the “More Efforts Needed” rating, which means that data centres need to do more to align to the IEA’s Net zero by 2050 Scenario. Progress is assessed at the global level against the IEA’s net zero by 2050 Scenario Trajectory for 2030 (IEA, n.d.), and recommendations are provided on how they can get “on track” with this pathway. Recent trends on reducing the environmental impacts of data centres have generally been in the right direction to match this trajectory; however, without acceleration it will fall short (IEA, n.d.).
The carbon footprint of a data centre is affected by three factors:
- electricity consumption
- water consumption
- lifetime of the equipment.
When analysing these factors, it can be seen in Table 1 that hyperscale and co-located data centres are far more efficient (including accounting for water consumption) than internal data centres. This is driven by better energy utilisation, more efficient cooling systems and increased workloads per server (Lavi, 2022). As a result, they are less carbon intensive per tonne of GHG emissions per workload than internal data centres.
Table 1 – Impacts of hyperscale, colocation and internal data centres. Adapted from Lavi, 2022.
|
|
Internal |
Colocation |
Hyperscale |
|---|---|---|---|
|
Energy use (million MWh) |
26.90 |
22.40 |
22.85 |
|
Computing workloads (million) |
16 |
41 |
76 |
|
Water intensity (M3MWh-1) |
7.20 |
7.00 |
7.00 |
|
Carbon intensity (Ton CO2-eq MWh-1) |
0.45 |
0.42 |
0.44 |
|
Water intensity (m3/ workload) |
12.15 |
3.85 |
2.10 |
|
Carbon intensity (Ton CO2-eq/ workload) |
0.75 |
0.25 |
0.15 |
With Scotland’s electricity maintaining a grid intensity of below 50 grams of CO2e per kilowatt hour delivered across 2017-2020 (Scottish Government, 2023), as opposed to the UK average of 149 grams of CO2e per kilowatt hour delivered in 2023 (National Grid, 2023), the emissions intensity of datacentres in Scotland is likely to be significantly lower.
Summary
Investment in digital connectivity can support emission reductions for those primarily industrial sectors which benefit from efficiency. ICT reliant on digital connectivity is supposed to help meet challenges of emission reduction although there is a lack of evidence for these claims.
Digital technology is a source of emissions in and of itself which tends to be overlooked.
As a result of these, we cannot say for certain whether the indirect effects of digitalisation (e.g., saved emissions from home working, see Section 5.1.3) will reduce overall emissions.
Climate adaptation, just transition and investment in digital connectivity
This section sets out the evidence we have been able to find that meets our criteria. Although just transition and adaptation are important policy areas, the steering group wished to focus primarily on Net zero targets and emissions reduction with this research. The Steering Group also emphasised the need to only include information and projects that were current and operating, not theoretical.
The resulting research has emphasised how these concepts are new and emerging. As novel as the concepts such as just transition and adaptation are, the evidence base is being created. As the situation progresses, more and more evidence will be developed to revise the assertions below.
Digital connectivity and adaptation strategies
With the evidence we have been able to find that meets our criteria, we have low confidence in the evidence that digital technologies, which rely on connectivity, support climate adaptation strategies.
ICT technology is an integral component of many proposed mitigation measures (Dwivedi, et al., 2022), but less so for adaptation. Mitigation is reducing and stabilising levels of GHG emissions; adaptation is adapting to life in a changing climate. It is considered by many that digital connectivity and the ability to communicate and share data will be important for adaptation, especially in rural communities.
The example we have been able to find include the European Commission Farmers Measure Water project, where one farmer described how decisions need to be made quickly: “We need fast internet in rural areas because a lot of farmers and water authorities have to make decisions on an hourly basis. If we take a measurement and only see the results in a week’s time, it is too late: the problem has already occurred. If you have fast internet, you have direct access to your data and can decide on the spot what to do” (European Commission, 2022).
Digital technologies can also support climate-resilient agriculture by helping farmers assess weather forecasts and mitigate impacts on crop yields and productivity (United Nations Development Programme, 2023).
In terms of what the ICT sector itself is doing to adapt to climate change, in 2018 TechUK submitted a report to the Department for Environment, Food and Rural Affairs (Defra) on behalf of the ICT sector outlining how the sector intends to adapt to climate change. Within it, they state that ICT infrastructure including connectivity has unique characteristics that make it more resilient (TechUK, 2018). These include:
- Asset life is relatively short. So more resilient assets can be deployed as part of the normal replacement cycle.
- There is built in redundancy in ICT infrastructures so that if same proportion of ICT assets is damaged or affected by climatic events, there are backups.
- Technology development is fast particularly around threats.
The first two of these are in direct conflict with reducing the direct GHG emissions of ICT and digital connectivity delivery. Programmes that mandate less redundancy or longer asset life may affect the ICT industry’s ability to adapt to climate change. The final point reinforces the ICT sector’s claim that it will innovate out of problems, without evidence to support it.
Digital connectivity and a just transition
With the evidence we have been able to find that meets our criteria, there is moderate evidence that digital connectivity supports a just transition.
There is debate in the literature over whether digital connectivity supports a just transition. Views are largely that it may help when accompanied by strong policy. One study shows that the Just Transition Score may increase as digitalisation increases (Wang, et al., 2022), but this could be a correlation rather than indicating causation. The mechanisms are also little explored: for example, one paper sets out that the digital economy indirectly improves just transition by increasing the level of human capital and financial development (Wang, et al., 2022). There is no further investigation into how this takes place.
There are a few points of information related to how digital connectivity relates to just transition:
- People with low and medium income are more vulnerable to the impacts and costs of economic transitions. Transitions may include job automation, increasing need for access to digital solutions and digital public services, higher energy and food prices, or transport poverty (European Commission, 2022).
- Some articles link which digital solutions can be justice and equity enablers. Examples include
- smart energy management and decentralised and distributed energy production and sale (United Nations Development Programme, 2023)
- an easy-to-use and reliable public transport system that improves mobility for all (United Nations Development Programme, 2023).
This indicates that digitalisation may enhance a just transition.
- Collecting data and use of data is highlighted as important for justice and social good (Friends of Europe, 2021). Many smart solutions require a level of monitoring to maintain the efficiency of the service. Regulation, oversight and controls on appropriate data collection and use will be key. This indicates that policy implemented through digital solutions may become increasingly important in relation to a just transition.
- Across many policies, a just transition is also linked to skills development, with the Climate Change Committee (2023) stating digital skills as a fundamental enabler of net zero. The Welsh Government state the need to “prevent existing labour market inequalities being carried through into the new net zero and digital economies” (Welsh Government, 2022), recognising that employers are actively seeking employees with digital skills.
Summary
The evidence base related to digital connectivity and adaptation in relation to concrete real-world examples is very limited among the literature we have reviewed.
There is no direct evidence to date that investment in digital connectivity supports a just transition, but there are many suggestions for mechanisms by which it might influence a just transition. One of these mechanisms is skills development.
Key mechanisms by which digital connectivity influences emissions reduction
Digital connectivity, primary needs for travel and GHG emissions
We have moderate confidence in the evidence that digital connectivity can reduce primary needs for travel, although we have low confidence to whether this reduces GHG emissions in total.
The assumption that digital can replace physical goods or services completely and therefore avert emissions underpins a great deal of policies supporting digitalisation. It is true digitalisation can substitute certain products or GHG generating activities, such as an e-reader capable of displaying hundreds of books or videoconferencing and telework replacing physical travel. Methodologies to measure the true GHG emissions savings of these substitutes are not rigorous or consistent (Hook, et al., 2020). At the same time, demand for travel is still growing (Itten, et al., 2020; Statista, 2023).
Differences in methodology, scope and assumptions make it difficult to estimate average energy savings of working from home versus working in the office. Rebound effects and home energy use is often overlooked, and where they are included, studies find smaller savings (Harvard Business Review, 2022). Rebound effects include increased non-work travel and more short trips. For example, Harvard Business Review found that a decrease in vehicle miles driven is accompanied by a 26% increase in the number of trips taken (Harvard Business Review, 2022). Trips which would have been taken anyway, such as taking children to school, are also not included.
In the report “Emissions impact of home working in Scotland” concludes that working from home leads to a reduction in commuting and office emissions and an increase in home emissions. How these changes in emission balance out for each individual defines whether their net impact from home working will be positive or negative. The authors state that across their scenarios, the overall impact on emissions will be small (Riley, et al., 2021).
Due to the ambiguities in methodologies, the actual or potential GHG emission reductions of teleworking remain uncertain. Economy-wide savings are likely to be modest (Riley, et al., 2021), and in many circumstances could be negative or non-existent (Hook, et al., 2020).
Public sector digital technology use
We have good confidence in the evidence that the public sector is using technology to solve problems linked to sustainability – but the evidence is not accompanied by reports on the effects of technology use on GHG emissions.
The mechanism of reducing GHG emissions by public sector authorities using digital technology is mainly around energy efficiency. Many documents include a wealth of examples of cities using technology to save energy (European Commission, 2022) – but the GHG emissions associated with implementation or life cycle of this equipment have not been considered.
Main source of emissions from digital connectivity and associated ICT
We have good confidence in the evidence that the largest proportion of emissions from digital connectivity and associated ICT equipment comes from waste management after use.
The ICT sector tends to focus on energy use of their products as the largest influence on the carbon footprint. Therefore, there are calls for energy sources to be decarbonised (Ericsson, n.d.). Independent academic studies are more likely to conclude that the carbon footprint or life cycle emissions of a digital product is dominated by electronic waste or e-waste (Itten, et al., 2020 and Dwivedi, et al., 2022). Figure 5 shows the result of a study into video streaming from device purchase, which identifies that 78% of the GHG emissions are from e-waste (Itten, et al., 2020). This illustrates our claim that the largest proportion of emissions from the use of devices comes from waste management after use (please note, extraction of materials and production was not included in this study, which focused on impacts from consumer behaviour).
Figure 5 – Proportion of GHG emissions from the use case of streaming videos (Itten, et al., 2020).
In its 2020 report on e-waste, the International Telecommunication Union (ITU) estimates that 15 million tonnes of CO2e were averted by the recovery of iron, aluminium, and copper from processed e-waste (International Telecommunications Union, 2020). The ITU report also disclosed that less than 18% of all e-waste can be accounted for, meaning that almost 83% of e-waste is likely not properly disposed of. The sector’s emission reductions may be limited because of the uncertain fate of e-waste.
Human behaviour and digital connectivity
We have good confidence in the evidence that human behaviour plays a role in digital trends, rebound effects, and responsible use of digital connectivity.
Academic papers point out that whilst digital technologies are becoming more efficient individually, the higher demand for computing power, storage capacities, transmitted data and devices per person is systematically compensating for this progress (Aebischer & Hilty, 2015) (Hischier & Wager, 2014). This trend can be partially explained by rebound effects regarding time, volume, weight, and price (Itten, et al., 2020), but also human behaviour. Technology can act as a fashion or wealth statement, with the average person owning more and more connected devices such as smartphones and smart watches. These are often replaced with the latest model far sooner than is required on a technology replacement cycle (Itten, et al., 2020).
Future ICT sector energy consumption reduction
We have moderate confidence in assertions that the ICT sector will continue to innovate to reduce energy consumption.
Deployment of next generation low-power chips and more efficient connectivity technologies (5G and 6G, networks powered by artificial intelligence) is repeatably hailed as the way to reduce the overall footprint of ICT (European Commission, 2022).
Each switch to new standards or technologies requires a massive replacement of equipment. For example, 5G and 6G will require users to replace equipment, due to lack of backwards compatibility of existing smartphones, tablets, and computers. Also, as a growing fraction of products become smart or part of the Internet of Things (IoT), overall resource demand could decrease in theory. In practice, the opposite happens because software-controlled objects are also prone to software-induced obsolescence (Kern et al., 2018; NGI, 2020). While each new model is likely to be more energy efficient than the last, and while smaller smart IoT devices may not consume large amounts of energy in use, 85-95% of their lifecycle energy footprint is created in production. The sheer number and variety make them particularly susceptible to obsolescence once software or hardware support runs out (NGI, 2020).
The fast-evolving nature of digital technologies and the possible sharp increase in digitally enabled services is likely to reinforce the ICT sector’s growing emissions (European Commission, 2023). The European Commission has set out that unless digital technologies are made more energy-efficient, their widespread use will increase energy consumption.
Summary
The key mechanisms that ICT and digitalisation can reduce GHG emissions described by literature include replacing the need to travel, although there is evidence that these savings may not be as high as first thought. The largest source of emissions from ICT equipment is after use, as e-waste, something that changing standards and upgrading systems can increase. Human behaviour plays a role in the resulting emissions from ICT and digitalisation.
Key examples of digital connectivity policies
We studied international policies associated with digital connectivity and decarbonisation, adaptation and just transition in 10 countries, selected based on the methodology in Section 4, to gather important contextual information for Scotland. The degree to which each country links their digital goals and strategy has been given a score, with five representing explicit mention of the GHG or carbon impacts of increased digitalisation, and one representing no mention or linking of decarbonisation within the policy, see Appendix 1 for further detail on the scoring.
|
Country |
Score |
Key conclusions and data sources |
|
Finland |
★★★★ |
Finnish policy does connect increased digitalisation with helping the green transition, but there is no explicit mention of the carbon impact of increased digitalisation on the environment. Finnish Government, 2022 European Union Digital Skills and Jobs Platform, 2023 Ministry of Finance Finland, n.d. |
|
Portugal |
★★ |
Portugal says digitalisation will contribute to decarbonisation. Portugal Digital, 2020 Global Enabling Sustainability Initiative, 2020 |
|
Norway |
★★ |
Norwegian policy connects increased digitalisation with aiding the green transition. Norwegian Ministry of Foreign Affairs, n.d. Norway and European Union, n.d. |
|
Sweden |
★★★★ |
Swedish policy links the use of ICT to decarbonisation effects, as well as acknowledging decarbonisation, circularity, conscious choices, and the energy transition as drivers for a sustainable world. OECD, 2018 Regeringskansliet, 2010 |
|
Estonia |
★★★★★ |
Estonian policy contains a clear and explicit mention of the carbon effects of increased digital footprints, and provides a commitment to reduce the effects. European Union Digital Skills and Jobs Platform, 2023 |
|
Canada (Ontario) |
★ |
Canadian policy contains no mention of the carbon or environmental impact of increased digitalisation. Government of Canada, 2022. Ontario, n.d. |
|
New Zealand |
★ |
New Zealand policy does not explicitly mention the carbon or environmental impacts of increased digitalisation. Digital.Govt.NZ, n.d. Digital.Govt.NZ, 2022 |
|
Denmark |
★★★★ |
Danish policy takes a holistic approach to digitalisation and digital section emissions, with direct considerations for green ICT acquisition and support for the EU’s Green Public Procurement criteria. The Danish Government, 2022 Digitalserings Partnerskabet, 2021 Agency for Digital Government, n.d. |
|
Iceland |
★★★ |
Icelandic policy nods to sustainable procurement as a lever for green digitalisation, but provides no quantification. Nordic Council of Ministers, n.d. Government of Iceland, 2021 Stjornarrad islands, 2023. |
|
Wales |
★★★★ |
It is recognised that digitalisation will play a role in the transition to net zero in the Decarbonising Wales with digital technology website. Centre for Digital Public Services, 2022 |
Appendix 2: Summary of digital policies across 10 countries provides further detail on individual policies.
Decarbonisation impact of these policies
Policy measures to support emission reductions, adaptation or just transition
Few of the countries we studied for this research have set policy measures designed to support emission reductions, adaptation, or just transition in direct association with digital technologies.
No evidence of impact has been identified during this review. This does not prove a lack of progress or attention. There are other jurisdictions outside the scope of this research which may have evidence of policy impact. An example is the European Union Declaration on Digital Rights and Principles. This promotes digital products and services with a minimum negative impact on the environment and on society, as well as digital technologies that help fight climate change (European Commission, n.d.).
Sustainability considerations of using ICT and digital infrastructure
We have good confidence that European countries are starting to look at the sustainability considerations of using ICT and digital infrastructure.
The European Commission is leading the way in setting net zero or climate neutrality targets for certain elements of ICT infrastructure. In the “Fit for the Digital Age Strategy”, the Commission sets ambitious goals such as the climate neutrality of data centres in the EU by 2030 (European Commission, 2023). Measures to improve the circularity of digital devices and to reduce electronic waste include the Right to Repair Directive (European Commission, 2023) and the recently issued eco-design criteria for mobile phones and tablets (European Commission, 2023). These should have a corresponding positive impact on lifecycle emissions from digital technologies. Efforts are also ongoing to develop low-energy chips under the European Processor Initiative (European Processor Initiative, 2023).
The European Commission is starting to look at policy and governance around ICT direct and indirect emissions: “Until recently, the digital transition progressed with only limited sustainability considerations. To diminish adverse side effects and deliver its full potential for enabling environmental, social, and economic sustainability, the digital transition requires appropriate policy framing and governance” (European Commission, 2022).
“Digitalisation is an excellent lever to accelerate the transition towards a climate-neutral, circular, and more resilient economy. At the same time, we must put the appropriate policy framework in place to avoid adverse effects of digitalisation on the environment.” Svenja Schulze, Federal Minister for the Environment, Nature Conservation and Nuclear Safety of Germany (European Council, 2020).
Policy development programmes for datacentre best practice
We have good confidence that countries are starting to drive policy for data centre best practice.
In Estonia, the government has moved to the use of the Estonian Government Cloud (Riigipilv) for ‘Infrastructure, Platform and Software as a Service.’ Analysis of this pointed out that eliminating in-house servers and server rooms, instead relying on cloud services via data centres, offers the biggest potential for reducing emissions (Vihma, 2022). Data centres of the Estonian Government also use the ISO50001 energy management certification.
In Germany[3], the Government launched the Green IT initiative in 2008 to reduce the energy consumption and GHG emissions of its ICT operations. One objective set for the 2022 to 2027 phase of Green IT initiative includes that ‘main’ data centres (>100kW ICT load) owned by the government should meet the German Federal Government Blue Angel criteria for energy efficient data centres (Blume & Keith, 2023). From the start of the initiative, energy consumption has fallen by 49% from 649.65 GWh in 2008 to 334.54 GWh in 2021. This reduced consumption resulted in budgetary savings of €546 million (Blume & Keith, 2023).
In Denmark, the Agency for Digital Government examined which environmental requirements the public sector can include in tenders for data centres and concluded that the EU’s Green Public Procurement criteria is the most appropriate to use (Agency for Digital Government, n.d.).
In China, the Government has called for an average Power Usage Effectiveness of 1.25 in the east and 1.2 in the west of the country as part of its Eastern Data and Western Computing Project. Major cities now have maximum Power Usage Effectiveness requirements for new data centres, including Beijing (1.4), Shanghai (1.3) and Shenzhen (1.4) (IEA, 2023). Power Usage Effectiveness is the metric used to determine the energy efficiency of a data centre.
The private sector is also taking action to reduce the environmental impacts. In January 2021, date centre operators and industry association in Europe launched the Climate Neutral Data Centre Pact, pledging to make data centres climate-neutral by 2030 with intermediate (2025) targets for PUE and carbon-free energy (IEA, 2023).
Baseline assessments and monitoring
We have good confidence that there is no current framework for baseline assessment or monitoring of the environmental impact of increased digitalisation which also considers the indirect benefits and potential rebound effects.
There is a need to develop consistent metrics to measure the impact of technology on the environment (United Nations Environment Programme, 2021).
The European Commission identifies a need for a science-based assessment methodology on the ‘net environmental impact’ of increased digitalisation that consider both the benefits and the possible rebound effects (European Commission, 2022). The Commission has therefore launched dedicated research and innovation initiatives, saying that it will launch a project under Horizon Europe, to develop a methodology and common indicators for measuring the footprint of ICT (European Commission, 2023). In the UK, Building Digital UK also recognises this as a gap and will be reporting on environmental benefits of their interventions (Building Digital UK, 2023). Similarly, EU Member States are collaborating on the Toulouse call for a Green and Digital Transition in the EU. This looks to monitor the impact of digitalisation on the environment and contribute to the development of measurement tools (Presidence Francaise, 2022).
While the framework does not exist to quantify the full scope of direct and indirect effects, a number of standards exist for some elements.
Global standards to support carbon accounting in the ICT sector
There are global standards that can support carbon accounting (the method used to calculate a carbon footprint) in the ICT sector.
The main ones recognised and accepted by ICT bodies are:
- Greenhouse Gas Protocol ICT Sector Guidance. This builds on the internationally accepted GHG Protocol Product Life Cycle Accounting and Reporting Standard (GeSI and Carbon Trust, 2017).
- Recommendation ITU-T L.1470 (01/2020) (International Telecommunications Union, 2020).
- “Guidance for ICT companies setting science-based targets.” (Science Based Targets Initiative, 2022).
In summary
Our literature review has found no good examples of international experience of applying standard carbon accounting in the ICT sector, and this gap is recognised at the European Union level. Standards exist at the corporate or product level which could be adapted.
Conclusions
This work is the start of a process. As a rapid review, we were able to quickly identify information which fit our criteria, but there may be areas we have missed. Digital connectivity infrastructure and ICT are highly interconnected and overlapping with our behaviours and geography, and so this exercise has also highlighted we are having to pull together disparate pieces of information, research and case studies to try to come to conclusions. A key challenge is in understanding the “net” picture – there are disparate sources citing the means by which digital connectivity can impact on emissions, but it is not possible to combine this evidence to form a complete picture.
We were asked to research five key questions and found the following answers:
- To what extent is there evidence that investment in digital connectivity can support emissions reduction, climate adaptation and a just transition?
We have found mixed evidence of the decarbonisation impact, adaptation and just transition of digital connectivity. The sector produces direct emissions from energy consumption and generation of e-waste. This is despite the possibility that it can reduce indirect emissions through increasing efficiency and behaviour changes such as reduced travel linked to working from home. Studies point out a need for a holistic approach in calculating GHG emissions of the ICT sector, including rebound effects and emissions from the end-of-life. This would ensure indirect emissions and emissions from end-of-life are fully accounted for.
Investment in digital connectivity can support emissions reduction for those primarily industrial sectors that benefit most from efficiency. ICT technology and digitalisation can and does reduce GHG emissions in other industries. Heavy industry and the energy sector would benefit the most from digitalisation. ICT reliant on connectivity is supposed to help meet challenges of emissions reduction although there is a lack of evidence for these claims.
The ICT sector is a source of GHG emissions, which tends to be overlooked. It is our view that the reduction in indirect GHG emissions (largely driven by digitalising and making other sectors more efficient) does not negate the need to reduce the ICT sector’s direct impacts from energy consumption and generation of e-waste.
While the ICT sector focuses on the emissions associated with energy use, which is not insignificant, we have good confidence that the GHG emissions associated with e-waste are of growing concern internationally in terms of reaching climate goals. It is uncertain whether ICT’s GHG emissions reduction potential in other sectors can actually outweigh its direct emissions. It gives us only moderate confidence that the ICT sector can help reduce more emissions than are inherent in the manufacture, use and disposal of the equipment used to achieve those savings.
There is a great deal of speculation that digital technologies have the potential to aid adaptation to climate challenges, especially in rural areas, though with few concrete examples. While there is no direct evidence that investment in digital connectivity supports a just transition, there are many suggestions for mechanisms by which it might influence a just transition. One of these mechanisms is skills development, which is also recognised as a key enabler for net zero. Digital connectivity and ICT are capable of doing both good and bad, either addressing or exacerbating existing inequalities, as well as questions around access to connectivity and skills. Studies repeat the need for strong policy in this area.
- If so, what are the key mechanisms by which this could occur (for example, reduction in travel, investment in green data centres or other mechanisms suggested in the evidence)?
The key mechanisms by which ICT and digitalisation can reduce GHG emissions, as described by literature, include replacing the need to travel, although there is evidence that these savings may not be as high as first thought. The largest source of emissions from ICT equipment is e-waste, which changing standards and upgrading systems can increase. Human behaviour plays a role, either positive or negative, in the emissions from ICT and digitalisation.
- What are key examples of existing policies (in Scotland, such as in local authorities, the UK and/or international examples from comparable countries) designed to support emission reductions, adaptation and/ or just transition through digital connectivity? Is there any evidence for the impact of such policies?
No evidence of impact has been identified during this review. Many of the countries analogous to Scotland have policy that mentioned digitalisation as an enabler or essential piece of their decarbonisation, climate change or net zero agenda. None of them were accompanied by evidence of impact of their policies. This does not prove a lack of progress or attention. There are other countries outside the scope of this research that may have evidence of policy impact.
- What are the different options suggested within the literature for Scotland to provide a baseline assessment of, and monitor carbon emissions from digital infrastructure, technologies, and associated activities?
There are no good examples of what other countries are doing, and this gap is recognised at the European Union level. Standards exist at the corporate or product level, which could be adapted.
- What are the other key gaps in existing knowledge where further research is required to support digital connectivity and Scotland’s climate change goals?
Gaps include a need for a baseline assessment methodology, direct studies exploring the questions asked in this research and a consistent methodology for calculating direct and indirect emissions from ICT and digitalisation.
Gaps identified by this research
We have used specific search criteria and search words and applied them in google and google scholar. On basis of this search, we have found the following evidence gaps:
- There is no active study that has been found within this review that investigates whether investment in digital connectivity directly results in GHG emissions reduction.
There are varying approaches to quantifying direct and indirect emissions of ICT, with no academic or sector wide consensus.
There are different approaches and methodologies for calculating and comparing the GHG emissions of digital and non-digital practices and solutions, for example online versus in-person events. As an example, (Hook, et al., 2020) outlines that working from home evaluations should encompass the following:
- energy footprint
- transportation footprint
- technology footprint
- waste footprint.
The evidence we have found to investigate whether digital connectivity contributes to a just transition and the key mechanisms by which this occurs is not conclusive or good quality.
The ICT sector and literature focus on emissions reduction, with climate adaptation either an afterthought or future looking, with few real-world examples.
Case studies of digital technologies saving money, power or water in municipalities focus on the GHG emissions reduced or averted, with no acknowledgment of rebound effects, which literature states is important.
The GHG emissions associated with the collection and use of data, which is deemed to be necessary to digitalisation, are opaque and limited to specific studies on data centres. For example, the full lifecycle of the Internet of Things is not explored in the literature.
Lack of evidence of policy to address GHG emissions of e-waste e.g. from refrigerants leaking GHG.
Lack of evidence of policy to address the embedded GHG emissions from extraction of raw materials and production of the ICT equipment.
Lack of best practice for measuring, monitoring and assessing the GHG footprint of electronic communications services. The European Commission is also looking to develop this in a Horizon Europe project.
Bibliography
Aebischer & Hilty, 2015. The Energy Demand of ICT: A Historical Perspective and Current Methodological Challenges. In: ICT Innovations for Sustainability. s.l.:s.n., pp. 71-103.
Agency for Digital Government, n.d. Digital Green Transition. [Online]
Available at: https://en.digst.dk/digital-transformation/digital-green-transition/
[Accessed 30 11 2023].
Agency for Digital Government, n.d. Digital Green Transition. [Online]
Available at: https://en.digst.dk/digital-transformation/digital-green-transition/
Blume, A. & Keith, M., 2023. Germany’s green IT initiative is cutting energy consumption and GHG emissions in its public sector. [Online]
Available at: https://blogs.worldbank.org/governance/germanys-green-it-initiative-cutting-energy-consumption-and-ghg-emissions-its-public
[Accessed 30 11 2023].
Building Digital UK, 2023. Building Digital UK – environmental resource guide August 2023. [Online]
Available at: https://www.gov.uk/guidance/building-digital-uk-environmental-resource-guide-august-2023
Centre for Digital Public Services, 2022. Decarbonising Wales with digital technology. [Online]
Available at: https://digitalpublicservices.gov.wales/our-work/decarbonising-wales-digital-technology
Digital.Govt.NZ, 2022. Action Plan for the Digital Strategy for Aotearoa. [Online]
Available at: https://www.digital.govt.nz/digital-government/strategy/digital-strategy-for-aotearoa-and-action-plan/action-plan-for-the-digital-strategy-for-aotearoa/
Digital.Govt.NZ, n.d. The Digital Strategy for Aotearoa. [Online]
Available at: https://www.digital.govt.nz/digital-government/strategy/digital-strategy-for-aotearoa-and-action-plan/the-digital-strategy-for-aotearoa/
Digitalserings Partnerskabet, 2021. Visions and recommendations for Denmark as a digital pioneer. [Online]
Available at: https://en.digst.dk/media/24796/visions-and-recommendations-for-denmark-as-a-digital-pioneer-danish-government-digitisation-partnership.pdf
Dreyfuss, Gadson, Riding & Wang, n.d. The IT Productivity Paradox. [Online]
Available at: https://cs.stanford.edu/people/eroberts/cs201/projects/productivity-paradox/background.html
[Accessed 2023].
Dwivedi, et al., 2022. Climate change and COP26: Are digital technologies and information management part of the problem or the solution? An editorial reflection and call to action. International Journal of Information Management, Volume 63.
Kern et al., 2018. Sustainable software products—towards assessment criteria for resource and energy efficiency. Future Generation Computer Systems, Volume 86, pp. 199-210.
Energy Systems Catapult, 2023. Innovating to Net Zero: Digitalisation for Net Zero. [Online]
Available at: https://es.catapult.org.uk/report/innovating-to-net-zero-digitalisation-for-net-zero-emissions/
Ericsson, n.d. ICT and the climate. [Online]
Available at: https://www.ericsson.com/en/reports-and-papers/industrylab/reports/a-quick-guide-to-your-digital-carbon-footprint
Europacable, 2022. Fibre: the most energy-efficient solution to Europe’s bandwidth needs, White Paper. [Online]
Available at: https://europacable.eu/wp-content/uploads/2022/07/Europacable-Whitepaper-on-Energy-Efficiency-of-Fiber-networks-05-July-2022.pdf
European Commission, 2020. Fibre is the most efficient broadband technology. [Online]
Available at: https://digital-strategy.ec.europa.eu/en/library/fibre-most-energy-efficient-broadband-technology
European Commission, 2022. Strategic Foresight Report 2022 Twinning the green and digital transitions in the new geopolitical context. [Online]
Available at: https://eur-lex.europa.eu/legal-content/EN/TXT/PDF/?uri=CELEX:52022DC0289
European Commission, 2022. Study on Greening Cloud Computing and Electronic Communications Services and Networks: Towards Climate Neutrality by 2050. [Online]
Available at: https://digital-strategy.ec.europa.eu/en/library/study-greening-cloud-computing-and-electronic-communications-services-and-networks-towards-climate
European Commission, 2023. Circular economy: New rules to make phones and tablets more durable, energy efficient and easier to repair, enabling sustainable choices by consumers. [Online]
Available at: https://ec.europa.eu/commission/presscorner/detail/en/ip_23_3315
European Commission, 2023. Report on the state of the Digital Decade 2023. [Online]
Available at: https://eur-lex.europa.eu/legal-content/EN/TXT/HTML/?uri=CELEX:52023DC0570
European Commission, 2023. Right to repair: Commission introduces new consumer rights for easy and attractive repairs. [Online]
Available at: https://ec.europa.eu/commission/presscorner/detail/en/ip_23_1794
European Commission, n.d. European Digital Rights and Principles. [Online]
Available at: https://digital-strategy.ec.europa.eu/en/policies/digital-principles
European Council, 2020. Digitalisation for the benefit of the environment: Council approves conclusions. [Online]
Available at: https://www.consilium.europa.eu/en/press/press-releases/2020/12/17/digitalisation-for-the-benefit-of-the-environment-council-approves-conclusions/
European Processor Initiative, 2023. Framework partnership agreement in European low-power microprocessor technologies. [Online]
Available at: https://www.european-processor-initiative.eu/
European Union Digital Skills and Jobs Platform, 2023. Estoanian Digital Agenda 2030. [Online]
Available at: https://digital-skills-jobs.europa.eu/en/actions/national-initiatives/national-strategies/estonia-estonian-digital-agenda-2030
European Union Digital Skills and Jobs Platform, 2023. Finland: a snapshot of digital skills. [Online]
Available at: https://digital-skills-jobs.europa.eu/en/latest/briefs/finland-snapshot-digital-skills
Eurostat, n.d. Glossary:Global-warming potential (GWP). [Online]
Available at: https://ec.europa.eu/eurostat/statistics-explained/index.php?title=Glossary:Global-warming_potential_(GWP)
Exponential Roadmap Initiative, 2023. Exponential Climate Roadmap. [Online]
Available at: http://www.exponentialroadmap.org/
Finnish Government, 2022. Government report on the digital compass sets the course for Finland’s digital transformation. [Online]
Available at: https://valtioneuvosto.fi/en/-/10623/government-report-on-the-digital-compass-sets-the-course-for-finland-s-digital-transformation
Freitag, et al., 2021. The real climate and transformative impact of ICT: A critique of estimates, trends, and regulations. Patterns, Volume 3, Issue 8.
Friends of Europe, 2021. Connected Europe: A digital brand for a just transition. [Online]
Available at: https://www.friendsofeurope.org/insights/connected-europe-a-digital-brand-for-a-just-transition/
GeSI and Carbon Trust, 2017. ICT Sector Guidance built on the GHG Protocol Product Life Cycle Accounting and Reporting Standard. [Online]
Available at: https://ghgprotocol.org/sites/default/files/2023-03/GHGP-ICTSG%20-%20ALL%20Chapters.pdf
Global Enabling Sustainability Initiative, 2020. Portugal joins Digital With Purpose to unite sustainability with technology. [Online]
Available at: https://gesi.org/posts/portugal-joins-digital-with-purpose-to-unite-sustainability-with-technology
Government of Canada, 2022. Canada’s Digital Ambition 2022. [Online]
Available at: https://www.canada.ca/en/government/system/digital-government/government-canada-digital-operations-strategic-plans/canada-digital-ambition.html
Government of Iceland, 2021. Policies and Strategies. [Online]
Available at: https://www.government.is/topics/information-technology/policies/
Harvard Business Review, 2022. Is Remote Work Actually Better for the Environment?. [Online]
Available at: https://hbr.org/2022/03/is-remote-work-actually-better-for-the-environment
HCL Tech, 2021. Artificial Intelligence, defined in simple terms. [Online]
Available at: https://www.hcltech.com/blogs/artificial-intelligence-defined-simple-terms
Hischier, R. & Wager, P., 2014. The Transition from Desktop Computers to Tablets: A Model for Increasing Resource Efficiency?. In: ICT Innovations for Sustainability. Advances in Intelligent Systems and Computing. s.l.:s.n.
Hook, A., Court, V., Sovacool, B. K. & Sorrell, S., 2020. A systematic review of the energy and climate impacts of teleworking. Environmental Research Letters, 15(9).
HP Enterprise, n.d. Workload. [Online]
Available at: https://www.hpe.com/us/en/what-is/workload.html
IBM, 2023. What is artificial intelligence (AI)?. [Online]
Available at: https://www.ibm.com/topics/artificial-intelligence
IEA, 2023. Data Centres and Data Transmission Networks. [Online]
Available at: https://www.iea.org/energy-system/buildings/data-centres-and-data-transmission-networks
IEA, n.d. Net Zero Emissions by 2050 Scenario (NZE). [Online]
Available at: https://www.iea.org/reports/global-energy-and-climate-model/net-zero-emissions-by-2050-scenario-nze
IEA, n.d. Tracking Clean Energy Progress 2023. [Online]
Available at: https://www.iea.org/reports/tracking-clean-energy-progress-2023#methodology
[Accessed 08 12 2023].
International Energy Agency, 2023. Data Centres and Data Transmission Networks. [Online]
Available at: https://www.iea.org/energy-system/buildings/data-centres-and-data-transmission-networks
International Telecommunications Union, 2020. ITU-T Recommendations. [Online]
Available at: https://www.itu.int/ITU-T/recommendations/rec.aspx?rec=14084
International Telecommunications Union, 2020. The Global E-waste Monitor 2020. [Online]
Available at: https://www.itu.int/en/ITU-D/Environment/Documents/Toolbox/GEM_2020_def.pdf
Itten, et al., 2020. Digital transformation—life cycle assessment of digital services, multifunctional devices and cloud computing. The International Journal of Life Cycle Assessment, Volume 25, p. 2093–2098.
Lavi, H., 2022. Measuring greenhouse gas emissions in data centres: the environmental impact of cloud computing. [Online]
Available at: https://www.climatiq.io/blog/measure-greenhouse-gas-emissions-carbon-data-centres-cloud-computing
[Accessed 30 11 2023].
Lin, B. & Huang, C., 2023. Nonlinear relationship between digitization and energy efficiency: Evidence from transnational panel data. Energy, Volume 276.
Ministry of Finance Finland, n.d. Sustainable Growth Programme for Finland – boosting reforms and investments. [Online]
Available at: https://vm.fi/en/sustainable-growth-programme-for-finland
National Grid, 2023. How much of the UK’s energy is renewable?. [Online]
Available at: https://www.nationalgrid.com/stories/energy-explained/how-much-uks-energy-renewable#:~:text=20%20April%202023%20saw%20the,achieved%20on%2018%20September%202023.
NGI, 2020. Internet of Waste: The case for a green digital economy. [Online]
Available at: https://media.nesta.org.uk/documents/Internet_of_Waste_-_The_case_for_a_green_digital_economy_1.pdf
Nordic Council of Ministers, n.d. Report: A study of the digital green transition in the Nordic Baltic countries. [Online]
Available at: https://en.digst.dk/media/27140/bilag-3a-study-of-the-digital-green-transition-in-the-nordic-baltic-countries.pdf
Norway and European Union, n.d. Norway EU Green Alliance. [Online]
Available at: https://www.regjeringen.no/contentassets/debc1b0c0a2f47d1b77beb96d896cf45/20230420eu-norway-green-alliance-final.pdf
Norway Grants, n.d. Estonia – Green ICT. [Online]
Available at: https://eea.innovationnorway.com/article/estonia-green-ict
Norwegian Minstry of Foreign Affairs, n.d. Digitalisation for Development: Digital strategy for Norwegian development policy. [Online]
Available at: https://www.regjeringen.no/globalassets/departementene/ud/dokumenter/utvpolitikk/digital_strategynew.pdf
OECD Library, 2023. Information and communication technology (ICT). [Online]
Available at: https://www.oecd-ilibrary.org/science-and-technology/information-and-communication-technology-ict/indicator-group/english_04df17c2-en
OECD, 2018. OECD Reviews of Digital Transformation. [Online]
Available at: https://www.oecd.org/sweden/going-digital-in-sweden.pdf
Ontario, 2020. Ontario Onwards. [Online]
Available at: https://files.ontario.ca/tbs-ontario-onwards-action-plan-en-2020-10-18.pdf
Ontario, n.d. Building a Digital Ontario. [Online]
Available at: https://www.ontario.ca/page/building-digital-ontario#section-0
Osoro, O., Oughton, E., Wilson, A. & Rao, A., 2023. Sustainability assessment of Low Earth Orbit (LEO) satellite broadband mega-constellations. [Online]
Available at: https://arxiv.org/abs/2309.02338
Portugal Digital, 2020. Action Plan for the Digital Transition: Strategy for the digital transition in Portugal. [Online]
Available at: https://portugaldigital.gov.pt/plano-de-acao-para-a-transicao-digital/
Presidence Francaise, 2022. Toulouse Call for a Green and Digital Transition in the EU. [Online]
Available at: https://www.economie.gouv.fr/files/files/2022/Call_for_Green_Digital_Transition_EU.PDF
Regeringskansliet, 2010. ICT for a greener administration – ICT agenda for the environment 2010–2015. [Online]
Available at: https://www.government.se/contentassets/4a75c8132fb84313a6a0d2f08a04ab76/ict-for-a-greener-administration—ict-agenda-for-the-environment-2010-2015-n2010.31
Riley, R. et al., 2021. Emissions impact of home working in Scotland, s.l.: Climate X Change.
Royal Society, 2020. Computing for net zero: how digital technology can create a ‘control loop for the protection of the planet’. [Online]
Available at: https://royalsociety.org/-/media/policy/projects/climate-change-science-solutions/climate-science-solutions-computing.pdf
Science Based Targets Initiative, 2022. Information and Communication Technology (ICT). [Online]
Available at: https://sciencebasedtargets.org/sectors/ict
Scottish Environmental Protection Agency, 2023. Scotland’s industrial greenhouse gas emissions revealed for 2022. [Online]
Available at: https://media.sepa.org.uk/media-releases/2023/scotlands-industrial-greenhouse-gas-emissions-revealed-for-2022/
Scottish Government, 2021. A changing nation: how Scotland will thrive in a digital world. [Online]
Available at: https://www.gov.scot/publications/a-changing-nation-how-scotland-will-thrive-in-a-digital-world/
Scottish Government, 2021. Green datacentres and digital connectivity: vision and action plan for Scotland. [Online]
Available at: https://www.gov.scot/publications/green-datacentres-and-digital-connectivity-vision-and-action-plan-for-scotland/
Scottish Government, 2021. Scottish Greenhouse Gas Statistics 2021, s.l.: s.n.
Scottish Government, 2023. Climate Change Plan Monitoring Report 2023: Electricity. [Online]
Available at: https://www.gov.scot/publications/climate-change-monitoring-report-2023/pages/3/#:~:text=Scotland%20has%20made%20significant%20progress,for%20the%20years%202017%2D%202020.
Scottish Government, 2023. Publication – Statistics Supply, Use and Input-Output Tables: 1998-2020. [Online]
Available at: https://www.gov.scot/publications/input-output-latest/
Siemens, n.d. Messages from 2030 Sweden: A picture of transformation. [Online]
Available at: https://assets.new.siemens.com/siemens/assets/api/uuid:3731ed91-6429-4cfb-bd02-b51cb9791ed7/Siemens-Report-Picture-of-Transformation.pdf
Social Progress Imperative, 2022. Just Transition Score. [Online]
Available at: https://www.socialprogress.org/static/e1977d5b833d24ddcfd4a0ad381262f9/Just%20Transition%20Score%20-%20Social%20Progress%20Imperative-%202022.pdf
Statista, 2023. Annual growth in global air traffic passenger demand from 2006 to 2022, with forecasts until 2023. [Online]
Available at: https://www.statista.com/statistics/193533/growth-of-global-air-traffic-passenger-demand/
Stjornarrad islands, 2023. Opinber innkaup / Public procurement. [Online]
Available at: https://www.stjornarradid.is/verkefni/rekstur-og-eignir-rikisins/opinber-innkaup/
TechUK, 2018. The UK’s core digital infrastructure: Data Centres Climate Change Adaptation and Resilience. [Online]
Available at: https://assets.publishing.service.gov.uk/media/5a81ce26e5274a2e8ab55eb7/climate-adrep-tech-uk.pdf
The Danish Government, 2022. National Strategy for Digitalisation. [Online]
Available at: https://en.digst.dk/media/27861/national-strategy-for-digitalisation-together-in-the-digital-development.pdf
UNEP, 2021. With new pact, tech companies take on climate change. [Online]
Available at: https://www.unep.org/news-and-stories/story/new-pact-tech-companies-take-climate-change
United Nations Development Programme, 2023. Four ways digital can power a just energy transition. [Online]
Available at: https://www.undp.org/blog/four-ways-digital-can-power-just-energy-transition
United Nations Environment Programme, 2021. With new pact, tech companies take on climate change. [Online]
Available at: https://www.unep.org/news-and-stories/story/new-pact-tech-companies-take-climate-change
Vihma, P., 2022. The carbon footprint of Estonian digital puublic services. [Online]
Available at: https://e-estonia.com/carbon-footprint-of-estonian-digital-public-services/
[Accessed 30 11 2023].
Wang, H., Yang, G. & Yue, Z., 2023. Breaking through ingrained beliefs: revisiting the impact of the digital economy on carbon emissions. Humanities and Social Sciences Communications, Volume 10.
Wang, J., Wang, K., Dong, K. & Shahbaz, M., 2022. How does the digital economy accelerate global energy justice? Mechanism discussion and empirical test. Energy Economics, Volume 114.
Welsh Government, 2022. Stronger, Fairer, Greener Wales. [Online]
Available at: https://www.gov.wales/sites/default/files/publications/2022-05/stronger-fairer-greener-wales-plan-employability-and-skills0.pdf
Williams, L., Sovacool, B. & Foxon, T., 2022. The energy use implications of 5G: Reviewing whole network operational energy, embodied energy, and indirect effects. Renewable and Sustainable Energy Reviews, 157(112033).
World Bank, 2022. How broadband infrastructure impacts greenhouse gas emissions: A Chile case study. [Online]
Available at: https://blogs.worldbank.org/digital-development/how-broadband-infrastructure-impacts-greenhouse-gas-emissions-chile-case-study
World Economic Forum, 2021. This year’s e-waste to outweigh Great Wall of China. [Online]
Available at: https://www.weforum.org/agenda/2021/10/2021-years-e-waste-outweigh-great-wall-of-china/
World Economic Forum, 2022. Digital Tech Can Reduce Emissions by up to 20% in High-Emitting Industries. [Online]
Available at: https://www.weforum.org/press/2022/05/digital-tech-can-reduce-emissions-by-up-to-20-in-high-emitting-industries/#:~:text=World%20Economic%20Forum-,Digital%20Tech%20Can%20Reduce%20Emissions%20by,20%25%20in%20High%2DEmitting%20Industries&text=Davos%2DKloste
Appendix 1: Detailed methodology and approach to the research
This Annex details the methodologies developed and used to complete this research project.
Definitions
The scope of this project defines ‘climate change’ as including Scotland’s interim and 2045 Net zero and emissions reduction targets. Although just transition and adaptation are important policy areas, the steering group wished to focus primarily on Net zero targets and emissions reduction with this research. The Steering Group also emphasised the need to only include information and projects that were current and operating, not theoretical.
By ‘digital connectivity’, we include the following:
Infrastructure
- fixed broadband (including subsea fibre, trunk or backhaul fibre, and access fibre)
- mobile connectivity (including 4G and 5G macro and 5G small cells)
- Datacentres Application, use and behaviours.
- existing applications such as artificial intelligence (AI) and Internet of Things (IoT)
- data-driven products and services
- practices such as working from home that are enabled by digital connectivity.
Geographical scope
- in Scotland and/or serves Scotland
- where there is applicable learning for Scotland.
Key dependencies
- digital skills
- renewable energy
These are all encompassed in our Figure 1 – The landscape of digital connectivity defined as within scope of this research. on page 14 of this report.
Literature review
Search terms
The search terms we used were agreed by the Steering Group on 24th October 2023, these are set out below under the subheadings of Infrastructure, Application, use and behaviour, Geographical scope, and Key dependencies. We used Google and Google Scholar search engines.
Infrastructure:
- Digital connectivity infrastructure strategy
- Digital connectivity infrastructure policy
- Digital connectivity and climate change
- Digital transformation
- Broadband strategy
- Broadband policy
- Mobile network strategy
- Mobile network policy
- 5G strategy
- 5G policy
- Remote digital connectivity
- Rural digital connectivity
- Digital connectivity national plan
- Digital connectivity policy
- Economy strategy + datacentres (looking for links to environmental topics)
- Datacentres as opportunities for economic growth (looking for links to environmental topics)
- National Data Strategy (looking for links to environmental topics)
- Security of data infrastructure (looking for links to environmental topics)
- Resilience of data infrastructure (looking for links to environmental topics)
- Net zero digital connectivity infrastructure
- Net zero broadband infrastructure
- Net zero mobile network infrastructure
- Net zero datacentres
- Green digital connectivity infrastructure
- Green broadband infrastructure
- Green mobile network infrastructure
- Green datacentres
- ‘distribution’, ‘fairness’, ‘equality’ or ‘just transition’ of digital connectivity infrastructure
- ‘distribution’, ‘fairness’, ‘equality’ or ‘just transition’ of broadband infrastructure
- ‘distribution’, ‘fairness’, ‘equality’ or ‘just transition’ of mobile network infrastructure
- ‘distribution’, ‘fairness’, ‘equality’ or ‘just transition’ of datacentres
- Environmental impacts of digital connectivity infrastructure
- Environmental impacts of broadband infrastructure
- Environmental impacts of mobile network infrastructure
- Environmental impacts of datacentres
- Environmental footprint of digital connectivity infrastructure
- Environmental footprint of digital networks
- Sustainable digital infrastructure
- Sustainable broadband
- Digital carbon footprint
- Carbon emissions of datacentres
- Carbon emissions of digital connectivity infrastructure
- Carbon emissions of home working
- Environmental payback of digital connectivity infrastructure
- Environmental payback of broadband infrastructure
- Environmental payback of mobile network infrastructure
- Environmental payback of datacentres
- Life cycle assessment of working from home.
- Defra carbon factors for working from home.
- Life cycle assessment of broadband
- Life cycle assessment of mobile phones / mobile network infrastructure
- Life cycle assessment of datacentres
- Energy intensity of digital connectivity infrastructure
- Energy intensity of broadband infrastructure
- Energy intensity of mobile network infrastructure
- Energy intensity of datacentres
- Environmental sustainability of digital connectivity infrastructure
- Environmental sustainability of broadband infrastructure
- Environmental sustainability of mobile phones / mobile network infrastructure
- Environmental sustainability of datacentres.
Application, use and behaviours
- AI strategy
- Internet of Things (usually in the digital strategy and linked to Environmental departments of councils, waste etc).
- Working from home strategies across business groups and government.
Geographical Scope:
- The analysis of policies was focused on:
- Scotland
- Finland,
- Wales,
- Portugal,
- Norway,
- Sweden,
- Estonia,
- Canada (Ontario),
- New Zealand,
- Denmark and
- Iceland
These jurisdictions have topological and population density scale comparisons with Scotland and are likely to face similar digital connectivity issues (land mass, areas of low population density, rural communities).
Some further findings on China were identified as part of the research and included in the report.
Key dependencies
Key dependencies were discussed as part of the scoping analysis as follows:
- Digital skills strategies – from school age to beyond in target countries
- Government skills strategies
- Government “digital transformation” strategies – usually local government
- Digital inclusion strategies
- Renewable energy strategy (to see if there’s a link to digital)
- National Grid and Distribution Network Operators / Distribution System Operator and their requirements for digital connectivity (fixed and mobile)
Methodology for policy review
We undertook a desk review of existing policies from countries within our scope. We looked for whether their policies were designed to support emission reductions, adaptation or just transition through digital connectivity. Section 7 presents our results and uses a score to rate the extent that digital connectivity and emissions reduction is linked within a country’s policy, with five being explicit mention of the GHG or carbon impacts of increased digitalisation and one being no mention or linking of decarbonisation within the policy.
Table 3 – Key of star ratings used to assess country policies and their link between digital connectivity and emissions reduction.
|
★ |
No mention of decarbonisation within digital connectivity policy. |
|
★★ |
Minor mention of decarbonisation in the digital connectivity policy. |
|
★★★ |
Digitalisation recognised or reported as a contributor to green transition, but no mention of the GHG impacts of digitalisation. |
|
★★★★ |
Digitalisation and decarbonisation linked heavily, and mentions of wider coloration with other decarbonisation initiatives, e.g., through EU green IT community |
|
★★★★★ |
As the above, also with explicit mention of the GHG or carbon impacts of increased digitalisation. |
Assessment of confidence
Following a methodology developed by the Intergovernmental Panel on Climate Change for the fifth assessment report and used for the sixth for the consistent treatment of uncertainties, we developed a confidence level based on the extent of agreement in the literature and the robustness of evidence. Figure 3 on page 15 sets out what constitutes low, moderate, and good confidence in our claims.
- Low agreement is where sources conflict.
- Medium agreement is where sources make broadly similar conclusions but the data or evidence they use to support their conclusions is very different.
- High agreement is where sources independently make similar conclusions and underlying data are similar despite being independent.
- Limited evidence is some evidence available but largely anecdotal and not from recognised peer reviewed sources. Availability of data was low.
- Medium evidence is information from peer reviewed sources or official sources.
- Robust evidence is a greater volume of information from peer reviewed sources and official sources.
Appendix 2: Summary of digital policies across 10 countries.
A summary of digital policies and their links with decarbonisation, across 10 countries selected based on the methodology in Section 4. The degree to which each country links their digital goals and strategy has been given a score, with five representing explicit mention of the GHG or carbon impacts of increased digitalisation, and one representing no mention or linking of decarbonisation within the policy.
The policies from the individual countries are presented in Appendix 2: Summary of digital policies across 10 countries.
Some policies explicitly mentioned a just transition, and reference to adaptation was not found in any of the policies we were able to identify. See Section 7.2.3 for specific comment on data centre related policy.
Finland
Score: five – digitalisation and decarbonisation linked heavily, and mentions of wider collaboration with other decarbonisation initiatives as well as of the GHG or carbon impacts of increased digitalisation.
Finnish policy does connect increased digitalisation with helping the green transition, but there is no explicit mention of the carbon impact of increased digitalisation on the environment.
The Finnish Government: Digital Compass was drawn up for the purpose of managing the development of the digital transformation in Finland. Based on European values and the Digital Decade 2030 programme. Promotes an economically, socially and ecologically sustainable digital green transition (Finnish Government, 2022).
Objective 9 of the Digital Compass states that Finland develops and applies digital technologies that respond to global climate and environmental challenges (European Union Digital Skills and Jobs Platform, 2023).
Ministry of Finance Finland: Sustainable Growth Programme for Finland aims to support growth that is ecologically, socially and economically sustainable in line with the aims of the Govt Programme. Funding will come mainly from EU Recovery Plan ‘Next Generation EU’ – one of four key elements ‘Digitalisation and a digital economy will strengthen productivity and make services available to all’ (Ministry of Finance Finland, n.d.)
Portugal
Score: two – minor mention of decarbonisation in the digital connectivity policy.
Portugal says digitalisation will contribute to decarbonisation.
Portugal’s Action Plan for Digital Transition (Measure 9) speaks to increased digitalisation of public services, which it reports will contribute to decarbonisation and environmental benefits. (Portugal Digital, 2020)
Portuguese Secretary of State for the Digital Transition has partnered with Digital With Purpose (2020 onwards) to acknowledge and deliver digital sustainability. (Global Enabling Sustainability Initiative, 2020)
Norway
Score: two – minor mention of decarbonisation in the digital connectivity policy.
Norwegian policy connects increased digitalisation with aiding the green transition.
The Norwegian Ministry for Foreign Affairs, Digitalisation for Development, Digital Strategy for Norwegian Digital Policy acknowledges climate change as an important priority but doesn’t directly acknowledge the climate impacts of ICT (Norwegian Minstry of Foreign Affairs, n.d.).
The Norway-EU Green Alliance acknowledges that digital transition is important for and contributes to the green transition (Norway and European Union, n.d.).
Sweden
Score: four – digitalisation and decarbonisation linked heavily, and mentions of wider collaboration with other decarbonisation initiatives.
Swedish policy links the use of ICT to decarbonisation effects, as well as acknowledging decarbonisation, circularity, conscious choices, and the energy transition as drivers for a sustainable world.
The Swedish Government’s ICT for a Greener Administration report outlined the importance of acquisition and public procurement, use of ICT in government agencies and digital tools to reduce business travel (OECD, 2018).
The focus of the Swedish Information Society policy is, among other things, to use ICT to promote sustainable growth (Regeringskansliet, 2010).
Estonia
Score: five – digitalisation and decarbonisation linked heavily, and mentions of wider collaboration with other decarbonisation initiatives as well as of the GHG or carbon impacts of increased digitalisation.
Estonian policy contains a clear and explicit mention of the carbon effects of increased digital footprints, and provides a commitment to reduce the effects.
The Estonian Digital Agenda 2030 stresses the activities of the Estonian development plan contribute through the use of innovative technologies and environmentally friendly solutions to reduce the impact of climate change. They are also meant to reduce the time required for covering distances and ensure a good living environment all across Estonia.
The Estonian government also has Green Digital Government Commitments, stating “we analyse the environmental impact of the Estonian digital government and ways to reduce it” (European Union Digital Skills and Jobs Platform, 2023).
Canada (Ontario)
Score: one – no mention of decarbonisation within digital connectivity policy.
Canadian policy contains no mention of the carbon or environmental impact of increased digitalisation.
Canada’s Digital Ambition 2022 mentions at a high level that their Digital Ambition aligns with the Greening Government Strategy – but delivery on specific plans is unclear from published policy and strategy (Government of Canada, 2022).
The Building a Digital Ontario – Ontario’s Digital Strategy does not mention environmental protection or any digital sector emissions (Ontario, n.d.).
The Ontario Onwards Action plan mentions the importance of environmental protection, but does not specifically link environmental protection with digital and sustainability.
“The Government of Canada’s Digital Ambition goes hand in hand with the Greening Government Strategy, which seeks to make Government of Canada’s operations low carbon through green procurement and clean technologies. Through the increased promotion of environmental sustainability, and by integrating environmental considerations in its procurement process, the federal government is in a position to influence the demand for environmentally preferable goods and services” (Ontario, 2020).
New Zealand
Score: one – no mention of decarbonisation within digital connectivity policy.
New Zealand policy does not explicitly mention the carbon or environmental impacts of increased digitalisation.
The Digital Strategy for Aotearoa proclaims: “we use data and digital technology to address big issues of our time like climate change. We also want the tech sector to play a key role in creating a more equitable, low-carbon future.” (Digital.Govt.NZ, n.d.)
However sustainable delivery or green ICT is not noted in any of the flagship initiatives of the Action Plan for the Digital Strategy for Aotearoa (Digital.Govt.NZ, 2022).
Denmark
Score: four – digitalisation and decarbonisation linked heavily, and mentions of wider collaboration with other decarbonisation initiatives.
Danish policy takes a holistic approach to digitalisation and digital section emissions, with direct considerations for green ICT acquisition and support for the EU’s Green Public Procurement criteria.
The Danish Ministry of Finance’s National Strategy for Digitalization focuses on digital as an enabler and doesn’t consider the impact of digital emissions (The Danish Government, 2022).
The “Visions and Recommendations for Denmark as a Digital Pioneer” document focusses on digitising energy and utility data as a prerequisite to understand the impact of increased digital connectivity. Heavier focus on using digital to achieve green transition (Digitalserings Partnerskabet, 2021).
The Agency for Digital Government – Digital Green Transition lays out plans for the EU’s Green Public Procurement criteria to have been tested throughout 2022 and 2023 (Agency for Digital Government, n.d.).
The Study on the Digital Green Transition in the Nordic-Baltic Countries does not explicitly mention the quantification of spend vs emissions (Agency for Digital Government, n.d.).
Iceland
Score: three – digitalisation recognised or reported as a contributor to green transition, but no mention of the GHG impacts of digitalisation.
Icelandic policy nods to sustainable procurement as a lever for green digitalisation, but provides no quantification.
The Digital Green Transition – Government of Iceland sets out the Icelandic ambition to leverage digital effects to achieve and accelerate the green transition (Nordic Council of Ministers, n.d.) (Government of Iceland, 2021) (Stjornarrad islands, 2023)
Wales
Score: four – digitalisation and decarbonisation linked heavily, and mentions of wider collaboration with other decarbonisation initiatives.
It is recognised that digitalisation will play a role in the transition to net zero in the Decarbonising Wales with digital technology website.
The policy for Wales also mentions a just transition and how skills are central to that (Centre for Digital Public Services, 2022).
Tech Net Zero discovery investigated greener government and third sector tech report came up with 6 recommendations of how public services could use digital technologies to reach net zero, one of which was to measure the carbon footprint of a digital service (Centre for Digital Public Services, 2022).
© Published by Frazer-Nash Consultancy, 2024 on behalf of ClimateXChange. All rights reserved.
While every effort is made to ensure the information in this report is accurate, no legal responsibility is accepted for any errors, omissions or misleading statements. The views expressed represent those of the author(s), and do not necessarily represent those of the host institutions or funders.
Double Diamond Model: what is it? – Justinmind ↑
Using the supply, use and input-output tables and 2019 data coupled with the Greenhouse Gas Effects 2024-2025 (Scottish Government, 2023) and includes the direct and indirect carbon dioxide equivalent emissions of the following sectors: Computers, electronics and opticals; Telecommunications; Computer services; and Information services. ↑
Whilst undertaking the research to support this statement we have identified additional information, beyond the scope of our initial research, for Germany and China. ↑
December 2023
DOI: http://dx.doi.org/10.7488/era/4512
Executive summary
Background
Scotland recognises the significance of a place-based transition to net zero greenhouse gas emissions (GHG). As part of setting a target of net zero by 2045, the Climate Change (Scotland) Act 2009 places importance on the role of local authorities in achieving this target. Therefore, it is a priority for the Scottish Government to facilitate area-wide and locally-led efforts as part of a just transition to net zero.
Across the 32 local authorities in Scotland, 17 have set net zero targets specific to tackling territorial GHG emissions generated in their geographical area (from agriculture, buildings, industry, land use and land use change and forestry, transport and waste). This is in direct comparison to 26 local authorities that have set net zero targets to reduce their organisational GHG emissions.
This research examines local authority climate-relevant strategies and policies within them; the potential of these policies to reduce emissions if they were scaled to the national level; and the barriers that local authorities face in implementing these policies.
Main findings
We developed a register of 69 climate change strategies across all 32 local authorities. We found that local authorities are modelling exemplary action on climate change across many fronts through the benefit of deep-rooted relationships with local stakeholders and unparalleled knowledge of their area.
However, the level of detail and methodological evidence presented in climate change strategies are often sparse, with many strategies failing to model the scale of impact on GHG emissions.
From the 69 climate-related strategies, we selected six leading strategies for quantification and identified 13 policies within these that could be appropriate for scaling up. We undertook an initial estimate of the potential territorial emission reduction if they were replicated across all Scottish local authorities. We also assessed the likelihood for change at this scale, considering local authorities’ sphere of control, capacity and timescales, alongside the magnitude of potential change. Through this process we identified two policy areas with the potential for major impact on territorial greenhouse gas emissions:
- Nature-based solutions: a combination of individual policies to green derelict land, restore damaged peatland and afforestation.
- Net zero transport: several climate policy initiatives such as active transport, decarbonisation of public transport and low-emission vehicle licences for taxis.
The impact on Scotland’s national territorial emissions, should all local authorities adopt the leading policies, from nature-based solutions (5,497 ktCO2e) and net zero transport (1,527 ktCO2e) amounts to an estimated total potential reduction of 7,024 ktCO2e by 2045. This is an indicative figure, illustrating the scale of change that could be possible.
We found that the Scottish Government have set a compelling ambition to closely support local authorities to develop locally owned and led climate action strategies to tackle territorial emissions.
However, we also found that local authorities are limited by a lack of clarity on their roles and responsibilities, and by a lack of best practice guidance or frameworks across all the territorial emission categories. They face barriers including lack of data maturity, capacity, specialist skills, accountability and funding.
Recommendations
Local authorities could be further supported to develop their climate policies. We recommend the establishment of best practice guidance on the development of climate policies. This would help improve clarity and consistency across local authorities.
Further research could expand on the capacity and capability requirements to deliver local authority climate policies between now and 2045, including methods by which the resourcing needs could be met. Further investigation could help quantify the funding available for tackling each GHG inventory, where further funding might best be directed and methods for administrating funding to ensure that national ambitions can be met.
Glossary and abbreviations
|
BEIS |
Department for Business, Energy and Industrial Strategy |
|
ktCO2e |
Kilo-tonnes of carbon dioxide equivalent |
|
DESNZ |
Department for Energy Security and Net Zero |
|
GHG |
Greenhouse gas |
|
GHGI |
Greenhouse gas inventory |
|
IPCC |
Intergovernmental Panel on Climate Change |
|
KPI |
Key performance indicator |
|
LA |
Local authority |
|
LEZ |
Low emission zone |
|
LHEES |
Local Heat and Energy Efficiency Strategies |
|
LULUCF |
Land use, land use change and forestry |
|
SIC |
Standard Industrial Classification |
|
SSN |
Sustainable Scotland Network |
Introduction
Context
The recent parliamentary inquiry into the role of local government in delivering net zero stressed that it will be impossible for Scotland to reach net zero without local leadership spearheading area-wide decarbonisation efforts (Net Zero, Energy and Transport Committee, 2023). The inquiry recognised that achieving net zero cannot be dictated. It requires a collective effort between local government, which holds the local knowledge and fruitful partnerships across the public and private sectors, and national government which have the strategic capabilities and resources to support and coordinate local efforts.
The Scottish Government is continuing the drive toward empowering, building capacity, and providing the necessary foundations for local government to build their net zero programmes. The parliamentary inquiry also established that, while councils have at times been a model for net zero leadership, this needs to be rapidly scaled across all local authorities and all emission sectors in each local authority. The inquiry report noted that the Scottish Government must facilitate this scaling by providing local authorities with a comprehensive roadmap for net zero and “far more certainty than they have at present about the roles they are to play” (Net Zero, Energy and Transport Committee, 2023).
The Duties of Public Bodies: Reporting Requirements Order placed responsibilities on all public bodies, including local authorities, to report on scope 1 and 2 (and some scope 3) organisational emissions (Climate Change Order, 2015). As a result, all 32 local authorities have developed organisational emission inventories and in 2022 the Accounts Commission reported that 26 local authorities had developed organisational net zero targets (Audit Scotland, 2022). However, local authorities have some influence on certain emissions reduction beyond their organisational boundaries. These emissions produced within a local authority’s geographical area of responsibility are referred to as ‘territorial emissions’. Only 17 local authorities have developed territorial net zero targets and even fewer have developed policies for reducing territorial emissions. If this situation persists, it will present a major barrier to the success of Scotland’s national Climate Change Plan, which is heavily reliant on place-based and locally-led action (Scottish Government, 2020).
In their recent progress update to parliament, the Climate Change Committee noted that “momentum on a local level is increasing, but local action is uncoordinated” (Climate Change Committee, 2022, p. 53). There are pockets of exemplary action but also a lack of knowledge sharing across local authorities. This has led to policies being rolled out with different timescales, best practice not being disseminated and opportunities being missed to drive coordinated action across all local authorities. In November 2023 the Scottish Government launched a new Scottish Climate Intelligence Service to support local authorities to build capacity and capability for the development of area-wide programmes of emissions reduction for the benefit of their communities. This service will enable local authorities to deliver their own area-wide territorial net zero targets and to contribute to Scotland’s national commitment to net zero by 2045 (Improvement Service, 2023).
This research addresses some of the identified challenges by analysing the climate policies local authorities have developed to directly tackle territorial GHG emissions, and mapping their potential impact on territorial GHG emissions.
Project aims and research questions
The first aim of this project was to identify key GHG emission reduction policies developed by Scottish local authorities. We developed a comprehensive register of local authority climate-related strategies and associated policies and described the current action being taken by each local authority across all emission categories.
The second aim was to compile and undertake an initial estimate of the policies’ GHG emission reduction potential at both the local authority and national level. This aim was broken down into three sub-questions. Firstly, to identify what the key policies are that have significant GHG emission reduction potential. Secondly, to estimate their emissions reduction potential within their respective local authorities. Thirdly, to estimate what the emission reduction potential would be, should they be applied across all Scottish local authorities. This type of analysis has previously been conducted by the Edinburgh Climate Commission and Place-based Climate Action Network, although this was only in relation to policy scenarios at the local level (Williamson, et al., 2020).
The third aim was to engage with local authorities through a series of semi-structured interviews to understand how the most significant policies could be implemented across Scotland, including the role of Scottish Government and other public bodies in enabling this.
Overall, this project highlights area-based policy options for Scottish Government to consider for national deployment, whether as a statutory instrument, as in the case of Local Heat and Energy Efficiency Strategies (LHEES), or via other delivery approaches such as frameworks or guidance.
Defining the greenhouse gas emission inventory
The UK greenhouse gas inventory (GHGI) is published annually by the Department for Energy Security and Net Zero (DESNZ) and sets out the latest estimates in territorial GHG emissions for all 374 local authorities across the United Kingdom, including the 32 local authorities across Scotland. We have charted the latest DESNZ territorial GHGI publication data for Scotland (DESNZ, 2023) in Figure 1 below. This shows the total territorial GHG emissions split into the inventory categories (agriculture, buildings, industry, LULUCF, transport and waste) between 2005 and 2021. The dataset employs several different methodologies to calculate the spatially disaggregated emissions for each inventory category.

Table 1 provides a description of each of the GHGI categories. These are important for drawing boundaries around polices, determining which inventory a specific policy will impact.
|
Category |
Description |
|---|---|
Agriculture |
A variety of policy options exist for the mitigation of GHG emissions through agricultural practices. The most prominent options are improved crop and grazing land management, restoration of organic soils, and livestock manure management. |
Buildings |
Building emissions are typically tackled through policies implementing technological solutions to improve energy efficiency performance, or non-technological approaches such as land use management and planning legislation. There is a drive to move towards zero direct emission sources of heating and hot water, such as heat pumps, to decarbonise buildings. |
Industry |
Net zero emissions from industry is possible but challenging. Reduced materials demand, material efficiency, and circular economy solutions can reduce the need for primary production. Primary production policy options include switching to new processes that use low to zero GHG-producing fuels (e.g. electrification). |
Land Use, Land Use Change and Forestry |
Changes in how land is used impact’s terrestrial ability to store or release carbon to the atmosphere. Humans are changing the natural rate of flux through Land Use, Land Use Change and Forestry (LULUCF) and policies that seek to improve the quantity (e.g. afforestation) and quality (e.g. restoration) of natural sinks are important to preserving natures ability to retain and further sequester carbon. |
Transport |
Transport emissions are addressed through avoided journeys and modal shifts due to behavioural change, uptake of improved vehicle and engine performance technologies, electrification, low-carbon fuels, investments in related infrastructure, and changes in the built environment. Combined, these offer high potential for mitigating emissions from transport. |
Waste |
Management policies typically consist of waste prevention, minimisation, material recovery, recycling, and re-use. There is growing potential for indirect reduction of GHG emissions through principles of circular economy and design leading to decreased waste generation, lower raw material consumption, reduced energy demand and fossil fuel avoidance. |
It is possible for policies to transcend multiple emission inventories. For example, a policy that seeks to develop a green network to increase the level of active transport[1] by improving tree canopy coverage and hedgerows would impact a transport and LULUCF inventory. There are activities and emission changes that would impact both inventories in this instance.
Methodology
This section provides a summarised version of the research methodology. A more detailed methodology is available in Appendix 13.1.
A steering group was established to support the delivery of the project, and consisted of representatives from the Scottish Government, ClimateXChange, Sustainable Scotland Network (SSN), and the Turner & Townsend research team. Findings and outcomes were reported to the steering group for comments and to confirm the research direction throughout the project. The project was divided into three tasks.
Evidence review
Task 1 was to compile a comprehensive policy register to understand the current climate action being taken by each local authority. This register provides a useful tool to view and analyse individual climate policies across Scotland. We applied the following process:
- Search: our search began with reviewing information available through the “Wider Influence” tab of local authority climate change submissions to SSN (SSN, 2023b). Where gaps existed, we supplemented these by conducting an online search of local authority websites and other public body sources for the relevant policy documentation.
- Classify: we utilised a rapid evidence assessment (HM Treasury, 2020) to classify each policy based on its high-level data, including years of coverage, policy owner, whether the policy is monitored, and any associated targets.
- Select: we developed screening criteria based on Scottish Government priorities for the current project and used this to recommend six strategies of significance to progress to Task 2.
We presented the key findings to the steering group and our assessment of the selected strategies. We asked the steering group for advice on the selection of the six strategies. This resulted in the addition of geographical criteria to our selection assessment, to ensure the research considered local authorities from rural and island communities.
Quantitative research
For Task 2 we developed a GHG profile for each of the six strategies selected from Task 1. This involved identifying the emission boundary of each policy within the strategies and the quantification of the potential impact on territorial emissions of the respective local authority. We then proceeded to calculate an aggregated figure to estimate the policies’ potential impact if rolled out at the national level. We approached this by:
- Assessment boundary: GHG boundaries were established using GHG Protocol Action Standard (Greenhouse Gas Protocol, 2014) to apportion the relevant sinks and sources to each policy and estimate potential emission impacts. This was used to determine the likelihood and magnitude of change.
- Policy scenario emissions: in the first instance, we used existing activity and emission factor information from the local authority policies to develop policy scenario emissions estimates. In the absence of information, we applied Intergovernmental Panel on Climate Change guidance. We then used the HM Treasury Green Book to approximate changes and associated emissions values to provide national-level policy scenario figures.
The more comprehensive methodology in Appendix 13.1 explains in detail the range of approaches and methodologies applied in the assessment of GHG boundaries, development of the policy scenario emissions estimations and the limitations of this approach. The findings from Task 2 were presented to the steering group with the objective of selecting two of the most likely and impactful areas of policy to be considered for national deployment by local authorities. These were developed into policy briefings for Scottish Government.
Qualitative research
For Task 3 we conducted interviews with representatives from two local authorities to gain their views on wider implementation of the selected policy areas, including the roles of local authorities, Scottish Government and other public bodies. We planned a third interview with one further local authority however, we were not able to agree a time and date for the interview to take place in the timescales of this research.
A topic guide was developed and formed the basis of 45-minute semi-structured interviews on Microsoft Teams. These aimed to collect the comprehensive views on the likelihood of wider adoption of the policies, including practicability, the capacity and capability required to deliver a new policy. We also included other open-ended questions, encouraging participants to expand further on topics they deemed relevant. The data from interviews was collated in a thematic analysis grid and key themes were extracted using an analytical approach guided by participant views.
We combined the data from all sources (the evidence review, quantitative potential emissions modelling, discussions with the steering group, and the qualitative research) to discuss the key challenges and the possible approaches to adopting the climate policies at a national scale. The conclusion is presented in Section 11.
Review of existing evidence
Overview
The aim of this review was to understand the climate strategy and policy landscape across Scottish local authorities. We created a Climate Strategy Register that involved the collation of climate action plans from all 32 local authorities including individual sector strategies such as transport plans, waste plans and local development plans (Appendix 13.3).
This report makes a distinction between a climate strategy and a climate policy in the context of the documents reviewed. Policies feed into sector strategies, which feed into a climate change strategy.
Most local authorities reviewed already have a top-level document we define as a climate change strategy. A climate change strategy refers to several planned actions and policies designed to outline an organisation’s approach to tackling climate-related challenges in their local region. Climate change strategies encompass other nomenclature such as a ‘climate action plan’. A climate change strategy will typically cover ambitions for all GHG emission inventories and may link to separate sector strategies that set out in further detailed policies specific to a singular emission inventory. For example, a climate change strategy might reference a separate transport emission sector strategy.
A climate policy encompasses an individual action or set of actions that deliver ambitions set out by a climate strategy. Policies will typically include setting of targets and key performance indicators to measure and verify the success of the policy’s intended impact. For example, a transport sector strategy might include a policy to increase electric vehicle charging infrastructure, and a policy to implement a low emission zone (LEZ) in a city centre.
We used several sources of information to inform our review of existing evidence. We started with reviewing the “Wider influences” local authority climate change report submissions to SSN (SSN, 2023b). The wider influences section of SSN reports was completed with varying degrees of information but overall, the level of detail was sparse. We supplemented this gap by searching each of the local authority websites for their climate action strategies. We found various types of initiatives at different levels of hierarchy.
We identified 69 strategies relevant to climate change across the 32 local authorities. We developed short summaries of each strategy document, which are set out in Appendix 13.2.
We developed a screening matrix to rank each of the strategies against five criteria outlined in Table 2 and determined the level of maturity by assessing the level of evidence provided in a climate change strategy as yes / no / partial. Each of the strategies was then assigned a relevance score to identify those that closely aligned with the research objectives.
|
Screening criteria |
Description |
Maturity | |||
|
1 |
2 |
3 | |||
|
1 |
Scalability |
If the policy impacts a defined region, is there possibility for it to be scaled to cover a wider geographical location? |
N |
N |
Y |
|
2 |
Replicability |
Can the policy be easily replicated by other local authorities in Scotland? |
N |
Y |
Y |
|
3 |
Impacts |
Does the policy quantify the intended impacts (e.g. emissions reduction) and set targets against these? |
N |
Y |
Y |
|
4 |
Timescales |
The policy has a clear start and end date and where possible, has interim milestones and targets that will be used to measure progress. |
N |
P |
Y |
|
5 |
Resource |
Does the policy quantify the resourcing requirement to deliver the stated impacts (e.g. finance)? |
N |
P |
Y |
Although some strategies where much more detailed than others in terms of the detail provided against individual policies, all the strategies provided sufficient information for us to understand how they would lead to an impact of the GHG emissions in their area. However, quantified information about the level of impact a strategy had was often high-level, not valued as an impact on territorial GHG emissions, or left as an open ambition.[2]
Selected local authority strategies
From the existing evidence review, we identified five climate change strategies that scored well across all of the screening categories. These climate change strategies were discussed with the steering group and we identified that all of the selected climate change strategies were across the central belt of the country. We therefore added a sixth strategy from a more rural local authority to ensure that we had a more diverse geographical spread. The six climate strategies matching the criteria were taken forward to the next task of valuating climate policies. The local authorities selected are shown in Figure 3 below.
|
Key |
Local authority |
Climate strategy name |
|
1 |
Argyll and Bute Council |
Decarbonisation Plan |
|
2 |
Stirling Council |
Climate and Nature Emergency Plan |
|
3 |
Perth & Kinross Council |
Climate Change Strategy and Action Plan |
|
4 |
Angus Council |
Sustainable Energy and Climate Action Plan |
|
5 |
Glasgow City Council |
Glasgow Climate Plan |
|
6 |
Dumfries and Galloway Council |
Carbon Neutral Strategic Plan |
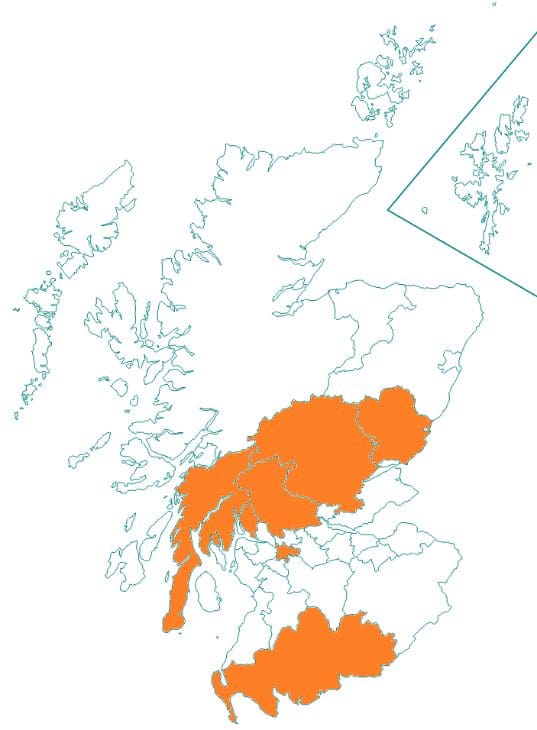
In the following paragraphs, we present two example climate change strategies as representative of the strategies we reviewed.
Stirling’s Climate and Nature Emergency Plan was the highest-ranking strategy (table 3) we reviewed. This was due to the large array of topics covered, efficient writing style, the explanation of policies and how those could be translated into other local authorities and regions. It provided several emission impact figures for policies and actions to show the effect on the environment and highlighted how these would be resourced in the region. Stirling’s Climate and Nature Emergency Plan was also one of the few climate change strategies to mention their current territorial emissions, which is the key focus of this project. Mention of territorial emissions is usually a strong indicator that a climate change strategy would give thorough information around carbon impacts and implementation. Stirling’s Climate and Nature Emergency Plan estimated a territorial emission reduction of 1/3 between 2005 and 2018 and mapped out their future to show where the local authority wanted to be by 2030. This was one of many examples from Stirling’s Climate and Nature Emergency Plan that set it apart from other climate change strategies and provided a clear understanding of how the local authority wanted to meet their targets for territorial GHG emissions.
The Glasgow Climate Plan (Glasgow City Council, 2022) and Stirling Climate and Nature Emergency Plan (Stirling Council, 2022) were key examples of detailed climate change strategies that could be deployed to support a national transition to net zero. Both strategies gave detailed explanations of the current regional context which was pivotal in explaining why certain policies or actions had a greater impact than others. The strategies also highlighted the importance of developing and investing in climate policymaking to ensure polices they set are appropriate for the regions as well as the communities they serve, whilst aiming to minimise the (negative) impact on residents as much as possible. Another key area both strategies explore is the financial implications of initiatives, indicating whether projects are either already funded, part funded or if they are being financed. This is something the Glasgow Climate Plan provided details on more than any other climate strategy reviewed. Importantly, the strategies outlined the capacity requirements to adequately resource their polices and provided timebound milestones to monitor progress against.
Additional findings
Territorial emissions impact
Of the 69 climate change strategies, 56 either partially valued their emissions impact or failed to value the scale of their impact on GHG emissions at all. A common theme in the absence of territorial GHG emission impact was to apply a bespoke indicator as a measure of success, such as increasing the number of staff working remotely. The majority of climate change plans did not outline the methodologies applied in gathering and quantifying performance measures and targets, so it was often unclear how impacts would be measured.
The key aim of this research was to identify policies that could impact territorial GHG emissions in a major way. The top performing policies against the criteria were scored well because they quantified the anticipated impacts. Emissions were typically quantified as either a tonnage reduction in GHG emissions (tCO2e) or a percentage reduction against a baseline figure.
Resourcing, financing and timelines
56 of the 69 climate change strategies had fully or partially evidenced timescales for implementation and completion. adopt a unified approach.
The most mature climate change strategies also included considerations around cost, whether funding had been secured, who would be financing it and who would be delivering these policies. For example, Argyle and Bute’s Decarbonisation Plan (Argyll and Bute Council, 2021) outlines sources of funding against each individual policy, whether funding has been secured or still requires budget.
However, policies aimed at achieving the same outcome might do so on different timescales. There was no clear pattern across the climate change strategies on how timescales were decided upon. The exception to this rule was waste targets as they are set nationally, which is a good example of how other policy areas could do the same to territorial emissions and targets
Only 13 of the 69 climate change strategies cited their territorial emissions. Of those, only some set territorial emissions targets. It is not clear why this was the case. It could be due to local authorities not having updated information about their territorial emissions or because they were not confident in how they could enact change in their regions. Climate change strategies that specifically mentioned territorial emissions and set emissions targets for their area had more detailed action lists that went beyond council owned assets. This difference is important as it highlights some local authorities are being proactive in tackling territorial GHG emissions in the local authority area beyond just those of their own organisations.
Summary
The level of detail and consistency of targets and performance metrics showed that there was no clear and consistent approach to developing climate change strategies. This makes comparison and valuation of the climate strategies complex due to the non-uniform nature of presenting impact and the lack of detail around the methodological approaches applied.
The strategies we ranked high on our measures including scalability, replicability, and quantification of impacts, could form the basis of best-practice knowledge sharing, and setting of a national approach (see Appendix 13.1.1 for further detail). Our findings reflect those of recent research carried out by Environmental Standards Scotland (Environmental Standards Scotland, 2023) that recommended Scottish Government introduce a standardised Climate Plan template with mandatory reporting for local authorities. This recommendation would go some way to solving some of the challenges uncovered by this research.
Results of quantitative research
Overview
From the six climate strategies reviewed in detail (Figure 3), 61 distinct climate policies were extracted. The distribution of the policies across the GHG inventory categories is summarised in Figure 4.
Of the 61 policies extracted, most policies (26) targeted building emissions and are outside the scope of this research as they are covered by the exemplar LHEES approach that has already been rolled out nationally across all local authorities. This research intended to identify policies in other GHG inventory categories that have the same potential for rollout across local authorities. With building emissions excluded, the remaining 35 policies have the greatest numbers in transport (13), LULUCF (8) and industry (7) as shown in Figure 4.
Figure 4: Number of policies extracted, by GHG inventory.
Of the 35 policies, we could only collect sufficient information from 13 policies to be able to estimate potential GHG emission impact. These are described alongside example targets and KPIs in Appendix 13.5.
Policy scenario emissions
We analysed the 13 policies to estimate the potential GHG emission impact if they were to be scaled-up to the national level and enacted across all 32 local authorities. The potential GHG emission impacts are high-level indicative estimates using a basic methodological approach and incorporating multiple assumptions, as set out in Appendix 13.1.2 and 13.2. As such, the quantitative findings are indicative, illustrating the scale of potential impact that local authorities may have in tackling climate change. Further analysis would provide more accurate potential GHG impacts of policies.
The findings of this analysis are detailed Table 4. Each row in Table 4 contains a climate policy that originates from either a single local authority or multiple local authorities where policies were similar. Table 4 details that across the 13 policies assessed for their GHG emission impact, there is potential for an estimated 9 MtCO2e overall change to territorial emissions, or 22% of the current inventory emissions for Scotland.
The full breakdown of the indicative estimated potential impact on each individual local authority’s GHG inventory is presented in Appendix 13.6 and sources for the assumptions and conversion factors are included at Appendix 13.2.
For each of these 13 policies valued, we also show in Table 4 our assessment of the likelihood of each policy to cause a change in emissions if rolled out nationally to all local authorities, taking account sphere of control, capacity and capability, and the timescale over which a policy would be enacted. We also assessed the magnitude of the potential change. Both of these methodologies are outlined in IPCC guidelines (IPCC, 2006) and set out in Appendix 13.4. There will be widely ranging factors and contexts at an individual local authority level which have not been accounted for and that would significantly impact implementation of the policies assessed. In addition, there are critical wider factors such as future national policy development and available budget that were not incorporated into this quantitative analysis.
Findings
Comparing the policies evaluated in Table 4 with the Climate Change Plan sector envelopes (Scottish Government, 2020, p. 253) indicates that both LULUCF and transport policies have the greatest potential to impact territorial GHG emissions, with a high likelihood of the local authority being able to influence their outcome. Table 3 below shows estimated potential GHG emission reductions in these policy areas if implemented in each local authority.
The other policy areas evaluated may also compare favourably with the Climate Change Plan sector envelopes but local authorities have a more limited control on the outcomes. This is the case with policies relating to changes in agricultural practices. In addition, while seven industrial emission-related policies were present amongst the six climate strategies finalised, none sought to value their impact on territorial GHG emissions and provided limited definitive action. Instead, the industrial-emission-related policies opted for a model of getting organisations to sign up to climate change pledges. Policies that were either outside the local authorities’ sphere of influence, or policies that impacted centralised issues, such as waste management, were also not carried forward to interviews with local authorities.
|
Local authority |
1) Nature-based solutions |
2) Net zero transport | ||
|
Total LULUCF emissions (ktCO2e) |
Potential emission reduction (ktCO2e) |
Total Transport emissions (ktCO2e) |
Potential emission reduction (ktCO2e) | |
|
Aberdeen City |
31 |
-32 |
305 |
-63 |
|
Aberdeenshire |
357 |
-107 |
613 |
-72 |
|
Angus |
389 |
-52 |
235 |
-31 |
|
Argyll and Bute |
-532 |
-225 |
186 |
-24 |
|
City of Edinburgh |
70 |
-37 |
640 |
-139 |
|
Clackmannanshire |
24 |
-155 |
66 |
-15 |
|
Dumfries and Galloway |
-239 |
-59 |
571 |
-42 |
|
Dundee City |
23 |
-485 |
184 |
-40 |
|
East Ayrshire |
-31 |
-39 |
229 |
-34 |
|
East Dunbartonshire |
20 |
-41 |
113 |
-30 |
|
East Lothian |
194 |
-36 |
210 |
-30 |
|
East Renfrewshire |
23 |
-58 |
147 |
-38 |
|
Falkirk |
79 |
-115 |
327 |
-43 |
|
Fife |
345 |
-150 |
584 |
-101 |
|
Glasgow City |
68 |
-225 |
761 |
-170 |
|
Highland |
110 |
-1,489 |
598 |
-80 |
|
Inverclyde |
3 |
-55 |
106 |
-23 |
|
Midlothian |
52 |
-83 |
137 |
-26 |
|
Moray |
-167 |
-56 |
162 |
-26 |
|
Na h-Eileanan Siar |
951 |
-461 |
42 |
-8 |
|
North Ayrshire |
-32 |
-280 |
151 |
-37 |
|
North Lanarkshire |
90 |
-313 |
736 |
-97 |
|
Orkney Islands |
43 |
-181 |
29 |
-6 |
|
Perth and Kinross |
-140 |
-47 |
515 |
-42 |
|
Renfrewshire |
35 |
-76 |
301 |
-52 |
|
Scottish Borders |
-103 |
-51 |
261 |
-32 |
|
Shetland Islands |
572 |
-160 |
43 |
-7 |
|
South Ayrshire |
-55 |
-48 |
209 |
-31 |
|
South Lanarkshire |
-27 |
-152 |
666 |
-91 |
|
Stirling |
-150 |
-63 |
249 |
-25 |
|
West Dunbartonshire |
9 |
-56 |
127 |
-25 |
|
West Lothian |
48 |
-106 |
373 |
-51 |
|
Total |
2,059 |
-5,497 |
9,878 |
-1,527 |
Results of qualitative research
Overview
The results of the quantitative research found that policies in LULUCF and transport showed potential in having significant impacts on local authority territorial GHG emissions. To find out more about how these policies were developed, and the potential pathways to implementing similar policies at the national level, we interviewed local authorities who had leading policies in nature-based solutions and net zero transport.
Findings
The findings below combine evidence from our review of existing data and assessment of the key themes identified through thematic analysis of interviews.
Capacity and capability
It was clear from the interviews that lack of capacity to develop and deliver policies would likely hamper efforts in expanding policies across all local authorities in Scotland. We found that some local authorities had the resource and ability to hire specialist skills into the organisation. Through this they could actively engage with teams across the organisation to ensure policy ambitions were carried out. An example of this given by one respondent:
“It’s imperative to ensure that any planting of new trees considered multiple planning and climate aspects, impacting the species of tree selected, factoring in considerations about the future microclimate and requirements for future flood prevention.”
However, local authorities do not always know what skills they need to deliver on a policy ambition. One respondent explained that many policies require both multi-disciplinary expertise, such as project management, as well as specialist skills, such as ArcGIS[3], to properly manage the rollout of a policy.
One respondent explained that budget cuts mean that retaining enough resource within the organisation, with access to the right skills and expertise would be a defining factor in the success of climate policies’ targets. Respondents did signal that it was possible to access skills external to the local authority (e.g. through consultancy) but this was often ad hoc. Developing and implementing policies will require multi-year and decadal management to realise their full benefits. Not being able to retain the skills and resource within the local authority places their success at risk.
Data maturity
One of the respondents explained that having good quality data that is continually updated and shared across the organisation is critical to enabling policy development and delivery. The example provided was the data landscape for nature-based solutions policies, which is complex, onerous to compile and requires near-constant updating. For example, in the greening of derelict land, the classification of land as ‘derelict’ ebbs and flows as multiple stakeholders retain interest in the space. The local authority itself (potentially across multiple departments), private individuals, residents and developers may all have a stake in the use of the derelict land. Added to this is the difficulty of collecting accurate data about derelict land, such as carbon evaluation, existence of contaminants, appraisal of natural ecosystems and animal species, and importance to flood prevention. This information is needed to show causal links between greening derelict land and benefits such as heat reduction and carbon sequestration.
Data also enables a local authority to develop robust climate policies by identifying measurable KPIs and to set realistic timescales. Several climate change strategies we reviewed were at early stages of development and specifically referenced the need for additional research to complete the valuation of a policy’s impact. For example, several transport policies referenced other transport strategy documents in-development that sought to improve data maturity for the local area, and enable valuation of impacts and target setting. Timescales for the development of these strategies were not clear.
Collecting adequate data is key to the development, measurement, and success of a climate policy. However, the landscape is complex and demanding and interrelated to capacity and capability in the local authority as discussed above.
Geographical diversity
We found that the overarching aims of climate change strategies across Scotland are the same. However, sometimes these goals are were coupled with specific local issues. Therefore, motivations, KPIs, and targets by which the local authorities measure the performance of climate related policies often differ. This has a knock-on effect on the data and capacity needed to implement policy across diverse communities.
One clear example of this is in homeworking policies. In large island communities that have a widely dispersed rural communities, home working and flexible working has benefited commuters who do not need to travel great distances to reach their work location. One interviewee explained that the policy has helped island communities to overcome other issues such as the lack of public transport provision. Similar homeworking policies also exist in cities with a specific focus on reducing the amount of traffic congestion within the city centre at peak times. Both sets of policies have differing motivations for enacting homeworking polices but the end benefit of reduced air pollution is the same.
Accountability and ownership
We found that climate policies often span multiple departments within an organisation. In some circumstances this led to ambiguity around accountability for the successful delivery of a policy. One respondent explained that for nature-based climate policies, using afforestation as a specific case in point, the responsibility and budget for tree planting might fall with a local authority’s parks department. However, responsibility to actively manage LULUCF from a climate perspective might reside with the sustainability or planning departments. This leads to complexities around who in a local authority needs to be consulted for LULUCF projects and who has ultimate ownership of a policy being successfully enacted. Respondents referenced that it is not uncommon for there to be “a lot of silo working” across departments, so projects that might impact on a climate policy are not always communicated, or vice versa. Respondents also noted that there tends to be an aversion to taking on or sharing climate policy responsibilities because it is a change from how departments have functioned in the past,
“[we] have always done it this way so why would we do it another way”.
Funding
Funding, or the lack thereof, was a common theme across respondents. One respondent noted that there is a lack of funding available to commission external expertise, for example the delivery of a feasibility study. This hampered efforts to collect the information needed to develop robust policies and set realistic targets. It was clear from the strategies reviewed that only a few local authorities sought to quantify the funding requirement to deliver policies.
A strong theme was the lack of funding to attract and retain talent within the local authorities. One example given was that of senior planners, who are required within in a local authority to appropriately manage LULUCF. We were told:
“[Local authorities] advertised at between £39,000 and £48,000 per annum while the private sector advertises similar roles for between £48,000 and £68,00 per annum”.
This leads to expertise being stripped out of the public sector by the private sector after employees have gained a few years’ experience.
There are several avenues of funding available to Scottish local authorities. However, it was the view of respondents that funding was piecemeal, short-term where local authorities needed a longer-term financial commitment and finite, which leads to competition across local authorities. There was a view shared across respondents that funders such as Scottish Government and NatureScot should look to review how funding is administered. A model was suggested in which funders work directly with each individual local authority to identify areas where funding could have the greatest impact at the local level. There was appreciation though that both Scottish Government and NatureScot are themselves suffering from budget and resourcing pressures to many of the local authorities, which hampers efforts to change existing models.
Summary
While very limited, the qualitative evidence indicates that many of the barriers highlighted by the interviews are aligned to those presented in the climate strategy documentary review. Further, the interviews also indicate that these barriers are interlinked and require a holistic approach to be overcome. For example, the lack of funding directly impacts capacity and capability within local authorities to deliver climate policy. This in turn directly impacts the maturity of data across the sector and, again, the local authority’s ability to deliver robust climate policies.
Considering the identified barriers to enacting climate policies, local authorities have nevertheless made significant inroads to developing some best-in-class policies that go above and beyond national ambitions. This is evident in the detail and narrative presented in multiple climate strategies. This shows there is a major interest and commitment by local authorities to tackle their territorial emissions. While policymaking in this area is limited in its scope, scale and consistency, local authorities interviewed demonstrated keenness to increase action.
Combined results
Table 4 combines the quantitative and qualitative research’s estimated potential impacts for the policies should they be implemented nationally. Appendix 13.1.2 describes the methodology used to arrive at the figures included and Appendix 13.2 lists the sources used.
|
Inventory / Policy |
Current territorial emissions |
Potential National Policy emission impact estimate |
Interim target emission impact |
% change from current |
Likelihood |
Magnitude |
Interim target year |
Policy target year |
|
Agriculture |
7,985 |
-1,416 |
-907 |
-17.73% | ||||
|
Changes to Agricultural Practices |
-1,416 |
-907 |
-17.73% |
Possible |
Major |
2025 |
2030 | |
|
Buildings (not accounted) |
11,600 |
0 |
0 |
0.00% | ||||
|
Industry |
7,798 |
0 |
0 |
0.00% | ||||
|
LULUCF |
2,059 |
-5,497 |
-1,159 |
-266.94% | ||||
|
Greening of derelict land |
-2,167 |
N/A |
-105.23% |
Likely |
Major |
2025 |
2040 | |
|
Peatland restoration |
-2,530 |
-1,150 |
-122.86% |
Possible |
Major |
2030 |
2045 | |
|
Reforestation (1 million new trees per local authority) |
-800 |
-9 |
-38.85% |
Likely |
Moderate |
2030 |
2045 | |
|
Transport |
9,878 |
-1,527 |
-258 |
-24.02% | ||||
|
Active travel |
-793 |
N/A |
-16.59% |
Unlikely |
Major |
N/A |
2030 | |
|
Homeworking |
-0.31 |
N/A |
-0.00% |
Likely |
Minor |
N/A |
2026 | |
|
Low Emission Zone |
-129 |
N/A |
-1.30% |
Very likely |
Moderate |
N/A |
2030 | |
|
Public transport |
-169 |
-76 |
-1.71% |
Likely |
Moderate |
2030 |
2045 | |
|
Fleet vehicles |
-124 |
-26 |
-1.26% |
Likely |
Moderate |
2025 |
2030 | |
|
Council Business Travel |
-235 |
-118 |
-2.38% |
Very likely |
Moderate |
2030 |
2045 | |
|
LEV Taxi Licences |
-76 |
-38 |
-0.77% |
Likely |
Minor |
2032 |
2045 | |
|
Waste |
1,333 |
-541 |
-306 |
-40.57% | ||||
|
Waste Reduction Strategy |
-520 |
-290 |
-39.03% |
Likely |
Major |
2025 |
2045 | |
|
Council Waste Reduction |
-21 |
-16 |
-1.55% |
Very likely |
Moderate |
2030 |
2045 | |
|
Scotland Total |
40,653 |
-8,981 |
-2,629 |
-22.09% |
Policy briefing: Nature-based solutions
Background
Biodiversity loss and the destruction of natural habitats is directly linked to climate change. Scottish forests, peatlands and bogs contribute to healthy eco systems. These systems work to remove CO2 from our atmosphere and in some areas become large carbon sinks. According to the Biodiversity Intactness Indicator, Scotland has seen a 15% decline in its natural capital since 1950 with only 64% of our protected woodlands being in a favourable or recovering condition (Scottish Government, 2022).
|
Policy |
Nature-based solutions |
|
Description |
Changing land use – particularly on areas of derelict land – that directly improves carbon sequestration potential through improvements in management practices, afforestation, repairing damaged ecosystems such as peatland, and greening of derelict land. |
|
Potential estimated national impact |
-5.4 MtCO2e |
|
Broader impacts |
|
Figure 5 shows the total estimated impact on LULUCF territorial GHG emissions by each individual policy, moving the inventory from 2.1 MtCO2e emission per annum to (negative) -3.4 MtCO2e through a combination of three polices.
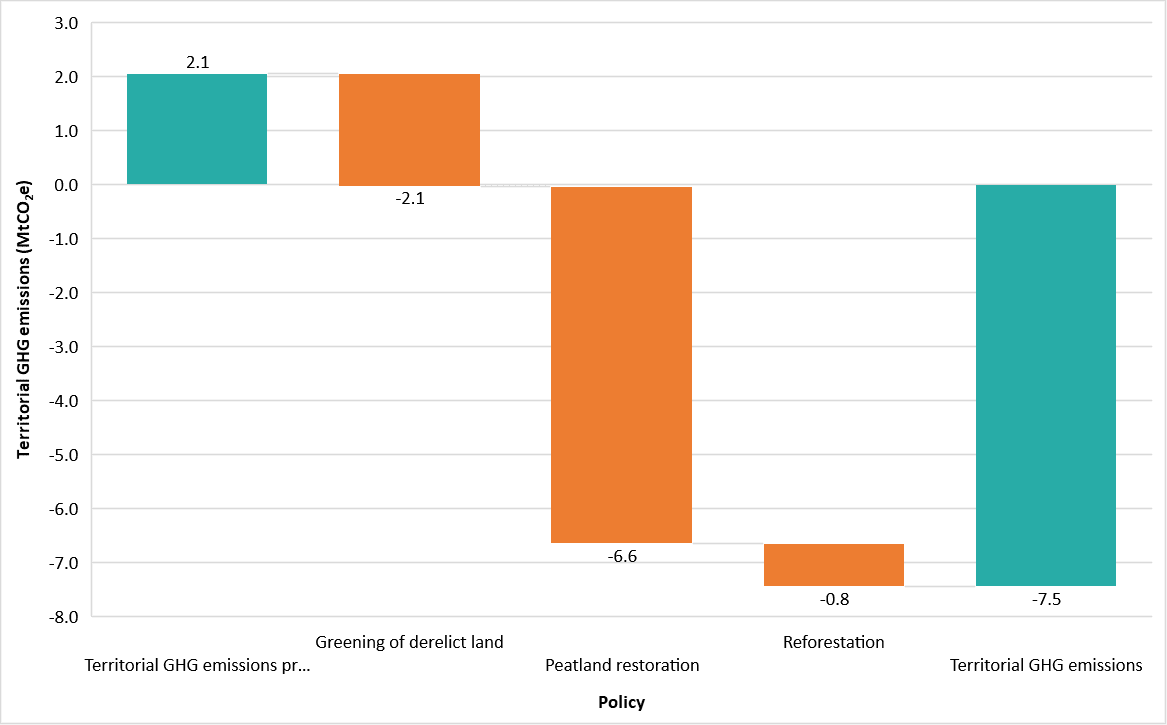
Figure 5: Potential impact on LULUCF territorial GHG emissions across Scotland for a nature-based solutions policy
Greening Derelict Land
The rewilding policy outlined in Glasgow’s Climate Plan (Glasgow City Council, 2022) was one of the most developed we found during the quantitative review. It was used as the foundation to value the potential impact of nation-wide greening of derelict land. NatureScot estimated the total area of urban vacant and derelict land in Scotland in 2017 to be 11,649 hectares (Nature Scot, 2022). Across Scotland, 35% (4,077 ha) of urban vacant and derelict land can be thought of as being uneconomic to develop and/or is viewed as suitable to reclaim for a ‘soft’ end use (i.e. non-built use). The most common new use for sites that were previously urban vacant and derelict land was for residential development, with 50% of sites reclaimed for this purpose (Nature Scot, 2022). Changing land use for derelict land comes with many challenges for local authorities to consider including potential decontamination, private ownership, stakeholder relations, and internal ownership of the policy (see findings from the qualitative research in Section 7).
We have given an interim target of 2025 for greening to reach an estimated net gain in carbon sequestration potential of 2.2 MtCO2e across Scotland by 2040. This figure is an upper bound estimate and was calculated on the basis of the following significant assumptions:
- 50% of the uneconomic land could be ’greened’ as described above.
- Derelict land is assumed to be neutral grassland that can be converted to coniferous woodland, applying carbon stock estimates (tC / ha) by habitat type and converting to MtCO2e (Carbon Rewild, 2020).
- Afforested trees would reach their peak potential sequestration between 16 and 25 years of age (Carbon Store, n.d.).
Peatland Restoration
Scotland’s Nature Agency estimates that Scotland has some 1.8 Mha of blanket bog, representing 23% of the total land area (NatureScot, 2023). It is estimated that up to 80% of the total peatland area (1.44 Mha) is damaged. We have drawn on several policies across three local authorities that had detailed peatland restoration ambitions. The policies we reviewed sought to meet the pace of restoration set by Scottish Government of 20,000 ha restored per annum, with a target of 250,000 ha restored by 2030 (Scottish Government, 2020). Maintaining this pace of change to 2045 would mean a potential restoration of 0.55 Mha of peatland by 2045. The International Union for Conservation of Nature (IUCN) estimates that up to 4.6 tCO2e per hectare could be reduced by restored peatland (IUCN, 2010). This produces an estimated carbon reduction potential of 2.5 MtCO2e.
A strong caveat to the total potential restoration area is that much of the peatland across Scotland is under private ownership. Local authorities have limited powers outwith their own land ownership and may face significant challenges in convincing some private landowners to restore the peat on their land. In the absence of clear data on the area of peatland under private ownership, or other ownership covenants, for the purposes of estimating a potential GHG emission reduction we have made the broad assumption that these challenges could be overcome. However, if these challenges cannot be overcome it would severely reduce achievable emissions reductions.
Afforestation
We have used Stirling’s Climate & Nature Emergency Plan (Stirling Council, 2022) reforestation policy to plant 360,000 new trees by 2030, and 1 million new trees by 2045 as the basis for the modelled figures. The average kilogram of carbon dioxide sequestered by a mature tree is between 10kg CO2 and 40kg CO2 depending on age, species, and growing environment (EcoTree, 2023). For the purposes of estimation, 25kgCO2 / tree / per annum has been used. Scaling this ambition to the national level, the total estimated removal of 0.8 MtCO2 per annum across Scotland.
There are significant assumptions that sit behind the above estimation. These include:
- Stirling’s policy does not specify the type of land that will be converted, the detailed timescales for planting (impacting when the new tree stock will be at maturity), nor the preferred species of tree to be reforested.
- The policy does not value the GHG emission impact of planting new trees.
- We have assumed that the afforested trees will sequester emissions at their peak potential (i.e. a mature forest). This means the estimated emissions removals are limited by the fact we have not modelled a progressive change in sequestration over time, accounting for the growth of new woodland, such as that outlined by the Woodland Carbon Code (UK Woodland Carbon Code, 2021).
Summary
During our research we found that local authorities were eager to develop and create policies for land use that could make a quantifiable impact. One common theme across all local authorities was the consideration of peatland as one of the most impactful policies to reduce their carbon emissions. There are abundant resources provided by the IUCN peatland code (IUCN, 2023) that local authorities could access to begin developing strong peatland restoration policies.
Policy briefing: Net zero transport
Background
Scotland has ambitious targets to reduce transport emissions to net-zero by 2045 (Transport Scotland, 2019a). Transport emissions are one of the largest GHG inventory categories, accounting for 24% of overall territorial emissions (DESNZ, 2023). This is reflected in the number of transport policies identified across local authority climate change strategies. The policies in the section below demonstrate how local authorities are driving forward transport solutions.
|
Policy |
Net zero transport |
|
Description |
Supporting the nation’s transition to net zero transport through a combination of policies tackling public and private transport methods, including promoting active travel and implementing low emission zones. |
|
Potential estimated national impact |
-1.5 MtCO2e |
|
Broader impacts |
|
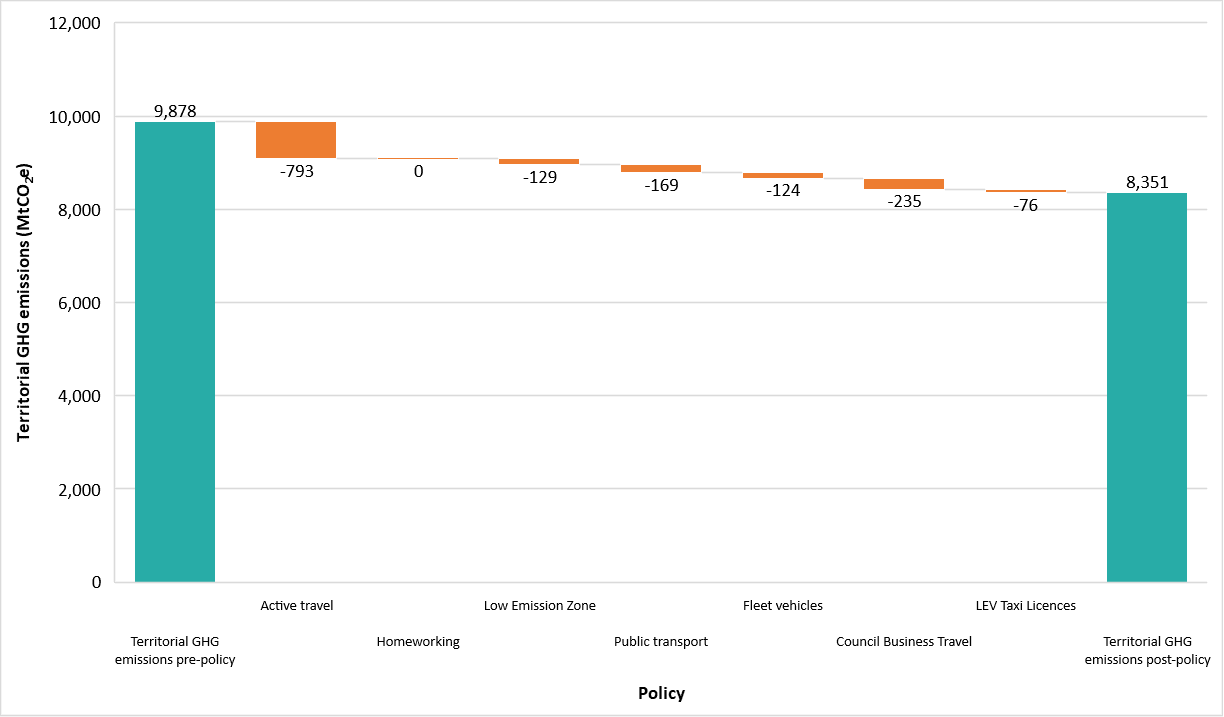
Figure 6: Potential impact on transport territorial GHG emissions across Scotland for a net zero transport policy
Figure 6 shows the total estimated impact on transport GHG emissions by each individual policy, moving the inventory from 9,878 MtCO2e emission per annum to 8,351 MtCO2e through a combination of seven polices.
The Scottish National Transport Strategy states that 40% of transport emissions come from fossil fuelled cars. Recognising the impact that internal combustion engine cars have, local authorities have started to introduce policies targeted specifically at reducing these emissions. (Transport Scotland, 2019a).
High private use car use does not just affect GHG emissions, it also has a significant impact on air quality, health and pedestrian safety. Private car use contributes to high pollutions levels and with transport contributing to 1/6 of Scotland’s particulate matter (PM10) it is clear this is an area for policy focus (Transport Scotland, 2019a).
Local authorities understand the need for potent policies to be in line with national targets such as the goal to reduce car kilometres driven by 20% by 2030. These range from encouraging more active travel through the creation of active travel corridors and implementing low emissions zones in congested zones.
Active transport
The figures for this policy were modelled using Argyll and Bute Council’s Decarbonisation Plan 2022-2025 (Argyll and Bute Council, 2021). £2.3 million has been invested in delivering a wide range of active travel initiatives such as improved pathways, community cycle repair stands, cycle parking and new cycling routes. Through a combination of similar initiatives, a viable aim would be to convert 47% of remaining road journeys of up to 3km to active travel, which was the average proportion of active travel journeys up to 3km in 2019 (Transport Scotland, 2019b). The Council has committed to develop an Active Travel Strategy that would drive the policy forward at a future stage, but up to this point, resource to deliver the policy is dependent on external funding awards and is not covered by council budgets.
Homeworking
This policy has been valued as a proportion of the 262,000 Scottish FTE public sector total workforce (Scottish Government, 2022) working from home for 50% of their contracted hours. Reducing the average commute of 20 km round trip to office locations made in 73% of circumstances by personal car (Scottish Government, 2022b). Further potential emission reductions could be achieved through reduced operation of offices, such as heating, lighting, equipment and other operational emissions, although these have not been factored into our current study. However, it should be noted that emissions from reduced transport are minimal due to increased emissions associated with staff working from home (Riley et al., 2021).
Low-emission zones
Currently, there are four low emission zones (LEZ) in Scotland with enforcement for Dundee, Aberdeen and Edinburgh being introduced in 2024. Glasgow’s LEZ is integrated with the City Development Plan 2, Glasgow Transport Strategy and their Climate Plan to implement the change. The LEZ has been operating since 2018 with the aim of encouraging more active travel and public transport use in the city centre. The policy was implemented in phases to ensure low levels of disruption for residents, which should be a key consideration if scaling this across Scotland. Using findings from the London LEZ (Mayor of London, 2023), we have assumed a 4% CO2 saving on emissions from transport on minor roads, to account for the fact LEZs will likely be operational in urban areas.
Decarbonisation of public transport
Climate targets published in the Stirling Climate & Nature Emergency Plan (Stirling Council, 2022) aim to reduce GHG emissions from public transport by an interim target of 25% in 2030, with an overall target of 75% by 2045. This has been extrapolated using population as a function to estimate the number of people served by public transport. However, the provision of public transport across Scotland is dependent on several factors, including sparseness of the population and socioeconomic circumstance, which are not accounted for in the potential emissions impact estimation. Further work should be undertaken to quantify the benefits.
Decarbonisation of fleet vehicles
This policy’s emissions were modelled using the estimated number of 28,800 fleet vehicles in the Scottish public sector (Scottish Futures Trust, 2022). We applied a conversion factor for assumed petrol cars, diesel LGVs and HGVs (BEIS, 2023). The average number of kilometres travelled annually is 12,000 km (Scottish Futures Trust, 2022). Post-conversion to EV emissions are zero, as per emission factor guidance. It is worth noting that EV technology for HGVs is under development and may not play a major role until post-2030 (Transport & Environment, 2023).
Council business travel
These emissions were estimated based on climate targets published in the Stirling Climate & Nature Emergency Plan (Stirling Council, 2022). The plan sets out the ambition of reducing baseline transport emissions (4,450 tCO2) by the interim target of 45% by 2030, and the overall target emission reduction of 90% by 2045. This has been applied across the other local authorities, using population as a proxy. Further research to quantify emissions for each local authority would need to be carried out to refine these estimates.
LEV taxi licences
Stirling Climate & Nature Emergency Plan (Stirling Council, 2022) sets out the authority’s commitment to 100% of all taxis operating in the region being EVs by 2045. Using this as a foundation, we have valued the policy ambition in potential national GHG territorial emission impact.
There are 20,396 taxi licences registered across the 32 local authorities in Scotland of which 9,928 were registered as of 2021 (Transport Scotland, 2021). 1.9% are thought to be ULEVS (DfT, 2023). The policy will seek to increase the share of ULEV licences to 100% by 2045 effectively curtailing the emissions from private car hire.
To calculate the GHG emission impact, we anticipate that the average number of kilometres travelled per annum per capita is 80.85 km taken from the average number of trips made in the UK, by mode of transport (DESNZ, 2023) across the population of Scotland (5,563,000). Assumed that most private hire taxis are diesel cars, we applied the emission factor for a diesel car from BEIS company reporting datasets (BEIS, 2023) to calculate a saving on emission of 76.36 ktCO2e.
Summary
It is clear from our research that transport is a key focus for all local authorities across Scotland due to the interlinked impacts spanning multiple socio-economic factors. Transport policies are very publicly visual in their delivery, making it easy for local authorities to point toward action being taken. In this section we have outlined some of the transport-related policies that could potentially be rolled out across Scotland’s local authorities. There is great potential to support local authorities to drive ambitious change in transport emissions, many of whom are already showing innovative solutions to enacting change in their local area. We have also given high-level estimates of potential emissions reductions if some of the most mature existing travel policies were scaled up.
Conclusions
Through pursuit of Local Heat and Energy Efficiency Strategies (LHEES), the Scottish Government has set the foundations for local authorities to drive their own locally led net zero agendas, directly tackling territorial greenhouse emissions from buildings. This research sought to investigate the role of local authorities in addressing emissions across other inventory categories, to replicate the success and best practice generated by LHEES.
From the evidence reviewed and from the interviews with local authorities, it is clear that there is local authority ambition to deliver climate policies that tackle local climate challenges, at the same time as delivering emissions reductions that go above and beyond national targets. Our climate strategy register details 69 current local authority climate-relevant strategies and describes the action being taken across all emission categories. We uncovered several climate change strategies that clearly detail intent, value their potential impacts and address resourcing and funding needs. Further research could be carried out to establish best-practice guidance on the development of climate policies, using existing local authority approaches as the foundation. This would help improve consistency across local authorities in how they value policy impacts and Scottish Government’s understanding of the resourcing, skills and funding needed to deliver.
This research assessed local authority strategies and policies to find where the most mature and impactful local authority climate policies have been developed. We scaled-up the emission reduction potential of the strongest of these local policies to give high-level-indicative estimates of what the impact could be in other local authorities and at a national level. Combining all of the analysis, we identified the greatest potential for impactful local authority controlled policies on territorial emissions to be within the LULUCF and transport categories.
For these to be implemented across Scotland, we found that the Scottish Government has a key role to play. They can provide effective leadership through facilitating best-practice knowledge sharing, improved access to skilled resource and targeted funding initiatives.
Territorial GHG policies are complex and data-driven, requiring specialist resource to develop and deliver, which we found does not always exist within individual local authorities. The Scottish Climate Intelligence Service has recently been launched in response to this barrier for many local authorities. Further research could expand on the capacity and capability requirements to deliver local authority climate policies between now and 2045, including methods by which the resourcing needs could be met.
Finally, funding is key to driving forward all the strategies and policies we have reviewed in this research. There are many pockets of funding available to local authorities to deliver climate policies. However, the interviews show that the funding is often piecemeal and short-term. Further investigation could help quantify the funding available for tackling each GHG inventory, where further funding might best be directed and methods for administrating funding to ensure that national ambitions can be met.
References
Argyll and Bute Council, 2021. Decarbonisation Plan 2022-2025, s.l.: s.n.
Audit Scotland, 2022. Scotland’s councils’ approach to addressing climate change. s.l.:s.n.
BEIS, 2022. Digest of UK Energy Statistics – Annual data for UK, 2021, London: Crown.
BEIS, 2023. Government conversion factors for company reporting of greenhouse gas emissions. [Online]
Available at: https://www.gov.uk/government/collections/government-conversion-factors-for-company-reporting
BEIS, 2023. Green Book supplementary guidance: valuation of energy use and greenhouse gas emissions for appraisal, London: Crown Commerical.
BEIS, 2023. UK Greenhouse Gas Emission Statistics: Frequently Asked Questions, London: Crown Copyright.
Carbon Rewild, 2020. Exploring the Carbon Capture Potential of Different Land Types. [Online]
Available at: https://carbonrewild.com/exploring-the-carbon-capture-potential-of-different-land-types/#:~:text=Wetlands%20are%20globally%20considered%20a,grow%20in%20or%20on%20water
Carbon Store, n.d. Carbon Sequestration. [Online]
Available at: https://carbonstoreuk.com/publications/carbon-sequestration-the-basics/#:~:text=As%20trees%20grow%2C%20the%20process,CO%E2%82%82%20as%20they%20are%20sequestering.
Climate Change Committee, 2022. Progress in reducing emissions in Scotland – 2022 Report to Parliament, s.l.: s.n.
Climate Change Order, 2015. Climate Change (Duties of Public Bodies: Reporting Requirements) (Scotland) Order 2015. s.l.:s.n.
DESNZ, 2023. Average number of trips by purpose and main mode. [Online]
Available at: Average number of trips by purpose and main mode
DESNZ, 2023. UK local authority and regional greenhouse gas emissions national statistics, 2005 to 2021. [Online]
Available at: https://www.gov.uk/government/statistics/uk-local-authority-and-regional-greenhouse-gas-emissions-national-statistics-2005-to-2021
[Accessed 01 November 2023].
DfT, 2023. NTS0409: Average number of trips and distance travelled by purpose and main mode: England, 2002 onwards, s.l.: Department for Transport.
EcoTree, 2023. How much CO2 does a tree absorb?. [Online]
Available at: https://ecotree.green/en/how-much-co2-does-a-tree-absorb
Environmental Standards Scotland, 2023. An investigation into the effectiveness of the systems in place to support local authorities in their duty to contribute to the delivery of climate change targets, s.l.: s.n.
Glasgow City Council, 2022. Glasgow’s Climate Plan, Glasgow: Glasgow City Council.
Greenhouse Gas Protocol, 2014. Policy and Action Standard: An accounting and reporting standard for estimating the greenhouse gas effects of policies and actions, s.l.: World Resources Institute.
HM Treasury, 2020. Magenta Book: Central Government guidance on evaluation, London: UK Government.
Improvement Service, 2023. Climate Intelligence Service. [Online]
Available at: https://www.improvementservice.org.uk/products-and-services/consultancy-and-support/climate-change/climate-intelligence-service
IPCC, 2006. Guidelines for National Greenhouse Gas Inventories, s.l.: s.n.
IUCN, 2010. Peatlands and Greenhouse Gas Emissions Reduction in Scotland, s.l.: IUCN.
IUCN, 2023. Peatland Code. [Online]
Available at: https://www.iucn-uk-peatlandprogramme.org/peatland-code-0
Mayor of London, 2023. Inner London Ultra Low Emission Zone Expansion One Year Report. [Online]
Available at: https://www.london.gov.uk/programmes-strategies/environment-and-climate-change/environment-and-climate-change-publications/inner-london-ultra-low-emission-zone-expansion-one-year-report?auHash=IxeIM3L6iJh-CwYvb2wek2UKMCSJvpOqMgtpRAMt5B8
Nature Scot, 2022. LLC3 Urban Vacant and Derelict Land, s.l.: s.n.
NatureScot, 2023. Blanket bog. [Online]
Available at: https://www.nature.scot/landscapes-and-habitats/habitat-types/mountains-heaths-and-bogs/blanket-bog#:~:text=Blanket%20bog%20is%20one%20of,23%25%20of%20our%20land%20area.
Net Zero, Energy and Transport Committee, 2023. The role of local government and its cross-sectoral partners in financing and delivering a net-zero Scotland, Edinburgh: The Scottish Parliament.
Scottish Futures Trust, 2022. Phasing out petrol and diesel cars & vans from public sector fleet, Edinburgh: Scottish Futures Trust.
Scottish Government, 2020. Update to the Climate Change Plan 2018 – 2032: Securing a Green Recovery on a Path to Net Zero, s.l.: s.n.
Scottish Government, 2022a. About public sector employment statistics. [Online]
Available at: https://www.gov.scot/publications/about-public-sector-employment-statistics/pages/local-government-employment/
Scottish Government, 2022b. Census data – Transport. [Online]
Available at: https://www.scotlandscensus.gov.uk/census-results/at-a-glance/transport/
Scottish Government, 2022. Biodiversity strategy to 2045: tackling the nature emergency, Edinburgh: ScotGov.
Scottish Government, 2022. Public Sector Employment in Scotland Statistics for 2nd Quarter 2022. [Online]
Available at: https://www.gov.scot/publications/public-sector-employment-scotland-statistics-2nd-quarter-2022/pages/6/
SSN, 2023b. Reporting: Public Bodies Climate Change Duties. [Online]
Available at: https://sustainablescotlandnetwork.org/reports
[Accessed 07 07 2023].
Stirling Council, 2022. Climate and Nature Emergency Plan 2021 – 2045, Stirling: Stirling Council.
Transport & Environment, 2023. Electric HGVs will soon be cheaper overall than diesels in the UK. [Online]
Available at: https://www.transportenvironment.org/discover/electric-hgvs-will-soon-be-cheaper-overall-than-diesels-in-the-uk/
Transport Scotland, 2019a. National Transport Strategy, Edinburgh: s.n.
Transport Scotland, 2019b. Transport and Travel in Scotland 2019: Results from the Scottish Household Survey, Edinburgh: s.n.
Transport Scotland, 2021. Scottish Transport Statistics, Glasgow: ScotGov.
Transport Scotland, 2022. Scottish Transport Statistics (2021) Personal and cross-modal travel, s.l.: Transport Scotland.
UK Woodland Carbon Code, 2021. 3.3 Project carbon sequestration. [Online]
Available at: https://www.woodlandcarboncode.org.uk/standard-and-guidance/3-carbon-sequestration/3-3-project-carbon-sequestration
Williamson, R., Sudmant, A., Gouldson, A. & Brogan, J., 2020. A Net-Zero Carbon Roadmap for Edinburgh, s.l.: PCAN & Edinburgh Climate Commission.
Appendices
Detailed methodology
Selection of climate strategies
The research identified 69 separate climate-related strategies across the 32 local authorities. To determine which were the key strategies to take forward to develop greenhouse gas emission boundaries, we designed five selection criteria to score each of the strategies against the metrics in 3.
We developed a screening matrix that ranked the strategies against five criteria outlined in Table 5 and determined the level of maturity on a scale of 1-3, assessing the level of evidence provided in a climate change strategy as yes / no / partial. We further embellished the five section criteria to ensure the strategies selected covered, as a collective, each of the six greenhouse gas emission inventories
Following presentation of the final policies selected with the steering group, a further consideration was made to ensure that at least one climate strategy from a local authority located outside of Scotland’s central belt was included, to ensure a better geographical spread. This resulted in the addition of Dumfries and Galloway Council to the climate boundary task.
Greenhouse gas emission boundaries and scenario emissions calculations and limitations
It is impractical to measure greenhouse gas emissions impact in real time from every chimney, exhaust, or acre of land use. GHG emission estimates are based on a series of models that estimate emissions from different sources (BEIS, 2023). The calculations performed for each of the scenario emissions is in line with international guidance (IPCC, 2006). We used government conversion factors for company reporting of greenhouse gas emissions (BEIS, 2023), Green Book supplementary guidance on the valuation of energy use and greenhouse gas emissions for appraisal (BEIS, 2023) and from IPCC guidance (IPCC, 2006). Other sources were researched from literature in the absence of standardised sets of emission factors.
The basic equation used to quantify scenario emissions is:
Equation 1: GHG scenario emissions
- Activity data is a variable that is changed by a policy. For example, a policy may look to reduce the number of kilometres travelled by private car.
- Emission factor is a constant that is used to convert the activity data to an impact. In most cases, this will be a GHG emission conversion factor.
- The impact estimate can either form a policy target or metric by which to measure success. Typically, this will be a GHG emission saving but it could also include other benefits (e.g. societal).
An example of this methodology in practice would be estimating GHG emissions from vehicles. The activity data might be the total number of kilometres travelled by that type of vehicle and the emission factor would be the amount of CO2 emitted per kilometre.
Emission factors for energy sources are either dependent on the fuel characteristics (for emissions of CO2) or how the fuel is burned, for example the size and efficiency of equipment used. For other sources, the emission factor can be dependent on a range of parameters, such as feed characteristics for livestock or the chemical reactions taking place for industrial process emissions. Emission factors are typically derived from measurements on several representative sources and the resulting factor applied to all similar sources in the UK.
This approach follows the ‘Tier 1’ approach as set out in IPCC guidance for national greenhouse gas inventories (IPCC, 2006):
|
Uncertainty → |
Tier 1 |
|
Detail and complexity → |
|
Tier 2 |
| ||
|
Tier 3 |
|
Table 5: Quantification of GHG emission impact
An example of how an emission factor was applied to an activity is converting 1 tonne of municipal waste to 1 tonne of recycled waste as part of a landfill reduction strategy. Using emission conversion factors from government conversion factors for company reporting (BEIS, 2023), 1 tonne of waste sent to landfill has a greenhouse gas intensity of 497 kgCO2e/tonne. A tonne of waste recycled has a greenhouse gas intensity of 21 kgCO2e/tonne. Comparisons made between the two indicate a net greenhouse gas benefit of avoiding waste going to landfill.
As noted in Table 5, this is a basic methodological approach, using emissions and conversion factors from representative sources not specific to Scottish local authorities. In some instances, population data has been used as a proxy where local authority specific data was not available. The activity data was also derived from a variety of sources encompassing a range of levels of confidence (see Appendix 13.2). As such there is a high level of uncertainty in the estimated projected emissions reductions.
Sources for emissions equations
As described in the methodology section above, the figures presented in Tables 3, 4, 12, 13, 14, 15 and 16 and Figures 5 and 6 used the basic equation activity data x emission factor. The emissions factors were primarily drawn from Green Book supplementary guidance: valuation of energy use and greenhouse gas emissions for appraisal (BEIS, 2023) and Guidelines for National Greenhouse Gas Inventories (IPCC, 2006). However, in some cases additional sources were drawn on. The activity data was calculated using a range of sources. The sources are presented in Table 7 below, by GHG inventory category.
Table 7: Sources for emissions calculations by inventory category
Climate change strategy register
|
Organisation |
Strategy |
Summary description (150-250 words) |
|---|---|---|
|
Aberdeen City Council |
Climate Change Plan |
This builds on Aberdeen’s route map to net zero and has many actions to reduce carbon emissions and build resilience. It includes their reported emissions, climate risks and adaptation, targets for buildings, mobility and behaviour change and how these are aligned to the SDGs. Actions include: low carbon/renewable energy installations, zero emission council fleet, upgraded street lighting and nature-based solutions for council owned land. |
|
Aberdeen City Council |
Electric Vehicle Framework |
This framework was released in 2021 and the objectives are to identify how the city’s charging infrastructure should be increased and managed, ensure that the Council’s policies and strategies facilitate a greater uptake of EVs, outline what supporting measures are required, identify the key groups that should be involved in delivering the framework and set out the costs involved in delivering the framework. Actions include to increase EV charge points, identify key groups that should be involved in delivering this framework, ensure the council’s policies and strategies facilitate a greater uptake of EVs. |
|
Aberdeen City Council |
Waste Implementation Plan and Policy |
This strategy sets out the plans to manage waste until 2025, introducing new waste infrastructure and recycling services. The main targets set in this document are; waste growth to be eliminated by 2015, for Aberdeen to be aligned with the Scottish Government’s Zero Waste Plan 2010, to introduce an organic waste collection for all households by 2016, develop facilities within the Aberdeen Area to recover resources and for no more than 5% of household waste to be landfilled by 2025. |
|
Aberdeen City Council |
Local Transport Strategy |
This strategy is broad and covers elements such as maintenance, management, support but have a focus on sustainable development and travel covering areas such as ultra low emission vehicles, school travel and climate change mitigation and adaptation. Objectives in this section include enabling development that reduces the need to travel and minimises the reliance in personal care use and facilitates sustainable travel methods of walking and cycling when land planning. Travel packs should be provided for users of workplaces and schools by developers so there is future planning for sustainable transport use. Aberdeen City has been making improvements to accessibility of EV chargers, developing a comprehensive publicly accessible charging network serving the City and the trunk and strategic road network in partnership with the Energy Saving Trust (Scotland), Transport Scotland and the Office for Low Emission Vehicles. EV charging points are also included in their LDP. |
|
Aberdeen City Council |
Local Housing Strategy |
The vision for this strategy is for the people of Aberdeen to live in good quality sustainable homes, which they can afford and that meet their needs. This strategy covers fuel poverty, climate change, homelessness issues and the condition of the housing stock. The fuel poverty targets are aligned with the national statutory targets set out by ScotGov. The key actions to achieve this include improving energy efficiency across housing, work with residents to obtain the best prices for heat and power, maximise their income and encourage them to reduce their carbon footprint. |
|
Aberdeen City Council |
Hydrogen Strategy and Action Plan |
The overall aim of this strategy is to position Aberdeen as an example for hydrogen technology by utilising transferable expertise form the oil and gas industry and the capacity for renewable energy generation in the NE of Scotland. Overall, this strategy has 7 areas covering; vehicle deployments, renewable hydrogen, refuelling infrastructure, non-transport applications, supply chain/makrey development, community and education and policy and education. Actions to deliver this plan include having a fleet of hydrogen vehicles and expand this to deploying hydrogen buses, to gain support there will be incentives such as free parking. These actions come soff the back of a second refuelling station (Aberdeen City Hydrogen Energy Storage Project). |
|
Angus |
Sustainable Energy and Climate Action Plan |
The climate action plan outlines multiple actions to be delivered across 2-6 years, with 2 actions funded through the Mercury programme. These include clean growth business units and Timmergreens low carbon housing-led regeneration scheme. Any PPIs are yet to be confirmed by the Mercury Programme and partners include Crown Estate Scotland, Scotland Innovation Centre and Zero Waste Scotland among others. There is also an action to deliver a maintenance and repair programme for historic buildings to ensure climate resilience across 6-10 years. The PPI will be the number of historic buildings retrofitted in partnership with Historic Environment Scotland and funding is yet to be confirmed. |
|
Angus |
Transition to Net Zero Action Plan |
The purpose of this Transition to Net Action Plan (2022 to 2030) is to ensure Angus Council meet the 2030 Scottish Government interim emissions reduction target of a 75% reduction in emission, enroute to the Net Zero target by 2045. From the base year of 2012/13 to the end of the financial year 2020/21, Angus Council reduced its emissions by 52.5%. Going forward to 2030, Angus Council must reduce its emissions by 5% each year to meet the 75% reduction target. The key themes identified below, will be used drive emission reductions within key operational areas to meet the 2030 interim emissions reduction target: Leadership, Governance & Procurement Buildings, Energy & Infrastructure Waste, Recycling & Circular Economy Fleet & Business Travel Land Use Adaptation Within each of these key themes, Action Plans containing emission reduction projects and initiatives have been developed. The progress of the Action Plans and Angus Councils Transition to Net Zero will be reviewed and reported annually in November (starting from 2023), alongside the Public Bodies Climate Change Duties Report. |
|
Angus |
Local Development Plan |
Sets out detailed policies and proposals to guide development and investment over a 10 year period. Reviewed every five years and used as a basis for determining planning applications. |
|
Argyll and Bute Council |
Decarbonisation Plan |
This plan is aligned with the Scottish emission reduction targets and covers waste, energy and transport consumption, transport, climate adaptation and offsetting. This includes climate commitments across these streams , the main themes are: Argyll and Bute Council to achieve 75% carbon reduction by 2030 and net zero before 2045, support a low carbon economy, lead by example and develop practices and partnerships that inspire low carbon behaviour and to make ‘Climate Friendly Argyll & Bute’ a recognised brand and underpin behaviours of council staff and customers. Targets includes a new waste strategy to transition not the Landfill Ban by 2025, additional solar installation to council assets and £2.9million external funding to active travel. |
|
Dumfries & Galloway |
Carbon Neutral Strategic Plan |
This policy consists of a wide range of quantified actions all aimed at reducing carbon emissions. The actions span across categories of; Agriculture, council buildings and streets, council transport, domestic, LULUCF, non domestic buildings, transport and waste. All individual actions within these categories have measures against them of first year of full impact of measures savings, 2025 annua savings (tCO2e) and 2030 annual savings (tCO2e). |
|
Dumfries & Galloway |
Active Travel Strategy |
Integrate the work of this strategy with that of the Regional Transport Strategy to facilitate sustainable travel: |
|
Dumfries & Galloway |
New Waste Management Infrastructure |
Proposals for new or extended waste management facilities will be expected to have given full consideration to the following criteria: National and Local waste plans; Sustainable transport principles; Environmental impacts; Site suitability. |
|
Dundee |
Climate Action Plan |
Dundee City Council are leading on four general actions with partners of SSN and Dundee Partnership. With SSN they are looking to adopt an emissions modelling tool to quantify the impact of Climate Action Plan actions, to inform future targets and present data in an interactive way but they do not have funding in place. With Dundee Partnership this local authority are looking to develop and trial a carbon budget for the Council but do not have funding in place. Dundee City Council have funding for the following two actions where they are collaborating with Dundee Partnership; Establish effective governance for the Climate Action Plan in partnership with public, private and community organisations and implement a system for monitoring and reporting progress and Develop the Sustainable Dundee communications strategy to raise awareness, communicate and engage people in the Climate Action Plan to promote prolonged behaviour change. |
|
Dundee |
Waste and Recycling Strategy Action Plan |
This strategy provides an update on actions taken to implement national policy and meet legislative requirements in Dundee and sets out the strategic direction for the Council going forward. It provides a clear action plan to ensure that waste is managed more efficiently, ensuring that every recycling opportunity is taken over the next five years in order to work towards national recycling targets and once again becoming “Scotland’s Recycling City”. |
|
East Ayrshire Council |
Local Development Plan (LDP) 2 |
LDP2 covers the whole of the East Ayrshire Council area and sets out the Council’s planning policy framework for all matters, including the environment. |
|
East Ayrshire Council |
Clean Green East Ayrshire Climate Change Strategy |
Plans on becoming a net zero council by 2030 and wider communities by 2045. |
|
East Ayrshire Council |
Ayrshire Growth Deal |
Signed in November 2020, this marked the culmination of five years’ work by the three Ayrshire councils, partner organisations and Scottish and UK Governments. It aims to deliver a series of projects to foster economic growth whilst addressing sustainability and climate change. |
|
East Ayrshire Council |
Community Renewable Energy (CoRE) |
Working closely with both the private sector and our partners at the University of Strathclyde and centred around the Cumnock area, this initiative will place East Ayrshire at the very centre of innovation and development of new approaches and technologies that are needed locally to make the move to net zero while also supporting the wider climate change aspirations for Scotland and the UK. Comprising a programme of Demonstrator Projects, CoRE has funding of £17m from the UK Government, together with £7.5m allocated by East Ayrshire Council as part of the Ayrshire Growth Deal. The projects will combine academic and commercial expertise, local resources and new and emerging technologies to move the area into a low carbon future. CoRE will include a Centre of Excellence in Cumnock and various developments linked to energy research and generation at different locations around the local area, including former mining sites. |
|
East Dunbartonshire |
Local Development Plan 2 |
The local development plan shows how the council plan to embed sustainability in their planning process. It includes policy around renewable energy and low carbon technologies including decentralised energy centres and heat networks. It also highlights in LDP policy 15 the need to set stricter requirements for carbon reduction via energy efficiency and renewable use. |
|
East Dunbartonshire |
East Dunbartonshire Sustainability and Climate Change Framework (‘SCCF’) & Sustainability and Climate Change Framework Action Plan |
Sets a framework for strategic, cross-Council approach to sustainability, including corporate carbon reduction. The policy explores several areas but fails to move away from council owned assets and fails to explore territorial ones. |
|
East Dunbartonshire |
East Dunbartonshire Council Active Travel Strategy |
Supplements the Local Transport Strategy, seeking to improve opportunities for transport powered by human physical activity as an alternative to motorised transport. It gives a more detailed explanation on the benefits of improved active travel links for ED and shows how they will be implemented. |
|
East Dunbartonshire |
East Dunbartonshire Local Transport Strategy |
Sets out the Council’s transport policy, presents Transport Planning Objectives and co-ordinates future priorities to enhance transport and travel in East Dunbartonshire including enabling a shift to environmentally, socially and economically sustainable transport. It includes are of focus such as |
|
East Lothian |
East Lothian Climate Change Strategy |
East Lothians climate plan outlines how the council want to meet their Net Zero targets. It focuses on council owned emissions and does not mention council wide emissions in much detail. It includes outcomes on the following areas |
|
East Lothian |
East Lothian Transport Strategy |
East Lothian Councils Transport policy identifies Sustainable Transport, Active Travel, Air Quality and resilient transport networks and infrastructure as key focus areas. The polices work to ensure East Lothian is well-connected, healthy and active, where active travel and sustainable transport methods are embedded in local area plans. |
|
East Lothian |
East Lothian Local Development Plan |
East Lothians Local Development Plan and supplementary planning guidance set out a framework to support and encourage low carbon lifestyles and the transition needed to achieve decarbonisation. Planners actively seek provision where necessary of green networks, paths, active travel routes, open space and Sustainable Drainage Systems in new housing developments. The LDP helps to build a picture of how East Lothian see their built environment in the future but fails to mention any quantitative impacts that this may include. |
|
East Lothian |
Active Travel Improvement Plan |
Locally, the Active Travel Improvement Plan (ATIP) is one of four supporting plans to East |
|
East Renfrewshire |
Local Development Plan 2 |
The LDP2 sets out a long-term strategy and a policy framework to guide future development, sustainable and inclusive economic growth and regeneration. Delivering sustainable development across East Renfrewshire is supported through a number of strategic policies. |
|
Edinburgh |
Climate Strategy |
This strategy sets a target for Edinburgh to be net zero and climate resilient by 2030. This strategy is based on six key actions being; improving energy efficiency in homes and buildings, a citywide programme for heat and energy generation and distribution infrastructure, decarbonising public transport, renewing climate adaptation efforts, supporting behaviour change of citizens and growing the green economy. |
|
Edinburgh |
City Plan 2030 |
The City Plan 230 is very specific to Edinburgh’s future developments. This plan includes spatial strategy, policies, proposals within the city and maps to accompany these with an action plan detailing specifics. The plan covers the city until 2032 and aims to plan the city in a way that responds to climate change, social inequalities, and commits to eliminating poverty, ensure residents have enough money to live, have opportunities to work and plentiful learning opportunities. |
|
Edinburgh |
City Mobility Plan |
The main goals of this plan is to ensure that the people, goods and services of Edinburgh are able to travel around the city in a way that is safe, sustainable, efficient and beneficial to all. The main target that the actions in this plan are centred around is for by 2030 to lower the number of kilometres travelled by car in Edinburgh to reduce by 30% aligning with the net zero target for the city of 2030. |
|
Falkirk |
Climate Emergency Update |
The Climate Emergency Strategy will set out how the Council intends to reach their organisational and national net zero target. The strategy includes points on • fleet decarbonise • Decarbonise Council, operational, building stock (will be contained within the Local Heat and Energy Efficiency Strategy); • reduce emissions from waste; and • support territorial decarbonisation (this will require some level of community engagement. The plan also mentions community owned solar growth, hydrogen innovation and EV charging which would have impacts on territorial emissions, however, does not go into much detail around data and figures. |
|
Fife |
Zero Waste Fife – Resource Strategy and Action Plan 2018-2028 |
In 2011 the Zero Waste Plan was superseded by a new strategy that addressed the obligations and opportunities presented by the Waste (Scotland) Regulations 2012. It outlined further improvements to the kerbside recycling service, and treating unsorted waste to recover accessible recycle and energy. Additional efforts focused on the development of new business avenues for Fife’s two landfill sites to maintain income levels, and the potential development of an arms-length organisation to develop and operate waste treatment infrastructure on behalf of the Council. A further revision of the Zero Waste Strategy in 2015, took account of developments in household waste recycling and the development of waste management infrastructure (anaerobic digestion facility for the treatment of organic waste). It also took account of the Scottish Government recycling targets and the implementation of the biodegradable municipal waste landfill ban in 2021. |
|
Fife |
Climate Fife: Sustainable Energy and Climate Action Plan |
Climate Fife is Fife’s response to the climate emergency. The plan sets out the strategy which underpins Climate Fife, presenting: • a vision for where Fife Council wants to be, and the themes and programmes to show where actions are needed and how this will be supported. |
|
Fife |
Fife Local Transport Strategy |
Fife Local Transport Strategy does a good job at outlining Fife’s transport future and when paired with the climate Fife plan will focus on reducing the need to travel by settlement and development planning and smart technology; promoting active travel, increasing vehicle efficiencies, making public transport more popular and increasing the uptake of ULEV (ultra-low emission vehicles) such as hybrid-electric, full-electric and hydrogen fuel vehicles. |
|
Glasgow |
Glasgow Climate Plan |
The plan aims to address the climate and ecological emergency by: |
|
Glasgow |
City Development Plan |
Glasgow’s City Development plan outlines key areas of interest for planning consent and ensures that Glasgow meets its built environment goals around sustainability. This includes lots of planning consent around buildings and homes which make up most of the document. |
|
Glasgow |
Energy and Carbon Masterplan |
The Energy and Carbon Masterplan (ECM) sets out a vision of a transformed energy economy for Glasgow that is based on low carbon and increasingly de-centralised energy sources that are better able to meet Glasgow’s energy needs and help Glasgow tackle climate change. The ECM builds and extends the current collaborative working arrangements on energy and sustainability in the city through the work of the Sustainable Glasgow initiative and is a key strategy in helping deliver Glasgow’s aspirations to become one of Europe’s most sustainable cities. |
|
Glasgow |
Glasgow City Council Resource and Recycling Strategy |
Glasgow City Council Resource and Recycling Strategy |
|
Glasgow |
Glasgow Transport Strategy |
Glasgow Transport Strategy 2022 looks to deliver and expand on the following objectives: |
|
Highlands |
Carbon CLEVER |
Highland council-led initiative with a target of a carbon neutral Inverness in a low carbon Highlands by 2025 |
|
Inverclyde |
Inverclyde Net Zero Strategy |
The net zero strategy has two targets, a delivery of carbon footprint reductions of 73% between 2021-2030 |
|
Inverclyde |
Inverclyde Waste Strategy |
The Council has implemented a large waste minimisation and recycling programme in terms of both infrastructure and promotion. The programme included kerbside recycling for various types of waste, education on how to reduce and recycle waste and generating energy from waste and circular economy principals. |
|
Midlothian |
Midlothian Climate Change Strategy |
The strategy sets out a clear vision and set of objectives, to highlight what we can, and must do to combat climate change and highlights some of the challenges to achieving this. It focuses on a number of themes including Energy Efficiency; Recycling & Waste; Sustainable Development; Sustainable Travel; Business Processes; Carbon Management; Governance & Management; and Risk. |
|
Midlothian |
Midlothian Active Travel Strategy |
Promotes an Active Travel culture where walking and cycling become the normal choice for everyday journeys. The plan outlines future planning around walking and cycling routes, increasing safety for non-car users and school walking safety. |
|
Moray |
Climate Change Strategy |
This Climate Change Strategy identifies the key areas that the Council will prioritise within available resources to not only help reduce its own impact on the environment, but how it will seek to influence and encourage the wider community. The Strategy and Action plan detail a range of measures that will contribute directly to achieving key outcomes. Details of how the key actions will be delivered, along with timescales, targets and resource requirements, will be further developed and defined, and be subject to regular review. This Climate Change Strategy comprises the council’s response to the national and international priority of tackling climate change and shall be taken account of in all future planning and policy work undertaken by Moray Council. The policy lacks quantitative data. |
|
Moray |
Local Development Plan |
The Moray Local Development Plan (MLDP) 2020 sets how the Council sees the MLDP area developing over the next 10 years and beyond and covers the administrative area of Moray Council, minus the southern part which falls within the Cairngorm National Park which prepares its own LD. Alongside National Planning Framework 4 (NPF4), the MLDP forms the Development Plan for Moray. |
|
North Ayrshire |
Environmental Sustainability and Climate Change Strategy |
The North Ayrshire climate strategy outlines the key focus areas for them to meet net zero. It includes both territorial emissions and council owned in great detail. Some of the key areas include: •Progress and monitor the Net Zero Carbon Roadmap, with milestones to be reported quarterly to the Head of Service and to Cabinet every six months Council’s through the corporate performance monitoring framework |
|
North Ayrshire |
Electric Vehicles Strategy |
The aim of the Council’s Electric Vehicle strategy is to increase the number of EVs being used throughout North Ayrshire by creating a robust network of EV charge points. The strategic objectives of the EV Strategy are as follows: |
|
North Ayrshire |
Zero Waste Strategy |
The Council were 1 of only 9 Scottish local authorities who exceeded the Scottish Government’s Zero Waste Plan target to recycle over 50% of household waste by 2013, and are currently one of the top performing Councils for recycling in Scotland, highlighting the success of the previous strategy due to their previous strategy. This new strategy outlines the following key areas they want to achieve: Recycle 60% of household waste by 2020; • Cease disposal of Biodegradable Waste to landfill by 31st December 2020; • Recycle 70% of all waste by 2025; and • Reduce the waste disposed of to landfill to a maximum of 5% by 2025. The strategy remains focussed on the waste hierarchy, which identifies waste prevention as the most preferred option, followed by re-use, recycling, and treatment/energy recovery, and then disposal as the final option. |
|
North Ayrshire |
Local Development Plan 2 |
The LDP sets out the planning and built environmental context for the council region. The plans are based around buildings, spaces and infrastructure and does not outline how they will be achieved. |
|
North Lanarkshire |
Active Travel Policy |
The strategy includes targets to work towards a council with active travel provisions with different interventions necessary to achieve each strategy aspect. The strategy focuses on fostering collaboration across the council’s remit and suggests exploring feasibility of developing cross boundary links for active travel with other local authorities and partners. |
|
Orkney Islands |
Orkney Sustainable Energy Strategy |
Developed in partnership with Orkney Islands Council, Highlands and Islands Enterprise (HIE), Community Energy Scotland and the OREF (Orkney Renewable Energy Forum) working to reduce island’s dependency on fossil fuels. |
|
Orkney Islands |
Sustainable & Active Travel |
Contribute to the health and wellbeing of the people of Orkney. |
|
Perth & Kinross |
Climate Change Strategy and Action Plan |
The strategy covers: transport, buildings and energy, business and industry, waste and circular economy, land use, education and engagement, climate resilience. Within each theme there are quantified targets and 4-5 sub-themes with KPIs attached to measure progress against a baseline value. Each category includes a exemplar case study of how this policy aspect will be progressed. |
|
Renfrewshire |
Plan for Net Zero (Phase 2) |
The plan has five key actions: 1. detailed phase plan to 2030, 2. quantified delivery plans, 3. verifying, adopting, and updating emissions modelling tool, 4. developing a carbon budget for Renfrewshire council, 5. developing an adaptation plan for Renfrewshire. The policy categories cover: clean energy, sustainable transport, circular economy, connected communities and resilient place. |
|
Scottish Borders |
Climate Change Route Map |
The climate change route map emphasises collaboration, talking about climate risks/vulnerabilities and undertaking strategic environmental assessments. The categories covered are: resilience, transport use, nature based solutions, energy, waste management, adaptation, behaviour change. The policy document outlines progress to date up to 2021. |
|
Shetland Islands |
Shetland’s Climate Change Strategy |
Shetland Partnerships overarching framework of Shetland’s strategic plan to address climate change. Content currently under development by Shetland Partnership Climate Change Steering Group. |
|
South Ayrshire |
Sustainable Development & Climate Change Framework |
The sustainability strategy has three key themes: 1. Sustainable Council: reducing the corporate GHG emissions and improving the wider environment, 2. Sustainable environment: protecting and enhancing the environment while improving the health, well-being and livelihoods of local communities, and 3. Sustainable Community: supporting local communities to limit GHG emissions, adapt to climate change impacts and improve their local environment. |
|
South Lanarkshire |
Sustainable Development and Climate Change Strategy 2 |
The policy builds upon their 2017 to 2022 climate change strategy and covers health and wellbeing, climate justice, transport, energy, greenspaces, community, waste, protect environment, nature-based solutions, green economy, circular economy, and business transition. Each category has key actions listed out, with progress to-date outlined within document and 5 year improvement actions specified to reach each aim. |
|
Stirling |
Climate and Nature Emergency Plan |
The strategy covers: energy use and generation, transport, resource efficiency, nature and biodiversity, and climate adaptation. It lists ~5 key priorities for each objective, outlines progress to date, includes final targets and interim targets and measures of progression. The national ScotGov targets have been translated to be applicable to Stirling Council area and Stirling Council specifically, and they have used 2005 as their GHG emission base year from which to measure any progress. The policy also notes which other council policies are required to reach the objectives (e.g., the local development plan is integral to advance the objectives listed in the energy use and generation section of the policy document. |
|
West Dunbartonshire |
Climate Change Action Plan |
This plan implements our Climate Change Strategy through a series of high-level actions for the short, medium and long term, setting out the need for action and a high-level framework. |
|
West Dunbartonshire |
Climate Change Strategy |
An overarching Strategy setting the foundation for a plan of action for 2021-22 and beyond and is a response to Scotland’s Climate Emergency and 2045 net zero carbon reduction target. |
|
West Dunbartonshire |
The West Dunbartonshire Energy Centre |
Scotland’s largest water source heat pump installation to date to help Council transit towards net zero. £20 million project, of which the £6.1 million came from Low Carbon Infrastructure Transition Programme |
|
West Dunbartonshire |
Local Development Plan 2 (LDP2) |
Seeks to ensure that new development in West Dunbartonshire is aligned with the goal to achieve net zero through net zero carbon buildings, clean energy generation, green infrastructure, etc. |
|
West Dunbartonshire |
WDC Local Housing Strategy |
Details how the Council and stakeholders will address and support housing, including fuel poverty, etc. |
|
West Lothian |
Climate Change Strategy |
This Strategy aims to ensure that activities to tackle climate change to contribute to the achievement of the outcomes identified within the council’s Corporate Plan (2018-2023) and the West Lothian Local Outcomes Improvement Plan (LOIP) (2013-23). |
|
West Lothian |
Adaptation Action Plan |
The Action Plan identifies seven adaptation outcomes which the council will work towards through implementing over 70 actions over the next 6 years (2022 -28). |
|
West Lothian |
West Lothian Local Outcomes Improvement Plan (LOIP) |
The mechanism by which Community Planning Partnerships deliver improved outcomes for their communities. They are based on a clear understanding of local needs and reflect agreed local priorities, as well as the National Performance Framework developed by the Scottish Government. |
Quantifying impact
In the development of the emission boundaries, we applied two measures of assessing impact: Likelihood and Magnitude.
Likelihood
Likelihood is defined as the probability or chance that a given policy will achieve its intended impact or target. We have applied IPCC Guidance (IPCC, 2006) to determine likelihood as outlined in Table 8.
|
Likelihood |
Description |
Probability |
|
Very Likely |
Reason to believe the effect will happen (or did happen) because of the policy. |
90-100% |
|
Likely |
Reason to believe the effect will probably happen (or probably happened) because of the policy. |
66-90% |
|
Possible |
Reason to believe the effect may or may not happen (or may or may not have happened) because of the policy. About as likely as not. Cases where the likelihood is unknown or cannot be determined should be considered possible. |
33-66% |
|
Unlikely |
Reason to believe the effect probably will not happen (or probably did not happen) as a result of the policy. |
10-33% |
|
Very unlikely |
Reason to believe the effect will not happen (or did not happen) because of the policy. |
0-10% |
There are several considerations made when assessing the likelihood, a policy has in achieving its intended outcomes.
- Sphere of control: a measure of how much control a local authority has over whether action is taken against a policy. This ranges on a scale from absolute where a policy is enacted through legislation, through to voluntary where a policy results in stakeholders making a pledge.
- Capacity and capability: whether the local authority have the resources it needs to actively measure and enforce the provisions within a policy once it is active.
- Timescale: the impacts of policies may require consistent action taken over several years, or even decades. This can prove difficult as socioeconomic needs shift over time meaning that policies may also need to adapt over time, changing impacts and targets.
An example of a policy that is ‘very likely’ to meet its intended targets is a Low Emission Zone whereby a local authority has absolute ability to determine the classification of vehicles that enter its zone. Compare this to a policy improving active travel provision whereby the intended benefits are somewhat dependent on stakeholders enacting the policy out of their own free-will.
Magnitude
Magnitude is a simple measure of a policy’s potential impact on an inventory’s emissions. Following IPCC guidance (IPCC, 2006), we have set the following impact boundaries to rank the valued policies:
|
Magnitude |
Description |
Impact |
|---|---|---|
|
Major |
The effect significantly influences the effectiveness of the policy or action. The change in GHG emissions or removals is likely to be significant in size. |
>10% |
|
Moderate |
The effect influences the effectiveness of the policy or action. The change in GHG emissions or removals could be significant in size. |
1-10% |
|
Minor |
The effect is inconsequential to the effectiveness of the policy or action. The change in GHG emissions or removals is insignificant in size. |
<1% |
Policy descriptions
Table 10: Descriptions of 13 climate policies collated from six chosen local authorities for valuation, including example targets and KPIs set by the local authorities
|
Inventory / Policy |
Description |
Example targets and KPIs from local authorities |
|---|---|---|
|
Agriculture | ||
|
Changes to Agricultural Practices |
Changes in agricultural methods to reduce the use of nitrogen fertilisers, changes in animal feeds, reduced intensity of livestock production and improvements in waste management. |
This policy consists of a wide range of quantified actions all aimed at reducing carbon emissions. All individual actions within these categories have measures against them of first year of full impact of measures savings, 2025 annual savings (tCO2e) and 2030 annual savings (tCO2e). |
|
LULUCF | ||
|
Greening of derelict land |
Identify and utilise Vacant and Derelict Land for greening and rewilding in combination with renewable energy generation measures and reducing flood risk. |
% VDL used for renewable energy generation |
|
Peatland restoration |
Increase investment in peatland restoration in the region to enhance biodiversity and increase capacity for carbon sequestration. |
Percentage emissions reduction. 20,000 hectares restored per annum 250,000 hectares restored by 2030 |
|
Reforestation (1 million new trees per local authority) |
Protecting and enhancing existing ecosystems and biodiversity through reforestation. |
Plant 80,000 new trees by 2023; 360,000 by 2030 and 1,000,000 by 2045. |
|
Transport | ||
|
Active travel |
Encouraging walking and cycling for shorter journeys rather than the use of personal cars. |
Many journeys are relatively short and could easily be undertaken by walking or cycling. In 2017 |
|
Homeworking |
Promote homeworking and videoconferencing to reduce traffic congestion, as part of a range of effective working practices. |
Number of staff working remotely. |
|
Low Emission Zone |
Reduce emissions from transport in city centres and improving air quality by expanding low emissions zone. |
Percentage transport emissions |
|
Public transport |
Work with transport stakeholders in the city to support rapid transition to cleaner public transport as part of the City’s Low Emissions Zone. |
% change in PM 10 at each monitoring location, averaged over a three-year period. |
|
Fleet vehicles |
Deliver rapid transition of council’s fleet to electric, supporting the city’s existing fleet strategy’s target of becoming low carbon by 2030. |
Share of low emission vehicles in the overall modal split – % change |
|
Council Business Travel |
Replace modes of council business transport with low emission alternatives. |
45% reduction in transport emissions by 2030 against a 4,450tCO2 baseline. |
|
LEV Taxi Licences |
Make it compulsory for taxi licences granted depending on whether the mode of transport is a low emissions vehicle. |
100% of new taxi licences that are EV by 2032 |
|
Waste | ||
|
Waste Reduction Strategy |
Detailing how the region will help reduce, reuse and recycle, detailing corporate standards, targets and staff guidance for our waste activities, including improving infrastructure. |
By 2025 – 95% reduction of landfill waste (as part of a suite of other initiatives) |
|
Council Waste Reduction |
Reduce the amount of council-generated waste going to landfill. |
70% reduction of waste going to land fill by 2030 against a 892t 2019 baseline |
Valuing greenhouse gas emissions
Table 21: Total territorial greenhouse gas emissions (ktCO2e), by inventory (BEIS, 2022)
|
Local authority |
Territorial greenhouse gas emissions (ktCO2e) | ||||||
|---|---|---|---|---|---|---|---|
|
Agriculture |
Buildings |
Industry |
LULUCF |
Transport |
Waste |
Total | |
|
Aberdeen City |
32 |
585 |
236 |
31 |
305 |
30 |
1,218 |
|
Aberdeenshire |
1,083 |
579 |
244 |
357 |
613 |
117 |
2,993 |
|
Angus |
264 |
249 |
117 |
389 |
235 |
9 |
1,263 |
|
Argyll and Bute |
297 |
198 |
85 |
-532 |
186 |
23 |
257 |
|
City of Edinburgh |
37 |
1,203 |
213 |
70 |
640 |
73 |
2,236 |
|
Clackmannanshire |
24 |
103 |
290 |
24 |
66 |
5 |
512 |
|
Dumfries and Galloway |
1,555 |
350 |
185 |
-239 |
571 |
17 |
2,439 |
|
Dundee City |
5 |
353 |
63 |
23 |
184 |
14 |
642 |
|
East Ayrshire |
330 |
238 |
78 |
-31 |
229 |
11 |
855 |
|
East Dunbartonshire |
27 |
237 |
28 |
20 |
113 |
40 |
465 |
|
East Lothian |
112 |
217 |
552 |
194 |
210 |
29 |
1,313 |
|
East Renfrewshire |
43 |
196 |
9 |
23 |
147 |
3 |
421 |
|
Falkirk |
61 |
308 |
1,454 |
79 |
327 |
68 |
2,298 |
|
Fife |
308 |
741 |
1,143 |
345 |
584 |
138 |
3,260 |
|
Glasgow City |
13 |
1,293 |
380 |
68 |
761 |
196 |
2,710 |
|
Highland |
638 |
526 |
458 |
110 |
598 |
80 |
2,410 |
|
Inverclyde |
31 |
151 |
46 |
3 |
106 |
3 |
340 |
|
Midlothian |
70 |
189 |
48 |
52 |
137 |
18 |
513 |
|
Moray |
261 |
228 |
313 |
-167 |
162 |
37 |
834 |
|
Na h-Eileanan Siar |
81 |
66 |
22 |
951 |
42 |
22 |
1,184 |
|
North Ayrshire |
135 |
258 |
349 |
-32 |
151 |
30 |
891 |
|
North Lanarkshire |
79 |
636 |
313 |
90 |
736 |
78 |
1,932 |
|
Orkney Islands |
239 |
44 |
14 |
43 |
29 |
4 |
373 |
|
Perth and Kinross |
408 |
353 |
89 |
-140 |
515 |
81 |
1,307 |
|
Renfrewshire |
50 |
370 |
120 |
35 |
301 |
27 |
903 |
|
Scottish Borders |
767 |
251 |
103 |
-103 |
261 |
13 |
1,292 |
|
Shetland Islands |
107 |
42 |
34 |
572 |
43 |
4 |
801 |
|
South Ayrshire |
296 |
239 |
168 |
-55 |
209 |
10 |
867 |
|
South Lanarkshire |
341 |
652 |
208 |
-27 |
666 |
33 |
1,874 |
|
Stirling |
182 |
204 |
178 |
-150 |
249 |
45 |
709 |
|
West Dunbartonshire |
21 |
179 |
46 |
9 |
127 |
7 |
390 |
|
West Lothian |
89 |
362 |
211 |
48 |
373 |
67 |
1,150 |
|
Total |
7,985 |
11,600 |
7,798 |
2,059 |
9,878 |
1,333 |
40,653 |
Table 32: Estimated potential impact on greenhouse gas emissions (ktCO2e) from Agriculture and LULUCF policies
|
Local authority |
Agriculture |
LULUCF | ||||||
|---|---|---|---|---|---|---|---|---|
|
Total Agriculture emissions |
Changes to Agricultural Practices |
Total policy impact |
Total LULUCF emissions |
Greening of derelict land |
Peatland restoration |
Reforestation (1 million new trees per LA) |
Total policy impact | |
|
Aberdeen City |
32 |
-6 |
-6 |
31 |
-7 |
0 |
-25 |
-32 |
|
Aberdeenshire |
1,083 |
-193 |
-193 |
357 |
-15 |
-67 |
-25 |
-107 |
|
Angus |
264 |
-47 |
-47 |
389 |
-27 |
-1 |
-25 |
-52 |
|
Argyll and Bute |
297 |
-53 |
-53 |
-532 |
-11 |
-189 |
-25 |
-225 |
|
City of Edinburgh |
37 |
-7 |
-7 |
70 |
-12 |
-1 |
-25 |
-37 |
|
Clackmannanshire |
24 |
-5 |
-5 |
24 |
-60 |
-70 |
-25 |
-155 |
|
Dumfries and Galloway |
1,555 |
-275 |
-275 |
-239 |
-34 |
0 |
-25 |
-59 |
|
Dundee City |
5 |
-1 |
-1 |
23 |
-448 |
-12 |
-25 |
-485 |
|
East Ayrshire |
330 |
-58 |
-58 |
-31 |
-14 |
0 |
-25 |
-39 |
|
East Dunbartonshire |
27 |
-5 |
-5 |
20 |
-16 |
0 |
-25 |
-41 |
|
East Lothian |
112 |
-20 |
-20 |
194 |
-10 |
-2 |
-25 |
-36 |
|
East Renfrewshire |
43 |
-8 |
-8 |
23 |
-33 |
0 |
-25 |
-58 |
|
Falkirk |
61 |
-11 |
-11 |
79 |
-53 |
-37 |
-25 |
-115 |
|
Fife |
308 |
-50 |
-50 |
345 |
-122 |
-3 |
-25 |
-150 |
|
Glasgow City |
13 |
-2 |
-2 |
68 |
-199 |
-1 |
-25 |
-225 |
|
Highland |
638 |
-113 |
-113 |
110 |
-250 |
-1,214 |
-25 |
-1,489 |
|
Inverclyde |
31 |
-4 |
-4 |
3 |
-29 |
-1 |
-25 |
-55 |
|
Midlothian |
70 |
-12 |
-12 |
52 |
-22 |
-36 |
-25 |
-83 |
|
Moray |
261 |
-47 |
-47 |
-167 |
-3 |
-28 |
-25 |
-56 |
|
Na h-Eileanan Siar |
81 |
-15 |
-15 |
951 |
-2 |
-434 |
-25 |
-461 |
|
North Ayrshire |
135 |
-24 |
-24 |
-32 |
-249 |
-7 |
-25 |
-280 |
|
North Lanarkshire |
79 |
-14 |
-14 |
90 |
-239 |
-49 |
-25 |
-313 |
|
Orkney Islands |
239 |
-42 |
-42 |
43 |
-7 |
-149 |
-25 |
-181 |
|
Perth and Kinross |
408 |
-74 |
-74 |
-140 |
-8 |
-14 |
-25 |
-47 |
|
Renfrewshire |
50 |
-11 |
-11 |
35 |
-51 |
-1 |
-25 |
-76 |
|
Scottish Borders |
767 |
-133 |
-133 |
-103 |
-13 |
-13 |
-25 |
-51 |
|
Shetland Islands |
107 |
-18 |
-18 |
572 |
-1 |
-134 |
-25 |
-160 |
|
South Ayrshire |
296 |
-53 |
-53 |
-55 |
-20 |
-3 |
-25 |
-48 |
|
South Lanarkshire |
341 |
-61 |
-61 |
-27 |
-79 |
-48 |
-25 |
-152 |
|
Stirling |
182 |
-32 |
-32 |
-150 |
-28 |
-11 |
-25 |
-63 |
|
West Dunbartonshire |
21 |
-4 |
-4 |
9 |
-31 |
-1 |
-25 |
-56 |
|
West Lothian |
89 |
-16 |
-16 |
48 |
-77 |
-4 |
-25 |
-106 |
|
Total |
7,985 |
-1,416 |
-1,416 |
2,059 |
-2,167 |
-2,530 |
-800 |
-5,497 |
Table 13: Estimated impact on greenhouse gas emissions (ktCO2e) from Transport policies
|
Local authority |
Transport | ||||||||
|---|---|---|---|---|---|---|---|---|---|
|
Total Transport emissions |
Active travel |
Homeworking |
Low Emission Zone |
Public transport |
Fleet vehicles |
Council Business Travel |
LEV Taxi Licences |
Total | |
|
Aberdeen City |
305 |
-33 |
-0.01 |
-5 |
-7 |
-5 |
-10 |
-3 |
-99 |
|
Aberdeenshire |
613 |
-38 |
-0.01 |
-6 |
-8 |
-6 |
-11 |
-2 |
-112 |
|
Angus |
235 |
-17 |
-0.01 |
-3 |
-4 |
-3 |
-5 |
-1 |
-49 |
|
Argyll and Bute |
186 |
-12 |
0.00 |
-2 |
-3 |
-2 |
-4 |
-1 |
-37 |
|
City of Edinburgh |
640 |
-76 |
-0.03 |
-12 |
-16 |
-12 |
-22 |
0 |
-221 |
|
Clackmannanshire |
66 |
-7 |
0.00 |
-1 |
-2 |
-1 |
-2 |
-1 |
-22 |
|
Dumfries and Galloway |
571 |
-22 |
-0.01 |
-3 |
-5 |
-3 |
-6 |
-2 |
-65 |
|
Dundee City |
184 |
-21 |
-0.01 |
-3 |
-5 |
-3 |
-6 |
-1 |
-63 |
|
East Ayrshire |
229 |
-18 |
-0.01 |
-3 |
-4 |
-3 |
-5 |
-2 |
-53 |
|
East Dunbartonshire |
113 |
-16 |
-0.01 |
-3 |
-3 |
-2 |
-5 |
-1 |
-46 |
|
East Lothian |
210 |
-16 |
-0.01 |
-3 |
-3 |
-2 |
-5 |
-1 |
-47 |
|
East Renfrewshire |
147 |
-14 |
-0.01 |
-2 |
-3 |
-2 |
-4 |
-12 |
-52 |
|
Falkirk |
327 |
-23 |
-0.01 |
-4 |
-5 |
-4 |
-7 |
0 |
-68 |
|
Fife |
584 |
-54 |
-0.02 |
-9 |
-12 |
-9 |
-16 |
-2 |
-159 |
|
Glasgow City |
761 |
-92 |
-0.04 |
-15 |
-20 |
-14 |
-27 |
-2 |
-268 |
|
Highland |
598 |
-34 |
-0.01 |
-6 |
-7 |
-5 |
-10 |
-17 |
-116 |
|
Inverclyde |
106 |
-11 |
0.00 |
-2 |
-2 |
-2 |
-3 |
-2 |
-35 |
|
Midlothian |
137 |
-14 |
-0.01 |
-2 |
-3 |
-2 |
-4 |
-1 |
-40 |
|
Moray |
162 |
-14 |
-0.01 |
-2 |
-3 |
-2 |
-4 |
-1 |
-41 |
|
Na h-Eileanan Siar |
42 |
-4 |
0.00 |
-1 |
-1 |
-1 |
-1 |
-1 |
-12 |
|
North Ayrshire |
151 |
-19 |
-0.01 |
-3 |
-4 |
-3 |
-6 |
-1 |
-57 |
|
North Lanarkshire |
736 |
-49 |
-0.02 |
-8 |
-11 |
-8 |
-15 |
-6 |
-149 |
|
Orkney Islands |
29 |
-3 |
0.00 |
-1 |
-1 |
-1 |
-1 |
0 |
-10 |
|
Perth and Kinross |
515 |
-22 |
-0.01 |
-4 |
-5 |
-3 |
-7 |
-1 |
-65 |
|
Renfrewshire |
301 |
-26 |
-0.01 |
-4 |
-6 |
-4 |
-8 |
-4 |
-79 |
|
Scottish Borders |
261 |
-17 |
-0.01 |
-3 |
-4 |
-3 |
-5 |
-1 |
-49 |
|
Shetland Islands |
43 |
-3 |
0.00 |
-1 |
-1 |
-1 |
-1 |
0 |
-10 |
|
South Ayrshire |
209 |
-16 |
-0.01 |
-3 |
-4 |
-3 |
-5 |
-1 |
-48 |
|
South Lanarkshire |
666 |
-47 |
-0.02 |
-8 |
-10 |
-7 |
-14 |
-6 |
-141 |
|
Stirling |
249 |
-14 |
-0.01 |
-2 |
-3 |
-2 |
-4 |
-1 |
-40 |
|
West Dunbartonshire |
127 |
-13 |
0.00 |
-2 |
-3 |
-2 |
-4 |
-1 |
-38 |
|
West Lothian |
373 |
-27 |
-0.01 |
-4 |
-6 |
-4 |
-8 |
-2 |
-79 |
|
Total |
9,878 |
-793 |
-0.31 |
-129 |
-169 |
-124 |
-235 |
-76 |
-1,527 |
Table 44: Estimated potential impact on greenhouse gas emissions (ktCO2e) from Waste policies
|
Local authority |
Waste | |||
|---|---|---|---|---|
|
Total Waste emissions |
Waste Reduction Strategy |
Council Waste Reduction |
Total | |
|
Aberdeen City |
30 |
-16 |
-0.86 |
-17 |
|
Aberdeenshire |
117 |
-27 |
-0.98 |
-28 |
|
Angus |
9 |
-8 |
-0.44 |
-8 |
|
Argyll and Bute |
23 |
-11 |
-0.33 |
-12 |
|
City of Edinburgh |
73 |
-47 |
-1.96 |
-49 |
|
Clackmannanshire |
5 |
-4 |
-0.20 |
-4 |
|
Dumfries and Galloway |
17 |
-22 |
-0.57 |
-23 |
|
Dundee City |
14 |
-16 |
-0.56 |
-17 |
|
East Ayrshire |
11 |
-10 |
-0.46 |
-10 |
|
East Dunbartonshire |
40 |
-9 |
-0.41 |
-9 |
|
East Lothian |
29 |
-8 |
-0.41 |
-9 |
|
East Renfrewshire |
3 |
-5 |
-0.36 |
-5 |
|
Falkirk |
68 |
-12 |
-0.61 |
-13 |
|
Fife |
138 |
-38 |
-1.41 |
-39 |
|
Glasgow City |
196 |
-78 |
-2.38 |
-81 |
|
Highland |
80 |
-29 |
-0.90 |
-30 |
|
Inverclyde |
3 |
-5 |
-0.29 |
-5 |
|
Midlothian |
18 |
-8 |
-0.35 |
-8 |
|
Moray |
37 |
-7 |
-0.36 |
-7 |
|
Na h-Eileanan Siar |
22 |
-5 |
-0.10 |
-5 |
|
North Ayrshire |
30 |
-10 |
-0.51 |
-10 |
|
North Lanarkshire |
78 |
-35 |
-1.29 |
-37 |
|
Orkney Islands |
4 |
-4 |
-0.08 |
-4 |
|
Perth and Kinross |
81 |
-13 |
-0.58 |
-14 |
|
Renfrewshire |
27 |
-14 |
-0.68 |
-15 |
|
Scottish Borders |
13 |
-10 |
-0.44 |
-11 |
|
Shetland Islands |
4 |
-3 |
-0.09 |
-3 |
|
South Ayrshire |
10 |
-8 |
-0.43 |
-9 |
|
South Lanarkshire |
33 |
-30 |
-1.22 |
-32 |
|
Stirling |
45 |
-7 |
-0.35 |
-7 |
|
West Dunbartonshire |
7 |
-9 |
-0.33 |
-9 |
|
West Lothian |
67 |
-12 |
-0.69 |
-12 |
|
Total |
1,333 |
-520 |
-20.62 |
-541 |
Table 15: Estimated potential impact on total territorial greenhouse gas emissions (ktCO2e), by inventory
|
|
Territorial greenhouse gas emissions post policy (ktCO2e) | ||||||
|
Local authority | |||||||
|
Agriculture |
Buildings |
Industry |
LULUCF |
Transport |
Waste |
Total | |
|
Aberdeen City |
25 |
585 |
236 |
-1 |
241 |
13 |
1,100 |
|
Aberdeenshire |
889 |
579 |
244 |
250 |
541 |
89 |
2,593 |
|
Angus |
217 |
249 |
117 |
337 |
203 |
0 |
1,124 |
|
Argyll and Bute |
245 |
198 |
85 |
-757 |
162 |
11 |
-57 |
|
City of Edinburgh |
30 |
1,203 |
213 |
33 |
501 |
24 |
2,003 |
|
Clackmannanshire |
19 |
103 |
290 |
-131 |
51 |
0 |
334 |
|
Dumfries and Galloway |
1,280 |
350 |
185 |
-298 |
529 |
-5 |
2,041 |
|
Dundee City |
4 |
353 |
63 |
-462 |
144 |
-2 |
100 |
|
East Ayrshire |
272 |
238 |
78 |
-70 |
195 |
0 |
714 |
|
East Dunbartonshire |
22 |
237 |
28 |
-22 |
84 |
31 |
380 |
|
East Lothian |
92 |
217 |
552 |
157 |
179 |
20 |
1,218 |
|
East Renfrewshire |
35 |
196 |
9 |
-35 |
109 |
-2 |
312 |
|
Falkirk |
50 |
308 |
1,454 |
-36 |
284 |
56 |
2,115 |
|
Fife |
258 |
741 |
1,143 |
195 |
483 |
99 |
2,919 |
|
Glasgow City |
11 |
1,293 |
380 |
-157 |
591 |
115 |
2,232 |
|
Highland |
526 |
526 |
458 |
-1,379 |
518 |
50 |
699 |
|
Inverclyde |
27 |
151 |
46 |
-53 |
83 |
-2 |
253 |
|
Midlothian |
57 |
189 |
48 |
-31 |
112 |
10 |
385 |
|
Moray |
214 |
228 |
313 |
-223 |
136 |
29 |
699 |
|
Na h-Eileanan Siar |
66 |
66 |
22 |
490 |
35 |
17 |
696 |
|
North Ayrshire |
111 |
258 |
349 |
-312 |
114 |
20 |
540 |
|
North Lanarkshire |
65 |
636 |
313 |
-223 |
639 |
41 |
1,471 |
|
Orkney Islands |
197 |
44 |
14 |
-138 |
22 |
0 |
139 |
|
Perth and Kinross |
334 |
353 |
89 |
-187 |
474 |
68 |
1,130 |
|
Renfrewshire |
38 |
370 |
120 |
-41 |
249 |
12 |
749 |
|
Scottish Borders |
634 |
251 |
103 |
-154 |
230 |
2 |
1,065 |
|
Shetland Islands |
89 |
42 |
34 |
412 |
37 |
0 |
614 |
|
South Ayrshire |
242 |
239 |
168 |
-103 |
178 |
2 |
727 |
|
South Lanarkshire |
280 |
652 |
208 |
-178 |
575 |
2 |
1,538 |
|
Stirling |
150 |
204 |
178 |
-213 |
224 |
38 |
580 |
|
West Dunbartonshire |
17 |
179 |
46 |
-47 |
102 |
-2 |
296 |
|
West Lothian |
73 |
362 |
211 |
-58 |
323 |
55 |
965 |
|
Total |
6,570 |
11,600 |
7,798 |
-3,438 |
8,351 |
792 |
31,672 |
Table 56: Percentage change in territorial greenhouse gas emissions (ktCO2e) from implementing policies
|
|
Percentage change in territorial greenhouse gas emissions | ||||||
|
Local authority | |||||||
|
Agriculture |
Buildings |
Industry |
LULUCF |
Transport |
Waste |
Total | |
|
Aberdeen City |
-20.0% |
0.0% |
0.0% |
-101.9% |
-20.8% |
-56.1% |
-9.7% |
|
Aberdeenshire |
-17.9% |
0.0% |
0.0% |
-30.1% |
-11.7% |
-23.8% |
-13.4% |
|
Angus |
-17.8% |
0.0% |
0.0% |
-13.5% |
-13.4% |
-94.4% |
-11.0% |
|
Argyll and Bute |
-17.7% |
0.0% |
0.0% |
42.3% |
-12.8% |
-51.3% |
-122.0% |
|
City of Edinburgh |
-18.3% |
0.0% |
0.0% |
-53.5% |
-21.7% |
-66.9% |
-10.4% |
|
Clackmannanshire |
-19.6% |
0.0% |
0.0% |
-637.1% |
-22.1% |
-92.1% |
-34.9% |
|
Dumfries and Galloway |
-17.7% |
0.0% |
0.0% |
24.6% |
-7.3% |
-130.4% |
-16.3% |
|
Dundee City |
-22.3% |
0.0% |
0.0% |
-2113.7% |
-21.7% |
-117.2% |
-84.5% |
|
East Ayrshire |
-17.5% |
0.0% |
0.0% |
126.5% |
-15.0% |
-95.5% |
-16.6% |
|
East Dunbartonshire |
-18.3% |
0.0% |
0.0% |
-211.1% |
-26.1% |
-22.8% |
-18.3% |
|
East Lothian |
-18.3% |
0.0% |
0.0% |
-18.6% |
-14.5% |
-29.8% |
-7.3% |
|
East Renfrewshire |
-18.5% |
0.0% |
0.0% |
-255.7% |
-25.6% |
-175.4% |
-25.9% |
|
Falkirk |
-18.2% |
0.0% |
0.0% |
-146.3% |
-13.1% |
-18.9% |
-7.9% |
|
Fife |
-16.3% |
0.0% |
0.0% |
-43.5% |
-17.3% |
-28.4% |
-10.4% |
|
Glasgow City |
-16.7% |
0.0% |
0.0% |
-330.9% |
-22.4% |
-41.3% |
-17.7% |
|
Highland |
-17.7% |
0.0% |
0.0% |
-1354.6% |
-13.3% |
-37.4% |
-71.0% |
|
Inverclyde |
-11.7% |
0.0% |
0.0% |
-2100.5% |
-21.6% |
-158.5% |
-25.5% |
|
Midlothian |
-17.6% |
0.0% |
0.0% |
-160.3% |
-18.8% |
-44.6% |
-25.1% |
|
Moray |
-17.8% |
0.0% |
0.0% |
33.3% |
-16.0% |
-19.9% |
-16.3% |
|
Na h-Eileanan Siar |
-18.0% |
0.0% |
0.0% |
-48.5% |
-18.2% |
-21.2% |
-41.2% |
|
North Ayrshire |
-17.9% |
0.0% |
0.0% |
876.1% |
-24.3% |
-33.5% |
-39.4% |
|
North Lanarkshire |
-17.4% |
0.0% |
0.0% |
-346.8% |
-13.1% |
-47.1% |
-23.8% |
|
Orkney Islands |
-17.7% |
0.0% |
0.0% |
-423.4% |
-21.4% |
-93.4% |
-62.6% |
|
Perth and Kinross |
-18.1% |
0.0% |
0.0% |
33.6% |
-8.1% |
-16.9% |
-13.5% |
|
Renfrewshire |
-22.9% |
0.0% |
0.0% |
-216.1% |
-17.1% |
-55.8% |
-17.1% |
|
Scottish Borders |
-17.3% |
0.0% |
0.0% |
49.7% |
-12.1% |
-84.7% |
-17.5% |
|
Shetland Islands |
-16.8% |
0.0% |
0.0% |
-28.0% |
-15.0% |
-91.2% |
-23.4% |
|
South Ayrshire |
-18.0% |
0.0% |
0.0% |
87.0% |
-14.7% |
-84.2% |
-16.2% |
|
South Lanarkshire |
-18.0% |
0.0% |
0.0% |
570.8% |
-13.7% |
-94.9% |
-17.9% |
|
Stirling |
-17.8% |
0.0% |
0.0% |
42.3% |
-10.2% |
-16.6% |
-18.1% |
|
West Dunbartonshire |
-18.0% |
0.0% |
0.0% |
-613.8% |
-19.4% |
-121.7% |
-24.1% |
|
West Lothian |
-18.4% |
0.0% |
0.0% |
-222.0% |
-13.6% |
-18.5% |
-16.1% |
|
Total |
-17.7% |
0.0% |
0.0% |
-266.9% |
-15.5% |
-40.6% |
-22.1% |
© Published by Turner & Townsend, 2023 on behalf of ClimateXChange. All rights reserved.
While every effort is made to ensure the information in this report is accurate, no legal responsibility is accepted for any errors, omissions, or misleading statements. The views expressed represent those of the author(s), and do not necessarily represent those of the host institutions or funders.
Active transport typically means a human-powered form of transport such as walking or cycling. ↑
For example, a policy might be to increase the number of journeys under 5km completed by active travel. ↑
ArcGIS is a family of client, server, and online geographic information system (GIS) that enables users to create, analyse, visualise, and share spatial data such as maps. ↑
December 2023
DOI: http://dx.doi.org/10.7488/era/3885
Executive summary
The Carbon Neutral Islands project is a Scottish Government commitment to support six Scottish islands (Islay, Raasay, Hoy, Yell, Barra and Great Cumbrae) to become carbon neutral by 2040.
We present evidence on the readiness status of island businesses to meet this challenge. Our focus is on the skills available within business to support decarbonisation, skills gaps and future requirements. Our research included a literature review along with online surveys and in-person interviews with key stakeholders on the islands.
Findings
- While most of the businesses interviewed across the six islands are willing and ready to engage with the Carbon Neutral Islands project, there is a lack of knowledge and skills.
- A minority of businesses actively track their carbon footprints. However, some businesses who are developing a strategic plan for decarbonisation do not always use their carbon footprints to guide their strategies.
- Time and cost are key barriers to businesses in tracking carbon footprints and developing a decarbonisation strategy. While most agreed that tracking carbon footprints and developing plans are important, half or more of the businesses in the renewable energy sector, agriculture, housing and trades sectors did not do this.
- Participants have a general understanding about carbon use in their businesses and a general awareness of how to measure it via calculator tools. However, most participants were less confident in their technical knowledge and how to implement changes. There are challenges around finding footprint calculators relevant to individual island-based businesses and guidance for plan development.
- There is a general lack of knowledge of the skills that are required for decarbonising businesses and how to develop these skills. Other key gaps include a lack of understanding of the technical options for decarbonisation. Our evidence indicates that agriculture, aquaculture and marine, the self-employed and logistics sectors require the most support over a wide range of skills.
- Current actions towards carbon neutrality are short term and generalised, such as selecting 2-year green energy tariffs. Barriers to longer-term carbon neutrality include costs of green technologies and a lack of qualified technicians within the islands for installing or maintaining equipment (e.g. heat pumps and solar panels).
Next steps
Our findings aim to support areas of possible action for consideration by the Carbon Neutral Islands (CNI) project team and appropriate Government agencies. The following steps would help address the skill gaps identified and support island businesses to decarbonise:
- Develop a training programme for the CNI project Community Development Officers (CDOs) to enable them to provide island businesses with information resources and support knowledge and understanding. They could directly support businesses in the production of carbon actions plans. Since the production of this report, CDOs across all of the islands have undergone training including accredited qualifications in corporate standard carbon accounting, energy assessor training and other energy efficiency advisory training. It has been hugely valuable for the CDOs and the communities they serve. Roll out to other islands would significantly benefit them.
- Develop island specific carbon planning tools such as carbon calculators. These should ensure relevant measures to each island and account for sectorial differences within each community.
- Provide training for technicians, electricians, mechanics and other trades so they can provide installation and maintenance services to green technologies.
- Develop sector specific roadmaps to carbon neutrality with short- and long-term targets, which aim to address key barriers identified in this report.
- Run specific agricultural focused actions such as additional skills development support for crofters and small farms to understand and implement sustainable land management practises and conduct carbon audits, which are critical for securing some grants and funding.
- Develop a coordinated support package for islands businesses with relevant government agencies and training providers. The level of support for businesses on Cumbrae has increased substantially to include Commercial EPCs, Display Energy Certificates, Carbon Audits and Businesses Energy Scotland funding support. There would be significant benefits to replicating this across the other islands.
- Upgrade energy infrastructure in islands, to support the inclusion of greener technologies as part of businesses decarbonisation strategies.
- Promote a circular economy, which would support reduction in waste and supply chain carbon emissions, aiding in businesses achieving net zero.
Glossary
|
CDO |
Community Development Officer from the Carbon Neutral Islands project |
|
CNI |
Carbon Neutral Islands project |
|
SME |
Small and medium enterprise |
|
Net zero |
The term ‘net zero’ for the Scottish Government means a balance between the amount of greenhouse gas emissions produced and the amount removed from the atmosphere in Scotland. The Scottish government aims to achieve net zero emissions of all greenhouse gases by 2045. |
|
Carbon neutral |
The definition of ‘carbon neutral’ for the Carbon Neutral Islands project is an island where the greenhouse gas emissions are in balance with carbon sinks (such as forests, peatlands, or active carbon removal technologies). This is very similar to ‘net zero’, and for the purposes of this project, the terms are used interchangeably. |
|
Decarbonisation |
The act of removing carbon emissions from daily activities, operations or practises. |
|
Carbon footprint |
The calculation of how much carbon a person, business, activity, or building emits. |
|
Decarbonisation plan |
A strategy informed by a carbon footprint to reduce the amount of carbon a business emits over a number of years. The aim is to reduce carbon emissions each year until the business reaches net zero. |
Introduction
The Carbon Neutral Islands (CNI) project is a Scottish Government ‘programme for government’ commitment to support six Scottish islands (Islay, Raasay, Hoy, Yell, Barra, and Great Cumbrae) to become carbon neutral by 2040. It also aims to support other goals such as economic and skills development.
This project investigates the extent to which businesses, public sector organisations and other bodies within key sectors across the six islands have carbon neutral strategies. Sectors of interest include tourism, food & drink, retail, leisure, transport, aquaculture and marine, renewable energy, agriculture, media, self-employed, logistics, housing and construction/trades. We investigate what would be needed in order for businesses to adopt and implement a carbon neutral strategy.
We consider the skills required in order to deliver carbon neutrality in these sectors on the six Scottish islands. We also consider the nature and scale of the overall skills development that is required to help island businesses meet the goals of the CNI project, both in the medium term (to 2030) and longer term (to 2040). The key challenges and barriers, including sector-specific barriers, for island businesses in preparing to meet the goals of the Carbon Neutral Islands project are reviewed.
We undertook desk-based literature reviews on current sector readiness on a UK-wide scale and a review of local, Scottish and UK policy and how it supports island businesses. We used online surveys in an attempt to achieve broad participation across the six islands. In addition we visited the islands and conducted in-person interviews. A detailed methodology can be viewed in Appendix 1.
Key challenges we experienced undertaking this project were:
- Securing participation – Out of approximately 600 businesses identified and contacted through desk-based research, only 63 surveys were returned with an additional 29 interviews conducted across the six islands.
- Statistical analysis – due to the limited responses, detailed sectorial analysis was not possible. In some cases there were only 2 responders for a sector. Out of the 13 participating sectors, only 4 sectors had over 10 responders (see Table 1 – Error! Reference source not found.).
- There are a number of crossovers between sectors where a business is linked to a number of sectors such as tourism, retail and food. This makes statistical analysis between sectors more challenging because the distinction between them is unclear. This is reflected in the sector breakdown tables, where although there were 59 responders with 6 choosing not to answer, a number of responders selected multiple sectors their business fell into. There were also responders who operated more than one business and used the same survey to answer for all the businesses they operated. This increased the total number of sectors who responded to the questions from the expected 63 to 122. This makes comparisons difficult and potentially skewed data.
As a result, we were unable to present the level of robust findings that may have been possible with more substantial response rates. However, we are confident that the 10% sample achieved, combined with the in-person interviews and input from CDOs, means that we have representative evidence to support our findings.
We can’t conclude on any substantial differences in the readiness and skills between some sectors as the response rate was insufficient.
Overview of island businesses
We found the following sector profiles within the islands:
- Tourism is a dominant sector across all islands (both within the CNI target islands and amongst the other UK islands more generally). This extends to supporting industries such as hospitality and distilleries.
- Independent trades are a vital sector on islands including construction and mechanical, however few have a significant online presence, meaning it was difficult to obtain accurate numbers of these businesses.
- Retail is a prevalent sector with most falling into the food and drink category. Local grocery stores often have a multipurpose function offering post offices and parcel pick up points, some gifts and locally produced goods. Dedicated retail shops are limited on the islands with smaller resident populations such as Hoy and Raasay, however larger population islands such as Cumbrae and Islay have a more diverse retail sector.
- Agriculture and aquaculture are also important sectors across the islands for economic revenue and employment, although not as large in number of businesses and scale of operations compared with rural and coastal mainland areas.
- Large commercial farms are less common on islands than on the mainland. However, there are a larger number of crofts located within the islands, owned by small holders who do not sell to larger supply chains and are more invested in selling goods/produce locally in small volumes or for private consumption.
- There have been challenges for aquaculture businesses such as restricted access to markets following Brexit and losses during the Covid-19 pandemic, meaning there has been a downturn in shellfish and the wider fishing industries.
| Tourism | 25% |
| Food and drink | 19% |
| Retail | 14% |
| Leisure industry | 14% |
| Transport | 7% |
| Aquaculture and marine economy | 4% |
| Renewable energy | 3% |
| Agriculture | 3% |
| Media and related activities | 3% |
| Self-employed | 2% |
| Logistics | 2% |
| Housing | 2% |
| Construction/Trades | 2% |
Figure 1 shows the breakdown of the number of businesses identified across all the CNI islands. While each island showed a diverse range of businesses and were unique in many sector distributions, there was a significance of tourism and recreation businesses across all six islands. These industries include bed and breakfasts, hotels and other holiday accommodation, shops, grocers, galleries, cafés and theatres. Other sector businesses have a critical value to the islands e.g. aquaculture and agriculture can employ a considerable number of staff though there are few businesses. The transport sector reflects the size of the communities, with smaller populations having fewer transport businesses. Some island business operate several operations from a single main business (i.e. a farm may also be a B&B, or a bus operator may also be a mechanic etc.) which makes accurately calculating the numbers of businesses challenging.
Assessment of carbon neutral strategies across island businesses
Carbon reduction readiness
There were 63 responses to surveys and in person interviews. Full details and breakdown of responses can be found in Appendix B (Section 12.5). We found that around half of participants were aware of their businesses carbon footprint to some degree with less than 20% actively tracking it. Around 25% of participants have or are developing a decarbonisation strategy.
Most businesses do not currently track their carbon footprint. More businesses in the tourism, media and transport sectors actively track their carbon footprints than in the other sectors. However, the percentage of businesses in these three sectors actively tracking their carbon footprint is still under 50%.
Similarly, the majority of businesses regardless of sector are not currently producing carbon reduction plans. Those businesses that are tracking their carbon footprints are more likely to produce decarbonisation plans.
Barriers to developing a carbon strategy
Participants were asked about barriers to tracking their carbon footprints and developing a plan to decarbonise.
| Q8 If you do not track your carbon footprint what are the barriers to this? | |||
| Cost | 51% | ||
| Time | 69% | ||
| Lack of skills in the business | 56% | ||
| Lack of external support | 51% | ||
| Not a priority for our business | 29% | ||
| If other please give details | 13% | ||
| Note: Percentage of people who chose this answer | |||
| Q12 If you don’t have a plan to become carbon neutral what are the barriers to this? | |||
| Cost | 68% | ||
| Time | 70% | ||
| Lack of skills in the business | 58% | ||
| Lack of external support | 53% | ||
| Not a priority for our business | 30% | ||
| If other please give details | 10% | ||
Summary of overall responses
The majority (69-70%) said they did not have time to produce carbon footprint baselines. There was also some confusion and lack of understanding on how to do this and which tool out of the many options was right for them. There were also some issues raised with the appropriateness of standard carbon assessment metrics to island business, particularly farming. There is no clear advice on carbon recording tools, calculators and other baseline production options and explanation of how they differ, and which would be most appropriate for islands businesses. This complexity further dissuades businesses from looking into calculating their carbon footprint.
Responders stated that it would be helpful to outsource the carbon footprint and plan production. However, it is difficult to find and apply for the limited funding available for this. We understand that Highlands and Islands Enterprise are aware of this issue and are investigating the support they, or other agencies, could offer.
Responders stated that access to training and external support would be beneficial to allow business owners and operators to better prepare for a net zero transition. However, finding time for upskilling remains a key barrier.
Summary of sector analysis
Time and costs are the most common barriers to businesses in tracking carbon footprints and developing decarbonisation strategies. Most acknowledged that developing footprints and plans were important, but:
- 67% of businesses in the renewable energy sector indicated that developing a footprint was not a priority for their business. Half of businesses in other sectors including agriculture, housing and trades businesses also stated this was not a priority.
- Renewable energy sector place higher priority on developing a plan, with only 25% stating this was not a priority. We find that this sector puts more value in producing the plans than tracking footprints.
- Retail businesses indicated they placed more value in creating a footprint than a plan, as did logistics and leisure.
Prioritising internal resources for decarbonisation efforts is indicated to be challenging across all sectors with the third most identified barrier being the lack of skills and support needed to produce a carbon footprint or plan. Further detail is provided in Appendix B.
Overall Carbon Neutral Island barriers to developing a carbon strategy
Developing a decarbonisation plan is a complicated undertaking, requiring financial and supply records to provide a carbon footprint baseline and develop future actions to improve the carbon footprint. This can be a complex task with many businesses saying that they do not have the knowledge on how to create a baseline or where to find appropriate information to assist them.
Most businesses on the islands are micro scale (up to 10 employees), with many being sole ownership and minimal staff with seasonal increases. Larger businesses (still within SME definitions) are found on some of the larger islands such as Islay, Barra and Yell specifically within distilleries and Aquaculture industries. Producing a plan and looking for alternative options to reduce the carbon emissions is difficult for these businesses due to time pressures within the business.
Costs are also a large factor in preventing businesses being enabled to decarbonise, with many green technologies and alternatives remaining at a higher purchase cost than non-green options. A common example are EVs, while significantly more accessible now than 5 years ago, the purchase costs are still higher than equivalent combustion engine cars, with the investment return taking serval years to see the financial benefit. In contrast, from discussions with businesses owners we found that new clean heating systems can be a worthwhile investment. Although purchase prices may be higher, the overall running costs are lower compared to the high cost of oil which is the main source of heating in the islands, the investment can have favourable returns in a short period of time.
These barriers make it difficult to produce a decarbonisation strategy even though around 70% of participants would like to make it more of a priority.
Assessment of business readiness
We reviewed the details of island business readiness to become carbon neutral. Full details from the surveys can be found in Appendix B (Section 0). While formal decarbonisation plans were in place for a minority of business sectors, most responders reported that they are actively taking steps to reduce their carbon use. The findings suggested that the number of employees (size of business) did not factor into decarbonisation strategies or readiness. There were some sectoral differences however, with businesses like distilleries, fish farms and agricultural businesses having a more developed carbon strategy, this is due to a necessity to either comply with operational conditions or access subsidies.
The majority of the participants indicated that they were taking some steps to becoming net zero ready. However, the largest proportion (87%) said that the action was recycling. This action alone is not sufficient to meet net zero targets. We found that other actions were high level such as reducing paper/plastic use, short term such as a 2 year green tariff and generalised with non-industry-specific actions. There are limited long term technical actions being planned or undertaken by individual businesses due to costs and lack of qualified technicians such as solar panel installers within the islands to construct and maintain the green technology equipment.
Recycling is the most common action taken by businesses to reduce their carbon footprint and conserve resources. The circular economy is important among island businesses and participants stated that they try to reuse and maintain resources due to limited access or costly waste disposal. There are added ferry costs for waste removal or recycling, with some smaller islands having a reduced recycling capability, with recycling centres often at capacity restricting further use.
A reduction in business travel has been as a result of move to IT based solutions nationally following Covid-19. Some of the more expensive decarbonisation options such as electric vehicles and micro energy generation are more of a challenge for relatively small island businesses.
We found from the in-person interviews that there is a strong desire within island businesses to support other local businesses and providers of goods to keep supply chains local. This is more challenging on smaller islands with more limited local products available to source.
While no formal decarbonisation plans may be in place for all business participants, most reported that they are actively taking steps to reduce their carbon use (Appendix B Section12.8). Of those that stated that they are not taking any steps to reduce their carbon footprint at this point, most are planning to do so in the future.
Key skills gaps
Overview of Carbon Neutral Islands businesses skill readiness and gaps
Having access to skills to understand how to reduce carbon emissions is essential to the net zero transition. All participants indicated they have a general ‘basic level’ understanding about carbon use in their businesses and stated they are aware of options to measure carbon use via calculator tools. However, when it came to technical knowledge and implementing changes, participants were less confident in their skills. Fewer than 1/3 of participants are confident in their technical knowledge to deliver technical and detailed decarbonisation actions (Figure 4).
| Q26 What skills do you already have in your organisation to help deliver carbon reduction? | |||
| General understanding of where carbon is used in your business and what solutions may be available to assist in carbon reduction | 100% | ||
| Knowledge of how to assess the carbon footprint of your organisation using a calculator tool | 44% | ||
| Technical knowledge specific to your industry and data analysis skills to do bespoke carbon calculation for your business | 32% | ||
| Knowledge of how to write a decarbonisation plan for your organisation | 28% | ||
| Management and administrative skills to implement carbon reductions in your business | 36% | ||
| Technical and specialist skills to implement carbon reductions in your business | 16% | ||
| Please give detail on the types of skills you have in your organisation that will help you to decarbonise your business | 36% | ||
Only 22% of responders have actively sought external training to increase their skills and understanding of carbon reduction, with those who did undertake training using online webinars and internet sources (Figure in Appendix B). Many of these online training sources did not result in accreditation or certification, however a small number pursued a deeper level of understanding and completed certified courses.
Skills gaps and barriers across CNI businesses
Participants were asked what challenges and barriers they faced in gaining the skills needed to develop actionable decarbonisation plans and achieve the transition to net zero by 2040. The following responses provide a guide on where further support could be focused to support CNI businesses.
| Q30 What do you see as the challenges and barriers for your organisation to building up the skills needed to achieve carbon neutral? | |||
| Cost | 79% | ||
| Time | 65% | ||
| Lack of skills in the business | 42% | ||
| Lack of external support | 40% | ||
| Not a priority for our business | 7% | ||
| If other, please give details | 21% | ||
| Note: Percentage of people who chose this answer | |||
The prominent responses were again cost and time, similar to business planning. This was followed by not having the skills to increase this knowledge suggesting there is a skills gap to be filled.
Sector skills readiness and gaps
Due to limited returns from some sectors it is difficult to do a comprehensive comparison of net zero readiness and skills between sectors, only four participating sectors had responses from more than 10 businesses. However, it is possible to draw evidence to support conclusions on the general level of readiness of islands businesses on the whole.
Summary of analysis
The analysis has highlighted that there are substantial gaps in the skills required to support the route decarbonisation across most of sectors. The main gaps across all sectors include the lack of knowledge of what skills are required to meet net zero. Most of the businesses we spoke with did not know what skills they required to begin to address the challenge, such as the skills needed to produce a carbon footprint or a decarbonisation plan.
Businesses are also unclear on how to access relevant skills, many having significant time restrictions limiting their ability to research the skills or to develop them within the business. Another key issue is the lack of financial support or prioritisation to pay for training or employ someone with this knowledge. We found evidence of a willingness to learn. Finding ways to signpost, fund and develop the relevant skills would be an important first step for policy makers. Developing these skills (see also Table 10 in Appendix B) within the islands would support the longer-term roll-out of decarbonisation plans across the island businesses. Within the CNI project (to 2040) there is the opportunity to create a skills development programme to drive the change required.
Current skills across different sectors
The majority of participants from 9 sectors out of 13 have indicated they do not know what skills are required to produce plans or deliver the actions within the plans (Table 7 in Appendix B). Those in renewable energy, housing, agriculture, and construction felt that they had a good understanding of skills requirements. Sectors such as renewables and housing have clear guidance on how to reduce carbon, hence a better understanding than most about what skills are required to plan for and action decarbonisation strategies.
While all sectors responded that they had a general understanding of carbon use within their business, only those working in the renewable energy sectors felt they had the technical knowledge and ability to understand and track carbon use within their business. This technical understanding makes it easier for these sectors to produce and implement plans to reduce carbon emissions. Our evidence suggests that there is a lack of the more specialist skills to implement carbon reduction actions across all sectors other than the renewables sector.
Few have undertaken training in carbon reduction skills, with the highest proportion of those who have had training within the renewable energy, aquaculture and transport sectors. Up to half of responders from these sectors stated they have actively sought training in these areas.
During interviews it was clear that although willing to learn, it was difficult to find the time or cost to be able to undertake training.
Skills gaps and barriers across sectors
We also asked about potential options to improve business readiness and understanding of the requirements to decarbonisation.
When it comes to developing skills to assist businesses in transitioning to net zero, it appears that there is a significant difference between the sectors in what skills they require to develop (although there were few participants for some sectors). Our evidence indicates that that agriculture, aquaculture and marine, the self-employed and logistics require the most support over a wide range of skills (Table 10 in Appendix B).
The main barrier identified by all businesses across all sectors to decarbonising was cost (Table 11 in Appendix B). Having time was also a key barrier for businesses in all sectors except transport and renewable energy.
| Q29 What support does your organisation require to build up the skills needed to plan and deliver carbon reductions to reach carbon neutral? | |||
| Training | 60% | ||
| Tools | 44% | ||
| Funding | 86% | ||
| Ongoing external support | 56% | ||
| Other (please specify) | 9% | ||
| Note: Percentage of people who chose this answer | |||
Lack of funding features highly in the barriers and challenges businesses face in decarbonising, along with the cost of time. There are funding routes for some businesses, for example Transport Scotland offers grant funding to help organisations install electric vehicle (EV) charging infrastructure on their premises (Find Business Support.gov, 2024). There is also the Scottish Governments SME Loan Scheme (Business Energy Scotland.org, 2024), which is designed to help businesses install new energy efficient systems, equipment or building fabric improvements (loans available up to £100,000). However, the landscape can be confusing and complicated, poorly signposted with highly competitive application processes. Most of the schemes tend to be nationally focussed and rarely take into account island issues such as ferry journeys and limited technical support locally. Information access on decarbonisation strategy advisory services is also an important opportunity. If information was clearer and readily available, businesses would have more confidence in their understanding and the skills needed to investigate green and low carbon alternatives as well as being able to produce carbon baselines and reduction strategies.
Interview insights
These are the common challenges and opportunities raised by businesses through this research.
Opportunities:
- CDOs are a good resource – could they be trained to help produce plans?
- Training local trades in installation and maintenance
- Circular economy practices are important
- Land management important for businesses and communities in decarbonisation strategies
Challenges:
- Old building stock, hard and expensive to renovate/upgrade
- Infrastructure limitations for EVs and other green technologies
- Limited access to renewable and low carbon technologies
- Regulation restrictions hinder some effort, more flexibility through policy needed
- Decarbonisation plans for Agricultural businesses will be required for subsidy access, support not always available for small crofting and farms
- Lack of skills/knowledge to effectively strategize for transition – Toolkits/packs would be useful
- Wide scale dependency on oil for heating
- External supply chain carbon cost
- Lack of financial incentives/ expensive to decarbonise
Evaluation of challenges and barriers to CNI business net zero readiness
There were many common themes from the in-person interviews including: buildings; supply chains; agriculture; green technologies and infrastructure; and regulation and policy.
While not necessarily exclusive issues to island communities, these illustrate the particular challenges faced by island businesses. The significance and prevalence impact on the viability of implementing carbon downshifting within island based businesses. Each issue is explained further in the following sections.
Buildings
Older buildings, which are prevalent on the islands, face greater net zero challenges such as poor energy efficiency. This is due to buildings being poorly insulated, not having the capacity to have cavity wall insulation (stone built) and requiring extensive renovation to accommodate low carbon heating options. The ability to upgrade the older buildings is further exacerbated by the lack of trades able to do the renovations, cost of materials (these are significantly higher on Islands) and availability of materials as some suppliers do not offer carriage to some Scottish islands. This means that it is harder and more expensive to upgrade these buildings to be more energy efficient. While not solely a business challenge as this is an issue for residential buildings as well, many businesses are located within old buildings. This was made evident during the island visits and during conversations with the consultees and CDOs. A typical challenge for island buildings is the need to change heating systems. There are no mains gas lines on any Scottish island except one, Stornoway, which has a small gas network servicing a portion of houses in the main town. This limits common options to reduce cost and carbon with a switch from oil. While there are low carbon alternatives, these can be expensive to install such as electric heat pump systems which often require a whole system upgrade due to lower heating levels or require importing of fuel such as biomass which is costly and has a high carbon footprint due to transportation.
Supply chains
Island businesses have a larger supply chain carbon footprint than mainland Scotland counterparts due to additional transportation. While mainland businesses may find varied supplier access within their locality, island businesses are restricted by suppliers willing to ship to island locations and inevitably additional transport costs.
Agriculture
Businesses identified that it can be challenging to apply national policy in local island environments, such as livestock grazing practises in fields and land management practises. This can be counterproductive to low carbon ambitions. For example, waste management is a significant challenge to island farmers, while there may be a range of commercial waste management options for mainland farms, island farms have fewer options. Waste must be transported by island farmers on ferries to mainland agricultural waste facilities which is financially expensive, carbon intensive and time consuming. There is a need to identify ‘island proofed’ waste management practises or investment in island agri-waste facilities.
Some farming practices are not recognised in farming carbon audits such as not ploughing a field after harvest for reseeding. While it is widely acknowledged by interviewees that a more carbon efficient land management practice is needed, farmers are not able to record this as a “carbon positive” decision.
Green technologies and infrastructure
Green technology can be more expensive than conventional energy and transportation technologies but can be very efficient in an island setting (e.g. wind turbines due to a good wind resource). Businesses that do wish to invest in renewable technologies can find it difficult to find installers and to get prompt maintenance and repairs as they are reliant on mainland technicians who often view islands jobs as low priority and charge higher costs.
Local authorities across Scotland are seeking to install more EV chargers and some islanders would like more investment from their local authorities and other government organisations to ease the individual costs for charges and installation.
Grid capacity is a significant issue across the UK, and particularly so on islands where grid infrastructure is aged and under increasing constraint. While there is a strong desire to install microgeneration technologies such as solar and wind turbines, access to the grid is a challenge and also expensive.
Regulation and policy
While policy is a driving force behind net zero actions, for islands, policy and regulation can be a barrier for some businesses. By their nature, policy and regulations are uniform and broad reaching, not allowing for unique island characteristics. Regulations that may be appropriate for large and mainland businesses do not fully account for the differences of SME and island businesses. These UK and Scottish Government regulations can become barriers and restrict decarbonisation opportunities. An example raised by interviewees is the ability to utilise local produce and goods instead of having to import from large mainland suppliers. Regulation and policy does not allow the sale of locally produced food direct from the source. While it is understood the regulation is to ensure the quality and safety of food consumed, it is restrictive. Locally grown vegetables and fruit, eggs used to be a regular item on the shelves, supporting local farmers, crofters and other suppliers. Now, they are not allowed to buy direct from the grower and instead have to go through the larger distributor.
Another key restriction from regulation is the closure of island abattoirs due to regulatory cuts. The livestock must now be transported off island to be processed and returned back to the distributors. This increases costs for farmers, stress for the animals and increases the carbon footprint of the food products.
Evaluation of opportunities
Opportunities have been identified to assist businesses in achieving operational net zero by 2040. These opportunities include training; supply chains; and land management.
There are opportunities to help upskilling of business owners/operators as well as enabling them to utilise green technologies in their decarbonisation strategies. Each of these opportunities is explained further below:
Training
There are opportunities around training in various forms to aid in the net zero transition of island businesses. These opportunities would not only benefit the transition ambition, but also could increase island economic prosperity and could help reduce population decline often seen in smaller islands. Across many of the businesses and sectors that participated in this study, access to training and skills to understand and develop carbon footprints and decarbonisation plans was highlighted as important. A key finding is that there are opportunities to utilise the CDOs for the islands as contacts and signposters for training and support.
Training for island technicians, electricians, mechanics and other trades to install and service low-carbon technologies such as heat pumps, wind turbines, insulation and property retrofit would be beneficial to allow greater access to green technologies. Increased training for green technology skills would also benefit the island economy by attracting new businesses and skilled employees to the island. Currently islands are more likely to be reliant on Scottish mainland-based company support for green technologies, reducing reliability and efficiency of support and delivery of new technology, as well as adding to cost.
Supply chains
Island businesses in most cases will strive to support other local businesses, sourcing goods where possible within the island. While there can be significant challenges around local supply chains, there are also opportunities to increase local production. For example, ‘added value’ food production, with crofters, farmers and bakers able to develop new products from ‘home and locally grown’ produce. However, this can also have a negative implication for carbon emissions. For example, distillers interviewed on Islay mentioned the recent trend of local growing of barley products for whisky production results in higher emissions from the smaller scale cultivation of the crop and transportation of fertiliser and seed to the island at high cost and high carbon footprint, compared to buying ready produced barley grain from a bulk distributor.
However, restrictions from Food Standards Scotland regulation prohibit the sale of local produce with many providers not having sufficient accreditations or certificates to sell their goods commercially despite having a good food and health standard. This impacts on the businesses ability to reduce carbon emission from their supply chains as part of their CNI net zero readiness. Reviewing Food Standards Scotland agency regulations for small food growers to consider allowing more access to local sellers would support the local economy, reduce carbon footprint of imported foods as well as tackle some food insecurity issues unique to islands. This includes issues such as disruption to ferry transport essential to food delivery regularly during adverse weather events. Costs, food has a significantly higher cost than on mainland Scottland due to increase transport costs being added to the consumer price. Quality and storage ability can also be affected due to longer transportation times, this is prevalent with fruit, vegetables and eggs. Access to locally produced goods would have many benefits to ease food insecurity and improve economic development opportunities for Scottish islands.
The closure of most island abattoirs has seen increased costs for farmers and higher carbon footprints for the product being exported and imported back to the island. The Food Standards Scotland abattoir database (Food Standards Scotland, 2024) lists only authorised slaughterhouses and processing plants located on Barra, Isle of Lewis, Isle of Mull, and Islay. The slaughterhouse in North Uist is scheduled to close later this year. Orkney lost its abattoir in 2018/2019. With 93 inhabited Scottish islands, this is a significant deficit to local communities. Re-opening these facilities would likely be a financial and regulatory challenge. However, there could have significant carbon and financial benefits to farmers, increase animal welfare and reduce costs to island consumers as well as offering additional employment opportunities to island communities.
Land management
Good land management is well known for carbon storage and ecosystem services benefits. There is an opportunity to train and promote large landowner businesses, such as estate owners who operate shooting and fishing activities and farmers in alternative land management practises. Providing access to knowledge and skills could reduce the loss of carbon from standard practises such as ploughing, heath burning and over grazing. Further investment into island peat restoration would provide a useful carbon sink as well as offering more sustainable peat harvesting opportunities for businesses such as distilleries.
Conclusions
The ambition of the CNI project is for the six target islands to reach net zero by 2040, 10 years ahead of the UK target and 5 years ahead of Scotland as a whole. We focused on primary data collection through direct engagement with island businesses. This was enabled through direct involvement of the island-based Community Development Officers.
Overall island businesses are very willing to embrace the challenge to achieve carbon neutrality. They can see the benefits to them and the wider community and have a desire to engage and make progress. However, the challenges they face are significant and evidenced to be arguably greater than businesses based in mainland Scotland communities. The key message businesses conveyed through the interviews was having the ability to have island-focused solutions. This was enhanced by the overall support articulated for the CNI programme and in particular the CDO resource. There is a desire to enable further action through CDOs.
Our findings on three main research questions are as follows:
Do businesses have a carbon reduction plan or strategy?
Many businesses across all sectors have a desire to track their carbon footprints and develop decarbonisation plans. We found that there are significant barriers to acting on this desire. Cost and time are the most commonly identified barriers among island businesses. Skills and access to information are also a concern and a significant gap to enabling decarbonisation measures by businesses.
Do businesses have the skills to develop the carbon awareness and implementation of decarbonisation strategies?
The research identified that most businesses feel they lack specialist knowledge. Despite this, participants feel they have a good general understanding around carbon emissions in their business operations. They were keen to explore ways to reduce carbon but lack knowledge of how.
Significant gaps in the current skills across most SME island businesses included technical aspects on how to actively reduce emissions. There were also gaps in understanding suitability of green technologies and accessing information and funding to action decarbonisation initiatives.
Access to advice and the ability to develop skills in-house would be a significant benefit to many businesses.
What is required to support businesses to transition?
Key opportunities to close the skills gap and assist in the transition process are:
- Training local CNI CDOs to directly support the business community in accessing information and support to develop decarbonisation strategies. This could be via signposting to online resources or helping to develop a template decarbonisation plan for businesses to follow. Local representation is central to the decarbonisation efforts as they understand the unique nature of each island. There is a significant opportunity which could be progressed with HIE to sustain the role of CDOs and potential for income associated with fees for services provided, as HIE have provided funding for island CDOs previously.
- Training local trades in the installation and maintenance of green technologies is an opportunity to increase access to low-carbon alternatives as well as to open new economic opportunities for local supply chains. There is potential to establish a pan-island CNI trades network, enabled through CDOs, for sharing knowledge and resources.
- Many businesses are taking positive steps to reduce their carbon footprints and sustainable use of materials by utilising local supplies and services where possible. Increasing access to local services, skills and goods can significantly reduce carbon costs from external supply chains. Currently, islands are heavily reliant on external supply chains with larger carbon footprints and additional carbon from transportation. They also suffer from limited local purchasing options. This dependence on distant suppliers and supply chain insecurity is a unique feature of island business operation as well as general island living. Whilst there is unlikely to be a solution to this distance from market, there could be further attention given to procurement policy and support mechanism interventions which recognise these supply chain constraints for islands. Directly supporting and enabling the development of local supply chain and circular economy options would be beneficial as well as facilitating the pathway to net zero for islands.
Key recommendations
This section presents actions that could be taken to address the issues raised in our research.
Development of skills across the CNI sectors
There are opportunities around training in various forms to aid in the net zero transition of island businesses. These opportunities would not only benefit the transition ambition but could also improve island economic prosperity and reduce population decline often experienced on smaller islands.
Develop signposting to training options across island and sectors
Many of the businesses and sectors that participated in our study highlighted access to training and skills to understand and develop carbon footprints and decarbonisation plans as gaps. Some sectors want to upskill in-house with other preferring external skills being brought in e.g. from advisory services, so signposting to appropriate training and advice to allow them to do this would be beneficial.
Utilise the CDOs for the islands as contacts for training and support.
In addition, or as an alternative to the above, CDOs could provide more direct support to businesses. This could be encouraged either by further training CDOs in carbon footprint and decarbonisation plan development, or by CDOs being supported to direct businesses to relevant information and resources. This could also offer a routeway for the positions of CNI CDO to be sustainable through a chargeable service provided to local businesses. It would also provide stable employment in supporting decarbonisation.
Training for technicians, electricians, mechanics and other trades
Training for technicians, electricians, mechanics and other trades would allow island businesses greater access to green technologies. In order to be certified for installation and maintenance of these technologies, specific accreditation is often required. Responders stated that gaining these certificates and accreditations is complex and time consuming with minimal support. In many cases Tradesmen are small or even sole businesses that do not have the capacity to become accredited.
Currently islands are more likely to be reliant on Scottish mainland-based company support for installation or design of green technologies. This can be more difficult than for mainland counterparts due to more limited options, impose less competitive prices and have longer delivery times. Securing installation and maintenance on green technology is often extremely difficult in an island, with large delays, higher costs and limited options. Mainland contractors can have geographic exclusions that commonly exclude islands from access to standard services and prices. Addressing this constraint would have multiple benefits, not only by increasing access to low carbon technologies, but by increasing the skills on islands, expanding employment opportunities, and supporting apprenticeships to retain island residents.
Development of sector specific roadmaps
Cost and time have been identified as the most significant area where support is needed across the sectors. However, the priority needs across the sectors have some significant differences. Cost and time constraints were especially notable around seasonal businesses such as tourism and leisure whereas tools and training were more important to agriculture. Renewable Energy, Food and Drink, and Logistics sector responders stated they would like to have access to training to up-skill. Aquaculture, Retail, and the Leisure industry sector responders stated a preference for external skills being brought in (Appendix B Table 3). The remaining sector responders stated all the support options would be useful and had no immediate preference or priority. This all means that a sector targeted approach may be useful in supporting island business.
It would therefore be important to develop specific sector roadmaps within an island context. This could include developing tools such as carbon calculators that account for the sector requirements as well as the island location. These tools would support baselining but should be linked to specific actions and support e.g. funding to help implement their plans. This sectoral approach is supported by the different priorities that were found between business such as:
- To achieve a net zero transition, the retail and food & drink sectors have indicated they would benefit from more assistance in decarbonising their supply chain and ability to use local produce and goods.
- The tourism, leisure and transport sectors would like more infrastructure and local trades assistance to allow for green technologies to be used such as EV chargers and microgeneration.
- Agriculture would like more support in developing their decarbonisation strategies and undertaking carbon audits.
Funding support landscape improvements
There are funds and investment opportunities that may be available for businesses to support decarbonisation efforts (BEIS, 2021). These funds can provide significant financial support and cover a variety of decarbonisation strategies. However, we found that businesses lack the knowledge to access these funds, and face time pressures to complete applications. We also found that there are no means of coordinating a funding search or application process.
These funding application processes are also often complicated with limited assistance offered. Many funds are also only accessible for large organisations or for specific sectors which do not reflect the significant number of SME businesses which account for over 35% of carbon emissions (Energy Saving Trust, 2022). The competitive nature of grants and investments also restrict the access to many who may qualify but do not have the expertise needed to successfully apply and secure funds. Interviewees felt that smaller businesses did not qualify for grants and funding due to a wide range of exclusions. This was especially prevalent among the trades, crofting and farming interviewees.
Finally, the overall capacity and scope of the funding is not sufficient to have impact for enough businesses.
There is the opportunity to address this for CNI islands through reviewing funding guidance and the application process to better reflect the challenges faced by island based SMEs which could be linked to the sector roadmap priorities would support a coordinated approach to meeting the 2040 targets.
The Islands (Scotland) Act 2018 and the 2019 National Islands Plan represent positive steps to support islands and may in time present a key route to address island impacts and opportunities. However, these policy provisions are yet to be fully implemented across all programmes to support all island businesses more directly.
Specific agricultural focused actions
Agriculture has a significant part to play in the net zero target across islands with land use being a major carbon contributor. From our policy research it would seem that there are limited policies and strategies that offer practical actionable support for crofters and small-scale farmers. There can be a disconnect between land use and natural resource protection which may cause policy to become a barrier for those looking to reduce carbon emissions and turn to a more sustainable way of farming. This could include actions such as installation of renewable energy technologies (Solar, Wind or Anaerobic Digestor systems). The general strategic changes to agricultural policy/support mechanisms and subsidy for agriculture should have carbon reduction as a key aspect of framing but also account for island-specific challenges.
Upgrading of island energy infrastructure
Delivering upgrades to islands energy infrastructure is essential in the development and use of renewable energy and associated technologies. This will support island businesses to develop more long-term carbon reduction plans for example by allowing businesses greater access to grid to invest in wind, solar or battery technologies.
Islands are an ideal test bed for the use of mixed renewable energy (tidal, solar, storage and wind). However, the lack of grid capacity severely restricts the ability for companies to develop and test these technologies. It is difficult to gain connections even for domestic or commercial small scale renewable energy technologies.
Many islands suffer from energy insecurity due to grid infrastructure not being reliable and power cuts are common. While there is a nationwide push and promotion of increased renewable energy technologies, all consultees spoken to during the project made reference to significant grid restrictions faced. There is a need for grid infrastructure improvements to support decarbonisation via green technologies across the islands. Without upgrading and improving the grid infrastructure to accommodate more green technology connections, island businesses will struggle to benefit from decarbonisation via green technology.
Promotion of circular economy to reduce emissions from supply chains and waste as part of business decarbonisation strategies
The development of an island circular economy with emphasis on recycling, reuse and sharing of resources. Island communities have fewer recycling options meaning more waste going to general landfills. There are some islands where only reduced recycling is offered, and facilities often overfilled, for example on Hoy, a café owner mentioned this is why she tries to reuse rather than recycle. Many residents try to reuse and upcycle where possible while complying with regulations regarding disposal of waste products. Sharing of tools, some small plant and farming equipment is commonplace with island businesses willing to share and lend equipment where possible and if needed.
Next steps
There are several options highlighted throughout this report that will support island businesses to decarbonise. The key steps that would help are:
- Develop a training programme with the CDOs to enable them to enhance island businesses information routes and understanding. This could also ultimately be a resource to produce business actions plans.
- Develop island specific carbon planning tools such as carbon calculators. These should also account for sectorial differences.
- Develop sector specific roadmaps to carbon neutrality with short and long-term targets.
- Develop a coordinated support package for islands businesses with relevant government agencies and training providers.
References
BEIS, 2021. Net Zero Strategy: Build Back Greener. [Online]
Available at: https://www.gov.uk/government/publications/net-zero-strategy
Energy Saving Trust, 2022. How can policy better support SMEs in the pathway to Net Zero?. [Online]
Available at: https://www.theccc.org.uk/publication/how-can-policy-better-support-smes-in-the-pathway-to-net-zero-energy-saving-trust/
Food Standards Scotland, 2024. Approved Establishments Regiser. [Online]
Available at: https://www.foodstandards.gov.scot/publications-and-research/publications/approved-premises-register
Scottish Government, 2023. Carbon Neutral Islands Project Progress Report. [Online]
Available at: https://www.gov.scot/publications/carbon-neutral-islands-project-progress-report/
Appendices
Appendix A Methodology
This project was undertaken using a range of methodologies and resources. The following sections detail the method used to complete each phase and task.
Phase 1
Phase 1 was to investigate and understand the baseline for current business readiness and the support that is available in a general sense. We also wanted to identify the sector landscape across the CNI islands to allow a comparison between the National sectors and island sectors.
To achieve these goals the tasks proposed consisted of:
- Desktop research to identify the businesses and relevant organisations on each Island
- Graphical analysis of island business distribution
- Policy review of support for decarbonisation, islands and small businesses
- Desk based literature review of wider sector readiness
Business Identification and Analysis
We identified businesses using desk-based research, using online local databases such as commercial directories and cross referencing as best as possible using other online sources such as social media and individual businesses websites to verify current operational status. We recorded results in a CNI target businesses database which was issued to the CDOs for a sense check. CDOs were able to provide invaluable guidance to this stage of the process to refine and target business contacts.

Figure 7: Businesses across the islands
Phase 2 – Engagement Methodology
To allow for maximum outreach, an online survey was created using Survey Monkey for wide spread distribution to the island businesses. The survey comprised of 31 questions that addressed a range of topics that related to the research questions. Readiness, Skills and Needs. The survey was compiled and issued following GDPR privacy standards and all information used in the production of the report has been anonymised.
The surveys were hosted on an online platform and participants were emailed the link to access the surveys. The platform allows for some basic analysis of survey results which was then refined and formatted to create the graphics in section Error! Reference source not found..
Where interviews were held, the interviews were summarised and key comments were selected that best represented the research questions posed in the project, summarised and represented in a graphical way to be clear and concise.
Sectoral comparisons were assessed by filtering and carefully selecting the most relevant questions that provide evidence based data for the questions presented by the project. A table presentation was selected as the most visually appealing way to show how ready the businesses are and what support they require to decarbonise.
Phase 3 – Report production
To compile the data obtained from phase 1 and 2 of the project, we used MS Excel to convert narrated data from interviews into data points for statistical analysis and summarisation. The data accessible from the Survey Monkey online platform was also very useful in providing a clear analysis with multiple filters and analytic tools to aid in the production of statistical graphics.
Selection of the key survey questions to be included in the report were based on the relevance to the key research questions. The full survey was important to gain a full understanding of the awareness and skill level of the participants, however not all were critical to include. We reviewed the 31 survey questions and highlighted those that provided the most detailed information around skills, training, challenges and opportunities. The final question selection was reduced to 10 for the general island findings and 15 for the sector comparison section.
The interviews were well organised by the CDOs and provided a deeper understanding on how the businesses owners felt about support for island net zero transition, how big a priority it was for them and what could encourage them to do more. From the interviews, we discovered that a number of common themes around challenges, opportunities and needs linked the islands and businesses. While there were subtle differences in the themes, the core issues were the same which lends credibility to the small sample when seen across the 6 islands and all interviewees.
Reflections
Challenges in Methodology
Undertaking engagement on a wide scale across various islands is difficult and there has been less participation than we expected. It is essential to have strong connections within the community to promote and encourage participation. CDO connections was very helpful within the islands in getting responses but with limited time available wider engagement was a challenge during island visits. The survey completion rate varied between as low as 3 on Hoy to a maximum of 15 for Yell with the others ranging around 8-12. Interviewees numbered around 3-6 people per visit with the exception of Islay where only 1 in person interview was arranged, however there were phone interviews following the visit.
Online surveys while useful and easy to issue to multiple contacts, rely on the willingness of the recipient to complete them. This reliance has meant that only a small section of island businesses were captured in the survey data, with gaps in the sectors and business sizes. It was hoped that a wide range of sectors and businesses sizes would participate to give a clear picture of the challenges, opportunities and needs of island businesses. This was not the case and the result is that we have significant gaps in data and inconclusive evidence on the current net zero transition readiness on islands.
Lessons Learnt
For engagement reliant projects, it is essential to identify strong community leaders and any steering groups and open discussion early with them on how best to engage with and encourage wide participation. Opportunities to communicate directly with a large number of business owners that were in steering groups were missed. Had we more directly engaged with them in person, perhaps we could have gained more cooperation from a valuable resource.
Visits to the islands were useful and critical in conducting the in person interviews, however time was limited and therefore organising interviews difficult. It may be more productive to contract local residents to undertake the engagement tasks following a set methodology provided by the Project Manager.
The online surveys were useful and provided good data and analysis tools. On reflection, the survey was too long and some questions repetitive and unclear to the participant. While all the questions provided key insight into the carbon related operations of the businesses the final number used in the report was 10-15 out of the 30 and questions asked during the interviews would have been useful to have in the survey to allow for statistical analysis.
Our analysis is based on responses to questionnaires and in-person interviews.
Overall CNI readiness
As shown in Figure , around half of the participants are aware of their businesses carbon footprint to some degree, less than 20% are actively tracking it. There is a slight increase in those who are developing a decarbonisation strategy with around 25% stating they have or are developing a plan for their business. We have assumed for this analysis that any non-responding participants do not track their carbon footprint or plan to develop a decarbonisation strategy.
|
Q5 Are you aware of your organisation’s carbon footprint? |
 | |
|
Q6 Do you track your organisation’s carbon footprint? |
 | |
|
Q10 Do you have a plan to become carbon neutral or are you developing one? |
 | |
If yes, which option best describes your current stag of planning? – We have a draft plan: 6– We are considering writing a plan but have not started preparations: 4 – We have a fully developed: 3 – We have a fully developed carbon neutral plan or strategy: 3 – We intend to write a plan and have started preparations: 3 | ||
Sector analysis of carbon strategy development
Sector readiness
Sectors are compared although there were no participants for some e.g. waste and mining. Some participants skipped some survey questions. Table 1 shows the percentage of businesses in each sector tracking their carbon footprints.
|
(Responses Skipped 6) |
Responses |
Yes |
No |
|
Renewable energy |
4 |
25% |
75% |
|
Housing |
2 |
0% |
100% |
|
Food and drink |
21 |
17% |
83% |
|
Aquaculture and marine economy |
5 |
20% |
80% |
|
Tourism |
26 |
26% |
74% |
|
Retail |
15 |
18% |
82% |
|
Agriculture (including crofting), land use and forestry |
4 |
0% |
100% |
|
Transport |
7 |
40% |
60% |
|
Self-employed |
3 |
0% |
100% |
|
Logistics (related to any of the sectors above) |
3 |
0% |
100% |
|
Leisure industry (music, arts, theatre, active tourism) |
16 |
14% |
86% |
|
Construction and Trades |
2 |
0% |
100% |
|
Media and related activities |
4 |
50% |
50% |
|
|
Responses |
Yes |
No |
|
Renewable energy |
4 |
25% |
75% |
|
Food and drink |
2 |
24% |
76% |
|
Aquaculture and marine economy |
20 |
40% |
60% |
|
Tourism |
5 |
29% |
71% |
|
Retail |
24 |
18% |
82% |
|
Agriculture (including crofting), land use and forestry |
15 |
0% |
100% |
|
Transport |
4 |
25% |
75% |
|
Self-employed |
6 |
0% |
100% |
|
Logistics (related to any of the sectors above) |
3 |
0% |
100% |
|
Leisure industry (music, arts, theatre, active tourism) |
3 |
36% |
64% |
|
Media and related activities |
16 |
50% |
50% |
|
|
Training |
Funding |
Advice on new supplies and supply chain |
External support |
|
Renewable energy |
75% |
100% |
75% |
50% |
|
Food and drink |
85% |
85% |
100% |
85% |
|
Aquaculture and marine economy |
40% |
80% |
60% |
80% |
|
Tourism |
55% |
85% |
70% |
65% |
|
Retail |
73% |
73% |
82% |
82% |
|
Agriculture (including crofting), land use and forestry |
0% |
0% |
100% |
0% |
|
Transport |
40% |
100% |
40% |
40% |
|
Self-employed |
50% |
50% |
100% |
50% |
|
Logistics (related to any of the sectors above) |
100% |
100% |
67% |
67% |
|
Leisure industry (music, arts, theatre, active tourism) |
36% |
71% |
50% |
64% |
|
Media and related activities |
67% |
100% |
100% |
100% |
Sector barriers to developing a decarbonisation strategy
Responses were separated into sectors to identify any differences that were present between the business types. Few responding businesses were actively tracking their carbon footprints, but only renewable energy sector participants indicated this as not a priority. Many businesses identify time and cost as the main barriers with agriculture and logistics strongly indicating that barriers are cost, time and lack of skills equally. Media sector businesses responded that lack of skills is the main barrier, whereas renewable energy states that cost is the main barrier for them. With tourism, time is the main factor given most are small or sole operator business with significant seasonal pressures.
|
Responses |
Cost |
Time |
Lack of skills |
Lack of external support |
Not a priority | |
|
Renewable energy |
3 |
100% |
67% |
33% |
67% |
67% |
|
Housing |
2 |
50% |
100% |
50% |
50% |
50% |
|
Food and drink |
18 |
44% |
66% |
50% |
44% |
22% |
|
Aquaculture and marine economy |
4 |
50% |
25% |
75% |
50% |
25% |
|
Tourism |
23 |
48% |
61% |
52% |
52% |
17% |
|
Retail |
13 |
54% |
77% |
61% |
61% |
23% |
|
Agriculture (including crofting), land use and forestry |
4 |
50% |
100% |
50% |
25% |
50% |
|
Transport |
4 |
100% |
75% |
75% |
75% |
25% |
|
Self-employed |
3 |
33% |
67% |
67% |
33% |
33% |
|
Logistics (related to any of the sectors above) |
3 |
100% |
100% |
100% |
67% |
33% |
|
Leisure industry (music, arts, theatre, active tourism) |
14 |
43% |
57% |
64% |
57% |
29% |
|
Construction/Trades |
2 |
50% |
100% |
50% |
50% |
50% |
|
Media and related activities |
2 |
50% |
68% |
100% |
50% |
0% |
|
Responses |
Cost |
Time |
Lack of skills |
Lack of external support |
Not a priority | |
|
Renewable energy |
4 |
100% |
50% |
25% |
50% |
25% |
|
Housing |
2 |
50% |
50% |
50% |
50% |
50% |
|
Food and drink |
17 |
59% |
76% |
52% |
59% |
23% |
|
Aquaculture and marine economy |
4 |
75% |
75% |
75% |
50% |
25% |
|
Tourism |
20 |
70% |
70% |
60% |
60% |
25% |
|
Retail |
12 |
75% |
83% |
83% |
83% |
42% |
|
Agriculture (including crofting), land use and forestry |
3 |
67% |
67% |
33% |
33% |
33% |
|
Transport |
5 |
80% |
40% |
40% |
60% |
20% |
|
Self-employed |
3 |
67% |
67% |
33% |
33% |
33% |
|
Logistics (related to any of the sectors above) |
3 |
100% |
100% |
100% |
100% |
67% |
|
Leisure industry (music, arts, theatre, active tourism) |
10 |
80% |
70% |
60% |
60% |
40% |
|
Construction/Trades |
2 |
50% |
50% |
50% |
50% |
50% |
|
Media and related activities |
2 |
100% |
100% |
100% |
100% |
50% |
Decarbonisation actions by businesses
The following provides the evidence on current actions being taken by the participating CNI businesses in general from the 6 islands.
| Q14 Is your organisation already taking actions to reduce your carbon footprint? | |||
| Yes | 81% | ||
| No | 8% | ||
| Not yet (planning to take action) | 8% | ||
| Other (please specify) | 4% | ||
| Note: Percentage of people who chose this answer | |||
The majority of participating businesses are actively taking steps to reduce their carbon footprint, however, as shown in Figure , these actions are largely recycling.
| Q15 What measures do you take to reduce your organisation’s carbon footprint? | |||
| Recycle | 87% | ||
| Use low carbon and recyclable packaging for your products | 38% | ||
| Use supplies and suppliers that have low carbon products | 31% | ||
| Use local suppliers and products | 49% | ||
| Use electric vehicles | 11% | ||
| Have low carbon heating in your premises | 27% | ||
| Have microgeneration like solar and wind at your premises | 13% | ||
| Use green energy supplier | 24% | ||
| Use public transport | 7% | ||
| Reduce business travel with online meetings | 38% | ||
| Invest in high quality machinery and keep it maintained | 31% | ||
| Reduce water use | 29% | ||
| Electric vehicle charging at office to encourage staff | 9% | ||
| Electric vehicle charging at premises that the public can use | 4% | ||
| Other (please specify) | 38% | ||
| Note: Percentage of people who chose this answer | |||
Sector actions to decarbonise
The following table shows the differences across the sectors from the participating CNI businesses in terms of the level of activity presently underway.
| Q14 Is your organisation already taking actions to reduce your carbon footprint? | ||||
| Responses | Yes | No | Not yet, planning to take action | |
| Renewable energy | 4 | 100% | 0% | 0% |
| Housing | 2 | 50% | 50% | 0% |
| Food and drink | 16 | 87% | 0% | 13% |
| Aquaculture and marine economy | 5 | 100% | 0% | 0% |
| Tourism | 23 | 86% | 9% | 5% |
| Retail | 13 | 77% | 0% | 23% |
| Agriculture (including crofting), land use and forestry | 3 | 33% | 33% | 0% |
| Transport | 6 | 100% | 0% | 0% |
| Self-employed | 3 | 67% | 0% | 0% |
| Logistics (related to any of the sectors above) | 3 | 33% | 33% | 33% |
| Leisure industry (music, arts, theatre, active tourism) | 15 | 80% | 7% | 14% |
| Construction/Trades | 2 | 50% | 50% | 0% |
| Media and related activities | 4 | 100% | 0% | 0% |
Skills training to help decarbonisation
| Q23 Has anyone in your organisation taken part in skills training to help your business decarbonise? | |||
| Yes | 22% | ||
| No | 78% | ||
| Q24 If yes, what type of training? | |||
| |||
| |||
| |||
| |||
| |||
| |||
| |||
| |||
| |||
| |||
| |||
| Q23 Has anyone in your organisation taken part in skills training to help your business decarbonise? | |||
| Responses | Yes | No | |
| Renewable energy | 4 | 50% | 50% |
| Housing | 2 | 50% | 50% |
| Food and drink | 20 | 20% | 80% |
| Aquaculture and marine economy | 5 | 40% | 60% |
| Tourism | 26 | 23% | 77% |
| Retail | 16 | 25% | 75% |
| Agriculture (including crofting), land use and forestry | 4 | 50% | 50% |
| Transport | 7 | 43% | 57% |
| Self-employed | 3 | 33% | 67% |
| Logistics (related to any of the sectors above) | 3 | 0% | 100% |
| Leisure industry (music, arts, theatre, active tourism) | 16 | 19% | 81% |
| Construction/Trades | 2 | 50% | 50% |
| Media and related activities | 3 | 33% | 67% |
| Q25 Do you feel you have a good understanding of the skills your organisation will need to plan and deliver actions to reduce your carbon footprint to reach carbon neutral? | |||
| Responses | Yes | No | |
| Renewable energy | 4 | 75% | 25% |
| Housing | 2 | 100% | 0% |
| Food and drink | 20 | 20% | 80% |
| Aquaculture and marine economy | 5 | 40% | 60% |
| Tourism | 26 | 27% | 73% |
| Retail | 16 | 25% | 75% |
| Agriculture (including crofting), land use and forestry | 4 | 75% | 25% |
| Transport | 0 | 43% | 57% |
| Self-employed | 3 | 33% | 67% |
| Logistics (related to any of the sectors above) | 3 | 0% | 100% |
| Leisure industry (music, arts, theatre, active tourism) | 16 | 31% | 69% |
| Construction/Trades | 2 | 100% | 0% |
| Media and related activities | 3 | 33% | 67% |
| Q26 What skills do you already have in your organisation to help deliver carbon reduction? | |||||||
| Responses | General understanding of where carbon is used | Knowledge of how to assess the carbon footprint | Technical knowledge to do bespoke carbon calculation | Knowledge of how to write a decarbonisation plan | Management and administrative skills to implement carbon reductions | Technical and specialist skills to implement carbon reductions | |
| Renewable energy | 3 | 100% | 100% | 100% | 100% | 100% | 67% |
| Housing | 2 | 0% | 0% | 50% | 50% | 0% | 0% |
| Food and drink | 11 | 90% | 27% | 9% | 9% | 9% | 9% |
| Aquaculture and marine | 2 | 100% | 50% | 50% | 50% | 50% | 50% |
| Tourism | 14 | 93% | 57% | 29% | 29% | 36% | 7% |
| Retail | 9 | 78% | 33% | 33% | 22% | 33% | 11% |
| Agriculture | 3 | 0% | 33% | 33% | 33% | 0% | 0% |
| Transport | 5 | 80% | 33% | 20% | 20% | 20% | 20% |
| Self-employed | 1 | 0% | 0% | 100% | 0% | 0% | 0% |
| Logistics | 0 | 0% | 0% | 0% | 0% | 0% | 0% |
| Leisure industry | 9 | 89% | 33% | 22% | 22% | 22% | 22% |
| Construction/Trades | 2 | 0% | 0% | 50% | 50% | 0% | 0% |
| Media and related activities | 2 | 100% | 100% | 50% | 50% | 50% | 0% |
Table 9: Existing carbon reduction skills within sectors
| Q27 What skills do you need to develop in your organisation in order to deliver carbon reduction? | |||||||
| Responses | General understanding of where carbon is used | Knowledge of how to assess the carbon footprint | Technical knowledge to do bespoke carbon calculation | Knowledge of how to write a decarbonisation plan | Management and administrative skills to implement carbon reductions | Technical and specialist skills to implement carbon reductions | |
| Renewable energy | 2 | 50% | 50% | 50% | 50% | 50% | 100% |
|
Housing |
2 |
0% |
0% |
0% |
0% |
50% | 50% |
| Food and drink | 17 | 47% | 82% | 65% | 71% | 53% | 65% |
| Aquaculture and marine | 3 | 100% | 100% | 100% | 100% | 100% | 100% |
| Tourism | 24 | 50% | 62% | 58% | 62% | 41% | 54% |
| Retail | 15 | 47% | 73% | 60% | 53% | 27% | 47% |
| Agriculture | 4 | 25% | 25% | 50% | 25% | 50% | 50% |
| Transport | 5 | 40% | 80% | 40% | 40% | 40% | 60% |
| Self-employed | 3 | 100% | 67% | 67% | 67% | 67% | 100% |
| Logistics | 3 | 100% | 100% | 67% | 100% | 67% | 67% |
| Leisure industry | 13 | 54% | 67% | 62% | 46% | 38% | 38% |
| Construction/Trades | 2 | 0% | 0% | 0% | 0% | 50% | 50% |
| Media and related activities | 3 | 33% | 33% | 67% | 67% | 33% | 67% |
| Q30 What do you see as the challenges and barriers for your organisation to building up the skills needed to achieve carbon neutral? | ||||||
| Responses | Cost | Time | Lack of skills | Lack of external support | Not a priority | |
| Renewable energy | 4 | 75% | 25% | 0% | 0% | 0% |
| Housing | 2 | 100% | 100% | 0% | 0% | 0% |
| Food and drink | 18 | 78% | 72% | 55% | 50% | 6% |
| Aquaculture and marine economy | 5 | 60% | 60% | 40% | 40% | 20% |
| Tourism | 24 | 75% | 62% | 46% | 46% | 8% |
| Retail | 14 | 71% | 78% | 64% | 64% | 0% |
| Agriculture | 4 | 75% | 100% | 25% | 0% | 0% |
| Transport | 6 | 67% | 33% | 17% | 33% | 0% |
| Self-employed | 3 | 100% | 100% | 67% | 33% | 0% |
| Logistics (related to any of the sectors above) | 3 | 67% | 67% | 67% | 67% | 0% |
| Leisure industry (music, arts, theatre, active tourism) | 14 | 85% | 78% | 50% | 50% | 14% |
| Construction/trades | 2 | 100% | 100% | 0% | 0% | 0% |
| Media and related activities | 3 | 67% | 69% | 33% | 33% | 0% |
© Published by Aquatera, 2024 on behalf of ClimateXChange. All rights reserved.
While every effort is made to ensure the information in this report is accurate, no legal responsibility is accepted for any errors, omissions or misleading statements. The views expressed represent those of the author(s), and do not necessarily represent those of the host institutions or funders.
DOI: http://dx.doi.org/10.7488/era/4426
Executive summary
Aims
The purpose of this study is to deliver on a commitment in the Scottish Onshore Wind Sector Deal (SOWSD) to “publish a paper identifying the range of skills needed by industry to deliver our 2030 target” [1] and to inform the enhancement of skills and training provision to meet future sector needs.
Approach
We interviewed 22 Scottish onshore wind stakeholders between February and March 2024, including 11 developers, one owner / operator, two construction companies, two consultancies, three operation and maintenance providers, two skills and training providers and one local authority planning department. Furthermore, we developed a workforce model based on:
- the BVG Associates assessment of the pipeline of onshore wind projects in Scotland underlying their 2023 report “Scotland onshore wind pipeline analysis 2023-2030” and
- our estimates of the workforce requirements for a typical onshore wind project based on wider ITPEnergised insights from working on more than 500 onshore wind projects and validated through stakeholder consultation as part of the study.
Modelling assumptions were validated with the stakeholders above in March 2024.
Findings
- To meet the 2030 ambition, the workforce serving the onshore wind sector will need to increase from around 6,900 FTE (full time equivalent) in 2024 to a peak of around 20,500 FTE in 2027. Over 90% of these roles will be in construction and installation of wind farms. Employment by activity is shown in Figure 1. These job opportunities will only be available if estimates regarding the forthcoming onshore wind project pipeline materialise.

Figure 1: Annual FTE per onshore wind project stage.
Source: Workforce model using data from BVG Associates 2023 and consultants’ expertise.
- Overall, stakeholders felt that those working in the sector have the right skills, but there are skilled workforce shortages. In the short term, there is a need for more people to join the sector and for individuals from other sectors to be reskilled/ upskilled. Without this, the sector faces challenges in delivering new projects on time, maintaining existing wind farms and maximising economic and environmental benefits.
- Not addressing skill shortages is likely to have a severe impact on the ambition to install 20 GW of onshore wind by 2030. By 2027, our model predicts that, on average, four times more FTEs will be required for construction and installation than in 2024. Within this, five times more civil contractors will be required. More than 46% of these individuals will be required to build wind farms in Highland and Dumfries and Galloway, regions where stakeholders have highlighted is already difficult to recruit individuals. For operations and maintenance (O&M) the figures are smaller and the timeframes longer: around 2.5 times as many roles will be required in 2030 than in 2024. The regions with the highest requirement, of around 37%, are again Highland and Dumfries and Galloway[2].
- There will be significant shortages in technical roles, particularly high voltage engineers and wind turbine technicians. Across Scotland, FTE for electricity grid connections will need to increase from 1,100 in 2024 to 4,500 in 2027, a 400% increase. The number of wind turbine technician FTE will need to increase from around 465 in 2024 to almost 1,200 in 2030, a 258% increase. These will affect project development and operations if they are not resolved.
- The scarcity of skilled planners and specialist environmental consultants is set to continue. An average of 100 FTE planners and 434 FTE environmental consultants is estimated to be required across Scotland each year to enable wind farm developments between 2024 and 2030.
- Stakeholders have identified a growth need for digital skills for data analysis and drone inspections to improve turbine performance monitoring.
- There will be a need for diverse skillsets within the sector, which encompass project management, stakeholder engagement and regulatory compliance.
Recommendations
- The Scottish Government, together with partners in other public agencies, industry and the education sector, has the opportunity to address expected skill shortages in relation to the 20 GW capacity ambition by 2030. Investing in skills development is not only essential for the success of individual onshore wind projects but also for Scotland’s broader renewable energy goals. Addressing these shortages will require a comprehensive approach, including workforce development initiatives, training programmes and industry-academy collaborations. In this regard, collaboration between stakeholders from the public, private and education sectors will be crucial to bridge skills divides and unlock the full potential of Scotland’s onshore wind resources.
- Undertake a purposeful awareness raising programme of career opportunities within the sector, the transferrable nature of the skills developed and that many job categories in this sector will be required for a long time.
- Implement targeted campaigns in rural areas where most new installations will take place, to demonstrate highly skilled jobs for local people, many of which pay well above the average UK salary.
Glossary / Abbreviations table
|
CAD |
Computer-aided Design |
|
CITB |
Construction Industry Training Board |
|
DNO |
Distribution Network Operator |
|
dwpa |
Danish Wind Power Academy |
|
eBoP |
Electrical Balance of Plant |
|
ECoW |
Ecological Clerk of Works |
|
ECU |
Energy Consents Unit (Scottish Government) |
|
EHV |
Extra High Voltage |
|
EU |
European Union |
|
FTE |
Full-time Equivalent Employee (an FTE can be one full-time member of staff or multiple part-time employees) |
|
GVA |
Gross Value Added |
|
GW |
Gigawatt |
|
GWEC |
Global Wind Energy Council |
|
GWO |
Global Wind Organisation |
|
HNC |
Higher National Certificate |
|
HND |
Higher National Diploma |
|
HV |
High Voltage |
|
IEA |
International Energy Agency |
|
ISP |
Independent Service Provider |
|
IT |
Information Technology |
|
LA |
Local Authority |
|
LCREE |
Low Carbon Renewable Energy (data published by ONS) |
|
MW |
Megawatt |
|
NVQ |
National Vocational Qualification |
|
O&M |
Operations and Maintenance |
|
OEM |
Original Equipment Manufacturer |
|
OHL |
Overhead Line |
|
ONS |
Office for National Statistics |
|
REPD |
Renewable Energy Planning Database |
|
SAP |
Senior Authorised Person |
|
SCADA |
Supervisory Control and Data Acquisition |
|
SCQF |
Scottish Credit and Qualifications Framework |
|
SOWSD |
Scottish Onshore Wind Sector Deal |
|
TSA |
Turbine Supply Agreement |
|
TWh |
Terawatt Hour |
Introduction
Background
Onshore wind is a mature technology, with the first commercial windfarms built in the 1980s in the US and in Denmark. Scotland’s first commercial onshore windfarm, Hagshaw Hill, started generating electricity in 1995. Rapid expansion in the last 30 years has seen onshore wind supplying electricity in countries all over the world. An overview of the recent developments in the global onshore wind industry is provided in Appendix A.
The Scottish Government has recognised the importance of onshore and offshore wind to supply the increased amounts of electricity that will be necessary to achieve net zero carbon emissions by 2045. In the Onshore Wind Policy Statement, the Scottish Government stated its ambition to increase the installed onshore wind capacity of 9 GW in 2021 to a minimum of 20 GW by 2030 (Scottish Government, 2022). Furthermore, the Government intends that this should benefit communities across Scotland and allow a just transition of the workforce to skilled jobs within the onshore wind sector. The statement was followed in 2023 by the Scottish Onshore Wind Sector Deal (SOWSD), which committed to support the delivery of the necessary skills and training across Scotland to contribute to a just transition and realise the 20 GW ambition (Scottish Government, 2023).
Purpose of this study
The purpose of this study is to deliver on a commitment in the SOWSD and in turn, to:
- understand the jobs and skills requirements to support the deployment of onshore wind
- provide the analysis from which the enhancement of current skills and training provisions to meet future sector needs can be developed.
The aim is to map the annual numbers of jobs and skills needed to achieve 20 GW of installed onshore wind capacity by 2030. The specific objectives are to:
- estimate the number and types of jobs required annually in each stage of an onshore wind project
- estimate the geographic spread of these jobs across Scotland
- analyse the current level of skills available for onshore wind and the demand for these skills
- understand whether there are any skills gaps or shortages within the onshore wind industry in Scotland
- understand future demands for skills to enable the 2030 target to be achieved
- identify any skills gaps and make recommendations as to how these might be addressed.
Study methodology
We interviewed 22 Scottish onshore wind stakeholders between February and March 2024. These included 11 developers, one owner / operator, two construction companies, two consultancies, three operation and maintenance providers, two skills and training providers and one local authority planning department. Furthermore, we developed a workforce model that was based on analysis undertaken by BVG Associates of the pipeline of onshore wind projects in Scotland (BVG Associates, 2023), combined with the ITPEnergised assessment of the job requirements for a typical onshore wind project. This provided an assessment of job requirements for each project stage of a wind farm. Workforce numbers, job roles and modelling assumptions were validated in writing with the consulted stakeholders in March 2024.
In the remainder of the document, Section 4 provides an overview of the onshore wind sector in Scotland and a description of the job roles associated with each stage of the project lifecycle. Section 5 presents a summary of the modelling methodology and estimates of current and future job numbers. Section 6 describes the skills associated with the job types identified in Sections 4 and 5 and outlines the findings from our stakeholder engagement regarding skills shortages. Section 7 outlines options for addressing skills shortages from the stakeholder engagement and an international overview. Section 8 provides conclusions and recommendations.
Project pipeline, lifecycle and associated job roles
We reviewed the UK Government’s Renewable Energy Planning database (Department for Energy Security and Net Zero, 2023) to identify the project lifecycle phase of all onshore wind farms in Scotland. At the end of 2023, there was approximately 9.8 GW of installed onshore wind capacity in Scotland. This was distributed across 329 operational sites. The largest of these is at Clyde Wind Farm (operated by SSE Renewables in South Lanarkshire) with an installed capacity of 350 MW, and the smallest is Lower Rumster in Highland with an installed capacity of 0.2 MW. Highland has the largest amount of installed wind capacity (2.12 GW) followed by South Lanarkshire (1.352 GW) and Dumfries & Galloway (1.122 GW). All other local authorities have less than 1 GW installed capacity.
As of September 2023, there were 240 sites either under construction, awaiting construction or with planning applications submitted. These totalled 13.7 GW, with one greater than 500 MW (Scoop Hill Wind Farm in Dumfries & Galloway) and two greater than 400 MW (Viking Wind Farm in Shetland and Teviot Wind Farm in Borders). Another 28 of these windfarms are greater than 100 MW in installed capacity.
Onshore wind project lifecycle, job roles and skills levels
A typical onshore wind project is led by a project developer, who will normally operate the wind farm when it is operational. The developer is supported by a number of contractors and sub-contractors. An onshore wind farm project has five phases with the following durations: feasibility (1 year), development (3-4 years), construction (1-2 years), operation and maintenance (25+ years) and end-of-life. See Figure 1 and detailed descriptions of each project phase below. The project lifecycle structure is based on the ITPEnergised experience of consulting and managing over 500 projects for onshore wind developers. It also aligns with the onshore wind project lifecycle used in recent analysis undertaken in relation to Scottish Government policy (see Section 5). An overview of each project phase and typical workforce composition, in terms of full-time equivalent (FTE[3]) positions and job roles, is provided in Table 1. For the purposes of this study, Optimat and ITPEnergised have developed a model based on a ‘typical’ wind farm which has 90 MW capacity and comprises fifteen 6 MW turbines[4].
Figure 1: Onshore wind project phases.
Feasibility is the initial phase where developers engage with landowners and review potential onshore wind farm locations. This is followed by high-level analysis to understand whether the site has potential and whether there are any obvious issues that might prevent a wind farm being developed. Issues can include connections to the electricity grid, access to the site and whether there are any existing wind farms neighbouring the site. Feasibility can last up to a year and requires around four FTEs (see Table 1).
|
Job role |
FTE |
|
Project manager |
0.5 |
|
Consultant – site design and modelling |
0.2 |
|
Consultant – energy yield assessors and WindPro design specialists |
0.3 |
|
Consultant – grid connection consultancy and application |
0.3 |
|
Planning officers |
0.3 |
|
Environmental consultant |
0.3 |
|
Financial analyst |
2 |
|
Total |
4 |
During the Development phase more detailed assessments are carried out by the developer with support from specialised environmental and technology consultancy firms. These include assessment of potential impacts on ecology, ornithology, geology, hydrology, peatland, noise & vibration, cultural heritage, archaeology, forestry, landscape & visual impact, aviation, and radar and telecommunications. It will also include an assessment of energy yields and some initial engineering design to understand costs. These are essential to the developer’s business case and planning application. During this phase the developer will engage with planning officers within local authorities and the Scottish Government’s Energy Consents Unit (ECU), and with statutory bodies (such as NatureScot) to secure planning permission. The planning process currently takes between two and four years, depending on whether there are any objections to the application that require a public inquiry. At the same time the developer will engage with the appropriate Distribution Network Operator (DNO) to secure a date for connection of the wind farm to the national electricity grid. Finally, the developer will engage with the local community to address any concerns they may have at the earliest possible stage. Overall, this can be the longest phase pre-operations, typically three to four years and requiring around ten FTEs (see Table 2).
|
Job role |
FTE |
|
Project manager |
2 |
|
Planning officers |
0.8 |
|
Environmental consultant |
4.5 |
|
DNO case worker |
0.3 |
|
Consultant – grid connection consultancy and application |
0.3 |
|
Technical consultant |
2 |
|
Total |
10 |
When it comes to Construction and installation, developers will typically appoint one or more principal contractors, including the original equipment manufacturer (OEM) of the wind turbines. This initial procurement phase takes at least six months, and sometimes longer for wind turbines. The timing is also critical as most construction takes place over the summer months. Each of the primary contractors will subcontract others to fulfil local or specialised roles, including building access roads, foundations for turbines, substations and other onsite buildings, and delivering balance of plant (all of the cabling, components and equipment required to deliver electricity to the grid). These contractors, in turn, may also have subcontractors. There is, therefore, a complex supply chain hierarchy. The final part of this phase is physical connection of the wind farm to the grid, which is undertaken by specialist high voltage engineers working for the DNO. Overall, the construction and installation phase lasts at least one to two years, and requires around 148 FTEs across 16 different roles (see Table 3).
|
Job role |
FTE |
|---|---|
|
Project manager |
1 |
|
Planning officers |
0.2 |
|
Environmental consultant |
1 |
|
Civils contractor |
50 |
|
Civil engineer |
2 |
|
Crane/lifting contractor |
15 |
|
Grid connection installation |
35 |
|
DNO EHV commissioning engineer |
4 |
|
Transport operative |
15 |
|
Logistics manager |
1 |
|
Back-office support |
5 |
|
Health & safety officer |
3 |
|
Environmental consultant – ECoW |
0.3 |
|
TSA/OEM project delivery team |
3 |
|
Electrical engineer |
2 |
|
eBoP contractor |
10 |
|
Total |
148 |
Once a wind farm is operational, the OEM that supplied the wind turbines will generally provide Operation & Maintenance services for up to 10 years. The operator will subsequently take out a maintenance contract with an independent service provider (ISP), who will generally service all of that operator’s sites. Most ISPs operate across the whole of the UK, but usually specialise in O&M for a few manufacturers, as technicians must be certified to work on specific wind turbine models. Operators of larger wind farms may, in addition, directly employ a few wind turbine technicians in addition to ISPs performing the bulk of O&M activities. Our ‘typical’ wind farm will require around five FTEs across 10 different roles (see Table 4).
|
Job role |
FTE |
|
Technical consultant |
0.1 |
|
Back-office support |
0.1 |
|
Health & safety officer |
0.1 |
|
Wind turbine technician |
4.2 |
|
HV technician |
0.1 |
|
IT manager |
0.1 |
|
Asset manager |
0.2 |
|
Crane/lifting contractor |
0.01 |
|
Logistics manager |
0.3 |
|
Electrician |
0.01 |
|
Total |
5 |
At the End of life stage (typically 25 years), the operator can choose to decommission the wind farm, extend its operational life, or repower with larger turbines. Life extension is often sought as this is the most economical option. In this case the existing turbines are retained in place. Repowering can generate additional revenue from larger turbines, capitalising on the fact that these older sites tend to be in the most optimal locations for onshore wind. In the case of repowering, however, the operator/owner must essentially begin the project lifecycle again. For the purposes of our ‘typical’ wind farm we are assuming a similar level of FTE requirements to construction and installation. This is because the majority of end-of-life activities will not take place until later in this decade, at which point new turbines will be typically at least two to three times as powerful as the existing turbines. In addition, existing turbines might not be supported by the OEMs due to their age, making O&M more difficult (see Table 5).
|
Job role |
FTE |
|---|---|
|
Project manager |
1 |
|
Planning Officers |
0.2 |
|
Environmental consultant |
1 |
|
Civils contractor |
50 |
|
Civil engineer |
2 |
|
Crane/lifting contractor |
15 |
|
Grid connection installation |
35 |
|
DNO EHV commissioning engineer |
4 |
|
Transport operative |
15 |
|
Logistics manager |
1 |
|
Back-office support |
5 |
|
Health & safety officer |
3 |
|
Environmental consultant – ECoW |
0.3 |
|
TSA/OEM project delivery team |
3 |
|
Electrical engineer |
2 |
|
eBoP contractor |
10 |
|
Total |
148 |
Although specialised consultancies have been described for the development phase, these can also be engaged during any of the other phases. Overall, this highlights the broad range of roles that are required for a wind farm project. For the technical roles in particular, individuals require a significant number of years’ experience (see Appendix C). Tables 1 to 5 also illustrate that usually a wind farm project will employ most people during construction and installation and end-of-life phases. The next section provides a more detailed analysis of this.
In addition to the original turbines installed on the project site, wind farms require components to be manufactured and supplied throughout the project’s lifecycle. There are no manufacturers of large (multi-MW) wind turbines in the UK, and many of the components within these turbines are also not manufactured in the UK. This means that turbines and their parts must be imported. There is, however, end-of-life and remanufacturing capability within Scotland. Renewable Parts (based in Renfrew and Lochgilphead) refurbishes turbine components such as gearboxes for resupply to companies that provide operations and maintenance services. ReBlade, based in Glasgow and Dumfries, specialises in the decommissioning and recycling of blades and nacelles.
Current and future job numbers and their geographic distribution
Estimating current and future job numbers and types
The rapidly expanding activity in the onshore wind industry, in alignment with the nation’s net zero targets, represents a significant economic opportunity for Scotland. To enable this scale of activity, the sector will require a skilled and experienced workforce. It is, therefore, important to understand the overall number of FTE jobs that will be active in the sector on an annual basis, as well as the overall scale of economic activity in job creation in 2024-2030. This is an important distinction to ensure a clear understanding that some of the jobs will be temporary in nature (e.g., construction-related), whilst others will be permanent for the lifecycle of the project (e.g., operations).
The traditional economic modelling approach for estimating FTE numbers is based on the Gross Value Added (GVA) of the sector, calculated as a function of its turnover using historical ratios of these figures. A major limitation of this approach is the overall lack of detail as this method provides a broad overview rather than detailed insights into specific job roles within an industry. It does not easily break down workforce needs into different categories of employment, such as managerial, technical, or operational roles. Further, this approach relies on historical data and static assumptions about the relationship between economic output and employment. Most importantly, in sectors undergoing rapid transformation, such as renewable energy, the past may not be a reliable predictor of the future. Innovations, cost reductions, and changes in regulatory or market environments can significantly impact both GVA and employment levels in ways that historical data cannot predict.
To address these challenges, we developed an approach that makes use of a simulated model of a ‘typical’ onshore wind farm, ITPEnergised in-house expertise of equivalent projects, and refined and tested this through in-depth stakeholder consultation. This was combined with additional data sources as discussed with the study Steering Group. The model structure is presented in Figure 2. This is, to our knowledge, the first systematic attempt to conceptualise workforce composition in an onshore wind farm project.
The development of a ‘typical’ onshore windfarm model and approach for estimating FTE requirements per project phase and per job role associated with each phase are described in Appendix D.
The FTE predictions were triangulated against data in the Low Carbon and Renewable Energy Economy (LCREE) estimates (Office for National Statistics, 2021) that have been analysed and interpreted, in detail, by Ramboll UK in 2023 (Ramboll, 2023). Using the corresponding onshore wind project data from the Renewable Energy Planning Database (Department for Energy Security and Net Zero, 2021), we calculated the estimate of FTE per GW in construction and operations. Details on the validation process and data sources can be found in Appendix D.
Finally, we combined our model of a ‘typical’ onshore wind farm, with data from BVG Associates regarding the pipeline of the onshore wind projects in the timeframe 2024-2030, to project workforce requirements on an annual and regional basis. The BVG Associates database expands on the data contained in the REPD by forecasting wind farm project movement through different project stages up until 2030. It also includes information on planned wind farms that are not yet in the public domain.
An overview of our approach is provided in Figure 2.

Figure 2: Overview of workforce model developed within this study.
Figure 3 provides an overview of projected FTE by project stage on an annual basis to 2030. This highlights the large number of jobs in construction with a peak in 2027. O&M activities are expected to increase steadily throughout this decade and require almost 1,500 FTE by 2030. Significant end-of-life activities are not expected to begin until 2029.

Figure 3: Annual FTE per onshore wind project stage.
Using the capacity predictions on an annual basis, we calculated the number of FTE per job role per year in 2024-2030 (see Table 6). In total, the forecasted scale of activity will require an average of 14,256 FTE each year until 2030, with a particularly high demand for civils contractors and individuals that will deliver the grid connection and installation. It is, however, important to note that the majority of jobs in the onshore wind construction sector might not be sustained in the long term as currently the onshore wind project pipeline predictions show a decrease in activity from 2028 onwards. However, these construction jobs are highly transferrable to other infrastructure projects, including in offshore wind. In contrast, jobs created in operations and maintenance are likely to be sustained over the lifespan of an onshore wind project.
|
Job roles |
2024 |
2025 |
2026 |
2027 |
2028 |
2029 |
2030 |
|---|---|---|---|---|---|---|---|
|
Civils contractor |
1578 |
3429 |
4785 |
6416 |
5089 |
5457 |
3064 |
|
Grid connection installation |
1105 |
2400 |
3350 |
4491 |
3562 |
3820 |
2145 |
|
Crane/lifting contractor |
474 |
1030 |
1437 |
1926 |
1528 |
1639 |
922 |
|
Transport operative |
473 |
1029 |
1436 |
1925 |
1526 |
1637 |
919 |
|
eBoP contractor |
315 |
686 |
957 |
1283 |
1017 |
1091 |
613 |
|
Wind turbine technician |
465 |
531 |
596 |
776 |
931 |
1097 |
1198 |
|
Back-office support |
169 |
356 |
493 |
660 |
531 |
572 |
335 |
|
Environmental consultant |
792 |
696 |
554 |
462 |
217 |
208 |
110 |
|
DNO EHV commissioning engineer |
126 |
274 |
383 |
513 |
407 |
436 |
245 |
|
Health & safety officer |
106 |
218 |
301 |
403 |
327 |
353 |
212 |
|
TSA/OEM project delivery team |
95 |
206 |
287 |
385 |
305 |
327 |
184 |
|
Project manager |
263 |
255 |
256 |
228 |
167 |
124 |
73 |
|
Civil engineer |
63 |
137 |
192 |
257 |
204 |
218 |
123 |
|
Electrical engineer |
63 |
137 |
192 |
257 |
204 |
218 |
123 |
|
Logistics manager |
64 |
106 |
138 |
183 |
167 |
186 |
146 |
|
Financial Analyst |
307 |
222 |
143 |
52 |
21 |
7 |
12 |
|
Planning Officers |
176 |
152 |
141 |
104 |
72 |
34 |
21 |
|
Consultant – Grid connection |
92 |
73 |
59 |
34 |
21 |
5 |
5 |
|
Asset Manager |
22 |
25 |
28 |
37 |
44 |
52 |
56 |
|
DNO case worker |
46 |
39 |
37 |
26 |
18 |
4 |
3 |
|
HV Technician |
11 |
13 |
14 |
18 |
22 |
26 |
28 |
|
IT manager |
11 |
13 |
14 |
18 |
22 |
26 |
28 |
|
Consultant – Energy Yield & WindPro |
46 |
33 |
22 |
8 |
3 |
1 |
2 |
|
Consultant – Site Design & Modelling |
31 |
22 |
14 |
5 |
2 |
1 |
1 |
|
Electrician |
1 |
1 |
1 |
2 |
2 |
2 |
3 |
|
FTE |
6894 |
12082 |
15828 |
20469 |
16409 |
17541 |
10570 |
The colour code is indicative of the relative magnitude of FTEs required; green indicates low and red indicates high, a darker colour indicates a higher number.
Further detail of FTE requirements for different project stages is provided in Appendix D.
Predicting the geographical distribution of onshore wind skills demands
We used the BVG Associates data, as requested by the Steering Group, to analyse workforce requirements for different project stages on an annual basis and at a local authority (LA) level. The data for construction and installation, and O&M are presented in Table 7 and Table 8, respectively, as these project stages have the largest workforce requirements (in the period to 2030), the vast majority of which will be needed onsite. This highlights that Dumfries & Galloway, and Highland local authorities will have the highest workforce demands. Each of these LAs is projected to need more than 20% of the total construction and installation workforce requirements in 2026 and 2027, and Highland will also require 21% of the total workforce in 2028. In terms of O&M, Highland will require more than 20% of the projected workforce in each of 2027, 2028, 2029 and 2030.
It is also clear from this analysis that several Local Authorities will have little or no onshore wind activity throughout this period, as shown in Table 7 and Table 8 below.
|
2024 |
2025 |
2026 |
2027 |
2028 |
2029 |
2030 | |
|---|---|---|---|---|---|---|---|
|
Aberdeenshire Council |
81 |
149 |
283 |
696 |
806 |
424 |
191 |
|
Argyll and Bute Council |
0 |
345 |
1024 |
1748 |
2317 |
1421 |
571 |
|
Dumfries & Galloway Council |
416 |
2028 |
3723 |
4335 |
2013 |
1573 |
725 |
|
East Ayrshire Council |
0 |
323 |
704 |
2018 |
1669 |
1398 |
35 |
|
East Lothian Council |
0 |
0 |
230 |
230 |
230 |
0 |
0 |
|
Highland Council |
514 |
1788 |
2819 |
4173 |
3071 |
2615 |
1834 |
|
Midlothian Council |
0 |
0 |
0 |
208 |
208 |
208 |
0 |
|
Moray Council |
162 |
1232 |
1321 |
948 |
344 |
56 |
0 |
|
North Ayrshire Council |
2 |
2 |
0 |
0 |
0 |
0 |
0 |
|
North Lanarkshire Council |
0 |
68 |
68 |
0 |
0 |
475 |
475 |
|
Orkney Islands Council |
51 |
51 |
46 |
46 |
0 |
0 |
0 |
|
Perth & Kinross Council |
0 |
129 |
129 |
129 |
397 |
863 |
466 |
|
Scottish Borders Council |
955 |
1436 |
1095 |
909 |
1022 |
981 |
1012 |
|
Shetland Islands Council |
855 |
93 |
475 |
475 |
382 |
0 |
0 |
|
South Ayrshire Council |
383 |
561 |
699 |
694 |
516 |
153 |
0 |
|
South Lanarkshire Council |
1024 |
1248 |
258 |
883 |
663 |
538 |
38 |
|
Stirling Council |
0 |
195 |
195 |
0 |
0 |
0 |
0 |
|
Unknown* |
0 |
0 |
733 |
733 |
116 |
2644 |
2423 |
|
West Dunbartonshire Council |
0 |
0 |
0 |
0 |
257 |
257 |
257 |
|
West Lothian Council |
107 |
167 |
38 |
0 |
0 |
0 |
0 |
|
Western Isles Council / Comhairle nan Eilan Siar |
12 |
0 |
0 |
168 |
554 |
386 |
386 |
|
Total |
4562 |
9813 |
13840 |
18393 |
14564 |
13990 |
8412 |
*unknown refers to projects that have been confirmed by BVGA with developers that are not yet in the public domain. N.B., no new wind farms are forecast to be built in the following local authorities in the period to 2030: Aberdeen City, Angus, Clackmannanshire, Dundee City, East Dunbartonshire, East Renfrewshire, Edinburgh City, Falkirk, Fife, Glasgow City, Inverclyde, and Renfrewshire. The colour code is indicative of the relative magnitude of FTEs required; green indicates low and red indicates high, a darker colour indicates a higher number.
|
Local authority |
2023 |
2024 |
2025 |
2026 |
2027 |
2028 |
2029 |
2030 |
|---|---|---|---|---|---|---|---|---|
|
Aberdeenshire Council |
51 |
55 |
55 |
63 |
63 |
87 |
99 |
107 |
|
Angus Council |
2 |
2 |
2 |
2 |
2 |
2 |
2 |
2 |
|
Argyll and Bute Council |
42 |
39 |
39 |
50 |
58 |
115 |
177 |
188 |
|
Clackmannanshire Council |
5 |
5 |
5 |
5 |
5 |
5 |
5 |
5 |
|
Dumfries & Galloway Council |
112 |
112 |
124 |
146 |
280 |
332 |
382 |
395 |
|
East Ayrshire Council |
90 |
90 |
90 |
96 |
127 |
141 |
210 |
158 |
|
East Lothian Council |
15 |
15 |
15 |
15 |
15 |
27 |
27 |
27 |
|
East Renfrewshire Council |
4 |
4 |
4 |
4 |
4 |
4 |
4 |
4 |
|
Falkirk Council |
4 |
4 |
4 |
4 |
4 |
4 |
4 |
4 |
|
Fife Council |
9 |
9 |
9 |
9 |
9 |
9 |
9 |
9 |
|
Highland Council |
212 |
214 |
224 |
252 |
335 |
422 |
486 |
547 |
|
Inverclyde Council |
3 |
3 |
3 |
3 |
3 |
3 |
3 |
3 |
|
Midlothian Council |
0 |
0 |
0 |
0 |
0 |
0 |
11 |
11 |
|
Moray Council |
50 |
50 |
50 |
73 |
114 |
129 |
132 |
132 |
|
North Ayrshire Council |
13 |
13 |
13 |
13 |
13 |
13 |
13 |
11 |
|
North Lanarkshire Council |
29 |
29 |
29 |
32 |
32 |
32 |
32 |
47 |
|
Orkney Islands Council |
5 |
5 |
7 |
7 |
9 |
9 |
9 |
8 |
|
Perth & Kinross Council |
30 |
30 |
30 |
30 |
37 |
37 |
58 |
82 |
|
Scottish Borders Council |
74 |
77 |
123 |
140 |
154 |
174 |
202 |
218 |
|
Shetland Islands Council |
1 |
1 |
1 |
1 |
6 |
25 |
25 |
25 |
|
South Ayrshire Council |
55 |
55 |
67 |
75 |
84 |
103 |
111 |
111 |
|
South Lanarkshire Council |
135 |
139 |
193 |
193 |
206 |
213 |
239 |
241 |
|
Stirling Council |
16 |
16 |
16 |
26 |
26 |
26 |
26 |
26 |
|
Unknown* |
0 |
3 |
3 |
3 |
41 |
41 |
41 |
129 |
|
West Dunbartonshire Council |
0 |
0 |
0 |
0 |
0 |
0 |
0 |
13 |
|
West Lothian Council |
18 |
20 |
26 |
28 |
28 |
28 |
28 |
28 |
|
Western Isles Council / Comhairle nan Eilan Siar |
4 |
5 |
5 |
5 |
5 |
14 |
14 |
34 |
|
Total |
980 |
996 |
1138 |
1276 |
1661 |
1994 |
2349 |
2566 |
*unknown refers to projects that have been confirmed by BVGA with developers that are not yet in the public domain. N.B., no operational wind farms are forecast in the following local authorities in the period to 2030: Aberdeen City, Dundee City, East Dunbartonshire, Edinburgh City, Glasgow City, and Renfrewshire. The colour code is indicative of the relative magnitude of FTEs required; green indicates low and red indicates high, a darker colour indicates a higher number.
Workforce distributions for other project stages per Local Authorities are presented in Appendix E.
Skill requirements and shortages
A programme of stakeholder interviews was undertaken to provide greater insight to the job roles and specific skills that will be needed to achieve the ambition of 20 GW by 2030. In total, 35 stakeholders, that are undertaking different activities across different onshore wind project stages, were contacted; 22 of these stakeholders were interviewed (see
Figure 4), including 11 developers, 2 O&M, 2 experts in skills/training, 2 from consultancies, 2 from construction, 1 owner/operator and 1 from other expertise.
Figure 4: Stakeholder organisations that were interviewed as part of this study.
Stakeholders were asked to provide their views on the following topics (see Appendix F for the full list of interview topics):
- lifecycle of a typical onshore wind project
- project-specific workforce requirements
- workforce composition and numbers
- skill level assessment
- project development challenges
- adaptation to technological advancements
- collaboration with educational institutions
- attracting and retaining talent
- impact of policy changes
- incorporating circular economy principles
- other aspects that can constrain projects.
All of those interviewed were optimistic about the future of onshore wind in Scotland, with nine (41%) indicating that they expect significant increases in turnover and recruitment in their companies as a result. However, all were quite clear that there are a number of constraints that would need to be addressed in order for this to happen. As a result, six (27%) think that their current project pipelines will not be fully realised until after 2030.
A summary of the responses regarding skills shortages is provided in the following section. The stakeholder engagement has identified significant reservations regarding the feasibility of the project pipeline implementation due to constraints other than skill shortages. These further insights are presented in Appendix G.
Specific skills shortages
Overall, based on interview responses there is significant competition for skilled and experienced people across many different job roles within the onshore wind sector. Thirteen (59%) reported significant competition for experienced members of staff, and nine (41%) for skilled staff in general, across several roles. Six (59%), including four of the developers, specifically noted that headhunting of senior staff was a routine occurrence. Furthermore, recruitment and staff retention are challenging for those that operate in more remote locations – identified by eight (36%). Several specific skills shortages were identified, and these are described as follows:
Wind turbine technicians: although industry sources indicated that a single technician can maintain ten individual turbines, in practice all ISPs, and two operators, noted that two or three wind turbine technicians are needed to do so. The reasons for this are two-fold. Any turbine undergoing maintenance must have at least two technicians working on it for health and safety reasons, one of whom must have a certified electrical qualification. Secondly, a technician will typically have experience of two or three turbines, yet there is a broad range of manufacturers and models (including legacy models). Both operators and ISPs indicated that there is already a shortage of wind turbine technicians (nine or 41% of all stakeholders interviewed). Typically, ISPs recruit individuals from other sectors where they have gained relevant expertise in an electrical, mechanical, or hydraulic engineering discipline. Feedback from all three ISPs indicates that having experience of working safely with the electrical and mechanical systems that are present in wind turbines is more important than detailed knowledge of the turbines themselves. These individuals will have a minimum NVQ level 3 / SCQF level 6 qualification and are trained on specific wind turbine technologies by their new employer, either in-house or via specialist training providers. This is a process that can take between one and two years. Two of the ISPs and one of the developers interviewed had worked directly with the further education sector to develop relevant wind turbine technician training. Staff turnover with ISPs is relatively high at 10-20%, particularly when individuals have experience and higher-level certifications. This is reported to be due to a combination of long working hours and, in some cases, significant travel requirements and/or working away from home. Some of these individuals move to offshore wind where thirteen (59%) of stakeholders reported that salaries are higher. Four (18%) specifically stated that this attracts younger workers in particular.
High voltage engineers: of those interviewed, fourteen (64%), including all of the developers, specifically stated that there is a shortage of electrical engineers in general, and high voltage engineers with Senior Authorised Person (SAP) accreditation in particular. These individuals are accredited to work safely on high-voltage equipment, to connect and maintain grid connections, and typically have at least five years’ experience. The shortage of individuals with SAP accreditation will become more pressing as onshore (and offshore) wind industries are reliant on adequate grid connections, and grid operators are undertaking significant expansion to meet these needs, which also requires high voltage engineers.
Planning officers: although principally employed by local authorities and the ECU, stakeholders noted the importance of individuals with planning experience to developers’ operations with six (27%) stating that they were aware of planning officers being actively recruited to assist with onshore wind planning applications. What this means, however, is that local authorities (and the ECU within the Scottish Government) have become limited in terms of their resources to review onshore wind farm applications. This results in delays to the consenting process, with some developers indicating that it can add several years onto the project development stage.
Speciality consultants: operators, developers and consultancy firms all agree that there is a shortage of specialist consultancy expertise covering both environmental and technical aspects. These individuals can either work within a development company or for a consultancy firm, that is then subcontracted by the developer during different project stages. The reason for this shortage is primarily because the specialist consulting market was relatively small until the large expansion of onshore and offshore renewable energy installations increased the demand for individuals with niche skills. As with other skilled individuals in the onshore wind sector, there is ample evidence of headhunting taking place, with six (27%) of stakeholders reporting high turnover of consultants and two developers indicating that they had used specialist recruitment agencies. This process can take more than 12 months and often requires the company to offer enhanced employment packages to secure the right individuals.
Civils and construction: this sector has seen a marked downturn in workforce numbers due to COVID, BREXIT and, more recently, inflationary increases that have seen construction costs spiral. The issue is that there is more than enough work available for remaining construction companies and they can afford to choose the most lucrative contracts. Given the uncertainties and delays regarding when onshore wind projects may progress to the construction and installation stage, it is becoming an increasing concern to developers (noted by two in particular) that they can secure the necessary resources. This becomes a greater issue for smaller windfarms and those in more remote locations. The constraints facing the construction sector have been confirmed by recent analysis from the Construction Industry Training Board (CITB), which indicates that 19,950 extra construction workers will be needed in Scotland before 2027 (approximately 3,910 new starts per year) (CITB, 2023).
Digital skills: of those interviewed 14 (64%) also identified a growing need for digital skills. This ranged from the ability to undertake analysis of large datasets that are produced from the sensor systems now embedded within modern turbines, to the use of drones to visually inspect turbine blades and nacelles without having to climb the turbine. Employing individuals with such skills allows operators and ISPs to monitor turbine performance remotely and more effectively, and to identify issues and take preventative action at an earlier point, thus minimising turbine downtime. SCADA, IT and data managers were also highlighted as needed to oversee the installation and operation of such systems.
Other specific skilled roles that were identified by those interviewed included: project managers (with specific experience in different onshore wind project stages and disciplines – eight interviewees), stakeholder engagement specialists (to work with LAs, landowners and local communities – seven interviewees), procurement specialists (two interviewees), legal and financial experts (two interviewees), regulatory compliance experts (one interviewee), energy traders (to understand the financial processes of energy management and trading on the market – one interviewee), quantity surveyors (one interviewee), CAD technicians (one interviewee) and operational control room staff (one interviewee).
Skills challenges in remote locations
As already noted, many of the wind farms that are within the planning process are located in remote regions, including Highland, Dumfries & Galloway, and Argyll & Bute. Of those interviewed eight (36%) stated that it was difficult to recruit and retain a local workforce for construction and installation and then O&M of a wind farm in remote areas, with four highlighting Highland, Dumfries & Galloway, and Argyll & Bute as being particularly challenging. Instead, those working on these project stages often travel from outside the area and spend up to two weeks onsite and two weeks off. Two of the ISPs operate both local and regional (travelling) teams as a result but find that it can be difficult to recruit and retain people in these regional teams. From the regional perspective, the remote and rural areas often struggle to support, cater, and accommodate the large number of temporary workforces in construction phases of projects.
Sectors competing for skills required in onshore wind
The onshore wind sector is heavily influenced by a number of other sectors, mainly offshore wind, but also wider infrastructure development.
Offshore wind uses many of the same skillsets as onshore wind, meaning that workers can transfer relatively easily from one sector to the other. Feedback from 13 (59%) of stakeholders interviewed during this study indicates that salaries tend to be higher for offshore wind, to compensate people for long periods away from home (typically two weeks) and longer shifts (generally longer hours and seven days a week). This observation is also supported by those providing training (AIS Group, 2024). Two developers and two ISPs that were interviewed as part of this study suggested that younger workers, in particular, were attracted by the higher salaries in offshore wind.
There are a number of large infrastructure projects taking place across the UK, including transport (e.g., HS2 and electrifying the rail network), decommissioning of nuclear power stations, upgrading and reinforcing the electrical grid (in anticipation of increased renewable electricity generation), and upgrades to the national gas network. Each of these needs a cohort of workers with construction and engineering, as well as other skills. Four (18%) stakeholders that were interviewed as part of this study highlighted their concerns of staff shortages in construction companies.
Altogether, this means that there is high competition between sectors for similar skilled workers and the services of the companies that employ them. Overall, nine (41%) of stakeholders indicated a shortage of skilled people affecting the wider sector. This, in turn, can cause delays to project starts and for projects to take longer than originally planned.
The emerging need and opportunities for remanufacturing
Four interviewees noted that lead times for securing wind turbines for new installations were increasing (18 months was quoted by one), and that parts were not always readily available. One stakeholder stated that they were aware of turbines that were idle because it had not been possible to secure the necessary parts.
This offers an opportunity to enhance Scotland’s remanufacturing sector. The ISPs that were consulted indicated that they routinely source remanufactured parts from UK, Danish and Dutch suppliers, and, in some cases, they can do so more quickly than new parts can be provided by OEMs. With the increasing age of wind turbine installations, and with many of the older models no longer manufactured, it becomes even more pressing to have a domestic supply chain.
Options for addressing skills shortages
Feedback from stakeholder engagement
The overriding sentiment is that the skill shortages need to be addressed urgently through encouraging more people into the sector. In the short term, this means attracting people with some existing, relevant and transferrable skills and experience to address current shortages. These individuals will have some understanding of what is required of them from their previous roles but will need to be supported through retraining and upskilling. These roles could be technical, managerial or operational. Given the projected growth of the sector and the small size of some of the companies operating within onshore wind, and ISPs in particular, it is clear that this will require external support.
At the same time, there needs to be a greater effort to encourage younger talent to enter the sector. These will be people coming through further and higher education systems via apprenticeships, or certificate, diploma and degree programmes. These individuals will be critical in three to five years’ time when onshore wind activity is expected to be at its peak. For those entering technical roles, there will be a need to ensure greater opportunities for practical, on-the-job experience. In this regard, increasing the intake and scope of apprenticeships and training schemes, such as the Wind Training Network (ESP, 2024), will be important. This network, established by ESP, has 11 further education institutions as its members but is only delivering between 70 and 80 trained individuals per year[5]. On its own, this is far too small to have a significant impact. There is, therefore, a need for more strategic and wider intervention to meet the forecast numbers of skilled workforce demand.
The most pressing action is to raise awareness of the broad range of career opportunities directly or indirectly associated with the onshore wind energy sector, especially for regional workforces. There is scope for targeted campaigns in rural areas where the majority of the new installations will take place – to demonstrate well-paid, highly skilled jobs for local people. For example, according to UK Government statistics a wind turbine technician can expect a starting salary of £25,000 reaching £47,000 with experience (National Careers Service, 2024). This compares well with the average UK salary (across all sectors and experience) of around £35,000 (Office for National Statistics, 2023). This could also help address population decline, due to younger people moving to more populated parts of the country (National Records of Scotland, 2021).
For O&M, onshore wind provides a long-term, potentially whole-life, career opportunity. Many of these and other skills required are readily transferrable to other sectors, including offshore wind and other onshore renewables, such as solar photovoltaic and battery storage. This could have an additional benefit of retaining people in their home regions, addressing the issue of depopulation and demographic changes in rural and remote areas (National Records of Scotland, 2021). For the construction sector, it is clear that Scotland is entering a phase of intensive infrastructure development in the energy and transport sectors in particular, but also across many aspects of the built environment. As a result, there will be ample employment opportunities available to individuals with these skillsets for the foreseeable future.
Therefore, there needs to be concerted action to increase the visibility of the sector to individuals in secondary, further and higher education. These are the people that could address potential workforce shortfalls towards the end of this decade and into the 2030s.
Several of those that were interviewed indicated that they had existing connections with further and higher education institutions, through recruitment, offering placements and internships, and giving lectures and talks to students. Four of the operators, two of the ISPs, one of the consultancy firms and one of the construction firms are already working with the further education sector, including Ayrshire, Dumfries & Galloway, and Dundee & Angus Colleges, to develop and refine training courses, including for wind turbine technicians. There is an opportunity to strengthen, coordinate and expand these developments through organisations such as ESP which has established strong connections between industry and the further education sector.
Overview of international skills strategies in the onshore wind sector
The Global Wind Organisation (GWO) has developed a series of certified courses that cover safety and technical aspects for technicians working in the onshore and offshore wind sectors (Global Wind Organisation, 2024). This comprises 16 standards divided into 27 training modules, which are delivered by third party training providers across the globe. Individuals completing the training are awarded certificates that can be verified by employers through an online global database. In 2023 around 156,400 individuals had certificates in at least one GWO module.
In terms of technical training for specific wind turbines, the Danish Wind Power Academy (dwpa) was one of the first dedicated training providers for the sector (Danish Wind Power Academy, 2024). Established in 2004, the trainers it employs have significant experience in technical work in the sector and can provide training across multiple wind turbine manufacturers and models. This training can be provided online or in-person and several of those interviewed for this study indicated that they had sent staff on dwpa courses, because of the high level of trainer expertise. BZEE, based in Germany, is another leading training provider (BZEE, 2024). Founded in 2000 by the German wind industry, it has developed certified training courses for the wind sector. It has a global network of training providers that deliver technical training including on specific manufacturers’ equipment. There are no such technical training facilities in Scotland. Companies instead use a combination of internal training and sending staff to training providers such as dwpa and BZEE.
There is the opportunity to consider the creation of training provision akin to dwpa or BZEE in Scotland.
Conclusions and recommendations
In conclusion, this study has indicated that the sector has skilled workforce shortages. Scotland urgently needs significantly more people to enter the onshore wind industry workforce if the country is to achieve the 20 GW ambition by 2030.
If skill shortages are not addressed, the impact on the ambition to install 20 GW of onshore wind by 2030 is likely to be severe. By 2027, our model predicts that on average four times more FTEs will be required for construction and installation than in 2024 and, within this, five times more civils contractors will be needed. More than 46% of these individuals will be required to build wind farms in Highland and Dumfries and Galloway, regions where stakeholders have highlighted that it is already difficult to recruit individuals. For O&M the figures are smaller and the timeframes longer: around 2.5 times more FTE will be required in 2030 than in 2024. However, the regions with the highest requirement are again Highland and Dumfries and Galloway, with around 37% of the total projected requirement.
Specific project findings include:
- A peak of almost 20,500 FTE will be required by 2027 across the whole of Scotland, from around 6,900 in 2024. This includes almost 18,800 FTE for construction and installation activities, representing 92% of the total workforce required.
- O&M requirements will increase from around 600 FTE in 2024 to 1,500 FTE in 2030. This number is expected to be maintained or even increased during the following decade.
- 46% of individuals constructing and installing wind farms will be working in the local authorities in Highland and Dumfries and Galloway, and a further 21% in East Ayrshire and Argyll and Bute.
- Around 37% of all O&M FTE will be working in Highland and Dumfries & Galloway from 2027 onwards.
- Technical expertise shortages, particularly in high voltage engineers and wind turbine technicians will pose significant challenges to project development and operation. An average of almost 3,000 FTE will be required each year, peaking at almost 4,500 in 2027, across Scotland to enable grid connections. A further 800 FTE wind turbine technicians will be required on average each year across Scotland to maintain installed turbines.
- A lack of skilled planners and environmental specialists will hamper the planning and consenting process, leading to delays. An average of 100 FTE planners and 434 FTE environmental consultants will be required each year to enable wind farm developments.
- Remote project locations will exacerbate workforce shortages and require innovative strategies to attract and retain talent in rural areas.
- There is a strong case for enhancing remanufacturing capacity in Scotland.
- Diverse skillsets encompassing project management, stakeholder engagement and regulatory compliance will be essential for effective project execution and communication.
Addressing these shortages will be challenging. For example, the Industrial Strategy Council, established by the UK Government in 2018, projected that by 2030 around 20% of the UK’s workforce would be under-skilled for their jobs (Industrial Strategy Council, 2020). In 2022, the IET reported that the UK had a shortfall of 173,000 skilled workers in science, technology, engineering and maths sectors, a situation that the IET had been monitoring for the previous 15 years (The Institution of Engineering and Technology, 2022). The solutions recommended from both the Industrial Strategy Council and the IET were for closer collaboration between government, industry and education/training providers to address these challenges, and that upskilling and reskilling would be key elements of this.
Recommendations
Investing in skills development is essential for the success of individual onshore wind projects and for achieving Scotland’s broader renewable energy goals. Addressing these shortages will require a comprehensive approach, including workforce development initiatives, training programmes and industry-academy collaborations. In this regard, collaboration between public, private and education sector stakeholders will be crucial to bridge skills divides and unlock the full potential of Scotland’s onshore wind resources.
Further actions may include:
- Undertaking an awareness raising programme of career opportunities within the sector, the transferrable nature of the skills developed and that this is a sector that is a key contributor to achieving net zero, and will be active for a long time (potentially a whole life career).
- Targeted campaigns in rural areas where the majority of the new installations will take place, to demonstrate well-paid, highly skilled jobs for local people. This could also help address population decline, due to younger people moving to more populated parts of the country.
- Extending wind turbine technician training in Scotland to support the O&M of onshore, and eventually offshore, wind farms. This could build on the Wind Training Network already established by ESP and extend this training to specific wind turbine models, as provided by dwpa and BZEE. Alternatively, it could be delivered in partnership with one or both of these organisations, for example, establishing a subsidiary of dwpa or BZEE in Scotland.
References
AIS Group (2024). More information available at: https://training.aisgroup.co.uk/pages/expertareaarticle.aspx?id=86
Blackridge Research & Consulting (2022). Global Top 15 Wind Turbine Manufacturers (2022). Available at: https://www.blackridgeresearch.com/blog/top-wind-turbine-manufacturers-makers-companies-suppliers
Bloomberg NEF (2023). Goldwind and Vestas in Photo Finish for Top Spot as Global Wind Power Additions Fall. Available at: https://about.bnef.com/blog/goldwind-and-vestas-in-photo-finish-for-top-spot-as-global-wind-power-additions-fall/
BVG Associates (2023). Scotland onshore wind pipeline analysis 2023-2030. Available at: https://www.scottishrenewables.com/assets/000/003/621/Scotland_2030_Pipeline_Analysis_Dec_22_FULL_REPORT_original.pdf
BZEE (2024). More information available at: https://www.bzee-association.org/
Danish Wind Power Academy (2024). More information available at: https://danishwpa.com/
Department for Energy Security and Net Zero (2023). Renewable Energy Planning Database. Available at: https://www.gov.uk/government/publications/renewable-energy-planning-database-monthly-extract
ESP (2024). Wind Training Network established by ESP in 2012 to support the sector growth. More information available at: https://esp-scotland.ac.uk/energy-transition/
Global Wind Energy Council (2023). Mission Critical: Building the global wind energy supply chain for a 1.5°C world. Available at: https://gwec.net/supplychainreport2023/
Global Wind Energy Council & Global Wind Organisation (2023). Global Wind Workforce Outlook 2023-2027. Available at: https://gwec.net/global-wind-workforce-outlook-2023-2027-pr/
Global Wind Organisation (2024). More information available at: https://www.globalwindsafety.org/
Industrial Strategy Council (2020). Rising to the UK’s Skills Challenges. Available at: https://industrialstrategycouncil.org/sites/default/files/attachments/Rising%20to%20the%20UK%27s%20skills%20challenges.pdf
International Energy Agency (2024). More information available at: https://www.iea.org/energy-system/renewables/wind
ITPEnergised (2024). One of the partners delivering this study, is an established environmental and technology consultancy that has advised clients in more than 500 onshore wind farm projects. More information available at: https://www.itpenergised.com/
National Careers Service (2024). More information available at: https://nationalcareers.service.gov.uk/job-profiles/wind-turbine-technician
National Records of Scotland (2021). Population Grows in Large Cities, Declines in Remote Areas. Available at: https://www.nrscotland.gov.uk/news/2021/population-grows-in-large-cities-declines-in-remote-areas
Office for National Statistics (2021). Low carbon and renewable energy economy, UK: 2021. Available at: https://www.ons.gov.uk/economy/environmentalaccounts/bulletins/finalestimates/2021
Office for National Statistics (2023). Employee earnings in the UK: 2023. Available at: https://www.ons.gov.uk/employmentandlabourmarket/peopleinwork/earningsandworkinghours/bulletins/annualsurveyofhoursandearnings/2023
OurWorldInData (2024). Renewable Energy. Available at: https://ourworldindata.org/renewable-energy
Ramboll (2023). Assessment of the structure, conduct and performance of Scotland’s onshore wind, offshore wind and hydrogen sectors. Available at: https://www.climatexchange.org.uk/projects/economic-analysis-of-scotlands-wind-and-hydrogen-sectors/
ReBladeLtd (2024). More information available at: https://reblade.com/
Renewable Parts Ltd (2024). More information available at: https://www.renewable-parts.com/
Scottish Government (2022). Onshore Wind: Policy Statement 2022. Available at: https://www.gov.scot/publications/onshore-wind-policy-statement-2022/
Scottish Government (2023). Onshore Wind Sector Deal for Scotland. Available at: https://www.gov.scot/publications/onshore-wind-sector-deal-scotland/
The Construction Industry Training Board (2023). 19,550 extra construction workers needed in Scotland by 2027. Available at: https://www.citb.co.uk/about-citb/news-events-and-blogs/19-550-extra-construction-workers-needed-in-scotland-by-2027/
The Institution of Engineering and Technology (2022). Engineering Kids’ Futures. Available at: https://www.theiet.org/media/11077/engineering-kids-futures.pdf
Wind Europe (2024). More information available at: https://windeurope.org/about-wind/wind-basics/
Appendices
Appendix A – Onshore wind global market overview
As the onshore wind sector has matured, so has the ability to maximise the amount of electricity produced, even in areas with lower wind speeds. Turbines have become larger, with rotor diameters typically 120 m long compared with 15 m in 1985. Turbines now generate up to 7.5 MW compared with less than 1 MW in 1985 (Wind Europe, 2024). Countries across the globe are looking to wind (in addition to solar and hydro) to provide clean and sustainable energy. According to the International Energy Agency (IEA), combined onshore and offshore wind generated more than 2,100 TWh of electricity in 115 countries across the world in 2022 (International Energy Agency, 2024). China is dominating this growth, installing 59 GW in 2023 alone (half of all global installations in 2023), compared with 17.9 GW in the European Union (EU) and 11 GW in the United States (US). However, to achieve global net zero targets, annual installations will need to reach 350 GW by 2030. Onshore wind accounts for 93% of all installed wind capacity, although the share from offshore wind is expected to increase, with offshore responsible for 18% of new capacity installed in 2022. Wind is second to hydropower in terms of global renewable energy production (OurWorldInData, 2024).

Figure 5: Key components of a wind turbine. From ‘Background analysis of the quality of the energy data to be considered for the European Reference Life Cycle Database (ELCD)’ (2013). 10.2788/5377
Manufacturing of wind turbines and their parts takes place in several countries. China dominates with ten of the top fifteen global manufacturers (Blackridge Research & Consulting, 2022). Vestas Wind Systems (Denmark) and Goldwind (China) are the largest manufacturers by installed turbine capacity (Bloomberg NEF, 2023). Other European manufacturers include Siemens Gamesa Renewable Energy (Spain), GE Renewable Energy (France), Nordex (Germany) and ENERCON (Germany). Each of these companies exports turbines across the globe. The only wind turbine manufacturing sites in the UK are for offshore wind turbine blades: Vestas has a site located on the Isle of Wight, and Siemens Gamesa has a site in Hull.
Manufacturing is not, however, keeping pace with the anticipated demand for the installation or supply of spare parts for operations and maintenance (Global Wind Energy Council, 2023). This has been attributed to a number of factors including increasing manufacturing costs and uncertainty regarding the timing of large-scale installations in different countries. Leading global organisations such as the IEA and the Global Wind Energy Council (GWEC) have stated publicly that more needs to be done to support the wider onshore wind supply chain to meet the global installed capacity ambition. The key components of a turbine are highlighted in Figure 5.
Although manufacturing of new onshore turbines and their components is not expected to happen within Scotland within the period to 2030; refurbishment and remanufacturing of parts for existing, largely legacy turbines, is already happening and has potential to be expanded. This will require skilled people.
Global trends regarding skills demand in the onshore wind sector
Construction / installation, and operations and maintenance (O&M) of windfarms will require the largest numbers of individuals, compared to other project stages in the period to 2030. Globally, it is estimated that by 2027 there will be a need for 256,000 technicians to construct and install onshore wind turbines and a further 243,500 to undertake O&M activities, an annual increase of 17% on 2022 figures (Global Wind Energy Council & Global Wind Organisation, 2023). Of all technicians employed in the wind sector, 87% are expected to work onshore. Further analysis suggests that almost 43% of these individuals will be new recruits to the sector (based on growth projections and an annual attrition rate of 6%) (International Energy Agency, 2024). Overall, this indicates a large global competition for individuals with such skills.
For new entrants into technical roles, wind sector employers tend to recruit either directly from further or higher education or from other sectors that have relevant transferable skills, e.g., oil & gas, or vehicle maintenance. These individuals are then provided with in-house training, supplemented as required with external training, that is specific to the wind sector.
Appendix B – Onshore wind project lifecycle
|
Stage |
Feasibility |
Development |
Construction |
O&M |
End-of-life |
|---|---|---|---|---|---|
|
Duration |
1 year |
3-4 years |
1-2 years |
25+ years | |
|
Project lifecycle activities |
|
|
|
|
|
Appendix C – Job roles, skill level and years of experience
The job roles, skill level and years of experience in the table below were produced through consultation with a range of IPTEnergised members of staff that have experience of, and responsibility for, delivering different phases of onshore wind projects. This internal assessment was validated by sharing with all engaged stakeholders at the end of February 2024.
|
Job role |
Skill level |
Exp. Yrs (>) |
|---|---|---|
|
Civil engineer |
Post-grad |
5 |
|
Electrical engineer |
Degree |
5 |
|
Mechanical engineer |
Degree |
5 |
|
Environmental consultant – ECoW |
Variable |
2 |
|
Environmental consultant – ornithologist |
Variable |
4 |
|
Environmental consultant – ecologist |
Variable |
4 |
|
Environmental consultant – hydro/hydrogeo/geologist/peat specialist |
Degree |
4 |
|
Environmental consultant – noise & vibration |
Degree |
4 |
|
Environmental consultant – cultural heritage/archaeologists |
Degree |
4 |
|
Environmental consultant – forester |
HND/HNC (+) |
2 |
|
Project manager |
Degree |
3 |
|
Health & safety officer |
HNC/HND/GWO |
3 |
|
Wind turbine technician |
HNC/HND/GWO |
1 |
|
Workshop mechanic |
Variable |
1 |
|
HV technician |
Variable |
5 |
|
Logistics manager |
Variable |
1 |
|
Electrician |
Variable |
1 |
|
IT manager |
Post-grad |
2 |
|
Civils contractor |
Variable |
1 |
|
Transport operative |
Variable |
5 |
|
Asset manager |
Degree |
2 |
|
Consultant – site design and modelling |
Degree |
2 |
|
Consultant – energy yield assessors and WindPro design specialists |
Degree |
2 |
|
Consultant – shadow flicker |
Degree |
2 |
|
Consultant – grid connection consultancy and application |
Degree |
2 |
|
Consultant – landscape & visual consultant |
Degree |
2 |
|
Consultant – carbon consultant/specialist |
Degree |
2 |
|
Consultant – aviation, radar & telecommunications |
Degree |
2 |
|
Back-office support |
Variable |
1 |
|
Grid connection installation |
HNC/HND |
5 |
|
DNO EHV commissioning engineer |
HNC/HND |
10 |
|
Protection engineer |
HNC/HND |
10 |
|
Crane/lifting contractor |
HNC/HND |
2 |
|
Planning officers |
Degree |
4 |
|
DNO case worker |
Degree |
4 |
|
Financial analyst |
Degree |
1 |
|
eBoP contractor |
Degree |
5 |
|
Structural engineer |
Degree (+) |
5 |
|
TSA/OEM project delivery team |
Variable |
1 |
Appendix D – FTE requirements for different project stages
Detailed model description
A model was developed to estimate the workforce requirement in the onshore wind industry that will enable us to provide a breakdown of the total workforce requirements into specific job roles.
To develop the model, we used the knowledge base of our project partner IPTEnergised, who have developed and supported over 500 onshore wind projects, to create a simulated onshore wind farm (90MW installed capacity) and a detailed description of job roles and their fulltime equivalents across all stages of the wind farm life cycle (feasibility, development, construction, operations and maintenance, end of life). This part of the model served as a basis for the estimated FTEs per job role per project stage, normalised to 1GW (FTE/GW). The resulting FTE number per GW was then multiplied by the BVGA forecasts of total GW capacity in each wind farm life cycle stage in the timeframe from 2024 to 2030. This calculation yielded the number of FTEs by job role by project stage across the entire pipeline of Scottish onshore wind projects in 2024-2030.
As a quality control for the FTE/GW assumption from the IPTEnergised, we used the data from LCREE 2021 that has been interpreted by Ramboll (2023) to break down the total employment numbers into those involved in the construction and operations of onshore wind farms. We divided this number by the onshore wind capacity under construction and in operation, respectively, to yield an estimate for FTEs per GW that are independent from those presented in the IPTEnergised model. This quality control exercise showed that the FTE/GW assumptions presented by IPTEnergised are consistent with the employment in the sector in 2021. The 2021 time point was used to enable the use of Ramboll interpretation of LCREE 2021 data. LCREE 2022 was released in March 2023. LCREE is an industry self-reported dataset that has certain limitations associated with the differences in individual interpretation of employment in the low carbon/renewable energy sector.
|
FTE/GW |
LCREE 2021 (Ramboll Interpretation) / REPD 2021 |
IPTEnergised |
|
Construction |
1929 |
1644 |
|
Operations |
100 |
56 |
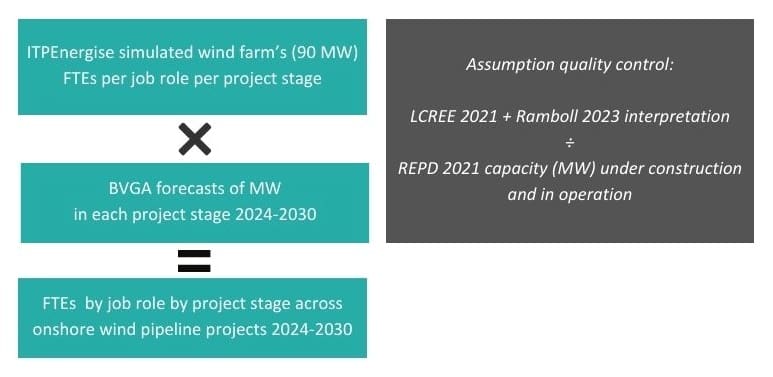 The figure below illustrates the data sources and activities carried out to create and validate the model.
Figure 6: Data sources for model validation.
The heatmaps below illustrate FTE requirements for different project stages in 2024-2030. A darker colour indicates a higher value, representing a relatively higher FTE demand for a job role.
|
Job roles (feasibility) |
2024 |
2025 |
2026 |
2027 |
2028 |
2029 |
2030 |
|
Project manager |
77 |
56 |
36 |
13 |
5 |
2 |
3 |
|
Consultant – Site design and modelling |
31 |
22 |
14 |
5 |
2 |
1 |
1 |
|
Consultant – energy yield assessors & WindPro design |
46 |
33 |
22 |
8 |
3 |
1 |
2 |
|
Consultant – grid connection consultancy and application |
46 |
33 |
22 |
8 |
3 |
1 |
2 |
|
Planning officers |
46 |
33 |
22 |
8 |
3 |
1 |
2 |
|
Environmental consultant |
46 |
33 |
22 |
8 |
3 |
1 |
2 |
|
Financial analyst |
307 |
222 |
143 |
52 |
21 |
7 |
12 |
|
FTE |
599 |
433 |
280 |
101 |
40 |
13 |
24 |
|
Job roles (development) |
2024 |
2025 |
2026 |
2027 |
2028 |
2029 |
2030 |
|
Project manager |
154 |
131 |
125 |
88 |
60 |
13 |
9 |
|
Environmental consultant |
694 |
561 |
394 |
269 |
60 |
40 |
0 |
|
Planning officers |
123 |
105 |
100 |
70 |
48 |
11 |
7 |
|
DNO case worker |
46 |
39 |
37 |
26 |
18 |
4 |
3 |
|
Consultant – grid connection & application |
46 |
39 |
37 |
26 |
18 |
4 |
3 |
|
FTE |
1065 |
875 |
693 |
479 |
203 |
71 |
21 |
|
Job roles (construction) |
2024 |
2025 |
2026 |
2027 |
2028 |
2029 |
2030 |
|
Project manager |
31 |
68 |
95 |
127 |
100 |
96 |
58 |
|
Civils contractor |
1577 |
3392 |
4783 |
6357 |
5034 |
4835 |
2907 |
|
Civil engineer |
63 |
136 |
192 |
255 |
202 |
194 |
116 |
|
Planning officers |
6 |
14 |
19 |
26 |
20 |
20 |
12 |
|
Crane/lifting contractor |
473 |
1017 |
1435 |
1907 |
1510 |
1450 |
872 |
|
Grid connection installation1 |
1104 |
2374 |
3348 |
4450 |
3524 |
3385 |
2035 |
|
DNO EHV commissioning engineer2 |
126 |
271 |
382 |
508 |
402 |
387 |
232 |
|
Transport operative |
473 |
1017 |
1435 |
1907 |
1510 |
1450 |
872 |
|
Logistics manager |
31 |
68 |
95 |
127 |
100 |
96 |
58 |
|
Back-office support |
158 |
339 |
479 |
636 |
504 |
484 |
291 |
|
Health & safety officer |
95 |
203 |
287 |
381 |
302 |
290 |
174 |
|
Environmental consultant |
31 |
68 |
95 |
127 |
100 |
96 |
58 |
|
Environmental consultant – EcoW |
9 |
20 |
29 |
38 |
30 |
29 |
17 |
|
TSA/OEM project delivery team |
95 |
203 |
287 |
381 |
302 |
290 |
174 |
|
Electrical engineer |
63 |
136 |
192 |
255 |
202 |
194 |
116 |
|
eBoP contractor |
315 |
678 |
956 |
1271 |
1006 |
967 |
581 |
|
FTE |
4651 |
10005 |
14110 |
18752 |
14849 |
14263 |
8576 |
|
Job roles (operations) |
2024 |
2025 |
2026 |
2027 |
2028 |
2029 |
2030 |
|
Wind turbine technician |
465 |
531 |
596 |
776 |
931 |
1097 |
1198 |
|
HV technician |
11 |
13 |
14 |
18 |
22 |
26 |
28 |
|
IT manager |
11 |
13 |
14 |
18 |
22 |
26 |
28 |
|
Asset manager |
22 |
25 |
28 |
37 |
44 |
52 |
56 |
|
Crane/lifting contractor |
1 |
1 |
1 |
2 |
2 |
2 |
3 |
|
Logistics manager |
33 |
38 |
42 |
55 |
66 |
78 |
85 |
|
Back-office support |
11 |
13 |
14 |
18 |
22 |
26 |
28 |
|
Health & safety officer |
11 |
13 |
14 |
18 |
22 |
26 |
28 |
|
Environmental consultant |
11 |
13 |
14 |
18 |
22 |
26 |
28 |
|
Electrician |
1 |
1 |
1 |
2 |
2 |
2 |
3 |
|
FTE |
576 |
659 |
739 |
962 |
1154 |
1360 |
1486 |
|
Job roles (end of life) |
2024 |
2025 |
2026 |
2027 |
2028 |
2029 |
2030 |
|
Project manager |
0 |
1 |
0 |
1 |
1 |
12 |
3 |
|
Civils contractor |
1 |
37 |
2 |
59 |
55 |
621 |
157 |
|
Civil engineer |
0 |
1 |
0 |
2 |
2 |
25 |
6 |
|
Planning officers |
0 |
0 |
0 |
0 |
0 |
2 |
1 |
|
Crane/lifting contractor |
0 |
11 |
1 |
18 |
16 |
186 |
47 |
|
Grid connection installation1 |
1 |
26 |
1 |
41 |
38 |
435 |
110 |
|
DNO EHV commissioning engineer2 |
0 |
3 |
0 |
5 |
4 |
50 |
13 |
|
Transport operative |
0 |
11 |
1 |
18 |
16 |
186 |
47 |
|
Logistics manager |
0 |
1 |
0 |
1 |
1 |
12 |
3 |
|
Back-office support |
0 |
4 |
0 |
6 |
5 |
62 |
16 |
|
Health & safety officer |
0 |
2 |
0 |
4 |
3 |
37 |
9 |
|
Environmental consultant |
0 |
1 |
0 |
1 |
1 |
12 |
3 |
|
Environmental consultant – EcoW |
0 |
0 |
0 |
0 |
0 |
4 |
1 |
|
TSA/OEM project delivery team |
0 |
2 |
0 |
4 |
3 |
37 |
9 |
|
Electrical engineer |
0 |
1 |
0 |
2 |
2 |
25 |
6 |
|
eBoP contractor |
0 |
7 |
0 |
12 |
11 |
124 |
31 |
|
FTE |
4 |
110 |
6 |
174 |
162 |
1833 |
463 |
Notes:
- Grid connection installation requires multiple skills and can vary dependent on the specific wind farm location. Specific skilled roles are:
- Project managers
- Designers
- Land agents (for land rights)
- Equipment manufacture
- Civils teams for installation
- Cable pullers, jointers, etc
- Linesmen (for OHL connections)
- Commissioning engineers
- SAPs
- Protection engineers
These are additional FTEs to these with the same skillsets required for other aspects of the construction and installation phase. However, the same individual can perform multiple roles that require the same skillset (up to one FTE) across this phase.
- Two DNO EHV commissioning engineers are required for each of the developer and the subcontractor for the DNO.
Appendix E – FTE requirements by project stage and Local Authority
Local authorities with no forecast activities in specific project stages are not included in the tables below.
|
Local authority |
2023 |
2024 |
2025 |
2026 |
2027 |
2028 |
2029 |
2030 |
|
Aberdeen City Council |
0 |
0 |
0 |
0 |
0 |
0 |
0 |
0 |
|
Aberdeenshire Council |
26 |
15 |
8 |
5 |
0 |
0 |
0 |
0 |
|
Argyll and Bute Council |
100 |
81 |
57 |
25 |
4 |
4 |
0 |
0 |
|
Clackmannanshire Council |
2 |
2 |
2 |
2 |
0 |
0 |
0 |
0 |
|
Dumfries & Galloway Council |
86 |
55 |
36 |
25 |
10 |
0 |
0 |
0 |
|
East Ayrshire Council |
59 |
58 |
6 |
1 |
0 |
0 |
0 |
0 |
|
East Lothian Council |
8 |
0 |
0 |
0 |
0 |
0 |
0 |
0 |
|
Fife Council |
0 |
0 |
0 |
0 |
0 |
0 |
0 |
0 |
|
Highland Council |
182 |
140 |
106 |
59 |
12 |
0 |
0 |
0 |
|
Midlothian Council |
7 |
0 |
0 |
0 |
0 |
0 |
0 |
0 |
|
Moray Council |
9 |
9 |
7 |
0 |
0 |
0 |
0 |
0 |
|
North Ayrshire Council |
5 |
5 |
5 |
5 |
0 |
0 |
0 |
0 |
|
North Lanarkshire Council |
20 |
17 |
17 |
1 |
0 |
0 |
0 |
0 |
|
Orkney Islands Council |
2 |
0 |
0 |
0 |
0 |
0 |
0 |
0 |
|
Perth & Kinross Council |
31 |
31 |
31 |
10 |
0 |
0 |
0 |
0 |
|
Scottish Borders Council |
72 |
59 |
27 |
20 |
12 |
0 |
0 |
0 |
|
Shetland Islands Council |
1 |
0 |
2 |
2 |
2 |
2 |
0 |
0 |
|
South Ayrshire Council |
11 |
5 |
2 |
15 |
13 |
13 |
13 |
0 |
|
South Lanarkshire Council |
27 |
23 |
17 |
14 |
14 |
0 |
0 |
0 |
|
Stirling Council |
5 |
0 |
0 |
0 |
0 |
0 |
0 |
0 |
|
Unknown |
105 |
108 |
121 |
101 |
37 |
22 |
0 |
25 |
|
West Dunbartonshire Council |
9 |
0 |
0 |
0 |
0 |
0 |
0 |
0 |
|
West Lothian Council |
2 |
0 |
0 |
0 |
0 |
0 |
0 |
0 |
|
Western Isles Council / Comhairle nan Eilan Siar |
6 |
6 |
0 |
0 |
0 |
0 |
0 |
0 |
|
Total |
775 |
613 |
443 |
286 |
103 |
41 |
13 |
25 |
|
Local authority |
2023 |
2024 |
2025 |
2026 |
2027 |
2028 |
2029 |
2030 |
|
Aberdeen City Council |
0 |
0 |
0 |
0 |
0 |
0 |
0 |
0 |
|
Aberdeenshire Council |
27 |
20 |
19 |
17 |
7 |
3 |
0 |
0 |
|
Angus Council |
1 |
0 |
0 |
0 |
0 |
0 |
0 |
0 |
|
Argyll and Bute Council |
47 |
56 |
65 |
58 |
24 |
12 |
4 |
4 |
|
Clackmannanshire Council |
0 |
0 |
0 |
2 |
2 |
0 |
0 |
0 |
|
Dumfries & Galloway Council |
154 |
136 |
67 |
36 |
28 |
24 |
0 |
0 |
|
East Ayrshire Council |
19 |
59 |
57 |
51 |
1 |
0 |
0 |
0 |
|
East Lothian Council |
8 |
8 |
8 |
0 |
0 |
0 |
0 |
0 |
|
East Renfrewshire Council |
0 |
0 |
0 |
0 |
0 |
0 |
0 |
0 |
|
Fife Council |
0 |
0 |
0 |
0 |
0 |
0 |
0 |
0 |
|
Highland Council |
161 |
134 |
116 |
130 |
77 |
55 |
0 |
0 |
|
Midlothian Council |
7 |
7 |
0 |
0 |
0 |
0 |
0 |
0 |
|
Moray Council |
16 |
15 |
9 |
7 |
0 |
0 |
0 |
0 |
|
North Ayrshire Council |
3 |
0 |
0 |
5 |
5 |
5 |
0 |
0 |
|
North Lanarkshire Council |
3 |
3 |
17 |
17 |
17 |
0 |
0 |
0 |
|
Orkney Islands Council |
4 |
2 |
2 |
0 |
0 |
0 |
0 |
0 |
|
Perth & Kinross Council |
4 |
0 |
21 |
31 |
31 |
6 |
0 |
0 |
|
Scottish Borders Council |
78 |
81 |
66 |
47 |
26 |
20 |
0 |
0 |
|
Shetland Islands Council |
9 |
1 |
1 |
0 |
0 |
2 |
2 |
0 |
|
South Ayrshire Council |
23 |
24 |
9 |
2 |
2 |
2 |
13 |
13 |
|
South Lanarkshire Council |
36 |
23 |
27 |
6 |
14 |
14 |
0 |
0 |
|
Stirling Council |
5 |
5 |
0 |
0 |
0 |
0 |
0 |
0 |
|
Unknown |
0 |
25 |
25 |
80 |
117 |
97 |
34 |
18 |
|
West Dunbartonshire Council |
9 |
9 |
9 |
9 |
0 |
0 |
0 |
0 |
|
West Lothian Council |
5 |
2 |
0 |
0 |
0 |
0 |
0 |
0 |
|
Western Isles Council / Comhairle nan Eilan Siar |
0 |
6 |
6 |
0 |
0 |
0 |
0 |
0 |
|
Total |
619 |
616 |
523 |
497 |
349 |
239 |
53 |
35 |
|
Local authority |
2024 |
2025 |
2026 |
2027 |
2028 |
2029 |
2030 |
|
Aberdeenshire Council |
81 |
149 |
283 |
696 |
806 |
424 |
191 |
|
Argyll and Bute Council |
0 |
345 |
1024 |
1748 |
2317 |
1421 |
571 |
|
Dumfries & Galloway Council |
416 |
2028 |
3723 |
4335 |
2013 |
1573 |
725 |
|
East Ayrshire Council |
0 |
323 |
704 |
2018 |
1669 |
1398 |
35 |
|
East Lothian Council |
0 |
0 |
230 |
230 |
230 |
0 |
0 |
|
Highland Council |
514 |
1788 |
2819 |
4173 |
3071 |
2615 |
1834 |
|
Midlothian Council |
0 |
0 |
0 |
208 |
208 |
208 |
0 |
|
Moray Council |
162 |
1232 |
1321 |
948 |
344 |
56 |
0 |
|
North Ayrshire Council |
2 |
2 |
0 |
0 |
0 |
0 |
0 |
|
North Lanarkshire Council |
0 |
68 |
68 |
0 |
0 |
475 |
475 |
|
Orkney Islands Council |
51 |
51 |
46 |
46 |
0 |
0 |
0 |
|
Perth & Kinross Council |
0 |
129 |
129 |
129 |
397 |
863 |
466 |
|
Scottish Borders Council |
955 |
1436 |
1095 |
909 |
1022 |
981 |
1012 |
|
Shetland Islands Council |
855 |
93 |
475 |
475 |
382 |
0 |
0 |
|
South Ayrshire Council |
383 |
561 |
699 |
694 |
516 |
153 |
0 |
|
South Lanarkshire Council |
1024 |
1248 |
258 |
883 |
663 |
538 |
38 |
|
Stirling Council |
0 |
195 |
195 |
0 |
0 |
0 |
0 |
|
Unknown |
0 |
0 |
733 |
733 |
116 |
2644 |
2423 |
|
West Dunbartonshire Council |
0 |
0 |
0 |
0 |
257 |
257 |
257 |
|
West Lothian Council |
107 |
167 |
38 |
0 |
0 |
0 |
0 |
|
Western Isles Council / Comhairle nan Eilan Siar |
12 |
0 |
0 |
168 |
554 |
386 |
386 |
|
Total |
4562 |
9813 |
13840 |
18393 |
14564 |
13990 |
8412 |
|
Local authority |
2023 |
2024 |
2025 |
2026 |
2027 |
2028 |
2029 |
2030 |
|
Aberdeenshire Council |
51 |
55 |
55 |
63 |
63 |
87 |
99 |
107 |
|
Angus Council |
2 |
2 |
2 |
2 |
2 |
2 |
2 |
2 |
|
Argyll and Bute Council |
42 |
39 |
39 |
50 |
58 |
115 |
177 |
188 |
|
Clackmannanshire Council |
5 |
5 |
5 |
5 |
5 |
5 |
5 |
5 |
|
Dumfries & Galloway Council |
112 |
112 |
124 |
146 |
280 |
332 |
382 |
395 |
|
East Ayrshire Council |
90 |
90 |
90 |
96 |
127 |
141 |
210 |
158 |
|
East Lothian Council |
15 |
15 |
15 |
15 |
15 |
27 |
27 |
27 |
|
East Renfrewshire Council |
4 |
4 |
4 |
4 |
4 |
4 |
4 |
4 |
|
Falkirk Council |
4 |
4 |
4 |
4 |
4 |
4 |
4 |
4 |
|
Fife Council |
9 |
9 |
9 |
9 |
9 |
9 |
9 |
9 |
|
Highland Council |
212 |
214 |
224 |
252 |
335 |
422 |
486 |
547 |
|
Inverclyde Council |
3 |
3 |
3 |
3 |
3 |
3 |
3 |
3 |
|
Midlothian Council |
0 |
0 |
0 |
0 |
0 |
0 |
11 |
11 |
|
Moray Council |
50 |
50 |
50 |
73 |
114 |
129 |
132 |
132 |
|
North Ayrshire Council |
13 |
13 |
13 |
13 |
13 |
13 |
13 |
11 |
|
North Lanarkshire Council |
29 |
29 |
29 |
32 |
32 |
32 |
32 |
47 |
|
Orkney Islands Council |
5 |
5 |
7 |
7 |
9 |
9 |
9 |
8 |
|
Perth & Kinross Council |
30 |
30 |
30 |
30 |
37 |
37 |
58 |
82 |
|
Scottish Borders Council |
74 |
77 |
123 |
140 |
154 |
174 |
202 |
218 |
|
Shetland Islands Council |
1 |
1 |
1 |
1 |
6 |
25 |
25 |
25 |
|
South Ayrshire Council |
55 |
55 |
67 |
75 |
84 |
103 |
111 |
111 |
|
South Lanarkshire Council |
135 |
139 |
193 |
193 |
206 |
213 |
239 |
241 |
|
Stirling Council |
16 |
16 |
16 |
26 |
26 |
26 |
26 |
26 |
|
Unknown |
0 |
3 |
3 |
3 |
41 |
41 |
41 |
129 |
|
West Dunbartonshire Council |
0 |
0 |
0 |
0 |
0 |
0 |
0 |
13 |
|
West Lothian Council |
18 |
20 |
26 |
28 |
28 |
28 |
28 |
28 |
|
Western Isles Council / Comhairle nan Eilan Siar |
4 |
5 |
5 |
5 |
5 |
14 |
14 |
34 |
|
Total |
980 |
996 |
1138 |
1276 |
1661 |
1994 |
2349 |
2566 |
|
Local authority |
2023 |
2024 |
2025 |
2026 |
2027 |
2028 |
2029 |
2030 |
|
Aberdeenshire Council |
0 |
0 |
0 |
0 |
2 |
0 |
28 |
61 |
|
Argyll and Bute Council |
57 |
0 |
27 |
0 |
25 |
0 |
1 |
0 |
|
Dumfries & Galloway Council |
0 |
0 |
0 |
0 |
42 |
4 |
0 |
73 |
|
East Ayrshire Council |
0 |
0 |
0 |
0 |
0 |
22 |
1040 |
0 |
|
East Renfrewshire Council |
0 |
0 |
0 |
4 |
0 |
0 |
0 |
0 |
|
Highland Council |
0 |
0 |
0 |
0 |
0 |
97 |
0 |
25 |
|
Moray Council |
0 |
0 |
0 |
0 |
0 |
0 |
0 |
98 |
|
North Ayrshire Council |
0 |
0 |
0 |
0 |
0 |
0 |
46 |
0 |
|
North Lanarkshire Council |
0 |
0 |
0 |
0 |
0 |
0 |
186 |
53 |
|
Orkney Islands Council |
0 |
3 |
3 |
0 |
5 |
4 |
7 |
2 |
|
Perth & Kinross Council |
0 |
0 |
0 |
0 |
0 |
0 |
0 |
52 |
|
Scottish Borders Council |
0 |
0 |
53 |
0 |
60 |
0 |
130 |
0 |
|
Shetland Islands Council |
0 |
0 |
4 |
0 |
3 |
0 |
0 |
0 |
|
South Lanarkshire Council |
0 |
0 |
0 |
1 |
0 |
0 |
0 |
0 |
|
Total |
58 |
3 |
87 |
5 |
137 |
127 |
1439 |
363 |
Appendix F – Stakeholder interview structure
The interview structure was approved by the project Steering Group as follows:
- Lifecycle of an onshore wind project: could you walk us through the typical lifecycle of one of your onshore wind projects and the key workforce needs at each stage?
- Project-specific workforce requirements: for your current and upcoming projects, what specific job roles and skills levels are you prioritising?
- Workforce composition and numbers: what does the workforce composition look like in terms of numbers and roles for a typical wind farm project?
- Skill level assessment: how do you assess the skill levels required for various job roles within your projects? What overlaps are there with related sectors, particularly offshore wind?
- Project development challenges: are there any unique challenges in project development that are creating new demands for specific skills or roles?
- Adaptation to technological advancements: how is your workforce adapting to the rapid technological advancements in the wind energy sector? What internal training do you provide (e.g., including apprenticeship programmes)?
- Collaboration with educational institutions: what role can partnerships with universities and vocational training institutes play in addressing the skill gaps?
- Attracting and retaining talent: do you experience recruitment difficulties (current or predicted) for any specific roles? What strategies can be implemented to make the onshore wind sector more attractive to skilled professionals, especially in a competitive job market? Is it more difficult to recruit in certain locations than others?
- Impact of policy changes: how do recent and upcoming policy changes influence the skill needs in the sector, and how is the industry adapting? What are the anticipated challenges in scaling up to meet this target?
- Incorporating circular economy principles: how can the industry integrate circular economy principles into its workforce development plans (e.g., recycling, repowering, decommissioning)?
Appendix G – Further insights from stakeholder engagement
In addition to workforce and skills issues, interviewees also highlighted a number of other factors that are constraining sector development. Of these, delays to grid connections and planning consent were stated by all of those interviewed as causing significant issues. We discuss here the delays caused by skills shortages outside the onshore wind industry.
Securing a grid connection date that aligns with project timelines is the most important factor for all developers. Without this the project cannot progress beyond early development stages. At present developers are being offered grid connection dates of mid 2030s for new projects. However, two reported that existing dates that had been agreed with the distribution network operator (DNO) have also been delayed. These delays can be due to a number of issues: resource shortages with the DNO due to competing demands; or lack of skilled workers (e.g., high voltage electrical engineers); or delays in planning consent for DNO operations (e.g., installing the 400kV lines that are required to connect to wind farms to the grid).
Planning consent from local authorities and the ECU within the Scottish Government (for wind farms larger than 50 MW) are also causing significant delays. Developers indicated that the process of securing planning permission can take several years, primarily because of personnel shortages within the LAs and the ECU, but, in some cases, also the time taken in addressing objections from the local community which can trigger a public inquiry. 64% of those interviewed (of which nine were developers) indicated that this was a significant issue. The SOWSD commitment to halve the consenting time to one year (or two years if there is a public inquiry) has been welcomed by the sector, but individuals remain sceptical that this will be achieved given that the resource in planning departments has not been increased.
Five developers also commented that projects which had been granted a grid connection date but had not progressed through the planning consent process for several years, should be removed to free resources and increase the chances of other projects being granted a grid connection.
These delays can increase developer costs. For example, other permits and leases may need to be maintained and paid for, the costs for subcontract labour and materials may increase, and interest on finance and investment still needs to be paid. Furthermore, according to our own estimates and those of interviewed stakeholders, significant investment (around £1.2-1.3M per MW) will need to remain ring-fenced for the construction of the wind farm. At the same time the revenue stream to pay for this investment and generate profit is delayed.
It became apparent through discussing these aspects with developers that the delays in grid connection and planning consent, and subsequent impacts mean that there is now an increased number of projects that are effectively ‘paused’ because they are no longer commercially viable. It is also clear that the main factor causing these delays is a lack of skilled human resources in grid operators and in planning departments (opinion of 64% of all stakeholders interviewed).
© The University of Edinburgh, 2024
Prepared by Optimat and ITPEnergised on behalf of ClimateXChange, The University of Edinburgh. All rights reserved.
While every effort is made to ensure the information in this report is accurate, no legal responsibility is accepted for any errors, omissions or misleading statements. The views expressed represent those of the author(s), and do not necessarily represent those of the host institutions or funders.
Scottish Government, 2023: page 6. ↑
For further detail see Section 5 and Appendices D and E. ↑
FTE refers to the number of hours that a full-time employee works for an organisation. One FTE can therefore be one full-time member of staff or multiple part-time employees. ↑
Appendix B provides further details of a wind farm’s project lifecycle, while Appendix C provides a more detailed description of the qualifications and experience required for different job roles. ↑
Feedback from stakeholder interviews. ↑
DOI: http://dx.doi.org/10.7488/era/3843
Executive summary
This research brings new insight into how climate-related hazards and their impact on people and communities vary across Scotland. The project explored which, if any, population groups are disproportionately affected by flooding, high temperature and poor air quality, how they are affected now and potential impact in the future.
Vulnerability to the impacts of climate change depends on two sets of factors:
- The likelihood that people and communities are exposed to climate-related hazards, eg where they live and the dwelling type.
- The characteristics of people and communities that make them more or less likely to experience a negative outcome if they were to be exposed to a hazard. These characteristics include eg age, health, income, property tenure and insurance cover.
To deliver a just (ie fair) approach to managing climate related risks the outcomes for the most vulnerable need to be understood and well managed. The process of identifying, and, if necessary, addressing the disproportionate risk faced by the most vulnerable is therefore a central component of a just approach to climate adaptation.
Main findings
- Low income and poor health are strong drivers of social vulnerability to all three of the climate-related hazards we investigated.
- In rural areas, access to the internet and isolation heighten vulnerability.
- In urban settings, poor health, income deprivation, high levels of social and private renting, lack of local knowledge and limited mobility are all important contributors to vulnerability.
- In general, local authorities experiencing the greatest disadvantage today continue to do so in the future.
- People in rural areas are at greater risk of being adversely impacted by climate change than those living in urban areas. This is particularly the case for flooding, though population density means that a greater number of people are affected in urban areas.
- The most socially vulnerable neighbourhoods in large urban areas are three times more likely to be exposed to high temperatures than others, and 50% more likely to be exposed to poor air quality. However, if planned reductions in emissions are realised, the latter risk is projected to decrease in the future.
- Different ethnic groups experience different levels of risk:
- Black ethnic groups tend to experience higher risk today than any other ethnic group, particularly in relation to poor air quality.
- However, difference between the risks faced by the most socially vulnerable neighbourhoods and others within the same ethnic group is greatest amongst white ethnic groups.
Implications for policy
Many of the most important drivers of social vulnerability affect vulnerability to all hazards considered in this report – flooding, high temperatures and poor air quality. Recognising this presents an opportunity to enhance resilience to multiple climate hazards through targeted action and adaptation.
Climate-related disadvantage is often driven by a limited capacity to appropriately prepare for, and recover from, hazard events eg flooding or heat waves. Supporting the most socially vulnerable to make property-level adaptations, including those in rented accommodation, would reduce the negative outcomes when exposed to a hazard.
Note
The datasets and thresholds used are not representative of thresholds of health-related impacts per se but are chosen to provide a relative insight into social disadvantage across Scotland. For any individual, the relationship between climate related hazards (such as flooding, heat, and air quality) and physical and mental health is extremely complex. It is widely documented, for example, that air pollution can have a negative impact on health, with the very young, the elderly and those with pre-existing health conditions being particularly vulnerable. However, the types of illnesses that may be exacerbated by air pollution can also be affected by multiple other factors – such as obesity, alcohol consumption, smoking and genetics. The ways in which these factors interact with air quality to influence overall health are not currently well understood, and further long-term research is needed. Similar complex interactions between multiple factors exist in relation to flooding and heat. Consequently, it is not generally possible to say with any certainty the impact air pollution may have on a specific individual. These caveats should be borne in mind when considering the information contained in this report.
Glossary
The following table provides selected definitions. Definitions of metrics are given in the appropriate location in the report.
|
Term |
Definition |
|
Climate justice |
Defined here as the outcome of taking action to manage climate related risks that provide a more equitable distribution of the potential harms faced because of both inherent social vulnerability and potential for exposure to hazards. |
|
Driver (of vulnerability) |
Factors that increase the impact exposure to a hazard has on a household or an individual |
|
Exposure |
The potential to encounter a climate-related hazard (i.e., to be flooded, or experience a high temperature, or poor air quality). |
|
Geographic disadvantage |
A function of: (a) the likelihood of exposure to a hazard, and (b) individual or group social vulnerability to that hazard. This considers the spatial coincidence of the hazard, exposure and social vulnerability that can be aggregated to the spatial scale of interest. |
|
Hazard |
The occurrence of a situation with the potential to cause harm (loss of wellbeing). In the context here, the hazards considered are flooding, high temperatures and poor air quality. |
|
Indicator |
The specific variables, e.g. ‘% unemployment’, that contribute to the drivers of vulnerability, e.g. low income |
|
Just transition |
Defined here as a ‘fair’ distribution of the short and long-term costs and benefits of climate mitigation or adaptation; an outcome achieved through a process that balances principles of utility and equality with maximising the outcomes from the most socially vulnerable. |
|
Risk |
A function of the chance of an event (e.g., the hazard) and the impact that the event would cause if it occurred (taking account of the social vulnerability of those exposed). |
|
Systemic disadvantage |
The risk faced by the most socially vulnerable when compared to those less vulnerable (Sayers et al., 2016). Since this enables a comparison of the risks faced within a selected grouping (for example, those living in urban areas or from a particular ethnic group) it is referred to here as systemic disadvantage. |
|
Vulnerability (social) |
The inherent characteristics of individuals and communities in which they live that influence the potential to experience loss of wellbeing when exposed to a climate hazard. |
Introduction
Motivation
Scotland’s climate is already changing, and further change is now inevitable. However, the effects of climate change will not be felt equally by everyone. Some places in Scotland – and the people living in those places – are more likely than others to be exposed to climate-related hazards, such as floods. The impact also varies, with some people and communities more vulnerable than others to being negatively affected when exposed to a climate-related hazard.
The Scottish Government is committed to embedding the principles of climate justice and just transition within its response to climate change. The plans developed to adapt to the effects of climate change should help to address inequality and support the people who are most affected by climate change and are the least equipped to adapt to its effects. Scotland’s Climate Change Adaptation Programme 2019-2024[1] (SCCAP2) states the Scottish Government’s objective to ensure that adaptation is focused directly on empowering the people who are more vulnerable to climate change and that adaptation actions are just and put people first.
Delivering these commitments successfully will require an understanding of the impacts of climate change across different social groups in Scotland. Although some evidence already exists, a recent independent assessment of SCCAP2[2] conducted by the Climate Change Committee (CCC) included a specific recommendation to improve the knowledge base around the distributional impacts of climate change.
The research presented here responds to this recommendation by identifying those groups in Scotland most likely to be disproportionately impacted by three selected climate hazards (flooding; high temperature; and poor air quality), now and in the future.
Research questions
Given this context, the research focuses on three primary questions:
Q1. What are the drivers of social vulnerability to climate hazards across Scotland?
Q2. Which groups are at the greatest social risk from climate related hazards, now and in the future?
Q3. To what extent are the most socially vulnerable disproportionately impacted by climate-related hazards?
It is anticipated that the evidence presented in responding to these questions will be relevant to public engagement on climate change issues, and in implementing a just transition.
Report structure
The report is structured as follows:
- Chapter 2 – Assessment approach, sets out the approach to the assessment.
- Chapter 3 – Climate-related hazards – Present and future, sets out why flooding, poor air quality and the high temperatures have been selected, as well as the data sources used, and the adaptation assumptions made.
- Chapter 4 –Social vulnerability, sets out the definition of social vulnerability, the individual indicators and integrated indices of social vulnerability used and shows how they vary across Scotland. This responds to the first research question: ‘What are the drivers of social vulnerability to climate hazards across Scotland?’
- Chapter 5 – Geographic disadvantage, sets out the definition of geographic disadvantage and aggregates the risk spatially to compare the risk faced across Scotland. This responds to the second research question: ‘Which groups are at the greatest social risk from climate related hazards, now and in the future?’
- Chapter 6 – Systemic disadvantage, sets out the definition of systemic disadvantage and compares the risks face by the most socially vulnerable and the less socially vulnerable across Scotland. This responds to the third research question: ‘To what extent are the most socially vulnerable disproportionately impacted by climate-related hazards?’
- Chapter 7 – Conclusions, summarises the findings of the study.
References are provided in Chapter 8. Appendix 1 provides an extended discussion of the rationale for the selection of three hazards. Appendix 2 presents the rationale for the selected indicators of social vulnerability and sets out the approach to calculating a vulnerability index.
Assessment approach
Climate-related hazards and the impact they have on the people and communities exposed to them vary across Scotland. Delivering a just (i.e., fair) approach to managing climate related risks seeks to ensure the outcomes for the most socially vulnerable are understood and well-managed, rather than basing decisions on strict utilitarian or purely egalitarian principles (e.g., Sayers., 2017). The process of identifying, and if necessary, addressing disproportionality in the risk faced by the most socially vulnerable is therefore a central component of a just approach to climate adaptation.
The framework of assessment used to support this process considers the factors that influence social vulnerability and how these combine with exposure to three selected hazards (flooding, heat, and poor air quality) to drive geographic and systemic disadvantage (Figure 1). The rationale of the approach is discussed in more detail below.
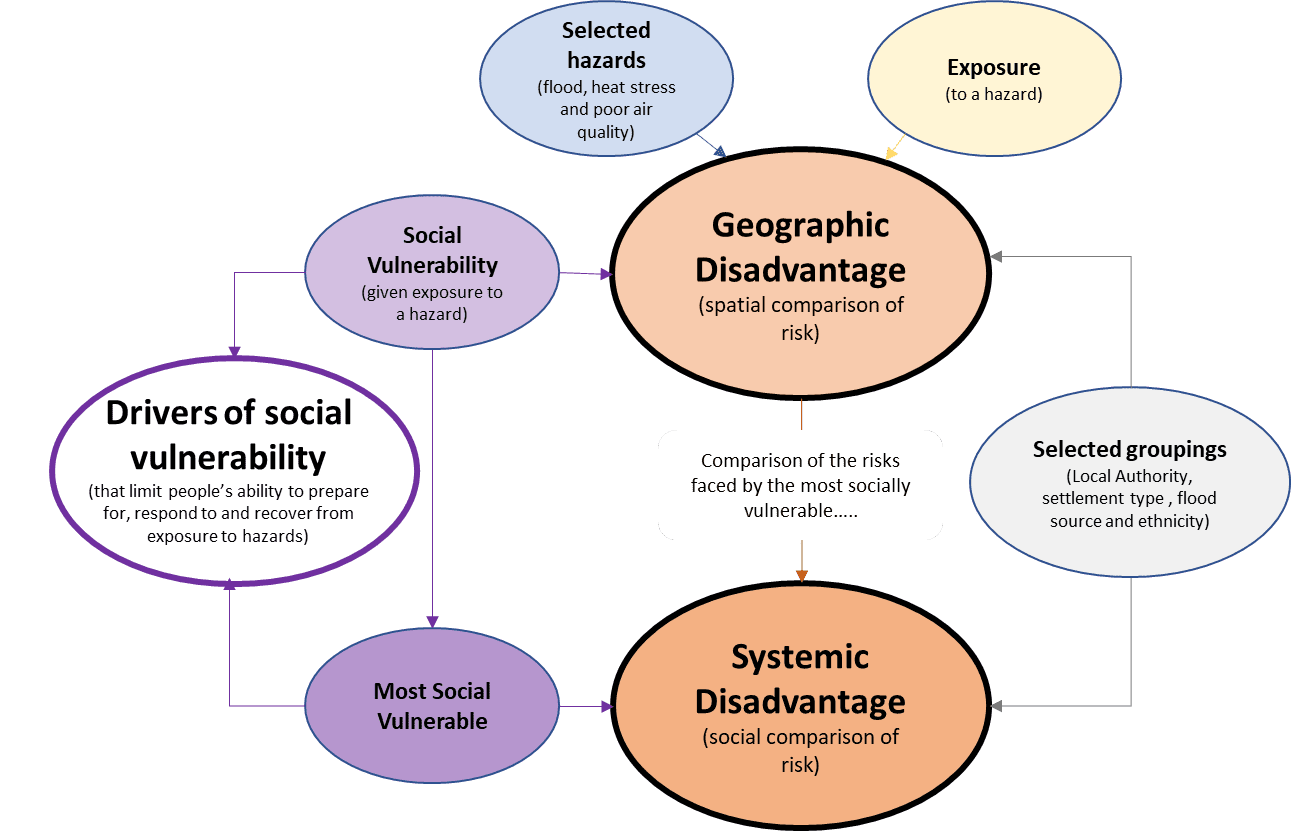
Figure 1 Overview of the assessment process
Climate-related disadvantage arises through the combination of two aspects:
- Social vulnerability – Social vulnerability refers to the combination of social characteristics of people and communities that determine their propensity for harm. Social vulnerability therefore reflects the inherent characteristics of the people and communities in which they live that would – if they were to be exposed to a hazard – make them more or less likely to experience a negative welfare outcome. There are many factors that contribute to social vulnerability, including bio-physical indicators such as older age groups and people with pre-existing ill-health as well as factors such as income, property tenure, access to insurance and access to support to enable adaptation. Multiple indicators are therefore used here to assess a relative measure of social vulnerability at the scale of a ‘neighbourhood’ (defined as one Data Zone[3]). The range of indicators used vary subtlety between the selected hazards (i.e., flooding, poor air quality and high temperatures) but many are shared (as detailed in Chapter 4). People and communities may be classified as socially vulnerable even if they are never exposed to a hazard – it is a measure of their potential to experience harm.
- Exposure to climate-related hazards – This refers to the likelihood of people and communities being exposed to one of the selected climate-related hazards (flooding, high temperature, and poor air quality). Exposure to each hazard varies across Scotland, with some communities more likely than others to be exposed to one or more of these three hazards.
To help understand how climate disadvantage manifests in Scotland the results of the analysis are viewed through two lenses; a geographic spatial lens and a systemic social lens as described below.
Geographic disadvantage (a spatial lens). This considers the risk faced by each neighbourhood, based on the social vulnerability and exposure to climate hazards within each neighbourhood. Those neighbourhoods with the greatest risk face the greatest ‘geographic disadvantage.’ To provide insight into how these risks are distributed, the risks at a neighbourhood scale are aggregated according to four selected groupings:
- Local authority: Local authorities are central to managing climate related risks and disadvantage (Figure 2, left). Neighbourhoods within a local authority area have been aggregated to enable an assessment of the geographic disadvantage faced by each local authority, and how this compares to other local authorities. All local authorities are considered alongside a specific focus on Glasgow and Dundee, that is used to illustrate the potential disadvantage experience in two city regions (Figure 2, right).
- Settlement type: The Scottish Government (2018) identifies eight settlement types ranging from very remote rural areas to large urban areas (Figure 2, middle). Neighbourhoods within each of these eight settlement types have been aggregated and compared to understand the differences in geographic disadvantage faced across rural and urban settings.
- Flood source: Across Scotland some communities are exposed to flooding and others are not, and the different sources of flooding can lead to different types of challenges. Neighbourhoods, therefore, have been grouped according to their potential exposure to three different sources of flooding: coastal, fluvial, and surface water. This enables an analysis and comparison of the risks faced across each source of flooding.
- Between different ethnic groups: Ethnicity is an important consideration across policy. Information on the proportional representation of five different ethnic groups in each neighbourhood (white, black / African / Caribbean, Asian, other minorities, mixed minorities) is used to aggregate the neighbourhood scale risks. The data on ethnicity is drawn from readily available information within public domain and linked at a neighbourhood scale to property tenure and income (Sayers et al., 2020). Ethnicity is not considered as a driver of social vulnerability, but aggregated risks faced by different ethnic groups is used to aid the understanding of distributional aspects of climate-related risks.
The approach and insights into geographic disadvantage across Scotland are discussed further in Chapter 5.
Systemic disadvantage (a social lens) (Sayers et al, 2017). Systemic disadvantage arises when the risks faced by the most socially vulnerable are greater than those experienced by the less vulnerable within a given grouping. To assess the degree of systemic disadvantage the risks faced by the 20% most socially vulnerable within the same local authority, settlement type, flood source or ethnic group are compared with the risks faced by the less vulnerable within the same group. This comparison of the risks faced within each of the four groupings helps to understand how the outcomes for the most socially vulnerable compare to those of others and hence, where needed, how improved outcomes may be appropriately supported (a central consideration in a just (i.e., fair) approach to adaptation, Rawls, 1971).
The approach and insights into systemic disadvantage across Scotland are discussed further in Chapter 6.
Note: Further elaboration of the assessment approach to both geographic and systemic disadvantage is provided where necessary throughout the report and in the supporting appendices.

Figure 2 Geographic aggregations – Local authorities, settlement types and city regions
Climate-related hazards – Present and future
Selected hazards
The 3rd Climate Change Risk Assessment (CCRA3) highlights increased climate-related risks across Scotland from a range of hazards (CCC, 2021). Flooding, increasing water scarcity and the degradation of the natural environment are all highlighted as important challenges. The European Environment Agency (EEA, 2017) also highlight higher temperatures and their association with poor air quality and other risks, such as wildfire, as important considerations.
Based on this evidence and review of available data, three selected priority climate-related hazards are assessed: flooding, heat stress, and air quality (with the rationale for their selection elaborated in Appendix 1). Both the associated present-day risks and how these may change in response to a 2oC rise in Global Mean Surface Temperature (GMST) by 2100 are assessed. In the case of flooding, a second higher, but plausible, 4oC rise in GMST is also considered (mirroring the scenarios used in UKCCRA3 future flood projections, Sayers et al., 2020). Information to support a similar analysis for heat and air quality given a 4oC climate future is not readily available and is excluded here.
Data sources and models
Table 1 sets out the data sources used, and processing undertaken, for each hazard. The approach necessarily varies across the selected hazards to reflect the availability of supporting datasets and previous analysis.
Adaptation assumptions
To explore future risk, it is assumed that flood-related adaptation continues as in the recent past (defined by the Current Level of Adaptation used within the CCRA3 flood projections, ibid) and that no further adaptation takes place to reduce heat or air quality risks (although it is noted that some aspects of adaptation are embedded in the UK Air Quality projections used here as input data). It is also assumed that the present-day socio-economic setting and related distributions (population, income etc) remains unchanged into the future.
|
Hazard |
Climate future* |
Climate data used |
Processing overview |
|
Flood | |||
|
Fluvial |
2oC, 4oC |
As used in UKCCRA3 – changes in future flows derived from UKCP18 Probabilistic Projections (in Sayers et al., 2020 based on Kay et al., 2020). |
Present-day and future flood hazard and associated risk are derived using the Future Flood Explorer (FFE, Sayers et al., 2020) taking account of climate change and a modification representation of Current Levels of Adaptation to better reflects existing flood defence standards in Scotland (as set out in UKCCRA3 modified to assume present-day coastal defence standards remain unchanged in urban areas). Note: The underlying information is based on the analysis undertaken for the UKCCRA3 (Sayers et al., 2020) that includes important caveats on variation in the accuracy of the underlying hazard mapping and important the location of the flood defence infrastructure and the ongoing programme of improvement. |
|
Coastal |
2oC, 4oC |
As used in UKCCRA3 – changes in relative Sea Level Rise (rSLR) from the UKCP18 Marine Report (Palmer et al., 2018) are used to provide an estimate of the change in coastal standards (in Sayers et al., 2020 based on Gouldby et al., 2017). | |
|
Surface water |
2oC, 4oC |
As used in UKCCRA3 – a pre-cursor to the 2.2km UKCP18 short duration rainfall projections (in Sayers et al., 2020 based Kendon et al., 2014 and Dale et al., 2017). | |
|
Air quality | |||
|
Particulate Matter (PM10) |
n/a |
Derived here using UK Air background concentrations developed for use in Local Air Quality Management assessments. These data are produced at a 1km resolution for the present-day (2018) through to 2030 with the latter taken as the future scenario for the purposes of this analysis (Figure 3). |
PM10 and NO2 are key pollutants influencing human health and regulated as such in associated regulatory frameworks. Severity is considered using a threshold approach to exposure based on the following thresholds: an annual mean air quality that exceeds 9.92 µg m3 PM10 and 9.21 µg m3 NO2 These thresholds represent the present-day (2018) average annual (mean) levels of PM10 and NO2 across Scotland. They are referred to as ‘poor air quality’ for the purposes of this report[4]. |
|
Nitrogen Dioxide (NO2, largely derived from burning fossil fuels) |
n/a | ||
|
Heat | |||
|
TMax – 95th percentile maximum temperature |
2oC Note: Equivalent data is not readily available for a 4oC |
Based on from 12km resolution UKCP18 outputs for the RCP8.5 scenario (Kennedy-Asser et al., 2021). The extreme heat measure is taken to be the average temperature for days exceeding the 95th percentile maximum temperature (TMax) for each 12km cell (Figure 4). Present-day refers to a 30-year period in the recent past (1990-2019). The future scenario refers to a 30-year period representing 2oC global warming*. |
Severity is considered using a threshold approach to exposure based on the following threshold: the mean temperature of days that exceed the present-day 95th percentile of the daily maximum summer temperature (TMax) averaged across Scotland (i.e., 21.6 °C). |
*Rise in Global Mean Surface Temperature (GMST)
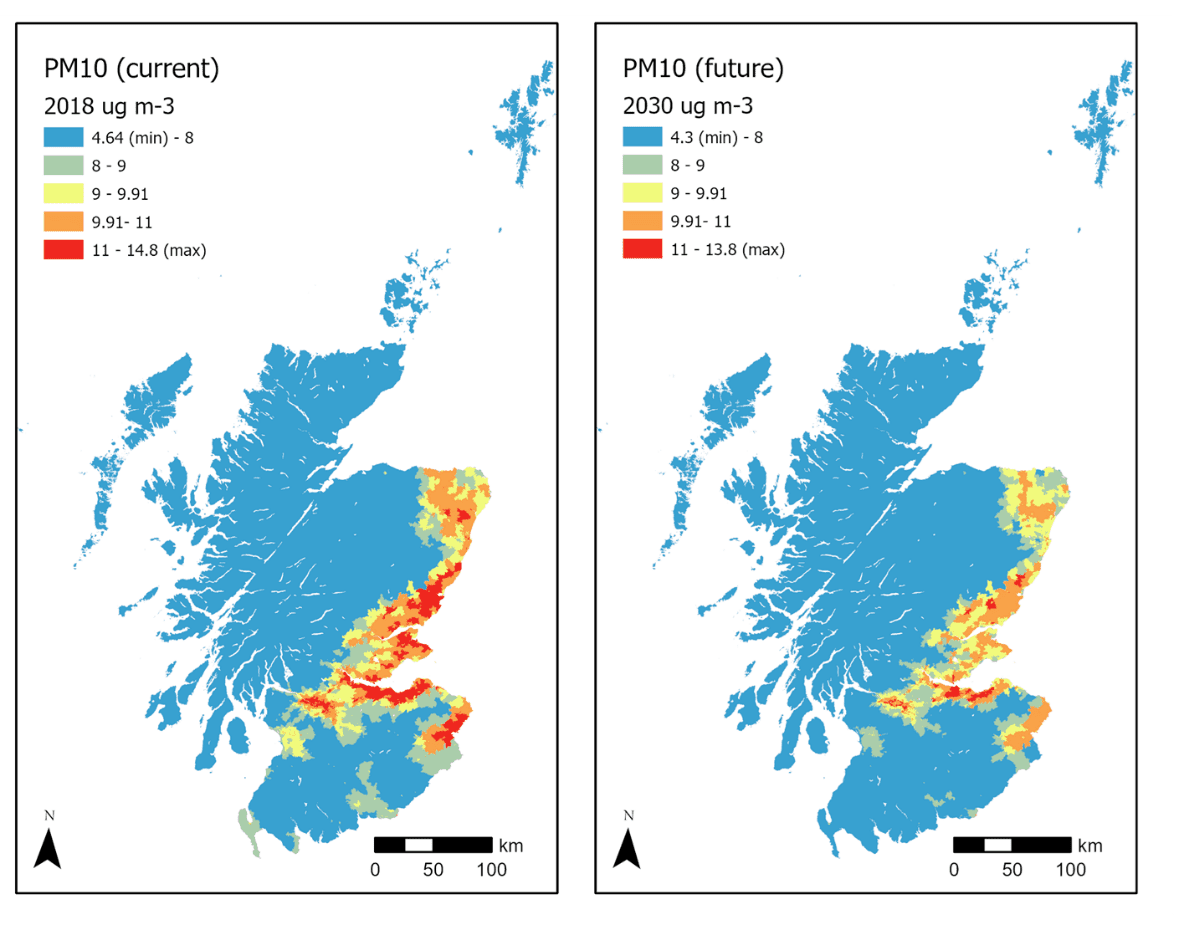
PM10 – Present and future (yellow, orange, and red indicate areas above the threshold of poor air quality used here)
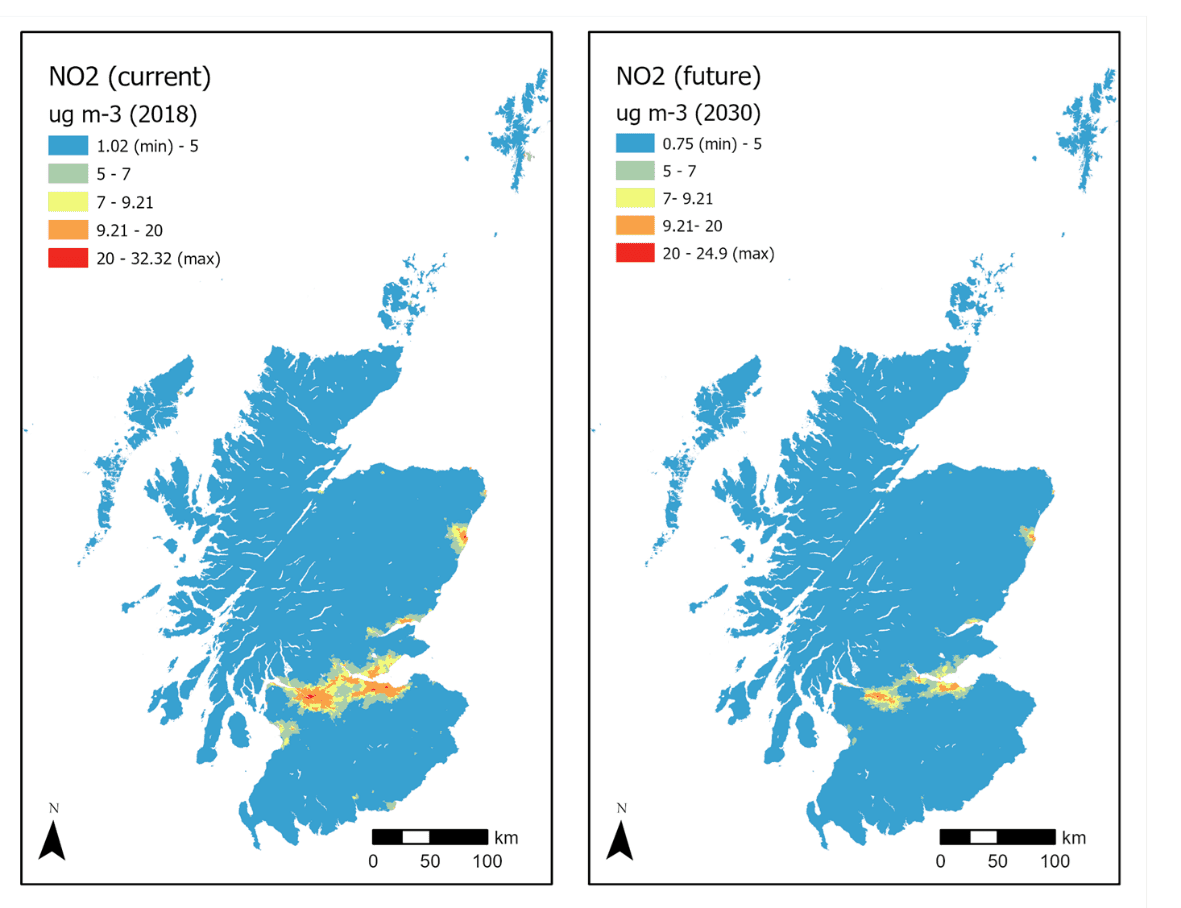
NO2 – Present and future (yellow, orange, and red indicate areas above the threshold of poor air quality used here)
Figure 3 Poor air quality – Present and future hazard
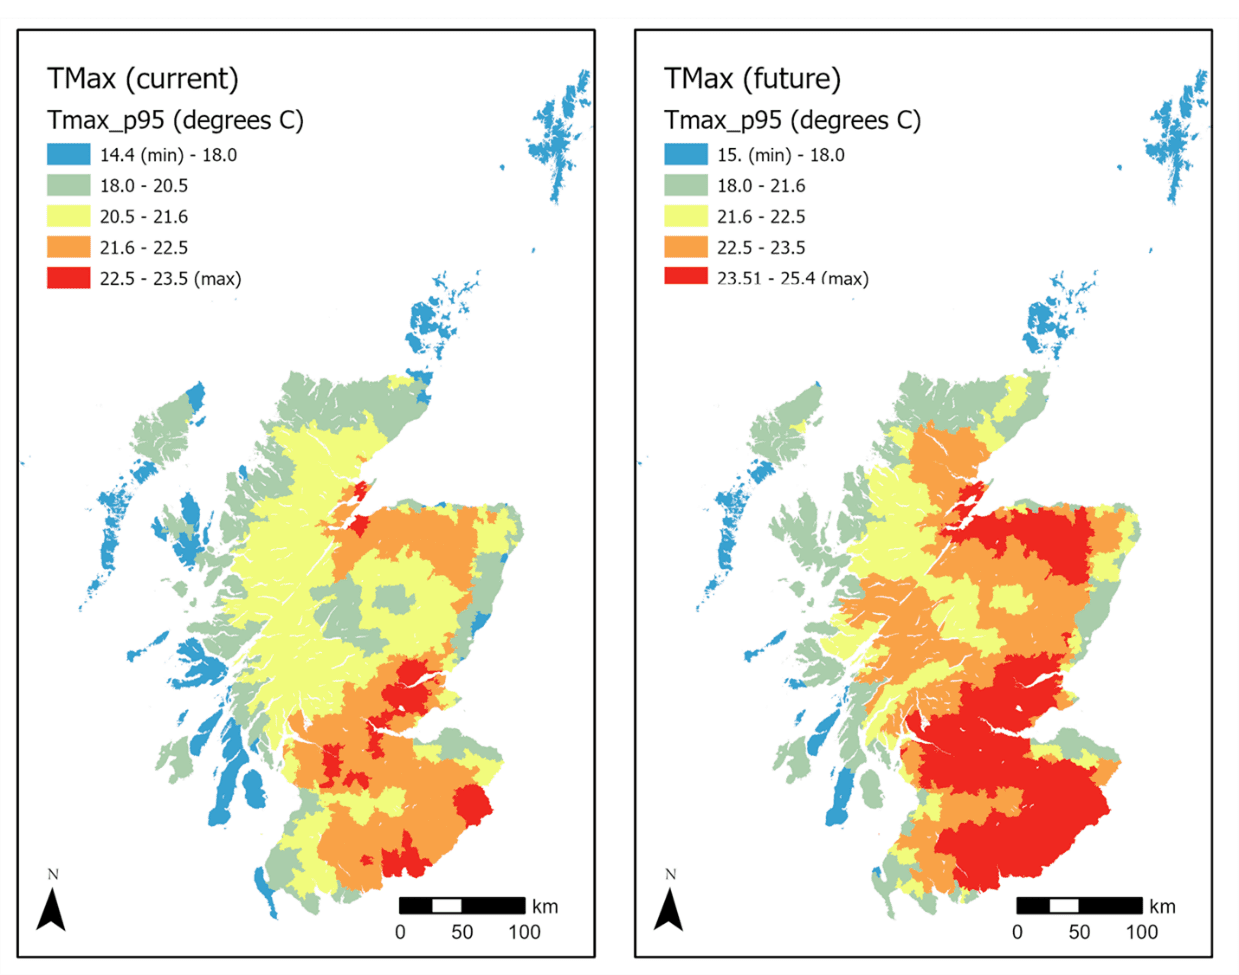 Left: Orange and red areas indicate areas above the threshold of high temperature used here
Right: Yellow, orange, and red indicate areas above the threshold of high temperature used here
Figure 4 High temperature – Present and future
Social vulnerability
What is social vulnerability?
Social vulnerability refers to characteristics of people and communities that determine their propensity for harm, irrespective of whether they are exposed to a hazard. Social vulnerability therefore reflects the specific characteristics of the people and communities in which they live that would – if they were to be exposed to a hazard – make them more or less likely to experience a negative welfare outcome.
There are many conceptualisations of social vulnerability and ways to consider who is vulnerable and why (e.g., Adger and Kelly, 1999; Tapsell et al., 2010; Lindley et al., 2011; Sayers et al., 2017, 2020). There is, however, general agreement that the most important characteristics relate to five domains:
- Susceptibility to harm – personal biophysical characteristics that lead to a differential (negative) impact on welfare given exposure to a hazard (e.g., older age groups and people with pre-existing ill-health).
- Ability to prepare – factors that may influence the degree to which people are able to prepare (e.g., access to insurance, income, and local knowledge).
- Ability to respond – factors that may influence the degree to which people are able to respond to a hazard event (e.g., income, personal mobility, and community networks).
- Ability to recover – factors that may influence how well people can recover from being exposed to a hazard event (e.g., income, insurance, housing mobility, and health service availability).
- Service access and community support – factors that may influence the help people are able to access when needed (e.g., GP services, help from neighbourhoods, access to online advice and support).
These domains underpin the three social vulnerability indices used here:
- Neighbourhood Flood Vulnerability Index (NFVI, Sayers et al., 2017)
- Neighbourhood (poor) Air Quality Vulnerability Index (NAQVI, defined here)
- Neighbourhood (high temperature) Heat Vulnerability Index (NHVI, defined here)
All three indices use multiple indicators at the scale of a ‘neighbourhood’ (defined by the census unit of a Data Zone, GI-SAT, 2011) to evaluate social vulnerability (Table 2). The selected indicators draw upon previous research (e.g., Lindley et al., 2011; Kazmierczak et al., 2015) and are combined to provide the three standardised social vulnerability indices across Scotland (Figure 5).
The rationale for the inclusion of each indicator is detailed in Appendix 2 together with the approach to calculating indices illustrated using the calculation of the NFVI.
| Group | Indicator | Heat | Air | Flood |
|
Age
|
Young Children |
🗸 |
🗸 |
🗸 |
|
Older Adults |
🗸 |
🗸 |
🗸 | |
|
Health
|
People in ill-health |
🗸 | ||
|
Households with members in ill-health |
🗸 | |||
|
Emergency hospital admissions |
🗸 |
🗸 | ||
|
Disability and ill-health |
🗸 |
🗸 | ||
|
Mood and Anxiety Disorders |
🗸 |
🗸 | ||
|
Medical and Care Residents |
🗸 |
🗸 | ||
|
Low birthweight |
🗸 |
🗸 | ||
|
Income
|
Unemployment |
🗸 | ||
|
Long-term unemployment |
🗸 | |||
|
Low-income occupations |
🗸 | |||
|
Households with dependent children and no employed adults |
🗸 | |||
|
Employment Deprivation |
🗸 |
🗸 | ||
|
Income Deprivation |
🗸 |
🗸 |
🗸 | |
|
Average Household Income |
🗸 |
🗸 | ||
|
Information Use |
Recent Arrivals to the UK |
🗸 | ||
|
English Proficiency |
🗸 |
🗸 |
🗸 | |
|
Internet
|
Sub-standard Broadband |
🗸 |
🗸 | |
|
Lack of Superfast Broadband |
🗸 |
🗸 | ||
|
Local knowledge
|
Population Transience |
🗸 |
🗸 | |
|
New Migrants from outside the local area |
🗸 | |||
|
Tenure
|
Social renting |
🗸 |
🗸 |
🗸 |
|
Private renting |
🗸 |
🗸 |
🗸 | |
|
Direct Flood Experience |
Households exposed to significant flood risk |
🗸 | ||
|
Crime |
Crime rates |
🗸 |
🗸 |
🗸 |
|
Mobility
|
Disability |
🗸 | ||
|
Disability and Ill-health |
🗸 |
🗸 | ||
|
Medical and Care Residents |
🗸 |
🗸 |
🗸 | |
|
Private Transport ownership |
🗸 |
🗸 |
🗸 | |
|
Accessibility by bus |
🗸 |
🗸 | ||
|
Social networks
|
Single Pensioner Households |
🗸 |
🗸 |
🗸 |
|
Primary School networks |
🗸 |
🗸 |
🗸 | |
|
Civil Organizations |
🗸 |
🗸 | ||
|
Single Adult Households |
🗸 |
🗸 | ||
|
Lone Parent Households with dependent children |
🗸 | |||
|
Health service access
|
Accessibility of Pharmacies |
🗸 |
🗸 | |
|
Accessibility of Hospitals |
🗸 |
🗸 | ||
|
Travel time to GP surgery (private transport) |
🗸 |
🗸 | ||
|
Travel time to GP surgery (public transport) |
🗸 |
🗸 | ||
|
Service Availability |
Emergency services exposed to flooding |
🗸 | ||
|
Care homes exposed to flooding |
🗸 | |||
|
GP surgeries exposed to flooding |
🗸 | |||
|
Schools exposed to flooding |
🗸 | |||
|
Indoor pollution sources |
Smoking Behaviour |
🗸 | ||
|
Indoor sources |
🗸 | |||
|
Housing Characteristics |
Caravan, mobile or temporary structures in all households |
🗸 |
🗸 |
🗸 |
|
Overcrowding |
🗸 | |||
|
High Rise Flat indicator |
🗸 | |||
|
Urban cover |
🗸 | |||
|
Lack of Private Greenspace |
🗸 | |||
|
Lack of Community Greenspace |
🗸 |
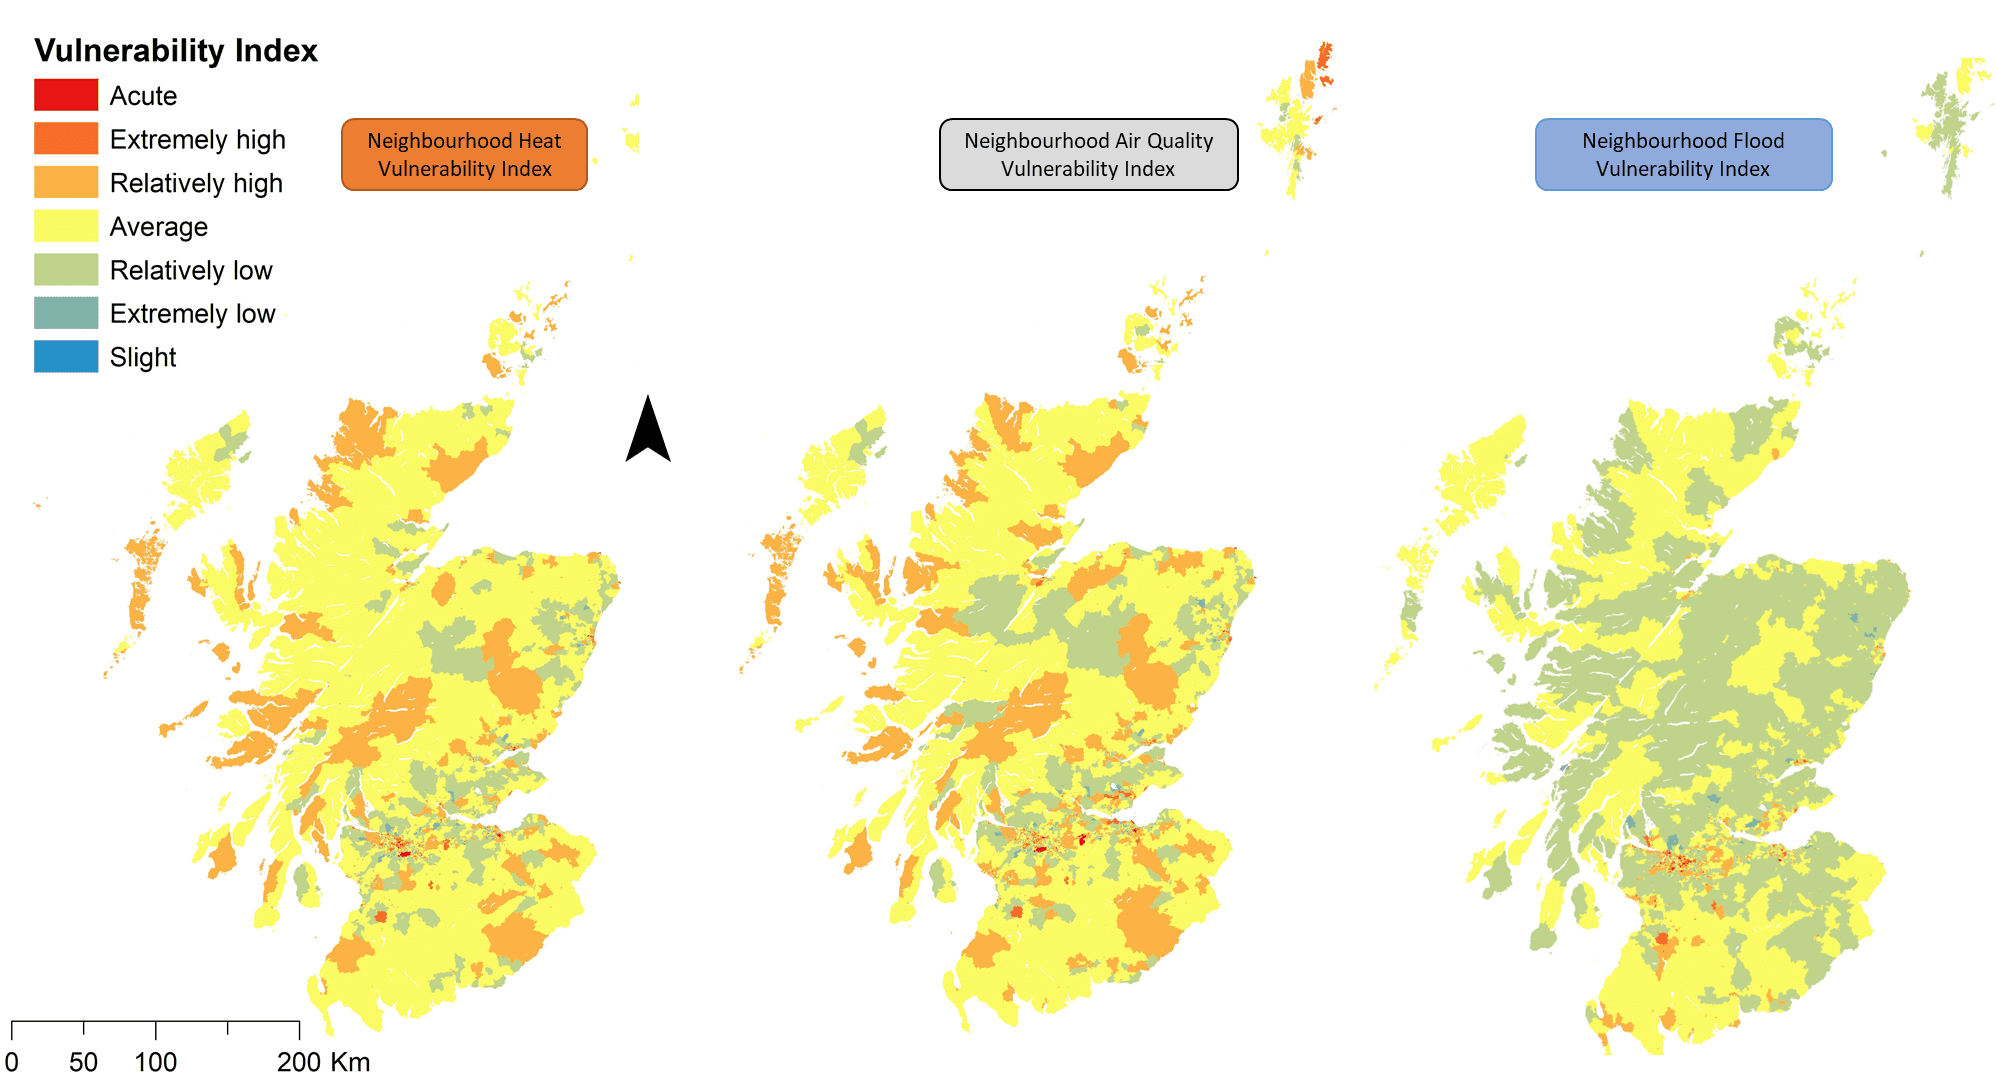
Figure 5 Indices of social vulnerability across Scotland: Heat, air quality, and flooding
Drivers of social vulnerability
Social vulnerability varies across Scotland. These include low income, ill-health, property tenure (particularly social housing) and a lack of local knowledge (either due to issues of language or relatively poor internet access) as well as biophysical sensitivities due to household composition (physical mobility, younger children, and older adults). Consequently, many of the neighbourhoods most socially vulnerable to one hazard are also inherently vulnerable to the others. The relative importance of these common factors that influence social vulnerability to each hazard, as well as hazard specific influences, are discussed below.
Flooding – Neighbourhood Flood Vulnerability Index
Poor health, income deprivation, and limited mobility are dominant contributors to social vulnerability to flooding across all settlement types (Figure 6). Income affects the extent to which people can prepare for, respond to, and recover from events (including their ability to purchase household insurance, make property adaptations or have autonomy over other aspects of adaptation). Restricted personal mobility and transport make it difficult to deploy household level adaptations (e.g., flood gates, move personal items or respond to post-flood challenges, such as find alternative accommodation or access services). In remote and rural areas, social and physical isolation also have a strong influence on social vulnerability. The most socially vulnerable neighbourhoods, particularly in very remote rural areas, also tend to experience low mobility (linked to indicators of physical disability, residential care, and private transport availability) and are more likely than others to have local services (e.g., GP practices and hospitals) affected by flooding and may have more limited social networks to draw upon (e.g., as suggested by higher number of single person households).
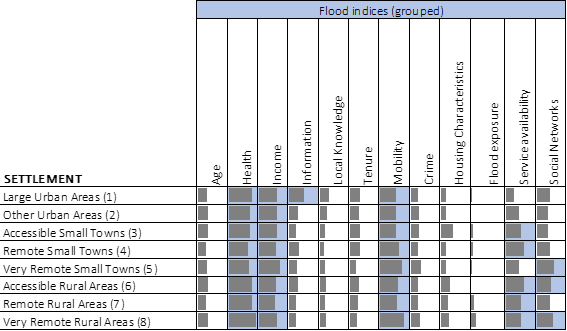
Bars show the relative contribution to the overall index of social vulnerability. Highlighted cells show the grouped indicators with greatest influence on social vulnerability for each settlement type.
Figure 6 Relative contributions to the Neighbourhood Flood Vulnerability Index
Poor air quality – Neighbourhood Air Quality Vulnerability Index
Biophysical drivers of social vulnerability (e.g., age, including younger children and older adults, as well as underlying health conditions) are important influences across Scotland (although are particularly influential in smaller towns and remote rural areas). These combine with income deprivation, lack of local knowledge (relating to pollution), and the presence of indoor air pollution sources that exacerbate the risk (e.g., parental smoking and household fuel types) to be the dominant drivers of social vulnerability to poor air quality across Scotland (Figure 7). In combination these issues both increase the potential to experience harm when exposed to poor air quality and reduce the capacity of households to adapt to poor air quality during an event and in the longer term.
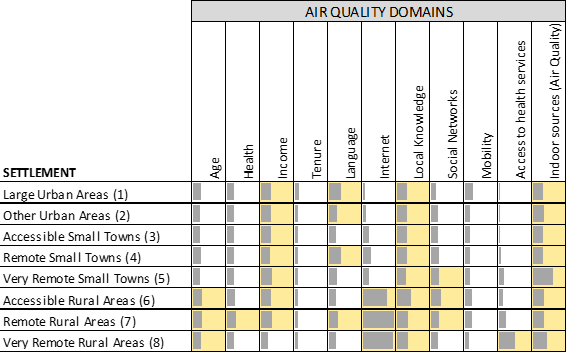
Bars show the relative contribution to the overall index of social vulnerability. Highlighted cells show the grouped indicators with greatest influence on social vulnerability for each settlement type.
Figure 7 Air quality – Relative contributions of social vulnerability
Beyond these nation-wide patterns, in rural and more remote areas poor internet availability further undermines adaptive capacity (limiting access to online information and health services as well as access warnings and support). Consequently, accessible rural areas, remote rural areas and very remote rural areas tend to higher social vulnerability than elsewhere due to lower adaptative capacity driven by relatively poor communications. Rural communities also tend to exhibit an increased prevalence of indoor sources of pollution that further increase inherent vulnerability to poor air quality. In remote towns and remote rural areas more limited English proficiency is also an influential factor in determining the overall level of social vulnerability. Within large urban areas and other urban areas social vulnerability is driven by issues of income, language, and local knowledge. The adaptive capacity of households in these communities tends to be limited due to poor access to information (e.g., reflecting limited internet connectivity) that in turn restricts awareness of potential problems as well as income.
High temperature – Neighbourhood Heat Vulnerability Index
Similar indicators increase social vulnerability as reported for air quality and flooding, particularly income and local knowledge (Figure 8). These drivers combine to undermine adaptive capacity by limiting the available resources to adapt their homes, accessing information about the dangers of excess heat in their homes, and accessing help during heatwaves.
In rural and remote areas, factors associated with biophysical drivers (relating to health and age) are also important influences on social vulnerability. As with air quality, the ability to access information through online sources tends to be more difficult. Difficulties in accessing health services is a particularly influential driver in very remote rural areas (although such areas are less likely to experience high temperatures, residents will be less well adapted to heat-wave events when very extreme events do occur).

Bars show the relative contributions to the overall index of social vulnerability. Highlighted cells show the domains with greatest influence on the vulnerability index for each settlement type.
Figure 8 Heat indicators – Relative contributions to social vulnerability
Variation in social vulnerability across Scotland
By Local authority
Social vulnerability varies between Local Authorities (Figure 9). The social character of some Local Authorities, including West Dunbartonshire, Glasgow City, and Dundee City, leads to high levels of social vulnerability to all hazards. This reflects the many challenges these Local Authorities face in addressing underlying social issues (such as income and information access that are important drivers of social vulnerability across all hazards). Subtle differences in the drivers of social vulnerability to each hazard are evident in some locations. For example, East Ayrshire exhibits a particular social vulnerability to flooding (as represented through the NFVI), whereas in Argyll and Bute, for example, social vulnerability to heat and air quality is dominant.

Positive values indicate greater social vulnerability compared to the average across Scotland. Data are averages (means) for each local authority.
Figure 9 Social vulnerability indices by Local Authority
By settlement type
Social vulnerability to all three selected hazards (flood, poor air quality and heat) is greatest in large urban areas, remote small towns, and very remote small towns (Figure 10). The underlying social vulnerability to poor air quality and heat are typically higher in more rural areas than the equivalent vulnerability to flooding. In part this reflects the important influence of internet access within the assessment of social vulnerability to poor air quality and high temperatures that is typically more limited in rural areas (an influence not explicitly included as part of the social vulnerability to flooding, see table 2.

A positive value indicates the social vulnerability is greater than the national average. A negative value indicates social vulnerability is less than the national average. All data are means.
Figure 10 Social vulnerability by settlement type: Flood, heat, and air quality
Geographic disadvantage
What is geographic disadvantage
Geographic disadvantage considers the combination of social vulnerability (from Chapter 3) and exposure to a hazard (i.e., high temperatures, poor air quality or flooding). How exposure to a hazard and social vulnerability combine determines the related social risk. Those neighbourhoods with the greatest risk are at greatest geographic disadvantage.
Geographic flood disadvantage
By flood source
Across Scotland fluvial flood risks are dominant today (~2018) and remain so in the future. Surface water flood risks and coastal flood risks are projected to increase more rapidly than fluvial risks and hence make a larger contribution to the national risk by 2080s (in terms of Expected Annual Damage, EAD)[5]. This is particularly the case given a 2oC climate future (Figure 11).

EAD is based on residential direct damage
Figure 11 Flood – Expected Annual Damage by flood source – all neighbourhoods
By Local Authority
Flood risk (as expressed by EAD) varies significantly across the Local Authorities, with Glasgow City, and Dumfries and Galloway experiencing the greatest risk today (~2018) and in the future (Figure 12). EAD is based on residential direct damage
As sown in Figure 12 the influence of climate change varies, with some Local Authorities experiencing more significant increases in flood risk than others. In Dundee City, Orkney Islands, North Lanarkshire, and Inverclyde, for example, the present-day flood risk is projected to double by the 2080s given a 4oC climate future. In some locations the influence of climate change on flood risk is much less; in South Ayrshire, Perth and Kinross, and East Renfrewshire, for example, the projected increase is around 30%.

EAD is based on residential direct damage
Figure 12 Flood – Flood – Expected Annual Damage by Local Authority – All neighbourhoods
By settlement type
Flood risk (as expressed by EAD) varies across the eight settlement types. Most of the national flood risk is generated within urban areas (large urban areas and other urban areas) – Figure 13. This is as expected given the large number of people living within the major, low-lying, estuaries of Scotland. Accessible rural areas are also significant in the context of the national flood risk profile. This is less intuitive and may in part reflect the greater uncertainty in underlying understanding of flood hazards in rural settings (including less information on the location and standard of flood defences). At an aggregated scale however, this insight is considered a credible finding.

EAD is based on residential direct damage
Figure 13 Flood – Expected Annual Damage by settlement type – all neighbourhoods
A focus on EAD can be misleading in terms of understanding how the risk is distributed at an individual scale. This is because some settlement types represent a much higher number of people than others. The metric of Expected Annual Damage: Individual (EADi, as defined in Sayers et al, 2017) provides an insight into the risk experienced by individuals (Figure 14). The EADi is calculated by dividing the EAD by the exposed population and highlights that those individuals living in smaller towns (accessible small towns) and rural areas (all categories) are, on average, subject to greater levels economic risk that those living in urban areas.

EADi is based on EAD residential direct damage normalised by population
Figure 14 Flood – Expected Annual Damage: Individual by settlement type – all neighbourhoods
By ethnicity
Present-day risk experienced by each ethnic group is similar, although black ethnic groups experience slightly higher flood risk today (when expressed by EADi) than all others (on average). In the future, given climate change, this broad pattern remains, however the risks faced by black, Asian, and Other minority groups are projected to increase more rapidly than for others (Figure 15). This tends to reflect the concentration of these ethnic groups in urban settlements most exposed to increases in flood hazard as the climate changes.

EADi is based on EAD residential direct damage normalised by population across Scotland
Figure 15 Flood – Expected Annual Damage: Individual – By ethnicity
Geographic air quality disadvantage
In general, poor air quality associated with NO2 is principally limited to larger urban areas although there is a stronger regional component for PM10 (Figure 3). As efforts are made to reduce emissions, air quality is projected to improve from present-day levels by 2030 in terms of both PM10 and NO2 (although the broad spatial pattern of concentrations remains largely unchanged). Consequently, there is a corresponding projected reduction in the proportion of neighbourhoods across Scotland exposed to above threshold concentrations of PM10 (falling from 57% in 2018 to 31% in the future) and of NO2 (from 46% to 14%).
This national scale perspective masks the significant variation in disadvantage across Scotland, as illustrated by Figure 16. This figure presents the spatial pattern of disadvantage by combining the Neighbourhood Air Quality Vulnerability Index (Figure 5) with the air quality hazard (Figure 3). Areas marked as extremely high or acute are of particular interest as these locations are within the 20% most disadvantaged across Scotland. The reason for this may be because:
- High social vulnerability levels combine with high concentration levels
- Lower social vulnerability levels combine with very high concentrations
- Lower concentrations combine with very high social vulnerability levels
These issues are considered further below from the perspective of Local Authorities, different settlement types and ethnic groups below.
By Local Authority
Glasgow City experiences the highest level of disadvantage associated with below average air quality, with over half of its neighbourhoods within the 20% most disadvantaged neighbourhoods today and in the future (Figure 18). Similarly, a high proportion of their neighbourhoods within the cities of Edinburgh and Dundee are within the 20% most disadvantaged in terms of below average air quality across Scotland. The principal pollutant of concern is not the same in all Local Authorities. In Mid Lothian and East Lothian, below average air quality is driven largely by PM10 and less so NO2. In Aberdeen, the opposite occurs, with high levels of disadvantage more associated with NO2.

Figure 16 Air quality – Future (2030s) – Social disadvantage. Left: PM10 –future; Right: NO2 –future. In both yellow indicates the Scottish average, i.e., areas where the combination of relative social vulnerability and relative air quality balance out at around average overall. Present-day distributions are similar and not shown here

A neighbourhood is defined at ‘significant risk’ if it is within the 20% most disadvantaged neighbourhoods across Scotland
Figure 17 Air quality – Local Authority
By settlement type
Much of Scotland is sparsely populated with good air quality (according to the threshold values set out earlier in Table 1). Exposure to below average air quality tends to be associated with urban areas (Figure 18). This is particularly evident for NO2 and, of course, is unsurprising. This basic narrative, however, masks two more subtle insights that highlight the present-day regional influence of PM10 pollution in accessible small towns and rural areas and that the air quality hazard is projected to significantly improve in urban settings (but this relies upon significant reduction in emissions).
By ethnicity
There is a stark variation in exposure to below average air quality (defined by the threshold values set out earlier in Table 1) across different ethnic groups (Figure 19). There is also a marked disproportionality in who benefits most from the projected improvements in future air quality. For PM10, for example, non-white ethnic groups are much more likely to experience below average PM10. This is especially true for the black ethnic group since there are five times as many black people living in neighbourhoods with above average PM10 concentrations compared to below average PM10 concentrations. Indeed, the black, and the ‘other’ non-white ethnic groups are the only groups who are still more likely to be exposed to above present-day average PM10 concentrations than not by 2030. A similar pattern holds for NO2 with the black, Asian, and other non-white ethnic groups all being more than three times as likely to be exposed to above average NO2 concentrations compared to below average NO2 in the present-day. By 2030, people in non-white ethnic groups are still more likely to be exposed to NO2 concentrations above the present-day average than people in the white ethnic group.

A value of 1.0 indicates a 1:1 ratio, i.e., an equal number of people exposed to above and below threshold of present-day average air quality (Table 1) today and in the future in the specified settlement type. Values greater than 1 indicate that a larger proportion of people living in the given settlement type are exposed to above threshold conditions compared to below threshold conditions.
Figure 18 Exposure to below average air quality – By settlement type

A value of 1.0 indicates a 1:1 ratio, i.e., an equal number of people exposed to above and below threshold of present-day average air quality (Table 1) today and in the future in the specified ethnic group. Values greater than 1 indicate that a larger proportion of people in the given ethnic group are exposed to above threshold conditions compared to below threshold conditions.
Figure 19 Exposure to below average air quality – By ethnic group
Geographic heat disadvantage
Much of the south and east of Scotland (away from the cooler coastal fringe) is projected to experience a considerable rise in high temperatures relative to the present-day average (Figure 4). Combining this pattern of exposure with information on social vulnerability provides an assessment of disadvantage (Figure 20). The distributions of disadvantage by Local Authorities, settlement types and ethnicities are discussed below.
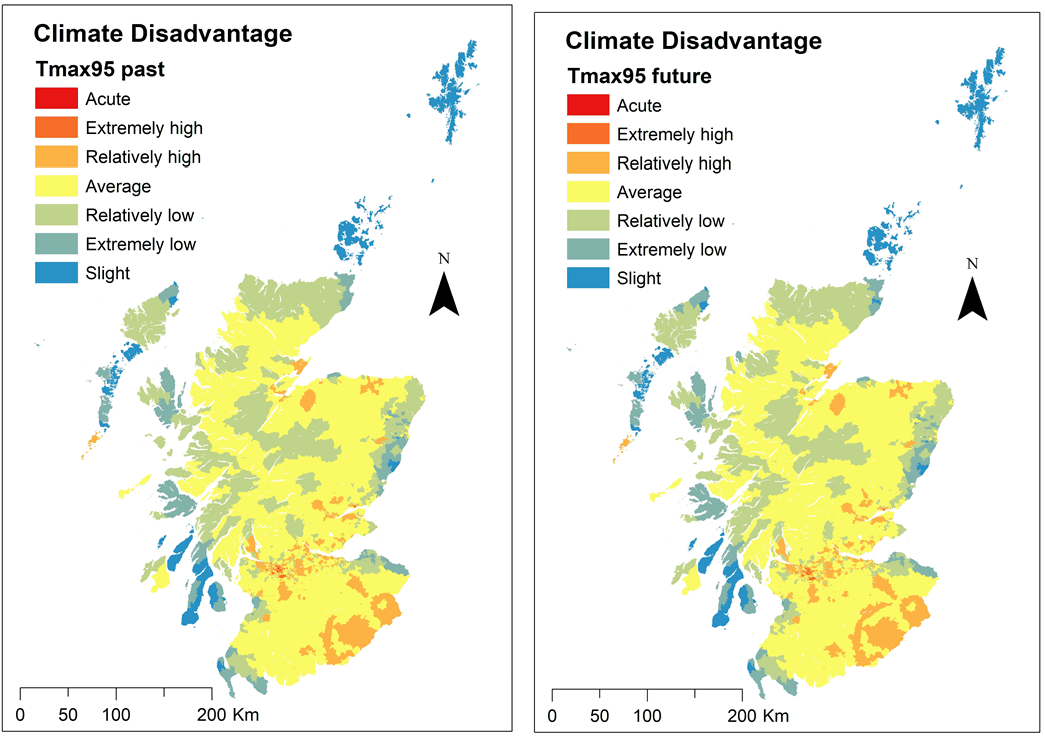
Figure 20 Heat – Future (2oC 2030s) – Social disadvantage
By local authority
All but 16% of Glasgow City’s neighbourhoods fall within the top 20% most heat disadvantaged neighbourhoods in Scotland, with East Renfrewshire, Falkirk and Dundee City also already experiencing significant heat disadvantage (Table 2). In general, most Local Authorities with significant disadvantage today continue to experience similar risks in the future. There are however some variations. Across Falkirk, for example, relative social risk from heat is projected to reduce in the future, whereas elsewhere increases are projected (e.g., in Scottish Borders and Dundee City). This takes account of changes in relative patterns of warming (Figure 21).

A neighbourhood is defined at ‘significant risk’ if it is within the 20% most disadvantaged neighbourhoods across Scotland. Local authorities with less than 1% of neighbourhoods at significant risk are excluded from the chart.
Figure 21 High temperature – Local Authority
By settlement type
Heat disadvantage is currently largely confined to urban areas (Figure 22). The present-day disadvantage is projected to increase and extend to influence more rural settings. The projected increase is significant across all settlement types (including a fourfold increase in the population exposed to above average maximum temperatures in Other Urban areas by 2030s).

A value of 1.0 indicates a 1:1 ratio, i.e., an equal number of people exposed to above and below threshold of present-day average high temperatures (defined by Tmax95) today and in the future in the specified settlement type. Values greater than 1 indicate that a larger proportion of people living in the given settlement type are exposed to above threshold conditions compared to below threshold conditions.
Figure 22 Exposure to above threshold high temperature – By settlement type
By ethnicity
The projected increase in exposure to extreme heat varies considerably between ethnic groups (Figure 23). Given a 2oC rise in GMST and assuming no change in population distribution, the analysis suggests that people in the Asian ethnic group are almost eight times as likely, and black groups more than nine times as likely, to live in neighbourhoods where temperature extremes are above the present-day Scottish average (as defined by the Tmax95) compared to below the present-day Scottish average.

A value of 1.0 indicates a 1:1 ratio, i.e., an equal number of people exposed to above and below threshold of present-day average high temperatures (defined by Tmax95) today and in the future in the specified ethnic group. Values greater than 1 indicate that a larger proportion of people in the given ethnic group are exposed to above threshold conditions compared to below threshold conditions. The threshold for comparison is an average (mean) temperature for Scotland (Table 1). This national value is compared against respective local averages per neighbourhood to determine whether the neighbourhood’s population is exposed or not. Given the resolution of temperature data used and tendency for warmer areas to be more populated all values are greater than 1.
Figure 23 Heat – Exposure to above average maximum temperatures – By ethnic group
Systemic Disadvantage
What is systemic disadvantage?
Systemic disadvantage arises when the risks faced by the most socially vulnerable are greater than those experienced by others.
Systemic flood disadvantage
Systemic flood disadvantaged is explored by comparing the risks faced by all neighbourhoods with those faced by the 20% most socially vulnerable neighbourhoods (as defined by the NFVI) within a given grouping (i.e., those exposed to the same flood source, living within the same settlement type, or from the same ethnic group).
By flood source
Across Scotland the present-day Expected Annual Damage experienced by an individual (EADi) living within the 20% most socially vulnerable neighbourhoods is, on average, similar in the case of surface water flooding and slightly less in the case of fluvial and coastal flooding (Figure 24). Given climate change, surface water and coastal flood risks increase similarly for the less and most socially vulnerable (in both a 2oC and 4oC future). Fluvial flood risk, however, is projected to increase more rapidly for the most socially vulnerable than for others given a 4oC climate future. The reason for this is difficult to determine (given the scope here) but highlights the importance understanding flood source-specific issues in supporting a just transition.

EADi based on EAD residential direct damage normalised by population
Figure 24 Flood – Systemic disadvantage in Expected Annual Damage: Individual by source
By settlement type and city regions
Flood risk (as defined by the EADi) experienced by those living in the 20% most socially vulnerable neighbourhoods varies markedly across the eight settlement types, with the most socially vulnerable living in remote and very remote small towns, accessible rural areas as well as other urban areas experiencing significantly higher risk than the average (Figure 25Figure 25).
The city of Glasgow and Dundee are important cites in Scotland with contrasting contributions to the national flood risk profile of Scotland; with the Expected Annual Damages from flooding greater in Glasgow than any other Local Authority whilst in Dundee flood damages are much less. This simple narrative fails to capture differences in the number of people exposed to flooding (with Glasgow having many more people exposed to flooding than Dundee) and provides no insight to how the risks are distributed between the most and less socially vulnerable. In both cities, when normalised by the exposed population, the most socially vulnerable experience greater risk than the less socially vulnerable and higher than average risk compared to the most socially vulnerable neighbourhoods across Scotland (as defined by EADi, Figure 26). When income, property tenure, and the likely access to insurance is considered (using the metric of Relative Economic Pain, REP, Sayers et al., 2017)[6] the significant disadvantage experienced by the most socially vulnerable in Dundee (and to a lesser extent Glasgow) is clear (Figure 27). This is likely to reflect the combined influences of low income, and social and private rented accommodation; both of which are considered important barriers to insurance (as reported by Flood Re, Sayers et al., 2020).
EADi based on EAD residential direct damage normalised by population across Scotland
Figure 25 Flood – Systematic disadvantage – By Settlement type

EADi based on EAD residential direct damage normalised by population
Figure 26 Flood – Systematic disadvantage (EADi) – Glasgow and Dundee city regions

Relative Economic Pain (REP) expresses the ratio between uninsured economic damages and household income
Figure 27 Flood – Systematic disadvantage (REP) – Glasgow and Dundee city regions
By ethnicity
Flood risk varies significantly across the five ethnic groups considered. As discussed earlier, black ethnic groups regardless of social vulnerability, on average, experience much higher levels of risk compared to others (Figure 15). This disproportionality is underlined when considered from the perspective of Relative Economic Pain (REP). As shown in Figure 28, the REP associated with present day flood risk is around 1.8 times higher within the black ethnic groups compared to the national average. This increases to 3.6 times by the 2080s given a 4oC climate future (much higher than for any other ethnic group). When comparing the risks faced by the most socially vulnerable within each ethnic group, the most socially vulnerable white groups are most disadvantaged, experiencing a REP of flooding similar to, or greater than, the average for white ethnic groups (Figure 28). The broader social and economic drivers for these issues are difficult to determine but reflect similar issues within the analysis here. For example, both black and the most socially vulnerable white groups are more likely than others to be living in socially rented accommodation and (Figure 29a) and within these two groups household incomes are also more likely to be constrained (Figure 29b). These findings indicate greater inequalities amongst white ethnic groups compared to others around both household incomes and household tenure. These influences lead to both black groups and the most socially vulnerable white groups experiencing higher levels of REP (from flooding) compared to others.
Note:
As introduced earlier the social vulnerability of each neighbourhood is independent of ethnicity. The systemic disadvantage within each ethnic group has therefore been determined as follows:
- The number of people from each ethnic group within each neighbourhood is determined based on published proportions at the neighbourhood scale.
- The number of people from each ethnic group living within the 20% most socially vulnerable neighbourhoods is then summed.
- The proportion of people from each ethnic group living with the 20% most socially vulnerable neighbourhoods is then determined.
- The various metrics (EADi, REP etc) for each ethnic group, including those living in 20% most socially vulnerable neighbourhoods and for all neighbourhoods are then determined.

A value of one indicates the Relative Economic Pain (REP) is equal to the present-day national average in Scotland. A value greater than one indicates the REP is higher than the present-day average by the given factor (i.e., a value of 1.5 indicators the REP is 1.5 times the present-day value).
Figure 28 Flood – Relative Economic Pain – By ethnicity

Distribution of tenure – Percentage of households living in social rented accommodation

Distribution of income (social renters) – Percentage of national average
Figure 29 Ethnicity – Income and tenure distribution
Systemic air quality disadvantage
Systemic disadvantage associated with air quality is explored by comparing the ratio of people facing above average concentrations of PM10 and NO2 compared to below average concentrations, using 2018 as a baseline. The assessment compares ratios for all neighbourhoods to those in the 20% most socially vulnerable neighbourhoods (defined using the Neighbourhood Air Quality Vulnerability Index – NAQVI) and grouped by settlement type.
Today, people living in large urban areas are six times more likely to be exposed to above average rather than below average concentrations of PM10, and eight times more likely for NO2. However, the most socially vulnerable neighbourhoods within large urban areas are much more likely to experience above average poor air quality, being nearly 10 and 13 times more likely for PM10 and NO2 respectively, i.e., compared to the population as a whole living in that settlement type (Figure 30). There is also a particular tendency for the most socially vulnerable neighbourhoods to experience higher pollutant concentrations in other urban areas (for NO2) and accessible small towns (for PM10) (Figure 31).
Elsewhere, the most socially vulnerable are generally less likely to be exposed to above mean concentrations compared to the population as a whole living in that settlement type, or there is very little difference. In rural areas, air quality is generally very good (and is expected to be even better in the future – Figure 18). In all rural areas, it is therefore more likely that people are exposed to concentrations which are below the Scottish mean rather than above it.
In the future, far fewer people are estimated to be exposed to concentrations above present-day averages. Nevertheless, future air quality improvements are expected to be less marked for the most socially vulnerable in large urban areas (for PM10 and NO2) and accessible small towns (for PM10) compared to the population as a whole living in these settlement types.

The y-axis shows the ratio of people expected to be exposed to above vs. below average concentrations of PM10 and NO2 using 2018 as the baseline. A value of 1 represents no difference, i.e., the same number of people for above vs. below.
Figure 30 Air Quality – Exposure to below average air pollutant concentrations – By settlement type

The y-axis shows the mean concentrations of PM10 and NO2. This is expressed as a mean of all neighbourhoods associated with each of the settlement types.
Figure 31 Mean air quality of all and top 20% most vulnerable by settlement type
Systemic heat disadvantage
Across Scotland, the most socially vulnerable neighbourhoods are disproportionately exposed to high temperatures (Figure 32). This is particularly the case in large urban areas, remote small towns, and accessible rural areas (Figure 33). In very remote small towns and very remote rural areas the reverse is true. This is because social vulnerability in these settlement types is strongly influenced by isolation-related factors (such as low accessibility of health services and poor internet) and isolated, more rural areas tend to have lower temperatures and lower temperature extremes. Currently the most socially vulnerable neighbourhoods in large urban areas are much more likely than not to be exposed to above average high temperatures (Figure 34). This is also true under the 2oC scenario; however, the most marked finding is that almost all socially vulnerable neighbourhoods in accessible rural areas are expected to experience above average high temperatures in the future relative to the present-day high temperature threshold. Similar patterns are seen in remote small towns and remote rural areas. In contrast, other urban areas and accessible small towns are expected to see a general trend towards higher numbers of people in less vulnerable neighbourhoods becoming exposed to temperatures exceeding the present-day high temperature average relative to the most socially vulnerable in the same settlement type.

Figure 32 Comparison of exposure of most socially vulnerable neighbourhoods
The y-axis shows the mean temperature for days exceeding the 95th percentile maximum temperature (TMax). This is expressed as a mean of all neighbourhoods associated with each of the settlement types. Modelled temperatures are averaged over large areas (see Table 1) so are expected to under-estimate elevated temperatures due to factors like Urban Heat Island intensity.

Figure 33 High temperatures of all and top 20% most vulnerable by settlement type

The y-axis shows the ratio of people expected to be exposed to above vs. below average high temperatures, i.e., for days exceeding the 95th percentile maximum temperature (TMax), using the present-day (1990-2019) as the baseline. The 1:1 line represents no difference, i.e., the same number of people for above vs. below. This accounts for the total number of people living in all neighbourhoods associated with each of the settlement types.
Figure 34 Heat – Exposure to worse than average high temperatures – By settlement type
Conclusions
The analysis presented provides evidence to support the development of more targeted approaches to delivering a just transition and improving resilience to climate change across Scotland. The analysis selects three climate related hazards (flooding, heat, and poor air quality) and for each explores three research questions:
- What are the drivers of social vulnerability to climate hazards across Scotland?
- Which groups are at the greatest social risk from climate related hazards, now and in the future?
- To what extent are the most socially vulnerable disproportionately impacted by climate-related hazards?
The rationale for the selected climate-related hazards and the conclusions from the research are summarised below.
Drivers of social vulnerability
Across Scotland, low income and poor heath are key drivers of social vulnerability. Income is important because of the potential for reducing adaptive capacity (including how well people can prepare for, respond to, and recover from exposure to potentially harmful hazards). People in poor health are more susceptible to further heath impacts when exposed to a climate-related hazard. For example, exposure to flooding can make pre-existing conditions worse or make treatment difficult due to power cuts. Some pre-existing conditions (or the medicine used to treat them) may make people more sensitive to the effects of air pollution and high temperatures (e.g., dehydration, ability to sweat and exacerbate symptoms such as cardiovascular disease).
Social vulnerability has various drivers across Scotland. Low income, ill-health, property tenure (particularly social housing) and a lack of local knowledge (either due to issues of language or relatively poor internet access) as well as biophysical sensitivities due to household composition (physical mobility, younger children, and older adults) influence vulnerability to all three hazards. Consequently, many of the neighbourhoods most socially vulnerable to one hazard are also often vulnerable to the others.
#Finding-1 Key drivers of social vulnerability are associated with vulnerability to climate-related hazards across Scotland
Low income and poor health are strong drivers of social vulnerability to all three selected climate-related hazards (flooding, high temperature and poor air quality). Both tend to be associated with neighbourhoods with a high proportion of people living in rented accommodation, particularly social housing. A lack of local knowledge and biophysical sensitivities, such as reduced physical mobility, younger children, or older adults, also importance contributors to social vulnerability across all three hazards.
#Finding-2 In rural areas, access to the internet and isolation heighten social vulnerability to climate-related hazards
Across rural communities, limited internet access restricts access to information and support services and combine with social and physical isolation to have a strong influence on social vulnerability to all three hazards. Low mobility (linked to indicators of physical disability, residential care, and restricted access to private transport) are also important influences. Restricted mobility, for example, makes it more difficult to access local services such as GP practices and hospitals, install or deploy household level adaptations, such as flood gates, and access alternative accommodation or remote services, such as access to GPs and hospitals.
#Finding-3 In urban areas, social vulnerability to climate-related hazards is driven by multiple factors in particular income and property tenure
In urban settings, poor health, income deprivation, high levels of social and private renting, lack of local knowledge and limited mobility are all important contributors to social vulnerability. People living on lower incomes and in rented accommodation are also less likely to have access to flood insurance and have more limited capacity to appropriately prepare for, and recover from, flood events. This includes, for example, taking action to adapt their homes.
Drivers of social vulnerability to each hazard
Despite the many shared drivers of social vulnerability across the three selected hazards, there are differences. The following summarises the most important drivers of social vulnerability for each hazard in turn.
- Flooding: Social vulnerability is often driven by a combination of poor health and constraints on adaptive capacity (due to low income, property tenure and mobility). Income and tenure affect the extent to which people can prepare for, respond to, and recover from events (including their ability to purchase household insurance) make property adaptations or have autonomy over other aspects of adaptation. Restricted personal mobility (linked to indicators of disability, residents in care, and private transport availability) makes it difficult to deploy property level adaptations (e.g., flood gates), move personal items or respond to post-flood challenges, such as changes in accommodation or services. If public services are affected by flooding at the same time, access to services (e.g., GP practices, hospitals etc) can be lost or delayed (with potential loss of access to important medication).
- Air quality: Social vulnerability to poor air quality tends to be associated with neighbourhoods where lower incomes and more limited local knowledge relating to poor air quality (e.g., due to limited internet access) combine to limit the capacity of households prepare for, and recover from, events as well as adapt to future conditions. However, our knowledge of the factors influencing indoor air quality is currently limited, and more work is needed to improve our understanding of these interactions.
- Heat (high temperatures): Income and local knowledge are most influential across Scotland in determining social vulnerability to heat. These drivers combine to undermine adaptive capacity by limiting the available resources for people to adapt their homes, access information about the dangers of excess heat in their homes, and access help during heat-wave events. Biophysical sensitivity due to health and age are important across all hazards, but they are critical influences on social vulnerability to high temperatures.
Geographic and systematic disadvantage
In responding to the research questions of ‘Which groups are at the greatest social risk from climate related hazards, now and in the future?’ and ‘To what extent are the most socially vulnerable disproportionately impacted by climate-related hazards?‘ the research highlights that climate-related risks vary across Scotland (now and in the future). In some settings, and for some hazards, the most socially vulnerable face risks greater than the less vulnerable. These findings are summarised below.
#Finding-4 Challenges vary across local authorities
In Glasgow, 84% of neighbourhoods are classified as being among Scotland’s 20% most high heat disadvantaged, the greatest proportion of any Local Authority. The combination of social vulnerability and exposure to climate-related hazards mean Glasgow is similarly disadvantaged with respect to flooding and below average air quality.
In general, local authorities experiencing the greatest disadvantage will continue to do so in the future. Climate change does not, however, always increase risk in a uniform way but reflects the changing pattern of each hazard. For example, the relative proportion of neighbourhoods experiencing the most significant social risk from heat is projected to reduce in the future in Falkirk but increase in Dundee City.
#Finding-5 People living in rural settings tend to be more flood disadvantaged than those living in urban areas
People living in rural areas, on average, are subject to greater flood risk than those living in larger urban areas; particularly those living in remote and very remote small towns, and accessible rural areas. This reflects social factors (such as isolation, limited access to remote services, and limited social networks) as well as exposure to more frequent flooding than those living in urban areas (on average).
Social vulnerability to other hazards is also often high in rural areas. In the context of heat and air quality disadvantages this reflects the more limited internet coverage in rural areas compared to urban areas and consequently a greater difficultly accessing information. The exposure to high temperatures and below average air quality is often lower in rural areas than in urban areas and hence the associated risks are less. As the climate changes, however, many rural neighbourhoods are projected to experience above average high temperatures. This is particularly the case in accessible rural areas settlements.
#Finding-6 Urban settings present a concentration of disadvantage
Within urban settings the most socially vulnerable tend to experience higher disadvantage to heat and air quality. This is partly due to higher exposure in these settings. For example, the most socially vulnerable neighbourhoods in large urban areas are three times more likely to be exposed to high temperatures than others, and 50% more likely to be exposed to below average air quality. The differential in air quality between rural and urban settings tends to reflect higher levels of nitrogen dioxide (NO2). If planned reductions in NO2 emissions are realised this particular risk is projected to decrease.
The standard of protection against flooding tends to be higher in urban areas than in rural, however the exposed population is much larger, particularly in large urban areas and other urban areas settings. This leads to a greater number of people experiencing flood disadvantage in urban settings compared to rural areas (when considered in aggregate).
#Finding-7 black ethnic groups face the greatest geographic disadvantage
Black ethnic groups tend to experience higher risk than any other ethnic group, particularly in relation to poor air quality. For example, people in black ethnic groups are more than three times as likely to be exposed to above average concentrations of air pollution than people in white ethnic groups. Flood and high temperature related risks faced by people in black ethnic groups are also projected to increase more rapidly with climate change than for any other ethnic groups (although the rise is significant for all).
Projected improvements in air quality, if realised, would lead to a significant reduction in the number of people exposed to above average concentrations of nitrogen dioxide (NO2) air pollution across all ethnic groups (using present-day average concentrations as a threshold). This is not the case for those exposed to above average PM10 concentrations. By 2030 people in black and other minority ethnic groups will remain disproportionately exposed to above average levels of air pollution. Flood disadvantage is projected to increase for all ethnicities as the climate changes, but black ethnic groups are projected to experience the most rapid rise (as expressed through changes in expected annual damages).
#Finding-8 – The most socially vulnerable within white ethnic groups experience the greatest systemic disadvantage from flooding
The difference between the risks faced by the most socially vulnerable neighbourhoods and others within the same ethnic group is greatest amongst white ethnic groups. This reflects the greater inequalities within the white ethnic groups compared to others around household incomes and household tenure. Lower household incomes and living in socially rented accommodation tend to limit access to insurance and increase the Relative Economic Pain (REP)[7] associated with flooding and constrain the degree of autonomy over other aspects of adaptation, including household modifications.
Implications for enabling a just transition to climate change
The findings of the research have three central implications for enabling a just transition:
Recognising intersectionality in the underlying drivers of social vulnerability
Many of the most important drivers of social vulnerability affect vulnerability to all hazards considered here – flooding, high temperatures, and poor air quality. Recognising this intersectionality in social vulnerability presents an opportunity to enhance resilience to multiple climate hazards through targeted adaptation. This includes improving access to support and information services (including, for example, internet coverage, income, and tenure).
Enabling adaptive capacity
Climate-related disadvantage is often driven by a limited capacity to appropriately prepare for, and recover from, hazard events. Strengthening these capacities is central to reducing disadvantage. This includes, for example, supporting better access to flood insurance for those living in socially and privately rented accommodation with lower incomes, and addressing the disparities in internet access between rural and urban areas. Supporting the most socially vulnerable to make property-level adaptations, including those in rented accommodation, would also reduce negative welfare outcomes when exposed to a hazard.
Facilitating investments that reduce risk for the most socially vulnerable
Sound evidence on disadvantage is a prerequisite to shaping policy levers, guidance and funding arrangements that facilitate a just transition. The response will necessarily be multi-faceted involving actors operating at different levels. To achieve this, consideration will need to be given to how to address geographic and system disadvantage through multiple policy levers, including funding mechanisms and planning approaches.
Research needs
The presented analysis necessarily includes several assumptions. These include uncertainty in climate hazards (now and how they may change in the future) and adaptation choices that may be made. There is also uncertainty in our understanding of social vulnerability. Opportunities to improve both the methods and the data to refine the results and insights should be considered. Where possible this should include validation at a local level to support the national scale analysis and associated findings presented here. Developing a nuanced understanding of local characteristics and contexts developed through such an exercise would help interpret findings presented here.
Consideration should be given to updating the analysis presented here in the coming years. Updated Census data and advances in hazard mapping, for example, are all planned in the coming few years (e.g., relating to flooding this includes updates to surface water and fluvial assessment and at the coast through initiatives such as the Dynamic Coast). Such advances should be incorporated in any future update.
References
Adger, W.N. and Kelly, P.M., 1999. Social vulnerability to climate change and the architecture of entitlements. Mitigation and adaptation strategies for global change, 4(3), pp.253-266.
CCC – Committee on Climate Change (2021) Independent assessment for Scotland: The third Climate Change Risk Assessment https://www.ukclimaterisk.org/wp-content/uploads/2021/06/CCRA-Evidence-Report-Scotland-Summary-Final-1.pdf
Dale M., Gill E. J. Kendon, E. J, Fowler, H. J. (2017). Are you prepared for future rainfall? Results from the UKWIR rainfall intensity project. Conference paper to the CIWEM Urban Drainage Group
EEA – European Environment Agency (2017) Climate Change impacts and vulnerability in Europe: An indicator-based report. Copenhagen: European Environment Agency
GI-SAT (2011) Scottish Government Geographic Information Science and Analysis Team. Evaluation of the Data Zone Geography. Report available at http://www.scotland.gov.uk/Resource/Doc/933/0120159.pdf. Last accessed March 2013.
Gouldby, B. P., Wyncoll, D., Panzeri, M., Franklin, M., Hunt, T., Hames, D., Tozer, N. P., Hawkes, P. J., Dornbusch, U. and Pullen, T. A. (2017) Multivariate extreme value modelling of sea conditions around the coast of England. Proceedings of the Institution of Civil Engineers – Maritime Engineering, 170 (1). pp. 3-20.
Kay, A. L., Rudd, A. C., Fry, M. and Nash, G. (2020). Climate change and fluvial flood peaks. Report to Environment Agency/Scottish Environment Protection Agency, SC150009 WP2 Final Report, UKCEH, 65pp. + Appendix (27pp.) In review.
Kennedy-Asser, A.T., Andrews, O., Mitchell, D.M. and Warren, R.F., 2021. Evaluating heat extremes in the UK Climate Projections (UKCP18). Environmental Research Letters, 16(1), p.014039.
Kazmierczak, A., Cavan, G., Connelly, A. and Lindley, S. (2015) Mapping Flood Disadvantage in Scotland 2015. The Scottish Government.
Lindley, S. J., O‟Neill, J., Kandeh, J., Lawson, N., Christian, R., and O’Neill., M (2011) Climate change, justice, and vulnerability. Joseph Rowntree Foundation, www.jrf.org.uk
Palmer, M. D., Howard, T., Tinker, J., Lowe, J. A., Bricheno, L., Calvert, D., Edwards, T., Gregory, J., Harris, G., Krijnen, J. & Roberts, C. (2018) UKCP18 Marine Report.
Sayers, PB., Horritt, M, Carr, S, Kay, A, and Mauz, J (2020) Third UK Climate Change Risk Assessment (CCRA3): Future flood risk. Research undertaken by Sayers and Partners for the Committee on Climate Change (using the Future Flood Explorer). Published by Sayers and Partners and the Committee on Climate Change, London
Sayers PB., Carr S., Moss C., and Didcock A. (2020) Flood disadvantage – Socially vulnerable and ethnic minorities. Research undertaken by Sayers and Partners for Flood Re. Published by Sayers and Partners (SPL), London.
Sayers PB, Horritt M, Penning Rowsell E, and Fieth J (2017). Present and future flood vulnerability, risk, and disadvantage: a UK assessment. A report for the Joseph Rowntree Foundation published by Sayers and Partners LLP. Accessible here http://www.sayersandpartners.co.uk/flood-disadvantage.html
Scottish Government (2020). Fourth National Planning Framework: Position statement. www.gov.scot
Scottish Government (2019b). Second Scottish Climate Change Adaptation Programme-2019-2024 (www.gov.scot)
Scottish Government (2019a). Climate Change (Emissions Reduction Targets) (Scotland) Act 2019. https://www.legislation.gov.uk/asp/2019/15/enacted
Scottish Government (2018). Scottish Government Urban Rural Classification 2016. Scottish Government Urban Rural Classification 2016 – gov.scot (www.gov.scot)
Tapsell, S., McCarthy, S., Faulkner, H. and Alexander, M., 2010. Social vulnerability to natural hazards. State of the art report from CapHaz-Net’s WP4. London.
Appendix 1 – Rationale of the selection of priority risks
Introduction
The Independent Assessment[8] of evidence for Scotland undertaken for the third UK Climate Change Risk Assessment (CCRA3), highlights a range of climate risks and identifies the urgency scores for twenty-five risks from climate change in Scotland which have increased since the previous CCRA five years ago. Flood-related risks remain the number one priority for action, with water scarcity and impacts on the natural environment also highlighted. Under Health, Communities, and the Built Environment there are thirteen identified climate risks and opportunities. Both high temperatures and interactions of high temperatures with other impacts (for example air quality) are highlighted as important issues. Other climate risks are expected, including from coastal erosion as being considered through other research activity, e.g., Dynamic Coast Scotland[9]. High temperature events are frequently associated with episodic air pollution and there are complex interactions with other risks such as wildfire.1 These impacts are known to cascade into risks associated with health and care delivery, due to additional stresses such as hospital admissions.
Addressing these issues is a significant adaptation challenge but remains central to achieving aims set out in the Scottish Climate Change Adaptation Programme 2019-2024 (SCCAP2), i.e., to ensure that the people in Scotland who are most socially vulnerable can adapt and have their risks appropriately managed and in a just manner.
Selection process
The research report here uses the evidence presented in documents introduced above and knowledge of data and tools readily available to the research team to selected three priority hazards. Based on this process the research focuses on risks related to heat, air quality and flooding. The evidence to support this focus is elaborated below.
Prioritising heat-related risks for assessment
Historically, policy in Scotland has centred on the mitigation of health impacts from cold temperatures and excess winter deaths. The potential impacts of high temperatures therefore represent something of a hidden risk and one which is not at the forefront of action. Previous studies have used existing thresholds for NE England to characterise heatwaves in the context of southern Scotland. This analysis (Figure A1) shows the rising trends in extreme daytime and night-time temperatures projected through both UKCP09 and subsequent UKCP18 climate projection data. The impacts of heatwaves and high temperatures are felt through several sectors. They include impacts on infrastructure such as transport and energy in addition to direct consequences for human health and wellbeing. Changes in temperature regimes also affect energy demand with different seasonal patterns predicted.
Met Office records shows that extremely high temperatures are already occurring, for instance maximum recorded temperatures of 31.9°C (recorded in Bishopton, 28th June 2018)[10]. The number of heat-wave events is expected to increase, but it is not only temperatures which should be considered. Patterns of exposure relate to aspects of the built environment, with levels of harm being influenced by individual health and demographic characteristics together with wider community contexts. It is these latter characteristics that assessments of vulnerability help to reveal. Estimates suggest that heat-related deaths in Scotland are likely to range from 70-285 per year by 2050 and grow to 140-390 per year by the 2080s. Based on analyses of past events[11],[12], impacts are likely to primarily affect older demographic groups, especially those with multiple health issues and disadvantages.[13] Excess heat-wave deaths are more prevalent in urban locations compared to rural locations due to the Urban Heat Island effect[14].


Figure A1: Trends in heatwave frequency projected for Scotland[15].
Heatwave related excess deaths should also be considered alongside the benefits of less severe winters and the potential for increased physical activity and higher Vitamin D exposure, each of which are reported to bring health and wellbeing benefits from temperature increases.2 For instance, evidence suggests that between 1989 and 2001 there were 51,600 Scottish excess winter deaths primarily affecting people over 65 years of age[16]. Measures to reduce cold-weather related deaths and tackle issues of fuel-poverty have been important adaptations stretching over many decades. However, there are increasing concerns about the potential detrimental effects of ‘super-insulated’ buildings in the context of summer heat-wave events. High levels of over-heating have been recorded in new-build homes across Scotland, with exceedance of 25 degrees C (as a recognised threshold in the UK government’s Housing Health and Safety Rating System (HHSRS))[17]. Although inevitably related to ambient temperatures, over-heating is as much – if not more – related to building design and use of properties by occupants. While some occupants express a preference for over-heated conditions, this does not mitigate the potential for health-related impacts and there is also the potential for impacts on carbon mitigation agendas, through increased demand for air conditioning. In this context, it is also notable that between 1999 and 2009 Glasgow city Council have recorded a higher proportion of severe weather events associated with unreasonably high temperatures (11%) than unreasonably low temperatures (10%).3,[18]
Conclusion – to include heat as one of the three priority hazards
Prioritising flood-related risks for assessment
The risk of flooding to people, communities and buildings is one of the most severe risks from climate hazards for the population, both now and in the future. This risk encompasses flooding from all sources, particularly rivers (fluvial), the sea (coastal) and surface water (pluvial) flooding; the 2018 National Flood Risk Assessment for Scotland, for example, estimates that 284,000 properties are at risk of flooding (1:200-year return period) today. Recent analysis for the UKCCRA3 confirms that the most socially vulnerable experience disproportionate flood risks today and in some settings their disadvantage increases in the future (Sayers et al, 2020). Analysis for Flood Re highlights the low uptake of insurance by the most socially vulnerable across the UK (including in Scotland) and the disproportionate risks faced by some ethnic minorities[19]. This analysis reinforces our work for the Joseph Rowntree Foundation (JRF) in 2015-17[20].
These studies highlight that flooding to people, communities and buildings remains among the most severe climate-related risks for Scotland with flood disadvantage experienced by socially vulnerable communities particularly in some coastal areas, declining urban cities, and dispersed rural communities. The previous work has highlighted that flood disadvantaged communities exist across Scotland. Glasgow and the wider City-region experience significant disadvantage.
The Position Statement on the Scotland’s fourth National Planning Framework[21] highlights flooding as a particular adaptation focus. The statement commits to more action to: reduce a communities’ exposure to flooding by future-proofing the design of the built environment and investing in green infrastructure; promoting natural flood risk management and strengthening policies on the water environment and drainage infrastructure; restricting development in flood risk areas; adapting existing infrastructure where climate change may increase vulnerability to flooding; and placing greater importance on flood risk management and coastal protection and the interface between planning on land and at sea. The statement also re-iterates commitments to socially just transitions which tailor responses according to the specific needs of climate vulnerable communities within a framework of place-based actions which enhance the quality of places, improve health and wellbeing, and reduce geographic disadvantage.
Conclusion – to include flood as one of the three priority hazards.
Note: As part of the CCRA3 analysis decreases are shown in the numbers of people at significant risk of river flooding in the 2050s and 2080s for Scotland in the low population scenario. This is due to estimated decreases in population in some areas rather than the influence of climate change. To avoid confusion, population change (in demographics or growth) is excluded here.
Air quality as a priority risk
There are clear social justice dimensions to the distribution of air quality impacts across Scotland, even without considering future climate change. For instance, a ranking exercise carried out with stakeholders from government, activist groups, community organisations and academia identified air pollution as the top concern for distributive environmental justice in Scotland[22]. In the context of high variability in pollution concentrations, there have been calls to consider both concentrations and patterns of population vulnerability when prioritising interventions like Low Emissions Zones.[23]
Air quality is a function of emissions characteristics and meteorological conditions, and so estimating future changes is particularly challenging[24]. In a similar way to heat waves, health burdens from air pollution are not solely due to concentrations but also the type and nature of human exposure (e.g., exposure to extreme events, exposure at rest or during exercise, or due to aspects of the built environment which enhance or offset pollution levels) and underlying susceptibility to negative effects, such as pre-existing respiratory disease. There is thus a vulnerability component to negative health outcomes. Greater harms can be expected where there is underlying biophysical sensitivity, enhanced exposure and factors which inhibit adaptive capacity.
Emissions scenarios underpinning climate projections are not only indicative of carbon emissions but also a range of other pollutants with the potential to cause future health burdens. However, health-related air pollutants are also subject to regulatory control. It is estimated that all Representative Concentration Pathways (RCPs) are associated with large emissions reductions in particulate matter (PM) and in the precursors of ozone (O3), including nitrogen oxides (NOx)[25]. Projections of ozone concentrations – as the dominant hazard linked to climate change2 – are open to considerable debate and trajectories depend on scenarios and trends in other pollutants, such as methane. This uncertainty means that ozone cannot be considered in the current study. Furthermore, health burdens depend on demographic and social characteristics and how they change into the future, both of which are also out of scope in the current study. One study estimated that the UK’s ozone-related health impacts could rise by 16–28% between 2003 and 2030 if factoring in socio-economic change[26] though analyses suggest substantial falls in mortality related to nitrogen dioxide and fine particulates (PM2.5) with around 6.5 million life-years and 17.8 million life-years gained by 2050 compared to a 2011 baseline[27].
Air quality episodes with elevated concentrations of air pollutants can lead to a range of chronic and acute diseases, evidenced by health outcomes which include increased hospital admissions and excess morbidity and mortality rates. The stagnation weather events associated with air quality episodes can also be associated with summer heatwaves and therefore have cumulative outcomes for human health.[28] Nevertheless, evidence suggests that recent heatwaves in Scotland have not been associated with very high O3 concentrations.2 Indoor concentrations are strongly linked to building type and use (e.g., fuel types) and other behavioural influences (e.g., smoking). As with heatwave impacts, trends towards more insulated buildings could increase risks from these sources since this reduces ventilation (ibid.). The Scotland CCRA3 summary has identified air quality as requiring further investigation which may suggest it is not an immediate priority for the current project. However, despite uncertainties, understanding risks associated with poor air quality could make a useful contribution given synergies with vulnerability factors held in common with heat-related risk. It is currently only practicable to analyse PM10 and NO2 for this study, and using available projections, i.e., which focus on expected changes in air pollutant emissions only.
Conclusion – to include air quality as one of the three priority hazards.
Other climate related risk that could be considered in future assessments
The CCRA3 summary for Scotland identifies several other risks that should be given further attention. They include several that relate to social issues:
Changes the natural environment, including terrestrial, freshwater, coastal and marine species, forests, and agriculture – this has a clear social justice connection, linking those that rely on natural environments (fishing and agricultural, forestry etc) and the groups that may be more or less able to adapt the potential changes. Disruption to the natural environment influences the prevalence and distributions of pests and influences patterns of food- and water-borne disease and contamination. The degree of exposure is in turn influenced by occupational and recreational behaviour making future population risks very challenging to estimate. On balance exposure to the natural environment is widely recognised to be of net benefit for human populations[29]. Indeed, the lack of greenspaces in many urban areas is a core issue of distributive justice in the present-day.[30] Population health is affected by changes to the natural environment, including terrestrial, freshwater, coastal and marine species, forests, and agriculture. However, analysis of residential risks from changes in these sectors are highly complex and their assessment would require further primary research to develop appropriate metrics and models. These risks are therefore not considered priority risks within the scope of this investigation but are discussed below for context.
Changes in coastal erosion – To some extent this is already covered by the recent Dynamic coast Studies but could be usefully extended to consider those communities that may come under increasing pressure for realignment/relocation (as a similar study is underway in England, Sayers et al in press) to address the associated challenge of ‘the viability of coastal communities and the impact on coastal businesses due to sea level rise, coastal flooding and erosion’. Relocation has clear social justice considerations but is not considered a priority over those risks identified for this investigation.
Changes in high winds, moisture and driving rain: highlighted by the CCRA3 these changes are primarily concerned with homes and costs to households, resulting from damage to dwellings. Damp buildings cause harm to health and wellbeing, and damage to dwellings from high winds can also risk injury, but the CCRA3 suggests there is some evidence contained in the assessment that indicates that the vulnerability of the Scottish housing stock to extreme wind and rain is declining. However, this is not considered a priority risk in scope for the investigation here.
Changes in vector borne disease: Some diseases transmitted by insects and ticks (vectors) are likely to change in prevalence in the future due to warmer temperatures changing the distribution of the vector in the UK as well as diseases acquired by people overseas and being brought back into the UK; although in Scotland, the future magnitude of risk from vector-borne diseases due to climate change is medium. This is not considered a priority risk here and this area is a subject of ongoing research.[31]
Changes in household water quality and supply: Reduced summer precipitation resulting from climate change is likely to increase periods of water scarcity and droughts. This may lead to interruptions of household water supplies and associated health, social and economic impacts, particularly for vulnerable households. Private water supplies are most vulnerable to current and future climate hazards that affect water quality (outbreaks) and quantity (interruption of supply) and are particularly important for more isolated communities. Climate change may also increase the risk of contamination of drinking water through increased runoff and flooding events that overwhelm current water treatment approaches. Sea level rise, heavy rainfall, and coastal erosion can increase pollution from historical landfills. There are specific concerns around this issue in Scotland, mainly in relation to Private Water Supplies (PWS), which are those not regulated or supplied by Scottish Water, which are more commonly located in remote and rural communities in Scotland. There is ongoing research by Scotland’s Centre of Expertise for Waters to make PWS more resilient to drought in the future and overall, the CCRA3 assessed the associated risks as low today rising to medium in future. This is not considered a priority risk here.
Appendix 2 – Social vulnerability indicators and indices
Social vulnerability indicators
The indicators used to assess social vulnerability across the three prioritised hazards are summarised in the Table below together with a brief rationale for their inclusion. More detailed discussion can be found in the various supporting references cited. Unless otherwise indicated, all data were sourced from https://www.statistics.gov.scot/, or the Scottish Index of Multiple Deprivation 2020 (https://www.gov.scot/publications/simd-2020-technical-notes/)
Table A2-1 Social vulnerability indicators
|
Domain |
Indicator |
Rationale |
Summary metric |
|
Age |
Young Children |
Young children are more susceptible to harms from a range of environmental hazards. There is extensive evidence from analyses of past events, and wider academic research. Evidence is available for stress from hot weather via Climate Just Young children and babies | Climate Just |
% People under 5 years old |
|
Older Adults |
Not all older people are socially vulnerable, However, older people may be more likely to experience detrimental physical impacts during periods of high temperatures, e.g., due to inhibited ability for thermo-regulation and dehydration. This may exacerbate existing ill-health. Similar evidence exists with respect to poor air quality, with the potential for poor air quality and high temperatures to be experienced concurrently. Older people | Climate Just |
% People over 75 years old | |
|
Health |
People in long-term ill-health |
The long-term sick are more vulnerable to flooding, the flood they experienced often making their pre-existing condition worse either as a one-off ‘hit’ or accelerating its adverse trajectory (discussed in Sayers et al., 2017). |
% People whose day- to-day activities are limited |
|
Households with members in ill-health |
Flooding may prevent the use of complex home-based health care systems, for example home dialysis, due to direct flood damage or to loss of power (discussed in Sayers et al., 2017). |
% Households with at least one person with long-term limiting illness | |
|
Emergency hospital admissions |
Some conditions and illnesses (or the medicine used to treat them) make people more sensitive to the effects of air pollution and high temperatures, e.g., dehydration, ability to sweat and exacerbate symptoms, e.g., cardiovascular disease. Some illnesses are associated with acute symptoms and hospital admissions, while others might not People in poor health | Climate Just |
Emergency stays in hospital (index) | |
|
Disability and Ill-health |
Comparative illness factor (index) | ||
|
Mood and Anxiety Disorders |
Some mental health disorders affect people’s ability to self-regulate to avoid environmental hazards or recognise and take effective precautions against symptoms caused or aggravated by environmental hazards. In some cases, medicines used may also increase susceptibility to effects, e.g., of heat stress (Page et al, 2012).[32] People in poor health | Climate Just |
Population prescribed drugs for anxiety, depression, or psychosis | |
|
Medical and Care Residents |
People living in medical and care establishments may have greater dependencies because of health-related factors. People in poor health | Climate Just |
% Living in medical and care establishments | |
|
Low birthweight |
Babies with low birthweight are susceptible to a range of health effects which can be exacerbated by exposure to high temperatures and poor air quality. Furthermore heat, air quality and other environmental stressors are also a cause of low birthweight due to impacts on pregnant women (Dadvand et al, 2014). [33] |
Proportion of live singleton births of low birth weight | |
|
Income |
Unemployment |
Low-income households are less likely to have the capacity to fully prepare for future floods (through insurance and property level measures). The NFVI uses a combination of income metrics to represent this important influence. The indices used to assess social vulnerability to high temperatures and poor air quality also use a range of income factors (see following section). |
% Unemployed |
|
Long-term unemployment |
% long-term unemployed or who have never worked | ||
|
Low-income occupations |
% in routine or semi- routine occupations | ||
|
Households with dependent children and no |
% Households with dependent children and no adults in employment | ||
|
Employment Deprivation |
People on low incomes have reduced adaptive capacity to high temperatures and poor air quality, e.g., have fewer choices in terms of goods and services, and they may also suffer lower self-esteem, engage less with others (e.g., via support networks) and experience higher levels of stress and anxiety. Employment deprivation is a distinctive measure of lower income which accounts for the proportion of working age people who are involuntarily excluded from paid employment, due to lack of opportunities, ill-health and disability or caring responsibilities. |
Score | |
|
Income Deprivation |
Income deprivation is a direct measure of people who are expected to be negatively impacted due to unemployment or who have low earnings. There are a range of associations between income and other factors which reduce adaptive capacity to high temperatures and poor air quality, some of which cannot be directly measured at neighbourhood level such as engagement with public organisations People on low incomes | Climate Just |
Score | |
|
Average Household Income |
Average household income is included as a relative measure of resources that households may have to support adaptation to high temperatures and poor air quality, for instance ability to adapt homes, access to private transport etc. People on low incomes | Climate Just |
Pounds | |
|
Information use |
Recent arrivals |
Higher proportions of people recently arrived from outside an area indicate a higher vulnerability as they are more likely to have difficulty obtaining and using information and guidance provided to the public. |
% People with <1 year residency coming from outside UK |
|
English Proficiency |
Relatively poor proficiency in English restricts people’s ability to prepare for, respond to and recover from events with the capacity to cause harm because it restricts knowledge of and access to information and support services. |
% People who do not speak English well | |
|
Internet |
Sub-standard Broadband |
The internet is an increasingly important means of supplying and receiving information about public authorities and services, for obtaining goods and services and for communicating with others (ONS, 2019). [34] However, its availability, reliability and accessibility varies across Scotland. Furthermore, the internet, like other critical infrastructure, can also be impacted by some events, like high temperatures or extreme weather.[35] The Universal Service Obligation relates to average household requirements, assumed to be download speeds >10Mbps and upload speeds of 1Mbps. Areas with poorer internet may also have less well-developed infrastructure for other key sectors, e.g., mobile communications, transport, and energy. |
% premises below the Universal Service Obligation (USO) (Ofcom, 2018) |
|
Lack of Superfast Broadband |
Better connection speeds allow more rapid access to information, goods and services and social networks. This is important given the increasing reliance on online information, especially during periods where demand is high. Internet accessibility is also important for business sectors and for employees working from home. |
Percentage of premises without access to superfast broadband | |
|
Local knowledge |
Population Transience |
In places with high amounts of population turnover there is the potential for higher vulnerability due to lack of knowledge of hazards, health and support services and social networks. Such areas are more likely to be characterised by rented accommodation and in some cases insecure employment. These factors affect the capacity for preparing for, responding to, and recovering from environmental hazards like high temperatures. |
% HHs which appear to have changed occupier (2012-2020) [36] |
|
New migrants |
People who have recently moved into an area may lack awareness of local flood risk provided through family and community clues. | ||
|
Tenure |
Social renting |
Social renters are less able to prepare for extreme weather events, for example due to inability to modify their homes to prepare for heatwaves or account for poor air quality. Property maintenance and adaptation is normally the responsibility of the property owner although in the case of some social tenants social renting may also provide opportunities for adaptation. Tenants in social housing are likely to have a range of other characteristics which increase vulnerability Tenants in social or private rented housing: who are we concerned about? | Climate Just |
% Social rented households |
|
Tenure |
Private renting |
Private renters represent a very broad group and not all are equally socially vulnerable. However, on average private renters are less able to prepare for extreme weather events, for example due to inability to modify their homes to prepare for heatwaves or account for poor air quality. Property maintenance and adaptation such as insultation and ventilation is normally the responsibility of the property owner. Renters may also be more transient and therefore less familiar with local neighbourhoods, environmental hazards, and sources of support Tenants in social or private rented housing: who are we concerned about? | Climate Just |
% Private rented households (historical reference) |
|
Direct flood experience |
Households exposed to significant risk |
A large body of research shows that those with experience of flooding are less vulnerable in subsequent events as they have more knowledge as to what to do and how to respond. Flood experience has often been shown to be a key factor in level of willingness to take preventative action against future floods and respond seriously to warnings. | |
|
Crime |
Crime Rates |
People living in high crime (or perceived high crime) areas may have reduced adaptive capacity during high temperature events due to an unwillingness to leave windows open at night. There is also a connection between crime and income, and income and security measures. Who are we concerned about? | Climate Just |
Crime rate per 10,000 population |
|
Mobility |
Disability and Ill-health |
People with disabilities or poor health are more likely to have reduced mobility and/or be reliant on others to assist them during extreme events, e.g., if they have symptoms of heat stress or acute adverse effects due to poor air quality. Even if people are relatively independent in normal times, there may be additional pressures if infrastructure is impacted, e.g., power cuts, internet, or mobile networks. People with low personal mobility | Climate Just |
Comparative illness factor (index) |
|
Medical and Care Residents |
People living in medical and care establishments may have greater dependencies because of health-related factors. As well as making people generally more susceptible to negative effects, there are also more likely to be low mobility and additional needs in relation to responding to and recovering from environmental stresses like high temperatures and poor air quality. People with low personal mobility | Climate Just |
% Living in medical and care establishments | |
|
Private Transport ownership |
People with access to private transport have increased adaptive capacity as they have more flexibility to cope with impacts which may result from extreme events and environmental hazards, for instance helping immediate family or the local community access health or other support services, or handling changes due to transport problems during periods of extreme heat. |
% Households with no car or van | |
|
Accessibility by bus |
In areas with low public transport provision, it may be more difficult for people to cope during and after events like heat waves, or if immediate family is affected by symptoms aggravated by poor air quality. More physically isolated areas may also be associated with other factors which increase vulnerability (Preston et al., 2014[37]). |
Bus Accessibility | |
|
Social networks |
Single Pensioner Households |
Socially isolated people may have restricted adaptive capacity because of a lower ability to seek and receive help if negatively affected by heat or poor air quality. For instance, a sample of approximately half of 919 people who died at home during the 2003 heat wave in Paris showed that 92% of them lived alone and social service records for 383 indicated that a quarter had no social ties (Poumadère et al., 2005). [38] Other studies have shown that those with social ties have lower risk of death, were more likely to take remedial measures and to have support networks for recovery. Single pensioner households may be particularly vulnerable due to a greater chance of other factors such as older age and ill-health, all other things being equal. |
% Single pensioner households |
|
Primary School networks |
Social ties are generally greater in some sub- sections of society meaning that information and support networks developed as part of everyday life vary. People with primary school children are one such group since connections between children and between parents of young children (e.g., through school related activities) are likely to be stronger on average (Kazmierczak et al., 2015). [39] During and after extreme event trusted social networks may enable greater adaptive capacity, e.g., through information sharing, support and sharing resources. People who are socially isolated | Climate Just |
% Children not of primary school age | |
|
Civil Organisations |
The presence of charities and other voluntary organisations in an area is one indicator of social networks and civil society. Such networks facilitate greater social engagement and participation which provide more potential for information, sharing of resources and wider support. People in neighbourhoods with these networks are less likely to be socially isolated, and people who are socially or physically isolated may also benefit because of activities of these organisations. People who are socially isolated | Climate Just |
Per capita rate of registered local civil organisations (Rutherford and Brook, 2018) [40] | |
|
Single Adult Households |
Living alone is not necessarily an indicator of social isolation, there are however several reasons why single adult households may be more vulnerable, including because of the potential for poorer social networks especially following traumatic life events. Furthermore, people in single households may have fewer resources and more precarity. [41]People who are socially isolated | Climate Just |
% Single adult households | |
|
Lone parent households |
These households face practical difficulties in responding to a flood where children are dependent on them as there is less direct within-the-family support. |
% Lone-parent households with dependent children | |
|
Health Service access |
Accessibility of Pharmacies |
People living in areas which are more physically isolated from health services are less likely to be able to access health services, medical help, or medicines quickly if experiencing heat stress or the effects of poor air quality. They are also less likely to use such services (Ensor, 2004). [42]Fortunately, more physically isolated areas tend to have cooler temperatures and better air quality, although residents may be affected by relatively low temperatures compared to people adapted to warmer environments. This situation is reflected in the differences with heat health warning thresholds across the UK. |
Accessibility of Pharmacies (Daras et al., 2019) [43] |
|
Accessibility of Hospitals |
Accessibility of Hospitals | ||
|
Travel time to GP surgery (private transport) |
Travel time to GP surgery (private transport) (mins) | ||
|
Travel time to GP surgery (public transport) |
Travel time to GP surgery (public transport) (mins) | ||
|
Service availability |
Emergency services exposed to flooding |
Various studies highlight the link between the degree of support provided by institutional (such as the police, the fire brigade, ambulances, and local authority social care) and community support networks and the vulnerability of the individuals in those communities. These linkages are discussed in Sayers et al, 2017 |
% of emergency services exposed to flooding |
|
Care homes exposed to flooding |
% no. of care homes exposed to flooding | ||
|
GP surgeries exposed to flooding |
% no. of GP surgeries exposed to flooding | ||
|
Schools exposed to flooding |
% no. of schools exposed to flooding | ||
|
Housing characteristics |
Over-crowding |
Densely populated locations and over-crowded households are indicators of where temperatures may be elevated indoors. There is also evidence for poorer health in residents living in crowded accommodation (Public Health Scotland, 2021). [44] |
% of people in over-crowded households |
|
High Rise Flat indicator |
High rise flats are well known to be associated with elevated temperatures during heat-wave events (Taylor et al., 2015). [45] Analyses of past events demonstrate increased mortality in these building types. Modelling suggests that the degree of enhanced exposure depends on a range of factors such as building orientation, insulation, ventilation and building use (DCLG, 2012). [46] |
Count of flats without gardens (Proxy for high-rise flats) Office of National Statistics Source: Ordnance Survey Open Greenspace | |
|
Smoking Behaviour |
Maternal smoking is an indicator of the potential for smoking behaviour within the home which may leads to poor indoor air quality. |
% Mothers current or former smokers | |
|
Indoor sources |
Sources of indoor air pollution, such as solid fuel burning, can give rise to elevated air pollution within the home. Domestic and commercial black carbon emissions are taken as a proxy indicator of a range of air pollutants associated with solid fuel use. |
Per HH Domestic/Commercial black Carbon emissions (t/a total / HH total) National Atmospheric Emissions Inventory [47] | |
|
Physical Environment |
Urban Cover |
Urban land covers are associated with higher temperatures because of the Urban Heat Island effect, especially during heat wave conditions (low wind speed, high solar radiation, and low cloud cover) (Levermore et al., 2018). [48] The effect is particularly marked in larger urban areas due to urban structures which prevent re-radiation of stored heat, albedo and thermal capacity of urban structures and waste heat from human activities (Smith et al., 2009). [49] Changes in urban cover overtime also exert an influence on temperature trends as has been shown for Glasgow (Emmanuel and Krüger (2012). [50] Neighbourhoods without much greenspace | Climate Just |
% Urban land cover Land Cover Map (2019) |
|
Physical Environment |
Lack of private greenspace |
Vegetated cover around individual dwellings has the potential to provide cooling through shading and evapotranspiration, thus cooling the local areas around where people live. However, it should be noted that this assumes that private spaces are vegetated. In Manchester, the average garden is about 50% vegetation and 17% trees (Baker et al., 2018). [51]Modelling studies have shown both local cooling effects from vegetation and increased temperatures if vegetation is removed (Skelhorn et al., 2014). [52] Private greenspace may also offer residents better adaptive capacity during hot weather. |
Lack of private greenspace (% dwellings without gardens) Office of National Statistics Source: Ordnance Survey Open Greenspace |
|
Physical Environment |
Lack of community greenspace |
Urban parks have been shown to be on average 1°C cooler than built-up areas and larger parks have a greater cooling effect due to shading and evapotranspiration (Bowler et al., 2010). [53] This impact can be particularly important in larger and denser urban areas where the cooling effect has an influence on surrounding areas. This effect can be reduced or even reversed in some cases, e.g., dried grass areas. Neighbourhoods without much greenspace | Climate Just |
Median combined size of parks and public gardens and playing fields within 1,000 m radius (m2) Office of National Statistics Source: Ordnance Survey Open Greenspace |
Social vulnerability indices
A unique social vulnerability index has been derived for each hazard:
- Flooding: Neighbourhood Flood Vulnerability Index (NFVI)
- Air quality: Neighbourhood air Quality Vulnerability Index (NAQVI)
- Heat: Neighbourhood Heat Vulnerability Index (NHVI)
To calculate each index the associated indicators of social vulnerability are combined using a statistical process. This process is illustrated for the NFVI below (taken from Sayers et al., 2017). Each other index follows a similar process of calculation. In all cases data are standardised and allocated no weights, i.e., where there are multiple factors contributing to a particular vulnerability theme they are all given equal importance in the calculations.
Approach to calculating the Neighbourhood Flood Vulnerability Index (NFVI)
The Neighbourhood Flood Vulnerability Index (NFVI) is determined through a three-stage process as outlined in Figure A2-1 and described below.
Figure A2‑1 The process used to calculate the NFVI (Sayers et al, 2017)
Stage 1: Determine the z-score for Individual Indicators
Each indicator (‘age’ etc. as described in the previous section) is normalised to a z score. The z score is derived by subtracting the mean value and dividing by the standard deviation. If an indicator is already in the form of a rank (e.g., as is the Index of Multiple Deprivation, IMD), the equivalent z score is determined by assuming the rank is drawn from a normal distribution and calculating the number of standard deviations from the mean associated with that rank. This is done so that each indicator has the same numerical parameters, rather than its original numbers (which might be a %, a number, a rank, a fraction, etc.), and to enable them to be compared and combined on the “same playing field.”
Stage 2: Determine the z-score for each domain
Z scores for the individual indicators that contribute to each domain (Susceptibility, Ability to Prepare, Respond and Recover, and Community Support) are combined based upon the assumption of equal weighting (Table A2‑1). The only exception is the individual indicator associated with ‘direct flood experience’ (e1). In this case the weighting is negative as it acts to reduce the relative vulnerability of one neighbourhood compared to another.
The resulting values for each domain are then themselves transformed into a z score.
Stage 3: Determine the NFVI
For each neighbourhood, the z scores derived for each Indicator are summed with equal weighting. The final z score is calculated based on these results and used as the NFVI.


Top: Belfast, Bottom: Boston
Figure A2‑2 Example Neighbourhood Flood Vulnerability Index Maps (Sayers et al, 2017)
Table A2‑1 Indicator weighting (Sayers et al, 2017)

© Published by Sayers and Partners 2022 on behalf of ClimateXChange. All rights reserved.
While every effort is made to ensure the information in this report is accurate, no legal responsibility is accepted for any errors, omissions, or misleading statements. The views expressed represent those of the author(s), and do not necessarily represent
those of the host institutions or funders.
Suggested citation: Sayers, PB., Lindley. S, Carr, S and Figueroa-Alfaro, R. W(2021) The impacts of climate change on population groups in Scotland. Research undertaken by Sayers and Partners in association with the University of Manchester for ClimateXChange.
-
https://www.gov.scot/publications/climate-ready-scotland-second-scottish-climate-change-adaptation-programme-2019-2024/ ↑
-
https://www.theccc.org.uk/publication/is-scotland-climate-ready-2022-report-to-scottish-parliament/ ↑
-
750 people on average in 2011 ↑
-
For air quality standards used in Scotland see Standards (scottishairquality.scot) ↑
-
Expected Annual Damage (EAD): defines annual ‘average’ residential damage considering a hazard event, from frequent to rare, their annual probability of exceedance and the associated damage (detailed in Sayers et al, 2020). ↑
-
The ‘relative pain’ of the economic risks faced by those exposed to flooding (expressed as the ratio between uninsured economic damages and household income). ↑
-
Relative Economic Pain (REP, Sayers et al., 2017): The ‘relative pain’ of the economic risks faced by those exposed to flooding (expressed as the ratio between uninsured economic damages and household income). ↑
-
https://www.ukclimaterisk.org/wp-content/uploads/2021/06/CCRA-Evidence-Report-Scotland-Summary-Final-1.pdf ↑
-
https://www.dynamiccoast.com/files/dc2/_DC2_WS6_CE_Disadvantage_FINAL.pdf ↑
-
Majekodunmi, M., Emmanuel, R., & Jafry, T. (2020). A spatial exploration of deprivation and green infrastructure ecosystem services within Glasgow city. Urban Forestry and Urban Greening, 52, article 126698. https://doi.org/10.1016/j.ufug.2020.126698 ↑
-
Johnson H et al. (2004) The Impact of the 2003 Heat Wave on Mortality and Hospital Admissions in England. Epidemiology, 15(4)6-11 ↑
-
Poumadere M, Mays C, Le Mer S, Blong R (2005) The 2003 Heatwave in France: Dangerous Climate Change Here and Now. Risk Analysis, 25(6):1483-1494 ↑
-
Climate Change and Marginalised Communities Workshop Contributors (2020) Climate change, marginalised communities and considered debate within Scotland’s climate emergency, Scottish Geographical Journal, 136:1-4, 41-48, DOI: 10.1080/14702541.2020.1834335 ↑
-
Marselle MR, Hartig T, Cox D, Siân de Bell SK, Lindley S, Triguero-Mas M, et al. Linking biodiversity to human health: a conceptual framework. Environ Int. 2021; 150:106420 ↑
-
a sequence of five days or more during which minimum temperatures do not fall below 15°C and maximum temperatures exceeds 28°C averaged across the region, from Large increase in projected heatwave frequency for Scotland under new UK climate projections (climatexchange.org.uk) ↑
-
McCartney, G, Collins, C, Walsh, D, Batty, GD (2012) Why the Scots die younger: Synthesizing the evidence Public Health 10.1016/j.puhe.2012.03.007 ↑
-
C. Morgan, J. A. Foster, A. Poston & T. R. Sharpe (2017) Overheating in Scotland: contributing factors in occupied homes, Building Research & Information, 45:1-2, 143-156, DOI: 10.1080/09613218.2017.1241472 ↑
-
Glasgow City Council (2017) ‘A Local Climate Impacts Profile for Glasgow City Council’. ↑
-
Sayers PB., Carr S., Moss C., and Didcock A. (2020) Flood disadvantage – Socially vulnerable and ethnic minorities. sayers_-_flood_disadvantage_-_socially_vulnerable_and_ethnic_minorities_10feb2021.pdf (sayersandpartners.co.uk) ↑
-
Sayers, P.B., Horritt, M., Penning Rowsell, E., and Fieth, J (2017). Present and future flood vulnerability, risk, and disadvantage: A UK assessment. A report for the Joseph Rowntree Foundation. ↑
-
Fourth National Planning Framework: position statement – gov.scot (www.gov.scot) ↑
-
Todd, H; Zografos, C; Todd, Helen; Zografos, Christos (2005) Justice for the Environment: Developing a Set of Indicators of Environmental Justice for Scotland Environmental values., 2005, Vol.14(4), p.483-501 ↑
-
Lee, D., Robertson, C., Ramsay, C., Gillespie, C. and Napier, G (2019) Estimating the health impact of air pollution in Scotland, and the resulting benefits of reducing concentrations in city centres Spatial and Spatio-temporal Epidemiology 29 (2019) 85–96 ↑
-
https://www.ukclimaterisk.org/wp-content/uploads/2021/06/CCRA-Evidence-Report-Scotland-Summary-Final-1.pdf ↑
-
Fenech et al (2021) Future air pollution related health burdens associated with RCP emission changes in the UK Science of the Total Environment. https://doi.org/10.1016/j.scitotenv.2021.145635 ↑
-
Heal, M.R., Heaviside, C., Doherty, R.M., Vieno, M., Stevenson, D.S., Vardoulakis, S., 2013.
Health burdens of surface ozone in the UK for a range of future scenarios. Environ.Int. 61, 36–44. ↑
-
Williams, M.L., Lott, M.C., Kitwiroon, N., Dajnak, D., Walton, H., Holland, M., Pye, S., Fecht, D., Toledano, M.B., Beevers, S.D., 2018. The Lancet Countdown on health benefits from the UK Climate Change Act: a modelling study for Great Britain. Lancet Planet. Heal. 2, e202–e213 ↑
-
Doherty R M, Heal M R, O’Connor F M (2017) Climate change impacts on hu-man health over Europe through its effect on air quality. Environmental Health, 16 (Suppl 1):1-18 ↑
-
Lindley, S.J., Cook, P.A., Dennis, M., Gilchrist, A., (2018), Biodiversity, Physical Health, and Climate Change: A Synthesis of Recent Evidence In: Marselle, M., Bonn, A., Graner, T., et al. (Eds.) Biodiversity, Health & Climate Change. Springer. ↑
-
Labib, SM, Lindley, SJ, Huck JJ (2021) Estimating multiple greenspace exposure types and their associations with neighbourhood premature mortality: A socioecological study Science of The Total Environment Vol 789 https://doi.org/10.1016/j.scitotenv.2021.147919 ↑
-
Maximising ecosystem services in urban environments (MEaSURE) (nercmeasureproject.co.uk) ↑
-
Page, L, Hajat, S, Kovats S, and Howard, LM (2012). Temperature-related deaths in people with psychosis, dementia, and substance misuse. Br J Psychiatry 200(6): 485-490. ↑
-
Dadvand, P; Ostro, B; Figueras, F; Foraster, M; Basagaña, X; Valentín, A; Martinez, D; Beelen, R; Cirach, M; Hoek, G; Jerrett, M; Brunekreef, B; Nieuwenhuijsen, M (2014) Residential Proximity to Major Roads and Term Low Birth Weight, Epidemiology: Vol 25 – Iss 4 – p 518-525 doi: 10.1097/EDE.0000000000000107 ↑
-
Office for National Statistics (2019) Exploring the Digital Divide. https://www.ons.gov.uk/peoplepopulationandcommunity/householdcharacteristics/homeinternetandsocialmediausage/articles/exploringtheuksdigitaldivide/2019-03-04#why-does-digital-exclusion-matter ↑
-
UK Parliament Note no, 621 (not dated) Infrastructure and Climate Change https://researchbriefings.files.parliament.uk/documents/POST-PN-0621/POST-PN-0621.pdf ↑
-
CDRC Residential Mobility Index | CDRC Data https://data.cdrc.ac.uk/dataset/cdrc-residential-mobility-index ↑
-
Preston, I., Banks, N., Hargreaves, K. Kazmierczak, A., Lucas, K., Mayne, R., Downing, C and Street, R (2014) Climate Change and Social Justice: an evidence review Report for the Joseph Rowntree Foundation ↑
-
Poumadère, M., Mays, C., Le Mer, S. and Blong, R. (2005), The 2003 Heat Wave in France: Dangerous Climate Change Here and Now. Risk Analysis, 25: 1483–149 ↑
-
Kazmierczak, A., Cavan, G., Connelly, A and Lindley, S (2015) Mapping Flood Disadvantage in Scotland 2015: Methodology Report. Scottish Government. ↑
-
Rutherford, A., Brook, O. (2018). Civil society organisations in Scotland, 2017. [data collection]. UK Data Service. SN: 852915, DOI: 10.5255/UKDA-SN-852915 ↑
-
Palmer, G (2006) Single Person Households Report for the Joseph Rowntree Foundation https://www.npi.org.uk/files/4213/7544/5585/single_people.pdf ↑
-
Ensor, T. (2004) Overcoming barriers to health service access: influencing the demand side. Health Policy and Planning 19, 69–79. ↑
-
Daras K., Green M. A., Davies A., Barr B., Singleton A. (2019) Open data on health-related neighbourhood features in Great Britain. Scientific data 6 (1), 107. DOI: 10.1038/s41597-019-0114-6 ↑
-
Public Health Scotland (2021). Healthy housing for Scotland: a briefing paper setting out the fundamental link between housing and public health. Edinburgh: Public Health Scotland; Healthy housing for Scotland (publichealthscotland.scot) ↑
-
Taylor, J, Wilkinson, P., Davies, M, Armstrong, B., Chalabi, Z., Mavrogianni, A., Symonds, P., Oikonomou, E., Bohnenstengel,EI (2015) Mapping the effects of urban heat island, housing, and age on excess heat-related mortality in London, Urban Climate, 14:4, Pages 517-528 ↑
-
DCLG (2012) Investigation into overheating in homes. Literature review. ↑
-
Tsagatakis, I., Richardson, J., Evangelides, C., Pizzolato, M., Pearson, B., Passant, N., Pommier, M. & Otto, A. (2021) UK Spatial Emissions Methodology: A report of the National Atmospheric Emission Inventory 2019. Retrieved from: https://naei.beis.gov.uk/reports/reports?report_id=1024 ↑
-
Levermore, G, J Parkinson, K Lee, P Laycock, S Lindley (2018) The increasing trend of the urban heat island intensity Urban Climate, 24: 360-368 ↑
-
Smith, C., Lindley, S. & Levermore, G. Estimating spatial and temporal patterns of urban anthropogenic heat fluxes for UK cities: the case of Manchester. Theor Appl Climatol 98, 19–35 (2009). https://doi.org/10.1007/s00704-008-0086-5 ↑
-
Emmanuel, R and Krüger, E (2012) Urban heat island and its impact on climate change resilience in a shrinking city: The case of Glasgow, UK, Building and Environment, Volume 53, 2012, Pages 137-149 ↑
-
Baker, F, Smith, CL and Cavan, G (2018) A Combined Approach to Classifying Land Surface Cover of Urban Domestic Gardens Using Citizen Science Data and High-Resolution Image Analysis Remote Sensing 10(4):537 DOI:10.3390/rs10040537 ↑
-
Skelhorn, C., Lindley, S., Levermore, G (2014) The impact of vegetation types on air and surface temperatures in a temperate city: A fine scale assessment in Manchester, UK, Landscape and Urban Planning, 121: Pages 129-140, ↑
-
Bowler, D. E. Buyung-Ali, L., Knight, T. M and Pullin, A. S (2010) Urban greening to cool towns and cities: A systemic review of the empirical evidence Landscape and Urban Planning 97 (2010) 147–155 ↑
DOI: http://dx.doi.org/10.7488/era/4072
Executive summary
The need for this research
A key recommendation from research and public engagement on climate action in Scotland is for the Scottish Government to develop a clear and concise vision and map. This will help the public understand the goals and the required actions.
Furthermore, Scotland’s Climate Assembly called on the Scottish Government to create a score card with 10 key performance indicators for climate change in an easily accessible and understandable format.
Aims
This research aimed to understand if a climate change score card and/or route map could be used as a communication method and how it could be developed.
To identify relevant examples and best practice, we undertook a rapid international literature review focused on climate change route maps and score cards designed for a public audience. We analysed how these examples could be applied to the Scottish context. This analysis included workshops with members of the public and stakeholder organisations. We used evidence from our literature review and these workshops to identify the needs, preferences and expectations of the Scottish public and stakeholder groups regarding any potential climate change route map and/or score card. In the final task, we assessed the feasibility of implementing these tools to communicate climate change progress and actions in Scotland. This assessment also considered the availability of data that could be used to inform these tools.
Summary of findings
- We found limited literature on the use and effectiveness of route maps and score cards in communicating climate change goals and actions.
- We also found limited international examples of the use of both tools by national governments and public sector bodies. We identified examples of UK-specific route maps developed in relation to climate change and other policy objectives, particularly in the public sector, and score cards developed by pressure groups and NGOs.
- The public workshops indicated moderate enthusiasm for a visually engaging and descriptive route map. This sentiment was also echoed in the stakeholder organisation workshop, where Adaptation Scotland’s Community Climate Adaptation Route map was highlighted by two participants. However, there were doubts about the validity and usefulness of route maps. Many users felt that these would unfairly place the responsibility for achieving climate change targets on individuals. There was an almost universal lack of interest in a score card as a climate change communication tool from both the public and stakeholder organisations.
- Workshop participants in both groups found it challenging to suggest what metrics should be used in both tools, and where they did, these linked to personally relevant actions. Examples included recycling and Ultra Low Emission Zones (ULEZ). However, in the literature review, we found evidence of applicable indicators that were supported by responses given at the stakeholder workshop. These include the Climate Change Committee’s adaptation indicators and Defra’s environmental indicators.
Our research concluded that a climate change route map and/or score card is most likely not the appropriate means for the Scottish Government to communicate climate change progress and actions to the public and stakeholders. This conclusion is based on the overall lack of support within the workshops for these tools, the lack of evidence on their effectiveness within the literature, and the limited international examples of similar methods. Of the two tools, some evidence that a visually engaging route map could be effective, but this is not conclusive.
Recommendations
We cannot confidently recommend that the Scottish Government use a score card or route map, for the reasons summarised above. However, if the Government wishes to develop these tools, or any other communication method, we have provided recommendations on the key communication principles these should follow.
We found little evidence on alternative approaches to communicate climate change progress and/or goals in Scotland; therefore, we cannot provide recommendations in these areas.
Recommendations on designing any future climate change communication method are summarised as follows:
- Keep it visual – users are much more likely to engage with content presented in illustrations and infographics. The visual elements should be clear and easy to understand and complemented by minimal text narrative to help users understand its content.
- Focus on positive messaging – users are more likely to be engaged and energised to take climate action if they can understand what the positive outcomes will be. Users are less likely to engage with negative messaging, as this is perceived as judgemental.
- Relate outcomes to personal actions – users are more likely to be engaged if they can understand what actions they need to take to achieve wider climate goals/targets; and they will be interested in understanding the cumulative impact of their actions. An example of this messaging could be: “If everyone in Scotland were to forego one car journey per week, we would be 5% closer to meeting our transport emission reduction targets and would improve air quality and congestion by 8%”.
- Emphasise the co-benefits – users are interested in knowing the co-benefits of taking climate change action for them. For example, additional benefits of reducing transport emissions such as improved air quality and health improvements from active travel should be clearly communicated. See point 3 for an example.
- Provide contextual detail for those who want to see it – some users will want to understand the detail behind any climate change goal/target and the actions required to achieve them. This information should be provided alongside any visual communication, rather than within. This will allow those users who want to explore the details to do so, without diluting any visual elements.
- Emphasise roles and responsibilities – to achieve credibility and legitimacy in the eyes of the users, any communication should clearly detail the roles and responsibilities of different agencies in achieving climate targets and goals. This is to reassure users that the actions, effort, and cost of achieving these goals is being fairly shared. Users, particularly the public, believe that the Government and businesses have the main responsibilities in achieving climate change targets, with the public providing a supporting role.
- Consider indicators carefully – develop indicators to help communicate progress towards climate change goals, according to the following principles:
- Choose indicators that will be directly affected by the actions detailed in a route map or score card.
- Emphasise that indicators are not definitive. This will avoid fixation on indicators that could lead to perverse action, which does not lead to environmental benefit.
- Choose indicators that are easy to update in a timely manner; for example, Electric Vehicle registrations where data is released on a monthly basis.
- Choose indicators that are expected to remain relevant as government policy and the wider context progress.
Abbreviations table
|
Scottish Government’s Climate Change Plan | |
|
CCC |
Climate Change Committee |
|
DBEIS |
Department for Business, Energy & Industrial Strategy |
|
Defra |
Department for Environment, Food and Rural Affairs |
|
DESNZ |
Department for Energy Security and Net Zero |
|
ENRD |
European Network for Rural Development |
|
ENEI |
England Natural Environment Indicators |
|
GHG |
Greenhouse Gas |
|
International Energy Agency | |
|
JNCC |
Joint Nature Conservation Committee |
|
Key Performance Indicators | |
|
NAEI |
National Atmospheric Emissions Inventory |
|
NGO |
Non-Governmental Organisations |
|
SSN |
Sustainable Scotland Network |
|
TDUK |
Timber Development UK |
Introduction
The Scottish Government’s Climate Change Plan sets out the ambitions to meeting the target of achieving net zero emissions by 2045. Achieving this target will require collective action across local government, industry, and society. Regarding individuals within society, the Climate Change Committee (CCC) estimates that 60% of the changes needed to meet Net Zero will require at least some element of behaviour change (CCC, 2019). Therefore, communicating these changes in a manner that generates engagement and facilitates change is crucial if Scotland is going to achieve its climate targets.
Recent research surrounding climate change messaging and public engagement around public action in Scotland has suggested that the public could find a climate change route map and/or score card useful to communicate the key milestones, required actions and progress found within the Climate Change Plan. This research will establish if either of these communication methods are an appropriate tool in communicating to the public. It will also detail how a climate change score card and/or route map, if feasible, could be developed and used, along with the data needed to inform this and to what extent it is available. Effective communication strategies have the potential to accelerate positive public behaviours and increase buy-in to policies that are attempting to reduce emissions.
Given this context, there is a need to explore in greater depth the usefulness and viability of a climate change route map and/or score card for Scotland. Therefore, this research has explored:
- The capabilities, useability, and best practices of route maps and score cards
- Their applicability in the Scottish context
- The needs, preferences, and expectations of potential users; and
- The feasibility of delivering a route map and score card based on (1), (2), and (3), above.
This research is broken down into the following three stages, as illustrated in Figure 1:
- An evidence review stage, including a literature review to identify the capabilities, usability, and applicability of both tools. This informs the discussion prompts for the engagement stage;
- An engagement stage, including a workshop with stakeholder organisations and five public workshops. This stage identifies the needs, preferences, and expectations of potential users; and
- An assessment stage to assess the feasibility of implementing both tools. This is based on literature from the review stage and information from both workshops in the engagement stage.

Figure 1: Research methodology for assessing the feasibility and requirements of developing a route map and scorecard
Literature review
This section provides an overview of academic literature and relevant examples of route maps and score cards for climate change policy communication and evaluation. We present an overview in relation to capabilities and useability, highlighting best practice to inform the applicability of both resources in the Scottish context. This informed the development of discussion points for the workshops (section 4) to understand needs, preferences, and expectations of potential users in subsequent sections of this report.
Background
Relevant surveys have indicated the public still views climate change as a global emergency (UNDP, 2021; Drews et al., 2022). In the Scottish context, there is public concern over climate change and support for climate change policies, including Scotland’s net zero policies (Scottish Government, 2020b), such as the Climate Change (Emissions Reduction Targets) (Scotland) Act (Scottish Government, 2019) and the Climate Change Plan (Scottish Government, 2020d). Research suggests that Government actions (Hammar and Jagers, 2011; Drews and van den Bergh, 2016; Davidovic and Harring, 2020; Wong and Lai, 2022) combined with effective communication and dissemination (Engler et al., 2021; Nursey-Bray, 2023) can lead to policy support and engagement.
However, recent studies indicate a public lack of understanding of climate change policy terms and the actions needed to achieve climate targets in Scotland (Scottish Government, 2020b; Scottish Government, 2021a). These complexities and uncertainties, as well as the presence of deliberate misinformation (Brulle, 2014), complicate the communication and adoption of climate policies (Budescu et al., 2009; Henderson-Sellers, 2011; Brulle and Roberts, 2017).
We have explored several methodologies in the literature for effectively communicating climate change impacts and policy. For instance, Jones & Peterson, (2017) integrated research findings from climate change science communication with a literature narrative policy framework. Their recommendations include using narratives, tailoring to audiences for relatability, and clearly linking narratives with impacts including risks and benefits. Nursey-Bray, (2023) also states that communications on climate change impacts should be tailored to the right audience, but also highlights that communications must be delivered by trustworthy messengers to be effective.
Similarly, Howarth et al., (2020) encourage the use of narratives to enhance climate science communication and Cameron et al., (2021) explore storytelling methods in addition to visuals in communicating policies. This includes the use of video, text, and maps. Wider studies also conclude that visual storytelling could better improve comprehension (Davidson, 2017; Mirkovski et al., 2019). León et al. (2023) explore social media as a platform and strategy for climate change communications. The authors conclude that including higher levels of interaction in social media strategies remains a challenge but could lead to more effective public engagement.
A study on communicating climate change after COVID-19 (Howick et al., 2020) suggested that a route map identifying clear targets towards net zero policies would aid public understanding of how targets can be achieved. This recommendation was driven by the perceived effectiveness of Scotland’s route map through the COVID-19 crisis (Scottish Government, 2020a). This route map presented various scenarios in the form of criteria-defined phases, with further information on current/future public restrictions through which users could understand upcoming mitigation targets and milestones. The study suggested that route maps can improve communications by providing clear and concise overviews of complex policies. This can aid in the understanding of objectives, key stages, uncertainties, and timelines. Furthermore, Scotland’s Climate Assembly identified a ‘route map’ and an accompanying ‘scorecard’ as potential communication and accountability resources for the Scottish government (Scottish Government, 2021b).
Route maps
The review of resources used to communicate climate change policies revealed that ‘roadmaps’ and ‘route maps’ are terms that have been used interchangeably in the literature to communicate objectives in a metaphorical sense (McGarry et al., 2022). The key features of these tools are their use in identifying objectives and synthesising the main elements of a strategic plan into high-level information. Visual representations usually accompany these tools. Blackwell et al., (2008) present a useful description, referring to route maps as a diverse range of resources used to organise and communicate information related to future plans. However, it is important to note that there is no strict definition of what ‘route maps’ should include, leading to a wide variety in methods employed under this heading.
Capability and useability
Whilst route maps take many forms, they are typically used as engagement tools. Route maps provide contextual information and long-term perspectives in climate policy documents or action plans, outlining key objectives and timeframes.
Notable examples of route maps used for communicating climate change targets include the Roadmap for the Global Energy Sector (IEA, 2021), the Scottish Government’s route map to achieve a 20 percent reduction in car kilometres by 2030 (Scottish Government., 2022) – see Figure 2, the net zero roadmap for the timber industry (TDUK, 2022), and the 2030 route map for water companies (Water UK, 2020). Appendix B of this report presents a list of reviewed route maps, including links for further exploration. The image in Figure 2 presents the aforementioned route map, used to illustrate achieving a 20% reduction in car kilometres by 2030. Figure 2, which shows a descriptive route map, represents the most common type of route map we identified during our review.

Figure 2: Infographic from a route map to achieve a 20% reduction in car kilometres by 2030 (Scottish Government, 2022)
The route maps we identified range from international to local and sectoral-specific applications. Our review revealed that there are limited international examples, with most related route maps coming from UK governments and other public sector bodies. For example, Glasgow City Council published the Circular Economy Route map for Glasgow 2020-2030 (Glasgow City Council, 2020), detailing the vision for the implementation of a circular economy in Glasgow. These public sector documents represent long-term strategies and often detail high-level goals/ambitions and the actions required to achieve them.
There is some variation in the level of detail provided within existing route maps. Some detail specific milestones and indicators, such as the Agricultural Reform Route Map (Scottish Government, 2023), while others simply state a high-level vision, like the Welsh Public Sector Route map (Welsh Government, 2021). These types of route maps have generally been developed within the last decade in response to Local Authorities and other public sector bodies declaring climate emergencies and agreeing to temporal net zero targets. As such, there has been limited scope to explore the effectiveness of either methodology or the effectiveness of route maps in general thus far.
We can consider the key properties of the existing route maps and the overlapping practices between them in the potential development of a route map in the Scottish context. The observed key properties include a general trend of communicating high level climate change policy ambitions, accompanying visual representations, the use of relatable indicators, and time-bound milestones. Most route maps include avenues for further exploration, such as links or supporting documentation, to allow users to find more information where available.
Applicability in the Scottish context
Our review showed that route maps have already been applied by the Scottish Government and Scottish public sector bodies (Scottish Government., 2022; Sniffer, 2023; Scottish Government, 2023). We identified 9 relevant route maps used by the Scottish Government and Scottish public sector bodies that communicate strategic plans for achieving net zero (see Appendix B).
These route maps outline clear pathways using key areas, and milestones, and time bound targets, all accompanied by visual representations. Therefore, the Scottish Government could follow a similar approach in designing a document that outlines the specific objectives, along with the milestones and indicators for the CCP.
This process is well understood and would complement existing documentation. It also enables the inclusion of a broad range of information and detail, enhancing the readers’ understanding of why specific objectives need to be achieved along with an outline of the wider context in which they sit.
If the same approach was to be followed for a climate change route map, key milestones, actions, and targets should be specific, measurable, achievable, and time bound. This is particularly important if they cover an extended period. Any future route map should include visual aids to present data and information in a clear and understandable manner. It may also prove useful to illustrate the interconnections between different actions and how they contribute to overarching goals, as seen in the Community Climate Adaptation Toolkit, (2023).
Limitations
Despite the familiarity of such an approach, there are limitations that should be taken into consideration. The static and informational nature of these documents may not achieve engagement with the public. The documents identified in our horizon scanning exercise vary in length and detail, with some consisting of over 80 pages. Larger documents of this type are highly unlikely to be read in detail by members of the public. For this reason, they may not be effective in communicating climate change objectives, progress, and actions.
Consideration also needs to be given to ‘hard to reach’ groups in terms of accessibility. The reviewed route maps were accessible through the webpages of publishers. This means they may not be suitable for groups who find it harder to access those
The route map approach does not allow dynamic reporting of specific indicators, as the document is produced in a static report form. Whilst this allows a large amount of contextual data to be included, there are issues surrounding updateability and relevance as the wider context changes over time. These issues may limit the ability to communicate key milestones, actions, and progress on tackling climate change to the public. This is because the public is likely to want to track progress against key climate change ambitions over time. To meet this need, a route map would need to be updated on a regular basis to display progress against the overarching themes and indicators identified. Such an approach would be time consuming and perhaps impractical due to the potential complexity of climate change indicators.
The absence of monitoring and the continual assessment of progress in route maps can also raise uncertainties. Monitoring also demonstrates the effectiveness of actions and highlights progress towards policy objectives (ENRD, 2021; UK Government, 2022).
Scotland’s Climate Assembly indicates a need for a score card to monitor and assess the progress towards net zero (SSN, 2022) which can potentially serve as an accountability resource.
Score cards
The available score cards in the literature cover a wide range of fields and sectors. For instance, the health-based score card developed by Beaglehole & Bonita, (2008) assesses global public health based on five areas key to the agenda of public health, and Ahmed & Rajaleximi, (2019), and Kennedy et al., (2013), use score cards and behavioural score cards respectively for assessing credit scoring. The types of score cards available in the literature are dependent on their use cases. Buys et al., (2014), developed a ‘sustainability scorecard’ to enable an informed and holistic assessment of the sustainability of industries based on assigned sustainability scores. On the other hand, Khazai et al., (2018) developed a ‘performance scorecard’ that quantitatively assesses resilience parameters to measure urban disaster resilience, and Peterson St-Laurent et al., (2022) produced an ‘adaptation scorecard’ evaluating climate adaptation projects based on 16 criteria.
Climate change related score cards found within the literature have been used to assess policy commitments and actions of public sector bodies and wider sectors towards achieving climate goals and targets, in an attempt to increase accountability and transparency (McKee et al., 2017).
Our review indicates that there are no climate change score cards developed by national governments or public sector bodies. A possible reason for this would be that it could be perceived as disingenuous for a government to assess its progress against self-developed metrics. This is made more complex by the fact that many score cards use qualitative data in assessment, leading to judgement calls when calculating scores/rankings.
Capability and usability
Score cards typically provide intuitive ranking systems based on selected indicators. The capabilities of score cards are flexible, as ranking/scoring metrics can be applied to a wide range of indicators, and the methodology in determining scores/ranking can be as simple or complex as needed. For example, the organisation Climate Scorecard has a very simple methodology where ‘yes/no’ determiners are used to rank climate change progress across a small range of nations (Climate Scorecard, n.d.).
The Climate Change Performance Index includes a comprehensive range of indicators and assessment techniques, accompanied by a technical report (Burck et al., 2022). Similarly, the Climate Scorecard from the Centre for Biological Diversity Action Fund presents a binary method of assessing Joe Biden and Bernie Sanders’s stated climate policy actions (Centre for Biological Diversity Action Fund, 2020), while Defra, (2019) apply multiple indicators to measure progress towards the targets set out in the UK’s 25 Year Environmental Plan. In either case, score cards typically involve the use of indicators to assess selected themes, with indicators sometimes sub-divided into additional ones for more complex assessments, as seen in Cooke et al., (2022).
While the score card assessments can be subjective (Centre for Biological Diversity Action Fund, 2020; Climate Scorecard, n.d.), some score cards use indicators and metrics which usually relate to datasets used to measure progress against related policies. For instance, Burck et al. (2022) present a Climate Change Performance Index where 59 countries are ranked based on their climate change performance, with an overall score given to each country. This score is derived from four main index categories, GHG emissions, renewable energy, energy use and climate policy, against which each country is individually assessed. A published methodology paper details how scores are assigned to each country by index category. Figure 3 presents the climate change performance index rating table developed by Burck et al. (2022) for 63 countries.
Most score cards provide easy to understand information on progress towards specific climate goals, allowing users to make quick comparisons between the entities that have been assessed. Intuitive ranking metrics and visual representations such as bar graphs (Burck et al., 2022) or traffic light systems (Cooke et al., 2022), allow information to be distilled quickly which could make this tool suitable for members of the public in Scotland who are looking for a rapid overview of progress achieved towards high-level climate goals.
Many of these types of score cards are generally interactive, with some hosted as online dashboards, where users can interrogate certain indicators/metrics if they would like to find out more detail. This allows users to drill down into areas they are personally interested in gaining a deeper understanding.
There is limited evidence to assess the effectiveness of score cards for climate change reporting and communication. Additionally, there are no available assessments of their effectiveness that we can draw upon. However, best practices can be inferred from the key characteristics of available score cards.

Figure 3: The climate change performance index by Burck et al. (2022).
Users typically draw on information from score cards to inform decision-making, as shown by Berke et al. (2015), who develop and test a climate change resilience score card that assessed how local plans in Washington DC (U.S.) and in the cities of Nashua and Norfolk (Malecha et al., 2018) target areas most prone to hazards. The score card evaluated planning documents using categories, including community vulnerability, policy response, and plan integration, to assign scores. The effectiveness of local plans was then assessed by policy makers and, based on the results of the scorecard, the city of Nashua amended its hazard mitigation plan, while Norfolk revised its comprehensive plan.
Score cards that use binary assessment methods might offer greater clarity but can potentially oversimplify complex situations, missing important information and face difficulties when measuring progress without quantifiable metrics. Therefore, although this approach could be easily understood by the public, the Scottish Government might need to supplement it with other evaluation methods to ensure comprehensive tracking of progress against its climate goals.
Limitations
There are potential drawbacks to score cards, include data availability, the potential for subjectivity, and the possibility of overlooking external factors influencing performance and omitting the indirect impacts of policies. Berke et al., (2015) highlight some important additional limitations which should be taken into consideration in the development of score cards, including the reliance on proxy indicators to represent climate vulnerabilities and data availability.
The ranking and scoring methodology utilised in any potential score card will need to be robust and transparent to ensure that the ranking/scoring results are viewed as trustworthy by the public. The majority of score cards publish some information on their methodologies, with varying detail articulating how judgements have been formulated.
Interestingly, an Environmental Audit Committee inquiry on an environmental score card Memorandum from the UK Government (UK Parliament, 2015) highlighted the limitations of environmental indicators, and provided the following cautionary notes against implementing an environmental score card:
- The reasons why indicators change and the levers for influencing them are not always clear. This can limit their value as a tool for making and evaluating policies.
- It can lead to a fixation on indicators rather than underlying issues which might result in perverse action which does not lead to overall environmental benefit.
- It may not be possible to keep the score card sufficiently current to influence policy due to lags in data collection and impacts on indicators.
- The Government will continue to need to prioritise its environmental interventions and priorities may change over time as evidence improves or the political landscape changes. A score card would need to be sufficiently flexible to respond to these changes.
Many of these limitations would also apply to the Scottish Government if they were to look to produce a score card that would provide climate change indicators, which are of a similar nature to environmental indicators.
Data availability for both methodologies
Smeets et al., (1999) present a set of environmental indicators that reflect trends in the state of the environment and monitor the progress made in realising environmental policy targets. This includes descriptive, response, and performance indicators such as GHG emissions, forest and wildlife resources, the concentration of phosphorus and sulphur in water bodies, recycling rates of domestic waste, and state environmental expenditure.
Similarly, Defra, (2019) also published a comprehensive set of 66 indicators describing environmental change that relates to the 10 goals within the 25 Year Environment Plan (Defra, 2018a). This framework includes indicators across 10 broad themes (covering natural capital assets, including air, water, seas and estuaries, wildlife, and natural resources), some of which relate to climate change. This framework shows the condition of these assets supported by available data. For instance, one of the indicators for the theme ‘Air’ is ‘Emissions for five key air pollutants’ which is linked to annually published emissions data. The assessment of change then assesses progress in the reduction of emissions for a date range.
In the Scottish context, the National Performance Framework presents Scotland’s national outcomes based on a range of 81 National Indicators, including economic, social, and environmental indicators (Scottish Government, n.d.). Some environmental indicators included within this framework can also be used to monitor progress against Scotland’s Climate Change Plan (Scottish Government, 2020c).
The Climate Change Committee (CCC) has also published over 100 indicators built around policy needs. These indicators address the risks identified in the UK’s Climate Change Risk Assessment (CCRA) and objectives of Scotland’s Climate Change Adaptation Programme (SCCAP), measuring and monitoring progress in building a climate ready Scotland (CCC, 2019). The indicators developed cover a range of themes, including the natural environment, building and infrastructure, and society, with associated sub themes and indicators.
Potential indicators, along with references to supporting data, are also highlighted in Annex B of Scotland’s Climate Change Plan (Scottish Government, 2020c). The sector policy outcome indicators cover electricity, buildings, transport, industry, waste and circular economy, agriculture, and land use.
We have provided a table of potential indicators in Appendix E.
Similarities and differences
Some similarities and differences exist between route maps and score cards relating to their capability and useability.
Both route maps and score cards have been used as public facing communication tools, and typically use visual representations to distil complex information. However, route maps organise and communicate plans (Blackwell et al., 2008), while score cards are used to monitor and assess the progress towards plans, and in some cases, holding leadership accountable (McKee et al., 2017).
Public sector bodies, mostly in the UK, have developed most route maps communicating climate change policies as a means of engaging with the public on strategies and milestones. In contrast, available score cards have been developed by independent bodies assessing a government’s commitment to its climate change policies.
During our review, we found no instances where both tools have been used simultaneously to communicate climate policy and assess the progress towards it. This is likely due to the differences in capabilities of both tools, their use cases, and the typical creators.
The needs, preferences and expectations of potential users
We have broken this section down into the key questions and themes identified in the research specification. We have assessed and identified the needs, preferences, and expectations of potential end-users of a climate change route map and/or scorecard. The ‘end user’ has been identified as the public in this context.
User needs
Generally, members of the public in our workshops viewed Scotland’s performance regarding climate change progress as fair or reasonable. Scotland was also typically seen as outperforming other countries and other parts of the UK. However, while many felt there is an overarching plan, or that they knew action is being taken, they felt progress is not always visible. Participant responses also noted a need to better communicate progress towards climate change goals, along with the key actions that are happening at different scales and how they link up with existing policy commitments. They were also unaware of what progress was being made.
“On paper it would probably look really good, but when it comes to, you know, hard facts about what they’ve done, or getting done, or intend to do soon, I would have a lot lower score.”
Both the public and stakeholder groups emphasised the need to connect any future climate change communications to personal actions that end users could relate to. This is to understand their own personal contributions to wider goals/progress.
“The bin waste and the food waste, the recycling – I do all that. I have no clue where it goes or what it does. Am I actually making a difference? I just do what the bin says, and every two weeks it gets picked up.”
However, the stakeholders stressed that focus should not solely be on end users to achieve the changes needed, as climate targets are a wider scale issue. Stating that users might find it more meaningful to participate in community actions rather than individual changes.
The public workshops also highlighted a wider desire for more positive framing of communication, stating that existing communication is too negative. It is often perceived as directive, telling people what actions they should take, rather than explaining why they should be taking action. Suggestions provided on positive framing included highlighting co-benefits, such as health and saving money. This was reinforced by the stakeholders who suggested that communicating the positive benefits of achieving targets, such as cleaner air or more abundant wildlife, would encourage change.
User preferences
Within both sets of workshops, we explored the key preferences of end-users regarding a potential climate change route map and/or scorecard. This focused on their preferred communication channels, content, and appearance based on the examples presented.
Communication channels
In the public workshops, despite recognition that a multi-channel approach is needed to reach all demographics, many participants expressed a preference for using social media to find out more about how Scotland is tackling climate change. A range of social media platforms were frequently highlighted as the most appropriate way to communicate, particularly by and for younger groups. Some questioned the value of TV adverts, but suggested alternative uses of TV, such as bulletins after the news in the format of a party-political broadcast, or Covid-style briefings.
“Well, social media is okay, but then it disappears… We’ve just got our third bin and we’ve got information through the post to say what goes in every bin. So, I think it’s a good idea through the post as well.”
Stakeholders suggested that both traditional and modern modes of communication were effective. For instance, participants suggest social media, podcasts, tweets, and emails were commonly used. However, it was suggested that accessibility issues might arise with modern modes of communication and that traditional means of communication could be equally effective.
Scorecard/route map content and appearance
Public groups showed a clear preference for simple tools which are not overwhelming and help people engage and understand the information quickly. In spite of this, there were frequent calls for more information to be available about why, when and by whom each policy or plan is being implemented. Suggestions for how this demand for more information could be accessed without overloading a simple tool included:
- Breaking down a visual roadmap or score card into separate elements which could be used in social media posts or posters.
- The potential for a website, platform, or hover-over functionality to provide more information, though few respondents spontaneously called for a large website or dashboard, presenting them with detailed information.
Of the three examples presented to participants, there was a clear preference for a visually engaging route map such as the ‘Transport Scotland route map to achieve a 20 per cent reduction in car kilometres by 2030’ (see Figure 2).
This example was widely preferred because it:
- Presents the information in a visually engaging, colourful, attention-grabbing way.
- Highlights clear timeframes and goals.
- Breaks down information into bite-sized chunks and short, concise sentences.
- Includes and distinguishes between legislation and investment.
- Considers accessibility e.g., it is easier to read or digest for dyslexic or neurodiverse individuals or might spark interest in young people.
- Could be adapted or broken down for different channels, such as linearly on a bus, shown in parts at a bus stop, featured in a social media post, or placed on a fridge.
These themes were echoed by stakeholders who commented that visuals in a route map which communicate how different areas can be affected by climate change would be useful. Similarly, the connection between people and nature was identified as useful in aiding the public to understand the relevance of climate change action and targets, with agriculture being a major topic in this regard. Participants also stated that communication styles should be tailored to specific sectors.
‘Trusted messenger’ participants also provided recommendations for the development of route maps, stating that route maps should:
- Lay out actions that communities can take on climate action and be presented in a visually engaging manner and include functionality to interact with the data;
- Explore how existing reporting requirements connect with route maps; and
- Investigate ways to streamline reporting so additional reporting requirements are not placed on public bodies.
However, stakeholders raised concerns over the granularity of a potential route map. It was suggested that a single overarching route map would be useful, but risks either being too complex or too high a level. Having the functionality that allows users to interrogate the supporting data and information and explore different policy areas including buildings, energy, nature, and transport, would be useful. It was also suggested that support needs to be available for access and use, and ways for the public to get involved should be included, such as providing contact details to get involved with a new bike path. One stakeholder who commented summarised this:
“A route map would be useful if it had a simple graphic on the landing page, with the added functionality of being able to interrogate the information further and to provide further context and specific information”
Score cards
Public groups were shown three examples of score cards (see Appendix C). The preferred choice was the Climate Change Performance Index (Burck et al., 2022) (see Figure 3), for a variety of reasons:
- The graph itself is visually engaging, with the colours clearly outlining a ranking and what information is being used.
- The ranking system enabled readers to readily compare the UK’s progress with others.
- It is based on a variety of metrics.
- The key typically made it easy to follow.
Stakeholders did not express a preference for score card content, noting that while score cards could use numbers as an engagement tool, they were not a public facing resource and would provide less value than a route map. A participant referred to score cards as a “political football”, stating that metrics already exist to assess and monitor progress such as biodiversity intactness index used to highlight Scotland’s biodiversity crisis.
- User expectations
Scorecard/route map content
Members of the public and stakeholders both expressed strong expectations of what a climate change score card and/or route map should look like, if this was to be developed by the Scottish Government.
One expectation raised by the public was the need for greater recognition of the barriers they face in taking action. A lack of, or more limited, services and infrastructure was noted across the groups, but was more frequently raised by those in rural areas. Some challenges included fewer or less frequent recycling facilities, fewer or closing local services such as banks and GPs, meaning travel is required to access the same services elsewhere, and reduced public transport options, which heightens reliance on cars. A route map needs to consider or acknowledge that these issues exist, particularly in rural areas.
“Because it’s alright us sitting here saying we all need to do more, but we all need to be able to do more.”
This was part of a wider dialogue suggesting that any potential route map and/or score card should emphasise the need for a ‘just transition’ and recognise that certain groups are more disadvantaged than others and that the benefits of any change should be equally shared. For example, stakeholders noted that harder to reach groups should be targeted by any communication method. Participants recommend that there should be a balance between the scale of the challenge and the method of communication, focusing on ‘empowering or equipping rather than education’.
This point was further built upon, with stakeholders suggesting that the onus should not be placed wholly on individuals. Stakeholders stated that in implementing route maps, clear roles and responsibilities should be defined for each action and outcome. In making this clarification, further responses from participants suggested making clear distinctions between public and government actions. In fact, a participant suggested that there be a separate route map for the government and the public, showing how a public route map could connect to the government route map.
It was also suggested that national and regional route maps should clearly indicate where people can take part, mentioning the Community Climate Adaptation Route map[1] as an example of where this has been implemented at multiple levels. The participant noted that, given the public’s interest in what agencies/government are doing, it might be best to signpost the public to resources for community action to avoid conflating the two responsibilities. This is because conflating personal or community action with public or private sector actions could result in more complex plans, which could turn the public off the messaging. It was recommended that simple messages be attached to route maps to avoid such complexity.
Some participants described how a route map could be useful, or the benefits of having one readily available. These included that it would help to provide some reassurance that there is a plan in place, or that action is being taken, and that it helps to provide advance notice of changes and actions which a household might be required to make in the future. It was noted that this helps provide some information for longer-term planning, for example, how long a household might have available to save to buy an electric vehicle.
Metrics
When the public groups were asked about the metrics or information, they would like to see on a score card or route map, only a few issues were consistently or frequently raised. Suggestions included: progress in reducing emissions or carbon footprint; increased use of renewable energy; improved recycling rates; and reduction in use of single-use plastics and driving mileage. Earlier parts of the discussion highlighting the importance to individuals of understanding their own personal contribution, making it clear that a score card might only be of use or interest if it relates directly to what people are doing on a day-to-day basis.
“I think it goes back to it being relatable and the small things and the impact that has. So it’s letting us know the small things that we do and how that impacts and improves things. For me, anyway. It’s got to be relatable to be interesting.”
The public groups also widely agreed that while the Scottish Government or local government may need to provide data, the validity of any tools should be independently assessed. All groups agreed on the need for independent oversight, emphasising that the Government should not be able to ‘mark its own homework’. A few also noted that an external body could help ensure the consistency of data collection and use. Suggestions for who might provide oversight included SEPA, academics and third-sector organisations.
“I think the Scottish Government can collect it, but they do need an outsider to come in and make sure that they’re not making it look like we’re better than we are.”
Stakeholders offered a broader suggestion of metrics that could be utilised by both communication techniques. Stakeholders suggested that it would be important to report progress against key drivers or themes such as transport, agriculture, and energy, as communities want to know how policy is tackling these sectors as well as what real progress is being made.
Stakeholders acknowledged that accessible data and metrics already exist which could be used to develop a route map/scorecard. However, concerns were raised over local and individual understanding of metrics. As such, it would be important to use metrics relevant to the public. Local air quality was given as an example that the public would easily understand and engage with. However, it was also stated that duplication and contradiction with existing metrics should be avoided so as not to dilute or cloud climate messaging. It was also suggested that “perhaps future resourcing should focus on engagement around metrics which could have more impact than creating a scorecard”. We have discussed what these metrics could look like in our recommendations.
In the public workshops, frequently mentioned examples of climate change progress referenced recycling, the introduction of Low Emission Zones, and more renewable energy and wind farms; however, not all participants viewed these developments favourably. Other signs of progress included being a net exporter of power, bike paths, phasing out gas boilers, becoming carbon neutral or net zero, and more electric cars and buses on the road. Although we cannot draw definitive conclusions on why these topics were mentioned, it is possible they were highlighted due to recent public discourse surrounding them.
Summary of workshops
Both public and trusted messenger workshops indicated a need for better communication regarding climate change targets and the actions needed to achieve them. However, it was not indicated that a route map and score card or an alternative tool would be appropriate for this purpose.
The workshops indicate a need for:
- Positive framing;
- Greater recognition of the barriers to individuals taking action;
- Communicating the wider benefits of taking action; and
- Relating climate targets to community and personal actions supplemented by information about why action is being taken.
There was moderate enthusiasm for a route map but a lack of enthusiasm for a score card in both workshops. While the tools can complement each other, overall, there is greater interest in understanding where progress is being made.
There was an overall preference for more descriptive but visually engaging tools with simple, concise text. However, there is still a desire for more detailed information which could be accessed via the tools.
The public and stakeholders found it challenging to suggest what metrics should be used on a scorecard; where they did, these again linked back to personally relevant actions, such as recycling. There was also widespread agreement that any tools should be independently assessed. Concerning the development of a route map and/or scorecard, stakeholders stressed avoiding placing additional burdens on reporting on both local and national governments. This suggests that, should the government proceed with the development of a scorecard, indicators would need to be tied to existing metrics and data sources where available.
Conclusions
Our research has revealed:
- There are no international examples of a climate change route map and or/score card being employed by another national government. Most existing route maps have been developed by UK local authorities and public sector bodies, and available score cards have been developed by independent bodies.
- There is a gap in the literature regarding the effectiveness of route maps and score cards for climate change communication and reporting.
- There seems to be no apparent need for a route map, but there is a moderate preference towards visually engaging yet descriptive route maps. such as the ‘Transport Scotland route map to achieve a 20 percent reduction in car kilometres by 2030’ and the ‘Community Climate Adaptation Routemap’. This aligns with our findings in the academic literature on climate change communication methodologies. Effective climate change communication methods should employ visual presentation methods whilst also creating a strong narrative that conveys clear milestones in an easy-to-understand format.
- There is no need or preference for a scorecard, and there is no indication of specific metrics or indicators that could be applied in the development of a potential scorecard. Participants in the public workshops were more concerned with evaluating and influencing personal actions like recycling, and stakeholders raised concern over how familiar the public would be with reporting metric and indicators.
- There is little indication of what alternative methodology would be effective.
We have suggested a range of indicators that could potentially be utilised if the Scottish Government decides to implement a climate change progress and goals communication tool. This can be found in Appendix E, and has been extrapolated from the findings of the literature review and indications from workshops.
Our research has suggested that there is still the need for improved climate change communication methods. Although we have not been able to identify which methods would be effective, in the recommendations, we have highlighted the key principles we have uncovered that will improve climate change communications. The details of these principles are covered below in section 7.1.2.
Recommendations
One of the aims of this project was to “make recommendations for how the recommendations for a route map and score card could be taken forward separately or in combination in Scotland”. As detailed in our conclusions, we did not find strong evidence that either approach is effective in communicating climate change goals and/or progress.
Therefore, we cannot confidently recommend that either approach is taken forward by the Scottish Government.
Alternative approaches
We found little evidence on alternative approaches that could be taken to communicate climate change progress/goals in Scotland. Therefore, we cannot provide recommendations that explicitly highlight other communication methods that have been successful.
We do, however, note that our research has indicated that there is a need to improve climate change messaging in Scotland. This has the potential to improve public and stakeholder buy in and contributions towards climate change goals and targets.
Based on the findings of our research, we can provide recommendations on how any future climate change communication method, whether it be a route map, score card or an alternative approach, should be designed. These recommendations are summarised below.
Communication fundamentals
- Use visual methods – users of a potential route map/score card are much more likely to engage with its content if it is of a visual nature. The visual elements should be clear and easy to understand and complemented by minimal text narrative to help users understand its content.
- Focus on positive messaging – any future communication method should focus on the positive outcomes/elements of taking climate change action. Users are more likely to be engaged and energised to take action if they can understand what positive outcomes will result from taking these actions. Users are less likely to engage with negative messaging, as this is perceived as judgemental.
- Relate outcomes to personal actions – Users are more likely to engage with a climate change communication method if they can understand what actions they need to take to achieve wider goals/targets. Users will be interested in understanding the cumulative impact of personal actions. An example of this messaging could be: “If everyone in Scotland were to forego one car journey per week, we would be 5% closer to meeting our transport emission reduction targets, and would also improve air quality and congestion by 8%”.
- Emphasise the co-benefits – users are interested in understanding what the co-benefits of taking climate change action will be for them. For example, if reducing transport emissions is listed as a key outcome/goal of a route map/score card, the additional benefits of improved air quality and health improvements from active travel should also be clearly detailed and communicated. See the example in point 3 for an example of how this could work.
- Provide contextual detail, but only for those who want to see it – some users will want to understand the detail behind any climate change goal/target and the actions required to achieve them. This information should be provided alongside any visual communication method, rather than within. This will allow those users who want to explore the details to do so, without diluting any visual elements.
- Emphasise roles and responsibilities – to achieve credibility and legitimacy in the eyes of the users, any communication method should clearly detail the roles and responsibilities of different agencies in achieving climate change targets and goals. This is to reassure users that the actions/effort/cost of achieving climate change goals is being fairly shared. Users, particularly the public, believe that the Government and businesses have the primary responsibilities in enabling climate change targets, with the public providing a supporting role.
- Consider indicators carefully – it will be necessary to develop indicators to help communicate progress towards climate change goals. They should follow these principles:
- Choose indicators where it can be proven that the actions detailed in any route map/score card will directly affect the indicator.
- Emphasise that indicators are not definitive. This will avoid fixation on indicators that could lead to perverse action, which does not lead to overall environmental benefit.
- Choose indicators that are easy to update in a timely manner; for example, Electric Vehicle registrations where data is released on a monthly basis.
- Choose indicators that are expected to remain relevant as government policy and the wider context progress.
References
Ahmed, M. and Rajaleximi, P. 2019. Predicting and Managing Credit Risk By Implementing Score card Using Hybrid Strategy with Trust Rating. . International Journal of Scientific & Technology Research. 8, pp.620–629.
Beaglehole, R. and Bonita, R. 2008. Global public health: a scorecard. The Lancet. 372(9654), pp.1988–1996.
Berke, P., Newman, G., Lee, J., Combs, T., Kolosna, C. and Salvesen, D. 2015. Evaluation of Networks of Plans and Vulnerability to Hazards and Climate Change: A Resilience Scorecard. Journal of the American Planning Association. 81(4), pp.287–302.
Blackwell, A.F., Phaal, R., Eppler, M. and Crilly, N. 2008. Strategy Roadmaps: New Forms, New Practices In:, pp.127–140.
Brulle, R.J. 2014. Institutionalizing delay: foundation funding and the creation of U.S. climate change counter-movement organizations. Climatic Change. 122(4), pp.681–694.
Brulle, R.J. and Roberts, J.T. 2017. Climate Misinformation Campaigns and Public Sociology. Contexts. 16(1), pp.78–79.
Budescu, D. V., Broomell, S. and Por, H.-H. 2009. Improving Communication of Uncertainty in the Reports of the Intergovernmental Panel on Climate Change. Psychological Science. 20(3), pp.299–308.
Burck, J., Uhlich, T., Bals, C., Höhne, N., Nascimento, L., Tavares, M. and Strietzel, E. 2022. Climate Change Performance Index 2023. Climate Change Performance Index (CCPI)., pp.1–32.
Buys, L., Mengersen, K., Johnson, S., van Buuren, N. and Chauvin, A. 2014. Creating a Sustainability Score card as a predictive tool for measuring the complex social, economic and environmental impacts of industries, a case study: Assessing the viability and sustainability of the dairy industry. Journal of Environmental Management. 133, pp.184–192.
Cameron, L., Rocque, R., Penner, K. and Mauro, I. 2021. Evidence-based communication on climate change and health: Testing videos, text, and maps on climate change and Lyme disease in Manitoba, Canada. PLOS ONE. 16(6), p.e0252952.
CAT n.d. Climate Action Tracker (CAT. Climate Action Tracker. [Online]. [Accessed 4 October 2023]. Available from: https://climateactiontracker.org/.
CCC 2019. Final assessment: The first Scottish Climate Change Adaptation Programme. Committee on Climate Change. 2, pp.1–160.
Centre for Biological Diversity Action Fund 2020. CLIMATE SCORECARD. Climate Action Fund. [Online]. [Accessed 5 October 2023]. Available from: https://centeractionfund.org/climate-scorecard/.
Climate Emergency UK 2022. Council Climate Action Score cards 2023. Council Climate Score cards UK.
Climate Score card n.d. Climate Score card Ratings by Country. Climate Scorecard. [Online]. [Accessed 5 October 2023]. Available from: https://www.climatescorecard.org/scorecard/.
Cooke, E., Cussans, A., Clack, A. and Cornford, C. 2022. Climate change and health scorecard: What are UK professional and regulatory health organizations doing to tackle the climate and ecological emergency? The Journal of Climate Change and Health. 8, p.100164.
Davidovic, D. and Harring, N. 2020. Exploring the cross-national variation in public support for climate policies in Europe: The role of quality of government and trust. Energy Research & Social Science. 70, p.101785.
Davidson, B. 2017. Storytelling and evidence-based policy: lessons from the grey literature. Palgrave Communications. 3(1), p.17093.
DBEIS and DESNZ 2023. UK territorial greenhouse gas emissions national statistics. Department for Energy Security and Net Zero and Department for Business, Energy & Industrial Strategy. [Online]. [Accessed 5 October 2023]. Available from: https://www.gov.uk/government/collections/uk-territorial-greenhouse-gas-emissions-national-statistics.
Defra 2018a. 25 Year Environment Plan.
Defra 2018b. England Natural Environment Indicators [Online]. [Accessed 3 October 2023]. Available from: https://assets.publishing.service.gov.uk/media/5fe0ba31d3bf7f3a39b3e2d1/England_Natural_Environment_Indicators_2018_accessV4.pdf#:~:text=The%20England%20Natural%20Environment%20Indicators%20%28ENEI%29%20publication%20has,of%20biodiversity%20indicators%20for%20the%20England%20Biodiversity%20Strategy.
Defra 2019. Measuring environmental change: outcome indicator framework for the 25 Year Environment Plan. Department of Environment Food & Rural Affairs.
Defra 2023. UK statistics on waste. Department for Environment Food & Rural Affairs. [Online]. [Accessed 5 October 2023]. Available from: https://www.gov.uk/government/statistics/uk-waste-data/uk-statistics-on-waste.
DESNZ 2023. Regional Renewable Statistics. Department for Energy Security and Net Zero. [Online]. [Accessed 5 October 2023]. Available from: https://www.gov.uk/government/statistics/regional-renewable-statistics.
Drews, S. and van den Bergh, J.C.J.M. 2016. What explains public support for climate policies? A review of empirical and experimental studies. Climate Policy. 16(7), pp.855–876.
Drews, S., Savin, I., van den Bergh, J.C.J.M. and Villamayor-Tomás, S. 2022. Climate concern and policy acceptance before and after COVID-19. Ecological Economics. 199, p.107507.
Engler, D., Groh, E.D., Gutsche, G. and Ziegler, A. 2021. Acceptance of climate-oriented policy measures under the COVID-19 crisis: an empirical analysis for Germany. Climate Policy. 21(10), pp.1281–1297.
ENRD 2021. The role of monitoring and evaluation in the policy cycle. European Network for Rural Development. [Online]. [Accessed 21 July 2023]. Available from: https://ec.europa.eu/enrd/evaluation/back-basics/role-monitoring-and-evaluation-policy-cycle_en.html#:~:text=Evaluation%20is%20an%20essential%20part%20of%20the%20policy,assessing%20the%20policies%20effectiveness%2C%20efficiency%2C%20results%20and%20impacts.
Forest Research 2023. Woodland Statistics. National Forest Inventory. [Online]. [Accessed 5 October 2023]. Available from: https://www.forestresearch.gov.uk/tools-and-resources/statistics/statistics-by-topic/woodland-statistics/.
Glasgow City Council 2020. CIRCULAR ECONOMY ROUTE MAP FOR GLASGOW 2020 – 2030 [Online]. Glasgow. [Accessed 27 September 2023]. Available from: https://glasgow.gov.uk/councillorsandcommittees/viewSelectedDocument.asp?c=P62AFQDNDX2UT1NTNT.
Green Central Banking 2022. Green Central Banking Scorecard. Green Central Banking. [Online]. [Accessed 5 October 2023]. Available from: https://greencentralbanking.com/scorecard/.
Griffin, M., Gravina, N.E., Matey, N., Pritchard, J. and Wine, B. 2019. Using Score cards and a Lottery to Improve the Performance of Behavior Technicians in Two Autism Treatment Clinics. Journal of Organizational Behavior Management. 39(3–4), pp.280–292.
Hammar, H. and Jagers, S.C. 2011. Can trust in politicians explain individuals’ support for climate policy? The case of CO2 tax. http://dx.doi.org/10.1080/14693062.2006.9685582. 5(6), pp.613–625.
Henderson-Sellers, A. 2011. Changing Climate Change Communication In: The Economic, Social and Political Elements of Climate Change., pp.555–573.
Howarth, C., Parsons, L. and Thew, H. 2020. Effectively Communicating Climate Science beyond Academia: Harnessing the Heterogeneity of Climate Knowledge. One Earth. 2(4), pp.320–324.
Howick, M., Calum, M., Cuthbert, M., Fraser, L., Pinkard, J. and JRS 2020. Communicating on climate change after COVID-19. Climatexchange., pp.1–65.
IEA 2021. Net Zero by 2050 – Analysis [Online]. [Accessed 29 June 2023]. Available from: https://www.iea.org/reports/net-zero-by-2050.
JNCC 2022. UK Biodiversity Indicators 2022. Joint Nature Conservation Committee. [Online]. [Accessed 6 October 2023]. Available from: https://jncc.gov.uk/our-work/uk-biodiversity-indicators-2022/.
Jones, M.D. and Peterson, H. 2017. Narrative Persuasion and Storytelling as Climate Communication Strategies In: Oxford Research Encyclopaedia of Climate Science. Oxford University Press.
Kaplan, R.S. and Norton, D.P. 1992. The Balanced Score card- Measures that Drive Performance. Harvard Business Review., pp.71–79.
Kaplan, R.S. and Norton, D.P. 1996. Translating strategy into action: the balanced Scorecard. Boston, Massachussetts: Harvard Business School Press.
Kennedy, K., Mac Namee, B., Delany, S.J., O’Sullivan, M. and Watson, N. 2013. A window of opportunity: Assessing behavioural scoring. Expert Systems with Applications. 40(4), pp.1372–1380.
Khazai, B., Anhorn, J. and Burton, C.G. 2018. Resilience Performance Scorecard: Measuring urban disaster resilience at multiple levels of geography with case study application to Lalitpur, Nepal. International Journal of Disaster Risk Reduction. 31, pp.604–616.
León, B., Bourk, M., Finkler, W., Boykoff, M. and Davis, L.S. 2023. Strategies for climate change communication through social media: Objectives, approach, and interaction. Media International Australia. 188(1), pp.112–127.
Malecha, M.L., Brand, A.D. and Berke, P.R. 2018. Spatially evaluating a network of plans and flood vulnerability using a Plan Integration for Resilience Scorecard: A case study in Feijenoord District, Rotterdam, the Netherlands. Land Use Policy. 78, pp.147–157.
McGarry, H., Martin, B. and Winslow, P. 2022. Delivering Low Carbon Concrete for Network Rail on the Route map to Net Zero. Case Studies in Construction Materials. 17, p.e01343.
McKee, M., Greer, S.L. and Stuckler, D. 2017. What will Donald Trump’s presidency mean for health? A scorecard. The Lancet. 389(10070), pp.748–754.
Mirkovski, K., Gaskin, J.E., Hull, D.M. and Lowry, P.B. 2019. Visual storytelling for improving the comprehension and utility in disseminating information systems research: Evidence from a quasi‐experiment. Information Systems Journal. 29(6), pp.1153–1177.
Moray Council 2022. Route Map to Net Zero. Moray Council., pp.1–58.
NAEI 2023. National Atmospheric Emissions Inventory (NAEI). National Atmospheric Emissions Inventory. [Online]. [Accessed 5 October 2023]. Available from: https://naei.beis.gov.uk/.
Nursey-Bray, M. 2023. Communicating climate change impacts to Australian coastal and marine communities. Ocean & Coastal Management. 242, p.106667.
Peterson St-Laurent, G., Oakes, L.E., Cross, M. and Hagerman, S. 2022. Flexible and comprehensive criteria for evaluating climate change adaptation success for biodiversity and natural resource conservation. Environmental Science & Policy. 127, pp.87–97.
Safeer, R., Bowen, W., Maung, Z. and Lucik, M. 2018. Using the CDC Worksite Health Score card to Assess Employer Health Promotion Efforts. Journal of Occupational & Environmental Medicine. 60(2), pp.e98–e105.
Safeer, R.S., Lucik, M.M. and Christel, K.C. 2021. Using the CDC Worksite Health Score card to Promote Organizational Change. American Journal of Health Promotion. 35(7), pp.997–1001.
Scottish Government 2023. Agricultural Reform Route Map. Rural Payments and Services. [Online]. [Accessed 5 October 2023]. Available from: https://www.ruralpayments.org/topics/agricultural-reform-programme/arp-route-map/.
Scottish Government 2021a. Climate Change and Net Zero: Public Awareness and Perceptions. www.gov.scot. 2021/034, pp.1–18.
Scottish Government 2019. Climate Change (Emissions Reduction Targets) (Scotland) Act [Online]. Edinburgh: Scottish Government. [Accessed 26 June 2023]. Available from: https://www.legislation.gov.uk/asp/2019/15/enacted.
Scottish Government 2020a. COVID-19 – Framework for Decision Making: Scotland’s route map through and out of the crisis. www.gove.scot., pp.1–46.
Scottish Government n.d. National Performance Framework. Scottish Government. [Online]. [Accessed 3 October 2023]. Available from: https://nationalperformance.gov.scot/#:~:text=It%20shows%20how%20well%20Scotland%20is%20performing%20overall,impartially%20by%20senior%20analysts%20in%20the%20Scottish%20Government.
Scottish Government. 2022. Reducing car use for a healthier, fairer and greener Scotland – A route map to achieve a 20 per cent reduction in car kilometres by 2030 [Online]. [Accessed 27 September 2023]. Available from: https://www.transport.gov.scot/media/50872/a-route-map-to-achieve-a-20-per-cent-reduction-in-car-kms-by-2030.pdf.
Scottish Government 2021b. Scotland’s Climate Assembly – recommendations for action: SG response [Online]. Edinburgh. [Accessed 27 September 2023]. Available from: https://www.gov.scot/publications/scottish-government-response-scotlands-climate-assembly-recommendations-action/documents/.
Scottish Government 2020b. The Big Climate Conversation: Findings from a programme of public engagement on climate change. www.gov.scot., pp.1–45.
Scottish Government 2020c. Update to the Climate Change Plan 2018 – 2032: Securing a Green Recovery on a Path to Net Zero. Energy and Climate Change Directorate., pp.1–225.
Scottish Government 2020d. Update to the Climate Change Plan 2018 – 2032 Securing a Green Recovery on a Path to Net Zero. www.gov.scot., pp.1–255.
Smeets, E., Weterings, R. and Bosch, P. 1999. Environmental indicators: Typology and overview. Environmental Science. 198117422.
Sniffer 2023. Community Climate Adaptation Route map. Sniffer. [Online]. [Accessed 9 October 2023]. Available from: https://www.sniffer.org.uk/community-climate-adaptation-route map.
SSN 2022. Scotland’s Climate Assembly – Final Session. Sustainable Scotland Network. [Online]. [Accessed 21 July 2023]. Available from: https://sustainablescotlandnetwork.org/news/scotland-s-climate-assembly-final-session.
TDUK 2022. Net Zero Roadmap. Timber Development UK.
The Church of England 2022. Route map to Net Zero Carbon by 2030. The Church of England., pp.1–72.
UK Government 2022. Evaluating Policy in Government. GOV.UK. [Online]. [Accessed 21 July 2023]. Available from: https://www.gov.uk/government/publications/guidance-and-resources-for-evaluating-policy-in-government.
UK Parliament 2015. Environmental Audit Committee inquiry on an environmental score card Memorandum from Her Majesty’s Government. UK Parliament. [Online]. [Accessed 5 October 2023]. Available from: https://committees.parliament.uk/writtenevidence/52226/html/.
UNDP 2021. Peoples’ Climate Vote RESULTS [Online]. [Accessed 27 June 2023]. Available from: https://www.undp.org/publications/peoples-climate-vote.
Water UK 2020. Net Zero 2030 Route map. Water UK. [Online], pp.1–46. [Accessed 29 June 2023]. Available from: https://www.water.org.uk/news-views-publications/publications/net-zero-2030-route map.
Welsh Government 2021. Net zero carbon status by 2030: public sector route map. Policy and Strategy., pp.1–16.
Wong, J.W.C. and Lai, I.K.W. 2022. The mechanism influencing the residents’ support of the government policy for accelerating tourism recovery under COVID-19. Journal of Hospitality and Tourism Management. 52, pp.219–227.
Appendices
Appendix A: Literature review methodology
We conducted a systematic literature review to identify key academic and grey literature relating to various forms of score cards for climate change communication and other public messaging using approved search terms. This was also done to identify sources that provide insights into communication and messaging strategies as well as methodologies that could be adopted to best convey key topics.
The search strategy was developed using identified keywords for four concepts/themes including:
- Public communication in other sectors;
- Climate change for communication and engagement;
- Scottish communication and messaging strategies; and
- Score card and route map climate change topics.
The concepts were searched using keywords and related search terms in the Google Scholar and Scopus database. Some inclusion and exclusion criteria were applied to ensure the review remained objective such as a date range between 2023 and 2011 to identify the most relevant and recent literature, however, a forward and backward snowballing process was also adopted, where relevant cited papers within papers were also used to inform the literature review. The inclusion and exclusion criteria were also based on publication titles, abstracts, and full text screenings, as well as key word exclusions. For example, there is some overlap between ‘balanced scorecard’ and ‘scorecard’.
The literature search returns frequently included reference to the ‘balanced scorecard’ approach. The ‘balanced scorecard’ approach is a framework developed by Kaplan & Norton, (1992) to translate strategies and mission statements into specific measures and goals in a corporate setting. The methodology for using a BSC involves developing critical measures for four perspectives in an organisation, usually financial, customer, internal progress, and learning and development (Kaplan and Norton, 1996). The BSC is a management and strategy framework, and does not resemble the type of score card being explored (Figure 3, for example). As such, evidence in the academic literature of the use of score cards specifically for climate change communication, which could inform the methodologies used for identifying KPIs to better communicate polices, was limited.
Boolean operators such as “AND” and “OR” were used to search between keywords and related search terms, and the minus sign “- “, was used to remove excluded keywords and search terms.
Appendix B: Evidence review of existing score cards/route maps
|
Communication typology |
Description |
Examples |
Positives |
Negatives |
Applicability to the Scottish context |
Potential key metrics |
|
Qualitative Score card |
Assesses the policy commitments and actions of countries/sectors and their contribution towards climate goals in an attempt to hold those that are not taking appropriate action to account. |
Council Climate Change Score Card (Climate Emergency UK, 2021). Climate Change performance Index (Burck et al, 2023). Climate change and health scorecard. (Cooke et al, 2022). The Climate Score card (Climate Scorecard, n.d.) Climate Score card (Centre for Biological Diversity Action Fund, 2020). |
Simple criteria and scoring system that is easy to follow and understand; Allows users to make informed decisions; Intuitive ranking system to assess the progress/effectiveness of different countries/ sectors; Interactive interface increases user engagement and ability to interrogate the data; Allows easy comparison of different countries/sectors that allows a rapid assessment of progress against; Aids communication and transparency; Can be used by countries/sectors for benchmarking against competitors. |
Potential for subjectivity; Potentially missing polices which indirectly impact criteria; May not consider external factors which may influence performance; Requires users to interrogate methodology to understand how scoring has been determined; Provides a static assessment that is only updated at a certain point in time i.e., yearly. |
– Usually produced by an NGO or pressure group who are motivated to hold governments/sectors to account for not taking enough action on mitigating/adapting to climate change. Therefore, it is unlikely this approach would be suitable for the Scottish Government as this would potentially appear disingenuous if Scotland were to score highly compared to other nations based on its own scoring criteria; Potential for confusion with whether to focus on short-term or long-term actions/progress; – Requires regular updating which could be a significantly administrative burden for the Scottish Government and will also rely on data availability and suitability; + Aligns with goals by linking scorecard/KPIs with specific objectives and targets. + Familiar and easy to understand for a wide range of users. This approach could be adapted by the Scottish Government to reflect key KPIs and track progress towards these. + Easy to compare actions and progress with other countries. |
Publicly available qualitative and quantitative targets and actions; High level policy commitments; Progress against policy commitments (either qualitative or quantitative) |
|
Dashboards |
Provides environmental indicators without further contextual information or subjective analysis. Does not include target data or pathways to net zero. |
Measuring UK greenhouse gas emissions (UK Government, 2023). |
Specific climatic indicators, such as trees planted, electric vehicles registered etc. | |||
|
Route maps | ||||||
|
Route map |
Designed to help users plot their own path to net zero Shows the key objectives and timeframes as part of a climate change policy document or action plan |
Roadmap for the Global Energy Sector (IEA, 2021). A route map to achieve a 20 per cent reduction in car kilometres by 2030 (Scottish Government, 2022). The timber industry Net Zero Roadmap. (TDUK, 2022). Agricultural Reform Route Map (Scottish Government, 2023). Marine recovery route map (UK Government, 2022). Circular economy route map for Glasgow 2020 (Glasgow City Council 2020). Route map towards greater ethnic diversity (Wildlife & Countryside Link, 2022) Waste Regulation Route Map (WRAP, 2014) Net zero carbon status by 2030: public sector route map (Welsh Government, 2021). Route map to Net Zero (Moray Council, 2022) Community Climate Adaptation Routemap (Sniffer, 2023). |
Can include simple wording as well as provide contextual information surrounding climate change targets and ambitions Dovetails with policy ambitions co-located in documentation, allowing users to cross references ambitions against policy. Typically includes a long-term perspective with a specific timeframe or goal in mind, such as Net Zero or other environmental objectives. Facilitates risk assessment and mitigation Usually visual and broken down into easily digestible sections This type of route map has been employed by the public sector in the UK and is a tried and tested approach. |
Often lacks specific quantitative metrics that are tied to route map timeframes Generally static documents that provide high level ambition but do not allow progress to be tracked unless document is updated on a regular basis Assumption heavy as often tied to high level policy objectives Text heavy and lengthy, creating barriers to user engagement. Often lacking defined actions or measures that will be taken to achieve long term goals or specific objectives Difficult to measure progress where metrics and milestones are not clearly defined or quantifiable Provides a set of actions that individuals can take rather than providing updates/progress against a specific climate goal. Static document that would prove challenging and time consuming to update. Difficult to measure the impact of such a route map |
+ Well understood practice that has been widely adopted within the Scottish Government and wider public sector bodies in bothScotland and the UK as a whole + Facilitates communication of high level ambitions on climate change mitigation/adaptation and provides clear objectives + No restrictions on the type or quantity of information that can be provided + can facilitate international cooperation, as it provides a common framework for different countries to work together and share best practices + Allows users to plot their own path towards a specific goal, such as Net Zero, by providing advice and recommendations that they can implement in a personal context. + Provides easy to understand information that is accessible to a wide range of users -Often lacks detail on how targets will be met along with specific -Often very text heavy and lacking specific detail, meaning that many users may not engage with the content, especially the public. – Focus on a smaller spatial scale, meaning that this type of route map may not be suitable at a national scale. -Static document that would be time consuming to update as the context surrounding climate change shifts as time moves onwards. -More suitable to policy audiences and those with prior knowledge/interest. |
Personal actions that users could take to contribute towards climate change goals and indicators |
Appendix C: Public workshop
Five discussion groups were held with the general public between 21st and 30th August 2023. Each group was 90 minutes long and attended by six members of the public; 30 people took part in total.
Quotas were set across the total sample to ensure it was broadly representative of the Scottish population. However, it was agreed that it would be split equally between urban and rural participants to ensure rural views are considered. The quotas were:
|
Demographic |
Overall quotas |
|
Gender |
50% male / 50% female |
|
Age |
50% 18-44 / 50% 45+ |
|
Social grade |
50% ABC1 / 50% C2DE |
|
Urban/rural |
50% Urban / 50% Rural |
|
Views on climate change |
A mix of views (answers a to d from the screening question below), excluding those who are not convinced climate change is happening (answer e) Which of these statements, if any, comes closest to your own view? |
Participants were recruited by Taylor McKenzie Research on behalf of The Lines Between, using a recruitment screener which was agreed by all parties. Groups were facilitated by The Lines Between.
Introduction – 20 mins
First, I’d like us to do a little exercise and introduce ourselves.
I’d like you to take a couple of minutes to think about how you would rate Scotland’s progress so far in tackling climate change.
I don’t mind what sort of rating you use, as I’d like to hear it in a way that makes sense to you.
I’d also like you to explain why you’d give it that rating. You might only want or need to give one or two reasons, but I’d like to hear what you think we’re doing well or not so well.
After a couple of minutes, I’d like to go around the room and ask everyone to:
- Tell us your name and where you are from.
- Give us your rating of Scotland’s progress.
- Explain why you have rated Scotland’s progress as you have.
[NOTE: this exercise will allow us to set the scene with each group but also understand:
- What specific metrics are most important regarding climate change in Scotland.
- What sort of rating scales they see as useful e.g. some may do a scale of 1-10, some Excellent to Poor, etc).
- The wider context of how well they think Scottish Government is currently performing.]
How would you prefer to be informed about the Scottish Government’s progress against climate targets?
- Who should evaluate what they are doing?
- What format would you like to see progress in?
- What is the best way to hold the Scottish Government to account for its climate change targets?
Route maps – 30 mins
One of the two things we want to look at tonight is the idea of a routemap, which could also be known as a roadmap or a pathway.
The aim of a routemap is to provide a clear and concise plan to help everyone understand what’s happening, what the endpoint is, and the actions or journey that needs to happen to get there. It should be able to communicate:
- What are the targets or goals of a policy or strategy
- What actions are needed for those targets can be achieved
- What timescales, milestones or order the changes need to happen in
- Any connections between or consequences from taking action
I’m going to quickly show you a few examples:
Guidance routemap – could be more visual or storytelling about the path or journey, or using accessible visuals and wording
- A route map to achieve a 20 per cent reduction in car kilometres by 2030 | Transport Scotland
- Net zero carbon status by 2030: A route map for decarbonisation across the Welsh public sector (gov.wales)
Descriptive routemap – provides contextual information and long-term perspectives in climate policy documents or action plans, outlining key objectives and timeframes.
Which of those examples do you prefer? Which resonate with you?
Does anyone feel they have seen anything like this before:
- About climate change?
- From the Scottish Government on another policy area?
- From another government or organisation about another issue?
IF YES: Probe for detail on the topic, what was included, and why useful / not.
What would a climate change routemap look like to you?
- What format would be most engaging?
- Would the examples I showed you work? What would need to change?
What information would you like to see in a routemap that would be useful in helping you or other people understand:
- What the Scottish Government is doing?
- When changes are going to take place?
- Your role in tackling climate change and helping you to plan what actions you might need to take?
Score cards – 30 mins
Moving on now, I’d like to talk about a Scorecard. By this, I mean a tool which would provide you with an easy-to-read assessment of how effective the Scottish Government’s climate change policies, strategies and actions have been. The aim would be to have something clear, trustworthy and easy to understand, though there are potentially lots of levels of detail.
I’m going to quickly show you a few examples:
- Climate Change Performance Index: https://ccpi.org/wp-content/uploads/CCPI-2023-Results-3.pdf
- Cooke et al., (2022) assesses the progress of UK professional and regulatory organizations in tackling climate change.
- The Green Central Banking Scorecard scores and ranks the range of green policies and initiatives adopted by G20 central banks. https://greencentralbanking.com/scorecard.
Which of those examples do you prefer? Which resonate with you?
Can anyone think of any other examples, not necessarily climate change, that you have found useful?
Let’s think about what a climate change scorecard might look like for you.
We’re going to do another exercise. I’d like you to consider what actions, steps, targets or data you’d like to see included on a scorecard that monitors Scotland’s progress. There could be up to 10, but it’s absolutely fine if you can’t think of as many as that. I’ll give you a few minutes to think about what you’d like to see, and if you could type them in the chat. However, don’t send them – I’ll tell you when we can all send them together at the end of the exercise.
Talk through metrics and reasons for including them.
Who should decide what indicators are included?
Who should produce the scorecard? Scottish Government, or someone else?
- Who would you want to hear from? Who would you believe?
- Who should provide the data for the scorecard?
How frequently should it be updated?
Would it be useful to compare Scottish progress against other nations?
Finally, I’d like to ask about your preferences for the format of a scorecard.
Would you prefer:
- A focus on data (e.g. numbers and comparison with targets) or a more visual or storytelling approach?
- How do we represent progress? For example, Red/Amber/Green status, Yes/No if met, or quantitative data.
- Would you prefer to view progress against high-level targets (e.g. for the country as a whole) or more sector-specific objectives (e.g. energy, transport)?
- Would you prefer an interactive dashboard with less detail or a static dashboard with more detail?
Thank and close – 5 mins
Thank you for attending the session today; your time and input is greatly appreciated. We will arrange a £60 payment to each of you as a thank you.
Regarding the next steps, today’s discussion will be transcribed, and the key themes and statements will be extracted and compared to the findings from other participants. These will form the basis of our report to the Scottish Government
Route map samples

Figure 4 -The Scottish Government’s route map to achieve a 20 per cent reduction in car kilometres by 2030 (Scottish Government, 2022)
Figure 4 displays the Scottish Governments route map to achieve a 20 per cent reduction in car kilometres by 2030. It displays a linear routemap beginning in 2021 and ending in the target year of 2030. Key milestones are represented, along with the associated actions that will be implemented to achieve these milestones. For example, the early 2022 milestone includes a commitment to provide free bus travel for those under 22 years of age.

Figure 5: The net zero carbon status by 2030: A route map for decarbonisation across the Welsh public sector (Welsh Government 2021).
Figure 5 shows the transport page of the Welsh public sector route map for decarbonisation. It sets outs the key principles that the Welsh public sector will undertake to achieve net zero in transport. A broad timescale for action is displayed on the left of the image, ranging from ‘Moving up a gear 2021-2022’ to ‘Achieving our goal 2026-2030’. On the right of the image, short sentences describe the key objectives of the route map, such as a commitment to increase the utilisation of active travel in the public sector.

Figure 6: The Church of England’s Route map to Net Zero Carbon by 2030 (The Church of England, 2022).
Figure 6 shows the ‘kind of change that is needed’ section of the Chuch of England Routemap to Net Zero Carbon. It shows key milestones that need to be achieved and the target date for when they will be achieved. A brief introduction to the key milestones is included on the left of the image. A table of milestones is presented to the right, including a description of each objective alongside a target date for when each will be implemented.
Score card samples

Figure 7: The climate change performance index by Burck et al, (2023).
Figure 7 shows the ranking table from the Climate Change Performance Index, with nations given a score out of 100 based on a different range of index categories (such as GHG Emissions). Each country is given (from left to right) an overall ranking (including a low to high rating) , score out of 100 and index category scores.

Figure 8 The score card for assessing organisational climate change policies by Cooke et al., (2022).
Figure 8 displays a score card that assesses different organisations on their climate change policies. Each organisation is given a score based on their policies regarding to elements such as their decarbonisation plan. The different assessment criteria are given on the left and the organisations assessed are given on the top. An overall score out of 11 is presented at the bottom, with the body of image showing green, amber and red indicators where each assessment criteria has been applied to each organisation.

Figure 9 The Green Central Banking Score card (Green Central Banking, 2022)
Figure 9 shows the ranking page of the Green Central Banking scorecard. Each country has been assessed on certain indicators, such as Monetary Policy, which are added together for an aggregate score out of 130. The image displays, from left to right, the country assessed, aggregate score, grade and the score for each of the assessment criteria (Research and Advocacy, Monetary Policy, Financial Policy, Leading by Example).
Appendix D: Stakeholder workshop discussion guide
The stakeholder workshop consisted of the following organisations agreed with the steering group to represent ‘trusted messengers’ regarding climate change. The workshop consisted of 9 organisations and lasted 1 ½ hours. The organisations that attended are listed below, along with the discussion guide.
- Creative Carbon Scotland
- Energy Saving Trust
- Highlands Climate Hub
- Improvement Service
- Royal Society for the Protection of Birds
- NatureScot
- North East Scotland Climate Action Network
- Scottish Communities Climate Action Network & Transition Network Hub for Scotland
- Sniffer
Step 1 – Introductions
Short round of introductions from both workshop organisers and attendees
Step 2 – Summary of research project aims
Short summary of the research aims
Step 3 – Summary of the findings from the public workshops
Short summary of the headline findings from the public workshops
Step 4 – Questions
Set of questions to prompt discussion on key points.
1. How do you currently communicate climate change goals and progress to the public?
- What information would be helpful in your communication with the public?
- How would you make that information land the most effectively and what methods would you utilise?
2. Do you need information/tools for influencing behaviour or reporting on progress (or both)?
- How do you ensure that they motivate and encourage action?
3. What value would a climate change route map and/or scorecard have in your organisation?
- Do you, or other organisations you are aware of, already have or use either?
- Would you use one within your organisation to communicate on climate change?
- Do you think a route map/score card is the best method to fill current information gaps?
d. Do you think there is a more effective way of communicating climate change progress/ambitions?
- Do you make a distinction between a route map/scorecard or see them as a complimentary method?
4. We’ve identified concerns around lack of positive communication, wider responsibility and wanting to know more about personal contributions.
- Do you think a route map/score card would address those issues?
- If not, what would?
- How could a route map or score card be used to communicate a positive or incentivising message?
- Would there be a more effective way to provide feedback on personal contribution to public other than a route map / score card?
- How do we make both tools as relevant as possible to individuals and their daily lives / actions?
- What metrics / issues have you found to be of most interest to the public in your work?
5. Feasibility to inform Phase 4 of the study.
- What metrics do you think would be most effective in communicating climate change progress goals/progress?
- Which bodies would provide the best independent oversight?
Appendix E – Potential indicators and their viability
As the workshops did not provide a clear preference regarding indicators that should be included in a potential scorecard, it was challenging to develop relevant indicators informed by stakeholder and public involvement. However, we provide a list of potential indicators based primarily on the literature review and proxies relating to responses during the workshops below. Indicators were also selected based on existing targets included in relevant UK and Scottish policies, such as Scotland’s Climate Change Plan, as a means of providing reference measurements where progress can be assessed. Therefore, the indicators suggested are intended to act as performance indicators following description by Smeets et al., (1999).
It is important to note that the indicators provided are not a representation of the preferences from the Scottish public and only serve as points of consideration if the Scottish government were to go forward with the development of a scorecard.
The table below presents the summary of potential indicators, their data sources, and the selection bias.
Table 1 Summary of potential indicators
If you require the report in an alternative format such as a Word document, please contact info@climatexchange.org.uk or 0131 651 4783.
© Published by LUC, 2023 on behalf of ClimateXChange. All rights reserved.
While every effort is made to ensure the information in this report is accurate, no legal responsibility is accepted for any errors, omissions or misleading statements. The views expressed represent those of the author(s), and do not necessarily represent those of the host institutions or funders.
info@climatexchange.org.uk
+44(0)131 651 4783
@climatexchange_
www.climatexchange.org.uk
-
https://www.adaptationscotland.org.uk/how-adapt/tools-and-resources/community-climate-adaptation-routemap ↑
DOI: http://dx.doi.org/10.7488/era/3637
Executive summary
Background
Decarbonising heating systems in buildings is an important step towards achieving net zero by 2045 in Scotland. The Heat in Buildings Strategy (Scottish Government, 2021a) outlines the steps planned to achieve this. The Scottish Government anticipates that one million zero carbon heating systems will be needed in new and existing homes by 2030, many of which will be heat pumps. This represents a major challenge because only 3,000 heat pumps are being installed each year in Scotland (Scottish Government, 2021b).
The higher upfront cost compared to gas boilers is a challenge for increasing rollout of heat pumps and effective financing options are required to enable this. This report identifies how innovative business models, such as subscriptions including payment plans, financing and ‘heat as a service’ models, could support the rollout of heat pumps by helping with the upfront investment, which is often a challenge for consumers.
Through a literature review and analysis, and in-depth discussion with stakeholder groups, we explore how three business models could be implemented in Scotland via pilot schemes.
Findings
- A limited number of heat pump finance offerings are currently available to customers in Scotland. Other than an upfront purchase, most of these are finance only payment plans for the purchase of the heat pump only. Uptake for these plans is very low. Funding from the Scottish Government currently includes an up to £7,500 interest-free loan and a grant to the equivalent value. There are heat pump on subscription offerings across Europe, but these are also fairly limited, reflecting an immature market.
- The following range of business models could be applied to heat pumps in Scotland:
- Finance only: Monthly payments and no upfront costs for the heat pump. This can also include routine maintenance, but we have chosen not to include it here. The customer owns the appliance after paying off the loan.
- Financing lease: A leasing scheme with fixed monthly payments that includes routine annual maintenance. The customer does not own the appliance.
- Subscription: Similar to financing lease, with the customer paying a monthly fee, which includes a fixed cost per unit of energy or heat delivered.
- Heat as a Service: The provider owns the appliance and delivers routine annual maintenance and breakdown cover, charging the customer a monthly fee to keep the home at an agreed temperature by providing heating.
- Adding the installation of energy efficiency measures, an energy tariff suitable for heat pumps and energy advice to these propositions could increase their appeal.
- There are also non-financial barriers such as complexity of installation, consumer difficulties in understanding fuel bill savings and a current lack of consumer demand.
- Specific barriers to heat pump subscription models include lack of understanding and reassurance around consumer protection and contractual issues – for example, when moving properties.
- Stakeholders have a mixed appetite for piloting new approaches, with the main challenge being provision of finance. Other challenges and risks include ensuring heat pump performance and supply chain capacity.
Proposed business models to pilot in Scotland
We propose three options for pilot schemes that could be tested in a progressive or staged approach. The business models are not expected to generate customer demand for installing heat pumps, but rather to present different financial options in a market where greater customer demand already exists.
- Finance and routine maintenance includes heat pump design, installation and routine annual maintenance through a finance package using monthly payments. This model would build on current market offerings to test the appetite of customers to have a more complete heat pump package by including routine maintenance. It would also test industry interest to launch such a proposition. This pilot could be rolled out fairly quickly if finance can be secured.
- Finance, routine maintenance with energy tariff would ensure customers are on an appropriate energy tariff for a heat pump. This makes the offering even more comprehensive and provides some reassurance around running costs.
- Subscription with routine maintenance and breakdown cover would test the market and consumer appetite for a subscription rather than an ownership model and could include a full maintenance package and potentially a suitable energy tariff. Based on this research, we do not consider the market nor consumers are currently ready for this pilot, but it could be tested in future.
Table 1: Overview of the three proposed business models to pilot
Glossary
| Term | Definition |
| ASHP | Air source heat pump, a renewable heating technology. |
| CaaS | Comfort as a Service, where the provider commits to keeping the home at an agreed temperature, by providing heating and cooling services. |
| DNO | Distribution Network Operator, responsible for operating the electricity distribution system which delivers electricity to most end users. |
| Tailored tariff | The provider incentivises a shift in energy demand by offering an energy contract specifically tailored to a heat pump, for example, a period of lower priced electricity each day, where the user can heat water and store for later use, with a higher price linked to a period where electricity demand is high. |
| Heat pump routine maintenance | Relates to annual routine service of the heat pump, required to maintain product warranty. |
| Heat pump breakdown cover | An insurance product where the customer pays a monthly fee which covers the costs of parts and labour for unexpected product breakdowns. |
| HaaS | Heat as a Service, where the provider owns the appliance and delivers routine annual maintenance as well as breakdown cover. The provider charges the customer a monthly fee to keep the home at an agreed temperature by providing heating. |
| Heat pump ready home | A home where property insulation levels and heating distribution system (pipework and radiators, for example) is suitable for heat pump installation and operation |
| HPOS | Heat pumps on subscription, where the appliance is owned by the provider and the customer is charged a monthly fee |
| kWh | Kilowatt hours used to measure units of electricity |
| MWh | Megawatt hours used to measure units of electricity |
| Leasing model | Fixed term contract which bundles appliance and routine maintenance for a monthly fee. Customer owns appliance |
| MCS | Microgeneration Certification Scheme. An industry scheme which regulates the quality of renewable product installation and operation. |
| Metered heat | Metered heat measured through a heat meter is what the supplier charges the customer for the heat provided, rather than for the energy consumed in delivering the heat. |
| Pain points | Relates to known challenges, for example, difficulties raised by customers in relation to the sourcing of a heat pump installer. |
| Subscription model | Fixed term contract which bundles appliance, routine maintenance and breakdown cover, with either electricity or heat tariff for a monthly fee. Supplier owns appliance |
| Supply chain | A supply chain is the system of all activities involved (raw materials, assembling, distribution, delivery) in delivering a finished product or a service to a customer. |
| ToU tariff | Time of Use tariff, used in connection with the supply of electricity and related to specific times of the day when costs may be higher or lower than average based on overall customer demand. |
| ZDEH | Zero direct emissions heating system, a term used by Scottish Government to refer to heating systems which produce zero direct greenhouse gas emissions (at the point of use) under normal operating conditions. |
Table 2: Glossary
Introduction
This report provides an assessment of, and evidence for, a range of practical and sustainable business models to advance heat pumps on subscription (HPOS) business models at scale in Scotland.
Policy context
The Scottish Government’s Heat in Buildings Strategy (Scottish Government, 2021a) outlines the steps it will take to reduce greenhouse gas emissions from Scotland’s homes, workplaces and community buildings and to remove poor energy performance[2] as a driver of fuel poverty. Building on the policies and actions set out in the Climate Change Plan Update (Scottish Government, 2021c), the Heat in Buildings Strategy sets out a pathway to zero emissions buildings by 2045 including short and long-term actions to accelerate the transformation of the nation’s building stock. It also sets out the principles the Scottish Government will apply to ensure its zero emissions heat delivery programmes support its fuel poverty objectives.
The Scottish Government aims to double the number of zero direct emission heating systems (ZDEHs) installed in Scotland every year for the next five years and for numbers of installations to reach 200,000 per year towards the end of this decade (Scottish Government, 2021c). This is considered a major challenge compared to the current installation rate of about 3,000 heat pumps each year (Scottish Government, 2021b). The high upfront cost of around £10,000 for an air source heat pump[3], (LCP Delta, 2022a) compared to gas boilers (~£3,000 – 4,000), means that identifying novel financial models and propositions is essential to unlock the opportunity.
Previous independent research from ClimateXChange (Energy Systems Catapult, 2021) recommended that the Scottish Government undertake further work to explore how Heat as a Service (HaaS) models might support its heat decarbonisation agenda, as well its fuel poverty and economic development goals. There are also potential customer benefits of these models in removing finance barriers and providing ongoing routine maintenance and breakdown cover.
Research aims, scope and methodology
A key principle of HPOS[4] models is that the responsibility for the provision and operation of the heat pump rests with the supplier. This is believed to address a number of customer pain points but creates risk and uncertainty for the provider, which may impact the commercial attractiveness.
This research aimed to:
- assess the current Scottish marketplace for HPOS;
- draw learnings from case studies within the UK and across Europe;
- conduct interviews with stakeholders to understand the appeal, risks and challenges of these business models in Scotland; and
- identify options for piloting and delivering HPOS in Scotland.
In brief, the methodology for this research included literature review and analysis, and in-depth discussion with stakeholder groups (including business, policy and consumer representatives). Please see Appendix 1 for further detail of our research methodology.
Defining heat pumps on subscription
There are a range of business models that could be applied to support the deployment of heat pumps. This section defines these models and explains how and why they could enable the deployment of heat pumps.
This report uses the term “heat pump on subscription” (HPOS) to refer to the wide range of innovative business models and propositions that could be applied to deploying heat pumps into homes. This excludes an upfront purchase where the customer pays for the heat pump outright.
Finance only
The provision of a financial loan is a natural progression from the standard upfront purchase, where a customer pays in full for the heat pump. In this model, the provider offers finance either directly or, in many cases, using a third-party specialist provider, with the customer repaying the cost of the heat pump and its installation over a number of years and owning the appliance once the loan has been paid off. This proposition can be supplemented with routine annual maintenance, often required by manufacturers to retain the warranty protection.
The principle of using a loan to fund the purchase of a product is fully established and regulated in the market and well understood by consumers. As such, we use this as a baseline proposition to develop more progressive models.
Subscription and leasing models
Subscription and leasing models depart from ‘finance only’ propositions as the provider is responsible for the provision and operation of the heat pump. The customer does not own the appliance and the provider delivers a service to the customer which wraps design, installation, routine maintenance and breakdown cover for the heat pump, usually over a minimum contract term, for a single monthly fee.
This model can also include the cost of energy or heat at a fixed price per unit, although the actual costs are variable and dependent on the amount of energy consumed or heat delivered.
The main attractions of a heat pump subscription model are:
- high initial costs are resolved by ongoing payments which cover product and energy used or heat delivered;
- the service provider owns the product, so appliance performance and technology risk are taken away from the customer; and
- customer pain points of arranging routine maintenance and breakdown cover are owned by the service provider.
These models introduce the fundamental concepts of subscription to consumers and are proposed as an intermediary step towards Heat as a Service (HaaS) offers.
Heat as a Service (HaaS)
HaaS builds further on the key principles of subscription and leasing and includes a commitment to maintain the customer’s property at a given temperature. The supplier owns the heat pump and takes accountability for the operational performance of the appliance as well as the amount of energy consumed to meet the agreed temperature in the home. There is usually some form of penalty levied against the supplier where the agreed temperature is not met. As with subscription and leasing, the features are consolidated into a single monthly customer payment.
The key elements that distinguish HaaS are:
- the customer benefits from a fixed cost solution to delivering heat to their home;
- the supplier is obliged to maintain a heat pump that delivers heat efficiently and reliably;
- the supplier is accountable for any costs arising from poor performance or appliance breakdowns; and
- energy use is based on an agreed level of heat or comfort[5] rather than units of electricity.
Proposed business models
High initial costs are a significant barrier to increasing the sales of heat pumps (air source heat pumps are typically around £10,000 (LCP Delta, 2022a)) particularly when compared to a standard gas boiler, the default and predominant solution in the UK. The business models identified in this research represent different approaches to resolve this issue by spreading the costs over the contract period.
We reviewed the existing market and used proprietary insight from LCP Delta (2022a) to create four business models for providing heat pumps to consumers, set out in Table 3.
| Name of business model | Service offering |
| Finance only | Monthly payments only and no upfront costs for the heat pump. This can also include routine maintenance, but we have chosen not to include it here. The customer owns the appliance after paying off the loan. |
| Financing lease | A leasing scheme with fixed monthly payments which includes routine annual maintenance. The customer does not own the appliance. |
| Subscription | As Financing lease, with the customer paying a monthly fee which includes a fixed cost per unit of energy or heat delivered. |
| Heat as a Service (HaaS) | The provider owns the appliance and delivers routine annual maintenance as well as breakdown cover. The provider charges the customer a monthly fee to keep the home at an agreed temperature by providing heating. |
Table 3: Overview of potential business models for providing heat pumps to consumers – categorised into four groups
Table 4 below provides an overview of these four key business models and their features, The table below provides an overview of these four key business models and their features, used for the analysis for this research project. The indicative costs for each model are based on calculations from LCP Delta Heat Research Services (LCP Delta 2022a).
| Finance only | Finance lease | Subscription | HaaS[6] | |
| Incremental cost | £180/month,
5-year loan |
£90/month,
15-year commitment |
£200/month,
15-year commitment |
£200+/month,
15-year commitment |
| Design | y | y | y | y |
| Product | y | y | y | y |
| Energy efficiency measures | y | y | y | y |
| Heating system changes | y | y | y | y |
| Installation | y | y | y | y |
| Routine maintenance | y | y | y | |
| Breakdown cover | y | y | ||
| Energy | y | y | ||
| Heat | y | |||
| Ownership | Y | N | N | N |
Table 4: Overview of four key business models and their components
Assessment of the Scottish market landscape for heat pumps on subscription
Current examples of heat pumps offerings in Scotland
This section provides an overview of the current market landscape in Scotland for heat pump business models.
Overall, the uptake of heat pumps is still very low in Scotland, with around 3,000 heat pumps installed each year (Scottish Government, 2021b). We found evidence of new propositions being launched, including models incorporating routine annual maintenance, financing options and a tailored tariff (see Glossary for definitions). There are no leasing or subscription models currently available in Scotland. Further details on these offers is provided in this section.
Heat pump offerings in the UK
There are several examples of current heat pump offerings in the UK. Octopus, British Gas, E.ON, Scottish Power and EDF Energy each offer their own proposition (please refer to the summary table of current heat pumps offerings in the UK in Appendix 3).
Overview of offerings
The offers are all variations of an upfront purchase, finance and, in some cases, installation and routine maintenance – there are no HPOS propositions. In all cases, the customer will own the product.
The financial case for heat pumps is weak for a customer in the UK. This is due to the high installation cost of heat pumps compared to gas boilers, and the relatively high price of electricity compared to gas[7]. There are also other potentially appealing business models, such as green mortgages, where the bank will offer a reduced mortgage interest rate when renewable technology is installed. These were not considered as part of this study.
To complete this research, we also looked at existing dedicated heat pump tariffs in Scotland (a summary table of heat pump tariffs is available in Appendix 3). There is legacy evidence of providers trialling bespoke tariffs, but Octopus is the only supplier currently with a tailored heat pump tariff, which potentially indicates a lack of consumer demand.
Scottish Government support
It is also worth highlighting that eligible households in Scotland can receive financial incentives towards the cost of installing heat pumps through the Energy Saving Trust. This is the Home Energy Scotland Grant and Loan, funded by the Scottish Government, which differs from subsidies available in other parts of the UK. This includes:
- the Home Energy Scotland Grant: £7,500 towards a range of heat pumps. This increases to £9,000 for households qualifying for the rural uplift; and
- the Home Energy Scotland Loan: £7,500 interest-free loan which can be used in combination with the grant. Loans are subject to an administrative fee and can be paid back up to a maximum of 10 years for a £7,500 value[8].
International examples of heat pumps offerings
We carried out research into the HPOS business models available across Europe. Examples from Germany, Denmark and the Netherlands show a more active market for heat pump business model offers (more details are presented as case studies in Appendix 5).
It is important to consider the specific conditions and context of each country before drawing conclusions around the opportunities to replicate these models in Scotland. In Germany, for example, gas prices are higher than electricity, which means that costs to operate a heat pump are lower than an equivalent gas boiler. There are three providers in Germany offering a rental or lease model which may serve as a positive indicator for the launch of HPOS propositions, although we do not have data on the success of these offers.
While the rental principle is more visible across Europe, only Denmark currently has a full subscription proposition. The Danish example includes the pilot scheme detailed in Appendix 5, where a full subscription model was trialled to support an accelerated roll-out of heat pumps in Denmark. Again, while this pilot was relatively successful, there are several points of difference between the Denmark and Scotland markets. Gas boilers are the default solution to heating in much of Scotland, with a penetration of 85% of households, while less than 15% of Danish households heat their homes in this way. District heating is relatively common in Denmark and the concept of buying heat in MWh is not unusual. Danes are also less likely to have problems paying for their energy because of the protection from their embedded social security and energy regulation provisions. There may also be cultural factors between the countries in terms of consumer acceptability to take on loans or debt, or the preference to own appliances rather than rent them. However, this has not been explored in this research.
Customer and provider insights
This section provides insight from LCP Delta research (2022b) around the customer perspective on different heating business models. The scope of this project did not include a literature review of customer perspectives or to undertake additional customer research. As such, the insights set out here provide an indication of the customer perspective.
The customer perspective
Recent customer research from LCP Delta (2022b) which is undertaken in five of the biggest European markets[9], showed that ‘alternative finance methods’ like paying upfront, finance only or an addition to an existing mortgage, are more appealing to customers than HaaS. The research highlighted that HaaS is perceived as a more expensive offer. This highlights that there is not currently a consumer demand for subscription models and there may be consumer concerns to overcome.
In the UK, 43% of survey respondents stated that they would choose to pay upfront for a heating appliance, with 20% indicating that they have used a finance option through/from the heating appliance provider. These findings did not relate specifically to heat pumps but heating appliances more generally and, given that gas boilers are lower cost and more popular, it is likely that respondents were thinking about gas boilers when they answered this question[10]. Interestingly, in the context of willingness to fund heating appliances, people on lower incomes were less likely to want to rent a heating appliance than respondents on higher incomes. The reasons for this are not clear but it may be due to preferences to pay for equipment outright, avoid ongoing payments and attitudes to debt.
Table 5 summarises the indicative costs of a heat pump for a customer specifically calculated for the UK for three alternative purchase methods (LCP Delta, 2022a).[11] Note that Table 5 has been created for illustrative purposes only and is not the outcome of a fully worked though model. It should also be noted that these costs do not include any government subsidies.
Paying upfront for a heat pump is clearly the least expensive solution over time, but the initial investment cost remains an important barrier for customers. This upfront cost can be avoided by a traditional loan which, combined with a routine maintenance and breakdown package, can provides consumer benefits.
By comparing a heat pump and a boiler finance proposition[12], the difference in cost between the two types of heating units is apparent. Gas boilers have much lower upfront costs than heat pumps. Reasons for this include the maturity of the gas boiler market and the installation for gas boilers being much simpler and therefore lower cost than heat pumps.
| Upfront purchase + routine maintenance | Finance | Financing lease | Total cost over lifetime of product | |
| Customer capital spend | £10,000 upfront + £130/year* for 15 years | n/a | n/a | £11,950 |
| 5 years loan (+15 year routine maintenance contract) | n/a | £180/month for 5 years + £130/year* for 15 years | n/a | £12,750 |
| 15 years loan (+15 year routine maintenance contract) | n/a | £70/month for 15 years + £130/year* for 15 years | n/a | £14,550 |
| 15 years lease | n/a | n/a | £90/month for 15 years | £16,200 |
*routine maintenance cost
Table 5: Customer indicative costs for three business models. (Source: LCP Delta 2022a)
The provider perspective
The most common way of selling heat pumps is an upfront purchase for the installation and an annual routine maintenance contract. In this business model the provider receives the profit upfront and there is only a small revenue flow per customer coming from the routine maintenance over the remaining lifetime of the appliance.
Table 6 below presents the difference in revenue for the provider comparing an upfront purchase from the customer and a service-based proposition. In the second, the provider needs to invest in the heat pump installation, but the customer pays it back over a number of years, generating an ongoing and more valuable revenue stream driven by interest payments from the loan.
| Upfront purchase + 15 years routine maintenance | HaaS for 15 years | Cost difference between the two business models |
| £11,950 | £16,200 | £4,250 |
Table 6: Indicative costs for a heat pump in the UK, comparing upfront purchase and HaaS, Source: LCP Delta (2022a)
Providing a HPOS solution offers providers the advantage of predictable revenue over a longer period of time as consumer contracts will span several years. Providers may add a premium to the monthly fee to cover any default payments, inflation and other risks. However, they are likely to also incur additional expenses (such as customer service costs, billing, remote diagnostics) compared to only selling the product. It takes several years before the provider receives a payback for their investment.
Due to the long timeframes involved, rolling out HPOS at scale would require large capital investment over a sustained period. LCP Delta analysis (LCP Delta, 2022a) shows that the most promising sources of finance for HPOS are likely to be traditional routes such as banks, leasing companies, bonds and investments funds, where long term and recurring income is valued rather than venture capital funds which often expect a more immediate return.
Findings from stakeholder interviews
This section provides results from the stakeholder interviews undertaken as part of this research. The interviews sought to understand stakeholder views to a range of heat pump business models, explore barriers, challenges and the likely success of these models. They also sought to understand the appetite for stakeholders to be involved in a possible pilot scheme in Scotland.
We undertook interviews with a wide range of stakeholders including Government representatives, manufacturers, installers, heat pump industry representatives, financiers, and consumer representatives. A full list is included in Appendix 1 as well as more detailed findings in Appendix 2. An overview of different business models (see Table 3 and 4 in Section 4) was presented to stakeholders as a stimulus for the interview.
Overall thoughts on HPOS business models
Installers acknowledged the potential for HPOS business models but highlighted the risk and impacts to consumer confidence of heat pumps more broadly if a HPOS pilot was poorly delivered. It was felt by stakeholders that all elements of the business model should be robust before HPOS is rolled out.
From a consumer’s perspective, stakeholders felt that HPOS represents a significant change in how households use and pay for their heating. The ‘finance only’ option was identified as likely to be the most attractive option as this was believed to be the simplest for consumers to understand. Including routine annual maintenance and breakdown cover in the package was seen as being key to providing customer protection; a view supported by consumer groups.
From the installer representatives we interviewed, consumer demand is required to stimulate growth in the supply chain. It was felt that leasing and including routine maintenance could improve uptake by reducing upfront costs for the consumers and building consumer trust in the provider. However, it was expressed by stakeholders that a crucial factor in its success will be how the lifetime cost of the asset compares with the consumer’s current heating system. One stakeholder highlighted the advantages of bundling a tariff alongside the heat pump to enable customers to ensure their bills were as low as possible. There was also some anxiety expressed around the possible impact on consumer confidence if a trial was not carefully prepared and executed.
Consumer groups also viewed HPOS as a positive concept, however highlighted that practical difficulties, such as creating a contractual framework that works for both consumer and provider, need to be overcome before this becomes an attractive proposition for either party.
The complexity of the offering for the consumer was highlighted as a key challenge. Stakeholders highlighted that this concept presents to consumers both an unfamiliar technology and payment format. Therefore, interviewees recommended that the contractual side must be very tightly controlled to ensure that consumers are protected.
We also found that product ownership resting with the supplier could be an issue for customers who are not familiar with these models, as well as the commercial opportunity and appeal of such a proposition for a service provider.
The Government representatives we interviewed were broadly supportive of the HPOS concept and acknowledge that subscription models have their place as part of a wider range of financial offerings. They also emphasised the importance of including routine maintenance within the ‘finance only’ option.
Distribution network operators (DNOs) were also positive towards the concept of HPOS, in particular the way in which it can provide consumers with everything they need in one package. Oversight of where installs are occurring was highlighted as important to allow DNOs to overcome the challenges presented to the electricity network from increased electricity demand.
Industry experts understood how the HPOS concept aligned with the macro trend of having access to products and services via a subscription service. It was also felt that the appeal of HPOS will vary across consumers. In a situation where the household would have ownership of the asset at the end of the subscription, HPOS could be an appealing proposition for owner occupiers and the younger demographic as it could add value to their home. For social housing providers this could be less attractive because of the tenant disruption from installation, potential difficulties with subscription fees for a tenant and it is unclear whether the lack of product ownership would be appealing to social landlords.
Challenges and risks
Stakeholders felt that the complexity of the offering presented several challenges for consumers.
Identifying a suitable provider of finance is a key challenge raised by numerous stakeholders. Whilst we did observe a positive response from finance providers who were interviewed, energy retailers did not engage in the process, so we were unable to assess their interest and likelihood to offer such a product.
Consumer lock-in (i.e., that once customers are within the contract, they are prohibited from switching heating system type or provider until the end of the term), was highlighted as a key challenge. It was felt that clarity is required on the contractual arrangements for situations where the consumer’s circumstances change, or they move property.
Unfamiliarity with the technology could make it difficult for consumers to know how efficiently they are using their heat pump and ultimately how much they will be paying for their energy. Minimum performance guarantees were identified as an approach to reduce the uncertainty for consumers, for example a commitment to ensure that the appliance operates as specified for an agreed period, with a payment made to the customer where this is breached. This could be further enhanced with remote monitoring i.e. the provider being able to monitor heat pump performance remotely and potentially being able to diagnose and rectify issues.
Manufacturers highlighted the need to make homes ‘heat pump ready’ prior to rolling out a heat pump uptake scheme. The reason for homes to be heat pump ready in advance is that most heating system replacements are distress purchases (i.e., when their current system has failed, and a replacement is needed reasonably quickly). It is recognised that most distress purchases lead to customers purchasing the same heating system type (e.g., gas boiler). Therefore, carrying out works to homes in advance of a heating system breaking down could help accelerate the heat pump install process.
Consumer awareness and marketing were also highlighted as key challenges that need to be addressed to accelerate demand. DNOs also raised the potential difficulty in recruiting consumers to a potential pilot scheme. A team of coordinators and administrators would help ensure the smooth running of the scheme and that customers receive an appropriate level of support. Installers reflected on the various regulations that are currently associated with renewables and were conscious of the risk of over regulation in this area.
Scottish context
Feedback from consumer groups suggest there are several factors that could present unique opportunities and challenges to the roll-out of HPOS in Scotland, especially in remote areas.
It was felt there is a specific opportunity in rural areas of Scotland where there is no / limited access to mains gas and a high proportion of fuels such as oil, LPG or electricity. Given the higher cost of these fuels and the unregulated nature of oil and LPG markets, heat pumps can be a more financially attractive proposition for households.
Despite this opportunity, concerns were raised by consumer groups on the suitability of Scotland’s housing stock for heat pumps, especially those with lower levels of energy efficiency. This reaffirms the importance of providing energy efficiency measures as part of the HPOS offering.
Consumer groups felt that it was important that both the heating asset and terms underpinning the HPOS agreements are tailored to the climatic conditions in Scotland. A longer heating season and harsh weather conditions in some areas could influence heat pump performance and the cost to the consumer.
In remote areas, poor mobile network infrastructure coverage was also highlighted as a challenge as this could limit the installation of smart meters and reduce the effectiveness of remote monitoring. Finally, a limited number of installers and a nascent supply chain in some remote areas of Scotland could deter investment and lead to long installation lead times in.
Key stakeholders to be involved in a pilot
Due to the infancy of the market, consumer knowledge of heat pump technologies and their use in the UK is not widespread. Consumer groups highlighted their role (alongside manufacturers) to provide independent advice as well as face-to-face education to reduce the information barrier. Well trusted, independent organisations such as Changeworks, Home Energy Scotland[13] and Citizens Advice were considered to also have an important role in providing impartial advice and support to consumers.
Officials from both the Scottish and UK Governments recognised their roles in raising public awareness of heat pumps and removing regulatory barriers. One stakeholder also noted the role of the UK Government in regulating energy pricing, which in turn would create a beneficial environment for heat pumps. Regarding the role of the Scottish Government, one stakeholder mentioned the importance of ensuring that clarity between any HPOS pilot and existing financial incentives is clear to avoid customer confusion.
To ensure a more cost-effective pilot, DNOs also identified their role in identifying areas of the electricity network that can accommodate increased heat pump deployment (i.e. in some areas the electricity networks have constrained capacity which may impact ability to be able to connect more heat pumps).
For installers, it was suggested that funding would likely be required for small and medium sized installers to overcome the significant initial investment required and improve the rate of return. Installers did not generally see a role for themselves in providing HPOS. However, they felt that if HPOS was rolled out this could be very beneficial for the market, help stimulate demand and provide a clearer pipeline of work for them.
In order to test the scalability of HPOS, stakeholders emphasised the need for the pilot to be comprehensive, ensuring that the concept is tested across a diverse range of participants and property archetypes and ages. A potential sample of 500 – 1,000 households was suggested to achieve this objective and ensure results are statistically valid. This was based on similar pilots. Some stakeholders felt that rather than the overall size of a pilot, the more important aspect was the range of property types and consumer groups involved in order to ensure the model is scalable. Some stakeholders also highlighted the need for the contractual complexities to be well-developed and clear to ensure the pilot is robust.
In terms of evaluation, stakeholders felt that the pilot should capture information on consumer attitudes such as their satisfaction with the install, interest in the pilot and the level of disruption caused by the install. The performance of the asset and estimated versus realised financial savings were also felt important to be recorded.
Some stakeholders highlighted the importance of a robust monitoring and evaluation plan to support households and assess whether the pilot had met its original aims of objectives. Further, some stakeholders suggested this should also be included as a standard part of any HPOS offer, outside of the pilot, to ensure estimated performance was achieved.
One of the main challenges identified with a pilot were the difficulties in recruiting participants and generating sufficient levels of demand, especially given the level of drop out that can be seen. Stakeholders highlighted recruitment lessons from other heat pump or similar projects, such as engaging with community groups.
Other challenges raised included the total cost of the pilot, ensuring the contractor had capacity to deliver and the practical issue of testing the success of a concept that requires long-term binding contract (such as 15 years).
Proposed business models to pilot in Scotland
This section explores what commercially viable and customer attractive business models could be deployed in Scotland. Three concepts for pilot schemes have been created, to address the challenges and hurdles raised in the desk-based research and from stakeholder interviews provided in earlier sections. The business models to be tested in these pilots are recommended by the research team, LCP Delta and Changeworks, in conjunction with conversations with the research steering group. It should be noted that further refinement of some of the practical dimensions of the business models will be required following this research as described in Section 8.4, such as the length of the pilot and number of households to target. These details would depend on Scottish Government ambitions and proposed timings.
There are numerous business models and variations of these models that could be applied. The models chosen here are specifically designed to be practical in terms of feasibility, delivery, and implementation. A progressive approach, as shown in Table 7 below, is recommended, starting with limited but evidence-derived features, and using lessons learnt to be deployed in successive stages.
Pilot 1 focuses on establishing the foundations of the model to overcome consumer barriers and test services that are relatively simple to implement. Pilot 2 builds on this by introducing another single component, a tailored tariff, and finally Pilot 3 consolidates these phases and moves to a subscription model where the provider owns the product.
| Pilot 1 | Pilot 2 | Pilot 3 | |
| Summary | Finance and routine maintenance | Finance, routine maintenance with energy tariff | Subscription with routine maintenance and breakdown cover |
| Features | Design, installation, routine annual maintenance, monthly payments, customer owns product | Design, installation, routine annual maintenance, monthly payments, heat pump tailored tariff, customer owns product | Design, installation, routine annual maintenance and breakdown cover, monthly payments, provider owns product |
Table 7: Overview of the three proposed business models to pilot
Overview
We took learnings from the market assessment and created four offers, starting with finance-only product and adding features in each stage, as presented in Table 1. These were used to gauge interest and engagement and to prompt discussion in the stakeholder interviews.
These pilots should be interpreted as broad options for business models that can be tested in Scotland. Note the following limitations and caveats:
- There are many variations and options for each of the three broad categories. For example, they could include optional extras that customers pay for in addition to the standard package but are not compulsory (such as making good a property after disruptive works or in-depth energy advice). They could also run at different term lengths depending on provider and consumer preference.
- Costs presented are indicative only. Actual costs are likely to vary significantly between different property types and customers (and have greater variance than typical costs of a gas boiler). For example, the installation cost of a heat pump will vary depending on the size of the home and the changes needed to the heat distribution system (i.e. radiators and pipework). There are also many factors that could influence the exact payments such as payment terms, interest rates and any add-on services. We have not modelled all of these scenarios as this was not within the project scope.
- Scottish Government incentives, in the form of a grant, have been calculated in Pilot 1 for illustrative purposes. The option to include this will depend on the availability of this grant at the time the pilot is tested.
Pilot 1: Finance and routine maintenance
7.2.1 The business model
Pilot 1 is the easiest to implement and is likely to have broad immediate appeal to customers. The model can be implemented immediately as the heating season is not specifically required for a pilot project because it is not testing product performance and we have already established that heat pumps are a planned purchase.
Overview of business model
Pilot 1 is a finance option scheme providing a complete heat pump solution. This solution includes the following services:
- heat pump system design;
- heat pump installation;
- finance for the heat pump purchase (monthly payments); and
- routine annual maintenance of the heat pump for the duration of the credit which can continue after the appliance is paid.
This model is a natural continuation from the Scottish Government’s Home Energy Scotland support which currently offers customers a £7,500 grant and £7,500 interest-free loan to install a heat pump (with a rural uplift where customers qualify). The models include the addition of a routine annual maintenance solution, which we have established through the research could be a key feature and benefit for customers.
What is being tested
With this model, several questions could be tested:
- Does a straightforward finance option have a greater appeal to a consumer than an upfront purchase?
- Does the inclusion of a routine maintenance package at an additional cost have appeal?
- Is there sufficient interest and engagement from the industry to partner with stakeholders and launch such a proposition?
Customer concerns addressed
This proposal addresses several customer pain points such as the identification of an appropriate installer and access to ongoing routine maintenance. The main barrier it addresses is the upfront payment of the appliance, by offering the opportunity to spread the cost with a loan with monthly payments over 5 to 15 years. Including Scottish Government subsidies, the Home Energy Scotland loan and grant would also reduce the capital sum with the maximum funding amount for a heat pump from these being:
- £15,000 (£7,500 grant plus £7,500 optional loan); and
- £16,500 (£9,000 grant plus £7,500 optional loan if the household qualifies for the rural uplift)
Table 8 shows indicative costs when the £7,500 Home Energy Scotland grant is included[14].
| Pilot 1 | Credit monthly payments | Maintenance cost | Total |
| 5 years loan | £46/month | £130/year for 15 years | £4,710 |
Table 8: Indicative costs for pilot 1 (finance and routine maintenance) when current Scottish Government subsidies accounted for
This type of model is not strictly an ‘as a service’ offer, as the customer owns the heat pump in full after paying the loan and can extend the routine maintenance service at a cost when the loan period is complete.
Customer and properties to target
Target customers are likely to be the same group that existing offers target, i.e. owner occupiers, able to pay, well informed customers making a planned purchase, but the opportunity to spread payments via a loan removes the significant upfront payment barrier. The addition of routine annual maintenance provides comfort and addresses a customer perception that providers are difficult to engage with. There is potential to extend to social/private landlords and multi tenure dwellings as well as district heating type schemes, but it is very likely that this will create additional complexity around installation, performance and contracting, as well as extending timescales significantly. Vulnerable customers are not excluded as a target customer, but access to credit for the loan finance could be a barrier for them.
It should be noted that appeal for heat pumps more generally is low. While this is expected to grow in future years, customer interest in this model at this stage could be limited.
Stakeholders involved
We would expect this proposition to be offered by a manufacturer or a retailer, likely by partnering with specialists from each sector. The approach requires the collaboration of a wide range of providers:
- appliance provider (most likely a manufacturer);
- finance provider (as retailers do not have the funds for financing, likely to be a third-party finance or a manufacturer of scale);
- installer (the retailer should engage it as a subcontractor as directly employed workforce for retailers is rare because of the costs); and
- maintenance provider (that should be provided by a subcontractor whose costs would be wrapped into the total cost or paid annually).
The benefit for the proposition provider is a potential group of consumers who were previously excluded because of the cost and limited additional risk as they will receive the revenue directly following installation.
From a customer perspective, as evidenced by the stakeholder interviews, a finance option model with at least routine maintenance included is likely to be the most instantly appealing and was also supported by consumer groups.
Indicative costs and revenue flows
Tables 9 and 10 show the costs for such business models without subsidies or grants. They are indicative costs as they were not modelled against specific Scottish property types or consumer profiles[15].
Table 9 below presents the split of the total cost of a heat pump between the cost of the appliance itself and the installation. This is the lowest cost solution, but the customer must be able to self-fund – it is presented here as a comparison against the finance options considered in Table 10.
| Pilot 1 | Appliance cost | Installation cost | Routine maintenance cost | Total |
| £8,000 | £2,000 | £130/year for 15 years | £11,950 |
Table 9: Indicative costs for “pilot 1” (finance and routine maintenance) without accounting for Scottish Government subsidies
Table 10 below shows an example of a finance purchase method including a finance loan for 5 or 15 years. For the customer, a loan allows the total cost to be spread over a number of years with higher or lower monthly payments depending on the loan period. A loan is more expensive than an upfront purchase but provides the benefit for the customer of spreading the cost and accessing routine maintenance throughout the contract period.
| Pilot 1 | Credit monthly payments | Routine maintenance cost | Total |
| 5 years loan | £180/month | £130/year for 15 years | £12,750 |
| 15 years loan | £70/month | £130/year for 15 years | £14,550 |
Table 10: Indicative costs for “pilot 1” (finance and maintenance) over different loan periods
7.2.2 The challenges
Pilot 1 is the least complex proposition and provides a measurable baseline against which more progressive and comprehensive propositions can be tested. However, the adoption of this kind of model has challenges, which are:
- Property suitability. This is linked to the energy efficiency measures which may be required in advance of installation to ensure operational efficiency and delivery of heat. As seen in the Danish case study, it is clearly stated that energy service providers are responsible for assessing whether homes are suitable for heat pumps before installing them.
- ‘Making good’ post installation. Customer expectations about the look of their property post-installation (i.e., redecoration, etc) may influence overall satisfaction with the project but this would also be an additional cost to the project. This could serve as an additional costed feature (presented as an optional extra to customers) to encourage sign up.
- Business case. Building a model that addresses risks and generates value for all supplier stakeholders as well as maintaining customer protection is challenging.
Pilot 2: Finance, routine maintenance with energy tariff
7.3.1 The business model
We would suggest Pilot 2 is run after Pilot 1 so that insights and lessons can be implemented. However, the two stages could be run in parallel, if desired, to assess any relative appeal of the additional features.
Overview of business model
Pilot 2 provides a finance option scheme, as per Pilot 1, but with the addition of a bespoke/tailored tariff to support heat pump operation.
What is being tested
With this model, the following issues will be tested:
- Does the inclusion of a tailored tariff with a commitment to be cheaper than a standard tariff have greater appeal to customers?
- Does the introduction of a tailored tariff unlock a new group of customers?
Customer concerns addressed
This model addresses several customer pain points that have already been identified for Pilot 1, the opportunity to spread the costs with a loan and access to installers and provision of routine annual maintenance. As with Pilot 1, inclusion of Scottish Government subsidies would further reduce the heat pump capital cost and related ongoing payments.
A tailored tariff is intended to offer benefits to both the retailer and the customer. The customer is incentivised to shift their demand by being offered periods of lower cost electricity when overall demand on the network is lower. This reduces costs for the customer and offers network benefits.
Customer and properties to target
As for Pilot 1, the target audience would be informed and interested customers who are planning a heating system change, rather than a breakdown prompting a distress purchase. There is potential to extend the target to social/private landlords and multi occupancy dwellings but, again, this will add additional complexity around installation, performance and contracting. Vulnerable customers are not excluded as a target customer for this model, but access to credit could be a barrier to them.
Stakeholders involved
The inclusion of an energy tariff means that this proposition is most likely to be offered by an energy retailer. As in Pilot 1, whoever offers the proposition will need to partner with specialists, such as a manufacturer for providing the appliance, finance providers for financing the appliance and a subcontractor for installation and maintenance.
Overview of tailored tariffs
The tailored energy tariff which matches the operation of a heat pump can be one of the following:
- A Time of Use (ToU) tariff, where a heat pump customer is offered a period (or periods) of low-cost electricity when their system can operate and fill the thermal store ahead of needing it to heat the property or to use as hot water. There will likely be a corresponding period where electricity is more expensive (when there is greater demand or low renewables generation). This would be supported by a commitment that signing up to this tariff would be cheaper than a standard tariff. As described in Appendix 3, Octopus has now launched their CosyOctopus proposition, which offers exactly this. It is currently the only tariff of this kind available in the UK.
- Metered heat should be considered as a logical next step once the principle of tariff plus appliance has been tested. Introducing metered heat would mean the installation of heat meters, which adds a further level of complexity as well as additional costs and risks for the provider. With a metered heat tariff, the supplier bills the customer for the heat provided, rather than for the energy consumed in delivering the heat and is explained further in Appendix 5, using the Danish trial as an example.
- Using heat as a proxy for consumption rather than kWh may also improve understanding for a customer and lead to advanced engagement, although some form of visualisation, i.e., an in-home display or smart phone app may be needed to present this data.
Indicative costs and revenue flows
The indicative costs for this business model are the same as those presented for Pilot 1, and they do not include any subsidies or grants. As for Pilot 1, these costs presented in Table 10 were not modelled against specific Scottish property types or consumer profiles[16].
7.3.2 The challenges
We find the same challenges in Pilot 2 as in Pilot 1. However, in addition to those, here we are engaging an energy retailer to develop a tailored energy tariff which may increase supplier risk but needs still to be an attractive offer to the customer. The supplier risk is linked to the following issues:
- Energy retailers must embed the risk of building a tariff that accurately reflects the variable cost of electricity at different time periods while also offering a customer price guarantee.
- Implementing tailored energy tariffs requires advanced metering infrastructure, especially for Time of Use tariffs, to accurately measure and record energy consumption in different time periods.
- Introducing Time of Use tariffs requires customer education and engagement from retailers to promote understanding and adoption. Installers could also provide in home support around the efficient operation of a heat pump and how to align with a specialist tariff.
Pilot 3: Subscription with routine maintenance and breakdown cover
7.4.1 The business model
Introducing a subscription model has the potential to unlock a significant new customer segment but introduces a new set of financial and operational risks. The complexity involved in creating a proposition of this type suggests that learnings from Pilots 1 and 2 are essential as well as clearly understanding customer demand.
Overview of business model
Pilot 3 includes a complete heat pump solution, including design, installation, routine maintenance and breakdown cover, with monthly payments to spread the cost over 5 to 15 years. There is a minimum contract term of 5 years that reflects the time to repay the cost of the appliance. An electricity tariff is excluded from this model at this stage, since it is subscription specifically that is being tested, but could be included if insight from Pilot 2 suggests that this is a key feature for customers.
The customer is committed to a fixed term contract and does not own the appliance at the end of the contract. This approach provides the customer with peace of mind, as the service provider would offer a single point of contact for any issues related to their heating system.
What is being tested
With this model, we would like to test several questions:
- Does product ownership influence the customer appeal (as the consumer does not own the appliance at the end of the contract)?
- Is a subscription type product of interest to a customer?
- Is there sufficient industry ambition to launch a subscription type of model?
Customer concerns addressed
In parallel to Pilots 1 and 2, this approach addresses one of the main customer pain points of high upfront costs. A subscription model allows customers to access a heat pump solution with affordable monthly payments over a fixed term, nominally a 15 year period in this model, which also includes routine maintenance and breakdown cover. Customers benefit from a well-maintained and reliable heat pump without the hassle or expenses associated with servicing or unexpected breakdowns.
Customer and properties to target
Target customers are likely to be the same as for Pilot 1 – informed customers who have conducted their own research and are comfortable with the principle of subscription. This could be extended to include social/private landlords and multi occupancy dwellings, but this will add further complexity around installation, performance and contracting. As the market evolves, the insight and lessons learnt from Pilot 1 and 2 can be applied to inform the decision on whether to extend the scope to include vulnerable customers or other target groups.
Stakeholders involved
This model provides long-term, predictable revenue for the provider, although this may be offset by the provision of the upfront capital and the time taken to recover that investment and generate profit. There are also additional expenses to be considered compared to a simple sale, including additional costs for customer service, billing and managing payments, remote diagnostics of the appliance and any interest attracted by loans from an investor or a finance provider. This financial risk was highlighted as a significant barrier by providers. Another concern raised by providers is their ability to offer multiple services from across the value chain (installation, asset management, financing and contracting) as a HPOS model would dictate. Building a consortium with third parties to offer these services was suggested by stakeholders as a solution to support the delivery of HPOS, which is the approach we suggest for the pilot.
We would expect this proposition to be led by a retailer or a finance provider, partnering with experts to deliver specialist services, including:
- a finance provider or manufacturer of scale who can offer finance;
- an installer, likely to be engaged as a subcontractor since a directly employed workforce adds further costs; and
- a maintenance provider, again engaged as a subcontractor, whose costs would be wrapped into the total monthly subscription cost.
Indicative costs and revenue flows
The cost for this model (see Table 11) is wrapped into a monthly subscription fee, initially including the appliance, and then standalone once the product cost has been recovered. We have modelled this pilot to run over 15 years with consistent monthly payments but there are other options. For example, the subscription could have higher initial costs to repay the product more quickly or lower monthly costs but for a longer period.
| Pilot 3 | Monthly payments | Routine maintenance cost | Total |
| 15 years lease | £90/month | n/a | £16,200 |
Table 11: Indicative costs for “pilot 3” (subscription, routine maintenance and breakdown cover)
7.4.2 The challenges
There are several challenges linked to the subscription model. For the suppliers, the challenges are linked to a better understanding of the risks involved and how they can manage those risks to develop propositions that will be commercially viable. A further challenge is how these propositions can be attractive to customers, especially given a lack of product ownership (which we believe – with current customer insights – is not perceived to be an advantage). Understanding customer concerns, is vital to be able to design appealing offerings. Several challenges and questions are raised linked to this proposition:
- Does the subscription model work in the heating sector?
- Does the cost to serve the customer increase in line with longer contract period?
- Does product ownership create a barrier or an opportunity?
- What level of guarantee is offered to the customers once the product is paid off and what is the scope?
- Does this model work for vulnerable customers and is there opportunity to use grant funding to subsidise their costs?
| Pilot 1
Finance and routine maintenance |
Pilot 2
Finance, routine maintenance with energy tariff |
Pilot 3
Subscription with routine maintenance and breakdown cover |
|
| Proposition | Design, installation, and routine maintenance of a heat pump with credit monthly payments. | Design, installation, and routine maintenance of a heat pump with monthly payments and a tailored heat pump tariff. | Design, installation, routine maintenance and breakdown cover for a heat pump, with monthly payments to spread the cost. |
| Timescale | Immediate
implementation |
Launch in parallel with or upon completion of Pilot 1 | Launched when or if market insights show that there is a market desire and a customer appeal. Insights from Pilot 1 and Pilot 2 first. |
| Target customer(s) | Informed customers first with potential to extend to social/private landlords and multi occupancy dwellings | Informed customers first with potential to extend to social/private landlords and multi occupancy dwellings | Informed customers first with potential to extend to social/private landlords and multi occupancy dwellings.
As the market is expected to evolve, it would be appropriate to extend to wider customer groups, including vulnerable customers. |
| What is being tested? |
|
|
|
| Proposition owner | Manufacturer or retailer | Energy retailer | Retailer or finance provider |
| Appliance provider | Manufacturer | Manufacturer | Retailer or manufacturer |
| Finance provider | Finance provider or manufacturer of scale | Finance provider or manufacturer of scale | Finance provider or manufacturer of scale |
| Installer | Subcontractor | Subcontractor | Subcontractor |
| Routine annual maintenance and breakdown cover | Subcontractor | Subcontractor | Subcontractor |
| Energy tariff | Not included | Energy retailer | Insights from Pilot 2 needed. If appeal is increased, then a tariff should be included. |
| Challenges |
|
|
|
Table 12: Summary table of Pilot schemes
Conclusions
Overview of findings
This research has explored how HPOS business models could be piloted in Scotland. It is anticipated that energy efficiency and climate change policy will drive demand for heat pumps towards the end of the 2020s and beyond. Given their high upfront costs, it will be necessary to help consumers with financing solutions in order to facilitate their uptake.
Our research has described a full spectrum of business models such as ‘finance only’, ‘full subscription’ and ‘heat as a service’ models. Some offerings are currently available in Scotland, but these are mostly limited to ‘finance only’ packages, which essentially provide payment plans to customers wanting to install a heat pump. There is no evidence of the uptake of these offerings, but we believe it to be very low.
There are also a multitude of additional options, alongside financing solutions that can be used to help consumers. Examples include the installation of energy efficiency measures, bundling with an energy tariff and the provision of energy advice.
Results from our desk-based research and stakeholder interviews demonstrate that the Scottish Government should be cautious in forecasting how quickly HPOS could be rolled out in Scotland or indeed how much consumer demand there is likely to be in the near term. Even if finance models are made available to consumers, there are still likely to be non-financial barriers, such as the complexity of the installation and associated costs and timescales, ability of the appliance to deliver sufficient heat without additional insulation, consumer difficulties in understanding fuel bill savings and a current lack of consumer demand, along with wider supply chain issues.
Our research has demonstrated that there is a mixed appetite from all stakeholders for involvement in a HPOS pilot. Challenges and risks such as consumer protection and ensuring heat pump performance were raised by consumer groups and finance providers. The biggest obstacle for organisations who might want to offer a trial proposition was seen to be the provision of finance; only larger companies are likely to be able to provide this and, within this, economies of scale are required to make it attractive.
Specific barriers to HPOS models, which were raised by consumer groups and finance providers related to consumer protection and understanding of contractual issues. For example, many were concerned about product ownership when moving properties. A further key challenge for potential consumers is accessing finance if they already have difficulty in obtaining credit. As discussed in Section 6 of this report, there are multiple issues around providing finance, including a current lack of willingness from finance institutions to enter the market at scale and uncertainty around the ability and willingness of energy suppliers to provide finance packages. As a result of these challenges, the business case for HaaS is currently not strong enough, which has a direct impact on current consumer demand and limits the motivation of finance providers to engage.
A further key consideration is understanding the target customer for different propositions and that a range of propositions may be required rather than a ‘one-size-fits-all’ approach. For example, there may be different levels of consumer appeal to product ownership, but there is a need to test different options to provide an appropriate evidence base. This range of propositions might include a finance plan for those customers that are not able to pay upfront for a heat pump, or a full subscription proposition for those that would like to have a peace of mind (LCP Delta, 2022a).
Overall, our research concludes that there are multiple barriers to all stakeholders in quickly rolling out HPOS models to consumers in Scotland. The consumer demand, supply chain and industry is far from being ready to roll this out at scale. However, we are still able to present options for the Scottish Government to develop HPOS as part of this research.
It should also be noted that the business models presented here are not expected to generate customer demand for installing heat pumps, but rather to present different financial options in a market where greater customer demand exists.
General recommendations
There are many steps the Scottish Government could take to explore, analyse and test HPOS models in greater detail but the best course of action should align with policy development and priorities. Some broad recommendations are made based on this research:
- Build on Scottish Government incentives. The Scottish Government already provides financial support to households through a grant and loan administered by Energy Saving Trust. This report has not considered the uptake, appeal or other factors of this loan as this was not in scope. However, having reviewed the current HPOS business models available in Scotland, we believe that understanding this would be a useful exercise to inform any HPOS pilots. Research with specific customer groups, such as customers who took out the financial support, or who applied and didn’t proceed, may be a useful starting point to test appeal of elements in the proposed pilot business models.
- Clarify regulation including customer protection. Alongside, or before, any initial pilots of HPOS models, further examination, assessment and clarity is needed to aid further development of HPOS models. For example, consumer protection is one of the most important areas for consideration, to examine more fully what customer protection is needed and how customers in different cases may be affected, for instance when they move house. Understanding how HPOS contracts would work in detail may help understand and overcome barriers.
- Build up to more complex and comprehensive propositions. We do not recommend piloting more complex business models such as HaaS immediately. Whilst HaaS could be tested on a small scale, there is very little appetite from industry or customers for this business model and little chance of a large-scale adoption at this point. Instead, we present below a series of staged pilots that would test certain elements of different propositions aimed to overcome specific barriers to heat pump uptake.
Piloting HPOS business models in Scotland
Drawing on the desk-based research, stakeholder interviews and our business model analysis, we recommend three business models to be tested in Scotland:
- Finance and routine maintenance: this includes heat pump design, installation, routine maintenance and a finance package using monthly payments. This model would build on current market offerings to test the appetite of customers to have a more complete heat pump package. This pilot could be rolled out fairly quickly if finance can be secured.
- Finance, routine maintenance with energy tariff: this is the same as package one but includes the bundling of an energy tariff, which would ensure customers are on the lowest possible energy tariff for a heat pump. This makes the customer offering even more comprehensive and provides the customer with reassurance around running costs. Rolling out this pilot would require the involvement of energy suppliers.
- Subscription with routine maintenance and breakdown cover: this model provides subscription rather than a financing model, the main difference being that the provider owns the heat pump and breakdown cover is included alongside routine maintenance. Other elements are the same as pilots 1 and 2, except that there is possibility, coming from the insights of pilot 2, to include a metered heat tariff, which will transform this model into a full subscription one. This business model is more advanced and we do not consider the market or consumers to be currently ready for it, although it could potentially be tested in future.
There are many variations of these models that could be presented and further analysis is required to define the specific features and terms that should be offered. To understand the effectiveness of any pilot requires clear pilot aims to be drawn up and appropriate monitoring and evaluation mechanisms to be implemented.
Stakeholder feedback also highlighted the risks of getting a pilot wrong in terms of potential negative impacts on the industry or negative customer opinions, therefore all elements of the business model need to be robust.
Proposed focus areas for further research
In our research we identified several current evidence gaps that would benefit from further examination.
This research has been conducted without direct feedback from customers on which business models or elements of them appeal the most or why and how this might differ between customer groups. Therefore, the findings and assumptions around customer appeal should be viewed in this context and market research would be needed to understand or test this further. Any pilot study should include an element of customer research to understand customer views. One caveat with undertaking customer research in the near term is to appreciate that attitudes to as-a-service business models may change as the market for these types of propositions grows, both within and outside of the heat pump market.
There are many variations around what specific features are included within each of the models proposed, for example the duration of the contract period, whether a partial up-front payment has appeal, or the type of tariff included in the proposition. Further research focussing on these particular elements may help the refinement of the pilot schemes proposed.
Further research is also needed to understand what consumer protection issues arise with HPOS models and what protection could and should be put in place. In particular, there are questions around the transfer of ownership if a property with a heat pump is sold and any obligation that may be placed on the new owner as well as appropriate regulations to ensure that customers are not exploited with long-term credit contracts.
Building on concerns identified in this research via engagement with consumer groups, we suggest that detailed understanding that directly explored consumer appetite for HPOS and any concerns that may limit uptake would also be of value.
There is also a need to explore what actions should be taken if a customer defaults on payment, or if the customer is vulnerable and unable to pay. This should include what happens to the product that has been installed and how the supplier accounts for this risk.
We also acknowledged that respondents to research questions are often using gas boilers as their reference point when responding to questions around potential models, for example, when asked about the appeal of a subscription service. There may be value in conducting research specifically using heat pumps as a baseline product.
References
Energy Saving Trust, Home Energy Scotland Loan webpage: Home Energy Scotland Grant and Loan: overview · Home Energy Scotland.
LCP Delta Heating Business Service, Ottosson K. and Timperley N. (2022a). Can Heat as a Service (HaaS) drive heat pumps into the mainstream? Can Heat as a Service (HaaS) drive heat pumps into the mainstream? Accessed June 2023. Please note that this report is available to subscribers only.
LCP Delta Heating Business Service, Barquin T. and Cooper C. (2022b). European Customer Research – 2021/2022 – Part 3 – Heating Replacement Trends. European Customer Research – 2021/2022 – Part 3 – Heating Replacement Trends. Accessed June 2023. Please note that this report is available to subscribers only.
Fleck, R., Anaam, A., Hunt, E. and Lipson, M. (2012). The potential of Heat as a Service as a route to decarbonisation for Scotland. Available at: The potential of Heat as a Service as a route to decarbonisation for Scotland Accessed June 2023
Scottish Government (2021a). Heat in buildings strategy – achieving net zero emissions in Scotland’s buildings. Available at: Heat in buildings strategy – achieving net zero emissions in Scotland’s buildings Accessed June 2023
Scottish Government (2021b). Heat Pump Sector Deal – Final report. Available at: Heat pump sector deal – Final Report Accessed June 2023
Scottish Government (2021c). Securing a green recovery path to net zero: climate change plan 2018 – 2032. Available at: “Securing a green recovery on a path to net zero: climate change plan 2018-2032”
Scottish Government (2021d). Heat Pump Sector Deal – Final report. Available at: Heat Pump Sector Deal – Final Report, Accessed June 2023.
Appendices
Appendix 1 Methodology: stakeholder interviews
The methodology focussed on qualitative insights from relevant groups along with analysis of quantitative data. The methods used included:
- Desk-based research to provide an overview of the current market landscape for innovative heat pump business models in Scotland and the international landscape.
- Stakeholder interviews to explore the feasibility of testing HPOS type pilots in Scotland, including an understanding of the barriers, challenges and solutions. This involved 18 interviews with a range of representatives from heat pump installers, manufacturers, consumer bodies, financing organisation, electricity network operations, trade associations and Government. A full list is provided below.
- Analysis of business models which would be piloted in Scotland, drawing on the data above and feeding in information from the research steering group.
Eighteen stakeholders were interviewed as part of this research:
- Industry experts (2)
- Manufacturers (2)
- Consumer organisations (3)
- Trade associations (3)
- Electricity network operators (2)
- Installer organisations (2)
- Financiers (2)
- Government (1)
- Housing association (1)
We also reached out to energy suppliers, but we were unsuccessful in recruiting any for this research in the timescales.
Interviews were semi-structured using a topic guide and interviewees were sent the heating business models developed in this research as a prompt for discussion.
Appendix 2 Findings from stakeholder interviews
Consumer Appeal
The appeal for HPOS will likely vary across consumers depending on their financial situation, awareness of low carbon heating systems and desire to reduce their carbon emissions. Removing the upfront cost of a heat pump will reduce a significant financial barrier to switching to a low carbon heating solution. However, in order to represent a financially appealing proposition, many stakeholders indicated that it is important the running costs associated with heat pumps remain competitive with traditional heating solutions. This is likely to be particularly important for vulnerable consumers, such as those in fuel poverty. It was also highlighted that this consumer group could have more difficulties being accepted onto HPOS due to potentially having poor credit ratings.
Stakeholders highlighted that due to the unfamiliarity with heat pumps and the infancy of these financing models, the total cost of HPOS may not be clear to be consumers. It was therefore considered important that consumers are provided with information on expected heat pump performance and the total cost of the subscription so that they can make an informed decision. This was especially thought to be important for risk averse consumers.
Appeal to providers
The appeal of HPOS to providers is relatively limited, especially amongst small / medium sized installers. This is primarily due to the existence of several barriers that currently deter organisations from offering HPOS. It was felt that smaller installation organisations would need funding in order to overcome the significant initial investment required and improve the rate of return.
Financial risk was identified by installers and consumer groups as one of the main barriers for potential providers. Some organisations may not have access to finance required to cover the significant upfront investment required to offer HPOS. For organisations with the necessary financial backing, the return on investment may not be sufficient to cover the additional credit risk.
The lack of consumer demand creates a challenge for potential providers to justify developing the supply chain and their HPOS proposition. Policy certainty would give providers more confidence on future demand and therefore drive the development of the supply chain. Consumer groups highlighted the role Scottish Government should play in providing clarity on the policy direction for heat decarbonisation in order to drive demand.
Finally, offering HPOS, especially the more advanced business models, requires providers to offer several different services across the value chain. This includes installation, asset management, financing and contracting. Consumer groups highlighted that few organisations would have the capabilities within their organisation to fulfil all responsibilities. Disaggregating the roles (e.g. via subcontracting) was suggested as a way in which different organisations could support the delivery of HPOS.
Almost all stakeholders interviewed felt that small / medium sized organisations are more likely to face the barriers identified above and that larger organisations are better placed to offer HPOS. Multiple stakeholders indicated that only larger companies are realistically going to have the capability and appetite for offering HPOS. It was suggested that large energy suppliers are currently well positioned in the market as they’re able to utilise existing relationships with customers and have access large marketing budgets to acquire new customers. Similarly, there was appetite from manufacturers to deliver or support HPOS rollout. It was felt that the prospect of a consistent payment stream could be attractive to these organisations. Unfortunately, we were unable to recruit an energy supplier to take part in the interviews.
Government indicated that, in order to justify additional investment in marketing and developing their proposition, potential providers need more clarity on the benefits that it could provide to their organisation.
Finance
Installers highlighted the role that organisations such as the Green Investment Group[17] or the Scottish National Investment Bank[18] should play in providing finance required to roll-out HPOS. For private investors, the attractiveness of this concept will depend largely on their risk appetite. It was believed by stakeholders that many financial organisations are interested in this but need long term policy certainty.
With regards to fixed term vs rolling contracts, it was suggested that a rolling contract could be preferable for the consumer as it could give providers an opportunity to amend terms or the option to leave if their situation changes. This option would likely be more costly for consumers to reflect the increased financial risk for providers.
Regulation
Stakeholders identified several areas in which changes to existing regulations and future regulations would be needed to support the roll out of HPOS. Currently, energy suppliers in the UK are only able to charge their customers in units of electricity consumed (e.g. p/kWh). In order to offer more complex forms of HaaS, changes to supplier licences would be required to enable suppliers to legally charge a customer for the amount of heat or warmth they receive (e.g. £/warm hours). Furthermore, it was highlighted that if the market is to offer long term contracts, the consumer’s right to change supplier at any point may need to be reviewed.
It was highlighted by several stakeholders that future regulation will be required to ensure consumers are protected. Consumer groups highlighted that if the contractual arrangement is between the consumer and the HPOS provider, then it is believed that the consumer will no longer be covered by Microgeneration Scheme Certification (MCS) protections (the main renewable technology quality standard that is commonly used for heat pump installations). Analysis for this project suggests that this would apply to business models where the customer owns the heat pump themselves and where they have a contractual arrangement with the provider rather than the installer (as it is the installer who is MCS certified)[19].
Further suggestions included ensuring that consumers are protected from extreme movements in electricity prices, especially those under long term contracts. Government highlighted that a ‘cap on fair usage’ policy, which could enable an upper limit on spend to be set by the customer and send alerts when this limit is approaching, to ensure there is sufficient protection for vulnerable consumers. Regulation is also required to ensure consumers can identify credible schemes to encourage uptake and trust.
Given the length and size of the contracts being proposed under HPOS, stakeholders felt that it would be likely that financial regulation would be required.
Adjustments to current energy market arrangements were also suggested by stakeholders to improve the attractiveness of HPOS. This was commented on in relation to global gas prices being a key driver of the price households pay for their electricity, especially in the UK. Decoupling of wholesale electricity and gas prices is currently being considered by UK Government as part of the wider Review of Electricity Market Arrangements (REMA). Manufacturers highlighted the significance this change could have on stimulating demand for heat pumps by reducing the impact high global gas prices have on the price of electricity, immediately reducing the cost of operating an electric heating asset.
Appendix 3 Heat pumps offerings and heat pump tariffs in the UK
Heat pump offerings
| Installation and routine maintenance | Upfront payment | Deposit payment | Finance and installation | Service only |
| Octopus Energy | E.ON | E.ON | British Gas | Scottish Power |
| EDF Energy | E.ON |
Table 13: Summary of current heat pump offerings in the UK
Octopus Energy has a heat pump offering, “Octopus heat pump” that includes providing and installing a heat pump. Alongside this, customers can choose from two optional service plans, as outlined in table 14.
The British Gas heat pump offering includes a financial option and installation. Their Warm Home Promise offers: a free home survey, industry-leading aftercare, free service in the customer’s first winter and a 5-year warranty and an air source heat pump from the leading brands Vaillant and Daikin. The financial plan from British Gas consists of a 5-years’ interest-free credit which makes the heat pumps more affordable for customers.
E.ON offers different finance options to help customers spread their heat pump cost. These are outlined in the table 15 below. Customers can pay upfront, with a deposit or choose one of the flexible payments options by paying monthly instalments for up to ten years.
Scottish Power is offering an Annual Service Plan for air source heat pumps. Their service includes full testing of the heat pumps equipment and the associated components by specialised engineer for £14.75 per month (one year automatically renewable contract). This service plan is only for air source heat pumps that are owned by the customer and used for personal use.
EDF Energy sales and installs air source heat pumps. Their prices start from £5,500 in England and Wales or £3,000 in Scotland (including the government grant). Heat pumps (Daikin models) purchased and installed from EDF Energy come with a 3–5-year warranty.
The following tables provide more details for the current heat pump offerings in the UK as described in Section 5.1.1.
| Standard warranty | Basic plan |
|
|
Table 14: Octopus Energy heat pump offering optional service
| Pay in full | Pay a deposit | Pay on finance |
| Pay the full amount upfront for the air source heat pump system. There’s no need for a credit check with this option so it’s quick and easy to do. | Pay a deposit and settle the balance once the installation is complete. This would be within seven days of installation and is subject to a credit check. | Spread the costs by splitting it into manageable monthly payments with no upfront payments.
|
Table 15: E.ON heat pump offering finance options
Heat pump tariffs
| Supplier | Status | Tariff | Details |
| Octopus | Active offer | Six hours of cheaper electricity a day | Cosy Octopus tariff is eligible for customers with a heat pump and a suitable smart meter |
| OVO Energy (no longer operating) | Trial only – no longer available | Discounted electricity tariff (all day) – 5p/kWh | A 2022 trial in social housing in Manchester. The Heat Pump Pro trial available to customers with a heat pump, a smart meter |
| Good Energy | No longer operational | Cheaper electricity units at times of the day | Launched in 2020, intended to help customers benefit from surplus electricity on the grid. |
Table 16: Overview of previous and current heat pump tariffs in the UK
Cosy Octopus is a tariff with double dip Cosy Hours every day: six hours of very cheap electric to warm the customer’s home. To be eligible for Cosy, the customer should have a heat pump (air, or ground source) at a property that Octopus supply. The customer will need a SMETS2 smart meter, or some types of first generation (SMETS1) smart meters, that Octopus can receive half-hourly consumption data from.
OVO Energy announced its trial of its type-of-use heat pump tariff, Heat Pump Pro in March 2022 being the first one of this kind in the UK. Only Daikin heat pump owners living in a Northwards Housing Association property in Greater Manchester were eligible for this trial. OVO Energy new Heat Pump Pro tariff allows members to pay a lower rate for energy used to power their heat pumps. With the Heat Pump Pro tariff trial, participants were getting 5p/kWh off their standard rate for electricity used to power their heat pump. The Heat Pump Pro trial was available for OVO members with a Daikin Heat Pump and smart meter, and who were also on OVO Energy’s Simpler Energy price plan (the variable rate plan). OVO connected the customer’s heat pump to its smart platform and analyse the data it receives from it in order to understand the customer’s central heating system behaviour.
Good Energy had launched a heat pump offer back in 2020 which is not available anymore. The tariff was supposed to help make it more cost-effective to run a heat pump, offering cheaper unit rates at different times of day to ensure consumers can benefit from surplus renewable generation or low demand on the grid.
Appendix 4 Indicative cost for E.ON heat pump offering vs. boiler offering[20]
| Heat pump | Boiler | |
| Item value | £10,000[21] | £2,900[22] |
| Upfront payment | £0 | £0 |
| Total amount of credit | £10,000 | £2,900 |
| Agreement duration | 120 months | 120 months |
| Annual rate of interest | 3.9% | 7.9% (fixed) |
| Monthly payments | £100.44 | £34.61 |
| Total amount payable | £12,053 | £4,153.20 |
Table 17: Indicative costs in a finance proposition comparing heat pump and a boiler
Appendix 5 International examples of heat pumps offerings
| Finance | Rent | Lease | Subscription |
| OK
(Denmark) |
Viessmann
(Germany) |
EWE
(Germany) |
OK
(Denmark) |
| Thermondo
(Germany) |
OK
(Denmark) |
||
| OK
(Denmark) |
|||
| Econic
(The Netherlands) |
Table 18: Overview of current heat pumps business models across Europe
| Case studies | ||
| Country: Germany | ||
Company overview With more than 90 years of existence, EWE is one of the largest contracting providers and utility companies in Germany. For many years, EWE has successfully combined the business fields of energy, telecommunications, and IT, and is thus well-placed to harness the opportunities resulting from the energy turnaround and digitalisation as well as play an active role in shaping these two trends. Today, EWE uses its experience to drive the energy revolution forward and to protect the climate. They are very familiar with heating services. Customers can rely on products and services from EWE but as well from their partner network. Offering EWE ZuhauseWärme offers a leasing scheme for air to water heat pumps. Their offer EWE HomeHeatPump includes all-round carefree package with the components of lease, service, and energy. The benefits of the leasing are the following: EWE takes care of the planning and organization, covers the acquisition and installation costs, fixed price guarantee for over 15 years, calculable and transparent monthly amount, replacement in the event of a total failure (prerequisite for regular maintenance by a specialist company or by means of a service contract with EWE). The customer can combine this offer with an optional service contract (inspection, maintenance, and repair, 24-hour availability and 365-day emergency service at monthly flat rate from € 23.80) and power supply from EWE (green electricity price guarantee for 12 or 24 months). |
||
Company overview Thermondo was founded in 2012 and has already become Germany’s largest heating system installer by bringing a new, digital approach to the staid business. Thermondo runs an online portal advising homeowners on how to modernise their heating systems. Offering Thermondo is offering a rental scheme for air to water heat pump. Their offering includes installation, maintenance, insurance and repairs for up to 15 years from 209 €/month. Thermondo takes care of all funding and financing processes for the customer and thus secure up to 35% state funding. |
||
Company overview Viessmann is a global family business founded in 1917 and growing since. Viessmann evolved from a heating system manufacturer to a solution provider for the entire living space in four generations. They cover all applications: heating, cooling, ventilation, energy generation, and energy storage. In doing so, we use a wide variety of energy sources: sun, wind, geothermal energy, electricity, biomass, or even oil and gas. Offering Viessmann Wärme offers a rental scheme, and the monthly rate includes all services such as installation, warranty, maintenance, and repairs. The installation is carried out by a qualified Viessmann partner. This person remains the first point of contact for the entire duration of the contract. Only after the rental system has been successfully installed does the Viessmann heating contract begin. A rental scheme means concluding a contract with a business partner, here Viessmann. The duration of the contract is usually 10 or 15 years. In order to ensure the greatest possible flexibility, Viessman also offers options with a term of one year or more. |
||
| Country: The Netherlands | ||
Company overview Econic is a dutch company founded in 2017 whose core activity is making houses and buildings more sustainable by installing and maintaining sustainable heat and energy systems at a fixed monthly fee. With their various (finance) solutions homeowners no longer need to invest in expensive equipment such as heat pumps, solar panels, home batteries, and EV charging stations. It also enables project developers and building owners to significantly reduce construction costs. What they began in the Netherlands, is now rolling out in Germany and finally throughout Europe. Offering Econic offers a rental proposition for residential customers including a heat pump, water tank and PV (EV charging and battery storage option are also possible). Their monthly membership fee is including material costs, installation, monitoring, maintenance, guarantees and service. The revenue structure is the following, there is fixed monthly fee with no upfront fee, the amount varies by customer but typically is around 250€. |
||
| Country: Denmark | ||
| The Danish Parliament decided in 2016 to investigate a new way of providing heat from heat pumps: “heat pumps on subscription” or “heat as a service”, where the heat pump is not owned and serviced by the house owner but owned by an energy service company that sells the energy to the house owner. The Danish example of heat pumps on subscription came from the pilot project from the Danish Energy Agency in order to speed the roll out of heat pumps in Denmark. Energy on subscription is a well-known concept in Denmark since about 65 % of Danish buildings are heated by district heating. District heating is characterized by a small sign-on fee, an annual fee for insuring well running system, and payment for the actual used heating. Therefore, energy companies in Denmark can offer in the same way heat pumps on subscription. Four companies with different background were selected to participate in the pilot project. The pilot project included a subsidy scheme where the companies were rewarded economically for each heat pump they installed. This subsidy scheme aims to drive the uptake of heat pumps in areas where district heating is not available and to help customers with lower incomes to invest in a heat pump.
The subscription in this trial takes the following form: customers pay an up-front fee for the installation of the heat pump, then a fixed price per kWh of heat delivered and a fixed annual payment to the service provider. The minimum subscription is 10 years. The relevance to HaaS is that customers pay a fixed price for kWh of heat output by the heat pump, not for the kWh of electricity the heat pump consumes. They also pay fixed annual prices to repay for the heat pump, installation, and any maintenance costs. OK, for instance who is currently offering this type of proposition, offer consumers a fixed monthly rate including all these costs. It is important to note, which is relevant for all case studies and examples, that this trial was not designed to improve the energy efficiency of buildings or to help consumers afford their heating bills. However, energy service providers are responsible for assessing whether homes are suitable for heat pumps before installing them. The results of the pilot are the following:
This example is also covered in a previous ClimateXChange report (Fleck et al. 2021).
Company overview OK a.m.b.a. is a Danish cooperative society. In addition to the parent company, the OK Group includes subsidiaries such as Kamstrup, EnergiData and OK Plus. OK is Denmark’s best-selling petrol brand, but delivers energy solutions for electric car charging, insurance, fuel oil, natural gas and heat pumps. Offering OK is currently offering a heat pump on subscription, a heat pump leasing, and a loan for heat pump purchase. |
||
| Heat pump on subscription | Heat Pump Leasing | Loan for heat pump purchase |
|
|
|
Table 19: Summary of heat pumps business models across Europe
Appendix 6 Examples of other products on subscription
Recently, the UK boiler market has seen the introduction of the boiler subscription service. On average subscription plan is liked to last between 5-10 years. The business model for boiler on subscription might be comparable to the heat pump subscription model, therefore here are some examples of boiler subscription service offerings including the pros and cons.
| Offerings | Pros | Cons |
|
|
|
|
|
|
Installation, annual boiler service, repairs, fix or replace guarantee, mainly no deposit or interest |
|
Table 20: Pros and cons of a boiler subscription offering
Appendix 7 LCP Delta Heating Business Service Customer survey
The Heating Business Service of LCP Delta conducted an online customer survey in December 2021 and January 2022 (LCP Delta 2022b).
Here are the details about the survey:
- Survey respondents:
- ~200 respondents from each of: France, Germany, Italy, United Kingdom, Netherlands
- Homeowners only
- For each country:
- 25% of respondents under 40 years old with annual household income under €40k
- 25% of respondents under 40 years old with annual household income over €40k
- 25% of respondents over 40 years old with annual household income under €40k
- 25% of respondents over 40 years old with annual household income over €40k
- No respondents connected to communal or district heating network
- No respondents under 18 years old
© Published by LCP Delta, 2023 on behalf of ClimateXChange. All rights reserved.
While every effort is made to ensure the information in this report is accurate, no legal responsibility is accepted for any errors, omissions or misleading statements. The views expressed represent those of the author(s), and do not necessarily represent those of the host institutions or funders.
- The research was conducted in early 2023 and was correct at time of finalisation in August 2023. The market has continued to develop and we are aware of new propositions now available, for example a proprietary heat pump being offered by Octopus and their Cosy tariff. ↑
- Poor energy performance refers to the inefficient use of energy within a household or building. It often results from inadequate insulation, outdated heating systems, inefficient appliances, and other factors that might lead to excessive energy consumption and high energy bills. ↑
- This is an average cost for an air source heat pump, but the costs can vary a lot between different sizes of heat pumps which may be required in different property sizes or types. ↑
- This report uses the term “Heat pump on subscription” (HPOS) to refer to the wide range of innovative business models and propositions that could be applied to deploying heat pumps into homes, as defined in Table 1. ↑
- When the supplier is maintaining the home temperature at an agreed level. ↑
- HaaS rather than CaaS was used for analysis in this research given current low cooling demand in Scotland. ↑
- The financial case is often more positive in areas where there is no gas connection and consumers do not use gas boilers to heat their homes. For example, they may use oil or LPG boilers, or electric storage heaters. ↑
- The loan available can be defined as a finance only deal; the householder is responsible for securing the installation and maintenance themselves (although some conditions around the installation apply) and owns the appliance. However, the fact that this is interest-free makes it a financially attractive offer. ↑
- Germany, France, UK, Netherlands and Italy ↑
- Survey respondents expected their new appliance to be below £4,300, however, air source heat pumps cost around £10,000 (source: LCP Delta Heating Business Service) ↑
- Available to subscribers only. ↑
- More details on comparative costs for a finance proposition between a heat pump and a boiler are in Appendix 4. ↑
- Free and impartial advice funded by the Scottish Government and delivered locally by different organisations, such as Changeworks. ↑
- Assumptions for the calculations: (1) Upfront purchase of a heat pump estimated at £10,000 with annual service of £130. (2) Interest rate of 4% a year. ↑
- Assumptions from LCP Delta Heating Business service research as of September 2022: (1) upfront purchase of a heat pump estimated at £10,000 with annual service of £130. (2) interest rate of 4% a year. (3) monthly payments based on offer by Heatio promoted in the UK that never became commercially available. ↑
- Assumptions from LCP Delta Heating Business service research as of September 2022: (1) upfront purchase of a heat pump estimated at £10,000 with annual service of £130. (2) interest rate of 4% a year. (3) monthly payments based on offer by Heatio promoted in the UK that never became commercially available. ↑
- The Green Investment Group – The Green Investment Group is an independent organisation whose mission is to accelerate the transition to net zero. ↑
- Scottish National Investment Bank – a mission-oriented investment Bank in the UK with missions of which achieving a Just Transition to net zero carbon emissions by 2045. ↑
- A similar case study is the Assignment of Rights (AOR) which was a voluntary feature of the Renewable Heat Incentive (RHGI) scheme. Under AOR, providers installed and owned the heat pump, and received RHI payments when the customer ‘assigned these rights’ to them. Our analysis suggests AOR schemes provided customer protection by providing a zero value contract between the installer and the customer so that the installer still had obligations to the customer. ↑
- We used E.ON‘s finance options for comparing a heat pump and a boiler offering as they have public data on their website for both offerings. ↑
- Representative example based on borrowing £10,000 for a new Daikin 9kW air source heat pump, 150 litre cylinder, eight new radiators and an in-home survey, with the £5,000 Boiler Upgrade Scheme grant from the UK government taken off the total price. ↑
- Based on the average cost of a new boiler installation bought after a personalised consultation, costing £2,900. ↑
DOI: http://dx.doi.org/10.7488/era/3841
Executive summary
Green hydrogen, produced by electrolysis using renewable or low-carbon electricity, is expected to play a key role in the Scottish Government’s net zero emission targets.
The purpose of this study is to determine if Scotland can produce green hydrogen at scale and export it at a competitive cost to the EU market. We explore the costs of producing hydrogen in Scotland, Chile, Norway, Morocco and France and the northeast region of the USA and exporting to northwest Europe, focusing on:
- Production of hydrogen at scale: A large-scale electrolytic hydrogen production plant (1GW) powered by a low-carbon energy source.
- Transport via pipeline: The hydrogen produced is distributed to Rotterdam, where it enters the EU, via either a dedicated pipeline, which transports it from a single facility, or shared pipeline, transporting it from the facility and additional producers.
- Transport via shipping ammonia: The hydrogen produced is converted to ammonia, shipped to Rotterdam and converted back into hydrogen in the Netherlands.
- Transport via shipping compressed hydrogen: The hydrogen produced is compressed to a high pressure and shipped to Rotterdam.
Findings
Figure 1 shows the costs of production and transport per country. From the countries analysed, hydrogen production is cheapest in France given its access to low-cost nuclear electricity. The most expensive is Scotland due to the higher cost of power from offshore wind compared with the other low-carbon power technologies used. Other countries are expected to become more competitive as low-carbon electricity costs reduce and technology improves.
The most cost-effective transport option varies depending on distance, volume, and technology. For longer distances, converting hydrogen to ammonia and shipping via ammonia vessels is most effective. In contrast, for shorter distances, pipeline or compressed hydrogen transport options are more cost-efficient. Pipelines are most cost-efficient when repurposed and the capacity is fully utilised. Where existing infrastructure is not available and the pipeline is not fully utilised, compressed hydrogen shipping offers a cost-saving alternative for shorter distances.
Figure 1 – Levelised cost of hydrogen production and transport (£/kg)
It is more costly to produce hydrogen in Scotland as compared to all other case study countries. This is because the cost of offshore wind generated power in Scotland is higher than the other low carbon power technologies used. In other case study countries, such as France which can produce hydrogen at a significantly lower cost, there could be low carbon power constraints without additional investment in nuclear technology. In contrast, the Scottish Government has set ambition to invest in and scale up its onshore and offshore wind power to enable the growth of its green hydrogen sector.
Exporting hydrogen via ammonia is a feasible option for countries further afield such as the USA and Chile because as distance from the EU increases the costs associated with ammonia shipping movement do not increase significantly. As a result, this allows countries further away from the EU to participate in the hydrogen market. Given the additional costs associated to recovering hydrogen from ammonia, this export method becomes particularly cost effective where ammonia is the end product.
Transporting compressed hydrogen via vessels could be an export method for shorter distances and smaller scale production. However, as the technology is not yet operational, the cost effectiveness and feasibility of this method will need to be further evidenced.
Scotland’s proximity to Rotterdam gives it a competitive advantage because it enables export of hydrogen via pipeline, which is the export option with the lowest cost. In comparison, countries that are further away cannot export via pipeline or compressed shipping due to technical and cost feasibility issues.
To outcompete countries that are closer to Rotterdam, production costs in Scotland must decrease. However, even if the cost of production remains higher in Scotland than in other European countries, Scotland will likely still be a market player as France and Norway alone cannot meet EU hydrogen import targets.
Considering the evolving state of the hydrogen industry, cost estimates for production and transportation carry uncertainty, which affects assessments of market competitiveness.
Recommendations
Government support could close the cost gap and enable Scotland to become a major competitor in the EU market. We recommend:
- Continue to support the scale up of offshore wind and hydrogen production to access economies of scale and enable the generation of surplus low-carbon power for export. Scale up should target a reduction in low-carbon electricity costs as well as capital expenditure for electrolysers (needed for producing green hydrogen).
- Provide subsidies to the sector of between £60m and £500m per year, depending on the export method chosen, to enable Scottish hydrogen producers to outcompete producers who benefit from USA and EU subsidies.
- Valuate the opportunity to repurpose pipeline infrastructure and develop a co-ordinated export strategy with multiple hydrogen producers to maximise use of shared pipelines.
Glossary
| Term | Meaning |
| Green hydrogen | Green hydrogen is hydrogen produced via electrolysis of water using renewable electricity and is zero carbon. |
| Low carbon power | Low carbon power is electricity produced with substantially lower greenhouse gas emissions than conventional fossil fuel power generation. |
| Levelised cost of hydrogen (LCOH) | The levelised cost of hydrogen is a standardised methodology used by economists to compare the costs of producing hydrogen by different methods. It considers the total costs (both fixed and variable) of production per kilogram over the life of the plant. It is a common metric that is used as a proxy for the price of hydrogen in today’s terms (where future costs are discounted), which is required to “break-even” financially. Therefore, it is an important calculation to assess early-stage project feasibility and compare options. |
| Levelised cost of electricity (LCOE) | The levelised cost of electricity is an economic measure used to compare the lifetime cost of generating electricity across the various generation technologies. It is the discounted lifetime cost of building and operating a generation asset, expressed as a cost per unit of electricity generated. It considers all relevant costs facing the generator. |
| Levelised cost of transport (LCOT) | The levelised cost of transport is the discounted lifetime cost of building and operating a hydrogen transportation method (i.e. a pipeline), expressed as a cost per unit of hydrogen produced. It considers the total costs (both fixed and variable) of transporting hydrogen per kilogram over the lifetime of the asset. |
| Electrolyser utilisation | The amount of time, represented as a %, an electrolyser is producing hydrogen. Thus, annual electrolyser utilisation would be measured over a year. |
| Sleeved Power Purchase Agreement (PPA) | Sleeved PPAs are a private agreement between an energy developer and an off-taker, for the purchase of electricity generated by the energy project. |
| Baseload capacity | Generating equipment which are designed to operate for long periods of time or near full load. |
| Shared pipeline | Pipelines which transport hydrogen from multiple hydrogen producers. |
| Repurposed pipeline | Pipelines which previously transported natural gas or other fuels, which have been adapted to transport hydrogen. |
| Load factor | Defined as the average consumption, output or throughput over a period of time of a particular technology or piece of infrastructure, divided by its consumption, output, or throughput if it had operated at full (rated) capacity over that time period. |
Table 1 – Glossary of terms
Introduction
The purpose of this study is to estimate the cost of producing and exporting green hydrogen at scale to the EU market in Scotland compared to other major exporting countries. We have selected the identified exporting countries and the Port of Rotterdam as the key import location into the EU market to, in part, simplify the analysis. We note, as part of a liquid hydrogen market, there will be many exporting countries and import terminals in the EU. These insights will be used to inform recommendations on how the Scottish Government can best support its hydrogen export economy.
Green hydrogen in Scotland
Importance of green hydrogen to a net zero Scotland
In March 2020, Scotland committed to achieving net zero greenhouse gas emissions by 2045 and a 75% reduction by 2030 relative to 1990 levels (Scottish Government, 2019). Hydrogen will play a crucial role in achieving the Scottish Government’s ambition to achieve its Net Zero target by serving as a sustainable energy source for a range of applications. Additionally, hydrogen has the potential to work alongside renewable electricity in reducing carbon emissions in the transportation, power, and industry.
In its 2022 Hydrogen Action Plan, the Scottish Government confirmed its initial ambition to produce 5 gigawatts (GW) of low carbon hydrogen by 2030 and 25GW by 2045 (Scottish Government, 2020a). This would be enough to meet a sixth of Scotland’s energy needs. The most ambitious scenario of the Scottish Hydrogen Assessment estimates that by 2045 Scotland could become a leading exporter of hydrogen (Scottish Government, 2020b).
Scaling up hydrogen production in Scotland
To meet Scotland’s production targets, wind energy capacity will need to be built, hydrogen production and associated infrastructure scaled-up, and early market creation supported.
The Scottish Government’s Hydrogen Action plan aims to achieve a 5GW hydrogen target by 2030, with the majority of this capacity coming from renewable sources. The Scottish Government has stated plans to continue to support the development of onshore and offshore wind projects in Scotland to realise this ambition (Scottish Government, 2022a) as generally the renewable power required is 1-2 times the installed electrolyser capacity.
As of 2022, Scotland had c. 9GW of installed onshore wind capacity and c. 2.2GW of installed offshore wind capacity (Scottish Government, 2022a). The Scottish Government intends to enable the significant ramp up of both onshore and offshore wind energy. For example, in its 2022 Onshore Wind Policy Statement the Scottish Government set an ambition to deploy 20GW of onshore wind by 2030 (Scottish Government, 2022b) and in its Offshore Wind Policy Statement, it set a target to achieve 8–11GW of offshore wind in Scottish waters by 2030 (Scottish Government, 2020c). More recently, the Crown Estate Scotland announced the outcome of the 2022 ScotWind leasing round, with 17 successful applicants being offered option agreements totalling c. 25GW of capacity (Crown Estate Scotland, 2022). Realising this renewable capacity in Scotland will enable the uptake of green hydrogen production.
Increasing the size of green hydrogen production plants will also support the Scottish Government to meet its targets at pace and cost effectively. Larger scale hydrogen production plants can lead to increased economies of scale, particularly related to reduced balance of plant, power electronics, and hydrogen purification costs (IRENA, 2020a). So, Scottish Government’s hydrogen production targets are more likely to be achieved through the development of large-scale projects; however, this needs to be supported by a corresponding scale-up in demand.
Government has a role in enabling early market creation by supporting research, innovation, and commercialisation of hydrogen technologies across a wide range of end uses. It can also develop policy to encourage early use cases. Establishing the early market for hydrogen in Scotland will enable production at scale, which could reduce costs, thereby further unlocking new markets. As the next section explains, export of hydrogen and its derivatives could be an avenue for accessing large scale demand.
Hydrogen production for export
In the Hydrogen Action Plan, Scottish Government established its intention to become a leading producer and exporter of hydrogen and hydrogen derivatives for use in the UK and in Europe with the aim of hydrogen to be delivered to mainland Europe in the mid-2020s (Scottish Government, 2022a). In the longer term, the Scottish Hydrogen Assessment estimates that approximately 3.3Mt (126 TWh) of renewable hydrogen could be produced in Scotland, with 2.5Mt (94 TWh) exported to the UK and European markets annually (Scottish Government, 2020b). Meeting Scotland’s hydrogen production targets and establishing it as a key hydrogen exporter will not only contribute to reducing emissions but has the potential to safeguard industry and employment.
Green Hydrogen in Europe
Importance of green hydrogen to a net zero Europe
Developing a hydrogen sector in the European Union (EU) will enable it to achieve sustainability targets while allowing greater energy independence. The EU aims to achieve net zero greenhouse gas (GHG) emissions by 2050 and a minimum GHG emission reduction of 55% by 2030 (EU Commission, 2022a). As noted, hydrogen’s suitability as a sustainable energy source across a range of sectors means the EU expects hydrogen to play an important role in achieving these targets. Further, geopolitical events have triggered momentum around the development of the EU hydrogen sector and in May 2022, via its RePowerEU plan, the European Commission declared an ambition for renewable hydrogen uptake to enable it to move away from imported Russian fossil fuels (EU Commission, 2022b). Currently, the EU is on track to produce 1 Mt of renewable hydrogen by 2024 and has set the ambition to produce 10 Mt of renewable hydrogen and import 10 Mt by 2030 (EU Commission, 2022b).
Role of imports in meeting hydrogen demand
Centres of hydrogen demand in Europe may not be in the same location as regions with favourable characteristics to produce hydrogen. Given this, there is a need to develop hydrogen transport infrastructure within the continent as well as globally to enable hydrogen to be moved from where it is produced to where it is consumed. The European Hydrogen Backbone initiative seeks to develop pan-European hydrogen pipeline infrastructure to connect demand centres such as industrial clusters and ports to areas of hydrogen production (EU Hydrogen Backbone Initative, 2022). In the near term, it seeks to transport half of the 10 Mt hydrogen production target via five large-scale pipeline corridors including corridors in the North Sea, Nordic & Baltic, southwest Europe, southeastern Europe, and North Africa (EU Hydrogen Backbone Initative, 2022). To meet the European Commission’s import targets cost effectively, the EU may also seek to import hydrogen produced further afield. Despite the additional transport costs, some imports may remain cost competitive particularly in countries with an abundance of cheap low carbon electricity.
Key export countries
The global hydrogen market is nascent. While the announcement of new projects for the production of low-emission hydrogen continues to grow, only 5% of these have undertaken firm investment decisions (IEA, 2023a). However, the market is expected to grow as importing countries seek to meet climate objectives and diversify their energy supply. Many governments have already set targets for hydrogen exports or imports to be reached in the coming decades.
The global trade of hydrogen will require new transport infrastructure, coordinated standards and regulations, and demand creation across multiple sectors in import countries. Hydrogen is expected to be transported globally via a range of technologies including pipelines and shipping vessels. The location of the export countries and status of existing transport infrastructure will dictate the most cost-effective option. Importing countries globally will seek to establish common standards and regulations to allow governments to discern between hydrogen of varying emissions intensities. Importing countries will also need to drive early hydrogen adoption across different sectors including difficult to abate sectors such as industry and heavy transport.
We have chosen to compare Scotland’s competitiveness in the EU market against Chile, Norway, Morocco, France, and the USA. This is because these countries cover a range of geographies, production methods, have appropriate infrastructure and are in good proximity to major EU hydrogen import terminals. While Chile is further afield, its access to an abundance of natural resources, particularly wind, will enable it to produce green hydrogen at scale. The US’s IRA subsidy is expected to accelerate the deployment of green hydrogen in the country enabling the US to become a major producer and exporter of hydrogen.
The export distances to the Port of Rotterdam from each of the case study countries are illustrated in Figure 2.
Figure 2 – Export distances to the Port of Rotterdam for each case study country via shipping and pipeline
Green hydrogen production and export supply chain
This section reviews cost components that will be key input assumptions for the levelized cost model.
Production and export supply chain overview
The hydrogen supply chain can be divided into two main stages. Low-carbon electricity generation to produce the feedstock power for the production of hydrogen by electrolysis. Hydrogen can then be exported by pipeline or by ship. For export by ship, the hydrogen may be converted into more easily transportable forms. Methods currently being considered by the industry include ammonia, metal hydrides, liquified hydrogen, liquid organic hydrogen carriers such as toluene and high-pressure gaseous hydrogen.
We have considered three pathways for hydrogen export, as illustrated in Figure 3:
- Transport pathway 1 – Pipeline: Gaseous hydrogen can be transported via a pipeline cost effectively particularly at large scale. We have considered a range of pipeline export models including via new or repurposed infrastructure and via a dedicated pipeline sized to a GW scale electrolyser and a shared pipeline sized to accommodate the transport of hydrogen from multiple producers.
- Transport pathway 2 – Shipping ammonia: Hydrogen can also be converted to ammonia and transported via dedicated vessels. Ammonia’s higher energy density relative to hydrogen makes it particularly cost effective to transport via ship.
- Transport pathway 3 – Shipping compressed hydrogen: High pressure gaseous hydrogen can be transported via dedicated vessels. Similarly, compressing hydrogen increases its energy density making it more economical to ship. Shipping pure hydrogen rather than a hydrogen derivative reduces additional costs associated with reconversion.
We have selected pathways to provide a wide and representative range of vectors for hydrogen export. We have not considered the transport of hydrogen in liquid form or as liquid organic hydrogen carriers (LOHC). This is because liquid hydrogen as a transport option is increasingly become less cost-effective relative to alternative options. While LOHC offers a reasonable route to export, it has notable similarities to the ammonia and compressed hydrogen pathways. Figure 3 – Schematic of transport pathways considered in this report
Large scale hydrogen production
Low-carbon electricity
Low-carbon electricity is the key feedstock for hydrogen production. The cost of the electricity and the capacity factor of the low-carbon generator are typically the largest contributors to the cost of hydrogen production. We have considered:
- The cost of electricity represented as the levelized cost of energy (LCOE).
- Capacity factor which is defined as the electricity produced in a period divided by the electricity it could have produced if it had operated 100% output for the period.
- Hourly energy production profile per generator for a given year in each case study country in order to size the generation capacity.
We set out the cost of electricity, capacity factor, and assumed generator size per case study country. We have reviewed a wide range of data to inform these inputs and the data presented below represents an informed average. A summary of the current and future assumed costs of electricity per country is shown in Figure 4.
Figure 4 – Electricity price assumptions by country
Offshore wind in Scotland
Scotland has abundant access to offshore wind resources, much of it remote from end users. This is expected to be the dominant power source for large scale hydrogen production in Scotland. We assume the LCOE for Scotland to be £58/MWh currently and £36/MWh in 2045. Similarly, the current capacity factor of offshore wind in Scotland is 55% today and is projected to increase to 61% in future (BloombergNEF, 2023). The size of the low-carbon generator required today will be 1.4GW and reduce in future to 1.3GW to power the electrolyser enabling an electrolyser utilisation of 65% and 67% respectively. The future projections are driven by assumed reductions in capital expenditure (CAPEX) costs due to improved supply chains, reduction in operations and maintenance (O&M) costs due to increased competition of service providers and technological improvements and innovation driven by global learnings (IRENA, 2020b).
Nuclear energy in France
Producers in France may use nuclear energy to generate low-carbon hydrogen. France has one of the largest nuclear power programs in the world, with nuclear power plants accounting for 68% of the country’s annual electricity generation (U.S. Energy Information Administration, 2023). This technology can provide a baseload capacity, ensuring a consistent and reliable source of power that allows for efficient and potentially high utilisation of hydrogen producing equipment (electrolysers).
The LCOE for nuclear in France is £37/MWh which we do not project to reduce in future (IEA, 2020). Nuclear power plants in France have a capacity factor of 85% due to the aging nature of the reactor stock resulting in more outages (IEA, 2020). Given the high-capacity factor, the generating capacity will be the same size as the GW scale electrolyser, resulting in a plant utilisation of 85%.
Hydropower in Norway
Norway has an almost entirely renewables-based electricity system, with low-carbon resources accounting for 98% of generation in 2020, of which hydro power was the dominant source at 92% (IEA, 2022a). This means low-carbon hydrogen in Norway can be produced via grid electricity resulting in high electrolyser utilisation.
Grid electricity prices vary in Norway depending on the bidding zone a customer is in. Zones are regularly redefined by Statnett, the System Operator, and currently Norway is divided into five bidding zones (NO1-NO5) (NVE-RME, 2023). Prices are set daily by NordPool to reflect the current level of congestion in the bidding zone. Prices are lower in zones where there is a surplus of power and higher in zones where there is a power deficit. Bidding zone NO4, which is in the north of Norway, has the lowest electricity prices in the country, due to more abundant wind and hydropower output, with a recent price of between €42/MWh and €50/MWh (Nordpool, 2023). Prices in bidding zones surrounding Oslo, the southern coastal hub Kristiansand and Bergen on the west coast have higher electricity prices of between €80/MWh and €86/MWh (Nordpool, 2023). In 2022 grid electricity prices in all zones increased significantly, driven by low reservoir filling levels in southern Norway and power export cables from the UK to Germany. We have assumed an LCOE of £52/MWh which represents an average of the recent wholesale electricity prices in Norway, and project this may decline in future as the external factors which have caused a recent spike are resolved.
Using electricity from the grid allows producers to run at a constant, maximum capacity factor, equalling their availability once annual maintenance has been considered. Given this, we assume the capacity factor to be 98% resulting in a high electrolyser utilisation rate.
Hydrogen producers in Norway will also incur the cost to connect to the electricity grid. This upfront cost will vary depending on the size and location of the connection. We assume a connection cost of £25,000/MW (Arup benchmark, n.d.).
Onshore wind in Chile
The geographical characteristics of Chile, particularly in the southern Magallanes region, enable access to significant amounts of onshore wind power. Producers will use this technology as their key electricity source.
We assume the LCOE for wind in Chile is £35/MWh which will reduce in future to £24/MWh (BloombergNEF, 2019a). We project reductions in cost driven by reductions in turbine prices and balance of plant costs, greater wind farm operational experience and improved preventative maintenance programmes (IRENA, 2020b). Based on electricity production data in the Magallanes region, the capacity factor of onshore wind in the area is particularly high at 59% resulting in an electrolyser utilisation rate of c.67%. Given the existing high-capacity factor of onshore wind technology in Chile, we project this will not increase significantly in the future.
Solar power and onshore wind in Morocco
Combining multiple low-carbon energy resources, such as solar and onshore wind power, can help reduce intermittent electricity production from a single low-carbon technology. Morocco has good natural resources to enable access to significant amounts of both solar and onshore wind.
We assume the current LCOE of solar in Morocco to be £32/MWh which will decline to £13/MWh in future. The current capacity factor of the technology is 28.8% which will increase to 30.6% (IEA, 2021). For onshore wind in Morocco, we assume the current LCOE is £49/MWh which will reduce to £41/MWh in future. Lastly, the capacity factor of onshore wind technology today is 37% and will improve to 45.9% in future (IEA, 2021). We project price reductions and improved capacity factors for both technologies due to global learnings. Significant declines in the LCOE of solar is driven by declines in module prices and plant costs and scaled up manufacturing capability (IEA, 2022b). The complimentary nature of the combination of solar and wind production enables an electrolyser utilisation rate of 65% with solar generating capacity sized at 1.2GW and wind sized at 1.3GW.
Onshore wind in the USA
In the US, the North East region has been selected as the basis for analysis. Although there are a number of projects and regional hubs exploring the potential to export low carbon hydrogen throughout the US, the North East Hub presents significant opportunities for exports to the EU. In November 2022, New York State Energy Research and Development Authority (NYSERDA) submitted a concept paper on behalf of seven states to be considered and compete for funding to develop a hydrogen hub in the area (NYSERDA, 2023). Given the Northeast’s relative proximity to the EU and this hydrogen hub initiative, we assume production takes place in this region. The USA has good wind resources enabling it to have access to significant amounts of onshore wind power. However, given the land constraints in the region, we assume hydrogen producers procure onshore wind capacity via sleeved purchase power agreements (PPAs). PPAs are contractual agreements between energy suppliers and consumers which enable consumers to procure electricity from a renewable asset without being directly connected to it. Sleeved PPAs are contractual arrangements for large consumers of electricity, such as hydrogen developers. The most prevalent PPA structure is a ‘pay-as-produced’ structure, whereby the offtake purchases all or a % of the renewable energy production and there is no volume or delivery obligation (U.S. Department of Energy, n.d.). We assume hydrogen producers procuring onshore wind PPAs will be eligible for the full IRA hydrogen production subsidy.
Wind purchase power agreement prices in the east coast are c. £24/MWh (U.S. Department of Energy, 2022) and while this price has been increasing slightly over the last few years due to supply chain pressures, it is projected to decline in future to £19.40/MWh due to increasing economies of scale, more competitive supply chains and further technological improvements (IRENA, 2019). The current capacity factor of onshore wind is 35% (U.S. Department of Energy, 2022) and will increase to 43.4% driven by improved wind turbine technologies, deployment of higher hub heights and longer blades with larger swept areas (IRENA, 2019). This enables an assumed electrolyser utilisation of 66.3% with a sleeved PPA agreement with a generator size of 1.3MW.
Electrolysis plant
Low-carbon hydrogen production requires electrolysis to convert low-carbon electricity and water into hydrogen and oxygen. There are currently several electrolyser technologies available. For this study, we have assumed the use of a 1GW alkaline electrolysis (AE) plant given it is currently and comparatively a more mature technology and lower cost. It is also currently the only technology that has been applied in commercial applications at sizes of more than 10MW. In Appendix 10.2 we considered the impact of using a proton exchange membrane (PEM) electrolyser on the levelized cost of production as a sensitivity.
The key considerations for this stage of the supply chain include the capital cost of the electrolysis plant, the indirect capital costs, and key operating parameters including electrolyser utilisation and efficiency of the system.
Capital costs
There is a wide range of capital costs for alkaline electrolysers quoted in literature, driven in part by the wide range of suppliers, locations of manufacture and the scope for the estimation of costs can be unspecified or inconsistent. For the purposes of this study, the overall capital cost used (see Section 8.1) is inclusive of the stack itself (the key component that separates hydrogen from oxygen) and indirect capital costs associated to power electronics, hydrogen purification and balance of plant. The range of alkaline electrolyser capital costs can be between c. £430/kW and £1,110/kW. We assume a CAPEX of £800/kW in 2023 (Oxford Institute for Energy Studies, 2022). This cost reflects the economies of scale of a 1GW plant, assuming manufacture in Europe.
Costs are expected to decline in future with maturing supply chains, increased economies of scale and technology improvements including increased stack lifetime, increased module and stack size, minimization of the use of scarce materials, and increased scale of production of electrolysers. The projected future costs of alkaline electrolysers could be between £150/kW and £600/kW (IEA, 2022c). We assume a conservative cost of £400/kW in 2045.
As noted, increased module and stack sizes can reduce the capital costs as large-scale hydrogen production benefits from economies of scale. The stack cannot be increased significantly due to challenges related to the manufacturing and possible mechanical instability issues of large-scale components (IRENA, 2020a). This means that the costs associated with the stack itself grows linearly as hydrogen production capacity increases. There are, however, opportunities for economies of scale particularly associated to reductions in shared costs such as balance of plant and development costs. Reductions in these shared costs, especially to the balance of plant could in turn have a large effect on cost savings as these costs contribute significantly to the overall CAPEX.
The largest economies of scale are around a 1GW module size after which the marginal cost decrease for increasing the capacity is much lower compared to smaller module sizes (IRENA, 2020a). This is because, it is anticipated that hydrogen production will be developed in multiple phases creating parallel production trains in a similar way to LNG and therefore accessing limited economies of scale. Figure 5 shows the LCOH reductions from scaling up from a 1MW facility to a 5GW facility in Scotland. To note, currently, the largest electrolyser installed is a 150MW facility in the Chinese region of Ningxia (Recharge, 2022), so reductions in LCOH due to economies of scale for system beyond this size are based on projections.
Figure 5 – Effect of economies of scale in electrolyser rating on LCOH
Operating parameters
In addition to capital costs, the operational parameters of the alkaline system can affect the levelized cost of production. The key operational parameters to consider include the efficiency of the asset, the stack life and electrolyser utilisation. These are presumed to improve in future due to technology improvements (Oxford Institute for Energy Studies, 2022).
Hydrogen transport via pipelines
Hydrogen can be transported in gaseous form via pipeline. Examples of hydrogen transport by pipeline are currently limited, however there are planned projects in multiple countries, including Scotland. We have assumed hydrogen will be transported via offshore subsea pipelines for Scotland, Norway and partly for Morocco. Similarly, most likely onshore pipelines will be used to transport hydrogen from France. Both onshore and offshore pipelines will be used for Morocco as subsea pipelines are required to transport hydrogen from Morocco to Spain. Pipelines from Chile and the USA have been excluded from the analysis due to the distances involved.
A compressor station is required to pressurise the gas, allowing the hydrogen to be transported long distances. Given how capital-intensive building or repurposing a pipeline is, it is typically only a cost-effective option for large scale hydrogen transport. The following sections provide more detail on the costs underpinning the cost of hydrogen transport by pipelines.
Pipeline inlet compression
To ensure hydrogen can be delivered to Rotterdam at an appropriate pressure, it must first be compressed at a large pipeline inlet compressor station.
The major driver of cost for the compressor station are the capital costs. The unit cost per megawatt for a large-scale station can range from £1.9m/MWe to £5.8m/Mwe (EU Hydrogen Backbone Initative, 2022). We assume the price of pipeline inlet compressor station will not change in future as the technology is already commercially mature resulting in limited opportunity for significant cost reductions.
The size of the pipeline inlet compressor station, and therefore the total CAPEX, will vary per case study country as the amount of hydrogen produced and distance it needs to travel will dictate the required size.
Pipelines
The components required for a hydrogen pipeline are essentially the same as for natural gas pipelines which are operated today. The cost estimates of hydrogen pipelines, as set out in European Hydrogen Backbone reports, are determined by gas transmission system operators experience in investing in and operating existing natural gas networks and initial hydrogen infrastructure pilot projects. The range of pipeline cost assumptions are based on assumed pipeline diameter, whether the pipeline is new or repurposed, whether the pipeline is offshore or onshore, and the pipeline utilisation. New, small diameter onshore pipelines (i.e. 20 inch) are cheapest at £1.2m/km to £1.6m/km whereas large diameter offshore pipelines can be c.£5m/km, depending on size (EU Hydrogen Backbone Initative, 2022). Finally, the cost of transporting hydrogen via a shared pipeline can be reduced on a levelised basis as pipeline utilisation is maximised. Shared pipelines are those with larger diameters that maximise utilisation by transporting hydrogen from multiple hydrogen producers. The full list of these cost assumptions can be found in Appendix 10.1.
Hydrogen transport by ship as ammonia
Figure 6 – Schematic of ammonia transport pathway
The low energy density of hydrogen can make it challenging to transport economically by ship. To overcome this, gaseous hydrogen may be converted to a more energy dense medium such as ammonia.
Today, ammonia is produced and transported globally in large quantities, especially for use as fertiliser. This means there is already a developed global supply chain for ammonia including production plants, storage tanks and transport vessels (although current production methods are carbon-intensive).
Ammonia production
We assume that ammonia will be produced using the Haber-Bosch process, which is the most common method for ammonia production at scale. The process requires: (1) hydrogen with buffer storage to enable a steady supply, (2) an air separator unit (ASU) to produce nitrogen and (3) ammonia synthesis plant where nitrogen reacts with hydrogen to form ammonia in the presence of a catalyst.
The key cost drivers of this process include the CAPEX of the buffer storage, ASU and ammonia synthesis plant.
Pressurised buffer storage CAPEX can vary depending on the storage pressure because lower pressures require larger storage tankers. CAPEX costs can range from £800-£1,300/kg of hydrogen (CSIRO, n.d.). For the purposes of this project, we assume more pressured buffer storage is required in case study countries where electrolysers are powered with intermittent renewables. We project less buffer storage in France and Norway where electrolyser utilisation rates are comparatively higher.
We assume the CAPEX cost of the ASU is c. £50,000/tons per day (tpd) and the cost of the ammonia synthesis plant is c. £285,000/tpd (Arup benchmark, n.d.). We assume the cost of the ASU remains constant in future due to the mature nature of the technology. However, we assume the ammonia synthesis plant CAPEX decreases in the future to £190,000/tpd (Arup benchmark, n.d.)as the existing global network of ammonia production grows to accommodate the future global hydrogen market.
Ammonia transport
Ammonia will be transported from a port at every case study country via a dedicated ammonia vessel. According to IEA, there are currently over 120 ports worldwide which can handle ammonia on a large scale (IEA, 2022c). Nonetheless it is projected that expanding the capacity of port infrastructure will be required to further enable the transport of large amounts of ammonia. Given this, we assume that the ports in all case study countries will require upgrades which involve CAPEX costs associated with new jetties, quay wall development and loading facilities.
Ammonia can be transported via different ship types, depending on how it is stored and today ammonia is typically transported in gas carriers designed for liquefied petroleum (LP). According to IEA, there are currently 200 gas tankers in operation across the world capable of transporting ammonia. They range in size with a carrying capacity of between 30,000 m3 and 80,000 m3, with the most recent orders having capacities of up to 87,000 m3 (IEA, 2023b).
The cost to ship ammonia will be dictated by the CAPEX of the vessel, OPEX, storage and cost of movement. According to BNEF, the total levelized cost of a 10,000 km trip of an ammonia vessel size with a carrying capacity of 23,000 tonnes is £1.37/kg H2 (BloombergNEF, 2019b) .
Transporting ammonia in liquid form can result in reduction in volume as the temperature difference between the ammonia storage tanker and the ambient air temperature results in boil-off gas. The total daily energetic boil-off gas for ammonia is c.0.1%, which is less than other liquified energy carriers such as LNG, given ammonia has a comparatively higher boiling point (Al-Breiki & Bicer, 2020). This may have a limited effect on case study countries transporting ammonia short distances to Rotterdam, such as France, however the effect is more significant in countries further away, such as for Chile.
Ammonia cracking
Ammonia will be converted back to hydrogen at Rotterdam. We note, in some instances ammonia could be the end use product for, for example, fertiliser production. To decompose ammonia to hydrogen and nitrogen, an ammonia cracker is used. Crackers reverse the ammonia synthesis reaction via an endothermic process resulting in a cracked gas of hydrogen and nitrogen after which purified hydrogen can be obtained. Efficient processes for the recovery of hydrogen from ammonia require further development to be applied in commercial applications.
The key cost drivers of ammonia crackers include the CAPEX of the system and the energy required to recover the hydrogen, represented as a reconversion loss. According to a report by UK Government, the CAPEX of a cracker is £2.37 million/ tpd H2 and we assume a recovery of 75% (UK Government, 2020). This study assumes that future technology improvements will increase efficiency and drive down energy consumption for ammonia cracking by 2045 (UK Government, 2020) .
Hydrogen transport by ship as compressed gas
Compressing hydrogen before loading it onto tanker ships analogous to those transporting compressed natural gas has potential to be a cost-effective mode of transport for lower volumes over shorter distances. The case for export via compressed hydrogen vessels from Chile and the USA have been excluded from the analysis due to infeasibility.
Currently, there is no global supply chain for shipping compressed hydrogen. However, smaller scale vessels are currently being developed and the first vessels could be operational as early as 2026 with larger scale vessels operational by 2030 (Provaris, 2022) . Although compressed hydrogen shipping is still nascent, it has been included as a pathway option due to its economic potential over shorter export distances, e.g. Scotland to Europe.
Compressed hydrogen will be transported via specialised vessels. Provaris, an Australian-based technology provider is planning to have vessels with carrying capacity of 26000 m3 by 2026 and 120,000 m3 by 2030 (Provaris, 2022). The smaller scale vessel will have a shipping range of up to 2,000 nautical miles and the larger vessel will have a range of up to 3,000 nautical miles making this pathway infeasible for countries further afield such as Chile and the USA.
The cost to ship compressed hydrogen will be dictated by the compression process, CAPEX of the vessel, OPEX, barge storage, port CAPEX and cost of movement. Provaris estimates an indicative levelised cost of transport (LCOT) of £3.75/kg for a single smaller vessel and £0.80/kg for the larger vessel (Provaris, 2022). Given the technology is still being developed there is significant uncertainty on costs.
Hydrogen production and transport costs
To determine if Scotland can produce green hydrogen at scale and export it cost competitively to the EU market, we have estimated the levelised cost of hydrogen production (LCOH) and transport to Rotterdam per case study country. We present this analysis for the hydrogen production pathway and three hydrogen transportation pathways:
- Production pathway
- Pathway 1 – Pipeline
- Pathway 2 – Shipping (Ammonia)
- Pathway 3 – Shipping (Compressed hydrogen)
For pathway 1, the LCOT has been evaluated based on the use of both dedicated and shared pipelines and new or repurposed pipelines. We have not presented the LCOT in 2045 for this pathway, as we assume no opportunity for cost reductions in future. For pathways 2 and 3, the LCOT has been evaluated for the years 2023 and 2045 to identify opportunities for cost reductions in future. We have compared the outputs of each pathway for each case study country to determine the most effective model for Scotland to produce and export hydrogen competitively in the EU market.
The key input assumptions for the levelized cost model are based on the cost review in section 7 of this report. All input assumptions and model methodology can be found the Appendix 10.1.
Large scale hydrogen production
Scotland analysis
Figure 7 shows the calculated LCOH in 2023 and 2045 for Scotland. The cost breakdown for the various production elements is also shown.
Figure 7 – Calculated LCOH for production of hydrogen in Scotland
The current cost to produce hydrogen in Scotland is estimated to be £6.58/kg H2. The main drivers of this are the electricity input costs and the electrolyser capital costs, which account for 66% and 17% of the overall LCOH, respectively.
Figure 8 shows that the future cost to produce hydrogen in Scotland is expected to decline by 2045 to £3.43/kg H2. This is driven by reduced electricity costs due to supply chain competition and scale up and reduced O&M, improved capacity factor of offshore wind generators driven by technological improvements and innovation and reduced electrolyser CAPEX due to maturing supply chains and technology improvements.

Figure 8 – Future production cost drivers for H2 2023 to 2045
Cost competitiveness
To understand Scotland’s potential as a large-scale exporter of hydrogen, the cost to produce in Scotland has been compared against the other case study countries in Figure 9.
Figure 9 – Calculated LCOH cost comparison
Today and in future, it will be cheaper to produce hydrogen in all case study countries compared to Scotland. This is due to the relatively high cost of offshore wind generated power compared to other technologies. In Norway and France, hydrogen producers benefit from low-cost electricity and high electrolyser utilisation, thanks to the high-capacity factor of grid electricity and nuclear power plants. There may be electricity constraints in France, as nuclear power is used to supply consumers rather than hydrogen producers. This means there could be limited ‘spare’ nuclear capacity available to supply producers. Building new nuclear plants are expensive and time consuming to construct. In Morocco, the complimentary coupling of onshore wind and solar generation also improves the electrolyser utilisation, but the additional cost of the second electricity sources increases its LCOH. Onshore wind costs in Chile and the USA are significantly lower than current offshore wind costs in Scotland. Electricity prices in the USA are particularly low as the Renewable Energy Production Tax Credit (PTC), a federal incentive that provides financial support for the development of renewable energy facilities, which has enabled and accelerated the onshore wind market. The hydrogen fuel tax credits via the IRA subsidy further reduces the cost of production in the USA.
Looking forward, Norway and France are expected to have limited overall cost reduction potential. Comparatively, we see a more significant cost reduction in Scotland, Chile, Morocco and the USA in future. LCOE and capacity factors for onshore/offshore wind and solar are projected to improve driven by reductions in CAPEX due to improved supply chains, reduction in O&M costs and innovation.
Overall, hydrogen production in Scotland is relatively more expensive compared to the other case study countries in the near and long term. The USA is estimated to be the most cost-effective large scale hydrogen producer with and without the IRA subsidy driven by the very low cost of onshore wind electricity. France and Norway are estimated to be relatively cost-effective large-scale hydrogen producers driven by cost-savings from the non-intermittent nature of their electricity source. However, by 2045, we expect Scotland’s hydrogen production cost competitiveness to significantly improve compared to the other case study countries due to efficiency advances and the cost reduction of offshore wind electricity.
Pathway 1: Pipelines
Pipeline transport pathway overview

Figure 10 – Schematic of pipeline transport pathway
The pipeline transport pathway considers an export model where, following production, the hydrogen is compressed and then transported to Rotterdam via a pipeline.
Scotland analysis
The calculated LCOT for transport via a pipeline from Scotland to Rotterdam is shown in Figure 11.
Figure 11 – Calculated LCOT for pipeline (pathway 1)
The cost to transport hydrogen from Scotland to Rotterdam is estimated to be £0.12– £3.16/kg H2 depending on the pipeline model used. Transporting hydrogen via a new offshore pipeline is more expensive than via a repurposed pipeline because the work associated with repurposing is less extensive than building new infrastructure. Furthermore, transporting hydrogen via a shared large-scale pipeline is less expensive than via a dedicated smaller pipeline, as producers benefit from economies of scale. Figure 12 further illustrates that as the amount of hydrogen transported increases, LCOT declines significantly.
Figure 12 – Pipeline economies of scale
Cost competitiveness
To understand Scotland’s potential as a large-scale exporter of hydrogen, the cost to produce and transport via dedicated and shared pipelines from Scotland to Rotterdam has been compared against other case study countries in Figure 13 andFigure 14.
Figure 13 – Pathway 1 calculated LCOH and LCOT cost comparison for a dedicated pipeline
Variation in levelised transport costs across the case study countries are driven by distance and cost of pipeline material. Transporting hydrogen from France is cheapest given its proximity to Rotterdam and ability to use onshore pipelines which are less expensive than offshore pipelines. The cost to transport from Morocco is more expensive than the other case study countries given its further distance from Rotterdam and requirement for some offshore pipelines to transport to Spain. Norway is able to transport hydrogen more cost effectively than Scotland, despite the further distance from Rotterdam and same assumption that offshore pipelines are used. This is driven by the ability to transport a larger volume of hydrogen (based on a 1GW electrolyser) from Norway as producers benefit from higher electrolyser utilisation.
Figure 14 – Pathway 1 calculated LCOH and LCOT cost comparison for a shared pipeline
Our analysis shows that Scotland can transport hydrogen via pipeline cost competitively compared to the other case study countries. We have excluded Chile and the USA from this comparison as the distance to Rotterdam makes this transport option unfeasible. It is most economical for producers to transport hydrogen via large scale shared pipelines rather than smaller scale dedicated pipelines due to economies of scale. This indicates that a consolidated export strategy for Scotland to Europe could ensure that Scotland is able to remain cost competitive with competing countries. While France can export at a lower cost due to the use of onshore pipeline, routing and right of way could be challenging if dedicated pipeline corridors are not currently available.
Pathway 2: Ammonia Shipping
Ammonia shipping overview

Figure 15 – Schematic of ammonia shipping transport pathway
The ammonia shipping pathway reflects the supply chain for hydrogen exports in the form of ammonia. Pathway 2 considers the implications of converting hydrogen into ammonia, transporting it via ammonia carrier vessels and recovering hydrogen at Rotterdam.
Scotland analysis
Figure 16 shows the LCOT ranges for ammonia shipping in 2023 and 2045.
igure 16 – Calculated LCOH for ammonia shipping (pathway 2)
The costs to transport hydrogen via ammonia shipping from Scotland to Rotterdam is estimated to be £2.56/kg. The main drivers of the LCOT are the CAPEX-related costs of ammonia production, namely, the CAPEX costs of the ammonia plant, and the ammonia cracker which account for 38% and 34%, respectively of total LCOT in 2023.
The future cost to transport hydrogen via ammonia shipping from Scotland to Rotterdam is expected to decrease to £2.34/kg by 2045. This is due to assumed reduction in ammonia production capital costs and reduced reconversion losses from the ammonia cracker. This is driven by maturing supply chains and technological innovation as ammonia is increasingly used as a hydrogen derivative for transport.
As noted, a key cost driver to the LCOT for this pathway is the ammonia cracker CAPEX and OPEX. Excluding the ammonia cracker from the supply chain reduces the LCOT by c.41% (Figure 17). This suggests ammonia shipping becomes a more attractive transportation option where ammonia is being used as the end product, as opposed to re-converting to hydrogen.
Figure 17 – Pathway 2 pre-cracking cost comparison
Cost competitiveness
Figure 18 shows the LCOT of the ammonia shipping pathway for the case study countries, in 2023 and 2045.
Figure 18 – Pathway 2 LCOH production and transport cost comparison
The levelised cost to ship ammonia to Rotterdam today and in future are relatively aligned across the case study countries, with the cost to transport being slightly higher for Chile, Morocco and the USA. This is due to the longer distance the ammonia has to travel resulting in a higher cost of movement and increased effects of boil-off gas. As shown in Figure 18, hydrogen production costs contribute significantly to the total cost of export, both today and in future. This is why hydrogen producers in the USA, particularly those which benefit from the IRA subsidy, can export to the EU market via this pathway most competitively. Given this, Scotland should seek to reduce production costs to be able to transport via ammonia vessels competitively to the EU market.
Overall, the analysis shows that Scotland can transport hydrogen via ammonia shipping competitively compared to the other case study countries. Given how costly recovering hydrogen from ammonia is, this export model is most cost effective where ammonia is the end product.
Pathway 3: Shipping as compressed hydrogen
Shipping compressed hydrogen overview

Figure 19 – Schematic of compressed hydrogen shipping transport pathway
The compressed hydrogen shipping pathway reflects the supply chain for hydrogen exports in its compressed form. Pathway 3 considers the implications of compressing the produced hydrogen and transporting it via compressed hydrogen carrier vessels.
Scotland analysis
Figure 20 shows LCOH estimates for shipping compressed hydrogen from Scotland to Rotterdam.
Figure 20 – Calculated LCOH for compressed hydrogen shipping (pathway 3)
The costs to transport hydrogen via compressed shipping from Scotland to Rotterdam is estimated to be £1.88/kg and is expected to decrease to £0.32/kg by 2045. As compressed hydrogen shipping is in early-stage development, vessel sizes are relatively small at 26000m3. As a result, transportation costs are higher due to a larger number of trips required to transport GW scale hydrogen production. In future, as vessel sizes increase, transportation costs are projected to decline hence the reduction in LCOT by 2045.
Due to the constraint on shipping size, the feasibility of transporting via compressed hydrogen at the 1GW scale may need to be reviewed further. We also note, given the infancy of the technology, the costs are very uncertain.
Cost competitiveness
To understand Scotland’s potential as a large-scale exporter of hydrogen via compressed hydrogen vessels, the cost to transport from Scotland to Rotterdam has been compared against the other case study countries in Figure 21.
The analysis shows that countries in proximity to Rotterdam have an export advantage due to reduced transportation costs. Scotland, Norway, and France have significantly lower unit costs than Morocco, given the shorter shipping distances.
1.88
Figure 21 – Pathway 3 LCOH production and transport cost comparison
Countries with significant transport distances (Chile and Morocco) have disadvantages given that the small shipment loads of the compressed hydrogen vessels, which means that a high number of ships are required, subsequently increasing the costs. The high number of ships could also pose logistical problems that would need to be considered. Currently, it is cheaper for France to transport hydrogen via either dedicated or shared pipelines, however in future, it could be more cost efficient for France to export hydrogen via compressed vessels compared to pipeline transport.
Overall, the analysis shows that Scotland can transport hydrogen via compressed hydrogen shipping competitively compared to the other case study countries. Given the early stage of the technology, the feasibility of transporting GW-scale hydrogen production via compressed vessel must be explored further. Additionally, as the technology is not yet operational, projected costs are still uncertain.
Pathway comparison
Figure 22 presents the outputs of the Scotland base case levelized cost for each of the pathways that have been reviewed.
Figure 22 – Calculated LCOH and LCOT Scotland pathway comparison
The levelized cost analysis has shown that future cost reductions are expected across the pathways. It also illustrates that Scotland’s largest blocker to cost effective hydrogen exports is the current cost of production. Support from the Scottish and UK Governments in the form of subsidies and grants could help improve this.
Figure 23 – Most cost-effective transport pathway in 2023
Exporting large scale hydrogen production via shared pipelines is a cost-effective option due to economies of scale. For longer distance, converting hydrogen to ammonia and shipping via dedicated vessels is economical. Given how costly recovering hydrogen from ammonia is, this export model is most cost effective where ammonia is the end product. Shipping compressed hydrogen could be most competitive, particularly for smaller scale production and via shorter distances, however the technology still needs to be developed and proved Figure 23).
Figure 24 – Calculated LCOH pathway comparison by production scale
The cost of exporting via a pipeline is the only pathway that becomes more cost effective as production scales up (see Figure 24). Significant gains are expected up to 2GW after which cost reductions diminish. Both shipping pathways have a positive relationship between cost and scale. Large scale efficiencies tend to be limited for shipping as increased production requires a higher number of ships or frequent trips which affects costs.
The cost to ship ammonia is not influenced significantly by distance to the European market which makes this a cost-effective option for exporting countries further afield, such as Chile (see Figure 25). In contrast, there is a direct relationship between the cost to ship compressed hydrogen and distance making this export model most economical for shorter distances.
Figure 25 – Calculated LCOH ammonia and compressed hydrogen comparison by distance
Conclusions and recommendations
Figure 26 – Levelised cost of hydrogen production and transport (£/kg)
It is more costly to produce hydrogen in Scotland than in all other case study countries. This is because the cost of offshore wind generated power in Scotland is higher than the other low-carbon power technologies used. In other case study countries, such as France, which can produce hydrogen at a significantly lower cost, there could be low-carbon power constraints without additional investment in nuclear technology. In contrast, the Scottish Government has set ambition to invest in and scale up its onshore and offshore wind power to enable the growth of its green hydrogen sector.
Transporting hydrogen via pipeline is the most cost-effective option for shorter distances, large scale production and where the pipeline used is repurposed. Scotland should, therefore, evaluate the opportunity to repurpose existing pipeline infrastructure to improve its competitiveness in the EU hydrogen market. It should also develop a co-ordinated export strategy, bringing together multiple hydrogen producers to maximise utilisation of shared pipelines.
Exporting hydrogen via ammonia is a feasible option for countries further afield such as the USA and Chile. Additional costs associated with ammonia production and cracking back to hydrogen are significant. However, as distance from the EU increases, the costs associated with ammonia shipping movement do not increase significantly. As a result, this allows countries further away from the EU to participate in the hydrogen market. Given the additional costs associated to recovering hydrogen from ammonia, this export method becomes particularly cost effective where ammonia is the end product.
Transporting compressed hydrogen via vessels could be a promising export method for shorter distances and smaller scale production, driven by viable shipping range and size of the vessels. However, as the technology is not yet operational, the cost effectiveness and feasibility of this transport method will need to be further evidenced.
Scotland’s proximity to Rotterdam gives it a competitive advantage compared to countries further afield. This is because its proximity to the EU market enables it to export hydrogen via multiple transport pathways. In comparison, countries that are further away cannot export via pipeline or compressed shipping due to technical and cost feasibility issues. Secondly, Scotland’s proximity to the EU also allows it to export hydrogen via pipeline, which, today is the lowest cost export option.
To outcompete countries such as France and Norway, Scotland must reduce its production costs. However, even if the cost of production remains higher for Scotland relative to other European countries, Scotland will likely still be a market player, as France and Norway alone cannot meet EU hydrogen import targets.
Considering the evolving state of the hydrogen industry, it’s important to note that cost estimates for different aspects of production and transportation carry uncertainty. This variation introduces some level of uncertainty when assessing the competitiveness of hydrogen production and transportation in the EU market.
Government support could close the cost gap and enable Scotland to become a major competitor in the EU market. To do this, it should continue to support the scale up of offshore wind and hydrogen production to access economies of scale and enable the generation of surplus low carbon power for export. Scale up should target a reduction in low carbon electricity costs as well as electrolyser CAPEX. Secondly, it could provide subsidies to the sector. To enable Scotland to be competitive in the EU market today, a subsidy range of £60m to £500m per year (depending on the export method chosen) could be required. There is a particular need for UK government and Scottish government support for Scottish hydrogen producers to be able to out compete producers who benefit from USA IRA subsidy support and EU based support.
Appendices
Levelised cost model methodology and assumptions
The levelised cost model considers the cost of hydrogen production and transport in years 2023 and 2045. It considers the total costs (capital, operating, replacement CAPEX) of production and transport over the project life and divides it by the total volume of hydrogen produced and transported. Both the costs and volume of hydrogen produced and transported is discounted at a rate of 10% using the following formula:
𝐿𝐶𝑂𝐻 (£ 𝑘𝑔) = 𝑆𝑢𝑚 𝑜𝑓 𝑐𝑜𝑠𝑡𝑠 𝑜𝑣𝑒𝑟 𝑙𝑖𝑓𝑒𝑡𝑖𝑚𝑒 (£) × 𝑑𝑖𝑠𝑐𝑜𝑢𝑛𝑡 𝑟𝑎𝑡𝑒 (%) / 𝑆𝑢𝑚 𝑜𝑓 ℎ𝑦𝑑𝑟𝑜𝑔𝑒𝑛 𝑝𝑟𝑜𝑑𝑢𝑐𝑒𝑑 and transported 𝑜𝑣𝑒𝑟 𝑙𝑖𝑓𝑒𝑡𝑖𝑚𝑒 (𝑘𝑔) × 𝑑𝑖𝑠𝑜𝑢𝑛𝑡 𝑟𝑎𝑡𝑒 (%)
The sum of costs over the lifetime are based on the constant input assumptions outlined in Table 2. These input assumptions remain constant across all pathways. In addition to the constant input assumptions, there are input assumptions that vary between pathways and countries, such as the size of a pipeline inlet compressor, the supply chain requirements, etc. These supplement the constant input assumptions in order to determine the volume of costs for each part of the supply chain. The total discounted costs of production are then summed over the project life and divided by the total discounted volume of hydrogen produced.
The input assumptions are based on the literature review for each part of the supply chain (Section 7 of the report). We have used the trends that have been developed to identify the likely cost range for 2045. Table 2 highlights which sources have been used for which part of the supply chain per pathway.
The building blocks of the model are broken down into electricity generation, electrolyser (hydrogen production), compression, ammonia production (if applicable), transport, reconversion/ recompression (if applicable). For each part of the supply chain the inputs are used to determine an annual cost split between these categories:
- Capital costs of infrastructure
- Replacement costs of infrastructure
- Annual variable costs
| Annual fixed costs | Unit | Current | Future | Sources | Confidence rating |
|---|---|---|---|---|---|
| Scotland – Offshore wind | |||||
| Offshore wind plant size | GW | 1.40 | 1.30 | Arup energy balancing tool based on Global Atlas Data | 3 |
| Capacity factor | % | 55% | 61% | (BloombergNEF, 2023) | 3 |
| LCOE | £/MWh | 58 | 36 | (BloombergNEF, 2023) | 3 |
| Morocco – Solar PV and onshore wind | |||||
| Solar PV plant size | GW | 1.20 | 1.20 | Arup energy balancing tool based on Global Atlas Data | 3 |
| Capacity factor (solar) | % | 28.8% | 30.6% | (IEA, 2021) | 3 |
| LCOE (solar) | £/MWh | 32 | 13 | (IEA, 2021) | 3 |
| Onshore wind plant size | GW | 1.30 | 1.30 | Arup energy balancing tool based on Global Atlas Data | 3 |
| Capacity factor (wind) | % | 37% | 45.9% | (IEA, 2021) | 3 |
| LCOE (wind) | £/MWh | 49 | 41 | (IEA, 2021) | 3 |
| Norway – Hydropower | |||||
| Capacity factor | % | 98% | 98% | (Department for Business, Energy & Industrial Strategy, 2021) | 3 |
| LCOE (wholesale) | £/MWh | 52.50 | 41 | (Nordpool, 2023) | 3 |
| France – Nuclear | |||||
| Nuclear power plant size | GW | 1 | 1 | Arup energy balancing tool based on Global Atlas Data | 3 |
| Capacity factor | % | 85% | 85% | (IEA, 2021) | 3 |
| LCOE | £/MWh | 38.2 | 38.2 | (IEA, 2021) | 3 |
| Chile – Onshore wind | |||||
| Onshore wind plant size | GW | 1.40 | 1.40 | Arup energy balancing tool based on Global Atlas Data | 3 |
| Capacity factor | % | 59% | 59% | (IEA, 2021) | 3 |
| LCOE | £/MWh | 35 | 24 | (IEA, 2021) | 3 |
| USA – Onshore wind | |||||
| Onshore wind plant size | GW | 1.3 | 1.3 | Arup energy balancing tool based on Global Atlas Data | 3 |
| Capacity factor | % | 35% | 43.4% | (U.S. Department of Energy, 2022), (IRENA, 2019) | 3 |
| Onshore wind PPA | £/MWh | 24 | 19.40 | (U.S. Department of Energy, 2022), (IRENA, 2019) | 3 |
| Alkaline Electrolyser | |||||
| Efficiency | kWh/kg | 56.55 | 52 | (Department for Business, Energy & Industrial Strategy, 2021), (IRENA, 2021) | 2 |
| Output pressure | bar | 1 | 1 | (Oxford Institute for Energy Studies, 2022) | 2 |
| Stack life | hours | 80,000 | 100,000 | (Oxford Institute for Energy Studies, 2022) | 2 |
| Water consumption | kg H20/ kg H2 | 12 | 9 | WaterSMART solutions | 2 |
| Capex unit cost | £/kW | 800 | 400 | (Oxford Institute for Energy Studies, 2022), (IEA, 2022c), Arup confidential quotes | 2 |
| Fixed OPEX cost | % of CAPEX | 4.5% | 2.5% | Arup benchmark | 2 |
| Stack replacement CAPEX | % of CAPEX | 20% | 15% | Arup benchmark | 2 |
| PEM Electrolyser | |||||
| Efficiency | kWh/kg | 56.27 | 56.27 | (IRENA, 2021) and Arup benchmark | 2 |
| Output pressure | bar | 30 | 30 | (IRENA, 2021) | 2 |
| Stack life | hours | 80,000 | 110,000 | (IRENA, 2021) | 2 |
| Water consumption | kg H20/ kg H2 | 25 | 19 | Arup benchmark | 2 |
| CAPEX unit cost | £/kW | 1,159 | 562 | Arup benchmark | 2 |
| Fixed OPEX cost | £/kW | 4.5% | 2.5% | Arup benchmark | 2 |
| Stack replacement CAPEX | % of CAPEX | 33% | 20% | Arup benchmark | 2 |
| Transea compressor | |||||
| Capex unit cost | £/MWe | 3 | 3 | (EU Hydrogen Backbone Initative, 2022) | 3 |
| Fixed OPEX | % of CAPEX | 1.25% | 1.25% | (EU Hydrogen Backbone Initative, 2022) | 3 |
| Scotland – compressor rating (dedicated pipeline) | MWe | 36 | 36 | Arup internal software. | 3 |
| Morocco – compressor rating (dedicated pipeline) | MWe | 40 | 40 | Arup internal software. | 3 |
| Norway – compressor rating (dedicated pipeline) | MWe | 60 | 60 | Arup internal software. | 3 |
| France – compressor rating (dedicated pipeline) | MWe | 45 | 45 | Arup internal software. | 3 |
| Scotland – compressor rating (shared pipeline) | MWe | 30 | 30 | Arup internal software. | 3 |
| Morocco – compressor rating (shared pipeline) | MWe | 31 | 31 | Arup internal software. | 3 |
| Norway – compressor rating (shared pipeline) | MWe | 44 | 44 | Arup internal software. | 3 |
| France – compressor rating (shared pipeline) | MWe | 39 | 39 | Arup internal software. | 3 |
| New Onshore Pipeline | |||||
| Capex unit cost | £m/km | 1.3 | 1.3 | (EU Hydrogen Backbone Initative, 2022) | 3 |
| Fixed OPEX | % of CAPEX | 1.25% | 1.25% | Arup benchmark | 3 |
| New Offshore Pipeline | |||||
| Capex unit cost | £m/km | 2.21 | 2.21 | (EU Hydrogen Backbone Initative, 2022) | 3 |
| Fixed OPEX | % of CAPEX | 1.25% | 1.25% | Arup benchmark | 3 |
| Repurposed Onshore and Offshore Pipeline | |||||
| Capex unit cost | £m/km | 0.26 | 0.26 | (EU Hydrogen Backbone Initative, 2022) | 3 |
| Fixed OPEX | % of CAPEX | 0.5% | 0.5% | Arup benchmark | 3 |
| Ammonia production plant | |||||
| Energy consumption | kWh/ kg H2 | 1.1 | 1.0 | (IRENA, 2022) | 3 |
| Capex unit cost | £/tpd NH3 | 238,500 | 190,000 | Arup confidential quotes | 3 |
| Replacement CAPEX | % of CAPEX | 15% | 15% | Arup confidential quotes | 3 |
| Fixed OPEX | % of CAPEX | 4% | 4% | Arup confidential quotes | 3 |
| Air Separator Unit | |||||
| Capex unit cost | £/tpd N2 | 51,000 | 51,000 | Arup confidential quotes | 3 |
| Fixed OPEX | % of CAPEX | 2.5% | 2.5% | Arup confidential quotes | 3 |
| Buffer storage | |||||
| Scotland – storage requirement | tonnes | 139.3 | 152.84 | Arup LCOH model calculation. | 3 |
| Morocco – storage requirement | tonnes | 137.93 | 173.08 | Arup LCOH model calculation. | 3 |
| Norway – storage requirement | tonnes | 40.32 | 43.85 | Arup LCOH model calculation. | 3 |
| France – storage requirement | tonnes | 36.07 | 39.23 | Arup LCOH model calculation. | 3 |
| Chile – storage requirement | tonnes | 142.09 | 154.52 | Arup LCOH model calculation. | 3 |
| Capex unit cost | £/kg | 708 | 495 | (CSIRO, n.d.), Arup confidential quotes | 3 |
| Replacement CAPEX | % of CAPEX | 25% | 25% | (CSIRO, n.d.), Arup confidential quotes | 3 |
| Fixed OPEX | % of CAPEX | 0.5% | 0.5% | (CSIRO, n.d.), Arup confidential quotes | 3 |
| Port upgrades | |||||
| Scotland – CAPEX | £m | 54 | 54 | Arup benchmark | 1 |
| Scotland – fixed OPEX | % of CAPEX | 4% | 4% | Arup benchmark | 1 |
| Morocco – CAPEX | £m | 43.3 | 43.3 | Arup benchmark | 1 |
| Morocco – fixed OPEX | % of CAPEX | 4% | 4% | Arup benchmark | 1 |
| Norway – CAPEX | £m | 59.4 | 59.4 | Arup benchmark | 1 |
| Norway – fixed OPEX | % of CAPEX | 4% | 4% | Arup benchmark | 1 |
| France – CAPEX | £m | 54 | 54 | Arup benchmark | 1 |
| France – fixed OPEX | % of CAPEX | 4% | 4% | Arup benchmark | 1 |
| Chile – CAPEX | £m | 43.3 | 43.3 | Arup benchmark | 1 |
| Chile – fixed OPEX | % of CAPEX | 4% | 4% | Arup benchmark | 1 |
| Ammonia shipping | |||||
| Vessel size | t NH3 | 53000 | 53000 | (BloombergNEF, 2019b) | 3 |
| Cost of transport | £/kg H2/ 10,000 km | 0.26 | 0.26 | (BloombergNEF, 2019b) | 3 |
| Boil of gas rate | % | 0.1% | 0.1% | (Al-Breiki & Bicer, 2020) | 3 |
| Ammonia cracking | |||||
| Scotland – cracker size | tpd H2 | 208.63 | 23.60 | Arup LCOH model calculation. | 2 |
| Morocco – cracker size | tpd H2 | 205.82 | 241.05 | Arup LCOH model calculation. | 2 |
| Norway – cracker size | tpd H2 | 301.64 | 306.16 | Arup LCOH model calculation. | 2 |
| France – cracker size | tpd H2 | 270.24 | 274.29 | Arup LCOH model calculation. | 2 |
| Chile – cracker size | tpd H2 | 205.88 | 208.97 | Arup LCOH model calculation. | 2 |
| Cracker CAPEX | £m/ tpd H2 | 2.37 | 2.37 | Arup benchmark | 2 |
| Fixed OPEX | % of CAPEX | 2.5% | 2.5% | Arup benchmark | 2 |
| Reconversion losses | % | 75% | 70% | 2 | |
| Compressed hydrogen | |||||
| Vessel size | m3 | 26000 | 26000 | (Provaris, 2022) | 1 |
| Cost of transport | £/kg H2/1000 NM | 3.75 | 0.64 | (Provaris, 2022) | 1 |
| Shipping distance to Rotterdam | |||||
| Scotland | km | 930 | 930 | Marine Vessel Traffic | 3 |
| Morocco | km | 2747 | 2747 | Marine Vessel Traffic | 3 |
| Norway | km | 1312 | 1312 | Marine Vessel Traffic | 3 |
| France | km | 38.2 | 38.2 | Marine Vessel Traffic | 3 |
| Chile | km | 17970 | 17970 | Marine Vessel Traffic | 3 |
| Pipeline distance to Rotterdam | |||||
| Scotland | km | 930 | 930 | Marine Vessel Traffic | 2 |
| Morocco | km | 1930 | 1930 | Marine Vessel Traffic | 2 |
| Norway | km | 1312 | 1312 | Marine Vessel Traffic | 2 |
| France | km | 435 | 435 | Marine Vessel Traffic | 2 |
Table 2 – Model input assumptions and sources
Sensitivities
Hydrogen Production Sensitivities
Table 3 provides a summary of the impacts on the production LCOH when key input parameters are changed. These results provide insights into the drivers the LCOH estimates.
| Notes | 2023 | 2045 | |
| Base case | Offshore wind with Alkaline electrolyser | 6.58 | 3.43 |
| Improved efficiency | 5 kWh/kg efficiency improvement | 6.00 | 3.10 |
| Lower CAPEX | Low end of CAPEX cost range | 5.28 | 2.91 |
| Lower O&M | Low end of O&M cost range | 6.38 | 3.36 |
| Lower electricity costs | Low end of offshore wind cost range | 5.49 | 2.79 |
| Increased utilisation | High end of utilisation rate range | 5.72 | 2.98 |
| PEM electrolyser | Offshore wind with PEM electrolyser | 7.73 | 5.90 |
Table 3 – Hydrogen production key sensitives
The results in Table 3 indicate the following:
- Increased efficiency in the production model yields a lower LCOH compared the base case, as it will reduce the electricity costs associated to power the electrolyser. Similarly, when lower CAPEX and OPEX cost assumptions are included, the LCOH declines. In particular, a decrease in CAPEX yields a significant drop in LCOH as it is major contributor to total costs.
- Over both years, the inclusion of lower electricity costs is expected to result in lower LCOH values. As electricity input costs are a major driver of production costs, minimising these costs will incur significant cost savings.
- In the near-term, the use of alkaline electrolysers is expected to offer cost-saving benefits due to their lower cost. However, by 2045, PEM electrolysers are expected to provide a lower LCOH due to cost reductions and longer stack life.
Ammonia Shipping Sensitivities
Table 4 illustrates the impact on LCOT for the Scotland base case when the shipping cost parameter is varied.
| Notes | 2023 | 2045 | |
| Base case | £0.26/kg H2 | 2.56 | 2.34 |
| Medium case | £0.56/kg H2 | 2.60 | 2.38 |
| High case | £0.82/kg H2 | 2.63 | 2.41 |
Table 4 – Pathway 2 transport distance sensitives
The analysis indicates that as transportation costs increase, the LCOT for ammonia shipping also increases. In practice, shipping costs may decline as ammonia transport is increasingly used to enable a global hydrogen market.
Compressed Hydrogen Shipping Sensitivities
Table 5 illustrates the impact on LCOH for the Scotland base case when the ship capacity is varied.
| Notes | 2023 | 2045 | |
| Base case | Compressed hydrogen ship capacity of 10 ktpa | 1.88 | 0.32 |
| 30 ktpa | Compressed hydrogen ship capacity of 30 ktpa | 0.76 | 0.13 |
| 65 ktpa | Compressed hydrogen ship capacity of 65 ktpa | 0.61 | 0.11 |
| 100 ktpa | Compressed hydrogen ship capacity of 100 ktpa | 0.57 | 0.10 |
Table 5 – Pathway 3 production scale sensitivity
The analysis indicates that as overall ship capacity of compressed hydrogen vessels increase, the LCOH of this transport option decreases. As the compressed hydrogen industry continues to develop and transport vessels up-scale, further cost reductions could be realised.
Inflation Reduction Act (IRA) subsidy background
The Inflation Reduction Act (IRA) was passed by U.S. Congress in 2022 and provides a variety of incentives for clean energy projects in the USA. An estimated $369 billion will be spent under the Act to help address energy security and transition over the coming decade (International Council on Clean Transportation, 2023).
As part of the IRA, the 45V Hydrogen Production Tax Credit was introduced. It provides an income tax credit for every kilogram of qualified clean hydrogen produced. To qualify for the credit, hydrogen producers must meet the following criteria (Saber Equity, 2023):
- The production process must have a lifecycle greenhouse gas emissions rate of less than 4kg CO2e/kg H2.
- The hydrogen must be produced in the US or a possession of the US.
- They hydrogen must be produced “in the ordinary course of a trade or business of the taxpayer”.
- The hydrogen must be produced for sale or use.
- An independent party must verify the “production and sale or use of such hydrogen”.
The tax credit is tiered based on the GHG emission intensity of the hydrogen produced. Hydrogen producers can earn up to $3 per kg of hydrogen produced for projects with a lifecycle greenhouse gas (GHG) emission intensity of less than 0.45kg CO2e/kg H2 (Center for Strategic & International Studies, 2023). In contrast, hydrogen projects which are more carbon intensive, such as steam reformation combined with CO2 capture and sequestration, will qualify for a lower credit amount. Further guidance from the US Treasury Department in required for calculation of emissions intensity levels of electrolysis-based hydrogen (Center for Strategic & International Studies, 2023).
The tax credit will expire in 2032 so projects which become operational in 2023 can benefit from the full 10 years of the credit, while plants which become operational later will receive progressively less (International Council on Clean Transportation, 2023). Additionally, the 45V Hydrogen Tax Credit is also “direct pay” for the first five years of operation. This allows clean hydrogen producers to claim a tax refund equal in value to their tax credits for five years.
The US Government also introduced the 45V Renewable Electricity Production Tax Credit. This offers renewable electricity producers a tax credit up to 2.6 cents per KWh of energy produced (The International Council on Clean Transportation, 2023). The renewable energy credit works in a similar set up to the hydrogen production credit. Projected figures suggest the IRA tax credit for renewable electricity and clean hydrogen can reduce the cost of green hydrogen production by almost 50% (The International Council on Clean Transportation, 2023).
References
Al-Breiki, M. & Bicer, Y., 2020. Technical assessment of liquefied natural gas, ammonia and methanol for overseas energy transport based on energy and exergy analyses. International Journal of Hydrogen Energy, 45(60), pp. 34927-34937.
Arup benchmark, n.d. [Online].
BloombergNEF, 2019a. Chile Power System Outlook. [Online]
Available at: https://data.bloomberglp.com/professional/sites/24/Flexibility-Solutions-for-High-Renewable-Energy-Systems-Chile-Outlook.pdf.
BloombergNEF, 2019b. Hydrogen: The Economics of Transport & Delivery. New York: BloombergNEF.
BloombergNEF, 2023. Levelized cost of electricity. [Online]
Available at: https://about.bnef.com/blog/2h-2022-levelized-cost-of-electricity-update/
Center for Strategic & International Studies, 2023. How the 45V Tax Credit Definition Could Make or Break the Clean Hydrogen Economy. [Online]
Available at: https://www.csis.org/analysis/how-45v-tax-credit-definition-could-make-or-break-clean-hydrogen-economy#:~:text=The%20Inflation%20Reduction%20Act%20(IRA,kg%20CO2e%2Fkg%20H2).
Crown Estate Scotland, 2022. ScotWind offshore wind leasing delivers major boost to Scotland’s net zero aspirations – News – Crown Estate Scotland. [Online]
Available at: https://www.crownestatescotland.com/news/scotwind-offshore-wind-leasing-delivers-major-boost-to-scotlands-net-zero-aspirations
CSIRO, n.d. National Hydrogen Roadmap. [Online]
Available at: https://www.csiro.au/en/work-with-us/services/consultancy-strategic-advice-services/CSIRO-futures/Energy-and-Resources/National-Hydrogen-Roadmap
Department for Business, Energy & Industrial Strategy, 2021. Hydrogen Production Costs 2021. [Online]
Available at: https://assets.publishing.service.gov.uk/media/611b710e8fa8f53dc994e59d/Hydrogen_Production_Costs_2021.pdf
EU Commission, 2022a. 2050 long-term strategy. [Online]
Available at: https://climate.ec.europa.eu/eu-action/climate-strategies-targets/2050-long-term-strategy_en
EU Commission, 2022b. REPowerEU: affordable, secure and sustainable energy for Europe. [Online]
Available at: https://commission.europa.eu/strategy-and-policy/priorities-2019-2024/european-green-deal/repowereu-affordable-secure-and-sustainable-energy-europe_en.
EU Hydrogen Backbone Initative, 2022. European Hydrogen Backbone a European Hydrogen Infrastructure Vision Covering 28 Countries. [Online]
Available at: https://gasforclimate2050.eu/wp-content/uploads/2022/04/EHB-A-European-hydrogen-infrastructure-vision-covering-28-countries.pdf
IEA, 2020. Projected Costs of Generating Electricity 2020 – Analysis. [Online]
Available at: https://www.iea.org/reports/projected-costs-of-generating-electricity-2020
IEA, 2021. Global Hydrogen Review: Assumptions annex. [Online]
Available at: https://iea.blob.core.windows.net/assets/2ceb17b8-474f-4154-aab5-4d898f735c17/IEAGHRassumptions_final.pdf
IEA, 2022a. Executive summary – Norway 2022 – Analysis. [Online]
Available at: https://www.iea.org/reports/norway-2022/executive-summary.
IEA, 2022b. Africa Energy Outlook 2022. [Online]
Available at: https://www.iea.org/reports/africa-energy-outlook-2022.
IEA, 2022c. Global Hydrogen Review 2022. [Online]
Available at: https://iea.blob.core.windows.net/assets/c5bc75b1-9e4d-460d-9056-6e8e626a11c4/GlobalHydrogenReview2022.pdf,
IEA, 2023a. Low Emission Fuels – Hydrogen. [Online]
Available at: https://www.iea.org/energy-system/low-emission-fuels/hydrogen
IEA, 2023b. Energy Technology Perspectives 2023. [Online]
Available at: https://iea.blob.core.windows.net/assets/d1ec36e9-fb41-466b-b265-45b0e7a4af36/EnergyTechnologyPerspectives2023.pdf
International Council on Clean Transportation, 2023. Can the inflation reduction act unlock a green hydrogen economy?. [Online]
Available at: https://theicct.org/ira-unlock-green-hydrogen-jan23/
IRENA, 2019. Future of Wind: Deployment, investment, technology, grid integration and socio-economic aspects. [Online]
Available at: https://www.irena.org/-/media/files/irena/agency/publication/2019/oct/irena_future_of_wind_2019.pdf
IRENA, 2020a. Green Hydrogen Cost Reduction. [Online]
Available at: https://www.irena.org/-/media/Files/IRENA/Agency/Publication/2020/Dec/IRENA_Green_hydrogen_cost_2020.pdf
IRENA, 2020b. Rewnewable Power Generation Costs in 2020. [Online]
Available at: https://www.irena.org/-/media/Files/IRENA/Agency/Publication/2021/Jun/IRENA_Power_Generation_Costs_2020.pdf.
IRENA, 2021. Making the breakthrough: Green hydrogen policies and technology costs. [Online]
Available at: https://www.irena.org/-/media/Files/IRENA/Agency/Publication/2020/Nov/IRENA_Green_Hydrogen_breakthrough_2021.pdf
IRENA, 2022. Innovation Outlook: Renewable ammonia. [Online]
Available at: https://www.irena.org/-/media/Files/IRENA/Agency/Publication/2022/May/IRENA_Innovation_Outlook_Ammonia_2022.pdf?rev=50e91f792d3442279fca0d4ee24757ea
Nordpool, 2023. See hourly day ahead prices. [Online]
Available at: https://www.nordpoolgroup.com/en/Market-data1/Dayahead/Area-Prices/ALL1/Hourly/?view=table.
NVE-RME, 2023. Norway and the European power market. [Online]
Available at: https://www.nve.no/norwegian-energy-regulatory-authority/wholesale-market/norway-and-the-european-power-market/#:~:text=Bidding%20zones%20in%20Norway
NYSERDA, 2023. Seven States in NE Regional Clean Hydrogen Hub Announce DOE Proposal for Funding and Designation as a National Hub. [Online]
Available at: https://www.nyserda.ny.gov/About/Newsroom/2023-Announcements/2023-4-7-Seven-States-in-Northeast-Regional-Clean-Hydrogen-Hub
Oxford Institute for Energy Studies, 2022. Cost-competitive green hydrogen: how to lower the cost of electrolysers?. [Online]
Available at: https://www.oxfordenergy.org/wpcms/wp-content/uploads/2022/01/Cost-competitive-green-hydrogen-how-to-lower-the-cost-of-electrolysers-EL47.pdf
Provaris, 2022. Compressed hydrogen connecting the world to a clean energy future. [Online]
Available at: https://www.listcorp.com/asx/pv1/provaris-energy-ltd/news/provaris-investor-presentation-2760034.html
Recharge, 2022. World’s largest green hydrogen project, with 150MW electrolyser, brought on line in China. [Online]
Available at: https://www.rechargenews.com/energy-transition/record-breaker-world-s-largest-green-hydrogen-project-with-150mw-electrolyser-brought-on-line-in-china/2-1-1160799
Saber Equity, 2023. Clean Hydrogen Production Tax Credit, Explained. [Online]
Available at: https://www.saberequityllc.com/Insights/Clean-Hydrogen-Production-Tax-Credit-Explained/
Scottish Government, 2019. Climate Change (Emissions Reduction Targets) (Scotland) Act 2019. [Online]
Available at: https://www.legislation.gov.uk/asp/2019/15/introduction/enacted
Scottish Government, 2020a. Hydrogen Policy Statement. [Online]
Available at: https://www.gov.scot/publications/scottish-government-hydrogen-policy-statement/
Scottish Government, 2020b. Scottish Hydrogen Assessment. [Online]
Available at: https://www.gov.scot/binaries/content/documents/govscot/publications/research-and-analysis/2020/12/scottish-hydrogen-assessment-report/documents/scottish-hydrogen-assessment/scottish-hydrogen-assessment/govscot%3Adocument/scottish-hydrogen-assessment.pdf
Scottish Government, 2020c. Offshore wind policy statement. [Online]
Available at: https://www.gov.scot/publications/offshore-wind-policy-statement/documents/
Scottish Government, 2022a. Hydrogen action plan. [Online]
Available at: https://www.gov.scot/publications/hydrogen-action-plan/
Scottish Government, 2022b. Onshore wind: policy statement 2022. [Online]
Available at: https://www.gov.scot/publications/onshore-wind-policy-statement-2022/
U.S. Department of Energy, 2022. Land-Based Wind Market Report: 2022 Edition. [Online]
Available at: https://www.energy.gov/sites/default/files/2022-08/land_based_wind_market_report_2202.pdf
U.S. Department of Energy, n.d. What is a Power Purchase Agreement?. [Online]
Available at: https://betterbuildingssolutioncenter.energy.gov/financing-navigator/option/power-purchase-agreement
U.S. Energy Information Administration, 2023. Nuclear power plants generated 68% of France’s electricity in 2021. [Online]
Available at: https://www.eia.gov/todayinenergy/detail.php?id=55259.
UK Government, 2020. Ammonia to Green Hydrogen Project Feasibility Study. [Online]
Available at: https://assets.publishing.service.gov.uk/government/uploads/system/uploads/attachment_data/file/880826/HS420_-_Ecuity_-_Ammonia_to_Green_Hydrogen.pdf
If you require the report in an alternative format such as a Word document, please contact info@climatexchange.org.uk or 0131 651 4783.
info@climatexchange.org.uk
+44(0)131 651 4783
@climatexchange_
www.climatexchange.org.uk
© Published by Ove Arup & Partners Ltd, 2023 on behalf of ClimateXChange. All rights reserved.
While every effort is made to ensure the information in this report is accurate, no legal responsibility is accepted for any errors, omissions or misleading statements. The views expressed represent those of the author(s), and do not necessarily represent those of the host institutions or funders.