Research shows the majority of people agree that climate action is urgent and important, but few are taking the action required to meaningfully reduce their emissions (Scottish Government, 2025). ClimateXChange, on behalf of the Scottish Government, commissioned this research to better understand how communications and marketing can either support or hinder the translation of climate concern into climate action.
The research examined three target behaviours: installing a heat pump, switching to an electric vehicle (EV), and using public transport more instead of driving. This research focused on citizens who are concerned about climate change, but had not engaged in one of these three target behaviours. In order to focus on the motivational and behavioural impact of communications, participants were recruited on the basis that they reported no major economic or practical barriers to engaging with the target behaviour.
The aim was to explore how target audiences respond to different types of communication and messages prompting people to take ‘warm-up’ behaviours. Warm up behaviours are the first steps toward larger changes in how they heat their homes and travel.
Findings will be used to inform the Scottish Government’s climate communication plans, policy levers to drive behavioural change, and public engagement on climate change more broadly.
Key Findings
Moments of change drive action, not communications alone
Across all three behaviour sets, changes in personal circumstances – such as the need to replace a gas boiler or buy a new car – as well as external factors – such as a change in public transport policy – are the primary drivers of action. Communications alone are insufficient to bridge the gap between intention and meaningful contemplation or warm-up actions. The strategic role of communications should be to prime the audience to consider the overarching behaviour ahead of the next crucial moment. They can build positive attitudes and beliefs that support these behaviours as sensible, practical, and financially viable.
Social norms are critical for heat pumps and electric vehicles
For both EVs and heat pumps, shifting the audience’s perception from seeing these as potential future norms to viewing them as part of the current norm is essential. Communications should focus on driving social norms and positioning these behaviours as desirable, everyday options being chosen by people across different segments of society. Using ‘real people’ as messengers, featuring heat pumps and EVs in everyday domestic settings, and highlighting increasing popularity proved most effective. For EVs, this includes avoiding luxury framing.
Financial and practical concerns outweigh climate benefits
Although the sample participants reported a desire to do more for the climate, taking action to reduce carbon emissions was not a strong motivator of warm-up behaviours. Participants were aware that gas and oil heating and driving internal combustion engine (ICE) vehicles were significant sources of emissions, but practical and financial considerations, along with social norms, were much more effective in prompting consideration. Communicating about climate benefits works best when mentioned as co-benefits alongside more practical arguments. For EVs, avoiding overly moral climate messaging is important.
Heat pumps require education and myth-busting
Low baseline awareness and knowledge among many participants highlighted the need for communications to educate the public about heat pumps. Key messages should focus on:
Financial benefits including government grants and running cost savings such as exclusive energy tariffs for heat pump customers
Installers offering to handle retrofitting work and grant applications, reducing non-financial costs
Credibility of messenger is critical due to high levels of cynicism around government grants and the energy sector. Consistent messaging across government sources, trusted brands, consumer advice brands, and industry voices is essential. Adopting a factual, confident tone is most effective and communications should avoid futuristic framing or qualifying statements like ‘up to’.
Electric vehicles need range and infrastructure messaging
Myth-busting and prompting re-consideration of current attitudes is important for building interest in EVs. Many participants held outdated views. Key message themes to highlight included:
Improved range of current-generation EVs compared with earlier models
Increased availability of EV charging infrastructure across Scotland
Reduced up-front costs of some newer EV models
Lower running and maintenance costs versus ICE vehicles
Authentic, everyday framing using real customers as spokespeople and Scottish examples proved particularly effective. Providing interactive tools such as route planners and charging maps helps people visualise EV ownership.
Public transport requires challenging entrenched attitudes
For driving less and using public transport more, attitudes were more entrenched. Participants viewed driving as the norm and usually drove as a default action. Coordination between public transport operators and government will amplify positive stories. Communications should focus on:
Taking advantage of policy, service or infrastructure improvements to challenge negative beliefs
For more entrenched car users who seldom used public transport, promoting one-off leisure journeys as a more achievable ask than changing commuting habits
Using influencers and social media to present relatable, human examples and highlight benefits
Adopt a straightforward, factual tone; avoid over-confidence or idealised depictions
Who is this relevant for?
The actionable insights contained in this report are relevant for the Scottish Government’s climate communications teams, policy makers developing behaviour change strategies, public engagement professionals, and partner organisations including energy providers, transport operators, consumer advice bodies, and local authorities involved in delivering Scotland’s net zero ambitions.
Introduction and approach
Introduction
Quantitative survey data demonstrates an intention-action gap among the public. The majority of people agree that climate action is urgent and important, but few are taking the action required to meaningfully reduce their emissions (Scottish Climate Survey 2024). Understanding what can drive people’s transition from latent climate concern to climate action is important for informing Scottish Government climate communications and public engagement.
There is a significant evidence base on the barriers and motivators to taking climate action. However, there is a lack of in-depth research on the role of communications and marketing in influencing people to act on their latent climate concern. In particular, there is a need for actionable insight around the role of communications in relation to “moments of change” where motivation and opportunity to act are higher than usual.
ClimateXChange, on behalf of the Scottish Government, commissioned this research to better understand how communications and marketing can either support or hinder the translation of climate concern into climate action. In this context, action refers to the immediate steps, or warm-up behaviours, someone might take after seeing a climate campaign – for example, visiting a campaign website, researching renewable heating systems, or booking a test drive for an electric vehicle. The research focused on citizens who are concerned about climate change and face no major socio-economic barriers to taking meaningful action yet are not currently doing so. These warm-up behaviours were grouped according to three overarching target behaviours – installing a heat pump, switching to an EV, and using public transport more instead of driving.
The aim was to explore how target audiences respond to different types of climate communication and message framing that prompt people to take warm-up behaviours that can serve as the first steps toward larger changes in how they heat their homes and travel. Framing refers to how a particular message is presented in order to influence how it is perceived by the audience, such as by choosing which additional information is included or omitted, or by presenting the message within a narrative.
Findings from this research will be used to inform the Scottish Government’s climate communication plans, policy levers to drive behavioural change to reach mitigation and adaptation goals, and public engagement on climate change more broadly.
Approach
Our research was split into four sequential phases:
A review of existing literature and evidence to identify:
Key barriers and motivating factors related to the overarching behaviours identified.
Behavioural theories that help us to explain inaction on climate change and how these can be used to prompt change
The effect of different communications, i.e. what works and doesn’t work to motivate overarching behaviours which reduce emissions, looking at message framing and content
The findings were used to develop and refine a set of hypotheses – see Appendix A – about the potential effects of a range of message themes associated with the core behavioural areas of focus. These hypotheses were then tested with research participants.
Six online focus groups were held with 30 participants who: agreed that it is important to take climate action; are willing to take more action than they currently do; and stated that money or other practical barriers do not prevent them from taking more action.
A two-part homework task where the research participants from phase 2 were asked to:
Reflect and think about what they’d seen and discussed in the focus groups and consider how that made them feel and think about the overarching and associated warm-up behaviours
Then, a week after the first task, consider taking a warm-up action(s) – recording their experience and thoughts on what they might/would do as a result of their chosen warm-up action, and add their thoughts on a variety of communication examples.
In depth interviews with each of the research participants to probe in detail their reflections on the whole research process – on what works and what does not work by way of climate communications and other relevant marketing-related interventions in connection with each overarching behaviour and associated warm-up actions.
For full details of the methodology please see Appendix B.
Throughout the research process we used behavioural theory to help us reflect on and analyse our findings. We used the:
Stages of change model (Prochaska & DiClemente, 1983) to help us think about where participants were on their journey to adopt a behaviour / undertake a warm-up action. The stages in the model are pre-contemplation (not ready to change), contemplation (considering change), preparation (planning to change), action (making changes), maintenance (sustaining change), and termination (no longer tempted).
Theory of Planned Behaviour (Ajzen, I., 1991) to understand how different potential communications and messaging would affect participant attitudes, subjective norms and perceived behavioural norms and therefore their intention / likelihood to adopt a behaviour / undertake a warm-up action.
See Appendix D for detail on both theories.
This report sets out the findings from the primary research, informed by learnings from the literature review. Fieldwork was conducted between July and November 2025. The main research findings are presented for each set of behaviours separately – that lead to installing a heat pump, switching to an EV and using public transport more instead of driving.
Behaviour set 1: Heat pumps
Context
Product/offer
For participants, the decision to replace a heating system is generally driven by necessity rather than aspiration, with typical moments of change being the end of the current system’s lifespan, moving home to a property with an older system installed, or renovating a current property. The infrequency of deciding on a new heating system often meant that participants’ attitudes were formed based on information gathered some years ago. Typically, they had little motivation to research the topic until they approached a moment of change. In this context, a moment of change refers to an instance where a combination of external and internal factors align, making a person more receptive to marketing and communications on a particular topic. This in turn meant that some participants had last looked at home heating in-depth at a time when heat pumps were far less widely available.
Choosing a heating system is a high-involvement decision. Participants were keenly aware of the potential negative consequences of making a poor choice to replace their current system, such as higher day-to-day running costs, or greater need for maintenance and the associated cost of this. This meant that a period of information gathering and comparison was the norm in the lead-up to the final choice of heating system. In the context of looking to change behavioural norms around heat pumps, this provides a useful opportunity – if heat pumps were established as a credible option, many participants would be motivated to include them in this information search.
Viewed as a product, heat pumps were considered costly in purely financial terms, particularly in comparison to equivalent gas/oil systems. In addition, heat pumps were associated with non-financial costs which are not required for replacing a gas boiler. These were typically linked to the additional work needed to retrofit a home to a standard suitable for a heat pump. Participants who were aware of the need to retrofit tended to anticipate having to plan and research multiple tradespeople, along with general disruption to the home as a result of plumbing, heating and insulation work.
Market considerations
At present, the market for heat pumps in Scotland is at a relatively early stage. Larger brands in the energy/home heating sector (e.g. Octopus, OVO) are beginning to focus more on heat pumps in their commercial and marketing strategies. Heat pumps themselves were still considered to be a relatively niche choice, even by participants who had greater background knowledge around them.
Consumer trust in the market was an important factor, and the choice of messenger had a pronounced impact on how communications were received. Due to the recent energy pricing increases across Scotland and the wider UK, participants indicated mistrust towards the utility sector, but certain trusted brands could be an exception to this view. Similarly, some participants were wary of messaging around grants and incentives for heat pumps due to high-profile scams linked to cavity wall insulation, double glazing or solar panels which were reported widely in national UK media, for example on BBC Morning Live (2025)[1].
Social norms
With low levels of awareness and background knowledge among most of the participants, there was not a strong sense of social norm or “norm in waiting” around heat pumps. Gas boilers are a very well-established heating norm. Participants with greater knowledge tended to view heat pumps as a niche product which may suit people with sufficient financial means and a specific type of home. Meanwhile, those with lower knowledge were most likely to default to gas boilers without actively researching heat pumps if triggered to look into a new heating system.
Moments of change: where the audience was most receptive to intervention
Participants highlighted several opportunities or changes of circumstance which played an important role in prompting contemplation and action. These moments were capable of shifting participants from a pre-contemplation state where a new heating system was not being considered at all, through to contemplation and ultimately preparation.
Moments of change broadly fit into two categories: moments arising from personal changes in circumstance, and those associated with wider external factors affecting the home energy or heating markets in Scotland.
Knowledge/awareness
Across the sample, levels of self-reported understanding and knowledge of heat pumps tended to be low. Participants who had some awareness tended to lack more specific knowledge around how heat pumps worked or the benefits of having one over a gas/oil system. Participants who reported greater background knowledge on heat pumps were often people who had looked into a heating system more recently. Those with the lowest reported knowledge of heat pumps had often been using the same gas-powered heating setup for longer periods of time without seeing a need to change.
A contributing factor to this low level of background knowledge was a perceived lack of visibility and interest in both the product category in general, and heat pumps as a specific product. Few participants expected to be frequently having organic discussions about heating systems with peers, outwith the preparation/information gathering phase of making a purchase decision. Some participants were unsure whether they had seen a heat pump before, as they lacked sufficient familiarity to identify a heat pump outside a building.
“I think just lack of knowledge, like I didn’t even know it [Heat Pumps] was out there to… I just thought you got a boiler and that was it. Do you know what mean? I didn’t really think much into it until this research. So [now], it’s kind of on my radar a little bit more than it was before.” (F, 30-39, C1)
Behaviour change starting point for heat pumps
Taking the contextual information into account, most participants were at the pre-contemplation stage of the stages of change model, and had not seriously considered a heat pump. A few had reached a moment of change more recently having moved towards contemplation but ruled themselves out of further action.
At the outset of the project, pre-contemplation participants tended to feel that if they had reached a moment of change such as a boiler breakdown, they would most likely to go through the steps of researching and choosing a new gas heating system. They would not consider heat pumps as an option. This has implications for any potential communications strategy, as education and building familiarity are likely to be an important first step in driving greater uptake.
Within the pre-contemplation audience, the overall lack of knowledge around how heat pumps work meant that many had not yet formed attitudes and beliefs about their effectiveness beyond very top-level information. This means that there is an opportunity to shape attitudes towards heat pumps while also building familiarity and knowledge.
Key milestones and opportunities at a national or market level, such as more widespread adoption of heat pumps, can play a role in establishing heat pumps as an option to be considered. Participants felt that as consumers become more aware of increased heat pump uptake in their local area, this could potentially turn pre-contemplation into contemplation. Personal moments of change tended to create a greater sense of urgency than changes at a national or market level, and therefore had greater potential to motivate warm-up action, moving people from contemplation to preparation in the Stages of Change model.
Personal moments of change
Given the expense and upheaval of replacing heating systems, these personal moments of change tended to occur either at the end of an existing heating system’s lifespan, or at moments where the friction and upheaval of a large home improvement would be lessened. Examples from participants included:
Breakdown of the currently used heating system, which necessitates a replacement.
Buying a new home (particularly one with a heating system nearing the end of its lifespan or warranty) was seen as an opportune moment to upgrade a heating system, as a period of upheaval and redecorating is expected and can be planned around fitting a new system.
Deciding to renovate or significantly modify a property was also seen as a good time to consider heating upgrades and other disruptive work.
A secondary personal crucial moment, which was less likely to inspire warm-up behaviours but had a social norming effect, was seeing friends, family or neighbours getting a heat pump installed. Seeing peers modelling the overarching behaviour and potentially hearing positive word-of-mouth was mentioned by some participants, who felt this would make them more likely to consider a heat pump alongside the more familiar heating options.
External/market moments of change
Cost was one of the most important factors participants considered when making a decision to purchase a new heating system. The upfront cost of the system and associated work to install it were often compared with any potential running cost savings over the lifespan of the system. Participants tended to be keen to explore any potential cost savings. This means that any changes to government policy, utilities pricing or the pricing of heat pumps themselves would present communications opportunities to establish heat pumps as a cost-effective option:
Any improvements or changes to government financial incentives/grants (e.g. broader eligibility criteria, increased grant amount)
Any reduction in up-front heat pump costs (e.g. due to market competition)
Any changes to energy pricing which favour electricity over gas
Another set of potential future communications opportunities emerged around milestones in uptake. Publicising the increasing popularity of heat pumps in Scotland or at a more local or regional level had the potential to build a credible social norm around heat pumps, as well as countering concerns about their ability to handle colder weather. Milestones of uptake around the associated financial incentives could offer similar opportunities to present heat pumps as a popular choice, as well as creating interest for consumers wishing to avoid missing out on incentives.
Lastly, with some participants holding the view that heat pumps were a new technology which was still developing, any improvements to heat pump technology which challenge some of the negative attitudes and beliefs around them could help establish them as an option worth considering. Examples of this type of improvement in the discussions included heat pump units becoming smaller, becoming easier to install or retrofit, or becoming even more energy efficient.
Associated warm-up behaviours
In the research discussions and homework tasks, participants identified a range of warm-up behaviours which they associated with researching/deciding on a new heating system. This insight gives an indication of the target behaviours which could be modelled or encouraged in communications to encourage heat pump uptake alongside the primary call to action of switching away from gas or oil heating:
Information searching online via search engines, or increasingly via AI//Large Language Model assistants
Reading consumer advice articles or product reviews to help weigh up pros and cons
Reading news articles linked to energy prices or heating systems
Figure 1: Home Energy Scotland educational web content (participant submission)
Speaking to friends and family, especially those with a heat pump
Seeking advice from tradespeople
Engaging with other online content, such as short-form social media videos, was also mentioned by some
Message themes which had the potential to move participants towards action
The following themes were most likely to prompt participants to consider or engage in warm-up behaviours. With most participants’ starting point being pre-contemplation, the most effective messages tended to be ones which focused on building awareness of key benefits or incentives, and/or contributed to establishing heat pumps as part of the norm for home heating. We have used the Theory of Planned Behaviour (Ajzen, I., 1991) to underpin analysis and identify messages which could build intention to act through subjective norms, attitudes and perceived behavioural control.
Presenting heat pumps as an increasingly popular choice
This emerged as a key messaging theme which could underpin a successful communications strategy on heat pumps. The lack of a strong subjective norm around heat pumps presented a barrier for most participants. Findings indicated that shifting the public’s perception of heat pumps from a relatively niche solution to an option which is already popular across Scotland would be essential if greater uptake is to be achieved.
This core communications proposition was relevant at both the pre-contemplation and contemplation stages. Perceiving heat pumps as an increasingly popular choice among “people like me” made pre-contemplation participants want to learn more. Contemplation stage participants who saw heat pumps as one of the default choices tended to be motivated to seek information in more depth, comparing the benefits of heat pumps to gas or other alternatives.
Often, participants’ views on the positives of gas central heating systems were strengthened by the perception that they are effective in providing the desired level of warmth in the majority of Scottish homes. If communications can help to establish a similar level of norm around heat pumps, it may add to the credibility of other messaging around the benefits of installing one.
Communications examples which were linked to this messaging theme included:
Communications from messengers with both trust and brand recognition in the sector (such as energy providers, manufacturers of gas boilers, or local installers)
Communications which used real heat pump owners as messengers, especially when supported by images of heat pumps in everyday domestic settings
Visual depictions of heat pump uptake (such as NESTA’s “Visit a heat pump” website, which included an interactive map showing where their heat pump champions were based) helped to build a sense of local norm.
Communications example in focus: Local manufacturers
In the homework tasks, participants often gravitated towards advertising (Fig.1) from trusted local installers or prominent names in manufacturing (e.g. Worcester). These brands are associated with the current norm of gas central heating, which meant that participants who saw them appearing to embrace heat pumps as part of their offer were more receptive to the idea that heat pumps are part of a current norm. Additionally, the trust felt towards these brands was important in avoiding cynicism about the other co-benefits such as running costs or financial incentives.
Running costs were an important factor in choosing a new heating system
Figure 2: Local boiler and heat pump installer (The Edinburgh Boiler Company, 2025)
Participants were generally price sensitive when making decisions about home heating, with discussions often returning to energy costs. Cost efficiency is an important factor in forming positive or negative attitudes about heating systems, with almost all participants holding the view that a “good” heating system is one which offers value for money. This aligned with the desk review insight around the importance of pricing to both barriers and motivators (see Appendix A). The potential to save money was therefore a strong motivator for consideration, and even participants who harboured some doubts over the effectiveness of heat pumps tended to be motivated enough by potential cost savings to at least conduct some further research. A key example of this from the stimulus materials used in group discussions was Octopus Energy’s heat pump campaign, which highlighted an exclusive energy tariff for heat pump customers.
Conversely, group discussions and interviews found that financial barriers are key in determining perceived behavioural control over the decision to invest in a heat pump. Even with a positive overall attitude to heat pumps, people are unlikely to engage further if they believe they are not affordable to run day-to-day. This finding highlights a major challenge for communications around heat pumps. Current energy pricing in Scotland means that running cost savings are not guaranteed by switching to a heat pump. However, any future change in energy pricing which would enable a claim around cost savings to be made would present a significant opportunity to increase the appeal of heat pumps versus gas boilers.
Credibility of messenger was an important factor in messaging on this topic. Claims from less trusted sources, such as unfamiliar installers or energy firms with perceived low customer satisfaction, were much more likely to be met with cynicism. Many participants had a favourable view of the utility firm Octopus, which lent credibility to their claims about heat pumps and their running costs. Alternatively, trusted brands in the consumer or financial advice space such as Which? or Martin Lewis played a valuable role in shaping attitudes for those beginning to seek out information on heat pumps.
Communications examples in focus: “Real people” case studies and champions
Examples from NESTA and Home Energy Scotland, both of which opted to present real-life owners of heat pumps as their spokespeople, had the advantage of contributing to building the norm around heat pumps and also offered credible claims about running costs. They combined an approachable, confident tone with realistic imagery depicting heat pumps in domestic settings (in the case of NESTA these were often supplied by the homeowners themselves, which added to the sense of authenticity).
Figure 4: Home Energy Scotland heat pump case study / hero (Home Energy Scotland, 2025)
Figure 3: NESTA’s visit a heat pump info page & visit a heat pump online portal (Nesta, 2025)
Highlighting financial incentives and grants which subsidise up-front costs
As with the theme of lower running costs, the price-sensitive nature of home heating decisions meant that financial incentives had strong motivational potential for participants. Highlighting the availability of financial support for heat pump installations was a prevalent theme in the media reviewed during the desk review (see Appendix A). Given the higher up-front cost of heat pumps in comparison to gas boiler systems, offering to subsidise this tended to positively influence attitudes towards heat pumps, and increased participants’ perceived behavioural control by making them feel more affordable. For many participants, the potential savings offered by incentive schemes would be enough to prompt some warm-up action, even if some cynicism about other benefits of heat pumps persisted.
A related sub-theme around financial incentives was identified. Some installers at both local and national level offered to support clients with the grant process, which further reduced the non-financial cost of installing a heat pump.
This messaging theme generated a degree of cynicism, particularly around the prevalence of scams linked to government grant schemes. In interviews and group discussions, anxiety or concern about scams tended to be triggered by the tone or word choice. Participants were alert to the use of phrasing associated with a sales pitch, or the use of qualifying phrases in claims, and typically reported that this type of phrasing damaged overall trust in the message.
The credibility of the messenger themselves also had an impact on the effectiveness of grant and incentive messaging. Government agencies were trusted to be factual about the terms and conditions, although some participants had a degree of wariness about the use of qualifying phrases in some messaging. In particular, some participants felt that the prominent use of the phrase “up to” in communications about grants led to the assumption that the quoted maximum grant amount would be difficult to qualify for.
In addition, some participants found the grant amount itself to be demotivating, as they assumed that the government would not sanction a large incentive unless the overall cost of installing a heat pump was sufficiently expensive to deter consumers.
To avoid the cynical response which some communications received here, there is a need to be up-front and honest about eligibility and avoid over-use of qualifying phrases like “up to £X” or “you could save”. Findings indicated that the most effective communications approach would be to leverage credible messengers such as government agencies, consumer advice brands and trusted suppliers where possible.
“I’m not so sure about the ones that talked about grants. Now, does everybody qualify for that grant? Because often when you click on these things you’re not eligible and next minute you’ve got 40,000 emails and phone calls from companies wanting to sign you up to their solar panels and everything, so I’m always very wary of these kind of things.” (M, C1, 50-75yrs)[2]
Installers offering to take care of preparatory work
This messaging theme tended to be less effective for the pre-consideration audience. However, for participants who were at the consideration stage, it did have some potential to move them closer to warm-up action.
This theme is linked to the non-financial costs associated with heat pump installation, for example additional research and information gathering, planning retrofitting works and applying for financial support. Participants who had considered heat pumps in more depth than the pre-considerers tended to view these additional tasks as adding significant friction to the process of switching to a heat pump. Conversely, replacing their gas boiler like-for-like with another boiler was anticipated to involve less additional effort on the part of the consumer. As with the purely financial incentives, warm-up behaviours were motivated by a perceived opportunity to avoid cost, and the additional effort and time required to retrofit a property.
Challenging the existing belief that heat pumps are disruptive or difficult to install proved to be an effective message, especially when paired with a credible messenger with a link to the energy or heating industries. For some participants, the idea that a trusted organisation was willing to handle some of the administrative burden of planning and securing financial support increased their perceived behavioural control.
“I quite like the first one [Octopus] because it did everything for you. You don’t need to go in and source it. You don’t need a separate company to come in and do the electrics. Everything is done for you from start to finish.” (M, C1, 50-75yrs)
Again, trust in the messenger is an important factor in ensuring messaging was received without cynicism, as the offer had some similarities with scams (e.g. around insulation or solar panels). Having a trusted brand to underpin messaging and providing a rough figure for the overall cost of retrofitting helped reassure participants.
Communications example in focus: Octopus Cozy Heat Pump
Reducing non-financial cost was a core message and part of the communications mix used by the UK energy firm Octopus to launch their heat pump offer. The credibility of their brand was high for many participants, which contributed to an overall positive reception for their communications when tested in the group discussions. The communications mix for this effective campaign featured messages which did more of an educational job about heat pumps and their benefits in comparison to gas boilers. It also included an offer to support with grant applications and retrofitting works alongside financial savings messaging.
Figure 5: Octopus Energy heat pump ad (Octopus Energy, 2025)
“I really like the Octopus one, purely because I am an Octopus customer. I think they’re really good at what they do. And I think for the last few years, energy companies in general have got so much bad press. I would be a bit nervous about going somewhere else for a heat pump and dealing with somebody that I didn’t know.” (F, AB, 50-75yrs)
Message themes which did not move participants towards action
The following message themes were not found to be effective in prompting participants to consider heat pumps and also did not help to motivate warm-up action. In some cases, these themes have potential as supporting or educational messages, either to increase the public’s familiarity with heat pumps or to reinforce the idea that those who have made the switch made the right choice.
Highlighting the potential to increase property values by installing heat pumps
While this was considered to be a potential benefit of heat pumps by some participants, the primary issue was simply lack of awareness of this as a reason to switch to a heat pump. There was not a perceived social norm around installing heat pumps as an investment to increase property value, as no participants in group discussions had heard of people switching to a heat pump for this reason. Similarly, none of the participants were aware of any media featuring messaging which framed heat pumps as a means of increasing property value. Participants understood that in a scenario where gas heating was close to being phased out as a viable option this message would be more motivational.
These findings are enough to suggest that this message theme could be tested for motivational value again in future if heat pumps become part of the norm, but at present the benefit was too hypothetical to have a significant impact on participants’ intention and action. In some discussions, this message theme had a demotivating effect, as it prompted participants to consider other home improvements they could make for a similar outlay, and often with less disruption to the home.
Highlighting heat pumps’ greater energy efficiency in comparison to gas boilers
The key issue undermining this message theme was around the audience’s understanding of what “efficiency” meant in a home heating context. For most participants, an “energy efficient” heating system was synonymous with cost efficiency, as they think of heating their home primarily as a household utility. For those who understood the difference more clearly, energy efficiency was simply far less relevant to their day-to-day lives unless it also translated to a reduction in household bills.
Further complicating the use of this theme is the fact that many participants noted that modern gas boilers are frequently advertised as being highly “efficient”, which led them to question whether this was a unique benefit of heat pumps.
Presenting gas boilers as a technology which is being phased out
While most participants agreed with the basic premise of this message theme, they tended to deflect the need for action due to an expectation that this would take place over a long timescale. The long lifespan of the average gas boiler meant that a “wait and see” attitude was prevalent among participants who were more aware of heat pumps.
Instead of motivating action at the next crucial moment, the response in discussions was often around the idea that consumers would be sensible to make their next heating system a modern gas boiler and consider making the switch at the next moment of change after that, in the hope that technology had improved further and the up-front and daily running costs had improved by this point.
As with messaging around increasing property values, there is some value in the idea of re-testing this message in future if a larger proportion of Scottish homes have switched away from gas central heating.
Having a heat pump instead of fossil fuelled heating improves air quality at home
This message theme lacked motivational value for almost all participants due to a lack of recognition of any air quality problems caused by gas boilers. Participants were unaware of any health issues as a result of gas or oil systems. Although coal fires were occasionally mentioned as an antiquated fuel source which was associated with poor air quality, participants did not link these issues to gas heating.
Highlighting the climate benefits of heat pumps
Desk insight showed that this type of messaging was prevalent in media promoting heat pumps (see Appendix A), however the primary insight did not indicate a positive impact on intentions or action. Although a reduction in carbon emissions was seen as a positive benefit of heat pumps by most participants, it was not sufficiently motivational to serve as a core message for communications aimed at increasing heat pump uptake. Given the current context of the home heating market and wider concerns about the cost of living, price sensitivity and worries about running costs were prioritised over climate change goals.
For some participants, typically those with lower background knowledge about heat pumps, there could be a demotivating effect if climate benefits are presented as a core benefit for switching. This was because climate-friendly behaviours (e.g. electric vehicles or recycling) were associated with making sacrifices, both financially and in terms of convenience. Presenting heat pumps as primarily a choice made for climate reasons had negative connotations for these participants, who assumed that heat pumps would be a more expensive and/or less convenient product compared to gas heating.
Presenting heat pumps as “cosier” or providing more consistent warmth than gas boilers
Many participants did not fully understand this messaging theme. Similarly to messaging on air quality, the promise of “cosier” or more consistent warmth did not cut through as a strong benefit of heat pumps. This was because few participants had issues with the performance of their existing gas system in terms of providing warmth. The idea of providing affordable heat was far more salient and motivational than the idea of consistency for most participants.
Figure 6: UK Government Heat Pump Campaign (Group discussion stimulus)
How choice of messenger impacted on heat pump communications
The ideal communications approach would employ consistent messaging from a wide variety of sources with some credible connection to the home heating or home energy sectors. With levels of trust and credibility varying from one participant to the next, consistency and breadth of sources will be important if cynicism is to be avoided.
Industry sources
Credible industry sources are important, but not only for practical information on cost, performance or installation. Seeing prominent brands in the gas heating industry offering heat pumps also contributes to the sense that the norm is shifting towards heat pumps. Energy providers are an important voice in the sector, although consumer trust is highly variable between brands. They play a key role in speaking about cost and affordability, which are important factors in the decision-making process for heating systems. Heating system manufacturers were similarly credible here, as their communications were seen as an endorsement of the viability of heat pumps, helping to position them as a choice alongside gas boilers.
“It’s from Octopus Energy, isn’t it? So, it’s from a reliable energy company. It’s not from some third-party kind of thing.” (M, C1, 50-75yrs)
Government
The Scottish/UK governments, and their associated brands (e.g. Home Energy Scotland), can play a key role in educating the public about heat pumps, and especially in promoting financial support. Government communications will also have opportunities to help build the norm around heat pumps, by highlighting anywhere that they are being adopted in the public sector.
Given the need for consistent messaging across sources, there is a potential strategic communications role behind the scenes for government, in helping to coordinate and support/incentivise industry sources to promote heat pumps.
Word-of-mouth
Word of mouth recommendations are important drivers of social norms and can be deemed more trustworthy than messaging from commercial or government sources. Friends, family and tradespeople were all mentioned as key in shaping attitudes and beliefs. However, most participants would only be likely to spontaneously discuss heat pumps if they were already in the process of weighing up a decision.
News sources
Trusted news sources varied from one participant to the next, but stories highlighting benefits of heat pumps and milestones in uptake helped to build the norm. Positive media coverage is also important to counter other stories which highlight the drawbacks of heat pumps in favour of gas and other fossil fuelled systems.
Consumer organisations/influencers
Consumer organisations and influencers (such as Which? or Martin Lewis) are important sources due to their perceived impartiality and expertise. Most participants associated these channels with unbiased information and tended to consult their reviews and other content when deciding on large purchases. Homework discussions indicated that smaller micro-influencers in the home improvement space could also play a role in driving norms by modelling the overarching target behaviour and presenting heat pumps in a favourable light.
How tone impacted on heat pump communications
Participants consider buying a heat pump to be an important decision requiring careful consideration of pros and cons. Therefore, participants responded best to a factual, confident tone in communications.
Tones which were effective in promoting heat pumps
A confident tone was common throughout the commercial and government communications which were received positively. This tone tended to speak positively and authoritatively about the benefits of heat pumps, while avoiding over-promising. Celebrating and highlighting the benefits of heat pumps was not associated with cynicism, as long as a “sales pitch” tone is avoided.
Adopting a tone which presented heat pumps as established, every day or normal was also effective, especially when looking to build the norm around them or challenge the existing norm around gas heating. The more heat pumps are framed as a popular choice, or as one of the default options available to consumers, the more likely they are to be considered when a moment of change occurs.
A factual, honest and unbiased tone is also essential when making claims about heat pumps. Many participants were wary of over-promising and scams. Communications which aim to build awareness for the pre-consideration audience should aim to strike a balance between acknowledging barriers such as up-front cost and being confident about benefits.
Tones to avoid when promoting heat pumps
Due to the prevalence of mistrust and cynicism, particularly around grants and financial support, communications should avoid the use of “sales pitch” phrasing or any terms which could be associated with clickbait or misleading advertising. Participants were very alert to the use of qualifying phrases in headlines and written content, and tended to react negatively to these. Examples of this type of phrasing included terms such as “up to” or “you could save”.
“Oh, I don’t like that bit where it says, “up to £7,500”. It would put me off applying. You just know it’ll be almost impossible to actually get the full amount. It makes me wonder if I’d get anything at all!” (F, AB, 30-39yrs)
With some participants adopting a “wait and see” attitude around heat pumps, which was in effect a soft rejection of the call to action, communications should avoid an overly futuristic tone. Positioning heat pumps as new or advanced technology risks reinforcing this attitude and reducing motivation to act at the next crucial moment.
Behaviour set 2: Electric vehicles
Context
Product/offer
Participants viewed the decision to buy or lease a new car as a high-involvement decision. As with a change of home heating system, participants expected to engage in extensive information gathering as part of the process. The potential to avoid unnecessary costs or inconvenience associated with purchasing an unreliable or unsuitable car offered a significant incentive to research a purchase. This was not a decision which participants expected to make frequently, which meant that knowledge and attitudes were not always updated without reaching a moment of change and beginning the process of contemplation and preparation. This factor became apparent in initial group discussions, with some participants surprised to learn about technological improvements made to EVs in recent years. Improvements to range and battery performance were particularly effective in prompting a change of attitude.
Cars were viewed as a relatively high interest, aspirational product. Some participants drew a comparison with heat pumps to illustrate that cars, and by extension EVs, possessed a greater degree of social value. Although practical concerns remained the critical deciding factors in choosing a car, participants reported that aspiration played a role in the decision. Participants reported that they were more likely to notice and/or comment on friends, family or neighbours getting a new car. There was a sense in group discussions and interviews that the aspirational value attached to new cars could be a useful tool in promoting EVs.
Despite the aspirational and social dimensions of the decision, getting a new car was still a decision which was typically driven by necessity, with events such as breakdowns or reaching the end of a lease agreement identified as typical moments of change.
Perceptions of infrastructure also played an important role in shaping participants’ attitudes to EVs as a product. With ICE vehicles still considered the norm, perceived lack of access to charging infrastructure was an important consideration, although participants often had not researched this in depth to confirm their suspicions.
Market considerations
The market for EVs was viewed by participants as established, but still growing. ICE vehicles are still perceived as being the norm in Scotland, but EVs are not considered to be an unusual choice. In part, this was due to the increasing visibility of EVs in public and in the media.
The initial group discussions revealed that industry communications had shaped participants’ views on EVs. In particular, the prominence of luxury or higher-end brands such as Tesla in the EV sector led some participants to view EVs as a luxury/premium product, reinforcing assumptions about their higher up-front cost. Some of the stimulus materials included promotional media from EV manufacturers at a lower price point to facilitate probing around this assumption.
“I’ve always had the impression they were more expensive cars in general. Some of them look brilliant but I sort of assumed they would be too dear for our budget.” (M, C1, 40-49)
Social norms
EVs were viewed by most participants as a future norm and as a choice which was becoming increasingly popular as a replacement for ICE vehicles. While ICE remains the default choice, most participants expected these vehicles to reduce in popularity in the coming years. While this lent itself to a positive view of EVs, this belief was also associated with the idea that EVs are still technology in an early development phase. Participants tended to expect the performance of EVs to improve further in the future, as well as hoping for their price relative to ICE vehicles to reduce. These attitudes lent themselves to a “wait and see” attitude among participants, which encouraged deflection or dismissal in favour of delaying a switch to EVs.
Moments of change: where the audience was most receptive to intervention
Knowledge/awareness
At a basic level, self-reported awareness of EVs was high across the sample. As such, participants tended to have formed attitudes and beliefs about EVs based on what they had seen and experienced themselves. As cars were typically an infrequent purchase, this meant that some cynicism or negative attitudes and beliefs were linked to information gathered some years ago. Beyond having a basic understanding that they were battery-powered and had to be recharged by plugging into the electricity grid, participants tended to report less detailed knowledge around EVs. Questions tended to focus on:
Range limitations
Running costs relative to ICE vehicles
Suitability for different lifestyles and driving needs, such as those who frequently drove longer distances
Suitability for different geographic locations, especially parts of Scotland where poor driving conditions and lower temperatures are likely
Rather than being linked to battery performance in colder temperatures, this concern was often voiced by more rural participants who had experienced road closures due to snow. This led to potential “range anxiety” if the overall travel distance was increased without warning.
Behaviour change starting point for EVs
With awareness of EVs high across the sample, participants at the pre-contemplation phase of the Stages of Change model were primarily those who had ruled out the idea of buying an EV at an early stage of decision-making, rather than being simply unaware of EVs as an option. Typically, their reasons for doing so centred on either financial costs or perceived practical unsuitability. Attitudes about key barriers were often based on older information and could be out-of-date in the context of contemporary EVs. A “wait and see” attitude also often came through, as pre-contemplation audiences defaulted to petrol cars while not outwardly rejecting the idea of owning an EV in future.
The overall impact of this among pre-contemplation participants was that compared to ICE vehicles, EVs were more likely to be ruled out of the decision-making process at an earlier stage based on assumptions about their relative expense or inconvenience. Communications can potentially play an educational role in updating knowledge and challenging negative attitudes, as well as in positioning EVs as part of the current norm.
Participants who were at the contemplation stage were not likely to outright dismiss the idea of making their next car an EV. Often, these were people who had historically reached the contemplation or preparation phase before deciding against an EV. As with the pre-contemplation audience, this group may hold views about cost and performance based on outdated information which necessitates a myth-busting approach in communications. As they were more likely to have conducted some research in the past, this group tended to be more knowledgeable about EVs and were therefore more receptive to communications which highlighted the benefits of EVs in more detail.
Personal moments of change
Personal moments of change for a new car tended to be linked either to the lifespan of the current car or changes in life circumstance. For participants who preferred to finance their car through hire purchase or similar, reaching the end of a payment plan or lease agreement often triggered consideration of a new car. For those who owned a car outright, noticing more frequent or more expensive maintenance needs was often the cue to begin researching a replacement.
Some participants highlighted changes to work or life stages as moments of change. For example, having a baby or having children leave the family home could be a prompt to consider upsizing or downsizing the family car. A change in working requirements was also mentioned, with people who expected to drive more or less frequently in a new job, or who expected to be driving in different conditions were often prompted to consider a replacement.
External/market moments of change
At market/society level, key moments in the development of EV technology, uptake of EVs, and changes to pricing and financial incentives all factored in the decision-making process. Changing social norms were also a notable moment of change for attitudes and beliefs. While they were less likely than personal moments of change to prompt immediate action, participants often spoke about the positive impact of seeing more EVs and EV infrastructure in their local area. Similarly, friends and family swapping an ICE vehicle for an EV was mentioned in some discussions as a trigger for contemplation.
With perceived lack of charging infrastructure often mentioned as a barrier, becoming aware of the increasing number of charge points across Scotland had the potential to prompt contemplation. Similarly, any reduction in the up-front cost of EVs, or improvements to the various financial incentives offered by government and manufacturers had the potential to nudge participants towards finding out more.
Milestones of uptake could also serve as moments of change if highlighted in communications. Being presented with evidence that EVs are increasingly being chosen over their ICE equivalents helped to challenge the “wait and see” attitude. This also helped to position EVs as part of the current norm rather than an incoming one. A similar effect was also observed around milestones in uptake for grants and incentives by creating a “fear of missing out”.
Associated warm-up behaviours
Participants highlighted a range of warm-up behaviours which would form part of their typical preparation for buying a new car. For the most part, these did not differ significantly from what they would expect to do if researching a new ICE vehicle:
Online information searches (primarily through search engines)
Reading consumer advice and reviews (including those from specialist motorist-focused publications, e.g. Autotrader)
Word of mouth, including speaking with friends or family who own an EV, but also in some cases seeking advice from professionals (such as mechanics)
Booking a test drive was associated with being further downstream in the decision-making process as it involved more effort and therefore was typically reserved for deciding between individual models of car.
Figure 7: Arnold Clark search result page for EVs (Participant submission)
Message themes which had the potential to move participants towards action
Presenting EVs as part of the norm in Scotland
This core communications proposition was important for pre-contemplation and contemplation audiences. Challenging the perception that ICE vehicles were the norm and positioning EVs as part of this norm had a strong effect on their likelihood to engage in warm-up behaviours. The idea that “people like me” were already making the switch away from ICE vehicles played an important role in priming participants to engage in warm-up behaviours when they next reached a crucial moment. Participants who reported taking warm-up action over the course of the research often mentioned seeing more EVs in their local area or engaging with friends and family who owned one when asked about factors which influenced their action.
Communications example in focus: Volkswagen Stories
One of the most effective stimulus materials in prompting consideration and increasing the likelihood of action, was this video series produced by Volkswagen UK to promote their ID range of EVs. The videos feature real customers who made the switch to an EV and tend to focus on the benefits of EVs in everyday driving. Using the drivers themselves as spokespeople and avoiding a heavily stylised depiction of the car helped to ground the messages. One particularly impactful example featured a Scottish couple who regularly travelled between Oban and Glasgow. Participants praised the authenticity of this approach, and the use of a recognisably Scottish example of a long journey felt more memorable than simply quoting a figure to illustrate the car’s range.
Figure 8: Tom’s VW story (Volkswagen UK, 2025)
“I really liked the one that explained about the chaps that were taking people from the hospital. I just liked that it sort of gave that confidence that it could be used. It’s giving you actual real-life scenarios from a real-life situation that’s happening…the importance of their journeys as well, and they trust that car to be reliable enough to do that.” (M, C1, 25-49yrs)
If this sense of norm can be created and reinforced, it is likely to boost the credibility of other messaging as well as prompting re-consideration of previously held beliefs. For example, those in rural or semi-rural locations may be prompted to reconsider their views on range and charging infrastructure if they begin to perceive the local norm shifting towards EVs. To achieve this, communications which presented EVs in normal everyday situations, and that spotlighted people with lifestyles that did not fit with the negative view of EVs, were particularly useful.
Raising awareness of improvements to EV range
This messaging theme evidenced the importance of communications in a myth-busting role for both the pre-contemplation and contemplation audiences. One of the most frequent reasons participants gave for not choosing an EV was the belief that they would require frequent recharging in order to cover the distances the participant expected to cover. This was usually contrasted with the ability of ICE vehicles to cover large distances on a single tank of fuel. Messaging from car manufacturers included in the desk review often highlighted range as a key feature for current-generation EVs (see Appendix A).
As cars were an infrequent purchase, discussions often revealed that participants had based this view on information which had been available the last time they reached a crucial moment. Frequently, this meant that participants were surprised to learn how far contemporary EVs are able to travel on a single battery charge.
“I didn’t realise you could probably get to Glasgow and maybe back on some of the newer ones. For me that’s something I’d be interested in finding out a bit more about.” (F, 50-59, AB)
Communications example in focus: Which? online EV quiz
This interactive advice resource from the consumer advice brand Which? was presented as a quiz. Users answered a short series of questions about their living circumstances and driving habits and received tailored advice on whether an EV would be a viable choice for them. This medium was useful in prompting participants to revisit assumptions about the range of EVs, as well as prompting some contemplation about the change of habit required to keep an EV charged up in contrast to their existing habits around filling up at a petrol station. The brand credibility of Which? as a perceived neutral party helped to foster trust in the advice given. It was possible for users to receive advice that recommended against buying an EV, which could be demotivational. However, some participants noted that the fact this was a possible outcome added to the sense of impartiality.
Figure 9: Which? EV feature and quiz (Which?, 2025)
Successfully challenging the perception of low range reduced the impact of other barriers. Based on this message, participants reported that the perceived lack of charging infrastructure, and the “hassle” associated with expecting to re-charge an EV more often than an ICE vehicle would need refuelled, were less of a concern. Likewise, as low range was associated with the belief EVs were a technology that was still in development, myth-busting on range helped to dispel the “wait and see” attitude.
Linked to this wider theme, some communications examples which encouraged participants to think about the distance required to cover a single week of average driving helped to re-position the range of EVs as sufficient for everyday needs.
Highlighting EVs with lower up-front costs
This messaging theme was effective at both the pre-contemplation and contemplation stages, as it challenged the belief that EVs were a premium product with a high up-front price. Challenging this view was essential to moving the pre-contemplation audience towards contemplation, as perceived high up-front costs tended to encourage dismissal early in the decision-making journey. For those who were contemplating an EV, being made aware of the options at lower price points increased their perceived behavioural control and encouraged further research to explore their options further.
This core communications proposition also has the potential to increase the sense of EVs as the incoming norm. The perception of EVs as a high-end product was in part linked to the strong impact of brands such as Tesla in popularising earlier generations of EVs. In contrast, promotional communications for more affordable EV models often focus significantly on price. For participants, seeing a wider variety of manufacturers, including mid-market or cheaper brands, helps to drive the idea that EVs are becoming increasingly popular across society rather than just for an affluent subset of the population.
Raising awareness of improvements to charging infrastructure and performance
This theme focuses on drawing attention to the increasing proliferation of public EV charging across Scotland. A sub-theme is around raising awareness of the increased availability of rapid charging. The impact of this was similar to messaging around range, prompting participants to revisit their beliefs about whether owning an EV would be a practical choice over an ICE vehicle.
For the pre-contemplation audience, the benefits of this messaging theme lie in reducing the risk of rejecting EVs as an option altogether. Participants who felt that public chargers were easily available locally tended to be more receptive to the idea of considering an EV for their next car. Additionally, some of the follow-up interviews indicated that discussions on the topic had primed participants to notice charging infrastructure in their local area, reinforcing the idea that EVs were part of the wider norm.Interactive online tools proved to be an impactful way to communicate this message to the contemplation audience, largely because they encouraged participants to reconsider beliefs about local infrastructure. Urban residents assume public chargers will be busy, while rural residents assume there will be few chargers nearby. Visually showing the number of available chargers on a map often prompted participants to change their view. Likewise, case studies and/or “real people” as spokespeople in communications added a sense of local authenticity to messaging which highlighted access to charge points.
“I imagine peak time in the Highlands it would be tough to get a space to charge. If you’re on the North Coast 500 basically any time between March and October, it’s just going to be constant [public chargers in use].” (F, 40-49, C1)
An important sub-theme linked to this topic was the need to explain how EV charging works to an audience who are familiar with petrol infrastructure and its associated habits. Participants tended to assume that public chargers would be a significant part of meeting their charging needs. Explaining that for many EV owners, home charging is the primary source of energy, with public chargers acting as a top-up for longer journeys or busy moments will be important to reduce concern about access to infrastructure.
Communications example in focus: ChargePlace Scotland
This interactive route planner allows users to plan journeys and check the availability of public chargers across Scotland. It shows the location of charging points and also uses a traffic light system to indicate which chargers are in use in real time. For participants who had reached the contemplation stage, this tool helped to build their sense of familiarity with local infrastructure, reducing “range anxiety” and also prompting them to plan out the journeys they might expect to make.
Figure 11: ChargePlace Scotland map
Highlighting financial incentives/grants
Although less impactful than range, infrastructure and cost, the availability of financial incentives was often sufficient to generate some interest among participants. This was associated with a specific warm-up behaviour. Rather than being linked directly with intention to purchase an EV, participants often reported that, as a result of communications focused on grants, their warm-up behaviour began and ended with a quick check of eligibility.
Similarly to messaging about lower than expected retail prices, there is potential for this message theme to increase perceived behavioural control by lowering the expected up-front cost of an EV.
Figure 12: BBC News article highlighting EV grant scheme (Group discussion stimulus)
There was a potential drawback to this core communications proposition linked to participants’ assumptions about why a government incentive would be deemed necessary. As with similar messaging on heat pumps, some participants took the presence of a financial incentive as confirmation that the up-front cost of an EV would be off-putting, reinforcing one of the main barriers to adoption.
“My first thought there is, if they’re offering you something like three grand off the price of a new electric car, how much is it in the first place?” (M, 50-59, C1)
As a sub-theme, some communications around EVs specifically highlighted grants or other incentives towards installing home charge points. Incentives focused on home charging tended to be received more positively than larger incentives which subsidised the cost of the car itself. This was due to participants who were sceptical about a larger incentive believing that that they were more likely to qualify for a smaller incentive.
Messaging which highlights growing uptake of financial incentives to buy an EV can also help to build the overall sense of social norm around EV ownership.
One further risk of this core communications proposition was linked to eligibility. Some participants who took action during the research project were disheartened to learn that they did not meet the criteria for a grant. This tended to reduce their motivation to pursue further information-gathering on EVs. Effective targeting and clear communication on criteria will be required to mitigate this.
Highlighting lower running/maintenance costs versus ICE vehicles
This message was more relevant to those at the contemplation stage, as maintenance and running costs tended not to be an important issue in comparison to range, infrastructure and cost. The theme still had some value as a sub-message for pre-contemplation participants, as it helped to position EVs as an advantageous choice and added to the list of potential benefits. As with other financial message themes, the potential to save money was often enough to merit a quick initial search, even for those who were still unconvinced by other benefits.
For those actively comparing ICE to EVs, reduced running costs presented an attractive proposition which felt worth looking into. Participants tended to associate the idea of running costs with potentially paying less tax, spending less on maintenance, or paying less per mile travelled in comparison to an ICE vehicle. Where EVs feel like the more affordable choice day-to-day, perceived behavioural control was likely to increase. Participants who felt EVs might offer lower day-to-day costs often felt that this could justify spending more up front. For participants with negative experiences around reliability in an ICE car, this was a strong argument to consider an EV.
The most effective media for this message tended to be more long-form and written content, including articles from consumer organisations or reviews from car magazines/sites. Word of mouth was also highly valuable here, and participants reported that the experiences and views of other EV drivers or mechanics were potentially influential.
“I was doing a bit of reading, and it seems that you can get a tariff for your energy bills that makes it cheaper to charge your car up overnight. I still don’t know if that would actually add up for me, but it’s food for thought.” (M, C1, 30-39yrs)
Message themes which did not move participants towards action
Presenting EVs as advanced/superior technology in comparison to ICE vehicles
While the idea of a better driving experience and owning the latest technology was positive for participants, it did not tend to prompt changes to attitudes or behaviour. The key flaw in this core communications proposition was its lack of specificity. Without specifically addressing their negative attitudes and beliefs around cost, range and infrastructure, there was not enough to convince participants to re-evaluate their existing views.
Focusing on climate benefits of EV ownership
Participants reported that this message theme alone was not enough to overcome their reservations about financial and practical factors. While most participants did not reject the idea entirely, climate benefits fit best as a co-benefit which could help reinforce the decision to buy an EV once it had already been made.
In some discussions, there was a degree of cynicism around the environmental credentials of EVs, for example about the climate impacts of the wider EV supply chain.
“We’d all love to have an electric car and do our bit for the climate, but when there’s expenses elsewhere maybe a big cost on a car isn’t top priority.” (M, C1, 30-39yrs)
Highlighting potential improved local air quality from EV ownership
This messaging theme lacked perceived relevance for most participants. There was a tendency not to recognise air quality in Scotland as an issue requiring significant action. This was particularly true for participants living in rural or semi-rural areas. As participants’ main front-of-mind concerns around EV ownership were financial and practical, improved air quality was perceived as a minor co-benefit at best.
“It’s like when they started adding Low Emission Zones in Edinburgh. I had to change my car as well, but I don’t see the effect that it’s actually had on the air, it still seems the same to me!” (M, C2, 30-39yrs)
Presenting ICE cars as likely to be phased out in the coming years
While this message generally felt credible to participants, it was not sufficient to prompt contemplation or warm-up action. The credibility of the messaging was reinforced by recent policy changes, such as the introduction of low emission zones in large cities. However, participants did not anticipate ICE vehicles to become significantly less viable in the short-term. Coupled with the long period expected between car purchases, this theme was associated with the “wait and see” attitude for most participants, reinforcing the idea that delaying the switch to an EV was the best course of action.
It’s fair to say [petrol] is on the way out. As it stands though, I think it’s not likely my next car will be electric. Maybe the one after that? (M, C2, 30-39yrs)
How choice of messenger impacted on EV communications
Given the importance of establishing a social norm around EVs, consistent messaging across a diverse mix of sources will be required. Additionally, the need for education or myth-busting to update and challenge existing attitudes around EVs means that messengers with a reputation for fairness and balance will be particularly useful.
Industry sources
One of the most important factors in driving the perceived social norm around EVs at a national level will be the visibility and credibility of recognised brands in the automobile industry. Seeing major manufacturers promoting EV models alongside or instead of ICE models was interpreted by participants as a strong signal that EVs are a popular and viable choice. Messaging from car manufacturers increasingly frames EVs as an option rather than a special category. In addition, the increased presence of mid-market and more affordable brands in the EV market is likely to help challenge the perception of EVs as a luxury item.
Consumer organisations/influencers
Both general (e.g. Which?) and specialist car review brands (e.g. Autotrader, What Car) were frequently mentioned in discussions and interviews. For many participants, they are an essential part of the information search for those considering a new car. This gives them an important role in shaping opinion, driving norms, and educating their audience.
Online social media influencers can play a similar role. Some participants highlighted this in the homework tasks. In particular, content which emphasised the normality of EV ownership or offered insight on the day-to-day running of an EV helped to prompt deeper consideration and normalise the idea of owning an EV.
Word of mouth
Participants highlighted the importance of personal networks in shaping their decision on which car to buy. Some participants reported a positive recommendation from a friend or relative as having had a strong motivational effect, as they felt they could be trusted to honestly report on the advantages and drawbacks of owning an EV. Similarly, some participants mentioned asking mechanics, taxi drivers or other professionals about the reliability and costs of EVs as a way of tapping into their greater experience.
Government
Government communications around EVs can play a key role in education, myth-busting and in drawing attention to policy changes or milestones of uptake that can serve as a crucial moment. Government also has a potential role in amplifying any positive stories about grants/incentives, or improvements to infrastructure which reduce the friction of EV ownership.
News sources/PR
Mainstream news media was highlighted as a useful channel for reinforcing norms or introducing narratives which counter negative attitudes around EVs. For example, articles which highlight milestones of uptake or improvements to EV technology were potentially useful in shaping a more positive view of EVs in the general public.
How tone impacted on EV communications
Tones which were effective in promoting EVs
Many of the advertising and promotional materials from EV manufacturers which were well received adopted a confident tone, presenting their product as stylish and effective. For participants, this matched their expectations from car advertising in general, which contributed to the sense that EVs are part of the norm. Likewise, an aspirational tone which depicts EVs as a desirable product with social as well as practical value could be similarly effective in the specific context of advertising, especially when coupled with messaging which highlights affordability.
Adopting a more overtly “everyday” tone was also an effective choice. Putting the spotlight on real people or presenting EVs in straightforward, relatable situations was a useful way to reinforce the norm. Visually depicting how EVs can fit into a typical person’s life helped to prime participants to consider their own driving habits and whether they would be compatible. Communications which included a recognisably Scottish example were particularly effective.
For communications focusing more on an educational or myth-busting role, participants reacted positively to a reassuring tone, which felt like a good fit for the content.
Tones which were less effective in promoting EVs
Although higher end car manufacturers often emphasise luxury and advanced technology, this tone did not suit a wider audience. It risks reinforcing the belief that EVs are prohibitively expensive or only suitable for an affluent subset of the population.
Tones which focused more on the morality or ethics of EVs using a climate change framing were less effective in prompting action or encouraging participants to re-think their existing views. Participants were all aware that fossil fuels are detrimental to the environment, and that EVs are a way to reduce emissions. This led to communications being perceived as “preachy” or patronising by some participants.
Behaviour set 3: Drive less/use public transport
Context
Product/offer
In contrast to the previous two overarching behaviours considered as part of this research, reducing private car use and making more extensive use of public transport requires a change in everyday habit as opposed to an infrequent, one-off decision. For participants, this tended to seem like a larger, more complex call to action, as they had to consider how to adapt to and maintain the new behaviour.
Broadly, participants outlined two main contexts for driving less and using public transport more: commuting and leisure travel. For both, participants tended to favour reliability, convenience and value for money. Commuting tended to be viewed as more stressful, with greater time pressure than leisure travel. The decision here was often dominated by participants’ attitudes and beliefs towards the public transport offer in their immediate area. The perceived quality and value for money of public transport varied considerably between areas. Levels of service provision and infrastructure also significantly differ depending on area of residence, so these attitudinal barriers were often linked to practical barriers.
The key benefits highlighted in the communications promoting public transport which were used in the research stimulus include:
Additional free time gained versus having to concentrate on driving
Avoiding the inconveniences of driving such as parking and heavy traffic
The environmental benefits of choosing public transport
Most participants tended to have already considered the public transport offer and had formed a preference for travelling by car instead. Often, this meant their driving habits were engrained, and they tended to have a positive view of driving, perceiving it to offer a greater level of door-to-door convenience and better value for money than public transport.
Knowledge/awareness
Knowledge and lived experience of using public transport was ubiquitous across the sample. This meant that participants tended to hold well-established attitudes and beliefs, which were often based on their personal experiences of using local bus or train services. Communications promoting public transport use instead of driving face a considerable challenge in shifting these attitudes without being able to evidence material change or improvements to the services themselves.
Market considerations
The public transport sector in Scotland is highly developed. Participants had high awareness of both nationally and locally relevant providers. Often, public transport operators have an effective monopoly on particular routes or areas. This in turn means that their reputation and credibility have a strong influence on local people’s attitudes towards reliability, convenience and value for money.
Overall, participants tended to report low levels of trust in public transport providers and often had an unfavourable opinion of their services. The recruitment criteria for this research offers a potential explanation for the high degree of reported cynicism around public transport. Participants were recruited on the basis that there were no significant practical or financial barriers to using public transport more than they already did. This likely led to a sample who opted not to use public transport based on attitudes and beliefs. As a sub-audience, their views pose a challenge for communications promoting the benefits of public transport.
Social norms
While use of public transport is already part of the social norm across Scotland, private car travel is more prevalent and normalised. The degree to which public transport is part of the norm varies regionally, with reliance on public transport often considered less normal in rural or semi-rural areas. In some cases, participants who had moved between rural and urban environments identified a link between the perceived level of availability and service coverage and the prevailing social norm of using public transport.
“When I used to stay in Glasgow as a student, I would use the bus all the time, but now I’m back up in Inverness I don’t think they’re nearly as good, so most people I know don’t bother.” (M, C2, 30-39)
Behaviour change starting point for driving less and using public transport more.
Participants who were at the pre-contemplation stage for driving less tended to be people who held well-established negative attitudes about the quality and value of their local public transport offer, while also having a positive view on the relative convenience and value for money of travelling by car. This meant they defaulted to driving when planning a journey and were likely to dismiss the idea of travelling by public transport without much consideration. Consequently, the communications focus for this audience has to be on challenging existing attitudes and beliefs in order to prompt a re-evaluation of the benefits of public transport. Policy or infrastructure changes often provided the best opportunities to do this.
For participants who do contemplate reducing their driving in favour of public transport, the challenge is more around supporting the change of habit. Often, participants in this group believed that they already used public transport as often as it makes sense for them to do. Highlighting new ways to use public transport, especially for leisure journeys, offered a potential route to move them from contemplation to preparation.
Moments of change: where the audience was most receptive to intervention
Knowledge/awareness
Knowledge and lived experience of using public transport was ubiquitous across the sample. This meant that participants tended to hold well-established attitudes and beliefs, which were often based on their personal experiences of using local bus or train services. Communications promoting public transport use instead of driving face a considerable challenge in shifting these attitudes without being able to evidence material change or improvements to the services themselves.
Behaviour change starting point for driving less and using public transport more.
Participants who were at the pre-contemplation stage for driving less tended to be people who held well-established negative attitudes about the quality and value of their local public transport offer, while also having a positive view on the relative convenience and value for money of travelling by car. This meant they defaulted to driving when planning a journey and were more likely to dismiss the idea of travelling by public transport without much consideration. Consequently, the communications focus for this audience has to be on challenging existing attitudes and beliefs in order to prompt a re-evaluation of the benefits of public transport. Policy or infrastructure changes often provided the best opportunities to do this.
For participants who do contemplate reducing their driving in favour of public transport, the challenge is more around supporting the change of habit. Often, participants in this group believed that they already used public transport as often as it makes sense for them to do. Highlighting new ways to use public transport, especially for one-off leisure journeys, offered a potential route to move them from contemplation to preparation.
Personal moments of change
At a personal level, opportunities to swap driving for public transport were often prompted by changing work or study requirements. As a change of job/study location means having to plan out a new commute and a potential change of daily routine, it offers a moment where existing habits must change regardless of the mode of transport chosen. Moving house offered a similar moment of upheaval where new habits are required. For both of these examples, the potential to motivate action on driving less was increased if the new location was perceived as having better public transport links than the old location.
Another key moment of change for participants was linked to eligibility for discounts. Reaching milestones associated with national or local discount schemes (e.g. an older person’s bus pass, or student discounts) typically prompted participants to engage in warm-up behaviours to explore the potential savings.
“I’ve been thinking about my daughter’s situation, going to university, and rather than taking the car, because she’s under 22, they get, like, free buses. So that’s a massive encouragement for her. And if she misses the bus, she’ll often get the train, and them cutting the peak fares, that’s made a big difference to the cost as well.” (F, 50-59, C1)
External/market moments of change
Negative attitudes about public transport among participants were typically based on perceptions of poor reliability, lack of service in the local area, or low value for money. This meant that any improvements to infrastructure or service, and any changes to policy which made pricing more affordable, afforded crucial opportunities to challenge these attitudes. Where communications were able to frame their messaging around a significant change like this, even the more cynical participants were likely to engage in some warm-up behaviours.
Associated warm-up behaviours
Participants reported a range of warm-up behaviours associated with journey planning, which were essential to use of public transport regardless of whether they were planning a one-off leisure journey or considering a change of commute. These included:
Online information searches using search engines and increasingly the use of AI assistants
Route planning through map applications on smartphones or websites
Route planning through public transport operators’ apps or websites
Message themes which had the potential to move participants towards action
Challenging existing beliefs about public transport services
As participants at both the pre-contemplation and contemplation stages held at least some negative attitudes and beliefs towards public transport, communications which were able to prompt a re-evaluation of views were crucial. Perceived behavioural control was often low, especially for participants living in places that they believed to be poorly served by public transport. These participants reported that becoming aware of service improvements, such as additional routes or more frequent services, could prompt them to re-consider.
Public transport was widely believed to offer worse value for money than private car travel, meaning it is necessary to challenge this belief by highlighting value for money wherever possible e.g. through discount cards, price promotions, changes to fare policy. Participants tended to assume they were aware of the current options for discounts and savings, which meant that they were unlikely to engage in warm-up actions linked to researching pricing without becoming aware of new discounts or changes to existing pricing structure. An example of this type of messaging which proved effective was ScotRail’s announcement of the removal of peak time rail fares.
Without material changes or improvements to frame messaging, public transport brands may struggle to challenge negative attitudes directly due to trust issues, with bus services in particular tending to have a low level of public trust. Some of the more human-focused social media content which was used as stimulus proved to be more effective at softening negative views on public transport than direct communications from public transport operators.
In contrast, participants tended to reject or dismiss claims which were not backed by a policy change (e.g. simply stating that public transport offered good value rather than highlighting a discount or price change). For many participants, the ScotRail example was one of the few communications pieces which was sufficient to prompt warm-up action by itself, although there remained some cynicism around other factors such as reliability and convenience.
“[ScotRail] actually have a calculator that I used to see how much I could potentially save by taking the train, so yeah, I did take action when I saw this” (F, 30-39, C1)
Communications example in focus: ScotRail peak fares announcements
Participants were shown several pieces of communication promoting ScotRail’s pricing changes at peak times, including promotional videos and PR/news headlines. The effectiveness of these communications lay in offering a straightforward, factual piece of information which challenged an existing negative attitude about value for money. Communications included examples of the money which could be saved travelling on some of Scotland’s busiest routes at peak times, which generated interest among participants. The ScotRail website featured a price calculator tool which was used by some participants in the homework tasks to explore the potential cost of commuting by rail.
Figure 14: ScotRail price change (ScotRail, 2025)
Highlighting improvements to public transport policy, infrastructure, or service
This messaging theme was closely related to the previous theme around challenging existing beliefs. With participants’ views often deeply entrenched and based on prior experience, they were most receptive when confronted with a clear positive change to the public transport offer.
From a communications strategy perspective, the drawback to this theme is the fact that it requires a change to occur in order to provide a compelling reason to engage with the message. Improvements which have the potential to prompt re-consideration for people who have negative views about value for money, reliability or service coverage should be treated as a major opportunity. Coordination with public transport operators and colleagues in local or national government will be important to ensure these opportunities are used to their fullest advantage.
The type of changes or improvements which participants identified as likely to prompt a re-think of their current views included:
The announcement of new bus, train or cycle routes in their local area
A change of bus operator in contexts where participants held a strongly negative view of the current operator
Changes to timetables or schedules which allowed for more frequent journeys, faster journey times, or extended operating hours
The announcement of new discount schemes, price promotions or similar
“I kind of have to drive to work, where I work in an industrial estate. I think it’s about two buses to get there, so it’s obviously less convenient. So really the push for myself to get to work via public transport is obviously less. But I think with the peak fares going, it’d be nice to go down to Edinburgh or Glasgow via the train. I always end up driving because the cost of the train tickets, it’s just really so expensive. So, yeah, peak fares going would really appeal to me” (F, 30-39, C1)
Focusing on leisure travel and “one journey at a time”
The effectiveness of this messaging theme lay in avoiding the deflection and dismissal associated with changing daily driving habits and instead focusing on encouraging participants to choose alternatives to private car travel when planning one-off journeys, especially leisure trips. For an entrenched driving audience, the idea of taking occasional leisure trips by train was a much smaller ask in comparison to replacing daily journeys to and from work, and was also something many participants had not considered doing for some time.
Communications which featured this theme tended to meet with less resistance than those proposing a change of habit. Participants were more likely to report warm-up behaviours as a result, helping to normalise greater use of the public transport. For those with entrenched negative views based on past experiences of public transport, this approach offered an opportunity to challenge these beliefs through new experiences.
One-off leisure travel was a more accessible call-to-action than commuting, as participants felt that the more infrequent occasional nature and lack of time pressure reduced the impact of barriers like perceived low reliability or cost. Some participants also engaged positively with the added value offered by using public transport to get to and from social or cultural events. For example, not having to drive home at night, or being able to drink alcohol at a concert.
Communications example in focus: Instagram influencer @thechaoticscot
This example highlighted the potential of travel influencers to encourage their audience to use public transport more and drive less. The example tested with participants featured a leisure trip to Rosslyn Chapel which involved multiple journey legs. Presented in a personable, relatable vlog style, the influencer highlighted the value for money and convenience of public transport and combined travel advice with recommendations for food, drink and attractions. The inclusion of recognisable Scottish landmarks and public transport brands often prompted consideration of similar leisure trips among participants.
Figure 15: The Chaotic Scot, 2025
Highlighting the additional free time gained by using public transport instead of driving
This messaging theme was less effective for the pre-contemplation audience, but participants who were already at the point of contemplating more use of public transport found it to be encouraging. It was prevalent in messaging aimed at commuters by rail and bus operators in the desk insight (see Appendix A). For many participants, framing the journey itself as free time was a novel benefit which they had not considered before.
The main flaw in this messaging theme was that while it had the potential to build positive attitudes towards public transport, it did not directly address the major barriers of perceived low value for money, reliability and convenience. This meant those with low perceived behavioural control (e.g. people who believed they could not realistically make more use of public transport) were likely to reject messaging along this theme.
In addition, participants tended to associate the benefit of free time more with rail travel than bus travel, as buses tended to be perceived as more crowded and less relaxing than rail.
“I do sort of like the idea of getting time back to do your own thing, you could check a few emails in the morning and stuff like that.” (M, AB, 25-49yrs)
Message themes which did not move participants towards action
Re-framing the costs of car ownership to include maintenance and other bills
Some communications examples sought to prompt re-evaluation of the perceived value for money offered by private car travel (see Appendix A). When comparing costs between driving and public transport, participants tended to focus on fuel costs for their car, which often compared unfavourably with the price of an equivalent bus or train ticket. This messaging theme aimed to re-frame the price comparison so that it accounted for a wider range of costs associated with owning and running a private car, such as insurance, tax, maintenance and parking.
While participants acknowledged the idea that there were other costs beyond fuel, this core communications proposition was not particularly motivating. This was linked to the perceived sunk costs of car ownership, as participants who were very unlikely to give up owning a car would still have to pay road tax, monthly car payments and maintenance costs even if they decided to make greater use of public transport.
Some participants also brought up the idea of car sharing in response to this, as multiple people sharing the fuel cost of a single journey often represented a considerable cost saving, further increasing the perceived value of driving versus buying individual tickets on public transport.
Highlighting the drawbacks of private car use
This messaging theme focused on highlighting some of the inconvenient or stressful aspects of private car travel, which have often become normalised and accepted among habitual drivers. While this type of messaging was relatable and prompted some discussion among participants, it was not strongly motivational. This was due to the lack of a positive case for public transport as an alternative.
The overall effect of highlighting the drawbacks of car use was to prompt reflection on the stresses and problems of travel in general, especially in a commuting context. Some participants felt that this messaging theme had greater potential as a supporting message or sub-theme paired with messaging which highlighted the benefits of public transport.
There was also some outright rejection of messaging which presented public transport as inherently less stressful than travelling by car. Participants who had negative views of the reliability of public transport often highlighted the stress of late or cancelled services. Buses were also specifically mentioned by participants who associated them with stressful or negative experiences, typically the behaviour of fellow passengers.
“[The FirstBus ad] is quite fun and I like that. But if you’ve ever been on a FirstBus in Glasgow when it’s full of school kids I don’t think you’d say that’s less stressful than driving! (F, 50-59, C1)
Highlighting climate change benefits of reducing car use
While the basic premise behind this core communications proposition was not rejected outright, participants tended to report little motivation to engage in warm-up actions based on communicating climate benefits alone. There was also little impact on attitudes, due to a perceived lack of new information. Participants generally felt that they were already aware of the emissions they were generating by driving, but without a compelling case for the practical and financial advantages of public transport, this knowledge was not sufficient to prompt a change in behaviour.
Figure 16: FirstBus campaign in Glasgow which focused on emissions (Participant submission)
A few participants in the group discussions were defensive on this issue and tended to point out the use of “dirty” fuels in public transport, especially diesel for trains or buses. Highlighting the increasing prevalence of electric buses and trains could help to minimise deflection based on this point.
Highlighting the ease of journey planning using digital tools
This was a proposition which was tested as a way to highlight the convenience of modern public transport. Some of the desk review media examples focused on the ease of use of booking and planning software as a core part of their proposition (see Appendix A). Participants agreed that the widespread adoption of map and journey planning applications on smartphones had made planning easier. However, with almost all participants reporting a high level of familiarity with digital journey planning tools, messaging which focused on this did not present a new, compelling argument to revisit public transport.
Given the familiarity of map and journey planning applications, this was highlighted as one of the easiest and most accessible warm-up actions for public transport use. Participants therefore tended to feel this theme was better suited to being framed as a call to action, rather than a benefit of public transport.
How choice of messenger impacted on communications promoting driving less and using public transport
Industry sources
Although participants often reported low levels of trust towards prominent public transport brands, they remain a key messenger for information about the services they provide. In particular, there was appetite from participants to learn about any improvements to services, which would enable public transport brands to challenge the perception of unreliability, inconvenience and/or poor value for money.
Given the importance of leisure travel as a more achievable call to action for participants, there is also a role here for messengers from linked industries (e.g. hospitality, entertainment). These messengers can help to frame public transport as a default way to get to and from events, reinforcing the idea of leisure travel as a “soft launch” for driving less overall.
Influencers/social media
This type of messenger stood out in the research as a particularly effective option for highlighting the benefits of public transport in a relatable way. The ability of influencers to add a human face and story as a framing device allowed them to circumvent cynicism about public transport. The use of vlogs and similar “real life” techniques helped to model the overarching target behaviour and allowed benefits to be highlighted as part of a lifestyle, with public transport framed as a positive choice.
Government
As material improvements to services and pricing were the most effective framing for a challenge to negative attitudes, government sources are likely to play an important role in communications to encourage more use of public transport. Government messengers were credible sources of information and can help to amplify and highlight any positive stories which have the potential to prompt a re-evaluation of the benefits of public transport.
News sources/PR
Trusted news sources can play a similar role to government, as a channel which allows people to be made aware of positive changes to the public transport offer. Given some participants’ cynicism towards messages which came directly from public transport brands, using media outlets to amplify messaging also has the advantage of presenting information from a neutral third party.
How tone impacted on communications promoting driving less and using public transport
Tones which were effective in promoting driving less and using public transport
Communications seeking to take advantage of improvements to policy or infrastructure to challenge attitudes on public transport were best suited to a factual, straightforward tone. While projecting confidence was important, it was equally important to avoid relying on unqualified claims to minimise cynicism.
For less factual communications, such as social media influencer content, the most effective tone was approachable, confident and inspiring. The idea of trying something new with public transport was one of the most compelling ways to introduce leisure travel to participants. The approachable style used by travel vloggers helped to model the overarching target behaviour and associated warm-ups for the audience while also highlighting key benefits.
Tones which were less effective in promoting driving less and using public transport
Some of the communications examples used humour to highlight the drawbacks of private car travel or the benefits of public transport. The response to this was mixed, and often the most cynical participants were the most dismissive of humour being used in this context. Overall findings indicated that a more matter-of-fact tone offered a less risky approach.
Another tone to avoid was over-confidence, especially when the messenger is a public transport provider. Given the tendency of participants to hold entrenched negative views, there was often a negative response to communications which represented the public transport experience in an idealised or unrealistically positive way.
Conclusions and actionable insights
The role of communications in prompting action across the three behaviour sets
Moments of change are key drivers of action, rather than communications
Across all three behaviour sets, the key finding which could underpin an effective communications strategy is that moments of change and other external factors are the primary drivers of action. Often, communications alone were not sufficient to “bridge the gap” between intention and meaningful contemplation or warm-up actions for people who are concerned about the climate and have the means to take action. Insights showed that communications can play a key role in driving warm-up behaviours by priming the audience to contemplate the overarching behaviour ahead of the next crucial moment. Communications can also be employed to build positive attitudes and beliefs to support the idea that the overarching behaviours are sensible and practically and financially viable.
Communications should look to prime the audience ahead of moments of change, and support this by building positive attitudes
In order to prime the audience ahead of moments of change, our findings indicate that communications should focus on driving social norms. Messaging should position the overarching behaviour as a desirable, everyday option that is being chosen by people across different segments of society. For both EVs and heat pumps, this means shifting the audience’s perception from seeing the overarching behaviour as a potential future norm, towards viewing it as part of the current norm. For the third behaviour set, negative attitudes towards public transport tend to be more entrenched. Communications encouraging driving less and using public transport more need to prompt the audience to re-evaluate their views. Findings indicated that the most effective ways to do this were to take advantage of positive changes to policy and infrastructure, and to encourage the audience to try swapping their car for public transport for one-off leisure journeys.
Reducing emissions was not motivating enough to present as a primary benefit in communications
Although the sample reported a desire to do more for the climate, taking action to reduce carbon emissions was not a strong motivator of warm-up behaviours for these three big changes. Participants were all aware that gas or oil central heating and driving ICE vehicles were significant sources of carbon emissions. They also tended to be positive about the idea of doing more to reduce their emissions. However, practical and financial considerations, along with social norms, were much more effective in prompting consideration of the three behaviour sets.
There was some evidence from the group discussions and interviews that suggested climate benefits could serve as a co-benefit alongside more practical arguments. Messaging on climate benefits could also potentially reinforce the decision to switch to an EV, heat pump or public transport once it is already being strongly considered.
For heat pumps and EVs, the communications should focus on driving social norms and build positive attitudes towards the overarching target behaviours
Both EVs and heat pumps represent infrequent, expensive purchases, which participants associated with the need for extensive personal research to avoid the consequences of making the wrong choice. With an audience who have a strong incentive to engage in warm-up behaviours ahead of their decision, the strategic goal should be to prime the audience, establish the warm-up behaviour as a valid option in each category in advance of the moments of change that prompt action.
The trigger for these warm-up behaviours tends to be a change in circumstance or other event which means the existing product or habit needs to be replaced, or which means that some of the major barriers to adoption are negated. Examples included reaching the end of a car lease agreement for EVs, or the breakdown of a current heating system for heat pumps.
Another important area of focus for communications on EVs or heat pumps should be around building positive attitudes and beliefs and increasing perceived behavioural control of the decision to purchase. This can be achieved primarily by focusing on financial and practical concerns, as these tended to be the strongest barriers to action. Heat pumps in particular were still not fully understood by many participants, which means educational or awareness-building communications will still be required. Similarly, effective communications should look to play a myth-busting role, as the infrequent nature of car and heating system purchases offers opportunities to challenge negative beliefs by highlighting where the offer has improved since the audience last researched the overarching behaviour.
For driving less and using public transport more, communications should focus on challenging existing negative attitudes to prompt a re-think
Because the audience’s attitudes towards public transport were more entrenched, findings indicated that communications to encourage the public to swap driving for public transport should focus on taking opportunities to challenge these attitudes. The most important opportunities to do so are presented by changes to the public transport offer which increase its appeal or contradict beliefs about low value for money, inconvenience or lack of service. In addition to a lack of positive attitudes, perceived behavioural control was often low for this audience, especially among those who believed public transport to be unaffordable or felt their area was under-served.
Participants tended to view driving as the norm and usually drove as a default way to travel for both commuting and leisure. As commuting habits were viewed by participants as much harder to change, supporting communications should look at focusing on leisure travel and one-off journeys. This presents a more achievable call to action and had the potential to encourage infrequent users of public transport to re-familiarise themselves, possibly reducing negative attitudes based on past experience in the process.
Gatersleben, B. & Uzzell, D. (2007). Affective Appraisals of the Daily Commute Comparing Perceptions of Drivers, Cyclists, Walkers, and Users of Public Transport. Available at 10.1177/0013916506294032
Krishna, G. (2021). Understanding and identifying barriers to electric vehicle adoption through thematic analysis. Available at https://doi.org/10.1016/j.trip.2021.100364
Prochaska, J. O., & DiClemente, C. C. (1983). Stages and processes of self-change of smoking: Toward an integrative model of change. Journal of Consulting and Clinical Psychology, 51(3), 390-395. http://doi.org/10.1037/0022-006X.51.3.390
Pamidimukkala, A., Solovyev, V., Prabhakar, A., Kermanshachi, S., & Ghosh, S. (2024). Barriers and motivators to the adoption of electric vehicles. Available at https://doi.org/10.1016/j.geits.2024.100153
Ramos, É. M. S., Bergstad, C. J., & Nässén, J. (2020). Understanding daily car use: Driving habits, motives, attitudes, and norms across trip purposes. Available at: https://doi.org/10.1016/j.trf.2019.11.013 1369-8478/
Rasca, S., & Saeed, N. (2022). Exploring the factors influencing the use of public transport by commuters living in small cities and towns. Available at: https://doi.org/10.1016/j.tbs.2022.03.004
Saleh, H. N., Maupa, H., Cokki, Sadat, A. M. (2025) Factors Affecting the Intention to Buy Electric Vehicles Through Integration of Technology Acceptance Model and Prior Experience. Available at https://doi.org/10.47738/jads.v6i2.730
Xue, Y., Zhang, X., Zhang, Y., & Luo, E. (2024). Understanding the barriers to consumer purchasing of electric vehicles: The innovation resistance theory. Available at https://doi.org/10.3390/su16062420
Barriers and Motivators to the target climate behaviours
Tackling climate change depends heavily on changing human behaviour, as positive individual and collective action plays a major role in reducing harm to the environment. However, driving meaningful behaviour change in the context of climate change can be challenging. Climate-related actions can require immediate effort for long-term benefits, can feel overwhelming due to the vast scale of the crisis, and often involve changing longstanding habits/routines and social norms. Meanwhile, the negative impacts of climate change can feel distant and are easy to ignore – making it easy to postpone behaviour change. Understanding the underlying attitudes and social factors towards climate behaviours can help to bridge the gap between climate communication and climate action.
Below are the barriers and motivators found within the literature for the three separate target behaviours – installing a heat pump, buying an electric vehicle, and driving less and using public transport. Understanding the behavioural, psychological and emotional factors that drive and prohibit these climate behaviours will help us to develop communications to encourage people to take positive steps towards action.
Installing a heat pump
Barriers
Money and cost are the key barriers to retrofitting a home
Generally, it was found that many are worried about the upfront costs of making changes to their homes, while others believe that the running costs of an electric heating system will be too great (Department for BEIS, 2022; Chapman, O., Kapetaniou, C. and Gabriel, M., 2021). In a survey conducted by Nesta (2021), 52% are worried about the upfront costs and just under half of respondents (45%) said that upfront costs are more important than the running costs when considering making changes to their home (Chapman, O., Kapetaniou, C. and Gabriel, M., 2021). However, the recent rise in electricity costs compared to gas does cast some doubt for some, as to whether moving from gas to electric heat pumps would reduce bills (Chitchyan, R., 2025).
Level of hassle/disruption of building work puts people off upgrading their heating system
If people are thinking about upgrading their property, they expect it to be time-consuming and disruptive, as such the ‘hassle-factor’ and inconvenience play a significant role in the low uptake of low-carbon heating technologies (LGA & The Behaviouralist, 2022 & IPPO, 2024). The hassle-factor of installing low-carbon heating is reduced at moments of disruption, such as renovations/refurbishments in the home and moving home (Behavioural Insights Team, 2012). These moments of change have been identified as ideal opportunities to encourage heat transition (The Behavioural Insights Team, 2023).
Individuals can be put off looking into the home heating due to the hassle of having to do the research and make decisions
The effort required to research energy efficiency and green heating measures can put people off seriously thinking about upgrading their heating system (Chapman, O., Kapetaniou, C. and Gabriel, M., 2021). Additionally, a large proportion of people don’t know where to start looking into energy efficiency measures and 34% of people surveyed strongly agreed that it would take a lot of effort to research and manage the installation of new energy efficiency measures (Chapman, O., Kapetaniou, C. and Gabriel, M., 2021). As such, this can be an obstacle to making decisions about installing new heating systems (Chapman, O., Kapetaniou, C. and Gabriel, M., 2021). With this in mind, several research reports have found that most people say they would only replace their heating system when their current one breaks down or becomes difficult to maintain (Caiger-Smith, D. and Amal, A., 2020 & Department for BEIS, 2022). This poses a potential opportunity to encourage a heating change, as an individual will be primed to carry out research and look into replacing their heating system. For those who are considering installing a heat pump, a simple research process is preferred such as a website with a list of links and grant information, a ‘one stop shop’, and a checklist of key points to consider for specific improvements (Chitchyan, R., 2025).
Uncertainty whether some types of homes are suitable for a heat pump
For some, there is a general perception that it may not be possible to install a heat pump in their home (Department for BEIS, 2022; IPPO, 2024). This is a particular obstacle for flat owners, in which people in Scotland are significantly more likely to live in compared to the rest of the UK (Caiger-Smith, D. and Amal, A., 2020). In addition, a common reason cited for not installing a low-carbon heating system is a lack of space for a heat pump/water tank (Caiger-Smith, D. and Amal, A., 2020).
The familiarity of gas boilers deters some from switching to more unfamiliar technologies
The perceived benefits of gas heating, such as reliability, convenience, and ease of use, are a deterrent for switching to low-carbon heating (Chapman, O., Kapetaniou, C. and Gabriel, M., 2021). Those without low-carbon heating systems are generally concerned about the cost and performance of these unfamiliar technologies and would prefer to opt for the familiarity and convenience of a gas boiler (Caiger-Smith, D. and Amal, A., 2020).
There is some scepticism about adopting new technology and a lack of knowledge about heat pumps
Generally, recent evidence has shown that there remains a lack of knowledge and trust in heat pump technology, the installation process, and proposed benefits (E.ON, 2024). People lack understanding about how heat pumps work and some common misconceptions remain. Namely, that they take a long time to heat a home, they can only provide heating, not hot water, and cost more to run (E.ON, 2024). The importance of longevity and whether new heating systems will be ‘fit for the future’ and able to keep up and adapt to new technologies is also a concern for some (Beaglehole, J. and Patel, R., 2016). As such, there is a preference to wait and see how the technology develops over time (Beaglehole, J. and Patel, R., 2016). Additionally, there is scepticism about the supply chain being sufficiently advanced to enable installation, maintenance, and general support to consumers (ARUP & Imperial College London, 2022).
Some consider heat pumps noisy and ugly to live with
A common concern with heat pumps is around noise, including concerns about noise within the home and whether the wider community could be affected by noise pollution (Beaglehole, J. and Patel, R., 2016). It is a common perception that heat pumps are noisy and due to their size, also not that attractive to look at (The Behavioural Insights Team, 2023; Caiger-Smith, D. and Amal, A., 2020).
There is a lack of trust in reliability and independence of advice and providers
When it comes to heat pump installation, a barrier cited frequently within the literature is the inconsistent or overly complex advice, along with low trust in information sources (IPPO, 2024). A consumer survey in Scotland conducted by the Energy Saving Trust suggests that the majority of Scots (65%) do not fully trust the UK Government, Scottish Government or local councils to give impartial advice, often believing that these institutions have hidden or mixed motives (Colley, K. & Craig, T. P., 2014). Furthermore, research conducted by The Energy Saving Trust (2010), found that energy suppliers are amongst the least trusted by the Scottish public, with less than 10% of Scottish households saying they trust energy suppliers.
Motivators
Saving money is a primary motivator
Concerns about energy bills rising are a motivator for people to switch to a more energy efficient and cost-saving heating system (LGA & The Behaviouralist, 2022). Marketing efforts should focus on emphasising any economic savings, comfort benefits and environmental benefits of heat pumps, in that order (Sustainable Energy Authority of Ireland, 2020).
Financial incentives may encourage a switch to low-carbon heating
It was very apparent within much of the literature that money and cost are the main barriers for consumers to install low-carbon heating systems (Chapman, O., Kapetaniou, C. and Gabriel, M., 2021; Beaglehole, J. and Patel, R., 2016 & Colley, K. & Craig, T. P., 2014). Furthermore, upfront costs appear to be considered more important than running costs for the majority of people (Sustainable Energy Authority of Ireland, 2020). As such, incentives for people to switch to green energy (receiving subsidies and grants) can be motivating (Chapman, O., Kapetaniou, C. and Gabriel, M., 2021; Behavioural Insights Team, 2012).
Warmth and comfort are key factors when considering heating systems
Research has shown that, when choosing a heating system, people are less concerned about the long-term running costs and prioritise comfort, familiarity, and reliability (Sustainable Energy Authority of Ireland, 2020). Most consumers focus on the outcomes of a system rather than the system itself, i.e. a warm and comfortable home heated by a system that is easy to run and use (ARUP & Imperial College London, 2022). Additionally, flexibility has been cited as a key characteristic of a heating system; consumers say they want the ability to control the temperature (Beaglehole, J. and Patel, R., 2016; Energy Saving Trust, 2022; & Furtado, J., 2019).
A desire to be energy efficient/protect the environment is a driver for low-carbon heating
Many of those who have installed low-carbon heating already, have been motivated by environmental benefits in an attempt to make their home more environmentally friendly (Energy Saving Trust, 2022 & ARUP & Imperial College London, 2022). Consequently, the top motivators to install a low-carbon heating system relate to energy efficiency and the environment (Chapman, O., Kapetaniou, C. and Gabriel, M., 2021).
Low-carbon technology can improve the value of homes
Research conducted by Savills (2022) (the property firm) found that 59% said they would be willing to pay more for a home if at least 75% of a property’s energy as powered by renewable sources. Further, analysis of average values of homes transacted between 2019 and 2021 shows that newer, cleaner methods of energy have a higher price tag. The same research found that properties utilising community heating schemes demand the highest average prices, followed by homes supplied by heat pumps, and homes that use oil. Property value has been found as a motivator for switching, where 58% of landlords and 36% of homeowners would invest in a heating system that would increase the house price (Sanders, J., 2025)
Visibility of others adopting the technology can be a motivator
The uptake of unfamiliar technologies is usually relatively slow as they are perceived as complex. Carmichael (2019) suggests that peer effects and observing others using this technology or being able to test the technology before investing in it could improve public uncertainty and increase adoption (Carmichael, R., 2019). This allows for better visibility of the costs, benefits, and relative advantages for the consumers’ own home. As such, evidence has shown that peer influence in local communities can encourage more homeowners to retrofit their homes (SEAI Behavioural Economics Unit, 2020).
Buying an electric vehicle
Barriers
Expensive upfront costs make purchasing an electric vehicle unrealistic for some
EVs often have a higher purchase price than ICE vehicles, making purchasing an EV financially challenging for many. These financial barriers are felt more acutely in lower-income households (Pamidimukkala, A., et al., 2024). Interestingly, a YouGov poll found that EV hesitant high-income British consumers are even more likely than average to see the high upfront cost as a deterrent (60%) (YouGov, 2024).
The perceived lack of public charging availability and infrastructure can be a barrier
One of the most frequently cites barriers globally is the lack of, or perceived lack of, sufficiently available public charging stations for electric vehicles (EVs) (Pamidimukkala, A., Solovyev, V., Prabhakar, A., Kermanshachi, S., & Ghosh, S., 2024; Consumer Scotland., 2024). Evidence shows that this is especially apparent in less affluent areas, where infrastructure for electric vehicles is disproportionately unavailable to those living in these areas (Pamidimukkala, A., et al., 2024). Limited access to charging stations reduces public confidence in their ability to use an electric vehicle as flexibility and easily as a non-electric vehicle.
Domestic charging points are often not an option leading to higher charging expenses
The above point, re public charging points, is compounded by the fact that a large proportion of the population would theoretically have to rely on public charging points as domestic charging points are simply not an option for many. It is illegal to run a charging cable along a pavement, meaning only those with driveways or other off-street parking can use domestic charging (Stonehaven, 2025). Additionally, public charging points tend to be significantly more expensive than charging an electric car at home, making electric vehicles less feasible for those in lower socioeconomic groups. Many believe it only makes sense to own an electric car if they had access to cheaper at-home charging stations (Krishna, G., 2021; Consumer Scotland., 2024).
The perceived hassle of owning an EV – driving distance and charging times – compared to a standard petrol car
The limited driving distance of EVs is a common barrier to adoption. Compared to ICE vehicles, most EVs have a shorter driving range, which can lead to concerns or anxiety among potential consumers about the impact on their flexibility and the need to plan ahead for driving longer distances, at risk of being stranded somewhere without charge (Pamidimukkala, A., et al., 2024). In addition to this, many are put off the idea of an EV due to the length of time it takes to charge. As the process of charging an EV is more time-consuming compared to refuelling a more conventional vehicle, the hassle-factor associated with this can be a barrier to adoption (Krishna, G., 2021; Pamidimukkala, A., et al., 2024).
Some experience resistance to adopting new/unfamiliar technology or innovations
There continues to be a reliance on ICE vehicles and the familiarity with the technology. Innovation resistance theory explains the resistance some people feel around adopting new innovative products, services, and technology. People can intentionally refrain from adopting new technologies or products in order to maintain familiarity (Xue, Y., Zhang, X., Zhang, Y., & Luo, E., 2024; Saleh, H. N., Maupa, H., Cokki, Sadat, A. M., 2025). In the context of EV adoption, some of the barriers discussed above, such as concerns over driving range and charging infrastructure contribute to this feeling of discomfort around adopting the new technology.
Motivators
The availability of financial incentives and support can motivate an EV purchase
Financial incentives are one of the key motivators for EV adoption. Purchase subsidies have been found to be one of the most motivating factors for EV adoption among consumers across numerous countries. Similarly, tax reductions, such as road tax exemptions can also be a motivating factor (Pamidimukkala, A., et al., 2024; Consumer Scotland., 2024).
Many are motivated by the lower running costs of EVs
Despite the higher purchase rate, the costs of running an EV are cheaper than that of ICE vehicles. Subsequently, the lower running costs have been found to be the most popular reason for going electric, according to a YouGov poll (YouGov, 2025). The same poll also found the cost of fuel to be highly impactful in people’s decision to purchase an EV.
The reduction in air pollution by purchasing an EV is a motivator
One of the most frequently cited motivators for purchasing an EV is the environmental benefits, and reduced local emissions compared to petrol/diesel cars (Pamidimukkala, A., et al., 2024; YouGov, 2025). Consumers concerned about climate change and motivated by environmental values are more inclined to choose EVs over more conventional vehicles (Naseri, H., Waygood, E.O.D., Patterson, Z., & Wang, B. 2024).
Having access to the infrastructure needed for an EV makes the decision to purchase one more straightforward
For those with the appropriate means, situational factors such as the availability of home charging stations, off-street parking, or nearby public charging infrastructure can act as motivators (Consumer Scotland., 2024). While stability and ease of use in every-day environments increases adoption likelihood (Pamidimukkala, A., et al., 2024).
Social norms and exposure effects of knowing people with an EV can increase familiarity and normality
To overcome resistance to the unfamiliar technology, or those who are more hesitant to switch to an EV, increasing visibility or familiarity with EVs through community charging hubs or car-sharing programmes have been found to foster normalisation and uptake (Pamidimukkala, A., et al., 2024). Previous experience of driving an EV increases the likelihood of preferences for EVs (Naseri, H. et al., 2024; Saleh, H. N., Maupa, H., Cokki, Sadat, A. M., 2025). Furthermore, knowing someone with an EV, e.g. friends or family, can be a motivating factor as it increases the familiarity with the new technology. This can reduce apprehensions around some of the barriers identified such as driving range and charging time.
Driving less and switching to public transport
Barriers
Driving can be a largely habitual behaviour for some that can be challenging to break
Due to its convenience, driving can be a habitual behaviour. Using the car for routine journeys tends to be an ingrained habit that can be difficult to change, as people don’t tend to think about their routine/partly sub-conscious behaviours. Additionally, research has shown that people who use the car frequently tend to neglect alternatives modes of travel (Ramos, É. M. S., Bergstad, C. J., & Nässén, J., 2020).
The perceived low cost of a car day-to-day can be a motivator to use compared to public transport
Although people are aware that owning a vehicle is expensive, the day-to-day costs of running a car are usually absorbed into regular outgoings. As such, some feel that using a car on a daily basis feels free, especially when travelling short distances where a tank of petrol can last for a long time (Possible, 2022). The rising cost of public transport on the other hand, can be a deterrent. Research commissioned by Campaign for Better Transport found that 97% of drivers want cheaper rail fares (Campaign for Better Transport, 2023) and in a separate survey, that 71% of people said cheaper train fares would make them more likely to travel by train Campaign for Better Transport, 2025).
Public transport can be unreliable and more of a hassle to use compared to cars
Public transport can be much more unreliable, compared to other methods of transport, making using public transport less convenient and harder to rely on for many (Scottish Centre for Social Research, 2010). For example, many have experienced delays and cancellations when using the train and the timings not always convenient (Possible, 2022). Other hassle-factors involved in using public transport such as route planning where individuals need to know the stop to get off at and the timing of either the bus/train, and can also put people off, opting for the ease and familiarity of the car.
Cars can feel safer, comfortable and more convenient than public or other modes of transport
Although people are aware of the risks of driving a car, the safety of a car was especially felt after dark by women and for those with children, where public transport can feel less safe (Possible, 2022). Research has shown that women often list safety concerns as a barrier using public transport (Consumer Scotland, 2024). The convenience of a car is also a strong barrier to switching to public transport for some journeys – as distances increase, public transport becomes less convenient and more time-consuming (Rasca, S. & Saeed, N., 2022). The perceived reliability and convenience of being able to use a car whenever necessary, with little thought is a key reason people use a car over other means of travel (Possible, 2022). Overall, many feel that having a car saves them time and makes life generally easier as it allows people to predict journey times more accurately and travel whenever needed. For those with babies or young children, a car is a safe space which can be used for napping, breastfeed, and managing the logistics of travel with essential items such as prams, and changing bags (Possible, 2022). The refuge of a car can feel important, compared to busy buses or trains.
Motivators
Taking public transport can make commuting less stressful and more relaxing
For many, experiences of unsafe driving from other drivers, congestion, and unexpected diversions can make travelling by car a stressful experience (Possible, 2022). Studies have found that car commuters find their journey more stressful than any other mode of transport (Gatersleben, B. & Uzzell, D., 2007). Evidence shows that taking public transport is significantly less stressful, second only to active modes of travel (Gatersleben, B. & Uzzell, D., 2007). Taking public transport frees up time for other activities such as reading a book, working, or just relaxing. In addition, in many areas, public transport can also be the quicker option with fast-track lanes for buses and quick trains, avoiding traffic and congestion.
Owning a vehicle is more expensive overall than travelling by public transport regularly
Ultimately, owning a vehicle is expensive, and although driving can feel free on a day-to-day basis, the cost of owning a car does add up when including petrol, insurance, tax, monthly payments, parking etc. Public transport costs significantly less than owning and operating a car. Going Car Free (Possible, 2022) is a study which followed ten people who trialled going car free for three weeks without significantly changing their routine and everyday commitments. The findings suggest that public awareness needs to be raised on how comparatively expensive car ownership is, alongside societal and environmental costs of private car ownership.
People can be motivated for environmental reasons to reduce their car use and opt for public transport
Environmental concerns were not found to be a key motivator for switching to public transport. However, protecting the environment has been cited as a co-benefit to reducing car use and using public transport more frequently (Consumer Scotland, 2024). Evidence shows that the majority of Scottish consumers would like to reduce their carbon emissions by using more environmentally sustainable public transport methods, however face significant barriers to doing so, are unsure of how to do so, or are unconvinces that their behaviour changes could have an impact (Consumer Scotland, 2024).
Framing of target associated warm-up behaviours in public communications
The below observations are taken from a selection of recent public-facing communications about each of the three target behaviours. Key messages are set out for each target behaviour alongside an analysis of the tone, call to action and choice of messenger.
Themes across all three behaviours
The urgency of earlier comms has been replaced by a lighter persuasive tone that emphasises personal choice
In our 2020 analysis of communications on climate change, a major theme in the messaging from government, media and academic sources was urgency. Climate change was often framed as a “climate emergency” and parallels to the Covid-19 pandemic were used to advocate for immediate action to cut carbon emissions at scale (ClimateXChange, 2020).
The overall tone of the more recent communications reviewed as part of this paper contrasted with this. The reviewed communications typically present the benefits of target behaviours in a more neutral, factual tone. This less emotive tone lends itself to a more rational framing of choices, encouraging consumers to weigh up their options and make the right choice for them. While climate benefits are still very much part of the messaging toolkit, they are presented as one of many reasons to engage in target behaviours rather than an overriding urgent concern.
Climate benefits are often presented as a co-benefit, as communications focus on the practical or financial benefits of target behaviours at a personal level
While the reviewed communications often included messaging on climate benefits, these were not typically presented as a primary reason to engage in a target behaviour. Instead, financial and practical benefits such as cost savings, convenience, and health benefits.
Comms often seek to create a sense of changing social norms, with high emission options being “phased out” and low emission technology growing in popularity
A prevalent theme across communications for all three target behaviours was around changing social norms, with the target behaviour positioned as a future norm, in opposition to the outgoing high-emission option. This enables communications to frame behaviours which are currently the norm, such as buying an ICE vehicle ownership or gas boiler, as outdated in comparison. This tends to be supported by messaging around legislation, messaging which highlights new or improved technology associated with low-emission options, or messaging which points to increasing demand for low-emission options.
Messaging is often framed around prompting reconsideration, tackling pre-existing beliefs about the drawbacks of low carbon options, and/or highlighting the pain points associated with high emission choices
Another common communication theme across each of the target behaviours was around prompting the audience to reconsider low-emission choices. Often, this took the form of myth-busting, with messages focusing on challenging beliefs about target behaviours which could pose a barrier (such as the belief that of EVs or heat pumps were more expensive to run than fossil-fuelled equivalents). There were also some communications which focused on emphasising the pain points and disadvantages of higher-emission choices, especially private ICE vehicle ownership.
Communications observations: Installing a heat pump
Communications around heat pumps tended to include basic educational information in order to improve awareness and understanding of how the systems work. The messaging tended to be focused on mitigating financial and practical barriers, and on enhancing the appeal of motivators such as financial support and reliable performance.
Barriers addressed by communications
Lack of consumer understanding about heat pumps (e.g. air source vs ground source, suitability for climate)
Up-front cost of installation is high
Gas boilers may still be cheaper to run due to electricity prices
Process (determining whether a heat pump is the right option, applying for grants, additional home upgrades may be needed) seems long and complex
Motivators addressed by communications
Financial support is available from the government to help with installation costs
Heat pumps have very high rates of customer satisfaction
With the right tariff, heat pumps can be cheaper to run than fossil-fuelled systems
Some heat pump manufacturers can handle the whole process from start to finish
Heat pumps are very energy-efficient, and have no direct carbon emissions
Communications on heat pumps are still looking to educate the public on the basics of the technology
Communications from government (UK Government, 2025), manufacturers (Octopus Energy, 2025) and consumer advice organisations (Money Saving Expert, 2025) were often presented as a primer or beginner’s guide. In addition to highlighting the benefits, information online often opened by offering a basic explanation of the technology, including types of heat pump system, how they work, and why they are considered to be a more climate-friendly option. An element of myth-busting is often present, challenging misinformation which makes heat pumps seem less attractive. For example, the belief that they are unsuitable for winter weather in Scotland.
In comparison to communications about electric vehicles, which tended to assume more knowledge on the part of the audience, this indicates that educating potential owners is still a priority for these information sources. Often, interactive tools were presented as part of this, as a way to simplify the process of learning whether a heat pump would be suitable for the audience’s home.
Financial support from government remains a key message to promote heat pumps
One of the core messages which was used to promote heat pumps across all reviewed sources was the availability of significant support from the UK and/or Scottish government, in the form of grants or interest-free loans. Eligibility for these financial incentives is often presented as a key factor to consider when exploring whether to install a heat pump at home, and as a major benefit to acting on an intention to install. This messaging is often framed as a counter to the high up-front costs of installation, which can otherwise be a barrier to further action.
A recent national news article from the BBC explicitly linked the UK Boiler Upgrade Scheme (BUS) to a large increase in demand for heat pumps nationwide (BBC, 2025). This also enabled the story to present heat pumps as a potential future norm, with demand increasing year on year.
Figure 17: BBC News article headline highlighting high uptake of the UK Government heat pump grant
Messaging around cost savings is prevalent, with pro-heat pump sources re-framing this as including maintenance
The other main financial incentive presented in communications is around running costs. While some sources acknowledge that current energy prices mean utility savings potential may be limited, messaging on the benefits of heat pumps often highlights potential for savings versus older and less efficient systems.
Consumer information provider Money Saving Expert created web content encouraging readers to compare the cost of running a heat pump against a range of other options, highlighting that older models of boiler and other heat sources like electric storage heaters, LPG and oil boilers may be more expensive to run (Money Saving Expert, 2025).
Switching to a heat pump is often presented as a high involvement decision in communications
Communications on heat pumps tend to present the decision to switch to a heat pump as a highly involved process which requires multiple factors to be weighed up. The key factors mentioned are typically suitability of the building itself, the type of heating system currently installed, age and specifications of radiators and water tanks, and eligibility for funding support.
Online content often features quizzes, checklists or interactive tools intended to streamline this process. These online tools are a warm-up behaviour which features frequently as a call to action. (UK Government, 2025)
Figure 18: gov.uk heat pump suitability checker
One large UK manufacturer has made reducing the administrative burden of heat transition a key part of their messaging.
The energy supplier Octopus has recently entered the heat pump market with an “all in one” product/service offer (Octopus Energy, 2025). A prominent message in their promotional communications has been around the lack of third-party involvement in the process, with the manufacturer providing survey, design, installation and also offering to apply for funding support on behalf of the customer. This core communications proposition may be worth exploring further with research participants as the time cost of the decision-making and administrative process involved in getting a heat pump has been identified as a potential barrier.
Some communications are making use of “real people” as messengers, inviting their audience to hear from lived experience
Figure 19: Octopus Energy promotional communications
Both the UK government and Nesta have opted to use people who already own a heat pump as messengers for some of their communications. The UK Government’s energy efficient home campaign features video and text-based testimonials from heat pump owners with different housing types and lifestyles speaking about how they made their decision and speaking positively about the installation process and experience of living with the new system (UK Government 2025a). Nesta have taken a more grassroots approach to peer messengers, setting up a service which connects people considering a heat pump with nearby people who already have one (Nesta 2025). This enables local people to act as champions for heat pump systems.
Figure 20: Nesta heat pump visit process
Both of these approaches help to build a sense of social norm, by making the behaviour more visible to those who are considering it. Visiting in person, or seeing video content of homes with heat pumps, is aimed at boosting familiarity with the technology to enhance motivation.
Narratives around consumer satisfaction are being highlighted to emphasise the positives
Data from heat pump owners has suggested higher rates of consumer satisfaction in comparison to gas boilers (MCS Foundation, 2025). This has enabled a narrative around consumer satisfaction to be presented in communications, such as the UK Government’s “Warm and fuzzy” campaign (UK Government, 2025). This narrative combines benefits such as reliability, cost savings and low emissions to present heat pumps as an attractive option.
Climate benefits of heat pumps are often de-emphasised in communications
While reduced emissions versus older fossil-fuelled systems are still frequently mentioned across reviewed sources, this is seldom presented as the core benefit of installing a heat pump. Instead, more practical, individual benefits such as cost savings, financial support, and reliable heat generation tend to be highlighted as key messages. Overall, this feeds into the wider framing of heat pump installation as an involved, rational decision which requires a range of factors to be considered, rather than a more emotional choice based on the urgent need for climate action.
Calls to action
The calls to action for heat pump communications tended to focus on warm-up behaviours, typically those linked to information gathering rather than more practical actions such as booking a survey visit.
Explore financial incentives like grants and interest-free loans from the government
Use an online quiz to find out how much it could cost to install a heat pump in your home
Find a local tradesperson who can give you an installation quote
Find out if your home is ready for a heat pump, or if other steps (like insulation or radiator upgrades) need to be taken first
Use a service that lets you arrange a visit with someone near you who has a heat pump to ask questions first-hand
Compare energy tariffs to see whether switching away from gas could save you money
Watch video content of people who own a heat pump to see what their experience was like
Communications observations: Buying an electric vehicle
Electric vehicle communications tended to position EVs as modern and innovative. Messaging often sought to address barriers which were linked to the performance of older models (such as the perception of limited range), and to present EVs as a “norm in waiting” that was rapidly replacing ICE vehicles.
Barriers addressed by communications
EVs still perceived as an expensive luxury item
Range of EVs can be seen as too short for people who drive longer distances, or who commute every day
Charging infrastructure for EVs is still developing
Motivators addressed by communications
EVs are quiet and offer a great driving experience
EVs are modern and innovative
Many EVs come with extra entertainment and safety features
With the right electricity tariff, home charging can be cheaper than running a petrol/diesel car
Financial support is available from the government and industry to subsidise home charging
Some makes and models of EVs are now available at similar prices to a new ICE car
Some manufacturers are re-framing EVs as an affordable choice, rather than a luxury product
While luxury is still a prevalent theme in some promotional campaigns for EVs, it is typically associated with products at a higher price point, such as Tesla. However, some manufacturers who are more recent entries to the UK market appear keen to make value for money a key part of their proposition. MG launched a mid-sized fully electric SUV in 2022 with a campaign which presented their product as affordable and accessible, while still emphasising modern technology and features (M3 Agency, 2022). The campaign was built around the idea that “Electric is for everyone” with messaging which highlighted the price point, range, and features such as wireless phone charging. Similarly, Dacia’s communications promoting the Dacia Spring describe it as “Europe’s most affordable new electric car” (Dacia UK, 2024)
Figure 21: Advert for a new MG Electric Vehicle
Figure 22: Which? EV quiz results (2025)
Pro-EV sources are keen to challenge the belief that limited range is still a problem
The improved range of current-generation EVs is a prevalent theme in promotional communications from manufacturers and consumer organisations. Communications tend to mention the range a car can cover on a single charge. Often, prospective buyers are encouraged to consider their daily or weekly driving habits, with the message that an EV will often be able to cover a typical week of driving with a single battery charge.
An example from Energy Saving Trust, an organisation focused on supporting energy efficient decisions to reduce emissions, uses an interactive online quiz to help potential EV owners to consider key factors before making a purchase. The quiz offers tailored messaging to users. Even if the largest possible values for weekday (over 25 miles per day) and weekend (over 200 miles) driving distance are input, the message is still that modern EVs have sufficient range to be a good fit (Energy Saving Trust, 2025)
Framing EVs as an incoming norm is a common promotional message
Manufacturer communications often frame EVs as being innovative and technologically advanced. Often, this is part of a wider framing which positions EVs as a new norm which is replacing the existing norm of ICE vehicles. Online promotional communications from the EV manufacturer Cupra frequently emphasise the growth of the electric car sector (Cupra UK 2025). The technology behind the vehicles is described as constantly improving, alongside the associated infrastructure.
Comparing maintenance costs between ICE and EVs is often positioned as a factor in decision-making
Pro-EV sources often make the claim that due to the reduced number of moving parts, EVs are often cheaper to maintain and repair than their ICE counterparts (Volkswagen Ireland 2025). While more neutral sources such as consumer organisations have questioned this claim, the overall effect is to encourage potential EV owners to consider the difference in maintenance needs versus an ICE car (Which?, 2025).
Communication on EVs often focuses on availability of charging infrastructure as key to making a purchase decision
Another key factor which is commonly presented as an essential part of the decision between EVs, and other options is access to charging infrastructure. Consumer guide Which? published an FAQ-style online guide for people who were considering purchasing an EV. The guide recommends charging at home or at work, if possible, due to the convenience and potential cost savings, and points out that relying on public charging points may be costlier than refuelling a petrol-powered car.
EV manufacturers such as Volkswagen also tend to present charging infrastructure as an important consideration. The landing page for EVs made by Volkswagen in Ireland offers a digital route planner tool which allows potential customers to visualise the availability of charging points on familiar journeys (Volkswagen Ireland, 2025). This tool helps to increase perceived behavioural control by enabling users to plan out how an EV would fit into their lifestyle before committing further.
Quiet/smooth running is positioned as a key advantage over ICE vehicles
EV manufacturers often highlight the fact EVs offer a less noisy or “smoother” driving experience in comparison to ICE vehicles, due to the lack of engine noise and automatic transmission (Cupra UK, 2025) (Tesla, 2025).
Figure 23: Description of EVs being smoother and quieter than traditional vehicles
Some communications are making use of “real people” as messengers, inviting their audience to hear from lived experience
Some EV manufacturers make use of a more authentic messenger by using real customers as spokespeople. Volkswagen UK’s “Your Volkswagen Stories” is an interactive online promotional campaign which features 14 video case studies from UK customers who chose an EV (Volkswagen UK, 2025). The choice of messenger reflects a diverse mix of lifestyles and stages (such as families with multiple children or a retired couple).
The campaign often includes a narrative of sceptical people being pleasantly surprised by the performance and overall driving experience of owning an EV. One example features an older couple based in Argyll and focuses on reliability and range as key selling points, for people travelling to and from rural areas. This framing enables EVs to be presented as a credible solution for a variety of audience segments who may be less likely to consider one.
Figure 24: An example of Volkswagen UK’s “Your Volkswagen Stories”
Climate benefits of EV ownership are often de-emphasised in communications
While communications about EVs frequently mention climate benefits such as zero direct carbon emissions, these are typically presented as a co-benefit, with performance, range, running costs, reliability and extra features more likely to be the primary focus of persuasive messaging. Often “above the line” communications such as advertising omit climate change messaging altogether. TV/digital advertising for Tesla (2025) and MG (2022) neglected to mention emissions or climate benefits entirely, positioning their products as a sensible choice for consumers rather than an environmental necessity.
Calls to action
EV manufacturers tended to focus on booking test drives or planning behaviours (such as interactive maps of charging stations). Consumer information sources were more likely to signpost to further information instead, or to direct the audience to interactive tools to guide them through the decision-making process.
Book a test drive of an EV
Take an interactive quiz to see if an EV is right for you
Use an online route planner to explore charging stations along your typical driving routes
Explore different models and specifications of EV to see which works best for you
Use a calculator tool to see whether an EV would be cheaper to run than an ICE vehicle
Explore financial incentives, like salary sacrifice schemes or grants to install home charging
Watch video content of people who own an EV to see what their experience was like
Communications observations: driving less and using public transport
Communications looking to encourage less driving and greater uptake of alternatives like public transport often focused on re-framing driving. Existing beliefs about the convenience and freedom of private car use are challenged, while communications also highlight practical advantages of alternatives.
Barriers addressed by communications
Private car use is perceived as offering personal freedom compared to sharing space on public transport
Private car use can be convenient as it enables door-to-door travel
Some people may not be able to access public transport easily
Driving may be quicker than alternatives
Public transport may be seen as cheaper than fuel costs for driving, especially on a journey-by-journey basis
Motivators addressed by communications
When maintenance, parking and fuel are factored in, public transport is often cheaper than driving over a longer period of time
As a passenger on public transport, you have free time to do whatever you like, instead of focusing on driving
Public transport can get passengers straight into town and city centres quickly and efficiently
Using public transport avoids the stresses associated with driving, like aggressive drivers and traffic jams
Multi-modal transport can help reduce the amount you drive and reduce geographic barriers
Active travel instead of driving has health and wellbeing benefits
Messaging often sought to challenge the belief that private car travel offers more personal freedom than public transport
A common theme in public transport promotional communications is around deconstructing the belief that travelling in a private car allows more personal freedom than shared travel options. Messaging may point out how certain aspects of private car travel which can limit personal freedom (such as having to concentrate on driving for the entire journey or having to find and pay for parking) have been normalised. The audience is prompted to consider whether an option such as bus or train travel could give them more control over how they choose to spend their journey.
Rail operators such as ScotRail (2025) and LNER (2024) have both focused on “freedom” as a theme in recent advertising campaigns targeting both commuters and leisure travellers. Both campaigns highlight the ways rail travellers can choose to use their journey time for work or leisure.
Figure 25: FirstBus #CarFree campaign materials
FirstBus (2024) ran a multimedia campaign in Glasgow which challenged the normalisation of private car travel with a creative concept based on a support group for “car addicts”. The campaign used humour to highlight the normalisation of negative aspects of driving, including expensive parking, road rage and high carbon emissions.
Messaging on cost encouraged drivers to consider wider costs of car ownership and longer periods of time
Public transport campaigns encouraged consumers to consider the savings offered by public transport over multiple journeys. ScotRail (2025) highlighted multi-journey savings, while FirstBus (2024) encouraged their audience to factor in other costs of driving, such as repairs, maintenance and parking, when comparing with public transport.
Figure 26: LNER promotional comms to choose the train
Public transport was often presented as a convenient option with direct access to city centres
Another frequent core communications proposition which enables public transport to be compared favourably to private car travel was convenience. Rail and bus operators highlight the frequency of services on major routes and the option to travel directly to town centres as an advantage (LNER, 2024) over both private car travel and flying.
Highlighting the stress of driving was a common message aimed at commuters
Related to the idea of challenging the perceived freedom of private car travel, this core communications proposition was focused more on the stresses of modern driving. Traffic delays and stressful encounters with other motorists are highlighted, with public transport presented as an alternative free from these issues. It encourages reflection on the stresses of driving and potentially primes the audience to consider a switch away from private car travel in future moments of stress. This core communications proposition featured in the ScotRail (2025), LNER (2024) and FirstBus (2024) campaigns.
Active travel is promoted as an alternative to driving with additional health and wellbeing benefits
Choosing to walk, wheel or cycle instead of driving is frequently promoted using a health and wellbeing framing. Messaging focuses on the benefits of fitting in more physical activity to overall health as well as mood and mental health. Campaigns such as Transform Scotland’s “A Wee Walk Works Wonders” (Transform Scotland, 2024) often incorporate this type of health and wellbeing framing, alongside messaging around saving money and reducing emissions.
Evaluation of the campaign found that the messages which highlighted health benefits and the fact that only a brief walk can make an impact were more memorable to audiences. Just over 6 in 10 (63%) of evaluation respondents spontaneously remembered the health and wellbeing message, whereas around 1 in 10 (11%) remembered the messaging around benefits to the climate (JRS, 2024)
Digital meetings are sometimes framed as an alternative to driving, which could prompt resistance to other target behaviours
Communications created by the Energy Saving Trust presents public transport and active travel as part of a hierarchy, with air travel and ICE vehicle travel as the most environmentally harmful (Energy Saving Trust, 2024). This notably includes digital communication (e.g. video calling) and presents this as being the least impactful option on the climate.
Figure 27: Active travel hierarchy from the Energy Savings Trust
While the overall narrative supports public transport and active travel as sustainable choices, and their online content highlights benefits of both, the idea that digital communication is also an alternative to travelling in person could potentially lead to online meetings or similar being viewed as competition to the target behaviour.
Multi-modal transport is presented as a way to reduce emissions, save money and fit in additional exercise
Another messaging theme which can reduce perceived barriers to driving less is multi-modal transport (such as park and ride schemes). Messaging encourages people who usually drive to explore ways to combine public transport, active travel and private car travel in order to reduce the amount of time they spend driving in favour of other options (Energy Saving Trust, 2024). This is presented as a way to mitigate geographic barriers (e.g. lack of access to public transport) as well as an option for those looking to try active travel without committing to long distances walking, wheeling or cycling.
Calls to action
Communications promoting public transport as an alternative to private car travel were often more direct in their calls to action than EV or heat pump communications. Frequently the main call to action was simply to try using public transport.
Try taking the train for leisure travel as well as commuting (or vice versa)
Use a route planner to find out how easy it could be to get to work with alternate transport
Compare pricing to find out whether public transport would be cheaper than driving (and parking) every day in a private car
Consider what you might be able to do with the free time on your commute if you went by public transport instead
– Hypotheses – message themes/territories
The following tables contain the list of hypotheses associated with each of the three behaviour sets. Each theme represents a particular message or idea intended to prompt consideration or warm-up action on the overarching target behaviour. These were developed from the desk research findings (see Appendix A). They served as a checklist to ensure media examples being considered for use in stimulus covered a broad range of themes and messages, and were also used to underpin development of the discussion guides and homework tasks.
Heat Pump
Messages /comms themes FOR Getting a Heat Pump
Saving money on heating bills
Financial incentives/ grants to switch to low-carbon heating
Quality of warmth and comfort from a heat pump
Reliability of heat pumps
Energy efficiency- protecting the environment through low-carbon heating
Low-carbon technology can improve the value of homes
Seeing that heat pumps are becoming more popular
Expecting gas heating to be phased out over the next few years
Installers can take care of all necessary work- making it easy to get a heat pump
There are benefits for the environment
Messages /comms themes AGAINST Getting a Heat Pump
Money and cost of the installation and retrofitting a home
Hassle/disruption of building work required
The hassle of having to do the research and make decisions
Being unsure if your home would be suitable for a heat pump
The familiarity of gas boilers over unfamiliar heat pumps- just don’t know enough about heat pumps
Scepticism about adopting new technology and whether it will work as advertised
Concerns about heat pumps being noisy and ugly
Lack of trust in reliability and independence of advice and providers
Concerns about the running costs compared to gas boilers
Electric vehicles
Messages /comms themes FOR Getting an Electric Vehicle
Financial incentives and support to buy an EV
The lower running and maintenance costs of EVs
Costs of EVs are coming down
The reduction in air pollution and helps the environment
Having clear access to the infrastructure needed for an EV
The range of EVs has improved a lot in recent years
Seeing that more and more people are getting EVs
Expecting petrol and diesel cars to be phased out over the next few years
Messages /comms themes AGAINST Getting an Electric vehicle
Expensive upfront costs
Lack of public charging availability
Domestic charging points are often not an option leading to higher charging expenses
Hassle of owning an EV – driving distance and charging times – compared to a standard petrol car
Nervousness about unfamiliar technology
Public Transport More Car Less
Messages /comms themes FOR Using Public Transport more and Your Car Less
Taking public transport can make travel (esp. in busy times) less stressful and more relaxing
Being able to make use of your journey time instead of having to concentrate on driving
With modern apps it is easier to plan journeys through public transport than ever
Scrapping of peak fares making rail travel cheaper at key times for commuting
Owning a vehicle is more expensive overall than travelling by public transport regularly
Environmental reasons to reduce car use
Messages /comms themes AGAINST Using Public Transport more and Your Car Less
Difficulty of breaking the habit of using the car- as car is part of daily routine
Low cost of a car day-to-day
Justifying the upfront cost of a car by using it
Unreliability of public transport
Hassle of using public transport compared to cars
Cars feel more comfortable and more convenient than public transport
– Methodology
ClimateXChange commissioned JRS to undertake this research. The work was split into four sequential phases:
Desk Research – reviewing existing evidence and communications encouraging people to take steps towards installing a heat pump, buying an EV, and/or using public transport more and driving less. This phase of the research was not conducted as a full academic literature review. It was a rapid evidence review that served to identify existing literature, evidence, and media and communications examples which could form the basis of the primary research. Particular focus was placed on:
Key barriers and motivating factors related to the key climate actions identified to prompt positive climate behaviours within similar audiences
Behavioural theories that help us to explain inaction to climate change and how these can be used to prompt change
The effect of different communications, i.e. what works and does not work to motivate positive climate action, looking at message framing and content
The resources were identified through discussion with the steering group and independent online searches. Online searches utilised Google Scholar for academic literature, and Google Search for media and messaging examples. The research team also had access to an existing bank of background materials accumulated over prior projects relating to communicating on climate change, and selected some sources for review directly from this. Scholar searches employed a range of climate change focussed search keywords/phrases including: ‘climate communications’, ‘climate action’, ‘intention-action gap’, ‘pluralistic ignorance’, ‘climate behaviours’, ‘climate action communication campaigns’, ‘climate action tipping points / moments of change’. Resources were drawn from current and recent (mostly from 2020 onwards) national and local Government publications and communications, research from academia, communications from third sector organisations, UK media articles, and communications / promotional material from organisations within the energy, car and transport industries.
An analysis framework was drawn up to identify key insights in relation to climate communication, messaging and framing and its impact on prompting people to take warm-up behaviours as the first steps toward larger changes in how they heat their homes and travel. The framework was populated using the following process:
Search conducted Google Scholar using selected keywords for academic sources. Compiled initial long list of media and communications examples using Google Search.
Supplementary sources were added from the research team’s existing bank of literature
Abstract and conclusions from each academic source were reviewed to filter out less relevant sources
Remaining academic sources were reviewed in depth to produce the final selection of 21
Final media and communications examples were selected based on relevance to insight from the selected academic sources
The findings were used to develop and refine a set of hypotheses about the potential effect of a range of message territories associated with of the core behavioural areas of focus. These provided a foundation for testing with research participants in the primary research (see Appendix A)
Qualitative research – to better understand consumer attitudes, beliefs and behaviours around the three target area behaviours and how communications can help encourage people to undertake warm-up actions / steps towards these target behaviours. A total of 6 online 90-minute group discussions took place, attended by 30 participants.
In the discussion groups, participants were asked to reflect on a range of past and current communications related to the three target behaviours, their attitudes towards these actions, what and where their moments of change would be for undertaking next steps/warm-up behaviours and the potential impact/efficacy of the hypotheses/ message territories developed from the desk research.
Sample
The sample focussed on people who agree that it is important to take climate action; are willing to take more action than they currently do; and state that money or other practical barriers do not present a meaningful barrier to them taking more action.
Specifically, the groups were set up to ensure that all respondents:
Had not seriously undertaken any of the core warm up behaviours in relation to one of the three core behaviours (installing a heat pump, buying an EV, and/or using public transport more and driving less)
In each group, had not seriously undertaken any of the core warm up behaviours in relation to at least one of the other two core behaviours
In this context, warm-up behaviours include:
Talking to friends/family/colleagues about the behaviour and or campaigns in relation to the relevant behaviour
Visiting relevant websites or comparison tools – either to take the relevant action or to determine if there is financial support available through government schemes in relation to the relevant behaviour
Doing further research on the topic of the relevant behaviour
Taking any other concrete steps towards the shift in behaviour
In addition to these behavioural aspects, the sample considered a mix of age, ethnicity, lifestage and urban versus rural living.
Group 1 – Heat pump
male/female mix
younger- 25-49yrs (pre kids/pre-teen kids only)
all to qualify for heat pump discussion
and to qualify for at least one of EV or drive less discussions
Group 2 – Heat pump
male/female mix
older- 50-75yrs (teen or older kids/no kids/empty nester)
all to qualify for heat pump discussion
and to qualify for at least one of EV or drive less discussions
Group 3 – EV
male/female mix
younger- 25-49yrs (pre kids/pre-teen kids only)
all to qualify for EV discussion
and to qualify for at least one of heat pump or drive less discussions
Group 4 – EV
male/female mix
older- 50-75yrs (teen or older kids/no kids/empty nester)
all to qualify for EV discussion
and to qualify for at least one of heat pump or drive less discussions
Group 5 – Drive less/public transport more
male/female mix
younger- 25-49yrs (pre kids/pre-teen kids only)
all to qualify for drive less/pt more discussion
and to qualify for at least one of heat pump or EV discussions
Group 6 – Drive less/public transport more
male/female mix
older- 50-75yrs (teen or older kids/no kids/empty nester)
all to qualify for drive less/pt more discussion
and to qualify for at least one of heat pump or EV discussions
Inclusiveness across sample:
recruited from across Scotland- urban and rural (note- it is unlikely that the very rural parts of Scotland will be represented much)
include target 5 me respondents
A two-part homework task
Research participants from phase 2 were asked to:
Reflect and think about what they’d been shown and discussed in the focus groups and how that made them think about the target and warm-up behaviours
Each group of participants were asked via an online survey -to reflect over a three-day period about the core behaviour sets/behaviours they had been discussing in their focus groups then fill out questions to probe their subsequent interest, desire, and motivation towards undertaking any next steps / warm up behaviours. The idea was that this would encourage respondents to stay at the moments of change created within the group discussions and to deeply consider relevant motivations and barriers at societal/collective; practical/rational; and individual emotional levels.
Then, a week after the first task, respondents were asked to consider taking warm-up actions for two behaviour sets – again via an online survey – and record their experience and thoughts on:
what they might/would do as a result of these actions
the associated communications and information encountered as part of the warm up actions
other communication examples encouraging warm up/key behaviour actions.
This homework task was designed to probe the role and potential impact/ efficacy of communications / communication elements.
In depth – 60 minute online – interviews with each of the research participants
These probed in detail their reflections on the whole research process – on what works and what does not work in climate communications and other relevant marketing in connection with each behaviour and associated warm-up actions. The discussions looked specifically at messaging content and framing; tone, style, and imagery; and who are relevant, credible and trusted messengers.
There were 27 people who participated in the homework and depth interviews:
Analysis
Client discussion and the findings from the desk review were used to develop:
A set of hypotheses for each of the three core behavioural areas of focus. Each hypothesis consisted of a statement about the potential for a particular message or proposition to prompt contemplation or action
The required discussion/topic guides, homework tasks and supporting stimulus material.
As each research phase progressed and moved to the next, the JRS research team followed a staged approach to analysis, with each moderator reviewing and analysing their own groups before coming together to discuss and synthesise findings.
How was ‘data’ gathered from participant reflections analysed?
At both stages of homework, participants’ notes were returned to JRS via an online survey platform, using WhatsApp or email
These were then distributed to the relevant researcher who undertook the final stage depth interview with the participant
From this, the individual JRS researchers supplemented their version of the hypotheses grid with insights gathered through the homework.
The JRS research team then came together to share their learnings from the initial group discussions and the homework exercise. The central hypotheses grid was then updated by the project lead, with all insights gathered.
This updated hypotheses grid was shared with the client team to provide the starting point for development of the topic guide and stimulus materials for use in the final stage of the primary research (depth interviews).
Use of Behavioural Theory
Throughout the research process we used behavioural theory to help us reflect on and analyse our findings. We used the:
Stages of Change Model (Prochaska & DiClemente, 1983) to help us think about where participants were on their journey to adopt a behaviour / undertake a warm-up action.
Theory of Planned Behaviour (Ajzen, I., 1991) to understand how different potential communications and messaging would affect participant attitudes, subjective norm and perceived behavioural norms and therefore their intention / likelihood to adopt a behaviour / undertake a warm-up action.
See Appendix D for a full explanation.
Research limitations
In the desk review, observations and insight were drawn from 21 resources. This was a short exercise to find and review relevant communications encouraging people to take steps towards installing a heat pump, buying an EV, and/or using public transport more and driving less. It was not a full literature review on the topic in question.
The qualitative methods delivered in the primary research offered in-depth insight into how individuals think and feel climate change actions and the role/impact of messaging and communications but with a sample of 30 participants it cannot tell us how many other people in the population feel or think in these ways.
Also, we were aware and recognised in running the follow-up depths and subsequent analysis that for the homework tasks the fact that the whole research exercise was about considering a range of warm-up behaviours will have influenced participant behaviours to a degree i.e. encountered the Hawthorne effect.
All the research adhered to UK GDPR legislation and the Market Research Society Code of Conduct.
– Use of behavioural theory
Stage of Change Model – A model for mapping behaviour change as a process
The Stages of Change Model (Prochaska & DiClemente, 1983), also known as the Transtheoretical Model, describes stages of behaviour change including: Pre-contemplation (not ready to change), Contemplation (considering change), Preparation (planning to change), Action (making changes), Maintenance (sustaining change), and Termination (no longer tempted). This model recognises that change is a process, not an event, and different strategies are effective at each stage.
In our research:
This proved to be useful in thinking about where people were at in terms of adopting a behaviour / undertaking warm up actions
Often, respondents were at the pre-contemplation stage, where they don’t see a need to do anything differently
The Action stage would be getting a heat pump, EV or changing your travel habits to drive less
Figure 28: The Stages of Change Model (Prochaska & DiClemente, 1983)
Preparation is where the warm-up behaviours take place
For the purposes of this project, we focussed on the first three stages in particular.
Theory of Planned behaviour – How we unpicked the impact of communications on intention and action
The theory of planned behaviour (Ajzen, I., 1991), outlines three key variables that affect people’s attitude-behaviour relationship:
The attitude toward the behaviour (the stronger the better)
Subjective norms (the support of those we value)
Perceived behavioural control (the extent to which we believe we can actually perform the behaviour).
These three factors jointly predict our intention to perform the behaviour, which in turn predicts our actual behaviour.
In our research:
For each communications hypothesis/theme, we looked at how these affected:
Attitudes and beliefs about the primary behaviour (Heat pumps/EVs/drive less)
Subjective norms associated with the primary behaviour
Perceived behavioural control
Challenging negative attitudes and building positive ones was a recurring theme throughout
Subjective norms are crucial. This was where pluralistic ignorance applied – where people believe others not to be taking action at scale
Notably, although we recruited participants based on the absence of practical/financial barriers, perceived behavioural control was often lower.
Figure 29: The theory of planned behaviour (Ajzen, I., 1991)
How to cite this publication:
Morton, C; Cuthbert, M; Fraser, L; Howick, M; Mowat, C. (2025) ‘Bridging the gap between climate concern and climate action’, ClimateXChange. DOI https://doi.org/10.7488/era/6842
While every effort is made to ensure the information in this report is accurate as at the date of the report, no legal responsibility is accepted for any errors, omissions or misleading statements. The views expressed represent those of the author(s), and do not necessarily represent those of the host institutions or funders.
This work was supported by the Rural and Environment Science and Analytical Services Division of the Scottish Government (CoE – CXC).
This source was not specifically referred to by participants. It has been selected as an illustrative example of the type of media coverage which was discussed by focus group participants. ↑
Quote labels reference participant gender, socio economic classification and age bracket. ↑
Community benefits are additional benefits offered by renewable energy developers to support communities. Examples include community benefit funds and in-kind benefits provided by developers such as investment in local infrastructure improvements or funding for education programmes. Community benefits currently operate on a voluntary basis in Scotland. The Scottish Government has published Good Practice Principles for onshore and offshore energy in Scotland, which are currently under review.
Within the context of that overarching review, the primary aims of this research were:
To understand how different renewable energy technologies affect the provision of community benefits. This included developing and testing a socio-economic analysis framework to understand the factors that influence the nature and level of community benefits associated with different renewable energy technologies.
To understand how mandating community benefits could work in practice for onshore renewable energy technologies.
To help identify any necessary adjustments to Scotland’s current voluntary community benefits approach for onshore and offshore to better support communities and industry as part of a just transition.
The study methodology incorporated an evidence review, qualitative interviews, and the design and testing of a socio-economic analysis framework. This research focused on the factors influencing how different renewable energy technologies affect developers’ provision of community benefits, rather than on the experiences and perspectives of recipient communities. Interviews were therefore conducted with renewable energy developers.
The Scottish Government is gathering other non-industry perspectives on community benefits, including the views of community members, through a public consultation on the Good Practice Principles.
Understanding the ability of different technologies to offer community benefits
One of the ways this research explored how renewable energy technologies affected developers’ ability to offer community benefits was to develop and test a socio-economic analysis framework. This framework set out the parameters assumed to influence the level and nature of community benefits. An initial set of seven draft parameters were developed by the Scottish Government and the research team. Following an assessment of the feasibility of measurement and feedback from renewable energy developers, four parameters were recommended for further consideration (and which are subsequently referred to as “the framework”). These were:
Technology maturity (i.e. more mature technologies, with well-established supply chains and business models, may better allow developers to build community benefit provision into their project plans compared to newer technologies).
Market maturity (i.e. maturity may influence investor confidence, competition between developers, and certainty in supply chains which may in turn determine predictability of financial plans and therefore ability to deliver community benefits).
Deployment and operating costs (i.e. the costs associated with developing and operating different renewable energy technologies may impact the financial capacity to provide community benefits).
Revenue and profit (i.e. a project’s revenue and profit will impact on its overall financial viability which may impact on its ability to delivery community benefits).
This study identified significant challenges in developing a single framework to assess how different technologies affect developers’ provision of community benefit. For such a framework to work as a practical, decision-making tool, quantitative data on the economics of different renewable energy technology projects would be required. However, existing public data is sparse and of inadequate quality and many developers were unable or unwilling to share commercially sensitive data about their projects. A further limitation was that existing data (e.g. on the value of community benefits from individual renewable energy projects) is based on actual provision rather than an assessment of potential. Additionally, data available is largely historical and therefore challenging to use when anticipating new technologies and emerging economic and regulatory models.
However, it was clear from interviews with developers that the financial aspects of a renewable energy project (costs, revenue and financial viability) were key factors impacting community benefit levels. They noted that projects with higher amounts of revenue, and more robust and predictable financial returns are better positioned to offer significant community benefits. Conversely, if the financial viability of a development is low, then it is unlikely it can offer monetary community benefits without the project becoming non-viable. Developers noted that both technology maturity and market maturity can have an impact on a project’s financial viability and are therefore, indirectly, also linked to a project’s ability to deliver community benefits. However, this was based on qualitative interviews and was not possible to measure using quantitative data.
Developers also reported that it is easier to offer community benefits for projects involving more established technologies like onshore wind, compared to newer technologies, due to the latter’s comparatively lower profit margins. Less mature technologies (e.g., floating offshore wind, hydrogen) can have higher risks, higher delivery costs, less predictability in cost and performance, and lower investor confidence which can impact on their ability to offer benefits.
Although not necessarily directly impacting the level of benefit offered, developers identified community engagement as key factor for effective delivery. Developers emphasised the importance of levels of community engagement and capacity to effectively manage and deliver benefit funds. Interviewees highlighted the importance of community engagement, consultation and feedback in moulding community benefit initiatives, ensuring more meaningful and tailored contributions. This is difficult to quantify and would therefore be challenging to include in a socio-economic analysis framework.
How mandating community benefits could work in practice (for onshore renewable technologies)
The available literature does not enable a comparison of the real-world impacts of mandatory, as opposed to voluntary, provision of community benefits. Mandatory community benefits as part of renewable energy infrastructure development exist in Denmark and Ireland, specifically for wind projects. However, the literature reviewed does not allow for a satisfactory comparative analysis of the in-practice impacts of mandatory versus voluntary approaches.
Existing onshore developers felt that the following factors should be considered:
clear guidance on what the financial expectation attached to mandating is to avoid any potential for confusion;
allowing for the differences between individual onshore technologies to be taken into account;
retaining a degree of flexibility, particularly in terms of allowing for community benefits to be designed around the needs of communities;
avoiding overly burdensome processes. For example, in relation to restrictions on how communities should spend the money.
The power to mandate community benefits is reserved to the UK Government. In May 2025, the UK Government published a working paper seeking views on a mandatory community benefits scheme for low carbon energy and mechanisms for shared ownership of onshore renewables[1]. This includes the option to utilise existing powers to mandate offering shared ownership.
Any necessary adjustments to Scotland’s current voluntary community benefits approach for onshore and offshore
This research has not identified any obvious adjustments that need to be made to Scotland’s current community benefit approach.
The literature highlights that the Scottish Government is leading the way across the UK in highlighting the role of communities in the development of renewable projects. While there are examples in the literature of other approaches to community benefit provision outside of Scotland (e.g. in Ireland and Denmark), there is limited evidence directly comparing how different approaches have impacted the level of community benefits delivered. Therefore, there are no clear lessons from these international approaches suggesting a need to change the current approach in Scotland.
Guidance from the Scottish Government, in the form of Good Practice Principles and a recommended community benefit contribution of £5,000 per installed MW per year for onshore projects, was highlighted in interviews with developers as being a strength of the current process. They felt it provided a degree of predictability while also allowing for flexibility in application. However, for projects of emerging and/or non-generative technologies, developers noted that more targeted guidelines would be beneficial, noting that there is no established industry standard approach.
Conclusion and recommendations
The intention was that the framework examined in this study could inform policy decisions on the appropriate levels of community benefit for different renewable energy technologies. However, further development and more complete data is needed to be functional for this purpose. Collating the required data would need considerable resources and rely on information that developers perceive to be commercially sensitive. Considering data gaps, collection challenges, the difficulty in sourcing data specifically focused on future ability to offer benefits (rather than actual performance), further research and/or alternative approaches would be required. For these reasons, the approach explored here does not provide a robust enough evidence base to underpin a framework for use as a decision-making tool.
The report highlights existing measurement tools and guidance that can be used to understand where a project sits in relation to certain parameters, such as technology and market maturity. Further data collection work would be needed to make the most of these tools for robust socio-economic analysis. This would involve collecting relevant data for a large number of projects across metrics with established measurement tools. This would require a significant time and resource commitment and may not be a practical option.
To better understand how different renewable energy technologies affect developers’ provision of community benefits further research, beyond the financial indicators highlighted, would be needed. Considering the challenge of sourcing quantitative data on project economics, further qualitative research may be the most feasible option. Ideally this would be with a larger selection of developers across the full technology spectrum (including those that had not been able to deliver community benefits), direct engagement with communities, and wider stakeholder engagement (e.g. project investors, funders and other partners that have assisted in project development). This type of engagement would add to and build on the insights from developers gathered in this study.
Introduction
This report presents findings from research exploring opportunities for providing community benefits from renewable energy projects using different technologies in way that is fair and consistent. The research was carried out by Ipsos on behalf of ClimateXChange and the Scottish Government.
Background to the project
The Scottish Government has set ambitious targets for achieving net zero emissions by 2045, emphasising the importance of renewable energy technologies in this transition. The Climate Change Plan update (2020)[2] sets out Scotland’s ambition of a transformed energy system, which supports sustainable economic growth across all regions of Scotland.
Communities are at the heart of the energy transition in Scotland. Community benefits are additional benefits offered by renewable energy developers to support communities, offering them an opportunity to work with renewable energy businesses to secure long-term benefits. They provide an opportunity to share in the benefits of the energy resource and can have lasting social and economic impacts[3].
The Scottish Government published Good Practice Principles for the onshore[4] and offshore[5] energy sectors to outline how they can achieve a positive legacy for local communities. The approach and nature of community benefits operates on a voluntary basis in Scotland, with the guidelines allowing for flexibility in benefits arrangements offered by industry. Decisions on mandating community benefits are reserved to the UK Government. In May 2025, the UK Government published a Working Paper on community benefits and shared ownership for low carbon energy infrastructure, seeking views on whether mandating is the right approach and if so, to inform the design of future policy proposals.
Good Practice Principles have been widely adopted, but the approach to community benefits has not been wholly consistent across developments. In recognition of this, and of the rapidly changing sectoral and policy landscape, the Scottish Government is undertaking a review of the Good Practice Principles to ensure that guidance continues to help communities and developers get the best from community benefits.
This research sits within that overarching review. It was designed to help the Scottish Government understand more about different approaches to providing community benefits and to explore the opportunities for providing community benefits in future in a way that is fair and consistent for industry and communities. The findings from this research will help to inform a refresh of the Good Practice Principles.
Aims and objectives
The primary aims of this research were:
To understand how different renewable energy technologies affect developers’ provision of community benefits. This included developing and testing a socio-economic analysis framework to understand the factors that influence the nature and level of community benefits associated with different renewable energy technologies.
To understand how mandating community benefits could work in practice for onshore renewable energy technologies.
To help identify any necessary adjustments to the Scottish Government’s current voluntary community benefits approach for onshore and offshore to better support communities and industry as part of a just transition.
The findings aimed to support policy development and further refinement of guidelines and frameworks to help ensure that community benefits are effectively and fairly integrated into Scotland’s net zero energy system and strategy.
Methodology
The research involved a mix of desk research, qualitative interviews with developers and data analysis, as outlined below (detailed methodology is in Appendix A):
A desk-based evidence review that explored examples of community benefits from onshore and offshore renewable energy technologies in the UK and other countries. Literature sources reviewed included 12 peer reviewed academic papers, 20 reports, 2 guidance documents from grey literature (e.g., renewable energy developers, private consultancies) and 1 policy document. These were all published between 2011 and 2024, with 22 documents from the last 5 years.
Initial scoping interviews with four industry representative bodies to understand their views on current community benefit approaches and to explore options for sourcing data that could support socio-economic analysis on community benefits.
Design of a socio-economic analysis framework to help understand the factors which are likely to affect the level and nature of community benefits.
In-depth interviews with 21 industry developers from a range of renewable energy technologies (see Appendix A). As the focus was on how different renewable energy technologies affect provision of community benefits, qualitative research with developers was carried out to help understand the views of those with direct experience of working with projects and benefits. Interviews helped to understand industry perceptions towards community benefits arrangements, collect feedback on the proposed analytical framework, and to understand availability of relevant data for socio-economic analysis.
Assessment of the suitability of a framework to act as a tool for the Scottish Government to understand what type and level of community benefit may be suitable for different renewable energy technologies, based on data availability and feedback from interviews.
Definitions
Community benefits are defined in this research in line with the Scottish Government’s Good Practice Principles:
Community benefits are additional benefits, that are currently voluntary, which developers provide to the community. The Scottish Government does not currently have the power to legislate for community benefits, which lies with the UK Government. A community benefit fund is considered to be a fundamental component of a community benefit package, though other measures may be considered such as in-kind works, direct funding of projects, or any other voluntary site-specific benefits. Community benefits are not compensation for impacts on communities or other interests, including commercial interests, arising from renewable installations and they are not taken into account in a decision over whether a consent for a development is granted.
Community benefit in Scotland is distinct from shared ownership. Shared ownership provides community groups or members of a community the opportunity to make an investment in a commercially owned renewable energy project. This includes any structure which involves a community group as a financial partner benefitting over the lifetime of a renewable energy project. As shared ownership is not considered a form of community benefit in Scotland, it has not been included within this research.
In this report renewable energy technologies have been interpreted as the range of technologies outlined in the Scottish Government’s draft Energy Strategy and Just Transition Plan[6]. This includes onshore wind, offshore wind (both floating and fixed), solar, hydro, pumped hydro storage, battery energy storage system (BESS), hydrogen, and carbon capture, utilisation and storage (CCUS).
Limitations
This study was limited by data availability. Existing public data (for example on community benefit values, project costs and revenue) is sparse and of inadequate quality to effectively measure the parameters within a socio-economic analysis framework. Many developers were unable or unwilling to share commercially sensitive data about their projects. A further limitation was that existing data (e.g. on the value of community benefits from individual renewable energy projects) is based on actual provision rather than an assessment of project’s potential capability. Additionally, existing data are largely historical and therefore challenging to use when anticipating new technologies and emerging economic and regulatory models. Consequently, data gaps mean it was not possible to develop a fully functioning socio-economic analysis framework as part of this study.
A further limitation is that this research draws on the views of a relatively small sample of developers. These represent one group of perspectives on community benefits, albeit from different organisations, working with different technologies. Non-industry perspectives, including those of community members themselves, were not included in the remit of this study and would not be expected to fill the data gaps highlighted above.
Current community benefit arrangements
This chapter details the current arrangements for delivering community benefits, based on findings from the literature and from the qualitative interviews with renewable energy technology developers. At various points, examples of community benefit projects identified in the literature are shown to help illustrate the findings.
Key findings
The literature highlights that the Scottish Government is leading the way across the UK in highlighting the role of communities in the development of renewable projects and in providing good practice guidelines.
Community benefits from renewable energy projects in the UK mainly involve community benefit funds[7], but there are also examples of in-kind benefits such as investment in education and infrastructure programmes. Community benefit funds are not as extensively adopted outside of the UK.
Onshore wind has more established community benefit practices than other onshore and offshore technologies. However, a key similarity is that all projects, regardless of technology, tended to adopt both community benefits funds and in-kind contributions.
There is limited evidence directly comparing how different approaches in the UK and in other countries have impacted the level of community benefits delivered.
Guidelines for community benefits
According to the reviewed literature, the Scottish Government is leading the way across the UK in highlighting the role of communities in the development of renewable projects. The Good Practice Principles for Community Benefits from Onshore Renewable Energy Developments (updated in 2019) and the draft Good Practice Principles for Community Benefits from Offshore Renewable Energy Developments (2018) outline how the energy sector can achieve a positive, lasting legacy for local communities, and a range of successful community benefit projects have been implemented to date.[8] These guidelines have been widely adopted across the renewables industry, providing best practice for the sector.[9]
The voluntary guidelines suggest practices like conducting impact studies to identify affected communities, engaging in consultations, and tailoring benefits to local context and needs. These principles aim to ensure benefits are well-targeted and meet community expectations, which could be seen as markers of a well-designed scheme.[10]
Example 1.
Beatrice Offshore Windfarm’s Community Benefits Fund used the Scottish Government’s Good Practice Principles to guide the development of the fund. The Beatrice Community Benefits Fund also undertook innovative analysis of the potential wider impacts of the community benefits funding, using a Social Return on Investment methodology.[11] This illustrates the ability of the Good Practice Principles to be applied alongside other models and approaches.
In Scotland, the Scottish Government also established the Community Benefits Register,[12] managed by Local Energy Scotland. It can be viewed online and offers a form of third-party reporting and public recognition.[13] Best practice guidance also exists in England, Ireland, the Netherlands and Germany (see Table 2 in Appendix B).
Approaches used in the UK and elsewhere
The literature provided examples of different approaches to designing and implementing community benefits schemes. However, most examples are from onshore wind farms, with some examples given from offshore wind technologies. There is very little to no reference to other renewable technologies such as hydrogen, hydro, solar, wave, thermal, or BESS.
Community benefit mechanisms referred to in the literature included[14]:
Financial contributions to a community benefit fund, to be used as directed by the community to invest in local initiatives[15];
In-kind contributions to local infrastructure, facilities, or services[16];
Grants, scholarships, or donations to support community initiatives[17];
Electricity discounts or subsidies for local residents[18];
Provision of environmental or recreational amenities.[19]
While these approaches share many similarities, there are some notable differences and ambiguities. These include varying interpretations of what constitutes the “local community” (especially for offshore projects)[20] and differing emphasis on the rationale for providing benefits (e.g., impact mitigation).
This section describes the different approaches to community benefits in more detail. Differences between the UK and other countries are noted, where available.
Community benefit funds
Community benefits from renewable energy projects in the UK are primarily delivered through community benefit funds. The UK onshore wind industry, in particular, has well established approaches for this.[21] Through this mechanism, developers voluntarily contribute a certain amount of funding to local communities. In some cases, the level of funding is linked to the amount of installed capacity of the project or the amount of energy produced. For example, in Scotland, it is the industry norm for onshore wind projects to typically deliver £5,000 per megawatt (MW) of installed capacity per year in alignment with the Good Practice Principles for Onshore Renewable Energy Developments.[22] However, the per MW model is not the only approach used and the total amount provided is based on the agreement between the developers and the community.
Example 2.
Crossdykes Wind Farm near Lockerbie, Scotland (developed by Muirhall Energy) offered an industry-leading £7,000 per MW per year for a community benefit fund, well above the industry standard of £5,000 per MW per year. The project provided an Initial Investment Fund of £100,000 to support community projects during the wind farm’s construction phase, showing a proactive effort to deliver early benefits.
Example 3.
Brechfa Forest West Wind Farm in Wales (owned by RWE Renewables), is an example of a community-administered community benefit fund which is expected to provide £11 million in community benefit funding, administered by the local enterprise agency and a volunteer panel of residents.[23]
Regarding offshore wind, the concept of community benefits in the UK is relatively newer and more flexible than for onshore, reflecting the evolving nature of the industry.[24] Some, predominantly near-shore English and Welsh wind farms (e.g. North Hoyle and Rhyll Flats off the North Wales coast) have followed the pattern of the onshore wind farms, with benefits pro rata to MW size, although at a much lower rate.[25] However, in many cases, and for some of the large North Sea distant offshore wind farms, the benefits packages have been more ad hoc and much smaller (pro rata) than for onshore projects.[26] Several challenges have been identified with providing community benefits funds for offshore wind projects, including defining the relevant community to be targeted.[27]
Example 4.
The Hornsea/Race Bank East Coast Community Fund, off the Norfolk coast, is managed independently by a specialist grant-making charity, GrantScape, on behalf of the developer Orsted. This enables an arms-length, transparent allocation process.[28]
According to a number of the literature sources, allocation and spending of community benefit funds are usually determined by developers, in collaboration with the local communities, often through local trusts or organisations. Developers often strive to tailor the benefits based on local priorities identified through community engagement.[29] Community benefit funds can take different forms, ranging from local funds – investments in communities nearest to developments to enhance services, assets and activities of residents – to regional funds – investment in transformational projects to provide socio-economic growth for wider communities.[30]
The evidence reviewed suggests that community benefit funds are not as extensively adopted outside of the UK. There are some instances of community benefit funds in Europe. Notably, in Denmark, from 2008-2018, the state-run “Green Scheme” mandated payments per kilowatt per hour of production to host communities. As of 2020, Danish developers must pay fixed amounts per MW installed into green funds for affected municipalities under the “Green Pool” scheme and make annual payments to neighbouring residents under the “VE-Bonus” scheme, with amounts determined by the Danish Energy Agency.[31] In Ireland, renewable energy auctions require developers to contribute €2 per MW hour to a community benefit fund, with defined spending allocations.[32]
Among the developers interviewed for this research, flexible community benefit funds were the most common approach being taken to community benefits in Scotland. The exact sum delivered through these funds varies project-by-project. Onshore wind developers said that they follow, and often exceed, the Good Practice Principles guidelines of £5,000 per MW per year. For other technologies, which developers said often have greater financial uncertainty and/or smaller margins than onshore wind, the levels of community benefit are less predictable. Developers said that the level of benefit is often closely linked to the project’s costs and financial returns, which varies.
“We typically work backwards from what we think the returns in the scheme are going to look like. And that’s very site specific, dependent on abnormal costs, grid costs, land rights costs…Depending on what that looks like, we’ll then generate a number to determine what we can reasonably offer local communities.” – BESS developer
In a number of cases, these funds are administered by Foundation Scotland, a charitable organisation that helps to support communities to set up, manage and distribute their funding. This has particularly been the case where local communities may lack the capacity to manage significant financial resources independently. Some projects also have established their own governance arrangements, involving boards constituted of local community members to determine the allocation of these funds.
Other community benefit mechanisms
Other examples of community benefits mechanisms that appeared in the literature include tax revenues or fiscal contributions from wind farm developers, which go directly into funding local infrastructure and community services. From the documents reviewed, this is common practice in Germany, Poland, Croatia, France and Italy. [33]
Example 5.
The Block Island offshore wind farm development in Rhode Island, USA, is an example of fiscal contributions being made to support local infrastructure. In this case, a formal Community Benefit Agreement was developed in which the wind farm company pays for improvements to town infrastructure where the cable comes ashore. This project was also highlighted in the literature as an example of community engagement resulting in locally appropriate community benefits and high levels of support for the development from the local community. As part of the public consultation on the project proposals, the developer, Deepwater Wind, collaborated with the town council to invite stakeholders and hired consultants from the local community to represent local interests. This helped establish trust and perceptions of fairness in the process.[34]
The literature also identified Australian examples of neighbourhood benefit programmes.[35] These programmes aim to address concerns around fairness that can arise when local residents receive no direct benefits from a renewable energy project which affects their experience of their place and community.[36] Examples of the types of benefits provided via these neighbourhood benefit programmes include support towards home energy efficiency measures, the installation of residential solar PV, and contributions to electricity bills for neighbours or neighbourhood community facilities (e.g. local hall, local fire-fighting facilities).
The reviewed literature suggests that the involvement of local authorities in the delivery of community benefits varies by country. In some European countries (including Denmark, Germany, France, Italy and Spain), the local municipality plays a significant role and often decides funding priorities of community benefits. In the UK and Ireland, local authorities generally decline involvement to avoid conflicts of interest in the planning process. However, Highland Council recently set out plans for a different approach to community benefit decision making and fund distribution and Shetland Council approved a new set of principles around community benefit.
Developers interviewed also described the types of in-kind benefits they offer communities. Examples included:
Employment and education programmes. This includes providing funding towards training in green technologies, especially in areas that are reliant on traditional energy industries rather than renewable energy.
Electricity discount schemes, with money coming off local residents’ bills.
Investment in environmental and net zero initiatives, including activities designed to reduce carbon footprint and support biodiversity in communities, along with awareness-raising around these issues.
Infrastructure improvements such as broadband access, roads and pathways, and community recreational facilities.
Impact of different approaches on the level of community benefits delivered
Based on the literature reviewed, there is limited evidence directly comparing how the different approaches in the UK and in other countries have impacted the level of community benefits delivered.
Among the documents reviewed, the only source that explicitly offers comparative analysis between approaches in the UK and European countries was the Department of Trade and Industry report conducted by the Centre for Sustainable Energy, which involved detailed case studies of major wind farms in the UK, Germany, Denmark, Ireland and Spain. The following points are drawn exclusively from this report:
The overall levels of benefits accruing to communities from wind projects in Denmark, Spain and Germany tend to be higher than in the UK. However, it is important to note that in such countries, community benefits are mostly associated with shared ownership practices, and therefore economic and financial benefits are linked to those practices. Shared ownership is not included in the Scottish Government definition of community benefits and it is also worth noting that developments outside of the UK will have different policy contexts and market conditions to those in the UK, making it difficult to directly compare.
While the authors do not find robust evidence that higher benefits directly lead to higher levels of support for developments, they suggest that they are likely an important factor in sustaining long-term acceptance of projects.
Lessons from community benefits projects
Common themes emerged from the literature and interviews around what constitutes good practice in community benefit:
Early community engagement. Establishing trust, building relationships with local residents and identifying concerns and priorities early on can lead to smoother running of the project and help dispel fears of community members early on.[37]
Ensuringcommunity representation in the co-design and administration of community benefits[38] as this can help establish trust and lead to higher levels of sustained support for the project.[39]
Providing broad and flexible community benefit. Literature and interviews highlighted the value of funds being used to support a wide range of community priorities like infrastructure, schools, housing, elderly care, environment, etc. that improve quality of life for residents.[40]
Community capacity was noted by developers as a factor that can impact on their ability to deliver community benefits. Not all communities were seen to have the resources or expertise needed to administer funds efficiently. They noted that the existence of strong community councils or Community Development Officers to help generate ideas have helped contribute to successful community benefit funds.
Ensuring transparency of communication and providing full information to communities through trusted messengers is seen in the literature as a crucial step in securing support from communities.[41]
The reviewed literature also suggests that formalising benefit commitments and monitoringprogress can promote accountability and sustainability over the long-term. It helps ensure developers deliver on promises made to communities.[42]
There is also evidence that partnering and aligning with local government, NGOs and other companies allows projects to leverage additional resources and maximise the scale and impact of their community investments.[43]
Understanding how different renewable energy technologies affect the ability to offer community benefits
One of the ways this research explored how renewable energy technologies affect the level of community benefits offered by developers was to develop and test a socio-economic analysis framework. This framework set out the parameters assumed to influence the level and nature of community benefits provided. This chapter outlines the steps taken to develop and test a framework and the extent to which this tool could help to understand how different renewable energy technologies affect the level community benefits provided by developers.
Key findings
Within the scope of this study, the available evidence did not support a single framework to robustly determine how different technologies affect the provision of community benefits. For such a framework to work as a practical, decision-making tool, quantitative data on the economics of different renewable energy technology projects would be required. However, existing public data is insufficient to effectively measure the parameters in the framework, and it was not possible within this study to gather the level of quantitative data that would be needed for robust socio-economic analysis.
However, it was clear from the interviews with developers that the financial aspects of a renewable energy project (costs, revenue and financial viability) were key factors impacting community benefit levels.
Developers’ feedback also highlighted that it is easier to offer community benefits for projects involving more established technologies like onshore wind, compared to other technologies (e.g. offshore wind, solar and battery storage) due to the latter’s comparatively low profit margins.
Original framework parameters
The initial parameters identified at the scoping phase of the project are outlined in Table 1. The following section sets out the feedback received from developers in response to this framework, and the extent to which these parameters are measurable within a framework.
Table 1 Initial list of identified parameters affecting provision of community benefits
Parameter
Justification for inclusion
Technology maturity
More mature technologies like onshore wind and solar PV have well-established supply chains and business models, allowing for community benefit provision to be built in to project plans. The more mature technologies are also more reliable in terms of return on investment (ROI), than less mature technologies. Emerging technologies have less predictability in costs and revenues, affecting community benefit schemes and their provision.
Market maturity
The level of market maturity can determine the provision of community benefits by influencing investor confidence, increased competition between developers, robust supply chains and solidified regulatory frameworks. These all determine predictable project economics and financial plans, increasing the likelihood and scale of community benefits being provided.
Project size/energy yield
The energy yield of a project is a critical factor that can influence the revenue and, consequently, the level of community benefits provided. Smaller projects may have small absolute margins and so may be less able to provide the same level of community benefits as larger projects.
Deployment and operating costs
The costs associated with developing and operating different renewable energy technologies can impact the financial capacity to provide community benefits. If one technology has higher upfront costs or operating expenses, this might reduce the scope of benefits a developer can offer, as well as the timing of delivering these benefits.
Revenue and profit
The amount of revenue generated by a project, or the profits it generates, could also have an impact on a project’s ability to deliver community benefit and on the level and nature of community benefits that can be delivered.
Land use, visual, environmental and social impacts
Wind farms, especially onshore ones, can have a significant visual impact and may occupy large areas of land which can influence the local community’s perception, and the level of benefits expected. This may differ for offshore wind. It may also influence the type of community benefit provided (environmental, social, economic). In contrast, solar PV installations typically are less sensitive to visual impacts than wind turbines but could be associated with higher land use impacts.
Wider economic impact of the project and its distribution
The economic returns from projects may also influence the level of benefits provided through community benefit schemes. Projects which require a large workforce for ongoing maintenance and operation will provide economic benefits to the local area through jobs and investment which is multiplied through other sectors and amenities required by residents. It can be theorised that a developer’s contribution to the wider economy may reduce their overall willingness to community benefit commitments, though it is unlikely that this contribution would affect their ability to provide monetary commitments.
Community benefit value
There is a lack of data on the level of community benefits offered by renewable energy projects. The Local Energy Scotland Community Benefits Register is currently the most comprehensive data source for capturing the community benefits monetary measures. However, this is not exhaustive and does not cover the full range of renewable energy technologies.
Further steps were therefore taken to identify additional and more up-to-date data for this research. Firstly, data was requested from developers taking part in interviews, but not all were willing or able to share this (either because they could not access the data, or due to commercial sensitivities). Secondly, online searching for publicly available information on monetary values of community benefits was carried out. While data for some projects is available publicly, this requires a significant time commitment to source since it is not held in a central source nor in a consistent format. Therefore, data gaps remained after taking these steps. For the framework to be robust, a more complete set of data on community benefit value is required.
Technology maturity
Technological maturity is a widely used metric for gauging a technology’s development and readiness for deployment.
Developers generally felt that this could have an impact on the viability of a project, and as a result affect the level of community benefits. Some agreed that, compared to mature technologies (e.g., onshore wind), technologies such as floating offshore wind, BESS and hydrogen can have higher risks, higher delivery costs, less predictability in cost and performance and lower investor confidence. However, some onshore wind developers argued that more mature technologies do not always have more secure financial models because recent cost increases in their supply chains have made viability harder to predict.
Technology maturity is suitable for quantitative measurement using the NASA Technology Readiness Level (TRL) scale (see Appendix E for details). To accurately assess a technology’s TRL, it is recommended that individual projects are approached directly for scoring, as they may employ different versions of the technology. If direct assessment is not possible, it would be possible to utilise the International Energy Agency’s ETP Clean Energy Technology Guide, which evaluates and provides comprehensive information on each technology’s current development stage across the energy system.
This parameter could be included in a socio-economic analysis framework, provided there was sufficient data available or one of the existing guides outlined above could be used.
Market maturity
Factors influencing market maturity include established supply chains, business models and supporting physical and regulatory infrastructure (ports for deployment of offshore wind, standards for solar farms, etc.).
Developers felt that emerging technologies and immature markets face difficulties determining an appropriate level of community benefits because of uncertainty around securing investment and finances. However, some onshore wind developers also noted that their more mature market can still experience challenges with supply chains, especially in relation to costs of deployment (e.g. turbine costs have increased).
Market maturity could be measured using existing tools. The Adoption Readiness Level (ARL) framework, developed by the U.S. Department of Energy, is a tool for assessing the commercialisation risks of new technologies. It helps identify potential roadblocks to market adoption, such as cost-competitiveness, regulatory landscape, public perception and infrastructure availability. It also helps evaluate market demand by identifying the target market, understanding customer needs, and assessing the competitive landscape.
The ideal approach to understanding this parameter would involve project-level assessments via direct engagement with project owners, using the scoring framework available online[44]. However, given the large number of projects, this endeavour would be challenging. The decision to pursue this should weigh the uncertainties about the parameter’s significance in determining community benefits, with the time commitment needed to collect this information.
This parameter would be suitable to include in a socio-economic analysis framework, but the ability to source the level of data required is challenging.
Project size or energy yield
This measure is quantifiable, based on the level of energy capacity installed for each project expressed in MW. This data is available on the Local Energy Scotland’s Community Benefit Register and the Renewable Energy Planning Database (REPD). To enable a comparison between different technologies, it is important to convert installed capacity to expected energy yield as each technology has different levels of efficiency.
Capacity and energy yield are both inputs in the estimation of gross revenue. Therefore, inclusion of these metrics as stand-alone parameters in the framework would be duplicative and would correlate very highly with any revenue estimations. For this reason, these metrics would not need to act as stand-alone parameters in an analysis framework but could be used as inputs to the revenue estimation.
Deployment and operating costs
The total costs of developing and operating a renewable energy project captures an important financial aspect assumed to influence the level of community benefit commitment.
Developers noted that the developmental and operating costs impact the financial capacity for a project to provide community benefit. As with revenue, obtaining precise cost figures would involve direct input from project owners. Again, due to commercial sensitivities and challenges in accessing this data, estimating total cost of production might need to rely on publicly available sources. This can be done for a selection of technologies using the Department for Energy Security and Net Zero’s Levelised Cost of Electricity (LCOE) estimates.[45] It is worth noting that not all REPD project technologies are included in this resource, and hence, some projects will require mapping to the closest matching technology category. Despite this challenge, a basic methodology for estimating LCOE from generation technologies is outlined in Appendix D.
When looking at non-generation projects, i.e. storage projects, it is important to reflect the differences to generation projects in the calculation of costs. An analogous version of the LCOE is the Levelised Cost of Storage (LCOS), which uses charging cost as fuel cost and uses the discharged electricity instead of generated electricity. Given the lack of access to the necessary data it is not possible to accurately estimate LCOS for storage projects.
Given that project costs provide a direct link to the financial aspects that are assumed to influence community benefits, it is recommended to include this parameter in a socio-economic analysis framework.
Revenue and profit
Developers agreed that the amount of revenue generated by a project has an impact on their ability to deliver community benefits and the level of community benefits that can be offered.
Ideally, obtaining precise revenue figures would involve direct input from project owners. However, due to commercial sensitivities and challenges in accessing data, estimating revenue might need to rely on publicly available sources. It is important to note that this approach is based on significant assumptions that might not hold true over time. Estimating future revenues is particularly challenging because it depends on projected electricity prices, which are notoriously difficult to predict with accuracy or extend into the future. Despite these challenges, a basic methodology for estimating revenues from generation technologies is outlined in Appendix D.
When it comes to non-generation projects, revenue estimation becomes even more complex and uncertain. These types of projects may involve diverse sources of income and variables, requiring a more nuanced approach to estimation. Battery storage projects generate revenue through a variety of mechanisms, often stacked together to maximise returns. Key revenue streams include arbitrage (buying electricity when prices are low and selling it back to the grid when prices are high), grid services (e.g. frequency regulation, voltage support), capacity market participation and ancillary services (e.g. black start capability). The lack of publicly available data for each of these revenue streams make it challenging to estimate revenue for non-generation projects.
Given that revenue estimation provides a direct link to the financial aspects that are assumed to influence community benefits, it is recommended that consideration is given to including this parameter in a socio-economic analysis framework.
Land use, visual and environmental impacts
There are several challenges associated with quantitatively measuring land use, visual, environmental and social impacts:
Quantifying land use involves assessing the physical footprint of a project, which can vary significantly based on the type and scale of the renewable technology employed. Further challenges arise in comparing land use impacts across different technologies, such as wind farms versus solar arrays, as each may occupy land differently (e.g., spacing between wind turbines versus solar panel coverage). These differences between technologies were also noted by developers.
Visual impact assessments are inherently subjective and can vary depending on individual perspectives and local landscape characteristics. Moreover, accurately quantifying visual impacts requires sophisticated modelling tools and surveys that consider factors like visibility range, landscape context, and viewer sensitivity.
Comprehensive environmental impacts involve a multitude of factors, including potential effects on local wildlife, ecosystems, water resources, and biodiversity. Data collection for environmental impacts may be inconsistent and require long-term monitoring to capture seasonal or cumulative effects accurately.
Social impacts can include effects on local communities, employment opportunities, and cultural shifts, which are difficult to measure quantitatively and may require qualitative research approaches. In addition, assessing social impacts often involves engaging with communities and stakeholders, which can introduce variability and complexity in data collection and interpretation.
Each of these aspects often interacts with others, making it challenging to isolate and assess impacts individually without considering cumulative or synergistic effects. Variability in methodologies and data availability can also lead to inconsistent measurements and comparisons.
For these reasons, this parameter is not suitable for a socio-economic analysis framework.
Wider economic impact of the project and its distribution
Renewable energy projects, especially large-scale ones, often generate significant economic benefits. For example, they may create high-value jobs through operation and maintenance, enhance the local supply chain and attract inward investments. These contributions can lead to substantial regional development and improved economic resilience.
However, there are notable challenges in confining these benefits strictly to the local communities most directly impacted by the projects. Economic effects often extend beyond the immediate vicinity. Moreover, quantifying these impacts presents difficulties, often necessitating self-reported data from projects. Such data can be subject to bias and may not fully capture the comprehensive economic changes occurring in the region. These challenges were reflected in interviews with developers. They noted that projects can add a lot of value to an area through high-value jobs, contribution to the supply chain and driving inward investment. However, they noted that it would be difficult to define this parameter, since the economic impacts may not be contained to the specific community in question. Projects can also incur wider costs, such as seabed option fees and rental fees for offshore wind renewable energy developments and these funds can have a wider economic impact.
Additionally, this metric’s applicability varies with different project types. For instance, projects involving CCUS often repurpose existing infrastructure, without necessitating a new workforce. As a result, the direct local economic impacts of such projects might be limited, underscoring the need for careful consideration when using this metric to assess community benefit commitments.
Wider economic impact provides a valuable lens for understanding potential benefits. However, the challenges and variability associated with measuring and applying this parameter across project types should be carefully evaluated to ensure fair, accurate and consistent community benefit determinations. For these reasons, this parameter is not suitable for a socio-economic analysis framework.
Community involvement and capacity
During interviews, developers suggested that community involvement and capacity influence the ability to provide community benefits and should be considered as part of a framework. This parameter focuses on the role of communities in both shaping and managing the benefits derived from renewable energy projects. Interviewees highlighted that placing community needs at the core is essential for ensuring that the type and level of benefits align with local priorities. They emphasised the importance of community engagement, consultation, and feedback in moulding these initiatives, arguing that this involvement leads to more meaningful and tailored contributions.
Additionally, while not directly impacting a developer’s ability to offer community benefit, the capacity of communities to effectively manage and deliver agreed benefits was seen as important. Interviewees pointed out that variations in the size and organisation of community councils or other community groups can significantly impact their ability to administer benefits. Hence, recognising these differences allows developers to support and enhance the local capacity, fostering increased participation and benefit realisation from the projects.
However, there are several challenges to quantitatively measuring these aspects. Quantifying community engagement and feedback is subjective, as perceptions of effective engagement vary among stakeholders. Communities often have diverse and evolving needs, making standardisation difficult. Additionally, while the number of consultations can be counted, assessing their quality requires qualitative data, which is harder to quantify. Asking the community to accurately capture and record this data would put significant burden on individuals who quite often are volunteers in the community. Moreover, community needs can change over time, necessitating ongoing updates and flexible metrics.
Due to these challenges, it is not recommended to include this parameter as a stand-alone element in a socio-economic analysis framework.
Conclusion
Following the assessment outlined above, four parameters were deemed suitable to be considered in a socio-economic analysis framework. These were:
Technology maturity
Market maturity
Deployment and operating costs
Revenue and profit.
To demonstrate how a framework could be used in future, socio-economic analysis has been carried out based on a sample of data on renewable energy projects (see Appendix C). The parameters in scope of this analysis are restricted to those which have been deemed feasible to measure and for which a suitable method to measure them has been identified. This analysis is based on data available from the Community Benefits Register Database, supplemented with additional data sourced through desk research. Due to the data sources available, it only includes onshore wind, offshore wind and hydro technologies.
Key findings from that analysis are:
Industry alignment and policy influence: While many onshore wind and hydro projects in Scotland are clustering around the recommended annual £5,000 per MW capacity for community benefits for onshore technologies, more than half of the onshore wind and hydro projects analysed in the available data set commit less than the recommended amount.
Revenue-benefit correlation: A positive correlation exists between gross project revenue and total community benefit commitments, with larger projects providing bigger packages. However, this relationship weakens for high-revenue projects, suggesting a potential plateau effect.
Costs and benefit packages: There is a positive correlation between total cost of production and total community benefit packages across all project sizes, suggesting that as total costs increase, so does the size of the overall commitment to community benefits. While this may appear contrary to the views of developers shown earlier (i.e. those who said that high costs can impact on financial viability and therefore their ability to offer community benefits) it should be noted that this data analysis is based only on projects already providing monetary benefits. It excludes those that had not yet provided any community benefits. It can therefore be assumed that the dataset excludes those projects that were deemed not financially viable enough to enable community benefit provision.
In interpreting these findings and considering next steps it is important to acknowledge the distinction between the willingness of projects (measured by actual provision) to provide community benefits and their ability to provide community benefits. The analysis above is based on actual provision of community benefits. It could be assumed that these commitments are indicative of both willingness and some inferred level of ability, but the data does not allow for an assessment of the capability of projects (and different technologies) to offer these benefits. The UK Government’s Contracts for Difference (CfD) scheme is the main support mechanism for renewable energy projects. It is important to acknowledge that although community benefit funds are not recognised costs in the CfD framework, they are often treated as part of a project’s overall cost base and priced in to CfD bids.
Robust analysis of the capability to provide community benefits would require detailed project-level data. To collate the data needed will require considerable resources and will also require renewable energy technology developers to share data they perceive as commercially sensitive, which may be unrealistic. This work has highlighted considerable data gaps, challenges collecting data in the future and difficulty in sourcing data specifically focused on future ability to offer community benefits rather than actual performance. Therefore, the approach explored here does not provide a robust enough evidence base to underpin a framework for use as a decision-making tool.
To better understand the capacity for projects to provide community benefits, it is suggested that further research and / or alternative approaches may be needed. This could take the form of qualitative research with a larger selection of projects across the full technology spectrum, to understand perceived barriers or enablers of moving from willingness to ability. This should offer insights into the practical challenges faced by projects. Longitudinal case studies may prove beneficial to understand how changes in policy, economic conditions or market incentives could have influenced both the willingness and perceived capacity to make these commitments.
Exploring mandatory community benefit arrangements
This chapter looks at current approaches to mandating found in the evidence review and the views of the industry on how mandating community benefits for onshore technologies could work in practice, based on qualitative research with developers.
Key findings
Mandatory community benefits approaches exist in Denmark and Ireland, as part of renewable energy infrastructure development for wind projects. However, the literature reviewed does not allow for a satisfactory comparative analysis of the in-practice impacts of mandatory versus voluntary approaches.
Existing onshore developers felt that the following factors would need to be considered for mandating to work in practice:
clear guidance on the financial expectation attached to mandating
accounting for differences between individual onshore technologies
retaining a degree of flexibility, particularly in terms of the ability for community benefits to be designed around the needs of communities
avoiding overly burdensome processes.
Current approaches to mandating community benefits
Mandatory community benefits as part of net zero energy infrastructure development exist in Denmark and Ireland, specifically for onshore and offshore wind projects. Other countries have mandated approaches for shared ownership, special taxes, energy subsidies, or monetary compensations, but not community benefits as defined here. This includes Germany, France, Taiwan, and the Philippines [46].
Denmark has a history of various mandates relating to community benefits. For example, until 2018, the “Green Scheme” required the Danish state to pay hosting communities a fixed amount per kWh of production from new turbines. This applied to offshore wind farms built outside the tender process and within 8km of shore.[47] More recently, as of June 2020, regulations require offshore wind developers to pay fixed amounts per MW installed into green funds for affected municipalities. The payment is DKK 115,000 per MW (around €15,500).[48] Additionally, in Ireland, renewable energy auctions mandate that developers contribute €2/MWh to a community benefit fund, with defined criteria for how the funds must be spent.[49]
Other mandated approaches similar to community benefits include special taxes imposed on developers, that are distributed to local authorities, and electricity subsidies for “host communities”. The former approach has been implemented in France and Germany. The French Maritime Wind Turbine Tax is imposed on offshore wind farms, and is allocated to local authorities to finance local projects, per a defined formula. Germany requires that tax revenue generated from offshore wind farms in the Exclusive Economic Zone is distributed to coastal states. Energy subsidies for host communities have been implemented in the Philippines and Taiwan. Since 2008, the Philippines has required that 80% of money generated from royalties, or government shares in renewable projects, must be used to subsidise the electricity costs of communities affected by these projects.[50] In Taiwan, the Electricity Assistance Fund (EAF) is distributed to communities affected by power plant projects (including, but not limited to renewable energy) according to a pre-defined formula. For example, in the case of offshore wind, 30% of EAF funds are provided to “local project fund pools” for the benefit of residents, community groups, and civil society organisations, and 70% is provided for councils and fishery associations.[51]
Although shared ownership is seen distinct from community benefits in Scotland, some other countries have mandated shared ownership or compensation payments. For example, in Denmark, the 2008 Renewable Energy Act mandated developers to offer at least 20% of shares in wind projects for sale to local households within 4.5km of a turbine.[52] Similarly, in Germany, several states have required that between 10% and 25% of wind farm shares be offered to local residents and municipalities. Mandated compensation payments to nearby residents and community funds have been implemented in Denmark and Ireland. Since 2020, Irish legislation obliges wind farm developments to provide an annual contribution to nearby households and communities.
While some of the literature reviewed implies that mandated approaches are more robust,[53] no clear evidence is provided of their outcomes and impact compared to voluntary approaches. The literature does not allow for a satisfactory comparative analysis of the in-practice impacts of mandatory versus voluntary approaches.
Developers’ perspectives on how mandating community benefits could work in practice
Industry stakeholders shared their views on the potential for mandating community benefits for onshore technologies. Mandating was explored in both the scoping interviews with representative bodies and in the main interviews with developers. Developers highlighted some key considerations that they felt should be borne in mind for how mandating could work in practice.
For mandatory community benefits to work in practice, developers felt that there would need to be clear guidelines on what the financial expectation is to avoid any potential for confusion. It was suggested that the community benefit value attached to any mandated approach should be realistic and determined in collaboration with industry to help clarify what the expectations are for developers and for communities.
To work in practice, it was felt that mandatory community benefits would need to take into account the differences between different technologies. For example, by having different levels of benefits that technologies are expected to contribute. Specifically, some interviewees highlighted the different operating contexts and economies (e.g. different capital costs) between some technologies. Further, it was suggested that hydrogen and CCUS should be treated differently because they are designed to complement renewable technologies by operating only when needed. Therefore, it was argued that it is difficult to tie community benefits to specific metrics for these.
“[If] it would be used to set an X amount per megawatt, [then] that would need to be split into different technologies because it’s not a clear cut case for all technologies. It has to show this is what it is for BESS, what is for wind, what is for solar. Because if you get that number wrong, you can make the scheme unviable or unattractive and therefore it will not come forward.” – BESS stakeholder
It was also felt that for mandating to be practical, the approach to community benefits should retain some degree of flexibility and the ability to be designed around the needs of individual communities. For example, one onshore and offshore wind developer said if mandating were to happen it should be around the amount of funding that should be provided and not how communities spend the money. This view echoes findings of a report by BiGGAR Economics (2023) that states that the current voluntary system has allowed communities and developers to be flexible in their arrangements, and has enabled the “formation of mature, collaborative relationships” between parties. [54]
Related to the point above, some developers felt that, in practice, mandates could mean a more bureaucratic process which could slow things down, in turn impacting developers’ ability to deliver benefits. Stakeholders made contrasts with the current system, which was perceived as “fairly simple” and “flexible”. Therefore, it was suggested that approaches to mandates should avoid overly burdensome processes and bureaucracy. For example, it was suggested that it should avoid having too many restrictions around timescales or conditions on how communities should spend the funding.
Another view from developers was mandating might impact on the existing relationships between developers and communities, as it could move away from a collaborative process to one where there is a firmer expectation around what developers are required to give. Therefore, the approach would need to consider the relationships between developers and communities. Developers particularly felt it important to avoid community benefits appearing like compensation. For example, it was felt that creating a mandated system through which a certain amount is paid made directly to homeowners could lead to the system feeling like a form of compensation.
“If it’s mandated, it absolutely can’t be attributed as compensation to the community. If money had to be paid to compensate people for the effects of a wind farm, then the wind farm shouldn’t be being built.” – Multi-technology stakeholder
Aside from practicalities, a key concern raised was that mandating community benefit provision could risk investor confidence. Some developers felt that mandatory community benefits would have an impact on financial viability of projects, which could make investors less confident to invest. It was suggested that they may choose to invest in projects in other countries that do not have a community benefit mandate or in which they feel the approach is more straightforward.
“The danger with [mandating] is that it creates investor concerns. There’s a lot of competing geographies around the world that want money for renewable energy projects…If one country becomes difficult or the risks are harder to understand, they’ll move that investment to another country where they understand it. And the UK, and especially Scotland, runs a real risk of upsetting investor confidence, which is already very delicate because of the situations with the grid at the moment.” – Solar PV stakeholder
As the scope of this research was focused on understanding how different renewable technologies influence the level of community benefits offered by developers, interviews were conducted with a sample of renewable energy developers. A wide range of other stakeholders will have views.
Adjustments needed to Scotland’s current voluntary community benefits approach
This chapter sets out the extent to which any adjustments are required to the current voluntary community benefits approach based on findings from the literature review, interviews with developers and the design and testing of a socio-economic analysis framework.
Key findings
This research has not identified any obvious adjustments that need to be made to Scotland’s current community benefit approach. Developers felt that the current system could better acknowledge the different realities of different technologies, but they were not specific about what the best future approach should be.
Developers felt that guidance from the Scottish Government, in the form of Good Practice Principles and a recommended level of community benefit for onshore projects was a strength of the current process. However, for projects of emerging and/or non-generative technologies, developers noted that more targeted guidelines would be beneficial, noting that there is no established industry standard approach.
The intention was that the framework in this study could be used by Scottish Government to determine an appropriate expectation of the level and types of community benefit required for different renewable energy technologies. This work identified significant data gaps, challenges collecting data in the future, and the difficulty in sourcing data specifically focused on future ability to offer community benefits rather than actual performance. For these reasons, the framework explored here is not robust enough to use as a decision-making tool.
Lessons from literature and developers’ views
Based on the literature reviewed, there is limited evidence directly comparing how the different community benefit approaches in the UK and in other countries have impacted the level of community benefits delivered. Similarly, there is limited evidence to compare the impacts of mandated and voluntary approaches. International examples do not therefore provide any obvious lessons for the current approach in Scotland.
Onshore wind developers interviewed as part of this study were largely satisfied with the current arrangements. They felt that having a recommended standard (of £5,000 per MW per year for onshore) works well, helping them to predict what the cost associated with each project will be. Since it is a recommended, rather than compulsory standard, they also felt that it also allows for a degree of flexibility, meaning that the community benefit contribution can be responsive to both project and local community needs.
“That financial outlay [£5,000 per MW per year] is much more predictable in our models that we bake in during development…we actually really try to make sure that we can deliver it and protect it.” – Multi-technology developer
Developers of some less well-established technologies (e.g. hydrogen and pumped hydro storage) expressed a desire for clearer guidance from government on the appropriate levels of community benefit for these technologies. They suggested that new guidelines around levels of community benefit should take into consideration the differences in scale and impact between projects like pumped storage and hydrogen generation, which can be more expensive and less visible than wind projects. Those from non-generative technologies (e.g. BESS) felt that it is more difficult to determine the amount of community benefits (funds) that can be delivered from these projects because they have lower level of return (they do not yield energy) and serve a different function in the energy market than generation projects.
Developers also suggested that further structure and support for communities could help them to manage funds more effectively. They felt that community-led decision-making was vital for ensuring the funds meet local needs, but that this should be balanced with adequate administrative support to prevent the misuse or underutilisation of funds.
“There is also a misconception that communities are underspending this funding. Our analysis shows that if we invest and empower communities, then they are very capable of delivering impactful projects.” – Multi-technology developer
Lessons from testing a framework approach
As noted earlier, to effectively measure parameters identified in the proposed framework, project-level data would be required on costs, revenue, technology readiness levels and market maturity. Data on these metrics is not currently available and collecting this data would be a significant task.
Developers felt that certain parameters (see chapter 4) were considered suitable for a socio-economic analysis framework. However, their limited testing means that the framework would need more comprehensive data to fully model these parameters’ effects on community benefits. This is especially true for community benefit commitment data (£/MW/yr) which currently is only reported in the Community Benefits Register Database for onshore wind and hydro projects.
When discussing the idea of such a framework, developers noted that community benefits should not have a one-size-fits-all approach and should be reflective of specific circumstances of each technology and each project. Concerns were raised by some interviewees that a framework might lead to overly prescriptive approaches which could risk stifling development and deterring investment.
“Each [parameter] is relevant and I can see why they have been captured as things that would influence the value and viability of community benefits […] It all depends on an individual project basis, depends on what else is happening in terms of landscape and development.” – Multi-technology developer
Interviewees also questioned whether sufficient data would be available to support the framework and there was some concern about using historic data to understand future community benefit levels. A few interviewees also highlighted concerns about data sensitivity and need for any information to be carefully handled.
Considering the data gaps, challenges collecting data in the future, and the difficulty in sourcing data specifically focused on future ability to offer community benefits rather than actual performance, a single framework may not be the most appropriate approach.
Conclusions
This research looked at current and future approaches to community benefits to help inform decisions around future provision of community benefits in a way that is fair and consistent. This chapter draws conclusions around the three broad research aims:
To understand how different renewable energy technologies affect the capacity of developers to provide community benefits, including developing and testing a socio-economic analysis framework.
To understand how mandating community benefits could work in practice for onshore renewable energy technologies.
To help identify any necessary adjustments to the Scottish Government’s current voluntary community benefits approach for onshore and offshore to better support communities and industry as part of a just transition.
Understanding how different renewable energy technologies affect community benefits
Within the scope of this study, the available evidence did not support a single framework to robustly determine how different technologies affect community benefits. For such a framework to work as a practical, decision-making tool, quantitative data on the economics of different renewable energy technology projects would be required. However, existing public data is sparse and of inadequate quality to effectively measure the parameters within a framework and many developers were unable or unwilling to share commercially sensitive data about their projects. A further limitation was that existing data (e.g. on the value of community benefits from individual renewable energy projects) is based on actual provision rather than an assessment of project’s potential ability. Additionally, data available is largely historical and challenging to use when anticipating new technologies and emerging economic and regulatory models.
However, from data that was available, it was clear that the financial aspects of a renewable energy project (costs, revenue and financial viability) were key factors impacting the developers’ offer of community benefits. Projects with higher amounts of revenue and more robust and predictable financial returns are better positioned to offer significant community benefits. Conversely, if the financial viability of a development is low, then it is unlikely developers can offer community benefits without the project becoming non-viable. Developers noted that both technology maturity and market maturity can have an impact on a project’s financial viability and are therefore, indirectly, also linked to a project’s suitability to deliver community benefits. As discussed above, while there are existing tools for measuring technology and market maturity, data gathering is challenging.
Developers’ feedback also highlighted that it is easier to offer community benefits for more established technologies like onshore wind, compared to other technologies (e.g. solar and battery storage) due to the latter’s comparatively low profit margins. Less mature technologies (e.g., floating offshore wind, hydrogen) can have higher risks, higher delivery costs, less predictability in cost and performance, and lower investor confidence which can impact on their ability to offer benefits.
While not directly impacting on the level of community benefits offered, developers noted the importance of community engagement and capacity to effectively manage and deliver benefit funds. Interviewees highlighted the importance of community engagement, consultation and feedback in moulding community benefit initiatives, ensuring more meaningful and tailored contributions. However, this is difficult to quantify and would therefore be challenging to include in a socio-economic analysis framework.
How mandating community benefits could work in practice (for onshore renewable technologies)
The literature reviewed does not allow for a satisfactory comparative analysis of the in-practice impacts of mandatory versus voluntary approaches. Mandatory community benefits approaches exist in Denmark and Ireland, as part of net zero energy infrastructure development for wind projects. While the literature provides examples of where this was happening outside of the UK, it was less clear on the extent to which mandating had an impact on the level and nature of community benefits when compared with voluntary approaches.
Developers felt that for mandating to work in practice, a number of factors would need to be taken into consideration. It was felt that any future mandating approach should allow for the differences between technologies to be accounted for by setting, for example, different recommended levels of community benefit fund value. For mandating to work in practice, it was also felt that flexibility was key, particularly in terms of how communities could make use of the funding provided. Practicalities aside, there was some concern that mandating could potentially pose a risk to projects, by placing a financial burden on some projects (particularly those with smaller financial returns such as solar and BESS technologies) which could pose a risk to investors.
Any necessary adjustments to Scotland’s current voluntary community benefits framework for onshore and offshore
This research has not identified any obvious adjustments that need to be made to Scotland’s current community benefit approach.
Guidance from the Scottish Government, in the form of best practice principles and a recommended level of community benefit for onshore projects was highlighted in interviews with developers as being a strength of the current process. However, developers’ feedback suggests the current system needs to better acknowledge the different realities of different technologies. Developers of emerging and non-generative technologies suggested that more targeted guidelines for these newer technologies would be beneficial, noting that there is no established industry standard approach. However, while they suggested some areas for consideration, they were not specific about what the best future approach should be.
The intention was that the framework in this study could be used by the Scottish Government to determine an appropriate expectation of the level and types of community benefit required for different renewable energy technologies. The parameters that were considered suitable for the framework could provide a useful understanding of the factors that influence ability to offer community benefits. However, this would be dependent on data gaps being addressed. Ideally, it would have up-to-date data on community benefit value covering the full range of renewable energy technologies, with at least 50 projects for each technology.
This study has identified data gaps, challenges collecting data in the future and the difficulty in sourcing data specifically focused on future ability to offer community benefits rather than actual performance. The approach explored here does not provide a robust enough evidence base to underpin a framework for use as a decision-making tool.
Recommendations and next steps
The report highlights existing measurement tools and guidance that can be used to understand where a project sits in relation to certain parameters, such as technology and market maturity. To make the most of these tools, further data collection work would be needed before they could be used for robust socio-economic analysis. This would involve collecting relevant data for a representative sample of projects across the metrics that have already established measurement tools. This would require a significant time and resource commitment and may not, therefore, be a practical option.
To better understand the factors influencing the level of community benefit, beyond the financial indicators highlighted in this study, further research would be needed. Considering the challenge of sourcing quantitative data on project economics, further qualitative research may be the most feasible option. Ideally this would be with a larger selection of developers across the full technology spectrum (including those that had not been able to deliver community benefits), direct engagement with communities, and wider stakeholder engagement (e.g. project investors, funders and other partners that have assisted in project development). This type of engagement would add to and build on the insights gathered from developers in this study.
Glossary / abbreviations table
Acronym/Abbreviation
Definition
ARL
Adoption Readiness Level
BESS
Battery energy storage system
BWE
German Wind Energy Association
CCUS
Carbon capture utilisation and storage
EAF
Electricity Assistance Fund
ESG
Environmental, Social, and Governance
GW
Gigawatt
IEA ETP guide
International Energy Agency’s Energy Technology Perspectives guide
LCLO
Local Community Liaison Officer
LCOE
Levelised Cost of Electricity
LCOS
Levelised Cost of Storage
MW
Megawatt
NASA
National Aeronautics and Space Administration of the United States
REPD
Renewable Energy Project Database
SROI
Social Return on Investment
TRL
Technology Readiness Level
References
Anchustegui, I. H. (2021). Distributive justice, community benefits and renewable energy: The case of offshore wind projects.
Arsenova, M., & Wlokas, H. L. (2019). Local Benefit Sharing in Large-Scale Wind and Solar Projects. IFC.
Arsenova, M., Skyt, P., & Qadeer, A. (2024). The Strategic Value of Community Benefits in Offshore Wind Development. IFC.
BiGGAR Economics. (2023). Baseline report on Community benefit and shared revenue from onshore wind projects to communities in the south of Scotland.
BiGGAR Economics. (2024). Developing a new model to maximise local economic benefits from development in Moray and Highland. Report to Moray Council and Highland Council.
BiGGAR Economics. (2024). Impact Assessment of the Rosehall and Achany Wind Farm Community Benefit Funds.
Centre for Sustainable Energy (CSE), & Garrad Hassan. (2005). Community Benefits from Wind Power: A Study of UK Practice and Comparison with Leading European Countries.
Chen, H., Esram, N. W., Johnson, A., Harmon, D., Phelan, P., & Fraser, A. (2024). Aligning Community Benefits with Decarbonization Goals: Lessons Learned from Development of Community Benefit Plans for IRA Funds. American Council for an Energy-Efficient Economy.
Cowell, R., Bristow G., Munday, M. (2011) Acceptance, acceptability and environmental justice: the role of community benefits in wind energy development, Journal of Environmental Planning and Management.
Department for Energy Security and Net Zero (2023) Electricity Generation Costs (2023)
Devine-Wright, P., Devine-Wright, H., & Cowell, R. (2015). What do we know about overcoming barriers to siting energy infrastructure in local areas?
Ejdemo, T., Söderholm, P. (2015). Wind power, regional development and benefit-sharing: The case of Northern Sweden., Renewable and Sustainable Energy Reviews.
Égré, D., Roquet, V., & Durocher, C. (2007). Monetary benefit sharing from dams: A few examples of financial partnerships with Indigenous communities in Québec (Canada).
Energy UK. 2024). Energy in Action: Community benefits from local infrastructure.
Glasson, J. (2020). Community Benefits and UK Offshore Wind Farms: Evolving Convergence in a Divergent Practice.
Klain, S.C., Satterfield, T., MacDonald, S., Battista, N., Chan, K.M.A. (2017). Will communities “open-up” to offshore wind? Lessons learned from New England islands in the United States.
Kerr, S. (2018). Community benefits schemes – Fair shares or token gestures?
Kerr, S., Johnson, K., & Weir, S. (2017). Understanding community benefit payments from renewable energy development. International Centre for Island Technology, Heriot Watt University.
Lane, T., & Hicks, J. (2019). A Guide to benefit sharing options for renewable energy projects. Akin Consulting; Community Power Agency.
le Maitre, J. (2024). Price or public participation? Community benefits for onshore wind in Ireland, Denmark, Germany and the United Kingdom.
Manitius. (2023). Community Benefits Programs & Clean Energy.
Munday, M., Bristow, G., & Cowell, R. (2011). Wind farms in rural areas: How far do community benefits from wind farms represent a local economic development opportunity?
San Martin, O., Morales, E., Antas, J., Seumas, S., & Wallace, J. (2022). The winds of change: The role of community engagement and benefit-sharing in wind farm developments. Statkraft.
Scottish Government (2018). Scottish Government Good Practice Principles for Community Benefits from Offshore Renewable Energy Developments.
Scottish Government. (2019). Scottish Government Good Practice Principles for Community Benefits from Onshore Renewable Energy Developments (updated).
Toledano, P., Albin-Lackey, C., Andres, M. D., & Brauch, M. D. (2023). Community Benefit Sharing and Renewable Energy and Green Hydrogen Projects: Policy Guidance for Governments. Columbia Center on Sustainable Investment.
Van den Berg, K., & Tempels, B. (2022). The role of community benefits in community acceptance of multifunctional solar farms in the Netherlands.
Van der Waal, E. C. (2020). Local impact of community renewable energy: A case study of an Orcadian community-led wind scheme.
Walker, C. (2013). Towards Greater Acceptance of Wind Energy: A Review of Community Benefits Models.
Welsh Government (2022) Guidance for developers, local communities & decision-makers: Local and shared ownership of energy projects in Wales.
Wind Europe. (n.d.). Compendium of wind success.
Appendices
Appendix A – Methodology
Evidence review
Aims and objectives
The aims of the evidence review were to:
Explore best practice on community benefits in the UK and internationally in relation to renewable energy technologies.
Explore how community benefit schemes operate and examine their funding arrangements in the UK and internationally.
Provide examples of where community benefits have been mandated and what impact this has had on industry, communities and the delivery of renewable energy technologies.
Inform the socio-economic analysis in terms of identifying key parameters and contexts that impact the propensity to supply community benefits at varying scales.
Identify data sources for the socio-economic analysis.
Defining the research questions
To ensure the evidence review is useful in summarising best practises and informing the socio-economic analysis the following research questions were defined:
Research Question 1 – What is the best practice on community benefits from onshore and offshore renewable energy technologies internationally?
Research Question 2 – How does the UK differ from international counterparts on the processes on the provision of community benefits? How does this impact the level of community benefits?
Research Question 3 – Which (if any) countries mandate community benefits as part of net zero energy infrastructure construction? What impact has this had on the provision of community benefits? What impact has this had on communities and the delivery of net zero energy policies?
Additional Scoping – What data is available on the levels of community benefits, and their corresponding technologies/market maturities/technology maturity and other hypothesised parameters which influence the provision of community benefits?
Scope of the literature search
The literature search included the identification of relevant sources from:
Existing research into/evaluations of community benefit schemes
Academic literature
Grey literature
Policy documents
Media publications
The search for literature was primarily done through using Google and Google Scholar but also used sources such as JSTOR, Scopus, and organisational websites where necessary. Whilst we did not take a strict view on the geographical scope of our search, we favoured countries which are contextually similar to the UK (European countries, US, Australia) as it is likely these findings will be more relevant to the UK.
We explored literature relevant to onshore and offshore renewable energy technologies. This included, but was not limited to, wind, solar, hydro, wave, thermal, pumped hydro storage, bioenergy, battery storage, hydrogen, Negative Emission Technologies (NETs) and transmission infrastructure. The ability to look at these internationally was dependent on the context and energy mix of the countries in question. It was decided that it would also be useful to assess levels of community benefits for technologies which may be emerging in the UK but are more established elsewhere, bringing in the Three Horizons approach featured in the proposal.
Search Terms
Some initial search terms for covering the aforementioned specifications and research questions were developed and are presented in the table below:
Search Term (Google/Google Scholar)
Relevance/comments
“[insert technology] community benefits best practice [international/UK/insert country]”
All technologies and internationally. This will support answering RQ1 and part of RQ2 by allowing for a comparison between countries.
“[insert technology] community benefits monitoring [international/UK/insert country]”
All technologies and internationally. This will support answering RQ1 and part of RQ2 by allowing for a comparison between countries.
“[insert technology] community benefits evaluation [international/UK/insert country]”
All technologies and internationally. This will support answering RQ1 and part of RQ2 by allowing for a comparison between countries.
“[insert technology] community benefits lessons [international/UK/insert country]”
All technologies and internationally. This will support answering RQ1 and part of RQ2 by allowing for a comparison between countries.
“[insert technology] community benefits impacts [international/UK/insert country]”
All technologies and internationally. This will support answering RQ1 and part of RQ2 by allowing for a comparison between countries.
“[insert technology] community benefits funding arrangements [international/UK/insert country]”
All technologies and internationally. This will allow us to understand the structure of community benefit funds, supporting RQ1 and RQ2
“[insert technology] community benefits management arrangements [international/UK/insert country]”
All technologies and internationally. This will allow us to understand the structure of community benefit funds, supporting RQ1 and RQ2
“[insert technology] mandate/mandated/mandating community benefits [international/UK/insert country]””
All technologies and internationally. This will provide an answer to RQ3, where we can begin to assess the impact of mandating community benefits and what this looks like in practise
“[insert technology] community benefits press release”
This search supports the scoping of what is feasible for the socio-economic analysis. At this stage, a high-level search will be conducted, with more in depth web scraping for data (if possible) to be completed as part of the socio-economic analysis.
Prioritisation approach
A long list of 86 sources were initially identified which were then prioritised using the prioritisation criteria set out below:
Based on existing evidence: Does the document focus on existing practice/examples of renewable projects/developments?
Focus on community benefits: Is the main focus of the document around the provision of community benefits (as opposed to for e.g. broader discussions of social acceptability of renewable energy developments OR community engagement)?
Policy guidance: Does the document include policy recommendations/best practice guidance/reflections on lessons learned?
Geographical scope: Does the geographical scope of the document include Europe, the UK or US?
Peer reviewed / grey literature: Peer reviewed sources were prioritised over grey literature sources.
Additional considerations:
Ensuring the inclusion of evidence on a wide spread of renewable technologies.
Ensuring the inclusion of evidence from both voluntary and mandatory community benefits schemes.
Ensuring the inclusion of evidence from a wide spread of types of community benefits.
Additional sources were added to the short-list of literature as suggested by Scottish Government and stakeholders in the scoping interviews. A total of 35 sources were reviewed in-depth. The final list of literature sources reviewed included 12 peer reviewed academic papers, 20 reports, 2 guidance documents from grey literature (e.g., renewable energy developers, private consultancies) and 1 policy document. The publication years of the reviewed documents ranges from 2011 to 2024, with 22 documents from the last 5 years.
Evidence extraction
The prioritised literature sources were then reviewed and findings relevant to the research questions were extracted into an excel sheet. Ipsos Facto, a Large Language Model, was used to assist with identifying and summarising relevant data.
Scoping interviews
In parallel to the evidence, we conducted four in-depth scoping interviews with industry bodies, trade associations, and members of developer groups to enhance the findings from the evidence review.
The aim of these interviews was twofold:
to understand their views on different types of community benefits and their perceptions of current / best practice arrangements related to community benefits;
to explore options for sourcing data from the industry, including the types of information they think businesses will / will not be prepared to share with us.
Learnings from the scoping interviews were used specifically to inform the design of the subsequent stakeholder engagement and framework development.
Developer interviews
In-depth interviews were conducted with 21 industry developers. Interviewees covered a range of technologies including onshore wind (7), offshore wind (7), solar PV (5), battery storage (6), grid stability (1), hydro (3), pumped hydro storage (3), hydrogen (6 including 2 green hydrogen) and carbon capture, utilisation and storage (2). Among interviewees, 11 were mostly multi-technologies developers and 10 were single-technology developers.
The objectives of the interviews were threefold:
To gather qualitative data on the types of community benefits they have delivered/plan to deliver, views on current arrangement for community benefits and potential different approaches (including mandating for onshore), and what factors have contributed to the provision/ success of their community benefits (i.e. to help inform what parameters are most important in informing potential future community benefits). This will help contextualise the socio-economic analysis and the findings in the report.
To gather quantitative data that we will then use in our analysis, using the parameters set out in the framework (these will be developed further based on CXC/SG feedback). This will include information such as the cost of developing the project(s), value of community benefits, proportion of those values in comparison with turnover/profit, employment impacts etc.
To help reframe/revise the socio-economic analysis framework as required, based on their views on what parameters/variables are important
Ahead of the interview, stakeholders were also requested to complete a ‘Data request sheet’ that aimed to gather data for the socio-economic analysis (see below).
Framework development
The development of the framework to assess the influence of various parameters on community benefits involved a systematic approach following stakeholder interviews. Each initial parameter underwent a comprehensive evaluation to determine the feasibility of its measurement and potential impact on community benefit commitments.
Assessment of measurement challenges. Initially, each parameter was scrutinised to identify any inherent challenges or limitations in its measurement. This involved examining the complexity, availability of data, and any factors that could hinder accurate quantification.
Identification of pre-existing measures. For parameters where it was determined that measurement challenges were minimal or non-existent, existing methodologies and measures were sought. This step involved a thorough review of established metrics and tools already in use.
Development of proxy measures. In cases where no established measures were applicable, proxy measures were devised. This involved identifying the closest available data that could serve as a stand-in to approximate the parameter’s influence on community benefits. These proxies were selected based on their relevance and potential to offer meaningful insights.
Throughout this process, each parameter’s potential to influence community benefits was evaluated. This iterative methodology ensured a robust and nuanced framework, capable of effectively guiding future assessments and decisions concerning community benefit commitments.
Socio-economic analysis
To illustrate the application of the framework, a socio-economic analysis was conducted using a sample dataset of renewable energy projects. This analysis examined the relationship between the parameters detailed in Section 5 and the levels of community benefits, employing the methodologies outlined in the framework.
The analysis focuses on parameters deemed feasible to measure with available methods, specifically revenue and costs, along with technology type. Technology type was used as a proxy for technology maturity, given the current uniformity of maturity levels within each technology. The analysis relied on data from the Community Benefits Register Database, supplemented by additional information obtained through desk research.
For this analysis, the scope included onshore wind, offshore wind, and hydro technologies. These were chosen based on their data availability and relevance to the parameters evaluated.
Appendix B Examples of community benefit-sharing initiatives
Table 2 Examples of community benefit-sharing initiatives and related guidance for renewable technologies in selected European countries (from O San Martin et al. (2022)
Country
Guidance document
Scope of initiative
Scotland
Scottish Government: Onshore Wind Policy Statement (2017); Scottish Government: Good Practice Principles for Community Benefits from Onshore Renewable Energy Developments (2019 Update); and Good Practice Principles for Community Benefits from Offshore Renewable Energy Developments (2018)
Wind farm operators currently utilise both community funding options and shared ownership, both are seen as good practices and responsive to the local community’s specific wishes.
England
Community Benefits from Onshore Wind Developments: Best Practice Guidance for England (2021)
Both a community benefit fund and community shared ownership are recommended. Noted that many developers are providing funds significantly below the recommended amount.
Ireland
Code of Practice for Wind Energy Development in Ireland Guidelines for Community Engagement; and Best Practice Guidelines for the Irish Wind Energy Industry (2012)
ORESS 1 Community Benefit Fund – Rulebook for Generators and Fund Administrators (2023)
Irish wind farm operators currently offer both community funding options and shared ownership; both are seen as good practices.
Netherlands
Dutch Wind Energy Association (NWEA): Code of Conduct for Acceptance & Participation of Onshore Wind Energy (2016)
Both a community benefit fund and community shared ownership are acceptable, but shared ownership is generally preferred and expected by local communities.
Germany
German Wind Energy Association (BWE):
“Collectively Winning – Local Wind Energy”: Framework Paper for the topics added value, public participation, and acceptance (2018);
“Citizen-owned Wind Energy” – Energy from the region for the region (2013)
Best practice in Germany heavily tends towards community stakes/shared ownership in wind farms as the main model of how communities benefit. In contrast, the community funding model is less well-received in Germany.
Appendix C Socio-economic analysis results
To demonstrate how the framework could be used in future, socio-economic analysis was carried out based on a sample of data from net zero energy projects. This analysis explores the relationship between the parameters outlined in chapter 4 and the levels of community benefits, using the methods outlined in the framework.
The parameters in scope of this analysis are restricted to those which have been deemed feasible to measure and for which a suitable method to measure them has been identified These include revenue and costs, as well as technology type (which serves as a proxy for technology maturity, as maturity levels do not vary within technologies currently). It should be noted that this analysis is based on data available from the Community Benefits Register Database, supplemented with additional data sourced through desk research. Due to the data sources available, it only includes onshore wind, offshore wind and hydro technologies.
The subsequent analysis in this chapter presents the relationships between the measurable parameters for which data is available and the level of community benefits.
Key findings
Industry alignment and policy influence. Many onshore wind and hydro projects in Scotland are clustering around the recommended annual £5,000 per MW capacity for community benefits for onshore technologies. However, a significant number of onshore wind and hydro projects (more than half of those analysed in the available dataset) commit less than the recommended amount.
Revenue-benefit correlation. A positive correlation exists between gross project revenue and total community benefit commitments, with larger projects providing bigger packages. However, this relationship weakens for high-revenue projects, suggesting a potential plateau effect.
Costs and benefit packages. There is a positive correlation between total costs and total community benefit packages. For projects costing less than £25 million, when comparing onshore wind and hydropower projects of the same energy capacity and with equivalent community benefit budgets (£5,000 per MW annually), onshore wind offers greater community benefits per pound spent on energy production.
Analysis of community benefit commitments
Many onshore wind and hydro projects in Scotland are aligning with the recommended community benefits package of £5,000 per MW capacity. The clustering of commitments around the recommended amount suggests that policy guidelines are influencing industry behaviour, but full compliance among onshore projects has not yet been achieved. This is observed in Figure 1 by the number of projects committing less than the recommended amount. Of the 282 onshore wind and hydro projects analysed, 177 were committing less than the recommend amount.
There exists a small but notable group of projects that have committed to providing community benefits from onshore renewable energy developments above the recommended £5,000 per MW capacity. These projects may be setting new benchmarks for corporate social responsibility. The strong concentration around the £5,000 figure could indicate an opportunity for standardising community benefit packages across the industry, potentially simplifying expectations for both developers and communities.
Figure 1 Distribution of Annual Community Benefit Commitments per MW – Onshore Projects
Source: Community Benefits Register Database
Figure 2 below illustrates where most of the data points are concentrated and the variation in the data. There are distinct patterns in community benefit commitments across the two different onshore renewable technologies shown. Figure 2 shows that hydro projects commitments range between £456 and £5,000 per MW per year, while onshore wind commitments range between £60-£20,000 (the upper end of this range is not visible in Figure 2 below as this distorted the shape and scales of the figure).
There is a concentration of commitments around the £5,000 figure for both hydro and onshore wind which aligns with the recommended amount (as demonstrated by the width of the violin plot), indicating a level of industry-wide acceptance of this guideline for land-based projects.
Figure 2 Distribution of Annual Community Benefit Commitments per MW by Onshore Technology
Source: Community Benefits Register Database
Figure 3 below shows the distribution of community benefit commitments among offshore projects. It should be noted that there was very low coverage of offshore wind projects captured in the register, and hence efforts were made to manually collect benefits data through desk-based research. This may have resulted in some discrepancies in actual provision versus what projects would have reported through the register. Figure 3 shows offshore wind projects notably committing lower amounts compared to onshore wind and hydro projects, with a range between c.£20-£2,000 per MW per year. It is acknowledged here that this analysis is based on 21 projects out of a possible 47 operational offshore wind projects in the UK[55] and therefore figures should be treated with caution.
Figure 3 Distribution of Annual Community Benefit Commitments per MW – Offshore Projects
Source: desk research
There are several reasons why offshore wind projects might be committing lower amounts than their onshore counterparts. Most importantly, onshore renewable energy projects in Scotland are encouraged to offer community benefits, typically around £5,000 per megawatt of installed capacity annually. This is a voluntary guideline, not a requirement, specifically for onshore projects, and does not apply to offshore projects. Beyond this, offshore wind farms, being located further from communities, might be perceived as having less direct impact on local populations, potentially justifying lower community benefit packages. The offshore wind sector in Scotland is also at an earlier stage of development compared to onshore technologies, with community benefit standards still being defined. This technological and market immaturity means standards for community benefits are still evolving within this sector. In contrast, onshore wind technologies are more established and benefit from years of development and market experience. The advanced state of onshore wind technology may allow for greater efficiency and cost reduction, enabling more substantial community support relative to their offshore counterparts. Moreover, the scale of offshore wind projects may mean that while there are lower per-MW commitments, the overall total community benefits package may still be substantial.
Analysis of community benefit parameters and their impact
Revenue and profit
Figure 4 below illustrates the relationship between estimated gross revenue and total community benefit commitments over the project lifetime. The relationship is split and visualised by revenue levels due to the variation in the strength of the relationship as revenue changes. Blue dots represent projects that have committed £5,000 per MW per year, while red dots represent any figure other than the recommended £5,000 per MW. There is a clear positive correlation between gross project revenue and total community benefit commitments across all renewable energy projects in Scotland. This suggests that as projects become more financially substantial, they tend to provide larger community benefit packages. As project size increases in revenue terms, there is a widening range of community benefit amounts. This indicates that larger projects have more diverse approaches to community support. The relationship between gross revenue and community benefits appears to weaken for larger revenue projects. This suggests a potential plateau effect where community benefit increases do not keep pace proportionally with revenue growth beyond a certain point.
Small (under £35m gross revenue) and medium-sized (£25-250m gross revenue) projects frequently demonstrate commitment to the recommended £5,000 per MW amount, suggesting strong guideline adherence among projects of these scales. Across these sized projects, there are few instances of commitments exceeding the recommended amount relative to their revenue, suggesting a general reluctance to exceed standard guidelines.
Figure 4 Community Benefits Package by Gross Revenue Bucket (Under £25M, £25M-£250M and £250M+ Gross Revenue)
Source: See appendix F (Recommended data sources)
Deployment and Operating Costs
Figure 5 below shows the relationship between estimated total cost of production, expressed as the average cost of producing one unit of energy (LCOE – £/MWh) multiplied by total expected production over the project lifetime, and total community benefit commitments over the project lifetime. As above, the relationship is split and visualised by total cost of production levels due to the variation in the strength of the relationship as total cost changes. There is a positive correlation between total cost of production and total community benefit packages across all project sizes, suggesting that as total costs increase, as does the size of the overall commitment to community benefits. The correlation between total cost and total community benefit are relatively strong (Pearson correlation coefficient[56] = 0.56) at lower total cost levels (under £25M total cost). This increases to 0.62 for mid-sized projects (£25-250M total cost). However above £250M total costs, there is no correlation (Pearson correlation coefficient=-0.002), indicating that total cost plays less of a role in determining community benefits at large cost levels.
While this may appear contrary to the views of developers shown earlier (i.e. those who said that high costs can impact on financial viability and therefore their ability to offer community benefits) it should be noted that this data analysis is based only on projects that were already providing monetary community benefits. It excludes those that had not provided any benefits. It can therefore be assumed that the dataset excludes those projects that were deemed not financially viable enough to enable community benefit provision.
This analysis goes further to explore whether there are any differences by technology class within onshore projects only (offshore projects have been removed at this stage as the recommended £5,000/MW applies only to onshore technologies). In order to do so, it is important to control for project size (as measured by MW capacity), so as not to produce spurious results. Figure 6 illustrates how many pounds (£) are allocated to community benefits for every pound (£) spent producing energy, categorised by the project’s size in capacity (MW). Blue dots represent projects that have committed less than the recommended £5,000 per MW per year, while green dots represent projects that have committed more than the recommended amount and red dots represent project that have committed the recommended £5,000 per MW. For projects with total production costs under £25 million, when comparing hydro and onshore wind projects of the same capacity that both allocate £5,000 per MW annually to community benefits, onshore wind projects are actually providing more community benefits per pound (£) spent on energy production than hydro projects.
Figure 5 Community Benefits Package by Total Cost of Production Bucket (Under £25M, £25M-£250M and £250M+ Total Cost)
Source: See appendix F (Recommended data sources)
Figure 6 Community Benefits Package by Total Cost of Production Bucket (Under £25M, £25M-£250M and £250M+ Total Cost)
Source: See appendix F (Recommended data sources)
Appendix D Methodologies for estimating revenue and costs
Expected Generation (MWh) = Capacity (MW) * Capacity Factor* Hours in a year
Breaking down these components:
Installed Capacity (MW): This represents the maximum power output of the project under ideal conditions. This data is readily available from the Renewable Energy Planning Database (REPD).
Capacity Factor: This represents the actual output of a project as a percentage of its maximum potential output over a specific period. Historical capacity factors for certain technologies (onshore wind, offshore wind, hydro, landfill gas, and sewage sludge digestion) in Scotland can be found in the Energy Trends: UK Renewables publications[57].
Addressing Missing Capacity Factors: For technologies where Scotland-specific capacity factors are unavailable (e.g., solar PV, tidal, wave, biomass), several approaches can be used:
UK-wide Proxies: Use UK average capacity factors as a starting point, acknowledging this as a limitation and potential source of error.
Technology-Specific Adjustments: Adjust UK proxies based on technology and location characteristics. For example, solar PV capacity factors are influenced by latitude and solar irradiance. Tools like PVGIS can provide location-specific solar irradiance data to refine estimates (this approach is out of scope for the analysis in this study).
Average Annual Electricity Price (£/MWh): This represents the average price received for each MWh of electricity generated over a year. Given the difficulty of obtaining project-specific PPA data, the wholesale market price serves as a practical proxy.
Wholesale Price Data Sources: While real-time wholesale price data requires plugging into Elexon’s BMRS API, a simplified approach for this framework should entail using Ofgem’s published weekly wholesale day-ahead price data[58] to calculate annual averages. These are GB-wide averages, and hence regional variations should be recognised as a limitation.
Simplified CfD Approach (for CfD-supported projects): For projects under a Contract for Difference (CfD) the strike price is a guaranteed price. This figure is a conservative estimate of returns, as actual revenue could be higher if market prices exceed the strike price. CfD data is available from the Low Carbon Contracts Company (LCCC).
Estimating Future Revenue (also applicable for projects not yet operational) – Generation Projects
For revenue in future years, or for projects under development or construction, estimating future revenue requires additional considerations:
Project Lifetime Assumption: Specify a reasonable assumed operational lifetime for the technology (e.g., 25 years for offshore wind, 20-25 years for solar PV). This assumption directly impacts total revenue calculations.
Future Capacity Factor Estimation: Project future capacity factors based on recent trends and technological advancements. If historical capacity factor data for the specific technology in Scotland (or a similar region) is available, this trend should be analysed over the past years.[59] This trend should be extrapolated outward to estimate future capacity factors. For less established technologies with limited historical data, the technology’s maturity should be considered. Rapidly evolving technologies may see more significant performance improvements expected while more mature technologies might expect to see more stable future performance anticipated. For example, floating offshore wind might be expected to see larger capacity factor gains in the coming years compared to a more established technology like onshore wind.
Future Electricity Price Estimation: Given the volatility of electricity markets, projecting future prices is challenging. For projects supported by a Contract for Difference (CfD), the strike price offers a guaranteed future revenue stream and can be used as a conservative estimate. For non-CfD projects, where future revenue is directly exposed to market price fluctuations, a simplified approach involves using the average annual CfD strike price for the corresponding technology in each future year. However, it’s essential to acknowledge that:
CfD strike prices are influenced by auction dynamics and may not perfectly represent the market value of electricity from non-CfD projects.
Not all technologies are represented in CfD auctions.
Using CfD strike prices as proxies across all non-CfD projects might result in a somewhat conservative revenue estimate, as market prices could exceed the strike price in some years.
Prices beyond the latest future year reported in the CfD auction reports are set at the price in the latest year for the respective technology. For example, if CfD auction strike prices are set for the year 2027, the strike price in all future years will be set at the prices in 2027 for that technology. It is acknowledged these prices are unrealistic, however, they serve as the most appropriate benchmark against which to extrapolate.
Discounting Future Cash Flows: To compare projects and scenarios, discount future revenue streams to their present value using an appropriate discount rate that reflects project risk. We propose using the technology-specific discount rate of 10% used by DESNZ in their Levelised Cost of Electricity (LCOE) methodology documents.
Total Cost of Production Calculation
Total Cost of Production Calculation – Generation Projects
Estimating the total lifetime cost of production across the range of projects in scope requires a consistent and transparent method to apply cost assumptions across different generation technologies. To support this, we use benchmark Levelised Cost of Electricity (LCOE) estimates published by DESNZ.
DESNZ’s LCOE values represent the average lifetime cost (£/MWh) of generating electricity for each technology type. These figures include all relevant capital, operational, fuel, and decommissioning costs, spread over the expected lifetime electricity output of a project. As such, LCOE is a useful and well-recognised benchmark for comparing the cost-effectiveness of electricity generation technologies in the UK.
Importantly, we are not re-estimating or recalculating LCOE. Instead, we are using DESNZ’s published LCOE values as input parameters in our framework to estimate total cost of production across different project configurations. Specifically, we apply the LCOE estimates to the expected energy output of each project to calculate a total cost figure. This calculation can be expressed as:
Total Cost of Production (£) = LCOE (£/MWh) x (Installed Capacity (MW) x Load Factor x Annual Operating Hours x Project Lifetime (years))
This approach allows us to derive a consistent estimate of total production cost, using technology-specific LCOE values as cost rates, scaled by the expected energy output of each project over its lifetime.
The process for estimating total cost of production is as follows:
Technology categorisation: Categorise REPD projects to align with the technology categories used in the UK Government’s LCOE estimates file. This may involve mapping project types to the closest matching category in the government data.
Energy Output Calculation: Estimate the annual energy output (MWh) for each project based on its capacity and typical capacity factors for the relevant technology.
Total calculation: Using the scaled cost components and estimated energy output, we will calculate the total cost for each project using the formula. It’s important to note that the UK Government’s LCOE estimates are provided for projects with commissioning dates in 2025, 2030, 2035, and 2040. Therefore, our total cost calculations will need to be based on the estimate that most closely matches each project’s expected commissioning date. We will assign each project to the nearest available estimate year based on its planned commissioning date.
Inflation-adjustment: Furthermore, all costs in the UK Government’s estimates are reported in 2021 prices. To ensure consistency and accurate comparisons across projects with varying commissioning dates, we adjust these figures to a common base year using HM Treasury GDP deflators. These temporal adjustments will help ensure that our total cost calculations accurately reflect the economic conditions and technological advancements expected at the time of each project’s commissioning, within the constraints of the available data.
Appendix E Socio-economic scoring mechanisms
Table 3 NASA Technology Readiness Levels
TRL
TRL Summary
1
Basic principles have been observed and/or formulated: Lowest level of technology readiness. Scientific research begins to be translated into applied research and development (R&D). Examples might include paper studies of a technology’s basic properties.
2
Developing hypothesis and experimental designs: Invention begins. Once basic principles are observed, practical applications can be invented. Applications are speculative, and there may be no proof or detailed analysis to support the assumptions. Examples are limited to analytic studies.
3
Specifying and developing an experimental Proof of Concept (PoC): Active R&D is initiated. This includes analytical studies and laboratory studies to physically validate the analytical predictions of separate elements of the technology. Examples include components that are not yet integrated or representative.
4
PoC demonstrated in test site/initial evaluation of costs and efficiency produced: Basic technological components are integrated to establish that they will work together. This is relatively “low fidelity” compared with the eventual system. Examples include integration of “ad hoc” hardware in the laboratory.
5
Technology/process validated in relevant environment: Fidelity of breadboard technology increases significantly. The basic technological components are integrated with reasonably realistic supporting elements so they can be tested in a simulated environment. Examples include “high-fidelity” laboratory integration of components.
6
Technology/process validated in operational environment: Representative model or prototype system, which is well beyond that of TRL 5, is tested in a relevant environment. Represents a major step up in a technology’s demonstrated readiness. Examples include testing a prototype in a high-fidelity laboratory environment or in a simulated operational environment.
7
System complete and qualified: Prototype near or at planned operational system. Represents a major step up from TRL 6 by requiring demonstration of an actual system prototype in an operational environment (e.g., in an aircraft, in a vehicle, or in space).
8
Product/technology in manufacture/process being implemented: Technology has been proven to work in its final form and under expected conditions. In almost all cases, this TRL represents the end of true system development. Examples include developmental test and evaluation (DT&E) of the system in its intended weapon system to determine if it meets design specifications.
9
Product/service on commercial release/process deployed: Actual application of the technology in its final form and under mission conditions, such as those encountered in operational test and evaluation (OT&E). Examples include using the system under operational mission conditions.
Fully Mature Market: A fully mature market is characterized by high levels of competition, well-established regulatory and policy frameworks, and a global supply chain. The technology is fully integrated into the energy system, and investment is based on market forces rather than policy incentives. The market operates efficiently with clear pricing signals. Hydropower, especially conventional dam-based installations, has a fully mature market with a global presence and long history of integration into energy systems.
4
Established Market: Established markets have a stable and supportive regulatory environment, a robust and competitive supply chain, and a broad base of stakeholders. Investment is seen as lower risk, and financing models are well understood. There is strong competition, and the technology is a significant part of the energy mix. Onshore wind and solar PV have both reached this level of market maturity, with widespread adoption and a solid market presence.
3
Growing Market: At this stage, markets are experiencing noticeable growth in demand and investment. The regulatory environment is becoming more supportive, with clearer policies and standards. The supply chain is expanding, and costs start to decrease as economies of scale are realized. There is a healthy level of competition with several established players. Fixed-bottom offshore wind is at this stage, with a growing number of projects and increasing investor confidence.
2
Emerging Market: Markets at this stage have begun to establish some regulatory frameworks and attract early adopters. The supply chain is forming but may not be fully reliable or cost-effective. There is a growing interest from investors, but financing often depends on policy incentives. Competition is limited, but there are signs of market growth. Floating offshore wind, which is beginning to see commercial interest and investment, but lacks the extensive market presence of fixed-bottom offshore wind, would fall into this category.
1
Nascent Market: The market at this stage is in its infancy. There are few, if any, regulatory standards or guidelines, and the supply chain is undeveloped. Investment is highly speculative, and there are very few players in the market. The technology may still be reliant on grants or government support with no established commercial financing models.
Appendix F Recommended data sources
The following below provides a summary of the key data sources currently available to measure framework parameters. However, these are not complete and additional work is required to fill gaps.
Parameter
Measurement item
Recommended data source
Community Benefit
Community benefits monetary value (£)
Community Benefit Register Database. Since the database does not cover all technologies, this would need to be supplement with data from individual developers, either through requesting this directly or sourcing it from company reports (where available).
Technical maturity
Technology maturity scoring
NASA TRL Scale
IEA ETP Clean Energy Technology Guide. While the database is comprehensive in its technology classification, there is likely to be some mis-classification of REPD projects to specific IEA ETP technologies. Ideally, project TRLs should be sourced directly from project owners.
Project revenue
Installed capacity
Community Benefit Register Database and REPD
Capacity factor
Energy Trends: UK Renewables publications. Historical capacity factors are only available for certain technologies. Newer technologies are therefore not captured and will need to be sourced directly from projects.
Electricity price
Elexon
Ofgem wholesale day-ahead price
CfD strike price
Low Carbon Contracts Company
Capital and operating costs
Technology categorisation
UK Government’s LCOE estimates. This data source captures LCOE for a selection of common technologies. More niche/newer technologies are not captured within this data source and therefore should be collected directly through projects.
Energy output
REPD
Energy Trends: UK Renewables publications
How to cite this publication:
Mulholland, C., Jones, R., Tapie, N. and Stow, C. ‘Renewable energy technologies and community benefits’, ClimateXChange. http://dx.doi.org/10.7488/era/6396
While every effort is made to ensure the information in this report is accurate as at the date of the report, no legal responsibility is accepted for any errors, omissions or misleading statements. The views expressed represent those of the author(s), and do not necessarily represent those of the host institutions or funders.
This work was supported by the Rural and Environment Science and Analytical Services Division of the Scottish Government (CoE – CXC).
Community benefit funds typically mean that developers will voluntarily contribute a certain amount of funding to local communities. In some cases, the level of funding is linked to the amount of installed capacity of the project or the amount of energy produced. ↑
Kerr et al (2017), Anchustegui (2021), Kerr & Weir (2018), O San Martin et al (2022), Scottish Government (2022), Scottish Government (2019), Scottish Government (2018) ↑
In the reviewed literature, shared ownership was a common practice in countries outside the UK, notably in Germany and Denmark. However, this is not outlined here as shared ownership is not part of the Scottish Government’s definition of community benefits. ↑
le Maitre, 2024; Toledano, et al., 2023; O San Martin, et al., 2022; ↑
Four operational offshore wind projects were in Scotland, two in Wales and fifteen in England. ↑
The Pearson correlation coefficient measures how strongly two variables are linearly related, ranging from -1 (perfect negative correlation) to 1 (perfect positive correlation), with 0 indicating no linear relationship. ↑
It is recommended to aim for a minimum of 5 years of historical data. This provides a reasonable basis for identifying trends and patterns, while also smoothing out short-term fluctuations or anomalies. ↑
Minimising peat excavation is crucial in order to avoid carbon emissions, protect biodiversity and ensure downstream water quality. Built development on peatlands results in the excavation and disturbance of peat. In order to ensure evidence-based planning and consenting decisions there is a need to gather evidence on the impacts and opportunities regarding the reuse of excavated peat. This will help to inform how best to balance the benefits of renewable energy with the need to protect and restore peatland habitats, ensuring sustainable development practices.
This project investigates the opportunities, impacts, and challenges associated with the reuse of excavated peat from windfarm construction sites. It provides a greater understanding of the current knowledge concerning wind farm development on peatland, peat and peaty soils across Scotland. We propose a hierarchy of peat reuse options based on environmental impact and offer recommendations for data collection and monitoring to enhance the evidence base.
The research combined a review of published evidence with stakeholder engagement and site visits.
Findings
We found very little academic research specifically investigating best practice for the reuse of peat on windfarms. We therefore used stakeholder discussions and site visits to understand the current situation, what is occurring at different sites within Scotland, and likely environmental costs and benefits of different reuse options.
Key issues
Avoidance of peat excavation: Minimising peat excavation is crucial. As a critical first step of the mitigation hierarchy, different stakeholders agree the need to limit volumes to protect peatland, biodiversity, and maintain hydrological connectivity.
Preparation and planning issues: Site surveys often lack the requisite detail to effectively avoid deep peat areas during construction. It also leads to problems with planning how to reuse greater volumes of peat than expected. Additional training for construction operatives would enable them to minimise peat disturbance and maintain the excavated peat’s structure.
Carbon storage: Accurate carbon calculations are needed to fully understand the impact of the wind farm. However, this study found that more peat is often excavated than planned, highlighting the need for greater accuracy in carbon excavation measurements. Monitoring the condition of reused peat is also necessary to enable better understanding of carbon storage and other ecosystem services.
There are a range of construction activities that result in the excavation of peat, such as the construction and maintenance of roads and tracks, compounds and substations, crane pads and turbine blade laydown areas, cabling, drainage ditches and borrow pits. The main reuse methods include borrowpit reinstatement, restoration activities and landscaping. These reuse options may have varying environmental outcomes (Table 1), consideration for which needs to be part of the planning process when constructing a wind farm and planning the reuse of excavated peat within the project.
Recommendations
Recommendation 1: Guidance on excavation peat reuse
Because detailed evidence to confirm the different environmental outcomes is not available, we recommend a simple hierarchy of peat reuse options accompanied by additional guidance and requirements, which are essential for maximising environmental outcomes. We recommend this comprises:
Recommendation 1a: Preparation and planning steps:
Avoid / minimise peat excavation wherever possible and
Appraise site circumstances and locally relevant potential reuse options
Recommendation 1b: Hierarchy of peat reuse
Recommendation 1c: Peat reuse implementation principles: to guide the site-specific choice of methods and implementation to maximise environmental outcomes.
The hierarchy is not useable as a standalone guide – it must be accompanied by the additional components – as shown in Figure 1 below.
To ensure the multiple potential environmental benefits of peat reuse are considered, avoiding a single-issue focus.
To ensure a balanced approach to peat reuse, we recommend targeting the following environmental outcomes:
Minimising carbon loss: Reducing carbon emissions from excavated peat.
Positive biodiversity outcomes: Achieving biodiversity goals at both local and national levels.
Ensuring downstream water quality: Minimising sediment and nutrient load in water bodies.
Recommendation 3: Enhanced monitoring of environmental outcomes from reuse of peat
Enhanced research and monitoring are required to improve and inform the reuse hierarchy and implementation of best practice techniques going forward:
Post-construction assessment: Providing accurate peat excavation volumes at the end of construction to build a dataset to be used within the sector for more accurate carbon calculations and reuse planning.
Post-construction monitoring: Regular monitoring of wetness of the peat, carbon fluxes and vegetation surveys to understand the broader environmental impact of peat reuse.
Data sharing and collaboration: Encouraging greater data sharing and collaboration between energy companies and the academic community to refine the reuse hierarchy and best practice in the field.
Next steps and future research
These results highlight our current understanding of peat reuse methods occurring in wind farm construction in Scotland. We have highlighted which environmental issues are critical and how the reuse of peat can maintain the habitat, allowing for environmentally conscious construction techniques to take precedence.
However, a clear conclusion from the information gained during this process is that planning prior to construction is key, as well as ensuring that stakeholders work together to achieve best practice.
After these main outcomes from the hierarchy, the attention needs to focus on delivering site specific reuse. It also became apparent that although there is a lot of knowledge within the peatland and wind farm sectors, there have been limited studies collecting data to inform best practice. This needs to be encouraged to understand current research gaps and advise on the right management methods to reduce peatland degradation in the long term.
Table 1: Synthesis of reuse options and simplified overview of potential environmental outcomes (Note: this table summarises potential outcomes indicated by research during this study, but evidence is limited and site-by-site circumstances vary significantly so currently this differentiation on environmental grounds cannot be fully reflected in the recommended ‘hierarchy of peat reuse’.)
Method of reuse
Carbon store
Hydrology connectivity
Availability
Comment
Borrow pit reinstatement
++
Low risk of carbon loss
Low chance of carbon sequestration (carbon increase) in the long term
+
Only if well planned, with impermeable layers and outflows built in
+++
Large storage potential, should have capacity for all excavated peat, however where there is more (or less) peat than planned may lead to issues
Borrow pits have potential to provide an environmentally robust reuse option, however only if best practice is followed and there are contingencies in place if changes in planned volumes occur
Around turbine foundations and crane pad verges
—
High risk of carbon loss through peat drying out and erosion
–
When constructed these areas will automatically have drainage channels cut. The reuse of peat here will likely be impacted by this drainage
+
Small volume
Use to encourage vegetation re-growth around construction areas. Often used as a way of merging the built infrastructure with the surrounding landscape
Side of road/ track or “landscaping”
–
Risk of carbon loss through peat drying out and erosion, however if vegetation regrowth occurs this is less likely
–
Addition of peat should connect the reused peat with wider environment to maintain hydrology, however this depends on flow patterns and drainage channels across roads
+
Small volume
If vegetation regrowth occurs and there is limited bare peat this has potential to become part of the wider landscape
Incorporation of peat in restoration / reinstatement projects
+++
Low risk of carbon loss, has potential to build carbon (dependent on restoration / reuse project)
+++
If well planned, should have hydrological connectivity with landscape
+
Small volume
Usually these projects are highly monitored to assess progress – useful for data gathering in the short term alongside the benefits of using excavated peat in areas that may have been degraded previously
Glossary
Acrotelm
The upper of two layers in peatland system. Acrotelmic peat consist of fresh or newly decomposed peat forming vegetation and is generally quite fibrous This layer possesses some tensile strength and depending on the height of the water table can be anoxic.
Arisings
Excavated material that is created during excavation and construction activities.
Blanket Bog
A type of peatland that is relatively rare globally, however, commonly found in Scotland, due to its cool, wet climate. Blanket bogs are characterised by a peat depth of 0.5 to 3m, situated on flat or gentle slopes and have poor drainage (see ‘Raised Bog’ below as alternative type).
Borrow pit
In windfarm development, an excavation site (or quarry) where materials like soil, gravel, or rock are dug up for use in the construction. These materials are typically used for building access roads, turbine foundations, and other infrastructure.
Catotelm
The lower of two layers in a peatland system. Catotelmic peat consist of waterlogged, highly decomposed dense organic material with low tensile strength. This layer is highly amorphous and tends to disrupt completely on excavation causing difficulty with handling and storage.
Dissolved organic carbon
Organic carbon compounds that can pass through a filter with a maximum pore size of 0.7 micrometres.
EU Habitats Directive (92/43/EEC)
A European directive for the protection and conservation of natural habitats and of wild fauna and flora which has been transposed into Scottish legislation through the Habitats regulations, amended in 2021 post EU exit. https://eur-lex.europa.eu/eli/dir/1992/43/oj/eng
Peat
Peat is an organic material that forms in cool, waterlogged conditions. It consists of partially decomposed organic matter, primarily plant material and no mineral fraction. Over time, the accumulation of this organic material creates a peat and peaty soil that are rich in carbon.
Peat soil
Also referred as organic soil, in Scotland it is defined as soil with a surface peat layer with more than 60% organic matter and of at least 50cm thickness.
Peaty soil
Organo-mineral soil which have a shallow peat layer at the surface (less than 50cm thickness) over mineral layers.
Peatland
Peatland is defined by the presence of peat soil or peaty soil types. This means that “peat-forming” vegetation is growing and actively forming peat, or it has been grown and formed peat at some point in the past. It is a type of wetland ecosystem where peat material accumulates. These areas are characterized by waterlogged conditions that slow down the decomposition of organic matter, leading to the formation of peat. Peatlands have a specific type of vegetation, are rich in biodiversity and play a crucial role in carbon storage. Peatlands can include blanket bog, upland raised bog, lowland raised bog and fens.
Peatland Management Plan
A Peatland Management Plan used in development projects on peat typically includes several key components to ensure the sustainable use and conservation of peatland ecosystems. The plan describes baseline peat conditions, detail on excavation and reuse volumes and potential impact, how the peat will be handled, stored, or reused once extracted. This is an integral part of consent conditions.
Piled foundations
Deep foundations that use long, thin columns (piles) driven or drilled into the ground to support wind turbine structures. These foundations are essential for ensuring stability, especially in areas with weak or variable soil conditions and high-water tables. Also reduce the volume of peat needed to be excavated.
Priority peatland habitat
Peatland habitats can be divided into four broad classes (blanket bog, upland raised bog, lowland raised bog and fen), depending on the types of plants that formed the peat. Priority peatland habitats are sub-sets of these broad habitats which have been recognised under the Scottish Biodiversity Framework as being important to protect for their conservation and biodiversity value.
Raised Bog
A type of wetland characterized by a dome-shaped surface of peat, formed by the accumulation of partially decayed plant matter, which rises above the surrounding groundwater levels and is primarily fed by rainfall rather than groundwater.
Reinstatement
Using peat and/or peatland vegetation that has been removed or excavated during the construction of a development, often surrounding infrastructure. This form of peat use involves protecting excavated peat, and returning it to where it was taken from, in its original order (acrotelm overlying catotelm). This should aim to reinstate the hydrology of the returned material to support peatland function following best practice, although full return of function is very difficult to achieve.
Restoration
Carrying out interventions which in combination with natural processes restores the hydrological function, coverage and condition of peatland habitat vegetation, resulting in a peatland that is actively forming peat and hence sequestering carbon. Further detail will be stated in the forthcoming Scotland’s Peatland Standard.
Revegetation
Using excavated peat and/or vegetation in the surrounding construction infrastructure or for landscaping. This form of peat use will often result in revegetation but may not result in functioning peatland. Nevertheless, it can have a role in protecting the surrounding peatland conserving carbon and biodiversity providing that best practice is followed.
Abbreviations
CO2
Carbon dioxide
DOC
Dissolved organic carbon
ECoW
Ecological Clerk of Works
GHG
Greenhouse Gas
IUCN
The International Union for Conservation of Nature
ha
Hectares
HRA
Habitats Regulations Appraisal
km
Kilometres
kWh
Kilowatt-hour
m
meters
MW
Megawatt
NPF4
National Planning Framework
PEAG
The Scottish Government’s Peatland Expert Advisory Group
PMP
Peatland Management Plan
POC
Particulate organic carbon
REA
Rapid evidence assessment
SEPA
Scottish Environment Protection Agency
WMLR
Waste Management Licensing (Scotland) Regulations
Introduction
Aims and scope
This project explored opportunities, impacts and challenges for the reuse of excavated peat from windfarm development sites. It is intended to inform application of National Planning Framework 4 (NPF4), regarding the development of wind farms on peatland, peat and peaty soils. It aimed to provide recommendations for a hierarchy of peat reuse options based on environmental impact along with recommendations for data collection and monitoring to continually improve and update the evidence base.
The project focused on gathering evidence of impacts and opportunities for excavated peat reuse on-site but also considered potential for positive off-site opportunities. Evidence of environmental costs and benefits in terms of emissions, peatland function, habitat, biodiversity, hydrology, stability and structure in relation to reuse practices was evaluated.
Defining ‘reuse of peat’ for this report
This report was commissioned to understand the reuse of peat on wind farm sites during the construction process. We recognise there are differing definitions of “reuse”.
Throughout the study we adopted the definition of “reuse” of peat as:
the use of peat and/or peatland vegetation that has been excavated during the construction of a wind farm.
In this context, the “reuse” of peat can involve reinstatement, revegetation or restoration processes both onsite and offsite, during the construction of a wind farm.
Research methods
A combination of research methods were used:
A Rapid Evidence Assessment to gather and evaluate the academic literature and other relevant studies.
Desk-based evaluation of existing wind farm developments on peatland in Scotland to understand current practices.
Site visits to active and completed wind farm developments on peatland to observe examples of reuse practices in situ.
Stakeholder engagement, via discussions during site visits, individual research interviews and a workshop to complement desk-research.
It was anticipated that there was limited literature available – in the absence of this, the site visits and stakeholder engagement were critical to the project. Full details of methods are provided in the Appendices.
Background
Scotland is committed to reaching net zero by 2045, how we use and manage our land is vital to achieving this, including the use of land to produce renewable energy. Balancing the benefits from renewable energy with land-based emissions and nature and biodiversity goals is vital, particularly where wind farms intersect with sensitive habitats, like peatland and on carbon-rich soils.
Globally, peatlands are the largest terrestrial carbon store estimated to hold 660 gigatonnes of carbon and 10% of non-glacial freshwater, however, only 17% of these ecosystems are protected (Austin et al., 2025). Globally, 20% of all blanket bogs are located within the UK and Ireland[1]. In Scotland alone, blanket bogs cover around 1.8 million hectares, which is 23% of the land area (Ferretto et al., 2019). Situating new wind farms in the right location is crucial. Although wind farm developments are expected to save carbon emissions by offsetting fossil energy sources (Renou-Wilson and Farrell, 2009), where wind farms are situated on peatlands, there is a risk of land-based carbon emissions, negating the reduction associated with offsetting fossil energy sources. The quality of the peatland habitat is an important factor, as areas that are already degraded and emitting carbon, could be improved through restoration of the whole environment. When applications are made for wind farm construction there are often enhancement conditions attached to these new developments leading to restoration, but some restoration may have been necessary without the wind farm construction occurring. Peatland condition categories[2] range from pristine, near natural, modified, drained and actively eroding in relation to GHG emissions and restoration potential. Historically, Scotland’s peatlands have not been protected across the whole habitat, with afforestation being prioritised up until recently. Wind farm construction in these areas, is likely to lead to environmental improvements, with stakeholders working together to reduce peatland degradation and ambitious programmes of peatland restoration being undertaken.
Overall, the literature searches presented over fifty academic studies and governmental reports, which provided useful information related to the impact of landscape management on peatland as well as some interactions between peatland and wind farm developments. However, there were no empirical studies monitoring changes in reused peat on windfarm developments over time. This is a major research gap. Understanding how the reuse of peat may change the peat itself had to be extrapolated from studies measuring changes within laboratories or evaluations of the landscape scale after a number of years since wind farm construction had occurred. Studies did consider the impact of peat excavation on the environment, hydrology and risks of erosion or the degradation of the peatland habitat. The literature did present a large number of studies focusing on the restoration of peatland habitats, however, these were not readily extrapolatable to the current study on reuse of peat, as the parameters related to restoration are substantially different. A large number of the papers and reports were focused on the Scottish environment which suggests that Scotland is leading the way in this area of research.
Summary of stakeholder engagement achieved
We obtained contributions from 31 individuals during our stakeholder engagement (for a more in-depth synopsis of stakeholder engagement findings see Appendix). Stakeholders highlighted what they viewed as the positive features of some reuse options, such as where the water flows in borrow pits (one method of peat reuse) have been managed to keep the water table near the surface. Stakeholders we spoke to were aware of the gaps in evidence and lack of specific studies and so based their views on their own observations or monitoring on sites they were involved with. Overall stakeholders agreed that a number of factors need to be considered carefully to have any chance of achieving optimal environmental outcomes from reuse of peat on windfarm sites – simply putting peat in a convenient location on site would not be beneficial as peat would dry out, erode or lose its structure and functioning. Key considerations were – what was the condition of peat prior to excavation, the need to plan how to minimise disturbance, handling, drying and transport of peat after excavation, consideration of the water levels and flows, vegetation cover and the stability of reused peat in situ.
Summary of site research conducted
During five site visits across varied locations in Scotland, a range of different peat reuse practices were observed including:
different approaches to infilling borrow pits,
use in landscaping (for example alongside tracks or to cover cables),
infill of other site features including historical peat cuttings,
incorporation of peat into peatland restoration.
Across sites the condition of peat prior to excavation and reuse varied, as did the nature of reuse even where the same general type of reuse was used, for example borrow pit size, shape, fill level, structure, hydrology and vegetation varied across sites where this practice was used. For more information related to site visits see the Appendix.
Summary of literature and stakeholder research findings
In Scotland, peatlands store over 2,735 million tonnes of carbon covering approximately two million hectares (Smith et al., 2007), equating to around 25% of Scotland’s land area. These peatlands are often considered good candidates for onshore wind farms due to the windy and exposed environments they are located in and because they are often considered poor (or unprofitable) for other land uses, like forestry and farming activities.
The main construction activities which result in substantial disturbance for a wind farm development are track construction for maintenance and access roads, trenches for cabling, quarried aggregate extraction (borrow pits) and turbine foundation excavation. This large-scale disturbance can affect peat stability, degradation (such as habitat condition, plant assemblages, carbon storage, etc), as well as the hydrology of the habitat. Other disturbances are related to building infrastructure to support the wind farm development like crane pad constructions, temporary and permanent compounds, as well as substations to join the electricity generated to the grid. Estimates of the direct disturbance to the peatland habitat per wind turbine vary greatly but have been reported to be between 0.2 to 1 hectare per turbine, with the turbines within a wind farm usually taking up less than 10% of the wind farm area (Sander et al., 2024). However, if this area is on deep peatland, there will be greater environmental impact, than on shallow peat or mineral soils.
Larger turbines, which are more widely spaced (typically on a 300-500 m grid, with the distance between turbines around five times rotor diameter), capture energy on a much smaller spatial ‘footprint’ than smaller ones on wind farms (Renou-Wilson and Farrell, 2009). However, this is also site-dependent and varies if repowering occurs, as repowering may use the same footprint as the previous turbines, or it could locate the turbines at a new area within the development, thus increasing the environmental impact.
Construction of a wind farm requires a significant array of associated infrastructure to be installed, this infrastructure may have impacts on the surrounding peatland either through the removal of peat from that habitat, removal and replacement of peat in less suitable locations or reducing the quality of the environment within the area the peat was moved to, compression, flooding, drainage, erosion or mass movement of the peat (Lindsay, 2018). Active peatlands are hydrologically linked and naturally stabilised therefore if hydrologically disrupted, the stability can be lost (Wawrzyczek et al., 2018). An unstable habitat can lead to wider environmental problems, with issues greater than just carbon loss, for example peat slides.
Peat and windfarms in Scotland
Peat is an amorphous organic deposit, considered to be the largest terrestrial carbon store. Peat is highly compressible and porous consisting of up to 90% water by volume. Active peat-forming mire has also been found to be effective in delaying storm run-off, reducing soil erosion and retaining inorganic nutrients when it is undrained (Bragg, 2002).
Across Europe it has been calculated that 25% of peatlands are degraded (Tanneberger et al., 2021). Under the EU Habitats Directive (92/43/EEC), there are 36 European regions with designated blanket bogs and of these, 12 have wind farm developments, including 644 wind turbines, 253 km of vehicular access tracks and an affected area of ~208 hectares, mainly in Ireland and Scotland where the extent of peatland is also higher (Chico et al., 2023). However, when this is compared to the Scottish soil maps, the extent of wind farm developments in Scotland on peatland is even higher, with 1,063 wind turbines and 635 km of vehicular access tracks on peatland in Scotland alone according to national inventory data (Chico et al., 2023).
Currently, 48% of wind farms in Scotland have already been built on peat[1] with this number likely to increase in the future. Wind farm developments can have an impact on the peatland habitats and emissions, during construction, operation, and decommissioning stages. This reduces the wind farms’ ability to reach the goal of net zero. Using a carbon calculator[2] to assess the carbon saving of wind farm developments compared to carbon lost through construction on Scottish peatland provides guidance on a wind farm’s carbon footprint. However, due to the heterogeneity of peatlands and the lack of detail at the required scale when completing peatland surveys pre-planning, it has been found that the amount of peat excavated is often more than the amounts used within the carbon calculations.
Both in discussion with stakeholders and within the literature, the instability of peat deposits was highlighted, with small movements leading to slope terracing, slumps or the collapse of peat banks – these events are relatively common. Furthermore, disturbed peat can lose more than 50% of its strength compared to undisturbed peat and, in many cases, behaves as a viscous material that will readily flow, particularly when affected by high rainfall (Jennings and Kane, 2015). These inherent properties of peat carry risk and need to be considered during the wind farm construction process as the destabilisation of peat mass through drainage or excavation operations could lead to an increase in landslides / bog flow events (Dykes, 2022).
From discussions with stakeholders, it is clear that the exact volume of peat to be excavated can differ from estimates calculated in the EIA at application stage. This is usually due to a combination of initially unknown factors prior to the construction process – the exact depth, viscosity and bulk density of the peat material that needs to be excavated. Calculations are usually based on predefined excavation requirements for the size of the turbine alongside average peat depths for the area provided by preliminary site surveys, using an interpolated model of a peat depth probe survey. However, the depth of peat can also vary significantly over time, with changes in the peatland hydrology, leading to peat shrinkage occurring during drought conditions (Morton and Heinemeyer, 2019). Thus the timing of peat surveys may affect peat excavation calculations, as well as the scale of the survey and heterogeneity of the habitat. Table 2 describes common reasons for excavation as part of the construction process and how they differ in approach.
Table 2. Common reasons for excavation on site and how they differ in approach when applied to peat and peatland.
Excavation types
Approach
Construction and maintenance of roads and tracks
Significant lengths of tracks need to be created linking wind turbines and wind farm infrastructure. The main methods that can be implemented are either cut and fill or to introduce floating roads. These roads will impact the drainage of the surrounding peatland by blocking or modifying flow and if floating the peat below can also be compressed, exacerbating drainage issues.
Construction of crane pads
Crane Pads are usually located adjacent to the turbine foundations to facilitate turbine components being lifted during turbine erection and future maintenance or repairs. Depending on the load, crane pads are usually unpaved, however, compacted with layers of gravel. For some installations, the turbine foundation is used as a crane pad after initial construction.
Turbine blade laydown areas
A designated space near the turbine foundation where large components are stored before installation. These are often temporary excavations and reinstated after construction.
Cabling
Usually installed along tracks so typically does not require additional excavation, although may require a small amount of disturbance and/or influence the scheduling of any reinstatement following tracks.
Turbine base
The digging of the foundations of turbine bases generates large volumes of peat that need to be reused. They also introduce alkaline concrete into the environment which may impact the pH of the surrounding habitat and may require drainage installation to protect the foundation and avoid uplift.
Compounds and substations
Temporary compounds provide facilities for workers and equipment. Substations are usually permanent installations, often with steel frames and cladding, crucial for power collection and transmission. The peat needs to be removed, before a hardstanding area is laid, using gravel. These areas also need to be linked to the access roads early in the construction process.
Drainage ditches
Drainage is necessary around wind turbine foundations and wind farm infrastructure to maintain integrity and is usually a permanent feature of the windfarm. Often this leads to a lowering of water levels associated with drainage around infrastructure. Drainage may impact a much wider area than the drain margin and as well as lowering water levels surface subsidence may also occur.
Borrow pit
The volume of peat excavated depends on the depth at which usable aggregate materials are found. The quantity and quality of aggregate in the borrow pit can be hard to judge before the pit is opened so the volume of excavated peat may be higher or lower than anticipated.
Roads and tracks
Construction and maintenance roads and tracks are the most extensive direct impact of a wind farm on peatland as the roads need to allow access to every turbine, plus all the other infrastructure buildings but could also provide access to areas for restoration and enhancement activities. Initially, roads were just cuttings made on shallower peat down to the mineral base. However, this meant that the roads were lower than the surrounding peatland and frequently led to drainage issues.
Construction methods have adapted from just cuttings to the ‘cut and fill’ method (where the peat is dug out until the mineral subsoil is reached and backfilling the trench with aggregate until the road is around the same level as the surrounding bog surface (Lindsay, 2018)) or the preferred method of floating roads (using a geotextile mesh on top of deep peat). Floating roads have limited peat removal as a geotextile mesh is laid on top of the peat, with aggregate poured on top. Another geogrid may then be added with more aggregate before the final ‘running surface’ is laid (Lindsay, 2018).
Stakeholders described how the design of the road network through a wind farm is largely driven by the placement of the turbines (often on ridges which may be where the deepest peat is located) and following the contours of slope (increasing the distances of the road network within the peatland habitat). Tracks also need to bear large weights, for example, the cranes used for wind turbine construction can weigh up to 200 tonnes (this also has implications for the construction of crane pads). A study showed the orientation of the road in relation to the flow of water within a peatland had a large impact (Elmes et al., 2022) and led to flow obstruction and changes to the overall hydrology when running perpendicular to the flow in comparison to parallel. However, this sort of nuanced planning is rarely discussed as part of the construction process. Infrastructure like work compounds and substations also require access roads (with drainage). Thus, the size of the area of peat that is disturbed by the development may be greater than first considered.
Drainage
It was highlighted by stakeholders – and during the site visits – that drainage is usually the first construction activity occurring when developing wind farm infrastructure and is often necessary around the turbine bases and accompanying roads and tracks to reduce the risk of surface flooding. Drainage ditches are also excavated around wind farm foundations to improve the stabilisation of the turbine foundations and to protect machinery. This process of draining peatlands is known to be detrimental, causing subsidence through oxidation of the peat (Williams-Mounsey et al., 2021) and carbon loss. However, peat further away from the drainage ditch (> 1m) will only lose 20% of its previous moisture content, with the main effect of peatland drainage leading to removal of surface water rather than deep water-table drawdown (Lindsay, 2014). Drying of the peat may also lead to cracking, which may lead to rainwater penetrating the base of the peat and lubricate the interface between the peat and the mineral subbase (Lindsay, 2018).
Excavation works
Other large-scale disturbances of the peat are through excavation works. This can be for granular material used during construction (taken from borrow pits); excavation of the wind turbine foundations (although piled foundations can reduce the overall negative impact); and trenches for laying cabling/pipework, leading to substantial quantities of peat that may need to be stored prior to reuse. Piled foundations are usually built over deep peat, rather than excavating large quantities of peat; long, thin columns (piles) are driven or drilled into the ground to support wind turbine structures. These foundations reduce the volume of peat needed to be excavated whilst ensuring stability of the structure. Turbine towers experience large forces and must be placed on a solid foundation embedded within the underlying mineral subsoil or bedrock (Lindsay, 2018). Stakeholders said that often large quantities of peat may be deposited on nearby surfaces temporarily, if trucks aren’t continuously available to receive the excavated material, or dependent on the stage of the construction process. However, it is best practice to only move the peat once (to maintain structure and water content) thus, if the requisite planning is in place, a reuse strategy can be implemented where excavated material is moved to its final location in one step.
Stockpiling peat occurs where peat has been excavated and may need to be temporarily stored prior to reuse due to logistical constraints. As well as becoming a potential source of GHG emissions due to its exposure to aerobic conditions, when peat is stored, changes have been observed within its hydrochemistry, leading to it becoming less acidic and less nutrient-rich (Detrey, 2022). Over time, dewatering also occurs, which alters the hydrophysical properties (porosity) of the peat, these are key for sustaining critical peatland ecohydrological functionality (Lehan et al., 2022).
Ground preparation for stablishing crane pads and turbine blade laydown areas often requires excavating peat to create a stable foundation, leading to the removal of substantial peat volumes, with similar issues as discussed related to other excavation works. This will expand the area of impact further away from the turbine, with underlying changes to the hydrology, potential for release of GHG emissions, vegetation changes and degradation of peatland (Wawrzyczek et al., 2018). Some of these areas are temporary. For example, at some sites visited, areas which had previously been turbine blade laydown areas had peat reinstated and vegetation was able to naturally regenerate. However, this only occurs if it is part of the plan created by the developers, as some laydown areas will remain as areas with stable foundations which are available for future use.
Current practices: use of excavated peat – reuse practices
Excavated peat needs to be moved from the excavation site and is often initially stockpiled until an appropriate time for reuse. The time peat is stockpiled can vary substantially and will be impacted by where it was excavated from, the volume, and timing of the excavation related to overall construction of wind farm site. Lehan, et al., (2022) undertook a restoration study, to assess the impact of time on the hydrophysical properties of peat blocks that were stockpiled for 3, 7, 11, and 14 months. In this study, stockpiling peat was differentially impacted dependent on whether it was shallower or deeper peats, where limited impact from stockpiling was observed in the shallower peats, regardless of stockpiling time; however, in the deeper peats as stockpiling time increased there was a decrease in microporosity as well as mobile porosity (drainable porosity) (Lehan et al., 2022). It may be necessary to rewet the peat or aim to keep it wet whilst stockpiled.
Peat that has started to dry out will be less likely to function when reused. When the surface of the peat starts to dry out development of a hydrophobic layer may occur which causes irreversible changes to the ability of peat to be fully rewetted and reduces the infiltration capacity of the peat (Evans et al., 1999), increasing the desiccation of the peat overall and exacerbating the issue over time. There could also be a similar issue occurring around drainage channels, changing the overall hydrology of the habitat. There are a number of different potential reuse practices that occur on site, with varying quantities of peat, depth of peat and aims (Table 3).
Table 3. Generalised overview of current and potential future reuse practices for excavated peat
Reuse practice – onsite
Approach
Borrow pit reinstatement
Borrow pit reinstatement is one of the main sites for the reuse of peat. Guidance from SEPA highlights the WMLR[1] paragraph 9(1)b restriction that spreading on land subject to man-made development including quarry restoration should not exceed up to a maximum of 2 metres depth of material.
Use to reinstate the natural habitat and to encourage vegetation re-growth. Often used as a way of merging the built infrastructure with the surrounding landscape.
Side of road/ track or “landscaping”
This often occurs as a way of managing levels within the wind farm area, particularly where tracks have been constructed as floating and sometimes will become higher than the surrounding peatland. Vegetation at the side of the road and in the deposited material is not often considered and it is assumed natural regeneration will occur.
Incorporation of peat in restoration / reinstatement projects
This is not standard practice and has to date only occurred as part of research trials in areas directly adjacent to wind farm construction sites, where peat is used as a substrate for other restoration work. Often these sites are already partially disturbed due to the construction process or historically (through forestry, man-made drainage or cuttings).
Examples from stakeholder discussions:
used as a substrate to fill drainage ditches as part of wider restoration efforts within previously forested sites
used as a substrate in the construction of dams to slow water down and hold within the landscape
used to infill sites of historical peat cuttings (between turbines)
hag infill in small areas within a degraded peat landscape
Incorporating a layer of excavated peat in formerly forested sites undergoing restoration
Offsite use
Literature review referred to some potential ways to reuse peat off-site, but we found no evidence these are practiced in Scotland. All stakeholders stated that offsite reuse of peat does not occur. Suggestions have been made that peat could be used offsite, but these are largely hypothetical.
When excavating peat, it is imperative that the different layers are kept separate (acrotelm, catotelm) and not mixed with the underlying mineral substrate. This is because of the different properties of these layers and mixing will degrade the peat and reduce its function. Although peat excavation during wind farm construction is likely to occur, large excavations of peat should be avoided. Peatland management plans are mandatory when submitting planning applications for wind farm developments on peaty soils (as part of Policy 5 of the NPF4 framework). These plans provide a draft outline of the volume of peat to be excavated and the reuse activities that will be performed as part of the development. The reuse of peat is unlikely to have wider environmental benefits in areas that are not already disturbed by the wind farm construction or considered degraded; depositing excavated peat on undisturbed vegetation is likely to be detrimental.
To prevent the loss of carbon and the increase in GHG emissions which would occur from the degrading peat, it is essential that a considerable time is spent planning prior to the excavation process – reducing the distance the peat is moved, keeping the times the peat is moved to a minimum and understanding the volumes of peat involved. From discussions with a number of stakeholders it was suggested that, although the level of planning and motivations of the energy companies to reuse peat without degrading it is high, it is often dependent on the capabilities and understanding of the operators doing the work. A number of training courses have been organised for the construction sector specifically to improve this. However, these courses are voluntary. Training the construction sector in the importance of peatlands, restoration techniques and sensitivity during construction, will enable greater preservation of this valuable resource. In almost all discussions with stakeholders the reuse of peat occurred onsite, there were discussions regarding offsite use, but these were more abstract in terms of what was possible, rather than what was occurring. The reasoning given that the majority of reuse is on site is because the SEPA guidance[1] states that unless the excavated peat is used for construction purposes in its natural state on the site from where it is excavated, it will be subject to regulatory control and considered waste.
Overall, although the terminology is the same between different wind farm construction sites – the reuse of peat within borrowpits, landscaping or restoration, it is always site specific. There may be commonalities between the sites, for example, the need to maintain hydrological connectivity, and the importance of peatland vegetation. There will also be significant differences related to volume of peat excavated, previous habitat conditions and use, weather conditions and water table level, knowledge and preparedness of the contractors. Within 3.5.2, 3.5.3 and 3.5.4 we present case studies representing recent site visits.
Quantities of peat excavated during wind farm construction
Reviewing a number of reports, for example the “Good Practice during Wind Farm Construction” (NatureScot), “Research and guidance on restoration and decommissioning of onshore wind farms” (NatureScot), “Developments on peatland: guidance on the assessment of peat volumes, reuse of excavated peat and the minimisation of waste” (SEPA[1]), “Developments on Peat and Off-site uses of waste peat” (SEPA), as well as habitat management plans for specific wind farms, all state the importance of collecting relevant and detailed site investigation data at an early stage of the application process to enable a full understanding of the site character and to inform a more accurate design process. This is in full agreement with the academic literature (e.g. Jorat et al., 2024) and discussions with stakeholders. During the planning process the amount of peat that needs to be excavated and how it will be reused is identified (see Table 3 for an example of the average areas involved in excavations). However, due to the heterogeneity of the environment and the lack of granularity of peat depth survey’s there is some ambiguity related to total peat volumes until excavation has started.
[1] Scottish Renewables, Scottish Environment Protection Agency. 2012. Guidance on the Assessment of Peat Volumes, Reuse of Excavated Peat and the Minimisation of Waste
Table 4. Area of turbines adapted from Albanito et al., 2022, also includes calculation of the average volume of peat per turbine taken from reviewed peatland management plans of operational wind farms in Scotland
Wind farm capacity (megawatts, MW)
Input
<10 MW
>10 to <50 MW
>50 MW
Average length of turbine foundations (m)
10
15
22.18
Average width of turbine foundations (m)
10
15
22.18
Average surface area of turbine foundation (m2)
100
225
492
Average depth of excavated peat (m)
1.455
1.365
1.350
Average volume of turbine foundations (m3)
145.5
307.13
664.14
Length of access track (or floating road) (m)
418
6513
32490
Width of access track (or floating road) (m)
5.66
5.66
5.66
Average surface area of access track (m2)
2366
36,864
183,893
Floating road depth (m)*
0.53
Average volume of floating road (m3)*
1254
Length of hard standing (m)*
37.99
Width of hard standing (m)*
32.29
Average surface area of hard standing (m2)*
1226.7
Extend to drainage around drainage features at site (m)*
60
Average volume** of peat per turbine (m3) anticipated to be excavated (includes road network and cabling linking turbines to grid)
8060 (± 1464)
Average volume* per wind farm (m3)
328,446 (± 59,650)
*Independent of wind farm capacity (MW)
**Average taken from reviewed peatland management plans of operational wind farms in Scotland.
Case studies – Borrow pit reinstatement
To successfully reinstate peat within borrow pit excavations, it is important to consider the borrow pit location, hydrological connectivity, depth, vegetation cover, and to preserve the layering of the peat (Figure 2). It is best practice to reinstate the borrow pit profile to a comparative level to the surrounding landscape, with gentle slopes that blend into the landscape, it’s design should maintain hydrological connectivity with the wider environment whilst also holding water within the peat soil. Often “cells” are created within the borrow pit to enable easier reinstatement, these cells are sometimes lined with clay to reduce the permeability through to the underlying parent material. This is to enhance the hydrological connectivity of the reinstated borrow pit and aims to keep the area wet. However, an outflow is also needed so that the area doesn’t become permanently waterlogged (Figure d). It is assumed that natural regeneration of peatland vegetation will occur, therefore seeding is not usually part of the PMP, however if seeding were to occur this would usually be two years after construction as part of the planning conditions process.
a)
b)
c)
d)
e)
f)
Figure 2. Examples of borrow pits a) newly completed (< 1 year); b) in the process of being in-filled, one cell completed – cell wall construction (light coloured) and peat infill (dark coloured); c) 15-year old borrow pit with examples of functional peatland vegetation (from natural revegetation); d) 15-year old borrow pit that was not designed with drainage, has led to waterlogging (arrow indicates ponding); e) 10-year old borrow pit, quite dry, with more of an acidic grassland habitat; f) newly completed (< 1 year) situated on a slope, quite shallow peat.
Case studies – roadside verges / landscaping
Peat deposited alongside roadside verges often occurs more in terms of landscaping rather than for preservation of the peat (and carbon within it) (Figure 3). However, the volumes are relatively small compared to borrow pit reinstatement. If the peat does not become integrated with the surrounding hydrology, it will likely dry out and decompose over time, releasing CO2 into the environment and possibly erode away.
a)
b)
c)
d)
Figure 3. Example of peat reused along roadside as part of landscaping process, a) drainage and indication of below ground cabling visible, vegetated peat reused for this infill; b) drainage channels and depth of floating road visible (newly constructed < 1 year), c) newly constructed (<1 year) landscaping, mixing of peat and mineral soil visible; d) Established peat at edge of floating road (15 years after construction), has maintained level and has peatland vegetation growing on it through natural revegetation. (Photographic permissions granted)
Case studies – incorporation within restoration projects
The reuse of peat is not considered for peatland restoration in the majority of cases. However, there are some examples where excavated peat has been used as part of the restoration process but this has only been permitted as an experimental approach. This is because once the peat is excavated (in the quantities it is being removed for wind farm construction), it has often lost structure and hydrological connectivity, and left as a stockpile until reinstatement begins (which varies from site to site).
Thus, the excavated peat has likely started to degrade, using this for restoration is unlikely to improve the habitat to the same level restoration with non-degraded peat would do. However, on some sites there are opportunities for reuse that could enable restoration if the appropriate planning and coordination between experts occurs. An example can be seen in Figure 4 (a and b). Key to the success of this kind of trial is planning how to implement it, for example a) efforts were made to move the peat only once – from excavation to reuse site; b) the layers of peat were kept separate and maintained across translocation; c) training was provided to the contractors involved in this reuse and restoration project. At a different site, excavated peat was used to infill peat cuttings that had occurred previously, however this infill can still be seen 10 years later (Figure 44c – differences in vegetation).
Although there are differences still visible in vegetation, the process for infilling used in situ vegetation. When reinstating the peat within the cuttings, the existing vegetation was stripped off and placed aside, the cuttings were then filled with acrotelmic peat generated from the excavation of nearby turbine bases. The vegetation was then replaced to reinstate the area and stabilise the peat. Although this may not have restored the peatland habitat to equivalent to undisturbed areas, as differences in vegetation are still visible. As the degradation was separate to wind farm construction, comparisons need to be made with how the environment was prior to wind farm construction, rather than comparison to pristine peatlands. Understanding whether the reuse of peat has been successful in maintaining a functioning peatland or at least preventing the loss of peat (and carbon) is very important, vegetation and water table monitoring occurs on some sites regularly to assess this (Figure 44d).
a)
b)
c)
d)
Figure 4. Examples of incorporation in restoration projects – a) Restoration trial (as part of the forest to bog project), where excavated peat was deposited at the side of a constructed track. However, to enhance restoration, prior to peat addition, vegetation was removed and the site ‘smoothed’, before the excavated peat was layered on top (to a depth of 150 mm or 300 mm dependent on trial site), after which the vegetation was put back on top of the reused peat. B) Zoomed in photo of trial site in a) peat vegetation covering trial site, with very little bare peat. C) Landscape restoration through the infill of furrows – here infill is within peat cuttings (but similar infill also occurs within the furrows of former forested sites). D) Dip well monitoring of water levels to assess success of peat reuse. (Photographic permissions granted)
Offsite use of excavated peat
Throughout this research it was discussed with stakeholders whether excavated peat could be used offsite from the wind farm construction; as to date only one paper was found. Balode et al., (2024) discussed various off-site novel uses for peat within the energy sector, building materials and additives, as well as agriculture and the wider environment (Figure 5); however, the paper does not focus solely on reuse and hence these uses are unlikely to occur within wind farm construction industry as the quantities involved in reuse are not going to warrant the creation of a comprehensive supply chain.
It is important to note that throughout the stakeholder consultation, it was repeatedly stated that reuse of peat off-site did not generally occur. Mainly this is due to two reasons, firstly classification – if the peat was taken off-site, it would be categorised as waste, which would likely entail a cost; secondly the necessary volumes of peat and the logistics of transportation would make it too costly to the project. If the reuse of peat offsite from wind farm construction was to be encouraged than new SEPA guidance and recommendations would need to be developed.
Figure 5. Novel applications of peat from Balode et al., (2024).
Environmental outcomes of peat reuse
The results of the literature review indicates that all anthropogenic activities within a peatland will impact the fate of nutrients. The fluctuating water table, local geochemistry and hydrology are the main drivers of a peatlands’ groundwater chemistry and discharge (Monteverde et al., 2022). Wind farm construction can increase the fluvial macronutrient loading of catchment streams (Heal et al., 2020), however, forest felling has been shown to lead to greater dissolved organic carbon (DOC) within felled areas compared to wind farm catchments (Zheng et al., 2018). It is important to note that often wind farms are developed on felled forest sites that were previously peatland, e.g. Whitelees and Camster, however it has been calculated that nearly 14 million trees have been cut down as part of wind farm construction projects over the last 20 years (2000 – 2020)[1]. Thus, academic studies comparing habitats as if they are discrete categories like a felled forest compared to a wind farm development need to include previous land use as part of their analysis. In other words, undisturbed peatland to forestry to felled forest and windfarm may produce different results compared to an undisturbed peatland to wind farm, but if only considering the final use they would be classed as having the same management factors influencing them. It is also unclear whether the environmental perturbations are additive and would likely occur if the area hadn’t previously been changed? Also the timing of monitoring is important, for example a newly constructed wind farm showed 5 g m2 losses in dissolved organic carbon (compared to control samples) over an 18-month period (Grieve and Gilvear, 2008) but it is unclear if losses reduce over time – this is a research gap. Is there an initial flush that quickly dissipates? Or are those losses continuous without signs of improvement. Grieve and Gilvear (2008) believe this 5 g m2 loss represents between 25% and 50% of annual carbon sequestration in peatlands in central Scotland, so it is quite substantial.
The structure and hydrology of removed and replaced peat will not resemble that of the undisturbed peat and likely undergo further degradation through settlement and oxidation (Lindsay, 2018). Excavated peat is often used to blend the transition from undisturbed areas to those which are part of the construction. The disturbance to the peat results in negative impact to the habitat (Jorat et al., 2024), however using excavated peat to link undisturbed areas with disturbed areas will encourage vegetation regrowth in keeping with the surrounding landscape and may stablise the disturbed peat. Error! Reference source not found. provides an overview of the potential environmental outcomes for some of these reuse options.
Understanding how each reuse option impacts the wider environment will inform the hierarchy. Repowering of wind farms, upgrading the turbines and technology used within a wind farm site once it has reached the end of use-limit, is one method of reducing disturbance on peatland. However, this still requires extensive planning, as the newer turbines are often larger, needing different spacing between turbines and larger foundations. Approximately 30% more land surface area will be disturbed for repowering using a new rather than reengineered foundation (Waldron et al., 2018). If the surrounding peatland has not recovered from the previous development, this could lead to greater degradation than using new locations.
It is unsurprising that wind farm construction leads to wide-scale changes to the peatland habitat, which are known to be sensitive habitats with unique attributes related to their hydrology and carbon richness. Within this report we have been focused solely on the impact of wind farms on the excavation of peat and its reuse, however once in situ wind farms may still have an impact on the surrounding peatland. For example, a study by Moravec et al., (2018) showed that wind turbines can affect ground surface temperatures (which has the potential to change soil hydrology); and these changes varied with proximity to wind turbine (Armstrong et al., 2016). These impacts may also last for the lifetime of the wind farm, a large-scale review of the impacts of pipeline construction on soil and crops found that pipelines caused soil degradation for years and decades following installation and that soil compaction and soil horizon mixing detrimentally impacted soil function (Brehm and Culman, 2022).
Table 5: Synthesis of reuse options and simplified overview of potential environmental outcomes (Note: this table summarises potential outcomes indicated by research during this study, but evidence is limited and site-by-site circumstances vary significantly so currently this differentiation on environmental grounds cannot be fully reflected in the recommended ‘hierarchy of peat reuse’.)
Method of reuse
Carbon store
Hydrology connectivity
Availability
Comment
Borrow pit reinstatement
++
Low risk of carbon loss
Low chance of carbon sequestration (carbon increase) in the long term
+
Only if well planned, with impermeable layers and outflows built in
+++
Large storage potential, should have capacity for all excavated peat, however where there is more (or less) peat than planned may lead to issues
Borrow pits have potential to provide an environmentally robust reuse option, however only if best practice is followed and there are contingencies in place if changes in planned volumes occur
Around turbine foundations and crane pad verges
—
High risk of carbon loss through peat drying out and erosion
–
When constructed these areas will automatically have drainage channels cut. The reuse of peat here will likely be impacted by this drainage
+
Small volume
Use to encourage vegetation re-growth around construction areas. Often used as a way of merging the built infrastructure with the surrounding landscape
Side of road/ track or “landscaping”
–
Risk of carbon loss through peat drying out and erosion, however if vegetation regrowth occurs this is less likely
–
Addition of peat should connect the reused peat with the wider environment to maintain hydrology, however, depends on flow patterns and drainage channels across roads
+
Small volume
If vegetation regrowth occurs and there is limited bare peat this has potential to become part of wider landscape
Incorporation of peat in restoration / reinstatement projects
+++
Low risk of carbon loss, has potential to build carbon (dependent on restoration / reuse project)
+++
If well planned, should have hydrological connectivity with landscape
+
Small volume
Usually these projects are highly monitored to assess progress – useful for data gathering in the short term alongside the benefits of using excavated peat in areas that may have been degraded previously
Limitations of data
Through the rapid evidence assessment (REA) we did not consider peatland restoration methods as part of the scope, however there are some strategies that go beyond restoration practices and should be a consideration as part of the reuse of peat. For example, rewetting peatland, drain blocking, revegetation, and fire management (Balode et al., 2024). Although there is academic research on the impact of peatland degradation, how wind farms can reduce reliance on fossil fuels and the social acceptance of wind farms within the environment, there is a lack of published research directly quantifying the impact of wind farms on peatlands, or providing evidence of best practice. Reliance on grey literature and stakeholder discussions is necessary to cover this research gap. For example, where novel reuse methods have been used, the industry has led monitoring of those sites, collected data and written these up as internal reports, which are not obviously available for the wider industry and academia to use. However, “standard practice” is rarely reviewed in academia nor comprehensive data collected, thus it is very difficult to make recommendations on what works best through standard literature reviews. Grey literature may be written with bias, there may be a lack of replication within the data, and it will not have been peer reviewed and is thus less reliable as a data source.
Often there is limited detail within peat management plans and planning applications for wind farms. For example, it is assumed that all excavated material will be peat; differences between peat layers (acrotelm and catotelm) are not distinguished and there is no reference to the vegetation layer. Depending on volumes, the only indication of reuse is stated as backfilling around turbine bases and landscaping around access tracks. As well as the aforementioned issues with the reuse of excavated peat, one important consideration that is often not discussed is that the different layers of peat excavated (acrotelm and catotelm) have different physical properties. Whilst the reuse options discussed above may be appropriate for acrotelm peat, they are unlikely to be suitable for catotelmic peat (generally below 1m depth peat)[1].
There is a lack of understanding related to the outcome of peat reuse – is it to restore peatland bog function, or is it to try to reduce losses of carbon from the excavated peat? Or is it to do something with the excavated peat that will minimally impact the wider environment? The likelihood is that the overall outcome will be somewhere between these points.
Although there is a significant amount of academic research on the impact of wind farms on peatland, there were clear gaps related to what should be deemed ‘best practice’. For example, there is no published work on the measurement of peatland parameters as part of the reinstatement of borrow pits on wind farms – how can best practice be defined when there is no indication of something working in practice, or a clear understanding of what ‘success’ looks like in this context? There have also not been any in-depth assessments of carbon loss after excavation and reuse – discussions were held in relation to loss of carbon as the peat dried out, but there is a lack of direct studies focusing on this over time. This information is also absent from the grey literature. There was a lot of discussion with stakeholders regarding what they believe works best from a real-world perspective (rather than lab based academic studies), but this still lacked underlying reported evidence, and was only discussed in terms of past experience of what worked (to reuse the peat available, and perceived that it remained within the field rather than eroding) and what hasn’t worked, remaining largely unmeasured and therefore unproven. Interestingly, where a wind farm had used a novel method of reuse, there was a monitoring plan set up by the energy company and evidence was gathered to justify this method. Highlighting how energy companies can lead the way in providing evidence of good practice.
Generally, there was a lack of monitoring occurring, both in terms of whether the construction process adheres to what has been set out in the PMPs but also to ascertain whether the approach has worked (and thus could be referred back to and repeated elsewhere). There is also a disconnect between the desired outcomes compared to the aims of the wind farm operators. For the wind farm developers, there is a need to balance aspects such as effectiveness and safety within the construction process (i.e. the need for drainage), with restoration, when that part of the construction process is complete. Removing drainage if it is no longer necessary within the wind farm infrastructure would enable an area to return to a more natural peatland habitat, although dialogue is required to ensure a shared understanding of how this might be defined.
Legislation and advisory documents change over time, for example “Scotland’s Peatland Standard”[1] (SPS) is currently being developed. This document will provide technical information and guidance to promote peatland protection. It will define the minimum for sustainable management and restoration requirements that Scottish Government expects all peatland owners, managers and contactors to follow. Thus, in future could potentially fill some of these knowledge gaps discussed.
We have developed the hierarchy below for reuse of peat through the literature review, stakeholder discussions and site visits presented within this report. We considered the role and nature of a potential hierarchy for peat reuse methods during this project, considering:
What needs to be included in a hierarchy and in which order.
What additional guidance or principles would help guide an environmentally beneficial approach to peat reuse.
Highlighting the research gaps at this time that need to be addressed to better inform a hierarchy of peat reuse methods.
Based on the findings of this study we have three recommendations:
Recommendation 1: Guidance on excavation peat reuse
1a: Planning and preparation steps 1b: A draft hierarchy of reuse methods 1c: Peat reuse and implementation principles
Recommendation 2: Environmental outcomes framework to ensure the multiple potential environmental benefits of peat reuse are considered, avoiding a single-issue focus.
Recommendation 3: Enhanced monitoring of environmental outcomes from reuse of peat – these investigations need to be targeted to address the specific research gaps highlighted in our study, and also better routine monitoring of site reuse implementation and environmental outcomes.
Our recommendations come from learnings acquired during this study. Through a rapid evidence assessment, an understanding was gained of the current research occurring on peatlands and wind farm developments, alongside site visits to see what was occurring in the field and a series of stakeholder discussions and workshops to fill in the gaps where reports or data were lacking. An area of clear agreement across stakeholders, both in terms of construction and also the conservation sector, is to minimise the amount of peat excavated. Avoidance of peat excavation can mean different things to different stakeholders, for example:
Is avoidance about minimising the volume of peat excavated? (reduction of waste and minimising cost) – Yes
Is avoidance about minimising the areas of carbon-rich soil impacted by excavation? (limited footprint of impact) – Yes
Is avoidance about minimising the loss of area of peatland in pristine / good conditions? (protected biodiversity) – Yes
Is avoidance about minimising loss of hydrological connectivity across on-site/off-site peatland and the wider functions of larger peat bodies? (ecosystem services) – Yes
Depending on the perspective of the stakeholder they may agree or disagree with some of the above statements, however they are overlapping in terms of reducing the impact of wind farm construction across peatlands. Avoidance is the essential first step in the hierarchy of reuse.
At times the timeline between site acquirement, site surveys, planning approval, and construction company deployment, leads to issues related to preparation and planning. Discussion with stakeholders highlighted that often the site surveys presented as part of the planning applications may not be at the detailed scale necessary to identify areas with the deepest peat (that should be avoided) at the construction stage. The construction contractors would like to avoid the areas with the deepest peat (due to costs and time, as well as to minimise the amount of peat disturbed) but are limited by what has previously been set out within the planning application. The condition of the existing peatland across the landscape prior to wind farm construction may not have been fully assessed, thus if the peat is already degraded the starting point for the reuse of peat will be lower and has the potential to degrade faster when disturbed.
Understanding the hydrological connectivity of the landscape will enable appropriate placement of drainage, this links closely to site condition – if there are already drier areas within the peatland, they may become drier over time with increased drainage. In some instances it is possible to reduce drainage after construction, if the areas being drained are reinstated with peat, however this is a consideration that should be made at the planning stage. Greater training needs to be provided for the construction operatives, both in terms of implementation of activities, but also to understand why it is important; as key to maintaining the quality of the peat during reuse, is minimising disturbance and maintaining the peat structure from the outset.
The importance of peatland for carbon storage is widely discussed both within the literature and by stakeholders, however, a key disconnection between the planning process and the completion of windfarm construction is the accuracy of the carbon calculations – it was widely discussed that in the majority of developments more peat is excavated than was planned. The actual amount of excavated peat is not used to recalculate the carbon loss and thus the overall impact of the wind farm development is not fully assessed. It also means the contractors inevitably have more peat excavated than was planned for reuse, thus the options for reuse of this peat may lack adequate planning for how to reuse appropriately. It is a pity contractors aren’t required to report how much peat has been excavated during the construction process, as this could improve the accuracy of estimates over time, but currently this data is not available or monitored. The condition of the peat that is reused is rarely monitored (at excavation or afterwards), therefore it is unclear whether this peat will continue storing the carbon it contains or whether carbon will be released into the atmosphere. Academic studies collecting empirical data on the release of carbon from disturbed peat are rare, and do not occur at a field scale or if they do these assessments usually occur in relation to agricultural disturbance rather than windfarm construction and are not wholly applicable. Where the peat was excavated from is also an important consideration for reuse – if it is taken from a borrow pit excavation this lends itself to borrow pit reinstatement, however if it is removed for cabling and road installation than returning the peat to this area (referred to as landscaping) may be a better option.
Recommendation 1: Guidance for Peat Reuse Options
Because detailed evidence to confirm the different environmental outcomes is not available, our recommendation is for a simple hierarchy of peat reuse options accompanied by some additional guidance and requirements which are essential for maximising environmental outcomes:
Recommendation 1a: Preparation and Planning Steps:
Avoiding / minimising peat excavation and
Appraise site circumstances and locally relevant potential reuse options
Recommendation 1b: Hierarchy of Peat Reuse
Recommendation 1c: Peat Reuse Implementation Principles: to guide the site-specific choice of methods and implementation to maximise environmental outcomes.
The hierarchy is not useable as a standalone guide – it must be accompanied by the additional components – as shown in
.
Figure 6: Guidance for Excavated Peat Reuse
Recommendation 1a: Preparation and planning steps
Is critical to conduct investigations to inform preparation and planning in order to maximise environmental outcomes – including first taking action to avoid peat extraction. Our recommended preparation and planning steps are set out in Table 6.
Table 6: Preparation and planning steps to accompany the hierarchy of peat reuse
Step 1: Avoidance
As per NPF4, avoidance of peat excavation is always the priority, in agreement with the NPF4 mitigation hierarchy. As part of the avoidance strategy, a “restorability assessment” should also be included – this should determine the condition of any peat that is due to be excavated and makes an assessment of the potential for reinstating the peat in that location. Taking into account the peatland condition, where it is located within the wider landscape, accessibility and how easy it may be to restore degradation in the future. As part of the avoidance strategy, as well as macro-level site decisions (e.g. develop on peat or not), micro-level decisions on site and in project designing and contracting should be considered to reduce the volume of peat excavated and/or impacted. For example, ensuring peat depth assessments are accurate and are used to guide any micro-siting[1] decisions.
[1] Micro-siting is where small adjustments to the wind farm lay out are made to avoid / minimise damage to peat (or other sensitive environments) on site.
Step 2: Preparation and planning: Appraise site and potential reuse outcomes
Preparation is critical for identifying the most beneficial options available on site and their feasibility. What is the depth of peat across the site? What has the peat been categorised as? If it is not in good condition, does it have potential for restoration? Has it been modified? Or drained? Aligning the details submitted within the application process (EIA) with further surveys, identifying depth and condition of peat at the exact locations for the tracks, turbines, general infrastructure and proposed reuse locations.
Planning, with the desired outcome in mind, is crucial to the successful reuse of peat. Knowing the volumes of peat to be excavated and from where on the site. Knowing the depth of peat and the thickness of each layer (acrotelm and catotelm). Planning where the borrow pit and stockpile need to be located. Planning peat movements to minimise disturbance. Contacting other stakeholders that may be able to enhance reuse of peat activities.
Prior land use:
Understanding what the starting land condition is. Has the land been used for other activities prior to wind farm planning? For example, many wind farms are being built on previous forest sites; some may have been used for grazing or are semi-natural habitats? These previous activities will impact drainage across the site, some areas may be drier or need to have the drained area restored, stump flipping may need to occur, and also natural regeneration of forest may affect the vegetative composition.
Peat condition and depth:
If the peat is in “good” condition prior to wind farm construction, this may negate some of the energy savings of renewable energy generation, as some studies have suggested that the carbon saved from the wind farm development won’t offset the damage to the environment. However, there are very few areas of pristine peatland in Scotland, and it is more likely to be a mosaic of conditions across the landscape – which may need to be considered regarding the progress of construction. The depth of peat in the area is also important, as deeper peats have different properties in terms of acrotelm, catotelm and underlying parent material. Very shallow peats are also a concern as they are more liable to mixing of soil and peat layers.
Reusability of peat at start of construction
The condition of peat prior to excavation will have an impact on its reusability. If the surrounding peatland is degraded, reused peat is unlikely to improve the conditions in the surrounding area (unlike peat extracted for restoration purposes). Inevitably, there will always be some degradation as peat is excavated (whether that’s through a loss of carbon or changes in porosity, hydrology, or vegetation coverage); thus minimising the amount of peat excavated will protect the environment. However, the counter point is that if the peat excavated is in very poor condition to begin with, it may not be able to be reused, and perhaps should not be excavated?
Site specific opportunities for reuse:
For all wind farms (and construction sites), the geographic limits for development activities are set (the development envelope). If there are areas where the reuse of peat would be more appropriate that is outside this area, than the reuse cannot occur there. Consideration should also be given to the site layout and options for reuse destinations – what is being constructed first and where. For example, the floating roads are often the first part of the infrastructure constructed to allow access to all areas. Where are the water courses and flows within the site, what is the connectivity with the wider landscape and habitats e.g. Is there an overlap with prior landuse or adjacent restoration work? Is the order of excavation and reuse appropriate to minimise carbon loss?
Agree desired outcome for use of excavated peat:
Setting a feasible intention (e.g. habitat to aim for) considering the site conditions and opportunities at the outset.
Recommendation 1b: Hierarchy of reuse
The rational for the hierarchy of reuse set out in Table 7 reflects the available evidence for environmental outcomes of peat reuse. The main options all have potential to deliver positive environmental outcomes in comparison to the secondary options or landfilling but there is insufficient evidence to rank the main options further. Their feasibility and environmental outcomes will depend upon the site context and the way they are implemented.
The table provides a supplement to the available information on good practices for use and handling of soil and peat. The evidence of environmental outcomes of reuse options has many gaps currently. Where there is evidence, it cannot always be confidently applied to specific sites and circumstances. Therefore, these principles / considerations are taking the precautionary principal approach and should be used as stepping stones reflecting the consensus amongst technical experts about things which are important to consider in the absence of a complete evidence base.
Table 7: Underlying rationale and details related to hierarchy of reuse of peat
(1) Main re-use options
Borrow pit reinstatement or infill
Borrow pit reinstatement involves putting excavated peat into a borrow pit at the end of the period of use. Potential desired outcomes can vary and should be informed by the planning steps.
Key priorities: Aim for a functioning bog, then consider other locally valuable habitats. Management / design needs to prioritise setting up the reinstated borrow pit appropriately for desired outcomes e.g. including an impermeable layer at the bottom of the pit; water outlet to hydrologically link the borrow pit to the rest of the peatland habitat; layered in a similar way to how it was excavated (including a vegetation layer). Aim to only move peat once if possible. Otherwise, if the peat that is removed from the borrow pit will be returned to the borrow pit it will need to be stockpiled prior to reuse. Reinstating the surface vegetation appropriately should enable recolonisation of the surface layer which will aid the development of a functioning bog habitat and increase biodiversity.
Rationale:
Capable of taking high volume, of which a significant portion may be from the original site as a result of the borrow pit excavation.
Whilst our study did not find peer reviewed studies that confirmed the environmental outcomes of borrow pit reinstatement, observations and comments from stakeholders, and their in-progress monitoring suggests some good environmental outcomes (including maintaining water levels and peatland vegetation), when borrow pit reinstatement is completed properly following the above key priorities.
Further research is needed to confirm these environmental outcomes – we have seen this is occurring at some sites, it would be beneficial to the sector if these results were published.
Other reinstatement
There are other areas impacted by wind farm developments that could be consider for reinstatement – for example areas that have been used for building compounds, crane pads, temporary access tracks etc
Reinstatement involves the reuse of peat to blend the natural habitat with the infrastructure disturbance as a way to encourage vegetation re-growth.
Key priorities: Maintaining hydrological connectivity between the reuse of peat and the landscape in situ. High risk of the peat drying out leading to erosion. To reduce this risk it is important to follow the peatland restoration technical compendium and future requirements of the forthcoming Scotland Peatland Standard.
Restoration
Restoration involves the reuse of excavated peat by incorporating it into areas of peatland on site that have previously been degraded through anthropogenic activities – for example forestry or peat-cuttings directly accessible from the development site. This can offset (compensate) for some of the residual impact of the development or for enhancing peatland conditions in support of the reinstatement of functional peatland. A number of discussions with stakeholders presented examples of this type of restoration occurring on wind farm developments. Although the results are unpublished, the results show promise as a way of delivering enhanced environmental benefits as part of the construction process.
Key priorities: Design must be site specific aiming for functioning peatland or other locally valuable habitat. After a thorough site survey, areas that are degraded peat should be identified and considered part of the reuse process. For long term success of this reuse method there needs to be collaboration between peatland restoration experts alongside the construction sector and use of the peatland restoration technical compendium alongside the Scotland Peatland Standard.
Rationale:
If this method of reuse of excavated peat was to occur, it would initially only be in areas within the wind farm development site identified as potential areas for restoration.
Reusing peat in these areas, although takes more planning and time (including assessing peat slide risks), is likely to be beneficial, particularly if it enables restoration which would not be possible in the absence of available peat.
Reinstating peat where peat has been historically located has a greater likelihood of returning peat to a functioning level than reusing peat in areas that were not peatland previously.
Peer reviewed studies were not available to confirm environmental outcomes of peat in restoration but observations and comments from stakeholders, and their in-progress monitoring suggests potential for good environmental outcomes, although only if well designed – more research is needed to understand effective methods and environmental outcomes.
Landscaping (road verges, embankment slopes etc)
Landscaping involves reinstatement of peat above cabling and alongside floating roads and embankments. Often the excavated peat is from where the cable is to be laid and will be returned to where it was extracted from, however alongside roads and embankments may be from other areas.
Key priorities: Care needs to be taken to maintain peat layering and planning related to hydrology needs to occur (as the peat above the cable risks being hydrologically isolated if situated between the floating road and drainage channels). Floating roads are often higher than the surrounding habitat, as aggregate and geotextile mesh has been put down as part of the construction process, this creates an island effect. It is important to consider the vegetation when reusing peat as part of the landscaping process. It is crucial to not reinstate peat on top of vegetation, this may mean that vegetation needs to be lifted away to reuse peat prior to returning the vegetation to the area.
Rationale:
Reusing peat along these road verges can improve the landscape, by changing the levels between the road and the wider landscape reducing the risk of island effects, but only if the hydrology and placement is considered, will it have the potential to reduce degradation.
It may be the only practical option in some circumstances as blending the zones between the infrastructure and wider environment may reduce the degradation spreading into the undisturbed peatland (through reducing the risk of the peat drying out and erosion occurring).
Reinstating excavated peat along the roadside will stabilise the surface and reduce the sediment runoff which could damage the wider environment.
Reusing excavated peat along roadsides gives the natural vegetation a chance to recolonise and restore these areas close to the wind farm development. Vegetation reduces the risk of erosion and further degradation.
Secondary options (2,3)
There is limited interest in reusing peat offsite and for the majority of construction projects it does not appear to occur. Questions were asked of stakeholders to assess if excavated peat could be reused within the horticulture sector, whisky industry or other aspects of the construction or energy sector. In all instances the answer was a definitive no, there is no evidence for the reuse of peat offsite in these sectors as part of wind farm construction, it does not occur. This is likely due to the volumes of peat involved and the sporadic nature of the supply chain, also as the Scottish Government has committed to phasing out the use of peat in horticulture this is unlikely to gain momentum as a viable option.
There are instances where an area has lost peat previously due to land use activities and offers an opportunity for excavated peat to be reused as part of restoration. An example from the stakeholder consultation was where the reuse of peat from a wind farm construction was used to reinstate an area of mining that had occurred nearby. It is important to note that if onsite reuse cannot occur all endeavours should be made to undertake these secondary options prior to the last option of landfill which should be avoided.
(2) Offsite
(known use)
This reuse occurs on a case-by-case basis and usually occurs where the land ownership or construction operators are linked. For it to occur more frequently, greater planning and preparation needs to be implemented prior to excavation and transport.
(3) Offsite
(unknown use)
Where peat has been extracted and there was no reuse plan in place for it, this could lead to unknown use offsite. This reuse is very unlikely to occur but when it does it is usually in small quantities e.g. for novel trials of reuse options. This is because once peat leaves the site it will be considered waste and is also costly to transport.
(4) Last resort option
Landfill
This should be considered a “last resort” option, and all other options should be prioritised before this.
The effectiveness and likely outcomes of different methods of peat reuse is heavily dependent on-site specific context, feasibility of achieving the desired outcome, and the detailed design of the method (such as borrow pit infill design). Thus, any hierarchy needs to be flexible, but decisions should be guided by a set of principles to maximise environmental outcomes. These include:
Aiming for functioning peatland (as close to natural functioning as possible because full natural functioning is likely to be unachievable in most cases), or other valuable habitat if not possible.
Maintaining / reinstating vegetation
Maintaining / reinstating water flows / hydrological functioning, whilst ensuring site stability and safety.
Minimising peat movement
Maintain peat structure (layers) where possible.
See Table 8 below for more detail.
Putting these into practice is facilitated by the preparation steps set out in Recommendation 1a above. For example greater detail could be requested prior to planning consent, because most peatland management plans lack depth and site-specific details. Requiring this information prior to the start of the construction process will increase the likelihood that planning, and preparation will be undertaken to the necessary extent to improve the outcomes of peat reuse. This would move the onus from contractor and place it with the energy company / landowner that ‘owns’ the consent and is responsible for full legal compliance. Greater detail within the PMPs would also provide a more accurate understanding of the true quantities of peat to be excavated, by including a requirement under the consent for accurate recording and in turn enhance the reuse strategy to be implemented. This could also provide future developments with more accurate calculations to use within their planning applications and PMPs. However, it is beyond the scope of this research to identify where responsibility lies for receiving and reviewing such additional material.
It was clear through the stakeholder consultation that there are a number of very knowledgeable groups working within the sector (Appendix B, including environmental government organisations, wind farm contractors, energy companies, environmental consultants from the private sector, as well as academics and conservation organisations). Capturing this knowledge to ensure recommendations for best practice are supported by what is practical will improve the wind farm construction process in the future.
Table 8: Peat reuse implementation principles – further explanation
Peat reuse implementation principles
Hydrological connectivity
Mapping out the connectivity of the site, will enable better drainage planning, targeted to ensure site stability / safety and support the desired peat reuse goal e.g., desired habitat. It will also enable more successful reuse of the peat if it is kept wet and can connect into the hydrology of the surrounding land at the location of reuse.
Minimise peat handling and disturbance
If enough planning has occurred, it may be possible to only need to move the peat once – from where it is excavated to the site of reuse. This also avoids storage of excavated peat, which generally leads to undesirable changes in peat properties, e.g. loss of water, bulk density increase, carbon loss, damage to microbial populations
Separation of peat layers
When excavating peat, the success of reuse will be increased if the different peat layers are kept separate (acrotelm, catotelm, and underlying mineral soil) as they have very different properties.
Maintain wetness of stockpiles
Stockpiling of excavated peat should be avoided where possible. If necessary to stockpile peat, stockpiles should be watered when necessary to maintain wetness. If the surface of peat dries out, a hydrophobic layer may form. This reduces the overall infiltration rate of the peat blocks and may lead to further desiccation and other negative impacts, as noted above under ‘Minimise disturbance and avoid storage/stockpiling’.
Multiple environmental outcomes should be targeted through peat reuse. To avoid excessive focus on one environmental measure of success, we recommend the following environmental outcomes should be considered when deciding on which peat reuse option to implement on site. These environmental outcomes should be monitored to assess success (see Table 9 for rationale):
Minimising carbon loss from excavated peat
Positive biodiversity outcomes reflecting local and national goals
Ensuring downstream water quality (sediment / nutrient load)
Following on from Recommendation 1 and the hierarchy of reuse options, environmental outcomes framework indicates the priority environmental outcomes for peat reuse. These should be considered by the consenting authority as part of the planning process, in conjunction with the EIA process and developers should be considering these in their development plans. We recommend the consenting authority to check that the applicant has fully considered these areas within the planning proposal as part of their strategy for reuse. The environmental outcomes framework should also guide subsequent monitoring and evaluation, during and after construction. Clarity on what environmental outcomes could potentially be achieved from peat reuse can support all parties to deliver better environmental outcomes.
Table 9: Rationale for Environmental Outcomes Framework for Peat Reuse
Outcome
Rationale for inclusion in the Framework
Minimising carbon loss from excavated peat
Carbon can be lost as the peat is disturbed primarily through hydrological changes and erosion – these two processes are interlinked, as erosion is more likely when peat starts to dry out. Leading to the loss of particulate organic carbon (POC) which is more easily transported by wind or water erosion. As the peat dries out and is exposed to oxygen, aerobic decomposition of the organic matter starts to occur, releasing the stored carbon as CO2. As carbon is lost subsidence of the peatland may also occur, this has knock-on concerns for the wider environment and safety and stability of the wind farm. Where the excavated peat has been left bare of vegetation carbon loss and erosion are also a greater risk.
Positive biodiversity outcomes reflecting local and national goals
Enabling the regrowth of peatland vegetation (particularly indicative peatland species like sphagnum mosses) helps rebuild peat structure and enhances carbon sequestration potential, but it also improves the wider biodiversity within the environment. However, studies focusing on peatland restoration have shown that vegetation is slow to recover and even ten years after restoration the vegetation present can still be dissimilar to pristine peatlands (Kareksela et al., 2015). Thus greater consideration is necessary related to vegetation regrowth to maximise its potential. Within our recommendations we have advised on best practice for the reuse of peat, however action should also be taken to maintain vegetative cover alongside this reuse. Whether this is through moving the vegetation layer as part of the reinstatement of reused peat, seeding the reused peat, or if there is existing vegetation in the area planned for peat reuse, stripping this off and placing aside, so that the vegetation can be replaced once the reused peat is reinstated in the area and stabilise the peat.
Ensuring downstream water quality (sediment / nutrient load)
Excavated peat can lead to increases in dissolved organic carbon (DOC) within water systems leading to changes in downstream water quality, as well as increased sediment loads. This can be through the physical disturbance of the construction process increasing water erosion and DOC leaching. Drainage can cause hydrological alterations and redirect water flows, mobilising sediments (POC) and DOC leading to increased carbon losses and peatland erosion (Grieve & Gilvear, 2008).
Recommendation 3: Improved research and monitoring
In discussion with stakeholders, some monitoring is occurring post wind farm construction for peat reuse, usually by the landowner or energy company, however as discussed previously this monitoring is not mandatory and usually focuses on novel uses, or where the reuse appears to have been successful. We recommend:
Monitoring of environmental outcomes of peat reuse for the life of the windfarm, EIAs often require follow up monitoring in relation to biodiversity post-construction, however Peatland Management Plans (PMPs) do not. We recommend greater considerations is given to PMPs as part of follow up monitoring to include:
Monitoring of peat levels, and wetness around the wind farm, irrespective of reuse option, this should occur to identify areas that may be drying out due to drainage, or where too much waterlogging may be occurring because of the changes in hydrology caused by the construction process.
Monitoring of vegetation cover and types, for example through vegetation surveys are used as indications of functioning peatlands, but other measures (like DOC within the water catchment or carbon fluxes) could provide a more nuanced understanding of the impact reuse is having on the wider environment.
Greater sharing of this data and collaboration with the academic community, would also enable further distinctions of best practice to occur. We recommend a formal advisory relationship to form between developers and the research community facilitated by Scottish Government, so that data sharing can occur and consenting authorities have access to better knowledge of effective peat reuse being undertaken. Data that has historically been collected but has not been reported on could be shared initially to assess how a collaborative data sharing process may work. The current lack of data sharing and credible longitudinal studies was noticeable at the site visits for wind farms that had been commissioned 10+ years previously – key details had been lost with job changes / retirement that could have benefitted the wind farm sector as a whole, with improved understanding of what is now visibly working and what hasn’t worked so well.
Research gaps
There are many research gaps that have been highlighted throughout this study. These could be addressed through the following actions:
The exact volume of peat excavated across a wind farm development is not known at completion of construction → We recommend asking the contractors to update records at the end of construction. Building on this we recommend a study to assess the differences between the amount of peat stated to be extracted prior to the wind farm development commencing compared to the wind farm after construction has finished. This could also be used to improve the accuracy of the carbon calculator providing a more accurate picture of the true carbon losses after completion of construction.
Understanding how the carbon content changes within the peat volume over time for all reuse options → We recommend monitoring projects focusing on carbon loss and GHG emissions
Seeing how the full GHG balance for infilled borrow pits changes dependent on size and age of the borrowpit → We recommend that monitoring of infilled borrow pits including size and volume, and hydro connectivity needs to occur at regular intervals
The environmental outcomes of borrow pits have not been fully assessed → We recommend collecting monitoring data of the regeneration of plants and biodiversity over time will enable this.
Reviewing available printed information on best practice (and standard practice) → Likely this is very limited and may involve contacting energy companies to access internal data and reports. We recommend greater collaboration between the energy companies and academia, with a greater amount of data sharing. Funding opportunities are usually the best way to encourage engagement between different stakeholders.
The level of revegetation on peat that had previously been excavated appears to be reliant on natural recolonisation, how well this occurs is not thoroughly understood. → We recommend monitoring how plants recolonise the excavated peat that has been reused which would enable a better understanding of best practice. From discussions with stakeholders there is limited reseeding occurring and it is largely left to natural revegetation. However, this is more likely to occur if the surface plants are maintained (removing the in situ plants, redistributing the reused peat and returning the plants on top should enhance recolonisation rates).
Conclusions
These results highlight our current understanding of peat reuse methods occurring in wind farm construction in Scotland. We have identified the critical environmental issues and how the reuse of peat can maintain the habitat, allowing for environmentally conscious construction techniques to take precedence.
However, the overriding synthesis of the information gained during this process is that planning prior to construction is key, as well as ensuring that stakeholders work together to achieve best practice. Avoidance of excavation of deep peat is the first priority. Next, acknowledging that once peat is excavated full consideration of how best to reuse it (ideally only moving it once and keeping the different layers separate, while aiming to keep the peat wet and/or maintaining hydrological connectivity) are crucial.
After these main outcomes from the hierarchy, attention needs to focus on delivering site specific reuse. It also became apparent that although there is a lot of knowledge within the peatland and wind farm sector, there has been limited studies collecting data to inform best practice. This needs to be encouraged to understand current research gaps and advise on the right management methods to reduce peatland degradation in the long term.
References
Albanito, F., Roberts, S., Shepherd, A., Hastings, A., 2022. Quantifying the land-based opportunity carbon costs of onshore wind farms. Journal of Cleaner Production 363, 132480.
Armstrong, A., Burton, R.R., Lee, S.E., Mobbs, S., Ostle, N., Smith, V., Waldron, S., Whitaker, J., 2016. Ground-level climate at a peatland wind farm in Scotland is affected by wind turbine operation. Environmental Research Letters 11, 044024.
Austin, K.G., Elsen, P.R., Coronado, E.N.H., DeGemmis, A., Gallego-Sala, A.V., Harris, L., Kretser, H.E., Melton, J.R., Murdiyarso, D., Sasmito, S.D., Swails, E., Wijaya, A., Winton, R.S., Zarin, D., 2025. Mismatch Between Global Importance of Peatlands and the Extent of Their Protection. Conservation Letters 18, e13080.
Balode, L., Bumbiere, K., Sosars, V., Valters, K., Blumberga, D., 2024. Pros and Cons of Strategies to Reduce Greenhouse Gas Emissions from Peatlands: Review of Possibilities, Applied Sciences.
Bragg, O.M., 2002. Hydrology of peat-forming wetlands in Scotland. Science of the Total Environment 294, 111-129.
Brehm, T., Culman, S., 2022. Pipeline installation effects on soils and plants: A review and quantitative synthesis. Agrosystems, Geosciences & Environment 5, e20312.
Chico, G., Clewer, T., Midgley, N.G., Gallego-Anex, P., Ramil-Rego, P., Ferreiro, J., Whayman, E., Goeckeritz, S., Stanton, T., 2023. The extent of wind farm infrastructures on recognised European blanket bogs. Scientific Reports 13, 3919.
Detrey, I., 2022. Bog in a Box: Is long term peat storage for future restoration viable? University of the Highlands and Islands, UHI.
Dykes, A.P., 2022. Landslide investigations during pandemic restrictions: initial assessment of recent peat landslides in Ireland. Landslides 19, 515-525.
Elmes, M.C., Petrone, R.M., Volik, O., Price, J.S., 2022. Changes to the hydrology of a boreal fen following the placement of an access road and below ground pipeline. Journal of Hydrology: Regional Studies 40, 101031.
Evans, M.G., Burt, T.P., Holden, J., Adamson, J.K., 1999. Runoff generation and water table fluctuations in blanket peat: evidence from UK data spanning the dry summer of 1995. Journal of Hydrology 221, 141-160.
Ferretto, A., Brooker, R., Aitkenhead, M., Matthews, R., Smith, P., 2019. Potential carbon loss from Scottish peatlands under climate change. Regional Environmental Change 19, 2101-2111.
Grieve, I.C., Gilvear, D., 2008. Effects of wind farm construction on concentrations and fluxes of dissolved organic carbon and suspended sediment from peat catchments at Braes of Doune, central Scotland. Mires and Peat 4.
Heal, K., Phin, A., Waldron, S., Flowers, H., Bruneau, P., Coupar, A., Cundill, A., 2020. Wind farm development on peatlands increases fluvial macronutrient loading. Ambio 49, 442-459.
Jennings, P., Kane, G., 2015. Geotechnical engineering for wind farms on peatland sites, Geotechnical Engineering for Infrastructure and Development, pp. 595-600.
Jorat, M.E., Minto, A., Tierney, I., Gilmour, D., 2024. Future Carbon-Neutral Societies: Minimising Construction Impact on Groundwater-Dependent Wetlands and Peatlands, Sustainability.
Kareksela, S., Haapalehto, T., Juutinen, R., Matilainen, R., Tahvanainen, T., Kotiaho, J.S., 2015. Fighting carbon loss of degraded peatlands by jump-starting ecosystem functioning with ecological restoration. Science of the Total Environment 537, 268-276.
Lehan, K., McCarter, C.P.R., Moore, P.A., Waddington, J.M., 2022. Effect of stockpiling time on donor-peat hydrophysical properties: Implications for peatland restoration. Ecological Engineering 182, 106701.
Lindsay, R., 2014. Impacts of artifical drainage on peatlands. IUCN UK Committee Peatland Programme. Briefing Note Number 3.
Lindsay, R., 2018. Peatlands and Wind farms: Conflicting Carbon Targets and Environmental Impacts, In: Finlayson, C.M., Milton, G.R., Prentice, R.C., Davidson, N.C. (Eds.), The Wetland Book: II: Distribution, Description, and Conservation. Springer Netherlands, Dordrecht, pp. 413-425.
Monteverde, S., Healy, M.G., O’Leary, D., Daly, E., Callery, O., 2022. Management and rehabilitation of peatlands: The role of water chemistry, hydrology, policy, and emerging monitoring methods to ensure informed decision making. Ecological Informatics 69, 101638.
Moravec, D., Barták, V., Puš, V., Wild, J., 2018. Wind turbine impact on near-ground air temperature. Renewable Energy 123, 627-633.
Morton, P.A., Heinemeyer, A., 2019. Bog breathing: the extent of peat shrinkage and expansion on blanket bogs in relation to water table, heather management and dominant vegetation and its implications for carbon stock assessments. Wetlands Ecology and Management 27, 467-482.
Natural England, 2013. Natural England Evidence Reviews: guidance on the development process and methods (NEER001). Natural England.
Renou-Wilson, F., Farrell, C., 2009. Peatland vulnerability to energy-related developments from climate change policy in Ireland: the case of wind farms. Mires and Peat 4.
Sander, L., Jung, C., Schindler, D., 2024. Global Review on Environmental Impacts of Onshore Wind Energy in the Field of Tension between Human Societies and Natural Systems, Energies.
Scottish Renewables, Scottish Natural Heritage, Scottish Environment Protection Agency, Forestry Commission Scotland and Historic Environment Scotland, 2015. Good Practice during Wind Farm Construction, version 3, available from https://www.nature.scot/doc/good-practice-during-wind-farm-construction
Smith, J., Nayak, D.R., Smith, P., 2014. Wind farms on undegraded peatlands are unlikely to reduce future carbon emissions. Energy Policy 66, 585-591.
Smith, P., Smith, J., Flynn, H., Killham, K., Rangel-Castro, I., Foereid, B., Aitkenhead, M., Chapman, S., Towers, W., Bell, J., Lumsdon, D., Milne, R., Thomson, A., Simmons, I., Skiba, U., Reynolds, B., Evans, C., Frogbrook, Z., Bradley, I., Whitmore, A., Falloon, P., Scottish Executive, Welsh Assembly Government, 2007. ECOSSE: Estimating Carbon in Organic Soils – Sequestration and Emissions: Final Report, Web only.
Tanneberger, F., Moen, A., Barthelmes, A., Lewis, E., Miles, L., Sirin, A., Tegetmeyer, C., Joosten, H., 2021. Mires in Europe—Regional Diversity, Condition and Protection, Diversity.
Waldron, S., Smith, J., Taylor, K., McGinnes, C., Roberts, N., McCallum, D., 2018. Repowering onshore wind farms: a technical and environmental exploration of foundation reuse. Carbon Landscapes and Drainage KE Network-led report. DOI 10.17605/OSF.IO/SCZDE
Wawrzyczek, J., Lindsay, R., Metzger, M.J., Quétier, F., 2018. The ecosystem approach in ecological impact assessment: Lessons learned from wind farm developments on peatlands in Scotland. Environmental Impact Assessment Review 72, 157-165.
Williams-Mounsey, J., Grayson, R., Crowle, A., Holden, J., 2021. A review of the effects of vehicular access roads on peatland ecohydrological processes. Earth-Science Reviews 214, 103528.
Zheng, Y., Waldron, S., Flowers, H., 2018. Fluvial dissolved organic carbon composition varies spatially and seasonally in a small catchment draining a wind farm and felled forestry. Science of the Total Environment 626, 785-794.
Appendix A – Research scope, questions and methods
Research Scope and Questions
To provide a comprehensive overview of the current state of knowledge, identify key knowledge gaps, and highlight areas for future research and policy development in sustainable peatland management within the context of renewable energy infrastructure, particularly in Scotland, this review has centred on the below questions:
Current practices:
How are excavated peat management and reuse practices being employed (of relevance for Scottish wind farm developments) both on-site and off-site?
Environmental impacts of current methods:
What are the impacts and/or benefits of current peat reuse practices in relation to hydrology and water quality, carbon emissions and storage, biodiversity and habitats?
Are there any environmental risks associated with current peat reuse practices, such as increased sediment load, erosion or landscape instability?
How do impacts change over time – what timeframes are relevant and are there long-term impacts of peatland disturbance and reuse practices?
Limitations and challenges:
What are the technical limitations of using excavated peat on-site?
How do regulatory frameworks impact the options for peat reuse?
Best practices:
From current available evidence, what peat reuse practices are preferable for minimising GHG emissions and wider negative environmental impacts?
How can peat management plans be optimised to maximise environmental benefits and minimise carbon losses?
Development of a reuse hierarchy
Hierarchy of Peat Reuse
Preparation and Planning Steps
Peat Reuse Implementation Principles
Research Methods
The following sections describe the information collation methods and data sources used in this study, these methods have been kept purposefully brief here, for more detail please see the appendices. A project database was compiled in Excel and is supplied separately to this project report.
Rapid Evidence Assessment
The method used for performing the evidence review was based on the Natural England (2013) evidence review methodology to ensure that the approach was transparent, objective and rigorous, allowing for robust evidential conclusions to be drawn from the available information for a full description see Appendix A.
Rapid Evidence Assessment methodology
The method used for performing the evidence review was based on the Natural England (2013) evidence review methodology to ensure that the approach was transparent, objective and rigorous, allowing for robust evidential conclusions to be drawn from the available information.
Scope
This rapid evidence assessment (REA) focused on synthesizing current evidence related to peatland excavation and reuse within the context of wind farm construction and similar large-scale developments. The assessment covered:
Current standard practices of peatland excavation and management in development projects.
Environmental impacts of peatland disturbance.
Opportunities for reuse of excavated peat on-site and off-site, including their environmental benefits and limitations over different timescales
Best practices for minimizing peatland disturbance and optimizing peat management plans.
Evidence search approach
The methodology comprises five main steps:
Define search strategy including keyword list compilation and define inclusion/exclusion criteria.
Searching for evidence and record findings.
Title and abstract screen.
Evidence extraction.
Evidence synthesis and evidence gap identification.
Step 1: Keyword list compilation
To establish a systematic search strategy, a list of key search words, search terms and suitable combinations were developed (included in separately shared document). These search terms were recorded for systematic use by the review team to reduce bias.
Step 2: Identification of information sources
In order to develop a comprehensive and relevant evidence base, appropriate information sources were identified. To reduce the risk of publication bias on the evidence base a range of information sources were used, which enabled access to peer-reviewed literature, grey-literature, and unpublished sources.
For this review Science Direct and Scopus were used to identify peer-reviewed information. Google Scholar and Research Gate provided further access to peer-reviewed information to enhance the literature search. Grey literature was also identified in the search and included industry reports and relevant committee proceedings.
Step 3: Evidence search
To facilitate the repeatability and transparency of the search process evidence searches were carried out as Boolean searches (AND, OR, NOT, etc). For example, using Boolean operators we searched (“excavated peat” OR “peatlands” OR “peat bogs” OR “carbon rich soils”) AND (“reuse” OR “recycling” OR “repurposing” OR “reclamation” OR “displaced” OR “borrow pits”) AND (“wind farms” OR “wind turbines” OR “wind energy” OR “onshore wind” OR “renewable energy”) AND (“sustainability” OR “environmental impact” OR “eco-friendly” OR “carbon footprint” OR “climate change” OR “carbon flux” OR “soil restoration” OR “land rehabilitation” OR “habitat restoration” OR “conservation”). The results of each search were recorded, including the number of search hits and number of relevant records returned, date of search and database used. Any other sources, such as evidence provided by stakeholders or generated through stakeholder engagement meetings were also documented similarly.
Developing and establishing search strings was treated as an iterative process and, as such, search strings were amended or adapted to optimise search relevance particularly where the number of search hits or relevance of records retrieved are excessively large or small.
Step 4: Title and abstract screen
In order to allow for a systematic and repeatable approach to screening whilst minimising individual subjectivity and bias, results of the evidence search were screened by title and abstract against pre-established inclusion and exclusion criteria for the review question(s). Evidence that did not satisfy the inclusion criteria were not taken forward for further analysis. References and key details (search date, search terms, publication name, database source and a DOI) were captured for all selected literature. Duplicates are also removed at this stage.
Step 5: Evidence extraction
To allow for interpretation and evaluation of the available literature evidence. A consistent, systematic approach to extracting evidence was taken for each item in the evidence item. Information was extracted on the basis of the review questions. Collated information included details of the type of study, the situation studied, key outcomes, endpoints and geographical extent (reported in separately shared excel document).
Step 6: Evidence synthesis and evidence gap identification
The compilation of evidence allowed for the type and amount of evidence obtained to be scrutinised and for any key evidence gaps or conversely areas of extensive evidence to be highlighted. This allowed for conclusions to be drawn based on the findings review and further enabled the appraisal of whether the collated evidence was adequate and suitable for addressing the review question. The collated information from the review of the literature is detailed in Supplementary Document 1 (finalisation in process).
Availability of the literature
The Rapid Evidence Assessment methodology used (Appendix A) obtained over 250 articles and reports through a range of keyword searches, in Science Direct and Google Scholar as described above. These were screened based on their title and abstract to identify relevant articles. This resulted in 50 articles and reports that were flagged as relevant for further scrutiny. These articles were then reviewed, and key information was extracted and is included within this report.
Desk-based research into current practices
A list of current wind farms in Scotland was obtained from the renewable energy planning database[12] (October 2024, quarter 3) sorted by energy type, location and whether they were currently operational (Figure 7). A sample of wind farms were chosen (as examples of a range of sizes of wind farms and locations across Scotland), to review the information provided within the peatland management plans, amount of peat to be excavated (if stated within application) and other related environmental planning information where obtained.
Figure 7. The distribution of wind farms across Scotland with peatland also highlighted. A list of current wind farms in Scotland was obtained from the renewable energy planning database[13] (October 2024, quarter 3) sorted by energy type, location and whether they were currently operational these were plotted on to a map of Scotland along with the distribution of peatland taken from Carbon and Peatland 2016 map[14].
Site visits
Five wind farm site visits were undertaken in November 2024 (Figure 3), these included three wind farms in the North-east of Scotland and two wind farms in the South-west of Scotland. These sites were chosen to cover a broad geographic distribution, a range of ages (different amounts of time since construction), and variation in peat depth. Visiting these sites provided a greater understanding of what was happening as part of the wind farm construction process, alongside providing context as to how peatland management plans are implemented and the many possible variations which can occur due to the amount of peat extracted, weather conditions and the inherent habitat quality prior to wind farm construction. These site visits also provided ‘real world’ examples of management practices in use, including (a) borrow pit reinstatement (over varying time periods – currently under construction, recent construction (< 5 years), 5-10 years since reinstatement, 10+ years since reinstatement), and (b) the replacement of peat at the side of the constructed roads (as part of the landscaping process and/or to maintain peat levels across the habitat).
Stakeholder Engagement Methods
During the study stakeholders were engaged for the following reasons:
To gain insights into current practices for reuse of peat excavated on wind farms in Scotland.
To gather views on the strengths, weaknesses, applicability and environmental outcomes of different reuse methods.
To gather suggestions for examples and sites which could provide learning about the two points above.
To gain input into the development of recommendations for reuse of excavated peat.
Appendix B Stakeholder engagement
Summary stakeholder engagement approach
Methods of stakeholder engagement:
Several different types of stakeholder engagement were employed in the study to gain further insights into relevant issues, current and potential future peat reuse methods, related considerations and impacts and to help identify sites to visit, get sign-posted to relevant documentation and research resources, and to understand considerations which are being or could be taken into account when decisions about reuse of excavated peat are made. Table 10 provides a brief overview of methods.
Table 10. Overview of stakeholder engagement methods
Dates
Activities
Purpose
Oct-Dec
2025
Research interviews with stakeholders / technical specialists.
Supplement desk-research.
Nov 2025
Site visits to wind farms incorporating local / other stakeholder engagement.
Gain insights into reuse activities on site, local context, site characteristics and how decisions were made.
Dec
2025
Academic / technical specialist online workshop
Supplement desk research, sense-check and refine draft recommendations.
Approach to identifying and selecting stakeholders to engage:
The project sought engagement with a range of different types of stakeholders academics and experts, such as those with a track record of relevant publications (i.e. on topics linked to the use of peat on wind farms in Scotland); practitioners from the energy sector (e.g. Ecological Clark of Works (ECoW) / Ecology officers) with wind farm sites in Scotland and from the construction sector that have been involved in building wind farms in Scotland; Civil Servants (Forestry and Land Scotland, PEAG); and conservation organisations (IUCN UK Peatland Programme). A selection of stakeholders were invited to attend the academic workshop, as well as a series of one-to-one discussions.
This approach to stakeholder engagement enabled the facilitation of site visits along with group discussions.
We identified stakeholders via:
Introduction / recommendations from the project steering group – a group of specialists from across relevant Scottish Government Agencies (see Section 8.1.7.3)
Desk research / REA – to identify relevant academics
‘Snowballing’ – asking our contacts and contacts via the steering group or other interviewees to recommend relevant technical experts or industry contacts who could provide access or insights about wind farm sites.
We have sought a diversity of sites, with reasonable access – but to include a site further North if possible due to variation in vegetation colonisation rates for reuse on site.
When selecting wind farm sites to visit we aimed to achieve a diverse range of sites with reasonable access where we would be able to observe a range of different types and ages of reuse of excavated peat. We chose to include sites in different locations, including some further North due to variation in vegetation colonisation rates which we were advised in earlier stakeholder interviews could likely influence the outcome / progression of reuse methods. We contacted several wind farmer developers / operators – some via introduction and some via publically available contact details and also landowners such as Forestry and Land Scotland. The final selection of sites for visit was based on who was willing to host a visit and practical feasibility in the project timescale and available resources (see Section 9.4). During the visits our hosts often shared wider insights about considerations for reuse of peat and examples from other sites which had worked well or less well – these insights are included in the summary findings here.
When selecting stakeholders to interview we tried to ensure a diverse range of perspectives, but we did not set out to achieve a rigorous sampling approach – we had to take a more pragmatic approach to gather insights from willing participants. The snow-balling approach was valuable in helping us identify people to speak to with relevant scientific and technical knowledge and who could provide insights into what had happened on specific sites. We made a deliberate effort to speak to some stakeholders from outside industry organisations, including academics, non-profit organisations and contractors/technical consultants to achieve some balance in our research. A full list of interviews is in Section 8.1.7.1.
Stakeholder workshop
We held an online workshop for academics and technical specialists on 16th December 2025 from 14:00 to 16:30. In total, 23 people attended (in addition to the Ricardo project team) including academic researchers, non-profit organisations, government agencies, energy company peatland specialists, see Section 8.1.7.2 for the list of attendees.
Workshop aims and objectives:
Gather insights from previous research and ongoing studies which may not yet be published, to fill research gaps.
Get insights into challenges / complexities which may need to be taken into account as we develop recommendations e.g. considerations for applying research results to different contexts / climates.
Discuss, test and refine initial ideas for a hierarchy of excavated peat reuse (or similar simple structured approach which could help guide decisions on peat reuse, depending on what has come from our earlier research.
Whilst the focus of the workshop was to engage academic researchers and technical experts, we also had attendees from industry who were technical specialists with relevant insights to share about their experiences with peat reuse in practice and the day-to-day challenges associated with planning, implementation and evaluation of peat reuse.
Workshop agenda:
Table 11. Workshop agenda
Time
Session
14:00
Introduction: project framing, context and scope; participant introductions.
14:20
Project literature review overview & stakeholder feedback
14:55
Examples of current practices drawn from sites visits / stakeholder interviews: comments, questions, sharing other examples.
Stakeholder feedback on recommendations / hierarchy
16:10
Final Polls: Feedback on options for recommendations
16:20
WRAP up and next steps
Findings from the workshop are incorporated into the stakeholder research results below (Section 8.1.6) and results of polls in Figure 8.
Figure 8: Results of word cloud (a) and other polls (b and c) undertaken during stakeholder workshop
a)
b)
c)
Method of analysis of stakeholder engagement findings:
Recording: Interviews
Transcripts and detailed notes of each stakeholder interview were recorded during the interviews and edited afterwards as needed to create an accurate record.
Recording: Site visits
During site visits photos and notes were taken relating to the site-specific context, practices and decisions. General learning was also noted, where for example the site host had experience across other sites or reuse practices.
Recording: Workshop
Transcripts and detailed notes were recorded during the workshop, as well as the results of polls and participation in interactive aspects of the workshop.
Analysis
Our project team systematically reviewed notes recorded from each element of the stakeholder engagement to identify comments related to the questions:
Current reuse practices
Potential future reuse practices
Insights about environmental outcomes from peat reuse
Other considerations
Evidence gaps
Priorities and recommendations.
Key findings from stakeholder engagement
Current peat reuse practices
During the workshop and stakeholder interviews a variety of practices were explained, along with associated issues, challenges and likely environmental outcomes or state of knowledge about the outcomes. The approaches are summarised in Table
Table 12. Current peat reuse practices
Current practice
Detail, benefits and issues
Borrow pit reinstatement, revegetation and habitat creation.
During site visits and interviews many examples of peat being put into disused borrow pits were shared. Common practices include:
Reinstatement / infill with the layer of peat which was previously on top of the borrow pit – often only part filled and then landscaped on one side to create gentler slope. Depth of infill varies.
Additional infill with peat excavated from elsewhere on site, sometimes designed with water outflow to mimic natural water flow.
Creating structured cells within borrow pits to maintain structure / control water flows with the aim of keeping peat wet / creating functioning peat bog or similar habitat.
Other practice examples included:
Allowing peatland heath type vegetation to develop in borrow pits without infilling any excavated peat (presumably when there was not excess peat).
Piping out peaty slurry from turbine bases into borrow pits.
Issues flagged included:
Water flows after infill – best practice is unclear, and design is unclear.
Peat depth – variable depths were filled, unclear whether all comply with current guidance[15].
Expense of constructing cells.
Insights shared about environmental outcomes:
Some examples seemed to have peatland vegetation indicator species and high-water tables
Often on slopes in landscaped borrow pits drier habitats develop.
Mixed success in maintaining / re-establishing vegetation cover meaning peat is sometimes left bare. More pronounce in northerly locations with slower vegetation colonisation.
Roadside verge reinstatement or revegetation.
A very common practice – excavated peat is stored alongside the road after construction, typically until after cables have also been laid, and then peat is reinstated. Sometimes:
Efforts are made to maintain structure and place turves on top for later reuse.
Wider verges are created / landscaped to hold more excavated peat from elsewhere on site.
Reseed to improve vegetation cover – although not common practice.
Issues flagged included:
Likelihood of peat drying out whilst store on roadside.
Significant risk of mixing soils and changing nutrient balance.
Significant risk of wind / water erosion during storage.
Convenience prioritised over effectiveness
Insights shared about environmental outcomes:
Mostly viewed as something unlikely to return to functioning peat bog due to peat storage, handling, contamination and proximity to road which will affect drainage.
Carbon may be lost during storage.
Revegetation, including wet heath type vegetation, was feasible or they knew of examples.
When vegetated can be beneficial to prevent silt / clay fines washing off into the wider landscape.
Infill historical peat cuttings
Not common but is used sometimes where peat cuttings are on site. Limited information was provided – unclear whether turves were placed on top or natural revegetation happened.
Example of storage in peat cuttings before use in incorporation into a restoration project was also cited.
Issues flagged included:
Only possible where peat cuttings exist – declining availability.
Insights into environmental outcomes:
Wet heath / acid grassland appeared to have developed on one site – although no vegetation survey data was available to confirm this.
Hydrological functioning / GHG emissions unclear – not data / other insights shared.
Reuse of peat where it had historically been located
Incorporate excavated peat into peatland restoration projects (pilot projects)
During two site visits and in other conversations examples of pilot projects to incorporate excavated peat into peatland restoration. Methods included:
Adding a layer of peat under existing turves / filling landscape furrows on former forested site.
Infilling bare sections of peat between hags, on degraded / eroded natural peatland areas.
Issues flagged included:
This is an experimental practice and not routinely permitted.
Access to suitable sites: access for earth works vehicles is difficult, making it hard to do larger areas away from tracks, without creating new access tracks.
Soil mixing is hard to avoid which can change nutrient balance in the peat and influence end result.
Designs aim to manage water to support peat formation whilst also ensuring safety / stability – different views were shared about how this should be done and appropriateness of approaches on site.
Insights shared about environmental outcomes:
Success of vegetation recovery/formation of active peat bog appears mixed so far, although long term observations and measurements are not available to enable evaluation.
GHG emissions fluxes are unclear – no monitoring data available.
Drainage related practices
Multiple stakeholders shared views and experiences on the role of drainage on site currently and typical practices. Current practices vary:
Infilling: some drainage ditches created during construction are infilled, and some aren’t. Those which are, are filled with arisings from the ditch creation, which would have been stored alongside for the duration of construction, mostly likely with limited management e.g. wetting.
Construction methods:
‘rock-filling’ above ground level in road construction to maintain water flows (floating road example)[16];
Angled flumes and other practices to separate silty or polluted drainage water to avoid wider pollution / silt spreading.
Issues flagged included:
Possible excessive / unnecessary drainage on some sites, having a detrimental effect on peatland habitats on site.
The importance of maintaining some ditches / drainage to ensure site stability and safety.
Insights shared about environmental outcomes:
Stakeholders felt that excessive drainage may hinder chances of successful recovery / recreation of peatland habitat re
Drainage important to maintain integrity of construction process – do not want to risk a peat slide
Scope for some of the temporary works drains to be infilled (usually with the arisings from the ditch itself) – however this is often not done (and doesn’t provide scope for vast quantities of peat reuse).
Peat handling & storage practices
Typical practice examples:
Roadside piles – various heights, various levels of attention to maintaining structure and wetness, varied timescales.
Efforts to minimise handling / transport often cited.
Insights shared about environmental outcomes:
Carbon lost when peat oxidises – often results when it dries out or is subject to erosion.
Carbon emissions from fuel use for transport around site (or off-site if that were to happen).
Off-site reuse of peat
No stakeholders cited any examples of peat being reused off-site – many had years of experience in the sector and had never known this to happen.
Other feedback provided by stakeholders on current practices included:
Variable ‘aims’ of reuse currently – ranging from developers who are trying to create functioning peatland on previously degraded land through to examples where people suggested there was no clear intention beyond finding a place to put the excess peat.
Compliance with guidance: multiple stakeholders shared a view / example that guidance is not always followed particularly in relation to peat infill depths and handling practices – reasons were unclear, although separately a skills gap was mentioned.
Quality of PMPs: varied – some followed fairly standard practice without consideration of the uniqueness of the site, whilst some were more nuanced / based on more detailed analysis of possibilities and potential outcomes
Enforcement / monitoring of PMPs: enforcement / monitoring during constructure can be inconsistent – sometimes very good collaboration and active consideration of effective approaches to achieve good environmental outcomes and sometimes poor / ineffective. Monitoring after construction and commissioning is not common practice, except were linked to habitat management plans which have a formal requirement for monitoring over the life of the site.
Influence of contracting process and responsibilities: separate contracts for different parts of the windfarm design and construction are commonly let which can make it difficult to develop and maintain a coherent plan for peat management through from planning permission through to final build and ongoing management. The wind turbine specification can also dictate excavation e.g. to achieve desired gradient for installation, but with more site surveys and consideration between developer, turbine supplier and site works contractor there may be potential to develop techniques which require less excavation.
Important of site selection / micro-siting: the flexibility to move turbines, based on more detailed site surveys of peat is important to reduce peat excavation.
Reuse of peat is well policed – must be in line with SEPA Reuse Guidance and therefore industry stakeholders follow this approach without feeling able to vary from this.
Potential future reuse practices
Practice
Details, benefits and issues
Deliberately targeting specific end habitat e.g. in borrow pits
Stakeholders suggested that it may be feasible to design reuse more intentionally with target end-habitat in mind e.g. designing the borrow-pit structure and planning peat excavation and handling specifically with the aim of targeting a valuable habitat – peat bog recreation if feasible or if not, another locally suitable and ideally wet habitat type. There was uncertainty about how to ensure success and what outcome was feasible on a site-by-site basis given the variability between sites in terms of prior land condition, surrounding context and land scape and land ‘capability’ for habitats.
Further use in restoration
Some stakeholders felt the incorporation of excavated peat into restoration projects had potential to achieve good environmental outcomes – examples highlighted were infill in degraded and eroded peatlands including hag infill, incorporation in former forested / forest bog landscapes – various methods being piloted.
Some apparent success of vegetation recovery on pilot examples was flagged, but stakeholders acknowledged that the environmental outcome were unclear.
Some stakeholder flagged potential concerns about the effectiveness of this approach due to:
Difficulty establishing vegetation on slopes
Potential challenges with water flows, depending on locations and hydrology.
Impact of damage during the restoration process and skills needed in planning, preparation and handling to achieve a good outcome.
Site stability / drainage – general agreement on its importance but different views on how to achieve / balance with other priorities leading to some concern about how to approach more experimental methods.
Infill of drainage ditches (where safety/stability allows)
Stakeholders flagged that, whilst it is important for site safety and stability to ensure suitable drainage is maintained, there could be opportunities to infil more drainage ditches or increase overall wetness on site to benefit existing peatland habitats on site or increase the likelihood of successful peatland habitat forming where peat reuse has aimed for this outcome.
Off-site uses
We asked whether uses such as agriculture/horticulture whiskey industry use would be feasible or environmentally beneficial in any circumstance or whether they knew of any other examples.
No stakeholders felt that off-site use was a good idea due to:
Costs
likely loss of peat structure / liquification during transport
environmental impacts of transport
likelihood that carbon would be lost from peat in the new use – lack of control over this.
Insights about environmental outcomes from peat reuse
Examples and comments on positive environmental outcomes:
Peat / vegetation recovery in restoration / hag infill – appears successful (in short-term) on flatter ground.
Softer trackside verges – vegetation and less slope – can prevent silt migrating into bogs.
Typical vegetation recovery: acid grassland mix initially, then (5-10yrs later) heathers / heath, and then hopefully wetter ones will progress to bog.
Examples and comments on negative environmental outcomes:
Most peat reused on wind farms turns into non-peatland habitat – it doesn’t function as peatland because hydrological conductivity is lost. At best going to form an upland wet heath, more likely to be an acid grassland.
If non-functioning peatland carbon will not be saved within the system Need to keep the carbon gaining and building within the system.
With poor water management silt is migrating into wet bogs.
Contamination of nutrient poor peatbog with mineral sources changes nutrient balance and therefore makes peatbog hard to achieve in reuse/restoration – flushed peat or fen more likely. Several stakeholders flagged that it can be challenging to prevent mineral contamination – storage and handling care is needed, and isn’t always feasible in practice.
Other comments on environmental outcomes:
Potential measurement approaches:
GI stage, peat probing / wetness, catchment mapping, qualitative sample (no one does this despite guidance), Van Post Scale (peat character).
Dip wells – across sites.
Water index via satellite imagery linked to Sentinal programme.
Pressure loggers – data recording for three months.
Options for assessing carbon; current government calculator, in house planning tools; revised carbon calculated – potential for different assumptions about loss of carbon on excavated peat.
Important to balance carbon / biodiversity outcomes. Some stakeholders flagged this in general and also one highlighted the challenge of balancing this in the context of deciding whether to rewet peat during storage – if abstraction from river is required this could have negative consequences for river habitat.
Several flagged nervousness about assuming reused and restored peat delivers the same environmental outcomes as natural peatlands.
Other considerations for excavated peat reuse
Drainage installation, maintenance and infill: stakeholders agreed that ensuring the right amount of drainage during construction and afterwards is important, but did not all agree on how well this is currently being achieved and whether it is possible provide clearer guidance on this.
Peat handling & storage: many stakeholders flagged the need to minimise movement and handling of peat, aim to keep peat local, minimise handling / travel distance. Use of large diggers and trucks makes this hard. Issues included:
Need to keep the peat moist: actively or passively
Need to maintain layers / structure and avoid contamination with mineral soils / aggregate as this will change the nutrient profile and functional structure of the peat.
Peat can liquify in trucks if handled.
Cost for moving peat
Some flagged that temporary storage in ‘groins’ between road junctions is often preferred as there is more space to work there, whilst other advocated designated storage areas. What is practical will vary site to site.
‘Land-made-available’ limitation: land envelope can restrict end destination of any peat reuse ‘on site’ – instances where sensible areas for ‘peat reuse’ are outside the envelope.
Site data availability: planning the peat re-use in advance would be good but often don’t get chance to plan until actually on site and work starts – trees often obscure lidar data.
Excavation timing: contractors don’t get much choice/penalties for delays – timing will influence ability to keep peat wet, keep structure etc.
Evidence gaps
Stakeholders flagged the following issues and gaps in evidence:
Limited monitoring of implementation and outcomes of Peatland Management Plans (PMPs). Monitoring isn’t required for PMPs in the same way as for Habitat Management Plans (which are monitored for the life of the wind farm), and therefore limited data is available on prior land condition, peat reuse/management methods, and environmental outcomes.
Approach and quality of assessments and monitoring could be better. Current over reliance on the presence or absence of specific vegetation as an indicator was highlighted – finding a species at a specific location in a large site doesn’t represent the entire site. Better quality peatland condition assessments are needed, ideally landscape based incorporating species, hydrology and other factors rather than quadrat based. This would provide better data for planning reuse / management and a better baseline for impact monitoring, particularly important as construction is often on degraded peat.
Lack of longitudinal studies into environmental outcomes of peat reuse/management approaches. People cited specific gaps such as study of behaviour and environmental outcomes of peat drying at the side of the road after reinstatement; impacts of storage techniques such as surface roughing to help water infiltration vs allowing crust to form; GHG emissions following disturbance and reinstatement.
General gap in terms of the understanding of peatland and peat behaviour in the context of wind farm construction. This includes peatland hydrology and how this is affected by disruption, how peat behaves in storage, the impact of movement on peat quality and potential for reestablishment in new destination
Evidence of the validity of measures such as water table and indicator species as indictors of GHG emissions / ‘functioning peat bog’ for reinstated / restored peatlands. Stakeholders flagged there is no research on peatland excavation and then reuse, hence need to establish the relationship with vegetation, hydrology.
Limited literature on remote sensing for wind farm monitoring.
Lack of clear guidance on some aspects of engineering and site management e.g. balancing drainage and wetness, storage practices.
Lack of research to show whether implementation of best practice is feasible. NPF4 Policy 5 states that ideally carbon rich soils are actively sequestering carbon, and this should be the aim of the PMP. There is a need for research to show if this is possible – this relates to points above about behaviour of peat after disturbance / validity of indicators.
Priorities and recommendations
In general stakeholders were reluctant to give detailed feedback on which methods of peat reuse on site should be a priority because of variability of site circumstances (e.g. land capability, condition) and the lack of concrete research to provide evidence of the environment outcomes which could be anticipated.
Some key comments and points on priorities were:
Revegetation and minimising bare peat is key to avoid negative cycle of drying and/or erosion: to help success it is important to have follow up surveys and action if issues are identified.
Need to minimise extraction of peat.
Advice must allow for flexibility and be nuanced due to the diversity of peatlands.
Suggested hierarchy:
Avoid;
Reinstate in location contiguous to other peatland where carbon can be retained and retain hydrology and long-term species composition will be at least consistent with species within the species disturbed.
Re-use off site to the same effect.
Alternative suggestion: two different hierarchies, one with the aim of functioning peatland, and one for the aim of using peat in a way that would result it being used for another purpose e.g. wet heath, dry heath.
Essential component is maintaining connectivity of the re-use areas with the hydrology and its immediate area, but also looking further at the wider hydrological unit. This also includes connectivity with the peatland restoration areas that will be undertaken on the site.
Guidance documents can be perfect, however, on the ground can be challenging e.g. to ensure hydrological connectivity – potential need for incentive to go for the best outcome and need to involve different parties to achieve this.
List of stakeholder discussion interviews and workshop attendees
Interviewees
Susan Nicol
Forestry and Land Scotland
Andy Gillan
RJ Mcleod
Mark Mulqueeny
SSE
Derek Healy
Duncan Mackay and Sons
James Allison
Scottish Power
Emma Taylor
SEPA
Roxane Anderson
University of Highlands and Islands
Gill Steel
Ironside Farrar
Siue Allen
Ironside Farrar
Malcolm Crosby
Forestry and Land Scotland
Richard Clarke
Forestry and Land Scotland
Sue White
Shetland Community Trust
David McGinty
SSE Renewables
Workshop attendees
Name
Organisation
Role
Andy Mills
OWC Ltd
Geomorphologist writing many PMP’s
Andy Gillan
RJ McLeod Contractors
Construction projects on peatlands
Irene Tierney
IMTECO Ltd
Ecologist writing many PMP’s
Emma Hinchliffe
IUCN UK Peatland Programme
Director
Cerian Baldwin
PeatlandACTION
Technical director involved in development, Scottish Peatland Standard and reviewing PMPs and EIAs in relation to peat
Alan Cundill
SEPA
Senior Specialist Scientist interested in reuse/management of peat
Claire Campbell
SEPA
Senior Specialist Scientist and reviewing PMP’s
Jessica Fìor-Berry
IUCN UK Peatland Programme
Peatland Programme policy lead
Karen Rentoul
NatureScot
Policy advice manager for uplands and also peatlands
Rachel Short
ScottishPower Renewables
Senior ecology manager responsible for design, construction and operation of wind farms, many on peatlands
Fiona Donaldson
SEPA
Waste policy unit interested in management of excavated peat
Grace Gubbins
NatureScot
Involved in the development of the biodiversity metric for the planning system, also supporting peatland expert advisory group
Roxane Andersen
University of Highlands and Islands
Peatland scientist, also sit on peatland expert advisory group
Chris Marshall
SLR Consulting
Peatland lead dealing with many PMP’s
Susan Nicol
Forestry and Land Scotland
Land managers leasing land for wind farms
Kirsten Lees
University of Derby
Peatland restoration with focus on carbon
Ainoa Pravia
Forest Research
Ecologist (for peatlands)
Iain Detrey
EA
Peatland adviser (for England)
Nicholle Bell
University of Edinburgh
Peatland restoration, and alternative reuse options
Kerry Dinsmore
SG
Principal science advisor on peatlands, also on steering committee
Project steering group
Ben Dipper (Scottish Government)
Kerry Dinsmore (Scottish Government)
Patricia Bruneau (Nature Scot)
Scottish Government policy team representatives
Appendix C Wind Farm Site Research (site visits & desk research)
Wind farm planning document review
This section reviews the desk-based research describing existing wind farms management plans including data on numbers of wind farms across Scotland on peat soils.
Wind farm site visit summary
This section combines the results of the desk-based research describing existing wind farm management plans alongside the information gathered during the site visits. We aimed to visit a diverse range of sites with reasonable access where we would be able to observe a range of different types and ages of reuse of excavated peat. We chose to include sites in different locations, the north-east and south-west of Scotland. In both areas we visited a newly constructed wind farm, alongside older wind farms within the same locality. This provided examples with different vegetation colonisation rates which could influence the success of reuse methods. We contacted several wind farmer developers / operators, the final selection of sites for visit was based on who was willing to host a visit and practical feasibility in the project timescale and available resources.
Desk-based findings
We reviewed the planning information prior to site visits. This included information on when the work was completed / site commissioned to generate energy, the number of turbines that had been built (both initially and in phased extensions), land ownership and whether other stakeholder were involved in the process (e.g. wildlife rangers based on site, ECoW’s).
Sample site selection
Site selection was undertaken taking into account key variables to ensure that a representative sample of wind farms across Scotland was obtained. Primarily, this included considering a range of development site sizes and locations across Scotland, while ensuring that wind farms were both operational and included relevant Peat Management Plans (PMPs). To note, the number of wind turbines was used as a proxy for development size, while the requirement for developments to have PMPs significantly reduced availability of case studies (even though this is an NPF4 requirement).
Peatland management plans
The key limitations in the approach concerned the accuracy of the data held within the PMPs, for which accessing documents with the requisite information (peat depths and volumes) was the first challenge. In those PMPs that were available, the peat volumes were based on peat survey depths, which are extrapolated across sites via peat probe information, meaning that there is a degree of uncertainty between distinct probe points. There is therefore a high degree of mathematical assumption based on converting peat depth extrapolations to volumes via combining this data with site stripping boundaries. Utilising survey information also assumes competence of all surveyors, despite peat surveys (and peat identification more generally) being a highly specialist skill that geo-environmentalists, geotechnical specialists and even soil scientists would not necessarily have experience of. In addition, peat volumes included in PMPs can change during the construction phase, such as where design is updated, or due to poor implementation of PMP measures. This means that volumes at project inception are often unlikely to be the same once wind farms are conducted, given the dynamic nature of the construction phase and typically iterative design approaches.
Overview of key finding from site visits
Key highlights are included in the main section 3.5.2, 3.5.3 and 3.5.4. A number of borrow pits were visited at each of the sites – these varied in effectivity, levels of monitoring and time since reinstatement. Landscaping examples where peat had been put down along the roadside were clearly visible in the newly constructed wind farms, in the older wind farms this was less obvious, in some cases the peat had become part of the surrounding peatland, however the likelihood was that in some areas it had been lost to the wider environment through erosion. Novel restoration reuse was seen, this was experimental and not common practice. No peat was taken off-site for reuse elsewhere.
Limitations of site visits
Although we were very grateful to the stakeholders for taking the time to show us the wind farms and distil their knowledge of the process, it was clear that this view was only able to provide a snapshot in time analysis of what had occurred at that site. Also depending on time from commissioning, some key details related to the reuse of peat were lost (e.g. exact volumes of peat used within infill of peat excavations, how borrow pit reinstatements were originally designed). Thus, it is harder to identify best practice and what has worked and what hasn’t if the methodology is unreported. The site visits could have been impacted by the weather conditions on the day (e.g. low cloud and drizzle for the final site visit), this made note taking and photographing examples harder and some of the finer details may not be visible in the photographs.
How to cite this publication:
Crotty, F., Dowson, F., Schofield, K., Barker, M., Ginns, B., David, T., Herold, L. (2025) ‘Reuse of excavated peat on wind farm development sites’, ClimateXChange. DOI: http://dx.doi.org/10.7488/era/6333
While every effort is made to ensure the information in this report is accurate as at the date of the report, no legal responsibility is accepted for any errors, omissions or misleading statements. The views expressed represent those of the author(s), and do not necessarily represent those of the host institutions or funders.
This work was supported by the Rural and Environment Science and Analytical Services Division of the Scottish Government (CoE – CXC).
Scottish Renewables, Scottish Environment Protection Agency. 2012. Guidance on the Assessment of Peat Volumes, Reuse of Excavated Peat and the Minimisation of Waste ↑
Micro-siting is where small adjustments to the wind farm lay out are made to avoid / minimise damage to peat (or other sensitive environments) on site. ↑
The Climate Change Committee’s 2023 Report to the Scottish Parliament called for stronger action on food system emissions. Policy interventions need to address the environmental impacts of food production and consumption while ensuring dietary improvements and economic sustainability.
This report assesses Scotland’s diet and climate policy landscape, identifying areas for policy development and providing recommendations to support the Scottish Government’s climate, public health and food security goals going forward.
The study combined desk-based research, stakeholder engagement and categorisation using a PESTLE (Political, Economic, Social, Technological, Legal, and Environmental) framework.
Key findings
Scotland’s complex diet and climate policy landscape includes several emerging developments and opportunities, yet challenges persist. These challenges typically reflect areas that would benefit from policy coordination and development.
Political alignment and coordination: Scottish Government has taken steps to articulate sustainable food ambitions through legislation such as the Good Food Nation Act. Fragmentation across different policy fields (health, agriculture, environment, economy) limits integrated food system transformation. Coordination between local, devolved, and UK governments remains limited, leading to conflicting priorities. The absence of clear emissions targets for food production constrains alignment with net-zero ambitions.
Economic levers and constraints: Investments in local food initiatives and growing interest in sustainable supply chains signal progress. Fiscal policies have the effect of benefiting high-emission food production over sustainable alternatives. Financial barriers constrain local authorities, small producers, and community groups in adopting agroecological approaches. The cost of sustainable food options continues to limit access and dietary change.
Social attitudes and engagement: Public interest in sustainable diets is increasing, and some awareness campaigns have gained traction. Cultural traditions, cost concerns, and inconsistent messaging shape public resistance to reducing red meat consumption. Food insecurity remains a barrier to sustainable diet access for lower-income households. Greater public engagement is needed to build trust and understanding of dietary policy aims.
Technological tools and innovation: Advances in precision agriculture and digital tools offer potential for more sustainable production. Lack of a standardised food emissions-tracking system limits evidence-based policymaking for reducing environmental impact. Rural areas often lack the digital infrastructure to adopt new technologies. Inadequate sustainability labelling limits informed consumer choice.
Legal frameworks: The Good Food Nation Act provides a foundation for coordinated food policy development. The evidence suggests a lack of strong enforcement mechanisms to drive change. Regulation of food marketing, labelling, and ultra-processed foods is limited. Devolved and UK-wide inconsistencies create legal misalignment across food, health, and trade policy.
Environmental integration: Scotland has made progress in climate policy and land stewardship through initiatives like the Land Use Strategy. There are challenges in balancing different land use functions such as forestry, agriculture, and biodiversity protection. Climate adaptation strategies for agriculture need to be better developed, due to increasing climate risks. The ecological role of grazing land in biodiversity and carbon sequestration is underutilised in policy planning.
Opportunities for action and policy implications
A summary of key opportunities for action is presented in the table below. A fuller articulation of these opportunities, with supporting detail, is included in Section 6, Conclusions and policy implications.
Building a resilient and sustainable Scottish food system
Key insights and policy pathways
Political
Promote more coordinated governance approaches to food policy.
Enhance cross-sector collaboration to support integrated food system policy.
Consider mechanisms to improve accountability across the food system.
Economic
Align agricultural support with sustainability goals.
Explore ways to enhance financial support for sustainable food systems.
Explore the effectiveness of fiscal policies for dietary shifts.
Social
Address food affordability and accessibility.
Foster inclusive public engagement and food education.
Support culturally sensitive dietary transitions.
Technological
Promote development of standardised emissions data for food products.
Enhance digital food labelling to support sustainability and consumer awareness.
Legal
Review opportunities to strengthen food regulations.
Support better alignment between devolved and UK-wide food policies.
Support increased transparency in food supply chains.
Environmental
Promote climate adaptation planning within food and land-use policy.
Balance food security with biodiversity needs.
Explore opportunities to align land-use policies with sustainability objectives.
Glossary and abbreviations table
Agroecology
A sustainable farming approach that applies ecological principles to agriculture and prioritises local knowledge, biodiversity, and low-input systems.
Carbon sequestration
The process of capturing and storing atmospheric carbon dioxide, often through natural systems like forests and soils.
Climate Change Committee (CCC)
The Climate Change Committee is an independent, statutory body established under the UK’s Climate Change Act 2008. Its primary role is to advise the UK Government and devolved administrations on emissions targets and to report to Parliament on progress in reducing greenhouse gas emissions and preparing for climate change.
Food for Life (Scotland)
Food for Life Scotland is a programme operated by the Soil Association, funded by the Scottish Government, with the mission to make good food the easy choice for all. The initiative focuses on harnessing the power of public food to positively impact health, the environment, and the local economy.
Food sovereignty
The right of people, communities, and countries to define their own food systems, including the production, distribution, and consumption of food.
Food system transformation
A fundamental shift in the way food is produced, distributed, and consumed to improve sustainability, health, and equity.
Fortification
The process of adding essential vitamins and minerals (such as iron, iodine, vitamin D, or folic acid) to food to improve its nutritional quality and prevent or correct dietary deficiencies in a population. Common examples include the fortification of flour with folic acid or milk with vitamin D.
Good Food Nation (Scotland) Act
The Good Food Nation (Scotland) Act 2022 establishes a framework for Scotland mandating the creation of national and local Good Food Nation Plans, aiming to ensure that food-related policies contribute to various aspects of well-being, including health, economic development, and environmental sustainability.
Just Transition
A policy framework to ensure that the shift to a low-carbon economy is fair and inclusive, protecting workers and communities.
Net-zero
Achieving a balance between greenhouse gas emissions produced and those removed from the atmosphere.
PESTLE analysis
A strategic framework used to identify and analyse Political, Economic, Social, Technological, Legal, and Environmental factors for understanding the broader context for decision-making.
Precision Livestock Farming (PLF)
Precision Livestock Farming refers to the application of advanced technologies and data-driven methods to monitor and manage individual animals within a herd. PLF aims to enhance animal health, welfare, productivity, and environmental sustainability.
Plant based
A diet or product primarily made from plants (e.g., vegetables, fruits, grains, legumes, nuts, and seeds). While not always strictly vegan or vegetarian, plant-based diets typically minimise or avoid animal products.
Plant based meat alternatives (PBMAs)
Food products designed to mimic the taste, texture, and appearance of conventional meat but are made from plant-based ingredients.
Procurement
The strategic process by which organisations acquire goods, services, or works from external sources to fulfil their operational needs. This process encompasses a series of steps designed to ensure that acquisitions are made in a timely, cost-effective, and quality-assured manner.
Reformulation
The process of altering the ingredients of food or drink products to improve their nutritional profile; for example, by reducing salt, sugar, or saturated fat, while maintaining taste and consumer acceptability.
Regenerative agriculture
A system of farming practices that aims to restore and enhance soil health, biodiversity, water cycles, and ecosystem resilience while producing food.
Scope 3 emissions
Refers to accounting for the indirect greenhouse gas emissions that occur across a retailer’s value chain, such as those from the production of goods they sell, transportation, packaging, and consumer use and disposal. Including Scope 3 emissions provides a more comprehensive picture of a retailer’s wider environmental impact beyond their direct operations.
Scottish Dietary Goals (SDGs)
A set of nutritional targets established by the Scottish Government to improve the overall health of the population by promoting healthier eating habits. These goals outline the recommended intake levels for various nutrients and food groups, aiming to reduce the prevalence of diet-related conditions such as obesity, heart disease, and type 2 diabetes.
Scottish National Adaptation Plan 2024-2029 (SNAP3)
The Scottish National Adaptation Plan 2024-2029 (SNAP3) is Scotland’s strategic framework aimed at enhancing the nation’s resilience to the impacts of climate change over a five-year period. SNAP3 outlines a comprehensive approach to adaptation, ensuring that Scotland’s communities, economy, and environment are prepared for current and future climate challenges.
Semi-structured interview
A qualitative data collection method that uses a flexible interview guide with open-ended questions. It allows the interviewer to explore specific topics in depth while also adapting questions based on participants’ responses.
Stakeholder mapping
A strategic process used to identify, analyse, and visualise individuals or groups (stakeholders) who have an interest in or are affected by a project, organisation, or policy. This technique helps to understand stakeholders’ influence, interests, and relationships, facilitating effective communication and engagement strategies.
Supply chain
The network of organisations, people, activities, information, and resources involved in the creation and delivery of a product or service from the supplier to the end customer.
Sustainable diet
A diet that promotes health and well-being while reducing environmental impact and supporting food system resilience.
Systematic literature review
A structured and comprehensive method for identifying, evaluating, and synthesising all relevant research on a specific topic using transparent and replicable procedures.
Third Sector
The part of an economy or society comprising non-governmental and non-profit organisations, such as charities, community groups, voluntary organisations, social enterprises, and cooperatives.
Ultra-processed food
Industrially formulated foods that typically contain additives and minimal whole ingredients; often linked to poor health outcomes.
Urban agriculture
The practice of growing, processing, and distributing food within or around cities and towns (e.g., community gardens, rooftop farms, vertical farming, backyard gardening, and small-scale livestock or aquaculture). It can support local food systems, access to fresh produce, and community engagement, climate resilience, and urban greening.
Vertical farming
A method of growing crops in vertically stacked layers, often in controlled indoor environments. This allows year-round production and is commonly used in urban areas to reduce food miles and increase local food resilience.
Zoonotic disease
A disease that can be transmitted between animals and humans. These diseases can be caused by viruses, bacteria, parasites, or fungi, and can spread through direct contact, food, water, or vectors like mosquitoes. Zoonotic diseases are a key concern in public health, agriculture, and environmental management due to their potential for outbreaks and global spread.
Table 1: Glossary and abbreviations used in the report
Introduction
How can Scotland balance climate goals, public health, and economic resilience in food policy?
Scotland’s diet and climate policy landscape is shaped by multiple, often competing priorities, making policy development and implementation particularly complex. Scotland’s net-zero ambitions don’t sit in isolation and delivery is influenced by UK Government food policy and wider cross-border complexities. Any approach must align with, Scotland-specific advice such as Recommendation R2024-003 from the Climate Change Committee’s (CCC) 2023 Report to the Scottish Parliament, which calls for stronger action on food system emissions (CCC, 2023). The CCC’s carbon budget for Scotland is due to be published in May 2025, and the CCC has highlighted that agriculture is projected to become the second-highest emitting sector by 2040. Efforts to reduce the environmental impact of food consumption need to be balanced with public health goals, economic considerations, and social acceptability. While the Scottish Government plans to introduce measures such as restricting unhealthy food promotion and encouraging sustainable agricultural practices, significant barriers remain. Public resistance to dietary change, particularly reductions in red meat consumption, reflects deep-seated cultural attitudes and concerns about choice, affordability and accessibility. Furthermore, promoting lower meat diets could lead to economic contraction in agriculture-related sectors, especially the red meat sector (Allan, Comerford & McGregor, 2019). If food system transitions are to be just, they must ensure that rural economies and farming communities remain viable while meeting climate targets, requiring sensitive and adaptive policy solutions.
Another layer of complexity arises from policy fragmentation and governance challenges. Responsibilities for food, health, environment, and agriculture are divided across multiple sectors and levels of government, including devolved and UK-wide authorities, leading to inconsistencies in strategy and implementation. Furthermore, the socio-economic impacts of dietary policy shifts, including how changes affect low-income households or food supply chains, are not yet fully understood due to limited data and evaluation frameworks. Addressing these challenges will require a holistic approach that integrates cross-sectoral collaboration, rigorous evidence, and stakeholder engagement to navigate trade-offs and identify the most feasible pathways for change.
Aims of the project
This report addresses two primary aims:
Analysis of a mixed-method evidence base for diet and climate policy in Scotland using a structured PESTLE framework.
Identification of evidence gaps and the proposal of actionable recommendations to inform future policy development.
These two aims seek to support the Scottish Government in developing policies aligned with climate targets, while also advancing a just transition that considers the nutritional needs of communities, and the livelihoods of people employed in the food system.
Methodology
Research design
This research adopted a mixed-method design to analyse the intersection of diet and climate policy in Scotland. It combined desk-based research, stakeholder engagement, and thematic categorisation using a PESTLE framework (Political, Economic, Social, Technological, Legal, and Environmental dimensions).
Research approach and evidence sources
The study integrated three core sources of evidence:
Literature review: A systematic review of academic, grey, and policy literature, including documents from the Scottish Government, Climate Change Committee, Food Standards Scotland, and international case studies. Further detail on the literature review method can be found in Appendices C and D.
Stakeholder engagement: 14 semi-structured interviews with stakeholders from government, academia, and civil society provided insight into governance challenges, socio-economic impacts, and practical barriers to policy implementation. Further detail on the method can be found in Appendix E.
Workshops: Three stakeholder workshops (one in-person, two online)[1] were conducted to validate findings, prioritise areas for further policy development, and co-develop recommendations. These involved scenario planning and structured group discussion. Workshop protocols and details of participating stakeholders are displayed in Appendix F.
Ethics and data management
The research followed ethical guidelines from the University of Bath and ClimateXChange. All participants gave informed consent and were offered anonymity. Data handling adhered to the Scottish Government’s “open as possible, closed as necessary” principle. Triangulation across data sources helped ensure reliability and consistency.
Stakeholder mapping
Stakeholders were identified through desk research and consultations (see Appendix A) and classified into categories including government, academia, third sector, public health, industry, and community groups. A database of 447 stakeholders was compiled (Appendix B).
PESTLE framework
The PESTLE framework guided the thematic analysis of areas for policy development and opportunities, ensuring comprehensive coverage of structural, social, and environmental dimensions. It helped surface interdependencies and evidence gaps across policy domains.
Limitations and future research
Due to time constraints, the analysis could not include quantitative modelling or longitudinal data. While the research drew from diverse sectors, representation from the food industry was more limited. Further research should explore economic modelling of dietary transitions, consumer behaviour dynamics, and legal feasibility of regulatory measures.
Further methodological detail, including workshop protocols and stakeholder lists, is available in the Appendices.
Analysis of diet and climate policy evidence
While the literature, stakeholder meetings, and workshops all highlighted the need for more integrated, cross-sectoral approaches to diet and climate policy, each source also highlighted distinct emphases.
The literature focused on systemic analysis and policy gaps, often referring to structural barriers, need for further regulation, and the dominance of voluntary policy mechanisms.
The stakeholder meetings added a degree of nuance on political sensitivities, informal policymaking, and institutional fragmentation, often surfacing insights that were missing from the literature, such as the influence of farming identities, lobbying, and inter-departmental misalignment (i.e. the lack of coordination between government departments, such as health, agriculture, and climate, which can lead to contradictory or disconnected policies).
The stakeholder workshops, by contrast, reflected the practical and lived experience of policy implementation, giving voice to tensions related to affordability, cultural norms, and supply chain dynamics, and offering grounded ideas for cross-sector collaboration.
Taken together, these sources converged on key challenges but revealed gaps in empirical evidence on effective interventions and highlighted the need for more inclusive, community-informed policy processes.
The following sections present an analysis of the issues shaping diet and climate policy, drawing on insights from the literature review, stakeholder meetings, and workshops.
We begin by outlining key areas for policy development, offering a comprehensive view of the diverse factors influencing policy in Scotland. For clarity, each PESTLE dimension is analysed separately, although we recognise that many issues cut across multiple dimensions. In addition to the summaries in Sections 5.1–5.6 of the report, extended analyses and illustrative examples are provided in Appendices G–L.
PESTLE Political dimension
The PESTLE Political dimension highlights key political drivers and barriers shaping Scotland’s food system, focusing on governance, policy coherence, and regulatory alignment. Despite ambitious climate and health goals, food policy remains fragmented; characterised by siloed strategies, short-term political cycles, and limited public engagement.
There are clear opportunities to improve alignment between national and local policies, embed measurable targets under the Good Food Nation Act, and integrate food more fully into net-zero strategies. Policy coherence is particularly lacking in areas such as dietary change, where targets, especially for meat reduction, are absent or politically sensitive.
Public procurement and food supply chain resilience require stronger alignment with sustainability priorities. Resistance to livestock reduction, driven by cultural, economic, and political factors, continues to constrain progress. Meanwhile, policy support for plant-based foods, oversight of emissions-intensive agriculture, and trade resilience post-Brexit, remain underdeveloped.
Improving citizen participation and learning from international best practice are also essential to ensure legitimacy and policy effectiveness. Overall, stronger strategic leadership and more integrated, inclusive policymaking are critical to enable a just transition in Scotland’s food system.
For further detail and illustrative examples, see Appendix G.
PESTLE Economic dimension
This section outlines key economic enablers and constraints in Scotland’s transition to a more sustainable and just food system. While the need for climate-compatible diets and resilient supply chains is increasingly recognised, economic policy and market structures remain poorly aligned with sustainability goals.
The analysis highlights persistent gaps in financial incentives for low-carbon agriculture, agroecology, and alternative proteins. Current financial support regimes continue to favour high-emission livestock production, while support for biodiversity and ecosystem services is limited. High upfront costs and infrastructure barriers also constrain farmers’ ability to adopt sustainable practices.
Trade and supply chains add further complexity to the landscape. Import/Export policies risk carbon leakage and should go further to reflect Scotland’s net-zero ambitions. Small producers face limited access to public procurement and mainstream markets, which are dominated by large retailers and multinationals.
A lack of stable, long-term funding also undermines urban agriculture, community food initiatives, and public food provision. Consumer incentives are misaligned; VAT law and pricing structures serve to limit the uptake of plant-based foods, while environmental and health costs remain externalised. Without targeted interventions, dietary shifts might also result in greater reliance on ultra-processed food or alternative animal products, with implications for health.
A clear transition strategy is needed to support rural economies, address workforce shortages, and align financial incentives, trade policies, and consumer support with Scotland’s net-zero goals.
For further evidence and examples, see Appendix H.
PESTLE Social dimension
The next section explores the social factors that influence dietary behaviours, food access, cultural norms, and public engagement with food system sustainability in Scotland. While awareness of sustainable diets is growing, economic inequality, cultural barriers, and information gaps continue to limit equitable access to healthier and more climate-compatible food choices.
The analysis shows that low-income, rural, and marginalised groups face structural challenges to adopting sustainable diets, including affordability, limited access to healthy food options, and digital exclusion. Taxation policies, such as levies on red meat, may also disproportionately affect households with limited economic flexibility unless protections are in place. High energy costs, limited cooking facilities, and restricted access to healthy food outside the home reduce the feasibility of dietary shifts for many communities.
Consumer environments and behaviours present further challenges. Ultra-processed foods dominate many retail and foodservice settings, while alternative proteins remain scarce or poorly understood. Misperceptions, unclear labelling, and cultural or sensory barriers to meat alternatives reduce consumer confidence in plant-based foods. Public institutions, such as schools and hospitals, have been slow to integrate sustainability into procurement and meal provision, missing valuable opportunities to shape norms and access around sustainable food.
Cultural identity, health concerns, and trust also play a critical role in shaping diet. Intergenerational tensions, media confusion, and stigma around plant-based eating reinforce resistance to change. The term “sustainable diet” is understood in multiple ways, and guidance on nutritional adequacy, especially for meat reduction, remains limited. There is also a need to strengthen support for regenerative and culturally inclusive farming practices.
Crucially, the evidence highlights an over-reliance on individual responsibility for dietary change, which overlooks the need for supportive food environments and system-level shifts. Policies that reshape food environments, through procurement, pricing, education, and public messaging, are likely to be more effective and equitable in the longer term. More specifically, focusing on health-based messaging, trusted community voices, and social norm–based approaches would help build broader public support.
In summary, socially informed policies must address structural inequalities, cultural diversity, and behavioural dynamics to ensure a just transition toward sustainable diets. This includes improving affordability and access, embedding sustainability in public food settings, and aligning dietary policies with both climate and public health goals.
Further detail and evidence examples are available in Appendix I.
PESTLE Technological dimension
Technology plays a critical role in shaping the sustainability, efficiency, and resilience of Scotland’s food system. The analysis highlights the lack of a comprehensive monitoring framework to evaluate the impact of dietary shifts on emissions, public health, food security, and biodiversity. Without clear indicators and centralised data systems, it is difficult to assess progress toward climate and health goals or ensure that dietary policies are evidence driven. Metrics for agroecological practices and sustainable diet transitions remain underdeveloped, impeding efforts to support and scale lower-impact farming approaches.
Digital infrastructure limitations, particularly poor rural broadband, continue to restrict the uptake of precision livestock farming and climate-smart technologies. Awareness of these tools remains low among producers, while Government support for adoption is often fragmented. Similarly, industry accountability is weakened by the absence of transparent data reporting and standardised carbon footprinting systems. Inconsistent greenhouse gas accounting methods, a lack of methane tracking at farm level, and the need for sector-specific targets for beef production further undermine emissions mitigation efforts.
Food system resilience also depends on improved technological capacity in supply chains. Current systems do not adequately support food origin tracking, nor do they account for high-emission foods in dietary data, weakening emissions attribution and policy precision. The sustainability impacts of emerging plant-based products remain poorly assessed, and infrastructure gaps limit the scaling of regional food systems and local supply chain technologies.
Digital tools could be used more effectively to promote sustainable consumer choices and increase transparency in food sourcing, animal welfare, and product quality. However, greater investment in infrastructure, digital literacy, and data coordination is required to unlock this potential.
In summary, a more technologically enabled food policy landscape in Scotland will require investment in data infrastructure, tailored emissions metrics, precision agriculture, and digital tools to support both consumer engagement and policy accountability. Doing so will help ensure that Scotland’s net-zero, biodiversity, and health ambitions are underpinned by robust evidence and smart, scalable solutions.
Further detail and evidence examples are available in Appendix J.
PESTLE Legal dimension
With reference to the role of legal and regulatory frameworks, the PESTLE analysis reveals that Scotland currently lacks targeted legal mechanisms to incentivise low-carbon food production. Regulatory gaps and weak enforcement of environmental standards limit the transition to sustainable agriculture, while power imbalances in the supply chain, favouring large corporations over smaller producers, remain largely unaddressed. The Good Food Nation Act, though an important step forward, does not extend regulatory authority over retailers, large-scale producers, or food manufacturers, limiting its system-wide impact.
Other issues requiring attention exist in consumer protection and information. Weak regulation of unhealthy food marketing, especially in out-of-home settings, undermines public health efforts. The continued reliance on voluntary reformulation agreements with industry, combined with the lack of mandatory carbon footprint labelling, limits consumers’ ability to make informed dietary choices aligned with Scotland’s climate and health goals. Meanwhile, the absence of mandatory nutritional fortification, such as for non-dairy milk products, can impede public health initiatives aimed at addressing nutritional deficiencies.
Legal and governance barriers also slow policy implementation. Complexities in devolved and UK-level responsibilities contribute to policy inconsistency, particularly on dietary and emissions targets. Additionally, legal risks around nutrient adequacy in meat and dairy reduction strategies may discourage more ambitious dietary guidance.
Within agriculture, current carbon audit schemes lack sufficient enforceable emissions targets and are perceived as bureaucratic, offering limited incentives for change. Unclear guidance on carbon markets and inconsistent rules on emissions reporting (including Scope 3 emissions from retailers) reduce transparency and slow investment in climate-smart farming.
In summary, legal reform is needed to strengthen regulatory levers across the food system, extending beyond the public sector to include retailers and industry, enforcing sustainability and nutrition standards, and improving consumer protections. Aligning governance frameworks, reducing administrative burdens, and embedding human rights principles into dietary policy are therefore needed to enable effective system-wide change.
Further detail and evidence examples are available in Appendix K.
PESTLE Environmental dimension
This final section examines the environmental factors affecting Scotland’s transition to a sustainable food system. The evidence highlights that many community food initiatives and new entrants to agroecological farming face significant barriers, particularly in accessing secure land and financial support. Temporary land use agreements and bureaucratic processes can limit the growth of community food systems, despite existing policy. In some cases, unregulated forestry expansion can risk displacing agricultural land, with limited assessment of net carbon impacts or broader public interest outcomes.
Scotland’s climate mitigation policies in agriculture remain focused on food-based emissions without addressing the wider transformation needed across the food system. Adaptation strategies for extreme weather, water resource management, and soil health are underdeveloped, leaving farmers vulnerable to increasingly unpredictable conditions. Localised environmental impacts of emissions-intensive farming are often overlooked in national-level emissions data, reducing policy responsiveness to regional ecological pressures.
The analysis also highlights the need for a more strategic approach to land use. With the majority of Scottish farmland classed as “Less Favoured”[2] and unsuitable for plant protein production, blanket approaches to livestock reduction may generate trade-offs for biodiversity, carbon sequestration, and rural livelihoods. Well-managed grazing land has shown potential to support biodiversity and store more carbon than forestry in some contexts, yet these contributions are not widely acknowledged in land-use planning.
From a consumption perspective, the environmental footprint of ultra-processed and highly standardised food products remains a concern, as do the resilience risks associated with crop monocultures and supply chain vulnerabilities. There is growing recognition that agricultural technologies, diversification, and the promotion of locally adapted crop varieties can play a role in building resilience, but these approaches require greater policy support and coordination.
In summary, delivering a climate-resilient and environmentally sustainable food system in Scotland will require integrated land-use and adaptation planning, support for agroecological transitions, and a shift toward more diverse and regionally appropriate production systems. Environmental priorities must be balanced with social and economic sustainability to secure long-term food system resilience.
Further detail and evidence examples are available in Appendix L.
Analysis of areas for policy development
We next move on to consider evidence linked to the foregoing PESTLE analysis. The PESTLE analysis of diet and climate areas for policy development in Scotland has revealed several critical evidence gaps that limit progress towards a sustainable, resilient, and equitable food system. This section summarises areas for development, evaluates the feasibility of addressing them through targeted initiatives, and prioritises areas for immediate and long-term action. A summary of identified areas for further policy development, feasibility of addressing issues, scope for collaboration, and suggested priority levels for each PESTLE dimension are set out in Table 4.1.1.1.
Disclaimer: While this report identifies multiple areas for policy development, it is acknowledged that various initiatives and programmes may already be addressing some of these areas to differing extents. The intention is not to overlook ongoing efforts, but to highlight where further action, coordination, or scaling may still be required.
1. Areas for further policy development: Political
A. Key areas:
Fragmentation of food policy across government sectors, limiting alignment between climate, health, and agricultural goals.
There is scope to improve coordination mechanisms between local, devolved, and UK-wide levels of government.
Absence of measurable targets for food-related emissions reductions, including dietary change.
There remains scope to strengthen public engagement and participation in the development of food and climate policy.
Lack of robust mechanisms to evaluate the effectiveness of food policy interventions.
Embed cross-sectoral policy alignment within Scotland’s legislative framework through new statutory obligations.
C. Areas for collaboration:
Government: Lead policy development and regulatory reform.
Third Sector and Academia: Provide research insights and advocate for evidence-based policymaking.
Private Sector: Engage in the development of sustainable business practices and supply chain transparency.
D. Priority level:
Addressing governance and coordination gaps will be foundational to all other policy reforms.
2. Areas for further policy development: Economic
A. Key areas for development:
Limited evidence on the economic viability and scalability of regenerative and agroecological farming systems in Scotland.
Misaligned or insufficient financial incentives to support sustainable production, strengthen local food supply chains, and scale community-led food initiatives.[6]
Lack of robust analysis on the potential impacts of fiscal measures—such as red meat taxation or incentives for plant-based foods—on consumer behaviour, equity, and health outcomes.
B. Feasibility options for development:
Phase 1: Foundations:
Conduct an economic feasibility study on regenerative farming models and their potential integration into Scotland’s agricultural sector.
Strengthen public procurement policies to better support local and sustainable food sourcing.
Phase 2: Scaling and alignment:
Explore targeted financial incentives to support low-emission and nature-friendly farming approaches.
Launch pilot projects to evaluate the impact of sustainable farming financial incentives.
Develop fiscal policies (e.g., targeted payments, taxation, or incentives) to shift consumption toward sustainable diets.
Support supply chain infrastructure investments to improve local food distribution and processing.
Phase 3: Structural reform:
Develop a comprehensive fiscal policy review to assess the potential impacts of taxation, support, and incentives.
Align agricultural support payment structures with climate and health objectives.
Establish a long-term funding strategy for sustainable food system transformation.
C. Areas for collaboration:
Government: Develop fiscal incentives and financial mechanisms to support health and sustainability goals.
Third sector and Academia: Assess economic impacts of taxation and financial reforms.
Private Sector: Adapt business models to align with financial incentives for sustainability.
D. Priority level:
Economic barriers need to be addressed to facilitate sustainable production shifts.
3. Areas for further policy development: Social
A. Key areas for development:
Limited data on food affordability and access among low-income and rural communities.
Need for more meaningful engagement with diverse communities in shaping food policy and dietary guidance.
B. Feasibility options for development
Phase 1: Foundations:
Expand public engagement initiatives, including community-led research into dietary transitions.
Expand public engagement initiatives to address affordability and accessibility barriers.
Pilot community-led food initiatives targeting low-income areas.
Phase 2: Scaling and alignment:
Conduct a national food accessibility and affordability survey.
Develop participatory policy design mechanisms to enhance local food governance.
Strengthen food education campaigns to promote healthier, more sustainable diets.
Phase 3: Structural reform:
Embed participatory policy design mechanisms within Scotland’s food governance structures.
Ensure that sustainable diets are embedded in national health and education policies.
C. Areas for collaboration:
Government: Develop and fund inclusive food policies.
Third Sector and Academia: Engage in community outreach and public health research.
Private sector: Improve food affordability through fair pricing strategies.
D. Priority level:
Important for equity and public buy-in but will require gradual integration.
4. Areas for further policy development: Technological
A. Key areas for development:
Absence of standardised methods for tracking food system emissions and sustainability impacts.
Limited integration of digital food labelling and consumer-facing sustainability information.
B. Feasibility options for development:
Phase 1: Foundations:
Support and shape the UK-wide Food Data Transparency Partnership to ensure Scotland’s dietary and sustainability priorities are reflected.[7]
Phase 2: Scaling and alignment:
Develop a digital food labelling initiative to improve transparency.
Expand precision agriculture technologies to improve farm efficiency.
Long-term:
Develop a data-driven food system policy framework that integrates real-time monitoring and reporting tools.
C. Areas for collaboration:
Government: Implement data standardisation policies and invest in rural technology.
Third Sector and Academia: Conduct research on food system emissions and digital innovations.
Private Sector: Drive technological advancements in food production and retail.
C. Priority level:
Essential for evidence-based policymaking and consumer engagement.
5. Areas for further policy development: Legal
A. Key areas for development:
Limited enforcement of supply chain transparency and sustainability regulations.
Gaps in legal frameworks for food labelling, marketing, and consumer information rights.
Uncertainty around the legal and nutritional implications of dietary transition policies.
B. Feasibility options for development:
Phase 1: Foundations:
Work with UK regulators[8] to strengthen food labelling frameworks, including clear nutritional and environmental indicators, while exploring Scotland-specific improvements in public-facing food information.
Implement supply chain due diligence requirements for major food retailers.
Phase 2: Scaling and alignment:
Expand mandatory sustainability reporting for businesses in the food sector.
Align food regulations to reduce policy inconsistencies.
Phase 3: Structural reform:
Establish legal safeguards around dietary policy shifts, ensuring public health is protected.
Embed right-to-food principles in Scotland’s food governance framework.
C. Areas for collaboration:
Government: Strengthen regulatory frameworks and enforcement mechanisms.
Third Sector and Academia: Advocate for consumer protections and legal reforms.
Private Sector: Ensure compliance with evolving regulations.
D. Priority level:
Important for transparency but requires multi-stakeholder cooperation.
6. Areas for further policy development: Environmental
A. Key areas for development:
Limited data on the environmental impacts of different livestock systems and land management approaches.
Lack of integrated policy guidance to balance food production, biodiversity, and climate priorities.
Under-developed integration of climate adaptation planning in agricultural policy and land use decisions.
B. Feasibility options for development:
Phase 1: Foundations:
Conduct a livestock emissions and sequestration study to refine policy targets.
Phase 2: Scaling and alignment:
Develop a national food system biodiversity framework to guide sustainable land-use decisions.
Support the delivery of Scottish National Adaptation Plan (SNAP3)[9] commitments on agricultural adaptation, with a focus on extreme weather resilience, soil health, and sustainable land use.
Invest in local and diversified crop production to enhance resilience.
Phase 3: Structural reform:
Embed climate resilience planning into Scotland’s agricultural and food policies.
Establish long-term land use strategies balancing food security and biodiversity conservation.
Third Sector and Academia: Oversee biodiversity and climate impact research.
Private Sector: Support sustainable farming practices and emissions reduction initiatives.
D. Priority level:
Important for aligning food production with Scotland’s climate targets.
PESTLE evidence analysis of areas for further policy development
In summary, addressing areas for policy development identified through the evidence review would require a combination of more immediate actions, pilot initiatives, and longer-term policy reforms. Targeting governance and coordination should be prioritised as a foundation upon which to develop emissions tracking, economic incentives for sustainability, and environmental resilience strategies. Based on the analysis of evidence, addressing these areas through targeted research, cross-sector collaboration, and data standardisation would be essential for leveraging meaningful progress on sustainable diet transitions.
Conclusions and policy implications
Diet, climate, and public health intersect in complex ways with food systems, shaping both environmental sustainability and human well-being. Dietary patterns influence greenhouse gas emissions, biodiversity, and resource use, whilst also influencing non-communicable diseases and health risks. A transition to sustainable diets presents an opportunity to improve public health and reduce environmental impact, though significant barriers including affordability and accessibility must be tackled. In Scotland, the transition to sustainable diets is complicated by cultural and economic reliance on established food industries, particularly livestock farming. Whilst high red and processed meat consumption poses health and environmental concerns, economic dependencies, consumer habits, and social norms around food identity and tradition all contribute to resistance to change.
Crucially, policymakers must navigate inevitable trade-offs between economic stability and sustainability. The Scottish red meat sector supports jobs and rural economies, making policies to reduce meat consumption economically sensitive. Furthermore, plant-based diets remain costly due to supply chain and financial support structures, with change carrying the risk of exacerbating social inequalities. Balancing voluntary industry commitments with regulatory measures and fiscal policies is needed to drive change whilst minimising economic disruption.
This report has highlighted the complex connections between diet, climate, and public health in food systems, and the urgent need for integrated policy responses for sustainable diet transitions. The UK’s 7th Carbon Budget (CB7) (Climate Change Committee, 2025) reinforces this urgency, proposing a substantial reduction in livestock numbers and a shift towards more sustainable dietary patterns. Scotland’s food system has the potential to reduce greenhouse gas emissions while improving public health, yet fragmented policies, gaps in governance, and limited economic incentives inhibit meaningful progress. In line with CB7, this report underscores the importance of policy coherence, aligned with public engagement, agricultural and industry support, fiscal measures, and public health initiatives.
Informing next steps for policy development
Whilst significant strides have been made with policies like the Good Food Nation Act (Scottish Government, 2022a), further action is needed to strengthen accountability, set clear sustainability targets, and improve cross-sectoral collaboration. Managing the economic implications of dietary transitions is also crucial to ensuring a just transition—without targeted support, rural inequalities may deepen, and resistance to change may grow. Lessons from other countries have shown that a mix of financial incentives, public procurement reforms, and consumer engagement strategies can drive sustainable dietary shifts while maintaining economic stability.
Such goals require coordinated action across government, agriculture, the food industry, public health, and civil society. A whole-systems approach must ensure sustainability policies are both equitable and inclusive. Priorities could therefore include:
Strengthening governance and policy coordination: Develop a cross-sectoral food policy framework aligning climate, health, and agricultural objectives. Enhance local-national coordination for food system implementation. Establish clear emissions reduction targets for food production and dietary transitions and clarify the role of dietary transitions in meeting this target.
Improving economic incentives for sustainable food systems: Redirect agricultural support payments towards sustainable and regenerative farming. Explore the role for fiscal policies (e.g. e.g. support payments or taxation) to make sustainable food choices more affordable. Invest in local food infrastructure and supply chains to reduce dependence on imports.
Addressing social and cultural barriers to dietary change: Expand public, agricultural, and food system engagement and participation and leverage procurement opportunities to increase awareness and availability of climate-friendly diets. Improve policies regarding food affordability to ensure sustainable diets are accessible to all income groups. Develop culturally sensitive strategies for dietary shifts, considering food traditions.
Investing in technology and data monitoring for food system resilience: Support the development of a UK-wide standard for emissions tracking in food production and consumption, recognising the complexity of this task and the need for cross-jurisdictional coordination. Introduce digital food labelling to increase consumer awareness of sustainability impacts.
Supporting legal and regulatory measures: Enforce sustainability standards in food production and marketing. Align devolved and UK-wide dietary policies for consistency. Improve public procurement regulations to prioritise sustainable food sourcing.
Integrating environmental considerations into food policy: Develop land-use policies balancing food security, biodiversity, and climate goals. Strengthen climate adaptation strategies for Scottish agriculture. Explore the potential role of well-managed grazing land in supporting biodiversity and contributing to carbon sequestration, while recognising that evidence on sequestration benefits remains contested.
Scotland has an opportunity to lead in sustainable food policy by embedding climate and health goals into food system governance. A cross-sectoral, just transition approach is essential to creating a food system that protects the environment, supports local economies, and enhances public health to secure long-term benefits for both people and the planet.
References
Allan, G., Comerford, D. and McGregor, P., 2019. The system-wide impact of healthy eating: Assessing emissions and economic impacts at the regional level. Food Policy, 86, p.101725. https://doi.org/10.1016/j.foodpol.2019.05.008
Ambler-Edwards, S., Bailey, K.S., Kiff, A., Lang, T., Lee, R., Marsden, T.K., Simons, D.W. and Tibbs, H., 2009. Food futures: Rethinking UK strategy. London: Chatham House. [online] Available at: Food futures: rethinking UK strategy. A Chatham House report -ORCA (Accessed: 25/11/24).
Attorp, A. and Hubbard, C., 2022. Governing the UK agri-food system post-Brexit, in Shucksmith, M. and Bosworth, G. (eds.) Rural governance in the UK. Abingdon: Routledge, pp. 78–98.
Bauer, J.M., Aarestrup, S.C., Hansen, P.G. and Reisch, L.A., 2022. Nudging more sustainable grocery purchases: Behavioural innovations in a supermarket setting. Technological Forecasting and Social Change, 179, p.121605. https://doi.org/10.1016/j.techfore.2022.121605
Beckert, M., Smith, P. and Chapman, S., 2016. Of trees and sheep: Trade-offs and synergies in farmland afforestation in the Scottish uplands. In: S. Kratzer and M. Schönhart, eds. Land use competition: Ecological, economic and social perspectives. Cham: Springer, pp.183–192. https://doi.org/10.1007/978-3-319-33628-2_11
Bellamy, A.S., Furness, E., Mills, S., Clear, A., Finnigan, S.M., Meador, E., Milne, A.E. and Sharp, R.T., 2023. ‘Promoting dietary changes for achieving health and sustainability targets’, Frontiers in Sustainable Food Systems, 7, 1160627. https://doi.org/10.3389/fsufs.2023.1160627.
Bhunnoo, R. and Poppy, G.M., 2020. A national approach for transformation of the UK food system. Nature Food, 1(1), pp.6–8. https://doi.org/10.1038/s43016-019-0003-3
Billen, G., Aguilera, E., Einarsson, R., Garnier, J., Gingrich, S., Grizzetti, B., Lassaletta, L., Le Noë, J. and Sanz-Cobena, A., 2021. Reshaping the European agro-food system and closing its nitrogen cycle: The potential of combining dietary change, agroecology, and circularity. One Earth, 4(6), pp.839–850. https://doi.org/10.1016/j.oneear.2021.05.011
Booth, A., 2006. Clear and present questions: Formulating questions for evidence based practice. Library Hi Tech, 24(3), 355-368. https://doi.org/10.1108/07378830610692127
Boyle, N.B., Jenneson, V., Okeke-Ogbuafor, N., Morris, M.A., Stead, S.M., Dye, L., Halford, J.C. and Banwart, S.A., 2024. ‘Connected Food: First steps for an ambitious national food strategy’, Nutrients, 16(19), p. 3371. https://doi.org/10.3390/nu16193371.
Brennan, M., 2023. Food systems transformation in Scotland—The journey to, vision of, and challenges facing the new Good Food Nation (Scotland) Act. Sustainability, 15(19), p.14579. https://doi.org/10.3390/su151914579
Briggs, H.R., Tallontire, A.M. and Dougill, A.J., 2019. Exploring the contribution of vertical farming to sustainable intensification from the point of view of the innovator and the farmer. Sustainability Research Institute, University of Leeds. [online] Available at: https://sri.leeds.ac.uk/publications/vertical-farming-sustainability (Accessed: 25/1/25).
Bryant, C., Couture, A., Ross, E., Clark, A. and Chapman, T., 2024. A review of policy levers to reduce meat production and consumption. Appetite, p.107684. https://doi.org/10.1016/j.appet.2024.107684.
Cleland, E., McBey, D., Darlene, V., McCormick, B.J. and Macdiarmid, J.I., 2025. Still eating like there’s no tomorrow? A qualitative study to revisit attitudes and awareness around sustainable diets after 10 years. Appetite, 206, p.107799. https://doi.org/10.1016/j.appet.2024.107799.
Culliford, A.E., Bradbury, J. and Medici, E.B., 2023. Improving communication of the UK sustainable healthy dietary guidelines—the Eatwell Guide: A rapid review. Sustainability, 15(7), p.6149. https://doi.org/10.3390/su15076149
Department for Environment, Food & Rural Affairs (Defra), 2024. Assessing carbon displacement risk in the agri-food sector: The development and application of a carbon displacement and wider impacts framework. October 2024. Defra. [online] Available at: ADAS Collaborate on Project Investigating Carbon Displacement (Accessed: 25/11/25).
Dogbe, W., Revoredo-Giha, C. and Russell, W., 2024. An analysis of the current and potential market opportunities for hempseed and fibre: the case of Scotland? Agriculture & Food Security, 13(1), p.57. https://doi.org/10.1186/s40066-024-00388-6.
Dogbe, W., Wang, Y. and Revoredo-Giha, C., 2024. Nutritional implications of substituting plant-based proteins for meat: Evidence from home scan data. Agricultural and Food Economics, 12(1), p.30. https://doi.org/10.1186/s40100-024-00272-2.
Edwards-Jones, G., 2010. Does eating local food reduce the environmental impact of food production and enhance consumer health? Proceedings of the Nutrition Society, 69(4), pp.582–591. https://doi.org/10.1017/S0029665110002004
Eory, V., Topp, K., Rees, B., Jones, S., Waxenberg, K., Barnes, A., Smith, P., MacLeod, M. and Wall, E., 2023. A scenario-based approach to emissions reduction targets in Scottish agriculture. ClimateXChange (CXC). [online] Available at: A scenario-based approach to emissions reduction targets in Scottish agriculture (Accessed 14/1/25).
Fardet, A. and Rock, E., 2020. Ultra-processed foods and food system sustainability: What are the links? Sustainability, 12(15), p.6280. https://doi.org/10.3390/su12156280
Ferguson, H.J., Bowen, J.M., McNicol, L.C., Bell, J., Duthie, C.A. and Dewhurst, R.J., 2024. The impacts of precision livestock farming tools on the greenhouse gas emissions of an average Scottish dairy farm. Frontiers in Sustainable Food Systems, 8, p.1385672. https://doi.org/10.3389/fsufs.2024.1385672
Follett, E., Davis, L., Wilson, C. and Cable, J., 2024. Working for the environment: farmer attitudes towards sustainable farming actions in rural Wales, UK, Environment, Development and Sustainability, pp. 1–20. https://doi.org/10.1007/s10668-024-03764-7.
Foster, J.A. and Poston, A., 2024. Occupant experience of domestic kitchen environments in low-energy social and affordable housing in Scotland. Building Research & Information, 52(7), pp.799–816. https://doi.org/10.1080/09613218.2024.2312504.
Gargano, G., 2021. The bottom-up development model as a governance instrument for the rural areas: The cases of four Local Action Groups (LAGs) in the United Kingdom and in Italy. Sustainability, 13(16), p.9123. https://doi.org/10.3390/su13169123.
Gill, M., Fowler, K. and Scott, E.M., 2024. ‘Bridging the gap between science and food policy: nutrition as a driver of policy drawing on Scotland as a case study’, Proceedings of the Nutrition Society, pp. 1–15. https://doi.org/10.1017/S0029665124000267.
Hasnain, S., Green, R., Williams, A., Dangour, A.D., Smith, P. and Hillier, J., 2020. Mapping the UK food system – a report for the UKRI Transforming UK Food Systems Programme. University of Oxford. [online] Available at: https://www.foodsystemresearch.org.uk/publications/mapping-the-uk-food-system (Accessed: 3/11/24).
Hielkema, M.H. and Lund, T.B., 2021. ‘Reducing meat consumption in meat-loving Denmark: Exploring willingness, behavior, barriers and drivers’, Food Quality and Preference, 93, 104257. https://doi.org/10.1016/j.foodqual.2021.104257.
Holmes, E.J., 2018. Brexit, beef, and beans: a sustainable food-system approach for the UK. Master’s thesis, Norwegian University of Life Sciences, Ås. [online] Available at: 249964646.pdf (Accessed: 18/2/25).
Hunt, L., Pettinger, C. and Wagstaff, C., 2023. A critical exploration of the diets of UK disadvantaged communities to inform food systems transformation: A scoping review of qualitative literature using a social practice theory lens. BMC Public Health, 23(1), p.1970. https://doi.org/10.1186/s12889-023-16775-3.
Jenkins, B., Herold, L., de Mendonça, M., Loughnan, H., Willcocks, J., David, T., Ginns, B., Rock, L., Wilshire, J., Avis, K., 2024. Breeding for reduced methane emissions in livestock. ClimateXChange. [online] Available at: http://dx.doi.org/10.7488/era/5569 (Accessed: 3/11/24).
Kemper, J.A., 2020. ‘Motivations, barriers, and strategies for meat reduction at different family lifecycle stages’, Appetite, 150, 104644. https://doi.org/10.1016/j.appet.2020.104644.
Kmetkova, D., Zverinova, I., Scasny, M. and Máca, V., 2024. Acceptability of meat tax and subsidy removal by meat-eaters: insights from five European countries (No. 2024/42). Charles University Prague, Faculty of Social Sciences, Institute of Economic Studies. [online] Available at: https://ies.fsv.cuni.cz (Accessed: 14/1/25).
Kwasny, T., Dobernig, K. and Riefler, P., 2022. ‘Towards reduced meat consumption: A systematic literature review of intervention effectiveness, 2001–2019’, Appetite, 168, 105739. https://doi.org/10.1016/j.appet.2021.105739.
Lambe, F., Weitz, N., Hilgert, A., Kemp-Benedict, E. and Carlsen, H., 2025. Applying the Unlocking a Better Future framework for a just transition in Scotland: Opportunities for the Scottish Government to promote socio-economic transformations needed to help tackle the climate and nature emergencies. Stockholm Environment Institute. [online] Available at: https://www.sei.org/publications/just-transition-scotland-unlocking-a-better-future/ (Accessed: 17/1/25.
Lampkin, N., Shrestha, S., Sellars, A., Baldock, D., Smith, J., Mullender, S., Keenleyside, C., Pearce, B. and Watson, C.A., 2021. Preparing the evidence base for post-Brexit agriculture in Scotland – case studies on alternative payments. Scotland’s Rural College (SRUC) and Institute for European Environmental Policy (IEEP). [online] Available at: https://www.gov.scot/publications/preparing-the-evidence-base-for-post-brexit-agriculture-in-scotland/ (Accessed: 3/2/25).
Leat, P., Revoredo-Giha, C. and Lamprinopoulou, C., 2011. ‘Scotland’s food and drink policy discussion: Sustainability issues in the food supply chain’, Sustainability, 3(4), pp. 605–631. https://doi.org/10.3390/su3040605.
Lee, A.J., Cullerton, K. and Herron, L.M., 2020. ‘Achieving food system transformation: Insights from a retrospective review of nutrition policy (in) action in high-income countries’, International Journal of Health Policy and Management, 10(12), pp. 766–776. https://doi.org/10.34172/ijhpm.2020.69.
Lozada, L.M. and Karley, A., 2022. The adoption of agroecological principles in Scottish farming and their contribution towards agricultural sustainability and resilience. The James Hutton Institute. [online] Available at: https://www.hutton.ac.uk/research/projects/agroecology-scotland (Accessed: 1/11/24).
Malone, T. and Lusk, J.L., 2017. Taste trumps health and safety: Incorporating consumer perceptions into a discrete choice experiment for meat. Journal of Agricultural and Applied Economics, 49(1), pp.139–157. https://doi.org/10.1017/aae.2016.39.
McBey, D., McCormick, B.J.J., Hussain, M. and Macdiarmid, J.I., 2024. ‘Does sociodemographic strata determine local access to plant-based meat alternatives?’, Proceedings of the Nutrition Society, 83(OCE4), p. E350. https://doi.org/10.1017/S0029665124003723.
McBey, D., Sánchez, G.M., McCormick, B.J.J., Horgan, G.W. and MacDiarmid, J.I., 2024. Consumer ranked likely effectiveness of interventions to reduce meat consumption, Proceedings of the Nutrition Society, 83(OCE4), p. E296. https://doi.org/10.1017/S0029665124002963.
McBey, D., Watts, D. and Johnstone, A.M., 2019. Nudging, formulating new products, and the lifecourse: A qualitative assessment of the viability of three methods for reducing Scottish meat consumption for health, ethical, and environmental reasons, Appetite, 142, 104349. https://doi.org/10.1016/j.appet.2019.104349.
McNicol, L.C., Bowen, J.M., Ferguson, H.J., Bell, J., Dewhurst, R.J. and Duthie, C.A., 2024. Adoption of precision livestock farming technologies has the potential to mitigate greenhouse gas emissions from beef production, Frontiers in Sustainable Food Systems, 8, 1414858. https://doi.org/10.3389/fsufs.2024.1414858.
Meyerricks, S. and White, R.M., 2021. Communities on a threshold: Climate action and wellbeing potentialities in Scotland, Sustainability, 13(13), 7357. https://doi.org/10.3390/su13137357.
Milner, J., Green, R., Dangour, A.D., Haines, A. and Wilkinson, P., 2015. Health effects of adopting low greenhouse gas emission diets in the UK, BMJ Open, 5(4), e007364. https://doi.org/10.1136/bmjopen-2014-007364.
Mitev, A., Portes, J., Osman, M., Codur, A.M., Abraham, C. and Kroll, L., 2023. The implications of behavioural science for effective climate policy: Output 1: Literature review and background report. Centre for Climate Change and Social Transformations (CAST) and The Behavioural Insights Team. [online] Available at: https://cast.ac.uk/resources/reports/the-implications-of-behavioural-science-for-effective-climate-policy/ (Accessed: 15/10/24).
Myrgiotis, V., Williams, M., Rees, R.M. and Topp, C.F., 2019. Estimating the soil N₂O emission intensity of croplands in northwest Europe. Biogeosciences, 16(8), pp.1641–1655. https://doi.org/10.5194/bg-16-1641-2019.
Nneli, A., Revoredo-Giha, C. and Dogbe, W., 2023. ‘Could taxes on foods high in fat, sugar and salt (HFSS) improve climate health and nutrition in Scotland?’, Journal of Cleaner Production, 421, 138564. https://doi.org/10.1016/j.jclepro.2023.138564.
Pechey, R., Reynolds, J.P., Cook, B., Marteau, T.M. and Jebb, S.A., 2022. Acceptability of policies to reduce consumption of red and processed meat: A population-based survey experiment, Journal of Environmental Psychology, 81, 101817. https://doi.org/10.1016/j.jenvp.2022.101817.
Rathnayaka, S.D., Revoredo-Giha, C. and de Roos, B., 2024. Assessing Scotland’s self-sufficiency of major food commodities, Agriculture & Food Security, 13(1), p. 34. https://doi.org/10.1186/s40066-024-00452-3.
Reay, D.S., Warnatzsch, E.A., Craig, E., Dawson, L., George, S., Norman, R. and Ritchie, P., 2020. ‘From farm to fork: growing a Scottish food system that doesn’t cost the planet’, Frontiers in Sustainable Food Systems, 4, 72. https://doi.org/10.3389/fsufs.2020.00072.
Ruani, M.A., Reiss, M.J. and Kalea, A.Z., 2023. Diet-nutrition information seeking, source trustworthiness, and eating behavior changes: An international web-based survey. Nutrients, 15(21), p.4515. https://doi.org/10.3390/nu15214515.
Rubio Ramon, G., 2024. Building animal nations: industrial animal agriculture in the making of Catalonia and Scotland. ERA [online] Available at: https://era.ed.ac.uk/handle/1842/41639 (Accessed: 26/1/25).
Scottish Parliament, n.d.(b). Briefing for the Citizen Participation and Public Petitions Committee on Petition PE1963: Phase in meat production ban by 2040. [online] Available at: Briefing for petition PE1963: Phase in meat production ban by 2040 (Accessed 23/1/25).
Shortland, F., Hall, J., Hurley, P., Little, R., Nye, C., Lobley, M. and Rose, D.C., 2023. Landscapes of support for farming mental health: Adaptability in the face of crisis. Sociologia Ruralis, 63, pp.116–140. https://doi.org/10.1111/soru.12399.
Smith, A.M., Duncan, P., Edgar, D. and McColl, J., 2021. Responsible and sustainable farm business: Contextual duality as the moderating influence on entrepreneurial orientation. The International Journal of Entrepreneurship and Innovation, 22(2), pp.88–99. https://doi.org/10.1177/1465750320939779.
Sovacool, B.K., Bazilian, M., Griffiths, S., Kim, J., Foley, A. and Rooney, D., 2021. ‘Decarbonizing the food and beverages industry: A critical and systematic review of developments, sociotechnical systems and policy options’, Renewable and Sustainable Energy Reviews, 143, 110856. https://doi.org/10.1016/j.rser.2021.110856.
Spiro, A., Hill, Z. and Stanner, S., 2024. Meat and the future of sustainable diets—Challenges and opportunities’, Nutrition Bulletin, 49(4), pp. 572–598. https://doi.org/10.1111/nbu.12685.
Sutherland, L.A. and Burton, R.J., 2011. Good farmers, good neighbours? The role of cultural capital in social capital development in a Scottish farming community. Sociologia Ruralis, 51(3), pp.238–255. https://doi.org/10.1111/j.1467-9523.2011.00536.x.
Vittersø, G., Torjusen, H., Laitala, K., Tocco, B., Biasini, B., Csillag, P., de Labarre, M.D., Lecoeur, J.L., Maj, A., Majewski, E. and Malak-Rawlikowska, A., 2019. Short food supply chains and their contributions to sustainability: Participants’ views and perceptions from 12 European cases’, Sustainability, 11(17), p. 4800. https://doi.org/10.3390/su11174800.
White, J.T. and Bunn, C., 2017. Growing in Glasgow: Innovative practices and emerging policy pathways for urban agriculture, Land Use Policy, 68, pp. 334–344. https://doi.org/10.1016/j.landusepol.2017.07.052.
Wiltshire, J., Freeman, D., Willcocks, J. and Wood, C., 2021. The potential for leguminous crops in Scotland. Ricardo Energy & Environment. [online] Available at: The potential for leguminous crops in Scotland (Accessed: 23/1/25).
Witheridge, J. and Morris, N.J., 2016. An analysis of the effect of public policy on community garden organisations in Edinburgh, Local Environment, 21(2), pp. 202–218. https://doi.org/10.1080/13549839.2014.940357.
The stakeholder mapping exercise aimed to identify and understand the individuals and organisations who influence or are affected by climate and diet policies in Scotland. It was designed to support inclusive, evidence-informed policy review by incorporating a broad range of perspectives.
The mapping focused on ten key policy areas:
Agriculture
Food systems
Public health
Carbon emissions
Land use and forestry
Water use and pollution
Economic and social impacts
Food security
Consumer behaviour and education
Urban planning and food infrastructure
Stakeholders were assessed for their relevance to these areas and the potential for involvement in the policy process.
Methods
Desk research: Systematic searches of government documents, NGO and advocacy websites, academic literature, and media reports to compile a draft list of stakeholders.
Expert consultation: Meetings with policymakers, researchers, and advisors to validate the list and identify additional stakeholders.
Categorisation: Stakeholders were grouped by type (e.g., government, academia, NGOs, industry, health, community, media, public).
Influence–Interest Mapping: Stakeholders were classified based on their level of influence over, and interest in, diet and climate policy. A rubric guided the assignment of High, Medium, or Low categories for each.
Stakeholder Categories
Stakeholders were grouped into eight high-level categories:
Government bodies and regulators (e.g., Scottish Government, SEPA, Food Standards Scotland)
Research and academia (e.g., University research centres, think tanks)
NGOs and advocacy groups (e.g., Nourish Scotland, Friends of the Earth Scotland)
Agriculture and food industry (e.g., NFU Scotland, food producers, retailers)
Public health bodies (e.g., NHS Scotland, Public Health Scotland)
Community organisations (e.g., local sustainability hubs, rural associations)
Media and influencers (e.g., journalists, campaigners)
General public and citizen groups (e.g., low-income groups, consumer organisations)
Ongoing Adaptation
Stakeholder positions and influence are dynamic. The mapping process includes continuous review to respond to evolving policy priorities and to adapt engagement strategies accordingly.
Appendix B: Findings from the stakeholder identification and mapping analysis
#
Stakeholder name
Stakeholder primary category
Stakeholder sub-category
1
Defra
(1) Government bodies, agencies & regulators
(1a) UK Government bodies
2
UK Government
(1) Government bodies, agencies & regulators
(1a) UK Government bodies
3
UK Parliament
(1) Government bodies, agencies & regulators
(1a) UK Government bodies
4
HM Revenue and Customs
(1) Government bodies, agencies & regulators
(1a) UK Government bodies
5
Marine Scotland Directorate
(1) Government bodies, agencies & regulators
(1b) Scottish Government bodies
6
Agriculture and Rural Economy Directorate
(1) Government bodies, agencies & regulators
(1b) Scottish Government bodies
7
Diet and Healthy Weight Team
(1) Government bodies, agencies & regulators
(1b) Scottish Government bodies
8
Good Food Nation Working Group
(1) Government bodies, agencies & regulators
(1b) Scottish Government bodies
9
Health & Social Care Directorate
(1) Government bodies, agencies & regulators
(1b) Scottish Government bodies
10
Population Health Directorate
(1) Government bodies, agencies & regulators
(1b) Scottish Government bodies
11
Scottish Government
(1) Government bodies, agencies & regulators
(1b) Scottish Government bodies
12
Food Security Unit
(1) Government bodies, agencies & regulators
(1b) Scottish Government bodies
13
Future Environment Division
(1) Government bodies, agencies & regulators
(1b) Scottish Government bodies
14
Energy and Climate Change Directorate
(1) Government bodies, agencies & regulators
(1b) Scottish Government bodies
15
Scottish Government (SGRPID, Animal health) (dairy production)
(1) Government bodies, agencies & regulators
(1b) Scottish Government bodies
16
Environment and Forestry Directorate
(1) Government bodies, agencies & regulators
(1b) Scottish Government bodies
17
Learning Directorate Support & Wellbeing Unit
(1) Government bodies, agencies & regulators
(1b) Scottish Government bodies
18
Scottish Labour Party
(1f) Scottish political parties
(1b) Scottish Government bodies
19
Food Standards Agency Scotland (FSAS)
(1) Government bodies, agencies & regulators
(1c) Advisory agencies and regulators
20
Decoupling Advisory Group
(1) Government bodies, agencies & regulators
(1c) Advisory agencies and regulators
21
Resource Efficient Scotland
(1) Government bodies, agencies & regulators
(1c) Advisory agencies and regulators
22
Scotland’s Climate Assembly
(1) Government bodies, agencies & regulators
(1c) Advisory agencies and regulators
23
Scotland’s Futures Forum
(1) Government bodies, agencies & regulators
(1c) Advisory agencies and regulators
24
Just Transition Commission
(1) Government bodies, agencies & regulators
(1c) Advisory agencies and regulators
25
Scottish Environment Protection Agency (SEPA)
(1) Government bodies, agencies & regulators
(1c) Advisory agencies and regulators
26
NatureScot (SNH)
(1) Government bodies, agencies & regulators
(1c) Advisory agencies and regulators
27
Environmental Standards Scotland (ESS)
(1) Government bodies, agencies & regulators
(1c) Advisory agencies and regulators
28
Environment and Forestry Directorate
(1) Government bodies, agencies & regulators
(1c) Advisory agencies and regulators
29
Scottish Forestry
(1) Government bodies, agencies & regulators
(1c) Advisory agencies and regulators
30
Energy and Climate Change Directorate
(1) Government bodies, agencies & regulators
(1c) Advisory agencies and regulators
31
Scottish Climate Intelligence Service
(1) Government bodies, agencies & regulators
(1c) Advisory agencies and regulators
32
Scotland Farm Advisory Service (FAS)
(1) Government bodies, agencies & regulators
(1c) Advisory agencies and regulators
33
Adaptation Scotland
(1) Government bodies, agencies & regulators
(1c) Advisory agencies and regulators
34
Agriculture and Rural Economy Directorate
(1) Government bodies, agencies & regulators
(1c) Advisory agencies and regulators
35
Scottish Food Commission
(1) Government bodies, agencies & regulators
(1c) Advisory agencies and regulators
36
Ministerial Working Group on Food
(1) Government bodies, agencies & regulators
(1c) Advisory agencies and regulators
37
Good Food Nation Working Group
(1) Government bodies, agencies & regulators
(1c) Advisory agencies and regulators
38
Environment, Climate Change and Land Reform
(1) Government bodies, agencies & regulators
(1c) Advisory agencies and regulators
39
Economic Development and Fair Work
(1) Government bodies, agencies & regulators
(1c) Advisory agencies and regulators
40
Agriculture and Horticulture Development Board
(1) Government bodies, agencies & regulators
(1c) Advisory agencies and regulators
41
Scottish Government Rural Payments and Inspections Division
(1) Government bodies, agencies & regulators
(1c) Advisory agencies and regulators
42
Scottish Natural Heritage
(1) Government bodies, agencies & regulators
(1c) Advisory agencies and regulators
43
Scottish Water
(1) Government bodies, agencies & regulators
(1c) Advisory agencies and regulators
44
Scottish Enterprise
(1) Government bodies, agencies & regulators
(1c) Advisory agencies and regulators
45
Crown Estate
(1) Government bodies, agencies & regulators
(1c) Advisory agencies and regulators
46
European Union Network for the Implementation and Enforcement of Environmental Law (IMPEL) (dairy production)
(1) Government bodies, agencies & regulators
(1c) Advisory agencies and regulators
47
Committee on Climate Change (CCC)
(1) Government bodies, agencies & regulators
(1c) Advisory agencies and regulators
48
Forestry Commission (FC)
(1) Government bodies, agencies & regulators
(1c) Advisory agencies and regulators
49
Scottish Science Advisory Council (SSAC)
(1) Government bodies, agencies & regulators
(1c) Advisory agencies and regulators
50
Science and Advice for Scottish Agriculture (SASA)
(1) Government bodies, agencies & regulators
(1c) Advisory agencies and regulators
51
Sustainable Development Commission
(1) Government bodies, agencies & regulators
(1c) Advisory agencies and regulators
52
Climate Adaptation Team
(1) Government bodies, agencies & regulators
(1c) Advisory agencies and regulators
53
SEA Gateway
(1) Government bodies, agencies & regulators
(1c) Advisory agencies and regulators
54
Scottish Land Commission
(1) Government bodies, agencies & regulators
(1c) Advisory agencies and regulators
55
Health Protection Scotland
(1) Government bodies, agencies & regulators
(1c) Advisory agencies and regulators
56
Retail Industry Leadership Group (ILG)
(1) Government bodies, agencies & regulators
(1c) Advisory agencies and regulators
57
Agri-tourism Monitor Farm Programme
(1) Government bodies, agencies & regulators
(1c) Advisory agencies and regulators
58
Education and Skills
(1) Government bodies, agencies & regulators
(1c) Advisory agencies and regulators
59
Business Gateway
(1) Government bodies, agencies & regulators
(1c) Advisory agencies and regulators
60
Highland and Islands Enterprise
(1) Government bodies, agencies & regulators
(1c) Advisory agencies and regulators
61
Transport Authority
(1) Government bodies, agencies & regulators
(1c) Advisory agencies and regulators
62
Revenue Scotland (leather sector)
(1) Government bodies, agencies & regulators
(1c) Advisory agencies and regulators
63
Forestry and Land Scotland
(1) Government bodies, agencies & regulators
(1c) Advisory agencies and regulators
64
Historic Environment Scotland
(1) Government bodies, agencies & regulators
(1c) Advisory agencies and regulators
65
Crofting Commission
(1) Government bodies, agencies & regulators
(1c) Advisory agencies and regulators
66
Scottish Law Commission
(1) Government bodies, agencies & regulators
(1c) Advisory agencies and regulators
67
Scottish Fiscal Commission
(1) Government bodies, agencies & regulators
(1c) Advisory agencies and regulators
68
Scottish Funding Council (SFC)
(1) Government bodies, agencies & regulators
(1c) Advisory agencies and regulators
69
Scottish Human Rights Commission (SHRC)
(1) Government bodies, agencies & regulators
(1c) Advisory agencies and regulators
70
Scottish Council on Global Affairs (SCGA)
(1) Government bodies, agencies & regulators
(1c) Advisory agencies and regulators
71
Policy Connect
(1) Government bodies, agencies & regulators
(1c) Advisory agencies and regulators
72
Advisory Group on Economic Recovery
(1) Government bodies, agencies & regulators
(1c) Advisory agencies and regulators
73
City of Edinburgh Council
(1) Government bodies, agencies & regulators
(1d) Local councils
74
Highland Council
(1) Government bodies, agencies & regulators
(1d) Local councils
75
Scottish Borders Council
(1) Government bodies, agencies & regulators
(1d) Local councils
76
West Lothian Council
(1) Government bodies, agencies & regulators
(1d) Local councils
77
Angus Council
(1) Government bodies, agencies & regulators
(1d) Local councils
78
South Lanarkshire Council
(1) Government bodies, agencies & regulators
(1d) Local councils
79
East Ayrshire Council
(1) Government bodies, agencies & regulators
(1d) Local councils
80
Argyll and Bute Council
(1) Government bodies, agencies & regulators
(1d) Local councils
81
Convention of Scottish Local Authorities (CoSLA)
(1) Government bodies, agencies & regulators
(1d) Local councils
82
East Dunbartonshire Council
(1) Government bodies, agencies & regulators
(1d) Local councils
83
South Ayrshire Council
(1) Government bodies, agencies & regulators
(1d) Local councils
84
Aberdeen City Council
(1) Government bodies, agencies & regulators
(1d) Local councils
85
Dundee City Council
(1) Government bodies, agencies & regulators
(1d) Local councils
86
Inverclyde Council
(1) Government bodies, agencies & regulators
(1d) Local councils
87
East Lothian Council
(1) Government bodies, agencies & regulators
(1d) Local councils
88
East Renfrewshire Council
(1) Government bodies, agencies & regulators
(1d) Local councils
89
Glasgow City Council
(1) Government bodies, agencies & regulators
(1d) Local councils
90
Orkney Islands Council
(1) Government bodies, agencies & regulators
(1d) Local councils
91
Shetland Islands Council
(1) Government bodies, agencies & regulators
(1d) Local councils
92
Stirling Council
(1) Government bodies, agencies & regulators
(1d) Local councils
93
West Dunbartonshire Council
(1) Government bodies, agencies & regulators
(1d) Local councils
94
Scottish National Party
(1) Scottish political parties
(1e) Scottish Government bodies
95
Scottish Conservative Party
(1) Scottish political parties
(1e) Scottish political parties
96
Scottish Green Party
(1b) Scottish Government bodies
(1f) Scottish political parties
97
University of Edinburgh
(2) Research & academia
(2b) Academic institutions
98
University of Glasgow
(2) Research & academia
(2b) Academic institutions
99
University of Stirling
(2) Research & academia
(2b) Academic institutions
100
University of Dundee
(2) Research & academia
(2b) Academic institutions
101
University of Strathclyde
(2) Research & academia
(2b) Academic institutions
102
University of Aberdeen
(2) Research & academia
(2b) Academic institutions
103
Scotland’s Rural College (SRUC)
(2) Research & academia
(2b) Academic institutions
104
Scottish School of Forestry
(2) Research & academia
(2b) Academic institutions
105
St Andrew’s University
(2) Research & academia
(2b) Academic institutions
106
Royal Veterinary College
(2) Research & academia
(2b) Academic institutions
107
UHI Inverness
(2) Research & academia
(2b) Academic institutions
108
Glasgow Caledonian University
(2) Research & academia
(2b) Academic institutions
109
The Queen’s Nursing Institute Scotland
(2) Research & academia
(2b) Academic institutions
110
Heriot-Watt University
(2) Research & academia
(2b) Academic institutions
111
Royal College of Nursing
(2) Research & academia
(2b) Academic institutions
112
Scottish Environment, Food and Agriculture Research Institutions (SEFARI)
(2) Research & academia
(2c) Research centres
113
James Hutton Institute
(2) Research & academia
(2c) Research centres
114
Sustainability Exchange
(2) Research & academia
(2c) Research centres
115
Centre for Ecology and Hydrology (NERC)
(2) Research & academia
(2c) Research centres
116
University of Edinburgh Climate Change Institute (ECCI)
(2) Research & academia
(2c) Research centres
117
Forest Research (FC)
(2) Research & academia
(2c) Research centres
118
Scottish Environment, Food and Agriculture Research Institutions (SEFARI)
(2) Research & academia
(2c) Research centres
119
Scotland Beyond Net Zero
(2) Research & academia
(2c) Research centres
120
Scottish Alliance for Food (SCAF)
(2) Research & academia
(2c) Research centres
121
Global Academy of Agriculture and Food Security, University of Edinburgh
(2) Research & academia
(2c) Research centres
122
Sea Mammal Research Unit (SMRU)
(2) Research & academia
(2c) Research centres
123
Biomathematics and Statistics Scotland (BioSS)
(2) Research & academia
(2c) Research centres
124
Centre for Climate Justice, Glasgow Caledonian University
(2) Research & academia
(2c) Research centres
125
Rowett Institute
(2) Research & academia
(2c) Research centres
126
British Geological Survey
(2) Research & academia
(2c) Research centres
127
British Geological Society (BGS)
(2) Research & academia
(2c) Research centres
128
University of Strathclyde Fraser of Allander Institute (FAI)
(2) Research & academia
(2c) Research centres
129
Nesta
(2) Research & academia
(2c) Research centres
130
Research Innovation Scotland
(2) Research & academia
(2c) Research centres
131
David Hume Institute
(2) Research & academia
(2c) Research centres
132
What Works Scotland
(2) Research & academia
(2c) Research centres
133
Research establishments
(2) Research & academia
(2c) Research centres
134
ScotCen Social Research
(2) Research & academia
(2c) Research centres
135
Pareto Consulting
(2) Research & academia
(2c) Research centres
136
Food Researchers in Edinburgh (FRIED)
(2) Research & academia
(2c) Research centres
137
Royal Society of Edinburgh
(2) Research & academia
(2d) Policy think tanks
138
Institute for Public Policy Research (IPPR) Scotland
(2) Research & academia
(2d) Policy think tanks
139
Green Alliance
(2) Research & academia
(2d) Policy think tanks
140
Reform Scotland
(2) Research & academia
(2d) Policy think tanks
141
Chatham House
(3) Third Sector & advocacy groups
(2d) Policy think tanks
142
Common Weal
(3) Third Sector & advocacy groups
(2d) Policy think tanks
143
Future Economy Scotland
(3) Third Sector & advocacy groups
(2d) Policy think tanks
144
Common Wealth
(3) Third Sector & advocacy groups
(2d) Policy think tanks
145
Food Ethics Council
(3) Third Sector & advocacy groups
(2d) Policy think tanks
146
Policy Exchange
(3) Third Sector & advocacy groups
(2d) Policy think tanks
147
Centre Think Tank
(3) Third Sector & advocacy groups
(2d) Policy think tanks
148
Conservative Environment Network
(3) Third Sector & advocacy groups
(2d) Policy think tanks
149
Capita
(3) Third Sector & advocacy groups
(2d) Policy think tanks
150
THEOS
(3) Third Sector & advocacy groups
(2d) Policy think tanks
151
The Badenoch and Strathspey Conservation Group (BSCG)
(3) Third Sector & advocacy groups
(3a) Environmental NGOs & advocacy groups
152
Friends of the Earth Scotland
(3) Third Sector & advocacy groups
(3a) Environmental NGOs & advocacy groups
153
Stop Climate Chaos Scotland
(3) Third Sector & advocacy groups
(3a) Environmental NGOs & advocacy groups
154
Keep Scotland Beautiful
(3) Third Sector & advocacy groups
(3a) Environmental NGOs & advocacy groups
155
Creative Carbon Scotland
(3) Third Sector & advocacy groups
(3a) Environmental NGOs & advocacy groups
156
Scottish Environment LINK
(3) Third Sector & advocacy groups
(3a) Environmental NGOs & advocacy groups
157
Scottish Wildlife Trust
(3) Third Sector & advocacy groups
(3a) Environmental NGOs & advocacy groups
158
Scottish Wild Land Group
(3) Third Sector & advocacy groups
(3a) Environmental NGOs & advocacy groups
159
Trees for Life
(3) Third Sector & advocacy groups
(3a) Environmental NGOs & advocacy groups
160
RSPB Scotland
(3) Third Sector & advocacy groups
(3a) Environmental NGOs & advocacy groups
161
Environmental Rights Centre for Scotland (ERCS)
(3) Third Sector & advocacy groups
(3a) Environmental NGOs & advocacy groups
162
Scottish Countryside Rangers’ Associations
(3) Third Sector & advocacy groups
(3a) Environmental NGOs & advocacy groups
163
Action to Protect Rural Scotland (APRS)
(3) Third Sector & advocacy groups
(3a) Environmental NGOs & advocacy groups
164
The Cairngorms Campaign
(3) Third Sector & advocacy groups
(3a) Environmental NGOs & advocacy groups
165
British Trust for Conservation Volunteers (BTCV)
(3) Third Sector & advocacy groups
(3a) Environmental NGOs & advocacy groups
166
British Trust for Ornithology
(3) Third Sector & advocacy groups
(3a) Environmental NGOs & advocacy groups
167
The Scottish Conservation Projects Trust (SCPT)
(3) Third Sector & advocacy groups
(3a) Environmental NGOs & advocacy groups
168
Plantlife International
(3) Third Sector & advocacy groups
(3a) Environmental NGOs & advocacy groups
169
The Wildfowl & Wetlands Trust
(3) Third Sector & advocacy groups
(3a) Environmental NGOs & advocacy groups
170
The British Trust for Ornithology (BTO)
(3) Third Sector & advocacy groups
(3a) Environmental NGOs & advocacy groups
171
Zero Waste Scotland
(3) Third Sector & advocacy groups
(3a) Environmental NGOs & advocacy groups
172
Zero Waste Scotland
(3) Third Sector & advocacy groups
(3a) Environmental NGOs & advocacy groups
173
Groundwork Trusts
(3) Third Sector & advocacy groups
(3a) Environmental NGOs & advocacy groups
174
The National Biodiversity Network (NBN) Trust
(3) Third Sector & advocacy groups
(3a) Environmental NGOs & advocacy groups
175
The Botanical Society of the British Isles (BSBI)
(3) Third Sector & advocacy groups
(3a) Environmental NGOs & advocacy groups
176
The Conservation Volunteers
(3) Third Sector & advocacy groups
(3a) Environmental NGOs & advocacy groups
177
Greenspace Scotland
(3) Third Sector & advocacy groups
(3a) Environmental NGOs & advocacy groups
178
Net Zero Nation
(3) Third Sector & advocacy groups
(3a) Environmental NGOs & advocacy groups
179
Green Action Trust
(3) Third Sector & advocacy groups
(3a) Environmental NGOs & advocacy groups
180
Environmental Protection Scotland (EPS)
(3) Third Sector & advocacy groups
(3a) Environmental NGOs & advocacy groups
181
Uplift UK
(3) Third Sector & advocacy groups
(3a) Environmental NGOs & advocacy groups
182
Labour Climate and Environment Forum (LCEF)
(3) Third Sector & advocacy groups
(3a) Environmental NGOs & advocacy groups
183
Climate Emergency UK
(3) Third Sector & advocacy groups
(3a) Environmental NGOs & advocacy groups
184
Tipping Point UK
(3) Third Sector & advocacy groups
(3a) Environmental NGOs & advocacy groups
185
Royal Scottish Geographical Society
(3) Third Sector & advocacy groups
(3a) Environmental NGOs & advocacy groups
186
Scotland The Big Picture
(3) Third Sector & advocacy groups
(3a) Environmental NGOs & advocacy groups
187
Sustainable Thinking Scotland (STS)
(3) Third Sector & advocacy groups
(3a) Environmental NGOs & advocacy groups
188
Fishery Trusts
(3) Third Sector & advocacy groups
(3a) Environmental NGOs & advocacy groups
189
Greener Kirkcaldy
(3) Third Sector & advocacy groups
(3a) Environmental NGOs & advocacy groups
190
Sustainable Cupar
(3) Third Sector & advocacy groups
(3a) Environmental NGOs & advocacy groups
191
Energy Saving Trust
(3) Third Sector & advocacy groups
(3a) Environmental NGOs & advocacy groups
192
Esmee Fairbairn Foundation
(3) Third Sector & advocacy groups
(3a) Environmental NGOs & advocacy groups
193
Linlithgow Climate Challenge
(3) Third Sector & advocacy groups
(3a) Environmental NGOs & advocacy groups
194
Changeworks
(3) Third Sector & advocacy groups
(3a) Environmental NGOs & advocacy groups
195
Scottish Policy Group British Ecological Society
(3) Third Sector & advocacy groups
(3a) Environmental NGOs & advocacy groups
196
National Trust for Scotland
(3) Third Sector & advocacy groups
(3a) Environmental NGOs & advocacy groups
197
Scottish Farming and Wildlife Advisory Group (SCOTFWAG)
Scottish Council for Voluntary Organisations (SCVO)
(3) Third Sector & advocacy groups
(3d) Community NGOs & advocacy groups
277
Transform Community Development
(3) Third Sector & advocacy groups
(3d) Community NGOs & advocacy groups
278
Community Development Lens (CoDeL)
(3) Third Sector & advocacy groups
(3d) Community NGOs & advocacy groups
279
Cyrenians
(3) Third Sector & advocacy groups
(3d) Community NGOs & advocacy groups
280
Eco Congregation Scotland
(3) Third Sector & advocacy groups
(3d) Community NGOs & advocacy groups
281
Environmental Rights Centre for Scotland (ERC)
(3) Third Sector & advocacy groups
(3d) Community NGOs & advocacy groups
282
Federation of City Farms and Community Gardens Scotland (FEL Scotland)
(3) Third Sector & advocacy groups
(3d) Community NGOs & advocacy groups
283
Get Growing Scotland
(3) Third Sector & advocacy groups
(3d) Community NGOs & advocacy groups
284
Worker Support Centre
(3) Third Sector & advocacy groups
(3d) Community NGOs & advocacy groups
285
Unite Scotland
(3) Third Sector & advocacy groups
(3d) Community NGOs & advocacy groups
286
UK Health Alliance on Climate Change
(3) Third Sector & advocacy groups
(3d) Community NGOs & advocacy groups
287
Social Farms & Gardens
(3) Third Sector & advocacy groups
(3d) Community NGOs & advocacy groups
288
Global Justice Now
(3) Third Sector & advocacy groups
(3d) Community NGOs & advocacy groups
289
Scottish Trade Union Congress
(3) Third Sector & advocacy groups
(3d) Community NGOs & advocacy groups
290
Compassion in World Farming (CIWIF)
(4) Agriculture & food industry
(4a) Agricultural organisations
291
Community Land Scotland
(4) Agriculture & food industry
(4a) Agricultural organisations
292
Nature Friendly Farming Network (NFFN)
(4) Agriculture & food industry
(4a) Agricultural organisations
293
Landworkers’ Alliance
(4) Agriculture & food industry
(4a) Agricultural organisations
294
Rare Breeds Survival Trust (RBST) Scotland
(4) Agriculture & food industry
(4a) Agricultural organisations
295
Mossgiel Organic Farm
(4) Agriculture & food industry
(4a) Agricultural organisations
296
Association of Independent Crop Consultants
(4) Agriculture & food industry
(4a) Agricultural organisations
297
Basis Registration Ltd (BASIS
(4) Agriculture & food industry
(4a) Agricultural organisations
298
Scottish Quality Crops
(4) Agriculture & food industry
(4a) Agricultural organisations
299
Tenant Farming Association
(4) Agriculture & food industry
(4a) Agricultural organisations
300
Scottish Dairy Growth Board
(4) Agriculture & food industry
(4a) Agricultural organisations
301
Scottish DairyHub
(4) Agriculture & food industry
(4a) Agricultural organisations
302
Bovine genetics and reproductive services
(4) Agriculture & food industry
(4a) Agricultural organisations
303
The Scottish Dairy Cattle Association
(4) Agriculture & food industry
(4a) Agricultural organisations
304
Young Farmers
(4) Agriculture & food industry
(4a) Agricultural organisations
305
Scottish Organic Producers Association (SOPA)
(4) Agriculture & food industry
(4a) Agricultural organisations
306
National Farmers Union Scotland (NFUS)
(4) Agriculture & food industry
(4a) Agricultural organisations
307
The Country Landowners’ Association
(4) Agriculture & food industry
(4a) Agricultural organisations
308
Scottish Water
(4) Agriculture & food industry
(4a) Agricultural organisations
309
Food, Farming and Countryside Commission (FFCC)
(4) Agriculture & food industry
(4a) Agricultural organisations
310
Crown Estate Scotland
(4) Agriculture & food industry
(4a) Agricultural organisations
311
Royal Highland and Agricultural Society of Scotland
(4) Agriculture & food industry
(4a) Agricultural organisations
312
Agricultural Industries Confederation
(4) Agriculture & food industry
(4a) Agricultural organisations
313
Advanced Plant Growth Centre (James Hutton Institute)
(4) Agriculture & food industry
(4a) Agricultural organisations
314
Scottish Agricultural Organisation Society (SAOS)
(4) Agriculture & food industry
(4a) Agricultural organisations
315
ADAS
(4) Agriculture & food industry
(4a) Agricultural organisations
316
Agricultural Industries Confederation
(4) Agriculture & food industry
(4a) Agricultural organisations
317
Agricultural Industries Confederation Scotland
(4) Agriculture & food industry
(4a) Agricultural organisations
318
Crop Protection Association
(4) Agriculture & food industry
(4a) Agricultural organisations
319
Linking Environment and Farming (LEAF)
(4) Agriculture & food industry
(4a) Agricultural organisations
320
National Farmers Union Scotland (NFUS)
(4) Agriculture & food industry
(4a) Agricultural organisations
321
Red Tractor
(4) Agriculture & food industry
(4a) Agricultural organisations
322
Ricardo (Future Farming Resilience Fund)
(4) Agriculture & food industry
(4a) Agricultural organisations
323
SRUC/SAC Consulting
(4) Agriculture & food industry
(4a) Agricultural organisations
324
Scottish Land and Estates
(4) Agriculture & food industry
(4a) Agricultural organisations
325
Scottish Rural College
(4) Agriculture & food industry
(4a) Agricultural organisations
326
Agriculture and Horticulture Development Board
(4) Agriculture & food industry
(4a) Agricultural organisations
327
DairyUK
(4) Agriculture & food industry
(4a) Agricultural organisations
328
Farm Quality Assurance Schemes
(4) Agriculture & food industry
(4a) Agricultural organisations
329
Assured Integrated Milk Supplier (AIMS)
(4) Agriculture & food industry
(4a) Agricultural organisations
330
Scottish Agricultural Organisation Society
(4) Agriculture & food industry
(4a) Agricultural organisations
331
Organic Soil Association
(4) Agriculture & food industry
(4a) Agricultural organisations
332
Dourie Farming Company Ltd
(4) Agriculture & food industry
(4a) Agricultural organisations
333
Scottish Land & Estates
(4) Agriculture & food industry
(4a) Agricultural organisations
334
Scottish Gamekeepers’ Association
(4) Agriculture & food industry
(4a) Agricultural organisations
335
South of Scotland Regional Economic Partnership
(4) Agriculture & food industry
(4a) Agricultural organisations
336
Scottish Crofting Federation
(4) Agriculture & food industry
(4a) Agricultural organisations
337
National Association of Agricultural Contractors
(4) Agriculture & food industry
(4a) Agricultural organisations
338
UK Irrigation Association
(4) Agriculture & food industry
(4a) Agricultural organisations
339
Scottish Tenant Farmers Association
(4) Agriculture & food industry
(4a) Agricultural organisations
340
Bank of Scotland Business
(4) Agriculture & food industry
(4a) Agricultural organisations
341
Royal Bank of Scotland
(4) Agriculture & food industry
(4a) Agricultural organisations
342
Pasture for Life
(4) Agriculture & food industry
(4a) Agricultural organisations
343
Scottish Association of Meat Wholesalers
(4) Agriculture & food industry
(4b) Food production organisations
344
Scottish Ecological Design Association (SEDA)
(4) Agriculture & food industry
(4b) Food production organisations
345
Milk Supply Association (MSA)
(4) Agriculture & food industry
(4b) Food production organisations
346
Social Enterprise Scotland
(4) Agriculture & food industry
(4b) Food production organisations
347
Scotland Loves Local Campaign
(4) Agriculture & food industry
(4b) Food production organisations
348
Scotland the Bread
(4) Agriculture & food industry
(4b) Food production organisations
349
Circular Communities Scotland
(4) Agriculture & food industry
(4b) Food production organisations
350
Campbells Prime Meat
(4) Agriculture & food industry
(4b) Food production organisations
351
Packaging Recycling Group Scotland
(4) Agriculture & food industry
(4b) Food production organisations
352
Scotch Beef
(4) Agriculture & food industry
(4b) Food production organisations
353
Food and Drink Federation Scotland (FDF Scotland)
(4) Agriculture & food industry
(4b) Food production organisations
354
Scotland Food and Drink
(4) Agriculture & food industry
(4b) Food production organisations
355
British Meat Processors’ Association
(4) Agriculture & food industry
(4b) Food production organisations
356
Quality Meat Scotland (QMS)
(4) Agriculture & food industry
(4b) Food production organisations
357
Food and Agriculture Organisation (FAO)
(4) Agriculture & food industry
(4b) Food production organisations
358
Marine Stewardship Council (MSC)
(4) Agriculture & food industry
(4b) Food production organisations
359
RSPCA
(4) Agriculture & food industry
(4b) Food production organisations
360
Scotch Whisky Association (SWA)
(4) Agriculture & food industry
(4b) Food production organisations
361
FoodDrinkEurope
(4) Agriculture & food industry
(4b) Food production organisations
362
Food and Drink Leadership Forum
(4) Agriculture & food industry
(4b) Food production organisations
363
Scotlean
(4) Agriculture & food industry
(4b) Food production organisations
364
UNISON Scotland
(4) Agriculture & food industry
(4b) Food production organisations
365
Scottish Wholesale Association
(4) Agriculture & food industry
(4b) Food production organisations
366
British Contract Manufacturers and Packers Association
(4) Agriculture & food industry
(4b) Food production organisations
367
The Packaging Federation
(4) Agriculture & food industry
(4b) Food production organisations
368
Scottish Fair Trade Forum
(4) Agriculture & food industry
(4b) Food production organisations
369
Resource Management Association Scotland (RMAS)
(4) Agriculture & food industry
(4b) Food production organisations
370
Consumer Scotland
(4) Agriculture & food industry
(4c) Supermarkets and retailers
371
Bute Produce
(4) Agriculture & food industry
(4c) Supermarkets and retailers
372
Remake Scotland
(4) Agriculture & food industry
(4c) Supermarkets and retailers
373
Scottish Grocers’ Federation’s Go Local programme
(4) Agriculture & food industry
(4c) Supermarkets and retailers
374
European Trade Union Federation of Textiles, Clothing and Leather (leather sector)
(4) Agriculture & food industry
(4c) Supermarkets and retailers
375
Product accreditation (leather sector)
(4) Agriculture & food industry
(4c) Supermarkets and retailers
376
Association of Convenience Stores (ACS)
(4) Agriculture & food industry
(4c) Supermarkets and retailers
377
British Retail Consortium (BRC)
(4) Agriculture & food industry
(4c) Supermarkets and retailers
378
Scottish Retail Consortium
(4) Agriculture & food industry
(4c) Supermarkets and retailers
379
Global markets (leather sector)
(4) Agriculture & food industry
(4c) Supermarkets and retailers
380
Scottish Grocers’ Federation
(4) Agriculture & food industry
(4c) Supermarkets and retailers
381
Scottish Trades Union Congress (STUC)
(4) Agriculture & food industry
(4c) Supermarkets and retailers
382
ASDA Supermarket
(4) Agriculture & food industry
(4c) Supermarkets and retailers
383
Tesco
(4) Agriculture & food industry
(4c) Supermarkets and retailers
384
Morrison’s
(4) Agriculture & food industry
(4c) Supermarkets and retailers
385
Sainsbury’s
(4) Agriculture & food industry
(4c) Supermarkets and retailers
386
The Refillery Edinburgh
(4) Agriculture & food industry
(4c) Supermarkets and retailers
387
NHS Scotland
(5) Public health bodies
(5a) Public health bodies
388
Public Health Scotland
(5) Public health bodies
(5a) Public health bodies
389
NHS Borders
(5) Public health bodies
(5a) Public health bodies
390
NHS Lothian
(5) Public health bodies
(5a) Public health bodies
391
NHS Grampian
(5) Public health bodies
(5a) Public health bodies
392
NHS Forth Valley
(5) Public health bodies
(5a) Public health bodies
393
Directorate of Health and Social Care
(5) Public health bodies
(5a) Public health bodies
394
Ministry of Public Health and Social Care
(5) Public health bodies
(5a) Public health bodies
395
Highlands and Islands Climate Hub
(6) Community organisations
(6a) Local food networks and sustainability hubs
396
Fife Communities Climate Action Network (FCCAN)
(6) Community organisations
(6a) Local food networks and sustainability hubs
397
North East Scotland Climate Action Resource Hub (NESCAN)
(6) Community organisations
(6a) Local food networks and sustainability hubs
398
Transition Black Isle
(6) Community organisations
(6a) Local food networks and sustainability hubs
399
Edinburgh Food Social
(6) Community organisations
(6a) Local food networks and sustainability hubs
400
Forth Valley Food Futures
(6) Community organisations
(6a) Local food networks and sustainability hubs
401
Highland Good Food Partnership
(6) Community organisations
(6a) Local food networks and sustainability hubs
402
Climate Hebrides
(6) Community organisations
(6a) Local food networks and sustainability hubs
403
Appetite for Angus Food & Drink Network
(6) Community organisations
(6a) Local food networks and sustainability hubs
404
Arran’s Food Journey
(6) Community organisations
(6a) Local food networks and sustainability hubs
405
Ayrshire Food an’ a that
(6) Community organisations
(6a) Local food networks and sustainability hubs
406
Bute Kitchen
(6) Community organisations
(6a) Local food networks and sustainability hubs
407
East Lothian Food and Drink
(6) Community organisations
(6a) Local food networks and sustainability hubs
408
Eat Drink Hebrides
(6) Community organisations
(6a) Local food networks and sustainability hubs
409
Eat SW Scotland
(6) Community organisations
(6a) Local food networks and sustainability hubs
410
Food from Argyll
(6) Community organisations
(6a) Local food networks and sustainability hubs
411
Food from Fife
(6) Community organisations
(6a) Local food networks and sustainability hubs
412
Forth Valley Food and Drink Network
(6) Community organisations
(6a) Local food networks and sustainability hubs
413
Great Perthshire
(6) Community organisations
(6a) Local food networks and sustainability hubs
414
Lanarkshire Larder
(6) Community organisations
(6a) Local food networks and sustainability hubs
415
North East Scotland Food & Drink Network
(6) Community organisations
(6a) Local food networks and sustainability hubs
416
Orkney Food and Drink
(6) Community organisations
(6a) Local food networks and sustainability hubs
417
A Taste of Shetland
(6) Community organisations
(6a) Local food networks and sustainability hubs
418
Glasgow Allotments Forum
(6) Community organisations
(6a) Local food networks and sustainability hubs
419
Abundant Borders
(6) Community organisations
(6a) Local food networks and sustainability hubs
420
Transition Edinburgh
(6) Community organisations
(6a) Local food networks and sustainability hubs
421
Edible Edinburgh
(6) Community organisations
(6a) Local food networks and sustainability hubs
422
Transition Stirling
(6) Community organisations
(6a) Local food networks and sustainability hubs
423
Moray Food Network
(6) Community organisations
(6a) Local food networks and sustainability hubs
424
Falkirk Food Futures
(6) Community organisations
(6a) Local food networks and sustainability hubs
425
Dundee Urban Orchard
(6) Community organisations
(6a) Local food networks and sustainability hubs
426
Fair Food Aberdeenshire
(6) Community organisations
(6a) Local food networks and sustainability hubs
427
Wester Hailes Growing Communities
(6) Community organisations
(6a) Local food networks and sustainability hubs
428
Scottish Rural Action
(6) Community organisations
(6b) Rural community associations
429
Countryside Alliance
(6) Community organisations
(6b) Rural community associations
430
Carbon Brief
(7) Media & influencers
(7a) Journalists and media outlets
431
The Grocer
(7) Media & influencers
(7a) Journalists and media outlets
432
The Scottish Farmer
(7) Media & influencers
(7a) Journalists and media outlets
433
The Scotsman
(7) Media & influencers
(7a) Journalists and media outlets
434
The Highland Times
(7) Media & influencers
(7a) Journalists and media outlets
435
The National
(7) Media & influencers
(7a) Journalists and media outlets
436
Health Food Business Magazine
(7) Media & influencers
(7a) Journalists and media outlets
437
Meat Management Magazine
(7) Media & influencers
(7a) Journalists and media outlets
438
HealthandCare.Scot
(7) Media & influencers
(7a) Journalists and media outlets
439
Laura Young (‘Less Waste Laura’
(7) Media & influencers
(7b) Influencers & activists
440
Students Organising for Sustainability (SOS-UK)
(8) General public & citizens’ groups
(8a) Vulnerable populations
441
Inclusion Scotland
(8) General public & citizens’ groups
(8a) Vulnerable populations
442
People and Planet
(8) General public & citizens’ groups
(8a) Vulnerable populations
443
The Commitment
(8) General public & citizens’ groups
(8a) Vulnerable populations
444
Scotland’s Regeneration Forum (SURF)
(8) General public & citizens’ groups
(8a) Vulnerable populations
445
Just Fair
(8) General public & citizens’ groups
(8a) Vulnerable populations
446
Poverty Alliance
(8) General public & citizens’ groups
(8a) Vulnerable populations
447
Citizens Advice Scotland
(8) General public and citizen groups
(8b) Consumer rights organisations
Appendix C: Systematic literature review methodology
Two main citation indexes were used to systematically search for articles: Scopus (for published academic literature); and Publish or Perish (for unpublished ‘grey’ literature).
In addition, a set of non-systematically derived articles supplemented the main systematic literature review protocol and more detail can be found below.
For the systematic search protocol, search parameters comprised Title-Abstract-Keyword searches of articles published in English since 2015. Because of the breadth of the topic, no categories were excluded from the search parameters. As Publish or Perish searches Google Scholar records, articles were limited to the first 200 returns by relevance.
The SPICE framework (Booth, 2006) was used to configure the systematic review search string and incorporated the following framework:
Setting: E.g. Scotland’s policy environment and the social, economic, and environmental factors specific to Scotland.
Perspective: E.g. policymakers, public groups, industry stakeholders, and other groups affected by diet and climate policies.
Intervention: E.g. climate-related dietary policy actions, public health initiatives, economic incentives, or educational campaigns.
Comparison: E.g. other regional or international diet and climate policies or scenarios where similar policy interventions are absent.
Evaluation: E.g. outcomes in terms of emissions reductions, public health improvements, economic impacts, or stakeholder engagement effectiveness.
The Title-Abstract-Keyword citation indexes were searched using the following strings, which were adapted during pilot searches because of limitations to search capabilities across each index and to optimise returns:
Scopus: TITLE-ABS-KEY ((“scot*” OR “united kingdom” OR “wales” OR “england” OR “northern ireland”) AND (“diet*” OR “food”) AND (“climate” OR “carbon” OR “emissions” OR “environment*”) AND (“policy*” OR “regulat*” OR “strateg*” OR “lever*” OR “mechanism*”) AND (“behaviour*” OR “percept*” OR “attitud*” OR “consum*” OR “meat” OR “dairy” OR “vegan” OR “vegetarian” OR “plant-based” OR “nutrition” OR “health” OR “wellbeing” OR “equit*” OR “sustainab*” OR “adaptation” OR “mitigation” OR “resilien*” OR “biodiver*” OR “econom*” OR “cost” OR “agricultur*” OR “produc*” OR “process*” OR “retail*” OR “trade*” OR “import*” OR “export*”))
Publish or Perish: scot* AND diet* OR food AND climate OR carbon OR emissions OR environment* AND policy* OR regulat* OR strateg* OR lever OR mechanism* AND behaviour*
Search results from each index were imported into Zotero where duplicates were removed.
Titles/abstracts were screened for eligibility based on the following criteria:
Inclusion criteria:
Publication language English
Published since 2020
Scotland, UK or other devolved policy contexts
Relevant to one or more of the five PESTLE dimensions
Availability of full text by 31/1/25
Exclusion criteria:
Publication language not English
Published before 2020 or focused on policy contexts prior to 2015
Without direct or indirect relevance to Scottish, UK or other devolved policy contexts
Without relevance to at least one of the five PESTLE dimensions
Conference proceedings
Methodological papers and study protocols
Each article was screened and assigned to one of three Zotero folders: Include; Exclude; Unsure. With reference to the latter, at the end of the initial screening these articles were re-examined and re-categorised to the Include or Exclude folder.
The following data were extracted from all included articles:
Article title
Last name of first author
Year of publication
Article URL
Article type (e.g., empirical study, policy document)
Study context and Aims/Objectives
Results:
Key findings
Conclusions
Areas for policy development
In addition to the systematic literature review, relevant articles from a variety of other sources supplemented the review to ensure a comprehensive and contextually relevant analysis. Articles were identified through:
Stakeholder Contributions – During stakeholder one-to-one discussions, participants suggested key reports, policy documents, and research papers that they considered highly relevant to the topic.
Citation Searches – Both forward citation searches (identifying newer papers that cited key sources) and reverse citation searches (reviewing references cited within important papers) were conducted to expand the review.
General Web Searches – Broader searches using Google were performed to capture relevant grey literature, media reports, and other non-peer-reviewed sources that may not be included in academic databases.
Targeted Website Searches – Specific searches were conducted on Scottish Government, NGO, and stakeholder websites to access reports, policy briefings, and unpublished data relevant to the research focus.
Appendix D: Systematic literature review flowchart
Appendix E: Stakeholder meeting methodology
Purpose and Overview:
The one-to-one stakeholder meetings[10] were conducted to gather qualitative insights into Scotland’s complex diet and climate policy landscape. These conversations were intended to complement the literature review and stakeholder workshops by eliciting the perspectives of individuals with practical experience and policy insight across relevant sectors of Government (supplemented by Third Sector and Academia).
Stakeholder Identification and Selection
Stakeholders were purposively selected based on their relevance to the intersecting themes of diet and climate policy, including specific expertise or engagement in areas such as emissions reduction, food security, policy development and advocacy, rural and environmental science, public health, environmental policy, agriculture, food production, and food insecurity. The selection process drew on:
Expert recommendations from Scottish Government contacts and members of the research steering group.
A stakeholder mapping exercise (see Appendices A and B).
Format and Approach
A total of 14 semi-structured informal online meetings were conducted.
Meetings followed a tailored topic guide to allow flexibility while covering core themes such as governance, policy coherence, barriers to implementation, and perceived gaps in evidence or support.
Discussions typically lasted 30–60 minutes and were designed to be conversational, allowing participants to reflect on both strategic and operational aspects of policy and practice.
Meetings were not recorded, but the researcher took detailed notes throughout.
Ethical Considerations and Data Management
Ethical approval was obtained through the University of Bath.
All participants were provided with information on the project and gave informed verbal consent.
Analytical Use
Insights from the stakeholder meeting notes were synthesised alongside the literature review and workshop outputs. They fed directly into the PESTLE analysis, helping to identify areas for policy development, clarify governance issues, and shape recommendations across the political, economic, social, technological, legal, and environmental dimensions.
Semi-structured meeting protocol
The following questions guided the meetings:
1. Understanding their role and work
Can you tell me about your current role and your team’s focus within the Scottish Government?
Does your work intersect with diet policy in Scotland, and what are the key objectives your team is working towards in this area?
2. Stakeholder relationships and collaboration
Who are the key stakeholders you collaborate with (e.g., other government departments, industry, civil society)?
Are there any stakeholders or groups whose influence or involvement you feel is missing or underrepresented in this policy area?
How would you describe the strength of your collaboration with other key stakeholders? Are there any gaps or challenges in communication or partnership?
3. Policy levers for diet change
What policy levers do you believe are most effective for promoting dietary changes that would both improve public health and reduce environmental impact?
In your view, are there particular dietary behaviours or food systems that should be prioritised for change in order to meet Scotland’s climate and health goals?
What challenges do you see in implementing these policies, either from a political, social, or logistical standpoint?
4. Identifying gaps in existing policy
Do you think there are any gaps in current diet-related policies that hinder progress towards climate goals or healthier diets?
Are there areas where more integration or alignment between climate and health policies could be beneficial?
Where do you see the biggest opportunities for new or improved policies in this space?
5. Future policy directions and needs
What emerging trends or issues do you think will have the biggest influence on future diet, and climate or health policy in Scotland?
In what ways do you think Scottish diet policy could evolve to address both climate change and public health more effectively?
Meeting participants
The following table summarises details of meeting participants
#
Organisation
Policy Area
1
Academia
Diet & Climate
2
Third-Sector (Environment)
Emissions
3
Scottish Government
Food Security
4
Scottish Government
Diet
5
Scottish Government
Policy engagement
6
Scottish Government
Rural and environmental science
7
Academia
Diet policy perceptions
8
UK Government
Diet policy
9
Scottish Government
Health
10
Scottish Government
Environment
11
UK Government
Agriculture & Environment
12
Scottish Government
Food insecurity
13
Third Sector (Health)
Diet & Health
14
Scottish Government
Climate and Diet
Appendix F: Stakeholder workshop protocols
Workshop Purpose
The workshops aimed to explore stakeholder perspectives on Scotland’s diet and climate policy landscape, identify priority issues and gaps, and generate ideas for practical cross-sector solutions. These sessions supported the development of policy-relevant insights through collaborative, activity-based engagement. Stakeholders were identified based on the mapping exercise and consultations with Scottish Government colleagues to identify a range of interests and influence (including Government, third sector organisations, academics, agriculture and food producers, health, community, and environmental groups).
Workshop Formats
Three stakeholder workshops were delivered:
One in-person workshop (full protocol detailed below)
Two online workshops, which followed a shortened format with similar core activities
Participant Recruitment Stakeholders were purposively recruited based on a preceding stakeholder mapping exercise. This mapping exercise identified relevant individuals and organisations across key sectors including Scottish Government, public health, agriculture, environment, food industry, third sector, and academia. The rationale for recruitment was guided by the segmentation of stakeholders within the mapping process, ensuring representation across high-interest and high-influence categories, as well as those with complementary or contrasting perspectives. All workshops included a cross-sector mix to support inclusive dialogue and the development of well-rounded policy insights.
Facilitation and Materials Workshops were facilitated by a research team using a structured agenda and visual/interactive materials. In-person materials included A0 wall charts, colour-coded sticky notes, printed worksheets, and feedback forms. Online workshops used virtual whiteboards, editable templates, and polling tools to replicate similar participatory methods in a digital environment.
Core Activities (all formats)
Activity 1: Priority Mapping Stakeholders identified sector-specific priorities, areas for policy development, and coordination needs using a structured mapping exercise. These inputs were categorised visually (in-person) or on a shared document (online) and discussed in plenary.
Activity 2: Policy Challenge Brainstorm Mixed-sector groups tackled pre-defined policy challenges (e.g., reducing meat consumption, supporting farmers, addressing inequalities). Each group identified key barriers and proposed short-term policy solutions, then shared findings with the wider group.
Activity 3: Prioritisation and Feedback Stakeholders reviewed the workshop’s emerging priorities and selected the most important using voting dots (in-person) or virtual polling (online). This was followed by group discussion and final reflections.
Additional In-Person Activity
Future Diet Scenarios Small groups considered hypothetical future policy scenarios for 2040 (e.g., localisation of food systems, technological innovation, policy-led dietary shifts). Discussions explored sector-specific impacts, challenges, opportunities, and future policy needs.
Data Collection and Follow-Up
Participant contributions were captured via workshop artefacts (e.g., sticky notes, templates, whiteboards), discussion summaries, and anonymised feedback forms. An optional follow-up survey was distributed by email. Thematic analysis of all outputs informed policy insights and recommendations.
To support co-production and refine the emerging findings, we incorporated iteration loops for feedback. Formative workshop outputs were shared with participants and relevant stakeholders following the sessions, and feedback was actively invited to validate interpretations, identify omissions, and strengthen final conclusions.
Participating stakeholders
Workshop
Format
Stakeholders
1
In-person
Food Standards Scotland.
Nourish Scotland
Public Health Scotland
Soil Association Scotland
Nature Friendly Farming Network
Rowett Institute, University of Aberdeen.
University of Edinburgh
Scottish Government (Tobacco, Gambling, Diet and Healthy Weight Unit).
Appendix G: Extended Political analysis: Areas for further policy development and supporting evidence
Key theme
Area For Policy Development
1. Governance and Structural Issues in Food Policy Coordination
Establish a coordinated and coherent food policy framework
Food policies operate in silos, with opportunities to strengthen cross-sectoral collaboration. Informal policy structures can limit transparency and efficiency.
Supporting evidence: Literature review
Effective policy implementation requires cross-departmental collaboration and a holistic approach, addressing both supply and demand aspects of the food system. Currently, policies in Scotland are fragmented, with limited integration across health, agriculture, and environmental sectors.
(Tregear, Morgan, Spence et al., 2024).
Supporting evidence:
Stakeholder meetings
Fragmented governance across Government divisions, leading to disjointed approaches to diet, climate, and health policies
(Stakeholder Meeting 3).
Supporting evidence: Workshops
“Greater cross ministry coordination between environment, net zero, health and housing needed to all recognise the link between industrial livestock production and emissions.”
(Workshop 4).
Align food policy with national climate targets
Food system policies should better align with net-zero targets by integrating climate action and dietary change into Scotland’s Good Food Nation objectives.
Supporting evidence: Literature review
Integrating national food strategies with climate change mitigation is crucial. Highlight Scotland’s leadership in establishing sustainable food policies aligned with net-zero.
(Boyle, Jenneson, Okeke-Ogbuafor et al., 2024).
Supporting evidence:
Stakeholder meetings
The focus on reducing meat and dairy emissions creates political sensitivities, with sustainable diets seen as contentious.
(Stakeholder Meeting 14).
Supporting evidence: Workshops
“Within Scottish Government: Make climate & diet part of a Good Food Nation objective. Include dietary change as one of Scotland’s climate goals. Work for better join up across policy areas, work against narrowness. Make this a priority for multiple departments.”
(Workshop 4).
Promote long-term, systemic approaches in food policy
Short-term political cycles and reactive policymaking impact long-term food system transformation.
Supporting evidence: Literature review
–
Supporting evidence:
Stakeholder meetings
–
Supporting evidence: Workshops
“Short term thinking- panic politics!
Prevents reliable engagement and constant churn
Just in time production and unequal power balance between food producers, wholesalers, and retailers
Framework contracts for catering are constantly tightened while tied into commercial”
(Workshop 1).
Enhance strategic leadership to drive dietary change
A clearer strategic vision could support sustainable dietary change. Industry influence (e.g., food advertising) shapes food choices, and Government could play a stronger role.
Supporting evidence: Literature review
A lack of visible, strategic political leadership to unify and implement health, environment, and food equity changes was highlighted as a major deficit.
(Food Farming & Countryside Commission, 2023).
Supporting evidence:
Stakeholder meetings
Absence of formal leadership and cross-departmental coordination, leading to fragmented efforts
(Stakeholder Meeting 14).
Supporting evidence: Workshops
“A lack of political will and leadership from politicians and the leaders of the wider food movement to take on the opportunities of dietary change, with an over-reliance on the free market to fix food.”
(Workshop 1).
Develop and implement a comprehensive national food strategy
A more holistic, integrated and strategic approach to food and diet across climate, health, and agriculture would strengthen policy coherence.
Supporting evidence: Literature review
Food system governance in the UK is multi-layered, involving numerous regulatory bodies and policies across sectors. This fragmentation complicates efforts to address system-wide issues like environmental sustainability and public health
(Hasnain, Green, Williams et al., 2020).
Supporting evidence:
Stakeholder meetings
Misalignment between climate, health, and food policies. Current policy frameworks lack coherence, creating conflicting objectives
(Stakeholder Meeting 13).
Supporting evidence: Workshops
“There is a tendency to think about different aspects of food systems links to health, missing thinking about the totality of the links between food and health- through benefits of health from employment, improved air quality, reduced pollution, better nutrition, visibility and access to green spaces, encouragement of physical activity etc. understanding food system the complexities and feedback loops of a complex system ( also consideration of impact of climate change effects locally and globally on food security).”
(Workshop 1).
Improve alignment of food policy across governance levels
Ensuring national and local policies work in tandem would improve implementation and outcomes.
Supporting evidence: Literature review
National food policies tend to prioritise large-scale, industrial supply chains, often at the expense of supporting local and regional food systems. This emphasis can marginalise smaller producers, reduce community resilience, and limit opportunities for sustainable, place-based approaches to food production and distribution. Strengthening policy support for local food networks could enhance food security, shorten supply chains, and contribute to environmental and public health goals.
(Witheridge & Morris, 2016).
Supporting evidence:
Stakeholder meetings
–
Supporting evidence: Workshops
“Local & national level joining up of food policies.”
(Workshop 3).
Strengthen policy coherence between national and local food initiatives
National dietary targets could better account for local food sovereignty and self-sufficiency, ensuring global dietary goals align with Scotland’s food systems.
Supporting evidence: Literature review
Insufficient consideration of how global dietary targets may intersect with local food sovereignty and autonomy.
(EAT, n.d.).
Supporting evidence:
Stakeholder meetings
–
Supporting evidence: Workshops
–
Define clear and measurable targets under the Good Food Nation Act
Establishing measurable goals for emissions, biodiversity, and dietary shifts would provide greater long-term direction.
Supporting evidence: Literature review
No specific targets or indicators. The Act does not set clear, measurable targets for emissions reduction, biodiversity conservation, or dietary shifts. Leaves flexibility to future governments, which may slow progress.
(Brennan, 2023).
Supporting evidence:
Stakeholder meetings
–
Supporting evidence: Workshops
–
2. Just Transition and Resilient Food Systems
Ensure a just transition in the food system
Stronger policy support is needed to help farmers, food workers, and consumers transition to sustainable practices while ensuring fairness and inclusivity.
Supporting evidence: Literature review
Weak link between food production and Just Transition principles. The document emphasises a Just Transition for farmers and crofters but does not sufficiently address how food system workers, small-scale producers, and consumers will be supported in adapting to more sustainable food systems.
(Scottish Government, 2022b).
Supporting evidence:
Stakeholder meetings
–
Supporting evidence: Workshops
“Just transition.”
(Workshop 1).
Align public procurement with sustainability and dietary targets
Align procurement policies with environmental and dietary goals across public institutions (e.g. schools, hospitals). Improve coordination between health boards and local authorities. Strengthen oversight and accountability to ensure sustainability outcomes.
Supporting evidence: Literature review
Public Sector Procurement Oversight. The document does not discuss whether public sector food procurement (e.g., schools, hospitals, government catering) will align with these dietary goals. A mandatory framework for institutional food policies (e.g., requiring plant-forward meals in public settings) is missing.
(Scottish Government, 2013).
Supporting evidence:
Stakeholder meetings
Public procurement policies have untapped potential to support local, sustainable food systems while stimulating the green economy.
(Stakeholder Meeting 8).
Supporting evidence: Workshops
“There is a gap in current public procurement accessing enough sustainable products.”
(Workshop 1).
Strengthen resilience in food supply chains
Increased investment in infrastructure, including capital support and processing facilities, would improve food system resilience.
Supporting evidence: Literature review
No Specific Strategy for Food System Resilience. The Act does not address supply chain vulnerabilities (e.g., extreme weather events, trade disruptions).
(Brennan, 2023).
Supporting evidence:
Stakeholder meetings
–
Supporting evidence: Workshops
“Supply chains-capital support-processing.”
(Workshop 3).
Enhance policy support for local and regional food systems
Policies could better integrate local food production into supply chains, enhancing resilience to global disruptions. Small-scale initiatives play a key role but require stronger policy backing. Strengthening regional coordination between producers, supply chains, and consumers, especially in remote areas, could enhance resilience and sustainability.
Supporting evidence: Literature review
Barriers to Local Food Growth: Access to land for community growing remains an issue despite policies like the Community Empowerment (Scotland) Act 2015. Infrastructure gaps: Rural and island areas face transport and distribution challenges, making it harder to get food to markets.
(Scottish Government, 2024).
Supporting evidence:
Stakeholder meetings
–
Supporting evidence: Workshops
“There is a gap of a localised/regional joined up application of sustainable food systems encompassing primary food production, supply chain and consumer. Scottish islands and some other areas around Scotland’s coast are very vulnerable to e.g. food access and affordability. Applying a bespoke sustainable food system would tick a lot of boxes and offer research opportunities and questions still to be asked.”
(Workshop 3).
Invest in infrastructure for sustainable and local meat processing
Expanding access to slaughter facilities, particularly in remote areas, would support local farmers and streamline processing.
Supporting evidence: Literature review
Processing capacity is limited: Lack of small abattoirs and local processing facilities hinders small farmers from scaling up.
Scottish Government, 2024).
Supporting evidence:
Stakeholder meetings
–
Supporting evidence: Workshops
“Need to support slaughterhouses due to lack of availability for farmers, especially in remote areas, and issues with accessing facilities, especially on the West Coast. Having slaughter hubs rather than individuals accessing/identifying farms (do paperwork before lorries enter premises.”
(Workshop 3).
Develop a food systems approach tailored to Scotland’s context
Policies should reflect Scotland’s unique rural and cultural contexts, including land-use trade-offs and food traditions.
Supporting evidence: Literature review
Advocates for transforming the UK food system using a systems-based approach to address interconnected challenges such as unhealthy diets, environmental degradation, and food system inefficiencies. However, it is UK-wide and lacks Scotland-specific insights, such as its distinct agricultural systems (e.g., crofting) or cultural preferences in food. Fails to account for Scotland’s devolved responsibilities in areas like agriculture and environment, which require more tailored solutions.
(Bhunnoo, & Poppy, 2020).
Supporting evidence:
Stakeholder meetings
–
Supporting evidence: Workshops
–
Address urban-rural inequities in food security and access
A more integrated approach is needed to address food security challenges in urban areas while supporting rural agricultural priorities.
Supporting evidence: Literature review
Urban-Rural Divide: Highlights Scotland’s diversity in land use but does not fully address the challenges of urban food security in comparison to rural production priorities.
(Gill, Fowler & Scott, 2024).
Supporting evidence:
Stakeholder meetings
–
Supporting evidence: Workshops
–
Advance implementation of the 10-minute neighbourhood model
Improve planning and spatial access. Connecting communities with local producers and using technology to improve food accessibility could support stronger local food systems.
Supporting evidence: Literature review
Exploratory study on the feasibility of 10-minute neighbourhoods in Edinburgh, noting that food accessibility is a key factor in their successful implementation. The research suggests utilising technology (such as online food hubs and delivery platforms) to connect consumers with local producers.
(van der Horst, Lane, Creasy et al., 2021).
Supporting evidence:
Stakeholder meetings
–
Supporting evidence: Workshops
“10 minute neighbourhood-bringing the local food system to see where it’s needed and linking it to local producers.
Creating greater closeness to system
Opportunities for technologies to help with that.”
(Workshop 1).
Integrate urban agriculture into food policy and planning
Urban agriculture could play a greater role in production methods supporting plant-based diets and lowering carbon footprints.
Supporting evidence: Literature review
Analysis of the climate impact of food consumed in Scotland, identifying urban agriculture as a crucial strategy for lowering carbon emissions and promoting plant-based diets. The research suggests that increasing urban food production can offset some of Scotland’s imported food emissions, which currently contribute significantly to the nation’s carbon footprint.
(Jaacks, Frank, Vonderschmidt et al., 2024).
Supporting evidence:
Stakeholder meetings
–
Supporting evidence: Workshops
–
Develop a national strategy for climate-compatible red meat supply
A clearer plan is needed to ensure red meat supply security amid potential future shortages.
Supporting evidence: Literature review
Impact of labour shortages on food availability and safety in the UK, with a focus on Scotland’s red meat sector. The study finds that geographical challenges and post-Brexit labour shortages increase supply risks. The paper calls for contingency planning in Scotland’s red meat processing sector to ensure long-term supply security.
McAreavey, Choudhary, Obayi et al., (2023).
Supporting evidence:
Stakeholder meetings
–
Supporting evidence: Workshops
–
3. Aligning Food Policy with Climate, Health, and Nutrition Goals
Align production and consumption policies for a sustainable food system
Current policies emphasise food production over dietary behaviour, missing opportunities to address both sustainability and consumer choices.
Supporting evidence: Literature review
Food supply chain sustainability is prioritized over dietary sustainability in Scottish policy discussions. They advocate for more emphasis on consumer choices, food accessibility, and reducing food waste.
(Leat, Revoredo-Giha, & Lamprinopoulou, 2011).
Supporting evidence:
Stakeholder meetings
Production vs. diet change focus: Policy emphasis on production over dietary behaviour misses opportunities for integrated approaches.
(Stakeholder Meeting 6).
Supporting evidence: Workshops
–
Strengthen national nutrition strategies to support dietary change
Policies lack structured plans for ensuring nutritional adequacy in plant-based diets, including fortification of alternatives to meat and dairy.
Supporting evidence: Literature review
The report points out that many plant-based alternatives lack fortification with essential nutrients like calcium, vitamin B12, and iodine, identifying a gap in nutritional standards for these substitutes.
Comrie, Wilson, Nneli, et al., 2024).
Supporting evidence:
Stakeholder meetings
Poor health outcomes and dietary patterns in Scotland may worsen if red meat reduction strategies do not account for suitable nutritional replacements.
(Stakeholder Meeting 11).
Supporting evidence: Workshops
–
Establish clear and measurable targets for reducing meat consumption
No official population targets exist for reducing meat consumption (e.g., 20% by 2030), limiting policy integration with sustainability and health goals.
Supporting evidence: Literature review
Discussion of future food policy challenges in Scotland, emphasizing that the country still does not have official set targets for reducing red meat consumption. The study suggests that integrating dietary changes into net-zero policies could improve policy coherence and sustainability outcomes.
Lambe, Weitz, Hilgert, et al., (2025).
Supporting evidence:
Stakeholder meetings
–
Supporting evidence: Workshops
“Absence of government policy: Scottish Government doesn’t currently aim to reduce meat by 20% by 2030. Government has cross-cutting national food policy and food plans, but this goal isn’t embedded within these plans. A big missed opportunity – perhaps because diets are perceived as too personal”.
(Workshop 4).
Integrate methane reduction measures into food and agricultural policy
There are no specific methane reduction targets for livestock, creating gaps in investment and emission mitigation strategies. Policies could balance methane reduction with food security and rural livelihoods.
Supporting evidence: Literature review
Setting clear methane reduction targets
Scotland currently lacks a specific methane reduction target for livestock, unlike New Zealand, which aims for a 10% reduction by 2030 and 24-47% by 2050.
A formal methane target could drive investment and farmer participation.
(Jenkins, Herold, de Mendonça et al., 2024).
Supporting evidence:
Stakeholder meetings
–
Supporting evidence: Workshops
–
Develop policies to reduce emissions across the entire food supply chain
Greater attention is needed on emissions from food transportation and storage, with investment in supply chain infrastructure.
Supporting evidence: Literature review
Highlights the need for investment in Scotland’s supply chain infrastructure to reduce emissions from food transportation and storage. The study suggests that targeted investments in cold chain logistics and sustainable transport can significantly lower carbon footprints in the Scottish food system.
Pultar & Ferrier, 2024).
Supporting evidence:
Stakeholder meetings
The industry favours low-volume, high-value, resource-intensive convenience foods, and inefficient transportation, reducing sustainability.
(Stakeholder Meeting 11).
Supporting evidence: Workshops
–
Bridge gaps between diet-related and public health policy frameworks
Policies could better integrate dietary guidance with efforts to reduce health inequalities and poverty.
Supporting evidence: Literature review
Poor diet as both a cause and consequence of poverty in Scotland, stressing the need for more proactive policy interventions to integrate nutritional guidance with poverty reduction strategies.
Hunt, Pettinger & Wagstaff, 2023).
Supporting evidence:
Stakeholder meetings
There remains a disconnect between health inequality and poverty-related dietary issues, highlighting the need for more nuanced and targeted policy interventions.
(Stakeholder Meeting 13).
Supporting evidence: Workshops
–
Update dietary guidance to reflect both health and climate priorities
While CCC carbon budgets support the transition to more sustainable and healthier diets in Scotland, they often lack specific guidance on reducing consumption of high-emission foods such as red and processed meats.
Supporting evidence: Literature review
A scenario-based approach to emissions reduction targets in Scottish agriculture emphasises that dietary changes could significantly contribute to emissions reductions, but Scotland lacks specific food-related emissions policies targeting red and processed meats.
Eory, Topp, Rees et al., 2023).
Supporting evidence:
Stakeholder meetings
–
Supporting evidence: Workshops
“Diet is about balance (rather than individual products being high/low) Climate impact.”
(Workshop 1).
Embed animal welfare considerations within public health and food policy
Animal welfare could be recognised within a sustainable welfare framework, linking it to zoonotic disease risks and food system sustainability.
Supporting evidence: Literature review
Examines Scotland’s Good Food Nation Act, noting that animal welfare policies remain part of a fragmented approach to food system policy. The study suggests that food policy should explicitly include welfare considerations.
(Brennan, 2023).
Supporting evidence:
Stakeholder meetings
–
Supporting evidence: Workshops
“Animal welfare currently considered an ethical issue but not a priority issue vs public health. Lack of connectedness between One Health / One Welfare approach to food and farming systems and the associated zoonotic risk and prevalent emergence from intensive systems e.g. swine flu, bird flu.”
(Workshop 4).
4. Economic and Political Barriers to Food System Change
Develop targeted policies and interventions for high meat consumers
Current policies do not sufficiently target high meat consumers or sub-groups, limiting effectiveness in driving dietary change. There is no clear government policy to encourage or incentivise reduced red and processed meat consumption, and existing strategies lack structured approaches to ensuring nutrient adequacy in plant-based alternatives.
Supporting evidence: Literature review
Study indicates that if high consumers of red and processed meat (>70g/day) reduced their intake to the Scottish Dietary Goal (70g/day), a 16% reduction in total meat consumption would be achieved.
This targeted reduction approach could help lower colorectal cancer risks, BMI, cardiovascular disease, and Type 2 diabetes cases.
Policy Gap: There is no clear government policy specifically encouraging or incentivizing reductions among high meat consumers, such as:
Public health campaigns targeting high meat eaters.
Incentives for shifting to plant-based or lower-meat diets.
Differentiated policies for groups at higher health risk from high meat consumption.
(Food Standards Scotland (FSS), 2024).
Supporting evidence:
Stakeholder meetings
There are tensions surrounding blanket meat reduction policies, with a focus on targeting high consumers of meat to achieve incremental emissions reductions being seen as more effective.
(Stakeholder Meeting 9).
Supporting evidence: Workshops
“Lack of tailored approach targeting red meat over-consumers in Scotland.”
(Workshop 1).
Shape future dietary patterns through integrated policy and public engagement
Without stronger Government intervention, major food manufacturers and retailers may dominate with unhealthy and unsustainable options. Policies do not directly address the reduction of ultra-processed foods linked to poor health and environmental harm.
Supporting evidence: Literature review
Climate-focused food-based dietary guidelines in other countries advocate for reduced consumption of UPFs due to their high environmental impact. The Scottish dietary guidelines do not yet emphasise avoiding these foods to the same degree, which could be an area for development
(Tregear, Morgan, Spence et al., 2024).
Supporting evidence:
Stakeholder meetings
Absence of formal leadership and cross-departmental coordination, leading to fragmented efforts.
(Stakeholder Meeting 3).
Supporting evidence: Workshops
“Bear in mind that diets are changing – the status quo will drive a worsening of diets.
If government are absent, then big food industry players will fill the vacuum with unhealthy / unsustainable food.”
(Workshop 4).
Support the development of the plant-based food sector
Business opportunities for plant-based products could be strengthened by ensuring consistency in agricultural and horticultural policies.
Supporting evidence: Literature review
need to review possible solutions that will replace and improve on the Common Agricultural Policy, in terms of environmental goods for both the industry and wider society. They recommend stabilising policy incentives to ensure better support for sustainable food production.
(Lampkin, Shrestha, Sellars et al., 2021).
Supporting evidence:
Stakeholder meetings
–
Supporting evidence: Workshops
“Support for the market that focuses on plant-based food – to drive business opportunities.
Government consistency on the Agricultural and Horticultural Development board (industry advocacy?) – DEFRA co-ordinated.”
(Workshop 3).
Build the economic case for food system transformation
The financial unsustainability of the current food system remains under-examined as a driver for policy change, with climate and health arguments alone proving insufficient.
Supporting evidence: Literature review
Highlights ways Scotland can reform its food economy to become more self-sufficient and resilient. It offers insights into where investments and support may be needed to enhance domestic pro‑ duction and promote a resilient and sustainable food system Their study suggests that policy shifts should prioritize local food production and reduce reliance on imports.
(Rathnayaka, Revoredo-Giha & de Roos, 2024).
Supporting evidence:
Stakeholder meetings
–
Supporting evidence: Workshops
“Health economics view on the cost of our current dysfunction! Can we convince people by showing them that it’s not financially feasible to continue as we are (whether at local authority or national level) where just climate or health outcomes have perhaps not convinced.”
(Workshop 4).
Balance regulation with industry compliance and capacity to adapt
Reliance on voluntary industry commitments rather than enforceable regulations limits the effectiveness of climate and food system policies.
Supporting evidence: Literature review
Inadequate Governance:
Few policies include clear accountability structures or measurable goals for implementation and evaluation.
Many approaches rely on voluntary industry compliance, reflecting neoliberal frameworks that prioritise individual responsibility over systemic change.
(Lee, Cullerton & Herron, 2020).
Supporting evidence:
Stakeholder meetings
Strong lobbying from agricultural and rural stakeholders affects policy decisions on livestock emissions.
(Stakeholder Meeting 4).
Supporting evidence: Workshops
–
Manage post-Brexit trade policy to protect food standards and sustainability
Policy challenges arise from post-Brexit trade disruptions and economic uncertainties, requiring stronger food system resilience.
Supporting evidence: Literature review
Discusses how Brexit has disrupted food governance in Scotland, leading to policy uncertainty in sustainable agriculture and food security. They highlight that Scotland needs a more independent policy framework to maintain sustainability goals post-Brexit.
(Attorp & Hubbard, 2022).
Supporting evidence:
Stakeholder meetings
–
Supporting evidence: Workshops
“Balancing trade tensions, concerns as a fallout from e.g., Brexit.”
(Workshop 1).
5. The Role of Technology, Trade, and Environmental Considerations in Food Policy
Strengthen regulation and oversight of intensive agricultural practices
A clearer policy framework is needed to address the environmental and animal welfare impacts of intensive farming.
Supporting evidence: Literature review
Argues that Scotland’s reliance on intensive farming practices negatively impacts biodiversity, soil health, and emissions. The report recommends strengthening agricultural policies to incorporate nature-based solutions and reduce chemical dependency in intensive farming.
(Brodie, 2023).
Supporting evidence:
Stakeholder meetings
–
Supporting evidence: Workshops
“Scottish Government policies must be more joined up with a clear goal to reduce the amount of meat and dairy produced in industrial farming systems.”
(Workshop 1).
Reevaluate the role of food miles in sustainability metrics
The contribution of food miles to total emissions is often overstated, highlighting the need for a more holistic sustainability discussion.
Supporting evidence: Literature review
Analysis of the impact of food miles and carbon footprint, showing that overemphasizing local production can exaggerate its sustainability benefits while ignoring production efficiency and food system integration.
(Vittersø, Torjusen, Laitala et al., 2019).
Supporting evidence:
Stakeholder meetings
–
Supporting evidence: Workshops
“Food miles as an unhelpful concept due to its disproportionately small impact (equal to or less than 5% of total emissions).”
(Workshop 1).
Assess the environmental and social sustainability of emerging food technologies
Emerging production methods (e.g., vertical farming) require evaluation of energy use, labour, and environmental impact to ensure long-term sustainability.
Supporting evidence: Literature review
Analyses energy use, labour demand, and environmental sustainability in Scottish vertical farming. They highlight high energy costs due to artificial lighting and climate control but note potential labour efficiency gains.
(Briggs, Tallontire & Dougill, 2019).
Supporting evidence:
Stakeholder meetings
–
Supporting evidence: Workshops
“Vertical farms/greenhouse tomatoes- what are environmental impacts of production?
Depends on production methods-and extent to which energy and labour is required.”
(Workshop 1).
Leverage product reformulation to support health and sustainability
Reformulating processed food products over time can reduce environmental impacts and improve health.
Supporting evidence: Literature review
Analyses the potential of reducing processed meat in Scottish food systems through reformulation strategies. They highlight environmental benefits, including lower greenhouse gas emissions, and health co-benefits.
(Spiro, Hill, & Stanner, 2024).
Supporting evidence:
Stakeholder meetings
Incremental reformulation of processed food products can contribute to sustainability goals by reducing resource use and environmental impacts over time.
(Stakeholder Meeting 14).
Supporting evidence: Workshops
“Encourage reformulation of processed foods and move consumers towards wholefoods.”
(Workshop 1).
Fully integrate environmental sustainability into economic frameworks for food policy
Economic and social considerations often take precedence over environmental sustainability in food, agriculture, and public health strategies. Greater policy focus is needed on agroecology to support low-input farming models.
Supporting evidence: Literature review
Lack of Integration into Agricultural Policy: Scotland’s agricultural subsidies still favour high-input conventional farming, with no clear financial support for agroecology. No explicit policy targets for agroecology within Scotland’s Land Use Strategy or Climate Action Plan.
(Lozada & Karley, 2022).
Supporting evidence:
Stakeholder meetings
–
Supporting evidence: Workshops
–
6. Evidence, Modelling, and Policy Implementation Issues
Enhance coherence across food-related policies and strategies
Stronger integration of research evidence and interlinked policy areas is needed to improve decision-making and coordination across food systems.
Supporting evidence: Literature review
Need for coordinated, holistic policy approaches: The report notes that effective policy implementation requires cross-departmental collaboration and a holistic approach, addressing both supply and demand aspects of the food system. Currently, policies in Scotland are fragmented, with limited integration across health, agriculture, and environmental sectors.
(Tregear, Morgan, Spence et al., 2024).
Supporting evidence:
Stakeholder meetings
Limited use of evidence in policymaking
(Stakeholder Meeting 8).
Supporting evidence: Workshops
“Bureaucracy-Business/Retail/Economics tape etc causing delays from evidence to policy.”
(Workshop 3).
Improve modelling of food systems and emissions pathways
Existing models do not fully capture the link between livestock production, dietary change, and emissions, leading to flawed policy assumptions. More precise emissions accounting is needed, recognising farming’s role in carbon sequestration.
Supporting evidence: Literature review
Argues that current emissions models oversimplify the role of livestock production by not accounting for regional variations, land-use differences, and dietary shifts. They claim policy assumptions based on these models often lead to misleading conclusions about sustainable diets and livestock impact.
(Houzer & Scoones, 2021).
Supporting evidence:
Stakeholder meetings
–
Supporting evidence: Workshops
“Always use net not gross emissions when modelling the environmental impact of meat. Farming is one of the few industries that sequesters carbon.“
(Workshop 1).
Strengthen the role of evidence in food policy development
Policymakers sometimes prioritise political feasibility over scientific recommendations, limiting evidence-based dietary policy development.
Supporting evidence: Literature review
–
Supporting evidence:
Stakeholder meetings
Policymakers sometimes lack awareness of dietary evidence or prioritise political feasibility over scientific recommendations.
(Stakeholder Meeting 10).
Supporting evidence: Workshops
“Knowledge-evidence-people.”
(Workshop 1).
Identify and address barriers to effective policy implementation
Regulatory and economic constraints slow the translation of research into policy action, affecting food business and retail sector participation.
Supporting evidence: Literature review
–
Supporting evidence:
Stakeholder meetings
–
Supporting evidence: Workshops
“Bureaucracy-Business/Retail/Economics tape etc causing delays from evidence to policy.”
(Workshop 1).
Boost research and innovation support for sustainable food systems
Greater investment in sustainable food technology research and industry collaboration is needed to support emissions reduction, dietary shifts, and agricultural innovation.
Supporting evidence: Literature review
Scotland must enhance investment in food research and technology to support the shift toward sustainable diets. The study emphasises integrating food technology research with industry-led sustainability initiatives.
Bellamy, Furness, Mills et al., 2023).
Supporting evidence:
Stakeholder meetings
There is limited emphasis on emerging technologies such as precision agriculture, alternative proteins, and sustainable farming practices, which could significantly reduce environmental impacts.
(Stakeholder Meeting 2).
Supporting evidence: Workshops
“Industry Research- small scale workshops and population interventions.”
(Workshop 4).
Shift policy focus from food supply to average consumption patterns
Policies based on average meat consumption may overlook disparities in consumption patterns across different population groups.
Supporting evidence: Literature review
Examines variations in meat consumption patterns across different socioeconomic groups in Scotland. The study finds that lower-income groups have limited access to plant-based alternatives, which affects dietary shifts. Policies addressing sustainability should consider economic disparities in meat consumption trends.
(McBey, McCormick, & Hussain, 2024).
Supporting evidence:
Stakeholder meetings
Current policies tend to focus on average consumption metrics, which may not adequately address disparities in meat consumption patterns.
(Stakeholder Meeting 2).
Supporting evidence: Workshops
–
Improve data collection and metrics for agroecological practices
The lack of monitoring on agricultural practices limits the development of evidence-based policies supporting agroecological change.
Supporting evidence: Literature review
Highlights gaps in monitoring agroecological practices in Scotland, particularly in assessing improving rural livelihoods through social
and economic outcomes (as well as environmental outcomes). The study calls for better data collection and policy support to enhance agroecological implementation.
(Lozada & Karley, 2022).
Supporting evidence:
Stakeholder meetings
–
Supporting evidence: Workshops
“Lack of data. Need to look at what is the actual impact of farming on climate in Scotland – what are the negatives we currently have and then learning from best practise to bring others on that journey. using real Scottish data to drive change. it should go wider than GHGs. it’s about biodiversity, habitat and plant protection and ecosystem, water use and flood management, soil quality, animal welfare etc.
baselining standards – over 170 farms there are some that are already at net zero, or close.”
(Workshop 3).
Address knowledge gaps in red meat production and consumption
Policy must better account for the diversity in red meat production systems and improve public understanding of meat reduction strategies.
Supporting evidence: Literature review
–
Supporting evidence:
Stakeholder meetings
–
Supporting evidence: Workshops
“Taking a nuanced approach to what has been called “red meat production” here: a farm with 1000 cattle fed on supplements and held indoors is not the same as a croft, a micro diary, or an integrated agroforestry system with 20 cows. Whilst some forms of red meat production will perfectly align with climate and nature restoration targets and score high on all these elements others will not.”
(Workshop 3).
Understand and overcome barriers to reducing meat consumption
Research is needed to identify the challenges consumers face when shifting away from meat consumption.
Supporting evidence: Literature review
Barriers included food neophobia, identity incongruence, habitual behaviour and practical difficulties. Strategies should focus on meat reduction, not exclusion, as completely removing meat from the diet was unpopular. As barriers and drivers differed with stage, we call for specialized campaigns. Consumers not intending to reduce meat intake could potentially be persuaded by climate awareness campaigns, and by promotion of small adaptations to familiar meals. Consumers intending to reduce meat intake may be prompted to do so by health awareness campaigns, changes to the choice architecture and increased availability of meatless meals.
(Hielkema & Lund, 2021).
Supporting evidence:
Stakeholder meetings
–
Supporting evidence: Workshops
“Research on why meat consumption changes are so hard for consumers.”
(Workshop 3).
Strengthen understanding of local food yields and market potential
Addressing the lack of data on community food production, informal markets, and small-scale retail contributions is necessary for better policy decisions.
Supporting evidence: Literature review
–
Supporting evidence:
Stakeholder meetings
–
Supporting evidence: Workshops
“What do we know about yield from community production versus supermarkets?
Western Isles (Eriskay; Berneray) has 3 Co-ops and 5 independents- egg sales likely down because of local informal markets.”
(Workshop 1).
Integrate food culture and heritage into policy design and evaluation
More effective ways to measure and incorporate food culture into policy are needed, as current frameworks lack clear metrics.
Supporting evidence: Literature review
–
Supporting evidence:
Stakeholder meetings
–
Supporting evidence: Workshops
“Food culture not a “SMART” target.
These concepts aren’t measurable and risk being overlooked by more measurable items.”
(Workshop 1).
Embed climate and sustainability audits into food policy frameworks
A stronger link between climate impact assessments and food taxation policies could improve sustainability outcomes.
Supporting evidence: Literature review
–
Supporting evidence:
Stakeholder meetings
–
Supporting evidence: Workshops
“Climate audit based on production; food tax-importing food from other countries.”
(Workshop 1).
Scale up support for agricultural innovation at farm and system levels
A clearer strategy for financing and scaling precision and regenerative farming would accelerate climate-smart practices.
Supporting evidence: Literature review
No clear mechanism for scaling up climate-smart technologies. The text highlights the importance of innovation (e.g., precision farming, regenerative agriculture) but lacks detail on:
How new technologies will be funded and adopted at scale. Which technologies will be prioritized for investment. How knowledge transfer will be ensured across different farm sizes and regions. Policy Gap: The government lacks a clear investment and implementation strategy for scaling up climate-smart agriculture technologies. Policy Need: Establish a national climate-smart agriculture fund and technology adoption grants for farmers.
(Scottish Government, n.d.a).
Supporting evidence:
Stakeholder meetings
–
Supporting evidence: Workshops
–
7. Policy resistance and political sensitivities
Develop strategies to manage resistance to livestock reduction policies
Ministers and industry stakeholders resist policies targeting livestock reduction due to economic concerns and public sensitivities. Addressing political tensions and developing strategies to gain support for dietary shifts remains a challenge.
Supporting evidence: Literature review
–
Supporting evidence:
Stakeholder meetings
Ministers and stakeholders resist policies due to economic concerns and public sensitivity.
(Stakeholder Meeting 4).
Supporting evidence: Workshops
“Red meat industry is one of the most profitable industries in Scotland-tensions, how do we sell this to Government to implement?”
(Workshop 1).
Political reluctance to introduce directive diet policy regulations
Concerns about public acceptability have made policymakers cautious about introducing more directive dietary regulations.
Supporting evidence: Literature review
–
Supporting evidence:
Stakeholder meetings
Political reluctance to enforce “Nanny-State” (sic) measures. Concerns over public backlash make policymakers hesitant to impose strict dietary regulations
(Stakeholder Meeting 1).
Supporting evidence: Workshops
–
Strengthen policy framing to improve public and stakeholder acceptance
The way policies are framed affects public and political acceptance, with resistance often tied to perceived losses.
Supporting evidence: Literature review
Discusses meat reduction policy framing more generally. Fewer than half this UK-representative sample supported meat reduction policies.
Framing measures as benefitting health vs. the environment did not change support.
Policies targeting meat were less supported than policies targeting unhealthy food.
Many respondents had no decided views about the acceptability of policies on meat.
(Pechey, Reynolds, Cook et al., 2022).
Supporting evidence:
Stakeholder meetings
Gains vs. losses framing influences policy acceptance: How policies are framed influences their acceptance, with resistance often linked to perceived losses.
(Stakeholder Meeting 1).
Supporting evidence: Workshops
–
Ensure fairness and equity in dietary policy design
Universal approaches may not account for cultural and socioeconomic diversity. Gradual adjustments to the food environment may ease resistance.
Supporting evidence: Literature review
–
Supporting evidence:
Stakeholder meetings
There are tensions surrounding blanket meat reduction policies, with a focus on targeting high consumers of meat to achieve incremental emissions reductions being seen as more effective.
(Stakeholder Meeting 13).
Supporting evidence: Workshops
“Not a blanket approach-gradually edit the food environment.”
(Workshop 1).
Create integrated policies linking agriculture, public health, and emissions reduction
Farmers may view their primary role as focused on food production, creating resistance to dietary and environmental policies. Stronger integration between agriculture, health, and climate policy is needed.
Supporting evidence: Literature review
–
Supporting evidence:
Stakeholder meetings
Farmers often do not consider public health issues within their scope, influencing resistance to health-driven dietary policies.
(Stakeholder Meeting 9).
Supporting evidence: Workshops
“Linking farmers and public health bodies e.g., local authorities.”
(Workshop 4).
Address ideological resistance to reducing red and processed meat consumption
Deep-rooted cultural norms and traditions contribute to differing perspectives on dietary change, particularly in rural communities.
Supporting evidence: Literature review
Cultural reluctance to consume plant-based foods and reduce meat consumption will slow progress and likely negatively feedback to changes in the food environment. There are positive findings as well, the increased declared willingness to change and the recent uptick in media coverage suggest that the transition to sustainable diets could accelerate, but whether it will happen in time will be a matter of enhanced interaction between policymakers, the media, and public.
(Cleland, McBey, Darlene et al., 2025).
Supporting evidence:
Stakeholder meetings
Strong cultural attachments to traditional diets, particularly in rural communities, create barriers to dietary change.
(Stakeholder Meeting 9).
Supporting evidence: Workshops
–
Overcome cultural and historical barriers to agricultural transition
Farming is deeply embedded in Scottish identity, with many farmers viewing themselves as stewards of the land. Historical events such as the Highland Clearances continue to shape land use patterns and influence perceptions of food and farming policy today
Supporting evidence: Literature review
Explores how animal agriculture (salmon farming) is deeply embedded in Scottish cultural identity, emphasising its historical, economic, and symbolic significance.
(Rubio Ramon, 2024).
Supporting evidence:
Stakeholder meetings
Farming is deeply embedded in cultural identity, often viewed as a birthright.
(Stakeholder Meeting 11).
Supporting evidence: Workshops
–
Resolve conflicts between climate policy and current farming priorities
Farmers primarily focus on food production and traditional practices, often leading to conflicts with environmental policies aimed at sustainability and emissions reduction.
Supporting evidence: Literature review
Farmer attitudes towards sustainable farming actions in rural Wales: Key barriers included time and cost to implement sustainable farming actions, availability of long-term financial valuation for ecosystem services, occurrence of extreme weather events, and presence of tenanted land.
(Follett, Davis, Wilson et al., 2024).
Supporting evidence:
Stakeholder meetings
There is an ongoing tension between environmental policies focused on sustainability and emissions reduction, and farmers’ primary focus on food production and maintaining traditional agricultural practices.
(Stakeholder Meeting 11).
Supporting evidence: Workshops
–
Address the practical and political challenges of fiscal measures (e.g., taxes, payments)
Discussions on taxation policies, such as a red meat tax, remain controversial due to concerns over fairness, public acceptability, and potential economic impacts on vulnerable populations.
Supporting evidence: Literature review
–
Supporting evidence:
Stakeholder meetings
Discussions around implementing fiscal measures, such as a red meat tax, have emerged as potential levers for influencing dietary change. While some fiscal levers, such as taxes on red meat, are being debated, their design requires careful attention to fairness, public acceptability, and economic implications.
(Stakeholder Meeting 5).
Supporting evidence: Workshops
“Unpopularity of taxes on any foods.”
(Workshop 1).
Embrace and integrate diverse stakeholder perspectives in policy development
Scottish Government and policymakers should engage constructively with disagreement and differing evidence bases among stakeholders.
Supporting evidence: Literature review
–
Supporting evidence:
Stakeholder meetings
–
Supporting evidence: Workshops
“Conveners (e.g. Scottish Government) need to get more comfortable with disagreement, different evidence bases among stakeholders.”
(Workshop 4).
8: Public involvement in sustainable food policy
Strengthen citizen engagement in food policy development
Public consultation mechanisms, including in the Good Food Nation (Scotland) Act, provide limited opportunities for meaningful citizen participation beyond advisory input, particularly among younger people. Existing public engagement structures in food and farming policy are weak, reducing community influence in decision-making.
Supporting evidence: Literature review
–
Supporting evidence:
Stakeholder meetings
Limited youth inclusion in policy discussions: Limited institutional mechanisms exist to incorporate youth perspectives into food and climate policy discussions, despite high climate awareness among younger populations.
(Stakeholder Meeting 4).
Supporting evidence: Workshops
–
Enhance local empowerment and participation in food system governance
Addressing the disconnect between policy and practice by streamlining local empowerment mechanisms, improving access to timely funding, and learning from crofting practices to support sustainable food systems.
Supporting evidence: Literature review
–
Supporting evidence:
Stakeholder meetings
–
Supporting evidence: Workshops
“Disconnect between areas and policy – big issue. The mechanism to provide the leavers for local empowerment is tedious and complicated. Must be simplified and shortened in terms of time. Need access to funding straight away when opportunities arise. This would avoid silos and increase connectivity e.g. land reform policy.
Need community to take on land and community need funding to do so. There is something about learning from crofting practices in the context of a sustainable food system. Some challenges are related to the free market and the crofting regulation, the right to buy and the lack of regulation.”
(Workshop 4).
9. Scotland in the global policy landscape
Incorporate global best practices into Scottish food policy
Further examining successful international policies could offer valuable insights for Scotland’s approach to meat reduction and sustainable diets.
Supporting evidence: Literature review
Analysis of successful policies aimed at reducing meat consumption in Denmark, Sweden, Germany, the Netherlands, and the UK. Key findings: Meat taxes and subsidy removals were effective in reducing meat consumption without major public resistance. Public acceptability increased when revenues from meat taxes were reinvested into sustainable food systems.
Combining fiscal measures with consumer awareness campaigns led to more effective dietary shifts.
(Kmetkova, Zverinova, Scasny et al., 2024).
Supporting evidence:
Stakeholder meetings
–
Supporting evidence: Workshops
–
Appendix H: Extended Economic analysis: Areas for further policy development and supporting evidence
Key Theme
Area For Policy Development
1: Financial Incentives and Risk Mitigation for Sustainable Food Production
Strengthen financial incentives for low-carbon food production
Policies lack regulatory and financial mechanisms to support low-carbon food production, scale up innovative technologies, and integrate climate adaptation strategies. Current financial support favours emissions-intensive farming, and financial relief programs for extreme weather risks are absent.
Supporting evidence: Literature review
No explicit agroecology support in agricultural payments
The Scottish farm payment system does not prioritise agroecological transitions.
Unlike the EU’s Farm-to-Fork Strategy, Scotland lacks clear pesticide reduction, soil health improvement, or biodiversity restoration targets linked to financial incentives.
(Lozada, & Karley, 2022).
Supporting evidence:
Stakeholder meetings
Supporting evidence: Workshops
“Not regenerative food production happening. Take Edinburgh – there is Lauriston community farm – a 100acre site. It would take 200 of these farms to produce enough food for population of Edinburgh…Identify key sites for more food production and increase awareness of the risks to our food sector. Increase resources put towards the issue.”
(Workshop 1).
Compensate farmers for delivering ecosystem services
Financial incentives for biodiversity and climate protection remain underdeveloped, limiting green investment and market development.
Supporting evidence: Literature review
Examines how financial incentives for biodiversity and climate protection in Scotland remain inadequate, limiting farmer participation in sustainability initiatives. Financial incentives under the CAP have been insufficient to encourage widespread adoption of biodiversity-supporting measures.
Farmers prioritize economic viability over environmental incentives, leading to low engagement in voluntary sustainability schemes. Scotland lags behind other EU countries, such as Austria and the Netherlands, in providing effective support and financial rewards for climate-friendly farming.
(Brown, Kovacs, Zinngrebe et al, 2019).
Supporting evidence:
Stakeholder meetings
–
Supporting evidence: Workshops
“Need to pay producers and farmers for the non-food products they produce – no financial incentive to help protect biodiversity and climate.
does seem to be demand for this, biodiversity net gain, or green investment
the financial model doesn’t work yet for
woodland carbon code is not accessible for commercial projects anymore
there was a boom for carbon measure bio net gain, but no longer, markets have not developed yet certainly in Scotland.”
(Workshop 3).
Scale up the use of alternative proteins in animal feed
Microbial proteins, insect- and hemp-based animal feeds lack commercial scaling support, restricting their ability to replace imported soy and improve sustainability.
Supporting evidence: Literature review
Limited support for scaling alternative protein animal feeds. Microbial proteins and insect-based feeds remain niche due to insufficient commercial scaling to reduce reliance on imported soy and enhance sustainable feed alternatives.
(Scottish Government, 2023).
Many countries across Europe and Asia have updated their legal frameworks to capitalise on the significant benefits that industrial hemp offers. In contrast, development of the hemp sector in Scotland has been slow, largely due to restrictive regulations. Industrial hemp can sequester more carbon dioxide than many conventional crops, enhance soil biodiversity, remove toxins through phytoremediation, and act as a natural insecticide and pesticide. It is also a valuable source of protein, dietary fibre, essential micronutrients, and bioactive phytochemicals.
(Dogbe, Revoredo-Giha & Russell, 2024).
Supporting evidence:
Stakeholder meetings
–
Supporting evidence: Workshops
–
Support farmers in transitioning to agroecological and climate-resilient practices
Farmers face financial and technical challenges in transitioning to sustainable agricultural systems. High upfront costs prevent the adoption of key technologies such as biochar application and precision livestock farming tools.
Supporting evidence: Literature review
Slow adoption of low-emission farming practices:
Farmers face high upfront costs for adopting new technologies, such as animal sensors and biochar application. Targeted financial incentives or support could improve uptake.
(Scottish Government, 2023).
Supporting evidence:
Stakeholder meetings
–
Supporting evidence: Workshops
–
Promote economic and agricultural equity across the food system
Addressing the regressive nature of food taxes by redirecting financial resources toward more sustainable farming practices.
Supporting evidence: Literature review
Implementing both tax policies and using the resulting revenue to subsidise consumers—particularly low-income households—can create a more equitable and less regressive public policy approach. By redistributing income through targeted payments or support schemes, this strategy helps mitigate the financial burden on vulnerable groups while still incentivising healthier and more sustainable food choices.
(Nneli, Dogbe & Revoredo-Giha, 2023).
Supporting evidence:
Stakeholder meetings
–
Supporting evidence: Workshops
“Taxes are regressive-redirect subsidies to more sustainable farming.”
(Workshop 1).
Address perceptions surrounding the economic viability of sustainable farming choices
Enduring perception that beef farming is more profitable than vegetable crop production, influencing farmer choices and limiting opportunities for community wealth-building.
Supporting evidence: Literature review
–
Supporting evidence:
Stakeholder meetings
–
Supporting evidence: Workshops
“For farmers: cows are more profitable than cabbage, so beef farming might be better for (e.g.) community wealth building.”
(Workshop 4).
Reform agricultural financial support to align with sustainability goals
Current financial support continues to prioritise high-emission livestock farming, without clear incentives for climate-friendly production or crop diversification.
Supporting evidence: Literature review
Scotland’s agricultural subsidies continue to favour high-emission livestock farming, with no clear mechanisms in the Good Food Nation Act to incentivise climate-friendly farming, diversify toward low-carbon crops, or enhance carbon footprint labelling for consumers.
(Brennan, 2023).
Supporting evidence:
Stakeholder meetings
–
Supporting evidence: Workshops
–
Assess and recognise the economic value of grazing land
Despite Scotland’s extensive grazing land, concerns remain about the economic efficiency of meat production relative to its high cost.
Supporting evidence: Literature review
–
Supporting evidence:
Stakeholder meetings
Economic value of grazing land: Despite abundant grazing land in Scotland and the UK, the relatively high cost of meat raises concerns about economic efficiency.
(Stakeholder Meeting 8).
Supporting evidence: Workshops
–
Manage the rural economic impacts of reducing livestock numbers
Reducing livestock farming without strategic policy support could threaten the financial stability of meat producers and contribute to rural depopulation.
Supporting evidence: Literature review
–
Supporting evidence:
Stakeholder meetings
Impact of livestock reduction on rural communities: Livestock reduction policies may exacerbate rural depopulation due to economic reliance on agriculture.
(Stakeholder Meeting 6).
Supporting evidence: Workshops
–
Address price dynamics in meat and dairy markets
Higher red meat prices can sometimes drive increased production, complicating efforts to lower consumption.
Supporting evidence: Literature review
–
Supporting evidence:
Stakeholder meetings
Price dynamics and production response: Increases in red meat prices can lead to higher production levels, complicating efforts to reduce consumption.
(Stakeholder Meeting 14).
Supporting evidence: Workshops
–
Improve the affordability and accessibility of meat and dairy alternatives
High prices for plant-based alternatives, driven by supermarket pricing and financial support structures, limit consumer accessibility.
Supporting evidence: Literature review
Price is a major factor preventing Scottish consumers from switching to plant-based meat.
Subsidising plant-based alternatives or taxing meat products were ranked as potential solutions.
(McBey, Sánchez, McCormick et al., 2024).
Supporting evidence:
Stakeholder meetings
Higher markup on plant-based food in retail: Plant-based foods often carry a premium price, limiting affordability for many consumers.
(Stakeholder Meeting 2).
Supporting evidence: Workshops
“We assess that there is currently a price-premium on especially convenience alternatives to meat and dairy. This has many reasons, but people are clear that it will need to be addressed.”
(Workshop 3).
2. Trade and Supply Chain Misalignment with Climate Goals
Align trade and supply chains with climate goals
Scotland’s food trade policies do not fully integrate net-zero ambitions, increasing the risk of offshoring environmental impacts. Expanding sustainable supply chains requires investment in skills, infrastructure, and collaborative mechanisms.
Supporting evidence: Literature review
Export Dependencies: Highlights risks of offshoring emissions by reducing local production but offers limited strategies for linking domestic production to dietary transitions.
(Thomson, Moxey & Hall, 2021).
Supporting evidence:
Stakeholder meetings
Food imports and emissions: Import reliance complicates carbon accounting and weakens domestic economic resilience.
(Stakeholder Meeting 2).
Supporting evidence: Workshops
“Offsetting/Offshoring of emissions.”
(Workshop 1).
Address procurement barriers for local and small-scale producers
Large multinational suppliers dominate public contracts, limiting opportunities for local and sustainable food producers.
Supporting evidence: Literature review
Current public procurement policies favour large multinational suppliers, making it difficult for local producers to compete for contracts. This limits market access for regional food systems and reduces opportunities to support sustainable, locally sourced food.
(Scottish Government, 2024).
Supporting evidence:
Stakeholder meetings
–
Supporting evidence: Workshops
–
Strengthen livestock supply chain infrastructure
Transport, distribution, and processing capacity shortages, including a lack of small abattoirs, create challenges for small-scale farmers.
Supporting evidence: Literature review
Rural and island regions face transport and distribution challenges, making it less efficient to get food to markets. Processing capacity is limited: Lack of small abattoirs and local processing facilities hinders small farmers from scaling up.
(Scottish Government, 2024).
Supporting evidence:
Stakeholder meetings
–
Supporting evidence: Workshops
–
Encourage consumer support for domestic agriculture
Strengthening links between primary producers and public-sector buyers can improve market access and resilience.
Supporting evidence: Literature review
–
Supporting evidence:
Stakeholder meetings
–
Supporting evidence: Workshops
“Links between primary producers and public sector…Opportunities for local producers to supply public sector.”
(Workshop 1).
Enhance school meals by funding local and sustainable procurement
Initiatives like Food for Life have the potential to improve the quality and sustainability of school food. However, uptake is often limited by financial constraints at the local authority level, where budgets are already stretched and competing priorities make it difficult to invest in more sustainable food procurement.
Supporting evidence: Literature review
–
Supporting evidence:
Stakeholder meetings
–
Supporting evidence: Workshops
“Using school dinners for quality
Much better now in terms of options.
E.g., food for life in East Ayrshire- but financial pressures has been hammered.
Transferring circa £10 million from agriculture budget to school food budget to support local procurement policies.”
(Workshop 1).
Balance business influence in food policy decisions
Food policy decision-making often prioritises business interests over sustainability and inclusivity. The limited integration of industry sustainability commitments weakens efforts to reduce food system emissions.
Supporting evidence: Literature review
Decision-making processes privilege the business sector, sidelining civil society concerns and limiting democratic participation in food policy development
Challenges in engaging food retailers: Difficulty in engaging with retailers and industry stakeholders hinders sustainable food practices.
(Stakeholder Meeting 8).
Supporting evidence: Workshops
“The role of the food industry: their involvement in research, funding of research… Industrial lobbying is strong.”
(Workshop 4).
Expand market access for agroecological and small-scale producers
Small-scale agroecological producers face challenges accessing mainstream markets dominated by large retailers.
Supporting evidence: Literature review
Limited financial incentives:
Most environmental incentive schemes do not explicitly support agroecological transitions.
Many agroecological farmers self-fund their practices, creating financial vulnerability.
(Lozada & Karley, 2022).
Supporting evidence:
Stakeholder meetings
Linking producers and consumers: Policies and markets often fail to effectively connect producers with consumers, limiting market efficiency.
(Stakeholder Meeting 3).
Supporting evidence: Workshops
–
Minimise emissions from imported food products
Policies targeting dietary change may drive increased food imports, undermining local sustainability. In general, meat from countries with high deforestation or intensive farming may have a higher footprint than Scottish-produced meat.
Supporting evidence: Literature review
This case study applied a carbon displacement framework to hypothetical carbon policies affecting UK beef production. It found that financial pressure to cut emissions could force some UK producers out of business, potentially leading to increased beef imports from countries with higher emissions, thereby raising global emissions. While modest emission reductions are possible through cost-effective practices, deeper cuts would likely require greater financial and technical support. The findings suggest further analysis of UK beef production is needed.
(Department for Food, Rural and Environmental Affairs (Defra), 2024).
Supporting evidence:
Stakeholder meetings
Consumption-focused policies risk increasing imports rather than reducing global emissions. Policies targeting consumption may inadvertently increase imports, undermining local sustainability.
(Stakeholder Meeting 2).
Supporting evidence: Workshops
–
Balance demand-side and supply-side strategies in food policy
Over-reliance on demand-side measures without sufficient supply-side interventions limits systemic change in sustainable food systems.
Supporting evidence: Literature review
–
Supporting evidence:
Stakeholder meetings
Overemphasis on demand-side strategies: Insufficient focus on supply-side measures weakens the resilience of sustainable food systems.
(Stakeholder Meeting 11).
Supporting evidence: Workshops
–
Balance domestic food standards with pressures from import competition
High food standards increase production costs, but low-cost imports undermine sustainability efforts. Trade strategy should prevent lower-welfare imports from undercutting UK farmers.
Supporting evidence: Literature review
–
Supporting evidence:
Stakeholder meetings
–
Supporting evidence: Workshops
“Cost of produce will increase with greater standards and requirements, and then we see imports coming in that are favoured for being cheap, not just meat but cereals too. when supply chains get too long, its harder to see where its coming from… e.g. horse meat scandal
need shorter supply chain and more locally produced food.”
(Workshop 3).
Address the impacts of resource-intensive food production
The food industry prioritises high-value convenience foods with inefficient transportation systems, reducing sustainability.
Supporting evidence: Literature review
–
Supporting evidence:
Stakeholder meetings
Resource-intensive convenience food production: The industry favours low-volume, high-value, resource-intensive convenience foods, and inefficient transportation, reducing sustainability.
(Stakeholder Meeting 11).
Supporting evidence: Workshops
–
Enhance food system resilience to global and domestic shocks
Structural vulnerabilities in food imports, land control, and export distribution impact local food security and community wealth-building.
Supporting evidence: Literature review
–
Supporting evidence:
Stakeholder meetings
–
Supporting evidence: Workshops
“Chatham House report – Choke points identified in red/amber/green rating. Current barrier is imported food. It seems we have enough land to address our vulnerability, but the control of the land is an issue. This includes food for animals and fertilizers and exported goods not going to local areas which might not contribute to community wealth building.”
(Workshop 4).
Manage carbon leakage risks in livestock trade and production
Carbon taxes on livestock risk increasing imports and causing carbon leakage without complementary trade adjustments.
Supporting evidence: Literature review
There is a significant risk of carbon leakage resulting from import substitution, where domestic efforts to reduce emissions in meat production may inadvertently lead to increased imports from countries with more carbon-intensive farming practices. Currently, there is no clear mitigation strategy in place to address this issue, which could undermine national climate targets and shift environmental impacts abroad rather than reducing them overall.
(Scottish Parliament, n.d.b).
Supporting evidence:
Stakeholder meetings
–
Supporting evidence: Workshops
–
Promote sustainable practices in supermarket and retail food supply
Since most food decisions are made in supermarkets, responsible retail practices are crucial for shifting consumer demand toward sustainability.
Supporting evidence: Literature review
Sustainability-oriented retailers can use innovative behavioural tools to promote healthier and climate-friendlier foods (such as vegetables) while meeting the “triple bottom line”. A real-life supermarket trial in Denmark tested if multi-layered nudges can increase the purchase of fruit and vegetables. The intervention led to small increases in sales. These findings showcase the possibility that supermarkets, in principle, have agency and ability to nudge consumers towards more sustainable diets.
(Bauer, Aarestrup, Hansen, et al., 2022).
Supporting evidence:
Stakeholder meetings
–
Supporting evidence: Workshops
“Supermarkets are where vast majority of decisions are made so we need to get that side of retail right.”
(Workshop 3).
Develop sustainable supply chain partnerships
Strengthening collaborations for key crops and improving processing infrastructure can enhance food system sustainability.
Supporting evidence: Literature review
–
Supporting evidence:
Stakeholder meetings
–
Supporting evidence: Workshops
“Supply chains for human consumption- SAOS-Bere Barley; processing facilities-peas and beans.”
(Workshop 1).
Align market demand with sustainable food choices
Consumer preferences, such as demand for sweeter apples, shape market dynamics and need to be considered in food system planning.
Supporting evidence: Literature review
Found that of the three perceptions measured, consumers derive the most utility out of how they perceive a product’s taste, rather than how healthy or safe they believe the product to be.
(Malone & Lusk, 2017).
Supporting evidence:
Stakeholder meetings
–
Supporting evidence: Workshops
“Demand-market wants sweeter apples.”
(Workshop 1).
3. Funding Gaps for Food Systems
Ensure stable funding for urban agriculture
Urban agriculture development is constrained by unstable, short-term funding, limiting its potential contribution to sustainable diets and climate goals.
Supporting evidence: Literature review
Urban agriculture (UA) currently relies heavily on short-term or temporary funding streams, which can limit its capacity to scale and sustain operations. This lack of stable, long-term investment undermines its potential to contribute meaningfully to long-term dietary change, local food security, and climate resilience. A more consistent and strategic funding approach is needed to unlock the full benefits of UA as part of a sustainable food system.
(White & Bunn, 2017).
Supporting evidence:
Stakeholder meetings
–
Supporting evidence: Workshops
–
Secure long-term food budgets in public institutions
Dedicated, ring-fenced funding is needed for food provision in schools and hospitals to support quality and sustainability.
Supporting evidence: Literature review
–
Supporting evidence:
Stakeholder meetings
Promoting plant-based menus through procurement: Public procurement policies offer significant opportunities to promote plant-based menus in public institutions such as schools, hospitals, and government offices. Effectively leveraging these regulations could support sustainability goals and encourage healthier dietary habits.
(Stakeholder Meeting 1).
Supporting evidence: Workshops
“Budget and funding
Food budgets not ring fenced in schools/hospitals”
(Workshop 1).
Strengthen support for community-based food initiatives and the third sector
Long-term funding is needed to sustain community-led food programs, address health inequalities, and support vulnerable groups. Over-reliance on overstretched third-sector organisations risks undermining their role in strengthening local food networks.
Supporting evidence: Literature review
–
Supporting evidence:
Stakeholder meetings
–
Supporting evidence: Workshops
“Lack of long-term funding for community/voluntary organisations.”
(Workshop 1).
Subsidise public dining to promote health and community wellbeing
Affordable, healthy meals outside the home can encourage better eating habits, inspire home cooking, and foster social dining spaces.
Supporting evidence: Literature review
–
Supporting evidence:
Stakeholder meetings
Lack of nutritional and environmental standards for out-of-home food: There is a lack of comprehensive regulations governing the nutritional and environmental standards of food sold in restaurants, cafes, and takeaway services. This regulatory gap limits the effectiveness of policy interventions aimed at fostering healthier and more sustainable dietary habits.
(Stakeholder Meeting 13).
Supporting evidence: Workshops
“Education – aspects of bringing nutritious food into schools as well as teaching children about healthy foods
Public diners – we subsidise everything else! So why do we not subsidise food. Work with culture around eating out of the home to provide healthy and affordable meals for everyone. May support inspiring people re cooking at home, as well as providing a social space.”
(Workshop 4).
4. Consumer-Focused Fiscal Policies and Incentives
Address VAT disparities for plant-based foods
Some plant-based meat alternatives (processed or prepared products such as hot takeaway food) are subject to VAT. Extending VAT exemptions could encourage meat reduction.
Supporting evidence: Literature review
Some plant-based meat alternatives are not VAT-exempt. This disparity in fiscal treatment creates a financial barrier to choosing more sustainable and lower-emission protein sources. Extending VAT exemptions or other financial incentives to plant-based meat alternatives could encourage greater consumer uptake, support dietary shifts aligned with climate and health goals, and promote market growth in the plant-based sector.
(Kennedy, Clark, Stewart et al., 2025).
Supporting evidence:
Stakeholder meetings
–
Supporting evidence: Workshops
–
Reduce economic dependence on alcohol and processed food sectors
Scotland’s food system is heavily reliant on the economic contributions of alcoholic beverages and processed foods, raising concerns about long-term sustainability.
Supporting evidence: Literature review
–
Supporting evidence:
Stakeholder meetings
–
Supporting evidence: Workshops
“Food systems are linked to economic opportunities for people in Scotland – but our food industry is heavily tied to alcoholic drinks and processed foods.”
(Workshop 4).
Internalise environmental and health costs within the food system
The current food system externalises costs like healthcare burdens from poor diets and environmental degradation onto society, rather than incorporating them into economic policies.
Supporting evidence: Literature review
Supporting evidence:
Stakeholder meetings
Externalisation of costs: The current food system externalises many economic costs, such as healthcare expenses linked to poor diets and environmental degradation costs, which are not adequately accounted for in economic policies.
(Stakeholder Meeting 11).
Supporting evidence: Workshops
–
Manage dietary shifts resulting from red meat reduction policies
Reducing red meat consumption may lead to increased demand for white meat and dairy, with potentially conflicting environmental and health outcomes. Negative perceptions of plant-based alternatives could also limit dietary shifts.
Supporting evidence: Literature review
–
Supporting evidence:
Stakeholder meetings
Substitution of red meat and perceptions of plant-based alternatives: Red meat reduction policies may unintentionally drive demand toward other meat products, such as white meat, due to negative perceptions of the healthiness of plant-based alternatives.
(Stakeholder Meeting 13).
Supporting evidence: Workshops
–
Prevent over-reliance on ultra-processed foods in sustainable diet transitions
Moving away from fresh meat could increase reliance on ultra-processed alternatives, posing health and sustainability concerns.
Supporting evidence: Literature review
–
Supporting evidence:
Stakeholder meetings
–
Supporting evidence: Workshops
“There’s a risk that moving away from fresh meat means to a turn to ultra-processed food.”
(Workshop 4).
Balance growth in the plant-based sector with sustainability objectives
There is a risk that increased plant-based food demand could lead to more industrial production while factory farming persists.
Supporting evidence: Literature review
Increasing demand for plant-based diets in the UK, including Scotland, may drive industrialized food production rather than promoting sustainable agriculture.
As plant-based food demand rises, major food corporations may scale up industrial production, leading to more monoculture farming and intensification.
(Rhymes, Stockdale & Napier, 2023).
Supporting evidence:
Stakeholder meetings
–
Supporting evidence: Workshops
“Risk that promoting plant-based food leads to an increase in industrial production of plant-based foods alongside continued factory farming.”
(Workshop 4).
5. Structural and Social Barriers in Agricultural transition
Assess the viability of agroecological farming models
Limited research on the financial and social sustainability of agroecology prevents evidence-based policymaking.
Supporting evidence: Literature review
There is currently no comprehensive cost-benefit analysis comparing agroecological farming with conventional agricultural systems in the Scottish context. This lack of evidence limits policymakers’ and producers’ ability to make informed decisions about transitioning to more sustainable practices. In particular, there is a need for robust financial models that capture the long-term economic, environmental, and social resilience benefits of agroecology, including reduced input costs, improved soil health, biodiversity gains, and greater climate adaptability. Addressing this evidence gap is essential for supporting policy development and encouraging wider adoption of agroecological approaches.
(Lozada & Karley, 2022).
Supporting evidence:
Stakeholder meetings
–
Supporting evidence: Workshops
–
Strengthen support for rural and agricultural workers
Inadequate policies limit rural workers’ access to land, resources, and affordable housing, creating barriers to sustainable food system employment.
Supporting evidence: Literature review
Current policies fall short in addressing structural barriers faced by rural agricultural workers, particularly in relation to secure access to land, essential resources, and affordable housing. These challenges limit opportunities for participation in sustainable food production and contribute to rural inequality. To support a just transition in the food system, policies must more effectively promote equitable access and create enabling conditions for rural livelihoods, especially for new entrants and marginalised communities.
(Centre for Climate and Social Transformations (CAST), 2024).
Supporting evidence:
Stakeholder meetings
–
Supporting evidence: Workshops
–
Develop economic transition strategies for the livestock sector
A clear economic transition strategy is needed to support industries affected by reduced red meat and dairy consumption. Triple Win economic models could help guide policy by capturing co-benefits across community wellbeing, public health, and cost savings.
Supporting evidence: Literature review
Triple win economic models are frameworks or strategies designed to deliver simultaneous benefits (or “wins”) across three key domains—usually economic, environmental, and social outcomes. These models are particularly popular in sustainability, public policy, and development sectors.
(Ellis & Tschakert, 2019).
Supporting evidence:
Stakeholder meetings
–
Supporting evidence: Workshops
“There is a gap in the development of triple win economic modelling which policy and decision makers can rely on and inform how the money best should be spent. An example is a study made in England on “broken pavements”, the cost claims by people, the cost avoidance of the council not being held accountable against the claims against the total cost implication for NHS i.e. NHS had to pick up the cost because of people hurt by damaged pavement. Community growing and the cost avoidance of seeking health care services is missing.”
(Workshop 1)
Support new entrants to farming and food production
Rising land costs and financial barriers make it difficult for new farmers to secure land and adopt sustainable practices.
Supporting evidence: Literature review
Limited financial incentives:
Most environmental incentive schemes do not explicitly support agroecological transitions.
Many agroecological farmers self-fund their practices, creating financial vulnerability.
Access to land tenure and financial support is a major barrier for new entrants, despite them being more likely to adopt agroecology.
Lozada & Karley, 2022).
Supporting evidence:
Stakeholder meetings
Land ownership and affordability issues: Competition and rising land costs are pricing out farmers, limiting opportunities for sustainable agricultural transitions.
(Stakeholder Meeting 1).
Supporting evidence: Workshops
–
Build a resilient and skilled workforce across the food sector
To address labour shortages in the food sector, policies should improve migration pathways, expand skills development, and offer incentives to attract and retain workers.
Supporting evidence: Literature review
–
Supporting evidence:
Stakeholder meetings
–
Supporting evidence: Workshops
“Workforce strategies, skills development and incentives to overcome labour shortages and create attractive career opportunities.”
(Workshop 1).
Appendix I: Extended Social analysis: Areas for further policy development and supporting evidence
Key Theme
Area For Policy Development
1. Food Access and Affordability Inequalities
Ensure equitable access to sustainable and healthy diets
Lower-income, rural, and marginalised groups face financial and logistical barriers to adopting sustainable diets. Existing policies and financial support do not adequately ensure food affordability, while tax-based approaches like red meat levies lack protections for vulnerable households.
Supporting evidence: Literature review
Public awareness of sustainable diets and their environmental impacts has increased over the past decade, but this growth is uneven across socioeconomic groups. Higher-deprivation (HD) groups face greater barriers, including availability and access, cost concerns and scepticism about health and environmental benefits, limiting their willingness to adopt sustainable dietary practices.
(Food Standards Scotland (FSS), 2021a).
Supporting evidence:
Stakeholder meetings
Low-income and rural communities face higher food costs, limited access to affordable healthy food, and reduced resilience to economic shocks.
(Stakeholder Meeting 4).
Supporting evidence: Workshops
“Food insecurity also discussed – cost of healthy food as a barrier, and food banks often do not allow a healthy diet.”
(Workshop 4, Group 2).
Enhance inclusion and participation in local food systems
Food systems should be designed to accommodate diverse needs, including time constraints, geographic location, and preferred access points.
Supporting evidence: Literature review
Suggests attending to a range of consumer-related changes:
Medium-term actions: The nature of consumer demand and its capacity to adjust
to social and cultural expectations in the light of market
realities and policy priorities.
The national, devolved, regional, local dimensions of food
and its role as a determinant of identity.
The desired consumer outcomes including the nature of a
sustainable diet.
The role of regulation, ‘consumer choice editing’ and
marketing in shaping consumer choice
A description of the EU/UK’s ‘sustainable consumer diet’.
The development of communication and education
strategies to engage the public on key food issues.
(Ambler-Edwards, Bailey, Kiff et al., 2009).
Supporting evidence:
Stakeholder meetings
Consumers may not feel fully in control of their dietary choices due to economic, social, and cultural constraints.
(Stakeholder Meeting 9).
Supporting evidence: Workshops
“How do people want to interact with this system? Time poor, etc. Geography, Creating the spaces that people want to access the food they need at their location.”
(Workshop 1).
Increase the availability of affordable, healthy food options outside the home
Policies insufficiently address affordability and accessibility of healthier out-of-home food choices, disproportionately affecting lower-income consumers.
Supporting evidence: Literature review
There is a persistent gap in policy and practice regarding the affordability and accessibility of healthier food options in out-of-home (OOH) settings, such as restaurants, cafés, takeaways, and workplace canteens. While public health initiatives emphasise the importance of nutritious diets, current policies often fall short in ensuring that healthier choices are both financially viable and widely available across different socioeconomic groups.
Food Standards Scotland (FSS), 2023).
Supporting evidence:
Stakeholder meetings
There is a lack of comprehensive regulations governing the nutritional and environmental standards of food sold in restaurants, cafes, and takeaway services. This regulatory gap limits the effectiveness of policy interventions aimed at fostering healthier and more sustainable dietary habits.
(Stakeholder Meeting 13).
Supporting evidence: Workshops
–
Improve access to cooking facilities, skills, and food literacy
Households with limited cooking equipment, high energy costs, or inadequate storage face difficulties in preparing sustainable meals.
Supporting evidence: Literature review
The study investigates how residents in energy-efficient, affordable housing in Scotland experience their kitchen environments. With a national push toward low-carbon housing, the paper explores whether energy-efficient designs support or constrain occupants in their daily cooking and living practices. Architectural Design, Building Services & Energy Use, fixtures and storage affected diet and had social and psychological impacts.
(Foster & Poston, 2024).
Supporting evidence:
Stakeholder meetings
Households with limited access to proper cooking equipment, affordable energy, or sufficient food storage options face challenges in preparing healthy, sustainable meals.
(Stakeholder Meeting 8).
Supporting evidence: Workshops
“Appeal:
Social and cultural barriers/appeal of healthy food
Including skills and knowledge and time poor
Less links with food production and consumption
Place of food in society (value not just cost).”
(Workshop 1).
Address the psychological, cultural, and economic barriers influencing food choices
Financial stress, mental health challenges, and economic insecurity impact the ability to make sustainable food choices, with food often serving as a coping mechanism.
Supporting evidence: Literature review
The study identified links between kitchen environments and unintended consequences of their design on occupants. These included architectural issues such as draughts, limited natural light, noisy or ineffective ventilation systems, non-opening kitchen windows, and difficulties in placing appliances. Not all findings were exclusive to low-energy homes, highlighting the need for targeted research to explore these issues further. A deeper understanding is required to assess whether tenants’ adaptive behaviours may influence their diet and affect their respiratory, physical, and mental health.
(Foster & Poston, 2024).
Supporting evidence:
Stakeholder meetings
Mental health, stress, and economic precarity influence people’s ability to make sustainable food choices, with food often used as a coping mechanism in challenging circumstances.
(Stakeholder Meeting 1).
Supporting evidence: Workshops
–
2. Availability of Healthier and Sustainable Food Options
Expand access to alternative proteins in mainstream food environments
The availability of meat-free options remains low in common food products, with only 12% of ready-to-eat sandwiches in the UK being meat-free.
Supporting evidence: Literature review
The food service sector is leading change by rapidly expanding meat-free sandwich options—34% of its range is now meat-free, with half of those being plant-based. In contrast, major food retailers are falling behind, with some even reducing their meat-free offerings since 2019. Notably, alternative proteins as fillings have risen by 620% since 2019, reflecting increased investment in this area. Among the big supermarkets, Sainsbury’s has improved its plant-based range, while Tesco, Morrisons, and Asda have scaled back. Vegetarian sandwiches have seen a 22% drop across retailer ranges. Overall, meat and cheese still dominate, and most high salt or fat sandwiches contain meat, limiting healthy and sustainable choices. Despite growth, plant-based sandwiches remain the most expensive, making them less accessible—especially during a cost-of-living crisis.
(Eating Better, 2022).
The availability of meat-free alternatives, especially for popular items like sandwiches, remains low, with only 12% of ready-to-eat sandwiches in the UK being meat-free.
(Stewart, Runions, McNeill, et al., 2024).
Supporting evidence:
Stakeholder meetings
–
Supporting evidence: Workshops
“Lead by example: public sector organisations and institutions to move to offering balanced, plant-based diets. this would make it more of a norm.”
(Workshop 4).
Address urban food swamps and improve access to healthy food
Many urban areas suffer from an overconcentration of fast food and ultra-processed options, requiring targeted policy interventions.
Supporting evidence: Literature review
Geographical and socioeconomic inequalities limit access to healthy and sustainable food, leading to “food deserts.”
(Mitev, Portes, Osman et al., 2023).
Supporting evidence:
Stakeholder meetings
Urban areas face “food swamps,” characterised by the prevalence of fast food and ultra-processed foods, which require targeted interventions.
(Stakeholder Meeting 1).
Supporting evidence: Workshops
“Planning to support healthier environments
Support local food and production initiatives e.g., to support those in urban areas and food deserts
Opportunities- GFN and implementing local plans including procurement.”
(Workshop 1).
Improve consumer information and transparency through food labelling
Consumers lack clear sustainability information on takeaway and restaurant food, limiting informed choices. Honest food labelling should ensure transparency on welfare standards, environmental impact, and product origins.
Supporting evidence: Literature review
Consumers often feel uninformed about the sustainability of food choices when dining out or ordering takeaways, limiting their ability to make environmentally conscious decisions.
(Food Standards Scotland (FSS), 2021a).
Supporting evidence:
Stakeholder meetings
Awareness campaigns should address how consumer choices are manipulated by food marketing strategies.
(Stakeholder Meeting 13).
Supporting evidence: Workshops
–
Reduce the consumption of ultra-processed foods
Despite high levels of ultra-processed food consumption in the UK, policies do not promote shifts toward minimally processed, locally sourced foods.
Supporting evidence: Literature review
The report highlights that the UK has high levels of ultra-processed food consumption. There is an opportunity for policies that encourage dietary shifts towards minimally processed locally sourced foods through public awareness campaigns and incentives.
Hasnain et al (2020).
Supporting evidence:
Stakeholder meetings
Ultra-processed foods, such as those offered by large fast-food chains (e.g., Domino’s Pizza), are often inconsistent with the principles of a sustainable food culture due to their high environmental footprint.
(Stakeholder Meeting 11).
Supporting evidence: Workshops
–
Overcome negative perceptions of plant-based meat alternatives
Concerns over food standards post-Brexit and perceptions of plant-based meat alternatives (PBMAs) as ultra-processed discourage consumer adoption.
Supporting evidence: Literature review
Supporting evidence:
Stakeholder meetings
Red meat reduction policies may unintentionally drive demand toward other meat products, such as white meat, due to negative perceptions of the healthiness of plant-based alternatives.
(Stakeholder Meeting 13).
Supporting evidence: Workshops
“Public perception will be challenging, fear of Frankenfood.”
(Workshop 1).
Integrate sustainable food practices into social and public environments
While schools promote healthy meals, there is little policy support for sustainable food options in fast food outlets and other social settings.
Supporting evidence: Literature review
Support for social contexts: Encourage sustainable food options in fast food outlets and social settings, addressing the cultural importance of such spaces for young people.
(McBey, Rothenberg, Cleland et al., 2024).
Supporting evidence:
Stakeholder meetings
There is a lack of comprehensive regulations governing the nutritional and environmental standards of food sold in restaurants, cafes, and takeaway services. This regulatory gap limits the effectiveness of policy interventions aimed at fostering healthier and more sustainable dietary habits.
(Stakeholder Meeting 13).
Supporting evidence: Workshops
“Local planning systems – don’t currently have levers to determine what food outlets are available in a local area.”
(Workshop 4).
Address sensory and aesthetic barriers to alternative protein adoption
The taste, texture, and unfamiliarity of plant-based foods, along with the “disgust factor” of lab-grown meat and edible insects, limit their acceptance.
Supporting evidence: Literature review
The appeal of plant-based diets is often hindered by unfamiliar flavours, textures, and food neophobia, making them less enticing for some consumers. Additionally, perceived sensory drawbacks and the “disgust factor” present major obstacles to the acceptance of novel protein sources such as edible insects and lab-grown meat, limiting their mainstream adoption.
(Food Standards Agency (FSA), 2022).
Supporting evidence:
Stakeholder meetings
Red meat reduction policies may unintentionally drive demand toward other meat products, such as white meat, due to negative perceptions of the healthiness of plant-based alternatives.
(Stakeholder Meeting 13).
Supporting evidence: Workshops
–
3. Cultural, Health, and Equity Considerations
Ensure cultural equity in dietary policy
Policies promoting meat reduction must consider cultural dietary practices, such as Halal diets, to ensure equitable food access.
Supporting evidence: Literature review
–
Supporting evidence:
Stakeholder meetings
The intersection of cultural dietary practices (e.g., Halal diets in Glasgow) with meat reduction policies raises equity considerations.
(Stakeholder Meeting 4).
Supporting evidence: Workshops
“Risk of culturally appropriate food.”
(Workshop 1).
Assess health impacts of meat reduction and provide targeted guidance
The Scottish Dietary Goals include a general recommendation to limit red and processed meat intake to 70g per day, but they do not offer specific or targeted guidance for individuals who consume high levels of meat.
Supporting evidence: Literature review
Scottish Dietary Goals do not include specific guidelines to support high consumers of red and processed meat in transitioning to healthier, lower-emission diets, limiting the effectiveness of dietary and sustainability interventions. There is a need for guidelines that help high consumers of red and processed meat transition toward healthier, lower-emission diets, which are currently missing from Scottish Dietary Goals.
(Comrie et al., 2024).
Supporting evidence:
Stakeholder meetings
Poor health outcomes and dietary patterns in Scotland may worsen if red meat reduction strategies do not account for suitable nutritional replacements.
(Stakeholder Meeting 13).
Supporting evidence: Workshops
“Price, affordability, and accessibility of food that is recommended in the dietary goals. People rely on ultraprocessed food to plug the gap in their diets due to affordability of healthier or more sustainable items such as locally grown fruit, veg, or meat.
From an education perspective, people know what they should be doing, but it is not possible to do this for many people – need to stop focusing on information, and instead focus on improving provision. We are worsening inequalities by asking people to buy more fruit and vegetables but not making this available equally to them.”
(Workshop 4).
Expand the focus of dietary policy beyond individual health
Policy approaches should move beyond solely focusing on meat reduction messaging and instead integrate messaging that promotes increased consumption of fibre, fruit, and vegetables. Given the limited success of standalone meat reduction campaigns, a more holistic and positive framing may be more effective.
Supporting evidence: Literature review
–
Supporting evidence:
Stakeholder meetings
–
Supporting evidence: Workshops
“Focus seems to be on meat reduction when it could be on fibre/ F+V increase.”
(Workshop 3).
Overcome misperceptions and structural barriers to healthier eating
Many Scots mistakenly believe they meet dietary guidelines, while strong taste preferences create resistance to reformulated foods. Early education and culturally sensitive messaging are needed.
Supporting evidence: Literature review
Many Scottish adults believe their diet meets guidelines, but in reality, most do not.
70% of people consuming high-salt foods (e.g., ready meals, processed meats) believe they are eating within or below the recommended limits.
66% of people consuming confectionery and biscuits frequently think they are within sugar guidelines.
Awareness of unhealthy consumption remains a key issue, suggesting that consumer education and product reformulation could play a crucial role in closing this gap.
(Food and Drink Federation Scotland (FDF), 2020).
Supporting evidence:
Stakeholder meetings
–
Supporting evidence: Workshops
“Address misconceptions around healthy diets – raise awareness that current dietary patterns (on average, across the country) are unhealthy, and that a meat reduction would in fact be healthy for many people. This should also present plant-based foods as a sustainable option, not just a trend / fad.
This could start with early years and be incorporated into the curriculum. It should take account of varied cultures and traditions, and acknowledge how massively the Scottish population has changed.”
(Workshop 4).
Build public trust in agriculture and dietary recommendations
Greater transparency and engagement are needed to rebuild consumer trust in agricultural institutions. Conflicting media narratives have fuelled public distrust in dietary recommendations.
Supporting evidence: Literature review
Significant issue in policies aimed at rebuilding trust in agricultural institutions through transparency and community engagement, particularly in the context of transitioning from meat and dairy to plant-based agriculture. Meat as the Default: Many Scots see meat as an essential part of a meal, making plant-based alternatives feel unnatural.
Scepticism About Health Claims: People distrust health recommendations due to conflicting messages in the media.
Limited Awareness of Environmental Impact: Most consumers do not link meat consumption to climate change.
Price and Convenience: Many participants perceived plant-based options as expensive, inconvenient, or unfamiliar.
(McBey, Watts & Johnstone, 2019).
Supporting evidence:
Stakeholder meetings
Media narratives can contribute to the negative depictions of farmers, influencing public perceptions and stakeholder relationships.
(Stakeholder Meeting 1).
Supporting evidence: Workshops
“Public perception will be challenging, fear of Frankenfood.”
(Workshop 1).
Address the social stigma associated with plant-based diets
The perception of plant-based diets as elitist or judgmental discourages dietary shifts, requiring reframing to improve acceptance.
Supporting evidence: Literature review
Found that some participants expressed frustration with what they viewed as urban-centric or moralising narratives around veganism, which they felt overlooked the realities of Scottish rural and farming communities. For example, one participant criticised “vegan warriors” who aggressively promote veganism without understanding rural food systems, labelling such activism as unhelpful and antagonistic.
(Brett, 2022).
Supporting evidence:
Stakeholder meetings
Social stigma affects dietary shifts, with plant-based diets sometimes perceived as elitist or judgmental.
(Stakeholder Meeting 11).
Supporting evidence: Workshops
“The terms “plant-based” and “vegan” as negative connotations-threats to identity of farmers.”
(Workshop 1).
Shape media narratives around farmers and sustainable diets
Media portrayals can contribute to negative depictions of farmers, influencing public perceptions and policy debates.
Supporting evidence: Literature review
Discusses how Scottish farmers are judged by urban-centric standards, where cultural capital is eroded by media-fuelled stereotypes (e.g., greedy landowners, climate change deniers). Explores how these portrayals undermine rural social cohesion and farmer legitimacy.
(Sutherland & Burton, 2011).
Supporting evidence:
Stakeholder meetings
Media narratives can contribute to the villainisation of farmers, influencing public perceptions and stakeholder relationships.
(Stakeholder Meeting 6).
Supporting evidence: Workshops
–
Clarify the definition of “plant-based” in policy and markets
The term “plant-based” carries different meanings for different stakeholders, creating confusion in communication and labelling.
Supporting evidence: Literature review
Found that meat substitutes were interpreted differently in terms of nutrition, cost, convenience, etc.
(McBey, Watts & Johnstone, 2019).
Supporting evidence:
Stakeholder meetings
–
Supporting evidence: Workshops
“Plant-based-what does it mean? Something different to everyone.”
(Workshop 1).
Improve knowledge and support for regenerative agricultural practices
Raising awareness and providing policy support for regenerative farming practices can improve adoption and sustainability outcomes.
Supporting evidence: Literature review
Leadership, coherence and commitment to align policy implementation and delivery with the Scottish Government’s vision, targets, and ambitions for agriculture, nature recovery, net zero vision and a Just Transition, and to avoid a reinvention – or worse, a watering down, of the status quo (i.e., the CAP), and outline 17 steps towards regenerative agriculture
(Brodie, 2023).
Supporting evidence:
Stakeholder meetings
Insufficient subsidies and grants to support diversification into sustainable agriculture.
(Stakeholder Meeting 6).
Supporting evidence: Workshops
“Few examples available of successful regenerative practices.”
(Workshop 4).
Strengthen dialogue and cooperation among producers
Improving communication and collaboration among agricultural producers can support coordinated and sustainable food production.
Supporting evidence: Literature review
Building trust and engagement with the farming, crofting, and land management sector — including its representative bodies and media — is essential for increasing the uptake of nature-based solutions (NbS).
Recommendations for the Scottish Government:
Clearly communicate what is expected from the sector under the Agricultural Reform Programme (ARP), and by when. Current uncertainty is contributing to inertia and resistance to change.
Frame communications around the business benefits of adopting NbS — such as improving resilience to economic and climate-related shocks, supporting food production, and boosting profitability. Messaging should directly counter sector narratives that portray NbS as peripheral or burdensome. Share compelling, real-world examples of farmers and land managers who have successfully embedded NbS into their core operations, and promote these stories through sector media outlets like The Scottish Farmer and Landward.
Ensure that individuals with direct experience in farming, crofting, and land management are actively involved in the design and testing of ARP policy. Their input is vital to ensure credibility, practicality, and sector buy-in.
(Brodie, 2023).
Supporting evidence:
Stakeholder meetings
Scotland’s agricultural vision emphasizes sustainable and regenerative farming practices, aiming to improve land management, enhance biodiversity, and promote long-term environmental viability.
(Stakeholder Meeting 14).
Supporting evidence: Workshops
“Dialogue between producers-agriculture cooperation.”
(Workshop 3).
Restore cultural connections to food and farming traditions
Addressing the legacy of industrial food production by fostering appreciation for food origins, sustainability, and health impacts.
Supporting evidence: Literature review
Explores the strong consumer attachment to locally produced food in Scotland, highlighting how this loyalty is often associated with perceptions of sustainability, trust, and quality. It notes that local origin is frequently seen as a proxy for environmentally responsible and healthier food choices, even when this may not always reflect the full environmental impact.
Recommends enhancing consumer education to improve understanding of food origin, sustainability credentials, and health claims. This includes raising awareness about how production methods, supply chains, and labelling affect environmental and health outcomes—helping consumers make more informed, evidence-based choices.
(Leat, Revoredo-Giha & Lamprinopoulou, 2011).
Supporting evidence:
Stakeholder meetings
Consumers often lack awareness of food provenance, challenging narratives around food sovereignty.
(Stakeholder Meeting 11).
Supporting evidence: Workshops
“Improve relationship with food. Industrial farming/food production to overcome hunger in late 19th/early 20th centuries has altered how we understand and interact with food. Need to improve relationship with food, bringing back cultural elements and also an appreciation of where food comes from, how it is grown/processed, and how it affects our planet and our health.”
(Workshop 4).
Promote sustainable meat reduction in culturally significant meals
Policies overlook opportunities to encourage lower meat intake in culturally significant meals, while social traditions make plant-based alternatives feel unfamiliar or unnatural.
Supporting evidence: Literature review
This study conducted focus groups across Scotland to assess attitudes toward reducing meat in familiar dishes.
Explored acceptance of plant-based alternatives to staple meat-based meals.
Participants expressed mixed reactions, with older and rural Scots more resistant to replacing meat in “staple” meals.
(McBey, Watts & Johnstone, 2019).
Supporting evidence:
Stakeholder meetings
Strong cultural attachments to traditional diets, particularly in rural communities, create barriers to dietary change.
(Stakeholder Meeting 3).
Supporting evidence: Workshops
“Traditions, habits, and culture: Cultural traditions around ways of living – needing food to fuel a physical working day. A meat industry has grown around that – the fish industry hasn’t grown in the same way / as strong. These traditions, which have started in childhood, when people see food being produced, carry those habits into school and beyond.”
(Workshop 4).
Enhance cultural sensitivity in policy design and public messaging
Campaigns should consider cultural, regional, and social differences to avoid alienating certain groups.
Supporting evidence: Literature review
Existing studies on barriers to, and enablers for, reducing meat consumption largely focus on the general population or students. Found that social norms, fear of stigmatisation and availability and price of meat and meat alternatives appear to be key factors. These differ significantly between subgroups within the population, influenced by factors such as age, gender, culture and socio-economic status.
(Spiro, Hill & Stanner, 2024).
Supporting evidence:
Stakeholder meetings
The intersection of cultural dietary practices (e.g., Halal diets in Glasgow) with meat reduction policies raises equity considerations.
(Stakeholder Meeting 4).
Supporting evidence: Workshops
–
Support farmer-to-farmer knowledge exchange and peer learning
Expanding opportunities for sustainability-focused peer learning and knowledge sharing among farmers.
Supporting evidence: Literature review
Transformation in agricultural land management is critical to achieving Scottish Government’s aims of mitigating climate change, addressing the biodiversity crisis, and achieving a just transition for land and agriculture. Providing advice and collaborative learning opportunities through the Farm Advisory Service (FAS) is the key mechanism to deliver behaviour change in the agricultural sector. The Scottish Government is seeking to better integrate the FAS into an agricultural knowledge and innovation system (AKIS) for Scotland. AKIS is a system of innovation which links organisations, institutions, incentives and funding. This research comprises an evidence review and options appraisal for an agricultural knowledge and innovation system (AKIS) for Scotland.
(Sutherland, Banks, Boyce et al., 2023).
Supporting evidence:
Stakeholder meetings
–
Supporting evidence: Workshops
–
Address generational tensions in dietary transitions
In Scotland, younger generations tend to be more climate-conscious in their attitudes toward diet, with greater openness to reducing meat consumption and considering environmental impacts. However, actual behaviour may not always align with these intentions. Resistance from older family and community norms can also create barriers to change.
Supporting evidence: Literature review
A 2024 survey by Consumer Scotland found that 85% of individuals aged 16-24 expressed concern about climate change, compared to 76% of the general population. This heightened awareness among younger Scots is influencing their dietary choices. For instance, a 2023 report by Food Standards Scotland revealed that 45% of 16-24-year-olds reported reducing their meat or fish consumption, a higher proportion than in older age groups. Additionally, the same report noted that 30% of individuals over 65 years would not consider eating less meat or fish, indicating a generational difference in attitudes towards meat consumption.
(Cotton, Gosschalk, Gray et al., 2024).
Supporting evidence:
Stakeholder meetings
Younger generations tend to be more environmentally conscious in their dietary choices, often favouring sustainable and plant-based options. However, their efforts to adopt climate-friendly eating habits frequently encounter resistance rooted in longstanding traditions, cultural expectations, and dietary norms upheld by older family members and the broader community. These intergenerational tensions can pose significant barriers to meaningful change.
(Stakeholder Meeting 4).
Supporting evidence: Workshops
“Carbon labelling on foods – WHO suggests young people more likely to change their diet because of climate concerns than health concerns – I think this links with young people’s climate anxiety etc.”
(Workshop 4).
Improve access to mental health support for farmers
Financial stress, environmental uncertainties, and policy changes contribute to high mental health burdens among farmers, requiring targeted interventions.
Supporting evidence: Literature review
Poor mental health is an increasing concern within the farming sector. This article examines the adaptability of “landscapes of support” — a term used to describe the range of mental health support available to farmers, including services provided by government bodies, non-profits, and community organisations. Focusing on the UK, the study draws on a literature review, interviews with 22 support providers, surveys of 93 support actors and 207 farmers, and a concluding workshop. The findings reveal that while many organisations adapted during the COVID-19 pandemic by using digital tools and expanding media outreach, they also faced significant barriers, including funding shortfalls, limited training, staff burnout, and poor rural connectivity. The article identifies opportunities to strengthen these support systems to ensure they are more resilient in the face of future crises.
(Shortland, Hall, Hurley et al., 2023).
Supporting evidence:
Stakeholder meetings
–
Supporting evidence: Workshops
–
4. Digital and Seasonal Food
Address digital inequalities in food access
Rural and lower-income consumers face barriers to accessing food delivery technologies, creating disparities in digital food system participation.
Supporting evidence: Literature review
Policy interventions must account for unequal access to digital tools and platforms, particularly among rural populations and lower-income households. These groups may face barriers such as limited broadband connectivity, lack of digital literacy, or affordability issues, which restrict their ability to engage with online food systems, including grocery delivery, meal planning apps, or sustainability-focused platforms. Addressing these disparities is essential to ensure equitable participation in emerging food technologies and digital food environments.
(Scottish Government, 2023).
Supporting evidence:
Stakeholder meetings
Digital tools (e.g., benefit calculators) depend on reliable internet access and digital literacy, potentially excluding vulnerable populations with poor dietary outcomes.
(Stakeholder Meeting 12).
Supporting evidence: Workshops
–
Ensure equity in seasonal diet transitions
A shift toward seasonal diets should not exacerbate existing social and economic disparities in food access.
Supporting evidence: Literature review
Local produce often needs long-term storage (e.g. apples, onions, potatoes, cabbage) to remain available year-round.
Storage leads to nutrient degradation, especially for vitamin C and antioxidants.
Frozen local foods preserve better but require energy-intensive processing (e.g., blanching), which can also reduce nutrients like B vitamins.
No studies yet published have considered the overall health benefits of eating a wholly local diet compared to a similar diet produced non-locally.
(Edwards-Jones, 2010).
Supporting evidence:
Stakeholder meetings
–
Supporting evidence: Workshops
“Shift towards seasonality, but this could amplify existing inequalities.”
(Workshop 1).
5: Consumer Education and Behavioural Change
Enhance consumer education on sustainable diets
Without targeted behavioural support, most people in Scotland struggle to align their diets with the Eatwell Guide, limiting progress toward CCC targets.
Supporting evidence: Literature review
The research finds that most people in Scotland do not follow the Eatwell Guide, making meat and dairy an important source of nutrients.
This suggests that simply recommending dietary shifts without supporting consumer behavior change will be ineffective.
Policy Gap: Absence of strong public awareness campaigns to help consumers transition to healthier, more sustainable diets, such as:
Educational initiatives on how to replace meat and dairy with nutrient-rich plant-based foods.
Supermarket incentives or labeling schemes to highlight healthier, climate-friendly food choices.
(Food Standards Scotland (FSS), 2024).
Supporting evidence:
Stakeholder meetings
Meat consumption trends in Scotland suggest an increase, highlighting the challenge of shifting dietary habits toward sustainability.
(Stakeholder Meeting 6).
Supporting evidence: Workshops
“Dietary guidance- Eatwell Plate- if we followed it emissions would be reduced e.g., high volume of red meat eaters
Which metrics are we using e.g., chicken (low carbon?)
People don’t pay attention to dietary guidance.”
(Workshop 1).
Clarify nutritional guidance for dietary transitions
Policies fail to provide comprehensive public education on suitable dietary substitutions and the potential risks of reducing meat and dairy consumption.
Supporting evidence: Literature review
Micronutrient Risks: The report highlights that reducing meat and dairy consumption can lead to decreased intakes of certain key nutrients (e.g., calcium, iron, vitamin B12), especially without careful substitutions. Groups with existing low nutrient intakes are at heightened risk under scenarios of reduced meat and dairy intake. Policies to enhance public understanding of appropriate dietary substitutions and potential nutrient risks associated with reduced meat and dairy are limited, suggesting an opportunity for educational initiatives.
(Comrie et al., 2024).
Supporting evidence:
Stakeholder meetings
The recommended 70g per day of red meat is often seen as a dietary requirement rather than a maximum limit, affecting efforts to normalise lower meat consumption.
(Stakeholder Meeting 2).
Supporting evidence: Workshops
–
Strengthen consumer connections to sustainable and local food systems
A disconnect between modern food habits and local food traditions reduces demand for low-carbon, locally produced foods.
Supporting evidence: Literature review
Better and bolder communication is needed to overcome a disconnect between what people buy and how they consume food and the production processes that have negative environmental impacts. Issues around food production and land use, and the links to food consumption need to be addressed.
(Centre for Climate Change and Social Transformations (CAST), 2024).
Supporting evidence:
Stakeholder meetings
disconnection between people, nature, and food systems weakens public engagement with sustainable diets.
(Stakeholder Meeting 11).
Supporting evidence: Workshops
“Local and community action around education and reconnecting to the land. Promoting interconnectedness between producers and consumers.
This will look different depending on the setting – urban and rural environments will look different in the nature available to them and how they connect with nature.
Requires input from local authorities, education institutions, local business/producers/suppliers to work together.”
(Workshop 4).
Define and communicate what constitutes a ‘sustainable diet’
The term “sustainable diet” is interpreted in varying ways, from affordability to environmental impact, complicating policy communication and engagement.
Supporting evidence: Literature review
Public understanding of what constitutes a “sustainable diet” is often diverse and inconsistent. For some, the concept is primarily linked to environmental impact, such as reducing carbon emissions or minimizing food waste. For others, it may be more closely associated with affordability, food security, or simply ensuring access to enough food to meet basic nutritional needs. This variation in interpretation highlights the need for clearer public communication and education around the multiple dimensions of sustainable diets—including environmental, economic, cultural, and health-related factors—to build a shared understanding and support informed decision-making.
(Cleland, McBey, Darlene et al., 2025).
Supporting evidence:
Stakeholder meetings
–
Supporting evidence: Workshops
–
Improve dietary messaging for young people
Adolescents are aware of environmental issues but lack understanding of the impact of meat consumption. Stronger educational initiatives and trusted voices are needed to clarify dietary choices.
Supporting evidence: Literature review
Adolescents were generally knowledgeable about the basic principles of sustainable diets but lacked familiarity with the term itself.
Environmental impacts of food, such as packaging and transportation (food miles), were more commonly understood than the broader sustainability of diets, such as reducing meat consumption.
Many young people prioritized other environmental actions, such as reducing plastic waste and air travel, over dietary changes.
(McBey, Rothenberg, Cleland et al., 2024).
Supporting evidence:
Stakeholder meetings
Limited institutional mechanisms exist to incorporate youth perspectives into food and climate policy discussions, despite high climate awareness among younger populations.
(Stakeholder Meeting 4).
Supporting evidence: Workshops
“Messaging – who are the trusted messages? Social media – young people and protein, influencers – do we need to recruit these people?”
(Workshop 3).
Raise public awareness of the links between diet and climate change
Many consumers do not associate meat consumption with climate change, reducing engagement with sustainable dietary changes. Clear communication is needed about the pathway to net zero and the role of diets.
Supporting evidence: Literature review
Research found that many consumers lack awareness of the connection between meat consumption and climate change. Meat is often viewed primarily through the lens of taste, tradition, or nutrition, with little consideration given to its environmental footprint. As a result, the role of meat production in contributing to greenhouse gas emissions, land use, and biodiversity loss is not widely understood. This highlights the need for targeted public education campaigns to bridge the knowledge gap and promote more climate-conscious dietary choices.
(McBey, Watts & Johnstone, 2019).
Supporting evidence:
Stakeholder meetings
–
Supporting evidence: Workshops
“We advocate strongly for the government to be very clear what the most impactful household choices are that people can take to reduce emissions and being clear that an average reduction of meat and dairy consumption is part of it.”
(Workshop 3).
Address misconceptions about alternative proteins
Widespread misconceptions about lab-grown meat and edible insects hinder their public acceptance as sustainable protein options.
Supporting evidence: Literature review
Consumer Confidence in Safety and Regulation A significant number of consumers express hesitation toward novel food products—particularly lab-grown meat and edible insects—due to concerns about their safety and how they are regulated. Recommended policy response: Strengthen regulatory frameworks, enhance transparency in production processes, and improve public communication to build trust and reassure consumers about the safety of these emerging food technologies.
Cultural Acceptance and Public Perception Deep-seated cultural attitudes and the “disgust factor” continue to pose major barriers to the acceptance of edible insects and lab-grown meat. Addressing these perceptions through culturally sensitive education and engagement is key to improving public receptivity.
(Food Standards Agency Scotland (FSAS), 2022).
Supporting evidence:
Stakeholder meetings
Red meat reduction policies may unintentionally drive demand toward other meat products, such as white meat, due to negative perceptions of the healthiness of plant-based alternatives.
(Stakeholder Meeting 13).
Supporting evidence: Workshops
–
Provide practical support for individuals undergoing dietary change
While policies encourage sustainable diets, they do not provide practical tools like meal plans, recipes, or visual guides to aid consumer transitions.
Supporting evidence: Literature review
Recommends creating accessible tools—such as recipes, meal plans, visual guides, and infographics—to help translate dietary guidelines into practical, everyday actions. These resources can support individuals in making informed, sustainable food choices by demonstrating how to implement the guidelines in realistic and appealing ways.
(Culliford, Bradbury & Medici, 2023).
Supporting evidence:
Stakeholder meetings
–
Supporting evidence: Workshops
–
Use health-focused messaging to promote sustainable dietary change
Policies focus on environmental messaging, but emphasising health benefits could be a more effective motivator for dietary shifts.
Supporting evidence: Literature review
Integrate sustainability into education and school food programmes:
Revise school curricula to incorporate up-to-date evidence on sustainable diets, emphasising the connections between food choices, climate action, and health outcomes. Complement this by implementing sustainable and nutritious school meal programs that model environmentally responsible eating habits, helping to normalize healthy, climate-friendly diets from an early age.
(McBey, Rothenberg, Cleland et al., 2024).
Supporting evidence:
Stakeholder meetings
Co-benefits of policy alignment: Opportunities exist to align health and sustainability goals, particularly through meat reduction strategies
(Stakeholder Meeting 9).
Supporting evidence: Workshops
“To ensure that an average reduction in meat and dairy consumption is compatible with healthy diets and ideally ensure positive impacts on health and nutrition.“
(Stakeholder Workshop 4).
Tackle misinformation about diet and climate impacts
Many people doubt that reducing meat consumption is an effective climate action, believing other behaviours (e.g., reducing plastic use) are more impactful. Improved communication and avoiding oversimplification are needed.
Supporting evidence: Literature review
Increased awareness: Over the last decade, public awareness of sustainable diets and their environmental impacts has grown. However, this increase is uneven across different socioeconomic groups.
Persistent barriers: Despite increased awareness, barriers to reducing meat consumption—such as cultural norms, cost, and scepticism about meat alternatives—persist.
Dietary change resistance: Many still perceive actions like reducing meat consumption as less impactful compared to other actions (e.g., reducing plastic use).
(Cleland, McBey, Darlene et al., 2025).
Supporting evidence:
Stakeholder meetings
–
Supporting evidence: Workshops
“Misinformation in terms of the public health impacts of changing diets. Communication needs to be clearer. Nuance around processing being seen as unhealthy and organic as healthy.”
(Workshop 3).
Reframe public understanding of protein needs
Public understanding of protein needs is often skewed, reinforcing resistance to reducing meat consumption.
Supporting evidence: Literature review
Across all stages of the family lifecycle, continued meat consumption was frequently justified by the belief that individuals require nutrients found in meat, such as iron and protein. These nutritional reflections were typically not grounded in scientific evidence but were instead based on ingrained beliefs shaped by social upbringing, rather than informed by alternative or external sources of information.
(Kemper, 2020).
Supporting evidence:
Stakeholder meetings
Overemphasis on protein requirements contributes to resistance against reducing meat consumption.
(Stakeholder Meeting 2).
Supporting evidence: Workshops
–
Strengthen consumer awareness of food provenance
Many consumers are unaware of where their food comes from, weakening narratives around food sovereignty and local sourcing.
Supporting evidence: Literature review
–
Supporting evidence:
Stakeholder meetings
Consumers often lack awareness of food provenance, challenging narratives around food sovereignty.
(Stakeholder Meeting 11).
Supporting evidence: Workshops
–
Empower consumers to make sustainable food choices
Providing consumers with the right information and tools can support the adoption of more sustainable eating habits.
Supporting evidence: Literature review
–
Supporting evidence:
Stakeholder meetings
Encouraging consumers to make informed dietary choices can enhance their ability to adopt sustainable eating habits.
(Stakeholder Meeting 1).
Supporting evidence: Workshops
–
Strengthen proactive public engagement in dietary change efforts
Providing early, transparent information to shape public discourse and build informed support for food system changes.
Supporting evidence: Literature review
Reviews research on how providing information about the impact of meat consumption and the benefits of meat substitutes positively affects respondents in China and the US. This information increases their intentions to support meat reduction policies, including more costly measures like a meat tax.
(Bryant, Couture, Ross, et al., 2024).
Supporting evidence:
Stakeholder meetings
–
Supporting evidence: Workshops
“Inoculation-plant information ahead of public debate.”
(Workshop 1).
Strengthen public health and policy support for sustainable dietary shifts
Public health campaigns and food policies lack coordinated efforts to actively promote widespread transitions to sustainable diets.
Supporting evidence: Literature review
Policy Coordination:
Highlights regional land use planning but provides limited discussion on integrating dietary policy into broader climate and health strategies.
(Reay, Warnatzsch, Craig, et al., 2020).
Supporting evidence:
Stakeholder meetings
Misalignment between climate, health, and food policies. Current policy frameworks lack coherence, creating conflicting objectives.
(Stakeholder Meeting 13).
Supporting evidence: Workshops
–
Balance individual responsibility with systemic food system change
Policies often overemphasise personal responsibility for diet change, while systemic food environment shifts are more effective and less stigmatising.
Supporting evidence: Literature review
Challenges the overemphasis on individual behaviour change as the primary solution to sustainability and public health issues. Instead, it advocates for a shift toward structural and policy-driven approaches that facilitate collective action and address the root causes embedded in social, economic, and environmental systems. By focusing on systemic transformation, such as changes in food infrastructure, regulation, and institutional practices, this approach underscores the need for environments that enable and sustain more equitable and widespread change beyond individual responsibility.
(Meyerricks & White, 2021).
Supporting evidence:
Stakeholder meetings
Policies often overemphasize individual responsibility for dietary choices, while structural food environment changes are more effective and less stigmatizing.
(Stakeholder Meeting 13).
Supporting evidence: Workshops
“Current resilience strategies rely on individuals to be able to prepare themselves, rather than creating a robust food system within Scotland.”
(Workshop 1).
Encourage social norm-based approaches to dietary change
Policies do not leverage peer influence to normalise reduced meat consumption and encourage widespread dietary shifts.
Supporting evidence: Literature review
Reviews interventions aimed at reducing meat consumption, categorising them into personal, socio-cultural, and external factors. Personal interventions include educational campaigns, emotionally framed messages, and skill-building (e.g., vegetarian cooking courses). Socio-cultural factors involve changing social norms and addressing cultural resistance to plant-based diets. Opportunities for promoting social norms around sustainable diets through public campaigns and community programmes.
(Kwasny, Dobernig & Riefler, 2022).
Supporting evidence:
Stakeholder meetings
Gender norms influence dietary choices, with meat consumption often associated with masculinity, creating barriers to plant-based diets.
(Stakeholder Meeting 1).
Supporting evidence: Workshops
“Need to make climate-friendly diets the norm?
Need long term changes.”
(Workshop 1).
Improve understanding of the long-term impacts of dietary shifts
Most studies focus on short-term dietary changes without exploring the effectiveness of multi-pronged interventions over time.
Supporting evidence: Literature review
Explores the nutritional and behavioural implications of substituting plant-based proteins for animal proteins in Scotland, using household purchase data.
Identifies price sensitivity as a driver of dietary change but does not address long-term behavioural adoption or resistance.
(Dogbe, Wang & Revoredo-Giha, 2024).
Supporting evidence:
Stakeholder meetings
–
Supporting evidence: Workshops
–
Address the prioritisation of cost and convenience over sustainability in food choices
Sustainability concerns are often secondary to cost and convenience when consumers make food choices.
Supporting evidence: Literature review
Examined the effects of decreasing meat and dairy intake on nutrient consumption and disease risk among Scottish adults. Although many individuals express genuine concern for sustainability and environmental impact, these values are often compromised by practical considerations, particularly cost and convenience. In everyday decision-making, affordability and ease of access tend to take precedence, revealing a gap between environmental awareness and actionable behaviour. This highlights the need for policies and systems that make sustainable choices more accessible, affordable, and integrated into daily life.
(Food Standards Scotland (FSS), 2022).
Supporting evidence:
Stakeholder meetings
–
Supporting evidence: Workshops
“Inability to pay for things- poverty in working population
Hard to get to nutrition when you have long term challenge
Need for equipment for prep; time-knowledge-cost
No freedom of choice in these circumstances
Good food is very inaccessible to those with nothing (not home and skills).”
(Workshop 1).
Normalise reduced meat consumption in everyday diets
The recommended limit of 70g per day for red and processed meat in Scotland is often misinterpreted as a dietary requirement rather than a maximum, which can undermine efforts to normalise lower meat consumption.
Supporting evidence: Literature review
It is important to emphasise that the UK recommendation of a maximum of 70g/day on average is a recommendation for individuals, not a population average, and a wide range of intakes for red and processed meat has been reported, for example, a range of 0–208g/day in men aged 19–64 years.
(Spiro, Hill & Stanner, 2024).
Supporting evidence:
Stakeholder meetings
The recommended 70g per day of red meat is often seen as a dietary requirement rather than a maximum limit, affecting efforts to normalise lower meat consumption.
(Stakeholder Meeting 4).
Supporting evidence: Workshops
“We also find that people are often not very clear about health benefits of a reduction especially in red meat consumption and the role of protein etc…. This is further confused by the NHS recommendation of 70g red meat, which can be misunderstood as a required minimum, rather than a maximum.”
(Workshop 3).
Assess the effectiveness of dietary behaviour change campaigns
Large-scale dietary campaigns often fail to drive change, with community-based, trusted sources being more impactful.
Supporting evidence: Literature review
Examined how often people seek, trust, and rely on 22 different sources of diet and nutrition information when making dietary changes. While sources like health websites, internet searches, and diet books were most frequently consulted, participants reported the highest trust in nutrition scientists, professionals, and scientific journals. This highlights a disconnect between popularity and trustworthiness. Trust, more than frequency of use, was a stronger predictor of influence on dietary change. Sources deemed less trustworthy were less likely to be relied upon, and seeking information alone didn’t always lead to effective dietary shifts. These patterns varied across sources.
(Ruani, Reiss & Kalea, 2023).
Supporting evidence:
Stakeholder meetings
Blanket dietary change campaigns are often ineffective and challenging to evaluate. For greater impact, information should come from trusted, community-based sources.
(Stakeholder Meeting 13).
Supporting evidence: Workshops
–
Evaluate the relative impacts of different behavioural interventions on food choices
Strategies like calorie labelling have shown limited effectiveness in driving significant dietary change.
Supporting evidence: Literature review
There are currently no plans to introduce a mandatory eco-labelling scheme, nor is the government set to endorse any existing or new framework. This decision reflects the limited evidence to date that eco-labels significantly influence consumer or business behaviour at the point of sale (Defra, 2024). Nonetheless, similar to the role nutrition labelling has played, eco-labelling could potentially encourage some level of product reformulation by manufacturers.
(Spiro, Hill, & Stanner, 2024).
Supporting evidence:
Stakeholder meetings
Behavioural interventions like calorie labelling have limited impact on dietary habits.
(Stakeholder Meeting 13).
Supporting evidence: Workshops
–
Shape food environments to promote healthier and more sustainable choices
Addressing the knowledge-action gap through nudging strategies and food system interventions.
Supporting evidence: Literature review
Behavioural nudges, such as making vegetarian options the default choice on menus, have been shown to significantly reduce meat consumption, with studies reporting reductions ranging from 20% to as high as 85%. These strategies work by subtly reshaping consumer choice environments, making plant-based selections more accessible and socially normative without restricting individual freedom.
Promote practical, habitual dietary shifts that are sustainable and health-supportive over the long term.
Supporting evidence: Literature review
–
Supporting evidence:
Stakeholder meetings
Encouraging consumers to make informed dietary choices can enhance their ability to adopt sustainable eating habits.
(Stakeholder Meeting 1).
Supporting evidence: Workshops
“Healthy “enough” (vis-à-vis everyday diets).”
“Habits of eating.”
(Workshop 1).
Rethink policy approaches to dietary change
Shifting from fear-based, top-down behaviour change strategies to more effective and inclusive policy tools.
Supporting evidence: Literature review
Examines the comparative evolution of rural development policies and Local Action Groups (LAGs) within a multi-level governance (MLG) framework. It focuses on two UK cases (Argyll and the Islands in Scotland; Coast, Wolds, Wetlands and Waterways in England) and two Italian cases (Delta 2000 in Emilia-Romagna; Capo Santa Maria di Leuca in Puglia).
Findings highlight how LAGs’ mechanisms, outcomes, and partnerships vary, but consistently demonstrate that while EU funding and policy frameworks provide critical support, it is the bottom-up leadership of local actors that most significantly drives success in rural development initiatives.
(Gargano, 2021).
Supporting evidence:
Stakeholder meetings
–
Supporting evidence: Workshops
“The tools and language of policy
Behaviour change is top-down using fear”
(Workshop 1).
Appendix J: Extended Technological analysis: Areas for further policy development and supporting evidence
Key Theme
Area For Policy Development
1: Data Gaps and Infrastructure for Policy Monitoring
Develop a comprehensive monitoring framework for sustainable diets
There is no structured system to track the effects of dietary shifts on emissions, health, food security, biodiversity, and sustainability, limiting policy effectiveness.
Supporting evidence: Literature review
Lack of Clear Enforcement Mechanisms for Emission Reductions
The 30% agricultural emissions reduction target (by 2032) is ambitious, but the text does not specify:
How reductions will be enforced (e.g., penalties for non-compliance vs. voluntary incentives).
Sector-specific targets for beef, sheep, dairy, and arable farming.
How progress will be measured and verified beyond voluntary reporting.
Policy Gap: Scotland lacks a detailed, binding framework for ensuring compliance with emission reductions in agriculture.
Policy Need: Develop a carbon budgeting system for farms with clear compliance measures, incentives, and accountability mechanisms.
Scottish Government, n.d.).
Supporting evidence:
Stakeholder meetings
–
Supporting evidence: Workshops
“Lack of data. Need to look at what is the actual impact of farming on climate in Scotland – what are the negatives we currently have and then learning from best practise to bring others on that journey. using real Scottish data to drive change. it should go wider than GHGs. its about biodiversity, habitat and plant protection and ecosystem, water use and flood management, soil quality, animal welfare etc.
baselining standards – over 170 farms there are some that are already at net zero, or close.”
(Workshop 3).
Establish a standardised data infrastructure to support policy integration
The lack of a unified system to collect, share, and analyse food system data hinders the integration of climate, health, and sustainability goals into policy decisions.
Supporting evidence: Literature review
Emissions Estimation Uncertainty: The report notes significant variability in greenhouse gas (GHG) emissions estimates for food consumed in Scotland, partly due to differences in accounting for land use change and specific food consumption patterns. Improved data accuracy, especially for children and region-specific consumption, could strengthen policy targeting emissions from specific food groups.
Data Gaps in Food Production Origins: The report identifies a need for detailed information on the origins of foods consumed in Scotland. This information is essential for accurately attributing emissions, particularly as some Scottish produce is processed outside Scotland before being reimported for local consumption. Policy could address this by improving traceability in food supply chains
Integration of Post-Retail Emissions: Only some models account for emissions from consumer actions, such as energy used in cooking or food waste. Policy could incentivize behaviours that reduce these post-retail emissions, such as promoting energy-efficient cooking practices and reducing food waste at home.
(Jaacks, Frank, Vonderschmidt et al., 2024).
Supporting evidence:
Stakeholder meetings
Data for policy tracking: Robust data systems are needed to inform policy decisions and track their effectiveness over time.
(Stakeholder Meeting 13).
Supporting evidence: Workshops
“Within Scottish Government:
Make climate & diet part of a Good Food Nation objective.
Include dietary change as one of Scotland’s climate goals.
Work for better join up across policy areas, work against narrowness. Make this a priority for multiple departments.”
(Workshop 4).
Set clear targets and indicators for sustainable diet policies
The absence of effective metrics makes it difficult to evaluate the impact of policies on health, emissions reduction, and food system sustainability.
Supporting evidence: Literature review
No Specific Emissions Targets for Dairy Farming
Scotland has national climate targets but lacks dairy-specific GHG reduction goals.
Limited data collection on methane emissions at the farm level makes tracking improvements difficult.
Policy intervention: Expand research funding and create national livestock emissions databases.
(Ferguson, Bowen, McNicol et al., 2024).
Supporting evidence:
Stakeholder meetings
Measuring dietary change: Identifying effective metrics to measure progress in dietary change is a key challenge.
(Stakeholder Meeting 2).
Supporting evidence: Workshops
–
Enhance monitoring and metrics for agroecological practices
The absence of clear indicators for assessing agroecology’s environmental, economic, and social performance limits its policy integration, while the lack of systematic data collection prevents evidence-based policymaking for sustainable farming transitions.
Supporting evidence: Literature review
Limited Research on the Economic Viability of Agroecology
No comprehensive cost-benefit analysis of agroecological farming vs. conventional farming in Scotland.
Need for financial models that demonstrate the long-term resilience benefits of agroecology.
Set Clear Targets for Sustainable Diets and Agriculture
Introduce climate-aligned dietary guidelines, including reduced red meat and dairy consumption.
Support horticulture expansion to increase domestic fruit, vegetable, and pulse production.
Align agroecology with Scotland’s Circular Economy and Net-Zero strategies
(Lozada & Karley, 2022).
Supporting evidence:
Stakeholder meetings
–
Supporting evidence: Workshops
“Lots of local producers-just not captured in the figures.
Recognising the informal sectors e.g., farm shops, allotments.”
(Workshop 1).
Improve industry accountability through transparent data reporting
The absence of clear industry accountability frameworks hinders progress toward aligning food production and retail practices with dietary and sustainability targets.
Supporting evidence: Literature review
Data and Accountability:
The need for robust, accessible data and transparent mechanisms to hold stakeholders accountable is underdeveloped in policy.
(Scottish Government, 2024).
Supporting evidence:
Stakeholder meetings
Data for policy tracking: Robust data systems are needed to inform policy decisions and track their effectiveness over time.
(Stakeholder Meeting 13).
Supporting evidence: Workshops
–
Develop robust metrics for tracking dietary change and emissions reduction
The absence of standardised indicators makes it difficult to assess the climate impact of dietary shifts and monitor progress toward emissions reduction goals.
Supporting evidence: Literature review
Variability in Emissions Estimates Across food based dietary guidelines (FBDGs):
Highlights the wide range of emissions reductions attributed to different dietary guidelines, which vary due to methodological differences across models. This variability can make it challenging to establish standardized or widely accepted climate benchmarks within FBDGs, which may complicate Scotland’s efforts to adopt clear, evidence-based climate targets.
(Tregear, Morgan, Spence et al., 2024).
Supporting evidence:
Stakeholder meetings
Measuring dietary change: Identifying effective metrics to measure progress in dietary change is a key challenge.
(Stakeholder Meeting 2).
Supporting evidence: Workshops
–
Expand broadband access to enable precision agriculture
Poor broadband connectivity in rural areas restricts the adoption of connected animal sensors and precision farming technologies, reducing agricultural efficiency.
Supporting evidence: Literature review
Connectivity and Infrastructure Barriers to Digital Agriculture:
Many rural areas lack broadband access, preventing the adoption of connected animal sensors and precision agriculture.
Investment in rural digital infrastructure is essential.
(Scottish Government, 2023).
Supporting evidence:
Stakeholder meetings
–
Supporting evidence: Workshops
–
2: Agricultural Emissions and Climate Reporting
Improve agricultural emissions reporting and accountability
Existing reporting mechanisms do not adequately integrate climate-smart farming technologies, reducing accountability and hindering emissions tracking.
Supporting evidence: Literature review
Monitoring and Accountability:
Annual progress reporting on agricultural emissions reductions must be strengthened.
Policies should integrate climate-smart farming technology adoption into monitoring frameworks.
(Scottish Government, n.d.)
Supporting evidence:
Stakeholder meetings
–
Supporting evidence: Workshops
–
Establish a standardised carbon footprinting and emissions tracking system
The inconsistent use of carbon calculators and the absence of methane emissions data at the farm level, combined with inconsistent GHG emissions calculation methods, make it difficult to assess and mitigate agricultural emissions effectively.
Supporting evidence: Literature review
Developing a standardised carbon footprinting tool
Farmers currently use multiple, inconsistent carbon calculators.
Recommendation: Create a universal farm carbon calculator, integrated with existing farm software and databases.
Nourish Scotland (2021).
Supporting evidence:
Stakeholder meetings
–
Supporting evidence: Workshops
Reassess methane accounting methods and livestock emissions data
Methane calculations should be reviewed due to methane’s short atmospheric half-life. There is also a need to ensure fair assessments of emissions from lamb and beef production, particularly in extensive grazing systems.
Supporting evidence: Literature review
–
Supporting evidence:
Stakeholder meetings
–
Supporting evidence: Workshops
“Need to review data that exists e.g. lamb emission data – lamb is just below beef in terms of emissions, which is unusual as they are the most extensively reared. Environmental impact takes into account amount of land you are using and in NZ where herd size is bigger but they are confined to smaller areas and use hard feed, and somehow they are more emission friendly? it seems Scotland is penalised for highland roaming. i think we need to get a new calculation for this.”
(Workshop 3).
Define specific emissions reduction goals for beef production
While Scotland has national emissions targets, it lacks sector-specific goals for beef production, a major contributor to agricultural emissions.
Supporting evidence: Literature review
No Sector-Specific GHG Reduction Targets for Beef Farming
While Scotland has national emissions targets, no specific reduction goals exist for beef production.
Develop a centralised database for methane efficiency traits in livestock
Unlike Ireland’s cattle breeding data system, Scotland lacks an integrated tool to track genetic progress in methane reduction, limiting breeding efficiency. [13]
Supporting evidence: Literature review
Scotland lacks a centralised database for methane traits in livestock, like the Irish Cattle Breeding Federation (ICBF). Integration with existing breeding tools like ScotEID and EGENES is needed to track genetic progress, alongside cross-country collaboration to enhance data sharing and breeding efficiency
(Jenkins, Herold, de Mendonça et al., 2024).
Supporting evidence:
Stakeholder meetings
–
Supporting evidence: Workshops
–
Increase farmer awareness and uptake of precision livestock farming (PLF) technologies
Many farmers do not view PLF tools as effective for reducing greenhouse gas emissions, limiting their adoption despite proven environmental benefits.
Supporting evidence: Literature review
Many farmers do not perceive PLF tools as effective greenhouse gas (GHG) reduction strategies, despite their proven benefits, limiting adoption. Policy intervention: Increase extension services, training programs, and peer-to-peer learning initiatives.
(Ferguson, Bowen, McNicol et al., 2024).
Supporting evidence:
Stakeholder meetings
–
Supporting evidence: Workshops
–
Enhance technological capacity for supply chain resilience against climate disruptions
The potential of technology to improve the resilience of food supply chains against climate-related disruptions remains underutilised.
Supporting evidence: Literature review
–
Supporting evidence:
Stakeholder meetings
Technology for Supply Chain Resilience: The potential of emerging and existing technologies to strengthen the resilience of food supply chains in the face of climate-related disruptions remains significantly underexplored and underutilised. Digital tools, data analytics, automation, and innovations offer opportunities to improve monitoring, forecasting, and responsiveness across the supply chain. However, their application in building climate resilience is still limited, and greater attention is needed to scale up these solutions and integrate them into policy and practice.
(Stakeholder Meeting 8).
Supporting evidence: Workshops
–
3. Food Consumption and Emissions Attribution Issues
Improve food consumption data accuracy for policy evaluation
High-emission foods like meat and dairy are often underreported in dietary assessments, limiting the accuracy of policy evaluations.
Supporting evidence: Literature review
Recognising underreporting issues, especially for high-emission foods like meat and dairy, could guide improvements in dietary assessment methods Underreporting in Food Consumption Data: Recognizing underreporting issues, especially for high-emission foods like meat and dairy, could guide improvements in dietary assessment methods. Policies might encourage better data collection and reporting to ensure more accurate emissions assessments and tailored dietary interventions.
(Jaacks, Frank, Vonderschmidt et al., 2024).
Supporting evidence:
Stakeholder meetings
–
Supporting evidence: Workshops
–
Enhance food origin tracking for accurate emissions attribution
The absence of comprehensive tracking for imported and processed Scottish foods makes it difficult to develop precise climate policies.
Supporting evidence: Literature review
Need for comprehensive information on the origins of foods consumed in Scotland to improve emissions accounting. The absence of detailed data, particularly for Scottish produce that is processed abroad and reimported, hinders accurate emissions attribution and the development of effective climate policies.
(Jaacks, Frank, Vonderschmidt et al., 2024).
Supporting evidence:
Stakeholder meetings
–
Supporting evidence: Workshops
“Scottish solutions and data are needed to tackle climate change in Scotland. We need national data and should stop using international data for GHGE and water use for our modelling.”
(Workshop 1).
Increase the granularity of Scotland’s net-zero emissions data
Scotland’s emissions tracking system focuses on high-level data without accounting for regional variations, reducing policy precision.
Supporting evidence: Literature review
Need for comprehensive information on the origins of foods consumed in Scotland to improve emissions accounting. The absence of detailed data, particularly for Scottish produce that is processed abroad and reimported, hinders accurate emissions attribution and the development of effective climate policies Data Gaps in Food Production Origins: The report identifies a need for detailed information on the origins of foods consumed in Scotland. This information is essential for accurately attributing emissions, particularly as some Scottish produce is processed outside Scotland before being reimported for local consumption. Policy could address this by improving traceability in food supply chains.
(Jaacks, Frank, Vonderschmidt et al., 2024).
Supporting evidence:
Stakeholder meetings
–
Supporting evidence: Workshops
–
Assess the sustainability impacts of plant-based alternatives
Clear methodologies are required to compare the sustainability of plant-based meat alternatives with traditional meat products.
Supporting evidence: Literature review
–
Supporting evidence:
Stakeholder meetings
Assessing Sustainability of Plant-Based Alternatives: Robust and transparent methodologies are urgently needed to assess the sustainability of plant-based meat alternatives in comparison to conventional meat products. Current assessment approaches often vary widely in scope and metrics, making it difficult to draw consistent conclusions about environmental, nutritional, and socio-economic impacts. Developing standardised frameworks would enable clearer comparisons, guide consumers and policymakers, and support innovation in the alternative protein sector.
(Stakeholder Meeting 13).
Supporting evidence: Workshops
–
Use digital tools to promote local, ethical, and sustainable food choices
Encourage consumers to connect with local suppliers and assess animal welfare and product quality through observable online rating systems.
Supporting evidence: Literature review
–
Supporting evidence:
Stakeholder meetings
–
Supporting evidence: Workshops
“Use digital shopping to encourage people to find and use local suppliers of animal produce and check welfare/quality – like a Tripadvisor score.”
(Workshop 1).
Expand infrastructure and technical support for local food systems
There is inadequate policy support for expanding infrastructure and providing technical assistance to scale up local and regional food production.
Supporting evidence: Literature review
There is currently a lack of dedicated funding mechanisms or targeted incentives to support the scaling up of low-carbon technologies within food production and processing. This gap limits the widespread adoption of innovations that could significantly reduce greenhouse gas emissions across the sector. Without strategic investment and policy support, many promising technologies remain at the pilot or early adoption stage, limiting their potential to contribute to national climate goals and a more sustainable food system.
(Sovacool, Bazilian, Griffiths et al., 2021).
Supporting evidence:
Stakeholder meetings
–
Supporting evidence: Workshops
–
Appendix K: Extended Legal analysis: Areas for further policy development and supporting evidence
Key Theme
Area For Policy Development
1. Regulatory Gaps in Sustainable Food Systems and Supply Chains
Strengthen regulation and incentives for low-carbon food production
There are no targeted resources, tax benefits, or regulatory measures to encourage low-carbon food production, limiting sustainability efforts.
Supporting evidence: Literature review
Lack of specific policies to incentivise low-carbon food production or regulate high-emission food products. The absence of targeted subsidies, tax benefits, or regulatory measures limits the transition to more sustainable food systems and weakens efforts to reduce the environmental impact of food production and consumption.
(Milner, Green, Dangour et al. (2015).
Supporting evidence:
Stakeholder meetings
–
Supporting evidence: Workshops
–
Enhance the polluter-pays principle and support for sustainable farming
Inadequate enforcement of environmental accountability and limited financial support for farmers transitioning to sustainable practices slow climate-resilient food system reforms.
Supporting evidence: Literature review
Enforcement of the polluter-pays principle[14] remains inadequate, with limited financial incentives and regulatory measures to ensure industry accountability. Additionally, there is insufficient support for farmers transitioning to environmentally sustainable practices, limiting progress toward a more climate-resilient food system.
Weak regulations allow power imbalances between large corporations and small producers to persist, reinforcing supply chain inequalities and environmental harm. Regulating supply chains avoids the barrier of relying on voluntary behaviour change.
Supporting evidence: Literature review
Regulatory gaps constrain efforts to ensure fairness and transparency in supply chains, particularly in addressing power imbalances between large corporations and small producers. Weak enforcement of fair practices within the food supply chain sustains inequalities and contributes to environmental harm.
(Food, Farming and Countryside Commission (FFCC), 2024).
Supporting evidence:
Stakeholder meetings
–
Supporting evidence: Workshops
–
Expand the reach of the Good Food Nation (Scotland) Act
The GFN Act primarily governs public sector food policies but lacks mechanisms to regulate supermarkets, food manufacturers, and large-scale agricultural producers.
Supporting evidence: Literature review
Limited Leverage Over the Private Sector:
The GFN Act focuses primarily on public sector food policy but does not impose obligations on supermarkets, food manufacturers, or large-scale agricultural producers.
Without mandatory private sector participation, major food system emissions and supply chain issues may remain unaddressed.
(Brennan, 2023).
Supporting evidence:
Stakeholder meetings
–
Supporting evidence: Workshops
–
Clarify the role of carbon markets in agriculture
Farmers struggle to engage in carbon markets due to unclear regulations, unstable pricing, and a lack of standardised methodologies.
Supporting evidence: Literature review
Scottish farmers have limited engagement with carbon markets due to a lack of standardised methodologies, clear regulations, and stable pricing mechanisms. This uncertainty prevents broader participation, reducing opportunities for farmers to benefit financially from carbon sequestration efforts and limiting the agricultural sector’s contribution to climate mitigation.
(Baker, Conquest & Moxey, 2023).
Supporting evidence:
Stakeholder meetings
–
Supporting evidence: Workshops
–
Enhance retailer accountability in a sustainable food system
Retailers are not required to report Scope 3 emissions from the products they buy and sell, limiting accountability for sustainability impacts.
Supporting evidence: Literature review
Regulatory Influence and Future Expectations: i. Some firms voluntarily disclose their emissions through the Science Based Targets initiative (SBTi). ii. While there is currently no legal requirement to reduce Scope 3 emissions, emerging policy signals indicate that more stringent regulations are likely in the future.
(Baker, Conquest & Moxey, 2023).
Supporting evidence:
Stakeholder meetings
–
Supporting evidence: Workshops
–
Support local and regenerative food production
Local food systems face barriers such as limited land and sea access and complex licensing requirements that disadvantage smaller producers.
Supporting evidence: Literature review
–
Supporting evidence:
Stakeholder meetings
–
Supporting evidence: Workshops
“Access to land, access to seas, complex licensing systems that play into the hands of multinational corporations who have the means and expertise to complete these.”
(Workshop 1).
2: Regulation of Food Marketing, Composition, and Consumer Information
Strengthen regulation of unhealthy food promotions
Weak marketing rules allow unhealthy food advertising that worsens health inequalities. Stronger regulation and fiscal measures are needed to shift sales toward healthier, sustainable options.
Supporting evidence: Literature review
Impact of food promotions on diet:
Unhealthy foods are heavily promoted, influencing consumer choices and increasing the purchase of unhealthy items.
Children in lower-income areas are more exposed to unhealthy food marketing and have higher childhood obesity rates.
Cost-of-living pressures have made nutritious food less affordable, worsening dietary inequalities. Weak oversight of marketing and promotional strategies for less healthy food options allows widespread exposure, particularly in vulnerable communities. This lack of regulation risks exacerbating health inequalities by reinforcing dietary patterns linked to poor health outcomes.
(Public Health Scotland (PHS), 2024).
Supporting evidence:
Stakeholder meetings
–
Supporting evidence: Workshops
–
Establish nutritional and environmental standards for out-of-home food
The absence of comprehensive regulations for food sold in restaurants, cafes, and takeaways weakens policy efforts to promote healthier and more sustainable dietary habits. There is also a lack of sufficient planning levers to regulate food outlets.
Supporting evidence: Literature review
Sustainability Measures:
There is a lack of policies addressing the environmental impacts of takeaway packaging and food delivery systems.
Nutritional Standards for Out-of-Home (OOH) Foods
Regulation of high-calorie, high-salt, and high-sugar foods sold out-of-home remains limited.
Promotion Regulation
Oversight of promotions for less healthy food options—particularly in quick service restaurants (QSRs)—is weak.
Equity in Access
Current policies do not adequately ensure that healthier OOH food options are affordable and accessible for lower-income communities.
(Food Standards Scotland (FSS), 2021b).
Supporting evidence:
Stakeholder meetings
–
Supporting evidence: Workshops
–
Mandate reformulation requirements for unhealthy foods
The reliance on voluntary industry commitments for food reformulation weakens public health efforts, as there are no legal obligations for reducing unhealthy ingredients.
Supporting evidence: Literature review
The UK and Scottish Governments rely on voluntary industry measures for food reformulation, with no legal obligation for companies to reduce unhealthy ingredients. This weakens efforts to improve public health and reduce diet-related diseases, leaving progress dependent on inconsistent voluntary compliance. Lack of mandatory reformulation:
The UK and Scottish Governments support mandatory reformulation only if voluntary efforts fail.
Currently, there is no legal requirement for companies to reformulate unhealthy foods.
(Obesity Action Scotland (OAS), 2019).
Supporting evidence:
Stakeholder meetings
–
Supporting evidence: Workshops
–
Implement carbon footprint labelling for food
There are currently no mandatory requirements for carbon footprint labelling on food products, which limits consumers’ ability to make informed, low-emission dietary choices.
Supporting evidence: Literature review
Regulation and Accountability a. Despite growing emphasis on emissions reduction, there are no mandatory requirements for carbon footprint labelling on food products, limiting consumers’ ability to make informed low-emission choices. b. Regulatory mechanisms to ensure business compliance with carbon labelling, food waste reduction, and sustainable practices remain weak.
(Climate Change Committee, 2020).
Supporting evidence:
Stakeholder meetings
–
Supporting evidence: Workshops
–
Ensure the right to adequate nutrition
Dietary policies must uphold human rights by ensuring all populations, particularly marginalised communities, have equitable access to nutritious food.
Supporting evidence: Literature review
–
Supporting evidence:
Stakeholder meetings
Ensuring the right to adequate nutrition: Issues surrounding the right to adequate nutrition, particularly for marginalized communities, have been highlighted. Dietary policies must align with human rights obligations to ensure equitable access to nutritious food for all populations.
(Stakeholder Meeting 4).
Supporting evidence: Workshops
–
Address gaps in food standards, including non-dairy milk fortification
The absence of mandatory fortification for non-dairy milk alternatives raises concerns about potential nutritional inadequacies for populations relying on these products as dairy substitutes.
Supporting evidence: Literature review
–
Supporting evidence:
Stakeholder meetings
Gaps in food standards, including non-dairy milk fortification: There are gaps in regulatory frameworks related to food standards, including the lack of mandatory fortification for non-dairy milk alternatives. This may contribute to nutritional inadequacies among populations that rely on these products as dairy substitutes.
(Stakeholder Meeting 13).
Supporting evidence: Workshops
–
3: Legal and Governance Barriers to Policy Implementation
Align devolved and UK dietary policies
Legal complexities in the division of powers create difficulties in developing cohesive dietary and climate policies across the UK, leading to inconsistencies between devolved administrations and the UK Government.
Supporting evidence: Literature review
–
Supporting evidence:
Stakeholder meetings
Challenges in aligning devolved and UK dietary policies: Aligning diet and climate policies between devolved administrations (e.g., Scotland) and the UK Government presents legal challenges. The division of powers complicates the development of cohesive dietary policies, resulting in inconsistent approaches across the UK.
(Stakeholder Meeting 9).
Supporting evidence: Workshops
–
Manage legal risks from dietary shifts
There are concerns that dietary guidelines encouraging reduced meat and dairy consumption could lead to nutrient deficiencies, creating potential legal risks if public health is adversely affected.
Supporting evidence: Literature review
–
Supporting evidence:
Stakeholder meetings
Legal risks from unintended nutritional deficiencies: Stakeholders have raised concerns about potential legal risks if dietary guidelines inadvertently lead to health issues, such as nutrient deficiencies. This is particularly relevant with blanket recommendations to reduce meat and dairy consumption without considering adequate nutritional alternatives.
(Stakeholder Meeting 9).
Supporting evidence: Workshops
–
4: Administrative and Market Challenges in Sustainable Agriculture
Evaluate the effectiveness of carbon audits in agriculture
While carbon audits for farmers are encouraged, they lack enforceable targets or evidence of significant emissions reductions, making them more bureaucratic than effective.
Supporting evidence: Literature review
Limited Impact of Carbon Audits:
There is no clear evidence that carbon audits have led to significant emission reductions in Scottish agriculture.
Administrative Burden and Costs:
Farmers must provide carbon data to multiple buyers, leading to high reporting demands.
Uncertainty About Market-Based Carbon Incentives:
Voluntary carbon credit markets are underdeveloped, leading to hesitation from farmers.
(Baker, Conquest & Moxey (2023).
Supporting evidence:
Stakeholder meetings
–
Supporting evidence: Workshops
–
Appendix L: Extended Environmental analysis: Areas for further policy development and supporting evidence
Key Theme
Area For Policy Development
1. Land Use, Tenure, and Access for Sustainable Agriculture
Improve land tenure security for community food systems
Temporary land use agreements create instability for community gardens, while bureaucratic hurdles, insecure tenure, and limited land availability continue to restrict community food-growing efforts, despite the Community Empowerment (Scotland) Act 2015.[15]
Supporting evidence: Literature review
While the importance of secure land access for community gardens is acknowledged, the prevalence of temporary land use arrangements creates instability, limiting long-term planning and the sustainability of community-based food initiatives.
(Meyerricks, & White, 2021).
Supporting evidence: Stakeholder meetings
–
Supporting evidence: Stakeholder workshops
“Need community to take on land and community need funding to do so. There is something about learning from crofting practices in the context of a sustainable food system. Some challenges are related to the free market and the crofting regulation, the right to buy and the lack of regulation.”
(Workshop 4).
Support new agroecological farmers with land and financial access
New farmers struggle to secure land and financial resources, limiting the transition to sustainable farming systems.
Supporting evidence: Literature review
Limited access to secure land tenure and financial support remains a significant barrier for new entrants into farming, even though this group is often more open to adopting agroecological and sustainable practices. Addressing these access issues is essential to enable a new generation of climate-conscious farmers.
(Lozada & Karley, 2022).
Supporting evidence: Stakeholder meetings
Land ownership and affordability issues: Competition and rising land costs are pricing out farmers, limiting opportunities for sustainable agricultural transitions.
(Stakeholder Meeting 1).
Supporting evidence: Stakeholder workshops
–
Strengthen strategic oversight for land use change
Unregulated forestry expansion risks displacing agricultural land without a public interest test or requirements for net carbon sequestration assessment.
Supporting evidence: Literature review
Market-driven forestry expansion poses a risk of displacing agricultural land without adequate strategic oversight. There is currently no requirement for a “public interest test” to assess the impact of afforestation on farming, nor a mandate for large forestry projects to demonstrate long-term net carbon sequestration, limiting sustainable land use planning and balance between agriculture and forestry.
(Scottish Government, 2024).
Supporting evidence: Stakeholder meetings
–
Supporting evidence: Stakeholder workshops
“The ARCZero[16] pilot in Northern Ireland showed that well managed grazing land stores more carbon in the soil and promotes more biodiversity than forestry. SG should account for this when planning future goals for land use.”
(Workshop 3).
Develop alternative land use strategies for rough grazing areas
There is no clear plan for repurposing Scotland’s vast rough grazing areas, limiting sustainable land management and biodiversity conservation. Livestock farming remains the only viable option for some land.
Supporting evidence: Literature review
There is no clear plan for repurposing the 60% of Scotland’s rough grazing land that may not be suitable for crop production. The absence of strategic land use policies limits opportunities for sustainable land management, climate mitigation, and biodiversity conservation.
(Kennedy, Clark, Stewart et al., 2025).
Supporting evidence: Stakeholder meetings
–
Supporting evidence: Stakeholder workshops
“Reducing livestock farming=farming concerns and biodiversity concerns-livestock farming only viable thing for certain land.”
(Workshop 1).
Recognise the role of grazing land in carbon sequestration and biodiversity
Well-managed grazing land can sequester more carbon and support greater biodiversity than forestry, which should be considered in Scotland’s land-use planning.
Supporting evidence: Literature review
Afforestation projects are viewed as potentially effective measures for carbon sequestration and therefore climate change mitigation. Much of the land in temperate regions suitable for afforestation is used for agriculture and consequently afforestation of farmland is frequently proposed. Landowners are commonly reluctant to sacrifice fertile land for purposes other than food and feed production. In Scotland’s uplands, grazed pastures are a common land use that could be put under pressure by demands for woodland planting. This chapter explores how farm woodland planting for carbon sequestration and biofuel production affects livestock output. The concepts presented show that there is great potential for integrating agriculture and forestry to achieve environmental benefits without compromising productivity.
(Beckert, Smith & Chapman, 2016).
Supporting evidence: Stakeholder meetings
–
Supporting evidence: Stakeholder workshops
“The ARCZero pilot in Northern Ireland showed that well managed grazing land stores more carbon in the soil and promotes more biodiversity than forestry. SG should account for this when planning future goals for land use.”
(Workshop 3).
Balance livestock reduction with land use trade-offs
With more than 85% of Scottish farmland classified as ‘Less Favoured Area’ (LFA) and often unsuitable for plant protein cultivation, reducing livestock could disrupt feed crop markets and impact farm incomes. Addressing mixed messages on CO₂ impacts of extensively grazed grasslands versus forestry is needed while ensuring food production resilience in a changing climate.
Supporting evidence: Literature review
Afforestation is widely regarded as a promising strategy for carbon sequestration and climate change mitigation. However, much of the land suitable for afforestation in temperate regions is already used for agriculture, leading to frequent proposals for planting trees on farmland. Landowners are often hesitant to give up productive land traditionally used for food and feed. In Scotland’s uplands, where grazed pasture is common, there is particular concern about the impact of woodland expansion on livestock farming. This article examines how woodland planting for carbon sequestration and biofuel production can influence livestock output. It highlights the significant potential for integrating forestry and agriculture in ways that deliver environmental benefits without reducing overall productivity.
(Beckert, Smith & Chapman, 2016).
Supporting evidence: Stakeholder meetings
–
Supporting evidence: Stakeholder workshops
“Don’t forget >85% of Scottish farmland is ‘less favoured’ so mostly cannot be used to grow plant proteins. Also poor quality crops are sold for animal feed. A reduction in livestock will impact this market and reduce farm incomes.”
(Workshop 3).
Acknowledge biophysical limitations on agriculture
Natural constraints determine what crops can be grown in different regions, influencing food production and sustainability.
Supporting evidence: Literature review
In Scotland, natural constraints such as climate, soil quality, altitude, and water availability significantly shape agricultural decisions—especially regarding what crops can be grown and where. These physical limitations, in combination with socio-economic and policy considerations, influence both food production capacity and agricultural sustainability. This article reviews how regional climate and infrastructure influence where legumes can be grown, considering their role in sustainable agriculture.
(Wiltshire, Freeman, Willcocks et al., 2021).
Supporting evidence: Stakeholder meetings
–
Supporting evidence: Stakeholder workshops
“Biophysical constraints on what can be grown. Lobby groups preserving industries. Reputation of Scottish food producers.”
(Workshop 1).
2. Areas for Policy Development in Agricultural Climate Mitigation and Adaptation
Current policies measure emissions from specific foods but fail to consider how broader agricultural and food system changes could drive more effective climate mitigation.
Supporting evidence: Literature review
Current assessments highlight emissions from specific foods but fail to consider the broader impact of systemic shifts in agricultural practices and food system transformations, limiting opportunities for comprehensive climate mitigation strategies.
(Nneli, Revoredo-Giha & Dogbe, 2023).
Supporting evidence: Stakeholder meetings
–
Supporting evidence: Stakeholder workshops
–
Avoid rebound effects in precision livestock farming (PLF) efficiency gains
Productivity improvements from PLF could inadvertently lead to higher total emissions if herd expansion offsets efficiency gains.
Supporting evidence: Literature review
There is a risk that productivity gains from Precision Livestock Farming (PLF) could lead to an overall increase in total emissions, as improved efficiency per unit could be offset by herd expansion.
(McNicol, Bowen, Ferguson et al., 2024).
Supporting evidence: Stakeholder meetings
–
Supporting evidence: Stakeholder workshops
–
Strengthen policy responses to climate risks in agriculture
Policies fail to address the financial impact of extreme weather on farming, lack strategies for water conservation, and fail to enforce improved soil management.
Supporting evidence: Literature review
Current policies fail to sufficiently address the financial impacts of extreme weather on agriculture, particularly within the beef sector. Water scarcity risks remain unmanaged due to the lack of strategies for rainwater capture and groundwater conservation. Furthermore, despite increasing concerns about soil degradation, there are no clear policy requirements for improved soil management.
SAC Consulting, n.d.).
Supporting evidence: Stakeholder meetings
Fragmented governance across Government divisions, leading to disjointed approaches to diet, climate, and health policies: Disjointed approaches to diet, climate, and health policies due to lack of coordinated structures.
(Stakeholder Meeting 3).
Supporting evidence: Stakeholder workshops
–
Integrate grazing land’s role in biodiversity and carbon capture
Policies fail to recognise the role of sustainable grazing systems in enhancing biodiversity and carbon sequestration.
Supporting evidence: Literature review
Current policies do not fully acknowledge or integrate the potential role of grazing systems in supporting biodiversity and carbon sequestration. The absence of clear guidelines or incentives limits opportunities to enhance sustainable grazing practices that contribute to environmental and climate goals
National Farmers Union Scotland (NFUS , n.d.).
Supporting evidence: Stakeholder meetings
–
Supporting evidence: Stakeholder workshops
–
Address localised environmental impacts of intensive farming
While overall farming emissions may appear low across systems, specific regions with intensive agricultural activities experience significant localized environmental impacts.
Supporting evidence: Literature review
The use of nitrogen fertilisers in agriculture is a major contributor to nitrous oxide (N₂O) emissions — a potent greenhouse gas. Reducing these emissions poses a significant global challenge, and doing so requires reliable methods for estimating N₂O output across different farming systems. Scientists commonly rely on biogeochemistry (BGC) models to estimate soil-based emissions, but these models can present difficulties: large-scale studies often lack local detail, while small-scale studies may not be widely applicable. In addition, many studies provide limited information on the reliability of their results. This study took a novel approach by focusing on eastern Scotland, a region with well-documented farming practices. Researchers applied a robust BGC model to assess N₂O emissions, nitrate (NO₃) leaching, and nitrogen uptake in crops such as barley, wheat, and oilseed rape. The high-resolution modelling revealed that although eastern Scotland’s intensive cropping systems are efficient, they exhibit elevated N₂O emission intensities per hectare, largely due to the use of synthetic fertilisers.
(Myrgiotis, Williams, Rees et al., 2019).
Supporting evidence: Stakeholder meetings
Localised environmental impacts of emissions-intensive farming: While the overall environmental impact of farming may be low when averaged across systems, localized environmental impacts can be significant, particularly in areas with emissions-intensive agricultural activities.
(Stakeholder Meeting 8).
Supporting evidence: Stakeholder workshops
–
Balance environmental goals with socioeconomic sustainability
Environmental goals can coexist with job security and the sustainability of fragile communities, but current policy does not always reflect this balance.
Supporting evidence: Literature review
This study explores what it means to be a responsible farm business in today’s world, especially after COVID-19 and Brexit. Being a responsible business involves tackling poverty, inequality, and environmental harm, but different groups—like customers, the media, and global organisations—have different views on what that means.
Farms are part of a complex rural system filled with tensions and contradictions. This research focuses on how farmers can understand and manage these tensions to run more responsible and sustainable businesses.
Using data from one farm and interviews with five others in the same community, the study develops a framework to show how farmers balance competing demands. It looks at how farmers’ entrepreneurial mindset (or Entrepreneurial Orientation, EO) is shaped by experience and changing times.
The study argues that good policies, informed by real-world farming experiences, can support responsible decision-making.
(Smith, Duncan, Edward et al., 2021).
Supporting evidence: Stakeholder meetings
–
Supporting evidence: Stakeholder workshops
“An acknowledgement that supporting our environment does not need to come at the expense of jobs or supporting fragile communities.”
(Workshop 1).
Understand the complexities of meat production and consumption
Variations in where meat is produced and consumed across the UK and internationally influence territorial emissions differently, shaping the regional impacts of dietary change.
Supporting evidence: Literature review
Highlights how territorial specialization in meat production and consumption across Europe creates uneven nitrogen and GHG burdens. Countries like the UK import much of their animal feed and meat, meaning dietary change impacts vary regionally based on local vs outsourced emissions.
(Billen, Aguilera, Einarsson et al., 2021).
Supporting evidence: Stakeholder meetings
–
Supporting evidence: Stakeholder workshops
“Complexities around where especially meat is produced and where it is consumed across the UK and internationally. Changes in diet in different regions will affect territorial emissions differently.”
(Stakeholder Workshop 3).
Rethink agri-tech and livestock systems for sustainability
Climate and environmental protection should focus on transforming food systems and reducing reliance on livestock feed crops like soy, rather than shifting all animals indoors.
Supporting evidence: Literature review
UK livestock systems rely heavily on imported soy. Holmes proposes a shift to legume-supported agroecology, noting this is better for soil, climate, and economic sovereignty.
(Holmes, 2018).
Supporting evidence: Stakeholder meetings
–
Supporting evidence: Stakeholder workshops
“Issues around agri tech and comms being that to protect climate and the environment, we do not need to put all animals indoors, rather than addressing the food systems themselves and the dependence we have on livestock production and the impact of feeding livestock e.g. deforestation to produce soy that only goes to feed livestock.”
(Workshop 3).
Ensure net zero goals align with animal welfare standards
Efforts to intensify food production for climate targets must not compromise animal welfare standards.
Supporting evidence: Literature review
Climate change affects agriculture in many different ways. The CCC advises that adaptation efforts should address risks such as flooding, heavier rainfall, and rising temperatures. It also recommends improving the sector’s ability to handle new challenges like shifting pest and disease patterns.
These climate impacts will affect multiple areas of farming. For instance, both crops and livestock will face heat stress and a rise in pests and diseases due to warmer, wetter conditions. Waterlogged soils can reduce crop yields, while livestock may suffer from lower welfare, affecting fertility and production, such as milk yields.
(Jenkins, Avis, Willcocks et al., (2023).
Supporting evidence: Stakeholder meetings
–
Supporting evidence: Stakeholder workshops
“Animal welfare: Intensifying food production to meet net zero goals could come at the expense of animal welfare.”
(Workshop 4).
3: Environmental Impacts and Food Systems
Address the environmental impact of ultra-processed foods
Ultra-processed foods, including those from large fast-food chains, often have a high environmental footprint and run counter to principles of sustainable food culture.
Supporting evidence: Literature review
Global food systems are increasingly unsustainable for human health, the environment, animal welfare, biodiversity, food culture, social equity, and small-scale farmers. While the high consumption of animal-based foods has long been seen as a key contributor to this problem, growing attention is now being paid to the role of ultra-processed foods (UPFs).
This review examines whether concerns about UPFs are valid. It looks at the typical ingredients and additives in UPFs and the farming practices used to produce them. The findings show that UPFs are closely linked to emissions-intensive farming and livestock systems, and they negatively impact nearly every aspect of food system sustainability. This is largely due to the global spread of cheap, highly processed products made from low-cost ingredients.
Although UPFs generally have lower greenhouse gas emissions than conventional meat and dairy, especially those low in animal-based calories, reducing UPF consumption—without replacing it with other energy-dense foods—can still lead to significant environmental benefits.
To improve sustainability, the review recommends cutting back on UPFs and shifting toward minimally processed, seasonal, organic, and locally produced foods.
(Fardet & Rock, 2020).
Supporting evidence: Stakeholder meetings
Environmental impact of ultra-processed foods: Ultra-processed foods, such as those offered by large fast-food chains (e.g., Domino’s Pizza), are often inconsistent with the principles of a sustainable food culture due to their high environmental footprint.
(Stakeholder Meeting 11).
Supporting evidence: Stakeholder workshops
–
Strengthen food system resilience against climate and supply risks
Enhancing farm resilience to weather extremes, power disruptions, and crop variability by reconsidering older, more resilient crop varieties, reducing dependence on a limited range of crops, and growing local varieties better suited to conditions. Greater policy focus is needed on planning and adaptation strategies to support farmers facing climate-related disruptions.
Supporting evidence: Literature review
Report on analysis highlighting how much of Scotland’s traditional food culture connected to native plants has been lost, with significant implications for climate resilience. This loss is rooted in historical events such as land enclosure, the Highland Clearances, the dissolution of monasteries, and strict regulation of industries like whisky production, which excluded traditional local ingredients. These processes contributed to the erasure of knowledge and practices around native plants—plants that could play a vital role in adapting to climate change through low-input, locally adapted food systems.
(Lozada & Karley, 2022).
Supporting evidence: Stakeholder meetings
–
Supporting evidence: Stakeholder workshops
“We need to be more resilient. Even weather concerns > power cuts etc. can have a huge impact on the resilience of a farm. A bad year of weather patterns can completely skew a crop trial, and previous variants that we maybe do not use/grow as much now, could potentially be more resilient. Poultry especially is much more sensitive to zoonotic/disease strains around years ago.”
(Workshop 3).
How to cite this publication:
Nash, N. (2025) Analysing a Complex Policy Landscape: Diet and Climate in Scotland’, ClimateXChange. DOI
While every effort is made to ensure the information in this report is accurate, no legal responsibility is accepted for any errors, omissions or misleading statements. The views expressed represent those of the author(s), and do not necessarily represent those of the host institutions or funders.
This work was supported by the Rural and Environment Science and Analytical Services Division of the Scottish Government (CoE – CXC).
If you require the report in an alternative format such as a Word document, please contact info@climatexchange.org.uk or 0131 651 4783.
A second in-person workshop (Workshop 2) was planned in Edinburgh on Friday 24th January but had to be cancelled at the last minute due to disruption from Storm Eowyn. ↑
Initial steps that can be taken using existing structures or resources. Includes scoping, piloting, stakeholder engagement, and coordination-building activities. ↑
Actions that require broader collaboration, policy alignment across sectors, or formal programme development. Often builds on earlier pilots or evidence. ↑
Longer-term actions requiring legislative change, significant investment, or systemic redesign. These aim to embed lasting transformation. ↑
Scotland’s Agricultural Reform Programme, particularly through greening payments and conditional support mechanisms (e.g., environmental conditionality), does include some financial incentives intended to encourage more sustainable production. ↑
Meeting 14 involved a group meeting rather than a one-to-one meeting, in which multiple participants contributed to the conversation. ↑
Note: The online workshops omitted the future scenarios activity due to time constraints but retained the same core activities and objectives. ↑
NB: Workshop 2 was cancelled the day before it was due to take place because of Storm Eowyn. ↑
Integrated cattle breeding data systems allow the tracking of genetic traits of livestock over time. This can include feed efficiency and methane emissions. By linking performance data to genetic profiles, these systems support selective breeding for lower-emission animals. Without such a tool, it is more difficult to monitor and accelerate genetic progress toward reducing methane emissions from cattle in a coordinated and efficient way. ↑
An environmental policy principle stating that those who produce pollution should bear the costs of managing it to prevent damage to human health or the environment. ↑
The Community Empowerment (Scotland) Act 2015 is legislation that aims to strengthen the voices of communities in decisions that affect them. It gives communities additional rights and opportunities to influence public service provision, ownership of land and buildings, and participation in local planning and decision-making to improve outcomes. See Community Empowerment (Scotland) Act 2015↑
The ARCZero project is a farmer-led initiative in Northern Ireland aimed at measuring and managing carbon flows within agricultural systems to achieve net-zero carbon emissions. Comprising seven diverse farms, the project employs advanced techniques such as detailed soil sampling and LiDAR scanning to assess both greenhouse gas emissions and carbon sequestration capacities. By establishing comprehensive carbon balance sheets, ARCZero empowers farmers to implement informed strategies that reduce emissions and enhance carbon storage, contributing to more sustainable and climate-resilient farming practices. ↑
Scotland’s construction industry relies heavily on traditional primary aggregates. Lower carbon alternatives such as recycled concrete and incineration bottom ash aggregates are gaining traction. Innovations in recycling technology have improved the feasible quality and consistency of alternatives to primary aggregates, leading to greater acceptance among contractors and suppliers.
This study seeks to investigate the availability of alternatives to primary aggregates and analyse barriers to their uptake through literature review, data collection and stakeholder engagement. We also provide four case studies of where alternatives to primary aggregates have been used in Scotland.
Findings
We have found that alternatives to primary aggregates can reduce greenhouse gas emissions significantly, with local sourcing further amplifying these benefits. However, logistical and supply chain challenges may limit these benefits when transportation distances exceed certain thresholds. As such, while there are promising pathways for the increased use of alternatives to primary aggregates in Scotland, strategic actions would be required to address existing barriers and to support the transition towards a more sustainable construction sector.
There are three key interrelated challenges to facilitating increased deployment of alternatives to primary aggregates in Scotland. These are technical viability and infrastructure, standards and market demand, and data availability.
Technical viability and infrastructure: Technical viability of alternatives to primary aggregates is improving. Investment in construction and demolition waste (CDW) infrastructure in Scotland has led to improvements in the purity and quality of alternatives to primary aggregates over the last 10 years. Advanced CDW recycling facilities are prevalent across the central belt, but their reach is limited in rural areas due to logistical and operational challenges, limiting uptake in these regions. Similar to the primary aggregates market, the market for alternatives is characterised by low profit margins, with producers of alternative aggregates also facing high investment costs for the development and expansion of recycling infrastructure. Stakeholders proposed incentivising recycling of recovered flat glass from construction and demolition projects through collaboration with the Scottish food and drink sector.
Standards and market demand: Some stakeholders suggested updating procurement specifications and regulations to reflect the advances in recycling technology noted above. Broader use of alternatives to primary aggregates is restricted by industry standards and related concerns regarding structural performance. Clients are generally risk-averse and influenced by uncertainties in technical performance quality. This limits market demand. Demand for alternatives to primary aggregates is also limited by competition from traditional materials.
Data availability: Although aspired to in this study, it was not possible to meaningfully forecast the availability of alternatives to primary aggregates. Low engagement generated limited responses and did not provide a representative dataset of material availability. Without more consistent and granular data, it is not possible to derive a robust definition of the volumes of materials available. That data is not systematically collected and stored as there is no real regulatory or client-led requirement for it, related to the points above. Evidencing the potential for adequate technical performance is difficult when the existing standards are thought by some to not fully reflect what is possible with modern processing techniques. It is difficult to make the business case for investment in a review and potential revision of standards without understanding the potential scale of environmental and economic impact, which is related to the need for more data.
In the context of the Scottish Aggregates Tax and other potential fiscal initiatives, there are two headline takeaways from this work:
Until robust and reliable Scotland-specific data on volumes of alternatives to primary aggregates is collected, any perceived benefits of tax rate changes will be somewhat speculative.
Potential subsidies for alternatives to primary aggregates are considered here at high level. Further work would be required to conduct a thorough assessment of the viability of any such scheme, which would, again, necessitate much more complete data than is currently available.
Further research
We have learned lessons that could inform future research:
Forecasting the availability of alternatives to primary aggregates in the Scottish construction sector is limited by significant data gaps that prevents meaningful baselining of their use.
Any future studies should factor in a longer data collection period to improve response rates.
A technical review of existing standards could be conducted to assess the feasibility of updating the current suite of industry standards to reflect advancements.
Feasibility studies should assess the expansion of infrastructure to rural regions.
Abbreviations
Abbreviation
Definition
CDW
Construction and Demolition Waste
CXC
ClimateXChange
CO2
Carbon Dioxide
GHG
Greenhouse Gas
GWP
Global Warming Potential
LCA
Lifecycle Analysis
MCI
Material Circularity Indicator
RC
Recycled Concrete
SATBAG
Scottish Aggregates Tax Bill Advisory Group
Table 1: Glossary and abbreviations used during report
Introduction
Study context and aims
The Scottish Government has set the target for Scotland to reach Net Zero carbon emissions by 2045, laid out in the Climate Change (Emissions Reduction Targets) (Scotland) Act 2019 (Scottish Goverment, 2019). To meet this target, they understand that GHG reductions must be made across a number of sectors, including the construction sector, which is widely estimated to generate around half of all of Scotland’s waste (Scottish Government, 2024).
In 2023, the Scottish Government commissioned Circle Economy, an international circular economy research body, to map the flow of materials throughout the Scottish economy. The aim of the work was to identify how circular approaches could generate economic benefits and reduce the environmental impacts of waste and material consumption. Their research, among several recommendations, suggests that adopting circular approaches to construction, such as prioritising the use of alternatives to primary materials and aggregates, has the potential to deliver an 11.5% reduction in Scotland’s emissions (Circle Economy, 2023).
To support this aim, the Scottish Government is considering how the Scottish Aggregate Tax can incentivise the use of alternatives to primary aggregates by imposing a tax on the extraction and use of primary aggregate materials. This comes at an opportune moment, as the Scottish Aggregates Tax is expected to go-live in April 2026, and is set to become the third fully devolved tax in Scotland, after the Land and Buildings Transaction Tax, and the Scottish Landfill Tax. It will replace the existing UK-wide Aggregates Levy in Scotland through charging a tax on the use of aggregate when it becomes subject to commercial exploitation in Scotland and will be administered by Revenue Scotland.
However, the evidence base for the significance of the role that alternatives to primary aggregates can play in reducing the environmental impact of the Scottish construction industry is not currently sufficiently robust. There has been no systemic data collection focussing on supply versus demand for alternatives to primary materials in Scotland, and therefore the full extent of the potential environmental impact is unknown. There is also uncertainty about how much more deployment of alternatives to primary aggregates is possible and what the potential options are to overcome the barriers to this ambition.
This study aims to develop a fuller understanding of the types, development levels, and potential impact of alternatives to primary aggregates, and the barriers to their increased use in Scotland. It focuses primarily on aggregates used within the construction industry, which are understood as granular building materials, primarily comprising of sand, gravel, and crushed stone and rock. They are often produced through the crushing, screening, and extraction processes within quarries, or produced as a by-product from demolition practices. While they play a critical role in construction projects, forming the basis of concrete, asphalt, and other materials, their use is not exclusively limited to this industry.
Our work included a review of available industry and academic literature on the subject, an investigation into the availability of relevant primary quantitative data, and a series of stakeholder engagement interviews and surveys. The combined insights from these activities are summarised in this report and draw learnings for policymakers to consider in the further development of the Scottish Aggregate Tax. The methodology followed is discussed in more detail in Appendix A.
Traditional primary aggregates use
In Great Britain, approximately 250 million tonnes of aggregates are used annually within the construction industry, with an additional 20 million tonnes in Northern Ireland. Scotland plays a vital role in the UK’s aggregate supply chain, both as a significant producer and consumer of materials. In 2022, Scotland produced 21.3 million tonnes of crushed rock, accounting for a substantial share of the UK’s total, alongside 4.5 million tonnes of sand and gravel. Additionally, the country produced 1.2 million tonnes of ready-mixed concrete (around 500,000m3), and 2.5 million tonnes of asphalt. Infrastructure projects dominate Scotland’s construction sector, comprising 22% of output and demonstrating a heavy reliance on aggregates (Mineral Products Association, 2024)
The push for sustainable practices in construction has led to growing interest in viable substitutes for traditional primary aggregates. Historically, primary aggregates, sourced from natural materials like rock, granite, and gravel have dominated the market due to their reliability and robust characteristics. Commonly used in applications such as house building and road development, these virgin materials are often chosen by contractors and developers for their proven durability and performance. However, the environmental costs associated with extracting and processing these carbon-intense materials, including significant GHG emissions and the depletion of finite natural resources, present the need for alternative solutions, some of which are set out below.
Alternatives to primary aggregates in Scotland
In 2021, recycled and secondary sources supplied 28% of total aggregate demand, while the remaining demand was fed from primary aggregate extraction in the UK (Mineral Products Association, 2022).
While there is no definitive categorisation of the different materials which may be classed as ‘alternatives to primary aggregates’, in this project we apply the following broad understanding:
Recycled aggregate: Construction and demolition waste (CDW) that has been processed into usable aggregate.
Secondary aggregate: Materials derived from the process of extracting aggregate or other industrial processes.
The availability of alternatives to primary aggregates plays a critical role in the successful uptake of sustainable materials in the construction sector. Through desk-based research and stakeholder engagement, it was found that there are a range of suppliers actively producing alternatives to primary aggregates in Scotland. The most commonly produced alternatives were found to be:
Recycled concrete (RC) and washed recycled sand, which are primarily used in building and housing construction applications
Incineration bottom ash aggregate (IBA), and
Recycled asphalt plannings which are typically deployed into road construction and infrastructure developments.
Case Studies
Provided alongside this report are four case studies of project examples where alternatives to primary aggregates have been used in Scotland. These are:
Case Study 1 – Using alternatives to primary aggregates to extend full fibre broadband across Scotland.
Case Study 2 – Incinerator Bottom Ash in low-carbon concrete for housing development.
Case Study 3 – Treatment of hazardous soil and use of by-products for secondary aggregates.
Case Study 4 – Sustainable development of the haul road to the East Capellie Recycling Wash Plant.
These case studies demonstrate some of the technical innovations and viability points discussed in Sections 3.1 and 3.3. They also highlight some of the outstanding challenges to stimulating wider replication of the examples discussed, such as a lack of publicly available externally verified full environmental impact calculations, and the lack of firm data on available volumes of the alternative materials discussed. These challenges, among others, are discussed in detail in Section 3.4.
Findings
In this section we present the combined outputs and insights from our literature review, stakeholder engagement, and data collection exercises, organised into general learning themes. Examples of how the themes explored here can impact specific businesses are illustrated in within the Case Studies referenced in section 3.4.
Factors driving uptake of alternatives to primary aggregates
During our stakeholder engagement, representatives of Scottish wash plants and producers of construction materials reported that attitudes to alternatives to primary aggregates have changed significantly over the last ten years. While all stakeholders agreed that there will always be demand for primary aggregates, recent innovations demonstrate that alternatives can now be used effectively in more cases than were previously possible.
Factors driving uptake of alternatives to primary aggregates, as discussed in our interviews, include technical innovations and changing attitudes, explored below.
Technical Innovations
There has been significant investment in development of advanced CDW recycling infrastructure across the central belt of Scotland over the last 10-15 years. Interviewees cited an increase in the number of CDW recycling sites equipped with wash plants, multiple crushers and screening technologies which allow for the removal of contaminants and impurities that can negatively impact the strength of concrete produced from recycled aggregates. This is an advancement on mobile crushing plants traditionally used for the management of CDW, which typically involve single crushing and minimal equipment for the removal of unintended constituents (Pacheco & Brito, 2021). Interviewees felt that these innovations have led to a significant increase in the quality and consistency of the recycled aggregates that can be produced. This view was supported in the interviews by a manufacturer of primary aggregates, a quarry and three operators of CDW recycling and wash plants. Examples of the improved technology are discussed in Case Study 4, provided alongside this report.
When producing concrete, key manufacturers, wash plants and major contractors, are now able to benchmark performance, and grade- and cube test alternatives to primary aggregate. The introduction of these new technologies allows them to understand the compressive strength, relative density and overall quality. Concrete cube testing is an essential process for assessing whether a product meets necessary safety standards and regulatory requirements, and whether they are suitable for different applications within construction. As a result of innovations in wash plant, screening and recycling technologies, these stakeholders are able to produce concrete from alternatives to primary aggregates that are able to meet similar standards and specifications to primary aggregates. This expands the scope of where these materials can be applied.
Changing attitudes
It is acknowledged that the development of Net Zero infrastructure and renewable energy projects, will require a significant increase in concrete production. For some stakeholders, this represented a potential opportunity for greater use of recycled and secondary aggregates. While the rapid growth of renewable energy infrastructure has the potential to reduce overall CO2 emissions, research has indicated that the increased demand for high impact materials, such as steel and concrete which both have significant carbon footprints, may undermine the environmental benefits of this infrastructure unless otherwise mitigated (Rueda-Bayona, et al., 2022). An interviewed manufacturer of primary aggregates and construction materials noted that they expect this to expand the portfolio of projects where alternatives to primary aggregates may be applied, provided that sufficient quality assurance and standards are in place. They noted that where they had the assets and the capability to supply alternative aggregates, these were being used in nearly every case due to demand from clients motivated by Net Zero targets, such as Tier 1 infrastructure contractors[1], Local Authority or residential clients.
Interviewees also noted that attitudes have been shaped by the negative impacts COVID-19 and Brexit had on the supply of construction materials. Following the easing of lockdown in 2022, construction projects and demand for construction materials surged. These events created scarcity in the availability of construction materials, particularly cement, leading to fluctuations in prices and long lead-in times for primary aggregates. Due to significant shortage of construction materials and significant lead-in times and costs associated with procuring these materials, Tier 1 infrastructure and housebuilding projects looked to recycled/recovered construction materials to fill the gap. Practical experience with recycled aggregates helped to dispel concerns regarding the quality and practical application of recycled materials.
Environmental impact
The construction sector is the world’s largest consumer of raw materials. According to UNEP and the World Research Institute, buildings account for 40% of all waste generated by volume, 40% material resource use by volume and between 33-37% of all GHG emissions (World Resources Institute, 2016) (UNEP, 2023). In addition, the extraction of primary aggregates, such as rock, sand and gravel generate significant environmental impacts on local biodiversity and habitats. Open-pit mining necessitates the removal of topsoil and vegetation to access the materials that lie beneath. In the UK, up to 22% of sand and gravel is extracted from marine dredging (Mineral Products Association, n.d.). Whilst controlled and responsible marine aggregate extraction would always seek to minimise adverse impacts, there is widely accepted potential for harm to marine habitats from aggregate extraction (United Nations Environment Programme Finance Initiative, 2022). Both activities generate severe negative impacts on animal and plant species and can contribute to sedimentation and erosion of riverbanks and coastlines (UKGBC, 2025).
There is a growing body of evidence that alternatives to primary aggregates can deliver improved environmental performance compared to traditional materials, particularly offering a lower carbon output. Through a rapid review of the literature, we found evidence on lower emissions associated with carbon-reinforced RC industrial flooring (Luthin, et al., 2023), recycled aggregate concrete (Hasheminezhad, et al., 2024) and concrete mixes (Adesina, 2020).
In a study carried out by Luthin (2023), the sustainability performance of a carbon-reinforced RC industrial floor was measured and assessed during its development using the Material Circularity Indicator (MCI) and Life Cycle Assessment (LCA) methods. These tools were used to evaluate both recycled and virgin materials, respectively. Linear resource flows refer to the traditional approach of resource use, where materials are extracted, used, and then discarded as waste, with minimal or no reuse properties. In contrast, circular resource flows aim to extend the lifecycle of materials by prioritising, reuse, recovery, and recycling, reducing the need for virgin material extraction and waste generation.
The study carried out by Luthin (2023) investigated and analysed the recyclability of a floor that that was produced with an RC mixture as the foundation material for an industrial floor, this was then measured and evaluated upon its strength, performance, and carbon profile. The LCA showed that the reinforced RC industrial floor outperformed traditional concrete in environmental performance, achieving a lower Global Warming Potential (GWP). It was shown that the GWP for producing 1 tonne of RC flooring had an equivalent of 80.3 kg CO2, compared to 195 kg CO2 equivalent for 1 tonne of precast slabs (Luthin, et al., 2023).
Additionally, the MCI assessment found that the circular performance reflected a similar result, with the reinforced RC floor accounting for a notably high MCI score of 0.8184 (82%) (with a score of 0 being completely linear, and 1 being completely circular). This score reflects the significant use of recycled materials in its production and the potential for further recycling at the end of its lifecycle. In comparison, a new concrete floor composed entirely of virgin materials would score close to 0 on the MCI scale, as it would rely entirely on linear resource flows, using new raw materials with little to no recycling or reuse involved. The MCI score of 82% demonstrates how effectively the RC floor minimises the use of virgin resources and maximises the use of alternatives. Results like this, however, should be read in conjunction with other aspects of the compared materials. For example, this study also found that the RC floor would be more expensive to install, and has higher levels of human toxicity than the precast slab option. This highlights that all material choices should be made based on as full a consideration of all factors as possible.
This assessment is supported by Hasheminezhad (2024) who conducted a similar study, reviewing the LCA and environmental performance of RC in comparison to traditional concrete materials. The study aimed to assess and highlight the GHG emissions and energy consumption associated with the entire lifecycle of concrete resources. This included evaluating the impacts across all phases of its use, including material extraction, production, transportation, usage, and end-of-life management (Hasheminezhad, et al., 2024). The study found that recycled aggregate mixtures of concrete do require marginally higher quantities of energy and cement than primary aggregates. This is often required to compensate for the lower strength and higher water consumption of the recycled materials involved. However, the research underlined the substantial environmental benefits of using recycled aggregate mixtures due to lower carbon emissions, especially when the recycled aggregates are sourced locally. This is due to the use of recycled materials significantly reducing the demand for virgin resources, such as natural sand and gravel, while also diverting CDW from landfills, both of which produce significant associated GHG emissions.
The Hasheminezhad et al. (2024) study also highlighted the GWP differences between the two concrete materials, showing that the GWP of RC was lower by up to 15% compared to natural aggregates, particularly when recycled aggregates completely replaced all natural components within the concrete mix. The whole life assessment outlines the importance and influence of energy consumption generated through extraction and transportation practices. With a particular focus on the value-chain of the resource and the importance of locally sourced materials, embodied emissions are a critical factor when assessing the carbon reduction potential of alternative materials. Embodied emissions relate to the GHG emissions associated with a product or material across its entire life-cycle, including sourcing and processing of the materials, and eventual end-of-life treatment. Therefore, these comparisons should factor all impacts associated with extraction, use and disposal.
The importance of reducing emissions in the transportation of aggregates is also highlighted in a review by Adesina (2020). The report recognises the potential for all aggregates to improve their carbon impact, and the major role in emissions profiles of cement content levels. They also note that the construction industry has made steady and effective progress in reducing emissions throughout the lifecycle of concrete mixtures by prioritising the extraction and efficient use of locally sourced aggregates. By adopting a more strategic approach to the processing and transportation of recycled aggregates, the industry can continue to effectively address and mitigate the challenge of high embodied carbon emissions (Adesina, 2020). This potential was emphasised by several of the stakeholder interviewees for this study as an important contributor to Scotland’s overall environmental ambitions.
It is also important to consider the environmental impacts generated through the transport of primary and alternative aggregates from their point of extraction or production to their point of use. As discussed in sections 3.1.1 and 3.4.4, wash plants for the recycling aggregates are heavily concentrated in the central belt of Scotland. Therefore, the logistical feasibility of supplying recycled or alternative aggregates is limited by distance, as after a certain distance, it becomes uneconomical to supply these materials via truck due to transportation costs. Similarly, after a certain distance, the environmental benefits of alternatives to primary aggregates are outweighed by the emissions generated through transport.
The outcome of an LCA assessment of CDW recycling completed by Ricardo in 2021 for Natural Resources Wales[2] found that delivery distances of more than 34km from originating site resulted in higher GHG emissions than were saved from the substitution of virgin materials. This break-even distance will increase as transport is gradually electrified and the electricity grid becomes less carbon intensive. This underlines the point that thorough LCA analysis is the only way to accurately reflect the environmental impacts, positive or negative, of any business decision.
Technical viability
Academic discussion
As discussed in the challenges section 3.4 below, there is a widely held perception that recycled or secondary materials can struggle to meet performance requirement standards. Whilst this will clearly be true for some materials, it is not the case for all, and it is important to be able to demonstrate successful use with technical data (Dhemaied, et al., 2024). There is a body of research which focusses on strength, durability, and workability of CDW-derived aggregates in infrastructure projects, with many studies showing promising results for specific applications. Examples are discussed below and in the case studies provided alongside this report.
Recycled sand can replace natural sand in certain construction contexts without compromising quality. In the Virgin Media O2 project under Scotland’s Full Fibre Charter (Scottish Government, 2022b), sand aggregate derived from CDW was successfully used in telecommunications infrastructure, highlighting the role recycled sand can play in sustainable resource management. Case Study 1 provides more information on this example.
Alternatives to primary aggregates have shown strong potential in asphalt applications, particularly for road construction. The UK’s first carbon-neutral road improvement project employed recycled asphalt aggregate to reduce its carbon footprint significantly (Scottish Construction Now, 2021). Additionally, Tarmac’s biogenic asphalt deployed in this project uses plant-based binders with recycled aggregate to achieve effective carbon capture, reducing reliance on petroleum-based materials. This innovative approach demonstrates the potential for CDW aggregates to maintain or enhance the mechanical properties needed for asphalt in road applications, supporting a low-carbon, sustainable future for Scottish road infrastructure (Tarmac, 2023).
RC is a sustainable construction material, primarily produced as a by-product from construction and demolition activities. It is composed of crushed concrete from structured components such as buildings, roads, and pavements, which is then sorted, cleaned and crushed into aggregate (typically between 2-4mm in diameter). Several studies, as discussed below, confirm the technical feasibility of using CDW-derived aggregates in low-carbon concrete formulations, meeting performance criteria for infrastructure applications while promoting sustainability. According to a review conducted by Han et al. (2023), suitably treated RC can act as a sufficient alternative for virgin concrete materials, with strategic adaptations to mortar content and density in recycled aggregates presenting durability and mechanical benefits to the material. This review highlighted that pre-treatment processes, such as the combined usage of lime soaking and carbonation[3], can also improve the performance and properties of RC within construction. This is both supported and tempered by Thomas et al. (2018), who conducted a performance analysis review measuring the technical feasibility of RC, covering parameters such as the strength and permeability of concrete mixed with recycled materials. The review found that while recycled aggregates show great potential in being a suitable alternative to virgin materials, the strength can be compromised should RC aggregate content exceed 25% of the overall material. However, the review explains that this can be adapted through modifications in the concrete mix design phase, which would be necessary to address changes in the material’s physical and mechanical properties.
Stakeholder opinion
Amongst the stakeholders interviewed for this study, there was broad agreement that the use of alternatives to primary aggregates has been limited due to concerns among construction companies and potential customers regarding quality and consistency in supply of the materials. It was felt that prior experiences, where the quality of materials used had not delivered the required final functionality, have led to clients being wary and sceptical of specifying for anything other than primary aggregates.
Discussion of the current and future situation, however, revealed a mix of viewpoints. There were several reiterations of the opinion that, beyond uses such as landscaping and backfill of drainage and cable trenches, virgin stone will always be preferable to clients. On the other hand, one producer of both primary and recycled aggregates felt that there has been more market acceptance of recycled products over the last four years. As discussed in section 3.1, this has been driven through the normalisation of alternatives to primary aggregates seen during the COVID-19 pandemic and resulting supply chain difficulties, alongside growing recognition of the fact that modern wash plants can produce very high purity output materials. One producer gave an example of a road construction project on their own site, using entirely recycled materials, which has seen 15,000 truck-loads, conveying 0.5M tonnes of materials, without any quality issues (please see Case Study 4 for more detail). This supports the summarised views from the literature discussed above. While there will continue to be the possibility for impurities and deleterious material to be present in alternatives to primary aggregates, it is not correct to assume this is always the case. It was felt amongst some stakeholders that, were robust testing and certification procedures in place to demonstrate how alternative materials comply with industry quality standards, there would be more comfort in their use for a wider range of applications.
These technical considerations, alongside potential environmental and economic benefits, play a critical role in shaping perceptions. Early involvement of client and design stakeholders in planning and decision-making processes is crucial for addressing specific concerns about the material’s use, while effective communication strategies are essential for securing support from both public and private sector clients and project sponsors.
Challenges and barriers to the increased uptake of secondary and alternative aggregates
As part of the movement to incentivise the development of sustainable practices within the construction sector, the broader adoption of non-virgin materials relies not only on their availability and relative demand, but also overcoming several barriers and challenges within the industry. The challenges identified through this study, and highlighted in the separately provided case studies, are categorised and discussed below, along with some initial ideas for options to begin tackling them.
Data challenges
The most significant barrier to developing a full understanding of what is both possible and practical is the lack of availability of robust quantitative data on alternatives to primary aggregates in Scotland. One of the initial ambitions of this project was to forecast the potential contribution to GHG reduction targets of an increase in use of recycled or secondary aggregates in the Scottish construction sector. To calculate this, primary data was sought from key producers and sources of alternatives to primary aggregates in Scotland, including established quarries, wash plants and demolition and excavation companies. The aim was to gain a baseline of annual sales in Scotland. This collated dataset would form a baseline of the potential supply of alternatives to primary aggregates, which would then be mapped against expected demand forecasts, both geographically and volumetrically, to calculate a proportion of how much forecast demand could be met. To calculate the GHG emissions associated with these volumes of secondary and recycled materials, we planned to apply GHG emission factors sourced from various standard approaches.
During the data collection phase, a simplified data collection form was sent to 36 suppliers of primary, and alternatives to primary, aggregates and demolition and excavation companies to request data on the types and volumes of materials sold annually. The research team conducted three rounds of emails and two follow-up calls to each identified supplier over a two-month period to request their participation in the study. Engagement with industry stakeholders was supported by ClimateXChange and members of the Scottish Aggregate Tax Bill Advisory Group (SATBAG).
Despite a large number of suppliers being contacted, the research team received minimal complete responses. There were several reasons for this, including:
Contacted suppliers had limited capacity to provide the requested data due to resourcing constraints or competing deadlines.
Contacted suppliers were concerned about potential commercial sensitivity in sharing the data.
Contacted suppliers did not see the commercial value in participating in the study, despite the relevance of the Scottish Aggregate Tax.
As a result, the limited primary data collected would not have been representative or robust enough to form a baseline for forecasting the future supply potential of alternatives to primary aggregates. Therefore, in agreement with ClimateXChange and the Scottish Government, the efforts to develop a GHG reduction forecast were discontinued and replaced by a focus on stakeholder interviews.
The challenge, and importance, of data availability regarding volumes of recycled and alternative aggregates was reiterated throughout our stakeholder interview phase. This interview phase incorporated four suppliers of recycled and alternative aggregate products contacted during the data collection, and seven public sector, industry and regulatory bodies. The purpose of these interviews was to gain in-depth insights into the key challenges facing the uptake of recycled and secondary aggregates (see Appendix A for further details).
During these interviews, it was noted that data availability inhibits the sector’s ability to forecast the potential environmental benefits of incentivising these alternative aggregates. It also limits understanding of what is possible and practical to aim for when considering the question of supply versus demand. There was a general consensus across the stakeholders interviewed that understanding the volumes available in the secondary market is key, but that such understanding does not currently exist at a sufficient level of accuracy. The difficulty was highlighted as particularly prevalent in Scotland, where interviewees noted suppliers are not used to being surveyed annually. While it is understood that the British Geological Survey is conducted every four years (e.g., in 2019 and 2023), the granularity of detail regarding the origin and characterisation of primary, recycled and alternative aggregates is not particularly well-defined.
To address this challenge, a systematic and robust data collection and reporting mechanism would enable confident, evidence-based decision making, both for Government and for industry members. Ideally, it should provide sufficient granularity to develop a quantitative local authority-level understanding on CDW arisings and volumes of alternatives to primary aggregates produced, stored and sold. Such a system would be complex and expensive to design and implement. The possibility of successful deployment would be maximised through collaborative public-private development.
Potential limited scope for increased use of alternatives to primary aggregates.
In contrast with the potential positive environmental impact and technical viability of alternatives to primary aggregates, is the belief of some stakeholders that there is minimal scope for a significant increase in their use. The potential for increased use of alternatives to primary aggregates needs to be balanced between what is possible and what is practical. The Mineral Products Association’s report, Aggregates demand and supply in Great Britain: Scenarios for 2035 (2022), posits that recycled and secondary aggregates are unlikely to meet projected demand in alignment with construction trends. This is due to the bulk of their supply being directly tied to demolition activity, and the fact that most suitable CDW is already being reused.
This sentiment was backed up in some of our interview conversations with sector bodies. They asserted that, in their estimation, 90% of recoverable CDW is diverted from landfill already and therefore opportunities for significant increases in recycled content are limited beyond incremental improvements. Indeed, the point was made by several interviewees that no-one in any industry likes unnecessary cost and waste, so for many years materials have been reused or repurposed on-site where possible to save costs. As such, construction sites have been adopting the principles of circularity without necessarily reporting it as such. Counter to this, among other stakeholders interviewed with experience in recycled aggregate production, and CDW management in general, there was the opinion that there is still potential for an increase in CDW diversion from landfill. One interviewee confirmed from direct experience that they could easily divert a lot more CDW from landfill and that they have the latent site capacity to process it into recycled aggregate. The only reason this is not done at present is that market demand is not sufficient to warrant the additional processing cost. Another interviewee noted that they have been able to significantly increase capacity since opening their first wash plant in 2017. In this time, they have developed facilities able to handle a much dirtier feedstock and process up to 300,000 tonnes per year at a rate of 150 tonnes an hour.
Addressing the data challenges discussed in Section 3.4.1 should provide clarity on how much scope there is for increased use of alternatives to primary aggregates. If there is found to be additional capacity, then efforts could be made to stimulate demand. These could include championing the role of alternatives to primary aggregates in meeting Net Zero targets through building or collating an evidence base of verified LCA studies or reports which demonstrate positive environmental impact when deployed appropriately.
Another significant opportunity to incentivise the use of alternatives to primary aggregates is through leading-by-example. Through public-sector procurement of relevant projects, mandates and design briefs could be developed to stipulate for, or give appreciable scoring consideration to, the use of alternatives where safe and technically appropriate to do so. The re-released Net Zero Public Sector Buildings Standard (2023) provides an example of how an initiative like this could be developed. While it does provide an embodied carbon (i.e. the emissions embodied in the materials used and construction activities themselves) target for new buildings, it is voluntary and does not stipulate specific measures or materials (Scottish Government, 2023). Opportunities to work within this existing framework, or via other public procurement or planning routes, could be explored and developed.
Challenges due to industry standards
A key factor limiting the uptake of recycled and alternative aggregates was found to be restrictions imposed by industry standards, which are then cascaded into procurement specifications. These established standards are instated to ensure safety, durability, and performance. These standards are designed to regulate the properties and quality of both natural and recycled aggregates across various applications. Key standards are listed in Table 2Error! Reference source not found., below.
Standard
Relevance:
BS EN 12620
Aggregates for concrete, outlining requirements for materials used in concrete production.
BS EN 13242
Aggregates for unbound and hydraulically bound materials, applicable to civil engineering work and road construction.
BS EN 933
Test methods for geometric properties of aggregates, covering particle size, shape, and other physical attributes.
BS 8500-2
Complementary to BS EN 206, this specifies additional requirements for aggregates in UK concrete applications.
WRAP Quality Protocol
Governing the performance standards for recycled aggregates, ensuring their safe and reliable use.
PAS 2050
Focused on assessing the carbon footprint of recycled aggregates.
BS EN 13108
Aggregates for bituminous mixtures, regulating reclaimed asphalt pavement (RAP) for road surfacing and structural layers.
EA Quality Protocol for IBAA
Specific to Incinerator Bottom Ash Aggregate, ensuring environmental safety and suitability for reuse in construction.
Table 2: Key standards relevant to recycled and natural aggregates
It is important to note that these standards have been developed to ensure the structural integrity, durability and safety of built infrastructure. Any increases to these thresholds must be evidence-based, appropriate for the product’s application, and supported by industry-wide consultation. These limits have been established due to well-grounded concerns regarding the potential of deleterious and contaminant materials making their way into recycled feedstock, which may compromise the safety of the structures. In addition, it was broadly acknowledged by all stakeholders interviewed that while recycled and secondary aggregates have many good properties, they will not fully replace demand for virgin aggregates, which will still be required for some applications. Nonetheless, there was concern among producers of recycled and secondary aggregates that existing standards and testing regimes no longer reflect the potential quality and performance characteristics of alternative aggregates produced through modern recycling techniques. While industry standards for the use of aggregates set an upper threshold of 30% of recycled content rate within concrete, some stakeholders reported confidence in the potential of increasing this upper limit without compromising the structural integrity of the concrete produced. If a concrete product contains a recycled aggregate content higher than this threshold, they can only be sold as an unspecified product and as such will not meet procurement specifications.
The feeling from interviewed producers of both primary and recycled or secondary aggregates is that these limitations may restrict market demand. This issue is compounded by the fact that, largely, project specifications require aggregates to meet specific quality and industry standards for which it is difficult for recycled and secondary aggregates, and secondary aggregate containing products such as RC, to demonstrate full compliance. It was noted during the interviews that a lack of relevant standards reflecting current industry practice for alternatives to primary aggregates may contribute to concerns around potential liability if a fault occurs following completion of a project. As a result, engineers and planners may be less inclined to approve these materials for use, and contractors and procurers may not integrate these materials into contracts and structural drawings. Nonetheless, while there was broad agreement that under the current suite of industry standards it is not possible to accurately test the suitability of non-primary material for some structural works, standards and testing regimes do exist to assess the suitability of these materials for non-structural works, such as pipe-bedding, cable laying and landscaping works.
Moreover, stakeholders noted that alternatives to primary aggregates are often not explicitly included within procurement specifications for public or private construction projects. This has the effect of limiting market demand. It is possibly due to a lack of appropriate standards and testing regimes to discern between high-quality and low-quality alternatives to primary aggregates, which for some stakeholders may contribute to misconceptions regarding the perceived risk of using recycled aggregates. In some cases, it was noted that if procurement specifications require a certain percentage of “recycled content” to be used, contractors may feel more comfortable fulfilling this requirement with lower-impact materials used for furnishings (e.g. wood, polypropylene, vinyl flooring), rather than with aggregates, which may deliver greater reductions in GHG emissions.
Almost all stakeholders agreed that the experience of having low-quality recycled aggregate on the market has contributed to misconceptions regarding the purity and performance achievable through innovative modern technological processing techniques. However, significant investment has recently gone into development of quality control processes and technologies to remove contaminants and increase the purity, and therefore quality, of outputs. This improvement and development has thereby expanded their potential uses for other applications.
For example, an operator of a wash plant noted that traditionally contractors used mobile crushers to produce recycled and secondary aggregates from construction, demolition and excavation activities. These crushers often used dry screening to filter out contaminants. However, due to Scotland’s wet climate – and, in the case of excavation, the silt and clay material common in Scotland’s geology – the crushed feed material would often become sticky, making it difficult to remove contaminants and ultimately reducing the purity of the output. Modern wash plants, on the other hand, are often equipped with multiple crushers, washing and screening technology to crush and effectively segregate aggregates from these contaminants. In the case of excavation activities, this also allows for the collection of the silt and clay as a valuable by-product. Similarly, an interviewed producer of construction materials noted that clients and contractors may not be aware that this sector is rapidly evolving, and that technologies are coming online that can, for example, extract the cementitious properties of concrete and recover the concrete used.
In conclusion, current standards and specifications for recycled and secondary aggregates are felt by industry stakeholders to be outdated or restrictive, failing to support the technological innovations and resultant industry confidence. As noted above, while demand for recycled and secondary aggregates has traditionally been lower than primary aggregates due to concerns regarding quality and consistency in supply, there is a sentiment among some interviewees that this has changed as a result of research and development investment and innovation, leading to significant improvements in the quality of materials that can be produced from CDW. While the structural integrity of built infrastructure must not be compromised, to enable broader recycled and secondary aggregate adoption, updates to standards and specifications are essential to reflect current practice and provide guidance on the materials’ structural performance.
To address these challenges, there is an opportunity to review current industry standards, to understand if there is scope to develop and update them to better reflect modern recycling capabilities and the quality of alternative aggregate products they can produce. Additionally, as with the option to develop a library of proof of environmental performance discussed in Section 3.4.2, a suite of case studies could be built or collated to demonstrate good practice and the technical appropriateness of alternatives to primary aggregates.
Operational and market challenges
There was broad disagreement among the stakeholders interviewed for this study regarding the need to provide additional support for the uptake of alternatives to primary aggregates. This was due to contrasting views regarding the perceived ‘saturation’ of recycling and wash plants across the central belt of Scotland, the operational barriers of expanding aggregate recycling facilities to rural areas, and the challenges in segregating CDW at source.
It was felt that the saturation of state-of-the-art facilities (e.g. wash plants), combined with a lack of demand for non-primary aggregates for reasons discussed above, means some of these businesses are sitting on significant amounts of washed concrete, recycled sand and gravel, with no off-take market (i.e. customers to buy their product). Indeed, four interviewees noted they could significantly increase their recycled output if there was sufficient market demand to justify it.
Within this context, some stakeholders representing primary aggregate suppliers felt that if the Scottish Government used financial or legislative support such as increasing the tax rate applicable under the Scottish Aggregates Tax to generate market demand and incentivise the use of recycled or alternatives to primary aggregates, the primary aggregate sector would be placed at a competitive disadvantage. These state-of-the-art facilities require millions of pounds of investment, which creates a barrier to entry for primary aggregate suppliers seeking to move into the recycled aggregate market due to sustainability and Net Zero benefits. In addition, these stakeholders felt that as some recycled aggregate companies operate their own fleets, they may be more readily able to drop the price of the recycled aggregates in order to sell excess stock, which may contribute to increased market volatility and reduce the competitiveness of primary aggregates.
On the other hand, producers of recycled- and alternatives to primary aggregates felt that their competitiveness was overstated due to the operational and geographic limitations of their business models. It was noted that traditional quarrying allows significant volumes of primary aggregates to be sourced (e.g. through drilling and blasting) and sent out for delivery with lower overheads and lower investment in infrastructure. This allows them to compete favourably against producers of recycled aggregates that require investment in high-specification wash plants, trash screens, and technology to grade and segregate feedstocks.
In addition, suppliers of alternatives to primary aggregates interviewed noted they were also constrained geographically, as their infrastructure needs to be situated in a catchment area where there is a high volume of CDW being generated. This makes competition with traditional primary aggregate suppliers challenging. This is especially true in rural regions outside of Scotland’s central belt, where it is currently not commercially viable to operate wash plants or supply non-primary aggregates due to a lack of non-primary material inputs, and the haulage and fuel costs associated with transporting these to customers. One interviewee noted the fuel costs may be subject to change, if they were able to transition their fleet to electric vehicles supplied by renewable sources. However, this remains a significant operational barrier.
It was generally agreed by interviewed stakeholders and within the supporting literature, that to maximise the financial and environmental benefits of using alternatives to primary aggregates, these should be used as close to the source as possible (e.g. demolition sites or construction sites) (Wang & al., 2024) (Santolini & al., 2024). However, there was concern that availability of recycled and secondary feedstock was also often constrained by resistance within construction and demolition companies to appropriately segregate materials at source, due to concerns regarding feasibility and costs. There was broad agreement that this was due to the structural and commercial pressures that construction and demolition companies face when delivering a contract. It was explained that demolition contracts tend to be awarded for efficiency and speed to avoid financial penalties for not completing a project within the timeframe set by the agreed upon planning permissions. This can lead to a tendency for operators to make business decisions based on the belief that the removal of specific structural elements and the use of screening technology to facilitate reuse and recycling of aggregates will be time consuming and generate additional, unwanted costs.
One specific example is the lack of on-site removal and screening being a key barrier to the recycling of flat glass. Currently, the Scottish Landfill Tax provides little financial incentive to recycle flat glass recovered from buildings as this material qualifies for the lower rate of landfill tax of £4.05/ tonne from 1 April 2025 (previously £3.30/tonne). As a result, recovered glass is crushed for use as a low-value input for aggregates in road construction or landfilled. British Glass (an industry body representing the UK glass industry) noted this is a significant lost opportunity to maximise the value generated from glass recycling, minimise avoidable waste, and reduce GHG emissions. Glass can be continuously recycled and remelted into new glass products without loss of quality, provided it is appropriately segregated to avoid impurities. Their estimates indicate up to 200,000 tonnes of flat glass is generated by the UK demolition and construction sector. If flat glass was diverted from landfill and remelted into new glass products, this could save 60,000 tonnes of CO2 per year. Replacing virgin raw materials with 10% recycled glass saves 3% of furnace energy when producing glass products (British Glass, 2024).
While there are currently no flat glass recycling facilities in Scotland, British Glass emphasised that there is significant market demand from the Scottish food and drink manufacturing sector, particularly Scottish whisky and gin distilleries, for recycled glass materials in order to reduce their Scope 1 emissions (those that are directly generated through their operations). As such, they underlined the clear synergies and shared economic benefits of greater cross-sector collaboration for the recovery and segregation of flat glass products (e.g. windows) for recycling by the food and drink sector into glass packaging (e.g. bottles). This would only be feasible if appropriate on-site practices were implemented by stakeholders within the construction and demolition sector.
To mitigate these operational challenges, stakeholders interviewed felt that the costs of the segregation and processing of recovered aggregates and glass could be passed onto the client, especially if this was mandated or supported by legislation. A change in planning permissions or adjustments to the Scottish Landfill Tax that increases the cost of disposal were both suggested as potentially significant levers for change.
Finally, it should be noted that several interviewees reflected the view that wash plants should be seen as complementary to, and not competitive against, the existing producers of primary materials. Through sector collaboration it was perceived that increasing use of alternatives to primary aggregates would contribute to the extension of the useful lifetime of quarries, while producing materials that may not directly compete with materials derived from hard rock quarries, such as clean crushed stone.
The market stimulation efforts and ideas to tackle challenges due to industry standards discussed in the above two sections would go some way to tackling the challenges discussed here as well. To address the issue of alternatives to primary aggregates only really making environment and commercial sense if used relatively closely to where they are produced, effort could be made to support the development of recycling infrastructure in areas away from the already well-served central belt of Scotland.
Fiscal factors
There was broad agreement among stakeholders that, currently, the cost of purchasing alternatives to primary aggregates is comparable to that of primary aggregates. Yet, despite this similarity in pricing, there is a preference for primary aggregates in the market. Our findings indicate this is driven by the quality issue perceptions discussed above and the associated costs and challenges of ensuring compliance with required standards (e.g., screening, sorting, testing). However, there could be two areas of flexibility that could support a shift of this market dynamic in favour of alternatives to primary aggregates.
These are:
Tax rate adjustments for primary aggregates: The Government could choose to raise the tax rate on primary aggregates to further strengthen the incentive to use alternatives to primary aggregates.
Subsidies for alternatives to primary aggregates: Businesses that reduce the use of primary aggregates by incorporating alternatives into their operations could be made eligible for a subsidy scheme. Payments could enable businesses to lower their costs and for these cost savings to be passed on to customers. This could lead to more competitive pricing for products made with alternatives compared to those made with primary aggregates.
Tax rate adjustments for primary aggregates
The Scottish Government’s review of evidence and policy options for the Scottish Aggregates Tax (2020b) conducted an illustrative modelling exercise (based on tax rates at the time) for four tax rate scenarios:
Option 1 – High levy rate (Tax increase scenario): Under this option, the Scottish Aggregates Tax rate is set above the UK levy rate.
Option 2 – Low levy rate (Tax decrease scenario): Under this option, the Scottish Aggregates Tax rate is set below the UK levy rate.
Option 3 – Scottish Government baseline (No tax scenario): The levy rate is set to zero under this option, to model the impacts of a ‘do nothing’ approach.
Option 4 – New landfill tax band for aggregates (Landfill scenario): The levy rate is kept at the same level as the UK levy rate, while creating an additional band of landfill tax for aggregates which is higher than the rate for landfilling inert materials.
The results of this modelling are reproduced in Table 3 below.
BaU
Option 1
Option 2
Option 3
Option 4
Aggregates levy rate
£2.00
£2.50
£1.50
£0.00
£2.00
Landfill tax for inert materials
£2.90
£2.90
£2.90
£2.90
£2.90
New landfill tax band for aggregates
–
–
–
–
£3.80
Demand for aggregates
–
Decrease
Increase
Increase
Unchanged
Production of primary aggregates
–
Decrease
Increase
Increase
Decrease
Imports
–
Decrease
Increase
Increase
Decrease
Exports
–
Increase
Decrease
Decrease
Unchanged
Production of recycled aggregates
–
Increase
Unchanged
Unchanged
Increase
Table 3: Modelled tax rates and impacts under different policy scenarios (reproduced from (Scottish Government, 2020b))
Unsurprisingly, the modelled outcomes for raising the tax rate for primary aggregates and for introducing additional costs for landfilling of aggregates (Options 1 and 4 respectively) show a decrease in the use of primary aggregates and an increase in the use of alternatives. These are expected results for the unambiguous financial interventions into the market modelled. However, the level of redistribution of total demand between primary and alternatives aggregates that is actually possible, and the resultant worth of that compared to additional administrative costs, remains unclear. The 2020 Scottish Government review highlights that 87% of CDW is already recycled in Scotland, and the challenges discussed in Sections 3.4.1 and 3.4.2 above corroborate and augment this note of caution. Until robust and reliable Scotland-specific data on volumes of alternatives to primary aggregates is collected, any perceived benefits of tax rate changes will be somewhat speculative.
Subsidies for alternatives to primary aggregates
While alternatives to primary aggregates will be already be exempt from the Scottish Aggregates Tax, there is the potential to further incentivise their use by offering a subsidy. Potential recipients, such as those economic operators placing alternatives to primary aggregates on the market, would need to comply with any systems set up to verify amounts being claimed, so introducing some administrative burden.
The potential impacts and costs of introducing a subsidy system which aims to offer a positive incentive for using alternatives to primary aggregates are impossible to robustly estimate without access to granular volume data. Any potential scheme itself could require claimants to collect, store and report data on alternatives deployed. This potentially could include volumes and rates of CDW reused on site, capturing material which is not currently reflected in standard waste reporting as it never officially becomes waste. While this would incentivise the use of alternative aggregates and avoid the negative associations of disincentivising primary aggregates through the use of a tax increase, it would necessitate increased administrative and resource burden on both the scheme administrator and relevant claimants. Further work would be required to conduct a thorough assessment of the viability of any such scheme, which would, again, necessitate much more complete data than is currently available.
Summary learnings and next steps
The learnings drawn from the evidence review and potential actions for policymakers are summarised below:
Alignment with net zero targets: The Scottish Aggregates Tax could emphasise the potential role of alternatives to primary materials in meeting net zero targets in the construction sector. This could be relevant for other sectors that may have a use for these materials, such as food and drink manufacturing. This is particularly relevant for the GHG reduction potential of recycled aggregates, as well as for the recycling of flat glass. These environmental benefits can be evidenced through lifecycle assessments, which demonstrate the carbon savings potential of using recycled aggregates and glass.
Data accessibility and transparency: Significant data gaps exist in the monitoring of CDW generation and resultant availability of materials that could be used as alternatives to primary aggregates. This might complicate the implementation of any potential future Scottish Aggregates Tax rate changes and generate reasoned resistance from affected stakeholders. Robust data on waste arisings generated from CDW projects, and the types, quantities and value of alternatives to primary aggregates produced and sold, would enable policymakers to more accurately monitor and understand market dynamics for these types of materials. Given the resource demands of additional data collection, we suggest that systems and processes would need to be developed collaboratively between government and industry partners to promote engagement and adherence.
R&D investment: Continued investment in advanced recycling infrastructure can improve the quality of recycled aggregates. Public-funded R&D could support existing recycling facilities and develop recycling capacity among primary aggregate suppliers, particularly in underserved rural areas.
Addressing quality perceptions: Sector wide misconceptions regarding secondary and recycled materials, often based on historic experience, limit market demand. Public sector and industry partners could seek out targeted opportunities to emphasise successful case studies and promote quality assurance practices.
Updating standards and specifications: Industry standards restrict the use of alternatives to primary aggregates. Investment in R&D to review and potentially update industry standards could better reflect modern recycling capabilities. This could also contribute to addressing the quality perceptions discussed above. This could be complemented by engagement with standards bodies, such as British Standards, National Highways and Transport Scotland.
Capacity building and market demand: Policymakers could capitalise on latent capacity for recycling facilities could increase their capacity by implementing mandates and incentives to require and encouraging the use of alternatives to primary aggregates (e.g. in public sector procurement), where safe and technically appropriate to do so.
Facilitate cross-sector collaboration: Policymakers could support innovation to incentivise cross-sector collaboration for the recovery and recycling of flat glass from construction and demolition projects.
Policymakers should continue to effectively engage with key stakeholder groups within the aggregate industry to ensure any measures, including changes to tax rates and provision of financial incentives, are feasible and accepted. Additionally, the majority of the barriers discussed in this report will require engagement and the development of a mutual understanding with wider stakeholder groups. These include:
Private sector customers of primary and alternatives to primary aggregates, including Tier 1 contractors, homebuilding contractors, landscapers and relevant trade associations.
Public sector customers of primary and alternatives to primary aggregates, including local authorities and relevant public sector procurement representatives.
Relevant industries that may benefit from recycled aggregates, such as the Scottish food and drink sector for the recycling and valorisation of recovered flat glass.
Relevant industry standards bodies and research institutions to review feasibility of updating existing standards for alternatives to primary aggregates.
In summary, while there is a bank of academic, grey literature and stakeholder-opinion evidence that alternatives to primary aggregates can play a practicable and impactful role in reducing GHG emissions in Scotland, there is not universal agreement in the industry on these points. There are significant challenges and knowledge gaps to overcome. There are questions about the feasibility of increasing the proportion of alternatives to primary aggregates deployed, from both the available supply and market demand angles. There are deeply held reservations about the ability of alternatives to primary aggregates to provide the required technical performance, compounded by a sentiment that industry standards do not accurately reflect current recycling capabilities. Finally, there is a clear lack of robust, granular, Scottish-specific data to provide unequivocal clarity on several of the contested points. This study has detailed the key points of these challenges, their roots, and suggested some potential options to begin tackling them to facilitate a move to a more circular economy and sustainable construction sector in Scotland.
References
Adesina, A., 2020. Recent advances in the concrete industry to reduce its carbon dioxide emissions. Envrionmental Challenges, Issue 1.
British Glass, 2024. Make windows not waste, s.l.: s.n.
Circle Economy, 2023. Circularity Gap Report Scotland. [Online] Available at: https://www.circularity-gap.world/scotland [Accessed October 2024].
Dhemaied, R., Soliman, A. & and Lotfy, A., 2024. Global Perspectives on Recycled Concrete Aggregates (RCA): A Comprehensive Review of Worldwide Applications and Best Practices. Procedia Structural Integrity, Volume 64, p. 343–351.
Han, S., Zhao, S., Lu, D. & Wang, D., 2023. Performance Improvement of Recycled Concrete Aggregates and Their Potential Applications in Infrastructure: A Review. Buildings. Buildings, 13(6), p. 1411.
Hasheminezhad, A., Daniel King, H. C. & Kim, S., 2024. Comparative life cycle assessment of natural and recycled aggregate concrete: A review. Science of The Total Environment, Volume 950.
House of Commons, 2022. Building to Net Zero: Costing Carbon in Construction. [Online] Available at: https://committees.parliament.uk/publications/30124/documents/174271/default/ [Accessed October 2024].
Luthin, A., Crawford, R. H. & Traverso, M., 2023. Demonstrating circular life cycle sustainability assessment – a case study of recycled carbon concrete. Journal of Cleaner Production.
Mankelow, J. M., Cameron, D. G. & M A Sen, E. J. E., 2023. Collation of the results of the 2019 Aggregate Minerals Survey for Scotland.. [Online] Available at: https://www.gov.scot/binaries/content/documents/govscot/publications/research-and-analysis/2023/09/2019-aggregate-minerals-survey-scotland/documents/collation-results-2019-aggregate-minerals-survey-scotland/collation-results-2019-aggregate-minerals-survey [Accessed October 2024].
Mineral Products Association, 2022. Aggregates demand and supply in Great Britain: Scenarios for 2035. [Online] Available at: https://mineralproducts.org/MPA/media/root/Publications/2022/Aggregates_demand_and_supply_in_GB_Scenarios_for_2035.pdf [Accessed October 2024].
Mineral Products Association, 2024. Regional overview of construction and mineral products markets in Great Britain. [Online] Available at: https://mineralproducts.org/MPA/media/root/Publications/2024/Priorities_for_Scotland_Publication.pdf [Accessed October 2024].
Mineral Products Association, n.d. Marine Aggregates. [Online] Available at: https://www.mineralproducts.org/Mineral-Products/Aggregates/Marine-Aggregates.aspx [Accessed 28 January 2025].
Pacheco, J. & Brito, J. d., 2021. Recycled Aggregates Produced from Construction and Demolition Waste for Structural Concrete: Constituents, Properties and Production. Materials (Basel), Issue 19.
Rueda-Bayona, J. G., Eras, J. J. C. & Chaparro, T. R., 2022. Impacts generated by the materials used in offshore wind technology on Human Health, Natural Environment and Resources. Energy, Issue 261.
Santolini, E. & al., e., 2024. Towards more sustainable infrastructures through circular processes: Enviornmental performance assessment of a case study pavement with recycled asphalt in a life cycle perspective. Journal of Cleaner Production.
Scottish Construction Now, 2021. And finally… Work completed on UK’s first carbon neutral road improvement project. [Online] Available at: https://www.scottishconstructionnow.com/articles/and-finally-work-completed-on-uk-s-first-carbon-neutral-road-improvement-project [Accessed October 2024].
Scottish Goverment, 2019. Climate Change (Emissions Reduction Targets) (Scotland) Act 2019. [Online] Available at: https://www.legislation.gov.uk/asp/2019/15/pdfs/asp_20190015_en.pdf [Accessed October 2024].
Scottish Government, 2020a. Update to the Climate Change Plan. [Online] Available at: https://www.gov.scot/binaries/content/documents/govscot/publications/strategy-plan/2020/12/securing-green-recovery-path-net-zero-update-climate-change-plan-20182032/documents/update-climate-change-plan-2018-2032-securing-green-recovery-path-net-zero/updat [Accessed October 2024].
Scottish Government, 2020b. Evidence Review and Illustrative Policy Options for a Scottish Aggregates Levy. [Online] Available at: https://www.gov.scot/binaries/content/documents/govscot/publications/research-and-analysis/2020/08/evidence-review-illustrative-policy-options-scottish-aggregates-levy/documents/evidence-review-illustrative-policy-options-scottish-aggregates-levy-final-re [Accessed October 2024].
Scottish Government, 2022b. https://www.gov.scot/publications/scotlands-full-fibre-charter-virgin-media-02-case-study/. [Online] Available at: https://www.gov.scot/publications/scotlands-full-fibre-charter-virgin-media-02-case-study/ [Accessed October 2024].
Scottish Government, 2023. Net Zero Public Sector Buildings Standard. [Online] Available at: https://www.netzerostandard.scot/ [Accessed January 2025].
Scottish Government, 2024. Scotland’s Circular Economy and Waste Route Map to 2030 Consultation. [Online] Available at: https://www.gov.scot/binaries/content/documents/govscot/publications/consultation-paper/2024/01/scotlands-circular-economy-waste-route-map-2030-consultation/documents/scotlands-circular-economy-waste-route-map-2030-consultation/scotlands-circular-economy- [Accessed October 2024].
Tarmac, 2023. Biogenic asphalt with plant based binder for carbon capture and storage. [Online] Available at: https://www.tarmac.com/case-studies/biogenic-asphalt-with-plant-based-binder-for-carbon-capture-and-storage/?cs1_c=52.486243%2C-1.890401&cs1_z=5&cs1_p= [Accessed September 2024].
Thomas, J., Thaickavil, N. & and Wilson, P., 2018. Strength and durability of concrete containing recycled concrete aggregates. Journal of Building Engineering, Volume 19, p. 349–365.
UKGBC, 2025. Aggregates. [Online] Available at: https://ukgbc.org/our-work/topics/embodied-ecological-impacts/aggregates/ [Accessed 28 January 2025].
UNEP, 2023. Building Materials and the Climate: Constructing a New Future, Nairobi: United Nations Envrionment Programme.
Wang, D. & al., e., 2024. Comprehensive evaluation of energy consumption and carbon emissions of asphalt pavement recycling technology. Case Studies in Construction Materials.
World Resources Institute, 2016. Accelerating Building Efficiency: Eigth Actions for Urban Leaders, Washington: World Resources Institute.
Appendices
Appendix A: Methodology
In the completion of this report, the research team completed the following activities:
Task 1: Policy drivers workshop
Task 2: Literature review
Task 3: Data collection
Task 4: Stakeholder interviews
These activities are described in more detail below.
Task 1: Policy Drivers workshop:
Following inception of the project, a workshop was held with representatives of the Scottish Government, CXC, Ricardo and members of the Scottish Aggregates Tax Bill Advisory Group (SATBAG). This workshop was used as springboard to discuss the aims and objectives of this research project, establish a common understanding of:
The taxation and regulatory context as it pertains to the Scottish Aggregates Tax and Scottish Landfill Tax, including:
The potential and feasibility of different tax rates to remove barriers to the use of alternatives to primary aggregates.
Relevant regulations and potential exemptions that might influence their use.
SEPA’s potential role in providing data and regulatory input into the research.
Barriers to the use of secondary and alternatives to primary aggregates, including discussion of: market perceptions, commercialisation issues, cost considerations, and relevant regulations.
Environmental considerations, including: the environmental impact of recycling and potential unintended considerations, alongside policy drivers to minimise waste arising from construction.
Future research and data need to address potential data gaps and requirements to facilitate survey and evidence gathering.
Industry engagement to develop a clearer picture of how tax and regulatory changes will affect different parts of the industry, as well as consideration of cross-border traffic of aggregates between Scotland and other areas, which could impact the effectiveness of any tax or regulatory changes.
Expected impacts and considerations, including price sensitivities to assess the long-term impacts of a policy shift, and the need to carefully balance the economic impact on industries that rely on primary aggregates with the environmental goals of promoting secondary aggregates and minimising waste.
Task 2: Literature review:
An in-depth literature review was undertaken of academic, grey and white paper sources relating to the economic and environmental impacts of the use of alternatives to primary aggregates and their use. The scope of the review primarily focused on Scottish and UK-related studies, and was expanded to cover international best practice studies, particularly as they pertain to life-cycle assessments of alternatives to primary aggregates. These findings were collated in an Excel Document Register to facilitate the identification and analysis of key themes relevant to the study. The sources identified are summarised in Table 4, below.
Task 3: Data collection and analysis:
Following the literature review, the research team progressed to primary data collection from relevant industry stakeholders involved in the supply of alternatives to primary aggregates in Scotland. The purpose of this activity was to gain a baseline understanding of the availability of alternatives to primary aggregates being sold in Scotland. This was then to be used to forecast the potential contribution to GHG reduction targets of an increase in use of recycled or secondary aggregates in the Scottish construction sector. To do this, the research team conducted desk-based research to identify up to 36 suppliers of aggregates, which included: manufacturers of primary aggregates, wash plant operators, construction and demolition waste recyclers, and demolition and excavation companies. Once identified, the collection of primary data was split into two sub-tasks: data collection surveys, and long-form interviews:
Sub-task 3.1: Data collection surveys:
The research team sent out data collection surveys to request the following information for the periods Jan-Dec 2021, Jan-Dec 2022, Jan-Dec 2023:
Material types supplied
Manufacturing locations
Quantities of material produced per year (tonnes)
Associated standards and quality control measures
Challenges associated with either collecting or increasing supply of each material type.
Due to data challenges described in section Error! Reference source not found., the research team received insufficient primary data to accurately forecast the potential availability of alternatives to primary aggregates.
Sub-task 3.2: Stakeholder interviews:
The research team conducted 4 interviews with relevant private companies and industry groups, listed in Table 5, for a duration of 45-60 minutes. The purpose of these interviews was to complement the data collection surveys and gather qualitative data to be used in Task 4, described below.
Research activity
Count
Research activity
Count
Building standards
8
Suppliers contacted for primary datasets
36
Academic and industry papers reviewed
19
Stakeholder interviews/surveys
10
Table 4: Research activities completed
Task 4: Investigate barriers and solutions to the supply of alternatives to primary aggregates:
Following the literature review and data collection phase, the research team conducted a series of interviews with relevant stakeholder groups to discuss any challenges or barriers to the uptake of alternatives to primary aggregates, and to assess potential fiscal or regulatory levers that could be used to mitigate these.
The aim of this phase was to facilitate a deeper understanding of how government and industry can work together to use environmental levies and associated instruments to affect the best possible climate impact and identify any barriers that may negatively impact their implementation. An interview script was developed to gain stakeholder inputs on the following topics:
Perceptions and attitudes toward alternative materials to primary aggregates
Operational considerations related to the supplying of alternatives to primary aggregates
Technical, regulatory and market barriers to the uptake of alternatives to primary aggregates
The policy and regulatory environment related to the application of alternatives to primary aggregates
To ensure that a broad range of viewpoints were considered, 10 interviews were conducted with relevant stakeholder groups identified from the SATBAG and during stakeholder engagement activities in Task 3. These stakeholders are recorded in Table 5.
Stakeholder Group
Organisation
Interview-/Surveyed
Private company
Brewster Bros
Interviewed
Public sector organisation
British Geological Survey
Interviewed
Industry body
British Glass
Interviewed
Industry body
Chartered Institute of Taxation
Interviewed
Local Authority lobbying body
Convention of Scottish Local Authorities
Surveyed
Industry body
Institute of Chartered Accountants Scotland
Interviewed
Private company
J&M Murdoch
Interviewed
Industry body
Mineral Products Association
Workshop
Private company
NWH
Interviewed
Government body
Revenue Scotland
Interviewed
Private company
Tarmac
Interviewed
Private company
Tillicoultry Quarries
Workshop
Industry body
The British Aggregates Association
Interviewed
Private company
W H Malcolm
Workshop
Government representative
William Carlin, Scottish Government
Interviewed
Table 5: Stakeholders engaged
Each interview was recorded and the transcript was cleaned and recorded in an Excel matrix to facilitate objective comparison and analysis of each stakeholder group’s perspective on the above noted topic areas.
Task 5: Synthesising results and report writing
Following completion of Tasks 1-4, the research team reviewed all evidence gathered throughout the study to identify key themes, areas of consensus, and areas where evidence or viewpoints may diverge or contradict each other. These were then mapped against the key objectives of the research project and grouped according to theme. This provided the basis of section Error! Reference source not found. in this report. Following this initial review, an interim report was developed and presented to CXC and representatives of the SATBAG to gain their input and ensure all viewpoints are objectively recorded within the body of the report.
Rob Snaith, R, Foss, J, Connell, J and Bonfait, J. (2025) The role of alternatives to primary aggregates in reducing emissions from the construction sector, ClimateXChange.
While every effort is made to ensure the information in this report is accurate, no legal responsibility is accepted for any errors, omissions or misleading statements. The views expressed represent those of the author(s), and do not necessarily represent those of the host institutions or funders.
This work was supported by the Rural and Environment Science and Analytical Services Division of the Scottish Government (CoE – CXC).
If you require the report in an alternative format such as a Word document, please contact info@climatexchange.org.uk or 0131 651 4783.
Large construction companies that generally manage the entire construction process for a project, often employing sub-contractors as part of the project delivery team. ↑
Saturating in limewater to introduce calcium into the material, thereby augmenting the carbonation reaction in which CO2 in the atmosphere is diffused into cement-based material to react with CH and form calcium carbonates. Results in enhanced strength and durability. ↑
Executive summary
The Scottish Government’s third Scottish National Adaptation Plan (SNAP3) commits to establishing a short-life expert adaptation finance taskforce by 2026 to the support the development of Scottish adaptation investment strategies over the life time of SNAP3.
The Scottish Government and ClimateXChange co-hosted a collaborative “ignite” knowledge exchange workshop on 18 March 2025, bringing together academics, finance experts and practitioners. The event aimed to take the first steps in developing the terms of reference for the adaptation finance taskforce (henceforth referred to as the Taskforce).
The workshop addressed existing challenges in climate adaptation finance, opportunities for further action and examples of successful and innovatively financed adaptation projects from the UK and other countries. Discussions explored key insights highlighted in the Climate Adaptation Finance: Insights and Opportunities for Scotland (2023) paper, which identifies a range of options for Scotland to harness financial solutions for climate adaptation challenges.
There were three main sessions at the workshop:
a panel session on the key challenges and emerging solutions
a panel session exploring case studies for financing resilience
an interactive session to design and prioritise the remit, membership and timeframe for the Taskforce
Key findings and discussion points
Scale of the challenge
Various figures were referenced on the scale of the shortfall between the financial resources needed to adapt to climate change and the amount of finance available (known as the adaptation gap) in Scotland, the UK and internationally. The United Nations Global Adaptation Gap report found that over two thirds of estimated costs/finance needs are in areas that are typically financed by the public sector.
The key message was that climate adaptation finance and investment is lacking and that innovative partnerships across multiple organisations, the private and public sector, are required to bridge the gap. With this challenge comes multiple opportunities for realising co-benefits across the economy and society and for investing in Scotland’s infrastructure, nature and communities.
Workshop speakers and participants highlighted the global scale of the adaptation finance challenge, noting that no nation has fully effective interventions in place. However, there are valuable initiatives and examples of good practice in the international sphere, in the UK and in Scotland. There are opportunities to learn from these pockets of excellence, apply them to the Scottish context and scale them up into bankable frameworks and projects which can be replicated.
Remit of the Taskforce
Attendees supported the idea of a taskforce to advise the Scottish Government on financing adaptation.
A priority for the Taskforce would be to quantify the required adaptation spend and how to prioritise it on a sectoral basis within Scotland. A majority of participants thought that the taskforce should focus on quantifying the finance needed for increasing resilience in Scotland and indicating in which areas or sectors this spend should be prioritised. A possible output could form the basis of an adaptation investment plan.
Working to better integrate adaptation into existing market codes such as Woodland Carbon Code, Peatland Code and emerging biodiversity/natural capital/ecosystem restoration codes was another proposed workstream for the taskforce which had strong support from attendees.
Attendees questioned whether this work needs to be addressed specifically as an adaptation finance taskforce or whether it is part of good sustainable investment and business practices. It may be useful to frame the need for adaptation finance within wider societal challenges such as food security, health and wellbeing, child poverty etc. As an alternative to a taskforce, one participant suggested creating a climate finance platform, or independent broker, to help facilitate partnerships and unlock longer term bankable actions as per the OECD Climate Adaptation Investment Framework.
Taskforce membership
A range of organisations were suggested to form the taskforce membership. Attendees were keen to be involved in the taskforce. A key gap at the event was finance industry practitioner and expert representation. Participants reflected that, although representatives from these institutions were invited, a more effective method of engagement might be to dedicate time to a targeted event for financial institutions and insurance sector representatives.
The proposed members presented in Figure 1 cover four broad areas:
Finance industry
Public sector
Research/academia
Other
Figure 1: Proposed taskforce membership
Timeframe
Due to the Scottish Parliament elections scheduled for May 2026, attendees queried whether a taskforce could be established and provide recommendations before the pre-election period. An alternative could be for it to be proposed as an early action of the new government.
There was general agreement that a taskforce should have start and end point, and the opportunity to reconvene or follow up after their recommendations are made in order to track delivery.
The example of the Net Zero Investor Panel was discussed as a potential format for replication. This took place over 9 months and all members participated either pro bono or had paid for time within their own institutions.
Next steps
The Scottish Government will look to engage further with industry bodies and other stakeholders, recognising the gaps discussed in this report.
ClimateXChange is offering a 7-8 month post-doctoral research opportunity to support the Scottish Government in developing an evidence base for the costs of ensuring a climate resilient Scotland.
Opportunities for financing a climate resilient Scotland – record of discussion
Session 1 – addressing barriers and maximising opportunities
The first morning session was a panel discussion and Q&A aimed at outlining the emerging opportunities and challenges in the adaptation finance space, how this fits into the Scottish fiscal landscape and lessons learned from net zero investment.
David Ulph, Scottish Fiscal Commissioner, provided useful context on the Scottish fiscal landscape including the relationship to Westminster and the overall spending agreement between reserved and devolved powers. He stressed that fiscal sustainability relies on considering include all aspects of mitigation, adaptation and inevitable damages arising from climate change. Emphasis was placed on the role of both private and public sector investment to deliver on all three aspects of climate change spending. More in depth work on mitigation spend has been carried out by SFC and they would be keen to consider adaptation fiscal analysis in future.
The audience heard from Anna Beswick, Policy Fellow at the Grantham Research Institute at LSE working on climate adaptation and resilience, who discussed the scale of the adaptation challenge across the UK and the rationale for increased investment in adaptation. Finance flows are comparatively much lower compared to mitigation though many adaptation actions can also have net benefits for society, the economy and the ability to reach net zero. Anna outlined the goals of the ATTENUATE project (Creating the enabling conditions for UK climate adaptation investment) which include the creation of an Adaptation Investment Framework processes to translate UK National Adaptation Plan ambitions into a range of outcomes. These include creating bankable adaptation projects, how to use public finance to leverage private investment and the understanding the impact of an improved enabling environment for greater investment.
Michael Mullan who leads the OECD’s programme on adaptation finance and investment outlined the context of the global adaptation finance gap and set out the OECD’s investment planning approach through the Climate Adaptation Investment Framework (CAIF). Michael explained that losses related to global climate-induced natural disasters are at an all-time high, but investment is insufficient. The principles for the CAIF could be used as a reference point for the expert task force. Michael also referenced a number of case studies (in Annex X). A key message from Michael’s intervention was that there is currently no global gold standard or “star pupil” for adaptation finance. There are, however, lots of pockets of excellence but they need to be brought together and standardised in order to address the scale of the challenge.
Looking forward to opportunities to try and overcome some of the challenges set out, Ben Connor from Verture presented the findings from the Climate Adaptation Finance: Insights and Opportunities for Scotland (2023) paper published as part of the Adaptation Scotland programme. The barriers to adaptation finance are summarised into six categories in this paper: market, information, technical, bankability, policy, and behavioural. The twelve opportunities to overcome these barriers were then presented in four categories:
Policy
Ambition and vision for a well-adapted Scotland
Develop high integrity, values-led adaptation markets
Mainstreaming adaptation in existing market codes
Data
Quantification of adaptation finance need
Open data platforms and common metrics
Knowledge management and information sharing
Innovation
Grant funds for project development
Blended finance to facilitate private investment
Project delivery innovation
Collaboration
Regional adaptation planning
Support for SMEs
Partnership brokering and collaboration support
These twelve opportunities were discussed as a rough framework for improving adaptation financing in Scotland as part of SNAP3 delivery and used as the basis for the afternoon’s discussion on the remit of the taskforce.
Picture 1: Ben Connor from Verture presenting in Session 1
Recognising that investment in mitigation measures is comparatively more mature than adaptation investment, Dimitris Andriosopoulos Professor of Finance and Director of the Responsible Business Institute (ReBI) at the University of Strathclyde offered some reflections from supporting net zero investment and his experience as a member of the Scottish Government’s Net Zero Investor Panel.
The discussion and Q&A focused on the need to deliver a financial return for private investment and the inherent difficulties in identifying and quantifying this return in the adaptation space. It was suggested that adaptation has a “marketing problem” in this regard. There may be a need to drop the term adaptation all together and just focus on social responsibility, business sustainability, managing climate risks, due diligence and good governance.
An additional barrier limiting adaptation investment was lack of clear signals to the market from government, including cases in the international sphere, resulting from misalignment or lack of join up between governments’ budget/finance and adaptation teams. More collaboration would foster opportunities for larger scale impact.
Discussion reflected a need for balance between the public sector and regulatory levers to incentivise investment and the need to build on the private sector’s understanding of risk and innovation which can sometimes be lacking in the public sector. There was agreement that private investment is needed (it is not an “if” but a “how”) as the public purse will not cover the scale of finance needed.
Session 2 – what works? Case studies for financing resilience
The groundwork for the conversation including the national context was well set out in the first session which allowed for a deeper dive into some examples of examples of ‘what is working’ in Scotland and internationally in session 2. This took a similar format of short presentations and then a panel discussion.
Craig Love, Director of Impact Assessment and Environment at the Scottish National Investment Bank, discussed the regulatory conditions needed for sustainable adaptation investment, specifically the role of financial risk disclosures such as the Taskforce for Climate-related Financial Disclosures (TCFD) framework.
Lucy Jenner from Savills spoke about her work with the Pentland Land Managers Association to work at a landscape scale using a blended finance model to increase nature restoration and increased resilience in the Pentland Hills. The Scottish Government Facility for Investment Ready Nature in Scotland (FIRNS) grant helped employ a farmer as a project manager. She reflected that there can be both challenges and opportunities to these landscape scale models, particularly when benefits might be felt in other parts of a catchment (ie those not paying for the adaptation interventions). It is difficult to attribute benefit and to be clear on what is investible.
Ed Heather Hayes from Fife Coast and Countryside Trust and Jyoti Banerjee from North Start Transition presented on another blended finance project pilot at the Dreel Burn in Fife and the opportunities from collaboration on Nature Finance Fife and the Fife Transition Lab. Both projects look for innovative solutions to funding nature restoration and the speakers were advocates for good investment practice and collaboration across sectors. The private partners they have worked with might need more convincing about the need to invest in nature, and need to value ecosystem services, so there is further work required to demonstrate the financial case for investment.
Finally, offering perspectives from the Regions4 network, Melisa Cran highlighted that subnational governments across the world are key drivers of adaptation and that they can be instrumental in delivering innovative approaches to address adaptation finance challenges. She gave examples from Catalonia, Quebec, Lombardy and regions in Brazil which are investing in local-level adaptation, mobilising private capital and testing different climate-resilience financial approaches. Further case study details can be found in Appendix A.
Session 3 – Identifying the remit and membership of the Taskforce
The afternoon session involved facilitated groups of 6-8 people with the purpose of discussing the remit, timeframe and membership of the proposed Scottish Government taskforce on adaptation finance.
In terms of its remit, participants were reminded of the key opportunities for action outlined in the Adaptation Scotland Adaptation Finance Insights and Opportunities paper. These were proposed as potential workstreams for the taskforce. After discussing in groups, participants were encouraged to indicate a prioritisation of workstreams by placing red sticky dots on the various potential opportunities previously identified or offer new suggestions.
The results of this prioritisation exercise can be seen in Table 1 below.
Participants indicated a clear preference for the taskforce to be focused on the quantification of investment/finance needed and mainstreaming adaptation in existing market codes such as the peatland code, woodland carbon code and developing ecosystem restoration codes.
From further discussion, it was suggested the quantification of Scotland’s adaptation finance need would need to go beyond a single high-level figure (as per those referenced in Session 1).
Quantification of investment needs for adaptation should involve the following actions:
Identifying what spend should be included as delivering for adaptation
Highlighting the key sectors which will require adaptation spend
This could be prioritised in terms of levels of risk or sectors of the economy most likely to be impacted by climate change and/or areas where public finance is likely to be most lacking/insufficient
This sequencing (finance gap + priority sectors = spend over next 5-10 years) could form the basis of an adaptation investment plan
There was recognition that we cannot wait until we have the “perfect” quantification of finance, but improved costings are required to help prioritisation of spend and to signal where investment is most needed.
Table 1: prioritisation of workstreams for the Taskforce
Intervention from AS finance insights and opportunities paper
Indication of preference (sticky dots)
Comments/post-its
Quantification of finance needed
12
For this clarification of definitions would be helpful: how does SG define adaptation and resilience? This would feed into data being used to quantify need – i.e. what “counts” as adaptation investment?
Need to understand scale of challenge and where we should prioritise spend
Mainstreaming adaptation in existing market codes (such as peatland code, carbon code etc)
11
Regional adaptation planning
8
(Provide governance of RAPs for investment – pivot to Regional Adaptation and Investment Plans)
Partnership brokering and collaboration support
6
Open data platforms and common metrics
6
Blended finance models
5
PDI
4
(Suggestion to help get ideas to an investment ready stage or supporting sequencing of policies from short to long term), picking off any low hanging fruit
Grant funding for project innovation
2
Vision for a well-adapted Scotland
2
A vision already exists through SNAP3. However, there is a need to get specific, go from how to finance adaptation to how do we finance these specific actions to deliver X vision)
Development of new, high integrity, values led markets
1
Knowledge management and information sharing
0
Targeted support for SMEs
0
Largely covered off by Adaptation Scotland engagement.
Other suggestions
Prioritising policies that can be invested in from private sector perspective rather than where are the biggest gaps
Upskilling and training
Supporting projects to start and then scaling them up (possibly similar to a SG funded incubator/accelerator programme)
Relationship building with the private sector
Need to recognise that this is long-term work but a short-term taskforce may provide a catalyst
Appendix A – Case study resources
ATTENUATE project – three ongoing case studies on bridging the adaptation funding gap
West Midlands Combined Authority on flooding and the risk to the built environment, transport network and social cohesion
London Borough of Hackney on risks to health, welfare and productivity, with a focus on social housing, from high temperatures and heatwaves
HM Treasury and Defra on risks to public and private assets, infrastructure, businesses, health, and to public finances (spending and income) from flooding and high temperatures
Catalonia, Spain: Creation of a Climate Fund funded by vehicle emissions taxes. Has generated 380 million EUR since 2021 to support adaptation and mitigation projects
Lombardy, Italy: Pioneering green budgeting, integrating climate priorities into public finance for better transparency, targeted investments, and increased access to climate funds.
Basque Country, Spain: First region in Spain to integrate the socioeconomic perspective into climate risk assessment, assessing the financial impacts of sea level rise and flooding to losses from €450 million to €2 billion by 2100.
Dr Kate Donovan, Co-Director of Edinburgh Climate Change Institute and Policy Director of ClimateXChange – Welcome
Sarah Chalmers, Scottish Government – Setting the Scottish Policy Context – adaptation finance in the Scottish National Adaptation Plan (2024-29)
10:30-11:30 Session 1 – Key challenges in mobilising adaptation finance and emerging solutions, Chair: Kate Donovan (ECCI and CXC)
Anna Beswick (Grantham Institute, LSE) – Addressing the adaptation finance challenge: rationale for increased investment and the need for the ATTENUATE project
Michael Mullan (OECD) – Global adaptation finance challenge and investment planning approaches (OECD CAIF framework)
Ben Connor (Adaptation Scotland) – Emerging solutions for Scotland
Dimitris Andriosopoulos (University of Strathclyde) – Lessons from Net Zero investment (SG investor panel)
David Ulph (University of St Andrews/Scottish Fiscal Commission) – Key fiscal risks from climate change
11:30-11:45 Coffee break
11:45-13:00 Session 2 – What works? Case studies of financing resilience, Chair: Anne-Marte Bergseng
Craig Love (SNIB) – The role of financial risk disclosures
Ed Heather Hayes (Fife Coast and Countryside Trust) and Jyoti Banerjee (North Start Transition) – Blended finance project pilot – Dreel Burn & Scottish Transition Lab
Lucy Jenner (Savills) – Blended finance project – Pentland Land Managers Association
Melisa Cran (Regions4) – Adaptation finance in other sub-national regions
13:00-14:00 Networking lunch
14:00-15:15 Session 3 – Remit of the SG expert Adaptation Finance Taskforce
Sarah Chalmers, Scottish Government – context and remit
Table discussions
15:15-16:00 Closing discussion Kay White (CXC) and Ben Connor (Verture) and next steps (Sarah Chalmers)
16:00-17:00 Drinks reception
Appendix C – Input from participants (Slido)
Appendix D – Attendee organisations
Adapt40
AECOM
Association of British Insurers
Aviva
Cadlas
Climate Emergency Response Group
ClimateXChange
CLIMPATH
Fife Coast and Countryside Trust
Forth Climate Forest
Government’s Actuary Department
King’s College London
London School of Economics
OECD
Rebalance Earth
Regions4
Scotland Beyond Net Zero
Scottish Government
Scottish Fiscal Commission
Scottish National Investment Bank
Savills
University of Aberdeen
University of Glasgow
University of Strathclyde
University of St Andrews
Verture
The Scottish Government and ClimateXChange wish to thank all participants and presenters for taking part in the workshop on 18 March 2025.
While every effort is made to ensure the information in this report is accurate as at the date of the report, no legal responsibility is accepted for any errors, omissions or misleading statements. The views expressed represent those of the author(s), and do not necessarily represent those of the host institutions or funders.
This work was supported by the Rural and Environment Science and Analytical Services Division of the Scottish Government (CoE – CXC).
ClimateXChange, Edinburgh Climate Change Institute, High School Yards, Edinburgh EH1 1LZ
The Scottish Landfill Tax (SLfT), introduced in April 2015, was designed to discourage landfill disposal and encourage prevention, reuse, recycling, and energy recovery.
The tax has two rates. The lower rate of SLfT was designed to provide a low-cost disposal route for inert, low-risk materials, such as rocks and soils. A higher standard rate targeted more polluting materials to support environmental goals.
In early 2024, lower-rate materials exceeded standard-rate materials for the first time. Along with shifts in policy priorities and a widening gap between the lower and standard tax rates, this raises questions about whether the lower rate remains aligned with the Scottish Government’s environmental objectives.
Aims
This research provides an initial evidence base to assess the effectiveness of the lower rate and explore whether changes could better support a low-carbon, circular economy. It examines the most common lower-rate materials, their environmental impacts, the feasibility of diversion and options for policy reform.
We conducted quantitative and qualitative data analysis, a literature review and stakeholder engagement.
Findings
Priority materials
We found that three materials accounted for 77% of all waste landfilled at the lower rate in 2023–24, by weight:
mechanically-treated fines (small particles from treatment of general construction and demolition waste, municipal recyclate etc.)
soils and stones from construction waste
mechanically-treated mineral fines (small particles from treatment of naturally-occurring materials such as rocks and soils, silt, clay, sand and stones, found in quarry, construction and demolition waste etc)
Mechanically-treated fines make up the greatest quantities of all lower-rate materials, despite being intended as a residual output from material recovery processes. Trends raise concerns regarding misclassification and (from our interviews) of intentional production.
Environmental impact analysis, based on the quantities landfilled in Scotland, showed that these three materials also have the highest impacts across indicators such as air pollution, water use and resource scarcity.
The classification of lower-rate materials is complex. The European Waste Catalogue (EWC) codes used by industry do not directly align with SLfT qualifying categories. Moreover, some codes encompass a range of material compositions depending on their source. Mechanically-treated fines are diverse in composition, originating from various construction waste materials. Soils and stones from construction waste, though better defined, also pose classification and compliance challenges. Mechanically-treated mineral fines tend to be more uniform.
Waste prevention and landfill diversion options
Soils and stones are often reused on-site or in restoration, though off-site reuse is constrained by regulation, logistics, and project timing. Options for recovering and re-using mechanically-treated fines are limited, due to contamination and variable composition. The recovery of mechanically-treated mineral fines is easier than the recovery of non-mineral fines but the cost and technical barriers make the use of virgin materials a simpler option.
Upstream measures in the construction sector may have more impact than attempts to recover and re-use waste. Such measures might include improving waste source segregation, designing for reuse and avoiding demolition. While such interventions are technically viable, they are limited in practice by weak incentives, inconsistent standards, and market barriers.
Policy assessment
The SLfT interacts with several fiscal and non-fiscal policies, both existing and on the horizon. These include the upcoming ban on biodegradable municipal waste to landfill; Scottish Aggregates Tax and Digital Waste Tracking, both expected in 2026 (DEFRA, 2023). Based on the assessment of diversion options for the priority materials, we highlighted various fiscal and non-fiscal policy options for future consideration.
Conclusions
This study suggests the lower-rate SLfT may be only partially aligned with Scotland’s current circular economy, waste prevention and climate goals. While it has supported some diversion of inert waste from landfill, it may also be driving unintended behaviours and limiting investment in recovery. Both fiscal and non-fiscal actions may be needed to address these challenges. The upcoming Scottish Aggregates Tax and wider circular economy policy agenda offer opportunities to align SLfT more closely with long-term environmental objectives.
Key areas for further exploration could include:
Raising the lower SLfT rate to incentivise application of the waste hierarchy.
Assigning a new SLfT rate to mechanically-treated fines, to address misclassification and recognise its relatively high environmental impacts.
Strengthening enforcement and guidance on material classification to reduce compliance risks.
Build on existing cross-border regulatory and enforcement cooperation to address ongoing challenges such as waste tourism and the evolution of the landfill tax.
This research is relevant to the Scottish Government, Revenue Scotland, SEPA, and others involved in the design or enforcement of fiscal and waste management policy, as well as stakeholders in the construction, demolition and waste processing sectors.
Glossary / Abbreviations table
AGL
The Aggregates Levy, a UK tax on the use of virgin rock, sand, and gravel for commercial purposes such as building roads and houses; to be replaced in Scotland by the Scottish Aggregates Tax from 1 April 2026
BMW
Biodegradable municipal waste
CCL
The Climate Change Levy, a UK tax to encourage reduction in gas emissions and greater efficiency of energy use.
CPF
Carbon Price Floor, a UK policy which imposes a tax on fossil fuels to incentivise investment in low-carbon power generation
C&D
Construction and demolition
C&D fines
Collective term used in this report for mechanically-treated fines (19 12 12) and mechanically-treated mineral fines (19 12 09) due to similar end-of-pipe diversion options and barriers
EPR
Extended producer responsibility, the responsibility of a producer for the environmentally sound management of a product until the end of its life
EWC code
European Waste Catalogue code, used in Scotland and across the UK for classifying waste, and sometimes referred to as the ‘list of wastes’
GHG
Greenhouse gas
LCA
Lifecycle analysis, a process of evaluating the effects that a product has on the environment throughout its production, use and disposal
LOI
Loss on ignition testing, introduced by HM Revenue and Customs in 2015, is used to determine the organic content of waste fines, helping prevent misclassification for landfill tax purposes: fines with less than 10% LOI qualify for a lower tax rate
RS
Revenue Scotland
SAT
Scottish Aggregates Tax, due to replace the UK AGL from 1 April 2026
SEPA
Scottish Environment Protection Agency
SLfT
Scottish Landfill Tax
SWEFT
Scottish Waste Environmental Footprint Tool, developed by Zero Waste Scotland, quantifies the environmental impact of household waste on a whole lifecycle basis
WAC
Waste acceptance criteria test is used to assess how waste will behave once landfilled, primarily by analysing leachate to determine suitability for disposal.
WTN
Waste transfer note, a document that details the transfer of waste from one person or organisation to another
Introduction
Research context and aims
The Scottish Landfill Tax (SLfT) was introduced in April 2015, following the devolution of landfill taxation under the Scotland Act 2012. It replaced the UK Landfill Tax in Scotland and was designed to discourage landfill disposal and encourage adherence to the waste hierarchy. This hierarchy prioritises prevention, reuse, recycling, and energy recovery over landfill.
The tax is collected and administered by Revenue Scotland and has two rates. The standard rate, which covers materials more likely to pollute the environment or generate greenhouse gas (GHG) emissions, will be £126.15 per tonne in 2025-26. The lower rate is £4.05 per tonne as of April 2025 (Revenue Scotland, 2024b). The lower rate applies to materials considered to have low GHG emissions, limited pollution risks, and no hazardous properties when landfilled. For instance, ceramics, glass, soil and stones, and various mixtures of inert materials. Both rates were raised incrementally each year from 2015-16 to 2024-25, and increased by around 24% in April 2025-26 (Revenue Scotland, 2024a).
However, there is a large, widening gap between the rates, and the criteria and conditions for setting them have remained unchanged since 2016. This prompts questions about whether the lower rate continues to align with Scotland’s evolving environmental priorities. It also offers opportunities for policy development, which this research explores. The timing of this study is particularly relevant: a UK Government consultation on landfill tax reform is underway at the time of the publication of this study, concluding in July 2025 (HM Treasury and HMRC, 2025). Moreover, in 2024, the Welsh Government implemented an increase to its lower rate. These developments signal a wider shift in approach across the UK, and this research aims to inform future decision-making in Scotland as part of that wave of change.
Tonnages of landfilled waste have steadily declined over the past decade, but standard rate materials have dropped fastest. In early 2024, the quantity of lower rate materials exceeded that of standard rate materials for the first time. Figure 1 shows the gap between standard rate material (in orange) and lower rate material (in teal) has narrowed in the last 5 years. The widening gap between the lower and higher tax rates has also increased concerns about whether this is driving waste misclassification and crime. It is hard to determine a clear trend related to the landfilling of lower rate material in the years since 2020.
Figure 1: Tonnes of taxable waste declared by quarter in Scotland (source: Revenue Scotland)
The upcoming ban on landfilling biodegradable municipal waste, effective from the end of 2025, is expected to accelerate this trend (Scottish Government, 2022). It is therefore timely to focus in on lower rate materials to assess if SLfT is still serving its purpose. The Scottish Government has committed to explore whether changes may be needed to this or related policy levers, to support progress towards a low-carbon, circular economy (Scottish Government, 2024a).
The SLfT intended to support Scotland’s environmental objectives, which include
Reducing the volume of waste sent to landfill.
Lowering GHG emissions.
Minimising pollution risks in landfill environments.
Promoting the application of the waste hierarchy.
Scotland’s waste and resources policies have evolved since the landfill tax was introduced. They are now strongly oriented towards the objectives set out in the Circular Economy (Scotland) Act 2024 and the Circular Economy and Waste Route Map to 2030 (Scottish Government, 2024a). These provide a framework for increasing resource efficiency and reducing reliance on landfill. Specific information on these can be found in Appendix A.
The Route Map commits to developing a residual waste plan to 2045 and reviewing materials currently landfilled to identify alternative management routes by 2027. The SLfT legislation allows for additional lower rates to be created in support of future policy (Scottish Government, 2022).
Scotland’s net zero targets and biodiversity strategy were introduced in light of the twin climate and biodiversity crises. They have reinforced the need for waste and resources policies that support decarbonisation across all sectors. Most environmental impacts associated with resource use take place before materials are disposed of. A circular economy, with an emphasis on resource efficiency and waste prevention, is therefore essential for meeting Scotland’s environmental objectives. SLfT should be evaluated in this context, considering not only tonnages landfilled but the whole-life environmental impacts of materials.
Project objective, aims and research questions
The overarching objective of this research is to evaluate the effectiveness of the lower rate of SLfT in supporting Scotland’s environmental policy objectives. These policy objectives include reducing the volume of waste sent to landfill, lowering GHG emissions, minimising pollution risks, and encouraging materials to move up the waste hierarchy.
This research supports policy development by assessing whether the lower rate of SLfT remains effective in advancing Scotland’s environmental objectives. It also examines whether adjustments to the tax or related policy levers could accelerate progress towards these objectives. Specifically, this study aims to:
evaluate the effectiveness of the lower rate in supporting Scotland’s environmental goals;
identify the lower-rate materials that have the greatest environmental impact;
explore waste prevention and diversion options for lower-rate materials and their feasibility;
assess key barriers to reducing reliance on lower-rate landfill disposal;
examine how the SLfT interacts with other fiscal and non-fiscal waste and environmental management policies and identify areas for future research and policy interventions.
To achieve these aims, the following research questions are addressed:
Which materials landfilled at the lower rate rank the highest in terms of quantity and negative environmental impacts?
What diversion options and alternative treatments exist for these materials, and how feasible are they in light of technical, market, and policy barriers?
What are the key barriers to reducing the volume of materials landfilled at the lower rate, and how can they be addressed?
How does the SLfT intersect with other fiscal and non-fiscal waste management and environmental policies, and what options exist to strengthen policy?
This report provides an initial evidence base for discussions on potential changes to the lower rate of SLfT. It does not present a cost-benefit analysis of policy options. It highlights the highest-impact materials and presents opportunities to divert from landfill, noting key barriers.
These findings aim to contribute to ongoing policy discussions and future research,
in support of Scotland’s transition to a low-carbon, circular economy.
Methodology
This study was conducted from December 2024 to March 2025 by Resource Futures and Aether, in collaboration with a steering group comprising the ClimateXChange research lead and representatives of the Scottish Government, SEPA and Revenue Scotland. It followed a three-stage approach (see Figure 2).
We designed the methodology to provide an initial evidence base to progress policy development. Robust data analysis was used to identify key materials and focus future research. Key materials were determined based on impact.
Figure 2: Research approach
We used quantitative and qualitative data analysis, a literature review, and stakeholder engagement to support this approach. Table 1 below summarises each research stage and corresponding data collection methods. These are further detailed in Appendices B and C.
Table 1: Data collection methods by research stage
Data collection methods
Research stage
Prioritisation of materials
Review of diversion and prevention options
Policy assessment
Weight-based EWC code analysis
X
Environmental impacts analysis
X
Desk-based research
X
X
Stakeholder engagement
X
X
X
In the first stage, we assessed tonnage and environmental impacts data on materials landfilled at the lower rate. This enabled us to prioritise the top three material streams.
We analysed tonnage data by EWC code, or groups of codes where necessary. This relied on data obtained from SEPA and Revenue Scotland. To assess environmental impacts, we used the Scottish Waste Environmental Footprint Tool (SWEFT). This covers a range of environmental indicators, including GHG emissions, resource depletion, and pollution potential (Zero Waste Scotland, 2024). We refined our understanding of the top material streams, through engagement with waste management operators, industry experts, policymakers, and the project steering group.
In the second stage, we examined opportunities to move lower-rate materials up the waste hierarchy. A high-level literature review identified prevention, reuse, recycling, and recovery options, assessing their technical feasibility. Stakeholder interviews provided further insights into potential diversion options and barriers to these.
In the final stage, we reviewed how the lower rate of SLfT interacts with related policies. We used desk-based research to review other relevant measures and draw comparisons with landfill taxation in other jurisdictions. Engagement with policymakers and regulators provided insights into how the tax operates in practice. We identified areas where further research is needed to address gaps or unintended consequences.
For the stakeholder engagement, we conducted eight in-depth, semi-structured interviews, and gathered additional insights via email, in January to March 2025. Further details of the methodology, including the stakeholder engagement, can be found in Appendix C.
Quantitative data review to determine priority materials
This section sets out how we identified the three highest-impact material streams taxed at the lower rate, which are assessed in more detail in Sections 5 and 6.
We first give a summary of the process for preparing and classifying waste for landfill in Scotland (Section 4.1). We then present findings by weight based on Revenue Scotland and SEPA data (Section 4.3) then on the weighted environmental impact of materials (Section 4.4). This forms the basis for prioritising lower-rate materials summarised in Section 4.5.
Introduction to classifying and preparing waste for landfill in Scotland
For waste to be landfilled in Scotland, waste producing businesses must follow a structured process to ensure compliance with environmental regulations. This process involves multiple parties, including waste producers, skip operators, transfer station operators, landfill operators, and regulators such as SEPA and Revenue Scotland.
Key steps in preparing waste for landfill include:
Waste identification – determining the type of waste based on its source, composition, and potential hazards.
Waste characterisation – including chemical analysis and testing (where required) to assess hazardous properties and biodegradability.
Waste classification – the waste is assigned a European Waste Catalogue (EWC) code by the waste producer. EWC codes must be included on waste transfer notes (for non-hazardous waste) and hazardous waste consignment notes. These documents accompany waste during its movement and disposal and are checked by waste carriers, site operators, and regulators.
Pre-treatment and landfill acceptance requirements – including necessary treatment to reduce environmental impact, compliance with landfill permit conditions, and landfill waste acceptance criteria (WAC) testing, where required.
Documentation and record-keeping – maintenance of records, results and transfer documentation to ensure legal compliance.
Two key documents to support businesses in meeting these obligations are:
Waste Classification Technical Guidance (WM3) (SEPA et al, 2015): The guidance, co-produced by SEPA, Natural Resources Wales, Northern Ireland Environment Agency, and Environment Agency, provides comprehensive instructions on identifying whether waste possesses hazardous properties.
Criteria and Procedures for the Acceptance of Waste at Landfills (Scotland) Direction 2005 (Scottish Government, 2012a): The document gives criteria and procedures for waste acceptance at landfills, ensuring compliance with environmental standards. WAC are described in the accompanying ‘Schedule’ to this Direction.
SEPA holds responsibility for governance of compliance and therefore holds national level data on the transfer and treatment of waste into, within, and out of landfills in Scotland. As regulator of the SLfT, Revenue Scotland holds parallel data obtained through tax returns. The anonymised data from Revenue Scotland, alongside SEPA’s, underpins the analysis presented in the following section.
While many elements of the landfill preparation process are legal requirements, some practices – such as separating certain materials for recovery – are strongly encouraged by regulators or industry bodies due to viable diversion routes or market demand. These distinctions are important context for the findings presented later in this report.
Overview of waste data analysis
This section presents a summary of analysis performed on waste tonnages data provided by SEPA, and SLfT returns data from Revenue Scotland which was anonymised for the purposes of this study. The data provided by SEPA and Revenue Scotland are categorised by EWC code (European Commission, 2000). These data insights can be used to help progress policy development.
EWC codes are a list of waste descriptions used in all UK nations and EU member states. However, as explained in detail in Section 5.3, EWC codes do not directly correlate to SLfT rates. EWC codes must be used on waste transfer notes and hazardous waste consignment notes. The submission of waste transfer notes also comes with ‘operator descriptions’ to further explain the EWC code categorisation. There are around 650 individual codes split across 20 ‘chapters’. The chapter typically defines the industry or source of waste; however, some definitions are more material- or process-based. Despite the large library of codes, some remain broad in scope. This means that use of the EWC codes within a dataset does not automatically achieve transparency or traceability in terms of material definitions.
For this report, descriptors have been adopted for each EWC code, or group of codes, present within the lower-rate tonnages data provided by Revenue Scotland. These are outlined in Table below.
Table 2: EWC codes within the lower tax rate in Scotland
Mixed niche materials, including from end-of-life vehicles
17 01 01
Concrete
We ranked the data from Revenue Scotland on lower-rate waste to landfill by weight. Data from SEPA for each matching EWC code, or group of codes, was then used to identify the amount of each material landfilled at lower rate as a proportion of the total landfilled. This allowed for prioritisation based on overall tonnage of lower rate material. Further information on steps for data cleansing and review is provided in Appendix B.
Results show the largest quantities landfilled in Scotland by material (at both lower and standard rate), in the financial year 2023 to 2024, were soil and stones, mechanically-treated fines and mechanically-treated mineral fines.
It is important to note that the data presented does not account for exemptions, meaning the reported tonnages are likely an underestimate of the actual quantities of waste generated. Exemptions are highlighted later in the report throughout Sections 6 and 7.
Figure 3 below highlights how the ranking changes when considering only materials landfilled at lower rate (in teal) with results for standard rate material also shown (in orange). The top three materials by weight are:
19 12 12: Mechanically-treated fines (fine particles left over from mechanical waste processing)
17 05 04: Soil and stones (non-hazardous soils and stones from C&D waste)
19 12 09: Mechanically-treated mineral fines (fine particles of minerals, e.g. sand and stones, left over from mechanical waste processing)
These three materials make up 77% of the material landfilled at lower rate in 2023-24. The analysis shows that most mechanically-treated fines and mechanically-treated mineral fines are landfilled at the lower rate. In comparison, only a small portion of soil and stones is landfilled at the lower rate.
Figure 3: Tonnage of waste to landfill at standard and lower tax rates by EWC code, 2023-2024.
Analysis of waste quantities and composition data
We identified short-term trends for each material. We also reviewed operator descriptions in the SEPA data to better understand the materials and their origins. Summaries are presented for the three material groups landfilled in the greatest quantities at the lower rate of tax. These are presented in order with the highest tonnage first.
Mechanically-treated fines: EWC 19 12 12
This non-hazardous material group contains fine particle rejects from mechanical waste processing, including sorting, crushing, pelletising and compacting, as well as a minority share of anaerobic digestion residue. A more detailed description is provided in Section 5.1.
Approximately 60% of mechanically-treated fines were landfilled at the lower rate of tax in 2023-24. As shown through SEPA and Revenue Scotland data in Figure 4 below, the overall quantity landfilled has decreased over the most recent three-year period. However, the quantity landfilled at lower rate (in teal) has increased, while the quantity landfilled at standard rate (in orange) has decreased.
For context, the quantity landfilled under the lower rate was consistently under 200,000 tonnes before 2020. This increased sharply to a peak in 2022-23, before declining slightly again in 2023-24, but remaining well over pre-2020 levels.
Figure 4: Tonnage of waste to landfill at standard and lower tax rates for the three priority materials from 2021 to 2024.
Soils and stones from construction waste: EWC 17 05 04
The soils and stones EWC code group is for non-hazardous materials and results from construction and demolition waste. It is restricted to topsoil, peat, subsoil and stones only. Therefore, soil waste classification testing must take place to determine if soils are non-hazardous or inert (qualifying for the lower rate), or hazardous (standard rate). More information is provided in Section 5.2.
Approximately 21% of soils and stones was landfilled at the lower rate in 2023-24. Figure 4 shows that both the total quantity landfilled (ie the combined teal and orange bars), and the quantity landfilled at lower rate (in teal), have decreased from a 2021-22 peak. As a result, the portion of this waste group landfilled at the lower rate has remained stable over the most recent three years.
Based on the operator descriptions submitted with the waste transfer notes, this EWC material group contained just over 12,000 tonnes (2.2%) of ‘contaminated’ soil in 2023-24. It should be noted that contaminated is not equivalent to ‘hazardous’. Descriptions of this EWC code attached to records of larger waste quantities simply state “contaminated soil” with no further specificity. Descriptions accompanying some of the smaller quantities of lower-rate waste have mention of contamination by Japanese knotweed.
In addition, around 10,000 tonnes (1.8%) was recorded as having traces of asbestos in 2023-24, almost entirely from one waste record. This was much higher than any records mentioning traces of asbestos for previous years.
These findings highlight uncertainty around the application of WAC testing to this code. Soil and stones containing hazardous substances may potentially have been misclassified under the non-hazardous code 17 05 04, instead of its hazardous counterpart, 17 05 03. From stakeholder interviews, it is understood that misclassification is likely to contribute to the large quantity of soil and stones being disposed of under this material group.
Mechanically-treated mineral fines: EWC 19 12 09
This material group is classified as fines from naturally occurring rocks and soils, silt, clay, sand and stones. It is non-hazardous. A more detailed description is available in Section 5.1.
76% of this material group was landfilled at the lower rate of tax in 2023-24, which was similar to the portion in 2022-23. Looking further back, the quantity landfilled at lower rate peaked at just over 120,000 tonnes in 2019-20, before a significant decline in the following two COVID years. Quantities landfilled at the lower rate have bounced back slightly but not to pre-COVID levels.
As shown in Figure 4 above, this material group is landfilled in proportionally greater quantities under the lower rate (in teal) than the standard rate (in orange).
Baseline environmental impact of materials
We used Zero Waste Scotland’s SWEFT data to provide a high-level assessment of how the materials landfilled at lower rate may impact the environment. This enabled us to check whether any lower-tonnage material groups warranted further attention due to their disproportionately higher environmental impacts.
The tonnages for 2023-24 were multiplied by lifecycle-based SWEFT factors. Lifecycle-based SWEFT factors consider the entire environmental impact of a material, from extraction to disposal, which helps assess its true ecological footprint. This produced a weighted impact for each material group against each of SWEFT’s six environmental indicators. Further information on methods and assumptions in application of SWEFT is provided in Appendix B.
Because SWEFT factors covers a range of environmental impacts, they cannot be aggregated into a single, comparable “score”. To visualise and compare relative impacts, we used a spider diagram (see Figure 5), which presents the results for the top six material groups landfilled at lower rate in Scotland during 2023-4.
Figure 5 below shows that the top three material groups by tonnage also have the greatest environmental impacts. These materials – mechanically-treated fines, soil and stones, and mechanically-treated mineral fines – are shown in the colours teal, dark orange and black respectively .
Mechanically-treated fines are estimated to have the largest weighted impacts on air pollution, mineral resource scarcity, water consumption and land use. Soil and stones, and mechanically-treated mineral fines, have the next-highest impacts for the same indicators.
One mixed material group (shown in light orange) scores highest on GHG emissions and biodiversity. However, this group, was found to be almost entirely made up of drill cuttings in 2023/24 based on operator descriptions within the SEPA data. As a result, we chose to describe this as a niche material (see Table 2). This results in a high environmental impact but with high uncertainty.
No other material groups were flagged as priorities for further research based on this high-level analysis of environmental impacts. As such, the three lower-rate material groups landfilled in highest quantities were prioritised for further research.
Figure 5: SWEFT tool results presented by material and relative environmental impact (only top six scoring material groups are shown)
Priority materials and supporting interview data
From the analysis of tonnage landfilled and environmental impact assessment, three material groups were prioritised: soils and stones, mechanically-treated fines, and mechanically-treated mineral fines. These materials accounted for 77% of lower-rate landfilled waste in 2023-24 and had some of the highest environmental impacts, particularly on air pollution, resource scarcity, and land use.
Grouped codes of niche materials were excluded due to data limitations: (i) they consist of multiple waste types with varying, and unknown, compositions and quantities, and (ii) the lack of specificity meant the assessment of environmental indicators relied more on generalised assumptions.
Focusing on the three dominant materials enabled targeted research into impactful interventions to reduce landfill and improve resource recovery. This selection was also verified through analysis of interviewee responses. For example:
Mechanically treated fines, mechanically-treated mineral fines and soils and stones were confirmed as the main materials: “They are the majority of materials in the lower rate.” (Commercial remediation company interview); “A lot of the lower rate material will essentially be fines.” (C&D waste management processor)
Most high-quality materials are already reused in construction: “The only reason construction companies take things off sites now is because they can’t use it.” (C&D skip operator)
Mechanically-treated fines come from transfer stations and skip waste: “Mechanical fines come from transfer stations and sorting of skips waste. Skip operators generate the majority of the fines in the Scottish market.” (Commercial remediation company)
Mechanical-treated fines create challenges for waste management: “Mechanically-treated fines are the top waste we question whether the rate is right.” (SEPA interview) and “we tend to stay away from mechanically-treated fines, because the administration and risk of misclassification sits with us.” (Commercial landfill operator)
Complexities in the categorisation of priority materials
Determining when a material qualifies for the lower rate is not straightforward. This is due to the complex properties of the lower-rate materials, the sources of these materials and the different classification systems used in policy. To aid in understanding, this section outlines what the three priority material streams comprise, the sources of these materials and their link to categorisations in Scottish policy.
Mechanical fines: EWC 19 12 12 and 19 12 09
Two of the priority materials, mechanically-treated fines and mechanically-treated mineral fines, belong to the same EWC chapter 19 12. This chapter refers to waste from the mechanical treatment of waste, for example sorting, crushing, compacting or pelletising (Dsposal, n.d.). These are commonly referred to as trommel fines, or mechanical fines (typically 10-40mm).
Fines that qualify for the lower rate under both waste codes largely come from construction and demolition (C&D) waste and, therefore, share similar diversion options and barriers which are discussed in Section 6. The term ‘mechanical fines’ is used hereafter as shorthand when these two categories of fines are discussed together.
The key distinction between the codes is their composition:
Mechanically treated mineral fines (EWC 19 12 09): Primarily from excavation and mechanical treatment of quarry waste, C&D waste, and aggregate recycling (WRAP and Environment Agency, 2013). Composition is relatively uniform.
Mechanically treated fines (EWC 19 12 12): Includes fines from mixed C&D waste, municipal recyclate, and residual waste. Fines qualifying for the lower rate are primarily from mixed C&D waste due to higher inert content (Di Maria et al., 2013; Vincent et al., 2022). Composition is far more varied.
The interview findings and other data suggest that mechanical fines – whether classified under EWC 19 12 09 or 19 12 12 – are commonly produced at transfer stations and through the mechanical sorting of skip waste, particularly when handling C&D material. Composition is mostly crushed bricks, tiles, concrete, and ceramics – similar to mineral fines (the same as mechanically-treated mineral fines). However, the code can also include additional inert materials, including fines from the mechanical treatment to recycle furnace slags, bottom ash, and plasterboard to recover gypsum[3] (Environment Agency, 2023a; Environment Agency, 2023b).
To summarise, both types of mechanical fines may contain a small amount of contamination and non-qualifying material, but can still be eligible for the lower rate if they meet the conditions set out in Article 4 of the 2016 Order. To qualify, fines must either consist entirely of qualifying material or contain only a minimal amount of non-qualifying material, must not be artificially mixed or hazardous under WM3, and must pass the Loss on Ignition (LOI) test with a result of 10% or less (Revenue Scotland, n.d.). Otherwise, they are subject to the standard rate.
Some waste producers intentionally misclassify mechanical fines to avoid the higher rate of tax, using blending techniques to bring LOI values down (Ali, 2023; SEPA, C&D waste management processor interview, commercial landfill operator interview). Many small- to medium-sized skip operators handle this waste, making enforcement difficult (waste industry association and commercial remediation company interview).
Soils and stones from construction waste: EWC 17 05 04
The EWC code 17 05 04 refers to non-hazardous soils and stones from C&D waste (including excavated material from contaminated sites) (Dsposal, n.d.; Environmental Standards Scotland, 2024; Katsumi, 2015; Commercial remediation company interview; C&D waste management processor interview). In Scotland, this material becomes waste after removal from a site. It can be used for work on site without being classified as waste.
Soils and stones require multiple tests. They must be classified as hazardous or non-hazardous following the WM3 classification. When subjected to testing it is likely for other materials to be found, which could make the soil active (non-inert), such as grass. Unless the contaminating materials are in small amounts and pass the soil LOI test, the whole load will be charged the standard rate. Non-hazardous soil and stone can only be disposed of in inert landfill sites and charged the lower rate if a WAC test confirms this is appropriate. A WAC test will determine the leaching ability of any contaminants in the soil.
Misalignment in waste code and policy guidance
This section compares EWC code definitions (Dsposal, n.d.), Revenue Scotland guidance (Revenue Scotland, n.d.), and SEPA guidance (SEPA, 2015) for the three priority materials.
The Scottish Landfill Tax (Qualifying Material) Order 2016 determines which materials qualify for the lower tax rate. There are seven groups of materials which qualify for the lower rate. However, these seven qualifying material groups and EWC codes do not align. This allows material to be classed as standard or lower rate under a single EWC code, as seen in the analysis of waste quantities (Section 4.3). Such misalignment is common in other jurisdictions in the UK and beyond with the widespread use of EWC codes and varying landfill policies.
Table 3 below presents a systematic review of the EWC codes for the priority three materials against other categorisations in Scottish policy. This provides a more specific, detailed understanding of these material streams.
Soils and stones (EWC 17 05 04) are the most straightforward to categorise, aligning clearly with Group 1 (Rocks and soils) and with no additional SEPA definitions or overlaps.
In contrast, mechanically treated fines (EWC 19 12 12) are the most complex to classify. As discussed in Section 5.1, this code can encompass materials across all seven qualifying groups, depending on source and composition, making consistent classification more challenging and reliant on testing and operator descriptions.
Table : Alignment of priority EWC codes with SLfT and SEPA definitions
Priority material
Mechanically treated mineral fines
Mechanically treated fines
Soil and stones
EWC code
EWC 19 12 09
EWC 19 12 12
EWC 17 05 04
EWC chapter
EWC 19 12: the mechanical treatment of waste, for example sorting, crushing, compacting or pelletising (Dsposal, n.d).
EWC 19 12: the mechanical treatment of waste, for example sorting, crushing, compacting or pelletising (Dsposal, n.d).
EWC 17 05: soil (including excavated soil from contaminated sites), stones and dredging spoil.
The Scottish Landfill Tax (Qualifying Material) Order 2016 groups
Group 1: Rocks and soils.
Group 3: Minerals.
Group 1: Rocks and soils.
Group 2: Ceramic and concrete materials.
Group 3: Minerals.
Group 4: Fines from the mechanical treatment to recycle furnace slags.
Group 5: Fines from the mechanical treatment to recycle bottom ash.
Group 6: Low activity inorganic compounds.
Group 7: Fines from the mechanical treatment of plasterboard to recover gypsum.
Group 1: Rocks and soils.
SEPA definitions (SEPA, 2015)
Fines from processing naturally occurring rocks and soils (e.g. group 1).
Fines from processing wholly inert bricks, tiles and concrete (e.g. group 3).
Fines from processing municipal recyclate or residual waste.
Fines from the processing of mixed C&D waste.
No further definitions given.
Waste prevention and landfill diversion options
In this section, we outline findings on the end-of-pipe and upstream diversion options for the three priority materials described in Section 5: mechanically-treated fines, mechanically-treated mineral fines, and soils and stones. A preliminary feasibility assessment of these technologies is also presented.
‘End-of-pipe’ diversion options involve reprocessing materials that have already been classified as waste, to divert them from landfill. ‘Upstream’ diversion options entail keeping materials at their highest value and reducing waste generation. For mechanical fines, this means preventing C&D waste from being mechanically treated (for example, keeping bricks as bricks). For soil and stones, it involves direct reuse.
We use the term ‘mechanical fines’ where the diversion options relate to both mechanically-treated fines and mechanically-treated mineral fines.
Mechanical fines: End-of-pipe diversion
This section outlines the diversion options and associated barriers for mechanical fines.
As some common challenges were identified, Section 6.1.1 first identifies overarching barriers relevant to all the diversion options. These barriers provide essential context for Sections 6.1.2 to 6.1.5.
Overarching barriers
Due to their complex and variable composition and technical processing requirements, mechanical fines are difficult, risky and costly to recover. According to a waste management company representative interviewed, currently only large- and medium-sized regional players are able to recover a proportion of mechanically-treated fines.
Material complexity (technical barrier): Mechanical fines contain mixed materials, sometimes requiring washing to remove contaminants (Burdier et al., 2022). Differing physical and chemical properties, including composition and size, affect the feasibility of end-of-pipe recovery (Hernandez Garcia et al., 2024). This is further impacted by Scotland’s wet climate, which reduces the effectiveness of dry screening technologies (as highlighted in research conducted by Ricardo for ClimateXChange, due to be published in summer 2025). Composition testing to match materials to diversion options is expensive. Virgin materials are often easier and cheaper to use.
Contamination (health and safety barrier): Heavy metals in some mechanical fines pose health and safety risks, limiting recovery (Oujana & Sanchez, 2018). Washing removes some contaminants (Vincent et al., 2022), but can create toxic wastewater and solid waste requiring further treatment (Cottrell, Ali and Etienne, 2024). The circularity benefits should be weighed against the resources and power needed to wash and process fines.
Processing infrastructure (operational barrier): Washing plants remove silt and clay to produce clean aggregate. However, washing systems are expensive and often require bespoke designs so they do not clog processing systems, reducing efficiency (Vincent et al., 2022; C&D waste management processor interview). Stakeholders cite uncertain policies and tax implications as barriers to investment (C&D waste management processor, C&D skip operator and SEPA interviews).
LOI testing (health and safety and regulatory barrier): LOI determines whether fines qualify for the lower rate tax or if they can be reused (interviews with C&D waste management processor and Commercial landfill operatorSUEZ). One interviewee reported that use of LOI tests to achieve end-of-waste status for mechanical fines was not permitted by SEPA due to its uncertain composition:
“We tried for a couple of years to get end-of-waste status on this material because some of the material, it does look really good and it would serve a purpose in further aspects of construction. But they’re very adamant that it’s a big no, because of the testing and because this material doesn’t come from a single source. You can’t test it as a single source, so it’s a bit of an unknown.” (C&D waste management)
Liability (enforcement barrier): The current liability structure is a barrier to diversion, as it places the risk of misclassification on landfill operators rather than waste producers. This reduces producers’ incentive to ensure accurate classification or pursue upstream diversion. With no direct repercussions, producers can intentionally or unintentionally misclassify mechanical fines as lower-rate material (see Section 5.3).
The following sections detail end-of-pipe diversion options for mechanical fines, noting more specific barriers to mechanically-treated mineral and mechanically-treated fines where relevant.
Landfill/quarry cover, engineering and restoration
Inert mechanical fines are used for engineering and landscaping, such as quarries and pavement base layers, or for daily landfill cover. There is demand in Scotland for such uses, particularly due to a shortage of soils and stones (commercial landfill operator interview). While this can support diversion from landfill, it can waste nutrient-rich fines that might be better suited for agricultural use (Renella, 2021).
Recycled aggregate
Mechanically-treated mineral fines can be stored on site for six months and reused as aggregate without a waste licence under the Waste Management Licensing (Scotland) Regulations 2011 (schedule 1, paragraph 19). Mechanically-treated fines do not qualify for this exemption, however, and SEPA does not include them as waste suitable for the manufacture of recycled aggregate (SEPA, 2013).
Recycled aggregates (from crushed bricks, ceramics, and concrete) are used in roads, railways, and non-structural concrete production. Their carbon footprint can be lower than virgin aggregates when transport distances are short (ClimateXChange and Ricardo, 2025).
Reducing the environmental impact of concrete through recovery of inert fines has received a lot of research interest. For example, in 2023, 934 publications about reuse of clay waste (e.g. brick powder) in cement mixtures were published (Hernández García, Monteiro and Lopera, 2024). Studies suggest the material could replace 10-20% of virgin sand in non-structural concrete (Mansoor, Hama, Hamdullah, 2024; Ali, 2023; Zhao, et al., 2020). Despite the diversion potential for fines, innovations have not been scaled up commercially as virgin aggregates are favoured (European Commission, 2023).
Barriers:
Recycled aggregates have different properties to natural aggregates and suit only low to moderate strength concrete (European Commission, 2023; Ali, 2023; Transport Scotland et al., 2020; commercial landfill operator interview; Ferriz-Papi and Thomas, 2020).
Fine material can be inappropriate for some filling activities. For example, fines can be too smooth for use in layers for road-based applications (Burdier et al., 2022). It could be beneficial to consider other diversion options that suit these physical properties, such as reuse in paint to improve grip, rather than invest in technologies to change them.
Quality and supply of fines are inconsistent (European Commission, 2023).
Despite a high concentration of wash plants in Scotland (C&D waste management processor interview), mechanical fines require further space and infrastructure investment to be diverted to precast or ready-mixed concrete plants (European Commission, 2023).
Wet fines from wash plants require more cement in concrete mixtures, increasing resource use and cost (commercial remediation company interview). Raw material and energy savings from using recycled aggregate need to be balanced against these impacts.
The lack of market uptake of recycled aggregates is likely due to a lack of know-how by concrete producers and trained personnel for recycled aggregates production (ClimateXChange and Ricardo, 2025; European Commission, 2023; Hernández García, Monteiro and Lopera, 2024).
Land treatment and agricultural soil improvement
Inert mechanical fines can improve land, for example, by stabilising soil through land remediation or as a fertiliser for agriculture (Manning and Vetterlein, 2004; Burlakov, et al., 2021; Ali, 2023). This could be a positive diversion option for mechanically-treated mineral fines that are less useful for construction purposes (Renella, 2021).
Mechanically-treated fines can help replenish nutrients to the soil and reduce reliance on commercial fertilisers (Braga et al., 2019; Szmidt and Ferguson, 2004; Campe, Kittrede and Klinger, 2012). By mixing these fines with organic materials, they can create a soil-like material for plants to grow in. Some fine particles, like clay, silt or ash, help keep the organic matter stable (Haynes, Zhou and Weng, 2021; Renella, 2021).
Mechanically-treated fines contain a mixture of these materials. However, the UK Government restricts the use of soil substitutes made from mechanically-treated fines as opposed to mechanically-treated mineral fines (Environment Agency, 2023b). This can only be done under specific permits, such as for landfill restoration schemes, and when ecological improvement is also demonstrable.
In Scotland, under the Waste Management Licensing (Scotland) Regulations 2011 (schedule 1, paragraph 9), exemptions allow the use of mechanically-treated mineral fines on land for agriculture and ecological improvement. Waste companies in Scotland sometimes use mineral fines from skips to create compost for local agriculture (C&D skip operator interview). SEPA, who registers such activities, has reported that this exemption often results in farmers being paid to accept such waste to reduce landfill disposal costs (SEPA interview). However, it is uncertain how much is used for genuine purposes, and how much is diverted to avoid paying tax (C&D waste management processor interview).
Barriers:
Silt and clay fines, which are beneficial for soils, are generally landfilled and this is because of high contamination of heavy metals or presence of organic materials (Renella, 2021).
Nutrient content varies, limiting predictability of composition and related cost savings for farmers. For example, recycled mechanical fines with high nutrient content can reduce costs by 25%, whereas those with low nutrient content may increase costs by 9% (Braga et al., 2019).
Potential conflicts with regulation on fertilisers. For example, UK government restricts the use of soil substitutes made from mechanically-treated fines (Environment Agency, 2023b) and new EU regulations may exclude some fines from fertiliser use (Renella, 2021).
Gypsum fines recycling
Gypsum fines (within EWC 19 12 12) can be recovered from plasterboard and used to make new plasterboards, cement, blocks and bricks (commercial landfill operator interview; Suárez, Roca and Gasso, 2016). Gypsum can also be used to improve soil in land remediation, particularly in areas with alkalinity or heavy metal contamination. SEPA advises that this is acceptable for treating land that has been flooded by seawater (SEPA, n.d).
Waste owners are encouraged to separate gypsum from other waste for recovery, as there are feasible diversion options and “because there’s a good recycling market for gypsum” (waste industry association interview). However, according to a commercial landfill operator, the composition of mechanically-treated fines “tends to be quite high in plasterboard and gypsum, which then means that we struggle to control the gas and the odours”. Gypsum can only be disposed of in landfills where no biodegradable waste is accepted as it has hazardous properties, releasing gas and odour, when mixed with biodegradable waste (commercial landfill operator interview).
When the ban on biodegradable waste to landfill is introduced at the end of 2025, it will potentially make the lower-rate landfill of mechanically-treated waste containing gypsum easier. Additional incentives for diversion to counter this could be necessary.
Barriers:
Recycled gypsum has high market demand, but the lower rate categorisation encourages landfill over recycling (waste industry association interview, commercial remediation company interview, commercial landfill operator interview).
Heavy contamination of mechanical fines restricts the potential to find and extract gypsum (Suárez, Roca and Gasso, 2016).
Lack of incentives to enhance sorting of gypsum and plasterboard; and conversely incentives to process waste products containing gypsum into mechanical fines to qualify for the lower-rate tax (commercial landfill operator interview).
Mechanical fines: Upstream diversion
This section describes the upstream diversion options involving the reduction and reuse of concrete, bricks, tiles and ceramics. These options can prevent mechanical fines from being generated in the first place.
Reducing demolition through refurbishing and retrofitting
Refurbishing or repurposing buildings and assets extends their usable life, avoiding the generation of demolition waste. In doing so, it helps reduce both material use and embodied carbon, making it a key strategy for sustainable construction.
Lifecycle analysis (LCA) is a valuable tool for comparing the impacts of refurbishing and retrofitting with demolition and new build. While new builds may achieve lower operational carbon, they usually require more materials and result in more embodied carbon emissions. In many cases, this means retrofit has lower emissions overall.
Adopting a retrofit-first approach can reduce unnecessary demolition, prioritising reuse unless structures are severely derelict or face irreparable structural issues (Green Alliance, 2023; construction company interview). To support this, pre-demolition assessments could be introduced earlier in the planning process, ensuring that any proposed demolition is justified in terms of carbon and material impacts (Green Alliance, 2023).
Barriers:
VAT policy favours new builds (0%) over renovations (20%) (Green Alliance, 2023).
Current policies focus on reducing operational emissions, such the Heat in Buildings Strategy to increase energy efficiency (Scottish Government, 2021a), rather than embodied carbon emissions (Green Alliance, 2022).
Circular principles are underused in construction and infrastructure, such as rail infrastructure projects (O’Leary, Osmani and Goodier, 2024).
Reduction and reuse of construction materials
Reducing demand for materials in the design stage has the greatest impact on reducing the environmental impact of construction (Green Alliance, 2023). This is particularly important for cement, which is challenging to remove from a building for reuse. Reduction and reuse can be increased through circular construction tools and approaches, sometimes described as ‘modern methods of construction’. These can improve companies’ understanding of GHG emissions throughout their supply chains. Examples include modular buildings, digital tools such as material passports, offsite manufacturing, and sustainable material substitution (Green Alliance, 2023).
Barriers:
Current circular building standards are voluntary, such as the UK Net Zero Carbon Building Standard, and the Scottish Government’s Net Zero Public Sector Buildings Standard (Scottish Government, 2021b; UK Net Zero Carbon Building Standards, n.d.). Construction design is determined by the client. With voluntary initiatives, cost factors are more likely to win over environmental factors (Construction company interview).
There are no mandatory requirements for construction companies in Scotland to conduct an LCA or report scope 3 emissions (those in its upstream and downstream value chains, which typically include the majority of material-related impacts) (construction company interview; Green Alliance, 2022).
Skills shortages and inconsistent standards, for instance for LCAs and product passports, limit the sector’s ability to apply circular practices (Hurst and O’Donovan, 2024; construction company interview).
Certain industry practices lead to unnecessary waste. For example, to ensure they have enough supply, contractors will often order 5-10% surplus, which can be hard to reuse (construction company interview).
Sustainable construction materials often cost more (construction company interview).
Environmental benefits of modern methods of construction are not fully accounted for in public procurement and other financial investment opportunities (Green Alliance, 2023).
Designing for deconstruction
Designing buildings with future disassembly in mind allows more materials, especially bricks and tiles, to be reused instead of downcycled. Such direct reuse has a greater impact in reducing raw material use than recycling (Green Alliance, 2023). However, deconstruction should only be pursued if the building is not fit for repurposing (construction company interview).
Early sorting of demolition materials also improves recovery outcomes. Many mechanical fines are produced from mixed, unsorted demolition waste, which results in variable and lower-quality outputs. Sorting materials earlier produces cleaner, inert fines that are more straightforward to reuse (C&D waste management processor interview, SEPA interview).
A major barrier to recovery and recycling of mechanically-treated fines is their complexity and variability (Section 6.1.1). To minimise the challenges associated with this, upstream measures should support sorting at source, before waste reaches skips or waste transfer sites (C&D waste management processor interview, SEPA interview). Greater source separation would generate more inert-only fines, which are also easier to find uses for due to waste management exemptions.
Barriers:
Mainstream current and historical construction practices do not design for deconstruction (Arup and Ellen McArthur Foundation, 2020).
Investors are not incentivised to incorporate circularity principles in design, considering material recovery (Arup and Ellen McArthur Foundation, 2020).
Demand for low-quality recycled aggregate (Section 6.1.2) takes the focus away from higher-quality recycling and reuse.
Integrated C&D tools and requirements for identifying, classifying and certifying salvaged materials are lacking (construction company interview).
Soil and stones: End-of-pipe diversion
This section explores the end-of-pipe diversion options for soils and stones from construction waste (EWC 17 05 04). End-of-pipe diversion options are concerned with when the material is classified as waste, and is then reprocessed into another material. As there are many exemptions for soil and stones reuse, the main diversion options are upstream, occurring before waste classification. The main end-of-pipe diversion option is to produce recycled aggregates.
Recycled aggregates
Soils can be washed to separate sand, gravel, and stone from contaminants, especially on brownfield sites, and reused as aggregate in construction (Magnusson et al., 2015; Choi et al., 2018; waste industry association interview).
Barriers:
Recycled aggregate is more expensive than virgin materials (Magnusson et al., 2015; commercial remediation company interview). Quarrying for natural aggregate is cheaper and more accessible (commercial remediation company and waste industry association interviews).
Soil remediation technologies are not widely used in Scotland (C&D skip operator interview).
Fluctuations in cost and quality lead to inconsistent demand, impacting the feasibility of supply. For example, a facility failed in 2016 due to lack of demand (commercial landfill operator interview). There is good supply in Scotland of recycled quarry materials, but demand is low (commercial remediation company interview).
There is low industry understanding of how to use recycled aggregates. For example, road projects where the ground is damp tend to require natural aggregates; recycled aggregates are more applicable for farm tracks, because they meet requirements for tractors more easily than cars (C&D skip operator interview).
There is a higher recycling and reuse rate for soils and aggregates on site; what is taken off site tends to be less usable (C&D skip operator interview).
Soil and stones: Upstream diversion options
This section covers how soils and stones can be kept on site or reused at another site under exemptions, avoiding classification as waste.
Landfill/quarry cover, engineering and restoration
Soils and stones are used for temporary or final landfill cover, haul roads within a site, and restoring quarry sites. In landfill restoration, layers of subsoil and topsoil must be added, to enable development of vegetation (SEPA, 2018).
In Scotland, exemptions from SLfT apply under the Waste Management Licensing (Scotland) Regulations 2011 (Schedule 1, paragraph 9). This relates to where soil and stones treat land for agricultural or ecological benefit. Soil and stones are not subject to the same per-hectare limits for infilling agricultural land as other waste types (Waste Management Licensing Regulations, Schedule 2, paragraph 2), making it easier to divert them in larger quantities.
Barriers:
Fewer landfills are operational. The number has declined since 2005 (SEPA, 2023) and this is expected to reduce further after the ban on landfilling biodegradable municipal waste (interviews with commercial remediation company; waste industry association; large public body).
Landscaping and construction
On-site reuse of soils reduces transportation and storage issues, making it the most cost-effective option (commercial remediation company interview). Transfer to another work site requires a waste management licence or exemption. Exemptions apply where soils and stones are used to treat land, provided certain conditions are met (Waste Management Licensing (Scotland) Regulations 2011, Schedule 1, Paragraph 7).
SEPA has issued regulatory guidance to support the sustainable reuse of greenfield soils which are soils from undeveloped, uncontaminated land. The soil must be used for a specified purpose, identified before excavation begins, and transfer must be approved by SEPA. Purposes may include the operational land of railways or land which is woodland, park, garden, verge, landscaped area, sports or recreation ground, churchyard or cemetery.
Interviewees indicated that practices for coordinating soil reuse in Scotland vary between projects based on developers (commercial remediation company and engineering consultancy interview). Public sector contracts sometimes include reuse requirements, while private contracts typically show less incentive. Carbon considerations are an emerging driver for on-site reuse, where these materials are less ideal than virgin quarry materials but still meet requirements (engineering consultancy interview).
Barriers:
The UK has over 700 soil types requiring thorough classification by type (topsoil/subsoil) and hazard level (hazardous/non-hazardous, active/inactive) prior to reuse (The Royal Society, 2020; Soil Association, 2021).
Mismatches in soil type, availability, project timelines, and storage requirements often hinder reuse (Thompson, 2021; Choi et al., 2018; Hale et al., 2021; Marasini et al., 2012; SEPA, commercial remediation company and engineering consultancy interviews).
Geography and pressure to keep heavy vehicle movements off community roads incentivises finding reuse options close to sites of origin, but timing can prevent this (engineering consultancy interview).
In some cases, the SLfT can have less negative financial impact on a project than costs of storage, transport, or project delays, making reuse impractical (engineering consultancy interview).
Reuse of soil and stones may be deprioritised compared to the sustainability of manufactured materials like concrete (Berryman et al., 2023) especially where time and budget constraints apply (commercial remediation company and engineering consultancy interviews).
Reuse options for contaminated soils are limited. Untreated soil is costly to landfill, while treated soil is typically restricted to low-grade uses such as embankments (engineering consultancy interview).
Liability concerns discourage topsoil reuse as developers and landowners remain responsible for future environmental impacts (Hale et al., 2021).
Multiple compliance pathways such as exemptions, permits, and definition of waste protocols create confusion, increasing the risk of non-compliance, misclassification, and illegal disposal (commercial remediation company interview; Thompson, 2021).
Despite Berryman’s et al. (2023) guidance aimed at harmonising best practice, industry uptake remains inconsistent. The absence of a unified legislative framework results in varied approaches across agriculture, land development, engineering, and land management sectors (Thompson, 2021).
Preliminary feasibility assessment of diversion options
This section presents an indicative assessment of the viability of different waste diversion options for the three priority materials: mechanically-treated fines (19 12 12), mechanically-treated mineral fines (19 12 09), and soils and stones (17 05 04). The assessment considers how feasible the diversion options currently are. This includes information on current use, research and development activity, and the barriers mentioned above in section 6.
The feasibility score therefore indicates the extent that future interventions are needed to target barriers and enable diversion. The feasibility scoring is as follows:
1 = Not currently feasible, would require significant intervention to upscale.
2 = Feasible to some extent, some barriers would need to be addressed.
3 = Most feasible, already happening widely in Scotland.
n/a = not applicable, didn’t come up as a diversion option for the material in the research.
The methodology behind this assessment can be viewed in Appendix D.
Tables 4 and 5 below present the preliminary feasibility assessment of the end-of-pipe and upstream diversion options. For reference we also include a general impact rating of the technology based on the findings from desk-based research and stakeholder interviews. The impact rating reflects the overall environmental and circular economy benefits (e.g. quantities of materials diverted from landfill) that could be achieved if the option were implemented more widely, using a simple scale of ‘high’, ‘medium’ or ‘low’.
Key takeaways of the assessment are:
Mechanically-treated fines have a limited number of feasible end-of-pipe solutions at present. Landfill cover and gypsum recycling are technically possible, but most other downstream options score low on feasibility and offer only low to medium impact. As a result, it is likely better to prioritise upstream interventions – such as deconstruction, modular construction, and refurbishment – for their higher impact potential, even though they are not yet widely adopted.
Mechanically-treated mineral fines have more feasible end-of-pipe diversion options, including reuse in land restoration and aggregate recycling. These options are already in operation and could be scaled further considering the opportunity to provide ecological improvements so maximum value is retained.
Soils and stones show the greatest feasibility overall, particularly for recycled aggregates and reuse in landscaping. While some remediation technologies are not yet fully developed, most of the downstream options are already in use.
Gypsum and plasterboard recycling is moderately feasible and could play a larger role with better separation and recovery at source.
Upstream interventions such as modular construction, deconstruction, and refurbishment, score high on impact across all materials where relevant, but face barriers related to investment, data, and planning. Technological readiness is improving – especially with AI-driven solutions for sorting and design – and deployment is likely to increase in the next 5–10 years with the right incentives and digital infrastructure.
Table : Preliminary feasibility assessment of end-of-pipe diversion options
Diversion options
Potential impact (low, med, high)
Mechanically-treated fines
Mechanically-treated mineral fines
Soils and stones
Landfill/quarry cover, engineering and restoration
Low
3
3
3
Recycled aggregates
Medium
1
2
3
Land treatment and agricultural soil improvement
Medium
1
3
n/a
Gypsum fines recycling
Medium
2
n/a
n/a
Table 5: Preliminary feasibility assessment of upstream diversion options
Diversion options
Potential impact (low, med, high)
Mechanically-treated fines
Mechanically-treated mineral fines
Soils and stones
Remediation technologies (e.g. soil washing)
Medium
1
1
2
Landscaping and construction soil reuse
High
n/a
n/a
2
Modular construction and material reuse
High
1
1
n/a
Deconstruction and material sorting
High
1
1
n/a
Refurbish or retrofit before demolition
High
1
1
n/a
Key (see the methodology above for more information)
Score
Colour
1: Not currently feasible
2: Feasible to some extent
3: Most feasible
n/a: Not a diversion option
Policy assessment
This section provides an overview of existing policies influencing the management and diversion of the three priority materials. It also identifies policy gaps and presents potential interventions discussed in previous sections to enhance waste diversion, aligning with Scotland’s environmental objectives.
Overview of existing policies
Several key policies and fiscal mechanisms shape the management and disposal of the priority materials in Scotland. Some policies are devolved to the Scottish Government, while others are reserved, under UK Government control. These policies shape the incentives and barriers encountered by waste producers and processors in diverting materials from landfill.
Fiscal measures
Scottish Landfill Tax (SLfT), the focus of this study, is devolved legislation introduced in 2015 to reduce the environmental impacts of waste, encouraging waste reduction and adherence to the waste hierarchy in Scotland. While standard-rate SLfT has risen significantly to £126.15 per tonne in 2025-26, the lower rate (£4.05 per tonne in 2025-26) remains considerably lower, as is broadly the case in the rest of the UK. As discussed, this lower rate is applied to seven groups of qualifying materials (Section 5.3), typically inert or less polluting wastes such as some construction and demolition waste. The lower-rate aims to provide an economic incentive for their diversion from landfill while avoid imposing undue costs on sectors where alternative treatment options may be limited.
The Aggregates Levy (AGL) is a UK-wide tax applied to commercially exploited (virgin) crushed rock, sand, and gravel to encourage the use of recycled alternatives. A Scottish Aggregates Tax(SAT) is expected to replace the UK AGL from April 2026, offering an opportunity to explore ways to further incentivise the use of secondary aggregates (Scottish Government, 2024b).
The Climate Change Levy (CCL) and Carbon Price Floor (CPF) are UK-wide fiscal measures designed to reduce carbon emissions by taxing energy use and setting a minimum price for carbon from electricity generation (HM Revenue and Customs, 2024). While these policies primarily lead to emissions reductions (Döbbeling-Hildebrandt et al. 2024, p.2) they also indirectly affect waste management across the UK by incentivising energy efficiency and low-carbon industrial processes.
Other regulatory measures
The Waste (Scotland) Regulations 2012, which are devolved secondary legislation, require waste producers to prioritise prevention, reuse, and recycling over landfill disposal (Scottish Government, 2012b). Businesses must segregate recyclable materials to improve recycling rates (Zero Waste Scotland, 2023). While these regulations reinforce waste hierarchy principles, they do not specifically address lower-rate waste streams.
The upcoming ban on biodegradable municipal waste (BMW) to landfill, effective 31 December 2025, is a devolved Scottish Government policy aimed at reducing environmental impacts from organic waste. While this ban will primarily impact standard-rate waste (Scottish Government, 2022), it could have indirect consequences for certain lower-rate materials. Minerals, and soils and stones, traditionally used for landfill engineering purposes, may see temporarily higher demand for use in landfill closures, but a long-term decline in demand. Alternative diversion pathways would be needed for these to align with Scotland’s circular economy objectives. In addition, gypsum, which currently can only be landfilled at sites without bio-waste, is likely to become easier to landfill. There may also be an increase bio-based mechanically-treated fines from municipal waste streams. Increased enforcement of fines’ classification and incentives for recycling may therefore be required. However, the ban will not signal the complete end of bio-waste to landfill, as it includes certain exemptions.
Digital Waste Transfer Notes (WTNs), a UK-wide initiative, aims to improve traceability and enforcement by transitioning to an electronic system for recording waste movements (DEFRA, 2023). This system aims to reduce the misclassification of waste, including lower-rate materials like mechanically-treated fines, by providing greater transparency in the movement of waste. It is expected to “shine a light on transactions and actors” currently missing from the system, while enhancing compliance with landfill tax regulations (CIWM, 2023). The April 2025 roll-out has recently been postponed to April 2026.
These are the key fiscal and regulatory policies interacting with lower-rate materials. However, gaps remain in their effectiveness for supporting diversion options for the three categories of waste which make up the bulk of lower-rated waste in Scotland notably mechanically-treated fines, soils and stones, and mineral waste. Addressing these gaps could involve targeted interventions, as discussed in the following sections and Appendix A.
Policy gaps and potential interventions
Despite existing regulatory and fiscal policies, several policy gaps hinder the effective diversion of lower-rate materials from landfill, such as mechanically-treated fines, and soils and stones from construction. These gaps are categorised according to their relation to either end-of-pipe waste management or upstream prevention in the material life-cycle.
This section outlines potential interventions to address such gaps. These are not policy recommendations but options to consider. Further research, analysis and consultation would be required before deciding whether to take any, or all, forward.
End-of-pipe diversion
Compliance risks and landfill misclassification
A key enforcement challenge is misclassification of waste at landfill sites. The widening gap between standard- and lower-rate SLfT (now standing at above £100 per tonne in 2025-26) may have inadvertently created financial incentives for waste producers to classify waste as lower-rate whenever possible. Along with the complex classification criteria (see section 5.3), this may have led to both deliberate and unintentional misclassification, particularly for mechanically-treated fines.
Rather than being residual outputs of material recovery, large quantities of fines are purposefully produced to qualify for the lower rate (Section 6.1.1). This distorts waste tracking data and results in potentially recoverable material being landfilled.
Landfill operators hold tax liability for misclassification, even though they do not generate or pre-process the waste. This creates financial risks for operators, leading some to refuse lower-rate fines altogether.
Ambiguity in classification raises costs for both regulators and waste operators. Waste producers may unintentionally misclassify waste due to lack of clear, standardised guidance, leading to incorrect application of the lower tax rate (see Section 7.2.1.1). Although better guidance could reduce some misclassification, it is unlikely to fully resolve the issue. This is because the underlying rules that determine whether fines are subject to the lower or standard rate are themselves complex and difficult to apply consistently, particularly when mapped against EWC waste code classifications (see Section 5.3). Clearer guidance may help reduce ambiguity, though it may also be worth exploring whether simplification of the tax qualification rules could support more consistent classification.
A recent SEPA report on the BMW-to-landfill ban notes that sorting residues from processing municipal waste (including mechanically-treated fines) may be generated in greater volumes in order to bypass the ban (SEPA, 2024a). This risks undermining the intent of the bio-waste ban policy through reclassification rather than genuine diversion. This risk is supported by our findings about the production of mechanically-treated fines to qualify for the lower rate (Section 6.1.1).
Potential fiscal interventions:
Explore the feasibility of a specific tax rate for mechanically-treated fines which is much closer to the standard rate, or reclassification under the standard rate. This could discourage excessive fines production while retaining the lower rate for less problematic inert materials. A careful balance would need to be struck to avoid unintended consequences, particularly for businesses reliant on landfill for inert waste management. Supportive measures, addressing upstream value chains, would likely be needed.
Potential non-fiscal interventions
Technical: Review LOI testing requirements to ensure they do not deter investment in fines processing, while maintaining environmental safeguards (C&D waste management processor interview; waste industry association interview; C&D skip operator interview).
Enforcement: Explore the potential for enhanced regulatory oversight through the upcoming digital waste transfer notes (WTNs) system to track and verify waste classification at source rather than at landfill. Through this, tax liability for misclassified mechanical fines could be shifted to the company which produced the fines, even if this is discovered after it has been accepted at landfill, along with penalties for misclassification.
Other: Improve guidance on EWC code classification by providing clearer criteria to support consistent decisions on whether waste qualifies for the lower rate. This could include practical examples of lower-rate materials, decision trees, and alignment with the upcoming digital waste transfer note system. In the longer term, there may also be value in exploring whether simplifying the underlying rules on lower-rate material classification could further reduce classification ambiguity.
Separation and recovery of mechanically-treated fines
Inadequate pre-sorting of C&D waste leads to contamination and fines production. Once contaminated, fines are difficult to reprocess. Industry practices in Scotland and globally do not sufficiently prioritise separation at the source, meaning valuable materials are lost to landfill.
Potential fiscal interventions:
Continue strengthening incentives to increase the demand for recycled fines. This is already starting with the planned introduction of the Scottish Aggregates Tax in April 2026 which will initially align with the UK Aggregates Levy. Over time, there may be scope for policy divergence in Scotland. Additional financial incentives – such as tax breaks or recycled content requirements – could drive up industry circularity, such as for reused material content, recycled material content and reusable materials (Green Alliance, 2023). However, interventions would have to avoid unintended consequences related to availability of recycled fines. This could be a particular issue in rural areas, which are further from recycling infrastructure (commercial remediation company interview).
Potential non-fiscal interventions:
Technological: More support for technologies and infrastructure to reprocess fines and reduce contamination could help address issues with fines in washing facilities. Programmes like the Knowledge Transfer Partnership could play a role. Existing examples include phytoremediation, which uses plants and microorganisms to degrade pollutants and reduce heavy metals (Yadav et al., 2022).
Technological: Technologies exist to make the shape of fines coarser and more suitable for construction purposes, though the outputs are currently more costly than natural aggregates (C&D skip operator interview). Further reuse routes could be explored, for example how to promote fine aggregates being added to paints for flooring to increase traction.
Regulatory: Encourage early-stage waste management planning by integrating material audits into construction permitting. This includes site investigations, sampling and testing to support effective use of recycled aggregates.
Other: Improve industry understanding of recycled fines through guidance and awareness campaigns, including how and when they can be reused (C&D skip operator interview).
Cross-border waste movement risks
SLfT operates within a broader UK framework, presenting cross-border waste movement compliance challenges. For instance, if Scotland increased its lower-rate SLfT while England maintained the current lower rate, waste exports may increase, undermining the tax’s effectiveness as well as Scottish tax revenues. Similarly, restricting mechanical fines’ eligibility for the lower rate in Scotland could lead to this waste stream being diverted to England instead of being recovered.
These risks are particularly relevant in light of recent and proposed changes across the UK. As mentioned, the Welsh Government increased its lower rate of Landfill Disposals Tax in 2024, and the UK Government is currently consulting on significant reforms to Landfill Tax in England and Northern Ireland, with the consultation due to conclude in July 2025 (HM Treasury and HMRC, 2025).
Introducing financial or enforcement-based interventions is challenging in a cross-border context. The Scottish Government has limited or no authority over waste processed or disposed of in other UK jurisdictions.
Potential fiscal interventions:
Considering penalties for cross-border misclassification, similar to Wales’ Unauthorised Disposals Tax (150% of the standard rate) and the proposal in the UK government’s consultation (200% of the standard rate) which creates an additional financial deterrent for people seeking to dispose of waste illegally.
Potential non-fiscal interventions:
Regulatory/enforcement: Enhancing regulatory and enforcement coordination between Scotland, England, and Wales to ensure greater policy consistency and prevent waste tourism.
Upstream diversion
Reducing reliance on landfill also requires preventing lower-rate materials from being generated as waste. However, this is constrained by limited incentives for circular practices, inconsistent reuse standards, weak producer responsibility measures and insufficient integration of circularity in planning and procurement.
Lack of incentives for designing in circularity
Soils, stones, and minerals removed from C&D sites are often generated, and classified as waste, without efforts to improve their quality or assess their reuse potential. This results in unnecessary landfill disposal, despite available prevention and recovery pathways. Lack of guidance on soil and stone classification, combined with inconsistent reuse standards, means that secondary materials markets remain underdeveloped.
Mechanically-treated fines are often the result of poor material selection at the design and procurement stages. If more construction materials and products were designed for disassembly, reuse, or easier sorting, rather than demolition, the production of fines could be significantly reduced. Currently, there is no strong economic driver for waste producers to prioritise clean, separable materials over mixed waste streams that result in fines.
Current planning regulations and public procurement rules do not sufficiently integrate circular economy principles. Without upfront material assessments, valuable materials are classified as waste and disposed of unnecessarily.
The UK and the devolved nations are moving toward more comprehensive extended producer responsibility (EPR) schemes for other materials. If an effective system is adopted for construction, this could encourage producers to adopt circular practices and reduce waste generation at the design stage. There have also been sub-national developments in London, where large planning applications for approval by the mayor now require whole lifecycle carbon assessments, carbon reduction plans, and circular economy statements. Before a redevelopment or demolition plan can be approved, an audit must be carried out to determine the reuse potential of materials in the existing building (Mayor of London, 2022).
Circular economy policies such as these are needed to transition the construction sector as a whole, changing value chains so that much less of the priority materials in this study are generated. The lower rate of SLfT could be iteratively increased in tandem with these interventions, as a supporting measure; if it were to be raised too rapidly without supporting upstream interventions, negative impacts on the construction sector and on illegal disposal would likely occur.
Potential fiscal interventions:
Consider raising the overall lower rate of SLfT to provide a greater incentive for circular practices on construction sites. Even a relatively modest increase could help to justify the costs of storing and transporting materials such as soils and stones for reuse (engineering consultancy interview). Wales’ new lower rate (£6.30 per tonne) could serve as a benchmark. A rate of £6 per tonne was deemed viable by industry interviewees (commercial landfill operator and C&D waste management processor).
Consider monitoring the development and impacts of the upcoming Scottish Aggregates Tax (SAT), which will replace the UK Aggregates Levy from April 2026. While the SAT will be limited to the commercial exploitation of aggregates as defined in the 2024 Act (Scottish Government, 2024b), its introduction provides a useful opportunity to review whether taxation influences the quantities of lower-rate aggregates sent to landfill. Insights from this review could help inform future considerations around the treatment of other virgin materials used in construction, within the context of devolved powers and existing legislative frameworks.
Consider financial incentives for reuse in construction, such as tax relief for projects incorporating secondary materials (construction company interview).
Ensure SLfT exemptions support the diversion of lower-rate materials from landfill. A review of existing and upcoming exemptions, for instance with the bio-waste to landfill ban, may help assess their effectiveness in facilitating prevention, reuse and recovery while maintaining environmental protections.
Consider engaging with HM Revenue and Customs over VAT reform, such as extending zero-rate VAT to refurbishment and retrofit to reduce incentives for demolition and new build construction.
Non-fiscal interventions
Policy: Consider the expansion of EPR to cover construction materials, shifting financial responsibility for waste management onto producers to encourage modular design and reuse.
Policy: Consider mandatory, rather than voluntary, circularity requirements targeting construction project clients (construction company interview). Investigate opportunities to strengthen public procurement rules to prioritise secondary materials, reuse, spoil management and design for deconstruction. These requirements could support more systematic waste prevention at the planning stage and drive investment in circular practices (SEDA, 2024; O’Leary, Osmani and Goodier, 2024).
Policy: Consider reforms to embed circularity in planning policy, such as requirements for pre-demolition assessments, material recovery assessments before deconstruction and resource management plans to include deconstruction design (Construction company interview; Green Alliance, 2023).
Policy: Explore adoption of carbon reporting tools that account for lifecycle emissions, including embodied carbon and Scope 3 (SEDA, 2024). Distinct reuse and recycling reporting for high-impact materials like concrete may also help reduce downcycling (Green Alliance, 2023).
Technological: Consider supporting the development of product passports or material databases for construction materials to improve transparency and enable reuse (construction company interview).
Technological: Consider the future use of AI and matching platforms to optimise design and reuse coordination (Huang et al., 2022; Choi et al., 2018; construction company interview).
Operational: Consider investigating early-stage site audits, sampling and testing to support on-site recovery and reuse of recycled aggregates (C&D skip operator and engineering consultancy interviews).
Operational: Consider the potential for construction material hubs to store and redistribute soils and other surplus materials. However, barriers remain around ownership, quality control, certification and fraud risk (commercial remediation company and construction company interviews).
Other: Consider aligning government strategies on housing and urban development with circular economy targets to create long-term demand for reused materials (Green Alliance, 2023).
Other: Consider investing in training and awareness to support greater uptake of recycled aggregates and reused soils. Cultural shifts may be needed to encourage viewing soil and stones as valuable resources, rather than ‘dirt’ (Thompson, 2021; Berryman et al., 2023).
Addressing both end-of-pipe and upstream barriers will be essential for improving SLfT effectiveness and enhancing material recovery. As with other areas of circular economy policy, coordinated packages of measures working across material value chains, targeting incentives at multiple stakeholders, are likely to be needed. By considering these policy measures, Scotland could identify strategies to reduce landfill reliance, improve material efficiency, and accelerate its transition to a circular economy.
Conclusions
This section summarises the key findings of the research and assesses whether the lower-rate SLfT remains effective in supporting Scotland’s environmental and waste management objectives. It also considers the broader policy implications, including potential enforcement challenges, unintended consequences, and cross-border impacts.
Summary of key findings
The lower rate of SLfT was introduced to enable the cost-effective disposal of low-risk, inert waste while ensuring compliance with Scotland’s broader environmental policies. Overall landfill trends show a mild downward trend in landfilled lower-rate materials at least until early 2020 (Figure 1), suggesting the tax may have initially influenced disposal patterns. Tonnages of lower rate material to landfill have since fluctuated without a clear trend (Figure 1). This research identifies several factors that may influence the continued effectiveness of the lower rate:
Lower-rate landfill disposal is dominated by three specific waste streams—mechanically-treated fines, soils and stones, and mechanically-treated mineral fines—which together accounted for 77% of all lower-rate waste landfilled in 2023-24.
Mechanically-treated fines are landfilled in the greatest quantities out of all lower-rate materials, and have seen the greatest increase in quantities between 2021-2024 (with a slight dip in 2022-23). This is despite originally being intended as residual outputs from material recovery processes. This trend raises concerns over misclassification and evidence from our interviews of fines being produced on purpose.
Environmental impact analysis highlights that mechanically-treated fines pose significant risks, contributing disproportionately to air pollution, resource depletion, and biodiversity loss compared to other lower-rate materials.
Current SLfT structures, fiscal incentives, and policy measures are not effectively supporting higher-value diversion options for lower-rate materials. The relatively affordable lower tax rate continues to make landfill the most economically attractive option for many waste producers of the priority materials, as it does in some other parts of the UK.
The upcoming ban on BMW (effective December 2025) will change landfill dynamics, reducing long-term demand for materials traditionally used in landfill engineering, and may lead to more lower-rate materials being sent to landfill.
Misclassification of waste remains a major issue, exacerbated by complex EWC code classifications that do not always align with SLfT qualifying material criteria. The lack of easy-to-use guidance and strong oversight contributes to both deliberate and unintentional misclassification.
These findings suggest that while the lower-rate SLfT has played a role in reducing landfill disposal overall, there may be opportunities to better align it with Scotland’s evolving circular economy and net zero ambitions.
Does the lower rate of Scottish Landfill Tax (SLfT) still support Scotland’s environmental objectives?
The lower-rate SLfT was designed to provide a cost-effective landfill option for inert, low-risk materials while supporting Scotland’s environmental policies, including waste reduction, emissions reduction, and adherence to the waste hierarchy. Since it was introduced, Scotland has introduced ambitious net zero targets and has increased its policy focus on achieving a circular economy. Compared to when the UK-wide Landfill Tax was first introduced in 1996, there is now more emphasis on reducing environmental impacts associated with upstream material use, rather than solely reducing emissions and hazards once materials are in landfill.
This research finds that the lower rate is no longer fully aligned with Scotland’s environmental objectives. Evidence suggests that progress in diverting lower-rate materials may have stalled, with data indicating a levelling-off of lower-rate landfill tonnages since 2020–21 (Figure 1). In addition, there is insufficient incentive to divert materials upstream, including via the planning and design stages of the construction projects which generate much of these materials.
Misalignment with policy goals
While the SLfT was intended to discourage landfill disposal and promote alternative waste management options, the lower rate has, in some cases, created unintended incentives:
Mechanically-treated fines have become a dominant lower-rate waste stream despite their potential for reduction and recovery, indicating that the tax structure may not sufficiently encourage more circular treatment of the mixed construction materials that make up this waste stream.
The low cost of landfill disposal creates limited incentives for repurposing soils and stones, which could otherwise be reused in construction and landscaping.
The lower rate of tax, at £4.05 per tonne (2025-26) appears to have had a limited impact in shifting waste up the hierarchy, with landfill remaining the most economically viable option for many waste producers.
Environmental and economic consequences
Mechanically-treated fines, which now make up a significant portion of lower-rate landfill disposal, have disproportionately high environmental impacts (on a whole life-cycle basis) compared to other lower-rate materials, including contributions to air pollution, resource depletion, and biodiversity loss.
The financial attractiveness of landfill compared to investment in secondary material recovery remains a major barrier. The cost of processing and diverting lower-rate materials often exceeds landfill costs, discouraging investment in alternative waste management solutions.
Compliance and enforcement challenges
The widening tax differential between standard- and lower-rate waste contributes to increased misclassification, particularly for mechanically-treated fines, where interviewees pointed to the ‘production’ of fines in order to qualify for the lower rate.
Landfill operators, who bear the primary tax liability for misclassified waste, face increased financial and compliance risks, leading some to refuse lower-rate fines due to the high burden of tax assessments and retrospective penalties.
Complexities in aligning SLfT qualifying criteria with EWC codes contribute to misclassification, due to a lack of clear guidance for waste producers and operators.
Conclusion and policy implications
The lower-rate SLfT remains partially effective but is increasingly misaligned with Scotland’s circular economy and wider environmental objectives. While it has supported landfill diversion in some cases, the increasing quantity of mechanically-treated fines being landfilled at lower rate undermines resource efficiency and waste hierarchy goals. Without adjustments, in conjunction with other supporting policies, there is a risk that the tax may continue to favour landfill disposal over resource recovery, limiting Scotland’s progress toward a low-carbon, circular economy.
To ensure Scotland meets its waste reduction, emissions reduction, and circular economy goals, reforms to the lower-rate SLfT are necessary. Key areas for further exploration could include:
Raising the lower SLfT rate by a greater margin than in previous years (as Wales is doing and proposed in the UK’s 2025 consultation), to incentivise application of the waste hierarchy.
Assigning a significantly higher SLfT rate to mechanically-treated fines specifically, to address misclassification and recognise its relatively high environmental impacts.
Strengthening enforcement and guidance on material classification to reduce compliance risks.
Build on existing cross-border regulatory and enforcement cooperation to address ongoing challenges such as waste tourism and the evolution of the landfill tax, recognising the complexities of working across different regimes.
By considering these targeted interventions, Scotland can help reduce reliance on landfill, improve material efficiency, and ensure that landfill tax policy aligns with long-term sustainability goals.
References
Ali, M. (2023) ‘An investigation into the uses of trommel fınes produced from recyclıng of constructıon and demolition waste’, Construction and Building Materials, 369(130579), pp.1-11. Available at https://www.sciencedirect.com/science/article/pii/S0950061823002908 (Accessed: 12 March 2025)
Berryman, C. et al. (2023) Sustainable management of surplus soil and aggregates from construction (C809). London, UK: CIRIA.
Bogas, J.A., Silva, M. and Glória Gomes, M. (2019) ‘Unstabilized and stabilized compressed earth blocks with partial incorporation of recycled aggregates’, International Journal of Architectural Heritage, 13(4), pp.569-584. Available at: https://www.tandfonline.com/doi/abs/10.1080/15583058.2018.1442891 (Accessed: 12 March 2025)
Braga, B.B., de Carvalho, T.R.A., Brosinsky, A., Foerster, S. and Medeiros, P.H.A., (2019) ‘From waste to resource: Cost-benefit analysis of reservoir sediment reuse for soil fertilization in a semiarid catchment’, Science of the total environment, 670, pp.158-169. Available at: https://www.sciencedirect.com/science/article/abs/pii/S0048969719310654 (Accessed: 12 March 2025)
Burdier, M., Anshassi, M., Guo, Y., Laux, S. and Townsend, T. (2022) ‘Enhancing the beneficial reuse properties of construction and demolition debris fines using lab-scale washing’, Resources, Conservation and Recycling, 183(106361). Available at: https://www.sciencedirect.com/science/article/abs/pii/S0921344922002063 (Accessed: 12 March 2025)
Campe, J. et al. (2012) The potential of remineralization with rock mineral fines to transform agriculture, forests, sustainable biofuels production, sequester carbon, and stabilize the climate. Available at: https://www.remineralize.org/wp-content/uploads/Rio%20Summit-RTE-2012.pdf (Accessed: 12 March 2025)
Choi, H, et al. (2018) ‘Soil Recycling Among Construction Sites by Optimizing Schedule and Costs for Earthmoving’ Journal of Asian Architecture and Building Engineering, 16(2), pp. 439-446. Available at: https://doi.org/10.3130/jaabe.16.439 (Accessed: 21 March 2025)
European Commission (2000) 2000/532/EC: Commission Decision of 3 May 2000 replacing Decision 94/3/EC establishing a list of wastes pursuant to Article 1(a) of Council Directive 75/442/EEC on waste and Council Decision 94/904/EC establishing a list of hazardous waste pursuant to Article 1(4) of Council Directive 91/689/EEC on hazardous waste. Available at: http://data.europa.eu/eli/dec/2000/532/2023-12-06 (Accessed: 27/03/2025)
Cottrell, J.A., Ali, M. and Etienne, G. (2024) ‘Utilisation of construction, demolition and excavation waste for the production of compressed trommel fines blocks’, Construction and Building Materials, 416(134985), pp.1-11. Available at: https://www.sciencedirect.com/science/article/pii/S0950061824001260 (Accessed: 12 March 2025)
ClimateXChange and Ricardo (2025) Evidence review on the potential role of alternatives to primary aggregates to deliver reductions in GHG emissions [Forthcoming; publication expected summer 2025].
Di Maria, F., Micale, C., Sordi, A., Cirulli, G. and Marionni, M. (2013) ‘Urban mining: Quality and quantity of recyclable and recoverable material mechanically and physically extractable from residual waste’, Waste Management, 33(12), pp.2594-9. Available at: https://www.sciencedirect.com/science/article/abs/pii/S0956053X13003814 (Accessed: 12 March 2025)
Döbbeling-Hildebrandt, N. et al. (2024) ‘Systematic review and meta-analysis of ex-post evaluations on the effectiveness of carbon pricing’, Nature Communications, 15(1) pp.1-12, Available at: https://www.nature.com/articles/s41467-024-48512-w#ref-CR69 (Accessed: 12 March 2025)
European Commission (2000) 2000/532/EC: Commission Decision of 3 May 2000 replacing Decision 94/3/EC establishing a list of wastes pursuant to Article 1(a) of Council Directive 75/442/EEC on waste and Council Decision 94/904/EC establishing a list of hazardous waste pursuant to Article 1(4) of Council Directive 91/689/EEC on hazardous waste.
Hale, S. E (2021) ‘The Reuse of Excavated Soils from Construction and Demolition Projects: Limitations and Possibilities’, Sustainability, 13(11), p. 6083. Available at: https://doi.org/10.3390/su13116083 (Accessed: 21 March 2025)
Haynes, R.J., Zhou, Y.F. and Weng, X. (2022) ‘Formulation and use of manufactured soils: A major use for organic and inorganic wastes’, Critical Reviews in Environmental Science and Technology, 52(22), pp.4113-4133. Available at: https://www.tandfonline.com/doi/abs/10.1080/10643389.2021.1989909 (Accessed: 12 March 2025)
Hernández García, L.C., Monteiro, S.N., Colorado Lopera, H.A. (2024) ‘Recycling Clay Waste from Excavation, Demolition, and Construction: Trends and Challenges’, Sustainability, 16(14), pp. 1-20. Available at: https://www.mdpi.com/2071-1050/16/14/6265
Huang, T. et al. (2022) ‘A BIM-GIS-IoT-Based System for Excavated Soil Recycling’, Buildings, 12(4), p. 457. Available at: https://doi.org/10.3390/buildings12040457 (Accessed: 21 March 2025)
Hurst, L.J. and O’Donovan, T.S. (2024). ‘Embodied impacts of key materials for UK decarbonised domestic retrofit: Differences between sources of embodied carbon and embodied energy data’, Energy and Buildings, 319(114515), pp. 1-12. Available at: https://www.sciencedirect.com/science/article/pii/S0378778824006315 (Accessed: 12 March 2025)
Kasinikota, P. and Tripura, D.D. (2021) ‘Evaluation of compressed stabilized earth block properties using crushed brick waste’, Construction and Building Materials, 280(122520). Available at: https://www.sciencedirect.com/science/article/abs/pii/S0950061821002804 (Accessed: 12 March 2025)
Katsumi, T. (2015) ‘Soil excavation and reclamation in civil engineering: Environmental aspects’, Soil Science and Plant Nutrition, 61(sup1), pp. 22–29. Available at: https://doi.org/10.1080/00380768.2015.1020506 (Accessed: 21 March 2025)
Magnusson, S. et al. (2015) ‘Sustainable management of excavated soil and rock in urban areas: A literature review’ Journal of Cleaner Production, 93, pp. 18-25. Available at: https://doi.org/10.1016/j.jclepro.2015.01.010 (Accessed: 21 March 2025)
Manning, D. and Vetterlein, J. (2004) ‘ExpLOItation and use of quarry fines’, Mist Project-Solutions, 44, pp.1-60. http://www.katlapumice.com/mist/mist2.pdf (Accessed: 12 March 2025)
O’Leary, M.J., Osmani, M. and Goodier, C. (2024) ‘Circular economy implementation strategies, barriers and enablers for UK rail infrastructure projects’, Resources, Conservation & Recycling Advances, 21. Available at: https://www.sciencedirect.com/science/article/pii/S2667378923000676 (Accessed: 12 March 2025)
Oujana, S. and Sanchez, D. (2018) ‘Origins of the Problematic Substances in Fines, for Their Acceptance at Inert Landfills’, Journal of Geoscience and Environment Protection, 6(5), pp.237-246. Available at: https://www.scirp.org/journal/paperinformation?paperid=84938 (Accessed: 12 March 2025)
Renella, G. (2021) ‘Recycling and Reuse of Sediments in Agriculture: Where Is the Problem?’ Sustainability, 13(4), pp. 1-12. Available at: https://www.mdpi.com/2071-1050/13/4/1648
Scottish Ecological Design Association (SEDA) (2024) 2045: The Big Conversation.
SEPA; the Civil Engineering Contractors Association (Scotland); the Environment Industries Commission (2010) Regulatory guidance: Promoting the sustainable reuse of greenfield soils in construction. Available at: https://www.sepa.org.uk/media/154233/reuse_greenfield_soils_construction.pdf (Accessed: 12 March 2025)
SEPA; Activities Exempt from Waste Management Licensing. Scottish Statutory Instrument 2011 No. 228: The Waste Management Licensing (Scotland) Regulations 2011. Paragraph 19. Available at:
Suárez, S., Roca, X. and Gasso, S. (2016) ‘Product-specific life cycle assessment of recycled gypsum as a replacement for natural gypsum in ordinary Portland cement: application to the Spanish context’, Journal of cleaner production, 117, pp.150-159. Available at: https://www.sciencedirect.com/science/article/abs/pii/S0959652616000792 (Accessed: 12 March 2025)
Zhao, Z. et al (2020) ‘Use of recycled concrete aggregates from precast block for the production of new building blocks: An industrial scale study’, Resources, Conservation and Recycling, 157(104786). Available at: https://www.sciencedirect.com/science/article/abs/pii/S0921344920301075 (Accessed: 12 March 2025)
Zhao, X. (2021) ‘Stakeholder-associated factors influencing construction and demolition waste management: A systematic review’, Buildings, 11(4), pp. 1-22. Available at: https://doi.org/10.3390/buildings11040149 (Accessed: 12 March 2025)
Appendices
Alignment of the Scottish Landfill Tax (SLfT) with broader policy frameworks
This appendix provides further context on how the SLfT aligns with key environmental policy frameworks, specifically the Circular Economy (Scotland) Act 2024 and Scotland’s wider decarbonisation strategy. It highlights the role of SLfT in supporting waste hierarchy principles, promoting resource efficiency, and contributing to net-zero targets through practical examples – while also noting current limitations.
Circular Economy (Scotland) Act 2024
Example 1: Waste hierarchy alignment
The Circular Economy (Scotland) Act 2024 places strong emphasis on the waste hierarchy, which prioritises prevention, reuse, recycling, and recovery before landfill. SLfT reinforces this principle by applying a financial disincentive to landfill disposal. The lower rate of SLfT, applied to certain inert materials such as glass, ceramics and soil, encourages their diversion from landfill toward reuse or recycling. This supports the Act’s objectives by reducing dependence on landfill and promoting material circulation within the economy. However, as outlined in Section 3.1 the lower rate appears to be an insufficient incentive to drive significant upstream changes, such as waste prevention or more ambitious reuse practices.
Example 2: Waste prevention and resource efficiency
The Act also aims to improve resource efficiency across sectors. By differentiating tax rates based on environmental impact, SLfT promotes the recovery of materials with low impacts and discourages disposal of more polluting waste. This financial incentive supports businesses in adopting sustainable waste practices. That said, the influence of SLfT on broader resource efficiency is limited, as its primary focus is end-of-pipe disposal rather than incentivising upstream design, reduction, or material substitution choices
Scotland’s decarbonisation strategy
Example 3: Reducing emissions from waste management
Scotland’s decarbonisation strategy includes a target of net-zero emissions by 2045. Landfilled waste—particularly biodegradable materials—generates GHGs such as methane. SLfT supports emissions reduction by applying a higher tax rate to waste streams which emit more GHGs in landfill, encouraging their diversion. The upcoming ban on landfilling biodegradable municipal waste in 2025 builds on this, aligning landfill policy with Scotland’s climate commitments. However, SLfT’s impact remains focused on reducing emissions from landfilled waste, and does not yet provide strong incentives to reduce embodied carbon or promote lower-carbon materials earlier in the lifecycle.
Example 4: Circular economy and carbon footprint reduction
The strategy also promotes circular economy practices as a means of reducing carbon emissions. SLfT complements this by encouraging alternatives to landfill, such as repurposing lower-rate materials like soil and stones for construction. This can reduce the need to extract virgin materials, contributing to lower carbon footprints. Nonetheless, SLfT’s role in driving circular construction practices remains limited, as it does not directly incentivise material reuse, design for deconstruction, or low-carbon construction methods upstream.
Integration of policy goals
Example 5: Aligning SLfT with policy reviews and landfill ban
The Scottish Government has committed to reviewing waste management options by 2027, alongside the upcoming ban on landfilling biodegradable municipal waste. These developments present an opportunity to better integrate SLfT with other fiscal and regulatory tools. While SLfT plays a role in discouraging landfill and supporting environmental objectives, its effectiveness is partly constrained by limited coordination with wider policies on construction, procurement, and materials management. Stronger understanding of policy cross overs could enhance the overall impact of SLfT.
Methodology for quantitative data gathering and analysis
Data requests
Both Revenue Scotland (as regulators of the SLfT) and SEPA (as the national environmental authority) hold and publish statistical data on waste to landfill in Scotland. However, the public-facing outputs are summarised and categorised from more disaggregated data. This is primarily to protect confidentiality within the tax returns (RS) and to make the outputs more accessible to the public (SEPA). As such, we made data requests to both organisations.
RS provided annual financial year (FY) data for five full years against 13 EWC codes / group codes as highlighted in Section 4.1. Multiple codes were grouped together in six of the 13 rows of data where RS needed to aggregate data to protect confidentiality. This is where only one company is responsible for an entire tax return for a single code and could therefore be directly identifiable.
SEPA provided 3 full years of data broken down by quarter, also at EWC code level. This annual data is publicly available but the latest year was released early to us by SEPA for the purposes of this report. The data is fully disaggregated and includes operator name & address, operator description and waste origin. There are 2,514 individual records in the data file.
We also made a request to Zero Waste Scotland for access to their Scottish Waste Environmental Footprint Tool (SWEFT). The tool provides lifecycle-based factors for certain waste categories across different treatment pathways (e.g. landfill, recycling, incineration…) for six different environmental criteria:
Climate / greenhouse gases, as kg CO2 eq. The contribution of emissions of greenhouse gases to climate change, measured as Global Warming Potential (GWP100)
Biodiversity, as species loss. An aggregated measure of species at risk, based on the ReCiPe endpoint indicator for Ecosystem quality.
Air pollution, as kg PM2.5 eq., Air pollution’s damage to human health, measured as the equivalent impact of PM2.5.
Mineral resource scarcity, as kg Cu eq. Mineral resource scarcity is a measure of the difficulty to mine a resource in the future given expected future production (measured in kg of copper equivalent).
Water consumption, as m3. Water consumption consists of the volume of water withdrawn and used.
Land use, as m2 annual crop eq. The species lost due to loss of habitat and soil disturbance, expressed as the equivalent species loss per sqm typical crop production.
Given the timeframe of this project and the desire to consider the role of SLfT against Scotland’s wider environmental objectives – the use of such a tool was considered appropriate to provide quick assessment across a broad coverage of potential environmental impacts.
Data cleansing
We then cleansed the data:
Annual totals were created in the SEPA data by FY, assuming that a financial year is the sum of Q2, Q3, Q4 and the following Q1.
SEPA data was filtered to remove any EWC codes that do not appear in the RS data for lower rate materials.
Tonnages for EWC codes in the SEPA dataset were aggregated where relevant in order to match the EWC code grouping provided by RS.
A SWEFT category was assigned to each material / material group in the RS/SEPA data. This was based on expert judgement of the project team, with the allocations presented in Table A 1 below. It is noted that SWEFT has to date only been compiled for household waste streams. Therefore, the nature of materials from a commercial / industrial source (more likely to qualify as lower rate materials) may differ in nature from household wastes of a similar material description. Given the timeline of this project and the aim to use SWEFT as an indicator of environmental impacts, this was deemed to be an acceptable weakness in the data review method.
We reviewed landfill tonnage data for potential discrepencies by comparing the national total to landfill (SEPA) which is assumed to represent the sum of both lower- and standard- rate materials against the RS data for the same period. For two of the grouped codes, the RS data for lower rate materials was found to be greater than the total to landfill represented by the SEPA data. In one case, this was resolved through communication with the data providers. For the remaining group, it was stated that “there can be slight differences in counting between the organisations due to water discounts applied, permanent removals, and movement from/to non-disposal areas”. For the most part, this verification exercise found good alignment between the two datasets. This is supported by the finding that the two datasets match in totals for some of the EWC codes that are only landfilled at lower rate. As such, the group with a remaining discrepency was identified to the project steering group for their information, without there being a significant impact on research outcomes.
Data analysis and prioritisation scores
We analysed the data with the view of identifying materials/ material groups to prioritise for further research.
For each of the 13 material groups in the RS dataset, we calculated the percentage of lower rate material as a portion of the total material landfilled (SEPA totals) for that group. This allowed for the groups with the highest quantities landfilled at lower rate to be identified and prioritised for further research, whilst providing additional context on the relationship between lower and standard rate wastes within the material definitions.
We reviewed a number of different reference material including the SEPA operator descriptions for each landfill record to give specificity to the materials included under each of the defined material groups. This also enabled us to screen out certain material groups as “niche materials” as described in Section 4.1.
Environmnetal impacts were estimated for each of the 13 material groups across the six environmental indicators included in SWEFT. This was completed by multiplying the 2023/24 tonnage for each material group with the corresponding SWEFT factor.
Based on step III, we ranked material groups in terms of their weighted impact against each environmental indicator. The output of this is provided in Table A 1 below.
An alternative view of the results was defined by calculating the relative impact of each material group across each indicator proportionally from zero to one. This helps to show the significance of impact for each material group which is not automatically understood from the appraoch in step IV. For example, there may be a significant difference in the scale of environmental impact between the first and second ranked material group for a given indicator. The ouput of this analysis is the spider diagram presented in section 4.4.
We assigned an overall priority score to each of the 13 material groups by considering both the overall tonnage disposed at lower rate; and the indicative environmental impacts. The ouput of this priority scoring is provided in Table A 1 below.
This method for prioritising materials was agreed with the project steering group as a basis for narrowing down the materials / material groups for further research and policy review.
Table A : Descriptor terms, SWEFT category, tonnage and weighted environmental impact rankings (SWEFT output)
NA: SWEFT factor = zero for biodiversity loss associated with landfill for those waste categories.
Methodology for qualitative data gathering and analysis
The qualitative research consisted of a literature review and interviews to support an assessment of diversion and policy options.
Desk-based research
The desk-based research was initiated in two stages. The first stage was a preliminary review of diversion options for four top ranking materials, based on the quantitative data collection and analysis of SEPA and RS data (Appendix B). These were: mechanically treated fines, mechanically treated mineral fines, soils and stones, bottom ash, and slags. The second stage was a more detailed review following the quantitative assessment of environmental impacts and a narrowing of focus on three priority materials (Appendix B). After prioritisation was finalised, further research was not conducted for bottom ash and slags.
The priority materials were researched using academic search engines, such as Google Scholar, Scopus and Web of Science. Organisations concerned with inert waste were checked for relevant sources, such as WRAP, Zero Waste Scotland and Green Alliance. Sources were prioritised for review if they were based in Scotland or the UK, summarised a wide range of sources through a literature review, or were indicated to be widely referenced.
Often, sources were not published based on EWC codes. Instead, they refer to common industry names for the materials, for instance, ‘trommel fines’ or ‘mechanical fines’ rather than ‘EWC 19 12 12’. In addition, as research refers to the recycling and recovery of mechanical fines generally, we combined searches on diversion options for mechanically-treated fines and mechanically treated mineral fines.
A combination of search terms were used, including terms related to:
Research questions, e.g. downstream, upstream, diversion, circular, barriers, enablers, limitations, risk, disposal and landfill.
Priority materials, e.g. trommel fines, mechanical fines, minerals, bricks, tiles, ceramics, fines, skip fines, soils, stones and gypsum.
Circularity or waste hierarchy stages, e.g. reuse, recovery, recycling, retrofit and refurbishment.
Industries, e.g. construction, demolition, quarrying, excavation, engineering and recycling.
Diversion options, e.g. aggregate, treatment, land, deconstruction, engineering, landscaping and cover materials.
Geography, e.g. Scotland, UK, Europe and rural.
Stakeholder engagement
Eight one-hour, semi-structured interviews were conducted online and in-person between January and March 2025. In addition, questions were answered via email by some of these stakeholders, and a 3 further stakeholders. The full list can be viewed below in Table A 2 .
Table A 2: Stakeholder engagement list
Stakeholder category
Stakeholder reference
Form of data collection
Date of interview
Position held
Regulator
Revenue Scotland-A
Interview
21 Jan 2025
SEPA Specialist
SEPA
Interview
21 Jan 2025
Waste Policy Lead
Revenue Scotland-B
Email
N/A
Head of Scottish Landfill Tax
Waste management, including industry associations
Commercial landfill operator
Interview and email
10 Feb 2025
Regional Operations Manager
C&D waste management processor
Interview and email
17 Jan 2025
Managing Director
Chair
Waste industry association
Interview
22 Jan 2025
Policy Advisor
Large public body
Email
N/A
National Sustainability Manager
Upstream sources
Commercial remediation company
Interview
03 Feb 2025
Regional Remediation Manager, Scotland
Engineering consultancy
Interview
21 Feb 2025
Technical Director
C&D skip operator
Interview
06 Feb 2025
Operations Director
Construction company
Interview
25 March 2025
Head of Supply Chain Development
A set of standard interview/email questions were developed based on the overarching research questions asked in the project. Before each contact with a stakeholder, these standard questions were tailored to the stakeholder’s knowledge and background and developed into an interview proforma. The standard questions investigated the following key points:
verifying quantitative findings on priority materials and sources of lower-rate materials;
identifying existing or future end-of-pipe diversion options for each priority material;
identifying existing or future upstream diversion options for each priority material;
understanding the barriers hindering the advancement of each diversion option, including technical, operational, policy, financial or wider barriers;
understanding potential policy options to address barriers associated with accelerating the diversion options; and
understanding the unintended consequences of any policy options.
All meeting invites were issued by the Scottish Government via email and were accompanied by a participant information and consent form for interviewees to review and sign. This included full details of data use and protection, in line with UK Government guidance.[5]
Interview requests were sent out in two stages to support research aims. The first stage targeted regulators, waste management organisations, local governments and tax-implementing organisations. They were selected to provide insights on data availability and granularity, triangulate/verify the assessment prioritising certain materials, and identify further stakeholders to contact. The second stage targeted ‘the source’ of lower-rate materials sent to landfill. Namely, stakeholders from sectors using large amounts of priority materials. Their insights were used to understand the on-the-ground situation, and triangulate quantitative findings on priority materials and desk-based findings on diversion options.
Qualitative analysis
Findings from desk-based research and stakeholder engagement were added to a spreadsheet, using the template shown below in Table 6. This spreadsheet enabled assessment of the diversion options, barriers and enablers. In addition, it informed the analysis of policy options and unintended consequences of these options, and was used to conduct the feasibility assessment described below in Appendix D.
Table : Template of structural headings used to analyse qualitative data
Priority material
Description of diversion option
Limitations
Upstream or downstream
Current barriers
Potential enablers
Risks
Methodology for the preliminary feasibility assessment
This initial feasibility assessment evaluates the viability of different waste diversion options for mechanically-treated fines (19 12 12), mechanically-treated mineral fines (19 12 09), and soils and stones (17 05 04) by considering their existing use in Scotland, research and development efforts, and regulatory and financial barriers. The Table A 2 below details the logic behind our assessment given in Section 6.5.
Note that this assessment serves more as a summary of Section 6 and a high-level guide for policy-makers, than an in-depth feasibility assessment.
Table A : Feasibility assessment methodology
Diversion option
Lifecycle stage of diversion
Key barriers
Feasibility score
(3 max)
Feasibility score justification
Mechanically-treated fines (19 12 12)
Landfill cover/quarry cover, engineering and restoration
End-of-pipe
Demand exists, minimal barriers
3
Common practice in Scotland, demand for landfill cover
While every effort is made to ensure the information in this report is accurate as at the date of the report, no legal responsibility is accepted for any errors, omissions or misleading statements. The views expressed represent those of the author(s), and do not necessarily represent those of the host institutions or funders.
This work was supported by the Rural and Environment Science and Analytical Services Division of the Scottish Government (CoE – CXC).
If you require the report in an alternative format such as a Word document, please contact info@climatexchange.org.uk or 0131 651 4783.
Some of the data provided by Revenue Scotland was grouped to ensure confidentiality is retained, for example where there is only one operator responsible for a specific code. These grouped codes have been verified by the project team as containing mostly niche materials, and therefore excluded from the shortlist. ↑
This group contains a code for mixed household wastes (20 03 01). An insignificant portion of this code is expected to be landfilled at lower rate. As such, it was assessed separately from the niche materials that make up the remainder of this group (which are more likely to be landfilled under the lower rate). ↑
Diversion options for gypsum have been reviewed, as the upcoming ban on landfilling biodegradable waste may unintentionally make it easier to landfill gypsum. Currently restricted from co-disposal with biowaste, gypsum may no longer face this barrier once all landfills exclude biodegradable waste. ↑
This group contains a code for mixed household wastes (20 03 01). An insignificant portion of this code is expected to be landfilled at lower rate. As such, it was assessed separately from the niche materials that make up the remainder of this group (which are more likely to be landfilled under the lower rate). ↑
This project was commissioned to inform the Scottish Government on the potential for an interactive Energy Performance Certificate (EPC) in Scotland. It is proposed that interactivity could allow householders to better assess potential retrofit measures. This, in turn, may prompt households to undertake energy efficiency measures and switch to clean heat systems. This report will help inform whether it would be beneficial to incorporate data or functionality into the national EPC register to support potential EPC interactivity.
Key findings
Three levels of potential interactivity have been identified for the Scottish Government to consider implementing in relation to EPCs:
Simple interaction, where both (i) no new user data and (ii) no integration with a calculation engine are required. Users could choose between customised or simplified views of EPC data. Click-through links signposting to further information could also be included (e.g. about measures, funding, further advice services).
Medium interaction, where (i) no new user data is required, but (ii) integration with a calculation engine is required. Users could see updated calculations based on already-completed as well as potential retrofit measures. Fuel costs could be updated in line with recent trends.
Detailed interaction, where customised user behaviour and occupancy inputs could update outputs via integration with an enhanced calculation engine (medium interaction functions also included). Users could personalise a range of inputs for which default values are normally applied in an EPC calculation.
The EPC outputs likely to be most useful to households are costs: household energy running costs, running cost savings, and the capital cost of various retrofit measures. The extent to which these outputs may be customised varies, as does the complexity of implementation. For example, household energy running costs could be updated by simply considering the latest fuel prices. Or, it could be tailored by updating one or more of the following variables: fuel prices, occupancy, heating temperature set point, heating patterns, or the number of baths or showers taken per day.
However, customising more variables may not necessarily make the outputs more representative, since the reliability of obtaining some of those inputs may be quite low. At any level of customisation, it will be necessary to inform tool users that outputs are ultimately estimates. Actual energy use and costs will inevitably be influenced by annual climate severity, changing fuel prices, and changes in household circumstances.
There are a number of existing tools that already deliver energy advice to households. These have varying levels of interactivity and customisation. In response to user testing and feedback, many offer relatively limited customisation. Circumstantially, this supports the reasoning that a modest spectrum of customisation may be the limit to which users are prepared to use such tools.
Limited evidence was identified of a direct link between the provision of customised information and households being prompted to retrofit. However, various literature sources quoting both professionals and typical consumers call for interactivity and customisation of EPCs. There is also relatable evidence that the provision of tailored information to households can prompt behavioural change. Offering households some level of interactivity alongside a traditional ‘static’ EPC could therefore be beneficial. Unfortunately, no direct evidence was found to support whether simpler or more detailed interaction is more likely to prompt households to retrofit.
Considerations for implementation
If the Scottish Government is minded to pursue an interactive tool, there are various options. It may commission its own interactive tool, or alternatively, it may look to use or adapt an existing tool to deliver a similar service.
The Scottish Government will also need to consider how best to integrate net zero policy ambitions in the implementation of any tool outputs or recommendations.
Providing sufficient interaction/ customisation for end users to feel that outputs are relevant to them is likely to be most important. The ability to update information from a ‘static’ EPC to reflect changes that have already taken place will likely be key. Furthermore, the ability to toggle retrofit measures will give users a sense of choice and control.
While a relatively simple implementation may suit the majority of potential users, a minority of users may see particular benefit in tailoring a wider range of input variables. If ‘detailed interactivity’ were implemented (as defined above), then customised views/ functions for different user groups may help simplify the user experience.
Reduced Data Standard Assessment Procedure. The Government tool for assessing the energy performance of existing homes for regulatory requirements.
Introduction
This project considers how an interactive Energy Performance Certificate (EPC) user interface may help to increase public uptake of energy efficiency and clean heating options in homes.
There could be an opportunity to integrate data that would support the development of an interactive EPC user interface when assessing the future needs of the national EPC register in Scotland. A system that enables the public to better assess energy efficiency and clean heat options may be expected to increase uptake of these measures. However, the Scottish Government needs to understand the likely benefits and limitations of such an interactive user interface before it makes decisions on changes to the EPC register.
Background and research scope
The focus of this report is on domestic EPCs. An EPC assessment combines findings from a physical survey of a building with standardised assumptions on how it is used. EPCs therefore provide an ‘asset performance assessment’ that allows homes to be compared to others elsewhere in the country. This is regardless of whether they are different sizes, specifications, or have different systems and/or use patterns. They are accompanied by a Recommendations Report. This provides examples of measures that may improve the efficiency of the home and make savings, intended to encourage homeowners to take action. Recommendations are presented in a set sequence that follows a fabric-first approach, with renewable energy sources considered last. EPCs are therefore an important source of information for homeowners and buyers to inform decision making.
However, the presentation of recommendations and savings means users are not aware of the impacts of implementing measures out of sequence. Also, EPCs do not provide information regarding potential options for switching to cleaner heat systems where properties are currently served by another fuel type. EPCs as therefore not necessarily aligned with the aims of the Scottish Government Heat in Buildings Strategy with regard to clean heat systems. Savings predictions reflect the standardised assumptions made in the EPC calculation in relation to occupancy and heating patterns. This makes the EPC less helpful when a homeowner wants to understand the benefits and savings they may experience according to their own circumstances. Offering users a level of interactivity may allow benefits of different potential improvement measures to be expressed. This can lead to more tailored recommendations and thus may better support users to act on them. There could therefore be value in a traditional ‘static’ public EPC for regulatory compliance, and an interactive interface to provide customisation for homeowners.
The scope of the research was therefore to identify the data inputs and outputs that may be relevant to an interactive EPC and consider how data inputs may be sourced.
The focus was on interactivity that would allow homeowners to input contextual information about how they use their home; essentially customising aspects of the EPC calculation that would otherwise use standardised assumptions, e.g. occupancy, heating patterns and temperatures. It was assumed that data obtained from an original EPC building survey would not fundamentally be challenged, e.g. floor areas, construction types. However, it is acknowledged that homeowners may wish to update information where retrofit works had already taken place since the EPC was carried out. For example, when new insulation has been installed or when energy systems have been upgraded or changed. Note that implications of the General Data Protection Regulation (GDPR) on interactive EPCs were deemed beyond the scope of this study.
Further, we sought evidence to understand the benefits and limitations that an interactive EPC interface may provide, to demonstrate whether user interactivity has led to increased uptake of retrofit measures. Our research explored a number of existing tools that offer a level of interactivity with EPC-like outputs. These were primarily targeted at homeowners (i.e. covering domestic/ residential properties), although portfolio-level tools were also briefly considered. The research also involved a desk-based literature review.
Data inputs and outputs for potential EPC interactivity
EPC review
Domestic EPCs for Scotland are produced using the UK Government’s Standard Assessment Procedure (SAP) implemented in approved software tools. For existing dwellings, it is recognised that detailed construction information is unlikely to be available. A ‘reduced data’ version of SAP (RdSAP) is therefore used, which makes assumptions about the construction based on age, etc. A selection of the inputs and outputs of the resulting calculation are held centrally in the Scottish Government’s EPC Register. Note, however, that not all intermediary outputs from the RdSAP calculation steps are held on the Register.
EPC outputs
We reviewed the outputs reported on a current Scottish domestic EPC (as at 2024). Those that may be relevant to end users making decisions on energy efficiency and clean heat measures were identified, as noted below. Further metrics proposed in the Scottish Government consultation on EPC reform were also considered for insight into potential future changes.
Energy Efficiency Rating (EER) (also known as the ‘SAP score’; Proposed to be called ‘Energy Cost Rating’ following EPC reform)
Environmental Impact Rating (EIR)
Primary energy indicator (kWh/m2year)
Running costs (£ for 3 years)
Savings (from potential recommended measures) (£ for 3 years)
Savings per recommended measure (£ for 3 years)
Recommended measures capital cost (£)
Emissions from the home (kgCO2/m2/year)
Space heating demand (kWh/year)
Water heating demand (kWh/year)
Heat Retention Rating (proposed for EPC reform; expected to be similar to Space heating demand metric)
Total energy use (proposed for EPC reform; expected to be similar to the calculation for primary energy indicator, but for delivered energy, i.e. without primary energy multiplier)
Dependent inputs
We then interrogated the underlying RdSAP calculation methodology[1] to identify the key inputs used to calculate the identified outputs. All outputs are derived from numerous inputs and calculation steps, with the exception of ‘Recommended measures capital costs’, which are simply quoted reference values. Inputs that offer the potential for contextual customisation relevant to particular occupant behaviour/use are noted below.
Fuel prices and standing charges
Capital costs for retrofit measures
Number of occupants
Number of baths or showers taken per day
Living room comfort temperature set point
Heating pattern on/off times (for a normal day and an alternative day, e.g. weekend)
External temperature (from regional climate information)
Ease of implementation
We made a qualitative assessment of the ease with which the above EPC outputs may be customised via calculation. Extensive customisation of an RdSAP calculation using occupancy parameters was implemented in the Green Deal Occupancy Assessment (GDOA) tool[2]. Since the GDOA tool functionality already exists[3], customisation of a number of contextual/ user inputs could be relatively easily facilitated in an RdSAP 2012 calculation. The following ‘ease of implementation’ ranking was therefore applied to the EPC outputs identified above:
High ease: Where an output already held on the Scottish EPC register could be adapted via a straightforward side calculation (i.e. where no RdSAP calculation engine would be required to re-model the impact).
Medium ease: Where the output could be updated by implementing aspects of the GDOA as part of a new RdSAP calculation, using data held on the EPC register.
Low ease: Where customisation of metrics has not previously been implemented in an RdSAP calculation, and therefore more work would be required to implement.
Note: In assigning this ‘ease’ hierarchy, it is assumed that the data held in the non-public version of the Scottish EPC register aligns with the import requirements of an RdSAP 2012 calculation. This appears likely to be the case based on summary information provided by the Scottish Government for this study. However, this would need to be verified in order to validate the recommendations of this study.
Table 1 shows the qualitative ‘ease of implementation’ ranking for customised EPC outputs.
The table refers to the SAP Product Characteristics Database (PCDB). The PCDB holds reference data for mechanical systems, which is used in SAP and RdSAP calculations. It also holds fuel prices and estimates for the capital costs of measures that are used in RdSAP calculations. Fuel prices are updated in the PCDB every 6 months but they are fixed in an EPC at the time of its issue. Capital cost of measures are only updated when a new version of the RdSAP methodology is released.
Currently, the EPC register does not store fuel use totals from the RdSAP calculation, although it is an intermediary calculated value that underpins many subsequent metrics. It is understood that this data is absent from both the public and non-public versions of the register held by the Scottish Government. It follows that even relatively simple-seeming amendments to EPC outputs, e.g. updating fuel prices, would require an RdSAP calculation to be re-run. Two scenarios have been presented in Table 1 for ‘Recommended measures capital cost’. Scenario A is assigned a ‘high’ ease of implementation, while Scenario B is assigned a ‘low’ ease of implementation. The measures costs applied to an EPC are generic and not tailored to the property (e.g. according to property dimensions, or similar). Scenario A assumes this is still the case but an alternative, updated source for measures costs could be referenced by an interactive tool. Customised retrofit measures costs were not a function that was implemented in the GDOA. Therefore, if such a customisation function were desired, this scenario would have a low ease of implementation.
EPC output
Ease of customisation ranking
Notes
Energy Efficiency Rating (EER) (Energy Cost Rating)
N/A
A regulatory metric fundamentally based on standardised assumptions for comparability. We therefore suggest that this metric should not be customised.
Environmental Impact Rating (EIR)
N/A
As with EER, a regulatory metric fundamentally based on standardised assumptions for comparability. We therefore suggest that this metric should not be customised.
Primary energy indicator
Medium
Calculation re-run with inputs customised.
Running costs
Medium
Calculation re-run with custom fuel prices, updated costs from PCDB and/or with other inputs customised.
Savings (from potential retrofit measures)
(also ‘per measure’)
Medium
Calculation re-run with custom fuel prices, updated costs from PCDB and/or with other inputs customised.
Recommended measures capital cost
Scenario A: High
Scenario B: Low
Scenario A: Values are not used in any output calculations. Updated typical/ generic values from an external source could therefore be presented to users relatively easily.
Scenario B: Currently no function exists to ‘customise’ costs via an RdSAP calculation (e.g. according to property dimensions, or similar).
Emissions from the home
Medium
Calculation re-run with inputs customised.
Space heating demand
Medium
Calculation re-run with inputs customised.
Water heating demand
Medium
Calculation re-run with inputs customised.
Heat Retention Rating (proposed)
N/A
Proposed to be a regulatory metric fundamentally based on standard assumptions for comparability. We therefore suggest that this metric should not be customised.
Total energy use (proposed)
Medium
Calculation re-run with inputs customised.
Table 1: Ranking of current and proposed EPC outputs according to their anticipated ease of customisation
End user value of existing EPC outputs
The EPC outputs identified in 5.1.1 were qualitatively assessed for their likely importance to end users in retrofit decision making. Discussions were held with Retrofit Coordinators at the National Energy Foundation, who directly engage with households on energy retrofit. Their feedback is supported in various studies (including National Retrofit Hub (NRH), (2024), Which? (2024), Jones (2022), and Bančič, Vetršek and Podjed (2021)) that have examined which metrics different end users find or would find valuable when considering home upgrades. In Table 2, the EPC outputs have again been assigned a ranking, this time indicating their expected usefulness to end users. Notes provide supporting rationale for each ranking.
EPC output
Likely importance to end users
Notes
Energy Efficiency Rating (EER) (Energy Cost Rating)
Medium
As a relative metric intended to enable comparison between dwellings, it is somewhat conceptual for consumers. However, it does show a relative point on a sliding scale of ‘good’ and ‘poor’ energy efficiency performance.
Environmental Impact Rating (EIR)
Low
Most consumers do not have a tangible concept of carbon emissions, although the rating does show a relative point on a sliding scale of ‘good’ and ‘poor’ environmental performance.
Primary energy indicator
Low
Primary energy is likely to be an unfamiliar concept for most consumers. It does not correspond directly to people’s actual energy bills despite incorporating ‘kWh’, which could cause confusion.
Running costs
High
Likely to be one of the most important, and tangible, indicators for consumers.
Savings (from recommended measures)
High
Likely to be one of the most important, and tangible, indicators for consumers.
Recommended measures capital cost
High
Consumers may not otherwise have an idea of relative costs of improvement measures prior to seeking their own quotes for work.
Emissions from the home
Low
Most consumers do not have a tangible concept of carbon emissions.
Space heating demand (Heat Retention Metric)
Medium
Allows users to see a breakdown of energy by end use (i.e. space heating). Some people may not readily relate to it being expressed in ‘kWh’.
Water heating demand
Medium
Allows users to see a breakdown of energy by end use (i.e. water heating). Some people may not readily relate to it being expressed in ‘kWh’.
Table 2: Ranking of EPC outputs according to their likely importance to end users in retrofit decision making
Simple cost-based metrics are more likely to be easily understood by consumers and are therefore more likely to contribute to retrofit decision making. This includes running costs and cost savings from potential retrofit measures. Energy assessors, consultants or other professionals in the sector may see value in the other metrics, but feedback suggests these are of less use to households. Furthermore, the concept of carbon emissions is identified in the above reference sources as not being tangible for most consumers, despite national policy striving for ‘net zero’.
Review of existing interactive home energy advice tools
Numerous tools are available, beyond a traditional RdSAP calculation, that offer EPC-type outputs to users with a level of interactivity/customisation. A selection of these tools were reviewed for this study to consider the possible forms a Scottish EPC user interface could take. Tools were identified using web searches and the knowledge of the research team. Criteria for inclusion included:
A domestic/ housing focus
An aspect of interactivity/customisation
Outputs similar in nature to those on an EPC (e.g. energy use, cost, retrofit recommendations)
Six tools were then selected for more detailed investigation. Selection criteria included:
Sufficient information available so they could be assessed for this research
Tools offering differing levels of interactivity/customisation
Limiting duplication of tools created by a single organisation, unless they offered something distinctly different from one another
Inclusion of a commercial/ portfolio assessment tool
We assessed outputs provided by each tool and the customisable inputs they request from users. These are summarised in Table 5 and Table 6 respectively, in Appendix A, alongside the outputs and inputs discussed earlier for EPCs. For the latter, the potential inputs are those of the RdSAP Green Deal Occupancy Assessment, which is taken as a baseline for calculation customisation potential.
It is apparent that many consumer-facing tools are based on a limited number of calculation engines. The Energy Saving Trust (EST) engine and the Parity Projects/ Core Logic engine appear to be popular options underpinning branded tools. These front-end tools may offer slight variations in presentation or user functionality, but they draw on the same foundational data and calculation approach. All tools rely on an underlying RdSAP calculation engine to generate outputs. However, they do not offer the full functionality of RdSAP to be customised, instead utilising many assumptions and generalisations. Most tools use at least some EPC data (from the EPC register) to pre-populate information for calculations.
Tools typically offer one or more of the following levels of interactivity/customisation:
Ability to toggle potential retrofit measures on or off and assess impacts/ benefits
Ability to make simple updates to property data (compared to that held on EPC), e.g. if insulation or new windows have been installed. Some also ask if there is space to facilitate renewable energy systems
Ability to provide basic contextual or occupancy information (some tools will typically progress with assumptions if users do not wish to provide customised information e.g., number of occupants, typical living room set point temperature, when people are typically at home)
Ability to provide more detailed contextual or occupancy information (again, some tools will typically progress with assumptions if users do not wish to provide customise information e.g., number of baths and showers taken per week, actual energy use totals from bills)
Many tools also offer further interactivity that does not relate to the calculations process but provides users with additional information. Examples include click-through links providing:
Specific information about retrofit measures
Information about potential funding or finance options
Links to trusted trades or advisory services (e.g., TrustMark, one-stop-shops)
Links to professional whole house retrofit plan or Retrofit Coordination services
It was noted in discussions with NEF that consumers often feedback that they are not confident translating a retrofit plan into action. There is apparently often distrust of trades/ contractors. Qualitative information such as that above may help households build confidence to take plans forward.
None of the consumer-facing tools reviewed allows for customisation to the same extent as the GDOA tool. The EST/ Home Energy Scotland tool provided the widest range of user customisation options. From discussions with a selection of tool owners, their user testing and feedback has identified a need for relative simplicity. It is assumed that this reasoning has also been applied to other tools, as they often offer similar functionality.
All the reviewed tools focus on the outputs expected to be of most value to consumers, as noted in section 5.1.4. These include running costs, cost savings from measures and the expected capital cost of retrofit measures. Most tools also report associated carbon emissions. However, despite this alignment in key outputs, the extent to which inputs can be customised varies across tools. It may be expected that outputs based on more extensive customisation will be more representative of a user’s actual circumstances. It is relatively unlikely that users will have an appreciation of this though, since they may only ever interact with one tool. All tools evidently have their place in the market, though it is very difficult to accurately assess their respective ‘success’ (i.e. the extent to which they encourage homeowners to undertake retrofit). Some commentary is offered in relation to specific tools below.
A consistent aspect of functionality offered across all tools is the ability to update whether some building elements have already been enhanced. They all also offer the option to select different potential retrofit measures to form a tailored retrofit plan. It should be noted however, that these outputs are not equivalent to a ‘whole house retrofit plan’ as defined by the PAS 2035 framework (BSI, 2023). These aspects of interactivity can help consumers consider the impacts of certain retrofit options and thus they can provide a useful step beyond a traditional ‘static’ EPC. It may be inferred that these are the aspects of most value to consumers, and there is perhaps less focus on perceived ‘accuracy’ of further customisation. Some aspects of the reviewed tools are discussed in more detail below.
UK Government ‘Find ways to save energy’ tool
This tool is owned by the Department for Energy Security and Net Zero (DESNZ). It uses an RdSAP engine hosted by BRE that implements selected parts of the GDOA. It includes default assumptions being made for parts of the GDOA that users are not asked to customise. DESNZ have indicated in discussions that user testing and consumer feedback has shaped the current functionality of the tool. For example, an earlier release of the tool included more customisation questions. However, these were removed as they led to high levels of user ‘drop out’ associated with those questions (i.e. users exited the online tool without completing beyond certain questions). Additional feedback suggests that a minority of users (estimated ~10%) would like more detail than the tool currently offers. DESNZ are exploring options for potential future updates.
EST engine backed tools
Three different tools were reviewed that utilise EST’s calculation engine:
Home energy check (branded as Home Energy Scotland)
Go renewable tool, developed with the Microgeneration Certification Scheme (MCS)
The Snugg Plan Builder (an example with a custom branded front end)
Each offers slightly different functionality and very different user interfaces. For example, the Home Energy Scotland tool does not directly link with the EPC register. However, users are encouraged to obtain their EPC information (from the register if not readily available) to aid answering questions. The Go renewable tool, as the name suggests, focusses on advising on renewable energy systems. It also gives recommendations on basic fabric efficiency measures that should ideally be carried out in conjunction with certain renewables.
Go Renewable and the Snugg Plan Builder each introduce some novel output metrics. Go Renewable offers a ‘heating system running cost metric’, which allows different heating system options to be directly compared. The Snugg tool features a metric on the potential income from a PV system (based on the Smart Export Guarantee). It also estimates a potential increase in property value increase resulting from installing retrofit measures. ‘Savings’ metrics may not motivate landlords or people that do not expect to stay in a home that long. However, metrics linked to property value may be an alternative motivator for such users.
Parity Project/ Core Logic ‘EcoRefurb’ tool
EcoRefurb is part of the Core Logic ‘Plan Builder’ suite of tools. It is an example of a branded front-end tool that uses the underlying Core Logic engine. According to the developers, user testing shaped the development of both inputs and outputs within the tool. One key aspect they identified as important was the provision more customised measure recommendation costs for users. Very few users apparently fed back that they would like to get into more detail in the initial assessment. More detail may be customised in the Plan Builder tool Core Logic provide to Retrofit Coordinators (similar to that in the GDOA) however, this was not reviewed during this study.
IRT ‘DREam’ stock assessment tool
Stock-level assessment tools were also considered during this study, although it is acknowledged that householders are not their target end users. The IRT tool is one such example intended for housing providers[4] (e.g. social landlords) to assess potential retrofit options at a stock level. Customisation typically focuses on filling data gaps where individual property surveys or EPCs have not been conducted. They also allow updated information to be input, based on maintenance records for example, to provide updated energy data for properties. A key feature of the DREam tool is that it integrates a map function and can overlay areas by index of multiple deprivation for example. It also provides comparisons of funding options that may support housing providers to deliver area based retrofit schemes. Understandably, occupancy-based customisation is not a focus of tools such as this. However, the property information updating and measures toggling functions are evidently important interactive outputs for the tool’s target audience.
Discussion: Levels of interactivity
Three broad levels of interactivity (simple, medium and detailed) are identified here for potential application to the existing EPC, for consideration by the Scottish Government. These levels reflect the functionality of the calculation tools that underpin an EPC and the capabilities of other existing interactive ‘energy advice’ tools that have been reviewed. This also assumes that data from the non-public version of the Scottish EPC register is sufficient to recreate a new RdSAP 2012 calculation for a dwelling.
Simple interaction
This is characterised as interaction that requires no new user data to be input and no calculation engine. Examples of potential functionality could include:
The ability to provide switchable, customised or simplified views for data for different types of user via an online interface. For example, more detailed EPC information could be accessible by professionals, while only key outputs may be required by households, with options to switch between views.
Click-through links signposting users to further information – such as details about measures or funding, links to trusted tradespeople or advisory services, etc.
Medium interaction
At this level, no new data inputs are required from users, but an RdSAP calculation engine would be needed to support provision of increased interactivity. Examples of potential functionality could include:
Allowing users to select their own potential retrofit measures, providing tailored cost savings for different retrofit approaches or combinations of measures (rather than a fixed sequence as per the current EPC methodology).
Enabling potential updates to property information where retrofit measures have already been installed.
Incorporating updated fuel costs sourced from the latest version of the PCDB.
Detailed interaction
Here it is assumed that a calculation engine is capable of incorporating customised user inputs to inform updated outputs. (All of the medium interaction functions above should also be possible at this level.) Examples of potential customisation could include updating with:
Actual household fuel costs and standing charges.
Actual number of occupants.
Actual living room temperature set points, heating schedules.
Actual number of baths or showers taken per day by household.
Section 6 discusses the ease with which data inputs may be sourced. It highlights that there may be a sliding scale of complexity of customisation at the ‘detailed’ level.
Implications related to RdSAP 10 and the Home Energy Model (HEM)
Data currently held on the Scottish EPC Register will have been created using the RdSAP 2012 software version. Reusing this data to re-run a new RdSAP calculation will therefore be more straightforward with an RdSAP 2012 engine. This is subject to confirmation that data held in the non-public version of the register is an appropriate format.
An updated version of the software, RdSAP 10, is currently in development. The ‘full’ version of SAP 10 has been in use since 2022 for newly built homes. It introduces several updates, related to heat pumps and introduces battery storage into calculations.
Translation of existing EPC Register data (created under RdSAP 2012) for use with a newer SAP engine such as the proposed RdSAP 10 would be more complex. Additional assumptions would need to be added alongside the original data from the EPC register. Furthermore, there is also no GDOA implementation in RdSAP 10 (i.e. customisation of occupancy parameters), so a further exercise would be required to replicate this functionality. However, moving to an RdSAP 10 engine would bring any new tool in line with the most current calculations, based on updated research.
The Home Energy Model (HEM) is a new calculation methodology that will eventually replace SAP and RdSAP. A key change in this approach is that calculations will be performed with much finer time resolution. While existing SAP and RdSAP calculations consider a monthly timestep, HEM utilises a 30-minute resolution. This is expected to better-represent heating demands, energy storage and demand flexibility potential for example.
HEM is based on a fundamentally different underpinning architecture compared to SAP. It will use ‘wrappers’ to assess different use cases, with each wrapper defining inputs and outputs that are processed by the core HEM model. One such wrapper will support the Future Homes Standard (FHS). In this context, key changes to modelling assumptions are expected compared to SAP. For example, assumptions about occupancy being linked to floor area (as in SAP) to being based on the number of bedrooms in a property. These changes reflect evolving consumer behaviours and systems operation patterns, highlighting further divergence from the assumptions used in SAP 10.
HEM will undoubtedly offer additional functionality compared to SAP, along with the ability to assess certain technologies more effectively due to its increased granularity. Some innovators, such as City Science and Furbnow, are already attempting to link existing home energy assessments to HEM. Both have undertaken projects in this space with the support of Innovate UK. However, during presentations at the Innovate UK ‘Net Zero Heat Open Day’ both organisations reported that additional input data, gathered from surveys and/or monitoring, is needed to achieve this (UKRI, 2024). That being the case, it seems unlikely that data from the existing EPC register could readily be aligned with HEM. Exploring the effort likely required in achieving this was beyond the scope of this study.
Data collection/ input methods and limitations
Review of potential data sources
A number of potentially customisable data inputs were identified in section 5.1.2.[5] This section explores ways such data may be sourced and/ or physically input into a tool (e.g., automated versus manual methods). While several theoretical options have been explored, the likelihood of some such information being available/ usable short term is low.
Table 7 in Appendix A gives an overview of relevant data input options that were identified during this study. Each input method was qualitatively assessed, based on the research team’s judgement, on a ‘high, medium, or low’ scale against the following parameters:
The ease of data input for the user
Likely reliability of the information
Likelihood of an information source to be available in the short-to-medium term
The rankings were assigned a score (High = 3, Medium = 2, Low = 1). These were summed to provide an overall current ‘readiness’ metric (scored out of 9).
Manual data entry approaches
Manual approaches rely on households obtaining data from existing sources (such as energy bills) or simply recalling their comfort/ heating preferences (e.g. temperature set points and heating patterns). Users will also readily know how many occupants are typically in the house.
The current readiness score of some manual inputs reflects the potential risk of reduced reliability when households need to consider typical conditions over a whole year. For example, if users never adjust temperature set points on their thermostats, reliability of temperature inputs may be high. This may also be the case if they never adjust programmed heating patterns. However, users are unlikely to take account of incidental day-to-day or seasonal adjustments made outside the normal programming. It is also unlikely that households would consistently track their average number of baths and showers per day for a whole year. A best estimate based on typical patterns seems far more likely. Reliability of some inputs may therefore be low when it depends on household recollection rather than on actual recorded data.
Automated data entry approaches
Automated methods range from updating information from the PCDB through to potentially obtaining data from internet of things smart devices. Fuel prices and standing charges could be taken from the most recent version of the PCDB. There are artificial intelligence (AI) tools that exist (generally intended for businesses) that can extract information from digital energy bills. However, for individual households, such tools are unlikely to be warranted since the information could manually be obtained relatively easily. Smart sensors include motion detectors (inferring occupancy), shower sensors, thermostats and programmers. All of these devices may theoretically be able to track and log conditions and output household data.
Note that there is currently no function or API (Application Programming Interface) to import external data sources into an RdSAP calculation. SAP calculations call on data held in the PCDB, but this database is updated periodically and not accessed ‘live’. The automated transfer of data is therefore an aspect that would need to be developed, if such functionality were desired. Subsequently, any proprietary sources of data (e.g. from consumer apps) would need to be collated and formatted accordingly to feed into SAP. It is assumed that users would be unlikely to manually process such data themselves if it were not automatically formatted and exported.
Automated methods therefore tend to score less highly than equivalent manual methods in the combined readiness metric. They score highly with respect to the ease of data input for the user and many provide inherently reliable data. However, they score low on the short-term likelihood for such automated functionality to be available. Fuel prices updated automatically from the PCDB are assumed to be less reliable than actual data from household bills due to averaging. However, the relative ease of implementing such an update still gives a high overall readiness score (8 out of 9).
Discussion of external temperature data
The RdSAP calculation utilises climate data broken down into 21 UK regions. These include assumptions for monthly average external temperatures. It is possible that some users may question whether the granularity of these climate zones is representative of their local conditions. However, it is quite likely that most users would not have the necessary awareness to challenge the relative accuracy of the climate data used.
Monthly temperature data is available from the MET office (the source of the current RdSAP climate data) at a resolution of 2km. This is a far higher resolution than the 21 UK regions. The format is essentially the same as is used in an RdSAP calculation. However, it would require reasonable effort (and signposting) for users to obtain this data manually and enter it into a user interface. As discussed above for automated methods, there is currently no function for new data to be imported into RdSAP. This would need to be specifically developed to automate the input of new, more granular external temperature data.
Something of potential interest to users and the Scottish Government is that the MET Office also provide ‘future climate scenario’ data sets. If incorporated into an RdSAP calculation, it would be possible to see the impact of changing climate conditions on key outputs and recommendations. Granularity varies depending on the type of climate predictions offered. For example, monthly average temperature predictions against the highest emission scenario (RCP8.5) are projected at a 12km scale. Import of such data to RdSAP would face the same challenges as other updated MET Office data noted above.
Varying interactivity options for outputs
Table 3 shows the outputs assessed as being of highest importance to consumers[6] alongside the relevant potentially customisable inputs. ‘Emissions from the home’ is also included, since the policy focus of retrofit is ultimately on achieving net zero emissions. Both a ‘medium interaction’ and ‘detailed interaction’ version (as per section 5.3) is included where such options exist. Note the medium interaction would require a SAP calculation engine but no new user input, instead using updated information from the PCDB or elsewhere. The highest ‘readiness’ levels determined for each of the data inputs is presented in the table.
EPC output
Fuel prices
Fuel standing charge
Capital cost of retrofit measure
Number of occupants
Main temp set point
Heating pattern timings
Partially heated rooms
Number of baths & showers per day
External temp
Running costs (medium interaction)
8
8
Running cost (detailed interaction)
9
9
9
7
7
7
6
7
Running cost savings (medium interaction)
8
Running cost savings (detailed interaction)
9
9
7
7
7
6
7
Measures capital cost (medium or detailed)
7
Emissions from the home (detailed interaction)
9
7
7
7
6
7
Table 3: Highest ‘readiness level’ of data inputs that may be customised for EPC outputs (at varying levels of interaction)
While some outputs in Table 3 have several potentially customisable inputs, not all may necessarily be customised. The example tools reviewed in section 5.2 implement different customisable inputs yet deliver essentially equivalent outputs. The inputs therefore represent a sliding scale of potential customisation.
Users may find it quite easy to customise one or two inputs with a high-scoring readiness indicator. Meanwhile, a more bespoke version of the same outputs may be possible, but the ease with which the data may be reliably obtained may be lower. This creates a potential risk of dubious accuracy; an output may seem to be accurate since it is based on multiple user customised variables. However, those variable values themselves may be inaccurate or unreliable, thus reducing the overall representativeness of the output. A sensitivity analysis on this phenomenon is unfortunately beyond the scope of this present study.
Absolute accuracy may not in fact be so relevant for an interactive tool intended to aid retrofit decision making. Pre- and post- retrofit energy performance of homes is relative; after all, many variables out of a user’s control influence energy consumption and cost over a given year. (e.g. external climate, energy price changes, varying household needs.) Providing sufficient interaction/ customisation for end users to feel that outputs are relevant to them is likely to be most important. The ability to update information from a ‘static’ EPC to reflect changes that have already taken place will likely be key. The ability to toggle retrofit measures selection will give users a sense of choice and control. Other input variables may be of more or less interest to users depending on how far they feel their behaviours are from ‘typical’. Households that align with these national trends may see little variation in customised calculations compared to default calculations. It is only when household characteristics are quite different from national trends that it may make notable differences to retrofit recommendations.
Evidence of intended outcomes
We looked for evidence that directly linked the use of interactive tools to the initiation of retrofit measures. Information was also sought on whether different types of interaction or customisation were more likely to prompt household decision making. A desk-based evidence review sought information from academic articles and grey literature. A selection of search terms were initially used, as detailed in Appendix B. These were expanded upon as other terms and concepts were identified in the reviewed sources.
In addition, advisors from NEF provided general feedback based on their experiences of directly supporting consumers with retrofit projects and administering grants.
Feedback related to the use of existing interactive energy advice tools, such as those discussed earlier, was also explored. This was primarily via online sources, though interviews were conducted with tool developers where possible. DESNZ (as owners of the UK Government ‘Find ways to save energy’ tool) and Core Logic (EcoRefurb tool) provided direct feedback on their respective tools.
The evidence review was widened to ‘relatable activities’ when it became clear that limited information was available on interactive tools and retrofit. Relatable activities were defined as those in which the provision of some form of customised information prompted behavioural change. The scope was limited to households and housing, and to at least energy-related behaviours, if not retrofit specifically. This broader search was not exhaustive but was intended to provide indicative context relevant to the primary concept.
Review of literature
Many sources suggest there is a need for interactivity and customisation of EPCs, with inference that this could promote the uptake of retrofit measures. However, no evidence was identified in the literature review to confirm that interactive tools would, or have directly, prompted retrofit actions. Nor did the literature review indicate what level of interaction or customisation might be more likely to prompt households to undertake retrofit.
Several EU research projects have explored ways that EPCs could be improved to better-serve various end uses (e.g. U-CERT, D2EPC, X-Tendo, CHRONICLE, EDYCE, Smart living EPC). U-CERT produced an extensive series of recommendations for EPCs (Bančič, Vetršek, and Podjed, 2021). This followed interviews and focus groups with different types of potential EPC users across 11 participating EU countries. Some recommendations related to improved granularity of calculations and reducing the ‘performance gap’ by using dynamic simulation and the use of measured data. However, many specifically focus on helping users better understanding energy use and prompting retrofit action. Several of these are also recognised in other sources (discussed below).
Example recommendations include:
Focus on cost-based metrics, as these are most tangible for users
Offer interactivity to make the information relevant to a user’s own circumstances and context
Provide different views tailored to the needs and knowledge levels of various users:
(a) non-professional users, for buying and selling properties, for energy management, and for retrofit recommendations.
(b) Professionals and more advanced users with more detail and technically specific data.
Digitalisation offers the potential for a ‘modular’ approach from basic to expert with options according to user interests
Explain the context of assumptions, so users understand if their patterns are likely to be different to what is assumed
Various studies have investigated the extent to which current static EPCs motivate users to retrofit. A recent study by Which? (2024) indicated that EPCs are rarely used to inform renovation decisions. Users instead rely on advice from builders or their intuition. The study suggests that the current format of EPCs does not effectively encourage homeowners carry out energy efficient home improvements, nor does it meaningfully guide their choice of measures.
The D2EPC research study found that less than 5% of end users were motivated to retrofit because of their EPC (Panteli and Duri, 2021). At least half of those surveyed were also not convinced that their EPC accurately represented their building’s energy efficiency. A Barclays/ Ipsos survey (Barclays, 2023) suggests that over half of homeowners do not feel confident making homes more energy efficient. A further study (Hiscox, 2018) indicates that a third of those surveyed renovated to keep up with current trends rather than for functional reasons.
The U-CERT and Which? studies indicate there is a need to update an EPC so they can still be relevant if some changes/ improvements are made. Otherwise they are readily obsolete (Bančič, Vetršek, and Podjed, 2021; Which?, 2024). The Which? study also states that EPC recommendations are too rigid, presented in a specific order rather than tailored to household priorities and budgets. This need for greater flexibility was echoed in discussions with Retrofit Coordinators at NEF who work directly with consumers. They observe that many households are favouring less disruptive, less risky technologies, rather than deep energy efficiency retrofit measures. App-linked technologies also gaining popularity, raising people’s interest in things like heat pumps, PV and battery storage.
This supports a case for savings forecasting across a flexible sequence of measures, rather than the pre-defined order used in EPCs. However, NEF note the importance of linked guidance (i.e. simple interactivity) on risks and implications of implementing measures outside a validated sequence. They advocate the role of Retrofit Coordinators in developing whole house retrofit plans to help households avoid unintended consequences. The U-CERT recommendations similarly stress the value of contextual information and guidance alongside an EPC (Bančič, Vetršek, and Podjed, 2021).
The majority of reviewed literature generally supported the concept of interactivity for EPCs. However, in the experience of innovators ‘Furbnow’ (UKRI, 2024), some users were not confident in entering property data in EPC tools. For this study, we recognise that there is a risk that too much complexity could deter users. Simpler interactivity may therefore be preferable.
Review of relatable activities
The literature review was widened to ‘relatable activities’ based on the research team’s experiences in the energy and retrofit sector. This included exploring links between interactive outputs and intended behavioural change on retrofit plans, smart meters and green finance (for retrofit). Reviewing these relatable activities provided some evidence that customised and/ or interactive information can prompt intended behavioural change among households.
Retrofit plans
Retrofit plans are bespoke reports intended to guide owners on how to retrofit their homes. These follow the principle of considering the individual context of a retrofit, (e.g. user influence), i.e. they include customised recommendations. Building Passport trials (including renovation plans) have been in place for a number of years in several countries and have also been the subject of previous ClimateXChange research (Small-Warner & Sinclair, 2022). Despite this, no quantitative evidence was found that their implementation increases retrofit uptake. Only circumstantial evidence of ‘intent’ from end users was given, suggesting likely future uptake of measures. In other words, it is not currently possible to directly link the implementation of renovation plans in Building Passports to a measurable increase in retrofit.
In the iBroad project trial, the majority of respondents agreed that a renovation roadmap enables and motivates them to undertake retrofit measures (Irish Green Building Council (IGBC), 2020). Similarly, 63% of experts surveyed for the follow-up iBroad2EPC project believed that tool would motivate homeowners to renovate (Mellwig, Maiwald, and Pehnt, 2024).
It was observed that renovation plans implemented in EU countries generally follow national policy by prioritising energy efficiency recommendations before renewable energy measures (Enefirst, no date). This is similar to the current approach taken in UK EPCs. As implemented, these plans do not necessarily provide the flexibility called for in many discussions of EPC reform. They are however, tailored to personal circumstances based on assessor expertise.
Smart meters
Smart meters serve multiple purposes. These include accurate billing, supporting the use of flexible tariffs, and improving visibility of the granularity of energy use at a local and national level. Alongside in-home displays, smart meters provide information that can help households to understand and potentially reduce their energy use.
A study for Smart Energy GB (Populus, 2019) found that consumers with smart meters report a higher number of energy saving activities than non-users. These activities increased over time with continued active smart meter use. There were also increased levels of behavioural change, such as buying more efficient appliances and implementing energy saving habits. Smart meters also enabled people to take part in flexibility and Time of Use activities to save money. These benefits are attributed to the in-home display showing energy use in near real time. This tailored, real-time information was reported to aid users in identifying energy usage and making more informed decisions to reduce usage.
These findings are supported by several other studies, some of which highlight the importance of displaying data in terms of cost to make it more relatable to users. (Darby et al, 2015, National Centre for Social Research (NatCen), 2022, Marshall Cross et al, 2019).
Detailed data (i.e., at appliance level information) was found to be most useful and persuasive for end users. For example, Scottish Power data analysis of interactive app users suggests a 5% energy saving compared to non-users. This is attributed to the more detailed breakdown of energy use, which raises awareness among householders and prompts action (Scottish Power, no date).
These findings support the concept that the provision of bespoke, time-relevant and cost-based data can encourage behavioural change. This may be likened to the customisation of an EPC providing up to date cost saving measures recommendations. Similar behavioural motivations may therefore be experienced as has been seen with smart meters.
Green finance mechanisms
Green finance (i.e., lending that supports environmentally-friendly activities) has been briefly explored as a behavioural incentive for retrofit. Data from Knight Frank for example supports the view that users value properties with higher EPC ratings (Knight, 2022). As such, retrofit measures that improve an EPC could increase property value. While this does not directly relate to interactivity, introducing interactivity or customised elements to EPCs that link recommendations to potential increases in property value could help promote behavioural change towards retrofit. This may be particularly motivating for landlords or individuals that do not expect to stay in a property long term, for whom typical ‘savings’-based motivators may be of little interest. The Snugg/ EST tool mentioned in section 5.2.2 includes an assessment on post retrofit property value.
Review of existing tools
No direct evidence was found to indicate whether simpler versus more detailed interaction and customisation is more likely to prompt households to undertake retrofit. As discussed earlier, many of the existing advice tools reviewed for this study offer limited level of customisation features. Circumstantially, this supports the idea that a modest spectrum of interactivity and customisation may be sufficient to motivate consumers. It is noteworthy that many consumer-targeted energy advice tools ultimately refer users to a professional service, where more detail can be explored. Such tools therefore appear to be primarily intended as a mechanism to motivate households onto the next step on a retrofit journey.
Direct feedback was obtained via interview by DESNZ regarding the UK Government’s ‘Find ways to save energy’ tool. This is only an advice tool and is not formal linked to any retrofit delivery schemes. As such, DESNZ are unable to track a ‘success rate’ for how many users of the tool convert to actually implementing a retrofit.
Additional feedback was gathered by interview with product developers Core Logic regarding their EcoRefurb tool. Core Logic advise that it is a free online tool to give consumers an idea of the retrofit options that may be suitable for their home. Users are then encouraged to develop a more detailed Whole House Plan with a Retrofit Coordinator. The developer reports that around 50% of users that submit a plan via the free tool go on to obtain a Whole House Plan. They consider this a good uptake rate.
By the time that consumers engage with professionals, they are reportedly well-informed and have a clear idea of the improvements they wish to pursue. However, from this point, it can sometimes take a year or more for households to instigate measures. A similar observation was also shared by NEF, who noted that households may need to save up for works or may choose to align with wider home renovation activities.
Conclusions and recommendations
Our research finds that cost-based metrics are most tangible and motivating to end users. The following EPC outputs are likely to be the most worthwhile focus for any proposed interactivity or customisation:
Running costs
Running cost savings
Retrofit measures capital costs
We identified three potential levels of interactivity (Table 4) for the Scottish Government to consider implementing in relation to EPCs.
Level of interaction
New user data required?
Integration with calculation engine required?
Example functionality provided
Simple
No
No
Customised/ simplified views
Click-through signposting to further information
Medium
No
Yes
Update with already-completed retrofit measures
Select own retrofit measures and sequence
Running costs updated by calling on updated cost information from the PCDB
Detailed
Yes
Yes
As per Medium interaction, plus:
Manual user inputs. (Automated inputs currently limited by a lack of import functionality into RdSAP)
More tailored versions of outputs by allowing more customisable inputs
Table 4: Potential levels of interactivity for EPCs
We did not find direct evidence to support whether simpler versus more detailed interaction or customisation is more likely to prompt households to retrofit. However, there appears to be significant demand from professionals and consumers for interactivity and customisation of EPCs. Additionally, there is relatable evidence from the use of smart meters, retrofit plans and from green lending that the provision of tailored information to households can prompt behavioural change. Offering households some level of interactivity alongside a traditional ‘static’ EPC could be beneficial.
All pf the tools reviewed in this study include the ability to update and toggle retrofit measures, addressing the call for increased flexibility in EPCs identified in the literature review. User testing and feedback from energy advice tool providers suggest that most existing tools offer a relatively limited degree of customisation. Circumstantially, this supports the notion that a modest level of customisation may represent the upper limit to what users are willing to engage with.
Many existing energy advice tools operate at the medium interaction level. There can be a sliding scale of complexity of customisation at the ‘detailed’ level. Importantly, greater customisation of inputs does not necessarily make the outputs more accurate, since confidence in various data inputs may be variable. The option to offer various customised or switchable views or functions for different users may help simplify an interactive EPC experience if necessary. For example, users could switch between ‘simple’ and ‘medium’ interaction views for users that do not wish to enter detailed personalised inputs.
At any level of customisation, it will be necessary to inform tool users that outputs are ultimately estimates. Actual energy use and costs will inevitably be influenced by a range of other factors e.g. annual climate severity, changing fuel prices, and changes in household circumstances, etc.
The implementation process may be more complicated depending on what version of SAP is targeted for use. RdSAP 2012 is the version used to create the EPCs currently on the register. Translation of existing EPC register data to use the newer RdSAP 10 engine would be more complex. It would also require some assumptions to be added alongside the original data from the EPC register. A move to align to RdSAP 10 would however bring the tool in line with a number of updated calculation assumptions. Moreover, the effort required to align with a HEM calculation has not been explored, though it is noted that the mechanics of HEM fundamentally differ from SAP. Considerable effort would be required by numerous parties to unlock the automated input of data i.e. an RdSAP tool provider (working on behalf of the Scottish Government) and proprietary software or app providers collecting user data.
Existing tools already deliver energy advice to households with varying degrees of interactivity and customisation. Therefore, rather than developing a new tool, the Scottish Government could consider whether a branded or adapted version of an existing tool may deliver a suitable service.
Opportunities and challenges of implementation
Interactive functionality has the potential to support the promotion of both energy efficiency measures and clean heating systems. There is clear scope to improve alignment with current Scottish Government policies on clean heat, particularly when compared to the limitations with existing EPCs. Currently, EPCs do not provide running cost or savings estimates for fuels types other than those currently used in the home. However, this functionality could potentially be introduced.
The Scottish Government will need to consider whether, and, how it wishes to support recommendations that involve the continued use of fossil-based systems. An interface could, in theory, be designed to present recommendations prioritised either for carbon savings or cost savings. Some of the tools reviewed for this study allow users to express their preference, which can subsequently influence the prioritisation of retrofit measures. The Scottish Government could choose to prioritise carbon savings in order to align with its ‘net zero’ policy. However, this may not align with the approach preferred by all households. Consideration of potential fuel poverty risks will also be needed.
Clean heat measures implemented in isolation from wider energy efficiency measures could lead to increased running costs for some users. However, the likelihood of this is reduced where heat pumps are adopted and appropriately installed (EST, no date, National Energy Association (NEA), 2022). Any changes in running costs should be clearly reflected in tool outputs to support informed decision making. However, this would stray from the current approach to retrofit recommendations on an existing EPC. These are prioritised ‘fabric-first’, and only those that would provide running cost savings are included.
Providing flexibility in how retrofit measures are recommended on an interactive EPC would likely be welcomed by users. However, this flexibility also introduces risks if retrofit measures are actioned without due consideration of wider property factors. For example, improving insulation and airtightness without adequate ventilation can lead to moisture build-up, which poses health risks due to damp and mould, and in some cases, structural damage (May and Griffiths, 2015). To mitigate this, linked guidance would be advisable where users have unlimited flexibility when selecting retrofit options. This would help prevent unintended consequences.
It is noted that the Scottish Government’s consultation for the Heat in Buildings Bill proposed a Heat and Energy Efficiency Technical Suitability Assessment (HEETSA) (Scottish Government, 2023). This is expected to offer a more tailored assessment of the suitability of retrofit than a standard EPC. If implemented, a HEETSA could play a role in reducing the risk of adverse outcomes from retrofit measures.
The provision of guidance and signposting (i.e., simple interactivity) may be a more user preferable and transparent alternative to policy-driven functionality. Users may lose trust in a tool if they feel the outputs are not aligned with their personal motivations. Conversely, they may value clear and candid advice, including information about potential risks, to support informed decision making.
Consideration may also need to be given to the skills and capacity of the retrofit delivery sector when designing an interactive tool. If the service proves very successful, an upturn in retrofit measures may be expected, which may outstrip local supply. Anonymously tracking the types of recommendations typically taken through to household retrofit plans could help identify potential capacity gaps within the delivery sector.
References
(All web references last accessed 18 February 2025)
BSI. (2023) PAS 2035:2023. Retrofitting dwellings for improved energy efficiency – Specification and guidance. Published on behalf of DESNZ by British Standards Institution.
National Energy Action (NEA). (2022) Making heat pumps work for fuel-poor households. Common challenges and top tips for overcoming them. Available at: https://www.nea. org.uk/wp-content/uploads/2023/02/Installing-heat-pumps-for-fuel-poor-households-landscape.pdf
Custom selection of retrofit measures for consideration
Energy Efficiency Rating (EER)/ Energy Cost Rating
Environmental Impact Rating (EIR)
Primary energy indicator
Running costs
Total running cost savings
Cost savings per retrofit measure
Recommended measures capital cost
Emissions from the home
Space heating demand/ Heat retention metric
Water heating demand
Total energy use
Heating system running costs
PV generation potential
Income from PV
Property value increase
EPC
X
X
X
X
X
X
X
X
X
X
X
Find ways to save energy (UK Gov)
X
X
X
X
Go Renewable (EST/MCS)
X
X
X
X
X
X
X
Home Energy Check (EST)
X
X
X
X
X
X
X
Snugg Plan Builder (EST)
X
X
X
X
X
X
EcoRefurb (CoreLogic)
X
X
X
X
X
DREam (IRT)
X
X
X
X
X
X
X
X
Table 5: Summary of outputs of existing interactive home energy advice tools, compared to EPCs
Inputs
Update property info, including completed retrofit measures
Number of occupants
Living room temperature set point
Heating pattern on/off times
Fuel prices & standing charges
Number of baths or showers taken per day
Any unheated or partially heated rooms
Types of appliances present
Fuel bill reconciliation function
Space around home for renewables
RdSAP GDOA
X
X
X
X
X
X
X
X
X
X
Find ways to save energy (UK Gov)
X
X
X
X
X
Go Renewables (EST/MCS)
X
X
X
X
Home Energy Check (EST)
X
X
X
X
X
X
Snugg Plan Builder (EST)
X
X
X
X
EcoRefurb (CoreLogic)
X
X
DREam (IRT)
X
Table 6: Summary of customisable inputs of existing interactive home energy advice tools, compared with GDOA
Data input
Potential data collection/ input methods
Manual or automated?
Already on EPC register or PCDB? Y/N
Ease of data input for user HML
Likely reliability of data HML
Likelihood of availability (short-mid term) HML
Overall ‘readiness’ score
Notes
Fuel prices and standing charges
Actuals from recent fuel bills
Manual
No
High
High
High
9
Actual fuel price information should be easy for households to extract from energy bills.
Fuel prices and standing charges
PCDB updated prices (compared to original EPC)
Automated
Yes
High
Medium
High
8
Medium reliability as will be averages (updated 6 monthly) and not necessarily reflect local actuals.
Fuel prices and standing charges
Automated data extraction from fuel bills/ meters
Automated
No
High
High
Low
7
Current Optical Character Recognition (OCR)/ Artificial Intelligence (AI) tools exist to extract data from (pdf) energy bills. (Generally used by businesses with multiple sites/ fuels). Fuel prices theoretically available from smart meter data.
Capital costs
Actuals from user quotes
Manual
Yes
Low
High
Medium
6
Households could seek their own quotes for various works. However, the EPC does not calculate payback, so there is limited incentive for users to do this until they are relatively committed to pursuing the upgrade measure.
Capital costs
From a national average source
Automated
Yes
High
Medium
Medium
7
Industry/ government sourced data. Medium reliability, since it would give national averages and may not reflect local variations.
Number of occupants
Household knowledge
Manual
No
High
High
High
9
Based on household knowledge.
Number of occupants
Sensor data, IoT
Automated
No
High
Low
Low
5
It is technically possible to infer occupancy from motion sensors. Reliability depends on type of sensors/ mode of operation. Such sensors are not common in homes. It is also likely to be unnecessarily complex for a householder-owned dwelling and too intrusive for a let property. There may be push-back from users for such sensors to be used in this way from a privacy perspective.
Number of baths or showers per day
Household tracking
Manual
No
Medium
Medium
Medium
6
Households are likely to estimate typical number of showers or baths, rather than actually log it (particularly if averaged over a year). Such data may therefore not be entirely accurate, but if (estimated) pattern differs from default assumptions, could be an improvement.
Number of baths or showers per day
Sensor data, IoT
Automated
No
High
Medium
Low
6
Shower sensors exist that extract data on number of showers and duration. However, not common technology in homes. (Note this does not cover baths, so an incomplete picture if a mix of showers and baths used in household, hence Medium ease.)
External temperature
More localised weather file (for average monthly temp)
Manual
No
Medium
High
Medium
7
Data exists, format likely to be appropriate. Medium ease and likelihood for users to go to effort to obtain it and transpose it accurately.
External temperature
More localised weather file (for average monthly temp)
Automated
No
High
High
Low
7
Data exists, format likely to be appropriate. But would need to be linked to SAP (hence Low likelihood currently).
Main temperature set point
Household input (e.g. from programmed set points)
Manual
No
High
Medium
Medium
7
Ease to input a single average value, if one were available, would be high. If users vary their set points from time to time, the input may not be entirely reliable (medium). Users are unlikely to record historic set point information (so medium availability of information).
Main temperature set point
Extracted from home automation/ smart thermostat or similar
Automated
No
High
Medium
Low
6
Smart thermostats may log temperature setpoints. Not widespread in homes, and data not standardised. Would be based on real data, but may only be from a sample period that might not represent typical seasons.
Heating pattern/ on/off times, normal day and alternative day
Household input (e.g. from programmed set points)
Manual
No
High
Medium
Medium
7
Ease to input values, if patterns can be discerned, would be high. If users vary their heating patterns from time to time, the input may not be entirely reliable (medium). Users are unlikely to record historic patterns (so medium availability of information).
Heating pattern/ on/off times, normal day and alternative day
Extracted from home automation/ smart thermostat or similar
Automated
No
High
Medium
Low
6
Data availability from sensors/ programmers varies. Not widespread in homes, and data not standardised. Would be based on real data, but may only be from a sample period that might not represent typical seasons.
Any non-heated or partial heated rooms
Household knowledge
Manual
No
High
Medium
Medium
7
Determining a typical profile if rooms are occasionally heated may be complex. Recollection of such instances over a typical year could be unreliable. Households unlikely to record this. However, if rooms are consistently unheated, it may be relatively easy to report.
Any non-heated or partial heated rooms
Extracted from home automation/ smart thermostat or similar
Automated
No
High
Medium
Low
6
Same issues as extracting heating patterns from sensors, plus would require a room-by-room assessment.
Table 7: Qualitative assessment matrix for data inputs
: Methodology
Review of existing EPCs to identify data inputs and outputs for potential interactivity
An example of the current Scottish EPC format was reviewed. Outputs relevant to end users making decisions for energy efficiency and clean heat measures were identified. The Scottish Government consultation on EPC reform was also reviewed to give insight on future changes/ additional outputs.
The SAP calculation methodology used to create EPCs (RdSAP 2012 v9.94) was interrogated to extract the input data that could be customised to create the identified outputs. This focussed on metrics for which standardised assumptions are used by default in the calculation (e.g. occupancy). The Green Deal Occupancy Assessment, as set out in Appendix V of RdSAP 2012 v9.92, was referenced to help identify contextual parameters. The ease of implementation to make each output interactive was assessed qualitatively with developers in BRE’s SAP team. This followed a ‘high, medium, low’ rating based on the following criteria:
High ease: Where an output already held on the Scottish EPC register could be adapted via a straightforward calculation (i.e. no SAP calculation engine required).
Medium ease: Where the output could be updated by implementing aspects of the GDOA as part of a new RdSAP calculation, using data held on the EPC register.
Low ease: Where customisation of metrics has not previously been implemented in an RdSAP calculation, hence more work would be required to implement.
The likely importance/ value of each output, from an end user perspective, was qualitatively assessed, again on a ‘high, medium, low’ scale. This synthesised information from several sources:
Information from literature sources (identified in subsequent tasks)
Expertise of BRE staff that work in the retrofit sector
Discussions with customer-facing practitioners from NEF
Review of existing consumer energy advice tools
Existing consumer-facing energy advice tools were identified using web searches and the knowledge of the research team. CXC had additionally cited the UK Government household energy tool and EST Renewables selector for consideration. Criteria for identifying tools included:
A domestic/ housing focus
An aspect of interactivity/ customisation
Outputs similar in nature to those shown on EPCs (i.e. energy use, cost, recommendations)
A representative selection of tools were shortlisted for more detailed investigation. Criteria for shortlisting included:
Limited duplication of tools created by a single organisation, unless they offered something distinctly different from one another (e.g. there are many tools created with the same underpinning architecture/ calculation engine by EST)
Tools offering different levels of interactivity/ customisation
Inclusion of a commercial/ portfolio assessment tool (e.g. for social landlords)
Sufficient information available on tools to allow them to be tested and explored as part of the research
Interviews were held with DESNZ and Core Logic as product owners of the ‘Find ways to save energy’ and ‘EcoRefurb’ shortlisted tools, respectively.
Relevant EU research projects (into enhanced or dynamic EPCs) were also explored. However, since the resulting tools were generally intended for use by professionals supporting households, they were not comparable to the other user-centric tools explored. They were therefore not reported alongside the other existing tools but instead informed the wider evidence review on intended outcomes.
Assessment of data collection/ sourcing methods
Methods of data collection/ input were identified using web searches. This used key words on data input sources (taken from the task described above) linked to concepts of ‘collection, data entry, data history, automation, smart’. Further methods were populated based on the research team’s own experiences and expertise in data entry and surveying for SAP/ EPCs. Novel approaches being explored by Innovate UK projects were publicised during the ‘Net Zero Heat Open Day’[7]. These were also reviewed for relevance.
Approaches were assigned as ‘manual’ versus ‘automated’ methods. It was also flagged if the data was already held on the EPC register or elsewhere linked to the creation of EPCs (e.g. the PCDB). The potential data sources/ collection methods were qualitatively appraised, based on the research team’s judgement, on a ‘high, medium, low’ scale against the following parameters:
The ease of data input for the user
Likely reliability of the information
Likelihood of an information source to be available short-mid term
Table 8 gives a practical illustration of the criteria for assigning the qualitative rating. The rankings were then assigned a score (High = 3, Medium = 2, Low = 1). These were summed to provide an overall current ‘readiness’ metric for each approach (scored out of 9).
Assessment parameter
High ease assessment criteria
Medium ease assessment criteria
Low ease assessment criteria
Ease of data input for user
Either automated, so minimal effort for user, or based on a few input parameters users are likely to readily understand.
Some tracking of household behaviours required, or users will need to seek out relatively simple data.
Difficult to identify or extract data correctly, or laborious to obtain.
Likely reliability of information
Based on real, household-specific data.
Based on real data but averaged or normalised in some way, or some other risk of error being introduced.
Accuracy of automated determination likely to be low.
Likelihood of availability short-mid term
Data currently readily available. Manual or PCDB input into (SAP) tool.
Data source exists in appropriate format, but collation effort/ processing will be required, which is likely to deter users.
Data would need to be appropriately formatted from source, SAP tools not currently capable of accepting import.
Table 8: Example criteria for assigning ‘high, medium, low’ qualitative ratings to data collection/ sourcing methods.
Identifying evidence of intended outcomes
A desk-based evidence review sought information from academic articles and grey literature. A selection of search terms used are given in Table 9. These were expanded upon as other terms and concepts were identified in the reviewed sources. Feedback linked to the example energy advice tools identified in an earlier task was also sought. This was from online sources, though additional discussions were also held with tool developers where possible. DESNZ (as owners of the UK Government ‘Find ways to save energy’ tool) and Core Logic (EcoRefurb tool) provided direct feedback on their respective tools. Additionally, advisors from NEF provided general feedback from their experiences of directly supporting consumers with retrofit projects and from administering grants.
Research was widened to ‘relatable activities’ based on the research team’s experiences in the energy and retrofit sector. The scope for this was limited to households and housing, and at least energy-related behaviours, if not retrofit. This included researching linkages between interactive outputs and intended behavioural change on smart meters, retrofit plans and green finance (for retrofit).
Energy Performance Certificate
Interactive
Building passport
EPC
User experience
(Retrofit/ Renovation) plan
Retrofit
Personal(ised)
Roadmap
(Retrofit) support
Dynamic
Behaviour change
Renovation
Customised
Consumer attitude
Smart meter
Success
Tailored advice
Table 9: Initial search terms used for evidence review (not exhaustive)
How to cite this publication:
Weeks, C. and Sinclair, C. (2025) ‘Potential for interactive EPCs for Scotland’, ClimateXChange. DOI: http://dx.doi.org/10.7488/era/6008
While every effort is made to ensure the information in this report is accurate as at the date of the report, no legal responsibility is accepted for any errors, omissions or misleading statements. The views expressed represent those of the author(s), and do not necessarily represent those of the host institutions or funders.
This work was supported by the Rural and Environment Science and Analytical Services Division of the Scottish Government (CoE–CXC).
If you require the report in an alternative format such as a Word document, please contact info@climatexchange.org.uk or 0131 651 4783.
As set out in the SAP Technical Appendix document RdSAP 2012 v9.94 (BRE, 2019) ↑
RdSAP 2012 version 9.92: Occupancy Assessment version Mar 2014. (BRE, 2014) This supported the Green Deal funding initiative (2012-2015) to ensure the cost of retrofit repayments would not exceed energy bill savings. ↑
The GDOA tool underpins the UK Government Find Ways to Save Energy tool discussed in section 5.2.1. ↑
Note that others including EST, Core Logic and BRE also provide tools for this market. ↑
Note that much innovation and research is underway into obtaining ‘real’ data for fabric performance metrics for use in SAP. For example, there are projects funded by Innovate UK exploring monitoring solutions, U-value measurement and automated thermography for fabric elements. However, inputs relating to building fabric performance and dimensioning were beyond the scope for this study. ↑
Virtually all outputs were identified as having the same ease of customisation in section 5.1.3. Therefore, outputs with highest perceived importance to consumers have instead been selected as the focus here. ↑
The Scottish Government’s Climate Change Plan update recognised the role that emissions removals will need to play in reaching net zero. Direct air capture (DAC) technologies extract CO2 directly from the atmosphere at any location rather than at the point of emissions. CO2 can then either be stored or used for a variety of applications, such as producing more sustainable fuels.
This study explores the costs and profitability of DAC and conducts an international comparison, through an evidence review, stakeholder engagement and modelling. We based the modelling on a 0.5 Mt DAC plant in Scotland operating in 2040, based on a Negative Emissions Technologies study by the Scottish Government. We modelled the two leading technologies, solid DAC and liquid DAC.
Key findings
Our modelling shows that demand for DAC CO2 in Scotland by 2040 will be approximately 0.1-0.15 Mt, rising to 0.2-0.24 Mt in 2050. This is far below the demand levels needed to make a 0.5 Mt DAC plant profitable. Much of this projected demand is driven by the UK sustainable aviation fuels (SAF) mandate that sets out targets for synthetic aviation fuel (e-SAF) – see figure 1.1. This highlights the importance of government policy for creating a sustainable market. To create demand for a 0.5 Mt DAC plant in Scotland, either Scotland would need to provide a disproportionate amount (~40%) of the UK’s synthetic fuels (particularly e-SAF), DAC would need to supply the vast majority of the CO2 used to make e-fuels, or much of the captured CO2 would need to be sent to storage as CO2 offsets. Please note that in this study, we assumed that only 50% of CO2 for e-SAF would come from DAC. However, the Committee on Climate Change 7th Carbon Budget (published after we conducted the study) assumed that all CO2 required for e-SAF comes from DAC. Therefore, the projected DAC demands for e-fuels are roughly double the values shown here.
Figure 1.1: Projected CO2 demands for e-SAF until 2050 in the UK (left) and Scotland (right). This demand would be met by a mixture of CO2 sources, not solely DAC.
Experts highlighted market demand for CO₂ as a key limiting factor with the sector currently relying on voluntary carbon markets, which are volatile. Government policy will be central to setting out a market, or markets, for DAC CO2 but is not yet fully developed. Planning restrictions, including timelines for approvals, land use concerns and uncertainties around final project specifications, create further hurdles. Other constraints include supply chain bottlenecks, though none of these are viewed as critical, and the immature state of CO₂ transport and storage infrastructure.
The cost of DAC is expected to drop by 30%-60% by 2040, depending on the technology. This will be driven by improved processes and materials, economies of scale and learning by doing. High gas prices in the UK mean that Scotland is not a particularly attractive location for liquid DAC, so advances in solid DAC will most likely be of greatest relevance. Industry experts highlighted the value of learning from current deployments such as understanding the impact of climate conditions, and how carbon capture materials perform and can be produced on an industrial scale. Integration with waste heat could have a significant impact on the cost of solid DAC to below £400/tCO2. Both the e-fuels and green hydrogen production industries could be expected to grow on a similar timescale to DAC and would be obvious industries to co-locate with DAC due to their production of waste heat.
By 2040, the cost of solid DAC is projected to be around £560/tCO2 and that of liquid DAC £340/tCO2. The starting point for the liquid DAC cost ranges are much more uncertain as the technology has fewer deployments than solid DAC. If the UK Government Emission Trading Scheme (ETS) price was set in order to be a penalty for exceeding emission allowances, the cost of DAC plus CO2 storage could be used effectively to set the ETS price. To be compatible with the e-SAF buyout price set in the UK SAF Mandate, DAC CO2 would need to cost below £400/tCO2. Our modelling suggests liquid DAC could reach this cost by 2040. Solid DAC has the potential to reach these costs if the plant has access to low-cost electricity (in the region of 6p/kWh), potentially aided by waste heat from other process such as green hydrogen or e-fuel production.
Despite the potential for DAC in Scotland to reach the costs compatible with profitable e-SAF production, e-SAF from DAC CO2 is still projected to be one of the most expensive forms of e-SAF compared to e-SAF synthesised from other CO2 sources. It would also be multiple times more expensive than current aviation fuels. The e-SAF buyout price in the SAF mandate has been set accounting for the cost of DAC CO2. The analysis in this study indicates that DAC CO2 would need to be in the region of £400/tCO2 to be compatible with the buyout price in the SAF mandate. This is compatible with projected liquid DAC costs in 2040 or solid DAC when using a mixture of low-cost electricity and waste heat. The buyout price is set to ensure that it is more economical to buy DAC e-SAF than to not meet the e-SAF mandate requirements. However, if other forms of e-SAF can meet the demand, the market for DAC e-SAF could be much smaller than projected here.
This is amplified when considering DAC as a CO2 feedstock for shipping e-fuels, where there are more options for decarbonised fuels and current fuel costs are lower than for aviation fuel. Even by 2050, shipping fuels are still projected to be up to 3 times more expensive than current shipping fuels (UMAS, 2023). A key future consideration with shipping e-fuels is whether ammonia comes through as a major fuel, which does not require a carbon feedstock such as DAC. If it does, ammonia could take up a lot of the shipping fuel market. However, significant safety concerns remain. If ammonia’s role is smaller than current projections, then the role of carbon-based e-fuels for shipping and of DAC would be larger.
Solid DAC would not be profitable for usage with the projected ETS price of £142/tCO2 in 2040, but would require an ETS price of £250-£350 /tCO2. To make DAC competitive with other sources of CO2, the ETS price would need to make up the difference between DAC and CO2 from other sources, currently around £100-£300/tCO2 depending on the use case and market fluctuations. The ETS scheme is still considering how DAC CO2 that is re-released is to be treated. DAC CO2 may not earn credits, but for instance if fuels made from DAC were carbon neutral, that fuel would not use any carbon credits.
Energy prices account for up to 80% of the cost of DAC. Countries or regions with low and stable energy prices, such as Iceland and Texas, are generally more favourable for DAC deployment compared to regions like the UK, where energy costs remain relatively high. The most competitive locations for solid DAC are those with both low-cost and low-carbon electricity, especially when considering the levelised cost of removal (LCOR), as shown in Figure 1.3. The LCOR is the cost of removing 1 tonne of CO2 from the atmosphere, accounting for any CO2 released in the process of capturing the CO2 e.g. CO2 emissions from energy used for the process.
Low-carbon electricity from renewable energy (especially wind) is an advantage for Scotland. However, given the higher cost of electricity in the UK, Scotland and wider UK are less attractive locations for DAC than other countries with a similar portion of low-carbon energy, as illustrated in Figure 1.3. For liquid DAC, gas prices are a key influence as gas is used to generate the high temperatures needed for the liquid DAC process. However, gas prices in the UK are high, meaning that Scotland is not an attractive location for liquid DAC compared to other international locations.
Figure 1.2: The influence of electricity price on the LCOR of solid DAC across international locations.
Using green hydrogen for liquid DAC increases costs by 33%. These costs are comparable to solid DAC when solid DAC is paired with low-cost electricity or waste heat (i.e. the lower cost solid DAC scenarios).
Abbreviations Table & Glossary
CCC
Committee on Climate Change
CO2
Carbon dioxide
CXC
ClimateXChange
BEIS
UK Government Department for Business, Energy and Industrial Strategy (now DESNZ)
DAC
Direct air capture
DACCS
Direct air carbon capture and storage
DESNZ
UK Government Department for Energy Security and Net Zero
EMEC
European Marine Energy Centre
e-SAF
Synthetic sustainable aviation fuel
FOAK
First of a kind, in reference to DAC plants
LCOD
Levelised cost of DAC
LCOR
Levelised cost of removal
KOH
Potassium hydroxide
Mtoe
Megatonne oil equivalent
NET
Negative emissions technologies
NOAK
Nth of a kind, in reference to DAC plants
ONS
Office for National Statistics
PtL
Power to liquid fuels
SAF
Sustainable aviation fuel
s-DAC, l-DAC
Solid DAC, liquid DAC
tCO2
Tonnes of CO2
Absorption
The dissolution of atoms, ions or molecules into another material. In liquid DAC, the CO2 from air is absorbed into a carbon capture liquid.
Absorbent
The substance which has absorbed the atoms, ions or molecules. The carbon-capture liquid used in liquid DAC is an absorbent.
Adsorption
The adhesion of atoms, ions or molecules from a gas or liquid onto the surface of a solid material (as opposed to being absorbed into the material). In solid DAC, the CO2 from the air is adsorbed onto the surface of a solid carbon-capture material.
Adsorbate
The substance which has adsorbed the atoms, ions or molecules onto the surface. The solid carbon-capture material used in solid DAC is an adsorbate.
Contactor
The element of machinery in a DAC plant that brings the air containing CO2 in contact with the carbon-capture material.
Load profile
The variation in energy demand over time. A flat load profile would indicate a consistent demand across all hours of the year; load profiles tend to fluctuate with periods of higher and lower demand.
LCOD
The cost of capturing one tonne of CO2 a DAC system. The LCOD reflects the cost of capturing one tonne of CO2 irrespective of any CO2 generated to facilitate the process e.g. for energy use.
LCOR
The cost of removing one tonne of CO2 from the atmosphere accounting for any CO2 released in the process, e.g. from energy use. If all the energy used is zero-carbon, the LCOD and LCOR will be the same.
Introduction
This study explores the cost and profitability of direct air capture (DAC) technology in Scotland. The findings from this report will feed into the evidence base for the Scottish Government on DAC technology. The focus of this study is on the capture and utilisation of CO2, as opposed to CO2 storage.
Aims
The key aims of this project were to:
Review the main research and development (R&D) trends in DAC: high activity research areas, the likelihood of success and the impact if successful
Understand key limiting factors in DAC deployment and scale up
Provide projections for the likely cost of DAC in Scotland and the key sensitivities
Understand how various scenarios, such as low-cost electricity and waste heat, would influence DAC costs
Understand how Scotland compares to other countries as a location for DAC
Quantify potential markets for DAC, both established and emerging, the size of those markets and potential for profitability.
Overview
The modelling in this study is based on a 0.5 Mt DAC plant, with both solid DAC and liquid DAC studied at this capacity. This 0.5 Mt capacity has come from the Negative Emissions Technologies study by the Scottish Government based on the Storegga and Carbon Engineering project, which was proposed to be built in the late 2020s with assumed minimum capture rate of 0.5 MtCO2 (Scottish Government, 2023).
The information in this study brings together academic literature with cost modelling alongside insight from interviews with DAC experts in industry and academia. It is important to note that the values in this study are projections based on best available data for a developing technology so are subject to significant uncertainty. Where possible, indications are given as to the main factors impacting the values provided and how changes to some of the assumptions would affect them.
Throughout this study, two key terms are used: levelised cost of DAC (LCOD) and levelised cost of removal (LCOR). The LCOD is the cost of capturing one tonne of CO2 from the air, quoted in terms of £/tCO2; the LCOR is the cost of removing one tonne of CO2 from the atmosphere, accounting for any CO2 released in the process of capturing the CO2 e.g. CO2 emissions from energy used for the process. If zero carbon energy were used, the LCOD and the LCOR would be equal. LCOD is the important metric for comparing DAC costs from a purely economical point of view, however, carbon credits will be assigned based on the carbon removed such that LCOR is still a key economic metric as well being important from a carbon reduction perspective.
Overview of DAC Technology
The carbon capture process
The process of capturing CO2 directly from the air has three generic phases (Third Derivative, 2021):
Drawing air containing CO2 at atmospheric concentration of around 400 ppm into the system and bringing it into contact with a carbon-capture material
Reaction of CO2 with the carbon-capture material, usually either a liquid absorbent or a solid adsorbent
Releasing the CO2 from the capture material to be used or stored, and regenerating the capture material to begin the cycle again
DAC technology
DAC technology has two main types: solid DAC and liquid DAC. The solid and liquid refers to the materials that are used to capture the carbon. In liquid DAC, the CO2 is absorbed into a liquid solution of potassium hydroxide or another base; this is the method used by the DAC plant developer Carbon Engineering, a partner in the planned Acorn DAC facility at Peterhead. In solid DAC, the method used by the businesses Climeworks and Global Thermostat, solid materials are used with the CO2 adsorbed (binding) to the material surface.
Both processes use heat to release the CO2 and regenerate the capture material, but liquid DAC needs much higher temperatures to do so, in the region of 900°C compared to solid DAC around 100°C (Sodiq, 2022). The high temperatures needed for liquid DAC means natural gas is currently used as part of the process, with the CO2 from the gas burned being captured in the process. This is the method used by Carbon Engineering.
More detail is provided on each of these methods in Appendix A.
Research and Development Trends
DAC is an active area of research both in industry and in academia. Academic research is largely focussed on materials and process improvement, such as sorbents and solvents that capture CO2 more quickly, more effectively and more selectively than those currently used, as well as materials that can last longer through more cycles. R&D in industry works on these same problems but also has a major focus on learning from current deployments, improving the quality of materials, and understanding the impacts of local conditions on processes and equipment. Several DAC companies are working on new processes. One process of particular interest in the UK would be electrochemical DAC that runs purely off electricity (as opposed to requiring heat), advantageous for the ability to run directly on renewable electricity. An overview of the main R&D trends in DAC is provided in Table 5.1 with a mapping of innovation areas shown in Figure 5.1. This overview is based on an initial literature review of DAC research that was then discussed with industry experts to capture their opinions and insights. A more detailed version of Figure 5.1 and more detail on each of the research areas in DAC is provided in Appendix B.
Table 5.1: Overview of research and development trends in DAC.
Area
Level of research activity
Impact on cost successful
Likelihood of success
Air contactors
Geometry
Medium
Medium
High
Air contactors
Passive air contactors
High
High
Low
Solid DAC sorbents
Amine-functionalised sorbents
High
Medium to low
Medium to low
Solid DAC sorbents
Zeolites
Medium
Medium to low
Medium to low
Solid DAC sorbents
MOFs
High
Medium to low
Medium to low
Solid DAC sorbents
Solid alkali carbonates
High
Medium to low
Medium to low
Solid DAC sorbents
Silica gel
High
Medium to low
Medium to low
Solid DAC sorbents
Calcium ambient weathering
High
Medium to low
Medium to low
Solid DAC sorbents
AI and machine learning for better sorbent designs
High
Medium to high
High
Liquid DAC sorbents
Alternative liquid sorbents: alkoamines, alkylamines, and ionic liquids
Medium
Medium to low
Medium to low
Regeneration process
Crystallisation
Low
Difficult to determine
Difficult to determine
Regeneration process
Electrochemical
High
High
Low
Regeneration process
Thermal regeneration
Medium
High
Medium
Regeneration process
Calcination
Medium
High
Medium
Integration with waste heat
Sources
Medium but increasing
Medium
Medium
Process optimisation
Medium
Low
Low
Integration with renewable energy
Grid carbon factors, curtailment and grid balancing
High
Medium
High
Integration with renewable energy
Tidal power
Low
Difficult to determine
Difficult to determine
Integration with renewable energy
Energy storage
Medium
Medium
High
Scaling up
Manufacturability
Low
High
High
Scaling up
Scalability
Low
High
High
Scaling up
Constructability
Low
High
High
Learning from deployment
Impact of climate and local conditions
High
High
High
Learning from deployment
Impact of climate
High
Difficult to determine
Difficult to determine
Learning from deployment
Co-benefits, reducing particulate matter, reducing other local pollutants
Medium, but increasing
Difficult to determine
Difficult to determine
Figure 5.1: Research and development areas in DAC.
Limiting factors for DAC deployment
The key limiting factors that came out in discussion with expert interviewees were cost and supply of green energy, plus demand for DAC through a stable, long-term market. Requirements on industries to use captured carbon, such as the UK SAF mandate, would provide market confidence, encouraging investment and enabling scale up. An overview of limiting factors is provided in the sections below with more detailed information provided in Appendix C.
Energy demand and cost
The high energy demands for DAC are expected to limit scale up, due to high energy costs and associated infrastructure constraints, such as a large connection to the electricity grid. A 0.5 Mt DAC plant would require around 1 TWh of energy, 20% electricity and 80% thermal energy. If the heat was supplied by heat pumps, that value could be brought to around 0.6 TWh of electricity per year. Assuming a flat load profile (i.e. the electricity demand is flat instead of varying across the day, 0.6 TWh would be around 68 MW in terms of connection capacity, in line with other large industrial sites or data centres.
Carbon intensity of electricity and fuel
The carbon intensity of electricity has a significant impact on the levelised cost of removal (LCOR) as the more carbon intense the electricity is, the more of the captured carbon is assigned to offsetting the source electricity. The grid carbon intensity does not directly affect the cost of capturing CO2, the levelised cost of DAC (LCOD), but does affect the net CO2 removal and the LCOR. The distinction between these two becomes important if DAC is being considered from a CO2 removal point of view or simply as CO2 as a product.
The carbon intensity of the UK electricity grid is expected to fall from 213 kgCO2/MWhe in 2019 to 6 kgCO2/MWhe in 2040. This has the effect of decreasing the LCOR by 28%.
Demand for CO2
The main market for DAC is currently voluntary carbon offsetting, which is a purely voluntary market without security of demand.[1]
The EU and UK SAF mandates offer major long-term markets for DAC, with both mandates stating an intention for a portion of SAF to come from DAC over time. These potential markets are explored in detail in section 9. Beyond e-fuels, other major emerging markets are construction materials and CO2 as a chemical feedstock. Existing CO2 markets such as the food and drinks industry are also of interest but would largely rely on companies looking to advertise their green credentials to offer a market for DAC.
Policy and government procurement were seen as major drivers here. Current carbon price forecast and emission penalties are not currently high enough to drive demand for DAC.
Planning restrictions
A 0.5 Mt DAC plant would be considered a major development under Scottish planning law, the average planning time for major development projects in Scotland in 2023/24 ranged widely from 22 weeks for projects with processing agreements compared to 53 weeks for those without (Scottish Government, 2024). Very roughly, delays impact project costs by 1%-2% per month, but the Scottish Government was praised in some of the engagements within this study for being dynamic and working with organisations to progress projects.
Geographical requirements
The main geographical requirements for DAC are to be near or connected to low cost, low carbon electricity with a high load factor and near transport, storage or usage of CO2.
The impact of climate on DAC is still not fully understood. Modelling indicates that cooler, drier climates could be techno-economically favourable for solid DAC, while warm and humid climates could be favourable for liquid DAC (Sendi, 2022). The UK is considered a cool and humid climate, which slightly reduces the productivity (i.e. how effectively the CO2 is captured) due to competition with water for adsorption to the surface. This increases energy requirements, but the overall impact is less than 10% in terms of levelised cost of DAC compared to a cold and dry climate. This is a much smaller impact than many other factors and technologies/materials could be optimised for different climates.
Transport and storage
The availability of CO2 transport and storage facilities is expected to be a major limiting factor, especially in the short term. The Storegga facility under the North Sea, planned as the first major CO2 storage site in Scotland, was due to be operational mid-2020s but progress appears to be stalled. Placing DAC sites near utilisation sites will minimise transport and storage requirements, the location flexibility of DAC is considered a major advantage.
Supply chain requirements
The supply chain will need to scale up. There are no major blockers foreseen but a bottleneck in the supply chain can be a risk to scale up. The only material that DAC could use a significant portion of supply and therefore the most likely to cause a bottleneck in the system are amine-based sorbents for solid DAC, currently mainly used in smaller quantities in the pharmaceutical industry.
Commercial sensitivity and maturity
Commercial sensitivity was seen to be a limiting factor in the scale up phase and optimising DAC processes, especially when optimising alongside other technologies like green hydrogen and e-fuel production. The European Marine Energy Centre (EMEC) was noted as an advantage in Scotland as they are very open to partnerships, knowledge sharing and demonstration projects.
Cost of DAC
Reference scenario
This study developed a reference scenario which aligns with ‘Pathway 3’ of the Scottish Government’s ‘Negative emissions technologies (NETS): Feasibility Study’ (Scottish Government, 2023). This pathway assumes that policies and mechanisms are implemented by the UK and Scottish Government which result in high carbon capture and NETS deployment. The 0.5 Mt capacity for the reference scenario has come from the NETs study based on the Storegga and Carbon Engineering project, which was proposed to be built in the late 2020s with assumed minimum capture rate of 0.5 MtCO2. This project was intended to be operational by the mid-2020s but is currently stalled.
Reflecting that current DAC deployment plans in Scotland are behind what was set out in the NETs study, the reference scenario in this study has been run for year 2040, in recognition that we are unlikely to see substantial deployment of DAC in Scotland in the short term. Our model accounts for reducing costs of DAC over time, incorporating the impacts of ‘learning by deployment’ by assuming a ‘learning rate’ on CAPEX, energy requirements and solid adsorbent cost.
Our modelling approach follows that of Young et al. (Young, 2023) with costs converted from USD to GBP using a ratio of 0.8 with key values set out in Table 7.1 and more detail given in Appendix D. A key assumption for year 2040 is the level of global deployment assumed for this year. This, along with the learning rate, determines the level of cost reduction from the ‘First-of-a-Kind’ (FOAK) plant. The 2040 deployment assumption is 15 Mt combined for both solid DAC and liquid DAC which is based on a global technology diffusion rate (i.e. how quickly the deployment capacity increases each year) of 25%. This value is high, above the average technology diffusions rates but still results in DAC deployment values below those projected elsewhere, reflecting an ambitious but realistic scenario.
The modelling of process energy requirements assumes the cumulative capacity of DAC deployed up to 2040 has improved process efficiency, reducing the energy requirements from a first-of-a-kind (FOAK) plant to an Nth-of-a-kind (NOAK) plant. The FOAK energy estimates for solid DAC are based on operational data from the Climeworks Orca plant (4 kt), while liquid DAC is based on academic literature and modelling (Keith, 2018).
Table 7.1 summarises the energy requirements of the solid and liquid DAC processes. The magnitude and split of electricity vs thermal energy across the two technologies is similar, but the liquid technology requires high-grade heat (circa 900oC), whereas the solid technology requires lower grade heat (circa 100oC) and therefore could be supplied by a heat pump rather than combustion of a gas. Assuming a COP of 2, the heat pump would use 0.75 MWh of electricity to produce the required 1.5 MWhth of thermal energy.
While a heat pump was chosen as the solid DAC heat source other sources of heat such as natural gas or hydrogen may also be used. Likewise for liquid DAC process natural gas was selected as the heating fuel with electricity supplied by the national grid but the process could be configured to generate electricity from natural gas in a combined-cycle-gas-turbine or substitute natural gas entirely for hydrogen or electricity. Alternative heat sources are explored further in section 7.2.4.
Table 7.1: Key inputs for the solid and liquid DAC processes built in 2040
Process
Solid DAC
Liquid DAC
Electricity use, MWh/tCO2
0.27
0.37
Thermal energy use, MWh/tCO2
1.5 (0.75 MWh electricity assuming COP = 2)
1.46
Thermal energy source
Heat Pump
Natural Gas
Electricity price, £/MWh
187 (Climatescope, 2024)
Natural gas price, £/MWh
49 (DESNZ, 2024)
CAPEX, £/tCO2 capacity
109
65
Lifetime of plant, years
20
25
Capacity factor
88%
90%
Estimating the cost of DAC
The values in the cost modelling and associated sensitivities are presented as two different metrics: the levelised cost of DAC (LCOD) and the levelised cost of removal (LCOR). The LCOD is the cost to remove a certain amount of CO2 from the air, the LCOR takes account of the emissions associated with the energy used to power the DAC plant e.g. from electricity generation or the burning of natural gas. The figures presented in this section primarily show the LCOD as this is the most relevant metric when considering costs and markets of DAC CO2; the LCOR is also marked on the figures to provide additional insight.
A breakdown of the contributing costs to the overall LCOD of solid and liquid DAC is shown in Figure 7.1. The effect of ‘learning rate’ and decarbonisation of the electricity grid is highlighted, with significant cost reductions from the estimated costs of a FOAK plant and a plant built in 2040. In 2040, this model assumes a combined global deployment of solid and liquid DAC of 15 Mt, split evenly between solid DAC and liquid DAC; this means that the learning rates applied to each technology are equivalent to 7.5 Mt of global deployment.
For solid DAC, the levelised cost is estimated to decrease by 75% from £2,253/tCO2 to £557/tCO2, while liquid DAC decreases by 25% from £453/tCO2 to £337/tCO2. The LCOR (shown as diamonds in Figure 7.1) is especially high for a solid DAC FOAK plant and changes significantly by 2040 as the UK electricity grid decarbonises from 213 gCO2/kWh to 6 gCO2/kWh.
The largest contributor to overall cost is variable OPEX, consisting of energy, water and sorbent replacement costs. Variable OPEX is significantly higher for solid DAC due to the use of electricity to supply process heat. Electricity is 3.8 times more expensive than natural gas producing heat and 1.8 times more expensive than via a heat pump (COP = 2) than a calciner used in the liquid DAC process. However, using a heat pump enables the use of zero/low carbon electricity. If natural gas were to be used instead in the solid-DAC process the combustion of the fuel would release CO2 and increase the cost of DAC per tonne of CO2 captured.
Natural gas is required in the liquid DAC process due to the high temperature requirements, in this case the emissions from natural gas emissions are captured within the DAC process. The use of alternative sources of heat is discussed further in section 7.2.4.
CAPEX costs were also higher for the solid DAC process (£109/tCO2) compared to liquid DAC (£65/tCO2). Since financing and fixed OPEX are fixed percentages of the CAPEX cost, these two are higher in the solid process.
Figure 7.1: Levelised cost for solid DAC and liquid DAC, showing breakdown by cost component.
Sensitivity analysis
A one-at-a-time sensitivity analysis was completed for the reference scenario, where a 20% increase or reduction was applied to a variable, holding all others constant, to see the impact on LCOR. Additional sensitivities were completed to assess the impact of changing energy price and waste heat usage by 50% and 100%. The results are shown in Figure 7.2, with negative values representing a reduction in cost. Waste heat costs are difficult to estimate and are usually process specific; for this analysis waste heat is assumed to be zero cost to represent the maximum potential benefit. The analysis highlighted that solid DAC was most affected by the operational capacity factor, see Figure 7.2 below.
Changes in the price of electricity and the proportion of heat from waste sources had a larger impact on the LCOD of solid DAC than liquid DAC, as solid DAC has nearly double the energy cost than liquid DAC per tonne. A 100% change in the price of electricity (zero cost or doubling the cost) impacts the overall cost of solid DAC by 46% and liquid DAC by 23%. The use of waste heat is also more impactful in the solid process, a similar 100% change reduces the overall cost of solid DAC by 32% and liquid DAC by 23%. It is also unlikely waste heat will be able to replace a significant proportion of liquid DAC heating simply due to the very high temperatures required for the liquid DAC regeneration process. A change in capex cost was slightly more significant in liquid DAC since capex made up a higher proportion of the total cost; changing the CAPEX cost by 20% impacts the solid DAC process by 7% and the liquid DAC process 8%.
Both electricity costs and waste heat utilisation were selected for a further, more detailed sensitivity analysis not only because they are major influencing factors, but because accessing those savings is realistic for a DAC plant in Scotland.
Figure 7.2: The sensitivity of levelised cost of DAC to changes in variables
Electricity price
In section 7.2.1 the price of electricity has been highlighted as the most significant factor affecting the cost of both solid and liquid DAC. A number of possible scenarios were modelled to assess the effect of electricity price on LCOD. These scenarios include:
Reference scenario price of grid electricity £187/MWh (Climatescope, 2024)
2040 Green Book estimate for electricity price £111/MWh (DESNZ, 2024)
Price of electricity from onshore wind under a contract for difference tariff of £73/MWh (DESNZ, 2023)
No cost renewables £0/MWh
As shown in Figure 7.3, because the solid DAC process uses electricity for heating, changes in electricity prices have a significant impact on the cost of solid DAC. The maximum achievable reduction in LCOD is 46% for solid DAC to £304/tCO2 and 23% for liquid DAC to £260/tCO2, however this relies on zero-cost electricity from a renewable energy source such as wind or solar.
More plausible electricity pricing scenarios such as private wire wind or the 2040 Green Book also significantly improve the LCOD of solid DAC and reduce the cost difference between solid and liquid DAC. By using electricity from onshore wind with a typical feed-in-tariff cost of £73/MWh there is the potential to reduce the overall cost of DAC by 28% and 14% for the solid and liquid processes respectively. However, this may result in longer periods of downtime due to low wind speeds. As shown in Figure 7.2, the LCOD is highly sensitive to the capacity factor and periods of downtime should be avoided.
Using the Green Book estimate for the price of electricity in 2040 has a smaller impact on the overall LCOD, reducing the solid and liquid process costs by 19% and 9%, respectively.[2]
Figure 7.3: The effect of electricity price on the LCOD of solid and liquid DAC.
Carbon intensity of electricity
The carbon intensity of the fuel used for DAC has no direct impact on the cost of DAC and therefore has no direct impact on the LCOD; however, it does impact the LCOR, i.e. the net cost of removing one tonne of CO2 from the atmosphere. The LCOR calculation includes the carbon emissions associated with energy use, the impact of which is shown in Figure 7.4. Using a 2024 grid carbon intensity which averaged 213 gCO2/kWh has an estimated cost of £775/tCO2. If the carbon intensity of the electricity grid follows DESNZ green book projections and falls to 6 gCO2/kWh in 2040 (DESNZ, 2024), this would reduce the cost of solid DAC by 28% and liquid DAC by 8%. The decarbonisation of the electricity grid can therefore be considered a necessity for Scotland to be a suitable location for solid DAC when compared to other global locations. Liquid DAC is less sensitive to the carbon intensity of electricity as it uses natural gas for heat process requirements. However, the associated combustion emissions must be successfully captured in the process and the upstream fugitive emissions of natural gas extraction must be considered.[3]
Figure 7.4: The effect of electricity grid carbon emissions on the LCOR of solid and liquid DAC.
Heat source and integration of waste heat
The LCOR can be significantly impacted by the energy vector used to provide process heating, shown in Figure 7.5 . Electricity, natural gas and hydrogen were considered for each process as well as the utilisation of waste heat.
In the reference scenario, the solid DAC process uses a heat pump to provide the target temperature of around 100°C. Using natural gas for solid DAC heating instead of electricity increases LCOR because of the emission released during combustion. While using green hydrogen does not release any further emissions during combustion, the higher cost of hydrogen compared to natural gas increases the LCOR.
In the liquid DAC process, emissions released from natural gas combustion are captured as part of the process. Natural gas may be replaced with hydrogen as a low-carbon alternative, although the higher cost of hydrogen outweighs the lower carbon emissions and increases LCOR overall.
The utilisation of waste heat is beneficial for both the producer and user of the heat. Waste heat can often be purchased at low cost and is considered as low or zero carbon. Using waste heat would reduce the amount of electricity or natural gas needed for heating, lowering fuel costs and avoid emissions from fuel combustion or electricity generation. However, the extent waste heat can be utilised is limited by the temperature of the source. Since Liquid DAC requires high temperature heating, the proportion of heat that can be supplied from waste heat is significantly lower than solid DAC. For each waste heat source discussed, further details related to calculations and size of plant needed to provide the waste heat are provided in Appendix H.
The viability of using waste heat from sources such as manufacturing processes, energy facilities, or data centres depends on the individual site and process. Both the cost and temperature of heat available influence the potential benefit of reducing the LCOR. The price of heat is subject to commercial negotiations and difficult to estimate. A no-cost waste heat source which can provide 100% of process heat has been modelled to show the maximum theoretical benefit to the solid DAC and liquid DAC processes.
One potential supplier of waste heat is the production of hydrogen via electrolysis. This is most impactful in solid DAC since the 80°C heat from hydrogen production can provide a significant proportion of the process’ thermal energy requirements, reducing the overall LCOD by 26%. There is limited impact on the liquid DAC process due to the high-temperature requirements of around 850°C (Sodiq, 2022). Using waste heat to provide heating up to 70°C and natural gas up to the final temperature of 850°C has a limited impact, only reducing LCOR by 2%.
E-fuel production is another potential source of waste heat. The E-fuel process has an operating temperature ranging from 200°C-240°C (Speight, 2016). This could provide the entire thermal requirement of the solid DAC process, reducing LCOR by 32% (Speight, 2016). As with waste heat from hydrogen, waste heat from e-fuel production can only supply a small proportion of the overall thermal energy of liquid DAC, reducing overall LCOR by 6%.
Figure 7.5: The effect of fuel type on the cost of solid and liquid DAC
Financing costs
An additional sensitivity was performed to understand the impact of financing costs on the cost of DAC. The reference scenario in this study uses financing costs of 3.5%, in line with social discounting rates (DESNZ, 2024).The values in Figure 7.6 show the impact of financing rates at more commercial levels of 10% referred to as the weighted average cost of capital (WACC) (UK Government, 2021). In this sensitivity, the cost of both solid and liquid DAC is increased significantly by the increase in required rates of return on capex investments. The cost of solid DAC is affected more than liquid DAC, with the LCOD of solid DAC increasing from £557/tCO2 to £642/tCO2, an increase of 15%; liquid DAC increases from £337/tCO2 to £404/tCO2, an increase of 20%. This sensitivity illustrates how the cost of DAC will depend heavily on how the initial capex is funded.
Figure 7.6: The effect of financing rates on the cost of solid and liquid DAC.
Additional costs
Purification
The DAC techniques detailed in this report have been developed with storage as a key market, which requires high levels of purity to minimise how much non-CO2 is stored. Climeworks reports minimum CO2 concentrations of 95% although concentrations of 99.9% are discussed in literature (Climeworks, 2022; Ozkan, 2021). These very high concentrations may require additional purification steps but for the purposes of this study, purification costs are assumed to be within the overall DAC costs presented here and additional costs are not added in.
For CO2 markets, the type of impurities will be important especially for applications within the food and drinks industry. Most of the ‘impurities’ in DAC CO2 are nitrogen and oxygen left over from the air; more problematic impurities would be from the DAC process such as amines from the sorbents. These impurities would have an impact on the markets for DAC, most notably for food and drink.
Transport
A recent CXC report “Onshore and inshore storage of carbon dioxide” discussed CO2 transport costs based on literature and discussion with industry, coming to a value of £20-£24/tCO2 for a 100-mile round trip (ClimateXChange, 2024). These values would be a significant portion of CO2 costs when CO2 costs are in the region of £50-£100/tCO2. Estimated DAC costs are in the region of hundreds of pounds per tonne, so transport costs are less influential. Transport costs would become significant again if carbon pricing was used to bring DAC costs down.
Profit
Profitability information for UK companies is published by the Office for National Statistics with an average for private, non-financial companies consistently around 10% (Office for National Statistics, 2024). It could be argued that DAC would need a higher profit margin as it is a new technology and carries a higher risk, or that finance may be offered to ‘green’ projects at a lower rate by investors seeking environmentally friendly investments. The UK SAF mandate buyout price includes a 20% price premium above expected e-SAF production costs, reflecting that the market is early-stage.
The average UK value of 10% is used to assess profitability in this study. With the cost of capture for DAC in 2040 projected to be in the region of £550/tCO2, the profit margin would be around £55/tCO2 bringing the cost of DAC in the market just over £600/tCO2.
International Comparison
To understand Scotland’s potential for large-scale DAC deployment, the cost to capture carbon in Scotland has been compared against the other countries. Electricity costs, natural gas costs and labour costs have been changed for each country to reflect building DAC plants internationally. Further details are provided in Appendix F.
It is difficult to estimate the future cost of DAC in other countries due to the limited amount of data publicly available on future costs and carbon emissions i.e. there is not a UK Green Book equivalent for all countries. However, current values for energy costs and carbon intensities are available therefore the cost of DAC in different countries in this section has been compared using the same inputs as in the reference scenario (e.g. learning rates have been applied out to 2040, 15 Mt of global DAC deployment is assumed) but the electricity cost and carbon scenarios are from 2024 data. This mix of projected and current data means that the values themselves are likely to change over time but we would expect the trends to remain similar, i.e. countries that countries with very low carbon electricity now will continue to do so, countries with high carbon electricity will take longer to decarbonise their electricity systems.
International comparison for solid DAC
Figure 8.1 presents an estimation of the LCOR for solid DAC in 2024 for various countries. Two points are shown for the UK as a whole: one showing where the UK would sit in 2024 as a comparison against other countries 2024 data, and one showing where the UK would sit in 2040 when the electricity grid has largely decarbonised.
The most competitive locations for solid DAC are those with both low-cost and low-carbon electricity. Iceland and Canada have either significant geothermal or hydro-electric resources, producing electricity with a cost below £100/MWh and carbon intensity below 80 gCO2/kWh. As a result, these locations have the lowest estimated LCOR ranging between £381/tCO2 and £434/tCO2. Whereas locations with high electricity grid carbon intensity like Oman and Texas have some of the lowest electricity costs but the highest LCORs. In terms of DAC capturing and using CO2, it can be argued that it is the LCOD that is important, purely the cost of capturing the CO2; however, where DAC is being used for a climate benefit (even if the CO2 is to be used), it is the LCOR that is relevant.
Scotland has a lower LCOR than five of the thirteen locations assessed. With a relatively high electricity price, the UK is generally only competitive against locations with significantly higher carbon intensity. The focus on LCOR means that Scotland would be a more attractive location for solid DAC than Oman or Australia, despite higher electricity costs. This picture could change over time, for example if the grid in Australia rapidly decarbonised.
The dashed lines in Figure 8.1 show the impact of the cost of electricity in the UK on the LCOR to illustrate how changes in electricity costs would affect the relative competitiveness of DAC in the UK. These lines show that in order for Scotland to become competitive with Iceland, electricity prices would need to be around a quarter of what they are now, more in the region of £40/MWh, a relatively similar picture for the UK as a whole in 2050 once the grid has largely decarbonised.
Figure 8.1: The influence of electricity price on the LCOR of solid DAC across international locations.
International comparison for liquid DAC
The cost of liquid DAC for the same selected locations is shown in Figure 8.2. This analysis shows that countries that are net exporters of gas e.g. Norway, Oman and Texas are estimated to have the lowest LCORs. The UK’s high gas prices result in the highest LCOR out of the locations assessed at £368/tCO2. The reliance on gas to supply heat for the regeneration process means that the carbon intensity of the electricity supply is far less influential for liquid DAC than it was for solid DAC, such that energy costs (particularly gas costs) dominate the trends more than carbon intensities.
Varying electricity prices, as shown in Figure 8.2, has less impact on the LCOR of liquid DAC in the UK than it did on solid DAC as electricity prices make up a smaller portion of the total cost of liquid DAC. As a result, Scotland is not as cost effective as other locations for the deployment of liquid DAC as described in the reference scenario. This is in line with the rule of thumb from Carbon Engineering that the most attractive countries for liquid DAC are those counties that are net exporters of gas.
Figure 8.2: The influence of electricity price on the LCOR of liquid DAC across international locations.
Market opportunities and potential profitability
To understand how profitable DAC could be in Scotland, various potential markets have been assessed. This section focuses on industrial utilisation of CO2 that might be scalable and viable in Scotland: what the major demand markets are, potential growth in those markets and the potential role for DAC.
This section examines the potential markets for DAC CO2 within Scotland and the UK. A number of markets are considered, each considered in terms of:
the size of the current market
potential growth in demand
potential competitiveness of DAC CO2 in the market
potential market size for DAC CO2
potential for DAC CO2 to be profitable in the market.
The analysis in each section is put in context of demand relative to a 0.5 Mt DAC plant where all of the captured CO2 is utilised as opposed to stored. In reality, a DAC plant may supply CO2 for both use and storage. The costs discussed in this section are based on the reference scenario and the sensitivity analysis in 7.1.
Overview of CO2 markets
The CO2 market is split into direct uses of CO2 (e.g. carbonating drinks) and indirect uses (e.g. as a chemical feedstock). The UK consumes around 0.6 Mt of CO2 per year (Food & Drink Federation, 2019). The key markets for CO2 in the UK are:
Food & drink industry
Fire suppression and extinguishers
Medical uses
Industrial and other uses.
Additionally, horticulture uses a significant amount of CO2 to boost crop yield within greenhouses, but this CO2 is generally produced as a by-product of gas-powered heating systems onsite. The annual horticultural CO2 demand in the UK in 2030 is estimated to range from 108–218 ktCO2, around 20%-35% of current UK demand but this will be very much dominated by demand in England (Ecofys, 2017).[4] As heat production is moved from natural gas to electrification, alternative sources of CO2 will be needed, offering an additional CO2 market. In terms of DAC, Climeworks have previously reported sales to greenhouses but it is difficult to see a major CO2 market here due the current CO2 used being a by-product of onsite heat generation and horticulture is not a sector with large profit margins that could absorb significant additional costs (Climeworks, 2015).
The indirect CO2 market is more difficult find information on, and therefore to quantify, but CO2 is used as a chemical feedstock for:
Fertiliser industry
Polymers and resins
Synthetic hydrocarbons
Other chemical intermediates.
The chemical market was not studied in this report due to this lack of information but recent reports have indicated that there could be demand for CO2 in the UK chemical industry of 0.45 Mt by 2040, increasing to 2.3 Mt by 2050 (Innovate UK, 2024).
The current cost of CO2
The cost of CO2 has been very volatile in recent years largely due to major fluctuations in global fossil fuel prices. During the peak high of energy prices in 2022, CO2 prices reached £2,000/tCO2 even £3,000/tCO2. These prices had a major impact on availability and production of products like meat and carbonated drinks in the UK (Energy & Climate Intelligence Unit, 2022). In conversations with expert interviewees as part of this study, current costs in 2024 between £100/tCO2 – £900/tCO2 were discussed. These costs still represent a broad range but were generally concentrated at the low end, in the region of £100-£300/tCO2. The cost of CO2 depends heavily on the requirements of the use case: the purity level both in terms of CO2 concentration and the type and concentration of impurities. However, these values provide a comparison range for CO2 from DAC.
Biogenic CO2 is seen as a key future source of CO2 and is generally currently sold for around £100/tCO2 or a little lower. However, there is a limited supply of biogenic CO2, which is a key issue for scaling up applications like e-fuels. The NETs study states that the total biogenic CO2 currently available from existing sites in Scotland is around 3.3 MtCO2/year with a future maximum of 5.2 MtCO2/year by 2032 (Scottish Government, 2023).
Food and beverage industries
CO2 is widely used in food and beverage industries, the primary uses are carbonated drinks, chilling and packaging, transporting food and stunning animals. As other CO2 sources are reduced, all these markets will need alternative sources of CO2 but some are more suited to DAC than others. DAC CO2 is cleaner than combustion sources, making it more attractive for packaging and carbonated drinks. Additionally, products using DAC CO2 could carry a green premium in the market.
The beverage industry is of particular interest for DAC because of the size of the market and it is possible to see how a product could benefit from being marketed as lower carbon. Packaging and stunning of animals is likely to move to green sources of CO2 only as required to by law, via organisational targets or due to lack of supply; a green premium for DAC CO2 is hard to envisage for these sectors. The food and beverage industry is by far the largest user of CO2 in the UK, accounting for around 60% of the UK’s CO2 demand, roughly 360 ktCO2/year (Food & Drink Federation, 2019). The growing focus on sustainable CO2 sources has brought DAC into consideration, with Coca Cola already investing in UK DAC company Airhive to supply CO2 to one of its drinks production sites via an on-site DAC plant (AP Ventures, 2024).
Future CO2 markets in the UK for DAC
The consensus within literature on future markets for CO2-derived products is that the market size is difficult to predict. However, three key factors were identified for assessing future markets:
Scalability
Competitiveness
Climate benefit.
The climate benefit of a market influences the degree of interest to governments and other organisations seeking to reduce climate impacts.
There are also a number of market segments that consistently appear in literature on using and sequestering CO2 from DAC in the future:
E-fuels (see section 9.2)
Construction materials (see section 9.6)
Chemicals / plastics.
The 2019 International Energy Agency (IEA) report ‘Putting CO2 to Use’ highlighted the potential future global markets for CO2 (IEA, 2019); Figure 9.1 shows their analysis of the key markets set out by future global market size and by potential climate benefit. The largest market is e-fuels, with demand driven in the early stages by SAF via government mandates. As SAF production scales up and carbon prices on fossil fuels rise, e-fuels will have an increasing share of the fuel market. Construction materials are considered to be the CO2 use with the greatest climate benefits as CO2 is stored within the materials and not immediately released upon use, as happens with fuels or utilisation in greenhouses.
A key unknown in the projections of future CO2 demand is how much CO2 is being recycled and reused onsite, as happens in the horticulture industry, and therefore how much CO2 may be required in future that is not currently being noted within the CO2 market. One example is the chemical industry, where CO2 is reused as a feedstock (Huo, 2022). These uses should be monitored and reviewed over time to understand how they could contribute to demand for DAC CO2.
Figure 9.1: Figure taken from an IEA report detailing the potential global market size and climate benefits of CO2 derived products. (IEA, 2019)
E-fuels
Carbon-based (IEA, 2019) e-fuels are considered a major future market for DAC CO2. Beyond CO2 storage, e-fuels were the most discussed market for DAC CO2 during the expert interviews within this project. The term e-fuels (also called synthetic fuels or power-to-liquid fuels, PtL) refers to molecular fuels made using electricity; these could be green hydrogen, ammonia or carbon-based e-fuels that can directly replace fossil-based fuels. These carbon-based fuels use CO2 as a feedstock for the process and are expected to be major market for DAC CO2.
Overview
The process for making carbon-based synthetic fuels depends on the type of fuel being made:
Fischer–Tropsch (FT) process is used to make long-chain hydrocarbons for synthetic aviation fuel, petrol, diesel etc.
Sabatier process is used for making synthetic methane
Synthetic methanol synthesis (not generally given another name).
This study largely focusses on outputs from the FT process, that creates a mixture of hydrocarbons of different lengths via a highly energy-intense process (more detail provided in Appendix I). The exact make-up of the outputs can be adjusted to favour certain chemical fractions, for example, if the process is optimised for synthetic sustainable aviation fuel (e-SAF), the kerosene portion can be in the region of 60% of the output. (Wentrup, 2022)
The CO2 has been captured either directly from the air or from biogenic sources
The energy used is zero-carbon, e.g. renewable energy sources.
The requirements on the CO2 source vary between definitions, with some (including the UK SAF mandate) allowing CO2 to be supplied from processes where the CO2 would otherwise have been emitted into the atmosphere (i.e. CO2 could come from fossil-fuel exhaust systems) and some having a stricter requirement where the CO2 must come from DAC or biogenic sources. The modelling within this study focusses on e-fuels produced from CO2 captured via DAC.
Market for FT chemical byproducts
The FT process makes a mixture of hydrocarbons. When the process is optimised, 60%-75% of the FT output can be used directly for liquid hydrocarbon fuels such as e-SAF or e-diesel (Wentrup, 2022; Mazurova, 2023). The other products created in the FT process are generally shorter, lighter hydrocarbons such a naphtha. These byproducts are useful chemicals with their own markets but are not particularly high-value products making it unlikely that a market for the FT side products will have a significant impact on the cost of e-fuels. This picture would change if there was a shortage of such chemicals from current sources or if there was a distinct drive from the chemical industry to move away from fossil-fuel feedstocks.
Aviation, e-SAF
Aviation fuel is a key market for DAC in the form of SAF for three key reasons:
The aviation sector will struggle to electrify and will still rely heavily on fuels in a net-zero future
There are already targets for e-fuels in the UK SAF mandate (Department for Transport, 2024a)
The aviation industry is relatively high value compared to some other markets and has the potential to absorb higher costs where other markets do not.
This section details potential demand for DAC CO2 based on e-SAF targets and the buyout price set out in the UK SAF mandate (Department for Transport, 2024a). This e-SAF section is the most detailed of the sections on potential CO2 markets due to the clear targets for e-SAF and a clearer role for DAC. A short sensitivity analysis is included based on academic research. The key assumptions underpinning this section are detailed in Appendix I.
The UK SAF mandate
The UK’s Jet Zero strategy sets out the UK Government’s strategy to decarbonise air travel, to be introduced from 1 January 2025, sets out targets for requirements for the use of SAF and e-SAF for the UK aviation sector (Department for Transport, 2024a).
In 2025, 2% of UK jet fuel demand will be required to come from sustainable sources, increasing linearly to 10% in 2030, then to 22% in 2040.[6] The mandate for e-SAF starts in 2028, reaching 0.5% in 2030 and 3.5% in 2040. For context, the last reported UK energy demands were 2022, when UK aviation fuel demands were around 12 Mtoe, though expected to increase in the short term in the rebound from the pandemic (Office for National Statistics, 2024). The mandate sets out intended CO2 sources for e-SAF but does not currently set targets. The SAF mandate states there is potential to increase the target percentages for e-SAF if market conditions allow.
More information and a comparison with the EU SAF mandate is provided in 12.1.23.
Demand for e-SAF
The UK SAF mandate allows us to project demand for e-SAF and consequently for DAC CO2. Figure 9.2 shows the projected e-SAF demand for the UK (left) and Scotland (right) based on the targets set out in the UK SAF mandate. These demands shown in Figure 9.2 are calculated using projections for the aviation sector from the UK Committee on Climate Change’s 6th Carbon budget based on analysis carried out in 2019 (Committee on Climate Change, 2020). The figures show that demand for e-SAF in Scotland reaches above 0.04 Mtoe by 2040, around 7% of the equivalent values for the wider UK at 0.55 Mtoe by 2040.
Figure 9.2: Projected e-SAF demand for UK (left) and Scotland (right) broken down by aviation sector i.e. domestic, international and military.
Figure 9.2 shows the split of demands by domestic, international and military according to the splits from the Committee on Climate Change (CCC) 6th Carbon Budget. The splits show Scotland has a much higher demand for fuel for domestic flights than the rest of the UK and that military demand is only a small portion. The Royal Air Force has been involved in the development and testing of synthetic fuels in the UK and could be a leader in future demand for e-SAF. However, with military demand being such a small portion of demand, the portion of e-SAF used by the military would have to be many times higher than the SAF mandate to add significant demand to the market. There is currently no indication that the military has such plans, though it could continue to be of notable benefit in supporting demonstrators and initial deployments.
Demand for CO2 for e-SAF
The demand for e-SAF will create a new market for CO2 but the portion of that CO2 that will come from DAC is not yet clear. Figure 9.3 show the expected CO2 requirements for e-SAF production based on the assumptions in Table 12.7 in Appendix I. By 2040, the demand for CO2 for SAF in the UK would reach around 2.6 MtCO2, with demand in Scotland around 0.2 MtCO2. By 2050, this value would increase to around 4.4 MtCO2 for the UK and 0.3 MtCO2 for Scotland. These values seem small compared to the potential CO2 from existing biogenic sources in Scotland (potential estimated at 3.3 Mt), but that biogenic resource is restricted in quantity and location (Scottish Government, 2023; Food & Drink Federation, 2019).
The UK SAF mandate does not state requirements for DAC CO2 but a 2022 briefing by Transport & Environment noted sub-targets from the EU SAF mandate that gave a target portion of CO2 from DAC (Transport & Environment, 2022). [7] Transport & Environment projected DAC demand based on demand and availability of other sources, “DAC will start to supply CO2 in 2030 and overtake other carbon sources as the main source by 2035-2040” (page 1). Taking a simple 50% of e-SAF CO2 demand being met by DAC in 2040 would equate to 1.3 Mt CO2 demand across the UK and 0.09 Mt CO2 demand in Scotland, around 20% of the output of a 0.5 Mt DAC plant. However, the high cost of DAC CO2 makes a 50% target ambitious in terms of supply; the values based on this 50% figure could therefore be seen as an ambitious value or upper limit for DAC demand. Even considering these values as an upper limit, the values demonstrate that demand for e-SAF within Scotland alone will not support a 0.5 Mt DAC plant, but if Scotland was leading UK green hydrogen and e-fuel production then demand for DAC would be higher than demand calculated for Scotland alone.
While this study has assumed that only 50% of CO2 for e-SAF would come from DAC, the Committee on Climate Change 7th Carbon Budget (published at the end of this study) appears to have assumed that all CO2 required for e-SAF comes from DAC, therefore the projected DAC demands for e-fuels are roughly double the values shown here (Committee on Climate Change, 2025).
Something that could significantly affect demand, especially Scottish demand, would be reduction in demand for domestic flights. As we see in Figure 9.2, nearly half of the Scottish e-SAF demand comes from domestic flights, around a quarter of which alone were to London Heathrow, with Belfast, Bristol and other London airports other main destinations (Transport Scotland, 2023). If train and ferry services were improved and made more cost-effective, this domestic portion of demand could reduce.
Figure 9.3: Demand for CO2 for e-SAF for the UK (left) and for Scotland (right).
Buyout price
The SAF mandate sets targets for SAF and e-SAF as a portion of UK aviation fuel demand but also sets a buyout price for these fuels: the price to be paid by the fuel supplier for failing to meet the SAF and e-SAF percentage requirements. To be competitive, the maximum price for SAF and e-SAF effectively becomes the buyout price + the cost of conventional fuel.
The buyout price in the UK SAF mandate is (Department for Transport, 2024a, p. 46):
£4.70 per litre, £5,875 per tonne for SAF
£5.00 per litre, £6,250 per tonne for e-SAF
Potential profitability of e-SAF
The buyout price in the UK SAF mandate effectively sets a cap on the potential profitability of DAC and allows us to understand the range of DAC costs that are compatible with future e-SAF markets. The buyout price set for e-SAF is designed based on modelled costs for e-fuels using DAC and with a price premium of 20% applied to SAF production costs (Department for Transport, 2024b, p. 83).[8] By design, the e-SAF buyout price should allow for DAC to be profitable, but it does rely on DAC achieving projected cost reductions (though it is not explicit about projected DAC costs). E-SAF made using DAC CO2 is still expected to be among the most expensive sources of e-SAF (though one of the most scalable) therefore the size of the market for DAC e-SAF beyond mandated amounts will depend on whether other sources can meet demand.
To examine DAC costs compatible with the e-SAF buyout price, Figure 9.4 shows the resultant e-SAF price per tonne for a range of DAC CO2 values (y-axis, £0 – £1,000) with other costs (e.g. facilities, capex, green hydrogen, energy) aggregated into non-CO2 costs (x-axis, £1,500/t to £6,500/t). Two dashed lines are shown on the figure marking the buyout price of £6,250/t and the buyout price minus the assumed 20% premium on e-SAF, reflecting the potential margin that SAF producers would add to production costs. Removing the 20% premium from the buyout price of £6,250/tonne gives a production value of £5,100/tCO2. Conventional jet fuel in the UK costs broadly in the region of £1,000/t, making the maximum compatible e-SAF price in the region of £6,100/t, very close to the buyout price (Jet A1 Fuel, 2024).
A technoeconomic assessment of SAF through PtL estimated DAC CO2 as around 40% of the total cost of £5/litre e-fuel production (Rojas-Michaga, 2023). This set the non-CO2 cost around £3/litre, £3,750/t. Using Figure 9.4, we can see that with non-CO2 costs at £3,750/tonne, DAC CO2 could be around £400/tCO2 while being compatible with the e-SAF buyout price. This value of £400/tCO2 is well below the DAC costs of capture of solid DAC of £550/tCO2 in the central case discussed in section 0. Additionally, this value is the cost of sale and would therefore need to include the cost of transport, storage and profit. The central ETS price of £142/tCO2 forecast for 2040 would bring DAC costs into the compatible range but still without a profit margin. For liquid DAC, the central case has DAC costs around £340/tCO2, below this target compatible value of £400/tCO2 and therefore with potential for a profit margin. However, it should be noted again that the liquid DAC costs are more uncertain than the solid DAC costs and other international locations are more attractive than Scotland to liquid DAC developers.
In terms of potentially profitable solid DAC scenarios, low-cost electricity would bring the cost of solid DAC down into the £400 region prior to the ETS (Figure 7.3), and waste heat from co-located e-fuel production could bring it lower still (Figure 7.5). Co-location would also remove transport costs. A major advantage of DAC is that it can be flexible with respect to location (access to energy infrastructure will remain a constraint) though transport costs are only expected to be in the region of £20/tCO2 (value sensitive to distance) (ClimateXChange, 2024). The main location requirements are around space, grid capacity and access to green, low-cost electricity. These are all the same requirements as for e-fuel production so co-location would be a sensible option.
In terms of profit, it could be assumed that DAC was subsumed into the e-fuel production costs, therefore the 20% premium applied to the buyout price would effectively include the profit on DAC. If the DAC was a separately supplied feedstock, an additional 10% profit on top of the DAC costs would be in the region of £40-£55/tCO2. These numbers are of course highly uncertain and dependent on many factors but they do show a potential for DAC to be profitable as a source of CO2 for e-SAF.
Figure 9.4: Comparison of e-SAF costs (values shown in bands) depending on the cost of DAC CO2 (y-axis) and all other costs in e-fuel production (x-axis). Dashed lines are shown for the buyout price listed for e-SAF in the UK SAF mandate and for the buyout price minus an assumed 20% premium placed on production costs by suppliers.
Other impacts on DAC cost, market and potential profitability
The comparison between DAC costs (i.e. LCOD) and the buyout price shows that DAC costs modelled for Scotland could be compatible with e-SAF production. However, there are three key factors that would have a major impact on potential DAC profitability:
Competition in the market and profit margins, including the cost of conventional fuel
Cost of H2
Cost of energy
Firstly, as discussed above, to be compatible with an e-SAF cost of £6,100/t, DAC costs would need to come down to around £400/tCO2. From the projections in section 0, liquid DAC could be compatible with these values or solid DAC using either low-cost electricity (Figure 7.3) or waste heat from co-located e-fuel production (Figure 7.5). The projected central ETS price of £142 for 2040 would bring DAC CO2 costs down into the £100-£300/tCO2 region. However, e-SAF from DAC CO2 is still estimated to be one of the most expensive forms of e-SAF. The market will rely on there not being enough e-SAF from other sources, such as e-SAF generated from biogenic CO2 for DAC CO2 to be competitive, which the analysis for the UK SAF mandate projects to be around 2-4 times cheaper than PtL from DAC (Department for Transport, 2024b).
Secondly, the cost of H2 assumed in the central case of the Rojas-Michaga et. al paper is £3.59/kg H2 (Rojas-Michaga, 2023).The most recent ClimateXChange report looking into green hydrogen production in Scotland, titled ‘Cost reduction pathways of green hydrogen production in Scotland’, estimated green hydrogen production costs in the region of £3.4/kg H2 by 2045 (£4.1/kg H2 including transport). (ClimateXChange, 2023) The sensitivity analysis in the ClimateXChange work put 2045 values between £2.8/kg H2 and £5.9/kg H2 such that green hydrogen costs remain a major source of uncertainty in costs with the potential to limit the viability of the industry.
Thirdly, changes in the cost of energy would have major impacts on both DAC costs and e-fuel production costs. The Rojas-Michaga et al. study uses central costs of 6p/kWh based on the cost of electricity from wind, around half the projected cost of electricity in the Green Book but in line with the reduced cost electricity values used in Figure 7.3. (Rojas-Michaga, 2023). This low-cost electricity scenario would result in costs for solid DAC in the region of £400-£430/tCO2, and bring hydrogen costs to the low end of projected costs from the ClimateXChange report (ClimateXChange, 2023, p. 42). The triple impact of low-cost electricity on e-fuel production, DAC CO2 and green H2 production makes it a major lever in whether DAC and e-fuel production could be profitable within Scotland.
Shipping
Within the industry interviews conducted as part of this study and within literature, shipping was viewed as a second major market within the UK for e-fuels (International Energy Agency, IEA, 2024). Maritime transport has more options for fossil-free fuels than aviation due to weight and volume of fuel being less of an issue. The fuels discussed in relation to maritime decarbonisation are methane, methanol, hydrogen, ammonia and gas oil/diesel (Lloyd’s Register, UMAS, 2021). These fuels currently come from fossil fuels either directly using fossil feedstock or using fossil fuel energy, but they can be made sustainably, using clean energy and clean feedstocks (i.e. feedstocks obtained with clean energy).
Although there is an understanding that the shipping industry must decarbonise, there is no equivalent to the UK and EU SAF mandates that proscribe the percentage of sustainable fuels or e-fuels. The FuelEU Maritime mandate sets targets for reducing emissions from shipping but not to the level of detail of the SAF mandates (European Union, 2024). This section uses estimations from industry reports to understand the potential market for shipping e-fuels and the potential for DAC CO2 to be competitive in that market.
Demand for sustainable shipping fuels
Potential demand for shipping e-fuels was modelled based on projected demand for shipping fuels from current UK fuel demand data (Office for National Statistics, 2024), shipping projections from the CCC’s Sixth Carbon Budget (Committe on Climate Change, 2020) and industry projections on future fuel mixes (Lloyd’s Register, UMAS, 2021; Transport & Environment, 2024) . Demand within the UK fuel demand data is broken down into international, coastal and naval. Within this study, it is assumed that domestic shipping will largely electrify, with sustainable fuels prioritised for international shipping. Office for Nationals Statistics (ONS) data gives 2022 values of 8.3 Mtoe of fuel for shipping, split 75% fuel oil and 25% gas oil. Of the total demand, 81% is international, 16% coastal and 2% naval. This 81% demand for international shipping, 6.8 Mtoe, is the focus of the modelling for potential e-fuel demand in this study.
A 2019 report by Lloyd’s Register and UMAS set out a number of scenarios of the potential future mix of low-carbon shipping fuels: a renewable energy dominated pathway; a bioenergy dominated pathway, and a mixed pathway (Lloyd’s Register, UMAS, 2021). The central, mixed pathway (figure shown in Figure 12.812 in Appendix I) shows e-fuels reaching around 20% of demand by 2040 and 30% by 2050 but this covers all e-fuels including hydrogen and ammonia that are not carbon-based. A more recent publication from European Federation for Transport and Environment projects that e-ammonia will be the dominant e-fuel for shipping, covering around 80% of e-fuel demand with carbon-based fuels covering the remaining 20% (shown in Figure 12.13 in Appendix I) The projected mix from the Transport & Environment report suggests only a relatively brief 10-year role for e-diesel with a more permanent transition to e-methanol and e-LNG but with demand for any carbon-based e-fuels not picking up until 2040.
With carbon-based e-fuels not expected to come into the mix of shipping e-fuels until 2040, this would mean demand for carbon-based e-fuels for shipping across the UK would reach about 0.35 Mtoe by 2045, 0.5 Mtoe by 2050. With Scotland representing around 4% of international shipping in the UK, Scottish demand would be in the region of 14 ktoe in 2045, 20 ktoe in 2050. These values are lower than the values projected for e-SAF but ramp much more steeply between 2040 and 2045. Although fuel demand for shipping and aviation is similar, the fact that such a small portion of international UK shipping comes via Scotland (~4%) means that the shipping e-fuel market would be heavily driven by UK demand.
Demand for DAC CO2 for shipping
Of the potential future fuels for shipping, e-methanol, e-LNG plus e-gas oil and e-fuel oil are the carbon-based molecules that would lead to demand for DAC CO2. E-gas oil and e-fuel oil production is very similar to that for e-SAF discussed in section 0. The FT process could be optimised for shipping fuels such that a larger fraction of FT output was suitable, potentially up to 75% (Bezergianni, 2013). Synthetic forms of methane (e-LNG) and e-methanol can be produced via similar processes (i.e. combining hydrogen and CO2). E-methanol and e-LNG are not ‘drop-in’ fuels so would require new ships or retrofitting of propulsion system, although there are some ships that already use LNG.
Figure 9.5 shows projected demand for CO2 for shipping e-fuels for the UK (left) and Scotland (right). The ranges reflect the high and low renewable energy fuel pathways in the Lloyd’s & UMAS report and the split of e-fuels (i.e. ammonia, hydrogen, carbon-based fuels) projected in the 2024 Transport Environment report “E-fuels observatory for shipping” (Lloyd’s Register, UMAS, 2021; Transport & Environment, 2024).[9]
The central values in Figure 9.5 show CO2 demand in Scotland reaching towards 0.1 MtCO2 by 2050, around 2 MtCO2 in the UK as a whole. The values shown in these figures are based on CO2 demand from creating e-fuels in the form of e-gas oil and e-fuel oil via the FT process. E-LNG and e-methanol would require similar amounts of CO2 as they require less CO2 per tonne but have a lower energy density, meaning more fuel is needed.
As with CO2 demand for e-SAF, not all the CO2 for these fuels would come from DAC. Taking the same assumption as for e-SAF of 50% of CO2 demand coming from DAC, DAC demand would reach in Scotland 0.05 MtCO2 by 2050, around 1 MtCO2 in the UK as a whole. The Scottish demand would account for around 10% of the output from a 0.5 Mt plant, adding to the 20% demand from e-SAF. Scottish e-fuel demands for aviation and shipping would be projected to support a 0.15 Mt DAC plant by around 2040, but again if Scotland was supplying e-fuels to meet wider UK demands, DAC CO2 demand would be far above 0.5 Mt CO2.
Figure 9.5: Projected demand range for CO2 for e-fuel for shipping in the UK (left) and Scotland (right). The central line corresponds to the central ‘Equal mix’ scenario in the Lloyd’s & UMAS report with the coloured areas showing the range from the other scenarios (Lloyd’s Register, UMAS, 2021).
Potential profitability
The analysis above indicates that the market for DAC for carbon-based shipping e-fuels is a broadly around half the size of the market for e-SAF. However, with more options for net-zero compatible fuels there is more potential competition in the market and a lower cost ceiling than for e-SAF. Projections for shipping e-fuel costs are in the region of £1,500-£2,500/t, multiple times higher than current cost for shipping fuel but far below the costs for e-SAF discussed in section 9.3.5 (UMAS, 2023). This difference between projected shipping fuel purchase costs and projected production costs for e-fuels via the FT process presents a major challenge when considering e-fuels from DAC for shipping.
Despite this cost difference, the 2024 Transport & Environment report projects that around 20% of shipping e-fuels will be carbon based, initially mostly e-diesel then shifting to e-LNG with an ongoing role for e-methanol (Transport & Environment, 2024). A similar cost analysis to that carried out for e-SAF is shown in Figure 9.5, showing the resultant price per tonne for e-fuel oil produced via the FT process. The values are shown for a range of DAC CO2 values (y-axis, £0 – £700) with other contributing costs aggregated (e.g. facilities capex, green hydrogen, energy) into non-CO2 costs (x-axis, £0 to £3,000). From Figure 9.6 it is clear that e-fuel oil made from DAC via the FT process is highly unlikely to come into the region of £1,500-£2,500/t.
For DAC-based e-gas oil and e-fuel oil to reach these values, not only would DAC costs have to be substantially lower than the central projections in this study, but green hydrogen and e-fuel production costs would also need to be much lower than current estimates. Much lower electricity costs would result in green hydrogen and e-fuel production costs being greatly reduced; zero-cost energy (likely using waste heat and zero-cost electricity) would bring DAC costs into the region of £300/tCO2, costs that are still far above being compatible with the £1,500-£2,000/t.
The ETS price would have a potential impact on whether shipping e-fuels were a potential market for DAC. In 2040, the central price is projected to be £142/tCO2e, with the high price at £169/tCO2e. If the other costs associated with e-fuel production could be brought into the region of £1,500-£2,000/tonne, DAC costs would need to be in the region of £100-£200/tCO2. These DAC values are still well below the most ambitious estimates for DAC costs presented in section 0, which reach as low as around £300/tCO2 but with a carbon price of £142/t, fuels produced from DAC CO2 could potentially enter the market.
In conclusion, shipping e-fuels being a market for DAC CO2 is likely to rely on a combination of the following:
Costs of e-fuel production being at the lowest end of current estimates, which would include the cost of DAC CO2 and green hydrogen being at the lowest end of current estimates
ETS prices being in the central or high range, or being greatly increased so that it effectively covers the cost of DAC
If an e-fuel production plant does not have access to biogenic or fossil CO2, the flexibility of DAC could make DAC CO2 the most economic (or only) option
sites were located near renewable energy sources but away from other CO2 sources such as industrial sites
Demand for sustainable fuels being high and driving up market prices.
Figure 9.6: Comparison of e-fuel oil costs for shipping (values shown in bands) depending on the cost of DAC CO2 (y-axis) and all other costs in e-fuel production (x-axis).
Drinks industry
The food and drink industry, and particularly the carbonated drink industry is of interest for DAC for several reasons:
The food and drink industry is a major UK consumer of CO2 in the UK
DAC can produce very pure CO2 meaning it is suitable for food and drink grade CO2
The carbonated drinks industry (e.g. soft drinks and beer) has a high mark up on products, especially compared to an industry like horticulture or construction materials
There is a market for premium products within the industry.
The market for premium products within the drinks industry is of particular interest as there is potentially a market for products that are greener or more ethical, a ‘green premium’. Typical examples that are already active in the market are organic or fair-trade products. We have used this idea of a green premium to understand how the higher cost of CO2 from DAC might be absorbed into product costs.
Additionally, there is already proven interest in DAC within the drinks industry with Coca Cola partnering with Climeworks and more recently investing in UK DAC company Airhive to supply DAC CO2 to replace fossil-derived CO2 at a production site (AP Ventures, 2024; The Chemical Engineer, 2018).
Current demands for CO2 and potential demand for DAC
Industry reports suggest the UK food and drink industry consumes in the region of 300-360 ktCO2 annually (Food & Drink Federation, 2019). As this demand is UK-wide, demand will not be spatially concentrated enough to support a 0.5 Mt DAC plant in Scotland. However, the potential size of the market is still considered and the potential for profitability as it is a market area where DAC CO2 is of interest.
The primary uses of CO2 in the food and drinks industry are carbonating drinks, chilling and packaging, transporting food and stunning animals. As discussion in section 9.1.2, as other CO2 sources are reduced, all these markets will need alternative sources of CO2 but the carbonated drinks industry is the most interesting for DAC. In Table 9.1, estimations are shown for the demand for CO2 within the soft drinks industry across the UK. These values add up to only 46-77 ktCO2 across the UK, information on the portion of this that is attributable to Scotland is not easily available so an assumption of 10% is made, broadly in line with population. A Scottish demand of 4.6-7.7 ktCO2 would only account for 1-2% of annual CO2 generation from a 0.5 Mt DAC plant and would therefore not be a major market.
Table 9.1: Calculation of CO2 requirement for UK soft drink and beer industries.
Metric
Soft drinks
Beer
Annual UK production
5,923 million litres (British Soft Drinks Association, 2024)
3,420 million litres (Statista, 2024)
CO2 required per litre
6-8 g/litre
4-10 g/litre (The Beer Store, 2024)
CO2 required for annual UK production
36-47 ktCO2
14-34 ktCO2
Potential profitability
The price of CO2 for utilisation discussed in interviews within this study were in the region of £100-£300/tCO2 though a broader range of up to £900 over recent years was discussed, with higher values again reported in the media (Energy & Climate Intelligence Unit, 2022). Food-grade CO2 commands a higher price than industrial CO2 due to its higher purity requirements.
To understand potential profitability of DAC in this market, we have considered the impact of changes in the cost of CO2 on the overall cost of the product. The cost of CO2 is estimated to be around 0.5%-1.5% of total production cost based on the costs in Table 9.1; much smaller than the portion of costs for e-fuels. Figure 9.7 shows the CO2 costs that would be compatible with 2% and 5% increases in production costs; the values are shown as ranges to reflect fluctuations in current costs, estimated to be £200-£300/tCO2. The 2% increase could be considered a green premium or simply a change in production costs, a 5% increase is more representative of a green premium that would to be passed on to customers by marketing the product as a green product.
The value of this green premium depends heavily on the product and the price of the product and varies country to country (Boston Consulting Group, 2023). PwC research giving a value of 9.7% for a green premium was focused shopping habits and is therefore more appropriate for the drinks market (PwC, 2024). Consumer research into green premiums gives values around 10% are but the full 10% has not been applied in the analysis here as other aspects of the production would presumably need to be ‘greened’ and the associated costs for those would also need to be included (PwC, 2024).
The most obvious insight from Figure 9.7 is that the projected DAC CO2 costs in section 0 are comfortably in the ranges shown. This contrast with e-fuels is because CO2 makes up a much smaller portion of the total cost than it does for e-fuels; drinks products that use less CO2 can naturally accommodate higher costs. When CO2 costs spiked, media reported that costs reached £2,000-£3,000t/CO2, easily increasing production costs by 10% for drinks and understandably causing issues in supply chains (Energy & Climate Intelligence Unit, 2022).
Figure 9.7: Range of DAC costs compatible with the carbonated drinks industry
The scenarios along the x-axis show various combinations of green premiums on drinks from using DAC depending on the percentage production costs CO2 currently makes up. The range in each scenario reflects uncertainty and fluctuations in current costs, assumed to be in the region of £200-£300/tCO2.
The values presented in Figure 9.7 demonstrate that the carbonated drinks industry is highly compatible with the cost of CO2 from DAC and could likely be profitable. However, the market size means that this would only be on the scale of a few kilo tonnes.
Construction materials
Construction materials come up consistently in discussions about carbon storage and utilisation because it is large-volume market and offers multi-decade storage potential. Additionally, construction materials offer an early market for CO2 while other markets, like e-fuels, are still developing. However, a market size or understanding the role of DAC is difficult to quantify. Additionally, construction materials are a low-value industry, making absorbing additional costs very difficult.
A key niche for ‘green’ construction materials is turning waste products into useful materials. Carbon8 make use of reactive residues come from processes like energy from waste, biomass, and the steel and paper industries, reacting them with CO2 captured from the same process to form aggregates that can be used in construction (Carbon8, 2024). A major financial value in this process comes from savings in waste disposal. These savings, combined with a market for the product and a carbon price, create a market for the CO2-storing product.[10] Currently, the CO2 used is collected onsite via CCS, limiting the role of DAC. However, as the market grows, so would the demand for CO2; not all sites may be suitable for CCS and a portion may choose to bring in CO2 from elsewhere, creating a role for DAC.
For cement and concrete, CO2 can be stored when the material is cast or when a structure is demolished and the concrete is reused. Quantification of the CO2 stored in concrete needs to be carefully considered: standard concrete contains some carbon and naturally reacts with CO2 in the air. For carbon capture and storage, the material has to store additional carbon to the amount that it would in standard use. Adding CO2 to cement has been advertised as enhancing the strength of the concrete but this depends heavily on the production process to ensure the concrete is not weakened instead (Fu, 2024).
Potential role for DAC CO2
There are currently no figures for projected CO2 demand in the construction industry and even Scotland-specific demand for construction materials is difficult to find data on. The UK datasets on demand for building and construction materials aggregates demand for Scotland and Wales, ranging from 6%-9% of UK demand (Department for Business and Trade, 2024). The IEA’s 2019 report ‘Putting CO2 to Use’ stated that companies creating products from industrial waste and CO2 were consuming around 75 kt/year globally, with UK-based Carbon8 storing 5 ktCO2/year in 2019 (IEA, 2019). By 2021, Carbon8 was producing 300 kt/year of aggregates, which would capture around 10%-20% CO2 per weight, therefore storing in the region of 10-20 ktCO2/year (University of Greenwich, 2021). However, this CO2 demand is largely met by the processes that produce the industrial waste and additional demand for CO2 may be limited.
The role for DAC in this process would be where there is not sufficient local CO2 demand or where onsite capture is not practical, for example it is too expensive and disruptive to install carbon capture, or space is limited. In these cases, DAC CO2 could be transported, but costs would need to be competitive.
Potential market size
Aggregates
Scotland produces around 21 Mt of aggregates per year, mainly from quarries but also from construction and demolition waste. The Carbon8 project generates aggregates from waste materials, with a market size more likely to be dictated by the availability of reactive waste materials than driven by the overall size of the aggregates market.
If we take energy from waste (EfW) as an example: 1.62 Mt of waste was incinerated in Scotland in 2023, a four-fold increase since 2011 (Scottish Government, 2024). The waste output from EfW is 20%-30% of the input by weight, therefore around 0.3-0.5 Mt of EfW waste outputs is generated annually in Scotland. If we again apply a 15% CO2 uptake to this waste output, we have a CO2 demand in the region of 0.05-0.07 Mt of CO2. Most of the CO2 needed for this process would be expected to come from the EfW process itself, even if 10% of this demand came from DAC to top up local supply, which would only generate a few kilo tonnes of DAC demand annually. Therefore, demand from processes industrial waste is not likely to contribute significantly to DAC demand in Scotland and would not be a driver for a 0.5 Mt DAC plant.
Cement
The UK consumes in the region of 15 Mt/year of cement, with Scottish and Welsh demand together accounting for 6%-9% annually (Statista, 2024). If we take Scottish consumption to be around 4% of the UK’s, we have a value for Scottish cement demand of 0.6 Mt/year. The potential CO2 uptake of cements depends on the chemical make-up, ranging between 8% and 25%, here we take 15% as a central value. (Hanifa, 2023) The theoretical maximum CO2 demand for Scottish cement would therefore be around 90 ktCO2/year. The portion of cement that is treated to store CO2 will depend on a market for green products, driven somewhat by consumer choice but most likely by legislative requirements to use lower-carbon building products.
As with aggregates, most CO2 for this process would be expected to come from carbon capture on local process, rather than DAC, and even then, local DAC with minimal transport may be preferable. As such, cement will not be a major driver for a DAC plant in the region of 0.5 Mt but could contribute early demand or drive demand for smaller, dispersed DAC plants.
Cost compatibility and potential profitability
Industry discussion within this project indicated that current CO2 prices in the region of £100-£300 were compatible with the market for incorporating into construction materials. The high end of this compatible range is at the very low end for projected solid DAC costs in the UK.
As with the shipping e-fuels industry, cost compatibility of DAC is likely to rely on either or both of a high ETS price or legislation. The ETS price would need to make up the difference between the £100-£300 range and the solid DAC price, projected to be in the region of £550, potentially higher if this demand is coming earlier than 2040. The current projected ETS of £142 in 2040 would not bring the solid DAC CO2 price in line with this range; an ETS price in the region of £250-£350 would be needed to bring DAC prices into this compatible range.
Conclusions
Scaling DAC requires overcoming technical, economic and logistical challenges. Key advances in air contactor design, sorbent efficiency and integration with renewable and waste heat are driving progress. However, high energy demands, market uncertainty and supply chain constraints remain significant barriers. For DAC to fulfil its potential, policy intervention, infrastructure development and a stable CO₂ market will be essential. With continued research and real-world deployment, DAC can play a pivotal role in meeting net zero goals.
The key aim of this study was to understand whether a DAC plant would be profitable in Scotland and under what conditions, and to understand the likelihood of those conditions where possible.
Research and development trends in DAC
DAC technology is advancing rapidly, with research focused on enhancing efficiency, reducing costs and improving integration with renewable energy and waste heat. Innovations in air contactor designs aim to optimise geometries and reduce capital costs, while ongoing work on sorbents and solvents targets scalable, cost-effective materials that maximise capture rates and minimise regeneration energy demands. New approaches to regeneration processes are exploring modular, low-energy solutions that can be optimised for climates and operational scales.
Integration with other energy systems is an area of future focus but research so far has been limited, partially by commercially sensitivity around sharing details of processes. Leveraging waste heat from processes like green hydrogen and e-fuel production could significantly offset DAC’s substantial thermal energy requirements but these technologies are also not yet developed at scale.
Limiting factors in DAC deployment
High energy demands and costs remain primary obstacles, with regions offering stable, low-cost energy (e.g., Iceland and Texas) better positioned for deployment than those with higher energy prices, such as the UK. The current reliance on volatile voluntary carbon markets adds further uncertainty, underscoring the need for government policy to provide confidence in a long-term market.
Additional hurdles include planning delays, including the fear of delays and difficulties, and the immature state of CO₂ transport and storage infrastructure. While cooler, drier climates provide marginal advantages, they are secondary to the broader economic and logistical barriers.
Cost of DAC deployment
The most obvious insight from the modelling in this study on the cost of DAC is that liquid DAC is projected to be cheaper than solid DAC in terms of costs per tonne of CO2 captured because of lower capex costs and lower energy costs. The central scenario in this study projects costs of capture (i.e. not including transport, storage or profit) in the region of £550/tCO2 for solid DAC and £340/tCO2 for liquid DAC. This is focussed on Scotland in 2040, assuming a global deployment level of 15 Mt. These central values carry significant uncertainty, particularly to overall learning rates, but also to the cost of key elements such as materials capex and energy costs.
Energy costs are the biggest contributor to the cost of DAC as modelled in this study, accounting for around half of the total costs. Although energy costs are higher for solid DAC than liquid DAC, there is more scope for reducing energy costs in solid DAC through the use of low-cost electricity and waste heat due the fact that solid DAC relies more on electricity and operates at a much lower temperature than liquid DAC allowing a bigger role for waste heat.
The waste heat sources considered specifically in this study were green hydrogen production and e-fuel production via the Fischer-Tropsch process, the process used to make e-fuels such as synthetic aviation fuel from CO2 and hydrogen. With e-fuels considered a major future market for DAC CO2, and Scotland considered an attractive location for these industries (especially within the UK), co-location of these three industries is very plausible, especially due to the major impact on the cost of DAC.
The option to use hydrogen instead of natural gas to provide the high temperatures needed for liquid DAC was also investigated. Using hydrogen pushes up the cost of liquid DAC by around 30% but even with this increase it is still cheaper than solid DAC, if that solid DAC is relying on grid-cost electricity.
An additional sensitivity was performed to understand the impact of financing costs on the cost of DAC by increasing the financing rates from 3.5%, in line with social discounting rates (DESNZ, 2024) to more commercial levels of 10% (UK Government, 2021). In this sensitivity, the cost of both solid and liquid DAC is increased significantly by the increase in required rates of return on capex investments highlighting that the cost of DAC will depend heavily on how the initial capex is funded.
International comparison
The cost of solid and liquid DAC in Scotland is compared to other potentially suitable, international locations. While liquid DAC is estimated to be cheaper than solid DAC per tonne of CO2 removed, the findings of the international comparison showed that Scotland was the most expensive of the regions investigated for liquid DAC, while Scotland was more favourable than many countries for solid DAC. This insight was in line with discussions within expert interviews in this study that indicated that Scotland and wider UK were not target locations for deploying liquid DAC, though this picture could change over time. Additionally, whilst liquid DAC has been estimated to be cheaper, the use of natural gas for its heat requirements may encounter challenges due to societal acceptance and political opposition to the continued use of fossil fuels.
Market opportunities and potential profitability
The conclusions from this study highlighted that there is a future market for DAC in Scotland broadly in the region of 0.15 Mt by 2040, not enough to make a 0.5 Mt DAC plant profitable for utilisation alone. Two key factors could make a plant of that scale profitable: demand for e-fuels from the rest of the UK or generating revenue from sending most of the captured CO2 to storage. Scotland’s clean energy resources, most notably offshore wind, offer key advantages for allowing DAC to be profitable especially when placed alongside other technologies such as green hydrogen and e-fuel production that could offer waste heat.
Synthetic fuels, especially sustainable aviation fuels (e-SAF), offer the most obvious market for DAC CO2 in Scotland, though it does not currently have specific requirements for DAC. In this study, we estimate that by 2040, DAC CO2 demand for e-SAF would be around 0.09 MtCO2 in Scotland and 1.3 MtCO2 for the wider UK but these values are ambitious based on DAC supplying a large share of the CO2 used. The projected cost of liquid DAC would be compatible with the buyout price for e-SAF, with the compatibility of solid DAC relying on the ETS price and potentially lower fuel costs or waste heat to be profitable
DAC demand from shipping fuels was projected to be lower than for e-SAF (~0.05 Mt for Scotland, 1 Mt for UK) due to there being more options for net-zero compatible fuels, with a knock-on effect on the price that would be paid for fuels. Consequently, not only would DAC costs need to be much lower but so would the other costs for e-fuel production, i.e. energy costs and green hydrogen production.
Carbonation for the drinks is a small but potentially highly profitable market for DAC and could support early development. However, the market is small, only a few kilo tonnes in Scotland, so it would not drive demand for a large-scale plant.
Construction materials come up consistently in discussion, but the potential market is hard to quantify, especially in a large-volume but low-margin industry. The demand for CO2 could be in the region of tens of kilo tonnes but much of this is expected to be generated and reused on-site rather than bought in from DAC. DAC could play a role in topping up on-site supply, but this demand is not likely to drive DAC demand on a large scale.
Future considerations for DAC in Scotland
Below are a set of future considerations for each of the sections within this study, highlighting areas that are likely to evolve over coming years or that could have a major impact on the potential profitability of DAC in Scotland.
Future considerations for R&D:
Monitor key developments in DAC that would lead to major changes in technology, the most obvious examples being:
Economies of scale balance against reduced storage and transport costs by building smaller plants locally to CO2 demand
Energy demand reductions that could address the high energy costs associated with DAC
Alternative regeneration technologies where that required less energy or allowed lower regeneration temperature for liquid DAC, eliminating the need for gas and the resultant carbon emissions
Monitor the insights gained from deployments and whether they affect any key assumptions in DAC cost calculations and market assumptions
Encouraging and facilitating co-operation between industries such as DAC companies, e-fuel companies and those developing green hydrogen facilities to understand the potential to use waste heat in DAC.
Future considerations for limiting factors:
Continue to engage with DAC providers, especially with regards to the planning process
Communicate where there is an expected market for DAC (both geographically and in which markets) and engage with suppliers to understand key limiting factors for that site.
Future considerations for the cost of DAC:
Monitor global deployment levels and learning rates, two of the major contributors to DAC cost reductions; R&D will feed strongly into learning rates
Ongoing consideration of energy prices on DAC, and how changes such as zonal pricing would affect DAC costs
Opportunities to co-locate DAC plants with waste heat sources, particularly green hydrogen and e-fuel production.
Future considerations for the market for DAC CO2:
Monitor relevant details within policies, such as the target for DAC CO2 in the UK SAF mandate
Seek to understand how DAC demand and generation will be spread across the UK. For example, if e-SAF production using DAC will be focused on a small number of sites, such that a DAC plant in Scotland would a meet a significant portion of UK demand.
Monitor signalling from maritime agencies and governments on the predicted role of e-fuels in shipping. For example, if ammonia began to be viewed less favourably, the role of sustainable carbon-based shipping fuels would increase
Engage with the chemical industry to understand the role of externally generated CO2 in future processes.
References
Acorn, 2021. Acorn Project Partner Update. [Online] Available at: https://theacornproject.uk/news-and-events/acorn-project-partner-update
Acorn, 2024. Capturing the Economic Potential: Maximising the Positive Impact of the Scottish Cluster. [Online] Available at: https://theacornproject.uk/assets/images/Scottish-Cluster-Economic-Potential_Email.pdf
Acorn, 2024. First Minister John Swinney visits the Acorn Project. [Online] Available at: https://theacornproject.uk/news-and-events/first-minister-john-swinney-visits-the-acorn-project
Advanced Science News, 2021. Electro swing direct air capture. [Online] Available at: https://www.advancedsciencenews.com/electro-swing-direct-air-capture/
AGU, 2018. Negative Emission Potential of Direct Air Capture Powered by Renewable Excess Electricity in Europe. [Online] Available at: https://agupubs.onlinelibrary.wiley.com/doi/full/10.1029/2018EF000954
An, K., 2022. The impact of climate on solvent-based direct air capture systems. Applied Energy, Volume 325, p. 119895.
Anon., 2022. OGV Energy. [Online] Available at: https://ogv.energy/news-item/3m-funding-boost-to-accelerate-innovative-smart-direct-air-capture-technology/ [Accessed 21 March 2025].
Anon., 2024. Energy Statistics for Scotland – Q1 2024. [Online] Available at: https://www.gov.scot/publications/energy-statistics-for-scotland-q1-2024/pages/electricity-generation-emissions/ [Accessed March 2025].
Anon., n.d. B9 Energy Projects. [Online] Available at: https://b9energy.co.uk/projects/ [Accessed 21 March 2025].
Anyanwu, J.-T., 2020. Amine-Grafted Silica Gels for CO2 Capture Including Direct Air Capture. Industrial & Engineering Chemistry Research, 59(15), pp. 7072-7079.
AP Ventures, 2024. Airhive. [Online] Available at: https://apventures.com/news/airhive-announces-new-investment-from-ap-ventures-and-coca-cola-europacific-partners-to-accelerate-deployment-of-its-direct-air-capture-technology [Accessed August 2024].
Argus, 2023. Brazilian natural gas pipeline prices flip. [Online] Available at: https://www.argusmedia.com/en/news-and-insights/latest-market-news/2481555-brazilian-natural-gas-pipeline-prices-flip
Australian Energy Regulator, 20224. Gas market prices. [Online] Available at: https://www.aer.gov.au/industry/registers/charts/gas-market-prices [Accessed 2021].
BEIS, 2021. UK Net Zero Strategy, s.l.: s.n.
Bezergianni, S., 2013. Comparison between different types of renewable diesel. Renewable and Sustainable Energy Reviews, Volume 21.
Bharti, S., 2021. Potential of E-Fuels for Decarbonization of Transport Sector. In: Greener and Scalable E-fuels for Decarbonization of Transport. s.l.:Springer Nature, pp. 9-32.
Boston Consulting Group, 2023. Green Awakening: Are Consumers Open to Paying More for Decarbonized Products?. [Online] Available at: https://www.bcg.com/publications/2023/consumers-are-willing-to-pay-for-net-zero-production [Accessed October 2024].
Brethomé, F. M., 2018. Direct air capture of CO2 via aqueous-phase absorption and crystalline-phase release using concentrated solar power. Nature Energy, Volume 3, pp. 553-559.
British Soft Drinks Association, 2022. 2022 Annual Report. [Online] Available at: https://www.britishsoftdrinks.com/write/MediaUploads/BSDA_2022_Annual_Report.pdf
British Soft Drinks Association, 2024. 2024 Annual Report. [Online] Available at: https://www.britishsoftdrinks.com/write/MediaUploads/BSDAAnnualReport2024.pdf
Building Research Establishment, 2020. Potential sources of waste heat for heat. [Online] Available at: https://www.climatexchange.org.uk/wp-content/uploads/2023/09/waste-heat-sources-for-heat-networks-scotland-final-nov-20.pdf
Carbon8, 2024. Carbon8. [Online] Available at: Annual production of beer in the United Kingdom (UK) from 2002 to 2023 [Accessed November 2024].
cdr.fyi, 2024. Key metrics. [Online] Available at: https://www.cdr.fyi/ [Accessed December 2024].
Climatescope, 2024. Power sector results. [Online] Available at: https://www.global-climatescope.org/results
ClimateXChange, 2023. Cost reduction pathways of green hydrogen. [Online] Available at: https://www.climatexchange.org.uk/wp-content/uploads/2024/01/CXC-Cost-reduction-pathways-of-green-hydrogen-production-in-Scotland-%E2%80%93-total-costs-and-international-comparisons-Jan-2024.pdf
ClimateXChange, 2024. Onshore and inshore storage of carbon dioxide. [Online] Available at: https://www.climatexchange.org.uk/wp-content/uploads/2024/07/CXC-Onshore-and-inshore-storage-of-carbon-dioxide-July-2024.pdf
Climeworks, 2015. Climeworks’ first industrial-scale direct air capture plant in Hinwil. [Online] Available at: https://climeworks.com/news/climeworks-builds-first-commercial-scale-direct-air-capture-plant [Accessed August 2024].
Climeworks, 2022. Carbon Dioxide Removal by Direct Air Capture. [Online] Available at: https://climeworks.com/uploads/documents/direct-air-capture-methodology_climeworks_2022.pdf
Climeworks, 2023. Supercharging carbon removal: a focus on direct air capture technology. [Online] Available at: https://climeworks.com/uploads/documents/climeworks-industry-snapshot-3.pdf
Climeworks, 2024. The reality of deploying carbon removal via direct air capture in the field. [Online] Available at: https://climeworks.com/news/the-reality-of-deploying-direct-air-capture-in-the-field [Accessed August 2024].
Committe on Climate Change, 2020. The Sixth Carbon Budget: Shipping. [Online] Available at: https://www.theccc.org.uk/wp-content/uploads/2020/12/Sector-summary-Shipping.pdf [Accessed December].
Committee on Climate Change, 2020. The Sixth Carbon Budget: Aviation. [Online] Available at: https://www.theccc.org.uk/wp-content/uploads/2020/12/Sector-summary-Aviation.pdf [Accessed December].
Committee on Climate Change, 2025. The Seventh Carbon Budget. [Online] Available at: https://www.theccc.org.uk/wp-content/uploads/2025/02/The-Seventh-Carbon-Budget.pdf [Accessed 26 February 2025].
Cooper, J., Dubey, L. & Hawkes, A., 2022. Methane detection and quantification in the upstream oil and gas sector: the role of satellites in emissions detection, reconciling and reporting. Environmental Science: Atmospheres, Volume 2, pp. 9-23.
Delgado, H. E., 2023. Techno-economic analysis and life cycle analysis of e-fuel production using nuclear energy. Journal of CO2 Utilisation, Volume 72.
Department for Business and Trade, 2024. Building materials and components statistics: November 2024. [Online] Available at: https://www.gov.uk/government/statistics/building-materials-and-components-statistics-november-2024 [Accessed December 2024].
Department for Business, Energy & Industrial Strategy, 2020. Carbon Capture, Usage and Storage. [Online] Available at: https://assets.publishing.service.gov.uk/media/5f36c6df8fa8f51744decfe4/CCUS-government-response-re-use-of-oil-and-gas.pdf [Accessed October 2024].
Department for Business, Energy and Industrial Strategy, 2023. Cluster sequencing Phase-2: Track-1 project negotiation list, March 2023. [Online] Available at: https://www.gov.uk/government/publications/cluster-sequencing-phase-2-eligible-projects-power-ccus-hydrogen-and-icc/cluster-sequencing-phase-2-track-1-project-negotiation-list-march-2023
Department for Energy Security & Net Zero, 2023. [Online] Available at: https://www.gov.uk/government/publications/traded-carbon-values-used-for-modelling-purposes-2023/traded-carbon-values-used-for-modelling-purposes-2023
Department for Transport, 2024a. Supporting the transition to Jet Zero: Creating the UK SAF Mandate. [Online] Available at: https://assets.publishing.service.gov.uk/media/66cf1f99a7256f1cd83a89c1/creating-the-UK-saf-mandate-consultation-response.pdf
Department for Transport, 2024b. Sustainable Aviation Fuel Mandate: Final stage Cost Benefit Analysis. [Online] Available at: https://assets.publishing.service.gov.uk/media/66601969dc15efdddf1a872d/uk-saf-mandate-final-stage-cost-benefit-analysis.pdf
DESNZ, 2023. Boost for offshore wind as government raises maximum prices in renewable energy auction. [Online] Available at: https://www.gov.uk/government/news/boost-for-offshore-wind-as-government-raises-maximum-prices-in-renewable-energy-auction
DESNZ, 2024. Green Book supplementary guidance: valuation of energy use and greenhouse gas emissions for appraisal. [Online] Available at: https://www.gov.uk/government/publications/valuation-of-energy-use-and-greenhouse-gas-emissions-for-appraisal
Duetz, S., 2021. Life cycle assessment of industrial direct air capture process based on temperature-vacuum swing adsorption. Nature Energy, 6(2), pp. 203-213.
Ecofys, 2017. Assessing The Potentail of CO2 Utilisation in The UK. [Online] Available at: https://assets.publishing.service.gov.uk/government/uploads/system/uploads/attachment_data/file/799293/SISUK17099AssessingCO2_utilisationUK_ReportFinal_260517v2__1_.pdf
Energy & Climate Intelligence Unit, 2022. Gas prices adding £1.7 billion to cost of beer and bangers. [Online] Available at: https://eciu.net/media/press-releases/2022/gas-prices-adding-1-7-billion-to-cost-of-beer-and-bangers [Accessed August 2024].
European Commission, 2023. European Green Deal: new law agreed to cut aviation emissions by promoting sustainable aviation fuels. [Online] Available at: https://ec.europa.eu/commission/presscorner/detail/en/ip_23_2389
European Union, 2024. Decarbonising maritime transport – FuelEU Maritime. [Online] Available at: https://transport.ec.europa.eu/transport-modes/maritime/decarbonising-maritime-transport-fueleu-maritime_en [Accessed August 2024].
Expert Market Research, 2023. United Kingdom Carbon Dioxide Market Size. [Online] Available at: https://www.expertmarketresearch.com/reports/united-kingdom-carbon-dioxide-market
Fasihi, M., 2016. Techno-Economic Assessment of Power-to-Liquids (PtL) Fuels Production and Global Trading Based on Hybrid PV-Wind Power Plants. Dusseldorf, Energy Procedia.
Food & Drink Federation, 2019. Falling flat: lessons from the UK 2018 CO2 shortage. [Online] Available at: https://www.fdf.org.uk/globalassets/resources/publications/falling-flat-lessons-from-the-2018-uk-co2-shortage.pdf
Food and Drink Federation, 2019. Falling flat: lessons from the 2018 UK CO2 shortage. [Online] Available at: https://www.fdf.org.uk/globalassets/resources/publications/falling-flat-lessons-from-the-2018-uk-co2-shortage.pdf
Fu, X., 2024. Storing CO2 while strengthening concrete by carbonating its cement in suspension. Communications Materials, 5(1), p. 109.
Ge, B., 2024. Innovative process integrating high temperature heat pump and direct air capture. Applied Energy, Volume 355, p. 122229.
Green Air, 2025. Bridging the Hydrogen and eSAF policy gap in the UK and EU. [Online] Available at: https://www.greenairnews.com/?p=6688 [Accessed March 2025].
Hanifa, M., 2023. A review on CO2 capture and sequestration in the construction industry: Emerging approaches and commercialised technologies. Journal of CO2 Utilisation, Volume 67, p. 102292.
Heirloom, 2022. A fundamental breakthrough in carbon mineralization. [Online] Available at: https://www.heirloomcarbon.com/news/a-fundamental-breakthrough-in-carbon-mineralization
Heirloom, 2022. A scalable direct air capture process based on accelerated weathering of calcium hydroxide. [Online] Available at: https://uploads-ssl.webflow.com/6041330ff151737fb03fc474/62447e0fcdc47145c3471d91_Heirloom%20White%20Paper.pdf
Huo, J., 2022. Net-zero transition of the global chemical industry with CO2-feedstock by 2050: feasible yet challenging. Green Chemistry, Issue 1, pp. 415-430.
ICAP, 2022. United Kingdom. [Online] Available at: https://icapcarbonaction.com/system/files/ets_pdfs/icap-etsmap-factsheet-99.pdf
IEA, 2019. Putting CO2 to Use. [Online] Available at: https://iea.blob.core.windows.net/assets/50652405-26db-4c41-82dc-c23657893059/Putting_CO2_to_Use.pdf
IEA, 2024. Direct Air Capture. [Online] Available at: www.iea.ord/energy-system/carbon-capture-utilisation-and-storage-direct-air-capture
IEA, 2024. Tracking Direct Air Capture. [Online] Available at: https://www.iea.org/energy-system/carbon-capture-utilisation-and-storage/direct-air-capture
indexmundi, 2024. Natural Gas Monthly Price. [Online] Available at: https://www.indexmundi.com/commodities/?commodity=natural-gas&months=60
Innovate UK, 2024. Sustainable Carbon Ambition for the UK Chemicals Industry. [Online] Available at: https://iuk-business-connect.org.uk/wp-content/uploads/2024/08/IUK-Sustainable-Carbon-Report.pdf [Accessed March 2025].
International Energy Agency, IEA, 2024. The Role of E-fuels in Decarbonising Transport. [Online] Available at: https://iea.blob.core.windows.net/assets/a24ed363-523f-421b-b34f-0df6a58b2e12/TheRoleofE-fuelsinDecarbonisingTransport.pdf
International Trade Administration, 2024. European Union Aerospace and Defense Sustainable Aviation Fuel Regulation. [Online] Available at: https://www.trade.gov/market-intelligence/european-union-aerospace-and-defense-sustainable-aviation-fuel-regulation#:~:text=Beginning%20in%202025%2C%20fuel%20uplift,the%20EU%2C%20regardless%20of%20destination
Jet A1 Fuel, 2024. Jet a1 price United Kingdom. [Online] Available at: https://jet-a1-fuel.com/price/united-kingdom [Accessed November 2024].
Keith, D. W., 2018. A process for Capturing CO2 from the Atmosphere. Joule, 2(8), pp. 1573-1594.
Koumparakis, C., 2025. Utilization of excess heat in future Power-to-X energy hubs through sector-coupling. Applied Energy, 377(124098).
Kwon, H. T., 2019. Aminopolymer-Impregnated Hierarchical Silica Structures: Unexpected Equivalent CO2 Uptake under Simulated Air Capture and Flue Gas Capture Conditions. Chemistry of Materials, 31(14), pp. 5229-5237.
Lennon, K., 2024. Chapter 4: Natural Gas. [Online] Available at: https://assets.publishing.service.gov.uk/media/66a7aeb0fc8e12ac3edb0646/DUKES_2024_Chapter_4.pdf
LPG Price monitoring agency, 2024. Price in Chile in 2021. [Online] Available at: https://lpg-price.com/natural-gas/lng-price-chile
Marchese, M., 2020. Energy performance of Power-to-Liquid applications integrating biogas upgrading, reverse water gas shift, solid oxide electrolysis and Fischer-Tropsch technologies. Energy Conversion and Management, Volume 6, p. 10041.
Mazurova, K., 2023. Fischer–Tropsch Synthesis Catalysts for Selective Production of Diesel Fraction. MDPI, 13(8).
McQueen et al., 2021. A review of direct air capture (DAC): scaling up commercial technologies and innovating for the future.
McQueen, N., 2020. Ambient weathering of magnesium oxide for CO2 removal from air. Nature Communications, 11(1), p. 3299.
Mostafa El-Shafie, 2023. Hydrogen production by water electrolysis technologies: A review. Results in Engineering, Volume 20, p. 101426.
Mukherjee, S., 2019. Trace CO2 capture by an ultramicroporous physisorbent with low water affinity. Science Advances, 5(11).
National Grid, 2024. National Grid: Live. [Online] Available at: https://grid.iamkate.com/
North Sea Transition Authority, 2022. Carbon footprint of UK natural gas imports. [Online] Available at: https://www.nstauthority.co.uk/media/5tib5x4n/nsta-gas-import-fact-sheet.pdf
Noya, 2024. About Noya. [Online] Available at: https://www.noya.co/press
Office for National Statistics, 2024. Energy use: by industry, source and fuel. [Online] Available at: https://www.ons.gov.uk/economy/environmentalaccounts/datasets/ukenvironmentalaccountsenergyusebyindustrysourceandfuel [Accessed August 2024].
Office for National Statistics, 2024. Profitability of UK companies – rates of return and revisions. [Online] Available at: https://www.ons.gov.uk/economy/nationalaccounts/uksectoraccounts/datasets/profitabilityofukcompaniesreferencetable [Accessed December 2024].
Ozkan, M., 2021. Direct air capture of CO2: A response to meet the global climate targets. MRS Energy & Sustainability, 8(2), pp. 51-56.
Ozkan, M., 2022. Current status and pillars of direct air capture technologies. iScience, 25(4), p. 103990.
PwC, 2024. Shrinking the consumer trust deficit. [Online] Available at: https://www.pwc.com/gx/en/issues/c-suite-insights/voice-of-the-consumer-survey.html [Accessed October 2024].
Rojas-Michaga, M. F., 2023. Sustainable aviation fuel (SAF) production through power-to-liquid (PtL): A combined techno-economic and life cycle assessment. Energy Conversion and Management, Volume 292, p. 117427.
Scottish Energy Statistics Hub, 2024. Scottish Energy Statisitcs Hub. [Online] Available at: https://scotland.shinyapps.io/Energy/?Section=RenLowCarbon&Subsection=RenElec&Chart=ElecConsumptionFuel
Scottish Environment Protection Agency, 2024. Scotland’s generated household waste drops to record low. [Online] Available at: https://beta.sepa.scot/news/2024/scotland-s-generated-household-waste-drops-to-record-low/ [Accessed 2024].
Scottish Government, 2024. Energy Statistics for Scotland – Q2 2024. [Online] Available at: https://www.gov.scot/publications/energy-statistics-for-scotland-q2-2024/pages/final-energy-consumption/
Scottish Government, 2024. Energy Statistics for Scotland – Q4. [Online] Available at: https://www.gov.scot/publications/energy-statistics-for-scotland-q4-2023/
Scottish Government, 2024. Planning Applications Statistics 2023/24: Quarterly (April 2023 to September 2023). [Online] Available at: https://www.gov.scot/binaries/content/documents/govscot/publications/statistics/2024/02/planning-applications-statistics-2023-24-quarterly-april-2023-september-2023/documents/planning-applications-statistics-2023-24-quarterly-april-2023-september-2023/pla
Scottish Government, 2024. Waste Incinerated in Scotland 2023. [Online] Available at: https://data.gov.scot/sepa/waste/incinerated.html [Accessed December 2024].
Scottish Government, n.d. Oil and gas. [Online] Available at: https://www.gov.scot/policies/oil-and-gas/carbon-capture-utilisation-and-storage/
Seipp, C. A., 2017. CO2 Capture from Ambient Air by Crystallization with a Guanidine Sorbent. Angewandte Chemie International Edition, 56(4), pp. 1042-1045.
Sendi, M., 2022. Geospatial analysis of regional climate impacts to accelerate cost-efficient direct air capture deployment. One Earth, 5(10), pp. 1153-1164.
Siriwardane, R. V., 2001. Adsorption of CO2 on Molecular Sieves and Activated Carbon. Energy & Fuels, 15(2), pp. 279-284.
Sodiq, A., 2022. A review on progress made in direct air capture of CO2. Environmental Technology & Innovation, Volume 29, p. 102991.
Speight, 2016. Production of syngas, synfuel, bio-oils, and biogas from coal, biomass, and opportunity fuels. In: Low Temperature Fischer-Tropsch. s.l.:Science Direct.
Statista, 2024. Annual production of beer in the United Kingdom (UK) from 2002 to 2023. [Online] Available at: https://www.statista.com/statistics/288789/alcohol-production-beer-in-the-united-kingdom-uk-annually/#:~:text=In%202023%2C%20approximately%2034.2%20million,compared%20to%20the%20previous%20year. [Accessed August 2024].
Statista, 2024. Consumption volume of cement in the United Kingdom (UK) from 2014 to 2022. [Online] Available at: https://www.statista.com/statistics/476761/cement-consumption-in-the-united-kingdom-uk/#:~:text=Published%20by,million%20metric%20tons%20in%202014 [Accessed December 2024].
Statistica, 2024. Average natural gas price in Canada from 2003 to 2021. [Online] Available at: https://www.statista.com/statistics/383564/average-canadian-natural-gas-price/
Statistica, 2024. Breakdown of the average natural gas bill for industries in France from 2020 to 2023, by component. [Online] Available at: https://www.statista.com/statistics/1357836/industrial-natural-gas-price-breakdown-france/
Statistica, 2024. Prices of natural gas for industrial consumers in Germany from 2010 to 2021. [Online] Available at: https://www.statista.com/statistics/595604/natural-gas-price-germany/ [Accessed 2021].
Statistica, 2024. Prices of natural gas for industry in Denmark from 2010 to 2021. [Online] Available at: https://www.statista.com/statistics/595596/natural-gas-price-denmark/
Statistica, 2024. Prices of natural gas for industry in Sweden from 2010 to 2021. [Online] Available at: https://www.statista.com/statistics/595740/natural-gas-average-price-sweden/
Statistica, 2024. Prices of natural gas for industry in the Netherlands from 2010 to 2021. [Online] Available at: https://www.statista.com/statistics/595650/natural-gas-price-netherlands/ [Accessed 2021].
Statistics Iceland, 2022. Energy Prices. [Online] Available at: https://statice.is/statistics/environment/energy/energy-prices/ [Accessed October 2024].
The Beer Store, 2024. How does beer get carbonated?. [Online] Available at: https://www.thebeerstore.ca/articles/how-does-beer-get-carbonated [Accessed August 2024].
The Chemical Engineer, 2018. Climeworks pioneering air-captured CO2 for drinks carbonation. [Online] Available at: https://www.thechemicalengineer.com/news/climeworks-pioneering-air-captured-co2-for-drinks-carbonation/ [Accessed December 2024].
Third Derivative, 2021. Direct Air Capture. [Online] Available at: https://f.hubspotusercontent30.net/hubfs/7483280/ThirdDerivative_DAC_Report.pdf?__hstc=76901642.7be046447e69be936567f3c40842d50b.1724662844372.1724662844372.1724662844372.1&__hssc=76901642.1.1724662844372&__hsfp=2867243310&__hstc=76901642.71b72a081e62c7d6
Trading Economics, 2024. Naphtha. [Online] Available at: https://tradingeconomics.com/commodity/naphtha [Accessed 2024].
Transport & Environment, 2022. Scaling up direct air capture. [Online] Available at: https://www.transportenvironment.org/uploads/files/DAC-briefing.docx-1.pdf
Transport & Environment, 2024. E-Fuels observatory for shipping. [Online] Available at: https://www.transportenvironment.org/uploads/files/Briefing_e-fuels_observatory_for_shipping.pdf
Transport Scotland, 2023. Chapter 8 – Air transport. [Online] Available at: https://www.transport.gov.scot/publication/scottish-transport-statistics-2023/chapter-8-air-transport/ [Accessed August 2024].
Triple Point Heat Networks, 2024. Waste Is Being Used To Heat Homes And Buildings Through Heat Networks. [Online] Available at: https://tp-heatnetworks.org/waste-is-being-used-to-heat-homes-and-buildings-through-heat-networks/#
U.S EIA, 2024. Natural Gas. [Online] Available at: https://www.eia.gov/dnav/ng/ng_pri_sum_a_epg0_pin_dmcf_a.htm
UK Government, 2021. Annex 4 – Cost of capital. [Online] Available at: https://assets.publishing.service.gov.uk/media/61b8758b8fa8f5037b09c7e1/Case_50395_-_Non-confidential_Annex_4.pdf [Accessed December 2024].
University of Greenwich, 2021. Carbon8 Systems: Development and commercialisation of Accelerated Carbonation Technology (ACT) to produce carbon-negative aggregates for the construction industry. [Online] Available at: https://www.gre.ac.uk/articles/greenwich-research-and-enterprise/research-case-study-prof-colin-hills-carbon8-systems-development-and-commercialisation-of-accelerated-carbonation-technology-act-to-produce-carbon-negative-aggregates-for-the-construction-in [Accessed December 2024].
Voskian, S., 2019. Faradaic electro-swing reactive adsorption for CO2 capture. Energy & Environmental Science, Issue 12, p. 3530.
Wang, E., 2024. Reviewing direct air capture startups and emerging technologies. Cell Reports Physical Science, 5(2), p. 101791.
Wentrup, J., 2022. Dynamic operation of Fischer-Tropsch reactors for power-to-liquid concepts: A review. Renewable and Sustainable Energy Reviews, Volume 162, p. 112454.
World Resources Institute, n.d. Direct Air CaptureL Assessing Impacts to Enable Presbonsible Scaling. [Online] Available at: https://publications.wri.org/scaling-dac-in-the-us#:~:text=Land%20area%3A%20DAC%20plant%20and,Engineering%202020%3B%20Uzor%202022
Xie, R., 2024. Moisture swing adsorption for direct air capture: Establishment of thermodynamic cycle,. Chemical Engineering Science, Volume 287, p. 119809.
Young, J., 2023. The cost of direct air capture and storage can be reduced via strategic deployment but is unlikely to fall below stated cost targets. One Earth, 6(7), pp. 899-917.
Zukal, A., 2010. Adsorption of Carbon Dioxide on High-Silica Zeolites with Different Framework Topology. Topics in Catalysis, Volume 53, pp. 1361-1366.
Appendices
Additional information on DAC technology
This appendix provides additional information on DAC technologies, focussed on established methods.
Within both solid and liquid DAC, the process itself (solvent/sorbent, regeneration process, mechanical design etc.) varies and is an active topic of research and development. Three methods developed by leading companies Climeworks, Global Thermostat, Carbon Engineering are currently at the furthest stages of development and scalability (IEA, 2024). An overview of the most active areas of research and development are provided and assessed for their potential to improve upon these established methods.
Liquid DAC – Aqueous Hydroxides
The liquid DAC capture process used by Carbon Engineering captures CO2 from ambient air using aqueous solution of KOH to form potassium carbonate (Sodiq, 2022). The carbonate is subsequently fed into a calciner where KOH is regenerated and CO2 released in a high temperature, high energy calcination process. The temperatures needed for this regeneration process are around 900°C and above; these temperatures are typically achieved by burning gas, with the released CO2 captured within the process. These high temperatures are an issue for liquid DAC technologies as heat pumps cannot reach this temperature meaning liquid DAC cannot run solely on renewable electricity.
Solid DAC – Solid Amines
Climeworks and Global Thermostat use a solid amine to capture CO2 from ambient air. Once the adsorption beds reach the desired capacity, a temperature-vacuum regeneration system (TVSA) heats the beds between 80 – 100°C which regenerates the sorbent and releases CO2 and water (McQueen et al., 2021). Heat pumps can provide the temperatures needed for solid DAC but not for liquid DAC.
Solid DAC – Solid Alkali Carbonates
This method developed by Heirloom uses a calcium looping method, similar to the liquid DAC method used by Carbon Engineering. Instead of an aqueous hydroxide, solid calcium carbonate (limestone) is heated in a calciner, producing pure CO2 and calcium oxide. The calcium oxide is arranged in a bed and captures CO2 passively from the air. Initially this capture stage required up to four weeks to reach the desired carbon uptake but recent innovation and developments has reduced this time to several days (Heirloom, 2022).
Table 12.1: Summary of established DAC technologies.
Method
Example Company
Energy requirements
Data Type / Source
Aqueous hydroxide solvent and calcium based kraft regeneration process
Carbon Engineering
High temperature heat
2450 kWhth
1460 kWhth and 370 kWhe
2420-2530 kWhth
1480-1520 kWhth and 370 kWhe (Keith, 2018)
Modelling (Keith, 2018)
Modelling (An, 2022)
Solid amine sorbent and temperature-vacuum (TVSA) regeneration process
Climeworks
+
Global Thermostat
Low temperature heat
Current: 3310 kWhth and 700 kWhe
Target: 1500 kWhth and 500 kWhe
3190-3530 kWhth and 290 kWhe
Plant Data (Duetz, 2021)
Modelling (Sendi, 2022)
Solid Alkali Carbonate and calcium based kraft regeneration process
Heirloom (not fully established yet)
High temperature heat
2210-1640 kWhth and 220 kWhe
Modelling (McQueen, 2020)
Main R&D trends in DAC
This appendix gives an overview of key current research and development trends in DAC.
Innovation Map
A variety of sources including publications in journals and industry consultations were used to develop a map of trends in research and development in the DAC space. These emerging technologies and methods are presented in the subsequent sections. An overview of the key R&D areas for processes and materials is provided at the start in Figure 12.1, mapping the R&D sectors to technologies and companies.
Figure 12.1: Trends in DAC Research and Development
Air contactors
Air contactors are the section of the system where air is passed through or across the liquid or solid sorbent capture material. Around 20% of the energy demand for DAC is used in this phase, largely as electrical energy for fans and pumps. (McQueen et al., 2021). The main energy demand is overcoming the pressure drop resulting from the input air meeting resistance from components of the system such as the filters. The air pressure needs to be kept high to maintain the concentration of CO2 and therefore the efficiency of the carbon capture.
Cost contribution to DAC
Air contactor’s contribution to the system capex and overall cost depends on the type of DAC. The Hanson et al. report from 2021 gives the cost of an air contactor for solid DAC of $13 million to $84 million ($1–$8 per tonne of CO2 removed), for liquid DAC the numbers are less clear but with projected capex values post innovation in the region of $200-$400 million and an ambitious minimum of $30-$60 per tCO2, a clear issue when trying to get to total costs of $100/tCO2 (Ozkan, 2022) (Hanson et al., 2021)
Air contactors
With air contactors being such a large cost in liquid DAC, it makes sense that air contactors are a key R&D area for Carbon Engineering. Carbon Engineering highlighted two main areas of development for contactors: reducing capex costs of the contactors and adapting the geometry of the contactors to increase the contact area between the incoming air and the capture agent, thereby increasing capture efficiency. Much of this contactor optimisation work has been done through computational modelling, with a move away from conventional packed columns where the air had to be forced through, resulting in large pressure drops, to structures that better accommodate air flow minimising resistance while providing a large surface area for CO2 capture e.g. thin, flat sorbent sheets, monoliths, or cooling towers-like scrubbers (Climeworks, 2023). These approaches are being developed in both liquid DAC and solid DAC, reducing electricity demand and increasing capture efficiency.
Passive air contactors
Another area of research is having passive air contactors, where wind or natural airflow drive the interaction between the air and capture material. There is a trade-off here with the capex reduction (up to 25% of the cost of capture) and energy demand reduction versus the reduced capture efficiency and increased capture time (Third Derivative, 2021). There are a number process-based or place-based factors that would make passive air contactors more attractive:
Sorbents with a high capture efficiency and low cost
Locations with lots of space and naturally strong airflow/windspeeds
Locations where airflow is already accelerated, e.g. cooling towers (Noya, 2024)
Locations with high electricity prices.
A number of startups are investigating this option including Heirloom, Carbon Collect, Infinitree, and Noya. Heirloom have reported that they have reduced the time taken for carbonation of their material from an industry standard of 2 weeks down to 2.5 days. It is not entirely clear how the acceleration was achieved but they are using thin layers spread over multiple levels to maximise contact area while minimising land use. The passive approach means that the air contactors need only <0.05 GJ/tCO2 (~14 kWh/tCO2), compared to upwards of 0.5-1 GJ/tCO2 for other approaches (around 140-280 kWh/tCO2). (Heirloom, 2022; Third Derivative, 2021)
In 2022, BEIS awarded the Dutch start-up CO2CirculAir B.V. £3 million for their SMART-DAC project, which utilises wind circulation to drive the CO2 capturing process, as opposed to relying on fans, thereby eliminating energy costs associated with forced air movement (Anon., 2022) The funding was allocated towards the construction of a pilot plant in Larne, Northern Ireland, at the B9 Energy Storage offices. Testing was set to begin in spring 2023, with the facility expected to capture at least 100 tonnes of CO₂ per year, however as of March 2025, according to the company’s website, the project is still under construction (Anon., n.d.).
Sorbents and solvents
Sorbents and solvents are the materials that capture the CO2, either by being absorbed into the solvent in liquid DAC or adsorbing onto the material surface in solid DAC. Solvents and sorbents are a major area of research in DAC, the ideal capture material would be highly efficient at capturing CO2, doing so quickly and selectively but also giving up the CO2 readily with a small change in temperature or pressure, therefore reducing the energy requirements for generation. For the DAC industry, the ideal capture material would also be low cost, easy to produce at scale and be stable throughout thousands of cycles. There is an additional consideration that some materials work better in humid conditions, while some are much worse in humid conditions; this will affect which materials are best suited to which countries/climates and use cases. A summary of potential improvements is given in Table 12.2 with more detail below with the filled cells indicating the advantages of each material.
Table 12.2: Summary of potential improvements in DAC solvents and sorbents, the filled cells highlight the advantages of each material for DAC.
Topic area
Improvement
Capture efficiency
Capture selectivity
Regeneration temperature/energy
Longevity
Scalable
Cost
Climate optimisation
Solid DAC
Amine-functionalised sorbents
Zeolites
MOFs
Solid alkali carbonates
Silica gel
Calcium ambient weathering
Liquid DAC
Alternative liquid sorbents: alkanolamine, alkylamines, and ionic liquids
New Amine Functionalised Adsorbents
The development of new amine functionalised sorbents used in solid DAC methods such as the ones used by Climeworks and Global Thermostat have the potential to reduce the energy demand of regeneration and to improve the number of cycles the sorbent can undergo before degeneration (Wang, 2024). Sorbent lifetime ranges in estimates from 0.25 – 5 years (McQueen et al., 2021).The Climeworks process uses 7.5 kg of sorbent per tonne of CO2 captured with the target of reducing this to 3 kg (Duetz, 2021).
Metal-Organic Frameworks
These physisorbent materials have a porous structure with a high surface area and tuneable properties (Wang, 2024). Tunability means that the material can be more selective to capturing CO2, as opposed to capturing other molecules like water, an issue particularly in more humid climates (Sodiq, 2022). Climeworks are working with co-producer Svante to create novel air contactors containing MOFs with very high surface areas and lower operational costs. In a recent development, a team at Ecole Polytechnique Federale de Lausanne, Switzerland (EPFL) have developed a new MOF which prevents the CO2/water competition, selectively capturing CO2 in wet environments (Sodiq, 2022). In one experiment the energy required for regeneration was comparable to established approaches, using 1,600 kWhth for MOF regeneration.
Zeolites
Zeolites have a similar structure to metal organic frameworks and when tuned appropriately, provide efficient and selective adsorption/desorption of CO2 in low concentrations due to a number of zeolite intrinsic properties; pore architecture, low price, crystal size and chemical composition (Sodiq, 2022; Siriwardane, 2001; Zukal, 2010). However, selectivity of CO2 is poor in humid air and the materials degrade through the cycles meaning more research is needed before moving from laboratory scale to industrial scale (Mukherjee, 2019).
Silica Gel
Silica gel materials are also of interest to overcome the issue of absorbing water rather than CO2. Recently, commercially available silica gels of different pore sizes were grafted onto a triamine to investigate the CO2 capture performance (Anyanwu, 2020). The grafting process was completed in both dry and wet conditions to assess the effects of moisture on the sorbent’s CO2 uptake capacity. The capacity of silica gel to capture CO2 improved by 40% indicating the potential suitability of Silica Gel-based DAC methods for humid climates (Kwon, 2019).
Regeneration Process
Crystallisation
Crystallisation is a potential alternative DAC method that offers low-cost CO2 separation from sorbents with minimal chemical and energy inputs. This method has been the subject of several research papers, one example uses aqueous guanidine sorbent (PyBIG) to capture CO2 from the atmosphere, binding it as crystalline carbonate salts which are subsequently separated by filtration and heated to 80-120°C to release the bound CO2 and regenerate the sorbent, requiring 1410 kWhth (Seipp, 2017). Other studies have used the same method and alternative sorbents with similar results (Brethomé, 2018). Research is currently limited to laboratory scale with overall energy requirements still higher than the optimised Carbon Engineering method (Sodiq, 2022).
Electrochemical methods
These methods are an active area of research and being developed by companies such as Verdox and Mission Zero Technologies (Voskian, 2019) The key advantage of electrochemical methods is that they use only electrical energy, there is no heat requirement. The electrical-only method is appealing for places where the greenest and cheapest energy sources are electric, as opposed to somewhere like Iceland that has cheap geothermal heat.
Electrochemical methods could offer highly efficient and modular solutions for DAC, suitable for various scales of deployment. An electro-swing method being developed at the Massachusetts institute of Technology (MIT) uses specially designed electrodes to capture CO2 through CO2’s electrochemistry (Advanced Science News, 2021). The method has shown promising results, working at ambient conditions with low energy requirements of 570 kWhe per tonne of CO2 captured. However, the process required CO2 concentrations higher than the 400ppm found in atmosphere (6,000 – 100,000) as well as reporting a capacity loss of 30% after 7,000 cycles. Both of these factors have currently limited deployment to laboratory scale (Advanced Science News, 2021).
Moisture Swing
Another active area of research companies such as Carbon Collect and Avnos are exploring moisture-swing adsorption processes using ion exchange resins. These systems capture CO2 efficiently in dry conditions and avoid the need for high energy consumption or a vacuum (Wang, 2024) (Xie, 2024). One recent study estimated a regeneration energy requirement of 377 kWhth per tonne of CO2 captured, but acknowledged this did not take into account the precooling process or differences in efficiency at scale (Xie, 2024). The method is suitable for low-purity CO2 applications like agricultural greenhouses. The method performs poorly in humid conditions and is limited to deployment in arid environments; research is ongoing to improve efficiency.
Integration with waste heat
Solid DAC and liquid DAC both use heat to remove the CO2 and regenerate the capture material. Approximately 80% of the overall energy demand for both types of DAC is thermal energy, which offers opportunities for using waste heat from other sources (Ge, 2024). The opportunity to use waste heat for DAC was discussed in some of the interviews with industry experts in this study. EMEC highlighted that green hydrogen production and e-fuel production both generate waste heat and are technologies that would make sense to develop alongside and co-locate with DAC.
There are a number of considerations for waste heat incorporation with DAC:
Amount of waste heat, e.g. in GWh
Temperature of waste heat
Concentration, e.g. at a single location or dispersed
Cost, including the cost of transporting or concentrating the heat
Accessibility, also linked to cost
Consistency of supply, within a day or year but also over the lifetime of the plant
Competing demands for the heat
Carbon intensity of the heat
A 2020 report by BRE for CXC considered sources of waste heat in Scotland, split by low-grade and medium-grade sources as summarised in Figure 12.2. These medium-grade sources would be suitable for solid DAC and low-grade sources could be upgraded via heat pumps. Dispersed sources such as supermarkets and bakeries are unlikely to be attractive for DAC due to size and are more likely to be attractive for district heating systems. Instead, waste heat sources that are more isolated and that DAC could be incorporated with from the start or the project (as opposed to retrofitted on to) would be attractive, examples being nuclear energy, green hydrogen electrolysis and e-fuel production.
Figure 12.2: Examples of waste heat sources in Scotland identified in report for ClimateXChange looking into waste heat sources in Scotland (Building Research Establishment, 2020).
Research trends
Research trends relevant to integration with waste heat:
Lower temperature sorbent materials: if the temperatures required for regeneration can be reduced, then waste heat can supply a larger portion of the thermal energy demand
Modular units: while not the key driver for making DAC modular, making units small, scalable and easy to integrate with other processes would allow DAC units to take advantage of dispersed sources of waste heat
Integration with renewable energy
DAC needs clean, low-cost energy with a high load factor. Climeworks has largely deployed in Iceland due to the cheap heat and electricity provided by geothermal energy. Carbon Engineering are deploying in Texas, where there is inexpensive and plentiful renewable energy plus cheap natural gas. Locations with continuous sources of renewable energy, such as geothermal or hydro are particularly appealing, but integration with wind energy is likely to be more relevant for Scotland.
As a rule of thumb, DAC only has ‘relevant’ amounts of negative emissions if renewable energy provides 80% of the energy supplied through the grid (AGU, 2018). Scotland’s electricity grid is around 60% renewables in terms of energy used but with a lot of renewable energy being distributed to other parts of the UK (Scottish Energy Statistics Hub, 2024). Using curtailed energy is attractive for many purposes, but it is hard to make DAC economical with current capex costs if the system is only used part of the time. A 2018 report stated that either DAC capex costs would have to come down 10-fold or carbon prices go up 10-fold to make running DAC on curtailed energy viable (AGU, 2018). While running purely on curtailed energy is never likely to be economically appealing, running only when the grid is at above 80% renewables could be. This sensitivity will be investigated in the modelling phase of this study.
Research trends
Research trends relevant to integration with renewable energy:
Lower temperature sorbent materials: if the temperatures required for regeneration can be reduced, then heat pumps are able to supply the energy more efficiently making integration with renewable energy more efficient
Electrochemical DAC: requires only electrical energy rather than thermal energy
Understanding local environmental impacts: maritime environments are hard on components, understanding which components are most affected and limit the life of the system is a part of the ongoing learnings from current deployments
Energy storage: incorporating energy storage would allow for higher load factors and better use of cheaper renewable energy but would also increase the capex costs
Tidal energy: EMEC brought forward the idea of pairing DAC with tidal energy, due to the periodic nature of tidal energy generation and the cycling nature of solid DAC, especially interesting as EMEC and Orkney are a key centre for tidal energy.
Learnings from deployment
Both Climeworks and Carbon Engineering stated that learning from deployments was their main focus for R&D and where they see the most progress coming from. Climeworks said they are adapting their testing facilities to be more ‘real-life’ and saw the main improvements coming from “better sorbents, better structuring better design of the plant”.
Climeworks posted a very open article on their website titled “The reality of deploying carbon removal via direct air capture in the field” that described and quantified many of the issues they had encountered in the first two years that the Orca plant was operating. (Climeworks, 2024) Many of these learnings were issues that caused the plant to underperform (e.g. 20% quality fluctuations in the sorbent material, recovery losses of 30% of the captured CO2) but saw the main cost reductions being in applying lessons learned from current deployments such as adaption for local weather conditions.
Understudied areas for R&D in DAC
Three key areas of that emerged as understudied areas for DAC are
Integration with waste heat: currently limited to an extent by a lack of information sharing between commercial parties but the opportunities may become more obvious as the technology matures and progress becomes steadier
Impact of local conditions: with relatively few deployments in place already, the impact of local conditions is not yet fully understood. Elements of local conditions could be climatic (largely temperature and humidity) and impacts of pollution (contamination of filters, degradation of components). These will affect costs and efficiencies, but also which technologies are best suited to which environments. For example, electrochemical DAC is less mature than other DAC technologies but is attractive in Scotland because it runs purely off electricity rather than heat. Different DAC technologies will be better suited to different locations and sensitive to different parameters, research will be needed for optimisation, aided by modelling.
Limiting factors in DAC deployments
This section gives more detail on the key limiting factors in DAC technology and projects. Limiting factors that affect the cost and profitability of a plant but also the rate at which a DAC plant or plants could be deployed beyond purely financial limitations.
Energy demand and cost
From discussion with industry, the key limiting factor for deployment and the key factor in deciding location was cost of energy. The UK is seen as an expensive place for energy compared to the likes of Iceland or Texas where DAC is being deployed. The impact of energy costs will be a key part of the scenarios investigated in the modelling phase. The UK Green Book projects industrial electricity costs in the central scenario to go from 18 p/kWh down to 11 p/kWh over the next decade,[11] electricity prices in Iceland are not only lower, in the region of 56 p/kWh but also much more consistent (Statistics Iceland, 2022; DESNZ, 2024).
In terms of the scale of the energy demand, a 0.5 Mt plant would require around 1 TWh of energy per year, based on a value of 2 MWh/tCO2 (IEA, 2024). For context, in 2023, Scotland generated just over 33 TWh of renewable electricity; 1 TWh is roughly equivalent to energy demand of homes in Dundee (Scottish Government, 2024). The energy demand for DAC is around 20% electrical energy and 80% thermal energy. With solid DAC, that 80% thermal energy can be provided by heat pumps, bringing the overall energy demand down. Assuming a heat pump COP of 2, considering the high temperatures needed, the overall energy demand could be brought down to 0.6 TWh. If that 0.6 TWh of energy demand is assumed to be spread evenly across the year (i.e. a load factor of 1), then the connection size required for a 0.5 Mt DAC plant would be in the region of 68 MW. This 68 MW value is equivalent to other large industrial connections or a data centre.
Demand for CO2
Interviewees generally noted that the other key factor holding back DAC deployment was a lack of long-term demand or a clear carbon market. This market can be either:
Carbon removals/storage
Using non-fossil carbon for application or manufacture of existing products or services, e.g. food and drinks, fertiliser
Using non-fossil carbon for new products or services such as e-fuels or low-carbon chemicals
DAC projects selling CO2 removals (carbon offset credits) are reliant on government policy incentives (e.g. USA’s Inflation Reduction Act), or via off-take agreements on the Voluntary Carbon Market (VCM). The VCM is composed of organisations or individuals buying carbon credits for the purposes of offsetting their emissions, this market can be volatile and is unlikely to scale to size that is meaningful in reducing global emissions due to its voluntary nature. Government mandates and regulation on removals could provide the long-term security for investors in DAC that is not offered by the VCM. The UK Government announced in its 2021 Net Zero Strategy an ambition for 5 MtCO2 of removals by 2030 and 23 MtCO2 by 2035, but this is not yet been backed by a mandate, and this could be met by other removal technologies than DAC (e.g. BECCS) (BEIS, 2021).
It was also noted that in jurisdictions where there are helpful policies in place, those policies often come with restrictions that all activities have to take place within the boundary of that jurisdiction. Large scale deployment will need policies that generate demand across a lot of jurisdictions and allow providers to function in an open market.
The market for captured CO2 as a feedstock in the chemical industry appears to be very immature, with very little information available.
SAF Mandates
SAF mandates were discussed widely in the interviews with attention drawn to differences between the UK and EU SAF (ReFuelEU) mandates where the EU mandate is explicit about where the CO2 in SAF comes from, whereas the UK mandate does not make a distinction. The expectation is that the EU mandate will phase out fossil-based CO2 over time, for other jurisdictions there is lower confidence about if and when fossil CO2 will be phased out. The UK has announced an intention to bring in a specific requirement for DAC within the SAF mandate in future.
Emissions Trading Scheme
The Emissions Trading Scheme (ETS) offers a mechanism for DAC to become financially attractive, especially in terms of capture and storage but only if DAC is recognised within the ETS system or the penalty price becomes comparable to the cost of DAC. The question of how greenhouse gas removal (GGR) systems should be integrated into the UK ETS system is currently being consulted on (closed 15th August 2024). There is concern that integration of removals in the ETS scheme could reduce efforts to reduce emissions (Department for Energy Security & Net Zero, 2023). The carbon price in 2025 is around £90 (~$120), with gradual but uneven increase out to 2050. These carbon values are at the low end of projections for the cost of capture for DAC, as the carbon price increases towards a maximum of £170, (~$220), it gets closer to the potential range of DAC costs.
To incentivise emitters to pay for DAC or DACCS, the more appropriate price comparison would be the buyout price: how much organisations are charged for every tonne of carbon they emit that they do not have carbon credits for. Currently, the buyout price for CO2 in the UK is £100/tCO2, not much above the carbon price and far below the price that would incentivise DAC use to offset emissions (ICAP, 2022). The names of companies that exceed their emissions allowance are also published, an incentive to comply for companies with a public profile.
Figure 12.3: Projected values for the UK carbon prices used for modelling purposes (Department for Energy Security & Net Zero, 2023).
Planning restrictions
Planning restrictions relevant to DAC are largely around land use and visual impact but the time taken to get planning permission was viewed as an obstacle for DAC projects, mostly because of how long the process can take. A 0.5 Mt DAC plant would be considered a major development; the average planning time for major development projects in Scotland in 2023/24 ranged widely from 22 weeks for projects with processing agreements compared to 53 weeks for those without (Scottish Government, 2024). This difference highlights the advantage of planning agreements and working with the Scottish Government and local authorities. These planning times have been gradually coming down over the last few years and the Scottish Government was praised in some of the engagements within this study for being more dynamic and working with companies to progress projects.
Impact of delays
The cost of delays depends heavily on what stage of the project the delay occurs: a delay at the start of the project has a smaller impact than at the end of the project where there are higher running costs, e.g. staff hired, money borrowed. A very rough rule of thumb is that delays cost 1-2% of the project costs per month. Planning delays can easily run into months, even years. Taking the lower end of those delay costs, 1% per month, is 12% additional costs for a year delay.
Perhaps the most impactful element of planning restrictions is confidence: a country or region known to have a very strict, complex or slow planning process is not attractive for DAC deployment where R&D is still happening at pace, and it may be difficult to give full details of what a plant will look like at the start of the process. Focusing early DAC deployment at existing industrial sites may be helpful in terms of space, grid capacity and minimising visual impacts, as would a flexible planning process with open dialogue with decision makers.
Geographical requirements
Location
The main geographical requirements for DAC are:
Near or connected to low cost, low carbon electricity with a high load factor
Near transport, storage or usage of CO2
During our expert interviews, a rule of thumb was discussed for liquid DAC that if a country was a net importer of natural gas, it is unlikely to be good candidate for liquid DAC. The UK has been a net importer of gas since 2004, indicating that Scotland could be more suitable for solid DAC (Lennon, 2024). Green hydrogen could be used instead of natural gas, but it is unlikely that this would be economical or the best use of green hydrogen. These costs can be investigated in the modelling phase.
Climate
An additional geographical consideration is climate. Most deployments so far have been in Europe or North America, Climeworks have currently deployed in Iceland and Switzerland and are learning how climate impacts their process. Based on learning from those locations, Scotland becomes a more attractive location than places like the Middle East or North Africa where the processes would need to be re-optimised for the climate, especially while deployments are being developed and scaled up.
Model-based research has indicated that cold (<18°C average temperature) and dry (<65% relative humidity) climates are most ideal for DAC. The UK is classified is cold and humid, along with much of Europe and parts of North America. Cold climates, dry or humid, were found to be most favourable climate-wise for DAC but lower energy prices in hotter places (e.g. Middle East, North Africa) compensate for this. This research is based on current, or at least recent, data published on the processes and materials used for DAC and adaption of materials and processes would allow optimisation for different climates, e.g. favouring more selective sorbents in humid regions to avoid capturing water instead of CO2 (Sendi, 2022).
Land area
The land use requirements for solid DAC plants and liquid DAC plants are very similar, 0.4 km2 and 0.5 km2 at a million tonne scale plant respectively (World Resources Institute, n.d.). For comparison, the land area needed for a forest to capture a megaton of CO2 is 860 km2. These values for the land use of DAC plants do not account for land area required for energy generation.
Transport and storage
Transport and storage of CO2 has been highlighted as a limiting factor both interviews, particularly in the short term. As the DAC industry matures, transport and storage is expected to become less of an issue as transport is optimised and large-scale storage infrastructure is established. Carbon Engineering noted that a key advantage of their site in Texas is that it is placed directly above large CO2 storage reserves. Pipelines and plans for CO2 storage are already in development.
Currently, CO2 is transported mainly by lorries, a limiting factor both in terms of reducing cost and achieving scale of transport and storage. This limiting factor is mirrored on the demand side for the likes of e-fuel manufacturers who will likely need onsite generation to meet CO2 demands as they scale up.
Ambitions for CO2 storage
The UK Government announced two sets of projects, Track-1 and Track-2 clusters, with an ambition to capture 20-30 Mt CO2 per year (Department for Business, Energy and Industrial Strategy, 2023). The Acorn project in the North Sea is within Track-2 and is part of an ambition to capture 510 Mtpa CO2 (Acorn, 2024). The Acorn project will repurpose existing gas processing and transporting facilities to permanently store CO2 under the North Sea (Scottish Government, n.d.). The Acorn project initially had an ambition to be delivering CCS by the mid-2020s, and storing 56 Mtpa by 2030, but a more recent press report from mid-2024 refers to support from the Scottish Government to “make the Scottish Cluster a reality” indicating a much lower confidence level on the timeline of delivery (Acorn, 2021; Acorn, 2024).
Supply-chain requirements
Supply chain requirements and limitations were discussed with stakeholders and investigated in previous work by City Science. The most likely material to cause a potential bottleneck in the DAC supply chain is amine sorbents, the carbon capturing material in solid DAC technology (McQueen et al., 2021). The bottleneck would occur due to DAC requiring large volumes compared to current production levels as opposed to any issue with a particular material or feedstock, although there are some processing issues as exposure to the precursor chemicals is harmful. These amine-based sorbents are currently produced in small volumes mainly for pharmaceutical applications, there may need to be development of a large-scale synthesis process that could take time to optimise (Coherent Market Insight , 2023). Part of the issue with sorbents such as PEI is that it degrades through the cycles and needs to be replaced or topped up, meaning the demand is ongoing rather than just when the plant is being set up. Improvements to the longevity and alternative materials are active areas of research (Sodiq, 2022). Early engagement with the industry to understand the scale of demand could mitigate some of these issues.
Previous work City Science has carried out has highlighted that material supply of generic materials was not likely to be a limiting factor in DAC supply. The three materials main materials considered were steel, concrete and aluminium. Within the stakeholder engagements as part of this study, no organisation has specifically stated material availability as a key limiting factor in their scale up although materials were mentioned as generic issues encountered during scale up.
In terms of equipment, many components already have very mature supply chains, especially from the oil and gas industry. Some interviewees said that the small size of the DAC industry compared to these suppliers’ usual industries has taken some getting used to for supply chains. Interviewees also discussed learning from deployments where compromises could be made with respect to supply chains and materials e.g. cost versus quality and longevity.
Commercial sensitivity and maturity
A limiting factor that came out of our discussions with industry experts was commercial sensitivity and maturity. One aspect is that there are so many DAC start-ups, each with a slightly different approach or process and each protecting their own commercial interests. The variety of processes and the lack of detailed process information makes it hard for potential backers or partners to pick a technology or company. EMEC was highlighted as a major draw in Scotland and a mechanism for overcoming some of these commercial sensitivity issues due to the expertise, potential for partnerships and involvement in demonstration activities.
Additional details on DAC cost modelling
The cost model used in this study is based on method used by Young et al. (Young, 2023). This approach uses cost data from early-stage DAC plants and applies then projects cost reductions based on learning rates as global deployment increases. The cost model uses an initial plant, the FOAK, then applies learning rates at each doubling of global capacity.[12]
The FOAK size used for the solid technology was 4 ktCO2, based on the Climeworks Orca plant. The FOAK size used for the liquid technology was 500 ktCO2 capacity, based on the STRATOS plant under construction, using Carbon Engineering technology. The FOAK cost is then projected over a level of deployment (i.e. over a number of doublings of capacity) to produce the NOAK cost.
The cost components of the ‘FOAK Outputs’ and ‘NOAK Outputs’ are then used to determine a cost of DAC, which is a levelised cost per tonne of CO2 evaluated over the lifetime of the plant. Equation 1 below demonstrates how the NUAC is calculated.
Equation 1
The CRF is the capital recovery factor, used to calculate the payback on financing required for the plant capex. Annual capex payments are calculated by multiplying the capex by the CRF. The CRF is based on both the cost of capital (i) and the plant lifetime (n) as shown in Equation 2. The cost of capital was set at 3.5% in the central case, consistent with a social discounting rate, and a value of 10% used in the sensitivity analysis to represent a more commercial weighted average cost of capital (WACC) (UK Government, 2021; DESNZ, 2024).
Equation 2
Three types of cost of DAC can been calculated, depending on the scope of emissions accounted for, and whether costs of transportation and storage are included:
Levelised cost of DAC (LCOD) (gross captured): NPV of abatement determined on the amount of CO2 physically captured by the DAC plant.
Levelised cost of removal (LCOR)NUAC (net captured): NPV of abatement determined on the amount of CO2 physically captured by the DAC plant, minus any Scope 1 and 2 emissions, to derive a net abatement.
Levelised cost of storage (net stored): Uses the net captured abatement. Includes the costs of transport and storage of CO2.
It is the NUAC net captured value that has been used in this study, also called the levelised cost of removal (LCOR). This definition accounts for the CO2 produced via scope 1 and scope 2 emissions, i.e. the emissions associated with the energy used to run the DAC plant.
A 2-year build period has been assumed for the costing (for both technologies), with the CAPEX spread equally across the first two years. There is no CO2 capture in these first two years as the plant is not yet operational; after the two-year build period, the annual costs (energy and non-energy OPEX) are modelled for each year, as well as the CO2 capture. The total length of the analysis period is therefore plant lifetime plus two years.
Range of projected SAF values
There is significant uncertainty in the projected cost of e-SAF driven by large uncertainty in several key contributing factors to the overall cost such as energy prices, the cost of green hydrogen and the cost of DAC. The Sustainable Aviation Fuel Mandate Final Stage Cost Benefit Analysis presents a range of SAF costs illustrating this uncertainty that had to be considered in setting the buyout price for SAF and e-SAF, shown in Figure 12.4 (Department for Transport, 2024b). The projected ranges for PTL, that we have referred to as e-SAF in this report, span a range of thousands of pounds, hence the focus in this study on understanding what the key factors are that will dictate where costs lie within this range.
Figure 12.4: Range of costs for various sustainable aviation fuel types presented as part of the analysis for the UK SAF mandate (Department for Transport, 2024b).
International Energy Data
A summary of the energy data used in the international comparison is provided in Table 12.3. The number of sources used has been minimised where possible to avoid differences in the assumptions and methods used to derive these figures. To account for the recent increase in energy prices due to a rise in global conflict, energy data from 2021 was used as this represents the most recent data unaffected by this increase.
Table 12.3: A summary of the cost and carbon of fuels used in the international comparison
Location
Natural Gas Cost £/MWh
Electricity Cost £/MWh (Climatescope, 2024)
Carbon Intensity of Electricity gCO2/kWh (Electricity Map, 2024)
Scotland (United Kingdom) (2024)
49 (DESNZ, 2024)
187
213
Scotland (United Kingdom) (2040)
49 (DESNZ, 2024)
187
6
Texas
13 (U.S EIA, 2024)
57
389
Canada
15 (Statistica, 2024)
60
72
Australia
30 (Australian Energy Regulator, 20224)
148
428
Germany
28 (Statistica, 2024)
187
372
Iceland
(No imports)
49
28
Chile
17 (LPG Price monitoring agency, 2024)
139
272
Brazil
32 (Argus, 2023)
110
90
Oman
10 (indexmundi, 2024)
51
471
Denmark
25 (Statistica, 2024)
257
132
Sweden
41 (Statistica, 2024)
88
25
Norway
(Negligible use)
105
30
Netherlands
29 (Statistica, 2024)
73
284
France
34 (Statistica, 2024)
176
53
Comparison to IEA
The International Energy Agency report on DAC provides in-depth analysis, including operating conditions and cost estimates, the LCOD is shown alongside cost estimates from our modelling in Figure 12.5. Using IEA energy prices, estimates of the cost of DAC are similar between the model used in this study and the values reported by the IEA. The IEA report does not include the deployment year within the modelling assumptions however the IEA cost of DAC falls within the range of 2040 to 2050 cost estimates.
Figure 12.5: Comparison to IEA estimates of the cost of solid and liquid DAC
Waste Heat
Hydrogen Production via Electrolysis
Hydrogen production operates at temperatures ranging from 60°C-80°C (Koumparakis, 2025) Assuming a heat exchanger with an approach temperature of 10°C is used, the waste heat can provide heating up to 70°C.
The solid DAC reference scenario used heat pump with a coefficient of performance (COP) of 2 to provide heating up to 100°C. With the hydrogen electrolysis process providing heating up to 70°C, manufacturing tables for heat pumps estimate a heat pump operating between 70°C – 90°C (i.e. a delta T of 20°C) would perform with a COP of 4.4 (Sabroe, 2023). A conservative COP of 4 has been used for the purposes of this modelling. The use of waste heat and a high performing heat pump has significantly reduced the LCOD by 26%.
The liquid DAC reference scenario used natural gas as the heating fuel. Using waste heat supplied at 70°C, natural gas would still need to be used to provide heating from 70°C – 850°C. As a result, the benefits are small, only reducing the LCOD by 2%. It is also unclear how the waste heat could be provided in practice for a liquid DAC system.
The supply the waste heat demand for a 0.5 Mt DAC plant, the scale of the hydrogen electrolysis plant needed was estimated at 34 kt/year for solid DAC and 3 kt/year for liquid DAC, with calculations shown in Table 12.4. This assumes a heat loss from the hydrogen electrolysis process of 26% (Mostafa El-Shafie, 2023) and an electricity use of 54 kWh/kg hydrogen. The scale of the hydrogen plant is small relative to the energy demands of Scotland, 34kt of hydrogen capacity could supply 1% of Scotland’s total energy demand, or 3% of the transport sector’s energy demand (Scottish Government, 2024).
Table 12.4: Estimating the size of hydrogen electrolysis plant needed to provide the thermal energy of the DAC process.
Solid
Liquid
DAC Capacity, Mt CO2
0.5
0.5
Thermal Energy Use, MWh/tCO2
1.5
1.46
% of Energy Supplied by Waste Heat
63%
6%
Waste Heat Supplied, MWh/tCO2
1.5
0.09
Electrical Energy Used, GWh
33.8
3.2
Hydrogen Production Capacity, kt
34
3
Energy from Waste
Energy from waste (EfW) incinerators burn waste at high temperatures, generating electricity from the exhaust gases produced, a simple process flow diagram is shown in Figure 12.6. Integrating the EfW process with either solid or liquid DAC requires the diversion of heat from electricity production to the DAC process, the simplest configuration of which is also shown in Figure 12.6. Using heat directly rather than for electricity is significantly more efficient, ranging from 500 – 800% (Z factor 5 – 8). (Triple Point Heat Networks, 2024)
Figure 12.6: An example configuration of how a DAC process may utilise heat from an energy from waste process.
An energy balance of the thermal energy required from the EfW process, and the corresponding loss of power production is shown in Table 12.5. Across Scotland municipal waste EfW facilities range from 10 – 45 MW but are typically 10-15 MW. If a 0.5 Mt DAC process were to have all thermal energy requirements supplied by an EfW this would significantly reduce power production. However, this would not be viable as part of a typical EfW commercial model and has not been included as a potential waste heat source.
Table 12.5: Estimating the size of EfW plant needed to provide the thermal energy of the DAC process.
Solid
Liquid
DAC Capacity, Mt
0.5
0.5
Thermal Energy Use, MWh/tCO2
1.46
1.50
Total Thermal Energy Use, MWh
750,000
730,000
Energy supplied by EfW, MWh
750,000
730,000
Thermal Power Supplied, MW
85.6
83.3
Reduction in Electrical Output, MW
12.2
11.9
E-fuel production
Further detail on e-fuel production
E-fuel production via the Fisher-Tropsch (FT) Process
This section provides some additional insight into the products from the FT process and the relative amounts of each produced. The reaction typically operates at temperatures ranging from 200-240°C, and requires a metal catalyst (Speight, 2016). The type of catalyst used will lead to selectivity towards different products. This means that the reaction can be tuned to favour specific hydrocarbon fractions, i.e. short chain hydrocarbons C1 to C5 through to much longer oils and waxes, C25+, as demonstrated in Figure 12.8. When optimised for synthetic sustainable aviation fuel (e-SAF), the kerosene portion can account for 60% of the output as demonstrated in Figure 12.7 (Wentrup, 2022). Figure 12.8 shows some percentage breakdowns for reported processes.
Figure 12.67: Illustrative figure of outputs from the Fischer-Tropsch process, showing the relative amounts of different lengths of hydrocarbons created. (Bharti, 2021)
Figure 12.812.7: Percentage outputs of hydrocarbons for various FT processes (Fasihi, 2016).
The FT process is energy-intensive, with significant heat generation. The waste heat from FT synthesis can be utilised to support DAC operations. Assuming a heat exchanger with an approach temperature of 10°C, the available heat can provide heating up to 230°C, meeting 100% of the thermal energy requirements for solid DAC and 25% for liquid DAC. Table 12.6 shows that the estimated e-fuel production scale required to satisfy this waste heat demand is 583 kt for solid DAC and 144 kt for liquid DAC, assuming a heat loss of 1.29 MWh per tonne of e-fuel (Marchese, 2020).
Table 12.6: Estimating the size of E-fuel plant needed to provide the thermal energy of the DAC process.
Solid
Liquid
DAC Capacity, Mt
0.5
0.5
Thermal Energy Use, MWh/tCO2
1.50
1.46
% of Energy Supplied by Waste Heat
100%
25%
Waste Heat Supplied, MWh/tCO2
1.50
0.37
E-fuel Production Capacity, kt
583
144
Key assumptions for the Fisher-Tropsch process within this study are given in Table 12.7.
Table 12.7: Key assumptions for e-fuel production in this study.
Metric
Value
Source(s)
CO2 per tonne e-fuel
3.2
Industry discussion, consistent with literature sources (Rojas-Michaga, 2023; Delgado, 2023).
Portion of FT output that is e-fuel
60%-75%
Industry discussion, consistent with literature sources (Wentrup, 2022; Mazurova, 2023).
Uncertainty in e-fuel production costs
This section gives an overview of some of the uncertainties in e-fuel production costs from key sources for this report.
The cost of e-fuel production is dependent on four key variables:
Cost of electricity
Cost of green hydrogen
Cost of CO2
Cost of e-fuel equipment capex
The future cost of all four of these key variables are highly uncertain. Research by Rojas-Michaga et al. models the contributing factors to e-fuel production cost and the associated uncertainties. Figure 12.9 shows the results of a simulation investigating the potential combinations of factors illustrating the range of potential costs. The modelling outputs form a bell curve showing the likely range of fuel costs in £/kg; the 95% confidence range is between £2.44/kg and £12.91/kg range. The buyout price for PtL in the UK SAF mandate is set at £5/litre, £6.25/kg which is just to the low side of the peak in Figure 12.9. This buyout price will need to be reviewed over time alongside the required percentage of PtL fuel in UK demand.
Figure 12.9: Uncertainty analysis of e-fuel costs showing the potential range of e-fuel costs in £/kg (Rojas-Michaga, 2023).
Impact of CO2 costs
The biggest contribution to uncertainty in e-fuel costs is expected to be the cost of hydrogen, both because hydrogen is one of the biggest contributions to the overall cost and because the future cost of hydrogen is very uncertain (ClimateXChange, 2023; Rojas-Michaga, 2023). The two other biggest sensitivities are the cost of electricity and the cost of CO2 in the form of DAC. Figure 12.10 (from the same paper as Figure 12.9) shows a sensitivity analysis of key metrics on the cost of a tonne of e-fuel.
Figure 12.10 : Sensitivity of e-fuel price to changes in costs of key variables (MJSP = minimum jet fuel selling price) (Rojas-Michaga, 2023).
The values used in the sensitivity analysis are given in Table 12.85 (Rojas-Michaga, 2023) Their analysis gives a cost breakdown of around 30% CO2, 60% H2 and 10% for the remaining costs. This CO2 contribution is much higher than some others due to the assumption that the CO2 is from DAC. In a fuel cost of £5/litre, non-CO2 costs are around £3.5/litre, equivalent to £4,375/tonne of e-fuel. These values were used investigate the likely range of e-fuel prices in section 12.1.22 below.
Table 12.85: Values used in sensitivity analysis in research by Rojas-Michaga et. al (Rojas-Michaga, 2023).
Parameter
Low value
Nominal
High value
Unit
CO2 cost
50
359
1000
£/tonneCO2
H2 cost
1
3.09
8
£/kg H2
Cost of electricity
0.03
0.06
0.09
£/kWh
UK SAF mandate buyout price
Figure 12.11 shows the projected costs for different fuels including PtL from DAC (Department for Transport, 2024b). The calculations project values for e-SAF made using DAC in the central case to be around £4k/t but with best and worst case scenarios of £2.2k/t to £9.1k/t.
Figure 12.11 : Table brought in from analysis as part of developing the UK SAF mandate showing the projected costs for different fuels including PtL from DAC (Department for Transport, 2024b).
UK and EU SAF Mandates
The UK’s Jet Zero strategy sets out the UK Government’s strategy to decarbonise air travel, to be introduced from 1 January 2025, sets out targets for requirements for the use of SAF and e-SAF for the UK aviation sector. (Department for Transport, 2024a) In 2025, 2% of UK jet fuel demand will be required to come from sustainable sources, increasing linearly to 10% in 2030, then to 22% in 2040.[13] The mandate for e-SAF starts in 2028, reaching 0.5% in 2030 and 3.5% in 2040. For context, the last reported UK energy demands were 2022, when UK aviation fuel demands were around 12 Mtoe, though expected to increase in the short term in the rebound from the pandemic. (Office for National Statistics, 2024) The SAF mandate states there is potential to increase these target percentages if market conditions allow.
The equivalent mandate for the EU, ReFuelEU Aviation, has a less ambitious early timeline, but the ramping of targets is steeper and the EU mandate is more specific about CO2 sources. The EU mandate targets 2% SAF by 2025 and only 6% by 2030 but the ramping is steeper with a 20% target by 2035 and a 70% target by 2050. (European Commission, 2023; International Trade Administration, 2024) For synthetic fuels, the EU mandate aims for 1.2% in all EU airports from 2030 (equivalent to around 0.7-0.9 Mt), more than double the UK percentage for the same year, and 35% synthetic fuels in all EU airports from 2050. (Green Air, 2025) The EU mandate is also explicit about the source of CO2 for synthetic fuels removing the option to use fossil-generated CO2 to make e-fuels from 2041, allowing only biogenic and DAC CO2, accepting these are the only sources compatible with future climate neutrality.
The UK SAF mandate states that the feedstock for PtL fuels will be DAC or point source carbon (biogenic or fossil fuel) but it is not clear if there are restrictions to be placed on what point sources would be allowed. The mandate does state that waste fossil CO2 is considered to “have zero lifecycle greenhouse gas emissions up to the point of collection”. (Department for Transport, 2024b, p. 86) The UK mandate recognises that DAC will be the main CO2 source in the long term but that it is expensive in the short term and they do not want to hinder early development. Recognition that DAC will need to be the main source of CO2 for PtLs in the long-term is reflected in the buyout price, which has been set based on projected DAC-based PtL costs.
E-fuels for shipping
A 2019 report by Lloyd’s Register and UMAS set out a number of scenarios of the potential future mix of low-carbon shipping fuels: a renewables dominated pathway; a bioenergy dominated pathway, and a mixed pathway. The mixed pathway, shown in Figure 12.812, has been used in the modelling in this study as a central scenario for potential e-fuel demands. Figure 12.13 shows the projected mix of e-fuel for shipping from Transport & Environment’ briefing used to estimate the proportion of carbon-based shipping fuels in future years. (Transport & Environment, 2024)
Figure 12.812: Figure taken from Lloyd’s Register and UMAS report showing projected fuel mix for shipping each decade to 2050 in the equal mix pathway. (Lloyd’s Register, UMAS, 2021)
Figure 12.13: Projected mix of e-fuel for shipping from Transport & Environment’ briefing “E-Fuels observatory for shipping” 2024. (Transport & Environment, 2024)
How to cite this publication:
McQuillen, J., Goodwin, H., Kennedy, E., Li, L. (2025) ‘Cost and profitability of direct air capture in Scotland’, ClimateXChange. http://dx.doi.org/10.7488/era/5940
While every effort is made to ensure the information in this report is accurate as at the date of the report, no legal responsibility is accepted for any errors, omissions or misleading statements. The views expressed represent those of the author(s), and do not necessarily represent those of the host institutions or funders.
This work was supported by the Rural and Environment Science and Analytical Services Division of the Scottish Government (CoE – CXC).
If you require the report in an alternative format such as a Word document, please contact info@climatexchange.org.uk or 0131 651 4783.
For context, the total carbon removal market (carbon removals, as opposed to generic carbon offsets) totalled around 13 MtCO2 globally by the end of 2024 (cdr.fyi, 2024). ↑
Green Book values for future energy costs are generally used for modelling exercises in studies such as this but there is a lack of confidence in projected energy costs, particularly given volatility in recent years. Therefore, Green Book costs were used as a sensitivity rather than as the central case. ↑
Upstream gas emissions are very difficult to accurate quantify, this uncertainty around quantification limits the confidence in the LCOR of liquid DAC(Cooper, et al., 2022). ↑
This estimation is based on the assumption that 10% of the total planted area utilises enriched CO2 with a rate of 5-10% across the industry (Ecofys, 2017). ↑
In terms of hydrogen production, only green hydrogen makes sense for the production of e-fuels as blue hydrogen would involve splitting methane for the chemical constituents only to recombine them to remake hydrocarbons. ↑
Currently, eligible SAF must be produced from sustainable waste or residue feedstocks, such as used cooking oil, forestry residues, unrecyclable plastics, or derived from renewable or nuclear power. Fuels produced from food, feed, or energy crops are not eligible. Over time, the portion of SAF that can come from certain sources (such as cooking oil) will be reduced. ↑
The targets within the EU SAF mandate for CO2 from DAC are 10% of the carbon feedstock in 2030, 20% in 2035, 40% in 2040, 80% in 2045 and 100% by 2050. ↑
This 20% premium on production costs would presumably cover interest on financing used plus profit for DAC, e-fuel production and green hydrogen production. ↑
The relevant figures from the Lloyds Register & UMAS report and the Transport & Environment report are shown in Appendix I section 12.1.23 (Figure 12.812 and Figure 12.13) (Lloyd’s Register, UMAS, 2021). ↑
In discussion with industry experts, the issue of regulation around repurposing waste products was raised. Recycling products assigned as waste into marketable products creates issues around certification. Making this process of waste to product easier would require the reduction of regulatory barriers across the recycled aggregates industry. ↑
In the high scenario, costs reach up to 40 p/kWh before coming down to 13 p/kWh over the next decade to 2034; in the low scenario drop down much more quickly and are in the range 10-13 p/kWh to 2034. ↑
This application of learning rates to every doubling of technology is an observed trend of developing technologies, sometimes referred to as Wright’s Law. ↑
Currently, eligible SAF must be produced from sustainable waste or residue feedstocks, such as used cooking oil, forestry residues, unrecyclable plastics, or derived from renewable or nuclear power. Fuels produced from food, feed, or energy crops are not eligible. Over time, the portion of SAF that can come from certain sources (such as cooking oil) will be reduced. ↑
Scotland has abundant renewable energy resources that could supply significantly more energy than it consumes. This presents a substantial opportunity for Scotland to become a net exporter of low-carbon energy, boosting employment, supporting economic growth and helping to deliver international decarbonisation.
In our research, we review, assess, and rank the potential of technologies that could enable cost-efficient domestic and international trade of hydrogen, as well its derivatives and products. Hydrogen derivatives are substances that contain hydrogen, manufactured for the purposes of transporting energy and converted back to hydrogen before use (e.g. ammonia). Hydrogen products are anticipated to be used directly, with no need for reconversion (e.g. sustainable aviation fuel). Further, we identify offtake sectors and countries, assess the scale of demand in potential markets, and identify gaps and opportunities in domestic and international policy.
We carried out desk-based research and targeted stakeholder interviews to gather data and review a range of hydrogen derivatives and products.
Findings
Hydrogen and derivative offtake markets
Scotland’s hydrogen potential poses an unprecedented opportunity to strengthen domestic industrial capabilities and cut greenhouse gas emissions. Hydrogen production capacity is anticipated to exceed Scottish demand in the future.
Industrial clusters in Scotland, England and Wales all provide a large local market for hydrogen and its derivatives and products. Existing industrial demand, proximity, and a similar regulatory framework offer key advantages over mainland Europe.
The European Union and its member states are unlikely to meet their low-carbon hydrogen demand on their own, creating an export opportunity for Scotland. Germany and the Netherlands are likely to become the dominant hydrogen offtakers in Europe. But because international trade requires extensive infrastructure and harmonised low-carbon certification frameworks, we identify domestic hydrogen offtake markets as having greater potential.
Hydrogen derivatives
Subsea hydrogen pipelines are critical to enhancing the competitiveness of Scottish hydrogen for trade within Europe. Alternative delivery methods and hydrogen derivatives have substantially higher costs.
Ammonia is expected to be the dominant hydrogen derivative in the medium to long term for global trade. This is due to high technical maturity, relatively high roundtrip efficiency, low production and transport costs, and established global market.
Hydrogen products and end use cases
Industry – including oil and biofuel refining, ammonia, and synthetic fuel production – will be the biggest driver of hydrogen demand in 2030 in both the EU and the UK. By 2045, other sectors like aviation, shipping, power generation are also expected to be major players in the hydrogen economy.
Some end-use sectors, such as chemicals and aviation, will be able to use hydrogen derivatives and products directly, avoiding substantial costs on reconversion. Emerging policies in the UK and in the EU make the market highly attractive to potential hydrogen exporters.
Synthetic methanol will be key to decarbonising existing industrial uses of methanol and in initial low-carbon maritime projects. However, uncertainty around maritime policy and the future availability and cost of biogenic CO2 remains.
In the long term, hydrogen is also expected to play a significant role in power generation, where it could replace natural gas and other fossil fuels in peaking plants.
Hydrogen-based Sustainable Aviation Fuels (SAF) are well-placed to decarbonise the aviation sector due to compatibility with existing infrastructure, policy support in the UK and Europe, and no commercially viable low-carbon alternatives.
The main low-carbon alternatives to hydrogen include Carbon Capture, Utilisation, and Storage (CCUS) and bio-based technologies.
Recommendations
Stimulate demand by improving alignment – Align the UK and EU Emissions Trading Systems to avoid potential carbon taxes on UK products including maritime fuels. The timely launch of the UK Carbon Border Adjustment Mechanism (CBAM) is also critical.
Stimulate demand by supporting trials and demonstration projects – Subsidy schemes, such as the Hydrogen Innovation Scheme, trials and demonstration projects help to create learnings, improve investor certainty and get initial projects off the ground.
Support infrastructure – Support key new-built and repurposed infrastructure projects including a core UK hydrogen network, ports, terminals, hydrogen boilers, refuelling stations and salt cavern storage.
Enhance competitiveness of Scottish hydrogen – To effectively compete with renewable rich regions, Scotland needs to meet a lower levelised cost of hydrogen. High electricity prices are one of the biggest weaknesses in Scotland’s hydrogen ambitions.
Reform the planning and permitting regime – Streamline complex processes where possible to avoid unneeded congestion and accelerate decarbonisation. Work with the Health and Safety Executive (HSE) to develop the safety case for hydrogen.
Optimise low-carbon policy frameworks – The Hydrogen Production Business Model needs to be optimised to interact with other low-carbon policy frameworks, such as the Contracts for Difference Scheme, Hydrogen T&S Business Models and the H2P Business Model.
Co-ordinate with the EU – Infrastructure projects have long associated lead times and limited flexibility once approved. Therefore, coordinating infrastructure deployment with the European Hydrogen Backbone and port infrastructure is essential.
Continue progress on low-carbon certification – A mutually recognised low-carbon hydrogen standard is critical to the success of hydrogen trade.
Engage local communities – Continue to engage with local communities and improve public understanding of hydrogen’s role in a net zero energy system.
Set out strategy on hydrogen trade – The Scottish Government could work with the UK Government on a clear strategy for how to develop hydrogen export capacity.
Glossary and abbreviations
Glossary
Dehydrogenation
The process of removing hydrogen from a chemical or organic compound.
Electrolytic (also known as green) hydrogen
Hydrogen produced by splitting water into hydrogen and oxygen molecules using electricity.
Gravimetric energy density
The amount of energy per unit mass of substance, usually expressed in terms of Watt-hours per kilogram (Wh/kg) or megajoules per kilogram (MJ/kg).
Hydrogen
Hydrogen is the most abundant and smallest molecule in the universe, made up of two hydrogen atoms.
Hydrogenation
The chemical process of bonding hydrogen and another compound.
Hydrogen derivatives
Substances that contain hydrogen and at least one other element. They are manufactured for the purposes of transporting energy and are converted back into hydrogen before use.
Hydrogen products
Substances that contain hydrogen and at least one other element, but which are intended to be used directly, with no need for reconversion to hydrogen.
Low-carbon alternative
In this report, low-carbon alternatives include all technologies that are economically viable substitutes to hydrogen solutions, such as electric, CCUS and biomass technologies.
Method of transport
Compressed hydrogen molecules can be transported in many ways, including through pipelines, ships and tube trailers.
Technology Readiness Level (TRL)
TRL is a scale used to identify, rate and compare the technical maturity of different technologies, with 1 being the least mature and 9 being the most mature and widely deployed technology.
Volumetric energy density
The amount of available energy per unit volume of substance. Often shown in terms of Watt-hour per litre (Wh/L) or Megajoules per cubic meter (MJ/m3).
Abbreviations
BEIS
Department for Business, Energy & Industrial Strategy
BECCS
Bioenergy with Carbon Capture and Storage
CAPEX
Capital expenditure or capital cost
CBAM
Carbon Border Adjustment Mechanism
CCGT
Combined Cycle Gas Turbine
CCS
Carbon Capture and Storage
CCUS
Carbon Capture, Utilisation and Storage
CO2
Carbon dioxide
DESNZ
Department for Energy Security and Net Zero (formerly known as BEIS)
ETS
Emission Trading Scheme
FCV
Fuel Cell Vehicle
GHG
Greenhouse gas
HEFA
Hydro Processed Esters and Fatty Acids
HPBM
Hydrogen Production Business Model
HVDC
High Voltage Direct Current
LH2
Liquified hydrogen
LOHC
Liquid Organic Hydrogen Carrier
LPG
Liquified Petroleum Gas
MCH
Methylcyclohexane
MgH2
Magnesium Hydride
NH3
Ammonia
RFNBO
Renewable Fuels of Non-Biological Origin
TRL
Technology Readiness Level
Introduction
Context
Scotland has abundant renewable energy resources which could supply significantly more energy than is consumed nationally. This presents an opportunity for Scotland to become a net exporter of low-carbon energy, potentially boosting employment and economic growth, and helping to deliver international decarbonisation.
In addition to electricity interconnectors, low-carbon energy is expected to be exported via mediums including low-carbon gases such as hydrogen. Scotland has ambitions to produce 5 GW of low-carbon hydrogen by 2030, rising to 25 GW by 2045 [1]. As emphasised by the Scottish Hydrogen Assessment, Scotland has the potential to grow a strong hydrogen economy [2]. The Scottish Government signalled its ambition for Scotland to ‘become a leading producer and exporter of hydrogen and hydrogen derivatives for use in the UK and in Europe’ [3]. Projections estimate that 75% of this production (by volume) could be exported to UK and European markets [3] [4]. This rise in production is expected to coincide with hydrogen demand growth in the rest of the UK and the European Union (EU), with the EU targeting 20 Mt of hydrogen per annum by 2030, half of which is expected to come from imports [5]. European industrial clusters are likely to be major offtakers and importers of hydrogen and derivatives due to high industrial demand, ambitious decarbonisation targets and limited renewable resources.
The movement of hydrogen over longer distances is not yet well proven. While existing research has confirmed the cost efficiency of future hydrogen pipelines linking the UK and mainland Europe [6], subsea hydrogen pipeline interconnectors are capital cost-intensive and have long lead times [7], making the Scottish Government’s ambition to export hydrogen in the 2020s [3] challenging without alternative options. Due to the low volumetric density of gaseous hydrogen, hydrogen-carrying derivatives are likely to be used in the absence of a centralised hydrogen pipeline network.
Hydrogen derivatives are substances that are manufactured using hydrogen and are generally capable of transporting hydrogen with higher volumetric energy density. Hydrogen products are also made with hydrogen, but are anticipated to be used directly, with no need for reconversion.
A range of technologies are available to increase the volumetric energy density of hydrogen for easier long-distance transport and storage. At a low temperature, gaseous hydrogen can be turned into liquid hydrogen. Liquefaction can help with storing hydrogen in smaller spaces for longer periods of time, transporting it and using it as aviation or shipping fuel. Hydrogen can also be reacted with nitrogen at high temperature and pressure to produce ammonia. Liquid ammonia can be stored more readily than liquified hydrogen due to it having a higher volumetric energy density. When transported to its destination, ammonia can be cracked back into hydrogen and nitrogen or used directly as ammonia in industrial applications. Liquid Organic Hydrogen Carriers (LOHCs) absorb hydrogen in an organic compound. This work focuses on the most advanced organic carrier, methylcyclohexane, which can be easily broken down to hydrogen and toluene. Lastly, metal hydrides, such as magnesium hydride, can carry hydrogen in a solid state, making international trade safer and simpler.
Methodology
We carried out desk-based research and targeted stakeholder interviews simultaneously to gather data and review a range of hydrogen derivatives and products. This dual approach was key to ensuring the interdisciplinarity of the research and bringing together technical, economic and policy aspects. More details can be found in the appendices (section 10).
To assess hydrogen derivatives and products and produce a clear, non-technical output, we assigned Red-Amber-Green (RAG) ratings to each hydrogen derivative and product. Clarification of these RAG categories is provided in Table 1.
RAG rating
Classification
GREEN
Low technical risks, high suitability, or high economic attractiveness.
AMBER
Moderate level of technical risk or suitability.
RED
High levels of risks, limited suitability or no economic attractiveness.
Table 1: Red-Amber-Green rating classification
Hydrogen Product and end use case mapping
Hydrogen is already used in a wide range of sectors, with 2022 consumption in the UK reaching more than 568,000 tonnes (22.3 TWhHHV) [8]. Most existing hydrogen demand is taken up by oil refining. While hydrogen today is mainly used for oil desulphurisation, its use in biorefineries for hydrogenation is anticipated to grow in the future as demand for biofuels increases [9]. Hydrogen is critical for ammonia and fertiliser manufacturing, making it the second largest end use case in the UK in 2022 [8]. It is also used as a feedstock in the chemical sector, most importantly, for methanol production. While the methanol industry is limited in the UK, low-carbon methanol production is an area of emerging interest domestically. Furthermore, demonstration projects are underway to investigate the use of hydrogen in steel manufacturing. Hydrogen is not currently used in steel making, but directly reduced iron may become the dominant technology by 2050 (see section4.2).
In addition to existing end use cases in industry, we also reviewed end use cases in three sectors: high-temperature heat, transport, and power generation (see Table 2). UK research suggests that hydrogen can be used in most industrial equipment for heat generation, reducing capital costs (CAPEX) in the manufacturing sector as compared to installing new industrial equipment [10]. Low-carbon alternatives include carbon capture and storage (CCS) and biomass technologies. Hydrogen and its derivatives are also well placed to decarbonise some hard-to-electrify transport applications. While hydrogen can be used directly in fuel cell vehicles, the low volumetric density of gaseous hydrogen or high storage costs associated with liquified hydrogen could require it to be converted into derivatives such as methanol, ammonia or other synthetic fuels. This is particularly the case for long-distance and heavy transport. Lastly, our literature review and stakeholder engagement suggested that hydrogen technologies have a high potential to decarbonise dispatchable power production. Existing power plants can be run on hydrogen, ammonia, biomass or retrofitted with CCS technologies. Technologies shown in Table 2 are assessed in section 4.2.
Industrial feedstock
Industrial heat
Transport
Power
Hydrogen based technologies
Hydrogen for ammonia and methanol production, refining and as a reducing agent
Hydrogen for high temperature heat
Hydrogen (fuel cell)
SAF, ammonia and methanol (maritime)
Hydrogen turbines
Ammonia turbines
Alternatives
None or very limited alternatives
CCUS-enabled heat generation
Biomass
Battery electric vehicles
Biofuels
CCUS and biomass turbines
Table 2: Hydrogen products and end use case mapping from our research
Hydrogen Derivative and Product Assessment
Hydrogen, derivatives and low-carbon alternatives
A range of hydrogen and alternative low-carbon technologies are available to export surplus renewable energy from Scotland to domestic and international demand centres. Table 3 summarises RAG ratings for hydrogen, derivatives and interconnectors. Further discussion on the economic case, technical feasibility and sustainability can be found in Appendix A.
Table 3: RAG ratings for hydrogen, derivatives and interconnectors
High voltage direct current (HVDC) interconnectors already connect the UK with neighbouring countries, allowing the energy system to manage electricity peaks and enhance energy security. To increase export capacities and achieve higher system benefits, HVDC interconnectors can be complemented with hydrogen production, using excess renewable energy and exporting it to UK and European demand centres.
Hydrogen pipelines are the most mature and cost-efficient way to transport hydrogen over short and medium distances. However, due to long lead times and high capital costs they are not expected to be available at larger scale in the short term. Like other gases, hydrogen can be shipped in liquid form, which requires an extremely low temperature of −253°C. Hydrogen derivatives are simpler to transport due to their higher energy density and higher transport and storage temperature.
The most widely used hydrogen derivative is ammonia (NH3), which is produced by reacting hydrogen with nitrogen at high temperatures and pressures. Ammonia has an established global market and is simpler to handle than liquid hydrogen as the boiling point of liquified ammonia is more than 219°C higher than that of liquefied hydrogen.
Organic compounds can also absorb hydrogen into their structure, forming LOHCs. These compounds remain stable as a liquid during transport even at ambient temperature and pressure, making them highly compatible with existing oil assets.
Although metal hydride technologies are relatively new, their simplicity and safety case could make them competitive with other hydrogen technologies. We took magnesium hydride as a case study as it can be easily shipped in a solvent slurry. Methanol is unlikely to be reconverted back to hydrogen at the point of destination. This is due to the economic case and carbon emissions associated with the methanol steam reforming reconversion process.
Hydrogen products
In some cases, hydrogen and its products can be used directly without the need to reconvert derivatives back to hydrogen or low-carbon power. This direct use can significantly improve overall round-trip efficiency, making the trade of hydrogen products an area of emerging interest. The availability of low-carbon alternatives is introduced as an additional factor in the analysis. A green rating is assigned to end-use cases with no or limited availability of alternatives, supporting the case for hydrogen use. A red RAG rating indicates widespread availability of low-carbon alternatives.
Industrial feedstock
The four main non-energy applications of hydrogen in industrial feedstock are ammonia for fertiliser, methanol production, oil refining and green steel production [11]. Table 4 summarises RAG ratings for selected end-use cases for hydrogen products. Further discussion on the economic case, technical feasibility and sustainability can be found in Appendix A.
NH3
CH3OH
Ammonia
Methanol
Refining
Green steel
Economic case
N/A
AMBER
N/A
GREEN/AMBER*
Technical feasibility
GREEN
GREEN
GREEN
AMBER
Scottish capabilities
RED
RED
GREEN
AMBER
Sustainability
AMBER
GREEN
GREEN
GREEN
Low-carbon alternative
GREEN
GREEN
GREEN
AMBER
Table 4: RAG ratings of selected end use cases for hydrogen products
(* – depending on whether hydrogen is used as a reducing agent or in blast furnaces)
Hydrogen is critical for oil refining and the production of ammonia, a key chemical used for fertiliser, plastic or synthetic fibre fabrication. In oil refining, hydrogen is primarily used in hydrocracking and hydrotreating processes. Hydrocracking uses hydrogen and a catalyst to break down heavy hydrocarbons into lighter fractions like jet fuel, petrol and diesel. Hydrotreating removes impurities from hydrocarbon streams with desulphurisation being a key process to improve petrochemical quality and reduce sulphur oxide emissions at the point of use, thereby preventing acid rain.
While its role in fossil fuel refining may decline, low-carbon hydrogen will remain crucial in biorefineries for producing synthetic and biofuels like hydro-processed esters and fatty acids (HEFA), hydrotreated vegetable oils (HVO) and biodiesel.
Hydrogen is essential for both conventional and synthetic methanol production. Although methanol can be produced using bioresources [12], bio-based methanol alone is unlikely to meet global demand [13]. This makes synthetic methanol crucial for timely and large-scale industrial decarbonisation. Syngas, a mixture of hydrogen, CO and CO2 molecule can be produced through natural gas reforming or by combining low-carbon hydrogen with sustainably sourced CO2. This mixture undergoes methanol synthesis, a process where it reacts at high pressure and moderate temperatures to produce methanol (CH3OH).
In contrast to the end use cases mentioned above, producing green steel requires new steel making equipment. Hydrogen, as an effective reducing agent for iron ore, holds significant potential to decarbonise steel and iron production. While some low-carbon alternatives exist, the IEA anticipates hydrogen-based direct reduced iron (DRI) technology coupled with electric arc furnace will dominate, contributing 44% of all emission reductions in the iron sector [14].
High temperature heat
High temperature heat is essential for various industrial processes including cement, ceramic and glass manufacturing. However, decarbonising high-temperature industrial heat is among the most challenging tasks due to technical difficulties and cost inefficiencies associated with generating such heat (>1000 °C) using existing electric technologies [15].
The need for low-carbon technologies is becoming more urgent as approximately 4,300 industrial heating units in the UK rely on gas, representing 70% of the country’s industrial gas consumption [10]. Existing equipment can be retrofitted to use hydrogen, generating direct and indirect heat up to 1000 °C.
Low-carbon alternatives including biofuels such as biomass or biomethane, and CCUS technologies are also viable. With CCUS, industrial plants are upgraded with post-combustion carbon capture systems, which store the resulting greenhouse gases in underground reservoirs.
Table 5 summarises RAG ratings for high temperature heat use. Further discussion on the economic case, technical feasibility and sustainability can be found in Appendix A.
H2
Hydrogen
CCUS-enabled gas
Bio-based products
Economic case
AMBER
AMBER
GREEN
Technical feasibility
GREEN
AMBER
GREEN
Scottish capabilities
AMBER
AMBER
GREEN
Sustainability
GREEN
AMBER
GREEN
Low-carbon alternative
AMBER
N/A
N/A
Table 5: The RAG ratings of selected high temperature heat use
Transport
Hydrogen can be used in fuel cell vehicles and has been shown to be able to be cost competitive with other fuels with government subsidies [16]. While the economic case for fuel cell heavy good vehicles (HGVs) is fairly well established [17], there is more uncertainty around lighter vehicles [18]. Battery-electric passenger vehicles and light duty vehicles (LDV) are likely to be more cost competitive compared to their fuel cell equivalents.
Sustainable Aviation Fuel (SAF) is currently used in aviation to reduce carbon emissions, and the similar composition as current options allows for storage for long periods of time in the same infrastructure [19]. While the industry continues to explore alternatives to SAF, there is a wide consensus that aviation is a hard-to-electrify sector. Both the EU and the UK have mandated the use of SAF from 2025 (see Figure 1). SAF is anticipated to be the dominant decarbonisation pathway, with other low-carbon fuels such as hydrogen taking up very small shares of the market [20].
Synthetic methanol and ammonia will increasingly be used as fuels in the maritime industry, as there are not many other alternatives. In case of shorter distances, some ships and ferries may be powered electrically with batteries or fuel cells [21]. A Norwegian ferry currently powered by hydrogen fuel cells can reduce yearly emissions by 95% [22].
Table 6 summarises RAG ratings for transport uses. Further discussion on the economic case, technical feasibility and sustainability can be found in Appendix A.
CH3OH
NH3
Hydrogen (fuel cell)
SAF
Methanol (maritime)
Ammonia (maritime)
Economic case
AMBER
AMBER
AMBER
GREEN
Technical feasibility
GREEN
AMBER
GREEN
RED
Scottish capabilities
AMBER
AMBER
RED
RED
Sustainability
GREEN
GREEN
AMBER
AMBER
Low-carbon alternative
RED
GREEN
AMBER
AMBER
Table 6: The RAG ratings of selected transport uses
Power generation
Renewables are well placed to decarbonise a large share of the electricity supply. However, due to intermittency challenges, electricity generation cannot always meet electricity demand. Hydrogen, ammonia and biomass are all low-carbon fuels that can be used in turbines to meet electricity demand when required. Alternatively, CCUS enabled gas turbines are an alternative that do not require major alterations of existing fossil fuel infrastructure, with the CO2 captured stored underground.
While all technologies reviewed in this section can generate power, they are not necessarily perfect substitutes (see Figure 1). Our stakeholder engagement confirmed that the main role of hydrogen is expected to be in peaking generation, with bioenergy with carbon capture and storage (BECCS) running at baseload due to high capital costs and substantial carbon benefits [23].
Power generation in Great Britain is dispatched in the order of merit or cost. Baseload units, for example nuclear power plants, run throughout the year. Mid-merit units, for example combined-cycle gas plants operate up to thousands of hours per year. Power plants that operate no more than 5% of the year are generally referred to as ‘peaking plants’ [24].
Table 7 shows the RAG ratings of selected power generation methods, with the ‘low-carbon alternative’ factor not being applicable to non-hydrogen technologies, such as gas CCUS, biomass and ammonia.Further discussion on the economic case, technical feasibility and sustainability can be found in Appendix A.
H2
NH3
Hydrogen
CCUS-enabled gas
Biomass
Ammonia
Economic case
GREEN
GREEN
GREEN
AMBER
Technical feasibility
AMBER
AMBER
GREEN
RED
Scottish capabilities
AMBER
GREEN
GREEN
RED
Sustainability
GREEN
AMBER
GREEN
AMBER
Low-carbon alternative
AMBER
N/A
N/A
AMBER
Table 7: The RAG ratings of selected power generation methods
E-METHANOL IN MARITIME
FEWER ALTERNATIVES
MORE ALTERNATIVES
LOW TECHNOLOGY READINESS
HIGH TECHNOLOGY READINESS
REFINING
CHEMICALS
HYDROGEN INTERCONNECTORS
STEEL
HIGH-TEMPERATURE HYDROGEN HEAT
AMMONIA IN MARITIME
AMMONIA POWER GENERATION
SMALL-SCALE HYDROGEN POWER AND CHP
HYDROGEN IN LIGHT VEHICLES
HYDROGEN IN HGVs
SUSTAINABLE
AVIATION FUEL
SMALL MARITIME APPLICATIONS
LOW-TEMPERATURE HYDROGEN HEAT
LARGE-SCALE HYDROGEN POWER
Figure 1: Technical and alternative technology assessment of selected hydrogen products and end use cases
ENERGY CARRIER
POWER GENERATION
TRANSPORT
INDUSTRIAL HEAT
INDUSTRIAL FEEDSTOCK
Offtaker Market Assessment
We assessed potential offtake markets for hydrogen derivative and products, covering Scotland, the rest of the UK, the Netherlands, Belgium, Germany and the European Union as a whole. Our findings are summarised in Table 8.
SCOTLAND
REST OF THE UK
GERMANY
NETHERLANDS
BELGIUM
WIDER EU
DISTANCE
GREEN
GREEN
AMBER
AMBER
AMBER
AMBER
INFRASTRUCTURE
GREEN
GREEN
AMBER
GREEN
AMBER
GREEN
EXISTING DEMAND
AMBER
AMBER
GREEN
GREEN
AMBER
GREEN
PROJECTED DEMAND
AMBER
GREEN
GREEN
GREEN
AMBER
GREEN
POLICY LANDSCAPE
GREEN
GREEN
GREEN
GREEN
AMBER
GREEN
Table 8: The RAG ratings of selected offtaker markets
Distance from Scotland and rest of UK
Our stakeholder engagement confirmed that distance is a key factor determining the price of both domestic and international hydrogen transport. The cost associated with all methods of hydrogen transportation increases linearly with the distance. Shorter distances between hydrogen production sites and demand centres result in lower capital costs for pipelines or tube trailers, compared to long-distance shipping. This means that the lowest associated costs are found within Scotland. Multiple stakeholders highlighted the potential benefits of co-locating hydrogen production and end-user project, substantially reducing the cost of hydrogen transport.
The nearest potential demand hotspots to Scotland are in the rest of the UK, with the closest being the industrial clusters in the North of England and Wales. Internationally, the closest industrial offtake markets are in the Netherlands, Belgium and Germany, in order of proximity. While distance to the nearest hydrogen terminal is highly relevant in the short term, its importance is expected to decrease as the intra-European hydrogen infrastructure, the European Hydrogen Backbone, becomes available. Once a centralised hydrogen market is in place, Central or Eastern European markets are anticipated to be accessible from Western Europe.
Infrastructure gap and opportunity
Hydrogen trade infrastructure, including ports, terminals, onshore and offshore pipelines, is key to removing barriers to trade. In contrast to the UK’s limited hydrogen infrastructure, Europe has around 2,000 km of hydrogen pipelines [25], with further extensions needed to avoid market inefficiencies. Existing infrastructure, for example gas interconnectors, can be leveraged and repurposed to bring down CAPEX costs. Subsea natural gas interconnectors already link Great Britain with Northern Ireland, Ireland, Norway, the Netherlands and Belgium. While IEA analysis suggests that the cost of hydrogen transport can be significantly reduced using repurposed pipelines [26], our stakeholder engagement suggests that the majority of the natural gas assets are unlikely to be altered, to maintain energy security.
While some of the fossil fuel infrastructure is required to stay in place, it is critical to develop purpose-built hydrogen assets, especially given the long lead times associated with new developments. To supplement and link up regional pipelines, the European Hydrogen Backbone project aims to develop 53,000 km of hydrogen pipelines by 2040. The REPowerEU Plan set out three major import corridors via the Mediterranean, the North Sea area and Ukraine. Germany and the UK signed a Memorandum of Understanding in 2023 strengthening collaboration on energy and climate, including security of energy infrastructure [27]. Research conducted by the Net Zero Technology Centre is ongoing to explore the feasibility of a subsea hydrogen pipeline between Scotland and mainland Europe [28]. Stakeholders suggested that further coordination with the European Union is key to ensure alignment between infrastructure.
All selected European countries have strategy on domestic pipeline infrastructure roll-out. Germany has a well-established network of pipelines especially in the north-west and is aiming to add 4,500 km of hydrogen pipeline using Important Projects of Common European Interest (IPCEI) funding [29]. The Netherlands is also aiming to link industrial clusters with a national hydrogen network by 2030 [30].
European ports and terminals, critical for long-distance import and export, are developing similar strategies. The Port of Rotterdam aims to supply 4.6 million tonnes of hydrogen per year by 2030 (181.2 TWhHHV) [31], with projections suggesting a capacity of 20 million tonnes per year by 2050 (788 TWhHHV ) [32] become major renewable energy hubs. More detail on infrastructure projects can be found in Table 11 (Appendix B).
As well as infrastructure to support the supply and trade of hydrogen, there is also a need for demand-side infrastructure to complete the value chain with offtake. This includes hydrogen refuelling stations, hydrogen boilers, salt caverns for storage and hydrogen-powered furnaces etc. For example, the EU’s Alternative Fuels Infrastructure Regulation includes a required number of hydrogens refuelling stations along it’s TEN-T core network, a road network that includes the most important connections between major cities and nodes, planned for completion by 2030. The regulation states that a hydrogen fuelling station with a cumulative daily capacity of one tonne, dispensed at least a 700bar, is required every 200km to “ensure a sufficiently dense network to allow hydrogen vehicles to travel across the EU.”
Meanwhile, many European countries are targeting a phase out of fossil-fuel powered household boilers by 2035, with clean hydrogen boilers seen as a key alternative. Development of demand infrastructure currently requires support from similar policies across the value chain, with several EU policy schemes such as the Emission Trading Scheme, SAF Mandates and Road Transport Fuel Obligation (RTFO). With the policy and investment progressing, demand-side infrastructure will follow. This presents an opportunity for Scotland to partner with the EU to shape and support these supply chains as they develop and provide the necessary hydrogen supply.
Existing demand for hydrogen and hydrogen products
While existing demand is mainly met by fossil fuel derived hydrogen and derivatives, the share of low-carbon hydrogen is expected to increase given emerging mandates, policy frameworks and increasing carbon prices. The Netherlands and Germany were the leading hydrogen trading countries in 2023, with a total import of 194,096,000 m³ and 6,322,280 m³ of overwhelmingly fossil-based hydrogen, respectively [33] (see Figure 15 in Appendix B).
Figure 2, below, shows the consumption of hydrogen in the UK, Belgium, Germany, the Netherlands and the whole of EU for the year 2022. In the EU, Germany is the largest consumer of hydrogen followed by the Netherlands, whereas Belgium is the 9th largest consumer. Together, these three countries account for roughly 41% of the total consumption of hydrogen in EU [8].
Figure 2: Total hydrogen consumption in the EU, the Netherlands, Belgium, the UK and Germany in 2022
Projected demand for hydrogen derivatives and products
As countries progress toward net zero targets, demand for hydrogen and hydrogen derivatives and products is expected to rise. On a European scale, the UK and Germany have the most ambitious short-term demand for hydrogen. The UK Government has estimated between 80 and 140 TWh in demand by the end of 2035 [34] [35]. For Scotland, as shown in section 7.3, analysis by Gemserv projects hydrogen demand to range from 0.6 TWh to 2.8 TWh by 2030, and from 2.9 to25 TWh by 2045.
Germany set a target of 95 – 130 TWh by 2030 [29] with independent projections in line with this range (42 – 72 TWh of demand by 2030) [4]. By 2045, forecasts range from 184 to 694 TWh depending on assumptions. Belgium anticipates a demand of 20 TWh by 2030 but expects a sharp increase to 200-230 TWh by 2050 [36]. The Netherlands has projected demands of 120 TWh (2050) [37]. Demand scenarios developed as part of this research are discussed in Appendix E.
Policy landscape and net zero ambitions
Scotland has an ambitious net zero target for 2045. This is five years ahead of the UK’s net zero target. Both Governments have published strategies and action plans on hydrogen production. However, stakeholders highlighted the lack of clarity on regional and hydrogen trade strategy. This perceived lack of clarity and of commitment to specific targets and routes could be a competitive disadvantage compared to other European countries.
In the UK, hydrogen production projects will be subsidised under the Hydrogen Production Business Model (HPBM). The HPBM will ensure it only stimulates production of hydrogen that is low-carbon by requiring volumes to comply with the Low Carbon Hydrogen Standard (LCHS) which sets a maximum emissions limit of 20 gCO2e/MJ [38]. While hydrogen production using imported natural gas is eligible for support under the Cluster Sequencing programme, the HPBM is not expected to support any form of hydrogen or hydrogen derivative import [38] and export [39].
In the absence of UK-wide policies supporting hydrogen trade, its main driver is expected to be international hydrogen import subsidies, mandates and targets. While the UK has committed to designing generous hydrogen business models, our stakeholder engagement suggests that regulatory bottlenecks remain, particularly around electricity market and the planning and permitting frameworks. According to stakeholders, the Review of Electricity Market Arrangements (REMA) is critical to cut the currently ‘very high’ grid electricity prices in the UK, particularly in Scotland. With hydrogen costs highly sensitive to electricity prices, reducing these will be essential to improving Scottish hydrogen competitiveness.
Stakeholders also reported that hydrogen regulation is fragmented and dated, with the planning and permitting process being more complex and lengthier compared to ‘other industrial countries’. These findings are in line with a 2023 research paper commissioned by DESNZ [40]. Scotland and UK specific regulatory bottlenecks are detailed in Table 18 (Appendix D).
The EU aims to be carbon neutral by 2050 [41]. It adopted a strategy on hydrogen in 2020 which focussed on 5 key areas: investment aid, production and demand, creating a hydrogen market (including infrastructure), research and international co-operation [42]. In the 2022 REPowerEU Plan, the European Commission set an ambitious 20 million tonne (equivalent to approximately 330 TWh) hydrogen target for 2030, with the EU aiming to import half of this [43]. Ambitious European import targets could offer potential opportunities to Scottish hydrogen exporters.
The German Federal Government established H2Global in 2021, a double auction model designed to facilitate inter-continental hydrogen trade [44]. In 2023, the European Commission decided to link the European Hydrogen Bank with H2Global to allow all EU member states access to the funding mechanism and agreed to jointly develop a European auction for international hydrogen imports [45]. Germany laid out an ambitious net zero target for 2045 [46] and their national hydrogen strategy states both a domestic hydrogen production target of 10GW alongside an import target of 90 TWh, potentially above 90% of the total demand forecast for 2030 [29]. They anticipate 2030 hydrogen demand to reach 95-130 TWh, around 50-70% (45 to 90 TWh) of which is forecasted be imported [29]. According to the National Hydrogen Strategy, pre-2030 imports are anticipated to be delivered by ships, with imports gradually expanding to pipeline-based solutions after 2030 [47].
Both the Netherlands and Belgium have net zero targets for 2050 and published national hydrogen strategies [48] [49]. The Netherlands has announced hydrogen import targets for 2030 for the Port of Rotterdam, 4.6Mtpa in 2030 increasing to 18Mtpa by 2050, and the Port of Amsterdam, 1Mtpa by 2030 [50]. Belgium has also set an import target of 0.6Mtpa, meaning that 62% of the continent’s 10Mtpa target could be met by these three ports [50].
The EU, along with member states are working towards a harmonised certification framework for low-carbon hydrogen to remove trade barriers [29] [51] [52]. Our stakeholder engagement suggests that misalignment between certification frameworks is expected to be the main bottleneck for international trade. UK and international hydrogen-related policies are further detailed in Table 19 (Appendix D).
SWOT Analysis
To shortlist high-potential hydrogen derivatives, products and end use cases, we considered the strengths, weaknesses, opportunities and threats associated with hydrogen derivatives and the trade of these products from a Scottish perspective.
Strengths
Strengths focus on the competitive advantages of Scotland.
As highlighted by a number of stakeholders, Scotland’s main competitive advantage in the hydrogen sector is access to abundant renewable generation capacity. As future renewable capacity is likely to exceed future electricity demand, Scotland is well placed to transition into an international hydrogen hub. Existing jobs, skills, and infrastructure, especially in the oil and gas and offshore wind sectors, could also confer a competitive advantage. Existing oil and gas infrastructure, such as gas interconnectors, ports, terminals and vessels, can be repurposed, resulting in savings in CAPEX. For example, due to the similarity of LPG and liquified ammonia, existing LPG terminals can be repurposed to import and export ammonia.
While Scotland does not have direct access to geological salt formations required for salt cavern hydrogen storage, depleted and partially depleted gas and oil reservoirs off the coast of Scotland could be suitable for large-scale hydrogen and CO2 storage. Existing feasibility studies, demonstration projects, and trials funded by the Scottish and UK Governments are critical to get initial commercial projects off the ground.
Weaknesses
Weaknesses focus on the competitive disadvantages of Scotland.
Our research identified high grid electricity prices as the main competitive disadvantage of Scotland. Despite abundant renewables potential, high prices and network charges seem to prevent Scottish industry and consumers to capitalise on this advantage. Additionally, compared to other regions aiming to export surplus low-carbon hydrogen to European demand hotspots, Scotland’s relative disadvantage in solar generation could lead to greater intermittency, translating into higher hydrogen production costs.
In terms of infrastructure, electricity network constraints and limited energy storage capacity could prevent the energy system from mitigating temporal and geographic electricity imbalances. Lack of geological salt formations beneath Scotland will also amplify the challenge of storing large volumes of hydrogen in the absence of a UK-wide centralised hydrogen network.
Other weaknesses include limited experience in the production of ammonia, methanol, LOHC, and other derivative, as well as the lack of low-carbon hydrogen production on a commercial scale.
Opportunities
Opportunities focus on the future potential of Scotland as well as Scotland’s environment, offtake markets and competitors.
Hydrogen presents the opportunity to cut carbon emissions, reduce wind curtailment costs, boost economic growth and enhance energy security and resilience. In trade terms, stakeholders highlighted the opportunity for Scotland to strengthen existing industrial clusters and focus on high value-added industries instead of exporting low value-added fuels.
Although electricity prices are currently high, reforms under REMA could reduce costs for consumers. From an offtake market perspective, the main opportunity is to export hydrogen to industrial clusters in England and Wales. Once online, a core network connecting demand and supply hotspots can transport gaseous hydrogen in a cost-efficient manner. The North of England has the added benefit of large potential hydrogen storage capacities. By transporting hydrogen to Cheshire, Teesside or the Humber, Scottish producers could utilise large-scale storage facilities, enhancing flexibility and hedging against supply and demand-side shocks.
Regulatory misalignment—particularly around certification—is less of a barrier within the UK, as the Low Carbon Hydrogen Standard is expected to be applied nationally. Internationally, the increasing willingness of the EU, Germany and the Netherlands to import and subsidise low carbon hydrogen is a significant opportunity. Partially driven by the RED III directive, industry in the EU will have to meet a substantial share of their hydrogen demand from low-carbon by 2030.
Threats
Threats focus on the future risks in Scotland as well as risk associated with Scotland’s environment, offtake markets and competitors.
As our research identified hydrogen export to England as a high-potential opportunity, any delay in building out a core network connecting UK supply and demand hotpots is a threat to the growth of the hydrogen economy. In terms of international transport, lack of progress with hydrogen interconnectors, ports, terminals and vessels could further delay hydrogen derivative and product trade.
While Scotland is well-placed to supply hydrogen molecules through high-pressure pipelines, it may be outcompeted in the European market by lower cost, low-carbon hydrogen from renewable rich countries particularly in the form of ammonia, methanol and other hydrogen derivatives. This is because of high electricity prices, intermittency challenges and high hydrogen transport costs in the absence of subsea hydrogen interconnectors. However, the main threat on an international scale is the lack of a harmonised certification framework. As emphasised by the IEA, inconsistencies in low-carbon hydrogen standards risk becoming the main barrier for the development of international hydrogen and derivative trade [53].
Hydrogen Derivative and Product Demand
This section discusses the findings of the analysis, with the methodology used to develop these estimates shown in Appendix E. The analysis estimates the annual demand for hydrogen in the EU, the Netherlands, Germany, Belgium and England and Wales. Annual demand scenarios were developed for the years 2030 and 2045, and the demand was divided into various sectors and hydrogen products. The years 2030 and 2045 are selected due to their significance to policy targets for both the EU and Scotland. The RED III targets set out by the EU focus on accelerating the demand for hydrogen, among other fuels, by the year 2030 [54] and Scotland has a target of achieving net zero by the year 2045. Finally, in our analysis, hydrogen demand is modelled under three scenarios: High, Central, and Low in 2030 and 2045. The full demand mapping results can be seen in Appendix E.
Sectoral Demand
Figure 3 shows the modelled annual demand, by sector, for the whole of the EU for the years 2030 and 2045. Hydrogen demand is expected to be significantly higher in 2045, compared to 2030. The industrial demand[3] shown in Figure 3 captures all industrial demand for hydrogen including demand for methanol and ammonia. The subsequent graphs in Figure 4 break down the industrial demand by product type.
Figure 3: Modelled annual demand for hydrogen and hydrogen derivatives in the EU
Figure 4 and Figure 5 show the expectation that demand for hydrogen use directly will be greater than demand for ammonia or methanol in both the 2030 and 2045 timeframe for the EU and nations considered. Demand for ammonia and methanol using low-carbon hydrogen will be driven by the RED III mandate which specifies that 42% of industrial hydrogen use (except refining) must utilise renewable fuels of non-biological origin (RFNBOs) by 2030. By 2045, it is expected that almost all ammonia and methanol will rely on low-carbon hydrogen.
Figure 4: Central Scenario EU Industrial Hydrogen Demand by Product in 2030 and 2045
Figure 5: Central Scenario National Industrial Hydrogen Demand by Product in 2030 and 2045
In all modelled scenarios for 2030 and 2045, the industrial sector is expected to remain the dominant driver of hydrogen demand in the EU. However, demand is likely to diversify between 2030 and 2045 largely because of increasing forecast contributions from the power generation sector – where hydrogen is expected to serve an important role in balancing the power system during times of low renewable generation.
For example, in 2030 the share of the industrial sector in the mix of total hydrogen demand ranges from 88% to 96% (Figure 6) but is expected to fall to within a range of 28% to 59% by 2045. Hydrogen demand in the transport sector is estimated to grow rapidly between 2030 and 2045 – largely driven by growth in demand for hydrogen as a low-carbon fuel for heavy transport, including maritime transport, aviation and HGV transport. In some scenarios, hydrogen consumption is further diversified between 2030 and 2045 by an increasingly large demand from the heating sector – which comprises as much as 14% of total hydrogen demand in the EU in the high scenario for 2045.
Figure 6: Share of different sectors and hydrogen derivatives of total hydrogen demand in the EU
Figure 7 and Figure 8 depict the modelled annual demand for hydrogen for Germany, Belgium, the Netherlands and England and Wales for different sectors in the years 2030 and 2045.
Figure 7 indicates that, consistent with the EU wide hydrogen demand, the industrial sector is anticipated to comprise most hydrogen demand in all countries by 2030. Similarly, reflecting EU-wide trends, hydrogen demand is expected to become increasingly diverse by 2045, when power generation, road transport and aviation will all likely also contribute to hydrogen demand in each of these markets. Hydrogen demand in the heating industry could also grow significantly in these markets; however, this is entirely dependent on the national policy landscape. For both 2030 and 2045, Germany and England and Wales are anticipated to drive most of the hydrogen demand.
Figure 7: Hydrogen demand for countries across all scenarios and sectors for the year 2030
Figure 8: Hydrogen demand for countries across all scenarios and sectors for the year 2045
Demand by Hydrogen Product
The total final demand for hydrogen, ammonia, methanol and sustainable aviation fuel (SAF) in the EU is shown in Figure 9. It is expected that hydrogen demand will be greater than any of the products assessed for both 2030 and 2045 making up 68% and 78% of demand, respectively. Of the products assessed, final demand for ammonia is likely to be greatest, estimated at 42 TWh in 2030. This is driven by low-carbon ammonia demand for use in fertilisers. It is expected that ammonia demand will rise to 206 TWh, with demand for maritime fuel making up over half of this total. Final demand for methanol derived from low-carbon hydrogen is expected to increase from 15 TWh to 20 TWh between 2030 and 2045. SAF demand from power to liquids in the EU is projected to increase from 4 TWh to 59 TWh between 2030 and 2045, due to the emerging SAF mandates.
Figure 9: Central EU Final Demand for Hydrogen and Products in 2030 and 2045
Figure 10 shows the central annual final demand for hydrogen and products by country. Similar to the EU as a whole, it is estimated that hydrogen has the highest demand for each region in both time periods. However, demand for ammonia could be significant, particularly in regions with significant maritime activity such as the Netherlands, where ammonia is estimated to form 44% of final demand in 2045. SAF demand is expected to be more evenly distributed across regions due to greater distribution of aviation activity. Methanol demand is relatively low across all regions ranging between 1 and 7 TWh per year by 2045.
Figure 10: Central National Final Demand for Hydrogen and Products in 2030 and 2045
Demand Scenarios for Scotland
As Figure 11 shows, the projected demand in Scotland is likely to be limited for the year 2030, ranging from just 0.6 TWh to 2.8 TWh from the Low to the High scenarios. The demand jumps up for the year 2045, ranging from 2.9 TWh in the Low scenario to 25 TWh in the High scenario[4].
Figure 11 shows that for the year 2030, industry is the main driver for demand in Scotland. However, for the year 2045, other sectors like Road Transport and Power Generation play significant roles as drivers of demand.
These results reaffirm the export potential for Scotland as the hydrogen production capacity of Scotland is expected to be larger than the demand for hydrogen.
Figure 11: Annual demand for hydrogen and hydrogen derivatives for Scotland for 2030 and 2045
Figure 12 shows the range of demand for hydrogen and its derivatives for Scotland. The graph shows that the demand for all sectors, other than industry, is limited in all scenarios for the year 2030, with demand varying by sector significantly in 2045. For example, in the transport sector, the Low and High scenarios estimate a demand of 0.6 TWh and 7 TWh, respectively. This wide range is the result of high uncertainty of demand for hydrogen in the maritime and road transport sectors of Scotland for 2045.
Figure 12: Range for hydrogen & hydrogen derivatives across all sectors for Scotland
Comparison to Literature
A European Commission [55] (JRC) study reviewed a diverse range of literature and used the projections from different studies to determine average annual demand for hydrogen in the EU. According to the JRC study, the total projected annual demand for hydrogen in 2030 is 230 TWh [55], which lies towards the upper bound of this report’s estimate of 108-236 TWh. Similarly, the EU Commission’s study projects the annual demand to be 900 TWh in 2040 and 1,270 TWh in 2050. Whereas this report’s analysis projects the demand for hydrogen for 2045 to be within the range of 733 TWh to 1852 TWh.
A 2021 study conducted by European Hydrogen Backbone [56] estimates that the annual demand for green and blue hydrogen in Industry (for both the EU and the UK) will reach 692 TWh in 2040 and 983 TWh by 2050 [56]. Whereas this report projects the demand in industry in both EU and UK to range from 534 TWh to 711 TWh in 2045.
Figure 13 provides a full comparison between the results of this study and those of two external studies. The results estimated for this report are shown as a range of total projected annual demand of hydrogen for EU, for the years 2030 and 2045. The results of the other two studies are not shown as ranges; and the years for these studies are 2030, 2040 and 2050. It is also worth noting that this study includes demand for the heating sector, which is not accounted for in the other two.
Figure 13: Comparison of this study’s results with the literature
The comparison of these estimates is challenging as their geographical scope and timelines vary, with a number further differences in modelling methodologies.
Policy Gap Analysis
Our stakeholder engagement and desk-based research highlighted the following policy gaps. Further regulatory gaps can be found in Table 18.
In the United Kingdom, reserved matters are decisions taken by the UK Parliament, as opposed to devolved matters where devolved institutions, including the Scottish Parliament, hold decision making authority. As such, we have split our policy gap analysis into Scotland based, UK based and international policy gaps.
Policy Gaps in Scotland
Scottish policy gaps are set out below.
Lack of clarity on hydrogen trade strategy
Clear signals from the Scottish Government are required for the Scottish industry to prepare and make strategic decisions to enable successful trade.
Planning and permitting
Planning and permitting processes need to be faster and streamlined. Hydrogen projects typically require long lead times, due to infrastructure requirements as well as typical barriers to the implementation of innovative technology. This finding is in line with our stakeholder engagement and 2023 report commissioned by DESNZ [57]. Streamlining and accelerating the planning processes is key to alleviating investment barriers.
While our stakeholder engagement and desk-based research was conducted prior to the announcement of ‘the Planning Hub’ [58], this new body is anticipated to improve consenting speed and make the planning system more efficient for hydrogen projects.
Regional Strategic Planning
Stakeholder engagement highlighted that Scotland is home to diverse regions, with varied geographical environments. Blanket, national strategic planning risks overlooking localised requirements and optimal use cases =. Scotland needs regional hydrogen strategies that are integrated with a cohesive national strategy.
Increasing need for trials and demonstration projects
The hydrogen industry, especially the trade sector, will utilise new technologies, which still need to be proven and developed. Trials and demonstration projects are increasingly needed to build the case for these technologies.
Policy Gaps in the UK
As outlined above, some policy gaps relate to the UK Government as a reserved power, as opposed to the Scottish Government, as a devolved power. The policy gaps for the reserved power, in this case the UK government, are detailed below.
Hydrogen Trade Strategy
The UK is currently lacking a clear strategy on hydrogen trade as well as a holistic strategy incorporating natural gas, electricity and hydrogen. This is urgently required to provide clarity, allow for strategic decisions to be taken and stimulate investment.
The establishment of National Electricity System Operator (NESO) is a positive step towards solving this issue. NESO is expected to address issues regarding whole system strategy by integrating electricity, gas and hydrogen infrastructure into one energy system plan. NESO has developed whole energy system models, titled Future Energy Scenarios, which support planning and identify the opportunity for Scotland to be an energy exporter. This work should be expanded to include economic modelling on trade, culminating in a developed and full strategy.
Infrastructure
A clear commitment to a core hydrogen network, linking industrial clusters in Scotland, England and Wales is needed. More clarity on the timeline is key to improving investor certainty and get initial projects off the ground.
Dated and fragmented hydrogen regulation
Onshore hydrogen projects are currently regulated under the Gas Act 1986 and Planning Act 2008, with hydrogen generally being defined as a ‘gas’. Our stakeholder engagement suggested that current regulation is fragmented, with more concise and ‘net-zero-aligned’ regulation increasingly needed in the UK.
Hydrogen Production Business Model
Risk-taking intermediaries (RTI), market players who take ownership of the hydrogen molecules before selling it on to transporters or end users, need to be recognised as an eligible offtake option. Stakeholders warned that without the recognition of RTIs, large-scale and efficient hydrogen trade, transport and storage may not materialise. Additionally, the current allocation round set up of the HPBM has also raised a competitive element between projects. This reduces collaboration between key stakeholders. The UK Government should assess how they can reduce this competition driven fragmentation within current funding mechanisms.
Misalignment between UK and EU ETS
The UK and EU ETS need to be aligned to successfully foster low-carbon trade of goods. Clarity is urgently needed around the scope of inclusion for the maritime sector.
Review of Electricity Market Arrangements (REMA)
The current electricity market pricing structure needs reforming to help bring down prices. As electricity prices are a major driver of hydrogen production costs, reforms are critical to increasing uptake and improving competitiveness of UK hydrogen.
Wider and international policy gaps
Alignment between international policy is critical to facilitating successful trade between nations. International policy gaps are shown below.
Lack of clarity on emission factors
Standardised emission factors for alternative fuels (e.g. methanol) are needed. This is highly relevant to sectors such as maritime and aviation where synthetic fuels may play a major role. Standard values are needed for carbon accounting, from accredited sources, to ensure reporting consistency.
Misalignment between certification frameworks
Differences in low-carbon hydrogen certification frameworks create complexity in international trade. The development of mutually recognised standardised certification frameworks is essential to facilitate cross-border trade in hydrogen and its derivatives.
Conclusions
Scotland has significant opportunities in the production, use and export of hydrogen, its derivatives and products, particularly to nearby markets in England, Wales, and the European Union. England and Wales offer a large local market due to existing industrial demand, geographical proximity, and similar regulatory frameworks. The EU is also a potential market because its member states are unlikely to meet their own low-carbon hydrogen demand, creating an opportunity for Scottish exports.
While Germany and the Netherlands are anticipated to import significant amount of hydrogen and derivatives, the extensive infrastructure and harmonised certification frameworks necessary for international trade are not yet in place. Subsea hydrogen interconnectors are crucial for intra-European trade as alternative delivery methods and hydrogen derivatives are associated with substantially higher costs. Without such a pipeline, other renewable resource-rich regions, such as the Middle East, South Africa and South America, may outcompete Scotland in the European market.
For global trade, ammonia is expected to become the dominant hydrogen derivative due to its technical maturity, efficiency, and well-established global market. Other hydrogen transport methods, like liquified hydrogen, LOHCs and metal hydrides, are anticipated have a more minor role. The most suitable hydrogen derivative for export will depend on factors including scale of production, transport distance, infrastructure readiness and end use application.
Key UK and EU industrial sectors such as chemicals, aviation, and steel are well-positioned to use hydrogen and hydrogen products directly, supported by rising carbon prices and emerging policies like the Sustainable Aviation Fuel mandates in the UK and the European Union. Although synthetic methanol will play a key role in decarbonising industrial use and maritime projects, uncertainties remain around maritime policy and biogenic CO2 availability.
As low-carbon ammonia markets and propulsion technologies mature, the maritime sector is projected to transition from ammonia to methanol in the medium to long term. Hydrogen has also been found to be critical for the decarbonisation of the iron and steel industry, with the majority of steel plants expected to use directly reduced iron (DRI) technology.
The success of international hydrogen trade will depend on robust infrastructure, emission trading schemes, and the timely implementation of the CBAM, alongside mutually recognised certification frameworks.
Recommendations
Stimulate demand by improving alignment – With carbon prices being among the strongest demand-side incentives, the Scottish Government could work together with the UK Government and the EU to maximise its benefits. As pointed out by stakeholders, the UK and EU Emissions Trading System need to be aligned to avoid potential carbon taxes on UK products including maritime fuels. The timely launch of the UK Carbon Border Adjustment Mechanism (CBAM) is also critical to stimulate demand domestically and achieve better alignment and consistency with the EU policy framework. Section 8 of the report discusses these policies, and more, in higher detail.
Stimulate demand by supporting trials and demonstration projects –The Scottish Government is encouraged to continue its approach with supporting hydrogen demand projects through subsidy schemes, such as the Hydrogen Innovation Scheme, helping end users overcome barriers to investment. More trials and demonstration projects are key to create learnings, improve investor certainty and get initial projects off the ground.
Support infrastructure – Scotland should support key new-built and repurposed infrastructure projects including a core UK hydrogen network, ports and terminals (see Section 5.2). This includes working with the UK Government to give developers more clarity on the timeline of a core hydrogen network and how this will link with UK ports and terminals. There should also be an equal amount of focus on developing demand- and storage-based infrastructure, like hydrogen boilers, refuelling stations and salt cavern storage.
Enhance competitiveness of Scottish hydrogen –To effectively compete with renewable rich regions, Scotland needs to meet a lower levelised cost of hydrogen. This is because the main contributor to the levelised cost of hydrogen is electricity price. High electricity prices are identified as one of the biggest weaknesses in Scotland’s hydrogen ambitions, as laid out in section 6.2. While the power of devolved administrations is limited, the Scottish Government is recommended to (1) commission research into alternative electricity market arrangements and (2) work with the Office of Gas and Electricity Markets (Ofgem) and the UK Government, representing the Scottish industry from an evidence base position.
Reform the planning and permitting regime and ensure safety case is developed – With Scotland having a longer and more complex planning and permitting framework compared to other industrialised countries, developers need more guidance. The Scottish Government should look to streamline these processes where possible to avoid unneeded congestion and accelerate decarbonisation. Work with the Health and Safety Executive (HSE) to ensure that the safety case for hydrogen is developed in a timely manner and disseminate the results effectively.
Optimise low-carbon policy frameworks – While current policy is designed to get initial projects off the ground, our research found that the Hydrogen Production Business Model needs to be optimised and designed considering interactions with other low-carbon policy frameworks, such as the Contracts for Difference Scheme, Hydrogen T&S Business Models and the H2P Business Model. The UK Government allowing risk-taking intermediaries in subsequent allocation rounds is critical to strengthen the hydrogen supply chain and unlock domestic hydrogen trade.
Co-ordinate with the EU –Infrastructure projects have long associated lead times and limited flexibility once approved. Therefore, coordinating infrastructure deployment with the European Hydrogen Backbone and port infrastructure is essential. More coordination with the EU, in the form of trade policies, was also one of the key takeaways and a commonly brought up point in the stakeholder engagement that Gemserv conducted. Key findings from the stakeholder engagement are discussed in Appendix G.
Continue progress on low-carbon – A standardised low-carbon hydrogen standard is critical to the success of hydrogen trade. The Scottish Government is recommended to work with the UK Government, European bodies and other international stakeholders to accelerate the harmonisation or the mutual recognition of low-carbon certification frameworks.
Engage local communities – Public perception has been seen to be a critical aspect in the successful implementation of hydrogen as a technology. The Scottish Government should continue to engage with local communities and improve the public understanding hydrogen’s role in a net zero energy system as well as the stringent safety and regulatory measures undertaken in implementation. The Scottish Government could also look at forming a strategy of how best to disseminate the benefits of hydrogen trade to local consumers.
Set out strategy on hydrogen trade – The Scottish Government could work with the UK Government on a clear strategy on how hydrogen export, and potentially import capacities, are planned to be developed.
Appendices
Hydrogen derivative and product assessment
Hydrogen, pipelines, derivatives and low-carbon alternatives
Economic implications
As shown in Figure 14 below, repurposed 48-inch pipelines are likely to have the lowest levelised cost of delivering hydrogen [26]. Since there are no existing pipelines between the Scottish mainland and the proposed hydrogen export markets in Europe, this option would likely involve the construction of a large length of new 48-inch pipeline. The construction of pipelines over long distances, however, would require a significant initial investment of both time and capital. Therefore, conventional tanker transport may provide a short-term solution, especially in cases where scale, distance or the end use case would not justify pipeline construction [59]. From a market perspective, our stakeholder engagement and existing research [60] [61] suggest that compressed pipelines are critical to ensure the competitiveness of Scottish hydrogen in European market. This is because alternative delivery methods and hydrogen derivatives are associated with substantially higher costs. Without a subsea pipeline, other renewable resource-rich regions, such as the Middle East, South Africa and South America, may outcompete Scotland in the European market.
Owing to its higher volumetric energy density of 70.85 kg/m3 [62], it is possible to transport the same amount of liquified hydrogen in a smaller tanker compared to gaseous hydrogen. Compared to compressed hydrogen pipelines, this option is still relatively expensive per volume of hydrogen transported, with the liquefaction process estimated to add up to almost half the total cost of hydrogen transport [63]. Liquified ammonia has been shown to be the lowest cost of selected hydrogen derivatives over long distances [26]. When ammonia is used directly as a feedstock, it is not necessary to reconvert the ammonia to hydrogen upon arrival.
Direct use of hydrogen derivatives is further discussed in section 4.2. Our research used offshore high-voltage direct current interconnectors as a reference point, as they are also suitable to alleviate curtailment issues to some extent. Despite no ‘conversion costs’, transporting renewable electricity through HVDC cables could have higher costs compared to repurposed hydrogen pipelines due to efficiency and flexibility restrictions, described within Section 5.1.1.2.
Figure 14: Levelised cost of delivering hydrogen Source: International Energy Agency (IEA) (2022)
Technical feasibility
Subsea high voltage cables are highly mature, with a technology readiness level (TRL) of 9 and nine electricity interconnectors already connecting Great Britain to neighbouring countries [64]. However, congestion issues, relatively low efficiency over long distances and the lack of long-term flexibility could make electricity interconnectors less suitable to export larger amounts of renewable energy compared to hydrogen technologies [7] [65] (Table 15)
Transporting hydrogen through new-built pipelines is a mature technology (TRL 9), with more than 2,000 km of pipelines operational in Europe [26]. Given limited commercial deployment, repurposed pipelines have lower technical maturity (TRL 7) [26]. Investigation into the repurposing of networks is ongoing in the UK as part of National Gas Transmission’s FutureGrid project [66]. Scotland has 17,000 miles of gas pipeline [67], with an additional 100% hydrogen North Sea pipeline being considered as part of the Hydrogen Backbone Link. This would enable export of hydrogen from Scotland to Germany through a 10 GW hydrogen pipeline by 2045, transporting 2.4 kt of hydrogen per day [4] [68]. Liquified hydrogen has been used for a long time, with the first liquefaction taking place in 1898 [69]. As liquified hydrogen has not been produced on a commercial scale, it has a TRL level of 8 [70] [63].
Although conversion and reconversion processes are needed, the simpler handling and higher hydrogen density of hydrogen derivatives make them more attractive. While some liquified ammonia could boil off during transport (approximately 0.098 % /day) [63], ammonia loss is less significant compared to liquified hydrogen, given the relatively high boil point of -33 °C. Stakeholders agreed that while low-carbon hydrogen production is in its infancy, ammonia production and shipping has competitive advantage in technical maturity compared to other derivatives. While no ammonia or liquid hydrogen port projects have been announced in Scotland, some of the existing infrastructure, for example LNG and LPG terminals, can also be repurposed to reduce capital costs [71]. Strategically important Scottish ports are discussed in further detail in Table 11. The final step in the value chain is ammonia cracking, splitting ammonia into hydrogen and nitrogen molecules. Ammonia crackers are not as mature as ammonia synthesis plants and have an overall TRL between TRL 4 and 6 [72].
The main technical advantage of LOHCs, for example methylcyclohexane (MCH) and dibenzyl toluene (DBT), is that they are compatible with existing liquid fuel assets, with no boil off during shipping. While interest in LOHCs is limited in Scotland, some UK-based developers are investigating this technology. Magnesium hydride has a volumetric H2 density of 106 kg H2/m3, which makes it a suitable alternative to ammonia in ports that do not allow its import or export, due to stringent safety regulation. Magnesium hydride is easier to handle than ammonia, and magnesium as feedstock is widely available, reducing total costs. Some stakeholders highlighted the increasing need for the HSE’s updated guidance on hydrogen safety, with most stakeholders mentioning the lack of guidance on hydrogen planning and permitting as a significant bottleneck. Several UK-based projects, including, HyDus [73], HEOS [74] and HydroStar [75], are investigating metal hydride technologies. Further research is being undertaken to increase the uptake efficiency and the dehydrogenation process, which does not require high temperatures. Our stakeholder engagement suggests that strategic co-location of hydrogen derivative plants with other heat-intensive processes could offer additional efficiency gains through heat recovery. Strategic planning with holistic and regional approach, however, is critical to unlock these opportunities. Technical advantages and disadvantages are displayed in further detail in Table 12.
Sustainability
Overall greenhouse gas (GHG) emissions associated with hydrogen and derivative transport are highly sensitive to the fuel and technology used for the conversion, transport and reconversion processes, also known as hydrogenation and dehydrogenation. Among all hydrogen and derivative transport methods, compressed hydrogen pipelines are associated with the lowest greenhouse gas emissions [76], with low energy requirement and compression being easy to decarbonise. Other derivatives, like ammonia and LOHC, require more energy, with some of the processing and transport methods being hard-to-decarbonise [77]. As Haber-Bosch synthesis accounts for approximately one third of all energy consumed in the ammonia production process [78], it is critical that any future ammonia plants are designed to run on low-carbon energy. However, only a limited amount of work has been done on electrifying ammonia synthesis and cracking [79]. A 2022 E4Tech research paper found that low-carbon ammonia would not necessarily meet the UK Low Carbon Hydrogen Standard even if electricity were to be used for ammonia synthesis [76]. Ammonia and most LOHCs are toxic to humans and marine ecosystem, with further sustainability and environmental concerns detailed in the Table 14.
Industrial feedstock
Economic implications
Low-carbon hydrogen can be integrated into ammonia and oil refining processes without significant modifications to existing equipment. This infrastructure readiness may offer cost benefits. As highlighted by stakeholders, there is better economic case for using ammonia directly compared to reconverting it to hydrogen. This is because costs and efficiency losses associated with reconversion, also known as dehydrogenation, can be avoided [80]. In Table 4, ammonia production and refining are not assigned economic RAG ratings due to the lack of a viable low-carbon alternative for reference. The future cost competitiveness of synthetic methanol remains uncertain, given the unknowns surrounding hydrogen and biogenic CO2. Existing research, however, suggests that bio-based methanol could be produced at a cost up to 55% lower than synthetic methanol [13]. Conventional methanol plants can also operate on bio-feedstock. The economic competitiveness of green steel varies, with a RAG rating of green and amber, depending on the chosen technology. Despite high costs, DRI technology is expected to capture a growing share of the green steel market due to its carbon neutrality. As sustainability becomes a priority, hydrogen-based iron reduction will likely become more cost competitive, gradually reducing reliance on highly polluting blast furnaces [81].
Technical feasibility
In contrast to ammonia and refining plants, synthetic methanol production necessitates significant infrastructure investment or substantial upgrades. The process requires the capture and storage of high purity biogenic CO2, with the technology currently at a TRL of 8-9 [13]. These plants operate at high efficiencies, ranging from 89 to 95% [82]. However, multiple stakeholders have emphasised the growing need for strategic planning, especially on regional scale, due to the geographical misalignment between biogenic CO2 and hydrogen supplies which is a challenge to efficient production. For steel production, electrolytic hydrogen has been successfully demonstrated for DRI, but it has not yet reached commercial scale (TRL 7) [83]. Currently, it is estimated that less than 1% of steel in Europe is produced using DRI [84], with the majority of planned DRI projects yet to be operational [85]. Steel production in Scotland has declined in recent years, with annual output falling below 6,000 tonnes of crude steel [86]. Although some plants have outlined their decarbonisation strategies, the path to fully decarbonising Scottish steelmaking remains uncertain. When asked about technical challenges, most stakeholders were not concerned about early-stage technical maturity. Stakeholders suggested that the complexity of the planning and permitting process and the length of consideration are more significant bottlenecks in project development.
The use of low-carbon hydrogen in oil refining and fertiliser production presents minimal technical challenges, as the transition primarily involves fuel switching. INEOS intends to use low-carbon hydrogen, starting as early as 2029 [87]. However, with no ammonia and fertiliser production facilities in Scotland, interest in ammonia production is limited. Meanwhile, plans to establish a renewable methanol plant in Scotland by GEG and Proman are underway [88].
Sustainability
Hydrogen has been used as industrial feedstock for decades, with strict adherence to safety regulations by producers and users. Beyond the environmental benefits associated with fuel switching and decarbonisation, hydrogen also plays a crucial role in desulphurisation which prevents sulphur oxide emissions and reduces the risk of acid rain. While some fugitive emissions may occur (see Table 14), regulations and commercial incentives are in place to minimise these. Further details on environmental impact are detailed in Appendix C.
High temperature heat
Economic viability
Hydrogen has a high gravimetric energy density of 120 MJ/kg compared to 44 MJ/kg of natural gas [89], making it an attractive option for decarbonising high temperature industrial heat. However, hydrogen’s low volumetric energy density compared to natural gas makes it more expensive to store and transport, due to the increased capacities required. For this reason, among others, transitioning to hydrogen as fuel comes with significant costs. For example, converting a furnace in the basic metals sector to hydrogen would cost approximately £730,000 for 10 MW of capacity [10]. It is estimated that £2.7 billion in capital investment would be required to convert UK industrial sites and equipment. CCUS is also considered relatively high cost even though costs are expected to decline with technology maturity [90]. Our stakeholder engagement confirmed that CCUS technologies will become more cost-effective with scale and concentration of demand. The carbon capture process itself is the most expensive component accounting for 80% of the total costs [90]. On the contrary, bio-based fuels are widely available, scalable and cost-competitive in certain locations. Our stakeholder engagement highlighted that while bio-based fuels are widely available today, feedstocks are limited, preventing larger-scale and widespread adoption in the future.
Technical feasibility
Most industrial equipment, such as boilers, kilns, ovens, furnaces, has been demonstrated to be compatible with hydrogen through the Hy4Heat project [10]. While the technology is available, it has yet to be demonstrated at a commercial scale (TRL 7-8; industrial fuel switching). Minor technical challenges persist, including issues with pipe sizes, flue gas composition and different heat transfer characteristics [91]. Additional details on hydrogen heating technical challenges are in Table 13. Many natural gas-fire gas furnaces can be retrofitted, with only certain components requiring modification [91] [92]. However, retrofit options and associated GHG and cost savings depend on the end use sector and the complexity of the industrial site. Our stakeholder engagement confirmed that more trials and demonstration projects are needed to increase the technical readiness of hydrogen technologies and create learnings in a Scottish context.
CCUS systems can be integrated with existing boilers and heaters [93]. However, carbon capture infrastructure requires large investment. The UK’s geological advantage and access to depleted hydrocarbon fields provide a competitive advantage for carbon storage [94]. As pointed out by stakeholders, scale is critical for operating CCUS systems cost-effectively. Therefore, these systems must be strategically located, near concentrated demand, favourable geology and potential biogenic CO2 offtakers. Although large-scale CCUS projects are not yet operational in Scotland, the Acorn Project has advanced directly to Track 2 of the UK Government’s Cluster Sequencing Programme. By reusing the existing hydrocarbon infrastructure, the Acorn project aims to capture and store between 5 and 10 Mtpa of CO2 under the seabed by 2030 [95].
Hydrogen boiler and indirect dryer
Hydrogen direct dryers and ovens, furnaces
Kilns
Carbon capture (depending on technology)
Biomass technologies
TRL 7 [96]
TRL 4 [96]
TRL 5 [97]
TRL 6-9 [98]
TRL 9[99]
Table 9: Technology Readiness Level of selected high temperature technologies
Solid biomass is a well-established technology, with most biomass boilers, kilns and furnaces achieving a TRL of 9 [99]. While the majority of biomass is currently used to generate electricity, over 37% is utilised to produce heat [100]. Given that CCUS and hydrogen technologies are not yet commercially available, many industrial plants aiming for long term decarbonisation opt for biomass. Unlike hydrogen, biomass can be stored at ambient pressure and temperatures. However, biomass technologies are generally unsuitable for direct heating applications, such as kilns, furnaces and dryers, as they may affect the product quality [99].
Sustainability
Burning hydrogen does not produce CO2, but it can generate increased levels of nitrogen oxides (NOx) compared to natural gas combustion due to the higher temperatures used [101]. Nitrogen oxides are a mixture of gases, worsening air pollution, impacting human health and, reacting with other gases, indirectly contributing to global warming. However, research indicates that the higher stable combustion temperature of hydrogen may offset NOx emissions [102]. This is because the increased air to fuel ratio enabled by hydrogen leads to lower combustion temperatures which in turn reduces NOx emissions [102]. While CCUS technologies cannot capture 100% of CO2 emissions, pairing them with biomass kilns and furnaces may result in negative emissions. Additional details on sustainability benefits and challenges are provided in Table 14.
Transport
Economic implications
For LDVs, Fuel Cell Vehicles (FCVs) achieving cost parity with fossil fuel powered LDVs before 2040 will be challenging, unless the fuel cell costs decrease due to higher volume production. When looking at 5-year total cost of ownership, fuel cell powered and battery electric powered LDVs will likely be close or marginally lower than fossil fuel powered LDVs by 2040 [103]. The Advanced Propulsion Centre conducted a battery and fuel cell vehicle cost comparison for a range of vehicle types. Findings included that fuel cell powered vans will be the preferred technology type by 2030 [104].
Fossil methanol has an established global market, with synthetic methanol production growing each year [105]. Existing ships and vessels that run on liquid fossil fuels, like diesel and kerosene, can be retrofitted to run on low-carbon, synthetic liquid fuels, like methanol, allowing owners to avoid the capital cost of a new ship. Although sales of methanol dual-fuel ships have significantly increased in recent years [106], the high cost of synthetic methanol may change commercial incentives [107]. Our stakeholder engagement also suggests that ammonia will be the dominant maritime fuel in the short and medium-term due to the lower cost of the fuel. This is in line with the analysis of the IEA estimating the cost of synthetic methanol production to be 25 to 100% higher than the production cost of low-carbon ammonia [107]. The difference in fuel costs is partially due to the high cost and limited availability of biogenic CO2, making methanol ships uncompetitive in the long-term, especially once ammonia technologies are mature. This is despite the higher transport and storage cost of ammonia, requiring cooling and compliance with a range of national and international regulations.
According to the International Air Transport Association (IATA) the average price of jet fuel in 2022 was roughly £3.18 per gallon, a 149% increase on the previous year, yet comparatively, in 2022, the current average price of SAF within the US was £7 per gallon [108]. While the IATA estimates that all SAF products are 2-4 times more expensive than alternative aviation fuels [108], costs could reduce with the emerging SAF mandate.
Technical feasibility
Hydrogen fuel cells have faster refuelling times than Battery Electric Vehicles (BEVs), making them well suited for long heavy-duty trips [16]. Fuel cells also have other potential applications in maritime, rail and aviation (HyFlyer) sectors. The Scottish Government has funded multiple hydrogen buses in Aberdeen that have been successfully implemented since 2015 [109]. On the whole, fuel cells have a high TRL, however this can vary slightly by use case. For example, the Aerospace Technology Institute label a generic fuel cell as TRL 8, with a fuel cell in aviation use cases at TRL 5 [110].
Ships can be retrofitted for ammonia engines easier than for fuel cells, which need a complete makeover of the engine infrastructure. Ammonia blends of 70% have been successfully implemented [111] in certain engines. The energy transfer chain of ammonia has a number of conversions resulting in efficiency losses. From the initial renewable energy produced, 17% will make it to the ship’s propeller [112]. On the other hand, it is more complicated to produce synthetic fuels in large quantities limiting the long-term applications. Ammonia must be stored at -33◦C. This gives e-fuels a storage advantage, as the conditions are much milder and not different to the current fuels used. The IEA’s report on International Shipping reports that in 2022, 90 (11% by tonnage) new-build orders were for ammonia-ready vessels, 43 (7%) were for methanol vessels and 3 were for hydrogen-ready vessels [113]. SAF encompasses a range of technologies or SAF production pathways, detailed in Table 10.
TECHNOLOGY
TECHNOLOGY READINESS
Hydrogen fuel cell engine in light vehicles
TRL of 9
Hydrogen fuel cell engine in heavy vehicles
TRL of 7-9
Sustainable Aviation Fuel
TRL of 9 (HEFA)
Low-carbon methanol as a maritime fuel
TRL of 9
Low-carbon ammonia as a maritime fuel
TRL of 9
Table 10: Technology readiness of transport technologies
Sustainability
Whilst SAFs release carbon when burned, they could reduce carbon emissions by 80% over the lifecycle compared to traditional jet fuel [114], while having similar combustion characteristics and safety considerations. Ammonia burns less easily and is less flammable than conventional shipping fuels, and therefore is safer from a health and safety perspective [115]. Hydrogen fuel cells do not result in any emissions of greenhouse gases when in use [116]. Further sustainability benefits and challenges are detailed in the Table 14.
Power generation
Economic implications
The capital cost associated with large scale hydrogen peaking plants is estimated to be between £350 and £600 per kW, whereas capital costs associated with fossil fuel based peaking plants is between £300-600 per kW [117] [118]. The overall cost of electricity, however, will depend on several factors, for example, load factor, efficiency of the turbine, heat and water recovery [119]. While large scale hydrogen power plants can technically provide both mid-merit and peaking generation, they are expected to be cost competitive when running as a peaking plant and below a load factor of 20-30% [118] [120]. This is due to higher operating costs compared to low-carbon alternatives. Despite additional costs, there is an economic case for retrofitting existing natural gas power plants with CCS (Table 17). This is because retrofitting is estimated to extend the lifetime of a power plant by 10 years, resulting in substantially lower capital costs [23]. The estimated cost of retrofit is around £110 per kW compared to the new-build gas turbine’s capital cost of £740 per kW [120]. Due to increasing scale and simplification, it is estimated that the cost of CCS-power plants could reduce by 45% after the first three installations, with technical innovation leading to an additional reduction of 5-10% thereafter [121]. With widely available biomass supply and highly mature technology, unabated biomass generation is currently the most prevalent among the selected technologies. However, as CCS technologies become commercially available, unabated biomass generation is anticipated to be phased out. This is due to the relatively high cost of power generation. While retrofitted hydrogen plants could reach a levelised cost as low as £65 per MWh in 2035, the Contract for Difference of biomass plants guarantees £100 per MWh (2012 prices) [23]. The levelized cost for unabated gas plants may reach £170-£180 per MWh while gas CCS plants’ levelized costs are estimated to be £75-£90 per MWh [23]. Despite this challenging economic case, biomass plants coupled with CCS technology are expected to have high potential due to substantial carbon benefits. While the cost of hydrogen-fired turbines could reduce over time, they are expected to be used for low load factor operation, with CCUS-enabled power generation running on higher load factors.
Technical feasibility
While only minor alterations are required to existing gas power plants to reach hydrogen/gas blends around 70% [122], 100% hydrogen power plants have more potential in the long term due to higher carbon benefits. Retrofit to 100% hydrogen plants is also technically feasible, with a few technical challenges including changes to pipes and combustors due to differences in hydrogen’s volumetric density. Ammonia is the least mature power generation technology among the four. A few projects have demonstrated the viability of co-firing up to 20% and 70% with coal and natural gas, respectively [123]. Some technical challenges such as flame stability, and the low combustion speed of ammonia do not only make ammonia-fired power generation less efficient than the baseline but also result in incompatibility with larger gas-turbines [124]. The main technical advantage of biomass power plants is that existing coal power plants can be easily retrofitted to run on biomass. Given high technical maturity, capacity for electrical generation from biomass in the UK reached 12% of all capacity in 2023 [125]. Despite high hydrogen potential, there is limited experience with hydrogen power generation in Scotland. The Peterhead Power Station is planned to be coupled with CCUS technology as part of the Acorn project, positioning the facility as one of the first CCUS-enabled gas power plants. In addition, there are eight major diesel generation sites in Scotland used as backup supply for remote locations [64] [126]. A few hydrogen power projects, like the Kirkwall Airport CHP, are operational in Scotland, but further trials are needed, particularly on remote Scottish Islands, to provide learnings of this sector in a Scottish context, according to our stakeholder engagement. Further technical details can be found in Table 17.
Sustainability
Main sustainability concerns include CO2 leakage rate from underground reservoirs, ammonia’s toxicity and NOx emissions. Due to high carbon benefits, a 2018 CCC Biomass report concluded that available biomass should be used with BECCS applications ‘to the maximum extent possible’ [127]. Further sustainability challenges and benefits are detailed in Table 14.
Offtaker Market Assessment
Existing demand
Figure 15: Import of hydrogen in 2023 in selected countries [33]
Figure 16: Value of ammonia trade in EU, Belgium, Germany and the Netherlands. Source: Eurostat
Infrastructure log
Country
Name
Type
Description
Shetland, Scotland, UK
Sullom Voe
Terminal
Shetland has some of the most abundant wind resources in the UK but is somewhat isolated from the mainland grid. This makes development of curtailment options including green hydrogen a top priority. Sullom Voe is a deepwater port that already has three existing tanker jetties designed for ultra-large crude oil tankers and one for medium sized LPG tankers. It is suitable for ammonia export based on similarities to the technology currently in use at the terminal for LPG.
Orkney, Scotland, UK
Flotta Terminal
Terminal
Flotta Terminal has a crude oil import pipeline and a jetty. It has been earmarked as the location for Hydrogen Hub Orkney test facility, owing to its remote location and significant industrial space available in the immediate vicinity for hydrogen production. Approval has been obtained for a 220MW interconnector to the Scottish mainland in order to facilitate future offshore wind generation.
Scotland, UK
Port of Cromarty Firth
Port
Plans to produce, use and export (via LOH and liquefaction) hydrogen are already in development. The port has a depth of up to 14m and is able to provide more than 2000m quayside in an ideal location to serve several of the North East ScotWind option areas. It was awarded Green Freeport status in 2023 and this is expected to attract further investment in a number of offshore wind and hydrogen projects.
Scotland, UK
Outer Hebrides Hydrogen Hub
An expansion of the green hydrogen production capacity has been put forward in the updated Energy Strategy for the hub. The Stornoway Port Masterplan included development of a 400m long, 10m deep port, that could accommodate LPG/NH3 gas carrier vessels that are unable to make use of the 6m port currently in operation. It is well placed to serve the northerly ScotWind option areas.
Scotland, UK
St Fergus Gas Terminal
Terminal
It is the central gathering hub for gas production from the Northern North Sea region and contains the SEGAL system and the SAGE gas terminal. Extensive international (Norway) and North Sea gas pipeline infrastructure have made the terminal the primary candidate for any new hydrogen export pipeline. The site is well positioned to receive any hydrogen produced offshore in the North Sea through these existing gas pipelines. The Acorn project intends to enable production of blue hydrogen, for the domestic market, next to the terminal, as a part of the “Hydrogen Coast” initiative.
Scotland, UK
Grangemouth/Hound point
Terminal (+ refinery)
The Hound point marine terminal appears to be the obvious export port suitable for the loading of VLGC. The company LNG9 have allegedly proposed a blue hydrogen/CSS project in the area already.
England, UK
Port of Immingham
Port
ABP and Air Products are collaborating to construct a jetty at the port that is capable of handling green hydrogen.
England, UK
Stanlow Terminals
Terminal
There has been an announcement of an intention to open a major new import terminal for green ammonia in the port of Liverpool. The new terminal is expected to be able to import and store in excess of one million tonnes (39.4 TWhHHV) of green hydrogen per year.
England, UK
Teesport
Port
While plans on low-carbon ammonia imports are unclear, Teesport is the main point for ammonia imports for fertiliser production in Teesside.
Antwerp, Belgium
Antwerp NH3 Import Terminal
Terminal
Aims to become a large hydrogen import hub and has excellent connections to the Shell and Exxon Mobil refineries and three steam crackers. A conceptual ammonia storage facility is planned for completion here in 2027.
Zeebrugge, Belgium
Zeebrugge New Molecules development
Other
Conceptual ammonia cracking facility planned for completion in 2030.
Brunsbüttel, Germany
Ammonia Brunsbüttel
Port
Ammonia cracking facility in the feasibility study stage. It has a projected capacity of 300 kt ammonia and a projected 2026 completion date.
Wilhelmshaven, Germany
Green Wilhelmshaven
Other
Ammonia cracking site with an announced size of 295 kt H2/year).
Hamburg, Germany
Ammonia import at Hamburg
Port
Conceptual ammonia cracking and storage facility at the port of Hamburg – planned for completion in 2026.
Maasvlakte, Netherlands
ACE Terminal
Terminal
Conceptual ammonia cracking and storage facility intended for completion in 2026.
Rotterdam, Netherlands
H2Sines.RDAM
Other
LH2 regassification facility in the feasibility study stage, with an announced size of 100 tpd LH2, with upscaling to 300 tpd and an intended start date of 2028.
Maasvlakte, Netherlands
Global Energy Storage (GES)
Other
Ammonia storage facility in the conceptual stage.
Maasvlakte, Netherlands
OCI Import terminal
Terminal
A terminal that is expected to be expanded to a capacity of 1.8Mt of ammonia
Maasvlakte, Netherlands
Koole & Horisont Energi
Other
Ammonia storage in feasibility study stage.
Table 11: Infrastructure opportunities in Scotland, the rest of the UK and selected European countries
In order to attract investment, hydrogen transport must be financially profitable within a specifically defined niche. A number of methods of hydrogen transport are available, all with differing properties which determine how cheaply and safely the hydrogen can be transported. Although hydrogen is incredibly dense by mass, it takes up a lot of volume, which makes it expensive to transport. It can therefore be compressed or even liquified to decrease the price of transport, or alternatively it can be transported in the form of other substances that contain a large amount of hydrogen but have different properties (for instance density) that make them cheaper to transport. Physical properties such as the volumetric density and storage temperature of each carrier are important factors that would have to be accounted for in the supply chain. On the other hand, technology readiness level (TRL), market readiness level (MRL) and commercial readiness level (CRL) are all technoeconomic properties that reflect how mature each technology is and whether the carrier is likely to be financially viable. Technoeconomic properties are not fixed in the same way as physical properties and so as the technologies develop, certain carriers may become increasingly viable. Ultimately both physical and technoeconomic properties of each transport option must be weighed up and used by decision makers to predict the best course of action.
Hydrogen heat technical challenges
Challenge
Description
Difference in flame speed
The combustion of hydrogen results in a much greater flame speed compared to the combustion of natural gas (1.7 ms-1 compared to 0.4 ms-1). If existing natural gas combustion equipment is used to combust hydrogen, there is a risk that the flame speed will exceed the gas velocity exiting the burner nozzle. This can cause an event called a “flashback” which can damage the nozzle and other components of the burner.
Adiabatic flame temperature
Hydrogen flames are much hotter than natural gas flames. This is referred to as a large difference in “stochiometric adiabatic flame temperature”. The adiabatic flame temperature of hydrogen is 2,182°C, whereas it is 1,937°C for natural gas – a difference of 245 °C. This temperature increase poses a risk to natural gas combustion equipment if operated with a hydrogen fuel source and additionally increases the NOx emissions.
Flame emissivity
Hydrogen flames radiate more UV radiation in comparison to natural gas flames, which makes them paler in colour and more difficult to see.
Safety considerations
Hydrogen has a higher flammability limit than natural gas and due to its molecular size (the smallest of all molecules), hydrogen is more prone to leakage. This is most problematic in poorly ventilated or confined situations where the leaking hydrogen cannot diffuse into the atmosphere and thus poses a risk of explosion.
Table 13: Technical challenges with high temperature heat equipment
Sources: [134]; [135]
Environmental log
Impact Sub-category
Description
Hydrogen derivative
Emissions reduction
NOx
Nitrogen oxides are a mixture of gases, worsening air pollution, impacting human health and, reacting with other gases, indirectly contributing to global warming. Ammonia typically generates high NOx levels during combustion, however recent research and development suggests that ammonia can be used to reduce NOx emissions at the point of combustion [136].
Hydrogen, ammonia
CO2
Combusting ammonia significantly reduces CO2 emissions, and any CO2 produced can be stored in geological storage in Scotland that have reliable leakage rates below 0.1% [137].
Fugitive hydrogen emissions
Hydrogen leakages in the NH3-H2 conversion process are estimated at 5% but stringent protocols and advanced processes are designed to minimise this risk [138] [139].
CO2
Utilises captured CO2 in production, offsetting any released CO2 and lowering atmospheric concentrations [140].
Synthetic methanol
SOx and NOx
Produces fewer NOx and SOx during combustion compared to fossil fuels [141].
CO2
Use of SAFs reduces lifecycle CO₂ emissions by up to 80% compared to conventional jet fuel [114]
and SAFs made from biomass or waste materials can be carbon neutral [142].
SAF
Indirect emissions
SAF as a drop in solution, is compatible with existing engines, reducing additional emissions by eliminating the need for new infrastructure [143].
Air quality
Particulate Matter
Upon combustion ammonia produces significantly less particulate matter [144].
Ammonia
Particulate Matter
Burns cleaner than fossil fuels, producing less particulate matter [13].
e-methanol
Particulate Matter
Typically generates fewer particulates and soot due to lower amounts of aromatics and sulphur [145] [146]. Evidence shows a reduction in contrail cloudiness when using SAFs [147].
SAF
Resource depletion and land use
Resource demand
The ammonia-hydrogen conversion process is energy intensive, requires significant volumes of water and involves extracting critical minerals for catalysts, potentially impacting direct or indirect land use changes [148] [149]/
Ammonia
Land Use Competition
Challenges arise if crops are specifically grown to capture biogenic CO2, leading to land use competition. Thus, other CO2 sources, like concentrated or engineered carbon capture, are preferred [150].
e-methanol
Use of renewable feedstock
SAF can be produced from waste materials or renewable sources like algae or plant oils, reducing the need for virgin resources and minimising land use competition [145], [151]. However, using food crops for SAF production displaces food crops, leading to the expansion of cropland into forests and grasslands, which reduces natural carbon sequestration [151] .
SAF
Ecotoxity
Environmental contamination
While ammonia is linked to eutrophication and acidification of soil and water bodies which impacts ecosystems [152], the effect is highly dependent on several factors and relatively higher concentration of ammonia [112].
Ammonia
Environmental contamination
Methanol is less toxic to the environment than many conventional fuels. Spills or leaks are less harmful and easier to remediate due to its quick evaporation. In addition, methanol does not dissociate into ions when dissolved in water, avoiding acidification [153].
e-methanol
Environmental contamination
Current reports indicate potential toxicity to aquatic life and suggest that certain SAF production methods may contribute to eutrophication [154].
SAF
Human / General toxicity
Acute toxicity
Ammonia is highly toxic and corrosive, posing life threatening health risks upon exposure though acute toxicity is usually a result of direct contact with it [155].
Ammonia
Flammability
Ammonia is not highly flammable but can form explosive mixtures with air at certain uncontrolled concentrations [155].
Chemical exposure
Prolonged, direct exposure to methanol via inhalation or ingestion is harmful to human health but small quantities are not [156].
e-methanol
Flammability
Methanol is highly flammable and poses a significant fire hazard [156].
Chemical exposure
Some SAF production pathways may produce volatile organic compounds or harmful substances, though in minimal quantities [157].
SAF
Combustion emissions
Whilst SAFs produce less particulate matter and NOx than conventional aviation fuels, they still emit fine particles and NOx which can cause respiratory issues when inhaled [146].
Table 14: Environmental log
HVDC interconnectors
Hydrogen pipelines
Liquified hydrogen
Ammonia
LOHC
Metal hydride
Energy transfer capacity per project (current maximum)
12 GW [65]
20-30 GW [65]
Depends on ships
Depends on ships
Depends on LOHC type and conditions of transport
Example of LOHC type (H-18 DBT): 47 MWh [158]
Technical advantage
Technical maturity and experience
Long-duration, inter-seasonal storage. Potential to decarbonise industrial processes directly.
Long-duration, inter-seasonal storage.
Potential to decarbonise industrial processes directly.
Long-duration, inter-seasonal storage.
Potential to decarbonise industrial processes directly.
Long-duration, interseasonal storage.
Potential to decarbonise industrial processes directly.Long-duration, inter-seasonal storage. Potential to decarbonise industrial processes directly.
Long-duration, inter-seasonal storage.
Long-duration, inter-seasonal storage.
High voltage capacity with low energy to heat losses
High power transmission capacity therefore low power losses
Efficiency over long distances [65] [159]
Can transport large volumes of energy over long distances [65]
More efficient for long distance transport.
Space efficiency by allowing more storage by volume relative to gaseous hydrogen [160]
Established global market
High volumetric density thus easier to store and transport
Efficiency over long distances [161]
Hydrogenation is exothermic, therefore, while efficiencies are low, heat recovery can increase overall efficiency. [162]
Operates at near room temperature and atmospheric pressure)
Enhanced safety during operation
No leakage [163]
Technical challenge
Congestion issues
Inefficiency over long distances [65]
Wind pattern correlation across the North Sea
Metal pipelines are susceptible to embrittlement (mainly an issue for distribution pipes) [65]
Requires high energy demand for liquefaction and regasification of hydrogen
Leakage through boil off is common [160]
Intermittent ammonia production is challenging.
Conversion and reconversion process are energy taxing [161]
Needs to be purified
Needs to be returned after dehydrogenation.
Dehydrogenation is endothermic [162]
Tanks can be heavy, due to metal hydrides’ low mass-specific storage density
Dehydrogenation requires high temperatures [163]
Table 15: Technical table of hydrogen derivative technologies
Name
Feedstocks
Notes
HEFA – Hydroprocessed Ester and Fatty Acids
Waste and residue fats (vegetable oil)
Purposefully grown plants
TRL 8-9. Already used commercially in aviation, as well as in road transport, so pressures on supply exist.
AtJ – Alcohols to Jet
Agricultural and forest residues
Sugar or starch crops
TRL 7-8. AtJ (and Gas+FT) can are considered advanced biofuels if produced from REDII compliant feedstocks.
Gas + FT – Biomass Gasification + Fischer-Tropsch
Same as AtJ (listed above)
Municipal solid waste
Gas+FT has significant carbon reduction and supply potential.
PtL – Power to Liquid
Hydrogen
Carbon dioxide
The CO2 can be sourced from biomass, waste processes (with CCS) or via direct air capture.
Table 16: An overview of SAF production pathways [77]
TRL [164]
Efficiency (%)
Levelized cost in 2035
Unabated gas (CCGT)
9
57
170-180
CCUS (CCGT)
8
50
75-90
Retrofit hydrogen
7
55
£65-100/MWh
New-built hydrogen
7
55
£90-125/MWh
Unabated biomass
9
20 [165]
£98 per MWh [166] and existing low-carbon contracts are for £100 per MWh (in 2012£)
Approximately between $167 and $197 pwe MWh at 25% power plant capacity factor in 2040 [169]
Table 17: Techno-economic table of power generation technologies
Policy tables
UK Regulatory Barriers
Policy gap
Description
1
HSE
The safety case for hydrogen still needs to be signed off by the HSE in the UK. This will remove uncertainty and confusion about the potential role of hydrogen in decarbonising heat, and other applications. The uncertainty that currently exists stops stakeholders from forward planning and making strategic decisions.
2
ADR regulation
Hydrogen transport is currently prohibited through ten road tunnels in the UK based on its classification under the European ADR rules (carriage of dangerous goods by road). Reviewing hydrogen-specific ADR regulation, along with restrictions for ammonia and LOHCs, transport efficiency could be significantly increased. However, any changes to these regulations should be dependent on safety cases being proven.
3
Offshore licensing
While it is confirmed that the North Sea Transition Authority will be the licensing and decommissioning body for offshore hydrogen projects [170], the industry seeks more clarity on the timeline and details of future hydrogen regime.
4
Gas Safety Management Regulation (GSMR)
GSMR currently prohibits injecting more than 0.1% hydrogen into the networks. This will need to be updated to unlock the UK’s line pack capacity. The UK Government will make a policy decision in 2023 on whether to allow blending of up to 20% hydrogen by volume into the gas distribution networks [16].
5
Planning and consenting
Our research suggests that developers face a number of constraints surrounding the delivery of critical regulatory consents, particularly planning and environmental permitting. Delays around consenting can significantly extend the lead time of hydrogen storage projects. Some stakeholders suggested streamlining the Nationally Significant Infrastructure Project (NSIP) regime in England and accelerating the consenting process through increasing funding to relevant planning offices across the UK.
6
Gas Act 1986
With no comprehensive hydrogen-specific regulation in place, onshore hydrogen is regulated under the Gas Act 1986 and Planning Act 2008. As hydrogen is defined as “gas” under the Gas Act, most transportation, storage, and supply regulatory requirements of natural gas applies to hydrogen as well.
7
Control of Major Accident Hazard (COMAH) regulation
Control of Major Accident Hazard (COMAH) applies to hydrogen and most of its derivatives, such as ammonia, methylcyclohexane and toluene. Magnesium hydride, however, is not considered a dangerous substance under COMAH. In Scotland, COMAH regulations are enforced by the COMAH Competent Authority.
Table 18: Policy gaps in the UK
International Hydrogen Policy Log
Region
Policy name
Description
European Union
Net Zero Target
The European Union aims to meet net zero emissions by 2050.
European Union
Hydrogen Strategy
The hydrogen strategy for a climate-neutral Europe was adopted in July 2020.
European Union
RePowerEU
The European Commission implemented the REPowerEU Plan to phase out reliance on Russian fossil fuel imports following the invasion of Ukraine.
European Union
REDIII Targets
Transport: RED III fuel suppliers must achieve a 14.5% reduction in GHG emissions associated with their fuels or achieve at least 29% renewables share in the fuel supply. In addition, at least 5.5% of the fuel mix must be composed of advanced biofuels and RFNBOs (combined binding target).
Industry: The EUs CBAM Regulation (10th May 2023) will be transitioned in during the period of 2023-2026 and then full force from 2026 onwards. The EU’s Fit for 55 proposals include a 50% renewable share for hydrogen used in industry. RED III – Industry must procure at least 42% of its hydrogen from renewable fuels of non-biological origin (RFNBOS) by 2030, though countries that can achieve a fossil-free hydrogen mix of at least 77% by 2030 can see that target reduced by 20%.
European Union
H2Global
H2Global is live (1st auction closed 2023) and formed through H2 purchase and sale agreements through a central body. Managed windows for funding applications through 10-year hydrogen purchase agreements, competition-based procurement process. As of 06/23, H2Global and the Hydrogen Investment Bank have been linked. Working on a European auction open to all EU countries.
European Union
Hydrogen Bank
Acts through an auction system, fixed price payment per kg. Fixed premium per kg hydrogen produced for a maximum of 10 years of operation. Auctions launched under the Innovation Fund in the autumn of 2023.
European Union
Innovation Fund
The innovation fund hydrogen focussed from Nov 2022. Acts through a competitive bidding process – max bid 4 Euro per kg* – and via waves of calls for proposals.
European Union
IPCEI
Important Project of Common European Interest (IPCEI) are live and provided in waves of grant funding. A requirement for projects must be for them to show they are financially viable without subsidies.
European Union
AFIR
AFIR passed March 2023, detailing one HRS to be deployed every 200km along Ten-T core.
European Union
Fitfor55
Fit for 55: 2.6% target for renewable fuels of non-biological origin (RFNBO) in transport by 2030
European Union
EU ETS
The EU Emission Trading Scheme is a “cap and trade” system that limits the amount of greenhouse gases which can be emitted within the EU.
European Union
EU MoUs
The EU has signed MoUs with Japan, Egypt, Mauritania (and others) around hydrogen including export/imports.
European Union
RED Low Carbon Hydrogen Standard
3.38 kg CO2-eq/kg hydrogen (28 gCO2e per MJ) (70% lower compared to emissions from fossil fuels). Two delegated acts under Renewable Energy Directive published by the Commision in Feb-23 – (i) principle of additionality, (ii) methodology for calculating GGG emissions. Rules to apply to imports.
United Kingdom
Net Zero Target
Net zero by 2050. 78% emission reduction by 2035. Mandated in law. Net Zero power system by 2030.
United Kingdom
UK Hydrogen Strategy
Production target of 10 GW by 2030, with at least 6 GW of this coming from electrolytic production.
United Kingdom
HPBM
Hydrogen Production Business Model – a CFD funding mechanism bridging the difference between producing low-carbon hydrogen gas and the price of natural gas. Funding provided through allocation rounds.
United Kingdom
LCHS
The UK Low Carbon Hydrogen Standard sets a carbon intensity threshold for hydrogen production of 20 gCO2e/MJ (2.4 kg CO2-eq/kg hydrogen). If the hydrogen produced meets this standard, it can be deemed low-carbon and is eligible for government subsidy.
United Kingdom
UK ETS
The UK’s own ETS scheme since leaving the EU.
United Kingdom
SAF Mandate
The UK has formed a SAF mandate stipulating set targets for percentage shares of SAF, and specific production pathways (such as PtL). Headline figure is that 10% of UK aviation fuel will be SAF by 2030.
United Kingdom
RTFO
The Renewable Transport Fuels Obligation
Germany
Net Zero Target
Net zero by 2045. Emissions shall move to net negative after 2050. Germany has set the preliminary targets of cutting emissions by at least 65 percent by 2030 compared to 1990 levels, and 88 percent by 2040 Mandated in law.
Germany
National Hydrogen Strategy
The German hydrogen national strategy was released in 2020 before being an update was released in 2023.
Germany
H2 Global
H2 Global – value €4 billion. Initial auction of 900mn euros launched in Dec 2022 for H2 derivatives. Government plans to make a further 3.5 billion euros available for new bidding rounds with durations up to 2036.
Germany
Carbon Tax
CO2 tax (introduced in 2023) for Avgas and Jet A-1.
Germany
Hydrogen Mobility Targets
Targets include fuel cell trucks, 20 HRS’s and passenger cars, fuel cell buses for public transportation, and the operation of the first inland ship operating on hydrogen by 2025.
Germany
National MOUs
Several MoUs signed surrounding imports of hydrogen and ammonia into the country – Mauritania MoU could equate to 8 million tonnes/year.
The Netherlands
Net Zero Target
Net zero by 2050. 55% CO2 reduction by 2030. In law.
The Netherlands
National Hydrogen Strategy
The Netherlands hydrogen strategy was released in 2020.
The Netherlands
National Climate Agreement
The national climate agreement contains set targets for fuel cell HDVs, passenger cars and hydrogen refuelling stations.
The Netherlands
Carbon Levy
In 2021, introduced carbon levy for industry – complementary to EU ETS – road mapped to 2030 currently.
The Netherlands
Guarantees of Origin Scheme
Green hydrogen Guarantees of Origin operational from Oct-22, following a Bill (May-22) and trial (summer-22).
The Netherlands
H2Global
300mn euro specific funding from H2Global, including funding for ammonia.
The Netherlands
National MoUs
In 2020, the US and the Netherlands signed a statement of intent to collaborate on hydrogen. The Minister of Energy of Chile and the State Secretary for Economic Affairs and Climate Policy signed a joint statement on collaboration in the field of green hydrogen import and export (July 2021). The UAE Ministry of Energy and Infrastructure and the Dutch Ministry for Foreign Trade and Development Cooperation have signed a Memorandum of Understanding on hydrogen energy. As part of their Joint Economic Committee, the UAE and the Netherlands have been in discussions to identify common interests and create a partnership for decarbonisation of the energy sector and increasing the use of clean hydrogen (March 2022).
Belgium
Net Zero Target
Net Zero by 2050, 55% emissions reductions target in place for 2030.
Belgium
National Hydrogen Strategy
Hydrogen strategy enacted firstly in 2021, with an update in 2022. Both strategies focussed on positioning Belgium as an import and transit location for low-carbon molecules into Europe. The country will remain dependent on energy imports in various forms to cover its domestic demand, estimating between 2 and 6 TWh of renewable hydrogen (or derivatives) in 2030 and between 100 and 165 TWh in 2050
Belgium
Energy Transition Fund
The Energy Transition Fund will fund until 2025, providing 20-30 million euros in support. The federal government has also earmarked 60 million euros (including 50 million euros from the national recovery and resilience plan) to invest and support projects to scale up innovative, low-carbon technologies.
Belgium
Hydrogen Act
The Hydrogen Act establishes a regulatory framework for the transport of hydrogen via pipelines. The act intends to foster the growth of the Belgian hydrogen market and the required hydrogen transport infrastructure.
Table 19: International Hydrogen Policy Log
Demand mapping methodology
Overview of Approach
The demand mapping analysis is carried out for five regions and six sectors for the years 2030 and 2045. The analysis only considers low-carbon hydrogen and derivate demand, and not hydrogen demand that does not meet sustainability criteria in the region. The regions covered are chosen based on the regional mapping carried out earlier in this project and include:
The EU
Germany
Belgium
The Netherlands
Scotland, England and Wales
The sectors covered are the ones in which hydrogen may play a role, with a focus on sectors where the role of derivatives and products could be greatest. These include:
Industry
Power Generation
Road Transport
Aviation (with a focus on power to liquid fuels)
International Maritime (with a focus on ammonia and methanol)
Heat
The analysis has taken a high-level approach to develop three scenarios (low, central and high) for each region and sector. In general, the approach taken for the EU and EU national geographies aligns due to similar overarching policy and data sources. While the approach for England and Wales often differs due to different policy and assumptions.
The EU and EU National Geographies (Germany, Belgium and The Netherlands) Sectoral Approach
Industry
The demand mapping for industry utilises data from Eurostat Simplified Energy Balances [171] which gives total demand for energy by industrial sector in the EU and the three EU nation states considered. The change in energy demand and suitability for hydrogen in each sector is based three scenarios developed in N-ZIP model produced for the Climate Change Committee (CCC) [172]. While this source does not give data based on EU suitability, it does give broad indications of sectoral suitability for hydrogen compared to alternatives and is therefore used to produce a low, central and high range of suitability.
An alternative approach has been used for sectors that currently use hydrogen (predominantly the chemicals sector and the refining sector). This is partially due to the EU’s target to ensuring 42% of hydrogen use meets RFNBO criteria in 2030 [54], however it is worth noting that refining is excluded from this target. The approach for the chemicals sector is to use a combination of current estimates of hydrogen demand [173], and calculating the proportion of low-carbon hydrogen that is required to meet the RFNBO target, while assuming the CCC’s reduction in energy demand for the sector by 2030.
While the 42% target does not apply to refineries, it is expected that refining will be an early user of low-carbon hydrogen due to current demand, experience in handling hydrogen and RFNBOs used in refining contributing to RFNBO targets in the transport sector. Hydrogen Europe estimate that there are 1.2 Mt/year of clean hydrogen projects announced in the refining sector by 2030, representing 26% of current hydrogen demand [174]. Furthermore, current hydrogen demand makes up approximately 40% of total energy demand in the sector. For this reason, estimates of total energy demand that is clean hydrogen in 2030 of 5, 10 and 15% have been selected for 2030. All scenarios assume refineries operate on clean hydrogen by 2045.
Industrial Sector
(*Different source / approach used for starred sectors)
Reduction in energy use 2022-2030
Proportion of total energy that is clean hydrogen in 2030
Reduction in energy use 2022-2045
Proportion of total energy that is clean hydrogen in 2045
Chemicals*
5-9%
8-9%
4-7%
24-29%
Construction
28-29%
0%
28%
71-80%
Food, beverages & tobacco
17-19%
0-7%
29-32%
15-25%
Iron and steel
0-6%
14-18%
29-36%
29-59%
Other industries
21-25%
0-4%
29-36%
18-37%
Mineral products
18-31%
3-7%
22-40%
25-28%
Non-ferrous metals
32-36%
0%
36-40%
26-28%
Oil and gas extraction
46-49%
4-10%
61-70%
47-50%
Paper, printing & publishing
21-26%
1-5%
44-49%
10-14%
Petroleum refineries*
20-22%
5-15%
29-35%
40%
Vehicles
27-30%
2-8%
29-35%
18-41%
Table 20: Trajectory of proportion of clean hydrogen used energy for the years 2030 and 2045
Industrial demand is broken down by product in 2030 based on applying RED III mandates to historic ammonia and methanol demand by region, developing scenarios based on historic high and low demand levels. Demand for 2045 is estimated, by assuming that all hydrogen demand for these products is low-carbon.
Power Generation
Hydrogen’s role in the power sector is uncertain and depends on policy incentives, infrastructure and technology readiness of turbines. This analysis assumes that total electricity generation in 2030 for the EU, Germany, Belgium and The Netherlands follows the estimates of generation in the MIX-CP scenario developed for European Green Deal Analysis [175]. This scenario was selected as it most closely aligns with policy measures that were agreed upon.
The analysis assumes that total electricity generation in 2045 follows the midpoint of the of the 2040 and 2050 values for the two scenario estimates in a recent European Commission report considering energy infrastructure configurations in Europe [176]. This estimate is used to develop a compound annual growth rate assumption of 4.2% for electricity generation in the EU between the 2030 estimate and 2045 assumption. This compound annual growth rate is applied to regional estimates in the MIX-CP scenario for Germany, Belgium and The Netherlands to estimate annual electricity generation in 2045.
It is broadly accepted that an electricity grid that is dominated by intermittent renewables will require low-carbon dispatchable generation to meet demand at times of low renewable generation. The CCC estimate that in the Balanced Pathway, 13% of electricity demand is met by low-carbon dispatchable power generation in 2045 [177]. However, the split between hydrogen and other options such as gas with CCUS or BECCS is unknown at this stage.
For the purposes of this analysis, the following proportions of electricity generation that are met with hydrogen are assumed. These include no hydrogen to power in 2030 due to the requirement for large scale hydrogen storage to be in place to operate hydrogen power at low load factors, which is its optimal role in the power system [178]. It is unlikely that there will be access to sufficient volumes of hydrogen storage in the 2030 timeframe due to the long lead times for large scale geological hydrogen storage [179]. Hydrogen power generation is assumed to have an efficiency of 48% [180].
Proportion of Total Power Demand that is met by Hydrogen
2030
2045
Low Scenario
0.0%
2.5%
Central Scenario
0.0%
5.0%
High Scenario
0.0%
7.5%
Table 21: Proportion of hydrogen in total power demand
Road Transport
The road transport analysis focuses on vans, buses and HGVs given that heavier vehicles are more suited to hydrogen and lighter vehicles are more suited to battery electric drivetrains. The low and the high scenario are based on the proportion of road transport energy consumption that is hydrogen in 2030 and 2045 in FES 2024 in the highest and lowest hydrogen deployment scenarios. The central scenario is estimated as the midpoint between these upper and lower bounds. The estimated demand for transport by these vehicle segments in 2030 is taken from the MIX-CP Scenario [175], for the EU, Germany, Belgium and The Netherlands.
Scenario
Proportion H2 2030
Reduction in Energy Demand 2030 – 2045
Proportion H2 2045
Low
0.4%
-66%
7.7%
Central
0.5%
-66%
17.7%
High
0.6%
-66%
27.8%
Table 22: Hydrogen Proportions of Energy Demand for Bus and Coach Transport
Scenario
Proportion H2 2030
Reduction in Energy Demand 2030 – 2045
Proportion H2 2045
Low
0.1%
-58%
0.7%
Central
0.1%
-53%
17.3%
High
0.2%
-49%
34.0%
Table 23: Hydrogen Proportions of Energy Demand for Heavy Goods and Light Commercial Vehicles
Aviation
The analysis on aviation focuses on e-fuels which are based on hydrogen combined with captured carbon. The analysis utilises estimates of future aviation fuel demand for the EU and the PtL sub mandate to estimate e-fuel demand in 2030 and 2045, based on a report from the European Union Aviation Safety Agency [181]. The value for total fuel demand in 2045 is estimated by taking the midpoint of the 2040 and 2050 values. This is used to estimate the central demand estimate.
EU Aviation
2030
2040
2045
2050
SAF Mandate (%)
5%
32%
38%
63%
PtL Sub-Mandate (%)
0.70%
8%
11%
28%
Total Fuel Demand (Mt)
46
46
45
44
SAF Supply (Mt)
2.3
14.8
27.7
PtL Supply (Mt)
0.3
3.7
5.0
12.3
Table 24: Projections for supply of SAF
The energy content of these e-fuels is then estimated using the value of 43 MJ/kg [182] to develop estimates in TWh. Both low and high scenarios assume the same mandate for PtL, but varying levels of fuel demand based on the EASA’s low and high aviation scenarios [181].
2030
2045
Low Scenario Multiplier on Base Case
90%
84%
High Scenario Multiplier on Base Case
115%
124%
Table 25: Multipliers on base case, by scenario
The national estimates for Germany, Belgium and The Netherlands are estimated based on national airport traffic data in 2023 [183]. This assumes that the current mix of air traffic data remains constant over time.
International Maritime
The analysis focuses on international maritime due to its greater suitability for hydrogen, derivatives and products than domestic maritime. This is due to the longer distances travelled in larger ships for international maritime which is less suitable for electrification. The decarbonisation route for ships is uncertain and could be met with biofuels or synthetic fuels. Transport & Environment (T&E) have estimated different routes to decarbonisation that comply with the EU’s FuelEU policy [184]. Note that the analysis carried out for T&E was designed for containerships and different shipping segments may select different decarbonisation routes. However, the authors of the report deemed it to be a good enough proxy to provide a high-level estimate of the entire international shipping sector.
These T&E scenarios are used to estimate the upper and lower bounds of e-fuel deployment in 2030 and 2045. The central scenario is derived as the midpoint of these bounds. The EU’s policy ensures that there is a minimum of 2% RFBNOs from 2034 onwards.
Proportion of International Shipping Demand that is e-fuels
2030
2045
Proportion e-ammonia high (%)
1%
42%
Proportion e-methanol high (%)
4%
4%
Proportion e-ammonia central (%)
0%
21%
Proportion e-methanol central (%)
2%
2%
Proportion e-ammonia low (%)
0%
2%
Proportion e-methanol low (%)
0%
0%
Table 26: Proportion of international shipping demand that is e-fuels
These fuel proportions are applied to the estimated energy demand for international shipping. This is calculated using the CP-MIX scenario as this complies with the fit-for-55 regulation and most closely follows the current policy structure of the energy scenarios produced by the EU Commission [175]. As this scenario only produces estimates to 2030, the growth rate for international shipping energy demand for each region between 2025 and 2030 is applied to the period 2030 to 2045 to estimate international shipping energy demand in 2045. This is deemed appropriate as applying this carbon reduction trajectory from 2025-2030 to the emissions metric results in gross emissions of approximately 14% for the EU in 2050, which should be compatible with achieving net zero provided sufficient greenhouse gas removals are in place.
Heat
The demand for hydrogen in residential heating is highly uncertain and could be significant, or non-existent in 2045. For this reason, and a lack of policy certainty, high level assumptions have been made for hydrogen deployment for heat. It is likely that due to the high efficiency of heat pumps, hydrogen heat would, at most, play a supplementary role in the heating mix. As with other sectors, the residential energy demand is estimated using the MIX-CP scenario and applying the 2025-2030 (negative) growth rate forward to 2045.
Proportion of Residential Energy Demand that is Heat
2030
2045
Low
0.0%
0.0%
Central
0.0%
10.0%
High
0.0%
20.0%
Table 27: Proportion of residential energy demand that is heat
Approach for England and Wales
Industry, Power Generation, Road Transport and Heat
The approach for the industrial, power generation, road transport and heating sectors for England and Wales utilises Future Energy Scenarios (FES) 2024 [185]. This contains three net zero compliant pathways for a decarbonised Great British energy system. In general, Electric Engagement is used for the low scenario, Holistic Transition forms the central scenario and Hydrogen Evolution is used to estimate the high scenario. However, the approach for the power generation sector is different, and the pathway mapping to our scenarios is inverted for Electric Engagement and Holistic Transition to provide consistent results.
The CCC’s Sixth Carbon Budget [177] is used to estimate the proportion of hydrogen demand that occurs in England and Wales for each sector as the FES results estimate demand for Great Britain as a whole. This process is carried out for both 2030 and 2045 periods for the low, central and high scenarios.
Hydrogen Regional Demand Split
Units
2030
2045
Industry England & Wales % of GB
%
88%
89%
Electricity supply England & Wales % of GB
%
97%
94%
Surface transport England & Wales % of GB
%
94%
92%
Non-residential buildings England & Wales % of GB
%
87%
87%
Residential buildings England & Wales % of GB
%
93%
93%
Table 28: Hydrogen regional demand split between England and Wales
The only sector that does not map directly between the Sixth Carbon Budget and FES 2024 is surface transport which includes rail in the Sixth Carbon Budget. The regional split for surface transport is assumed to apply to road transport for this analysis.
To estimate the hydrogen demand reduction from the announcement of the closure of Grangemouth refinery, in September 2024, Gemserv interpreted data and forecasts in NESO’s Future Energy Scenario’s databook [194]. The total demand provided by Grangemouth in each forecast were extracted and multiplied by an assumption on what proportion of this demand was forecasted as being served by hydrogen. This proportion was assumed to follow the forecasted mix between fuels of oil, hydrogen and gas for total Industry and Commercial sector.
The UK has announced its intentions for a SAF mandate which increases the proportion of SAF in the aviation fuel mix, this policy also includes a PtL sub mandate [186]. For this obligation to be met, PtL derived fuels must meet 0.5% of aviation fuel consumption in 2030, rising to 3.5% by 2040. The PtL sub mandate increases by 0.4% points for the five years between 2036 and 2040 [187]. For the purposes of this analysis, it is assumed that this trajectory continues and the PtL sub mandate increases to 5.5% by 2045.
Total aviation demand for the UK in the years 2030 and 2045 is based on the CCC’s Sixth Carbon Budget, utilising the Widespread Innovation and Tailwinds scenarios as these are the highest and lowest demand scenarios for aviation fuel. The central scenario is estimated as the midpoint between these. To estimate SAF demand in England and Wales, the regional split from the Balanced Pathway annual SAF demand is applied. England and Wales are estimated to be responsible for 94% and 93% of UK demand respectively for the years 2030 and 2045.
International Maritime
The UK generally does not report on energy consumption in the international maritime sector; however, T&E have developed analysis that estimates over 7 million tonnes of fossil marine fuel oils are used in the total maritime sector [184]. For the purposes of this analysis this is assumed to be exactly 7 million tonnes. The energy content of this fuel is estimated using EU Commission assumption of 40.5 MJ/kg for Marine Gas Oil (MGO) [188]. It is assumed that international maritime makes up 80% of fuel consumption based on the emissions estimates produced by T&E. Major port freight activity is used to estimate the proportion that occurs in England and Wales, estimated to be 81% of the UK total [189]. The proportional change in total energy demand for shipping is assumed to be the same for England and Wales and the assumptions made for the EU as a whole.
Once estimates of fuel demand in 2030 and 2045 are estimated, the proportion of this that is met with hydrogen derivates is applied to estimate derivative demand in the two time periods. The analysis assumes that the UK achieves less in terms of e-fuel deployment than the EU by 2030 due to its less ambitious policy in the sector. However, the UK Government has recognised a requirement to have at least 1% low-carbon shipping fuels by 2030. The analysis assumes that this is entirely met by e-fuels for the high scenario, half met by e-fuels for the central scenario and entirely met by other options such as biofuels for the low scenario. Due to the low technology readiness of ammonia as a shipping fuel, it is assumed that the 2030 demand is met with e-methanol. This is also in line with DNV data on fuel choices for ships on order, where 8% are methanol powered on gross tonnage basis [190]. For 2045 the assumptions for England and Wales follow that of the rest of the EU reflecting the international nature of shipping refuelling requirements.
Additional Tables and Graphs for Projected Demand
Figure 17: Mix of different sectors and derivatives in all three scenarios for the years 2030 and 2045
Note: Industrial demand figure is an aggregate of hydrogen, ammonia and methanol demand, with road transport figure showing 100% hydrogen demand. Heat notes domestic heating demand only.
Figure 18: Demand scenarios for the EU for all three scenarios
Figure 19: Hydrogen demand scenarios for 2030 for all the regions
Figure 20: Hydrogen demand scenarios for 2045 for all the regions
High Hydrogen Demand Scenario (TWh)
EU
Germany
Belgium
Netherlands
England and Wales
2030
2045
2030
2045
2030
2045
2030
2045
2030
2045
Industry: Hydrogen
153.6
525.4
37.2
132.2
5.5
18.9
7.5
28.0
14.1
50.6
Industry: e-Ammonia
48.9
116.4
9.1
21.7
4.2
10.1
6.7
15.8
3.0
7.2
Industry: e-Methanol
4.6
11.0
2.9
6.8
0.0
0.0
0.4
0.9
0.0
0.0
Power: Hydrogen
0.0
441.2
0.0
86.4
0.0
13.3
0.0
23.2
3.6
73.1
Road: Hydrogen
0.8
129.0
0.3
21.0
0.1
6.5
0.1
3.9
1.3
35.7
Aviation: e-fuels
4.4
73.4
0.6
10.4
0.1
1.9
0.2
3.3
0.7
6.8
Maritime: Ammonia
3.5
209.2
0.2
13.9
0.6
30.8
1.0
59.5
0.3
20.8
Maritime: Methanol
20.8
18.5
1.2
1.2
3.5
2.7
5.8
5.2
0.3
1.8
Heat: Hydrogen
0.0
327.9
0.0
67.0
0.0
9.8
0.0
13.3
0.5
70.5
Total
236.6
1851.9
51.6
360.7
14.0
93.9
21.5
153.1
23.8
266.5
Central Hydrogen Demand Scenario (TWh)
EU
Germany
Belgium
Netherlands
England and Wales
2030
2045
2030
2045
2030
2045
2030
2045
2030
2045
Industry: Hydrogen
129.0
484.6
32.2
122.9
5.1
18.0
7.0
26.0
10.0
31.7
Industry: Ammonia
40.3
96.0
7.5
17.9
3.5
8.3
5.5
13.1
2.5
5.9
Industry: Methanol
4.3
10.3
2.7
6.4
0.0
0.0
0.4
0.9
0.0
0.0
Power: Hydrogen
0.0
294.1
0.0
57.6
0.0
8.8
0.0
15.5
0.9
29.7
Road: Hydrogen
0.6
62.1
0.2
10.1
0.1
3.1
0.0
1.8
1.2
18.9
Aviation: e-fuels
3.8
59.3
0.5
8.4
0.1
1.6
0.2
2.6
0.6
5.4
Maritime: Ammonia
1.7
109.6
0.1
7.3
0.3
16.1
0.5
31.1
0.1
10.9
Maritime: Methanol
10.4
9.2
0.6
0.6
1.8
1.4
2.9
2.6
0.1
0.9
Heat: Hydrogen
0.0
163.9
0.0
33.5
0.0
4.9
0.0
6.6
0.5
13.1
Total
190.2
1289.2
43.9
264.6
10.8
62.2
16.4
100.3
15.9
116.6
Low Hydrogen Demand Scenario (TWh)
EU
Germany
Belgium
Netherlands
England and Wales
2030
2045
2030
2045
2030
2045
2030
2045
2030
2045
Industry: Hydrogen
68.8
436.8
19.0
106.8
3.3
16.6
4.5
26.1
1.6
7.5
Industry: Ammonia
31.8
75.7
5.9
14.1
2.8
6.6
4.3
10.3
2.0
4.7
Industry: Methanol
4.0
9.6
2.5
5.9
0.0
0.0
0.3
0.8
0.0
0.0
Power: Hydrogen
0.0
147.1
0.0
28.8
0.0
4.4
0.0
7.7
0.0
9.4
Road: Hydrogen
0.4
4.7
0.1
0.7
0.0
0.2
0.0
0.1
1.0
2.1
Aviation: e-fuels
3.5
49.6
0.5
7.0
0.1
1.3
0.2
2.2
0.6
4.1
Maritime: Ammonia
0.0
9.9
0.0
0.7
0.0
1.5
0.0
1.5
0.0
1.0
Maritime: Methanol
0.0
0.0
0.0
0.0
0.0
0.0
0.0
0.0
0.0
0.0
Heat: Hydrogen
0.0
0.0
0.0
0.0
0.0
0.0
0.0
0.0
0.0
0.0
Total
108.5
733.4
28.0
164.0
6.1
30.6
9.4
48.7
5.2
28.7
Summary: Hydrogen Delivery Method
H2 pipeline
Liquid H2
Ammonia
LOHC
Metal hydride
Method of usage
High volume gaseous hydrogen delivery.
High volume liquified hydrogen delivery, reconverted back to gaseous form upon delivery.
NH3 delivery, used directly (as a fuel; for chemicals production), or reconverted back to hydrogen.
Reconverted back to hydrogen upon delivery.
Reconverted back to hydrogen upon delivery.
Advantages
High efficiency.
Low cost over long duration
Continuous supply ability.
High volumetric energy density.
Increased efficiency compared to gaseous hydrogen transportation.
Flexibility in transport destination.
High volumetric energy density
Established market.
High efficiency over long distances.
Ambient conditions.
Heat recovery during hydrogenation reaction.
Ambient conditions.
Ambient conditions
No leakage.
Enhanced safety
Disadvantages
High investment cost.
Low flexibility.
Very low temperatures required, leading to high costs.
Reconversion to gaseous hydrogen is also energy intensive.
High boil-off rate reduces efficiency.
High energy requirement of conversion and reconversion.
Safety concerns around the handling of ammonia.
Purification and dehydrogenation are energy intensive.
The LOHC must be returned in a dehydrogenated state to be reused, adding to transportation costs.
High temperatures required for dehydrogenation.
Storage tanks are heavy due to a low mass-specific storage density.
Summary: Industrial Feedstock
Ammonia
Methanol
Refining
Green Steel
Method of usage
H2 required for NH3 production. End uses involve fertiliser, plastic or synthetic fibre production.
H2 required for synthetic and conventional methanol production. The methanol is then used within chemicals production for polymers and hydrocarbons.
H2 is needed for hydrocracking and hydrotreating within oil refining, both crucial steps within the refinery process. End uses include fossil fuels and biofuels.
Hydrogen can be used to produce steel, acting as a reducing agent for iron ore, via the hydrogen-based direct reduced iron (DRI) method. End uses include current uses for steel.
Advantages
Mature market.
Well-established technology.
Currently transported in large volumes.
Existing infrastructure available.
Increases efficiency when NH3 is used for chemicals production compared to reconversion back to hydrogen.
Mature market.
High demand for low-carbon methanol, and bio-methanol production alone will be unlikely to fulfil demand.
Large current market via fossil fuel production.
Growing market of biofuels will require hydrogen for refining.
Existing infrastructure available.
A method of reducing emission from the carbon-intensive steel industry.
Mature market with high demand.
Disadvantages
No current ammonia production facilities in Scotland.
The use of low-carbon hydrogen can increase costs.
Infrastructure development required.
The use of low-carbon hydrogen can increase costs. Bio-based methanol likely to be more cost competitive than synthetic methanol.
Scottish methanol production capabilities currently are lacking, although there are plans for a renewable methanol plant underway.
Fossil fuel refining demand expected to decline.
The use of low-carbon hydrogen can increase costs.
New infrastructure required.
Production route is higher cost than current steel production.
No current steel production facilities in Scotland.
Summary: High-Temperature Heat
Hydrogen
CCUS-enabled Gas
Bio-based Products
Method of usage
Existing heat equipment can be retrofit to use hydrogen, supplying direct and indirect heat up to 1000°C.
Current industrial heat equipment is fitted with carbon capture technology, and the carbon is stored to reduce emitted emissions.
Biofuels such as biomass or biomethane can be used for high temperature heat, usually up to temperatures of 200°C although higher temperatures could be used, depending on the biomass form.
Advantages
Current gas systems can be retrofit for hydrogen use.
High energy density of hydrogen.
Very high temperatures reached.
Can be low or zero carbon depending on the hydrogen production route.
Current gas systems and feedstocks can be used.
Scotland is geographically favoured for CCUS storage facilities.
Widely available, scalable and can be cost-competitive.
Can be stored under ambient conditions.
Scottish production abilities are promising.
Disadvantages
Retrofitting can be complicated due to the difference in combustion properties between H2 and natural gas.
The cost of low-carbon hydrogen is much larger than current sources of high temperature heat fuels.
Storage requirements of high pressures or low temperatures due to low volumetric density.
Technology not fully mature.
Cost of CCUS integration can be high due to high investment costs.
Cannot capture 100% of carbon emissions.
Feedstocks are limited, slowing further adoption.
Summary: Transport
Hydrogen (fuel cell)
SAF
Methanol (maritime)
Ammonia (maritime)
Method of usage
Hydrogen can be used in a fuel cell vehicle, for example in road and rail transport. Heavy good vehicles have been shown to suit fuel cells economically, but lighter vehicles show some uncertainty.
SAFs are a type of liquid biofuel for aviation, produced via feedstocks of synthetically via a process that captures carbon from the air. They are equivalent to Jet A1 aviation fuel and are compatible with modern aircraft.
H2 required for synthetic and conventional methanol production. This methanol can then be used directly as a fuel for maritime application.
H2 required for NH3 production. This ammonia can then be used directly as a fuel for maritime application.
Advantages
Zero emissions
Hydrogen refuelling is similar to current petrol refuelling.
Faster refuelling times and longer ranges than battery counterparts.
Fuel cell buses have been used in Scotland since 2015.
Easily integrated into current operations.
Little alternatives for aviation decarbonisation currently, leading to growing market.
Can reduce carbon emissions by over 80% compared to jet fuel.
Not many alternatives other than ammonia for longer distance maritime travel, leading to a growing market.
Existing infrastructure can be retrofit to run on methanol.
Not many alternatives other than methanol for longer distance maritime travel, leading to a growing market.
Lower cost of ammonia production, compared to synthetic methanol.
Existing infrastructure can be retrofit to run on ammonia.
Disadvantages
High costs of operation due to the high cost of low-carbon hydrogen and expensive equipment required.
When produced from feedstock, can compete with other uses of the feedstock e.g. crops and water supplies.
Not fully mature market.
Higher cost than conventional jet fuels.
Release carbon when burned.
High cost of synthetic methanol.
Relatively high transport and storage cost, due to cooling and compliance.
Efficiency losses due to extensive energy transfer chain.
Summary: Power Generation
Hydrogen
CCUS-enabled Gas
Biomass
Ammonia
Method of usage
Hydrogen can be used in turbines to meet electricity demand when electricity generation via renewable is not sufficient.
Natural gas turbines, coupled with CCUS, is a method of providing energy using existing infrastructure and fuel feedstock, while reducing carbon emissions.
Biomass can be used in turbines to meet electricity demand when electricity generation via renewable is not sufficient.
Ammonia can be used in turbines to meet electricity demand when electricity generation via renewable is not sufficient.
Advantages
Suitable for low-load factors.
Hydrogen/gas blends possible.
Retrofit of gas infrastructure available.
Retrofitting extends the life of the power plant, reducing capital costs.
Suitable for high-load factors.
Plans for a CCUS-coupled power plant in Scotland.
Widely supplied and highly mature technology.
Suitable for high-load factors.
Ammonia production is a mature technology.
Disadvantages
High operating costs.
Retrofit to 100% hydrogen requires more significant modifications due to differences in volumetric density.
Limited experience with hydrogen power generation in Scotland.
CO2 leakage from underground storage is a concern.
Can depend on feedstocks which could be required for other purposes, e.g. food and water.
Relatively high cost of power generation.
Least mature power generation technology.
Low efficiency and incompatibility with larger gas-turbines.
High toxicity.
Stakeholder Engagement Approach
We interviewed stakeholders for one hour, following a semi-structured format. Interviews began by presenting the scope of the project and gathering high level thoughts on the storage technologies considered as well as identifying any potential gaps in scope. Questions were structured around the seven evaluation criteria in the scope of the project. The topics focused on in interviews are shown with the list of stakeholders below.
List of stakeholders
Enquest
Net Zero Technology Centre
Centrica
Hydrogen Europe
Air Products
DNV
Johnson Matthey
INEOS
Scottish Futures Trust
Broad topics
Which hydrogen derivates are likely to dominate the market?
Which industries/ sectors are likely to be the main offtakers for HDPs?
Which countries or regions would you consider main import/ demand hubs?
What are some of the policy gaps and bottlenecks for hydrogen projects?
What are the most likely end users for hydrogen products?
Key findings
Most stakeholders suggest ammonia to dominate the European market. Some stakeholders also mentioned SAF (in addition to ammonia), green methanol and green diesels.
There are several concerns about policy gaps and bottleneck too. Concerns include but are not limited to: concerns about subsidising export, absence of trade policies with other EU nations, lack of uniform approach to global carbon pricing, planning and permitting issues causing complexity.
Stakeholders also mentioned some security concerns associated with ammonia like toxicity and difficulty in detecting leaks.
Stakeholders expect Southern and Northern Europe to be the new major hubs for hydrogen demand.
The most likely end-use sectors for hydrogen are fertilisers, shipping and aviation.
Finally, the stakeholders also identified some Scotland specific challenges. Scotland will have to compete with both nearby regions like the EU and faraway regions like the middle east, north America and even Australia.
Table of units
Abbreviation
Unit
Quantity
MJ/kg
Megajoules per kilogram
Energy content per unit of mass
MJ/m3
Megajoules per cubic meter
Energy content per unit volume
MW
Megawatt
Power output
GW
Gigawatt
Power output
MWh
Megawatt hour
Energy
TWh
Terawatt hour
Energy
Wh/kg
Watt-hours per kg
Energy stored in one kg
Wh/l
Watt-hour per litre
Energy stored in one litre
gCO2e
Grams of carbon dioxide equivalent
Amount of GHG equivalent to CO2 emitted (in grams)
kgCO2e
Kilograms of carbon dioxide equivalent
Amount of GHG equivalent to CO2 emitted (in kilograms)
gCO2e/MJ
Grams of carbon dioxide equivalent per megajoule
Carbon intensity
References
[1]
Scottish Government, “Draft Energy Strategy and Just Transition Plan,” 10 January 2023. [Online]. Available: https://www.gov.scot/publications/draft-energy-strategy-transition-plan/.
NZTC, “Enabling Green Hydrogen Exports: Matching Scottish Production to German Demand,” 2023. [Online]. Available: https://www.netzerotc.com/reports/enabling-green-hydrogen-exports-matching-scottish-production-to-german-demand-2/.
[5]
European Commission, “eur-lex.europa.eu,” 2022. [Online]. Available: https://eur-lex.europa.eu/legal-content/EN/TXT/HTML/?uri=CELEX:52022DC0230.
[6]
F. Kerle, M. Herborn, S. Prickett, O. Arup and P. Ltd, “climatexchange.org.uk,” 2023. [Online]. Available: https://www.climatexchange.org.uk/wp-content/uploads/2024/01/CXC-Cost-reduction-pathways-of-green-hydrogen-production-in-Scotland-%E2%80%93-total-costs-and-international-comparisons-Jan-2024.pdf.
[7]
Hydrogen UK, “Recommendations for the Acceleration of Hydrogen Networks,” 2023.
[8]
European Hydrogen Observatory, “Hydrogen Demand,” 2023. [Online]. Available: https://observatory.clean-hydrogen.europa.eu/hydrogen-landscape/end-use/hydrogen-demand.
[9]
IEA, “Renewables 2023,” January 2024. [Online]. Available: https://www.iea.org/reports/renewables-2023.
[10]
Hy4Heat, “Conversion of Industrial Heating,” Department for Buisness, Energy & Industrial stratgey , 2019.
[11]
IEA, “The Future of Hydrogen,” IEA, 2019.
[12]
E. B. F. B. Marco Scomazzon, “Alternative sustainable routes to methanol production: Techno-economic and environmental assessment,” Journal of Environmental Chemical Engineering, 2024.
IEA, “Net Zero Roadmap: A Global Pathway to Keep the 1.5 °C Goal in Reach,” September 2023. [Online]. Available: https://www.iea.org/reports/net-zero-roadmap-a-global-pathway-to-keep-the-15-0c-goal-in-reach.
[15]
G. P. T. &. A. K. Stark, “To decarbonize industry, we must decarbonize heat,” Joule, 2021.
[16]
Yanfei Li and F. Taghizadeh-Hesary;, “The economic feasibility of green hydrogen and fuel cell electric vehicles for road transport in China,” Elsevier, 2022.
[17]
T. C. C. D. Ainalis D, “Technoeconomic comparison of an electric road system and hydrogen for decarbonising the UK’s long-haul road freight,” 2023. [Online]. Available: https://www.sciencedirect.com/science/article/pii/S2210539522001353.
[18]
L. H. D. V. W. Z. Rout C, “A comparative total cost of ownership analysis of heavy duty on-road and off-road vehicles powered by hydrogen, electricity, and diesel,” 2022. [Online]. Available: https://www.ncbi.nlm.nih.gov/pmc/articles/PMC9803793/.
[19]
A. S. Marta Yugo, “A look into the role of e-fuels in the transport system in europe (2030-2050),” Concawe Reviwe, 2019.
B. A. H.-R. R. Kistner L, “Potentials and limitations of battery-electric container ship propulsion systems,” 2024. [Online]. Available: https://www.sciencedirect.com/science/article/pii/S2590174523001630.
[22]
A. Bajic, “Linde to supply liquid hydrogen for Norled’s ferry,” Offshore Energy, 8 March 2021.
[23]
CCC, “Delivering a reliable decarbonised power system,” March 2023. [Online]. Available: https://www.theccc.org.uk/publication/delivering-a-reliable-decarbonised-power-system/.
[24]
BEIS, “Capacity Market 2023: strengthening security of supply and alignment with net zero – Consultation Description,” 9 January 2023. [Online]. Available: https://www.gov.uk/government/consultations/capacity-market-consultation-strengthening-security-of-supply-and-alignment-with-net-zero.
[25]
International Energy Agency, “Global Hydrogen Review 2022,” 2022. [Online]. Available: https://www.iea.org/reports/global-hydrogen-review-2022.
[26]
IEA, “Global Hydrogen Review 2022,” 2022.
[27]
DESNZ, “Joint Declaration of Intent on establishing a United Kingdom – Germany hydrogen partnership,” Gov.uk, 2023.
The CCC, “Delivering a reliable decarbonised power system,” 9 March 2023. [Online]. Available: https://www.theccc.org.uk/publication/delivering-a-reliable-decarbonised-power-system/.
[30]
Gas for Climate, “Facilitating hydrogen imports from non-EU countries,” 2022. [Online]. Available: https://gasforclimate2050.eu/wp-content/uploads/2022/10/2022_Facilitating_hydrogen_imports_from_non-EU_countries.pdf.
[31]
Port of Rotterdam, “Rotterdam to supply Europe with 4.6 megatons of hydrogen by 2030,” mAY 2022. [Online]. Available: https://www.portofrotterdam.com/sites/default/files/2022-05/Rotterdam%204.6%20Mton%20hydrogen%20in%202030%20proposition.pdf.
[32]
Port of Rotterdam, “Import of hydrogen,” 2024. [Online]. Available: https://www.portofrotterdam.com/en/port-future/energy-transition/ongoing-projects/hydrogen-rotterdam/import-of-hydrogen.
[33]
WITS, “Hydrogen Imports by Country 2023,” 19 July 2024. [Online]. Available: https://wits.worldbank.org/trade/comtrade/en/country/ALL/year/2023/tradeflow/Imports/partner/WLD/product/280410.
[34]
DBT, “Hydrogen,” 19 July 2024. [Online]. Available: https://www.great.gov.uk/international/content/investment/sectors/hydrogen/.
[35]
DESNZ, “Renewable Energy Planning Database January 2023,” January 31 2023. [Online]. Available: https://www.gov.uk/government/publications/renewable-energy-planning-database-monthly-extract.
[36]
EHO, “Beglium,” 19 July 2024. [Online]. Available: https://observatory.clean-hydrogen.europa.eu/index.php/node/2169.
[37]
B. Schroot, “The Netherlands: a Blue Hydrogen economy now will ease a transition to Green,” Energypost.eu, 26 April 2021.
DESNZ, “Hydrogen projects: planning barriers and solutions,” December 2023. [Online]. Available: https://www.gov.uk/government/publications/hydrogen-projects-planning-barriers-and-solutions.
[41]
European Commission, “2050 long-term strategy,” 2020. [Online]. Available: https://climate.ec.europa.eu/eu-action/climate-strategies-targets/2050-long-term-strategy_en.
[42]
European Commission, “Hydrogen,” 2020. [Online]. Available: https://energy.ec.europa.eu/topics/energy-systems-integration/hydrogen_en.
[43]
RePowerEU, “COMMUNICATION FROM THE COMMISSION TO THE EUROPEAN PARLIAMENT, THE EUROPEAN COUNCIL, THE COUNCIL, THE EUROPEAN ECONOMIC AND SOCIAL COMMITTEE AND THE COMMITTEE OF THE REGIONS,” European Comission , Brussels, 2022.
German Federal Government, “National Hydrogen Strategy Update,” Federal Ministry for Economic Affairs and Climate Action, 2023.
[48]
The British Geological Survey, “Written Evidence Submitted by The British Geological Survey (BGS),” January 2021. [Online]. Available: https://committees.parliament.uk/writtenevidence/19568/html/.
[49]
Belgium Federal Government, “Belgium’s Roadmap for the Net-Zero Government Initiative,” 2021. [Online]. Available: https://www.sustainability.gov/pdfs/belgium-nzgi-roadmap.pdf.
[50]
Westwood Global Energy Group, “The Netherlands vs Belgium: Who will win the battle as Northwest Europe’s leading hydrogen import hub?,” 16 November 2023. [Online]. Available: https://www.westwoodenergy.com/news/westwood-insight/westwood-insight-the-netherlands-vs-belgium-who-will-win-the-battle-as-northwest-europes-leading-hydrogen-import-hub.
[51]
Government.nl, “Government Strategy on Hydrogen,” Government of the Netherlands , 2020.
[52]
FGov.Be, “Vision and Strategy Hydrogen Update,” belgium gov, 2022.
[53]
International Energy Agency, “Towards hydrogen definitions based on their emissions intensity,” April 2023. [Online]. Available: https://www.iea.org/reports/towards-hydrogen-definitions-based-on-their-emissions-intensity.
[54]
European Commission, “Renewable Energy Directive,” 2023. [Online]. Available: https://eur-lex.europa.eu/legal-content/EN/TXT/?uri=CELEX:32023L2413.
[55]
E. Commission, “The role of hydrogen in energy decarbonisation scenarios,” 2022.
[56]
E. H. Backbone, “Analysing Future Demand, Supply and Transport of Hydrogen,” 2021.
[57]
DESNZ, “Hydrogen Projects: planning barriers and solutions: research findings,” 2023. [Online]. Available: https://assets.publishing.service.gov.uk/media/657a2a92095987000d95e086/hydrogen-projects-planning-barriers-and-solutions-report.pdf.
Q. V. Dinh, P. H. Pereira, V. Nguyen, A. J. Nagle and P. G. Leahy, “Levelised cost of transmission comparison for green hydrogen and ammonia in new-build offshore energy infrastructure: Pipelines, tankers, and HVDC,” International Journal of Hydrogen Energy, vol. 62, pp. 684-698, 2024.
[60]
Arup, “The potential for exporting hydrogen,” May 2024. [Online]. Available: https://www.arup.com/insights/the-potential-for-exporting-hydrogen-from-the-uk-to-continental-europe/.
[61]
M. Iliffe and K. Gilmore, “Can green hydrogen produced in the UK be competitive in the emerging global market?,” 6 July 2023. [Online]. Available: https://www.baringa.com/en/insights/low-carbon-futures/can-green-hydrogen-produced-be-competitive/.
[62]
C. Chu, K. Wu, B. Luo, Q. Cao and H. Zhang, “Hydrogen storage by liquid organic hydrogen carriers: Catalyst, renewable carrier, and technology – A review,” Carbon Resources Conversion, vol. 6, no. 4, pp. Pages 334-351, 2023.
[63]
M. Aziz, “Liquid Hydrogen: A Review on Liquefaction, Storage, Transportation, and Safety,” Institute of Industrial Science, The University of Tokyo, 2021.
[64]
DESNZ, “Digest of UK Energy Statistics (DUKES): electricity,” 2024. [Online]. Available: https://www.gov.uk/government/statistics/electricity-chapter-5-digest-of-united-kingdom-energy-statistics-dukes.
[65]
A. Patonia, V. Lenivova, R. Poud and C. Nolden, “Hydrogen pipelines vs. HVDC lines: Should we transfer green molecules or electrons?,” Oxford Institute for Energy Studies, Oxford, 2023.
[66]
National Gas, “FutureGrid,” 2024. [Online]. Available: https://www.nationalgas.com/future-energy/futuregrid.
[67]
Scottish Government, “Scotland’s electricity and gas networks: vision to 2030,” 12 March 2019. [Online]. Available: https://www.gov.scot/publications/vision-scotlands-electricity-gas-networks-2030/pages/4/.
U. Schmidtchen, “FUELS – SAFETY | Hydrogen: Overview,” in Encyclopedia of Electrochemical Power Sources, Elsevier, 2009, pp. 519-527.
[70]
J. Incer-Valverde, J. Mörsdorf, T. Morosuk and G. Tsatsaronis, “Power-to-liquid hydrogen: Exergy-based evaluation of a large-scale system,” International Journal of Hydrogen Energy, vol. 48, no. 31, pp. 11612-11627, 2023.
[71]
Scottish Government, “Offshore wind to green hydrogen: opportunity assessment,” 21 December 2020. [Online]. Available: https://www.gov.scot/publications/scottish-offshore-wind-green-hydrogen-opportunity-assessment/.
[72]
M. El-Shafie, S. Kambara, S. P. Katikaneni, S. N. Paglieri and K. Lee, “Techno-economic study and process simulation for a small-scale hydrogen production plant based on ammonia decomposition,” International Journal of Hydrogen Energy, vol. 65, pp. 126-141, 2024.
E4Tech, “Expansion of hydrogen production pathways analysis – import chains,” April 2022. [Online]. Available: https://assets.publishing.service.gov.uk/media/62d6f00bd3bf7f2863092502/expansion-hydrogen-production-pathways-analysis-import-chains.pdf.
[77]
S. Csernik-Tihn, J. Mitchell and K. Edlmann, “www.climatexchange.org.uk,” 08 2023. [Online]. Available: https://www.climatexchange.org.uk/wp-content/uploads/2023/08/CXC-Hydrogen-as-storage-medium-August-2023_.pdf.
[78]
R. e. a. Bañares-Alcántara, “Analysis of islanded ammonia-based energy storage systems,” University of Oxford, Oxford , 2015.
[79]
M. Capdevila-Cortada, “Electrifying the Haber–Bosch,” Nature Catalysis, vol. 2, p. 1055, 2019.
[80]
Aurora Energy Research, “Renewable Hydrogen Imports could compete with EU production by 2030,” 25 January 2023. [Online]. Available: https://auroraer.com/media/renewable-hydrogen-imports-could-compete-with-eu-production-by-2030/.
[81]
McKinsey & Company, “Decarbonization challenge for steel,” 2020.
[82]
P. R. Narayanan, “Methanol from CO2: a technology and outlook overview,” PTQ Magazine, 2023.
[83]
IEA, “Iron and Steel Technology Roadmap,” 2020.
[84]
D. K. W. C.-G. M. v. d. B. Annika Boldrini, “The impact of decarbonising the iron and steel industry on European power and hydrogen systems,,” Applied Energy, 2024.
WMG, “Scottish steel industry needs to be revived to thrive,” 19 july 2024. [Online]. Available: https://warwick.ac.uk/newsandevents/pressreleases/scottish_steel_industry/.
GEG, “News,” 19 July 2024. [Online]. Available: https://gegroup.com/latest/global-energy-group-and-proman-to-develop-a-renewable-power-to-methanol-plant-at-the-nigg-oil-terminal.
[89]
M. F. A. M. S. M. E. H. A. Mohammad Alhuyi Nazari, “Utilization of hydrogren in gas turbines: a comprehensive review,” International Journal of Low-Carbon Technology , pp. 513-519, 2022.
[90]
Z. G. H. U. R. Mohammed Yussoff Ibrahim, “The Feasibility of Carbon Capturing, Storage and Utilization,” EJ EconJournals , 2015.
[91]
Element Energy, “Hy4Heat WP6 Understanding industrial appliances Industry Workshop,” 10 April 2019. [Online]. Available: https://static1.squarespace.com/static/5b8eae345cfd799896a803f4/t/5caf309a652dea64b686e278/1554985118652/BEIS+Hy4Heat+WP6+-+industry+workshop+handout+F.pdf. [Accessed 30 August 2024].
[92]
British Ceramic Confederation, “Hydrogen for the Ceramics Sector,” 2023.
[93]
B. Oyenekan, “Application of Post Combustion CO2 Capture to Natural Gas Liquefaction Plants,” Elsevier, 2010.
[94]
WSP, Crondall Energy, GEOEnergy Durham, “Deep Geological Storage of CO2 on the UK Continental Shelf,” 2023.
[95]
D. f. E. S. &. N. Zero, “Carbon Capture, Usage and Storage: a vision to establish a competitive market,” 19 july 24. [Online]. Available: https://www.gov.uk/government/publications/carbon-capture-usage-and-storage-a-vision-to-establish-a-competitive-market/carbon-capture-usage-and-storage-a-vision-to-establish-a-competitive-market.
[96]
Element Energy, “Industrial Fuel Switching Market Engagement Study,” December 2018. [Online]. Available: https://assets.publishing.service.gov.uk/media/5d51400bed915d718d63b558/industrial-fuel-switching.pdf.
[97]
Element Energy, “Conversion of Industrial Heating Equipment to Hydrogen,” November 2019. [Online]. Available: https://static1.squarespace.com/static/5b8eae345cfd799896a803f4/t/5e287d78dc5c561cf1609b3d/1579711903964/WP6+Industrial+Heating+Equipment.pdf.
[98]
A. E. P. A. A. A. A. N. L. F. M. Hesamedin Hekmatmehr, “Carbon capture technologies: A review on technology readiness level,” Elsevier Fuel, 2024.
[99]
BEIS, “Industrial fuel switching,” 2018.
[100]
DUKES, “Chapter 6: Renewable sources of energy,” 2024.
[101]
T. B. U. V. B. Fumey, “Ultra-low NOx emissions from catalytic hydrogen combustion,” 2018.
[102]
U. DOE, “Does the use of hydrogen produce air pollutants such as nitrogen oxides?,” 2024. [Online]. Available: https://www.energy.gov/eere/fuelcells/does-use-hydrogen-produce-air-pollutants-such-nitrogen-oxides#:~:text=Because%20hydrogen%20burns%20at%20higher,to%20fuel%20can%20be%20used.. [Accessed 30 08 2024].
[103]
A. Burke, “Projections of the costs of light-duty battery-electric and fuel cell vehicles (2020–2040) and related economic issues,” 2024. [Online]. Available: https://www.sciencedirect.com/science/article/abs/pii/S0739885924000350 .
B. C. Fasihi M, “Global production potential of green methanol based on variable renewable electricity,” 2024. [Online]. Available: https://pubs.rsc.org/en/content/articlehtml/2024/ee/d3ee02951d.
IEA, “The Role of E-fuels in Decarbonising Transport,” 2023. [Online]. Available: https://www.iea.org/reports/the-role-of-e-fuels-in-decarbonising-transport.
[108]
Globalair, “Could SAF Be a Cost-Effective Solution to Rising Aviation Fuel Prices?,” 19 July 2024. [Online]. Available: https://www.flyingmag.com/could-saf-be-a-cost-effective-solution-to-rising-aviation-fuel-prices/.
[109]
S. D. International, “Hydrogen: how it’s decarbonising heavy duty transport,” 19 July 2024. [Online]. Available: https://www.sdi.co.uk/news/hydrogen-how-its-decarbonising-heavy-duty-transport#:~:text=In%20Scotland%2C%20hydrogen%20is%20already,also%20been%20running%20on%20hydrogen.
A. bp, “What is sustainable aviation fuel (SAF),” 19 July 2024. [Online]. Available: https://www.bp.com/en/global/air-bp/news-and-views/views/what-is-sustainable-aviation-fuel-saf-and-why-is-it-important.html.
Element Energy, “Hy-Impact Series Study 3: Hydrogen for Power Generation,” November 2019. [Online]. Available: https://www.element-energy.co.uk/wordpress/wp-content/uploads/2019/11/Element-Energy-Hy-Impact-Series-Study-3-Hydrogen-for-Power-Generation.pdf.
[118]
Aurora Energy Research, “Out of Gas?,” 2021. [Online]. Available: https://auroraer.com/wp-content/uploads/2021/08/Out_of_gas_Public-1.pdf.
[119]
Z. H. X. t. H. Z. Tingting Wei, “Performance evaluation of a hydrogen-fired combined cycle with water recovery,” Eslevier, 2023.
[120]
AFRY, “Net Zero Power and Hydrogen: Capacity Requirements for Flexibility,” The Climate Change Committee, 2023.
[121]
Energy Technologies Institute, “Written evidence submitted to the Parliament by the Energy Technologies Institute (CCU0244),” July 2018. [Online]. Available: http://data.parliament.uk/writtenevidence/committeeevidence.svc/evidencedocument/business-energy-and-industrial-strategy-committee/carbon-capture-usage-and-storage/written/87155.html.
[122]
D. Roddy, “Advanced Power Plant Materials,” Woodhead Publisher, 2010.
[123]
IEA, “The Role of Low-Carbon Fuels in the Clean Energy Transitions of the Power Sector,” October 2021. [Online]. Available: https://www.iea.org/reports/the-role-of-low-carbon-fuels-in-the-clean-energy-transitions-of-the-power-sector.
[124]
A. Valera-Medina, H. Xiao, O.-J. M, W. David and P. Bowen, “Ammonia for power,” Progress in Energy and Combustion Science, vol. 69, pp. 63-102, 2018.
Regen, “Distribution Future Energy Scenarios 2022,” April 2023. [Online]. Available: https://regensw.wpenginepowered.com/wp-content/uploads/SSEN-DFES-2022-North-of-Scotland-report.pdf.
[127]
Climate Change Committe, “Biomass in a low-carbon economy,” November 2018. [Online]. Available: https://www.theccc.org.uk/publication/biomass-in-a-low-carbon-economy/.
[128]
A. Raj, I. S. Larsson, A.-L. Ljung, T. Forslund, R. Andersson, J. Sundstrom and T. Lundstrom, “Evaluating hydrogen gas transport in pipelines: Current state of numerical and experimental methodologies,” International Journal of Hydrogen Energy, vol. 67, pp. 136-149, 2024.
[129]
S.Giddet, S. Badwal, C.Munnings and M. Dolan, “Ammonia as a Renewable Energy Transportation Media,” ACS Sustainable Chemistry & Engineering, vol. 5, no. 11, pp. 10231-10239, 2017.
[130]
H. Crolius, “Nh3 vs. MCH: Energy Efficiency of Hydrogen Carriers Compared,” 2019.
[131]
N. Meng, “An Overview of Hydrogen Storage Technologies,” Energy Exploration and Exploitation, vol. 24, no. 3, pp. 197-209, 2006.
[132]
The Oxford Institute for Energy Studies, “Hydrogen storage for a net-zero carbon future,” 04 2023. [Online]. Available: https://www.oxfordenergy.org/wpcms/wp-content/uploads/2023/04/ET23-Hydrogen-storage-for-a-net-zero-carbon-future.pdf.
[133]
S. Chatterjee, R. K. Parsapur and K.-W. Huang, “Limitations of Ammonia as a Hydrogen Energy Carrier for the Transportation Sector,” ACS Energy Letters, vol. 6, no. 12, pp. 4390-4394, 2021.
[134]
Element Energy, “scottish-enterprise.com,” Aoril 2023. [Online]. Available: https://www.scottish-enterprise.com/media/0hwayqis/industrial-report.pdf.
[135]
J. Guarco, B. Langstine and M. Turner, “cea.org.uk,” [Online]. Available: https://cea.org.uk/wp-content/uploads/2021/06/Zeeco-Hydrogen-Article.pdf.
[136]
Royal Society, “Ammonia: zero-carbon fertiliser, fuel and energy store,” February 2020. [Online]. Available: https://royalsociety.org/-/media/policy/projects/green-ammonia/green-ammonia-policy-briefing.pdf.
[137]
c. e. g. d. wsp, “Deep Geological Storage of CO2 on the UK Continental Shelf,” Open Government Licence, 2023.
[138]
I. Dutta, “The Role of Fugitive Hydrogen Emissions in Selecting Hydrogen Carriers,” 2023.
[139]
Frazer-Nash, “Fugitive Hydrogen Emissions in a Future Hydrogen Economy,” March 2022. [Online]. Available: https://www.gov.uk/government/publications/fugitive-hydrogen-emissions-in-a-future-hydrogen-economy.
[140]
Methanol Institute, “carbon footprint of methanol,” 2020.
[141]
IRENA, “INNOVATION OUTLOOK RENEWABLE METHANOL,” 2021.
[142]
Sustainable Aviation, 2020.
[143]
European Environment Agency, 2022.
[144]
E. Nadimi, “Effects of ammonia on combustion, emissions, and performance of the ammonia/diesel dual-fuel compression ignition engine,” 2023.
[145]
ICF, “Fueling net zero: How the aviation industry can deploy sufficient sustainable aviation fuel to meet climate ambitions,” 2021.
[146]
M. Braun, “Pathway to net zero: Reviewing sustainable aviation fuels, environmental impacts and pricing,” Journal of Air Transport Management, 2024.
[147]
C. Voight, “Cleaner burning aviation fuels can reduce contrail cloudiness,” 2021.
[148]
Chatterjee, “Limitations of Ammonia as a Hydrogen Energy Carrier for the Transportation Sector,” 2021.
[149]
S. Ghavam, “Sustainable Ammonia Production Processes,” 2021.
[150]
Searchinger and Heimlich, “Avoiding Bioenergy Competition for Food Crops and Land,” 2015.
[151]
European Aviation Agency, “European Aviation Environmental Report 2022,” 2022.
[152]
Rand Europe, “The impact of ammonia emissions from agriculture on biodiversity,” 2018.
[153]
American Methanol Institute, “EVALUATION OF THE FATE AND TRANSPORT OF METHANOL IN THE ENVIRONMENT,” 1999.
[154]
IBA, “Sustainable Aviation Fuel: How Sustainable Is It Really?,” 2023.
[155]
Public Health England, “Ammonia: general information,” August 2019. [Online]. Available: https://www.gov.uk/government/publications/ammonia-properties-incident-management-and-toxicology/ammonia-general-information.
[156]
Public Health England, “Methanol Toxicological Overview,” 2015.
[157]
A. Lewis, “Future aviation fuels Work Package C3: Interactions Between Mitigation Measures and the Atmosphere,” 2022.
[158]
J. I. Markus Hurskainen, “Techno-economic feasibility of road transport of hydrogen using liquid organic hydrogen carriers,” International Journal of Hydrogen Energy, 2020.
[159]
NREL, “On the Road to Increased Transmission: High-Voltage Direct Current,” 12 June 2024. [Online]. Available: https://www.nrel.gov/news/program/2024/on-the-road-to-increased-transmission-high-voltage-direct-current.html. [Accessed 05 September 2024].
[160]
J. U. Y. H. L. X. S. G. Y. D. Tongtong Zhang, “Hydrogen liquefaction and storage: Recent progress and perspectives,” Renewable and Sustainable Energy Reviews, 2023.
[161]
A. R. I. M. A. Firman Bagja Juangsa, “Production of ammonia as potential hydrogen carrier: Review on thermochemical and electrochemical processes,” International Journal of Hydrogen Energy, 2021.
[162]
R. H. S. B. B. S. B. W. Miao Yang, “ A review of hydrogen storage and transport technologies,” Clean Energy, 2023.
[163]
S. S. T. L. E. R. S. S. G. N. A. T. S. S. P. K. S. Lavanya Mulky, “An overview of hydrogen storage technologies – Key challenges and opportunities,” Materials Chemistry and Physics, 2024.
[164]
IEA, “ETP Clean Energy Technology Guide,” 2023.
[165]
W. Liu, C. Liu, P. Gogoi and Y. Deng, “Overview of Biomass Conversion to Electricity and Hydrogen and Recent Developments in Low-Temperature Electrochemical Approaches,” Engineering, vol. 6, no. 12, pp. 1351-1363, 2020.
[166]
BEIS, “Electricity Generation Costs 2020,” 2020.
[167]
M. Bui, M. Fajardy and N. M. Dowell, “Bio-Energy with CCS (BECCS) performance evaluation: Efficiency enhancement and emissions reduction,” Applied Energy, vol. 195, pp. 289-302, 2017.
[168]
B. Yang, Y. Wei, L. Liu, Y. Hiu, K. Zhang, L. Yang and Y. Feng, “Life cycle cost assessment of biomass co-firing power plants with CO2 capture and storage considering multiple incentives, Energy Economics,” 2021.
[169]
Z. I. M. N.-L. R. M. M. &. B.-A. R. Cesaro, “Ammonia to power: Forecasting the levelized cost of electricity from green ammonia in large-scale power plants,” Applied Energy, vol. 282, p. 116009, 2021.
[170]
DESNZ, “Proposals for offshore hydrogen regulation,” September 2023. [Online]. Available: https://www.gov.uk/government/consultations/proposals-for-offshore-hydrogen-regulation.
[171]
Eurostat, “Simplified Energy Balances,” 2024. [Online]. Available: https://ec.europa.eu/eurostat/databrowser/view/nrg_bal_s__custom_12534402/default/table.
[172]
C. C. Committee, “Deep-Decarbonisation Pathways for UK Industry (Element Energy),” 2020. [Online]. Available: https://www.theccc.org.uk/publication/deep-decarbonisation-pathways-for-uk-industry-element-energy/.
[173]
E. H. Observatory, “Hydrogen Demand,” 2023. [Online]. Available: https://observatory.clean-hydrogen.europa.eu/hydrogen-landscape/end-use/hydrogen-demand.
[174]
H. Europe, “Clean Hydrogen Monitor,” 2023.
[175]
E. Commission, “Policy scenarios for delivering the European Green Deal,” 2021. [Online]. Available: https://energy.ec.europa.eu/data-and-analysis/energy-modelling/policy-scenarios-delivering-european-green-deal_en.
[176]
E. Commission, “Europe’s energy infrastructure configurations : a 2030-2050 outlook,” 2024.
[177]
C. C. Committee, the 6th Carbon Budget Dataset, 2020.
[178]
AFRY, “Net Zero Power and Hydrogen: Capacity Requirements for Flexibility,” 2023.
[179]
ClimateXChange, “Hydrogen as a storage medium in Scotland,” 2023.
DfT, SAF Mandate Consultation-Stage Cost Benefit Analysis – Dataset, 2023.
[188]
European Commission, “ANNEXES to the Proposal for a Regulation of the European Parliament and of the Council on the use of renewable and low-carbon fuels in maritime transport and amending Directive 2009/16/EC,” 2021.
[189]
DfT, UK major port freight traffic, by port and year, 2024.
[190]
DNV, “Maritime Forecast to 2050,” 2023.
[191]
“Grangemouth Oil Refinery,” The Editors of the Gazetteer for Scotland, 2021.
[192]
P. K. Dhar, V. G, P. V. Rao and G. Sri Ganesh, “Reducing hydrogen consumption in diesel hydrotreating,” Hindustan Petroleum Green R&D Centre, 2018.
Acknowledgements
The delivery team extends thanks to Dr Jamie Speirs, Reader and Deputy Director in the Centre for Energy Policy at Strathclyde University, and Dr Edward Brightman, Lecturer at the University of Strathclyde, for their thorough review and helpful and constructive comments throughout the project. Special thanks go to Dr Nicola Dunn, Project Manager at ClimateXChange, for her continuous support and valuable guidance. We also express our appreciation to the Steering Group for their insightful input and feedback and to the industry stakeholders who contributed to our research, providing essential perspectives.
We would also like to recognise the dedication and hard work of the Gemserv team, including analysts and graphic designers Rachael Quintin-Baxendale, Sandile Mtetwa, Dhairya Nagpal, Isaac Guy, and Thomas Gayton, whose efforts were key in bringing this report to its final form.
How to cite this publication:
Csernik-Tihn, S., Mitchell, J., Wilson, J., Morton, H. (2025) Review of demand for hydrogen derivatives and products’, ClimateXChange. DOI http://dx.doi.org/10.7488/era/5798
While every effort is made to ensure the information in this report is accurate as at the date of research completion, no legal responsibility is accepted for any errors, omissions or misleading statements. The views expressed represent those of the author(s), and do not necessarily represent those of the host institutions or funders.
This work was supported by the Rural and Environment Science and Analytical Services Division of the Scottish Government (CoE – CXC).
Industry includes chemicals and petrochemicals, construction, food, beverages and tobacco, iron and steel, machinery, textile and leather, non-metallic minerals, non-ferrous metals, oil and natural gas extraction, paper, pulp and printing, refineries, and transport equipment. ↑
These demand projections have been revised down to account for the closure of the Grangemouth refinery, announced in September 2024. The demand for the refinery as per NESO’s FES scenarios [194] was reversed, with assumptions according to data availability. The exact methodology used is discussed in Appendix E. ↑

 In the research discussions and homework tasks, participants identified a range of warm-up behaviours which they associated with researching/deciding on a new heating system. This insight gives an indication of the target behaviours which could be modelled or encouraged in communications to encourage heat pump uptake alongside the primary call to action of switching away from gas or oil heating:


 This interactive advice resource from the consumer advice brand Which? was presented as a quiz. Users answered a short series of questions about their living circumstances and driving habits and received tailored advice on whether an EV would be a viable choice for them. This medium was useful in prompting participants to revisit assumptions about the range of EVs, as well as prompting some contemplation about the change of habit required to keep an EV charged up in contrast to their existing habits around filling up at a petrol station. The brand credibility of Which? as a perceived neutral party helped to foster trust in the advice given. It was possible for users to receive advice that recommended against buying an EV, which could be demotivational. However, some participants noted that the fact this was a possible outcome added to the sense of impartiality.
 This core communications proposition also has the potential to increase the sense of EVs as the incoming norm. The perception of EVs as a high-end product was in part linked to the strong impact of brands such as Tesla in popularising earlier generations of EVs. In contrast, promotional communications for more affordable EV models often focus significantly on price. For participants, seeing a wider variety of manufacturers, including mid-market or cheaper brands, helps to drive the idea that EVs are becoming increasingly popular across society rather than just for an affluent subset of the population.
 Similarly to messaging about lower than expected retail prices, there is potential for this message theme to increase perceived behavioural control by lowering the expected up-front cost of an EV.


 The energy supplier Octopus has recently entered the heat pump market with an “all in one” product/service offer (Octopus Energy, 2025). A prominent message in their promotional communications has been around the lack of third-party involvement in the process, with the manufacturer providing survey, design, installation and also offering to apply for funding support on behalf of the customer. This core communications proposition may be worth exploring further with research participants as the time cost of the decision-making and administrative process involved in getting a heat pump has been identified as a potential barrier.

 While luxury is still a prevalent theme in some promotional campaigns for EVs, it is typically associated with products at a higher price point, such as Tesla. However, some manufacturers who are more recent entries to the UK market appear keen to make value for money a key part of their proposition. MG launched a mid-sized fully electric SUV in 2022 with a campaign which presented their product as affordable and accessible, while still emphasising modern technology and features (M3 Agency, 2022). The campaign was built around the idea that “Electric is for everyone” with messaging which highlighted the price point, range, and features such as wireless phone charging. Similarly, Dacia’s communications promoting the Dacia Spring describe it as “Europe’s most affordable new electric car” (Dacia UK, 2024)


 Figure 25: FirstBus #CarFree campaign materials
 Communications created by the Energy Saving Trust presents public transport and active travel as part of a hierarchy, with air travel and ICE vehicle travel as the most environmentally harmful (Energy Saving Trust, 2024). This notably includes digital communication (e.g. video calling) and presents this as being the least impactful option on the climate.
 The Stages of Change Model (Prochaska & DiClemente, 1983), also known as the Transtheoretical Model, describes stages of behaviour change including: Pre-contemplation (not ready to change), Contemplation (considering change), Preparation (planning to change), Action (making changes), Maintenance (sustaining change), and Termination (no longer tempted). This model recognises that change is a process, not an event, and different strategies are effective at each stage.
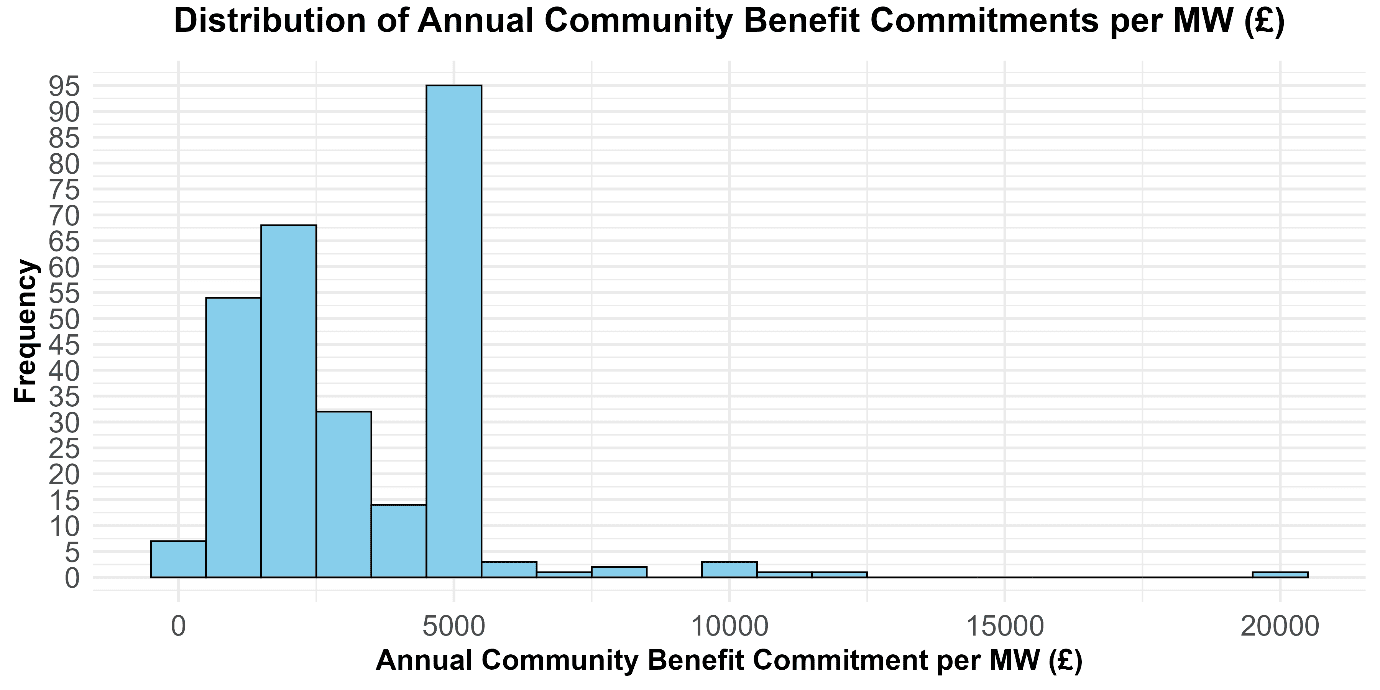
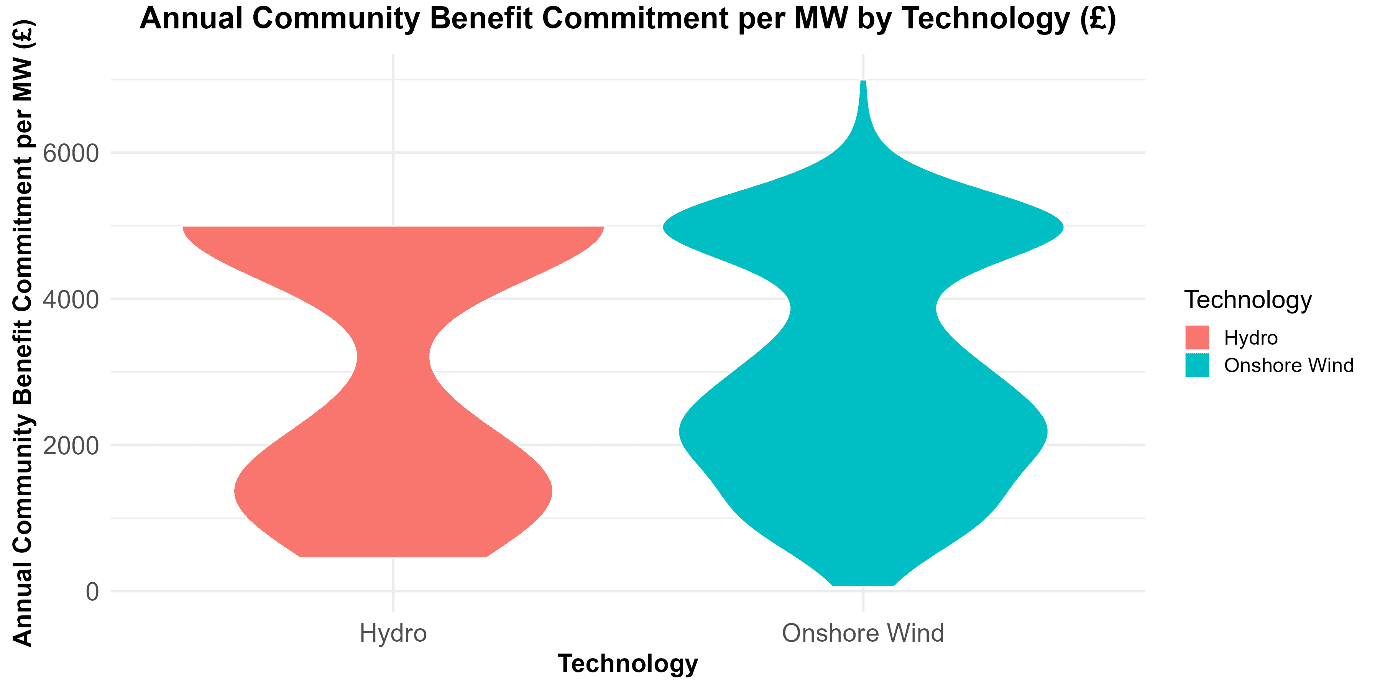
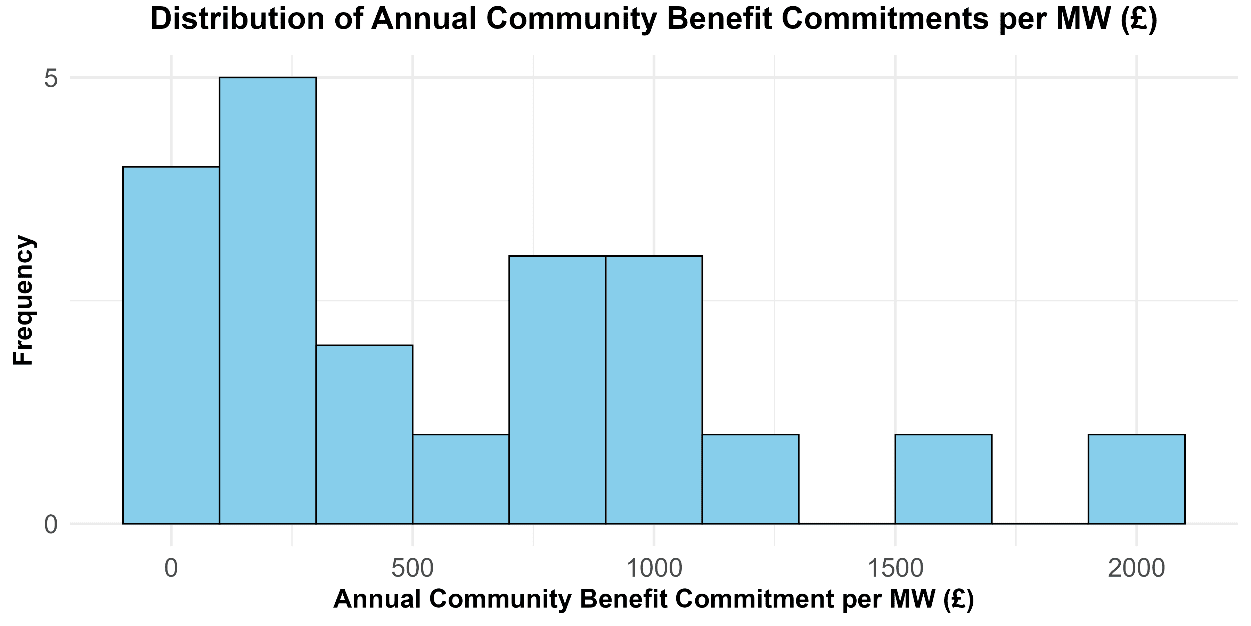
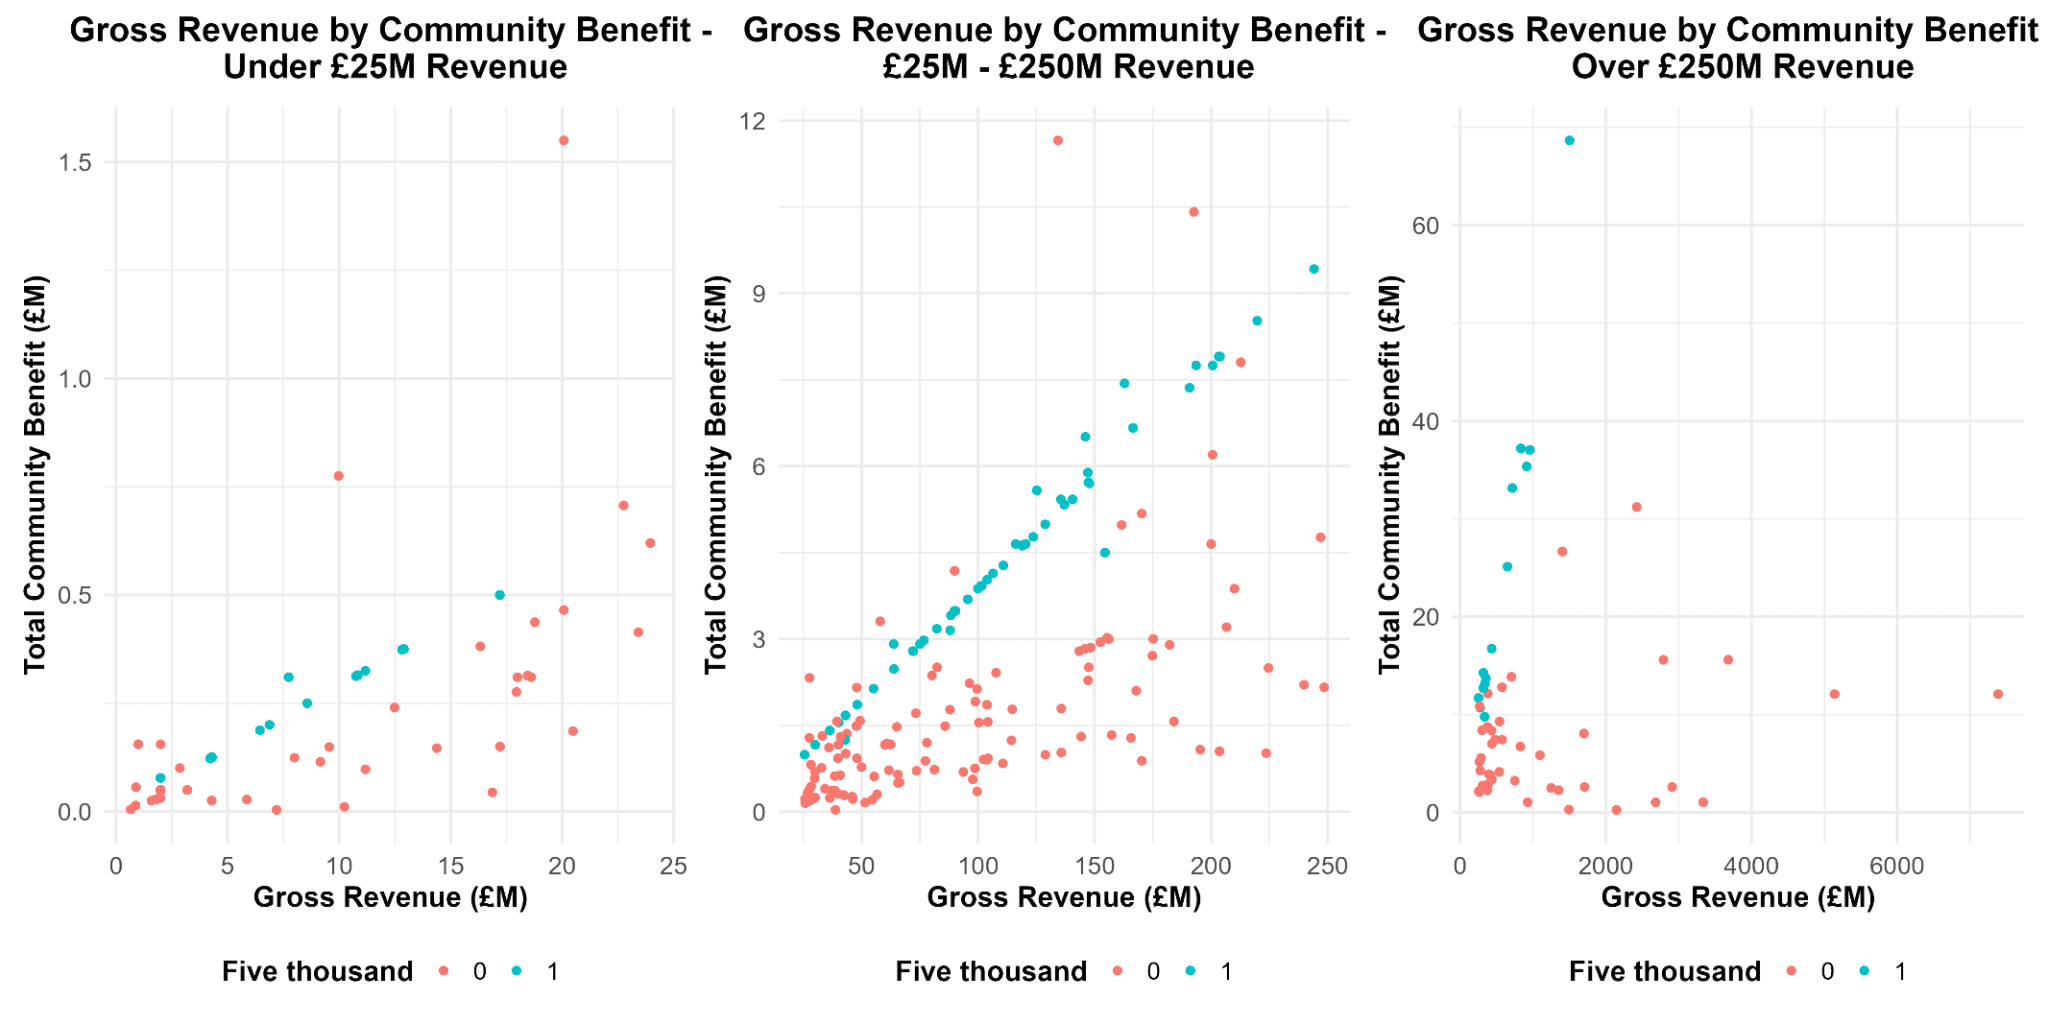
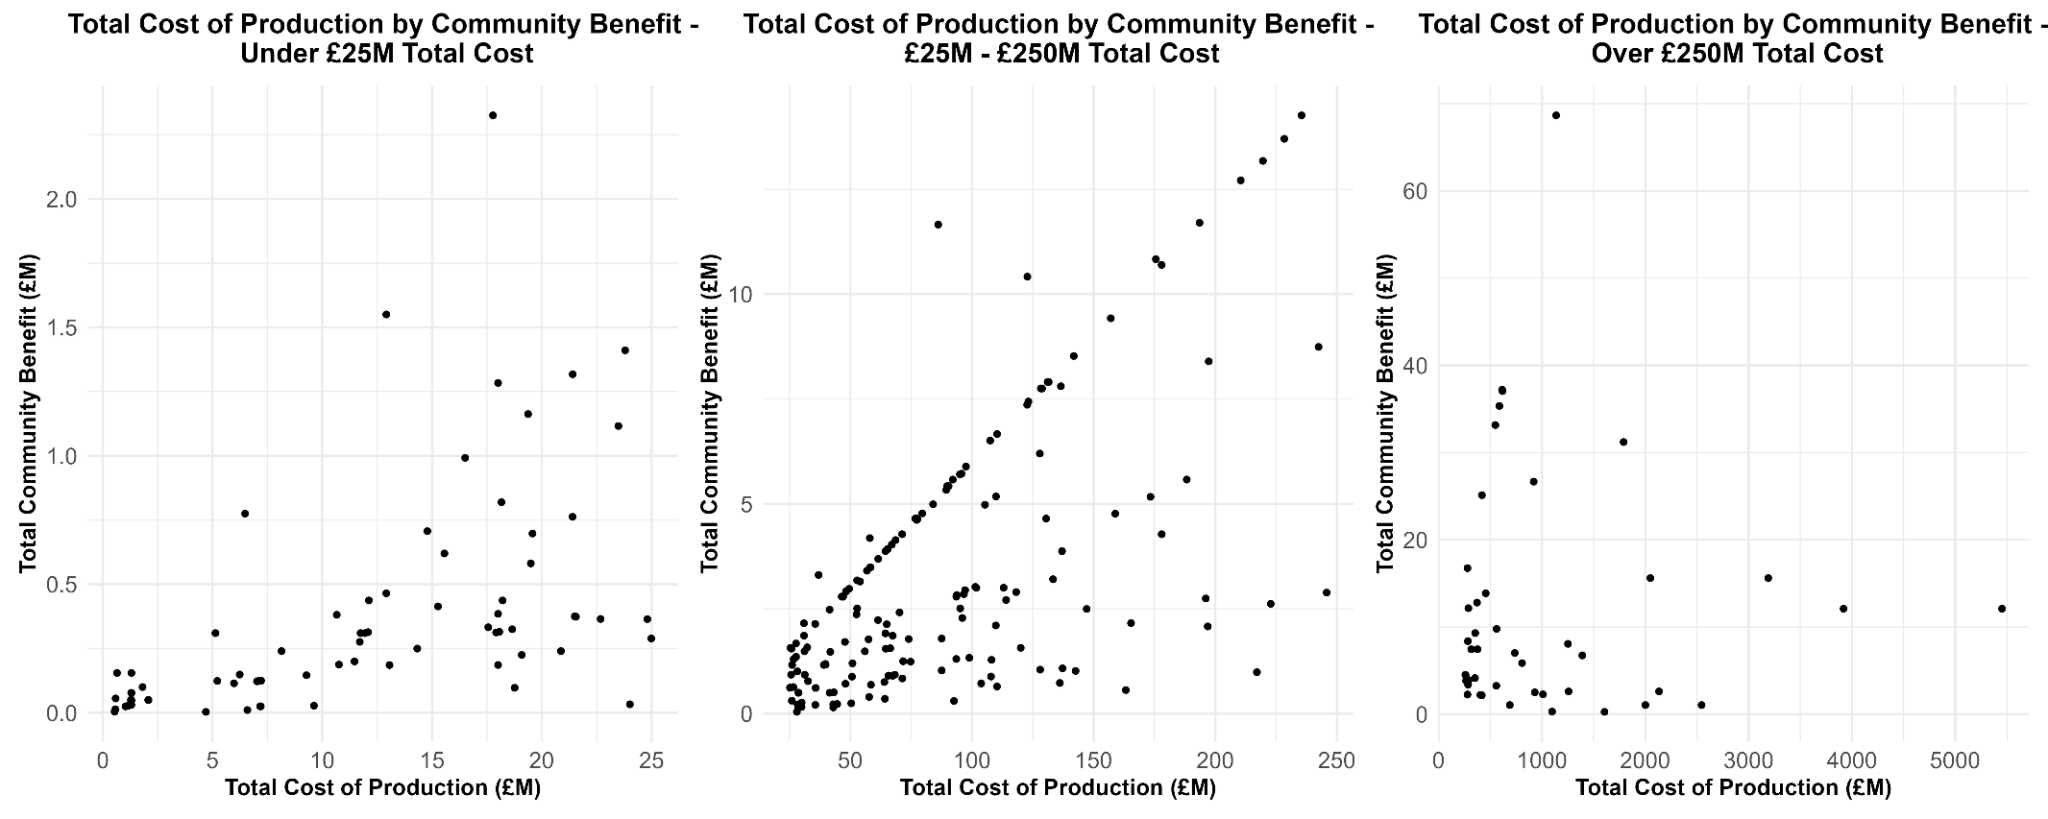
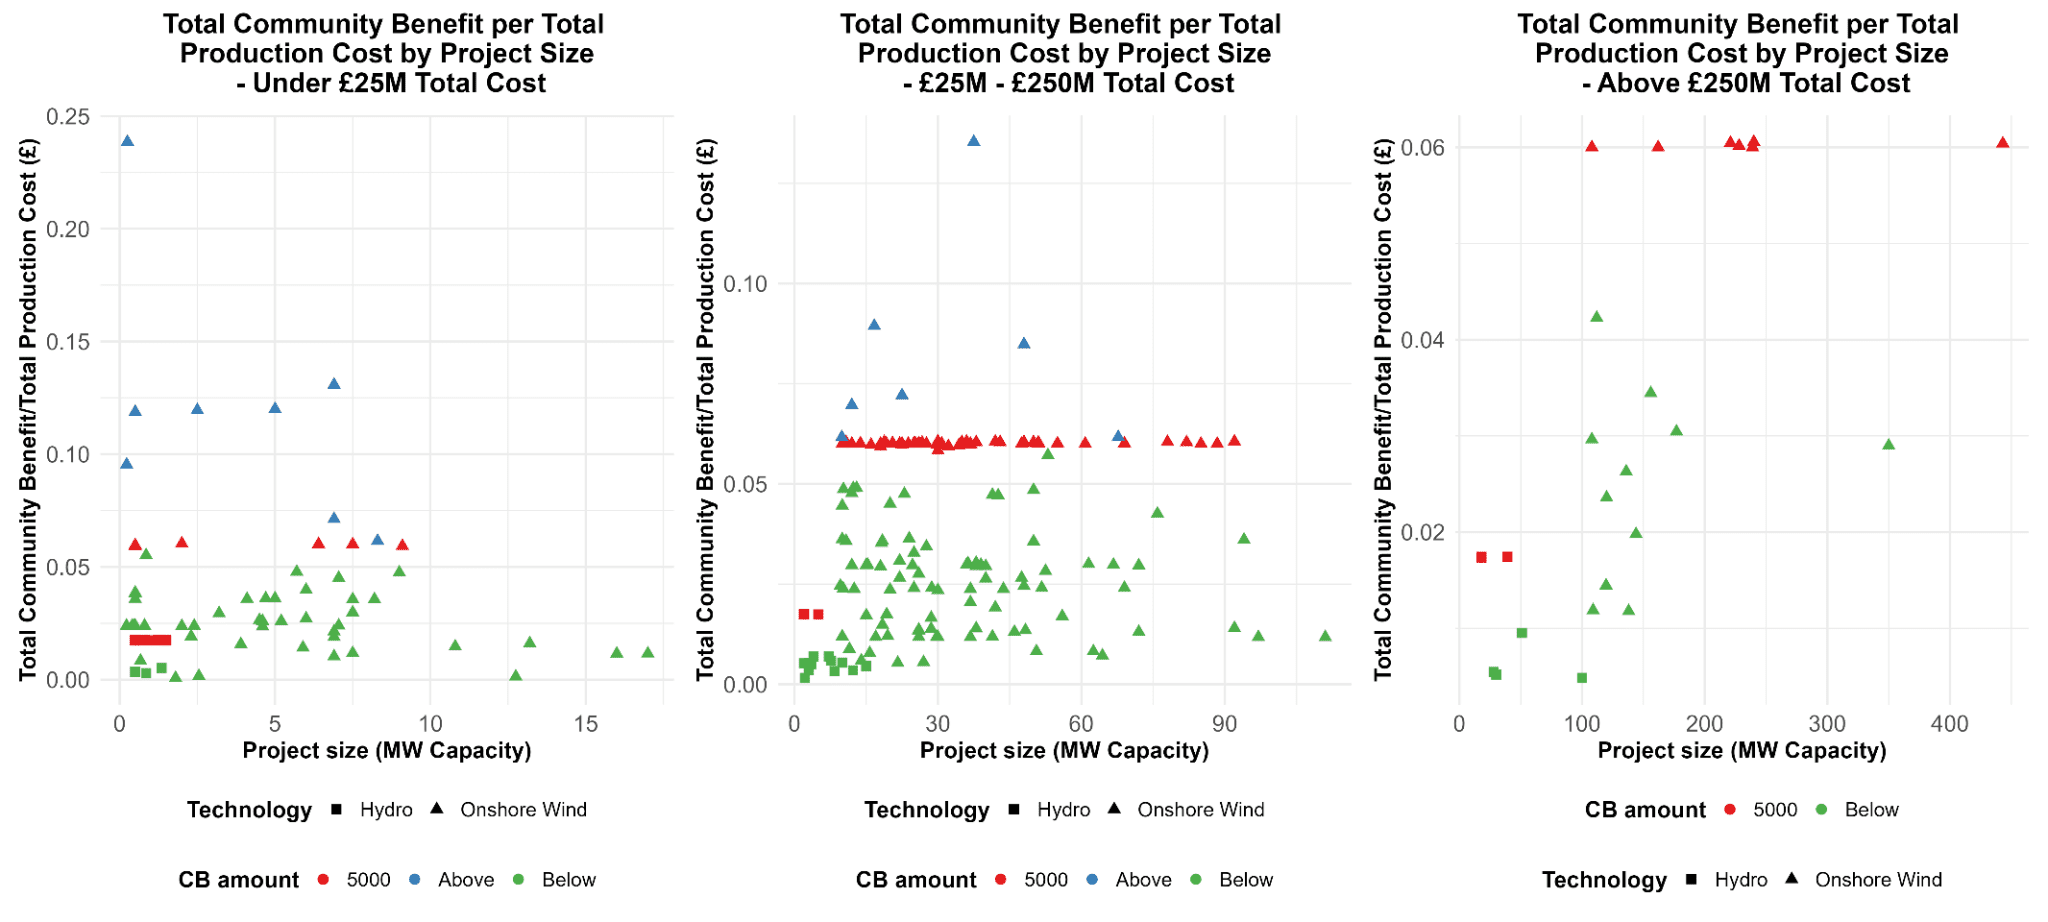
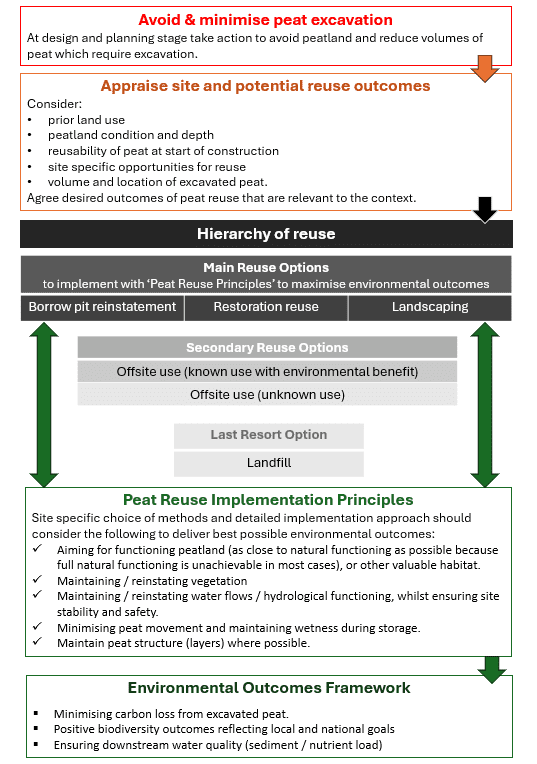
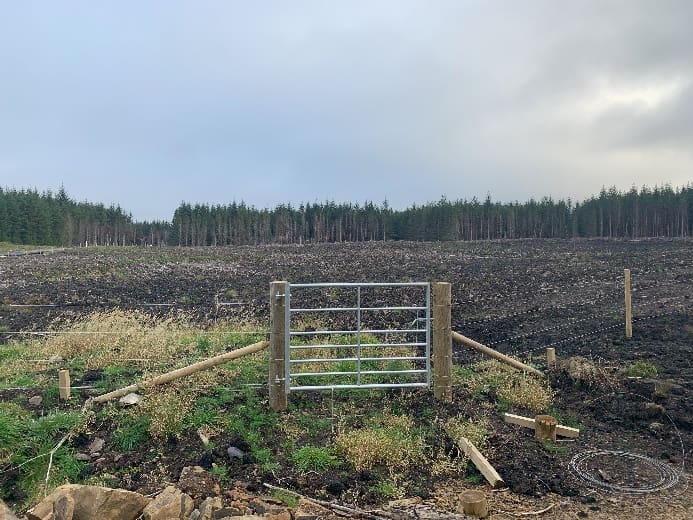


 d)
d)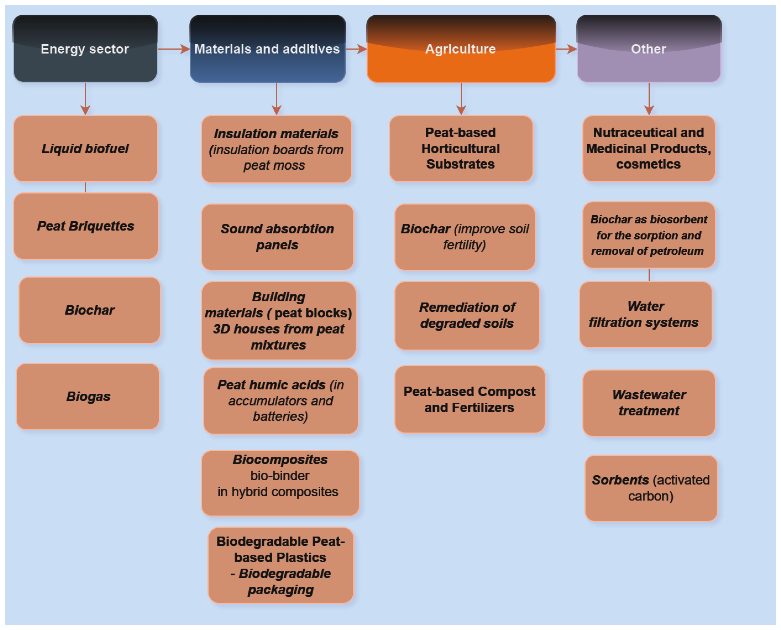
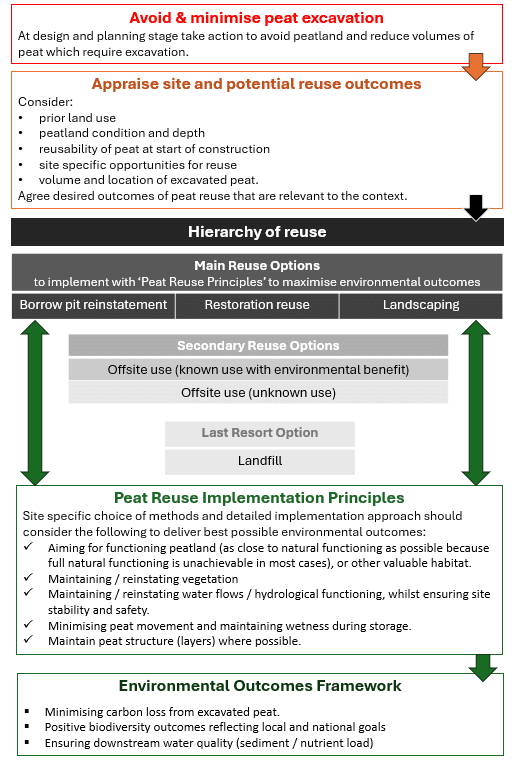
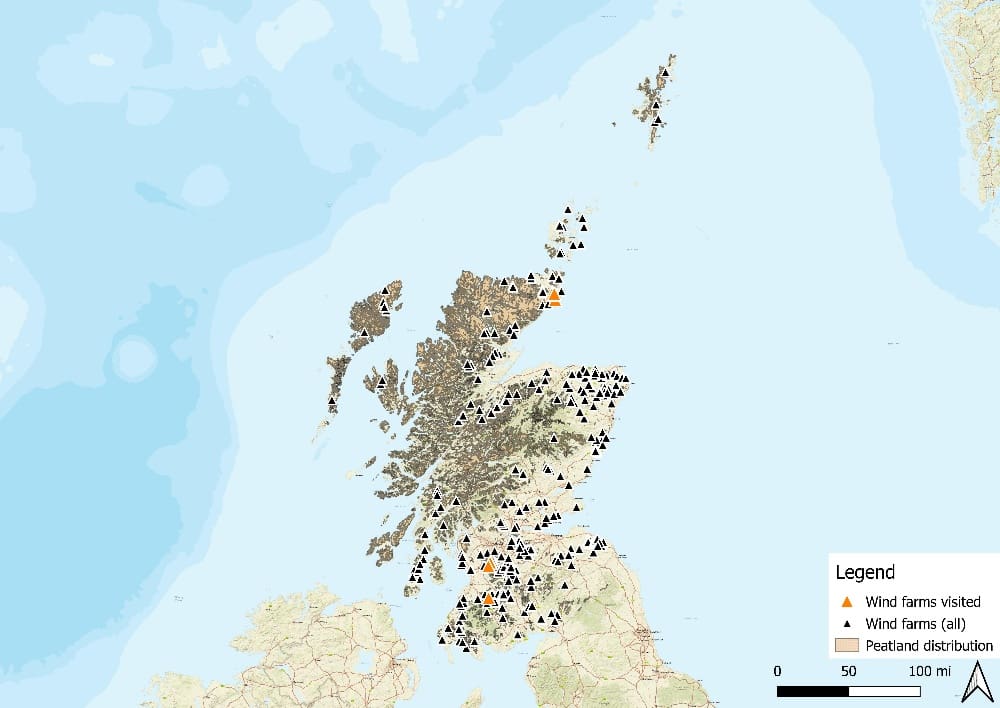
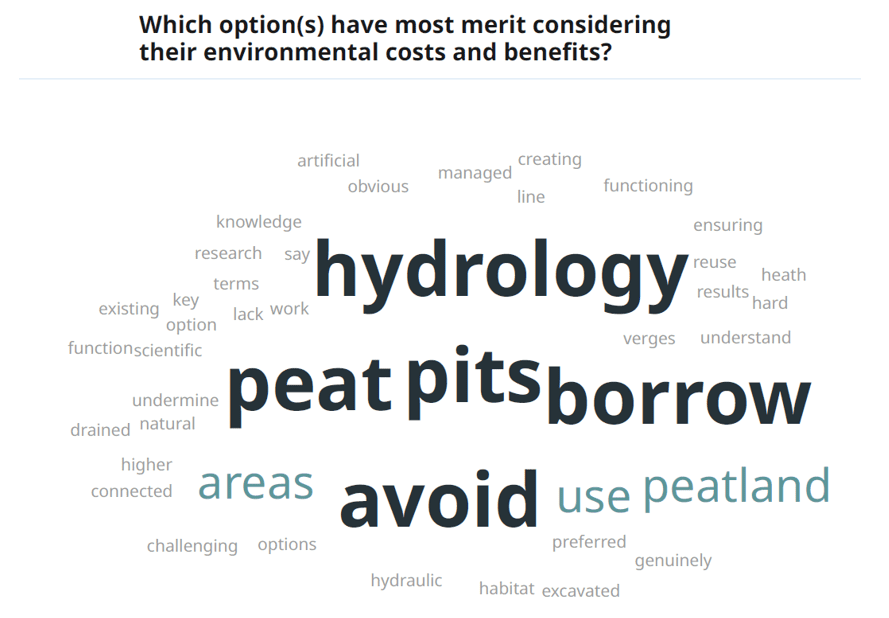
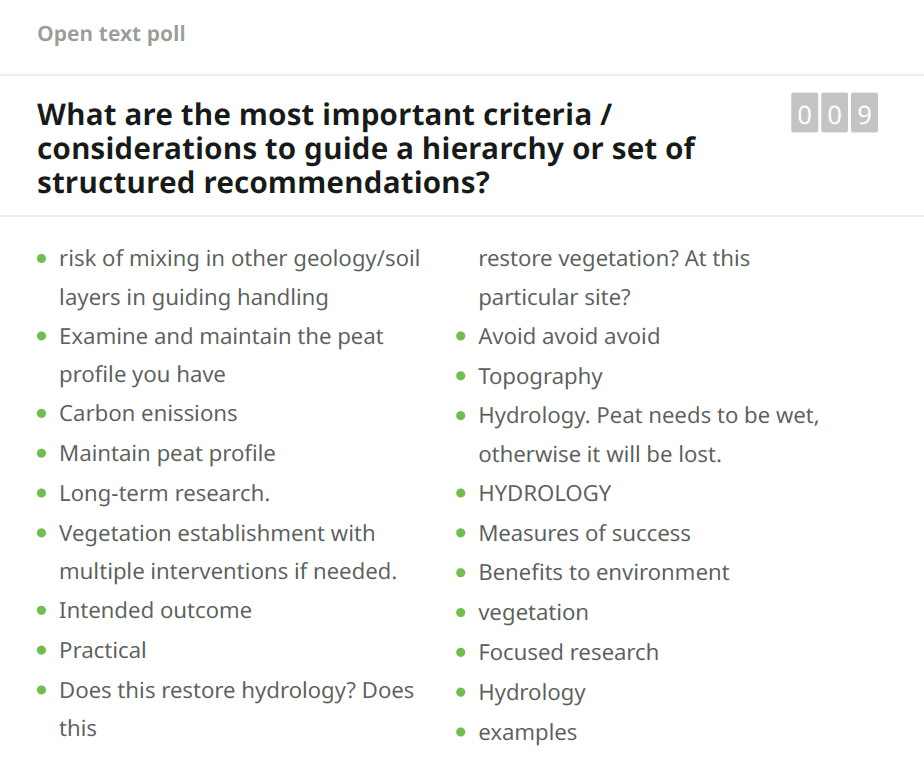
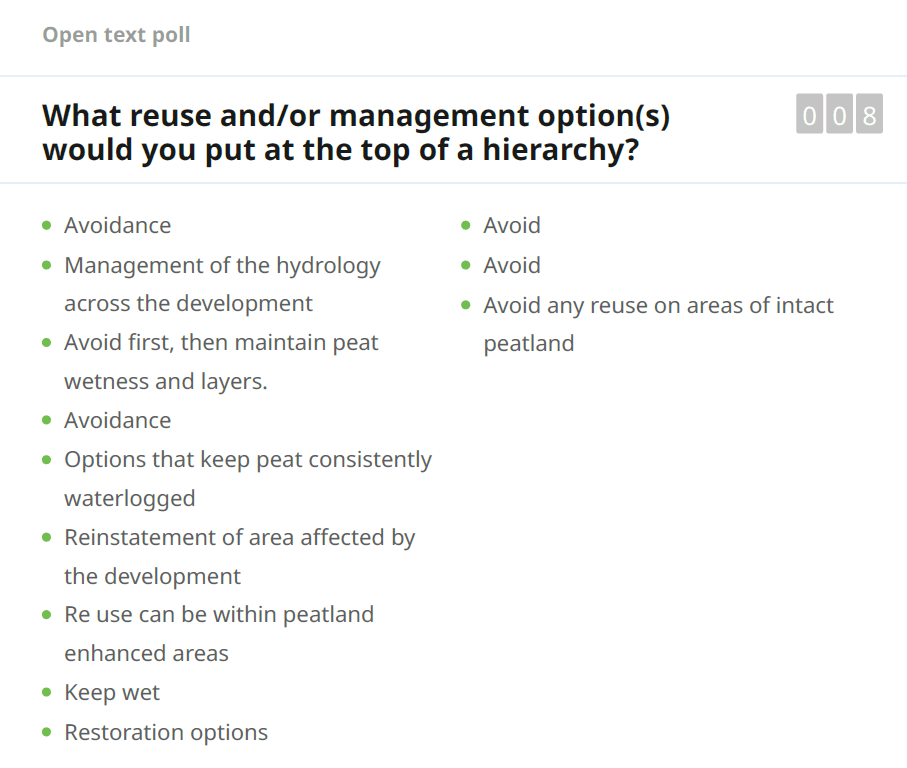


 Figure 5.1: Research and development areas in DAC.


