
Scotland faces a rapidly changing climate, with rising temperatures, shifting precipitation patterns and more frequent extreme weather events already affecting communities, infrastructure and ecosystems.
These climate change impacts are projected to intensify over the coming decades, placing growing pressure on public services, natural systems and populations. As Scotland continues to strengthen its national response, effective adaptation planning has become an essential part of long-term climate resilience.
Through the third Scottish National Adaptation Plan (SNAP3), Scotland has a national monitoring and evaluation (M&E) framework designed to track progress in building climate resilience. However, while this framework includes indicators linked to adaptation outcomes and objectives, it does not yet define quantified adaptation targets.
This report draws on a structured review of international literature and adaptation plans as well as interviews with policymakers and technical experts from seven jurisdictions. It explores how high-level adaptation goals and ambitions can be translated into robust, measurable targets and identifies lessons to support the development of adaptation targets in Scotland.
The research was not intended to prescribe specific targets for Scotland, but to identify the conditions, structures and processes required to develop robust adaptation targets in a complex and evolving risk landscape.
Findings
The evidence shows that adaptation targets work best when they are clearly defined, built into delivery systems, aligned with institutional capacity, and supported by strong governance and monitoring.
Further findings included:
- Stakeholder engagement with citizens and communities could help shape the early, value-based stages of problem framing with experts and technical specialists playing a lead role in interpreting evidence, prioritising risks, and designing metrics.
- Capacity constraints, including evidence gaps, overstretched delivery bodies and uneven sectoral readiness, emerged as one of the most significant limiting factors in effective adaptation target-setting.
- Targets are most credible and deliverable when embedded into established planning, budgeting and delivery systems.
From the evidence base, researchers also established a set of design principles for setting adaptation targets in Scotland and list actions to support an effective adaptation target setting system.
For further information, please read the full report.
If you require the report in an alternative format, such as a Word document, please contact info@climatexchange.org.uk or 0131 651 4783.
Research completed February 2026
DOI: https://doi.org/10.7488/era/7026
Executive summary
Purpose of the study
Scotland faces a rapidly changing climate, with rising temperatures, shifting precipitation patterns and more frequent extreme weather events already affecting communities, infrastructure and ecosystems. These climate change impacts are projected to intensify over the coming decades, placing growing pressure on public services, natural systems and populations. As Scotland continues to strengthen its national response, effective adaptation planning has become an essential part of long-term climate resilience.
Scotland’s third Scottish National Adaptation Plan (SNAP3) introduced, for the first time, a national monitoring and evaluation (M&E) framework designed to track progress in building climate resilience. However, while this framework includes indicators linked to adaptation outcomes and objectives, it does not yet define quantified resilience targets. The UK Climate Change Committee (CCC) has recommended that Scotland develop specific and measurable targets to strengthen accountability, support monitoring and clarify the level of resilience being sought.
This study draws on a structured review of international literature and adaptation plans, interviews with policymakers and technical experts from seven jurisdictions and a two-round modified Delphi process with Scottish experts, primarily from relevant policy and analytical areas within Scottish Government. The Delphi method is a structured, iterative method designed to gather informed judgement from experts to identify both areas of consensus and disagreement.
Together these sources provide practical evidence about:
- how adaptation targets are currently being used internationally;
- what credible and useful adaptation targets look like;
- how they can be governed, monitored and reviewed;
- and how stakeholder engagement contributes to the development of legitimate and workable targets.
The research was not intended to prescribe specific targets for Scotland, but to identify the conditions, structures and processes required to develop robust adaptation targets in a complex and evolving risk landscape.
Key findings
The evidence shows that adaptation targets work best when they are clearly defined, built into delivery systems, aligned with institutional capacity, and supported by strong governance and monitoring.
Clarity and quality of adaptation targets
The international review and results from the Delphi study consistently show that high-quality adaptation targets are most effective when they:
- drive action, not simply record activities;
- reflect a layered structure, with long-term resilience outcomes supported by near-term delivery or output targets;
- differentiate between process, output, outcome and impact targets, using each type appropriately; and
- be supported by an explicit Theory of Change that explains how actions lead to outcomes and impacts.
Governance, decision-making and institutions
Evidence consistently shows that credible and deliverable target systems require a hybrid governance model that combines:
- central coordination to maintain ambition, coherence and transparency;
- distributed sectoral responsibility for developing and delivering targets; and
- independent scrutiny to reinforce credibility and political discipline.
Stakeholder engagement
Evidence shows that while engagement is valuable, it does not guarantee influence. Target design is often led by governments and technical experts with authority to implement, while broader stakeholders shape outcomes mainly when there is genuine co-design, iteration and decision-making power. Delphi participants supported a differentiated approach in which:
- Citizens and communities shape the early, value-based stages of problem framing—what matters, whose risks count, and what fairness requires.
- Experts and technical specialists play a sustained role throughout target-setting, including interpreting evidence, prioritising risks, and designing metrics.
- Government retains final accountability.
Capacity, resources and feasibility
Capacity constraints emerged as one of the most significant limiting factors in effective adaptation target-setting. Participants in the Delphi study emphasised:
- limited analytical and modelling capacity;
- uneven sectoral readiness;
- significant evidence and data gaps;
- overstretched delivery bodies and competing statutory demands;
- insufficient and unstable funding to support planning, delivery and monitoring.
Integration, coherence and implementation pathways
Targets are most credible and deliverable when embedded into established planning, budgeting and delivery systems. The evidence shows that targets must:
- align with SNAP3 cycles, statutory reporting processes and cross-government planning;
- be coherent with related strategies (climate, nature, water, land, health, infrastructure) to avoid fragmentation and ensure clarity for delivery bodies;
- sit within a clear implementation pathway with milestones, roles, assumptions and review points; and
- be supported by functioning monitoring, evaluation and learning systems that provide the evidence required to assess progress.
These findings show that adaptation target-setting is as much a governance challenge as a technical one, shaped by institutional capacity, political incentives and delivery systems.
Design principles for setting adaptation targets in Scotland
The evidence base points to nine practical design principles:
- Design targets to drive action;
- Embed scientific and hazard-based evidence at the core of target design;
- Balance ambition with feasibility through phased development;
- Use mixed measurement approaches where evidence is incomplete;
- Integrate equity directly into ambition-setting and evaluation;
- Ensure targets remain interpretable and usable, avoiding unnecessary complexity;
- Provide clear and predictable review processes;
- Design within system capacity;
- Align targets with wider policy systems.
Policy implications for setting adaptation targets in Scotland
The study highlights several actions that would support an effective adaptation target setting system:
- Establish a phased, layered adaptation target framework.
- Integrate hazard- and risk-based evidence into all stages of target development.
- Anchor revision processes in statutory cycles with tightly governed flexibility.
- Embed equity within target ambition and delivery.
- Strengthen analytical, modelling and monitoring capability across government.
- Adopt mixed-method assessment frameworks.
- Prioritise simplicity and usability in target system design.
- Strengthen cross-government coordination and coherence.
- Develop transparent engagement pathways.
- Provide stable, multi-year funding for implementation.
Glossary and Abbreviations
|
Glossary | |
|
adaptive management |
A cyclical approach where decisions are revisited and adjusted as new evidence, learning and conditions emerge. Central to iterative target-setting. |
|
attribution |
Proving that an observed impact (e.g. reduced losses) is caused by a specific action. Often impossible in complex systems. |
|
baseline |
The starting point against which progress is measured. In adaptation, baselines may be dynamic rather than fixed, because climate risks continue to evolve. |
|
climate risk |
The potential for adverse impacts resulting from climate-related hazards (such as heatwaves, flooding or drought), interacting with the exposure and vulnerability of people, infrastructure, ecosystems or assets (adapted from IPCC, 2022). |
|
co-design |
A participatory approach where stakeholders, including communities and delivery partners, are directly involved in shaping targets, metrics and implementation pathways. |
|
contribution |
Demonstrating that an action plausibly supports resilience, even if causality cannot be isolated. |
|
enablers |
The capacities, resources, data systems, governance structures and institutional arrangements required for targets to be credible and deliverable. |
|
evaluation |
The periodic and structured assessment of the performance, effectiveness and efficiency of an intervention, typically asking what worked, what didn’t and why. |
|
impacts |
The longer-term, higher-level changes to systems, vulnerability or resilience (e.g. reduced heat-related illness, fewer properties at high flood risk). |
|
indicators |
Measurable variables used to track progress, performance or change over time. |
|
implementation pathway |
The processes, institutions, funding routes and operational systems through which adaptation targets are delivered in practice. |
|
learning |
The deliberate process of reflecting on monitoring and evaluation findings, and new evidence more broadly, to improve decisions, practice, design and delivery over time. |
|
mainstreaming |
Embedding adaptation targets and actions within existing planning, budgeting, regulatory and delivery systems (e.g. procurement, land-use planning, asset management). Integration increases feasibility and accountability. |
|
maladaptation |
Adaptation actions that increase risk or cost or exacerbate ineffectiveness or inequity. For example, protecting valuable assets in ways that heighten risk for neighbouring communities. |
|
milestones |
Intermediate steps or checkpoints within a longer-term adaptation pathway. Milestones help maintain momentum and enable course-correction. |
|
monitoring |
The ongoing and systematic collection of data to track whether activities are being delivered as planned and whether interim changes are occurring. |
|
Monitoring and Evaluation (M&E) |
A combined approach that links monitoring and evaluation activities to track implementation and assess effectiveness. Often used where learning processes are present but not formalised into MEL. |
|
Monitoring, Evaluation and Learning (MEL) |
A set of integrated processes that bring together monitoring, evaluation and learning to track implementation, assess results and effectiveness, and iteratively improve the design and delivery of adaptation actions. |
|
outputs |
The tangible, immediate products or services delivered by an intervention (e.g. flood maps produced, cooling centres established). |
|
outcomes |
The short- to medium-term changes resulting from the outputs (e.g. improved access to heat refuges, better-informed land-use planning). |
|
risk |
The potential for adverse consequences where something of value is at stake and the outcome is uncertain. In climate adaptation, risk is commonly understood as arising from the interaction of hazard, exposure and vulnerability. |
|
risk thresholds |
Points at which increasing climate risk signals unacceptable conditions or triggers action. For example, maximum tolerable heat levels in classrooms. |
|
targets |
Specified level of performance, threshold or outcome to be achieved, often assessed using one or more indicators. |
|
Theory of Change |
A structured explanation of how actions and investments are expected to lead to desired outcomes and impacts. A ToC clarifies assumptions and supports coherent target design. |
|
uncertainty |
The inherent difficulty in predicting climate hazards, impacts and system responses. Managing uncertainty requires adaptive pathways, scenario modelling and iterative revision. |
|
Abbreviations | |
|
CCC |
Climate Change Committee (UK) |
|
CXC |
ClimateXChange (Scotland) |
|
GGA |
Global Goal on Adaptation |
|
IPCC |
Intergovernmental Panel on Climate Change |
|
MEL |
Monitoring, Evaluation and Learning |
|
NAP |
National Adaptation Plan |
|
OECD |
Organisation for Economic Co-operation and Development |
|
SIDS |
Small Island Developing States |
|
SNAP |
Scottish National Adaptation Programme |
|
ToC |
Theory of Change |
|
UNEP |
United Nations Environment Programme |
|
UNFCCC |
United Nations Framework Convention on Climate Change |
Introduction
Context for the study
Scotland faces a rapidly changing climate, with rising temperatures, shifting precipitation patterns and more frequent extreme weather events already affecting communities, infrastructure and ecosystems. These climate change impacts are projected to intensify over the coming decades, placing growing pressure on public services, natural systems and populations. As Scotland continues to strengthen its national response, effective adaptation planning has become an essential part of long-term climate resilience.
Scotland’s climate adaptation policy is guided by the third Scottish National Adaptation Plan (SNAP3), which sets out actions to address climate change impacts from 2024 to 2029. Compared to previous plans, SNAP3 has significantly strengthened its monitoring and evaluation (M&E) framework (discussed in Section 3.5 below), introducing directional indicators, improving data quality and placing greater emphasis on understanding the link between actions and outcomes.
However, quantifiable adaptation targets have not yet been established. In its November 2023 report Adapting to Climate Change: Progress in Scotland, the UK Climate Change Committee (CCC) recommended that future adaptation plans include quantified resilience targets to provide clear benchmarks, clarify responsibility for delivery and strengthen monitoring by highlighting evidence gaps. In its response to the draft SNAP3 in April 2024, the CCC reiterated that specific and measurable targets for resilience across Scottish society would support appropriate budgeting, enable progress tracking and increase accountability for delivery.
International experience is beginning to demonstrate what effective adaptation target-setting may require. For example, Germany became the first country to introduce measurable adaptation targets in its 2024 Climate Adaptation Strategy, developed over two years through extensive engagement with ministries, stakeholders and citizens. Early reflections highlight improved inter-ministerial coordination and stronger governance links. Approaches in Kenya and Chile similarly show that aligning targets with risk and vulnerability assessments helps prioritise action and reduce social and geographical inequities. However, because national efforts to set adaptation targets are still in their early stages, detailed examples of emerging practice remain limited. The Scottish Government is therefore looking to understand what effective, workable adaptation targets could look like in practice, and how they might be developed and applied in ways that are grounded in evidence and aligned with national priorities. This forms the basis for the study.
Research aims
The Scottish Government recognises the value of quantifiable adaptation targets and is looking to learn from international practice. This includes identifying core principles for effective target setting, understanding what well-designed targets should encompass, and examining the processes through which they are developed, reviewed and evaluated. Therefore, a key aim of this study is to draw practical lessons from international approaches that can inform the process of developing measurable, context-appropriate adaptation targets for Scotland.
To achieve this the study addresses five research questions:
- Which approaches have been taken internationally in setting adaptation targets?
- What are the key challenges in setting robust, measurable and practical adaptation targets?
- What can be learned from examples where targets have been set and are being used to monitor adaptation action?
- How can adaptation targets best be monitored successfully?
- How could principles identified for setting adaptation targets be applied to Scotland’s national adaptation plans in the future?
The research explores the key enablers and challenges in developing adaption targets, including the role of government, stakeholder and citizen engagement, technical capacity and governance arrangements required to track long-term outcomes in complex, dynamic systems. It also considers how adaptation targets can be embedded within institutions in ways that support long-term learning, responsiveness and continuous improvement. By drawing on lessons from comparable jurisdictions, the research provides practical recommendations to inform the development of measurable, context-specific adaptation targets to strengthen SNAP3, shape future SNAPs and support Scotland’s ambition to show leadership in climate adaptation.
Methodology
Setting adaptation targets is complex and highly context specific. There is no single standard approach, and the processes through which targets are developed are often poorly documented. To address this challenge, we used a clear, three-phase methodology designed to generate practical insights for policy and to inform future adaptation target setting in Scotland. The research was carried out between June 2025 and April 2026 and combined three strands of evidence:
- a structured international review of literature and policy documents;
- qualitative interviews with selected jurisdictions; and
- a consensus-based process to test relevance for Scotland.
Together, these phases addressed the five research questions described in the research aims.
Phase 1: Structured review of international practice
Phase 1 established the evidence base for the study through a structured review of academic literature, grey literature and international adaptation plans. The review was guided throughout by the common enquiry framework developed for this project (Appendix B). This framework was built from the research questions, established policy-analysis methods, prior adaptation knowledge and iterative refinement with the steering group and shaped how all sources were identified, coded and analysed.
We undertook systematic searches across academic databases and key grey-literature sources, focusing on recent peer-reviewed work and high-quality reports, particularly those produced after the Paris Agreement 2015. This included research publications, assessments by international organisations and policy think-tank reports accessed through platforms such as Google Scholar. The initial search returned 84 references. Nine were excluded as not relevant, leaving 75 core sources. Each reference was logged in an Excel database and coded against the themes and sub-questions in the enquiry framework. Findings were then synthesised across 11 thematic evidence summaries.
In parallel, we conducted a structured review of national and sub-national adaptation plans and associated monitoring and evaluation (M&E) or monitoring, evaluation and learning (MEL) frameworks. Jurisdictions were selected using a multi-step sampling strategy (Appendix A) that prioritised countries with relatively mature adaptation systems and broad comparability with Scotland. We reviewed national adaptation plans from 22 countries. Because very few included explicit quantitative targets—and following discussion with the steering group—the sample was expanded to include nine sub-national jurisdictions with more developed or innovative target-setting practice.
All literature and documents were analysed using the same enquiry framework, enabling consistent assessment of key issues including the purpose of setting adaptation targets, governance and institutional arrangements, stakeholder engagement, use of evidence, resource and capacity constraints, timelines and the technical quality of targets. This structured approach provided a transparent and comparable evidence base for the analysis presented in Section 4.
Phase 2: Interviews with selected jurisdictions
To complement the evidence from the document and literature reviews, we carried out semi-structured interviews with policymakers and technical experts from seven jurisdictions (four national and three sub-national jurisdictions) that had developed, were developing, or demonstrated an innovative approach to adaptation targets. Short case summaries of these jurisdictions are provided in Appendix E.
Interviews lasted 45–60 minutes and followed a topic guide based on the enquiry framework (Appendix C), ensuring consistency while allowing exploration of context-specific issues. Interview data were analysed thematically and compared with findings from Phase 1. The findings from this integrated analysis are presented in Section 4.
Phase 3: Assessing relevance for Scotland
Phase 3 examined how the international lessons identified in Phases 1 and 2 could be applied in Scotland. To do this, we used a modified Delphi process. This is a structured, iterative method designed to gather informed judgement from people with relevant experience, particularly in areas where evidence is incomplete and decisions involve interpretation, trade-offs and practical considerations. It is designed to identify both areas of convergence and areas where views legitimately diverge, without aiming for unanimity or forcing consensus. The approach is well suited to adaptation target-setting, where uncertainty is inherent, evidence alone cannot provide definitive answers and operational feasibility needs to be understood from those working within the system. Participants respond independently and anonymously, reducing the influence of hierarchy or dominant voices. Views are gathered over successive rounds with controlled feedback, to allow for reflection and refinement.
We adapted this approach to the Scottish context, inviting a diverse panel of experts, primarily from within Scottish Government, with practical, policy and system-level experience identified by ClimateXChange and the steering group. An initial online survey was sent to approximately 30 stakeholders and produced eleven responses. The findings from this first round informed the design of a second survey, which focused on areas of uncertainty and divergence particularly relating to feasibility, fit and practical application. The second survey was sent to the same group and received thirteen responses. This level of participation is appropriate for a Delphi-style process, where the strength of the method lies in the quality and relevance of expert insight rather than in achieving a statistically representative sample. Insights from both stages informed the Scotland-focused analysis in Section 5 and the policy implications in Section 6.
Limitations of the study
We drew on structured and transparent research procedures across all three phases of the study. However, given the breadth of the research questions, the volume and variability of potentially relevant material and the time available, this work does not constitute a comprehensive or systematic assessment of all adaptation target-setting practice internationally. As a result, it remains possible that some relevant approaches or evidence were not captured through our search and review procedures. The international review focused on English-language and publicly accessible documents, and although we sought to prioritise jurisdictions broadly comparable to Scotland, findings inevitably draw on material produced in a range of institutional and geographic contexts. While this was appropriate for the aims of the research, some of the practices identified may not be fully transferable to the Scottish context. Documentation quality also varied considerably across jurisdictions, which limited the depth of analysis possible in some cases.
The qualitative evidence base was necessarily limited in scope. Interviews were conducted with a small number of selected policymakers and technical experts available during the interview period and findings therefore reflect the perspectives of those individuals rather than the full range of institutional or stakeholder views. Similarly, the modified Delphi process was deliberately expert focused in order to elicit informed judgement on issues where evidence is incomplete. However, this means that citizen and community perspectives were not included at this stage.
The modified Delphi process also has methodological limitations. Delphi approaches are not designed to be statistically representative; their purpose is to gather informed judgement from experts rather than to produce results that reflect a wider population. For this reason, the smaller number of responses in each round does not undermine the validity of the method. However, it does mean that the findings reflect the perspectives of those experts who took part, rather than capturing the full range of views across the wider system. This should be kept in mind when interpreting areas of agreement or divergence.
Integration of findings across the three phases required researcher interpretation, although this was mitigated through the use of a common analytical framework, triangulation across data sources and iterative engagement with the steering group. As the research was conducted within a defined timeframe, the findings should be understood as a snapshot of practice in a rapidly evolving policy area.
The SNAP3 Monitoring, Evaluation and Learning (MEL) system
Scotland’s third Climate Change Adaptation Programme (SNAP3) is supported by a Monitoring and Evaluation (M&E) framework designed to assess progress in building climate resilience across four themes: nature, communities, public services, and economy and industry. The framework provides a structured way of linking the Plan’s activities and delivery mechanisms to short-, medium- and long-term changes in resilience. The SNAP3 M&E framework was published in September 2024 by the Scottish Government. It is notable that a report on monitoring outcomes of SNAP3 using indicators representing the four themes, published by ClimateXChange in August 2024, widens this scope by discussing monitoring, evaluation, and learning (MEL) of SNAP3. In this report, we will refer to MEL, except where referring specifically to the published SNAP3 M&E framework. This approach reflects the relevance of learning to target setting, particularly in relation to the updating of targets in the light of evolving and uncertain risks and new information.
Structure of the SNAP3 M&E framework
SNAP3 is organised around five core elements: the strategic aim, outcomes, objectives, enablers and activities. These elements form the basis of the monitoring maps used in the SNAP3 M&E framework, which illustrate how actions are expected to create enabling conditions, deliver objectives and contribute to outcomes over time. The M&E framework is then structured around these monitoring maps and incorporates: (i) five-yearly outcome-level indicators linked to the four themes; (ii) annual objective-level indicators that track nearer-term progress; and (iii) policy evaluation and learning components that support improvement over successive cycles.
The five elements of SNAP3 can be summarised as follows, with brief examples to illustrate the distinction between levels:
- Strategic aim: the overarching ambition of SNAP3—to build Scotland’s resilience to climate change aligned with national outcomes.
- Outcomes: the long-term changes SNAP3 intends to achieve within each theme (one per theme, each split into 2–4 areas) e.g. under Communities: ‘Communities are prepared for and adapt to climate change impacts.’
- Objectives: what policy actions are expected to achieve during the Plan period (3–6 per theme) e.g. under Public Services: ‘Strengthen climate risk management across health and social care systems.’
- Enablers: the conditions and capacities that must be in place for objectives and outcomes to be achieved—such as resources, governance arrangements and system capabilities (21–30 per theme, grouped into 6–7 areas) e.g. ‘Improved availability of climate risk data and guidance for local authorities.’
- Activities: the delivery actions and mechanisms set out in SNAP3 that are intended to create enabling conditions and deliver the objectives (12–21 per theme, grouped into 4–6 areas) e.g. ‘Provide flood risk management training for local planners’ or ‘Update sectoral guidance to reflect new climate projections.’
Together, these elements structure the SNAP3 monitoring maps and provide the architecture for tracking progress through outcome indicators, objective indicators, evaluation processes and learning mechanisms.
Positioning targets in the SNAP3 M&E framework
Adaptation MEL frameworks often distinguish between outputs, outcomes and impacts, as defined by OECD (2023). This three-tier model provides a useful way of understanding the different levels at which adaptation targets could be developed in future national plans.
Outputs reflect the immediate deliverables of adaptation activities — for example, kilometres of drainage upgraded, numbers of properties retrofitted, or guidance documents produced.
Outcomes capture changes in capacities, behaviours or system characteristics that contribute to resilience — for example, increased public awareness of climate risks, improved ecological condition, or greater uptake of adaptive land-use practices.
Impacts relate to long-term reductions in climate-related harm, losses and damages, or improvements in climate-sensitive wellbeing — for example, reductions in heat-related illness, fewer properties experiencing repeat flood damage, or lower financial losses associated with extreme events.
All the outcome indicators defined in the SNAP3 M&E framework align with outcome-level indicators in this model. The objective indicators in SNAP3 represent a mixture of output- and outcome-level metrics. For example, indicators tracking public awareness, ecosystem condition, or the adoption of resilience-enhancing practices function as outcome-level indicators because they reflect changes that contribute to long-term resilience and are influenced by the outputs delivered under SNAP3. These types of indicators are essentially predictive, in that they relate to system characteristics that should, in principle, enable populations and services to withstand, recover from and adapt to climate hazards.
SNAP3 does not currently define impact-level indicators. However, some existing monitoring data relevant to climate risks, for example information on properties affected by flooding, heat-related health impacts, or economic losses from severe weather, illustrate the types of evidence that could inform future impact-level indicators framed around reductions in, or avoided, losses and damages over time. Indicators that track actual losses can provide evidence of whether improvements observed at the outcome level translate into reductions in climate-related harm. Considering the MEL system in this way helps identify where different types of targets might be positioned in future adaptation plans, including the potential for longer-term targets related to reducing measurable losses and damages. This framing is intended to support thinking for SNAP4 and subsequent plans, recognising that future iterations are likely to retain a broadly similar outcome–objective structure but should not be constrained by the architecture of SNAP3.
Implications for adaptation target setting
The current SNAP3 M&E framework already includes numerous quantitative indicators that could support the development of adaptation targets or milestones. A subset of objective indicators could underpin targets related to the delivery of specific outputs or initial changes necessary during the Plan period. Outcome indicators could support targets linked to more substantive improvements in resilience. This could include for example, increases in access to key services, adoption of adaptive management practices, or agreed tolerances for specific climate hazards.
There is also scope to introduce impact-level indicators and targets to assess longer-term adaptation performance, particularly where reduced losses, damages or harm would signal progress towards SNAP3’s strategic aim of Scotland having increased resilience to the impacts of climate change. Because climate risks will evolve, such impact-level targets may be most useful as benchmarks for learning and policy refinement rather than fixed commitments. Where targets are based on avoided losses or damages, baselines or no-adaptation counterfactuals would need to be established using emerging methodological approaches.
Theories of change that link outputs, outcomes and impacts, and that reflect the monitoring maps in the SNAP3 M&E framework, might be used to refine and update targets. For example, where desired reductions in losses and damages are not being achieved, a theory of change might be used to interrogate assumptions about the pathways via which outcomes that are assumed to enhance resilience at the outcome level translate into reduced losses and damages at the impact level. A better understanding of these pathways might result in revisions to targets associated with resilience indicators at the outcome level, for example where the importance of certain ‘resilience capacities’ is found to have been over- or under-estimated.
A more detailed analysis of the SNAP3 M&E framework in relation to target setting is provided at the end of this report (Appendix D). This analysis informed the design of Phase 3 (the modified Delphi exercise), helping shape questions about how adaptation targets might best be framed and structured within the SNAP3 system.
Report structure
The report is structured around the study’s five research questions.
Section 4 addresses Research Questions 1–4 by presenting findings from the international literature review, document analysis and interviews. It examines how adaptation targets are currently defined, governed, supported, delivered and integrated in national and sub-national contexts.
Section 5 addresses Research Question 5, applying the international lessons to Scotland and drawing on insights from the modified Delphi process to assess what forms of adaptation targets may be feasible, appropriate and useful within the Scottish policy system.
Section 6 provides the overall conclusions of the study and outlines the policy implications for future development of adaptation targets in Scotland.
Findings from the literature, document review and interviews
Introduction
Adaptation targets are shaped by a wide range of technical, institutional and political factors. To understand how effective target systems are developed, this chapter synthesises evidence from three sources: (i) the international academic and grey literature, (ii) the review of national, sub-national and sectoral adaptation frameworks, and (iii) interviews with policymakers, practitioners and experts. Together, these sources address Research Questions 1–4 by examining how adaptation targets are defined, governed, supported and implemented across different jurisdictions.
The chapter begins with a review of current practice in selected jurisdictions (Section 4.2), summarising how national, sub-national and sectoral governments are currently using quantified, time-bound and directional targets in their adaptation strategies. This overview draws on the synthesis of evidence from both the literature and document review and the interview findings. It is presented at the start of the chapter because it offers a concise picture of the existing landscape of adaptation target-setting, which helps contextualise and orient the more detailed thematic analysis that follows. For clarity and coherence, the remainder of the chapter is divided into two parts.
Part A presents findings from the literature and document review, outlining the characteristics of high-quality targets and the governance, capacity and integration conditions that support credible and deliverable target systems.
Part B summarises insights from stakeholder interviews, highlighting how jurisdictions interpret and navigate the practical realities of designing, negotiating, implementing and revising adaptation targets in practice.
Current practice in selected jurisdictions
A review of adaptation plans from 22 national and nine subnational jurisdictions found that explicit, quantified and time-bound adaptation targets remain relatively uncommon at national level. Eight of the 22 national jurisdictions reviewed included at least some quantified, time-bound targets, although their scope, level and governance function varied considerably. In some cases, a single quantified target was embedded within a broader framework of largely directional objectives. In others, multiple quantified targets were adopted and framed as part of an iterative process of refinement. Only a small number of jurisdictions developed more comprehensive approaches that spanned multiple sectors and levels. Among the nine subnational jurisdictions reviewed, three articulated at least some quantitative, time-bound adaptation targets. Adaptation targets have largely been developed though experimentation, selective quantification and incremental refinement. Table 2 summarises the eight national jurisdictions and three subnational jurisdictions identified as having at least some quantified, time-bound adaptation targets. Semi-structured interviews were conducted with policymakers and technical experts from seven jurisdictions (four national and three sub-national) that had developed, were developing, or demonstrated innovative approaches to adaptation targets. Short case summaries of these jurisdictions are provided in Appendix E.
Emerging patterns in target design
Several broad patterns emerge from the international review. First, quantified targets are most commonly found at the output level. These typically relate to implementation milestones, infrastructure delivery, restoration areas (e.g. hectares restored), or institutional and capacity-building actions. Such targets are generally easier to measure and tend to fall within clearer administrative control. As a result, quantification is most common where delivery levers are established and data systems are mature.
Second, a smaller group of jurisdictions have begun to articulate outcome-level targets focused on the conditions and capacities that contribute to resilience and reduce risk, such as improved preparedness and reduced exposure. These targets attempt to define what success looks like in terms of vulnerability or risk reduction. However, they are more methodologically complex and often influenced by external variables, including climatic variability and demographic change.
Third, explicitly framed impact-level targets, defined as quantified reductions in realised climate-related losses, damages or residual risk, remain rare. When included, they tend to take the form of long-term and aspirational goals that signal the desired direction of travel, rather than targets linked to clearly defined pathways or accountability mechanisms. Interviewees and document analysis suggest that attribution challenges, shifting climate baselines and political caution limit the adoption of quantified impact targets where delivery pathways are uncertain.
At subnational scale, cities were more likely than national governments to adopt spatially explicit or hazard-specific quantified targets, such as urban heat reduction or green infrastructure coverage. This may reflect more direct control over land-use planning and infrastructure delivery. However, even at city level, quantified targets tend to focus on outputs rather than demonstrable reductions in risk exposure. While Table 2 illustrates how jurisdictions structure adaptation targets, document review alone cannot fully explain how these targets function within governance systems in practice. These issues are explored further through the interview evidence presented later in this section.
How adaptation targets are embedded in governance systems
Interview findings show that adaptation frameworks often combine numeric, directional and indicator-based targets within the same system. Interviews examined how these different forms are used, what governance roles they serve, and what strengths and limitations have emerged in implementation. Table 1 presents examples drawn from interviewed jurisdictions to show how adaptation targets serve different governance functions depending on what they are intended to influence. Some focus on institutional capacity and integration, others on delivery of measures, others on the conditions and capacities that contribute to resilience and reduce risk (such as improved preparedness and reduced exposure), and a small number on reductions in realised losses.
Table : Observed Governance Functions of Adaptation Targets Across Jurisdictions
|
Target type |
What they do |
Example |
Observations from the review |
|
Input and capacity |
Input or capacity targets focus on embedding climate risk within institutional systems and decision-making processes. |
Percentage of organisations integrating climate risk into planning. |
Interviewees described such targets as important for mainstreaming adaptation and reducing reliance on isolated initiatives. They are often within direct administrative control and can be reported consistently across sectors. However, they primarily track institutional behaviour rather than changes in exposure or vulnerability and, on their own, do not demonstrate whether resilience conditions are improving. |
|
Output |
Output targets focus on the delivery of tangible adaptation measures. |
Kilometres of drainage infrastructure upgraded or numbers of retrofits completed. |
These targets are frequently quantified, linked to budgets and implementation programmes, and are easily understood by stakeholders. They provide clear evidence of activity and enable transparent reporting of progress. However, they do not show whether vulnerability or risk exposure is declining. Approaches dominated by output targets therefore demonstrate activity without clear evidence of reduced vulnerability. |
|
Outcome |
Outcome targets capture changes in vulnerability, exposure, preparedness or acceptable levels of risk. |
Reducing the proportion of properties at high flood risk or establishing probabilistic flood protection standards. |
These targets clarify what resilience means in practical terms and link policy action to changes in risk conditions. Where modelling capacity and governance frameworks are well established, outcome-level or risk tolerance standards can provide stable benchmarks for long-term planning. However, because they are influenced by many external factors including climate variability and socio-economic changes, it can be difficult to attribute observed changes to specific interventions. |
|
Impact |
Impact targets aim to reduce climate-related harm, losses or damages. |
Eliminating heat-related deaths. |
Such targets articulate the ultimate purpose of adaptation policy and send a clear signal of long-term ambition. However, avoided losses are difficult to measure because they depend on estimating what would have happened in the absence of adaptation, and outcomes may also be influenced by external factors such as climate variability and socio-economic change. In addition, delivery pathways are often uncertain, meaning that impact-level targets are rarely embedded within formal monitoring frameworks. |
Table . How Selected Jurisdictions Structure Adaptation Targets
|
Jurisdiction (Instrument)[1] |
Target-Setting Approach |
Extent of Quantification[2] |
Dominant Target Type |
Legal / Institutional Status |
Implications for Target Design |
|
Canada |
Structured around five interconnected systems (e.g. disaster resilience, health and well-being, nature and biodiversity, infrastructure, economy and workers), alongside cross-cutting foundational themes (knowledge, tools and governance), with system-level goals, medium-term objectives, key milestones and near-term targets aligned to objectives, including instances where multiple targets relate to a single objective. |
Extensive |
Output and emerging outcome |
National strategy with defined monitoring framework |
Demonstrates how quantified targets can be layered across interconnected systems and aligned with strategic objectives |
|
Chile |
Sectoral adaptation plans including specific time-bound “goals,” some functioning as quantified targets within broader directional objectives. |
Moderate |
Primarily output |
Sectoral plans under national adaptation framework |
Illustrates incremental quantification within sectoral planning even where the overarching strategy remains largely directional |
|
Germany |
33 targets and 45 sub-targets to 2030 and 2050; targets required to be “measurable,” which may include numeric or directional formulations. |
Moderate |
Output with emerging outcome elements |
First German strategy to establish measurable adaptation targets under federal framework |
Shows how legal requirements for measurability can support structured target-setting while allowing flexibility in format |
|
Japan (Climate Change Adaptation Plan, 2021) |
Sectoral and cross-cutting adaptation measures accompanied by KPIs and monitoring indicators across multiple domains. |
Extensive |
Predominantly output |
National adaptation plan with structured KPI-based monitoring |
Demonstrates mainstreaming of adaptation through sectoral performance indicators rather than standalone quantified risk standards |
|
Kenya |
Eight priority sectors broken down into actions with quantified “expected results” aligned to planning cycle. |
Moderate |
Output with emerging outcome elements |
Time-bound national action plan |
Illustrates integration of quantified targets within short- to medium-term planning and development priorities |
|
Netherlands |
Quantification concentrated in the water domain, notably through clearly defined probabilistic flood protection standards (e.g. 1:100,000 annual exceedance probability), while the broader national adaptation strategy includes comparatively fewer quantified, time-bound targets across sectors. |
Limited |
Outcome (risk tolerance standard) |
Flood protection standards legally embedded within the Delta Programme; broader strategy primarily strategic in orientation |
Illustrates how quantified risk standards may be well developed in technically mature domains, while broader cross-sector quantification can evolve more gradually. |
|
South Korea |
Sectoral adaptation measures accompanied by quantified elements; consistency across sectors varies. |
Moderate |
Primarily output |
National adaptation plan |
Reflects use of quantified elements within sectoral planning; cross-sector comparability depends on interpretation and implementation |
|
Rwanda |
Multiple quantified adaptation-related targets across sectors integrated within NDC and development planning processes. |
Extensive |
Predominantly output |
Embedded within NDC and national planning instruments |
Demonstrates alignment of adaptation targets with broader climate and development commitments |
|
Barcelona |
Spatially explicit and time-bound municipal targets (e.g. per capita water consumption reduction; urban greening expansion). |
Moderate |
Output and emerging outcome |
Municipal climate strategy |
Illustrates place-based target setting where cities have direct control over infrastructure and service delivery levers |
|
Lisbon (Metropolitan Plan for Adaptation to Climate Change, PMAAC-AML) |
Quantifiable urban adaptation measures focused on greening, water efficiency and public space adaptation. |
Moderate |
Output |
Metropolitan adaptation plan |
Shows how quantified targets can support visible implementation and public communication in urban contexts |
|
Paris |
Adaptation-relevant quantified targets embedded within broader climate action plan including multiple sectoral actions. |
Moderate |
Predominantly output |
Municipal climate action plan |
Demonstrates integration of adaptation-related targets within wider climate strategies, though adaptation and mitigation targets are not always clearly distinguished |
Table 2 provides illustrative examples of how different target types operate in selected jurisdictions and is not intended to be exhaustive.
Evidence from the literature and document review
Characteristics of high-quality adaptation targets
Across the literature and international document review, a consistent conclusion emerges: the quality of adaptation targets depends on clarity of intent, structure and measurability. Well-designed targets specify the risk addressed, the population or system concerned, the geographic scope, and the intended change over time (Magnan, 2016; Leiter et al., 2019). They distinguish between different types of targets and identify indicators (Berrang-Ford et al., 2019; UNEP, 2022), embed review mechanisms (Leiter et al., 2019; UNEP, 2022) and incorporate safeguards against maladaptation (UNEP, 2022; OECD, 2023). Where these elements are absent, targets risk becoming vague, symbolic or difficult to evaluate. This section synthesises the core characteristics of high-quality adaptation targets identified in the literature and observed in practice.
Defining target types improves clarity
Adaptation targets generally fall into four categories: process, output, outcome and impact (Berrang-Ford et al., 2019; UNEP, 2022). Process targets relate to institutional steps, outputs to actions delivered, outcomes to measurable changes in vulnerability or system performance, and impacts to reductions in climate-related loss or harm. These categories differ in measurability, attribution and time horizon. In practice, frameworks often blur these distinctions. Activities such as publishing plans or launching programmes may be reported as adaptation progress without clear evidence of risk reduction (Buntaine et al., 2017; Dzebo, 2019; Canosa et al., 2020). Distinguishing short-term process milestones from longer-term outcome and impact targets helps prevent administrative activity from being conflated with substantive adaptation (Magnan, 2016; UNEP, 2022).
Many jurisdictions therefore adopt layered structures in which near-term process and output targets support delivery, while outcome and impact targets provide strategic direction. Canada’s National Adaptation Strategy and Japan’s Climate Change Adaptation Plan illustrate how measurable near-term commitments can be aligned with longer-term objectives (UNEP, 2022; OECD, 2023).
High-quality targets define hazard, exposure, location and intended change
High-quality targets make the “unit of success” explicit. Generic formulations such as “increase resilience” lack the specificity required for implementation or evaluation (Magnan, 2016). Clear targets identify the hazard, the exposed people or assets, the relevant system or location, and the measurable change sought over a defined timeframe (Magnan, 2016; Berrang-Ford et al., 2019; Adaptation Scotland, 2022). For example, the Netherlands’ statutory flood protection standard requires that by 2050 every resident behind a primary flood defence faces an annual individual mortality risk from flooding of no more than 1 in 100,000. This specifies the hazard, the protected population, the infrastructure system and a quantified risk threshold within a defined timeframe, providing a concrete benchmark for engineering standards and investment decisions.
Where strong technical evidence exists, targets tend to be similarly precise. Belize’s mangrove restoration commitments specify hectares to be protected or restored by a defined year (Arkema et al., 2023). Other examples include hazard-specific ecological thresholds (Matthews et al., 2014; Bino et al., 2021), spatially bounded restoration targets (Goyette et al., 2023) and sectoral performance outcomes (Judd et al., 2022). Specificity strengthens clarity, monitoring, and integration into delivery systems.
Adaptive, revisable targets perform better under climate uncertainty
Static targets risk becoming misaligned as climate risks evolve. The literature emphasises designing targets that can be revised as evidence and policy priorities change (Hallegatte, 2009; Wise et al., 2014). Adaptive pathways approaches frame targets as part of staged decision processes rather than fixed end points. They incorporate thresholds signalling when existing measures become insufficient, triggers for alternative actions, and scheduled review cycles to reassess risk and performance (Haasnoot et al., 2013). Embedding review and revision into target design should therefore be understood as good governance rather than policy failure, supporting long-term resilience and learning (Hallegatte 2009; Biesbroek et al., 2018; UNEP, 2024).
Measurement systems should be defined at adoption
Target clarity depends on measurability. A consistent principle is that targets should be accompanied by a defined measurement plan specifying baselines, indicators, data sources, institutional responsibilities and reporting cycles (Leiter et al., 2019; UNEP, 2020; Essex et al., 2020). Many jurisdictions adopt targets before indicators or baselines are fully established, deferring measurement to later cycles and weakening accountability (UNEP, 2022; Mongelli et al., 2024). Strengthening monitoring and data systems is therefore fundamental to credible target-setting (UNEP, 2022; World Bank, 2023).
Tiered indicator systems, structured around a theory of change, improve coherence and link actions to impacts
Outcome indicators provide forward-looking evidence of improvements in vulnerability or system performance, while impact indicators capture reductions in loss or harm. Because outcome data mature slowly and attribution is complex, many jurisdictions rely initially on process and output indicators, even though these do not demonstrate risk reduction on their own (Berrang-Ford et al., 2019). Recent guidance and reviews encourage tiered systems that link process, output, outcome and (where possible) impact metrics along a coherent results chain (UNEP, 2022; OECD, 2023). In such systems, outputs represent actions delivered, outcomes reflect measurable changes in exposure or vulnerability, and impacts capture ultimate reductions in harm. Making these causal links explicit prevents delivery indicators from substituting for substantive progress and clarifies how near-term actions contribute to long-term resilience (Magnan, 2016). For example, an urban heat strategy might link tree planting outputs to increased canopy cover outcomes and, ultimately, to reductions in heat-related mortality. Although multiple interventions typically contribute to impact reduction and attribution is rarely linear, articulating these pathways improves coherence and review (Hallegatte, 2009; Wise et al., 2014; Watkiss and Hunt, 2019).
Embedding equity into target design strengthens distributive accountability
Equity is widely recognised as central to adaptation (Eriksen et al., 2015; Dilling et al., 2019; Biesbroek et al., 2025). Adaptation targets are inherently distributive, shaping whose risks are reduced and who benefits first. Yet equity is often expressed as principle rather than measurable commitment. High-quality targets identify intended beneficiaries and require that progress be tracked through disaggregated indicators across relevant dimensions of vulnerability (Ziervogel and Taylor, 2008; Adaptation Scotland, 2022).
Although equity is rarely framed as a standalone quantified target, some jurisdictions operationalise it through disaggregated monitoring, spatial prioritisation or beneficiary-specific commitments. For example, Canada’s National Adaptation Strategy tracks climate-related health outcomes across defined vulnerable populations, while several European cities prioritise adaptation investment in socially vulnerable neighbourhoods (Reckien et al., 2018; EEA, 2015). Belize’s mangrove targets are framed in relation to protecting coastal communities and livelihoods (Arkema et al., 2023). Where clearly specified, such mechanisms strengthen accountability by clarifying intended beneficiaries and preventing aggregate improvements from obscuring persistent inequalities.
Safeguards are needed to prevent maladaptation
Poorly designed targets can shift risks across sectors, locations or social groups (Magnan, 2016; UNEP, 2022). Targets framed narrowly around visible outputs, such as hectares restored or flood defences constructed, may generate ecological pressures or downstream impacts if system interactions are not assessed. In such cases, adaptation can redistribute risk rather than reduce it. The literature therefore emphasises integrating maladaptation screening and cross-sector assessment into target design rather than treating these as afterthoughts (OECD, 2023). This is particularly important where land use, water management and infrastructure systems interact closely. Ensuring that targets deliver net resilience gains and avoid locking in future vulnerabilities is central to long-term effectiveness (Bino et al., 2021; OECD, 2023).
Governance, decision-making and institutions
Adaptation target-setting is shaped not only by technical considerations but also by governance structures, institutional capacity and political incentives. The literature consistently shows that targets operate as political-administrative tools serving multiple functions: signalling ambition, guiding delivery, supporting learning and structuring accountability.
Targets serve multiple institutional and political purposes.
The literature shows that adaptation targets are often designed to perform several roles simultaneously, rather than fulfilling one primary purpose. For example:
Agenda-setting. Targets often use broad or aspirational language to raise the visibility of adaptation, communicate political commitment and align with international expectations—even when operational detail remains limited (Magnan 2016; UNEP 2020, 2022, 2024; Buntaine et al. 2017).
Guiding institutional effort. Targets help structure planning, justify budget allocations, and prioritise sectors or measures (Berrang-Ford et al. 2019). Documentary evidence from Canada and Japan emphasises that indicators and measurement frameworks are essential for steering investment and monitoring delivery (UNEP 2022; OECD 2023).
Accountability benchmarks. Even when non-binding, targets create reference points for public, parliamentary or peer scrutiny. However, the literature documents widespread weaknesses in baselines, indicators and monitoring systems, which often make accountability symbolic rather than enforceable (Buntaine et al. 2017; Dzebo 2019; EEA 2015).
Engagement and shared responsibility Adaptation targets can help communicate urgency and engage citizens, businesses and institutions (Magnan 2016). National adaptation strategies—for example in Japan—explicitly use KPIs and indicators to embed adaptation across administrative levels and to promote public recognition (Japan Climate Adaptation Plan, 2021).
International alignment and legitimacy. Targets also help countries signal their alignment with global processes such as UNFCCC reporting, NDC commitments and regional frameworks (Biagini et al. 2014; England et al. 2018; UNEP 2022). This alignment role can encourage the use of broad, aspirational statements rather than operationally specific targets.
Governance typically follows a central coordination–distributed ownership model
The literature identifies a dominant governance pattern in which central government provides coordination and strategic direction, while sectoral ministries and subnational authorities design and deliver operational targets. This arrangement balances cross-government coherence with the flexibility needed for sector-specific and place-based implementation.
Central government as coordinator: National environment or climate ministries most commonly lead the development of adaptation targets and UNFCCC reporting (Berrang-Ford et al. 2014, 2019). In practice, they convene cross-government actors, align priorities and embed adaptation targets within national strategies and regulatory frameworks.
Inter-ministerial coordination is essential but variable: Because adaptation spans multiple policy areas, coordination bodies, such as climate secretariats and inter-ministerial committees, are mentioned as important for coherence (England et al. 2018). Their role is primarily to facilitate across sectors, resolve competing priorities and translate high-level objectives into measurable targets. Zambia’s Interim Climate Change Secretariat uses this approach to align agriculture, water and environment ministries around shared goals (England et al. 2018).
Finance ministries are essential enablers: A recurring finding is that without the involvement of finance ministries, adaptation targets remain underfunded and weakly implemented (Arkema et al. 2023; OECD 2023; UNEP 2022). Sectoral cases such as Belize show how evidence-based targets can be aligned with national development and finance structures (Arkema et al. 2023). Embedding adaptation in budgetary processes e.g. through expenditure tracking, multi-year financing plans or integration into routine budgeting, significantly improves deliverability. The literature notes emerging examples where adaptation spending is linked to national development budgets or public financial management reforms, for example Belize’s integration of adaptation targets into its Nationally Determined Contribution (NDC) and associated finance structures, though most reviews conclude that systematic budget integration is still limited and uneven.
Independent advisory bodies strengthen transparency: Although they cannot enforce compliance, climate change committees, audit institutions and scientific advisory bodies enhance transparency by monitoring progress, assessing evidence and advising governments (Arkema et al. 2023; Berrang-Ford et al. 2019). Their presence can reinforce the credibility of centrally coordinated processes.
Sectoral and subnational actors develop and deliver operational targets: More specific and measurable targets often emerge at sectoral or local levels, where governance structures and technical capacity support detailed implementation. Examples include environmental flows in water management (Bino et al. 2021; Judd et al. 2022), wetland and habitat restoration (Goyette et al. 2023), and urban and regional adaptation planning (Reckien et al. 2018). These cases demonstrate how distributed ownership enables targets to reflect local risks, regulatory responsibilities and operational capacities, while remaining aligned with a central coordination framework.
Accountability is often indirect and non-binding
Across the literature, accountability for adaptation targets is generally weak, operating through political and procedural channels rather than legal or enforceable mechanisms. Most targets are embedded in policy frameworks rather than legislation, meaning governments face no formal penalties for underperformance (Berrang-Ford et al. 2019). As a result, accountability relies heavily on internal reporting, periodic strategy updates and peer scrutiny within government rather than external assessment (EEA 2015). This is particularly the case where adaptation strategies rely on directional policy commitments or recommended actions rather than quantified targets. Austria’s national adaptation strategy provides one example. The strategy sets out sectoral objectives and recommended actions across government rather than binding performance benchmarks, with implementation coordinated across ministries and federal states and reviewed through periodic progress reporting. While this approach supports coordination and shared ownership, it offers limited mechanisms for corrective action if progress is insufficient. Independent oversight bodies such as climate change committees, audit institutions and scientific advisory panels can strengthen transparency by tracking progress and advising governments (Arkema et al. 2023; Berrang-Ford et al. 2019), but their role is advisory and they cannot compel revisions to targets or reallocation of resources. Some countries do have more structured oversight architectures, for example, Canada combines interdepartmental reporting, scrutiny by the Auditor General and oversight from the Commissioner for Environment and Sustainable Development, yet even these mechanisms stop short of creating legally enforceable obligations.
A recurring finding is that meaningful accountability depends on the availability of clear indicators, baselines and monitoring, evaluation and learning (MEL) systems. Where these measurement systems are incomplete or disconnected from target-setting, it becomes difficult to assess progress, ensure comparability or initiate revisions (Bino et al. 2021; Ford et al. 2013; UNEP 2022). Without robust indicators and MEL frameworks, accountability remains largely symbolic because there is no consistent basis for evaluating performance or signalling when targets require adjustment.
Adaptation targets are political constructs shaped by feasibility and institutional constraints
The literature shows that adaptation targets are shaped less by what would most effectively reduce climate risk and more by what is politically, financially and institutionally viable. Several issues recur in how targets are designed. Short political cycles create strong incentives for visible, near-term outputs, making measurable actions more attractive than longer-term or transformational investments (Geden 2016; Hallegatte 2009; Zhang et al. 2023). Standardised or symbolic indicators such as plans produced or hectares restored, are often chosen because they are easier to implement and compare, even when they align only loosely with ecological thresholds or system dynamics (Bino et al. 2021; Goyette et al. 2023; Ford et al. 2013).
Budgetary constraints also limit ambition as targets usually need to fit within existing budgets, fragmented funding streams and limited administrative capacity, which encourages incremental approaches rather than more substantial or transformational shifts (UNEP 2020, 2022, 2024; OECD 2023). Data availability also influences target design. What can be measured is often prioritised, and in data-poor contexts targets tend to default to process indicators rather than vulnerability-reduction outcomes (Leiter et al. 2019; Berrang-Ford et al. 2019).
Equity and justice are widely acknowledged but rarely embedded in target design
Although Section 4.3 highlighted the importance of embedding equity within the design of adaptation targets, the literature shows that only a limited number of adaptation frameworks operationalise equity directly within target systems. Across the literature, equity is frequently cited as a core principle in adaptation planning, yet in practice it is more often addressed through consultation processes, participation mechanisms or high-level principles rather than through measurable or enforceable commitments (Magnan 2016; Dilling et al. 2019; Biesbroek et al. 2025). As a result, distributional accountability remains limited and the intended beneficiaries of adaptation measures are often left unspecified. Some national strategies reference equity through methodological guidance, for example by encouraging vulnerability assessments and distributional considerations in countries such as Bangladesh, as well as through wider international guidance promoting social and vulnerability-based criteria when selecting measures. These tools influence how targets are developed but typically stop short of generating explicit equity-focused targets or disaggregated indicators.
The literature also shows that technocratic, indicator-driven approaches to adaptation can inadvertently marginalise lived experience and Indigenous knowledge. Studies of ecosystem and land-use indicators demonstrate that standardised metrics, such as hectares restored or protected, often overlook Indigenous land management practices and locally defined wellbeing outcomes, privileging what is easy to quantify over what communities value (Ford et al. 2013; Bino et al. 2021; Eriksen et al. 2015). Similar issues arise in urban adaptation research, where vulnerability metrics based largely on available administrative data can exclude informal settlements or undocumented populations, thereby underrepresenting those who are most at risk (Reckien et al. 2018).
Stakeholder Engagement
Stakeholder engagement is broad but influence over target design remains concentrated
Across the literature, stakeholder engagement in adaptation target-setting is described as broad in scope but uneven in influence. Environment or climate ministries typically lead and coordinate these processes, supported by expert groups responsible for modelling, indicator development and technical assessment (Judd et al. 2022; Arkema et al. 2023; Matthews et al. 2014). Other participants commonly include scientific institutions, sectoral agencies such as water or forestry authorities, non-governmental organisations and, in some cases, private-sector actors involved in infrastructure delivery or risk management.
Although these processes often include civil society organisations and community groups, studies highlight that decision-making authority over target ambition, metrics and thresholds largely remains with government and technical experts (Magnan 2016; Eriksen et al. 2015; Canosa et al. 2020; Biesbroek and Delaney 2020). Consistent with this, Ziervogel and Taylor (2008) show that participation frequently informs agenda-setting or problem framing but rarely shifts the underlying power dynamics that determine formal decision authority. As a result, pathways from participation to decision rights are typically weak, and engagement tends to focus on shaping priorities rather than influencing the technical specification of targets.
Engagement improves relevance, legitimacy and feasibility even when formal influence is limited
Despite these limitations, the literature emphasises significant benefits associated with well-structured stakeholder and community level engagement. Participatory processes can improve the relevance of targets by surfacing granular insights into local vulnerabilities, lived experience and sector-specific constraints (Dilling et al. 2019; Leiter et al. 2019). Ziervogel and Taylor (2008) similarly highlight how community knowledge can illuminate risk dynamics that formal assessments overlook, particularly in contexts where administrative data is limited or uneven.
Citizen engagement also enhances legitimacy, especially where affected communities understand how decisions were made and how their input shaped the process. These legitimacy effects can strengthen public support and reduce resistance during implementation. Moreover, wider engagement can help refine feasibility assessments, identify implementation barriers early, and highlight where quantitative targets may conflict with social or distributional priorities. Even when technical parameters remain expert-defined, wider engagement, including citizen engagement, contributes to a more grounded and socially informed design process.
Trade-offs are handled most effectively when engagement is deliberative and co-productive
The literature also shows that stakeholder engagement is most effective when trade-offs are surfaced and negotiated transparently rather than resolved internally by technical teams (Arkema et al. 2023; Matthews et al. 2014; Yule et al. 2025). Trade-offs arise when decisions require balancing competing priorities, for example, distributing resources across sectors, reconciling environmental and economic objectives, or determining which populations are prioritised for risk reduction.
Structured deliberation, iterative workshops and co-production approaches help clarify these competing interests and can improve both the robustness and legitimacy of decisions. In Austria’s national adaptation strategy, for example, multi-stakeholder workshops were used to negotiate priorities across sectors such as agriculture, environment and regional development, reflecting a governance model that relies on consensus-building rather than quantified targets. Similar deliberative processes were used in Germany when developing measurable adaptation targets under the Climate Adaptation Act, where ministries, experts and stakeholders contributed to refining targets and resolving overlaps across thematic clusters. These examples illustrate how explicit negotiation can build shared understanding even when government retains responsibility for final decisions.
Several studies of participatory adaptation processes warn, however, that insufficient or superficial engagement can lead to tokenism, privileging technical or administrative perspectives over lived experience (Eriksen et al. 2015; Dilling et al. 2019; Biesbroek et al. 2025; Kythreotis et al. 2020). Ziervogel & Taylor (2008) reinforce this concern, showing that without meaningful deliberation, engagement processes risk reproducing existing inequalities, with marginalised voices heard but not acted upon. This underscores the need for engagement approaches that not only solicit input but also address underlying power dynamics.
Capacity, Resources and Feasibility
Across the literature and documents reviewed, capacity, resources and feasibility consistently emerge as the foundations of credible adaptation targets. Where evidence systems, institutional mandates, finance and monitoring capabilities are strong, targets become clearer, more measurable and more actionable. Where these enabling conditions are weak, targets tend to be symbolic, vague or unrealistic, regardless of political intent (UNEP 2020; UNEP 2022; OECD 2023; World Bank 2023; Magnan 2016). Developing robust targets therefore requires investing in the analytical, financial, institutional and delivery systems that shape both the form and ambition of adaptation targets before they are integrated into wider planning and implementation frameworks (Biagini et al. 2014; Adaptation Scotland 2022; Leiter et al. 2019).
Strong evidence systems enable credible and actionable adaptation targets
The strength of a government’s evidence base is a key predictor of its ability to set credible and measurable adaptation targets. Jurisdictions with robust risk assessments, climate projections, modelling capacity and exposure analysis are better able to translate scenarios into quantitative or threshold-aligned targets, such as hydrological modelling used to define environmental flow requirements, biodiversity thresholds, or city-scale heat and flood analyses that inform spatial commitments (Matthews et al. 2014; Bino et al. 2021; Judd et al. 2022; Goyette et al. 2023; Arkema et al. 2023; Mongelli et al. 2024; Neocleous et al. 2023).
The literature review emphasised the importance of downscaled models, local indicators and practical monitoring tools in supporting targets that can guide real-world decisions (Adaptation Scotland 2022; UNEP 2020; UNEP 2022; UNEP 2024; World Bank 2023; OECD 2023; Tompkins et al. 2018; Berrang-Ford et al. 2014; Berrang-Ford et al. 2019; Arfanuzzaman 2024; Canosa et al. 2020; Yule et al. 2025). However, capability is uneven: some sectors maintain strong in-house analytical expertise, while others lack tools or rely heavily on external consultants, resulting in significant variation in what different parts of government can credibly commit to (Biesbroek & Delaney 2020; Reckien et al. 2018; UNEP 2022; World Bank 2023). This variation means that jurisdictions with strong evidence systems tend to set time-bound, quantitative or threshold-based targets, while those with weaker evidence bases may set directional, qualitative or process-based targets (Magnan 2016; Leiter et al. 2019; Biesbroek et al. 2018). Effective target-setting requires evidence systems capable of supporting the level of specificity sought. Outcome- and impact-level targets require data, modelling and clear baselines to establish thresholds and plausible pathways for change, whereas many process and output targets can be developed with more limited analytical foundations.
Technical capacity shapes both the form and specificity of adaptation targets
Capacity strongly influences both what governments target and how precisely they do so. Where technical systems and data infrastructures are strong, targets tend to be quantitative, time-bound and aligned with thresholds (Berrang-Ford et al. 2014; Arkema et al. 2023; Goyette et al. 2023). Where capacity is weaker, targets remain qualitative, directional or process-based (Berrang-Ford et al. 2019; Tompkins et al. 2018; UNEP 2020, 2022, 2024). Many strategies express high ambition but lack measurable values, with quantification occurring only in sectors where statutory levers or long-established delivery systems exist. In these contexts, the form of targets reflects analytical constraints as much as political ambition (Biagini et al. 2014; Adaptation Scotland 2022; OECD 2023; Magnan 2016).
Financial feasibility is essential but rarely integrated into target-setting
Across the literature, few national or local strategies link target levels to costed delivery plans, budget lines or long-term finance pathways. Global and national reviews consistently identify chronic underfunding and the absence of clear financing pipelines, often resulting in strategies that list desirable actions without showing how they will be delivered (UNEP 2020, 2022, 2024; World Bank 2023; OECD 2023; Arfanuzzaman 2024). While appraisal tools exist (Watkiss and Hunt 2019), they are seldom applied systematically. This disconnect means that targets may formally commit governments to outcomes that are financially unviable, creating expectations that exceed available resources. In such cases, targets become barriers to implementation because they absorb administrative effort without generating deliverable pathways. Embedding financial realism at the design stage is therefore essential (UNEP 2020, 2022; World Bank 2023).
Clear mandates and governance structures enable feasible and deliverable targets
Strong evidence does not guarantee feasibility. Governance arrangements, including clear mandates, coordination mechanisms, and structured monitoring systems, are decisive in determining whether targets can be delivered. Jurisdictions with well-defined responsibilities and coordination structures tend to set more specific and actionable targets (EEA 2015; England et al. 2018; Reckien et al. 2018; Dzebo 2019; Leiter et al. 2019; OECD 2023). Where responsibilities are fragmented, targets remain vague or become confined to sectors with strong statutory levers such as water management (Berrang-Ford et al. 2014; Berrang-Ford et al. 2019; Tompkins et al. 2018; Ziervogel and Taylor 2008; Roggero and Thiel 2021). Feasible targets therefore require clarity on ownership, delivery partners and the legislative or regulatory frameworks that enable implementation (Magnan 2016; OECD 2023; World Bank 2023).
Monitoring capacity and attribution limits what targets can realistically track or revise
Monitoring, evaluation and learning (MEL) systems determine whether targets can be tracked or adjusted over time. Many governments lack stable indicators, consistent data or clear reporting responsibilities, forcing reliance on process indicators that are easy to measure but weak proxies for vulnerability reduction (Magnan 2016; Leiter et al. 2019; Biesbroek et al. 2018; UNEP 2022; OECD 2023). Because strict attribution is rarely possible in complex systems, feasible targets focus on contribution, system performance and functional improvements rather than direct causal claims (Hallegatte 2009; Moser and Ekstrom 2010). The literature also highlights the importance of staging through interim milestones and scheduled reviews to keep long-term targets on track (Biesbroek et al. 2018; UNEP 2024; Matthews et al. 2014; Bino et al. 2021). Approaches grounded in a theory of change are increasingly recommended because they help clarify causal pathways, intermediate outcomes and realistic expectations of progress.
Targets are more deliverable when aligned to sectoral and local implementation capacity
Targets are most feasible when aligned with the practical capabilities of the institutions responsible for delivery. The literature highlights persistent scale mismatches between national ambitions and local authority capacity, with many local governments lacking the staff, data systems or operational tools required to implement targets consistently (Berrang-Ford et al. 2014; Berrang-Ford et al. 2019; Reckien et al. 2018; England et al. 2018; Ziervogel and Taylor 2008; Yule et al. 2025). Feasible targets therefore need to be co-designed with delivery systems, tailored to available capacity and grounded in realistic assessments of what can be operationalised at different scales (Biagini et al. 2014; Adaptation Scotland 2022; OECD 2023; World Bank 2023).
Political framing strongly influences whether governments quantify adaptation targets
Target-setting is also shaped by how adaptation is politically and conceptually understood. Concepts such as acceptable risk, resilience thresholds and success criteria are inherently political (Tompkins et al. 2018; Magnan 2016; Geden 2016). Some jurisdictions avoid quantification because adaptation is understood as an iterative, learning-oriented process that cannot easily be captured by fixed numerical values. Others quantify only where delivery levers and accountability mechanisms are clear (Biesbroek and Delaney 2020; Canosa et al. 2020; World Bank 2023). The literature warns that arguments about “feasibility” can limit ambition, especially when budgets are tight or when tasks are shifted to organisations that lack the capacity to deliver them. (Eriksen et al. 2015; Biesbroek et al. 2025; Puig et al. 2025; Kythreotis et al. 2020). Feasibility is ultimately determined by the mix of analytical capacity, governance arrangements and how willing governments are to define what success looks like.
Integration, Coherence and Implementation Pathways
Across the literature, a consistent message is that the credibility and deliverability of adaptation targets depend on how well they are integrated into existing planning, governance and monitoring systems (UNEP 2020, 2022; OECD 2023; World Bank 2023; Berrang-Ford et al. 2014, 2019). Targets aligned with sectoral programmes, statutory duties and cross-government processes have clearer delivery pathways, while targets that sit outside these systems struggle to influence decisions (Adaptation Scotland 2022; Arkema et al. 2023; Bino et al. 2021; Judd et al. 2022). Integration concerns how targets connect to mandates, planning cycles, investment processes and review mechanisms (OECD 2023; Magnan 2016; Leiter et al. 2019). When governance is coherent and supported by functioning review systems, targets can shape policy and investment decisions; when governance is fragmented, targets tend to remain aspirational rather than actionable (Berrang-Ford et al. 2019; Arfanuzzaman 2024; Roggero and Thiel 2021).
Targets are most effective when embedded within established planning and delivery systems
Evidence shows that targets are more influential when they are integrated into established planning and delivery systems such as procurement, regulatory standards, spatial planning, asset management and service delivery (UNEP 2020, 2022; OECD 2023; World Bank 2023; Adaptation Scotland 2022; Reckien et al. 2018). Documented examples include Japan and Canada, where targets are embedded within sectoral strategies and statutory frameworks, and European ecological commitments, which are most enforceable when connected to water and biodiversity legislation (Bino et al. 2021; Judd et al. 2022; Goyette et al. 2023; Biesbroek and Delaney 2020). In contrast, plans that lack linkages to statutory or sectoral systems tend to exert limited influence on decisions (Reckien et al. 2018; Lyytimäki et al. 2021; England et al. 2018). Integrated targets therefore sit within delivery architectures that support enforceability, accountability and political traction (Arkema et al. 2023; OECD 2023; World Bank 2023).
Fragmentation across sectors and levels of government undermines coherent target delivery
The literature consistently identifies fragmentation across sectors and governance levels as a barrier to effective implementation of adaptation targets. National plans often contain overlapping frameworks or differing definitions of what constitutes a target (Berrang-Ford et al. 2014, 2019; Arfanuzzaman 2024). Document reviews show that Germany, Finland and the Netherlands use the term ‘target’ inconsistently across sectors. While the literature does not identify this inconsistency as a direct barrier to implementation in these specific jurisdictions, studies of European national and urban adaptation plans show that inconsistent terminology, weak indicator frameworks and unclear links between actions and outcomes are common challenges that contribute to fragmented governance and make it harder to track progress (Reckien et al. 2018; Lyytimäki et al. 2021; Sietsma et al. 2021). Research also suggests that local authorities struggle to align with national ambition because of unclear linkages between governance systems and reporting requirements (Kythreotis et al. 2020; Yule et al. 2025). As a result, coherence that appears strong in documentation often proves difficult to operationalise in practice. Fragmentation therefore limits alignment, coordination and the translation of targets into operational action (Roggero and Thiel 2021; World Bank 2023). The literature suggests that coherence can be strengthened through clearer vertical alignment between national and subnational targets, shared indicator frameworks, and coordinated monitoring and reporting systems that link sectoral and territorial levels of governance (Berrang-Ford et al. 2019; Reckien et al. 2018; Wise et al. 2014).
Global and regional frameworks support integration, but domestic revision remains inconsistent
Global and regional frameworks, including the Paris Agreement and Global Stocktake, provide regular points for reviewing adaptation targets (UNEP 2020, 2022, 2024; Magnan 2016; Tompkins et al. 2018). Donor and multilateral funding cycles also create external rhythms for reporting and revision (World Bank 2023; OECD 2023). Several countries, including Canada and Germany, align their monitoring and reporting systems with these external processes (Berrang-Ford et al. 2019; Reckien et al. 2018; Yule et al. 2025). However, international cycles rarely ensure domestic revision. Long-term targets often remain unchanged because revision entails political costs, such as reputational risk or perceptions of failure (Geden 2016; Raiser et al. 2020). The literature emphasises that while global processes structure reporting, domestic political commitment, institutional authority and internal governance mechanisms determine whether targets are updated. External frameworks can facilitate integration, but domestic political incentives and institutional arrangements are the primary drivers of change (UNEP 2022; World Bank 2023).
Iterative revision mechanisms are necessary but politically sensitive and inconsistently used
The literature distinguishes between formal revision mechanisms (monitoring and reporting systems, donor requirements) and informal mechanisms (political leadership, new evidence, interdepartmental negotiation) (UNEP 2020, 2022, 2024; Berrang-Ford et al. 2019). Structured revision processes are documented in Canada and Japan, but many countries lack clear pathways for updating targets (Leiter et al. 2019; Sietsma et al. 2021). Revision is politically sensitive because altering a target can be interpreted as lowering ambition or admitting inadequate progress (Biesbroek et al. 2025; Dilling et al. 2019). Revision is more likely where monitoring systems are well institutionalised and have senior-level support (Matthews et al. 2014; Bino et al. 2021; Judd et al. 2022). Where responsibilities are unclear or indicator systems are weak, targets tend to remain static (Magnan 2016; UNEP 2022). Iterative revision therefore depends as much on political culture and institutional support as on technical mechanisms (Hallegatte 2009; Moser and Ekstrom 2010; Wise et al. 2014).
Meaningful integration must align with political, social and contextual realities as well as technical systems
The literature cautions that integration cannot be treated solely as a technical exercise (Eriksen et al. 2015; Dilling et al. 2019; Biesbroek et al. 2025). Aligning targets with global frameworks may overlook local knowledge or equity concerns, and ecological studies warn against generic targets that lack regional grounding (Goyette et al. 2023; Matthews et al. 2014). Document reviews show that resistance to quantification in cases such as Austria reflects deeper political and conceptual understandings of adaptation, including the belief that adaptation is iterative and cannot be meaningfully expressed through fixed values (Reckien et al. 2018; Lyytimäki et al. 2021). Integration also requires legitimacy, communication and narratives that resonate with institutions and communities (Garvey et al. 2023; Kythreotis et al. 2020). Equity considerations remain central to meaningful alignment (Eriksen et al. 2015; OECD 2023). Integration is therefore shaped by values, political priorities and authority, not only by technical frameworks (Magnan 2016; World Bank 2023)
Deliverability depends on embedding targets in the operational systems responsible for implementation
For targets to influence real-world outcomes, they must align national ambition with the operational systems responsible for implementation, including land-use planning, water management, infrastructure investment, biodiversity management and economic development (OECD 2023; World Bank 2023). Targets influence outcomes most effectively when they are embedded in regulatory systems, investment cycles and sectoral delivery pathways (Arkema et al. 2023; Bino et al. 2021; Judd et al. 2022; Goyette et al. 2023).
Document reviews show that cities such as Barcelona, Paris and Lisbon incorporate adaptation into spatial planning, procurement and infrastructure programmes, integrating targets directly into the delivery systems responsible for implementation. This reflects a broader pattern observed in the literature, where local and regional authorities are often better positioned to operationalise adaptation commitments because they control land-use planning, infrastructure investment and service delivery (Reckien et al. 2018; Sietsma et al. 2021; Lyytimäki et al. 2021). By contrast, national strategies more commonly establish strategic direction while relying on sectoral ministries and subnational authorities to translate targets into operational action. Where targets sit outside these operational systems, they tend to remain disconnected from implementation and have limited influence on investment decisions or sectoral practice (Berrang-Ford et al. 2014, 2019; Adaptation Scotland 2022; Garvey et al. 2023).
Evidence from Interviews
Part A has examined what the international literature and national strategies reveal about effective adaptation target-setting, the characteristics of high-quality targets, the systems that support them, and the governance and feasibility conditions that shape their credibility. Part B now turns to the interview evidence. Semi-structured interviews were conducted with policymakers and technical experts from seven jurisdictions: Canada, Germany, Kenya and the Netherlands, and the cities of Barcelona, Lisbon and Paris. In responding to interview questions, practitioners described their experiences in terms of drivers, negotiation, institutional culture and iterative learning. For this reason, the interview findings are presented as a narrative account of how jurisdictions actually agree, design, operationalise and revise adaptation targets in practice.
Although structured differently, the interview findings reinforce and add nuance to the five analytical themes identified in Part A by illustrating how these dynamics play out in practice within government institutions. They illuminate how constraints and opportunities are interpreted within government, how ambition is negotiated, and how targets evolve over time within real institutional settings.
What Jurisdictions Have Learned About Setting Adaptation Targets
The seven jurisdictions examined, four national governments and three cities, took different approaches to setting adaptation targets. Some set clear numeric targets. Others used broader goals supported by indicators. Some wrote targets into law, while others relied on reporting and coordination. Despite these differences, common lessons emerged about how targets are introduced, defined and maintained over time.
The sections that follow examine five themes. First, what prompts governments to move from general adaptation goals to measurable targets. Second, how targets are negotiated with the departments responsible for delivering them. Third, what “measurable” means in practice, including how governments deal with outcomes influenced by multiple factors. Fourth, how monitoring and review affect whether targets remain visible and are updated over time. Fifth, how the way government is organised, and the data and staff capacity it has, shape the type of targets that are set.
The interviews largely reinforced the literature finding that targets tend to be introduced at moments when climate evidence converges with political or institutional triggers, such as legal changes, external reporting pressures or recent climate impacts that heighten the need for clearer commitments. Interviewees described targets as useful for setting direction and tracking progress. They did not identify a single model that works in all contexts, although targets were seen as most effective when they align with how government is organised, the data available and the actors responsible for delivery. Further detail on the interview approach and case study findings is provided in the appendices, including the interview topic guide (Appendix C) and jurisdictional case summaries (Appendix E).
Why targets are introduced
Climate risk assessments shaped what targets looked like, but they did not by themselves lead governments to introduce measurable targets. In Germany, the trigger was legal. The Climate Adaptation Act required the national strategy to include measurable targets, indicators and measures. Interviewees suggested that without this change, targets would not have been developed in such a structured way. In Canada, measurable targets were added late in drafting the National Adaptation Strategy. Interviewees described pressure to demonstrate tangible progress on resilience, alongside sustained advocacy from the insurance sector for clearer national benchmarks. Austria has debated SMART targets for more than a decade but has chosen not to adopt them. Interviewees cited concerns about attribution, shifting climate baselines, and the risk that numeric targets could imply more certainty than exists.
At city level, recently experienced climate impacts sharpened the case for targets. In Barcelona, drought made water-related targets more urgent and specific. In Paris, repeated heatwaves increased pressure for measurable commitments on cooling and greening. In Lisbon, adaptation plans were produced, but interviewees noted that the metropolitan strategy does not clearly consolidate headline numeric targets. Some quantitative figures appear in sectoral initiatives or supporting documents, but they are not presented as a unified set of strategic targets in the main plan. Across these cases, clearer adaptation targets tended to emerge when climate risk evidence was reinforced by legal requirements, external pressure or recent impacts that increased demand for measurable commitments.
Ownership and negotiated ambition
In all jurisdictions, ambition was shaped through negotiation with those responsible for delivery. In Germany, each ministry drafted its own targets within a shared structure. The Environment Ministry coordinated the process but did not set target levels. Interviewees emphasised that ministries should commit only to targets they are willing and able to implement. In Canada, responsibility is organised around five thematic “systems” (such as health and infrastructure), each led by a designated federal department. These lead departments developed targets within their area, aligned with existing programmes and funding. Interviewees were clear that limited resources constrained ambition and departments avoided commitments that were not backed by secured budgets.
Austria provides a contrasting example of how ambition is negotiated where formal targets have not been adopted. Rather than adopting formal SMART or quantified adaptation targets, the national adaptation strategy relies on sectoral goals and collaborative monitoring processes developed through workshops and dialogue across ministries, provinces and experts. Interviewees explained that concerns about attribution, shifting climate baselines and the risk of overpromising led policymakers to favour consensus-based coordination over formal targets.
A similar pattern appeared at city level. In Barcelona, delivery departments own their targets, while the climate office coordinates reporting. In Paris, sector departments define commitments within their mandates. In Lisbon, fragmented responsibilities across municipalities made it harder to consolidate and track targets consistently. Across the interviews, targets were more likely to be implemented when the actors responsible for delivery helped define them.
What “measurable” means in practice
The interviews show that “measurable” is understood differently across jurisdictions and sectors. In Germany, some targets include clear quantitative values and timeframes. Others are framed as directional goals, supported by indicators that are still being developed. Interviewees described this as a pragmatic approach: i.e. start with measurable commitments and refine them over time. Canada’s targets also vary. Some targets set clear numerical milestones. Others focus on ensuring that climate risk is built into planning, investment and decision-making processes. Interviewees explained that many early targets are near-term milestones intended to build momentum and support monitoring.
Austria tracks more than 100 quantitative indicators but has not adopted formal SMART targets[3]. Interviewees explained that the strategy emphasises monitoring progress and learning across sectors rather than defining fixed numerical thresholds for performance. There is also ongoing debate about whether numeric thresholds can capture adaptation outcomes, particularly where attribution is complex.
The city cases show similar variation. Barcelona’s water targets are clearly quantified, reflecting strong technical capacity. However, interviewees noted that greening targets are more difficult to deliver in a dense city where space is limited and drought places additional pressure on vegetation, meaning that targets in this area are often more contested and harder to achieve in practice. In Lisbon, quantitative figures tend to appear within individual measures or sectoral initiatives rather than as clearly defined strategic targets. Interviewees noted that the metropolitan adaptation plan does not present a consolidated set of overarching numeric targets in the main strategy document.
Across cases, interviewees questioned how far changes in outcomes can be directly linked to policy or their interaction with other social-economic factors. For example, heat-related deaths depend not only on government action but also on population age, individual behaviour and the severity of heat events. Drought can reduce water use, but it can also damage trees and green space. Because these outcomes are influenced by many factors, some jurisdictions use indirect indicators, for example measures such as tree canopy cover, access to cooling centres, or reductions in potable water consumption, to track progress, rather than trying to measure final impacts alone. In practice, what counted as “measurable” depended on the data available, the nature of the sector and the practical limits on delivery.
Monitoring, revision and accountability
How targets are monitored affects whether they remain useful over time. In Germany, targets sit within a formal cycle linking climate risk assessment, strategy, monitoring and revision. Progress is reviewed through the monitoring process and feeds into a formal policy cycle in which the strategy is revised every four years and the national climate risk assessment is updated every eight years. Monitoring results inform public reporting and subsequent revisions to targets. There are no sanctions for missing targets, but ministries are expected to explain gaps and propose further action. Canada’s monitoring framework is still being developed. Each lead department reports on progress within its system. Interviewees described this as an evolving process that is expected to strengthen over time. Austria provides a different model. Although the national adaptation strategy does not include formal SMART or quantified targets, progress is monitored through a combination of indicator tracking and sector workshops. Experts from ministries, provinces and academia review progress through structured discussion alongside more than 100 quantitative indicators.
At city level, Barcelona has an established reporting process. Departments report on implementation and indicators, and the climate office compiles this information for senior leadership. Targets are not legally binding, but regular reporting creates visibility and follow-up. In Lisbon, interviewees described monitoring as uneven. Where reporting systems are fragmented, it becomes difficult to track targets consistently. Across all the cases we looked at, formal penalties for missing a target were rare. Accountability operated mainly through reporting, political scrutiny and periodic strategy updates. Interviewees suggested this reflects the difficulty of attributing outcomes directly to policy action, as well as the need to maintain departmental ownership and flexibility when climate risks, data and implementation capacity are still evolving. Where regular review cycles exist, they allow targets to be adjusted rather than fixed permanently.
Institutional culture and capacity
Interviewees often explained differences in how adaptation targets are designed and used across jurisdictions and sectors by referring to how their governance systems are organised and what kinds of commitments are considered credible within them. In sectors with strong engineering traditions, such as water management, numeric targets were described as more straightforward to define and monitor. These sectors often already work with technical standards and routine monitoring, making quantified thresholds more familiar and defensible. In Austria, where a decision has been made not to develop quantified targets, interviewees emphasised a culture of coordination and consensus, which supports dialogue and qualitative assessment rather than rigid national thresholds. In Germany, a formal legal framework and established inter-ministerial structures shaped the cluster-based organisation and regular review cycle. In Canada, the federal system means responsibility for adaptation is shared across federal departments, provinces and territories. National targets therefore need to reflect what different actors are willing and able to implement, which can limit how prescriptive or ambitious they are at national level. In Lisbon, detailed planning documents are common, but fragmented responsibilities across municipalities make consistent tracking more difficult.
Interviewees also pointed to differences in capacity. Data availability, technical expertise and staff resources influence what can realistically be measured and reported. Where monitoring systems are already established, targets can be more precise; where data systems are still developing, targets tend to begin as milestones or directional commitments. These factors help explain why jurisdictions facing similar climate risks have adopted different approaches to setting and monitoring targets.
Iteration and learning
Across the interviews, setting adaptation targets was described as an iterative process shaped by practical constraints. Governments faced trade-offs between precision and credibility, ambition and deliverability and outcome measurement and system-level change. Rather than resolving these tensions upfront, jurisdictions adjusted their targets over time, refining indicators, strengthening monitoring systems and aligning ambition with available resources. In many cases, revisions were triggered by scheduled strategy review cycles, new climate risk assessments, monitoring results, or major climate events that revealed gaps in existing approaches. Target-setting was therefore described not as a one-off design exercise, but as part of a broader process of institutional learning.
Balancing targets across the results chain
Interview evidence suggests that adaptation target systems are most effective when targets at different levels of the results chain, inputs, outputs, outcomes and impacts, are designed to work together. Jurisdictions that rely predominantly on input or output targets can demonstrate activity but often struggle to show whether resilience conditions are improving. Conversely, jurisdictions that focus solely on high-level outcome ambitions may find it difficult to evidence delivery progress, maintain operational accountability or secure sustained political support.
Interviewees emphasised that greater clarity and coherence tend to emerge where institutional integration, delivery actions and resilience outcomes are aligned within a single framework. This alignment helps ensure that shorter-term milestones support, rather than compete with, longer-term resilience objectives. While impact-level targets remain the most challenging to operationalise, given attribution difficulties, shifting climate baselines and long time horizons, interviewees noted that linking deliverables to broader resilience ambitions can strengthen strategic coherence. Across jurisdictions, interviewees described effective target systems as those that provide complementary performance signals: inputs and outputs that track delivery and institutional capacity, and outcomes that articulate changes in vulnerability, exposure or preparedness. The interviews therefore suggest that the effectiveness of adaptation target-setting depends less on uniform quantification across all levels and more on whether different target types are combined to form a coherent and mutually reinforcing results chain.
Summary and implications for Section 5
Across all evidence sources, a consistent picture emerges. Adaptation target-setting is not a purely technical exercise; it is shaped by institutional capacity, political incentives, governance structures and social context. High-quality targets are clear, measurable and embedded in credible delivery pathways, yet few jurisdictions achieve this fully. Many rely on process or output indicators because data, modelling capability or attribution methods remain limited. Governance arrangements that combine central coordination with distributed ownership appear most common and support alignment, but accountability usually remains political rather than legal. Stakeholder engagement improves relevance and legitimacy but rarely shifts technical parameter-setting unless deliberation is structured and power imbalances are explicitly managed.
The interview evidence reinforces the literature by showing how target-setting unfolds in practice: through negotiation with delivery actors, iterative refinement, and pragmatic interpretation of what counts as “measurable.” Targets are seen to be most effective when supported by established monitoring systems, clear ownership, and alignment with operational delivery structures. Practitioners emphasised that building such systems takes time and that targets often mature across successive strategy cycles.
These insights provide the foundation for Section 5, which examines how the lessons from international experience can inform the development of adaptation targets tailored to Scotland’s governance system, evidence base and delivery landscape. The findings presented here set out the enabling conditions and design choices that underpin credible, feasible and context-appropriate adaptation targets.
Applying lessons of adaptation target setting and monitoring to Scotland
Introduction
This section applies the international lessons from Section 4 to the Scottish context. It draws on insights from a two-round expert elicitation process (using a modified Delphi approach), which explored the credibility, feasibility and practical implications of different approaches to adaptation target-setting in Scotland. The process was designed to identify where expert perspectives converge, where they diverge, and how issues such as equity, uncertainty, governance and revision cycles should shape the development of future targets.
The analysis synthesises views expressed across both rounds and is organised around five core dimensions of adaptation target-setting: target design, governance, stakeholder engagement, system capacity and policy integration. These dimensions reflect the themes used in Section 4 while focusing specifically on their implications for Scotland.
Section 5.2 examines how adaptation targets should be designed, including their purpose, structure and measurement approaches. Section 5.3 considers governance arrangements required to ensure accountability and stability over time. Section 5.4 explores the roles of citizens, experts and government in shaping and legitimising targets. Section 5.5 examines the institutional capacity, resources and evidence systems required to support implementation. Finally, Section 5.6 considers how targets should be embedded within wider policy systems, including the role of scientific evidence, ambition and equity in guiding long-term adaptation pathways.
Designing adaptation targets for Scotland
Please note: quotes from Delphi survey participants are included in italics throughout Sections 5.2–5.6.
Targets should primarily function as tools to drive action and enable delivery
Across both survey rounds, participants consistently emphasised that adaptation targets should function first and foremost as mechanisms that trigger and support practical adaptation action. As one participant put it, “Targets should drive action on the ground and enable the conditions to make things happen – process, people, funding.” Targets were viewed as tools to clarify priorities, direct resources and strengthen enabling conditions for delivery, such as skills, funding processes and long-term planning. Accountability was seen as an essential mechanism for encouraging timely action and enabling early corrective intervention when progress falls short. One participant noted that “being held to account is the overall motivator that will likely drive a lot of the other aspects.”
Participants also stressed that high-quality targets must be designed with a clear understanding of their intended users. Targets aimed at ministers, public bodies or regulators require clarity and operational relevance that directly supports decision-making, resource allocation and compliance. As one participant explained, the “key purpose of [a] target should be to motivate action: by signalling to ministers and policy makers what needs to happen by when.” These responses reinforce the view that adaptation targets should primarily guide behaviour and decision-making within government, rather than serving only to signal policy ambition or communicate priorities.
A layered, time-bound structure is preferred, in which long-term outcomes guide ambition and near-term delivery targets drive implementation.
There was strong support for an adaptation target framework operating across multiple time horizons. Long-term outcome or impact targets were seen as essential for articulating Scotland’s resilience objectives and providing coherence across sectors and policy cycles. Near-term delivery or output targets were viewed as equally important for maintaining urgency, supporting accountability and making implementation progress visible. As one participant observed, “[it is] really important to have a mix of short, medium and long term focus for targets.”
Views on medium-term stepping-stone or outcome targets were more tentative. While participants recognised their potential value for mapping adaptation pathways, they also highlighted challenges in defining and evidencing them at present. Participants therefore favoured a phased structure, beginning with long-term outcomes and near-term delivery targets before expanding into more detailed pathway milestones over time. Several participants cautioned against over-specifying interim milestones prematurely, with one noting the importance of “don’t pretend to know what you don’t know.”
A system-level Theory of Change is viewed as the most effective organising framework
Across both rounds, participants expressed strong support for using a system-level Theory of Change (ToC) to structure adaptation targets. A well-developed ToC was seen as an effective way to explain how near-term actions contribute to long-term outcomes, articulate causal pathways and make underlying assumptions explicit. As one participant explained, “A theory of change is a familiar tool… It would make clear the contribution of each output target to outcomes and impacts.”
Participants emphasised that the ToC should be treated as a living tool that can evolve as evidence develops. They cautioned against overly linear models that risk creating false certainty within complex climate systems and highlighted the importance of focusing on contribution rather than strict attribution when assessing progress. Participants also noted that the assumptions underpinning the ToC are as important as the targets themselves and should be explicitly documented and revisited as learning accumulates. However, a minority cautioned that ToCs risk becoming symbolic or procedural exercises if they are not actively integrated into monitoring and evaluation processes.
“Clear and measurable” targets require a mixed-method approach rather than reliance on numbers alone
Participants demonstrated a nuanced understanding of what constitutes a clear and measurable adaptation target. While quantitative thresholds and indicators were valued where robust and meaningful, participants strongly rejected the idea that clarity depends solely on numerical precision. As one respondent noted, “Quantitative is always preferred… but qualitative measures can be used where appropriate and can be equally as informative if done robustly.” This reflects the complexity and uncertainty inherent in adaptation and a desire to avoid false precision. Participants argued that clarity should derive from agreed criteria for assessing progress, consistent use of evidence and clear documentation of uncertainty, rather than from numerical targets alone.
Several participants also highlighted that numeric indicators can fluctuate in response to external shocks, such as extreme weather events, emphasising the importance of clear interpretive guidance when assessing progress. Qualitative tools such as narrative assessments were viewed as potentially valuable complements to quantitative indicators, provided they are structured using agreed rubrics and shared evidence standards.
Alignment with SNAP3 is essential, but targets should not be constrained by current indicators
Participants agreed that adaptation targets should be aligned with the SNAP3 monitoring, evaluation and learning framework in order to ensure coherence and continuity across policy cycles. However, they were equally clear that target development should not be constrained by the existing indicator set. As one participant commented, “regarding SNAP indicators, my view is we shouldn’t restrict target development using current indicators.”
Participants therefore supported using SNAP3 as an organising frame while allowing flexibility to develop new indicators, fill measurement gaps and update monitoring approaches as the evidence base evolves. In this view, targets should be driven primarily by desired outcomes and actions rather than by what is currently easiest to measure.
Simplicity, manageability and phased development are critical for a credible target system
Finally, participants emphasised the importance of designing a target system that is simple, usable and manageable in practice. Overly complex frameworks risk obscuring priorities and making it harder for delivery bodies to engage meaningfully with the system.
Participants therefore recommended starting with a minimum viable set of targets focused on the most significant outcomes and actions and expanding the framework over time as evidence and monitoring approaches develop. As one participant cautioned, attempts to construct highly detailed target hierarchies too early risk producing “a complicated system of targets that is full of holes and compromises and doesn’t really work.” Keeping the system focused and proportionate was therefore seen as an important safeguard against excessive complexity and a way of ensuring that targets support, rather than distract from, practical adaptation delivery.
Governance and accountability
Review cycles should be stable, statutory and tightly governed, with only narrowly defined exceptions
Participants strongly favoured a tightly bounded governance model in which fixed statutory review cycles provide the core accountability framework for adaptation targets. These cycles were valued for providing stability and predictability, helping ensure that adaptation commitments remain visible and are not displaced by competing policy priorities. Several participants highlighted the practical importance of fixed review schedules, noting that “continuous / ad hoc updating of targets will undermine confidence so better to operate on a transparent fixed review period.”
Similarly, respondents emphasised that stable review cycles allow sufficient time and resources for meaningful evaluation and delivery. As one participant observed, “fixed timescales are easier to plan for.” Another noted that “rolling and evidence-triggered updates sounds fraught… and vulnerable to being ignored / kicked into the long grass.”
While most participants accepted that reviews outside the statutory cycle could be justified in exceptional circumstances, they emphasised that such triggers should be narrowly defined and externally driven. For example, one respondent noted that “external conditions should also include climate disasters.” However, participants were generally resistant to revisiting targets routinely or in response to short-term performance issues. One participant argued that “[there is] not much point having targets if we are to simply adjust them to fit current (under) performance.”
Across both Delphi rounds, respondents drew a clear distinction between adapting delivery in response to learning and revising the targets themselves. Participants emphasised that learning processes should strengthen implementation rather than weaken ambition. As one participant noted, “revising targets downward is not something I like at all… it allows the underperformance to continue.”
Round 2 responses also highlighted the need for safeguards to maintain credibility when out-of-cycle reviews occur. Transparency and independent scrutiny were widely viewed as essential. One participant emphasised the value of “independent QA and publishing reviews… to ensure full transparency of the reasoning behind any changes.” Another highlighted that independence is important “to mitigate against the risk of political influence on targets.” Participants also stressed that criteria for exceptional review should be clearly defined. As one respondent noted, “the definition of exceptional circumstances should be extremely strict – financial restraints… should not be considered exceptional circumstances.”
Learning and monitoring should be continuous, while formal target revision remains infrequent
Across both rounds, participants emphasised that monitoring and learning should occur continuously even when formal revision of targets takes place only at fixed statutory intervals. Respondents highlighted the importance of routine assessment processes to track progress, identify emerging risks and support implementation. One participant commented that “there is a role… for continued (annual) assessments… we can’t wait 5 years.”
Such processes were seen as important for improving delivery and strengthening accountability between formal review cycles. However, participants emphasised that learning-driven adjustments should primarily influence implementation decisions rather than the targets themselves. This reflects a widely shared view that flexibility in delivery is appropriate, whereas flexibility in target ambition risks weakening the accountability function of the system.
Governance should combine central coordination with distributed delivery responsibility
The Delphi findings indicate strong support for governance arrangements that combine central coordination with distributed responsibility for delivery. Adaptation was widely understood as a cross-cutting policy challenge involving multiple sectors and institutions, making purely centralised or purely decentralised governance models difficult to sustain. As one participant explained, “required action is so varied and spread across multiple agents. Responsibility has to fall to those actively involved in delivery… though coordination within a central team [is] also necessary.” Similarly, another respondent described the preferred model as “somewhere in between central authority with distributed delivery autonomy.”
Across responses, participants emphasised that central coordination is important for maintaining coherence, transparency and momentum across the adaptation system, while sector-specific actors remain best placed to understand risks, operational constraints and delivery pathways within their respective domains. Participants therefore emphasised that central authority should focus primarily on coordination, oversight and accountability rather than direct operational control. As one respondent noted, “coordination is important to ensure consistency, transparency and timeliness. However individual areas will be best placed to understand what appropriate targets would look like and how to manage progress.”
Stakeholder engagement
Citizens and communities should shape early problem-framing and value-based decisions
Participants emphasised that citizens and communities have an important role in the early, value-based stages of adaptation target setting. Engagement was seen as particularly valuable when defining the problem, articulating what resilience should mean for Scotland and identifying whose risks and needs should be prioritised. Participants viewed lived experience as important for informing societal trade-offs and considerations of fairness in decisions about who benefits from adaptation and who bears the costs. Several respondents emphasised that citizen engagement is most meaningful during early scoping stages. As one participant noted, “I think citizens should be engaged at the start to scope the targets needed.”
Participants were more cautious about citizen influence in technically complex stages of the process, such as defining acceptable levels of climate risk or determining detailed implementation pathways. Some respondents emphasised the technical nature of these decisions, with one commenting on the risk of “the tyranny of participation… this strikes me as extremely technical work.” Citizen and community engagement was therefore widely viewed as most valuable where societal values and lived experience are central to decision-making, rather than across every stage of target design.
Experts and technical specialists should have sustained influence across all stages
Across both Delphi rounds, participants consistently supported a strong role for experts and technical specialists throughout the adaptation target-setting process. Expert involvement was seen as particularly important when interpreting complex evidence, assessing climate risks, understanding system interdependencies and identifying feasible pathways for adaptation. As one participant observed, “Co-creation with experts will make better, evidence based targets. Co-creation with the public will make them participatory and more socially acceptable.” At the same time, respondents emphasised that expert influence should complement rather than replace societal perspectives. As one participant explained, “experts and communities can and should have a role, but these are also political decisions and choices that ministers need to own.” Participants also noted that meaningful engagement requires time and facilitation skills. One respondent commented that while community perspectives are important, “few are well enough informed to do so meaningfully at the current time.”
Engagement should be meaningful, proportionate and focused where it adds the most value
Participants emphasised that engagement processes should be purposeful, proportionate and clearly designed. Meaningful participation was valued more highly than broad but superficial engagement. Poorly designed processes were seen as risks to trust and legitimacy, while excessive consultation could lead to stakeholder fatigue.
Several participants highlighted the technical complexity of adaptation decision-making, noting that individuals may struggle to engage meaningfully with highly specialised policy discussions. One respondent noted that “individuals in isolation will have little concept of the big picture or be able to weigh trades offs objectively.” Participants therefore emphasised the importance of focusing engagement where it adds the most value, particularly when decisions involve social trade-offs or distributive impacts.
Government must retain final decision-making authority
Participants were clear that engagement should inform, rather than replace, democratic accountability. Adaptation targets were widely understood as political choices that require ministerial ownership and responsibility.
As one participant stated, “Scottish Government needs to take responsibility for targets, with ongoing engagement with technical experts.” In this view, engagement processes should help inform decisions and improve legitimacy but should not replace the formal accountability of government institutions.
Transparency about roles, purpose and influence is essential for legitimacy and trust
Finally, participants emphasised the importance of transparency about who participates in target-setting processes and how their input influences decisions. Clear communication about the purpose and scope of engagement was seen as essential for maintaining trust and avoiding unrealistic expectations about the role of different actors. Without clarity about roles and influence, engagement processes risk creating confusion or undermining confidence in the legitimacy of the target-setting process. Ensuring transparency about how citizen, expert and government roles interact was therefore viewed as an important element of credible governance for adaptation targets.
System capacity, resources and feasibility
Limited institutional capacity and uneven system readiness constrain delivery
Participants repeatedly highlighted that Scotland’s adaptation system faces significant capacity constraints across central government, agencies and delivery partners. These constraints include shortages of specialist expertise, limited analytical and modelling capability, restricted staff time and competing statutory obligations. As one participant noted, “capacity in many organisations [is too limited] to allow things to be done differently rather than just continuing as normal because that’s all people have time to do.”
Participants also observed that levels of readiness vary significantly across sectors. Some areas of policy and practice already have clearer evidence bases and established delivery pathways, while others remain at earlier stages of development. This uneven readiness creates challenges for implementing consistent target frameworks across the adaptation system.
Resourcing gaps and uncertain funding undermine delivery and monitoring
Adaptation was widely perceived as under-resourced relative to the scale of climate risk. Many also emphasised that credible targets require sustained financial and institutional support for planning, delivery and monitoring activities. Several respondents highlighted the importance of stable funding to support long-term capability building. As one participant observed, “near term funding and high ambition gives confidence to stakeholders.”
However, participants stressed that resource constraints should not be used to justify weakening adaptation ambition. One respondent argued that “[we] can’t just weaken the target because we have underdelivered otherwise no accountability and makes the targets meaningless.” These responses highlight the tension between the scale of adaptation ambition and the current level of resources available to support implementation.
Evidence gaps and weak baselines limit what can be targeted at present
Participants identified substantial evidence gaps across many areas of adaptation monitoring and evaluation. In particular, respondents highlighted challenges associated with defining robust baselines, identifying appropriate indicators and measuring long-term adaptation outcomes. Several respondents cautioned against creating false precision when evidence remains limited. Participants emphasised that attempts to set precise quantitative targets without adequate evidence could produce misleading performance signals or unintended consequences. External shocks, such as extreme weather events, may also affect measured outcomes in ways that do not directly reflect progress in adaptation.
These challenges reinforce the importance of developing stronger data systems and analytical capabilities over time. Brooks et al. (2019) highlight emerging approaches within adaptation monitoring frameworks, including anomaly-based indicators, climate-adjusted baselines and counterfactual methods that estimate losses relative to expected climate conditions[4]. However, their operational application remains limited by data availability and modelling uncertainty. Participants therefore emphasised the need for measurement approaches that combine different types of evidence. As one respondent noted, “ideally we want a mix of unambiguous numeric targets and more qualitative assessments to bring depth and nuance.”
Over-complex target systems risk overwhelming delivery organisations
Participants consistently warned that overly complex target architectures could place excessive administrative burdens on delivery organisations. Risks identified included increased reporting requirements, fragmentation across sectors and diversion of staff time away from practical implementation. Several respondents highlighted the risk that complex frameworks could undermine usability. Participants therefore emphasised the importance of simplicity and clarity in target system design so that institutions responsible for delivery can engage effectively with the framework.
Feasible implementation requires prioritisation and phased development
Participants emphasised that a credible target system must reflect the current level of institutional capacity and evidence availability within Scotland’s adaptation system. Several respondents noted that meaningful implementation would require changes in organisational practices and capabilities.
A phased approach to target development was widely supported. Participants suggested beginning with a limited number of high-priority targets and expanding the framework as analytical capabilities, monitoring systems and evidence bases improve. Breaking longer-term objectives into manageable steps was also viewed as important for sustaining delivery momentum. As one participant observed, “breaking the required action… down into achievable blocks.”
Participants also noted that medium-term milestones may remain difficult to define in the near term. One respondent commented that “medium-term targets are less important than doing short and long term targets well.” Together, these responses suggest that prioritisation, sequencing and iterative development will be essential for implementing a credible adaptation target system under current institutional conditions.
Embedding targets in policy systems
Scientific evidence should actively structure adaptation targets, with hazard- and risk-based approaches strongly preferred
Across the Delphi process, participants emphasised that scientific evidence should play a central role in structuring adaptation targets. Several respondents stressed that “scientific evidence must feature to ensure targets remain up to date as new evidence of risks emerges.” Participants highlighted the importance of linking targets directly to climate risks, including through the use of climate projections, hazard modelling and risk assessments. Hazard-based framing was seen as particularly valuable because it connects climate science with concrete policy outcomes. As one participant explained, hazard-based approaches help demonstrate the need to invest in resilience measures that address climate hazards and their impacts on people and infrastructure.
Participants also emphasised that targets must be sufficiently precise to guide action and accountability. As one respondent noted, “a target should be a target, not a rough idea.” At the same time, respondents recognised that some aspects of adaptation cannot be captured through single numerical indicators. As discussed in earlier sections, qualitative or proxy-based measures may sometimes be necessary, provided they are embedded within a broader risk-based framework and accompanied by clear criteria for assessing progress.
Targets should evolve with new evidence through orderly and transparent processes
Participants widely agreed that adaptation targets must be able to respond to significant developments in scientific knowledge. As one respondent noted, “we need to adapt as new evidence comes to light.” However, participants were equally clear that constant or ad hoc revision of targets could undermine credibility and create uncertainty. One respondent observed that even evidence-triggered revisions can generate instability because “nobody knows when new evidence will arise.”
Participants therefore favoured an approach in which scientific evidence is continuously monitored, while formal revision of targets occurs through established governance processes. Stability was widely seen as an important feature of credible target systems. As one participant commented, “five years isn’t that long… stability is important.” In this approach, scientific evidence plays an ongoing role in informing implementation and interpretation of targets, while formal revisions occur through predictable and transparent review processes.
Ambition should lead, even where evidence and delivery capacity are still developing
Participants consistently emphasised the importance of maintaining ambitious adaptation targets, even where evidence and delivery systems are still evolving. Respondents frequently described ambition as necessary for signalling long-term direction and driving policy momentum. As one participant noted, “there needs to be long term ambition… based around the desire for a resilient society.” At the same time, participants emphasised that ambition should be structured in ways that support credible implementation. Near-term targets should remain achievable in order to build confidence and sustain delivery momentum. As one respondent explained, “targets must be achievable in the short term to build engagement and trust.” Participants also emphasised that uncertainty in the evidence base should not prevent action.
Several respondents argued that adaptation policy should follow precautionary principles when knowledge is incomplete. One participant stated directly that Scotland should “abide by precautionary principle when evidence is lacking.”
Ambition must be differentiated across sectors
Participants emphasised that adaptation risks, evidence bases and delivery systems vary substantially across sectors. As one respondent noted, “assuming all sectors have similar levels of risk, capacity or resource is not realistic.” A uniform approach to ambition was therefore widely viewed as impractical. Participants highlighted the diversity of adaptation challenges across sectors and the need to tailor targets to different contexts. As one participant explained, “it may be hard to have a consistent level of ambition when dealing with different contexts and complexities.” Participants therefore supported maintaining high overall ambition while allowing sector-specific targets to reflect differing risks, knowledge bases and delivery pathways.
Equity should shape adaptation ambition rather than being treated as a separate objective
Participants emphasised that equity and justice considerations should be embedded within adaptation targets rather than addressed through separate or stand-alone objectives. As one respondent explained, “equity/justice are inherent in becoming more climate resilience – so aren’t at odds with being very ambitious.”
In practice, participants suggested that equity considerations should influence how adaptation ambition is applied across sectors and communities. This could involve prioritising protection for groups facing higher vulnerability or exposure to climate risks or evaluating whether adaptation efforts reduce or reinforce existing inequalities.
Participants also emphasised the importance of transparency in how equity considerations are applied. One respondent highlighted the need for “central monitoring that equity is covered.” Embedding equity within adaptation targets was therefore seen as an important way of ensuring that resilience-building efforts contribute to broader social outcomes.
Conclusions and forward directions
The evidence from the literature, international practice and stakeholder engagement points to a clear conclusion. Effective adaptation target-setting depends as much on governance, capacity and delivery systems as on technical design. Across jurisdictions, targets work best when they are clearly defined, aligned with institutional responsibilities, embedded in delivery systems and supported by robust monitoring and review. The challenge for Scotland is not whether to set adaptation targets, but how to design them so they are credible, deliverable and aligned with how government operates.
This study combined evidence from international literature, policy review, stakeholder interviews and a two-round Delphi process to identify how adaptation targets can be designed and implemented in practice. This process identified areas of convergence and divergence in how these findings could be applied to adaptation target-setting in Scotland.
There was strong consensus across the evidence on several core features of effective adaptation targets. Agreement was particularly clear on the purpose of targets (to drive action), the value of a layered structure linking long-term outcomes with near-term delivery actions, the importance of hazard- and risk-based evidence and the role of hybrid governance combining central coordination with sectoral delivery responsibility. Participants also agreed on the use of statutory cycles for regular review, the rejection of continuous or ad-hoc revision, the use of mixed quantitative and qualitative evidence and the importance of proportionality and phased development. There was also agreement that equity should shape target ambition rather than sit in stand-alone targets.
Where views diverged, this was usually due to practical constraints rather than differences in principle. For example, participants broadly recognised the potential value of medium-term stepping-stone targets and more sophisticated risk-based metrics, but many emphasised evidence gaps, data limitations and uneven sectoral readiness that make them difficult to implement immediately. Several therefore favoured prioritising long-term outcomes and near-term delivery targets initially, with medium-term milestones introduced as monitoring systems and evidence bases mature. Similarly, while participants broadly supported public engagement in value-based questions, views varied on how far citizens should be involved in technically complex or ongoing decision-making processes.
These findings indicate that adaptation target-setting is constrained less by conceptual disagreement and more by limitations in data, capacity and institutional readiness. In several areas, views were conditional or context-specific rather than reflecting full agreement. Participants generally shared similar underlying principles but differed in how these should be applied in practice depending on institutional capacity, sectoral context or the stage of framework development. The clearest examples of context-dependent consensus related to:
- The degree of central authority. Although a fully distributed model was widely rejected, participants differed in how strong central coordination should be. Many responses emphasised that the appropriate balance between central oversight and sectoral autonomy would depend on the policy area, delivery responsibilities and existing governance arrangements.
- The balance between simplicity and completeness. Participants broadly agreed that target systems should remain usable and manageable. However, views differed on how streamlined the initial architecture should be. Some favoured a minimal set of high-priority targets to maintain clarity and reduce administrative burden, while others supported more detailed structures provided they remained practical for delivery institutions.
- The design and timing of medium-term stepping-stone targets. While their potential value for mapping adaptation pathways was widely recognised, participants differed in their views on when and how such milestones should be introduced. Many emphasised that their feasibility would depend on improvements in monitoring systems, baselines and analytical capability.
On Design principles for setting adaptation targets
These findings translate into a set of nine practical principles for designing adaptation targets that are credible, deliverable and aligned with Scotland’s institutional context.
Target design:
- Design targets to drive action. Targets should clearly specify who must act, by when, and on what basis. A layered structure should link long-term outcomes with near-term delivery actions.
- Embed scientific and hazard-based evidence at the core of target design. Climate projections, hazard modelling and risk assessments should inform ambition-setting and prioritisation, with mechanisms to manage evolving evidence and uncertainty.
- Balance ambition with feasibility through phased development. Initial frameworks should focus on a limited number of high-value targets and expand as data, analytical capability and monitoring systems mature.
- Use mixed measurement approaches where evidence is incomplete. Structured qualitative, proxy or provisional indicators can be used where data are limited, provided they are applied transparently and embedded within a wider science-led framework.
Governance and review:
- Integrate equity directly into ambition-setting and evaluation. Adaptation targets should reflect differences in vulnerability and exposure, including higher protection standards or accelerated timelines for communities facing greater risk.
- Ensure targets remain interpretable and usable, avoiding unnecessary complexity. Target systems should be simple enough to guide decision-making while robust enough to support meaningful assessment of progress.
- Provide clear and predictable review processes. Continuous monitoring of evidence should be combined with formal revisions tied to statutory review cycles and narrowly defined exceptional triggers.
Implementation feasibility
- Design within system capacity. Target frameworks should reflect current institutional capability and develop incrementally so that targets remain actionable rather than symbolic.
- Align targets with wider policy systems. Adaptation targets should be coherent with strategies across climate, nature, land, water, health and infrastructure, supported by central stewardship and sectoral delivery roles.
Together, these principles define the conditions under which adaptation targets can move beyond aspiration to shape decisions, investment and delivery across Scotland’s adaptation system.
Policy implications for adaptation target-setting in Scotland
The findings suggest that effective target-setting depends not only on technical design choices but also on strengthening institutional capability, governance arrangements and cross-sector coordination. The following actions highlight priority areas where policy development and institutional investment would support the creation of credible, ambitious and implementable adaptation targets.
- Establish a phased, layered adaptation target framework.
Begin with a small number of high-value targets linking long-term outcomes with near-term delivery actions, supported by a Theory of Change that clarifies pathways, assumptions and cross-sector linkages. Expand into medium-term milestones as evidence, baselines and monitoring systems mature.
- Integrate hazard- and risk-based evidence into target development.
Strengthen the use of climate projections, hazard modelling and national risk assessments to provide a consistent scientific basis for ambition-setting, prioritisation and evaluation.
- Anchor revision processes in statutory cycles with tightly governed flexibility.
Maintain five-year statutory review points as the primary mechanism for updating targets, with exceptional revisions permitted only when predefined, transparent and evidence-based triggers are met.
- Embed equity within target ambition and delivery.
Ensure that vulnerability and exposure influence the level of ambition, timelines and resource allocation. Central oversight can help maintain consistency while allowing sectoral and local tailoring.
- Strengthen analytical, modelling and monitoring capability.
Investment is needed to improve baselines, close evidence gaps, strengthen climate information and support the development of risk-based and mixed-method indicators.
- Adopt mixed-method assessment frameworks.
Develop clear success criteria, interpretive guidance and structured qualitative tools so that progress can be assessed fairly, particularly where metrics are influenced by climate variability.
- Prioritise simplicity and usability in target system design.
Avoid overly complex architectures or reporting burdens. Focus on the most material risks and outcomes so the framework remains manageable within existing capacity.
- Strengthen cross-government coordination and coherence.
Ensure adaptation targets align with related strategies across climate, nature, land, water, health and infrastructure, supported by central stewardship and sectoral delivery responsibilities.
- Develop transparent engagement pathways.
Clarify the roles of citizens, experts and delivery partners in shaping and implementing targets, while ensuring government retains accountability for final decisions.
- Provide stable, multi-year funding for implementation.
Long-term investment will be required to support capacity building, data systems, analytical functions and the practical delivery of adaptation targets across sectors.
In practice, developing effective adaptation targets in Scotland will require sustained institutional investment, clear governance arrangements and a phased approach that aligns ambition with delivery capacity.
References
Jurisdictional documents reviewed
|
National jurisdictions | |
|
Austria |
Federal Ministry Republic of Austria Climate Action, Environment, Energy, Mobility, Innovation and Technology (BMK), 2024. The Austrian Strategy for Adaptation to Climate Change Executive Summary. The Austrian Strategy for Adaptation to Climate Change 2024 – Executive Summary Federal Ministry Republic of Austria Climate Action, Environment, Energy, Mobility, Innovation and Technology (BMK), 2017. The Austrian strategy for adaptation to climate change. Part 1 – Context. The Austrian strategy for adaptation to climate change 2017- Part 1 – Context Federal Ministry Republic of Austria Climate Action, Environment, Energy, Mobility, Innovation and Technology (BMK), 2017. The Austrian strategy for adaptation to climate change. Part 2 – Action Plan. The Austrian strategy for adaptation to climate change 2017 – Part 2 – Action Plan |
|
Bangladesh |
Ministry of Environment, Forest and Climate Change 2022. National Adaptation Plan of Bangladesh (2023‐2050). Ministry of Environment, Forest and Climate Change, Government of the People’s Republic of Bangladesh. National Adaptation Plan of Bangladesh (2023‐2050) | United Nations Development Programme |
|
Belgium |
National Climate Commission. 2017. Belgian National Adaptation Plan 2017 – 2020. cnc-nkc.be/sites/default/files/report/file/nap_en.pdf 2021. Eindevaluatie van het Nationale Adaptatie Plan [Final evaluation of the National Adaptation Plan] (2017-2020) (google translated). Reports | National Climate Commission |
|
Brazil |
Ministry of Environment. 2016. National Adaptation Plan to Climate Change. General Strategy. Vol 1. https://www4.unfccc.int/sites/NAPC/Documents/Parties/Brazil%20NAP%20English.pdf Ministério da Saúde. 2013. Plano Setorial Da Saúde Para Mitigação E Adaptação À Mudança Do Clima/ [Sectoral Health Plan for Mitigation and Adaptation to Climate Change]. Plano Setorial de Sáude.pdf |
|
Canada |
Environment and Climate Change Canada. 2023. Canada’s National Adaptation Strategy Building Resilient Communities and a Strong Economy. En4-544-2023-eng.pdf |
|
Chile |
Departamento de Cambio Climático del Ministerio del Medio Ambiente. 2014. Plan Nacional de Adaptación al Cambio Climático Elaborado en el marco del Plan de Acción Nacional de Cambio Climático [National Adaptation Plan for Climate Change Developed within the framework of the National Climate Change Action Plan]. (google translated). unfccc.int/sites/default/files/resource/NAP_Chile_2017.pdf |
|
Czechia |
Ministerstvo životního prostředí v meziresortní spolupráci s využitím klimatologických podkladů Českého hydrometeorologického ústavu . 2021. Strategie přizpůsobení se změně klimatu v podmínkách ČR. 1. aktualizace pro období 2021 – 2030. [Strategy for Adapting to Climate Change in the Conditions of the Czech Republic. 1st update for the period 2021 – 2030] (google translated). OAZK_Narodni_adaptacni_strategie-aktualizace_20211026.pdf Ministerstvo životního prostředí. 2021. Národní akční plán adaptace na změnu klimatu [National Action Plan on Adaptation to Climate Change 2021- 2025]. OAZK_NAP_adaptace-aktualizace_20211025_0.pdf |
|
Finland |
Finnish Government Ministry of Agriculture and Forestry 2024. Government Report on Finland’s National Climate Change Adaptation Plan until 2030 Wellbeing, Safety and Security in a Changing Climate. Government Report on Finland’s National Climate Change Adaptation Plan until 2030 – Wellbeing, Safety and Security in a Changing Climate Finnish Environment Institute, Natural Resources Institute Finland, Finnish Meteorological Institute, University of Helsinki, Tyrsky Consulting, Finnish institute for health and welfare. 2022. Adaptation to climate change in Finland Current state and future prospects. Publications of the Government´s analysis, assessment and research activities. Adaptation to climate change in Finland : Current state and future prospects Munck af Rosenschöld, J. Todorovic, S., Virtanen, K., et. al. 2024. Indikaattoreiden nykytila ja kehittämistarpeet ilmastonmuutokseen sopeutumisen seurannassa [Current status and development needs of indicators for monitoring climate change adaptation in Finland]. (google translated). Indikaattoreiden nykytila ja kehittämistarpeet ilmastonmuutokseen sopeutumisen seurannassa |
|
France |
Stratégie nationale d’adaptation au changement climatique. [National adaptation strategy 2006]. (google translated). Stratégie_Nationale.vp 2025. 3rd French National Adaptation Plan (PNACC-3). PNACC_EN_VF_2.pdf |
|
Germany |
Federal Ministry for the Environment, Nature Conservation, Nuclear Safety and Consumer Protection. 2024 German Strategy for Adaptation to Climate Change Shaping precautionary action together. German Strategy for Adaptation to Climate Change |
|
Ireland |
Department of the Environment, Climate and Communications. 2024. National Adaptation Framework Planning for a Climate Resilient Ireland 2024. national-adaptation-framework-2024-0fa761a3-84e5-4bcf-ac40-0f91f6431ae8.pdf Government of Ireland. Climate Action Plan 2025. DECC_Climate_Action_Plan_2025_Annex_of_Actions__-_Final_Web.pdf |
|
Japan |
Climate Change Adaptation Plan. October 22, 2021 Cabinet Approval. 000081210.pdf KPIs for the sectoral measures set in the Climate Change Adaptation Plan (approved by the Cabinet on October 22, 2021). 000081212.pdf KPIs for the fundamental measures set in the Climate Change Adaptation Plan (approved by the Cabinet on October 22, 2021). 000081213.pdf |
|
Kenya |
Ministry of Environment and Natural Resources. 2016. Kenya National Adaptation Plan 2015-2030 Enhanced climate resilience towards the attainment of Vision 2030 and beyond. NAP_Final-Signed_22022017.pdf Ministry of Environment and Forestry. 2022. Review of the Implementation of Kenya’s National Adaptation Plan 2015–2030 in the Agriculture Sector. napglobalnetwork.org/wp-content/uploads/2023/01/napgn-en-2023-review-implementation-kenya-agriculture-national-adaptation-plan-2015-2030.pdf Climate Change Directorate, Ministry of Environment and Forestry, 2021. Kenya’s National Climate Change Action Plan 2018-2022: Second Implementation Status Report for the FY 2019/2020. napglobalnetwork.org/wp-content/uploads/2022/01/napgn-en-2022-kenya-NCCAP-2018-2022-Implemantation-Status-Report.pdf Climate Change Directorade, Ministry of Environment and Forestry. 2023. National Climate Change Action Plan (NCCAP) III. faolex.fao.org/docs/pdf/ken229355.pdf |
|
Netherlands |
Ministry of Infrastructure and Water Management. National Climate Adaptation Implementation Programme. Smarter, more systemic, for all and by all. November 2023. National Climate Adaptation Strategy (NAS) – Climate Adaptation Platform Netherlands Ministry of Infrastructure and the Environment. 2016. National Climate Adaptation Strategy 2016 (NAS). Adapting with ambition. https://klimaatadaptatienederland.nl/en/policy-programmes/national-strategy/nas/ |
|
New Zealand |
Ministry for the Environment. 2022. Aotearoa New Zealand’s first national adaptation plan. Wellington. Ministry for the Environment. environment.govt.nz/assets/publications/climate-change/MFE-AoG-20664-GF-National-Adaptation-Plan-2022-WEB.pdf |
|
Norway |
Norwegian Ministry of Climate and Environment. Meld. St. 26 (2022–2023) Report to the Storting (white paper) A changing climate – united for a climate-resilient society. Meld. St. 26 (2022–2023) |
|
Philippines |
Climate Change Commission (CCC) and the Department of Environment and Natural Resources (DENR). 2023. National Adaptation Plan of the Philippines. 2023-2050. climate.gov.ph/public/ckfinder/userfiles/files/Knowledge/PH NAP 2023-2050.pdf Climate Change Commission (CCC). The Philippine National Climate Change Action Plan. Monitoring and evaluation Report. 2011-2016. The Philippine NCCAP M&E Executive Brief [v2].pdf |
|
Thailand |
Climate Change Adaptation Division Department of Climate Change and Environment, 2023. Thailand’s National Adaptation Plan (NAP). unfccc.int/sites/default/files/resource/NAP_THAILAND_2024.pdf |
|
South Africa |
Department of Forestry, Fisheries and the Environment. 2020. National Climate Change Adaptation Strategy Republic of South Africa. unfccc.int/sites/default/files/resource/South-Africa_NAP.pdf |
|
Spain |
Ministry for the Ecological Transition and the Demographic Challenge (MITECO). National Climate Change Adaptation Plan 2021-2030. PLAN NACIONAL DE ADAPTACIÓN AL CAMBIO CLIMÁTICO Ministerio para la Transicion Ecologica y el Retro Demgrafico. Programa de Trabajo 2021-2025 Plan Nacional de Adaptación al Cambio Climático. Climate Change Adaptation: Work Programme 2021-2025 (google translated). pt1-pnacc_tcm30-535273.pdf |
|
Switzerland |
Federal Office for the Environment FOEN. 2012. Adaptation to climate change in Switzerland. Goals, challenges and fields of action. Adaptation to climate change in Switzerland. Goals, challenges and fields of action Strategie des Bundesrates, herausgegeben vom Bundesamt für Umwelt (BAFU). Anpassung an den Klimawandel in der Schweiz: Aktionsplan 2020–2025 [Adaptation to climate change in Switzerland: Action Plan 2020-2025]. (Google translated). Anpassung an den Klimawandel in der Schweiz: Aktionsplan 2020–2025 |
|
South Korea |
환경정책] 제3차 국가 기후변화 적응대책(’21~’25) [Third National Climate Change Adaptation] (google translated). 공지사항 – 온실가스종합정보센터 책소개_영문_브로슈어. [An Introduction to the third round of Korea’s national climate change adaptation plan] (google translated). 공지사항 – 온실가스종합정보센터 |
|
Rwanda |
NDC Support Facility. 2020. Revising Nationally Determined Contribution (NDC) mitigation and adaptation priorities for Rwanda Final Report 24 March 2020. Carbon Counts Report |
|
Sub-national jurisdictions | |
|
Barcelona |
Direcció de Serveis de l’Oficina de Canvi Climàtic i Sostenibilitat, Gerència de Serveis Urbans i Manteniment de l’Espai Públic, Gerència d’Àrea de Mobilitat, Infraestructures i Serveis Urbans, 2024. Pla Clima : mesura de govern (2018–2030). http://hdl.handle.net/11703/138564 |
|
Boston |
Mayor Michelle Wu. Boston’s 2030 Climate Action Plan, Draft – Summer 2025. [PUBLIC] Draft Boston 2030 Climate Action Plan – Summer 2025.pdf – Google Drive Mayor Marton J. Walsh. Climate Ready Boston – Final Report. December 2016. mass.gov/doc/boston-climate-ready-boston/download |
|
Copenhagen |
Copenhagen CPH 2020 Climate Plan. Roadmap 2021-2025. CPH 2025 Climate Plan – Roadmap 2021-2025 2020 Copenhagen Climate Adaption Plan. 2011. Miljø Metropolen. CPH 2025 Climate Plan – English 2012 The City of Copenhagen Cloudburst Management Plan 2012. Miljø Metropolen. 03_Cloudburst-Management-Plan.pdf |
|
Hamburg |
Hamburger Senat. 2025. Strategie zur Anpassung Hamburgs an den Klimawandel. Strategy for Hamburg’s adaptation to climate change ClimateAdatp. Four Pillars to Hamburgs’ Green Roof Strategy: financial incentive, dialogue, regulation, and science. |
|
Helsinki |
Helsinki’s climate change adaptation policies 2019–2025. City of Helsinki. 2019. https://www.hel.fi/static/kanslia/Julkaisut/2019/Helsinki-climate-change-adaptation-policies-2019-2025.pdf City of Helsinki. Environmental Report 2024. https://www.hel.fi/static/julkaisut/talous-strategia-hallinto/environmental-report-2024.pdf City of Helsinki’s Environmental Protection Targets 2040: Adopted by the City Board on 11 March 2024. City of Helsinki, https://www.hel.fi/static/kanslia/julkaisut/2024/HKI_Ymparistonsuojelun_tavoitteet_ENG_valmis_saav.pdf |
|
Lisbon |
CML-DMAEVCE – Direção Municipal de Ambiente, Estrutura Verde, Clima e Energia, CML-DAEAC – Departamento de Ambiente, Energia e Alterações Climáticas, Lisboa E-Nova – Agência de Energia e Ambiente de Lisboa. 2021. PAC Lisboa 2030. Uma cidade compremetida com o future. Lisbon 2030 Climate Action Plan. PAC Lisboa 2030 |
|
Paris |
C40 KnowledgeHub. Case Studies and Best Practice Examples. December 2024. Paris Climate Action Plan: Plan Climat 2024-2030 https://www.c40knowledgehub.org/s/article/Paris-climate-action-plan?language=en_US Overview of the 2024-2030 Climate Action Plan [English] https://cdn.paris.fr/paris/2024/05/13/planclimat_synthese_en_web-qG4w.pdf Catalogue des Fiches Actions du Plan Climat 2024-2030. https://cdn.paris.fr/paris/2024/12/18/catalogue_fiches_actions_vf-64nm.pdf Paris Climate Action Plan 2024-2030. Ville De Paris. https://cdn.paris.fr/paris/2025/06/25/plan-climat-en-9E8O.pdf |
|
California |
DRAFT California Climate Adaptation Strategy May 2024. https://climateresilience.ca.gov/overview/index.html Frequently Asked Questions Updated California Climate Adaptation Strategy https://climateresilience.ca.gov/overview/docs/20220404-CAS_FAQ.pdf |
|
Bydgoszcz |
Plan Adaptacji Miasta Bydgoszczy do zmian klimatu do roku 2030. [Adaptation Plan For The City Of Bydgoszcz Climate Change By 2030. Project – Version 9]. Plan_adaptacji_miasta_Bydgoszczy_do_zmian_klimatu_do_roku_2030.pdf |
Literature reviewed
Adaptation Scotland (2022) Capability framework for a climate ready public sector. Available at: https://www.adaptationscotland.org.uk/how-adapt/your-sector/public-sector/framework (Accessed: 16 August 2025).
Anantharajah, K. (2019) ‘Governing climate finance in Fiji: Barriers, complexity and interconnectedness’, Sustainability, 11(12), 3414.
Arfanuzzaman, M. (2024) ‘Bangladesh’s pathways to climate-resilient development: A methodical review’, World Development Sustainability, 4, 100144.
Arkema, K.K., Delevaux, J.M.S., Silver, J.M., Winder, S.G., Schile-Beers, L.M., Bood, N., Crooks, S. et al. (2023) ‘Evidence-based target setting informs blue carbon strategies for nationally determined contributions’, Nature Ecology and Evolution, 7(7), pp. 1045–1059.
Berrang-Ford, L., Biesbroek, R., Ford, J.D., Lesnikowski, A., Tanabe, A., Wang, F.M., Chen, C., Hsu, A., Hellmann, J.J., Pringle, P., Grecequet, M., Amado, J.C., Huq, S., Lwasa, S. and Heymann, S.J. (2019) ‘Tracking global climate change adaptation among governments’, Nature Climate Change, 9(6), pp. 440–449.
Berrang-Ford, L., Ford, J.D., Lesnikowski, A., Poutiainen, C., Barrera, M. and Heymann, S.J. (2014) ‘How are we adapting to climate change? A global assessment’, Mitigation and Adaptation Strategies for Global Change, 19(3), pp. 383–396.
Biagini, B., Bierbaum, R., Stults, M., Dobardzic, S. and McNeeley, S.M. (2014) ‘A typology of adaptation actions: A global look at climate adaptation actions financed through the Global Environment Facility’, Global Environmental Change, 25, pp. 31–40.
Biesbroek, R. and Delaney, A. (2020) ‘Mapping the evidence of climate change adaptation policy instruments in Europe’, Environmental Research Letters, 15(8), 083005.
Biesbroek, R., Berrang-Ford, L., Ford, J.D., Tanabe, A., Austin, S.E. and Lesnikowski, A. (2018) ‘Data, concepts and methods for large-n comparative climate change adaptation policy research: A systematic literature review’, Wiley Interdisciplinary Reviews: Climate Change, 9(6), e548.
Biesbroek, R., Broek, E., Engbersen, D., van Deursen, M., Agarwal, R., Thomas, A., Mukherji, A. and Njuguna, L. (2025) ‘Navigating the politics of transformational adaptation in international climate negotiations’, npj Climate Action, 4(1), article 3.
Bino, G., Brandis, K., Kingsford, R.T. and Porter, J. (2021) ‘Shifting goalposts: Setting restoration targets for waterbirds in the Murray-Darling Basin under climate change’, Frontiers in Environmental Science, 9, 785903.
Böhringer, C. (2003) ‘The Kyoto Protocol: A review and perspectives’, Oxford Review of Economic Policy, 19(3), pp. 451–466.
Bows-Larkin, A., Anderson, K., Bows, A. and Mander, S. (2008) ‘From long-term targets to cumulative emission pathways: Reframing UK climate policy’, Energy Policy, 36(10), pp. 3714–3722.
Brullo, T., Barnett, J., Waters, E. and Boulter, S. (2024) ‘The enablers of adaptation: A systematic review’, npj Climate Action, 3, article 40.
Buntaine, M.T., Parks, B.C. and Buch, B.P. (2017) ‘Aiming at the wrong targets: The domestic consequences of international efforts to build institutions’, International Studies Quarterly, 61(2), pp. 471–488.
Canosa, I.V., Ford, J.D., McDowell, G., Jones, J. and Pearce, T. (2020) ‘Progress in climate change adaptation in the Arctic’, Environmental Research Letters, 15(9), 093009.
Chandrakumar, C., Malik, A., McLaren, S.J., Owsianiak, M., Ramilan, T., Jayamaha, N.P. and Lenzen, M. (2020) ‘Setting better-informed climate targets for New Zealand: The influence of value and modelling choices’, Environmental Science and Technology, 54(7), pp. 4515–4527.
Chandrakumar, C., McLaren, S.J., Dowdell, D. and Jaques, R. (2019) ‘A top-down approach for setting climate targets for buildings: The case of a New Zealand detached house’, IOP Conference Series: Earth and Environmental Science, 323(1), 012183.
Chen, Y.-L. and Huang, M.-C. (2023) ‘Water usage reduction and CSR committees: Taiwan evidence’, Corporate Social Responsibility and Environmental Management, 30(3), pp. 1070–1081.
Christoff, P. and Eckersley, R. (2021) ‘Convergent evolution: Framework climate legislation in Australia’, Climate Policy, 21(9), pp. 1190–1204.
Dhyani, S., Murthy, I.K., Kadaverugu, R., Dasgupta, R., Kumar, M. and Gadpayle, K.A. (2021) ‘Agroforestry to achieve global climate adaptation and mitigation targets: Are South Asian countries sufficiently prepared?’, Forests, 12(3), 303.
Dilling, L., Prakash, A., Zommers, Z., Ahmad, F., Singh, N., de Wit, S., Nalau, J., Daly, M. and Bowman, K. (2019) ‘Is adaptation success a flawed concept?’, Nature Climate Change, 9(8), pp. 572–574.
Dzebo, A. (2019) ‘Effective governance of transnational adaptation initiatives’, International Environmental Agreements: Politics, Law and Economics, 19(4), pp. 447–466.
England, M.I., Dougill, A.J., Stringer, L.C., Vincent, K.E., Pardoe, J., Kalaba, F.K., Mkwambisi, D.D., Namaganda, E. and Afionis, S. (2018) ‘Climate change adaptation and cross-sectoral policy coherence in southern Africa’, Regional Environmental Change, 18(8), pp. 2349–2361.
Eriksen, S.H., Nightingale, A.J. and Eakin, H. (2015) ‘Reframing adaptation: The political nature of climate change adaptation’, Global Environmental Change, 35, pp. 523–533.
Essex, B., Koop, S.H.A. and van Leeuwen, C.J. (2020) ‘Proposal for a national blueprint framework to monitor progress on water-related Sustainable Development Goals in Europe’, Environmental Management, 65(1), pp. 1–18.
European Environment Agency (2015) National monitoring, reporting and evaluation of climate change adaptation in Europe. EEA Technical Report No. 20/2015. Available at: https://doi.org/10.2800/629559 (Accessed: 16 April 2026).
Feichter, C., Grabner, I. and Moers, F. (2018) ‘Target setting in multi-divisional firms: State of the art and avenues for future research’, Journal of Management Accounting Research, 30(3), pp. 29–54.
Ford, J.D., Berrang-Ford, L., Lesnikowski, A., Barrera, M. and Heymann, S.J. (2013) ‘How to track adaptation to climate change: A typology of approaches for national-level application’, Ecology and Society, 18(3), 40.
Ford, J.D., Tilleard, S.E., Berrang-Ford, L. and Araos, M. (2016) ‘Big data has big potential for applications to climate change adaptation’, npj Climate and Atmospheric Science, 1, article 3.
Garvey, A., Büchs, M., Norman, J.B. and Barrett, J. (2023) ‘Climate ambition and respective capabilities: Are England’s local emissions targets spatially just?’, Climate Policy, 23(8), pp. 989–1003.
Geden, O. (2016) ‘The Paris Agreement and the inherent inconsistency of climate policymaking’, Wiley Interdisciplinary Reviews: Climate Change, 7(6), pp. 790–797.
Goyette, J.-O., Savary, S., Blanchette, M., Rousseau, A.N., Pellerin, S. and Poulin, M. (2023) ‘Setting targets for wetland restoration to mitigate climate change effects on watershed hydrology’, Environmental Management, 71, pp. 365–378.
Hallegatte, S. (2009) ‘Strategies to adapt to an uncertain climate change’, Global Environmental Change, 19(2), pp. 240–247.
Jordan, A., Huitema, D., van Asselt, H. and Forster, J. (2010) ‘Allocation and architecture in climate governance beyond Kyoto: Lessons from interdisciplinary research on target setting’, Global Environmental Change, 20(3), pp. 361–369.
Judd, M., Bond, N. and Horne, A.C. (2022) ‘The challenge of setting “climate ready” ecological targets for environmental flow planning’, Frontiers in Environmental Science, 10, article 714877.
Kythreotis, A.P., Jonas, A.E.G., Mercer, T.G. and Marsden, T.K. (2020) ‘Rethinking urban adaptation as a scalar geopolitics of climate governance: Climate policy in the devolved territories of the UK’, Territory, Politics, Governance, 11(1), pp. 39–59.
Leiter, T., Olhoff, A., Al Azar, R., Barmby, V., Bours, D., Clement, V.W.C., Dale, T.W., Davies, C. and Jacobs, H. (2019) Adaptation metrics: Current landscape and evolving practices. Global Commission on Adaptation. Available at: https://unepccc.org/wp-content/uploads/2019/09/adaptation-metrics-current-landscape-and-evolving-practices.pdf (Accessed: 16 April 2026).
Lesnikowski, A., Ford, J.D., Berrang-Ford, L., Barrera, M. and Heymann, S.J. (2015a) ‘Adaptation tracking for a post-2015 climate agreement’, Nature Climate Change, 5(12), pp. 967–969.
Lesnikowski, A., Ford, J.D., Berrang-Ford, L., Barrera, M. and Heymann, S.J. (2015b) ‘National-level factors affecting planned, public adaptation to health impacts of climate change’, Global Environmental Change, 35, pp. 85–97.
Ligozat, A.-L., Brun, C., Demirdjian, B., Gouget, G., Jardé, E., Mialon, A., Mouronval, A.-S., Pagani, L. and Vieu, L. (2024) ‘Setting climate targets: The case of higher education and research’, bioRxiv, preprint.
Luh, J., Ojomo, E., Evans, B. and Bartram, J. (2017) ‘National drinking water targets: Trends and factors associated with target-setting’, Water Policy, 19(5), pp. 851–866.
Lyytimäki, J., Lonkila, K.-M., Furman, E., Korhonen-Kurki, K. and Lähteenoja, S. (2021) ‘Untangling the interactions of sustainability targets: Synergies and trade-offs in the Northern European context’, Environment, Development and Sustainability, 23(3), pp. 3458–3473.
Magnan, A.K. (2016) ‘Metrics needed to track adaptation’, Nature, 530(7589), p. 160.
Maldet, M., Lettner, G., Loschan, C., Schwabeneder, D. and Auer, H. (2023) ‘Creating an indicator system for the United Nations Sustainable Development Goals in communities and municipalities: Application and analysis in an Austrian case study’, Heliyon, 9(8), e19010.
Marinazzo, D. (2025) ‘With behaviors like these in complex systems, who needs mechanisms?’, Physics Magazine, 18(71).
Matthews, J.H., Forslund, A., McClain, M.E. and Tharme, R.E. (2014) ‘More than the fish: Environmental flows for good policy and governance, poverty alleviation and climate adaptation’, Aquatic Procedia, 2, pp. 16–23.
Mazzocchi, F. (2025) ‘An investigation into the notion of complex systems’, Foundations of Science, advance online publication.
Mees, H.L.P. and Driessen, P.P.J. (2019) ‘The roles of residents in climate adaptation: A systematic review in the case of the Netherlands’, Environmental Policy and Governance, 29(4), pp. 198–212.
Mongelli, F.P., Ceglar, A. and Scheid, B.A. (2024) Why do we need to strengthen climate adaptations? Scenarios and financial lines of defence. ECB Working Paper No. 3005. European Central Bank. Available at: https://ideas.repec.org/p/ecb/ecbwps/20243005.html (Accessed: 16 April 2026).
Moser, S.C. and Ekstrom, J.A. (2010) ‘A framework to diagnose barriers to climate change adaptation’, Proceedings of the National Academy of Sciences, 107(51), pp. 22026–22031.
Neocleous, P., Smith, P., Anders, A., Dichtl, J. and Li, Z. (2023) Principles for responsible banking: Guidance for banks on climate adaptation target setting. United Nations Environment Programme Finance Initiative. Available at: https://www.unepfi.org/wordpress/wp-content/uploads/2023/11/PRB-Adaptation-Target-Setting-Guidance.pdf (Accessed: 16 April 2026).
Oberthür, S. and Kelly, C.R. (2008) ‘The European Union in international climate policy: The prospect for leadership’, International Affairs, 84(1), pp. 1–21.
Oberthür, S. and Pallemaerts, M. (eds) (2010) The climate policy of the European Union: Origins, evolution and prospects. Brussels: Institute for European Studies.
OECD (2023a) Funding civil society in partner countries: Toolkit for implementing the DAC recommendation on enabling civil society in development co-operation and humanitarian assistance. Paris: OECD Publishing.
OECD (2023b) A territorial approach to climate action and resilience. OECD Regional Development Studies. Paris: OECD Publishing.
OECD (2023c) Scaling up adaptation finance in developing countries: Challenges and opportunities for international providers. Green Finance and Investment. Paris: OECD Publishing.
OECD (2023d) Glossary of key terms in evaluation and results-based management for sustainable development. 2nd edn. Paris: OECD Publishing.
Oliver, T.H., Benini, L., Borja, A., Dupont, C., Doherty, B., Grodzińska-Jurczak, M., Iglesias, A., Jordan, A., Kass, G., Lung, T., Maguire, C., McGonigle, D., Mickwitz, P., Spangenberg, J.H. and Tarrason, L. (2021) ‘Knowledge architecture for the wise governance of sustainability transitions’, Environmental Science and Policy, 126, pp. 152–163.
Puig, D., Adger, N.W., Barnett, J., Vanhala, L. and Boyd, E. (2025) ‘Improving the effectiveness of climate change adaptation measures’, Climatic Change, 178(7).
Puig, M., Cirera, A., Wooldridge, C., Sakellariadou, F. and Darbra, R.M. (2024) ‘Mega ports’ mitigation response and adaptation to climate change’, Journal of Marine Science and Engineering, 12(7), 1112.
Raiser, K., Kornek, U., Flachsland, C. and Lamb, W.F. (2020) ‘Is the Paris Agreement effective? A systematic map of the evidence’, Environmental Research Letters, 15(8), 083006.
Reckien, D., Salvia, M., Heidrich, O., Church, J.M., Pietrapertosa, F., De Gregorio-Hurtado, S. et al. (2018) ‘How are cities planning to respond to climate change? Assessment of local climate plans from 885 cities in the EU-28’, Journal of Cleaner Production, 191, pp. 207–219.
Rexer, J. and Sharma, S. (2024) Climate change adaptation: What does the evidence say? Policy Research Working Paper No. 10729. World Bank Group. Available at: https://documents1.worldbank.org/curated/en/099832003202474878/pdf/IDU-d6aad48f-890e-4245-b9d4-13ed5f8de6b6.pdf (Accessed: 16 April 2026).
Robinson, S.A. (2020) ‘Climate change adaptation in SIDS: A systematic review of the literature pre and post the IPCC Fifth Assessment Report’, Wiley Interdisciplinary Reviews: Climate Change, 11(5), e653.
Roggero, M. and Thiel, A. (2021) ‘A policy mixes approach to conceptualizing and measuring climate change adaptation policy’, Environmental Policy and Governance, 31(1), pp. 3–15.
Sietsma, A.J., Ford, J.D., Callaghan, M.W. and Minx, J.C. (2021) ‘Progress in climate change adaptation research’, Environmental Research Letters, 16(5), 054038.
Simonson, W.D., Miller, E., Jones, A., García-Rangel, S., Thornton, H. and McOwen, C. (2021) ‘Enhancing climate change resilience of ecological restoration: A framework for action’, Perspectives in Ecology and Conservation, 19(3), pp. 300–310.
Sulistiawati, L.Y. (2020) ‘Indonesia’s climate change nationally determined contributions: A far-fetched dream or possible reality?’, IOP Conference Series: Earth and Environmental Science, 423, 012022.
Tompkins, E.L., Vincent, K., Nicholls, R.J. and Suckall, N. (2018) ‘Documenting the state of adaptation for the global stocktake of the Paris Agreement’, Wiley Interdisciplinary Reviews: Climate Change, 9(5), e545.
Tsvetkov, P. and Andreichyk, A. (2025) ‘The analysis of goals, results, and trends in global climate policy through the lens of regulatory documents and macroeconomics’, Sustainability, 17(10), 4532.
United Nations Environment Programme (2021) Adaptation gap report 2020. Nairobi: United Nations Environment Programme. Available at: https://www.unep.org/resources/adaptation-gap-report-2020 (Accessed: 16 April 2026).
United Nations Environment Programme (2022) Adaptation gap report 2022: Too little, too slow – climate adaptation failure puts the world at risk. Nairobi: United Nations Environment Programme. Available at: https://www.unep.org/resources/adaptation-gap-report-2022 (Accessed: 16 April 2026).
United Nations Environment Programme (2024) Adaptation gap report 2024. Nairobi: United Nations Environment Programme. Available at: https://www.unep.org/resources/adaptation-gap-report-2024 (Accessed: 16 April 2026).
van de Steeg, J., Kinyangi, J., Notenbaert, A., Thornton, P.K. and Herrero, M. (2009) ‘Using climate information for priority setting and to target risk management and adaptation strategies in Africa’, IOP Conference Series: Earth and Environmental Science, 6, 392031.
van Herten, L.M. and van de Water, H.P.A. (2000) ‘Health policies on target? Review on health target setting in 18 European countries’, European Journal of Public Health, 10(suppl. 4), pp. 11–16.
Watkiss, P. and Hunt, A. (2019) ‘Economic appraisal of adaptation options for the agriculture sector’, in Economic tools and methods for the analysis of global change impacts on agriculture and food security. Cham: Springer, pp. 131–148.
Watts, M. (2022) ‘Deadline 2020: Mayoral leadership on science-based targets – Setting the standard for climate action’, Journal of City Climate Policy and Economy, 1(1), article 0002.
Wise, R.M., Fazey, I., Stafford Smith, M., Park, S.E., Eakin, H.C., Archer van Garderen, E.R.M. and Campbell, B. (2014) ‘Reconceptualising adaptation to climate change as part of pathways of change and response’, Global Environmental Change, 28, pp. 325–336.
Yule, E.L., Kythreotis, A.P., Harcourt, R., Howarth, C., Porter, J., Falloon, P. et al. (2025) ‘The opportunities and challenges of developing and implementing local climate adaptation targets’, PLOS Climate, 4(5), e0000634.
Zhang, P., Liu, D.C. and Lyu, S. (2023) ‘Leadership mobility and target adaptation: Does previous target achievement matter?’, Public Performance and Management Review, 47(1), pp. 204–231.
Ziervogel, G. and Taylor, A. (2008) ‘Feeling stressed: Integrating climate adaptation with other priorities in South Africa’, Environment, 50(2), pp. 32–41.
Zyzak, B. and Farsund, A.A. (2025) ‘Coordination of complex systems: The case of public policy meta-organisations’, European Management Journal, advance online publication.
Appendices
Sampling methodology for selecting national-level jurisdictions
Estimates suggest that, as of 2024, 171 countries (87%) have at least one national adaptation planning instrument in place (Adaptation Gap Report 2024). However, no single repository provides comprehensive information on which include monitoring, evaluation and learning (MEL) systems, or have established adaptation targets.
To identify the countries that are most likely to have developed adaptation targets, we began from two assumptions:
- Planning instruments without a MEL framework are unlikely to have adaptation targets, so we first identified countries with established MEL systems.
- The more advanced the MEL system, the more likely it is to include adaptation targets.
Using these assumptions, we developed a four-step process to identify the national jurisdictions with well-developed MEL systems.
Step I: Identify national jurisdictions that submitted a NAP to the UNFCC and developed a MEL framework
Using the NAP Global Network Trends database, we identified:
- 62 countries that have submitted a National Adaptation Plan (NAP) to the UNFCCC.
- Among these, countries that have:
- Developed a supporting MEL framework (45 countries)
- Established MEL indicators (41 countries)
- Committed to progress reporting, indicating advancement of their MEL system (52 countries)
Step II: Identify additional jurisdictions with MEL systems not submitted to UNFCCC
Because many high-income countries do not submit adaptation plans to the UNFCCC, additional sources were required.
- Using Leiter et al. (2021)[5], we identified additional countries that have developed a MEL system for their adaptation instrument, even if these instruments were not submitted to the UNFCCC.
- We also used the categorisation described in the same source to determine the stage of development of each country’s MEL system i.e.
- Starting Intention
- Early Stage
- Development Stalled
- Advanced Stage
- NAP M&E System Approved
- Progress Report Published
- Evaluation Published
Step III: Identify countries that have published NAP progress reports
- A published NAP progress report indicates that a country is more likely to have a well-developed and actively used MEL system, recognizing that reporting is only one component of MEL and may not fully reflect the existence of formal MEL frameworks, indicators, or processes. Using the UNEP Adaptation Gap Report (2024), we identified countries that have publicly available NAP progress reports.
Step IV: Select national jurisdictions with well-developed MEL systems and characteristics similar to Scotland
- Using the combined results from Steps I–III, we identified 47 jurisdictions with the strongest evidence of well-developed MEL systems.
- We then used a Large Language Model (LLM) to compare these jurisdictions with Scotland, assessing the degree of similarity across relevant characteristics specifically governance structures, socio-economic features and institutional arrangements.
- Based on this analysis, we selected 22 jurisdictions for further examination.
The 22 national jurisdictions selected for further analysis were:
Austria, Belgium, Brazil, Canada, Chile, Czech Republic, Finland, France, Germany, Ireland, Japan, Kenya, Netherlands, New Zealand, Norway, Philippines, South Africa, Spain, Switzerland, South Korea, Thailand, Rwanda
These jurisdictions were examined in detail to determine whether their adaptation instruments included specific targets.
Limitations
- Some countries may have updated their adaptation plans since Leiter et al. (2021) and could therefore have developed new or revised MEL frameworks and targets since then.
- Adaptation plans do not always explicitly include a MEL framework. While reasonable effort was made to identify such frameworks, through primary and secondary sources, some may have been overlooked or unavailable publicly.
Sampling methodology for selecting subnational-level jurisdictions
The review of national adaptation plans revealed that few included explicit targets. Following discussion with the project steering committee, the scope of analysis was expanded to include subnational jurisdictions.
Evidence suggests that, while European cities are increasingly developing MEL systems, quantified targets are still uncommon.
The European Environment Agency (EEA) report Urban adaptation in Europe shows that although cities and regions are developing monitoring and evaluation indicators and tools, only 55% of European local climate action plans include metrics that could measure progress. Of these, 72% focus on action outputs rather than targets or outcomes. Only 2% of indicators were linked to specific targets (Ramboll, 2024 in EEA 2024. Urban adaptation in Europe: what works? Implementing climate action in European cities. EEA Report 14/2023). The report also stresses that more tangible local targets are needed to measure progress and enable effective scaling of adaptation efforts.
A 2022 study by Gancheva, Lundberg and Vroom (Climate adaptation: Measuring performance, defining targets and ensuring sustainability European Union) reviewed the adaption plans of three cities (Athens, Kielce and Stockholm) and two regions (Flanders and North Rhine-Westphalia), finding broad objectives but no clear quantitative targets.
Given this context we took a purposeful sampling approach drawing on:
- suggestions from within the research team, CXC and the Scottish Government team.
- literature from the review in Phase 1 identifying cities with more advanced MEL systems
- expert input including informal insight from one of the authors of the Ramboll, 2024 publication (informally) who identified cities known to have set targets.
Based on this process and together with the steering committee we identified 8 cities and 1 region to research further.
Barcelona, Boston, Copenhagen, Hamburg, Helsinki, Lisbon, Paris, Bydgoszcz, and California.
|
Framework feature / characteristic |
Questions for analysis[6] |
|---|---|
|
Status |
|
|
Governance of target development |
|
|
Purpose/motivation |
|
|
Political economy and decision-making dynamics |
|
|
Stakeholder engagement approach |
|
|
Technical and scientific foundation |
|
|
Resource and capacity considerations |
|
|
Timeline and Sequencing |
|
|
Influences and learning |
|
|
Integration and coherence with existing planning |
|
|
Quality and characteristics of targets |
|
We developed a list of interview questions to guide key informant discussions, selecting a tailored subset for each participant based on their role and experience with adaptation target setting. Interviews lasted 45–60 minutes and followed a semi-structured format: each had a customised topic guide to steer the conversation, but interviewers followed participant responses flexibly, meaning not all questions were asked in every case.
Ethical Considerations
Informed written consent was obtained from all participants prior to interview. Each participant received a consent form in advance, which they reviewed, digitally signed and returned. At the start of every interview, verbal consent was also confirmed to ensure participants were fully aware of the purpose of the research and their rights.
Topic Guide with full questions
Thank you for agreeing to take part in this interview. Before we begin, I’d like to briefly remind you of the purpose of our conversation.
This interview is part of research on setting and monitoring adaptation targets, carried out to inform how the Scottish Government measures its progress on adaptation and resilience. We are interested in hearing your perspective on how adaptation targets have, or have not, been developed in your country [or city].
Your participation is voluntary. You can skip any question or stop the interview at any time. With your permission, I would like to take notes and/or record the conversation. Everything you share will be confidential and used only for the purposes of this research. The interview will take around 45–60 minutes.
Before we start:
- Do you have any questions about the research?
- Can we confirm that you have received, signed, and returned the consent form?
- Do you feel comfortable proceeding?
|
Theme |
Possible questions | |
|---|---|---|
|
1. |
Introduction |
|
|
2. |
Defining and framing adaptation targets |
|
|
3. |
Status and development process |
|
|
3. |
Status and development process |
|
|
4. |
Quality and characteristics of targets |
Nature and level of targets
Design of targets
Purpose of targets
|
|
5. |
Purpose and motivations |
Drivers of target setting
Agreement and support
Nature of response
Influence of purpose
|
|
6. |
Integration and coherence |
National and sectoral alignment
International alignment
|
|
7. |
Governance and institutions |
|
|
8. |
Political economy and decision-making |
|
|
9. |
Stakeholder engagement |
Process and participation
Challenges and influence
Balancing priorities
|
|
10. |
Knowledge and technical capacity |
Use of evidence
Risk and decision-making
Technical capacity
|
|
11. |
Resources and feasibility |
|
|
12. |
Timeline and sequencing |
|
|
Final reflections and closing |
Closing Remarks
|
Nick Brooks, for Climate Sense, October 2025
Elements and indicators in the SNAP3 MEL Framework
The SNAP3 MEL framework defines the following five elements across the four SNAP3 themes (nature, communities, public services, and economy and industry):
- Strategic aim: to ‘build Scotland’s resilience to climate change’ as part of Scotland’s set of National Outcomes (applies across all four themes)
- Outcome: what the policies and activities set out in the Plan expect to accomplish in the longer term to bring about increased resilience to climate change impacts in Scotland (one per theme, broken down into 2-4 areas)
- Objectives: the aims of the policies in the plan over its delivery period, which if achieved should lead to progress toward the intended outcomes (3-6 per theme)
- Enablers: enabling factors that overcome barriers to achieving outcomes and objectives in SNAP3. Objectives and outcomes will only be achieved if critical enabling factors are in place and barriers removed (21-30, across 6-7 areas per theme)
- Activities: the activities occurring from the key policies and delivery mechanisms set out in SNAP3 which will deliver the objectives and outcomes and put in place the necessary enablers for these to be achieved (12-21, across 4-6 areas per theme)
The MEL framework also defines indicators at the level of outcomes (2-6 per theme; 16 in total) and objectives (8-13 per theme; 40 in total). Outcome indicators measure phenomena such as ecological health, public awareness, community action and wellbeing, collaboration across public services, levels of risk assessment and action in the public and private sectors, employment in green jobs, and uptake of grants for specific adaptation actions.
SNAP3 MEL through the lens of outputs, outcomes and impacts
The SNAP3 outcome indicators echo outcome indicators used in other adaptation contexts. Typically, outcomes are defined as short- to medium-term changes resulting from the outputs of adaptation activities (OECD 2023). Outputs are defined as goods and services and short-term changes that are under the control of those implementing adaptation actions (OECD 2023). In adaptation contexts, outcomes are often changes in capacities, capabilities and characteristics that make populations and systems better able to anticipate, plan for, cope with, recover from and adapt to climate related tresses and shocks, i.e. more resilient. Changes in resilience, measured in terms of these capacities, capabilities and characteristics therefore are often measured at the outcome level (e.g. Venable et al. 2022).
Outcomes contribute to longer-term impacts that, in adaptation contexts, can be seen as the ultimate measure of adaptation performance or success. These might include reduced losses and damages and improvements in climate-sensitive aspects of human, ecological and economic wellbeing such as health, poverty and inequality, relative to a historical baseline or ‘no-adaptation’ counterfactual. These measures indicate whether inferred changes in resilience, as measured at the outcome level, have translated into reduced harms from climate change.
The SNAP3 Objective indicators represent a mix of output, outcome, and impact indicators as typically defined in adaptation MEL contexts based on the OECD (2023) definitions. These include indicators of losses and damages in the form of properties flooded and disruptions to transport and supply chains under the Public Services and Economy and Industry themes. Certain activities and enablers in the SNAP3 MEL framework exhibit characteristics of outputs and outcomes and might also be tracked using output and outcome indicators.
Although SNAP3 does not define indicators at the impact level, there is considerable scope to define such indicators. These would measure climate related losses and damages and climate-sensitive aspects of human, ecological and economic wellbeing as indicators of longer-term adaptation performance/ effectiveness at a level above that of the SNAP3 outcomes. As such, they would provide a way of assessing progress towards the SNAP3 strategic aim.
Implications for target setting
The SNAP3 MEL framework already includes numerous quantitative indicators against which targets and milestones might be set. Viewing the framework through the lens of outputs, outcomes and impacts demonstrates that there is scope for identify additional indicators, and by implication targets, at these three levels, linked through a theory of change that relates changes in one level to changes in the next level up. This could be done while retaining the current SNAP3 MEL architecture of activities, enablers, objectives and outcomes.
A subset of SNAP3 objective indicators might be associated with targets for the delivery of certain outputs and the achievement of certain outcomes. The outcomes of most interest in relation to target setting are likely to be those associated with changes that most demonstrably increase resilience. These might include targets for the adoption of certain management regimes and access to key services and resources. They also might include tolerances and coping ranges measured in terms of the severity of a specific hazard that can be accommodated without significant adverse impacts (for which definitions and thresholds need to be agreed) (European Commission 2013, Brooks et al. 2019a).
A set of impact level indicators and targets could be defined to measure success in delivering the SNAP3 strategic aim, based on avoided losses, damages and harm. These might include existing indicators of losses and damages in the SNAP3 framework, for which targets might be developed. Such impact level targets would need to be reviewed and potentially revised in the light of escalating climate risks. Consequently, any such targets might best be used as benchmarks against which adaptation performance is measured for the purpose of learning and policy revision, rather than binding goals. If these targets were based on avoided, rather than actual, losses and damages, baselines would need to be established based on historical data or ‘no-adaptation’ counterfactuals, for which methodologies are emerging and might be further developed (Brooks et al. 2019b).
Questions for consideration when developing adaptation targets
- To what extent should targets be linked to existing indicators, the logic of the existing SNAP3 MEL framework, and each other (through a theory of change)?
- Is the current SNAP3 MEL architecture appropriate, or would a framework based on outputs, outcomes and impacts be preferable for target setting?
- Are new indicators with associated targets required; if so, at what levels?
- Are any activities and enablers in the SNAP3 MEL framework useful for target setting?
- Should targets be set for delivery/implementation of SNAP3 policies (output level)?
- Should targets be set for improvements in the capacities that make people, places and systems more resilient (outcome level)?
- Can outcome targets be developed that specify the severity of specific hazards that certain national systems should accommodate to ground targets in climate risk?
- Should additional indicators targets be developed based losses and damages, building on existing indicators under SNAP3 themes (impact level)?
- How would targets based on losses and damages be operationalised, given the need for baselines and the evolving nature of climate change risks?
- Should targets be associated with milestones?
- How many targets are appropriate (at each level and in total)?
- Case Summaries of Adaptation Target Approaches in Interviewed Jurisdictions
Countries
Austria
Austria’s adaptation governance is collaborative, iterative and consensus driven. Adaptation targets have been shaped primarily through coordination and agreement across ministries, rather than through statutory obligation or central imposition.
Institutional Context
Adaptation competences are spread across several sectors and governance levels. National Adaptation sits within the Ministry for Climate Action, Environment, Forestry, Agriculture, Water and Regions. The National Adaptation Strategy (NAS) and National Adaptation Plan (NAP) are developed in a broad stakeholder process and are now in their third iteration. The cycle involves strategy revision, publication of a progress report, and subsequent updating. The adaptation team does not direct sectoral ministries but plays a coordinating role, convening actors, facilitating dialogue, identifying risks and synergies and working to prevent maladaptation. The strategy is structured around 14 policy areas (e.g. water management, construction and housing, health, tourism) and – complemented by scientific evidence, studies and literature – relies on workshops and expert consultation to ensure interdisciplinary input and co-ownership.
Why Austria Has Not Adopted SMART Targets
SMART (specific, measurable, achievable, relevant, time-bound) adaptation targets have not been formally adopted. Interviewees saw this as a response to the complexity of adaptation. Climate impacts vary across sectors and evolve over time. Attribution is difficult and isolating the effects of specific measures from broader socio-economic change or intensifying climate risks is not easy. Baselines also shift as climate risks intensify, making it unclear whether targets should focus on reducing absolute harm or limiting the rate of increase.
Heat-related morbidity and mortality was cited as an example. Should a target focus on reducing total deaths, while exposure is increasing? Or slow the rate of increase in impacts? Which baseline year should be used? If damages increase despite adaptation efforts, does this indicate policy failure, insufficient ambition, or more severe climate conditions? Interviewees noted that numeric targets could provide a sense of certainty that may not fully reflect this underlying complexity. These challenges, combined with Austria’s coordination-based governance model, have contributed to caution about rigid quantitative thresholds. Instead, the strategy relies on dialogue, quantitative and qualitative assessment and iterative monitoring to balance ambition with realism.
How Target Discussions Take Place
Adaptation goals are developed through sector workshops. Ministries, provinces, academia, social partners, NGOs and practitioners review challenges and goals, assess climate risk and measures’ relevance and discuss progress. This helps define ambition while maintaining cross-sector ownership and ensuring effectiveness as well as inclusion of social aspects. Targets are structured at three levels:
- One overarching national goal focused on resilience and synergies.
- Sector-level overarching goals.
- Sub-targets within sectors.
Vulnerability assessments underpin these discussions by describing expected climate trends and sectoral risks. Rather than planning against a single prescribed climate scenario, the strategy presents a range of projected developments. No specific scenario is embedded as a binding benchmark.
Monitoring Through Structured Dialogue
Monitoring combines quantitative indicators with structured expert review. The process includes:
- 47 quantitative and qualitative criteria
- Workshops across all 14 sectoral areas.
- Structured qualitative ratings of progress.
- Descriptive feedback from participants.
Experts (from ministries, provinces, academia and practice) review progress towards set goals, sub-targets and recommended activities (over 120 in total), assessing progress using a structured scale and providing contextual explanation. The Environment Agency synthesises indicator data and workshop findings into the progress report, with participants given the opportunity to review interpretations before publication. Although the strategy and reports are not legally binding, influence derives from stock-taking, inter-ministerial coordination, professional networks and sustained dialogue rather than formal enforcement.
Reflections and Lessons
Austria’s approach shows that structured adaptation governance can develop without adopting formal SMART targets. Progress has been driven by collaborative monitoring, sustained networks and regular revision of strategy. Interviewees highlighted the importance of engaging sector experts early, linking monitoring to practical solutions, maintaining trust across institutions and recognising the value of qualitative information, particularly for social dimensions of adaptation.
While international debate around SMART targets continues, Austria’s approach reflects a system in which ambition is shaped through consensus, coordination and realism about measurement challenges. The case demonstrates how institutional culture and governance arrangements influence adaptation target-setting alongside technical considerations.
Germany
Germany’s approach to adaptation target-setting is legally mandated, organised around seven thematic clusters, each led by a responsible ministry and embedded in a formal policy cycle. The Climate Adaptation Act requires the national adaptation strategy to include measurable targets, indicators and measures. Although the law mandates targets, their content and ambition are negotiated between ministries rather than imposed centrally.
Institutional and Legal Context
The Act formalised adaptation target-setting within a structured policy cycle. It introduced a four-year strategy revision cycle and an eight-year national climate risk assessment, embedding targets within a recurring assessment–monitoring–revision process. Before the Act, Germany had an adaptation strategy but no legal requirement to define measurable targets. Interviewees described the legislation as providing both political momentum and an institutional framework that strengthened coordination across ministries. However, the Act does not prescribe specific target levels, nor does it include sanctions for non-compliance. Where targets are not met, ministries are expected to propose corrective measures. In practice, targets function as steering and accountability tools rather than enforceable legal thresholds.
How Targets Were Developed
Target development was coordinated through the Inter-Ministerial Working Group on Adaptation. The Environment Ministry provided overall guidance, but line ministries drafted their own targets within the cluster structure. Advice was given that “good” adaptation targets should:
- Align with priority risks identified in the national climate risk assessment
- Be influenceable at national level
- Focus on outcomes rather than counting measures
- Be time-bound where feasible (with at least one 2030 target per cluster)
Each cluster was initially asked to propose three to five targets to ensure manageability. Drafts were reviewed and revised through technical exchanges and formal consultation, with overlaps resolved through facilitated discussion. Decentralised ownership was considered preferable to centrally imposed ambition and ministries were expected to only commit to targets they were prepared to implement.
What “Measurable” Means in Practice
The meaning of “measurable” varies across clusters. Some targets include explicit quantitative values and timelines while others define directional change, supported by developing indicators. In several cases, targets were adopted before appropriate indicators existed. Indicator systems are being refined over each successive cycle, with ministries commissioning research to address data gaps. Interviewees described target-setting as pragmatic, with scientific assessment balanced by political and practical considerations. Not all targets meet ideal criteria but this is accepted as part of institutional learning. The priority was to begin measurable target-setting and improve precision over time.
Stakeholder and Citizen Engagement
Structured stakeholder engagement accompanied target development. This included consultation on draft targets and the draft strategy, online input and a dialogue event involving around 60–70 stakeholders and approximately 40 ministry representatives. Stakeholders contributed expertise and suggested refinements, although final decisions remained with ministries. Separate regional citizen dialogues invited randomly selected participants to articulate visions of a climate-resilient Germany. Their input influenced the strategy’s vision more than the technical design of targets.
Funding, Ownership and Constraints
There is no central adaptation fund; ministries finance measures within existing budgets. Many measures were already underway and were incorporated into the adaptation framework. Fiscal constraints and political feasibility shaped the level of ambition, and not all identified risks are addressed in the first cycle. Targets are anchored in the national climate risk assessment, which prioritises high-risk areas.
Monitoring and Iteration
Germany’s framework operates as a structured policy cycle linking risk assessment, strategy, monitoring and revision. Targets may be refined or made more quantitative in subsequent cycles, and indicator systems are expected to mature over time. This iterative design allows ambition to develop progressively rather than requiring full precision from the outset.
Reflections and Lessons
Germany’s experience shows how a legal mandate can establish adaptation targets while still leaving space for negotiation between ministries. Targets are organised within seven thematic clusters, with each ministry responsible for developing and delivering its own commitments. Although the law requires targets to be set, their ambition and design emerge through discussion rather than central direction. The process combines stakeholder engagement with gradual improvement in measurement, linking targets to a regular cycle of monitoring and revision. In this way, measurable targets operate as practical governance tools, shaped by risk assessments, ministerial ownership and available resources.
Canada
Canada’s approach to adaptation target-setting is driven by national priorities and oriented toward mainstreaming resilience across systems. Targets were introduced through the development of the 2023 National Adaptation Strategy (NAS), rather than through legislation. While not legally mandated, they were intended to introduce measurable commitments to pursue near-term action.
Institutional Context
The NAS is organised around five interconnected “systems” (e.g. health and well-being, infrastructure, disaster resilience, nature and biodiversity, and economy and workers), each led by a responsible federal department. Environment and Climate Change Canada (ECCC) coordinates overall delivery, while central agencies, including Treasury Board and Finance, participate in formal governance structures to provide oversight of federal implementation. In Canada’s federal system, implementation requires collaboration with provinces, territories and Indigenous governments, and the NAS was framed as a shared vision for whole-of-society action rather than a top-down directive. Targets are not enshrined in law, and there are no statutory penalties for non-compliance. Accountability instead relies on public reporting, audit scrutiny and periodic strategy renewal.
Why Targets Were Introduced
Interviewees described the inclusion of targets as both political and strategic. The insurance sector had advocated for measurable national adaptation goals for over a decade, arguing that escalating climate losses required clearer risk reduction benchmarks. At the same time, the federal government sought to secure whole-of-society buy-in and demonstrate progress on resilience. Targets were intended to:
- Drive implementation beyond high-level goals.
- Focus limited resources on priority risks.
- Trigger the development of measurement approaches.
The decision to include measurable targets came relatively late in the policy process. Once confirmed, departments were instructed to develop near-term, realistic targets aligned with existing programs and funding streams.
How Targets Were Developed
Each “system lead” department drafted targets within its domain, coordinated by ECCC. Departments were encouraged to ensure targets were measurable, achievable and aligned with current policy instruments. In the first NAS cycle, many targets focus on mainstreaming i.e. embedding climate risk into planning, investment and service delivery.
As a result, targets often address process and capacity-building outcomes (e.g. integrating risk into decision-making, expanding program participation) alongside longer-term resilience ambitions. Near-term milestones were prioritised to build momentum. Interviewees acknowledged that ambition was shaped by funding constraints and political feasibility. Departments were cautious about committing to targets without guaranteed resources.
What “Measurable” Means in Practice
Canada’s 25 targets vary in specificity. Some include quantitative thresholds and timelines and others combine directional outcomes with supporting indicators. In certain cases, long-term ambitions (e.g. eliminating heat-related deaths by 2040) were included to signal the scale of transformation required, even where pathways remain uncertain.
Interviewees described targets as tools to mobilise action and improve coordination rather than as precise scientific endpoints. Where data gaps exist, monitoring and evaluation frameworks are being developed and expanded. The forthcoming progress report is expected to assess performance towards targets using both qualitative and quantitative assessments.
Funding, Leverage and Iteration
Funding limitations significantly shaped target design. Dedicated adaptation funding was lower than initially requested, leading some departments to align targets with initiatives already underway. A key strategy has been to mainstream resilience into major investment streams such as infrastructure and federal asset management. Through Treasury Board’s Greening Government Strategy and oversight role, resilience requirements are increasingly embedded in federal planning and procurement processes. The NAS will be updated over time, with a next update planned by 2030. Targets are expected to be reviewed and updated in future cycles. Accountability is maintained through public reporting, Auditor General scrutiny and periodic strategy updates informed by evolving climate science and awareness of Canada’s top climate risks.
Reflections and Lessons
Canada’s experience demonstrates how measurable adaptation targets can be introduced through political commitment rather than legislation. The approach is characterised by distributed accountability across system leads, strong horizontal coordination and an emphasis on mainstreaming as a first step. Targets function as coordination and mobilisation tools within Canada’s federated system, shaped by risk assessment, fiscal realities and intergovernmental dynamics.
The Netherlands
The Netherlands approaches adaptation target-setting in two different ways. In flood and water management, clear legal standards and stable funding are already in place. However, in broader adaptation policy, covering sectors such as health, agriculture and infrastructure, target setting has developed more gradually, with targets emerging through dialogue and practical experience rather than fixed national thresholds.
Institutional Context
Dutch adaptation policy is shaped by two main programmes. The Delta Programme, backed by the Delta Act and supported by around €1 billion per year, focuses on flood risk, freshwater supply and spatial adaptation. It operates with clear legal standards, for example flood protection levels of 1:100,000 per year, alongside stable governance and financing. Alongside this sits the National Adaptation Strategy, which addresses sectors beyond water management, including health, agriculture, infrastructure and nature. When first adopted in 2016, the strategy focused less on quantitative targets and more on raising awareness and engaging ministries that were still beginning to see adaptation as part of their responsibilities. Early efforts therefore concentrated on strengthening coordination rather than defining measurable thresholds.
Why Quantitative Targets Are Uneven
The Netherlands has a long history of numerical standards in flood management, supported by established institutions and monitoring systems. Similar standards do not yet exist across other areas of adaptation. Outside the water sector, responsibilities are more fragmented, data and capacity vary and acceptable levels of risk are less clearly defined. Interviewees noted that, unlike mitigation policy, adaptation does not have a single metric such as CO₂ emissions. For hazards such as heat, drought or pluvial flooding, there is less agreement on acceptable risk levels and how ambition should be measured. While flood protection norms are well established, other sectors are still working out how to translate climate risk into concrete targets. One idea discussed was that adaptation policy should at least ‘keep pace’ with climate change. In practice, this means ensuring that as hazards intensify, preparedness and protection increase accordingly so that overall risk does not rise without corresponding action. Rather than eliminating risk entirely, the aim is to prevent the gap between rising climate pressures and adaptive capacity from widening. The focus is therefore on maintaining resilience over time rather than setting a single fixed threshold.
Monitoring as a Driver of Target Clarity
A distinctive feature of the Dutch approach has been experimentation with monitoring as a way of clarifying goals. While formal national monitoring is coordinated centrally, the Climate Adaptation Services (CAS), a boundary organisation operating between government, business and knowledge institutions, established an informal “Monitoring Lab” to support subnational learning. The Monitoring Lab creates a protected space in which provinces, municipalities and water boards can test tools, share experience and reflect on progress without political pressure. Through this process, three monitoring questions emerged: ‘Are we doing what we said we would do?’, ‘What effects are we seeing?’ and ‘Are we on track?’. The third question has proved most influential. Participants recognise that it is difficult to judge whether the system is on track without clearer goals. Monitoring discussions therefore encouraged greater clarity about targets, even where formal quantitative standards were absent.
How Targets Are Developing in Practice
Current work focuses on supporting regional groupings to define more concrete goals for hazards such as heat, pluvial flooding, drought and sea level rise. National government facilitates this process but does not prescribe uniform targets. Given the decentralised nature of spatial adaptation and variation in local capacity, identical national standards are neither feasible nor considered appropriate. Instead, institutions convene dialogue, provide tools and support regions in defining context-specific ambitions.
Adaptive Management and Revision
Target-setting is embedded in a broader tradition of adaptive delta management. Major Delta decisions are reviewed every six years and supported by synthesis documents explaining assumptions and choices. Independent scientific review reinforces transparency and robustness. Revision is treated as a normal feature of governance rather than as evidence of failure. Interviewees also stressed the importance of creating safe spaces where participants can reflect beyond organisational mandates. Such settings are seen as essential for addressing complex questions about acceptable risk and long-term limits.
Reflections and Lessons
The Dutch experience shows how different approaches to adaptation target-setting can coexist within one country. In flood protection, long-established legal standards make quantitative targets straightforward. In other sectors, targets are emerging gradually through dialogue and practical experimentation.
Monitoring, particularly the question ‘Are we on track?’, has helped sharpen thinking about ambition. Rather than imposing uniform thresholds, the approach enables regions to define and revisit their own goals over time. Adaptation target-setting in the Netherlands combines technical expertise with ongoing discussion about acceptable risk, using quantitative standards where they are well established and adaptive management where they are not.
Cities
Paris
Paris has progressively strengthened adaptation targets across successive climate plans, particularly as heatwaves, flood risk and urban overheating became more visible public and political concerns. While earlier plans articulated general resilience goals, experience showed that without measurable targets it was difficult to assess progress or sustain momentum. Targets were therefore introduced to embed adaptation more firmly within municipal governance and to signal commitment to political leadership and residents.
Institutional Context
Adaptation in Paris is embedded across departments rather than managed by a single isolated unit. The climate team coordinates the overall climate plan and aggregates reporting, but operational departments such as urban planning, green spaces, water, public health and education are responsible for delivering sector-specific actions.
The climate plan integrates mitigation, adaptation, resilience, nature-based solutions and social equity considerations. Vulnerability to heat and other risks is unevenly distributed across neighbourhoods, and this shaped both the framing and location of adaptation targets.
Why Introduce Targets
Interviewees described several motivations for introducing measurable targets. First, they were seen as necessary to move beyond broad intentions. Second, they enable monitoring and accountability. Third, they strengthen coordination across departments by clarifying expectations. Finally, they signal seriousness to elected officials and the public.
There was recognition that without quantified goals, adaptation risks remaining aspirational. At the same time, adaptation is inherently multi-sectoral and influenced by external factors, which complicates target design.
How Targets Were Developed
Target-setting drew on climate projections, heatwave mortality data, flood risk assessments, green space analysis and neighbourhood vulnerability mapping. Major heatwave events acted as political catalysts, reinforcing the urgency of adaptation.
Departments reviewed existing sectoral plans and identified where climate considerations could be strengthened. The climate team facilitated coordination but did not impose targets. Each department proposed sector-specific commitments within its mandate and budget. Targets were shaped through internal negotiation to ensure feasibility within the constraints of a dense urban fabric and competing land uses.
Paris has limited opportunities for large-scale green expansion. As a result, targets often involve creative approaches such as greening rooftops, redesigning schoolyards, integrating trees into street redesign and embedding nature-based solutions within existing infrastructure.
Quantitative and Process Targets
There was internal debate about the value and limits of quantification. Quantitative targets are viewed as important for measurement and credibility. Examples include expanding green surface area, increasing shaded spaces, developing cooling facilities during heatwaves and improving access to climate shelters. Many targets are time-bound, often aligned with 2030 milestones.
At the same time, some commitments are process-oriented, such as integrating climate risk into planning regulations and urban design standards. These are harder to measure but essential for long-term resilience.
Reducing heat-related mortality illustrates attribution challenges. Health outcomes depend on demographic factors, public health systems and behavioural responses as well as physical adaptation measures. For this reason, Paris often uses measurable proxies such as cooling infrastructure or shaded space rather than outcome targets alone.
Monitoring and Consequences
Departments report periodically on agreed targets. The climate team consolidates this information and produces monitoring reports that inform political leadership. Some indicators, such as hectares of green space, are straightforward. Others are influenced by external variables.
Targets are not legally binding. However, missing them can lead to political scrutiny, reputational risk and internal accountability discussions. Civil society and media attention following extreme weather events can intensify this scrutiny. Targets also provide leverage for securing funding and prioritising projects.
Reflections and Lessons
Paris demonstrates a politically responsive model of municipal adaptation target-setting. Targets function as steering tools, coordination mechanisms and communication devices as much as technical instruments. They are negotiated within administrative constraints and revised over time as conditions change.
The case shows that measurable adaptation targets can strengthen institutionalisation and accountability in a complex urban administration, even where outcomes are influenced by factors beyond municipal control.
Barcelona
Barcelona introduced adaptation targets within its 2018 Climate Plan, which marked a strategic reset integrating mitigation, adaptation and climate justice. Targets were shaped by strong internal reporting culture, sectoral negotiation and significant spatial and climatic constraints. The process reflects both technical confidence in some sectors and political negotiation in others.
Institutional Context
The 2018 Climate Plan was developed by a core team including the Energy Agency, adaptation and resilience staff, social rights and citizen engagement units. Operational departments such as water, parks, coastal management and urban planning were closely involved. The climate office coordinates and reports on the plan, but departments retain responsibility for delivery.
Before drafting targets, the city undertook downscaled climate projections and vulnerability assessments. These highlighted increasing drought, extreme heat, sea level rise and pluvial flooding risks. Heat and water scarcity were identified as particularly pressing, shaping both the urgency and content of targets. Barcelona is a dense Mediterranean city with limited available land and growing water stress. These structural conditions strongly influence what can realistically be targeted.
Internal Debate on Quantification
There was substantial internal discussion about how far to quantify adaptation. In some sectors, especially water management, numerical targets were relatively straightforward. The water department operates with modelling tools and established engineering standards. For example, reducing potable water consumption to 100 litres per person per day was framed as both technically measurable and publicly communicable. Flood and wastewater systems also use return period thresholds and technical benchmarks. These provided a foundation for measurable targets linked to drainage capacity and infrastructure resilience.
In contrast, green space targets were more contested. Barcelona committed to increasing green surface area by approximately 1.6 square kilometres between 2015 and 2030. Given the city’s density, achieving this requires redevelopment projects, green roofs, pocket parks and greening of schoolyards. However, drought and tree mortality have complicated delivery, illustrating how climate impacts themselves can undermine progress toward adaptation targets.
Why Targets Matter Internally
Within the climate office, there was a clear view that indicators without targets were insufficient. Targets were seen as necessary for meaningful monitoring and internal accountability. However, the climate office does not have authority to impose targets. Each department had to agree to commitments based on its operational capacity and budget. This meant that target-setting involved negotiation rather than instruction. Departments needed to feel confident that they could deliver. In some cases, targets were calibrated to align with existing plans or capital investment cycles.
Targets were also framed in ways that could resonate politically. For example, ensuring access to climate shelters within a five minute walk provides a concrete and socially visible objective, particularly during heatwaves.
Limits of Municipal Control
Many adaptation outcomes depend partly on citizen behaviour and private sector decisions. Water consumption levels depend on household choices. Expansion of green space may require cooperation from private landowners. Heat resilience is influenced by building design and retrofitting decisions beyond direct municipal control. This complicates attribution. If targets are missed, it may not reflect municipal inaction but rather external factors such as drought intensity, demographic change or behavioural trends.
Monitoring and Revision
The climate office collects annual data from departments and tracks implementation rates. Reporting also occurs quarterly at executive level. Targets are not legally binding and there are no statutory penalties. However, they are politically salient. Failure to show progress can generate scrutiny from elected officials, civil society and the media.
Interviewees acknowledged that targets are both necessary and imperfect. Measurement methodologies influence results, and extreme events such as prolonged drought can distort performance indicators. Targets are therefore revisited during plan updates, and adjustments may be made in response to new climate information or political priorities.
Reflections and Lessons
Barcelona illustrates a negotiated municipal model of adaptation target-setting. Engineering-oriented departments were more comfortable with quantification, while land use and greening targets required more political compromise. A strong reporting culture supported measurable commitments, but delivery remains department-led and influenced by external factors.
The case shows that municipal adaptation targets must balance technical feasibility, spatial constraints and political credibility. Targets function as coordination tools and public signals of ambition rather than as legally enforceable guarantees of specific outcomes.
Lisbon Metropolitan Area
Lisbon’s experience highlights the distinction between structured adaptation planning and clearly defined strategic targets. While adaptation planning has expanded significantly across Portugal, explicit metropolitan level quantitative targets are less clearly embedded in the Lisbon plan than might initially appear.
Institutional and Methodological Context
Adaptation planning in Portugal began scaling up around 2010. Early municipal strategies were often broad climate plans, with adaptation framed as sectoral actions. Over time, planning became more structured and methodologically consistent. A key influence was the ADAM methodology, adapted from the UKCIP Adaptation Wizard and applied across more than two dozen municipalities. The ADAM cycle includes preparation, assessment of current and future vulnerabilities, identification and evaluation of adaptation options, integration into territorial planning instruments, monitoring and revision. The methodology became embedded in municipal tenders and metropolitan planning processes. In principle, the cycle anticipates monitoring and target-setting. In practice, interviewees noted that most effort has focused on vulnerability assessment and defining options, while monitoring and measurable targets have received less systematic attention.
How Targets Appear in the Lisbon Plan
The Lisbon Metropolitan Adaptation Plan implemented the early stages of the methodology in depth. It includes baseline analysis, sectoral vulnerability assessment and identification of adaptation measures at multiple scales. Measures are typically framed with assigned responsibility, thematic area and indicative timeframe. However, explicit numeric targets linked to overarching strategic objectives are less visible. Some numbers associated with Lisbon, such as figures related to tree planting or drainage improvements, may originate from individual projects or sectoral initiatives rather than from a consolidated metropolitan target framework. Interviewees cautioned that extracting numbers without understanding their origin risks misrepresenting the strategy. Targets may sit within supporting documents, sector annexes or separate funding programmes rather than within the main strategy text.
Why Targets Are Difficult to Consolidate
Several structural factors limit the consolidation of metropolitan targets. Implementation remains largely municipal. Each municipality has its own leadership, priorities and administrative capacity, while the metropolitan authority has a coordinating role but limited mandate to direct action. Portugal’s 2021 climate law requires municipalities and regions to adopt climate action plans. However, interviewees suggested that enforcement is limited and legal obligation alone does not ensure implementation capacity. National mandates may thus generate compliance in producing plans without guaranteeing delivery or measurable progress. More broadly, interviewees described a national planning culture in which strategy production can become an end in itself. Plans are developed over several years and then replaced by new plans, while systematic monitoring and evaluation receive less sustained attention. This can create a gap between planning activity and implementation outcomes.
Characteristics of Effective Targets
From the interviewee’s perspective, effective adaptation targets require three elements. They should be measurable, time-bound and clearly assigned to a responsible actor. Without these components, targets risk being delayed or overlooked. These principles are particularly relevant in contexts where monitoring systems are fragmented. Unclear responsibility or absent deadlines weakens follow-through.
Monitoring and Midterm Review
Lisbon Metropolitan Area is undertaking a midterm evaluation after five years. However, monitoring remains decentralised and data collection inconsistent across municipalities. There is no single consolidated inventory of progress. Plans are sometimes used to support funding applications or justify projects rather than as active management tools. This reinforces the challenge of moving from structured planning to measurable, coordinated implementation.
Citizen and Stakeholder Engagement
Public consultation is formally required in plan development, but participation levels vary. Citizens are rarely involved in defining numeric targets and target-setting often seen as an administrative function. Stakeholders such as researchers and nongovernmental organisations may provide technical critique, but direct citizen influence on measurable commitments is limited.
Reflections and Lessons
Lisbon’s approach illustrates that comprehensive planning frameworks do not automatically produce clear metropolitan targets. Strong methodologies and widespread plan adoption can coexist with weak consolidation of measurable commitments. However, interviewees also noted a steady increase in interest in adaptation and in the human and institutional resources dedicated to it. This creates greater opportunities to learn from earlier planning processes and gradually improve governance and monitoring systems. The case thus underscores the importance of linking targets to responsibility, timeframes and monitoring systems while also highlighting the limits of top-down legal mandates without capacity-building and coordinated follow-through. For cities considering quantified adaptation targets, Lisbon’s experience suggests that institutional culture and implementation practice are as important as methodological design.
References
Brooks, N., Anderson, S., Aragon, I., Smith, B., Kajumba, T., Beauchamp, E. and Rai, N. (2019a) Framing and tracking 21st century climate adaptation. IIED Working Paper. London: IIED. Accessed 16th April 2026: https://www.iied.org/10202iied
Brooks, N., Faget, D. and Heijkoop, P. (2019b) Tools for measurement of resilience in Nepal. London: Department for International Development. Accessed 16th April 2026: https://assets.publishing.service.gov.uk/media/5cff7c18e5274a3cc494e7b1/Resilience_measurement_LitRev_FINAL-updated1_ML_June_2019.pdf
European Commission (2013) Adapting infrastructure to climate change (Commission Staff Working Document No. SWD (2013) 137). Brussels: European Commission. Accessed 16th April 2026: https://eur-lex.europa.eu/legal-content/EN/TXT/PDF/?uri=CELEX:52013SC0137
IPCC (2022) Climate change 2022: Impacts, adaptation and vulnerability. Working Group II contribution to the Sixth Assessment Report.
OECD (2023) Glossary of key terms in evaluation and results-based management for sustainable development. 2nd edn. Paris: OECD Publishing. Accessed 16th April 2026: https://www.oecd.org/en/publications/glossary-of-key-terms-in-evaluation-and-results-based-management-for-sustainable-development-second-edition_632da462-en-fr-es.html
Venable, L., Brooks, N. and Vincent, K. (2022) Lessons for measuring resilience from the BRACC programme. NIRAS, LTS International and Kulima. Accessed 16th April 2026: https://bracc.kulima.com/sites/default/files/2022-03/Resilience%20Measurement%20Brief.pdf
How to cite this publication:
Lonsdale K., Thomas S. and Brooks N. (2026) International Review of Setting and Monitoring Targets, ClimateXChange.
DOI: https://doi.org/10.7488/era/7026
© The University of Edinburgh, 2026
Prepared by Climate Sense on behalf of ClimateXChange, The University of Edinburgh. All rights reserved.
While every effort is made to ensure the information in this report is accurate as at the date of the report, no legal responsibility is accepted for any errors, omissions or misleading statements. The views expressed represent those of the author(s), and do not necessarily represent those of the host institutions or funders.
This work was supported by the Rural and Environment Science and Analytical Services Division of the Scottish Government (CoE – CXC).
ClimateXChange
Edinburgh Climate Change Institute
High School Yards
Edinburgh EH1 1LZ
+44 (0) 131 651 4783
If you require the report in an alternative format such as a Word document, please contact info@climatexchange.org.uk or 0131 651 4783.
Complete list of documents reviewed in Section 7.1 ↑
Extent of Quantification reflects the relative number and sectoral coverage of explicit, time-bound numeric or formally measurable targets within the adaptation framework, based on document review. “Limited” indicates isolated or highly selective quantified standards; “Moderate” indicates multiple sectoral quantified or measurable targets; “Extensive” indicates broad cross-sector use of quantified or formally measurable targets embedded within the overall framework. Classifications are comparative rather than absolute. ↑
SMART is a widely used policy framework for designing targets. The acronym stands for Specific, Measurable, Achievable, Relevant and Time-bound. A target described as “SMART” clearly defines what will change, includes a measurable indicator, sets a defined timeframe, and is judged realistic given available capacity and resources. A formal SMART target is explicitly structured in this way in a strategy, often as a clear numeric commitment with a deadline. ↑
Examples of potential methodological approaches discussed in the wider literature (including Brooks et al. 2019) include anomaly-based indicators, climate-adjusted baselines, and counterfactual techniques that estimate losses relative to expected climate conditions. Other strands of work explore identifying thresholds in climate variables above which impacts escalate rapidly (e.g. temperature thresholds associated with heat-related mortality; McMichael et al. 2008; Gasparrini et al. 2015). These approaches remain constrained by data limitations, modelling uncertainty and the need for context-specific calibration. ↑
Leiter, T., Olhoff, A., Al Azar, R., & Barmby, V. (2021). Adaptation Monitoring, Evaluation and Learning (MEL) Systems: Strengthening Climate Resilience Through Evidence-Based Decision-Making. United Nations Development Programme (UNDP) and German Development Cooperation (GIZ). This study systematically reviewed national adaptation monitoring, evaluation, and learning (MEL) systems worldwide. It provides a comparative overview of how different countries design, implement and institutionalise MEL systems for climate change adaptation, whether or not they have submitted a National Adaptation Plan (NAP) to the UNFCCC. It provides a standardised typology of MEL system development stages, allowing for consistent comparison across countries and thus complements the UNFCCC and NAP Global Network data. ↑
These are the set of questions to guide enquiry and analysis of the adaption target development process. They will form the basis of the semi-structured interviews with policymakers and technical experts from selected jurisdictions. All the questions within each framework feature may not be answered. ↑
Research completed February 2026
DOI: https://doi.org/10.7488/era/6913
Executive summary
Project aims
The objective
Climate attribution research is the field of science looking at how climate change influences the intensity and likelihood of extreme weather events. It shows that those kinds of events are increasingly impacting people, places, infrastructure and services as global temperatures rise. To support forward-looking climate adaptation planning, decision-makers in Scotland require a new toolkit capable of rapidly translating attribution science into practical, future-proofed action (Grace et al., 2025).
The ScotClimATE online tool was developed to help Scotland’s public bodies plan for a world that is 2°C warmer than pre-industrial levels and to assess risks up to 4°C, in line with advice from the Climate Change Committee (CCC, 2021; Brown, 2025).
The ScotClimATE team identified a gap: there are no simple, easy ways to visualise future projections of extreme weather events in Scotland and how they may change as global temperatures rise.
The approach
Building on recommendations from Grace et al. (2025), this work translates methods from scientific literature and applies them through a new analysis of UK Climate Projections (UKCP18), an up‐to‐date and well‐tested ensemble of climate projections for the UK (Lowe et al., 2018). The tool includes an adjustment (bias correction), using observation-based data from HadUK‐Grid (Hollis et al., 2018).
The new analysis was built on two key components:
- a simple model for projecting Scotland’s annual average temperature based on global warming level (GWL)
- statistical models of the intensity and return periods, measures of the magnitude of extreme events and their frequency, using UKCP18 at different temperatures
The tool was developed in stages, with regular input from the Scottish Government Adaptation Team, alongside user feedback from the Public Sector Climate Adaptation Network (PSCAN).
Functionality and use of the delivered tool
ScotClimATE is designed to meet the needs of Scotland’s public bodies for strategic adaptation planning. It provides interactive visualisations of projected changes in extreme heat events, sustained heat over three days, extreme rainfall in a day, and extreme sustained rainfall over three days. It allows users to visualise how the intensity and return period of these extreme events change in UKCP18 data under different GWLs from +0°C 1850‐1900 average to +4°C. Results are projected onto an interactive map of Scotland, and users are provided a gauge of the spread of possible results based on UKCP18 data with confidence intervals.
Limitations of scope and methodology
Scope boundaries
The tool is designed for understanding infrequent, high-intensity events, typically expected only 1‐to‐10 times per century. It is not suited for assessing changes in usual weather, such as seasonal averages or possible high‐impact but low‐likelihood climatic changes (Arnell et al., 2025), not captured in the UKCP18 ensemble of 12 simulations. The tool does not provide projections for flooding. For this, users must use the latest information and guidance from SEPA. For events that are expected more often than once per year, or for assessing chronic changes, users should refer to the Local Authority Climate Service (Met Office, 2024a).
1.3.2 Data, model and analysis limitations
The tool does not provide projections for storminess, such as extreme wind and gust speeds, or storm counts due to the lack of available simulation data. It also does not provide extreme sub‐daily rainfall projections due to the required workload to build an analysis of observation radar data.
The tool uses UKCP18 simulation data as well as an adjustment (bias correction) using observed weather events (Met Office Hadley Centre, 2018c, 2019).
The ScotClimATE tool communicates uncertainty as confidence intervals based on the range of possible fits to the data.
The main findings
ScotClimATE fills a critical information gap in the adaptation toolkit
ScotClimATE addresses a specific gap, complementing existing tools – such as SEPA Flood Maps or the Local Authority Climate Service – by visualising low‐frequency, high‐impact extreme events. This helps complete the suite of resources needed for comprehensive climate scenario analysis.
Extreme heat and rainfall events to increase in intensity with a warming climate
The analysis shows that the hottest temperatures are projected to rise faster than average temperatures. It also shows that the most extreme one-day and three-day rainfall events in Scotland are likely to become more intense with rising global temperature.
User feedback validates the tool’s usefulness and usability
PSCAN users tested a prototype version of the ScotClimATE tool for extreme heat. 12 of the 13 testers who responded to the question found it to be ‘mostly useful’ or ‘very useful’ for helping them to plan for and assess changes in extreme heat at +2°C and +4°C, respectively. All testers who responded ‘agreed’ or ‘strongly agreed’ that the map was easy to use, and 13 out of 14 said the same about the slider function.
Additionally, PSCAN users provided a wealth of feedback into how they could use the tool for adaptation planning. These responses informed the development of the prototype tool into the delivered tool.
Future recommendations from the project
Tool deployment and governance
The ScotClimATE tool has been delivered to the Scottish Government for deployment as part of its materials to support adaptation planning and implementation in Scotland. To maximise its impact, public bodies should be encouraged to use ScotClimATE to better understand climate hazards. The tool’s capacity to help identify common hazards between regions can also be used to support collaboration between organisations.
Tool development
The tool provides a user‐tested framework for visualising the intensity‐return period relationship of simulated extreme events at different global warming levels. It can be expanded to include other climate hazards as suitable data becomes available. The methods used to produce ScotClimATE can also be applied to other UK regions covered by UKCP18.
A review should be conducted 12–24 months after launch to understand how the tool is being used and identify any needed improvements. This would provide practical insight into evolving user needs.
With the correct supporting materials, ScotClimATE could also be used as educational material to help people better understand present and future climate hazards in Scotland.
Terms and Abbreviations table
| CCC | Climate Change Committee |
| UKCCRA3 | Third Climate Change Risk Assessment |
| GWL | Global Warming Level. In ScotClimATE we define this as the global average near surface temperature difference during a period of analysis versus an estimate during a ‘pre-industrial` reference period from 1850 to 1900 (used by Morice et al., 2021; and IPCC, 2023). |
| SNAP3 | Third Scottish National Adaptation Plan (2024‐2029) |
| PSCAN | Public Sector Climate Adaptation Network |
| LACS | Local Authority Climate Service |
| GEV | Generalised Extreme Value distribution |
| shape, locationand scale(parameters of a GEV) | Parameters describing the relative distribution of the upper tailof a GEV, where the GEV is positioned on an intensity scale, andthe spread of the distribution on the intensity scale (see Auld et al., 2023; Coles, 2001a) |
| GEV withcovariate | Parameters describing the relative distribution of the upper tailof a GEV, where the GEV is positioned on an intensity scale, andthe spread of the distribution on the intensity scale (see Auld et al., 2023; Coles, 2001a) |
| The covariate | A parameter (e.g. a measure of a climate state) with which thedistribution of extreme events is observed to change. |
| bias correct | The use of results of observations to correct for unrealisticfeatures in model results (see Met Office Hadley Centre, 2021) |
| SEPA | Scottish Environment Protection Agency |
| UKCP18 |
UK Climate Projections |
| GCM | Global Climate Model |
| RCM | Regional Climate Model |
| CPM | Convective Permitting Model |
Introduction
Project overview
To support climate adaptation planning in Scotland, the ScotClimATE project provides accessible information on how climate change may alter the frequency and intensity of extreme heat and rainfall events in Scotland under different levels of global warming.
Policy context
The Climate Change Committee (CCC) is the UK and devolved governments’ independent expert advisor on climate change. In its 2021 advice for the third UK Climate Change Risk Assessment (UKCCRA3), the CCC outlined ten principles for good adaptation. One key principle was:
“Adapt to 2°C; assess the risks up to 4°C.” (CCC, 2021)
Building on this, the CCC’s 2025 advice stated that UK adaptation objectives,
“… should, at a minimum, prepare the country for the weather extremes that will be experienced if global warming levels reach 2°C above preindustrial levels by 2050. Planning for global warming levels reaching 2°C above preindustrial levels by 2050 should be a minimum level.
[…]
At the high end of possibilities, reaching 4°C above preindustrial levels by the end‐of‐century cannot yet be ruled out and should be considered as part of effective adaptation planning.” (Brown, 2025)
The +2°C GWL scenario represents a climate that is very likely within four decades under a high‐emissions scenario, and possible in a low‐emissions scenario (IPCC, 2023). The +4°C GWL scenario is plausible under high‐emissions scenarios by 2100 (IPCC, 2023).
Implementing the CCC’s advice requires accessible, decision‐useful data about climate hazards under different global warming levels. However, research by Grace et al. (2025) found the current climate data landscape to be a significant source of frustration for stakeholders in Scotland, with users in public bodies often finding it hard to obtain or interpret the data.
In Scotland, the statutory framework for adaptation planning is set by the Climate Change (Scotland) Act 2009 (2009). The Act requires Scottish Ministers to lay a national adaptation plan before Parliament every five years and places a duty on public bodies to help deliver the plan and report progress annually. The third Scottish National Adaptation Plan 2024‐2029 (SNAP3: Scottish Government, 2024) sets out Scotland’s current adaptation objectives alongside support for providers of public services to adapt to climate change and meet their statutory duties. This support includes updating the Public Bodies Climate Change Duties (PBCCD) statutory guidance, continued delivery of the Adaptation Scotland capacity‐building programme and development of a new tool on climate scenarios.
Project aims
The ScotClimATE project had a number of aims. The project deliverables included: the application of established analytical methods to a new analysis of extreme weather in Scotland; a tool to visualise that analysis; and this report that documents project deliverables and critical feedback from users of the tool. The key aims of the project are outlined below.
To be part of a climate adaptation planning toolkit for Scottish public bodies
The Scottish Government has identified the need for a toolkit to assist public bodies in adaptation planning for future climate hazards in Scotland. This need was initially identified by the ClimateXChange (CXC) report by Grace et al. (2025). This research also specified the necessary parameters of such a toolkit that could rapidly inform future‐proof climate adaptation planning.
To fill a critical information gap needed for adaptation planning
We (being the ScotClimATE research team throughout) have identified a key gap in the available information for adaptation planning in Scotland – readily available and easy to visualise projections of extreme weather events. Extreme weather events are categorised as individual unusually large intensities of hazardous weather (Coles, 2001a; Otto, 2017).
It is important that adaptation planning includes climate extremes (UKCCRA3; Catto et al., 2024). The intensity of extreme events at the same frequency may change at a different rate than average conditions.
To translate climate science for decision-making in public bodies
A key component of the ScotClimATE project has been the application of analytical methods and insights from scientific research literature to produce results that users can visualise with an online tool.
Insights from attribution studies (see Section 4) form the core of the underlying methodology that we have adapted to deliver ScotClimATE. We have built statistical models of extreme weather events in terms of their intensity‐return period relationship. Attribution studies provide robust insight into the impact of climate change on particular climate hazards: providing robust methods for quantifying and understanding how unusually hazardous observed events are in different climates. These methods provide a framework for projecting changes into possible future climates. In Section 4, we provide a background for how attribution methods can be applied to build a new understanding of extreme weather in changing climates. Explained in Section 8, we detail how we have applied some of these methods to understand extreme events in Scotland through their intensity‐return period relationship.
To deliver a user-friendly online visualisation tool based on key design criteria
As well as the new analysis in ScotClimATE, we have built a tool for providing useful results based on underlying data from the UK Climate Projection (UKCP18) set of modelled climate (Lowe et al., 2018). Users can visualise projections of extreme events under different climate scenarios that would otherwise require very particular expertise to produce. The tool achieves three design criteria informed by Grace et al. (2025):
- It provides useful quantification of hazards to inform climate adaptation. Namely, to prepare for +2°C warming, and assess up to +4°C warming (following UKCCRA3).
- It is tailored to meet the needs of public bodies.
- It is built to be easy to use by non‐scientists, with clear explanation.
To directly engage the target users and Scottish Government clients in the tool development
The target users of the ScotClimATE online tool are the Public Sector Adaptation Network (PSCAN). PSCAN is a space where representatives of more than sixty of Scotland’s public bodies convene and share learning and experience of adaptation in practice as well as receive training and support as part of the Adaptation Scotland Programme (Adaptation Scotland, 2025; Verture, 2025). In Section 9, we detail project interactions with PSCAN facilitated by Verture.
ScotClimATE has been built to provide projections of weather hazards only without providing information on the exposure or vulnerability of people or assets to that hazard. Grace et al. (2025) define a proportionate approach to climate scenarios analysis, where organisations develop their own understanding of what climate hazards threaten their service and assets.
The success of ScotClimATE in meeting each of these aims has been measured with feedback from PSCAN (Section 9), regular discussion with the Adaptation Team in the Scottish Government, and a reporting cycle with a steering group of experts in adaptation planning that has been coordinated by CXC.
Report structure
This report serves as a comprehensive overview of ScotClimATE. The first sections provide an overview of the scientific basis of ScotClimATE. In Section 4, we introduce leading theory on understanding extreme events that is applied in our analysis. In Section 5, we document available tools and datasets that offer insights for adaptation planning. Then, in Section 6, we introduce the delivered version of ScotClimATE. High‐level overviews of functional components of ScotClimATE are included in Section 7 on projecting from GWL to a climate state in Scotland, and in Section 8 on the statistical models of extreme events.
The last sections provide an overview of the production, use, and our suggestions for the future of ScotClimATE. In Section 9, we document the agile development cycle used to produce ScotClimATE. This includes results and syntheses of user feedback that have informed the development of the web tool interface and choice of hazards that can be visualised. To demonstrate possible use cases of the web tool, Section 10 presents a discussion of some results that can be produced using the statistical models behind ScotClimATE. Finally, our suggestions for future developments with ScotClimATE and conclusions from this work are documented in Section 11. Technical Appendices B, C and D are referenced in the body of this report.
Understanding changing extreme weather hazards
Scenario analysis based on GWL
When users analyse Global Warming Level (GWL) scenarios, they will build an understanding of changes in climate hazards with GWL. This understanding can be applied to adaptation planning, irrespective of the particular emissions pathway that leads to a different GWL. This intuitive approach lets users connect global climate change with changing climate hazards relevant to their service.
Grace et al. (2025) summarised the utility of identifying a small number GWLs in a scenario analysis:
- Fewer scenarios require less data gathering overhead.
- Each scenario can be considered in greater depth.
- Planning based on +2°C and +4°C challenges users’ current thinking to make resilient plans for possible future climates.
However, multiple scenarios would provide users the flexibility to understand the uncertainty due to different GWL projections (Grace et al., 2025).
Risk from extreme weather hazards
In line with Field et al. (2012) findings on the management of risks from extreme events in climate adaptation, Grace et al. (2025) define the need for understanding three components of risk when an organisation conducts a climate scenario analysis: hazard, exposure and vulnerability. Climate hazards are possible weather conditions and events that can cause damage and loss. Climate hazards have physical descriptions that are generic across analyses.
However, the amount of exposure of relevant people, systems and assets vary by organisation. Likewise, so does the level of vulnerability to the hazard of those exposed. This report and the resulting tool focus on an analysis of hazard that can provide useful information to inform climate scenario analyses.
Climate hazards are varied and complex. Recent years have seen a rapid development of new methods to understand extreme events in a changing climate. These developments have largely been driven by efforts in attribution: the quantification of changes in weather events due to human‐caused climate change (Otto, 2017; Thompson et al., 2025).
Probabilistic approaches are used to understand changes in the intensity and frequency of events (WWA, 2025). Further modelling efforts, such as storyline approaches are used to understand the extent to which the development, duration, and characteristics of particular events have changed with changes in climate (Shepherd, 2016).
Extreme events can be detected in the observed record (such as by Easterling et al., 2016). Catto et al. (2024) document ongoing efforts to build high‐resolution models of observed UK precipitation extremes. To produce ScotClimATE in the short development window available (3 months for the prototype version), we have used a probabilistic approach that is often used as part of attribution studies. To build projections, we have adapted the projection method of Auld et al. (2023). Probabilistic models for extreme events use appropriate statistical distributions to capture the relationship between frequency and intensity of extreme events. We fit Generalised Extreme Value (GEV) distributions to observed and projected events in Scotland.
Multiple hazard events can be far more destructive than single hazard events (Lee et al., 2024). However, our ability to fit probabilistic models to their frequency and intensity is heavily restricted by the individual nature of these events, small set of observations and the heavy workload required to identify or generate them using simulations. Therefore, in ScotClimATE we have only attempted to provide visualisations of single hazards.
Identified weather hazards
The CCC (2021) identified a number of risks to human and natural systems in the UK from a variety of different hazards. Additionally, Catto et al. (2024) document a number of published and un‐published resources for understanding an array of climate hazards that are under development as outputs of the UK Climate Resilience programme.
In building ScotClimATE we have considered a variety of different hazards (see Section 6 and 9). We determined our selection of hazards to include in the tool based on four factors:
- Whether a more suitable tool already exists for visualising the hazard (Section 5).
- How useful information on the hazard is to help in climate adaptation planning and decision‐making.
- The availability of data suitable to base a projection of the hazard.
- The difficulty of analysing and implementing the hazard – whether it was possible within the length of the project.
Extreme temperature was the most obvious hazard to include, and least difficult to implement in the proposed methodology due to these events’ large spatial scale and physical relationship to average temperatures (see Section 8).
This includes the hazards of extreme heat events and extreme cold events. The relationship between the intensity and the frequency of these events can be described with statistical models using extreme value theory (Auld et al., 2023; Coles, 2001a).
Projections of extreme heat are particularly useful due to the non‐linear increase in risk from increasingly high temperatures. Empirically, this has been described with J‐shaped curves of relative risk curves with temperature, where mortality risks from extreme heat increase more steeply beyond a certain temperature threshold (see Gasparrini et al., 2022; Masselot et al., 2023; Public Health Scotland, 2025). We apply our analysis throughout Scotland, but for the hazards considered there are often other analyses that can also provide useful insight. For example, the HOTdays analysis has delivered a characterisation of heatwave properties specific to major UK cities (Brown, 2020).
Extreme rainfall was considered the next least difficult hazard to implement due to the availability of observations and model data. Rainfall extremes can also be projected using extreme value theory (Gründemann et al., 2023). However, fluvial flooding extremes arising from rainfall require a more complex modelling of drainage basins. Projections of UK fluvial flooding and the required capacity of drainage systems have been developed by the FUTURE‐DRAINAGE project (Chan et al., 2023).
We identified that projections of the highest rainfall in one or three days was achievable during the ScotClimATE project. For this, we have been able to exploit daily rain‐gauge observations included in HadUK‐Grid (Hollis et al., 2018). To understand extreme rainfall at a higher temporal resolution, researchers can use weather radar data. There is weather radar coverage at least 5 km resolution over most of Scotland (Met Office, 2007). These data are available from Met Office (2003) in sub‐hourly gridded format processed by the Nimrod radar data system since late 2002, or processed with rain gauge measurements by the HYRAD system (UK Centre for Ecology and Hydrology, 2025). Processing and validating such data requires more time than was available in the ScotClimATE project, so visualisations of sub‐daily rainfall have not been included.
We also considered including the hazard from storm surge flooding. The weather that produces storm surges is not expected to significantly change with increasing GWL (Met Office Hadley Centre, 2018a), but mean sea levels will rise in time as a response to prolonged heating (Arias et al., 2021, box TS.4). We have identified a relatively low implementation difficulty for this hazard, but have not included it due to its dependence on time and global warming pathway, and because coastal flooding is already included in existing tools (see Figure 1).
While we have found that users need future storminess projections (Section 9), we currently lack validated model data to understand future storminess in Scotland. However, a detailed analysis may be accomplished in several years’ time with the emergence of new datasets. The ongoing CANARI (Climate Analysis, Attribution and Impacts) project will provide a large ensemble of high‐resolution storm tracks that can be sampled to understand changes in storminess and gusts (see CANARI, 2025).
Seasonal lack of rainfall is another hazard that can be projected with a moderate implementation difficulty. This hazard can be understood by calculating the seasonal standard precipitation index, which is the normalised anomaly versus a reference period. However, this hazard would not be analysed in the same framework of extreme value theory, and it was determined that users should usefully receive drought projections from Scottish Environment Protection Agency (SEPA) guidance.
Finally, we note that at present we will be unable to produce robust predictions for changes to weather related fire as there is no suitable model for predicting wildfire risk in Scotland due to its particular distribution of plant matter and topography (Naszarkowski et al., 2024). Instead, we advise users to consider that an increased probability of wild fire ignition is likely to co‐occur with drought extremes.
What attribution tells us about changes in extreme weather events
We have applied insights from attribution studies to provide the framework to understand changing extreme weather hazards with climate change in Scotland. The World Weather Attribution project (WWA, 2025) have developed rigorous methodologies for attribution of extreme weather events to human‐caused climate change, and the communication of this causal link. The process of attribution begins by identifying an extreme weather event. This can be triggered by the severity of impacts of the event; in the methodology provided by Philip et al. (2020), this is the number of recorded deaths.
In the probability framework for attribution, researchers first calculate the probabilities of an event as or more extreme as an identified event occurring: (a) in a year in the present climate, and (b) in a counterfactual climate without human induced warming (Otto, 2017; Philip et al., 2020). The probability ratio of (a) to (b) is used as a metric to quantify how climate change has altered the hazard of the identified event (Philip et al., 2020). When damage curves are identified to convert the intensity of extreme events into impacts, the probability ratio of weather hazard occurrence can be converted into a risk ratio of damage and impacts.
The probabilistic attribution approach provides insight into changes in the intensity and likelihood of an event. However, recent advances in attribution techniques allow researchers to test the impact of climate change given similar underlying weather patterns for an event (Thompson et al., 2025). These methods are providing new insights into both changes in duration of events and the drivers of these changes (Thompson et al., 2025). Future trends in extreme weather events are understood from the synthesis of many lines of evidence, from probabilistic attribution to comparisons with multi‐model ensembles, observational evidence and theoretical analysis (Otto et al., 2024).
ScotClimATE is built on an analysis of extreme events in UKCP18 projections with bias correction based on observations (Section 6). To do this, we have exploited the conceptual link from attribution of extreme events in the present day to projections of extreme events in possible future by extrapolation of the observed statistics of weather extremes (see Philip et al., 2020).
Previous analyses of extreme events in Scotland
There are a small number of previous analyses of the statistics of extreme weather events at high spatial‐resolution in Scotland. Undorf et al. (2020) provide a deep analysis of the 2018 summer heat in Scotland, exploiting data from observations as well as a variety of simulations. Higher likelihood of extreme heat was attributed to human‐induced warming, and there is an increased likelihood of heat exceeding that experienced in 2018 since then than before. Their work identified that extreme heat is an important concern for climate adaptation in Scotland (Undorf et al., 2020).
In the attribution and projection framework, analysis of extreme rainfall has been limited to particular events: the extreme rainfall that led to the 2020 fatal derailment near Carmont (Tett et al., 2025), and the 2021 cloudburst event over Edinburgh Castle (Tett et al., 2023). Simple physics suggests that the distribution of extreme rainfall events may shift to higher intensities in a warming climate. The mass of water that can be held by air increases by approximately 7% for a 1°C increase in temperature of the same mass of air. This fundamental physical equation is called the Clausius–Clapeyron relation. However, the scaling of extreme rainfall with warming climate has been found to depend on a number of factors determined by both location and changes in atmospheric circulation. There is a broad understanding that the distribution of extreme rainfall intensity can increase at rates faster than Clausius‐Clapyron at the shortest temporal scales (several hours), but at rates equivalent or less than Clausius‐Clapyron over longer (one day or longer) events (Fowler et al., 2021). These dynamics have been identified during the particular 2020 and 2021 events that have been studied (Tett et al., 2025, 2023).
The limited extent of published work on the links between climate change and extreme weather events in Scotland has resulted in few direct applications of this knowledge. In one rare example, O’Neill et al. (2022) have applied new understanding of changes in extreme rainfall to a climate change impact assessment for Edinburgh’s cultural heritage sites built on an assessment of impacts and changes in risk.
ScotClimATE has been designed for understanding changes in the relationship between intensity and return period for single weather hazards such as high heat or heavy rainfall. However, for many historical natural disasters, the impacts of weather events have been amplified due to the compounding of multiple weather hazards occurring within a single event (Lee et al., 2024). The National Centre for Resilience has identified a number of intersecting hazards that pose risk in Scotland (Simmonds et al., 2022).
Available tools and datasets
There are several tools available for a user to gather knowledge of climate hazards facing their service. Before using ScotClimATE, users should first consider what hazards they need to understand.
How to decide which tool to use
We suggest a workflow to help users build an understanding of climate hazards from an adaptation perspective.
- The user should build a familiarity with UK climate, weather, and terminology used to describe this. The latest State of the UK Climate report (Kendon et al., 2025) provides a description of the weather in 2024 within a discussion of changing UK climate.
- Based on their service, they should determine the particular hazards they need to consider.
- If the user is assessing flood risk from fluvial, coastal or surface water and small watercourses, they must refer to SEPA Climate Change Allowances Guidance (Scottish Environment Protection Agency, 2025a) and SEPA Flood Maps (Scottish Environment Protection Agency, 2025b).
- If the user is assessing heat or rainfall extremes they should use the Local Authority Climate Service (Met Office, 2024b) to understand chronic and seasonal changes, and ScotClimATE to understand rare extreme events.
The decision process for choosing which of these tools to use based on the type of hazard is shown in Figure 1. If a climate scenario analysis also includes impacts of coastal changes, users should access Dynamic Coast resources. The Dynamic Coast web maps service provides projections of future coastal erosion in Scotland (Rennie et al., 2021).
Datasets used in ScotClimATE
ScotClimATE is a tool for visualising the statistics of extreme weather events at different global warming levels in UKCP18, with some level of bias correction based on observations. To this end, the tool is built from several datasets listed in Table 1.
HadCRUT5 is a large number of time series, each of which is an estimate of global surface temperatures anomalies from 1850 to the present (Morice et al., 2021). We use this to define the GWL (see Section 7). UKCP18 is a set of climate projections with an ensemble of twelve 100‐year simulations identified by Grace et al. (2025) as the appropriate source of projected UK climate to inform adaptation planning. These simulations begin with a lower resolution Global Climate Model (GCM; Met Office Hadley Centre, 2018b). The output from the GCM are downscaled for the UK region with physics at smaller spatial scales using a Regional Climate Model (RCM; Met Office Hadley Centre, 2018c), and again at very high resolution with a Convection Permitting Model (CPM; Met Office Hadley Centre, 2019).
We analyse the GCM output to understand the global surface temperature in the simulations (see Sections 7 and 8). The RCM downscaling provides information on Scotland temperatures. The CPM downscaling introduces additional physics important in simulating the heaviest rainfall events, we use these data to build the extreme rainfall projections in ScotClimATE. However, due to the closeness to the domain boundary, the CPM output is not valid over the Shetland Islands (Met Office Hadley Centre, 2019). Users should note that ScotClimATE does not provide extreme rainfall projections there.
It is important to note that while the CPM is run at a higher spatial resolution than the RCM, this does not necessarily mean that the output is a more accurate model of real‐world weather (Lowe et al., 2018). By using the RCM data to model extreme heat – which are generally much larger spatial‐scale events than the most intense rainfall events – we avoid including potentially unrealistic dynamics which may result from the additional complexity of the CPM in our analysis.
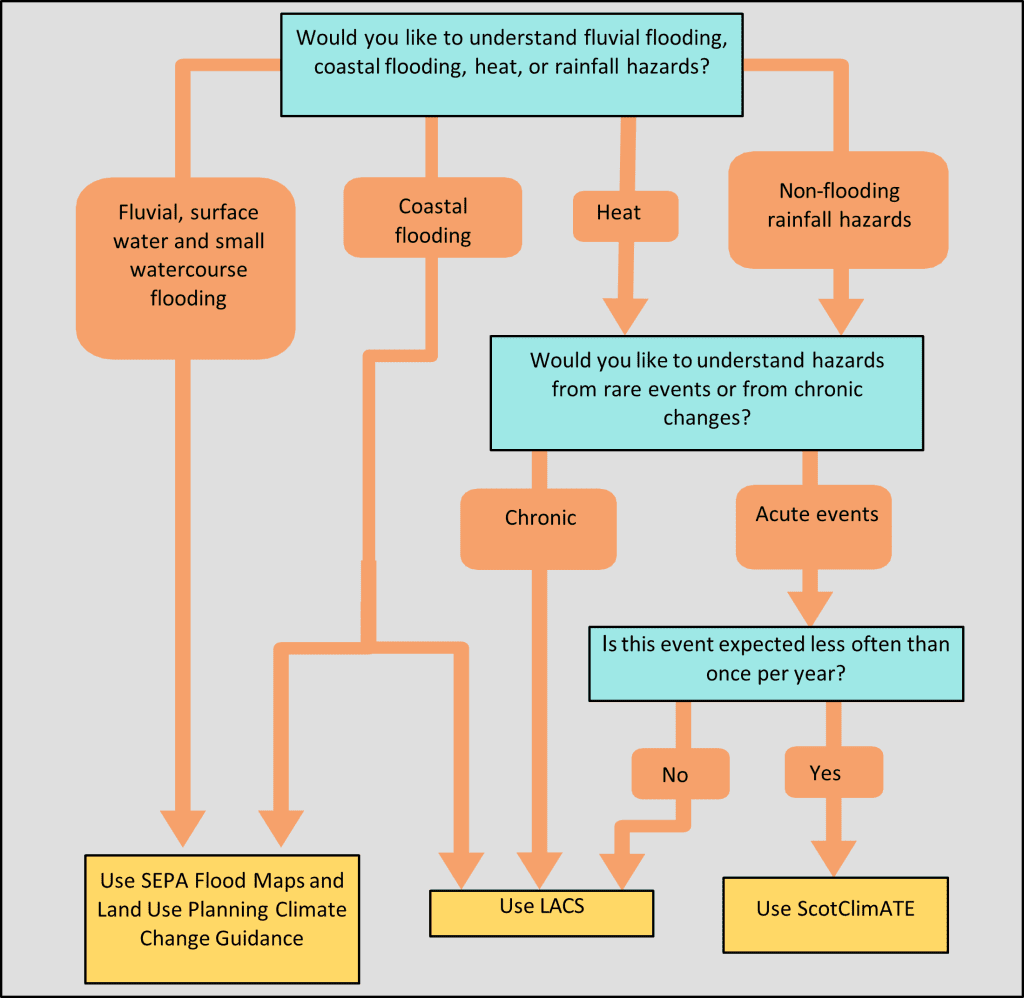
Figure 1: A diagram indicating which tool users can use to find projections for different hazards in Scotland.
| Dataset | Description | Reference |
|---|---|---|
| HadCRUT5 | Ensemble of 200 time series of estimated global near surface temperature anomalies versus the 1961 to 1990 reference period. | Morice et al. (2021) |
| UKCP18 GCM | Global Climate Model projections on a 60km grid. | Met Office Hadley Centre (2018b) |
| UKCP18 RCM | Regional Climate Model downscaling of GCM projections on a 12km grid. | Met Office Hadley Centre (2018c) |
| UKCP18 CPM | Local projections on a 5km grid re‐gridded from Convective Permitting Model downscaling of RCM projections on a 2.2km grid. | Met Office Hadley Centre (2019) |
| HadUK‐Grid | Gridded observation data over the UK land Surface. | Hollis et al. (2018) |
Table 1: Datasets underlying ScotClimATE. An overview process map is included in Appendix A for how data from these datasets are included in ScotClimATE.
The last dataset we use is HadUK‐Grid. This includes temperature and rain‐gauge measurements from UK weather stations interpolated onto a grid covering the UK land surface (Hollis et al., 2018). We use this observation-based dataset to provide the basis for some bias‐correction for ScotClimATE. However, there are a few limitations of these observations. There is limited weather‐station coverage, particularly in more sparsely populated areas of Scotland. Rain‐gauges are useful for sampling 24 hr accumulated rainfall at a single point: not all types of precipitation or precipitation in any place. In the UK, rain‐gauges are measured at 9am so these data do not capture identical diurnal effects in accumulated rainfall as would be experienced in periods defined by calendar days that start at midnight.
The delivered tool
ScotClimATE provides users with visualisations of analysed climate extremes using a web‐tool with a graphical interface. The analysis is built on existing datasets with the purpose of providing a framework for public sector users to quickly retrieve useful projections without the need for specialist scientific expertise.
The primary scientific outputs are local estimates of the relationship between return period and intensity of extreme heat and rainfall events in UKCP18 data. The return period is the reciprocal of the probability of exceeding an intensity threshold in a given year. For a very long simulation, the return period is the average number of years between an intensity threshold being exceeded. Alongside these estimates are uncertainty analyses communicated as confidence intervals of the fit to the available data. Users are able to visualise:
- the intensity of extreme heat or rainfall events at different return periods and GWL
- the return period of the extreme events of different intensities and at different GWL
- the change in intensity of the extreme events at the same return period between different GWLs
- and the change in return period of the extreme events at the same intensity between different GWLs
In Section 10, we provide examples of how users can interpret these results to understand extreme weather in Scotland. If users have a defined return period of hazard that their service is expected to withstand, then they can project a map of projected intensity of weather hazards at that return period. Alternatively, if users are aware of a particular threshold of hazard intensity that people or assets of their service are vulnerable to, then they can project the return period with which they can expect that threshold to be exceeded. Projecting changes in the intensity‐return period relationship of hazards could be especially useful where users wish to understand additional stresses of climate change on their current service design.
The components of ScotClimATE
ScotClimATE is built from four key components. These components work together to deliver visualisations of climate extremes through an interactive user interface.
- GWL scenarios are converted into a Scotland annual average temperature value (Section 7 and Appendix B).
- Statistical models are fitted to simulation data and observations (Section 8 and Appendix C). The simulation data is used to provide insights into the rarest extreme events, and how extreme events change with Scotland climate. Observation data is used to bias correct models fitted to simulation data.
- Using the online user interface, users can select hazards, select GWL scenarios and visualise results.
- The intensity and likelihood of extreme events at different GWLs are calculated based on the user selection. These values are returned to the user interface with confidence intervals calculated from the uncertainty accumulated at each fitting stage (Appendix D).
Purpose and caveats
ScotClimATE fulfils a very specific purpose – to support strategic decision-making in climate adaptation (Scottish Government, 2025). ScotClimATE provides information on how climate change may alter the frequency and intensity of extreme heat and rainfall events.
To this end, we have applied an analytical method to build statistical models of this relationship (Section 8). We have fit non‐stationary GEV distributions with covariate (such as in Auld et al., 2023; Coles, 2001b) to extreme events in UK Climate Projections (UKCP18) UKCP18 data is downscaled to different resolutions (see Section 5): we provide projections at the same resolution as the underlying data: on a 12km‐grid for RCM data for extreme heat and on a 5km‐grid for CPM data for extreme rainfall (see Figure 2 and Section 8). The CPM data is provided with a caveat that the downscaled data are not validated close to the UK‐region domain boundary (Kendon et al., 2019), as such ScotClimATE does not provide extreme rainfall projections for Shetland.
We apply a limited bias correction to the fits to UKCP18 using HadUK‐Grid observational data (Section 8.4). This correction adjusts the location parameter of the fitted GEV distribution to align frequent extremes in the recent climate with observations, while retaining the scale and shape parameters estimated from UKCP18 simulations. However, in this, we have assumed that it is appropriate to use observations to correct the relationship between the intensity and frequency of the more‐frequent extreme events in the observed climate, while we preserve the relationship of how much more intense the rarest extremes are compared to the more‐frequent extremes from simulations (Section 8). This means that projections of the highest intensity weather events expected every few years in the recent climate are corrected to look like recent observations. However, there is a key caveat that the difference in the projections of higher intensity of the rarest events, expected in tens of years or longer, is informed only with simulation data. As a result, the difference in projections of the most extreme and rare events versus frequent extremes in the present remains primarily informed by the structure of the climate model simulations rather than by observational constraints.
There are several reasons for this assumption. For annual heat and temperature maxima we have available 1200 years of simulation data (downscaled UKCP18 data are available in twelve one‐hundred year simulations), and less than one‐hundred years of observational data. Additionally, particularly at warmer climates than present, UKCP18 projections can produce rare extreme intensities during conditions that may be physically possible but have not yet been observed. In the case of extreme heat, this is likely to arise from land‐surface interactions such as drying.
At delivery, ScotClimATE is only built to visualise extreme heat and rainfall events. This limited selection of climate hazards is due to: constraints from the short turnaround time for the project; already available tools, such as SEPA Flood Maps and SEPA Climate Change Allowances Guidance for flooding and LACS for storm surge height; and due to the limitations of existing data and theory, such as the present lack of reliable predictions for future storm tracks (see Section 4).
To this end, and to avoid the confusion of multiple tools providing conflicting results for the same hazard, the choice of hazards included in ScotClimATE has been arrived at through consultations with PSCAN, Scottish Government Adaptation Team, and a steering group of experts organised by CXC. The online tool includes a disclaimer that users must agree to before accessing the tool. This disclaimer highlights that projections of climate hazards are not provided for specific domestic or commercial properties. When the hazard relates to flood risk, the SEPA Climate Change Allowances guidance and Flood Maps should be used.
Communicating confidence and uncertainty
Along with the central estimate of any statistic, we provide a gauge of the spread of possible results given the available data. To communicate this spread we adapt a calibrated language for communicating confidence intervals from IPCC (2005). These are listed in Table 2. However, we use a much more limited definition of level of confidence than the IPCC. As ScotClimATE is built to understand results in the underlying datasets (listed in Table 1), confidence in this context is only a calculation of the chance a fit represents the underlying data.
| Calibrated language | Quantile range | Meaning |
|---|---|---|
| Very high confidence | 5% to 95% | 9 in 10 possible fits lie in this range |
| High confidence | 10% to 90% | 8 in 10 possible fits lie in this range |
| Medium confidence | 25% to 75% | half of the possible fits lie in this range |
Table 2: Calibrated language used to communicate level of confidence of results. This is adapted from a table from IPCC (2005).
These confidence intervals reflect statistical uncertainty in the fitted model given the available data. A wide interval indicates that the result is weakly constrained. They do not represent the full range of possible climate futures, which would require consideration of additional models and scenarios.
The map interfaces
ScotClimATE visualises results with a coloured data layer over a zoomable and scrollable map. By clicking on individual grid cells, users can display the precise result and confidence intervals at that location (see Appendix D). The map interface highlights which cell the user is interrogating.
The map is displayed in the OSGB36 National Grid projection (explained in Ordnance Survey, 2025a). The National Grid projection has been chosen for several reasons:
- The underlying UKCP18 and HadUK‐Grid is distributed on this projection so we avoid introducing additional process uncertainties in re‐gridding.
- Maps on this projection are familiar to users who have used other Ordnance Survey map products.
- While the vertical axis does not correspond with North‐South, straight lines in this projection correspond very closely with straight lines on the ground.
- Distances between different points scale very closely within the Scotland domain, and displayed cells have almost exactly the same area as each other.
The last two points would not hold with a latitude‐longitude based projection, with distortion becoming worse further North. By providing data in same‐area cells, spatial averaging and visual comparison over areas – such as within Local Authorities – is intuitive. ScotClimATE provides a download function, where the downloaded comma‐separated values (.csv) or netCDF‐4 (.nc) files also contain the latitude‐longitude coordinates of the cell centres.
The underlying map uses Ordnance Survey data that represent geographic information at different zoom levels, including: settlement names, roads, hill‐shading and contours (available from Ordnance Survey, 2025b). Over this, users can choose to plot Local Authority Boundaries or NHS Boards. The data layer is coloured using colour‐scales selected for clarity and accessibility using ColorBrewer advice for cartography (see Harrower and Brewer, 2003). Users are able to adjust the opacity of the data layer to adjust the display of visualisations to their preference. Users may wish to use screen capturing software to save and share useful visualisations.
Hazard selection and slider interfaces
In the online tool, the control panel contains a number of sliders and information boxes. The information boxes provide descriptions of what the users are visualising based on the hazard selection and slider settings. Information boxes can be minimised, but the text is displayed by default and inline to facilitate accessibility where screen readers are used. The text of the descriptions is designed to equip the user with appropriate language for communicating what they are viewing in a way that is clear and concise, but still consistent with wider specialist literature in climate science.
At delivery, ScotClimATE can be used to visualise two extreme heat hazards and two extreme rainfall hazards. These are:
- Extreme heat: the highest maximum temperature.
- Sustained heat threshold for hot nights: the highest minimum temperature over three consecutive days.
- Extreme 1‐day rainfall: the most rainfall in one day.
- Extreme 3‐day rainfall: the most rainfall over three consecutive days.
After selecting a hazard, the user will choose a GWL. This varies from +0°C , being the 1850‐1900 reference period, to +4°C . It is important to note that users are selecting a global warming level, not a Scotland domain warming level. The projection of Scotland climate from GWL is discussed in Section 7. ScotClimATE does not allow users to visualise beyond a GWL of +4°C. This would be considering GWLs beyond those simulated in UKCP18. In this sense, we provide results from the statistical model only as interpolation within a range of simulated climates (see Philip et al., 2020).
When visualising results, the intensity of the hazards is the highest threshold expected to be exceeded in the return period. Users can choose to set intensity and visualise return period, or set return period and choose to visualise intensity. The process by which these hazards were selected for inclusion in ScotClimATE is discussed in Section 9.
Users can gain additional insights by comparing the change in the intensity‐return period relationship between different GWLs. When users select a visualisation of a change, they will have to also set a comparison GWL slider.
Return period sliders run from 10 to 100 years. Users may otherwise adjust an intensity slider which has a description and units that change with the choice of hazard, °C of temperature and millimetres of accumulated rainfall. The colour‐scale of the data layer changes with hazard selection.
Climate change in Scotland with global warming level
The UKCCRA3 advises adaptation planning based on defined GWLs (CCC, 2021). To capture how the intensity‐return period relationships of an extreme event vary with climate, ScotClimATE is built on non‐stationary GEV fits to the underlying data with a changing Scotland climate, measured as the year‐average temperature, as a covariate. However, due to global climate dynamics and local geography, the temperature of different regions change at a range of different rates with changing GWL. This section outlines the process we have designed to project a Scotland climate from a GWL. This is calculated as an anomaly from the 2000‐2020 reference climate with the change in Scotland climate with GWL following the sensitivity in UKCP18 simulations.
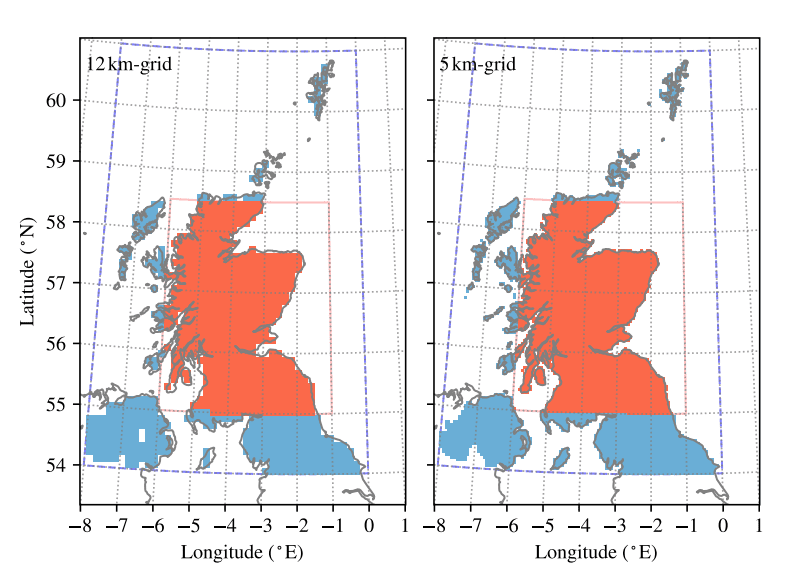
Figure 2: Scotland average temperature calculated from the shading in red. Left shows the 12km grid; right shows the 5km grid. (Cells where the models are fit (54°N to 61°N and −8°E to 0°E, blue and red shading), and the Scotland mainland land‐mask of Had‐Grid reporting cells (bound by 55°N to 58.5°N and −6°E to −1°E, red shading), projected onto the British National Grid).
Scotland year‐average temperature is an appropriate choice of covariate given the available data as, within the UKCP18 ensemble, there are large differences in average temperature at each simulation year. Our method uses information from the most intense weather events each year from all ensemble members, not a sample taken only from the hottest or wettest ensemble members.
Defining a global warming level
The GWL can be defined in various ways. We have used a commonly accepted and widely used definition, global average near surface temperature anomaly versus a pre‐industrial 1850‐1900 baseline (Morice et al., 2021). Many datasets are available for near‐surface, or 2 m above surface, air temperature.
We use HadCRUT5 data to estimate the GWL during a 2000‐2020 reference climate. HadCRUT5 provides a large ensemble of 200 estimates of the time series of global average temperature from 1850 versus a late twentieth century baseline. The largest spread between estimates is during the earlier part of the time series, where fewer weather observations are available, and more extrapolation is required. By randomly sampling from all possible 2000‐2020 GWLs from HadCRUT5 in our analysis, we are able to quantify this uncertainty in our analysis. The distribution of these estimates is shown in Appendix B.
Measuring climate change in Scotland
Operationally, there already exist indices for Scotland. For example, Jones and Lister (2004) have produced a Scotland temperature index based on a selection of weather station output, and Met Office (2019) define Scotland regional climatology using all land surface in Scotland.
However, to build ScotClimATE we have had to develop a particular definition of Scotland mainland average temperature to provide a relevant measure of Scotland climate that captures general changes with GWL. Plotted in Figure 2, we average over cells within mainland Scotland, bound by 55 to 58○N and −6 to −1○E. This selection excludes outlying islands and far‐western coastal areas where climate changes are likely to be heavily moderated by the slow‐changing northern Atlantic Ocean compared with inland and eastern areas. This simple definition can be applied to both UKCP18 and HadUK‐Grid data, and can be readily reproduced in other datasets.
To calculate the 2000‐2020 baseline climate, we use the annual average mainland Scotland climate. There is particular uncertainty in this calculation due to inter‐annual variability that the twenty year window is not long enough to account for. However, a much longer window would introduce other uncertainty, especially due to changing aerosol distributions over the late twentieth century. We apply a bootstrapping method – calculating averages of sets of randomly resampled 2000 to 2020 annual average temperatures with replacement – to find a distribution of possible baseline Scotland climate.
Finally, we estimate the sensitivity of Scotland temperature to GWL from UKCP18 annual average data. For this, we use the °C change in annual average Scotland mainland temperature in the RCM with the °C change in global average surface temperature in the GCM. This is shown in Appendix B (Figure 13) alongside a bootstrapping of 1000 estimates of this sensitivity for each ensemble member. To do this, we have assumed a linear sensitivity of Scotland temperature over the approximately 4°C change in GWL in each simulation. Inspection of the UKCP18 data shows no clear evidence of non-linearity over the simulated warming range, so a linear approximation is adopted. Other model results should also be analysed to build a deep understanding of how Scotland’s climate may change with global warming.
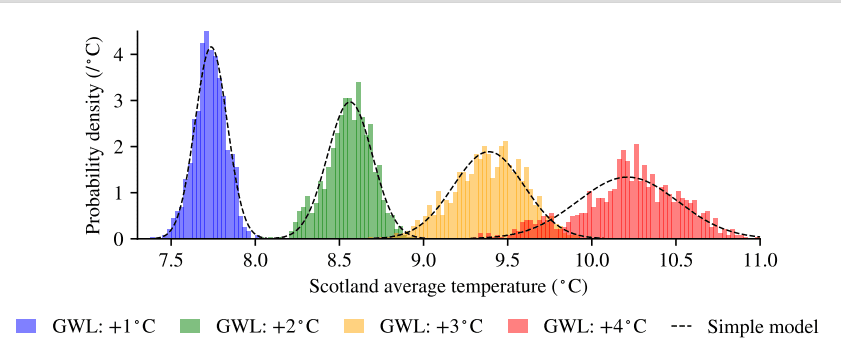
Figure 3: The histograms show 1000 estimates of projected Scotland average temperature distributions at four global warming levels (coloured bars). Distributions shift progressively to higher temperatures with increasing GWL. Dashed lines show a simple model fit closely matching the simulated distributions, expressed as probability density per °C.
A model for Scotland’s temperature
We consider changing Scotland temperature using the three components discussed above:

where TS(TG) is the projected Scotland average temperature at a GWL of TG, TS0 is the 2000‐2020 baseline Scotland temperature calculated from HadUK‐Grid, TG0 is the 2000‐2020 baseline GWL calculated from HadCRUT5, and α is the sensitivity of Scotland temperature to GWL calculated from UKCP18.
Without assuming underlying probability distributions of the values of TS0, α and TG0 we have randomly resampled the estimated values of these parameters to calculate 1000 bootstraps of possible values of TS at different GWLs. This is shown as histograms of different colours in Figure 3.
We have built a simple model to estimate TS(TG) with uncertainty. By assuming Gaussian distributions of possible values of TS0, α and TG0, we have calculated a mean fit and standard deviation of the parameter estimates (Table 3). Then, Equation 1 can be used to quickly find an estimate and uncertainty of TS(TG). These are included in Appendix B.
Probability distributions of this simple model are included in Figure 3. It effectively captures the underlying distributions of the bootstrapped estimates. As GWL is increased from the estimated GWL during the recent climate reference period (+1°C , Table 3), the uncertainty in Scotland’s climate quickly increases. Table 3 documents that the estimate of 0.83 ± 0.10°C increase in Scotland’s average temperature per °C increase in GWL is a major source of uncertainty in projecting future climate in Scotland.
| Parameter | Definition | Mean fit | Standard deviation | Source data |
|---|---|---|---|---|
| TS0 | Scotland average temperaturefrom 2000 to 2020 | 7.73○C | 0.09○C | HadUK‐Grid |
| α | Scotland average temperature change with GWL | 0.83 | 0.10 | UKCP18 GCM and RCM |
| TG0 | Global average temperaturechange for 2000 to 2020 versus 1850 to 1900 baseline | 1.00○C | 0.04○C | HadCRUT5 |
Table 3: Parameters used in projecting Scotland climate, TS, at different global warming levels. These parameters are used in Equation 1.Source data are described in Table 1.
Statistics of extreme events
Defining extreme events
We earlier categorised extreme events by their unusually large intensity (Coles, 2001a). However, it is obvious that this definition can be interpreted in a number of ways – and, for the purpose of understanding climate hazards, it is often useful to understand multiple definitions of extreme climate hazards.
Defining extreme events based on their frequency
Extreme events considered in ScotClimATE are categorised purely by how unusually intense they are. The statistical model is fit only to the set of single most intense events for each year. This annual maxima approach is used for consistency across hazards and ensemble members, and provides a stable basis for estimating return periods of rare events. The tool is used to visualise intensity thresholds of heat and rainfall that are expected to be exceeded once in ten or more years, or the return period of intensities that are only expected once every few years or longer.
To reiterate – the purpose of ScotClimATE is to provide users information on the most challenging weather for adaptation, and how this is projected to change with GWL. By using this method, we are able to directly analyse the intensity‐return period relationship of extreme events, and build statistical models that can project the behaviour of the rarest events that may have been seldom or never yet observed.
Defining extreme events based on clear quantifiable intensities
However, there are likely to be cases where scenario analysis requires users to consider other definitions of extreme hazards.
It is clear to communicate thresholds that are connected to our day to day understanding of potentially hazardous weather. For example, for extreme heat LACS (Met Office, 2024a) communicates:
- ‘Summer Days’ as passing a threshold of 25°C
- ‘Hot Summer Days’ as passing a threshold of 30°C
- ‘Extreme Summer Days’ as passing a threshold of 35°C
Defining extreme events based on their impacts
Alternately, as adaptation planning is built on an understanding of risk, which is a product of hazard, exposure and vulnerability (Field et al., 2012; Grace et al., 2025): it is clear that it is also important to understand extreme events based on their impact. High impact, high mortality, events may not necessarily be the most unusually intense events (Philip et al., 2020). Indeed, many of the highest impact events result from compounding hazards, where the individual hazards may not have exceptionally high intensity (Lee et al., 2024).
There may be empirical definitions of extreme weather based on identifying thresholds linked to impacts on human life. The clearest example is the risk linked to temperature hazards (for a UK analysis see Gasparrini et al., 2022). For example, Masselot et al. (2023) have calculated empirical relative risk relationships between high and low temperatures and excess deaths in European cities. The threshold for increased mortality from high‐heat can be lower than one might expect; Public Health Scotland (2025) have used mortality data to identify 18.2°C as a threshold for Scotland temperature above which there is significant increased risk of death.
The Generalised Extreme Value (GEV) distribution
The use of non‐stationary GEV with some appropriate selection of covariate that captures wider scale climate change has been established for climate attribution of extreme events (Philip et al., 2020). It has further been used to project how the distribution of extreme events changes with human induced forcing (such as by Auld et al., 2023).
The Generalised Extreme Value distribution (GEV) describes the distribution of the maximum values of a distribution in each of a series of independent blocks (Coles, 2001a). In ScotClimATE, the blocks are individual years, and the maxima are the most intense heat or rainfall events in each of those years. By selecting block maxima, we simplify the analysis versus selecting the peak values above a specified threshold: there is a clear relationship between the fitted distribution and the return period; we ensure that all extreme events are independent of each other; and we are able to easily include data equally from all UKCP18 ensemble members despite large temperature differences between ensemble members.
The process for this is:
- We extract extreme events from simulations and observations.
- We consider these with the modelled or observed annual average temperature in Scotland in the year when they occur.
- We fit an appropriate non‐stationary GEV distribution that captures how the statistics of the extreme events change with the annual average temperature in Scotland.
- We bias correct so that frequent present events look like observations, but projections at higher GWLs are informed by simulations.
- We test many possible resamples of the data to calculate confidence intervals for every result.
The non‐stationary GEV introduces changes in selected terms of a stationary GEV with a changing covariate (Coles, 2001b), such as changing climate. The stationary GEV is described with three parameters (see Coles, 2001a): the location describes position of its centre on an intensity scale; the scale describes the spread of the distribution on an intensity scale; and the shape describes the behaviour of the upper tail of high‐intensity events. In ScotClimATE: the location tells us about frequent extreme events that are expected to occur every few years; the scale tells us about the variability between years; and the shape tells us about how much more intense the rarest events are compared to the distribution of more-frequent events.
Depending on the value of the scale parameter, a GEV may have a defined upper limit or not. Auld et al. (2023) note that GEV distributions fit to extreme heat events generally have an upper limit, suggesting extremes above this limit are virtually impossible (Thompson et al. (2025) identify where this is not appropriate), whereas GEV distributions fit to extreme rainfall events generally do not. In ScotClimATE, we do not assume that an extreme intensity suggested as virtually impossible based on a GEV fit to UKCP18 data is in fact impossible – instead we communicate that it has an expected return time exceeding 200 years.
Extracting information from simulations
Introduced in Section 5, UKCP18 contains 1200 years of simulated UK weather in a wide range of possible climates. By identifying Scotland mainland annual average temperature as a covariate, we are able to use the full 1200 years data to fit a suitable statistical models to distributions of extreme events that change with climate. Included in Appendix C is the relationship between the parameters of the GEV distribution and the covariate to build a five parameter statistical model (c, loc0, loc1, scale0, scale1). In ScotClimATE, non‐stationary GEV distributions are fit for every land cell in a 12km grid for extreme heat (Met Office Hadley Centre, 2018c), and a 5km grid for extreme rainfall (Met Office Hadley Centre, 2019).
The twelve UKCP18 ensemble members produce a wide range of simulated climates for Scotland across the 1980‐2080 projection period, both in comparisons between members and within individual simulations. Between members, even at the same simulation years, there are a large range of annual mean temperatures. UKCP18 projections possess a cold bias for Scotland, with many simulated years colder on average than any observed years in HadUK‐Grid. However, the ensemble of results follow the same non‐stationary distributions of extreme events with Scotland climate – the physics being the same, but with different starting conditions between runs (Lowe et al., 2018).
As shown in Appendix C, the large number of UKCP18 simulation years and wide range of simulated Scotland climates allows us to capture both the behaviour of very rare extremes (based on the shape and scale0 parameters) and the change in the location and scale of the distribution with changing climate (based on the loc1 and scale1 parameters). The observational record alone would not have been useful for understanding possible future extreme hazards due the very small range of observed Scotland climates.
Bias correction and smoothing
ScotClimATE is designed to visualise the statistics of extreme events in UK climate projections (UKCP18 Lowe et al., 2018). However, these projections contain biases. We apply a limited bias correction such that in ScotClimATE the intensity‐return period relationship of common extreme events in the present climate resemble observed common extreme events in the present climate. To this end, in each cell the distribution is shifted such that the location at the present climate is that of the fit to HadUK‐Grid observation based data (the loc0 parameter from the fit to HadUK‐Grid is used). Notably, we find that after this observation based bias correction, extreme heat events are around 2°C more intense in the Scottish central belt than if the statistical model had been built on UKCP18 data alone.
In this bias correction, we have attempted to preserve as much information on the variability of the highest‐intensity events between years, and the distribution of the rarest extreme events relative to more-frequent events, from UKCP18. Particularly for the rarest, highest‐intensity, events UKCP18 may offer insight into physically possible – but not necessarily observed yet – conditions that lead to hazardous weather. For the purpose of climate adaptation it is useful to exploit such hazard projections from UKCP18 (Grace et al., 2025).
As well as bias correction, we have applied a spatial smoothing to the statistical model fit to extreme rainfall projections in the CPM. The smoothing is based on a convolution with a 2D Gaussian kernel with σ = 10km. This is useful due to the small spatial scale of the most extreme rainfall events, and some unphysical processes that can occur during the CPM simulation (Kendon et al., 2019). In particular, it allows ScotClimATE to use information from nearby cells to inform projections where extreme rainfall events have been modelled or observed, and to fill individual cells where anomalous data exist and the statistical model could not be appropriately fit.
It is worth noting that Met Office Hadley Centre (2021) suggest quantile mapping as a useful method for bias correction of UKCP18 data. In ScotClimATE we have opted not to use this method, particularly as the rare events we aim to capture may only be expected a few times in a century. Therefore, we might only require quantile mapping of the most extreme one in 5000 days of data – for which we have a very small set of observations. Quantile mapping would become a very expensive method where we are only concerned with the statistics of unusual weather.
The development process
ScotClimATE was developed with funding and project supervision from CXC, and close communication with the Scottish Government Adaptation Team and with Scottish Government analysts with software expertise. Scientific supervision was provided by Prof. Simon Tett, the Chair of Earth System Dynamics at University of Edinburgh; with external quality assurance of the scientific methods reviewed at an early stage by Prof. Stuart Galloway of the University of Strathclyde. The project proposal to develop ScotClimATE extended the working team to include time for Dr David de Klerk, a research software engineer at the University of Edinburgh, to translate the scientific analysis underpinning ScotClimATEinto an interactive and user‐friendly online tool. This time was included within the original proposal budget specification.
ScotClimATEhas been produced through an agile development process. This process was proposed in order to maximise the utility of the tool for the users given the very short project time: three months to prototype delivery, one month of prototype testing, and three more months to final delivery. The agile process proposed:
- building a prototype version of ScotClimATEfor visualising extreme heat
- gathering data from user testing of the prototype tool (user feedback contained in PSCAN User Survey 2025) and taking input from an expert steering group to inform further development
- agreeing immediate actions with the Scottish Government Adaptation Team and CXC to meet key milestones and to complete development
Extreme heat was proposed for the prototype tool as a climate hazard with a clear potential for impact (Masselot et al., 2023) and a clear physical relationship for change with increasing annual mean temperatures. Three further hazards, sustained heat threshold for hot nights, extreme one‐day rainfall and extreme three‐day rainfall, were included based on insights from PSCAN user feedback and input from the Scottish Government Adaptation Team.
User interaction and testing
As discussed in Section 3, PSCAN are the intended users of ScotClimATE. Project development began in July 2025, with a sketch of the proposed user interface delivered to CXC and Scottish Government Adaptation Team in the first project meeting. In August 2025, project development and progress on initial development were introduced to the expert steering group and PSCAN.
Insights following these early interactions were included in the prototype tool. In particular: a disclaimer page was added to ScotClimATE to outline the intended user purpose and to avoid misuse of the tool in property planning; uncertainty communication was simplified into calibrated language (Section 6); and data download options were added to allow users to further conduct their own offline analysis of projection data.
The prototype tool was delivered to Scottish Government Adaptation Team at the end of September 2025. In mid‐October 2025 user testing was conducted during the PSCAN bi‐annual meeting. Users were given a presentation overview of ScotClimATE and practical tutorial on how to use the prototype tool. Users were then able to test the prototype tool hosted online. An optional survey with corresponding participant information sheet was available for users to give feedback after testing. The survey was open for one week following the PSCAN bi‐annual meeting to allow users additional time for testing. Before the PSCAN bi‐annual meeting, the process including the tutorial, survey, and participant information sheet underwent ethical assessment and achieved approval from The University of Edinburgh School of GeoSciences Ethics Committee.
Feedback from user testing
Fifteen PSCAN users returned surveys and consent for information from their feedback to be used in publications. Users were asked to rate the usefulness of the prototype tool, their ability to understand certain content in the tool, and the usability of the tool’s features. Then, users were given long answer boxes to provide insight into additional features and hazards that would be useful to include, as well as any additional feedback to help in the development of ScotClimATE.
In its current form, how useful is the tool for helping you to plan for
and assess changes in extreme heat at +2°C and +4°C respectively?
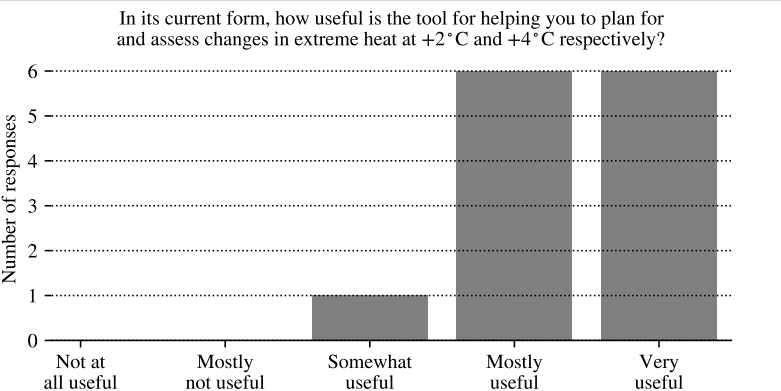
Figure 4: Bar chart showing perceived usefulness of the tool (PSCAN User Survey 2025). No respondents selected “not at all useful” or “mostly not useful.” One selected “somewhat useful,” while most rated it “mostly useful” or “very useful,” each with six responses.
PSCAN users provided extensive, helpful and insightful feedback that has been invaluable in the development of ScotClimATE. We understand that while the tool provides information on hazard, the users themselves are best placed to understand vulnerability and exposure to that hazard within their own service (Grace et al., 2025). We delivered a detailed synthesis of the user feedback to the Scottish Government Adaptation Team and to the steering group of experts.
Usefulness and use cases
Of 13 responses, 12 users found the prototype version of ScotClimATE either mostly or very useful in helping them to assess changes in extreme heat at +2°C and +4°C respectively (Figure 4). Users found it useful to both understand the return period of a given intensity of extreme heat and to project the intensity from a given return period.
Given the four different calculations available in the prototype tool, how might you use it?
“To determine how important it is for us to prepare for higher temperatures […]”
“[…] assess and rank current and future risks.”
“Go service‐by‐service in the local authority, identify critical temperatures & events with them and inform them how often those things are likely to occur. Compare return periods for risks across the country. Find other local authori‐ ties with similar climate risks.”
(relevant segments of responses from PSCAN User Survey 2025)
Users provided thoughtful insights for how an understanding of return period of particular extreme heats can help adaptation planning for their services. Users suggest that they can determine an importance for preparedness to different temperatures by quantifying the probability of experiencing defined heat thresholds each year (the reciprocal of the return period). Similarly, by building the projected hazard into a risk framework – such as with a damage function for their own service – users might build a ranking of present and future risks.
A strength of giving users access to visualisations of a whole Scotland analysis is that they are able to quickly see spatial distribution of how hazards present and develop. Even for users working within a particular Local Authority or NHS Board, they are able to identify other locations suitable for collaborative adaptation planning. This ability to identify where to share knowledge and insights may translate to a more collaborative approach to adaptation at the national scale. We provide a brief Scotland scale example of projecting return time from intensity in Section 10.1.
Given the four different calculations available in the prototype tool, how might you use it?
“Intensity: this can be used to consider potential impact of hot temperatures on specific areas, urban and rural and especially specific […] assets. […]”
“Would use this tool to assess which assets would be exposed to extreme events in different GWLs and return periods.”
“[…] To determine adaptation measures.”
(relevant segments of responses from PSCAN User Survey 2025)
Similarly, users can consider the frequency of risk that their service has to withstand. Users can use ScotClimATE to project the intensity of extreme events that is expected to be exceeded in particular return periods. By understanding particular temperature thresholds that the assets that they are responsible for are sensitive to, they can directly identify which assets are vulnerable in their climate scenario analysis.
Alternatively, for their own region, users can identify hazard thresholds they need to consider for different return periods that they are adapting to. This could accelerate users’ identification of adaptation measures they must take to prepare for increasing GWL. We provide a discussion of different hazard intensities at particular return periods and return times in Section 10.2.
Understanding and usability
Of 14 responses, 12 users agreed that they understood the purpose and caveats of the tool (Figure 5). However, one user identified that the disclaimer should inform users that the tool is for projecting meteorological hazards, not for providing information on other factors required to calculate risk such as vulnerability to hazards. Users expressed that further guidance on understanding vulnerability (beyond the scope of this project) would help them in adaptation planning for extreme hazards.
Fewer users agreed that they understood how uncertainty was communicated through the tool. Of 14 responses, only three users strongly agreed that they understood how uncertainty was communicated. Indeed, the tool itself provided very little information on how uncertainty was defined or communicated. One user communicated that they had a statistics background so found the presentation that contained a description of how confidence intervals were calculated easy follow. Communicating the processes of uncertainty calculation requires technical information that is likely unfamiliar to most of the tool’s users (we provide a description here in Appendix D).
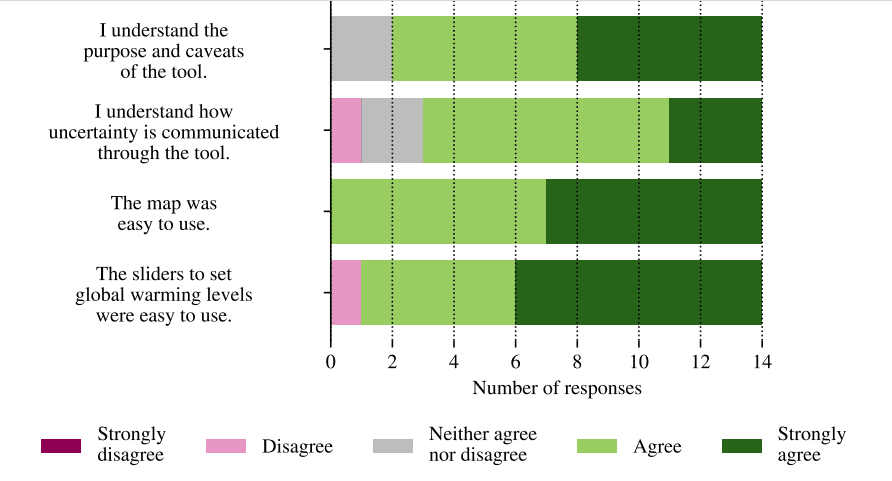
Figure 5: Horizontal stacked bar chart showing survey responses (0–14 respondents) to four statements about the tool. Most respondents agree or strongly agree that the tool is easy to use and that sliders are easy to use. More mixed responses are shown for understanding uncertainty and the tool’s purpose and caveats (PSCAN User Survey 2025).
In ScotClimATE, confidence intervals indicate the distribution of possible fits to results given that the tool is built only for visualising UKCP18 projections. In rigorous weather attribution studies it is important to undergo formal model validation and to use as many lines of evidence as possible (see Otto et al., 2024; Thompson et al., 2025). In designing ScotClimATE, we accept that UKCP18 currently provides the most applicable and well‐understood set of UK projections useful for adaptation purposes (Grace et al., 2025; Lowe et al., 2018). To these ends, narrow confidence intervals indicate where projections are well constrained within our methodology, whereas wide confidence intervals indicate poorly constrained projections. The projection from GWL to ScotClimATE is a major source of uncertainty in any projection (Section 8).
In all 14 responses, users agreed that the map was easy to use. Users suggested additional functionality for the map interface, including: postcode location search; the ability to add a ‘pin’ to a particular location to compile multiple hazards with similar functionality to the LACS “Generate Report” feature (Met Office, 2024a); and the ability to view other geographic information such as river basins and topography.
Similarly, there was high agreement that the slider to set GWL was easy to use. However, one user was not able to slide them. This could have been from computation limitations because the prototype version of the online tool had not been fully optimised for many users to access it, or because the user’s device or web browser did not allow that functionality. Users highlighted that while the description of GWL was useful, they wanted to understand how this relates to representative concentration pathways (RCPs) (described by van Vuuren et al., 2011). We have elaborated on the strength of analysing projected hazards based on ScotClimATE as a function of GWL in Sections 3, 7 and 8. Even between UKCP18 ensemble members there is a wide range of Scotland climates at the same years with the same RCP. Users can consult IPCC reporting on how GWL is projected to change with time in different Shared Socio‐economic Pathways (such as in IPCC, 2021, Figure SPM.8).
Many users provided helpful insights for how the language in the prototype tool needed to be revised to improve its usability. Users preferred clearer explanation for the parameters they were setting and less use of technical terminology.
Additional features
Following user testing, a second development cycle updated the prototype tool into the delivered version of ScotClimATE. Based on the user feedback, project team suggestions and Scottish Government Adaptation Team needs a prioritisation of the remaining work was agreed following the agile development process. Actions were prioritised and agreed.
The first priority was a language review with a focus on building clarity and user understanding. For example, based on user feedback, explanation for the return period of hazards was included in terms of the ‘1 in x year event’, and when projecting from the intensity of hazards the description of the slider and the information in the description boxes were designed to change to repeat the definition of the hazard. The interface in the control panel was also slightly re‐ordered to improve the usability based on user suggestions.
Next, three additional hazards for sustained heat and for rainfall were analysed and included in ScotClimATE (details of the selection process for these hazards are included in Section 9.4). Optimising the web tool, debugging and additional map functionality were also prioritised.
A number of user‐suggested features were rejected from inclusion. The ability for users to upload other datasets to analyse posed significant security concerns. Additionally, there would be significant software overheads in order to control and validate that users were uploading appropriate files and to build any system that would allow users to conduct their desired operations beyond the delivered scope of ScotClimATE. Similarly, we are unable to build the functionality to allow users to upload their own shapefile to define data downloads. Instead, ScotClimATE allows users to download netCDF4 data, which can be uploaded directly into certain geographic information system platforms such as ArcGIS (Esri, 2025).
Other functionality included deeper analysis of confidence intervals. This is likely not useful for the general user as confidence intervals in ScotClimATE are not based on a full assessment of multiple lines of evidence. However, the downloadable data from the tool includes a number of quantiles that can be used for a deeper analysis of the fitting uncertainty. For example, advanced users will be able to analyse the 95% confidence interval (such as in Section 10).
Some users suggested further scientific analysis that would assist adaptation planning in Scotland. Generally, these involved understanding compound hazards, such as drought followed by rainfall and interpreting results at higher resolution than the underlying data. Other suggestions included decoding the impact contribution from different factors, such as from urban heat islands. These suggestions provided useful insight into user needs but were beyond the scope of ScotClimATE so have not been included in the tool.
Additional hazards
Users suggested a wide variety of other hazards that could be included in the prototype tool. We have synthesised these into five categories: temperature hazards, rainfall hazards, lack of rainfall hazards, coastal hazards and other hazards. Within these categories, analyses of individual hazards were determined to be: doable within the current workflow; potentially possible with a different work flow; already provided by LACS; or not possible in this project/requiring new theory or data.
There was a methodological problem in the survey where users were asked to comment on ‘other climate hazards’ after testing a prototype for visualising extreme heat. This resulted in very few responses for more heat hazards. However, between the project team and the Scottish Government Adaptation Team, it was decided that 3‐day sustained heat threshold for hot nights was a useful hazard to include for its relation to health impacts, especially following Public Health Scotland (2025) publishing analysis of Scotland heat mortality data.
This hazard was analysed as block maxima in the same framework as extreme heat; sustained heat threshold can be defined as the annual maximum 3‐day minimum temperature. A related hazard in LACS is the annual count of nights warmer than 20°C . However, this threshold is generally inappropriate for understanding hot nights in Scotland where this threshold is generally not experienced even once per year. By analysing this hazard from an extreme value perspective, we are able to understand the most challenging rare events.
Users did not suggest hazards related to minimum temperatures. It is possible to conduct a similar analysis to extreme heat, but for a threshold of extreme lowest temperatures. LACS provides projections of annual minimum temperatures. Three users suggested it would be useful to visualise projections of heat at lower thresholds than are included in the tool, such as 25°C. This would be inappropriate to include as in many places these temperatures are expected multiple times per year already, so cannot be analysed as rare extreme events. As mentioned in Section 5, LACS already provides projections of the expected number of days exceeding 25, 30 and 35°C heat per year.
Ten users identified that 1‐day maximum precipitation should be included in ScotClimATE. As well as this, two users identified sustained precipitation. We agreed with the Scottish Government Adaptation Team that we would include 1‐day and 3‐day maximum precipitation. Both of these were suitable for extreme value analysis using the UKCP18 CPM data Met Office Hadley Centre (2019). Three users suggested changes in seasonal rainfall, which are already available in LACS and do not follow an extreme value distribution. Three users suggested including extreme flooding projections which are not provided in ScotClimATE. Users should instead use the SEPA Flood Maps tool and SEPA Climate Change Allowances Guidance to understand these.
Three users suggested lack of rainfall hazards. These could be understood in future analyses based on changes in standard precipitation indices for different lengths of drought. LACS currently provides summer and winter precipitation changes versus a 1981‐2000 baseline.
Three user responses related to changing sea level and extreme maximum storm surge height. Met Office Hadley Centre (2018a) provide guidance on how storm surge projections can be derived from UKCP18 data. Changes in storm surge height arise from changes in the mean sea level, which is projected to increase with time, and the distribution of storm surge anomalies around this mean level.
Other hazards related more directly to impacts, such as projected erosion rates, and changes to growing periods (counts of growing degree days per year are provided by LACS). Five users suggested the tool should include changes to maximum gust speeds. Making projections of future storminess remains a major challenge. In particular, this requires new understanding of changes in future North Atlantic storm counts and trajectories (Section 4).
How to use the tool
This section provides a brief tutorial for how to produce and interpret results in ScotClimATE. We provide examples of possible uses of the tool. Figures 6, 7, 8, 9 and 10 demonstrate a range of possible outputs from the tool. In each multi‐panel figure, the rows show projections at different GWLs, while the columns indicate the central estimate of the projection and the 95% confidence interval. The lower 2.5% quantile is the threshold below which lie the lower 1‐in‐40 results, while the upper 97.5% quantile is the threshold above which lie the upper 1‐in‐40 results. Each of these figures can be produced by downloading output data from the final version of ScotClimATE.
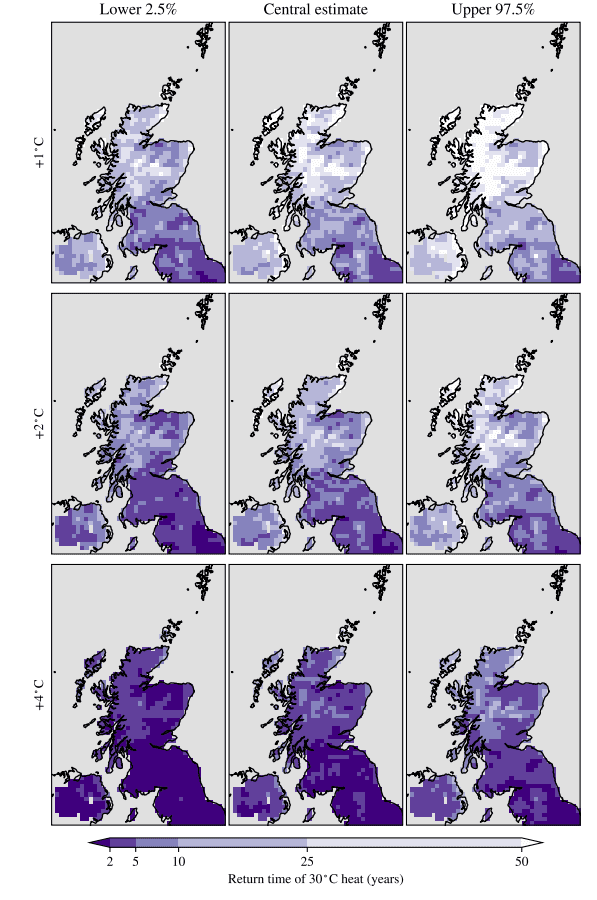
Figure 6: How often 30°C heat is expected to be exceeded at +1°C, +2°C and +4°C warming (rows). Columns show central estimates between a lower 2.5% and upper 97.5% confidence bounds of the results. Darker shading means shorter return times. The panels show that 30°C heat becomes much more frequent at GWL of +2 and again at +4°C warming than in the recent past.


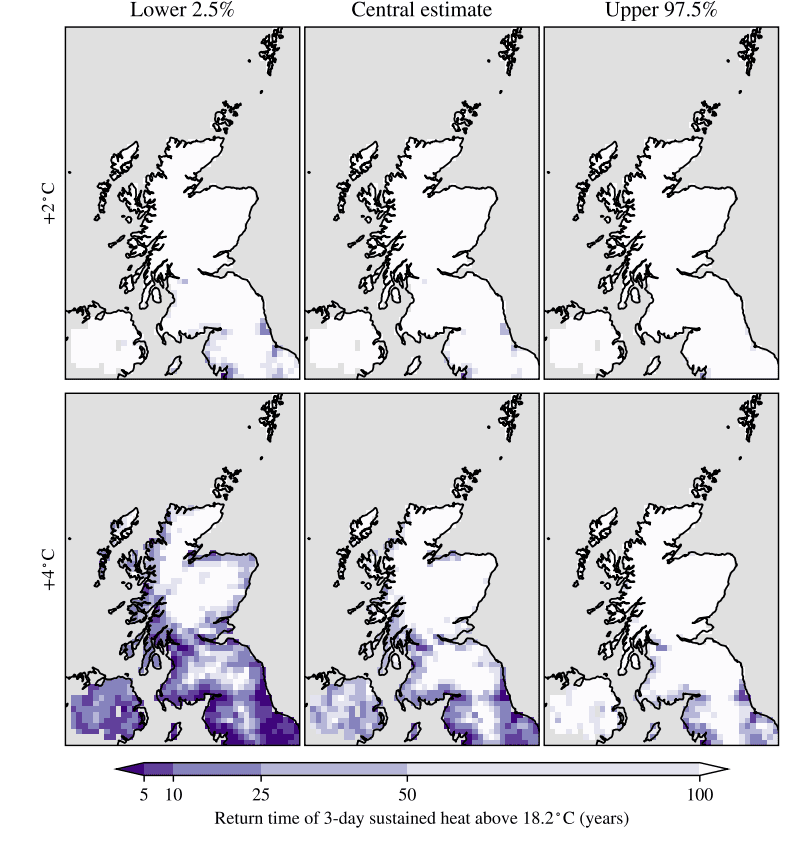
+2 C
+1 C
+4 C
Figure 7: The return time of sustained heat above a threshold of 18.2°C heat at GWL of +2 and +4°C in ScotClimATE (top row, bottom row). Columns show the central estimate, and lower and upper bounds of the 95% confidence interval (middle, left and right). This shows that 3-day sustained heat above 18.2°C is expected multiple times in 100 years in Southern and Western coastal regions at +4°C.
Figure 8: The hottest temperature threshold expected to be exceeded in 50 years at a GWL of +1°C in ScotClimATE. In the central belt, extreme heat between 31 and 35°C is expected. Columns show the central estimate, and lower and upper bounds of the 95% confidence interval (middle, left and right).
When we know a threshold that our service is sensitive to
When using ScotClimATE to help adaptation planning in the public sector, users can first consider the particular vulnerability of assets in their service to identify the thresholds of
hazards that those assets are sensitive to. Extreme events pose particular challenges for risks with non‐linear damage functions, or relative risks that increase rapidly beyond a particular weather intensity. An example of this would be the ‘J‐shaped’ heat mortality curves, where relative risk increases quickly for heat above a minimum mortality temperature (Gasparrini et al., 2022; Masselot et al., 2023; Public Health Scotland, 2025).
Supposing a user has identified a particular vulnerability at 30°C, they can produce a series of projections of the return period of that heat. This is shown in Figure 6. In the recent reference period, GWL of +1°C, this heat was expected for 1 in every 10 to 50 years in Central and North East Scotland, but much more frequently in the Tweed valley and along the Solway Firth where 30°C heat is expected in a comparable number of years as it is in northern England. This heat was expected in fewer than 1 in 50 years in the outlying islands of Shetland, Orkney and the Outer Hebrides.
At a GWL of +2°C, 30°C is expected every 2‐5 years around Glasgow. Projections like this are at the limit of the usefulness of ScotClimATE. Where a high temperature is expected this frequently it is more appropriate to use LACS to analyse the projected count of days at this temperature per year. At a GWL of +4○, many areas in central Scotland should expect to see at least one instance of 30°C heat most years. At this projection, 30°C heat is expected for more than 1 in every 25 years throughout mainland Highland.
Public Health Scotland (2025) has identified a significant impact on mortality of Scotland heat above a threshold of 18.2°C . Using ScotClimATE, we can interrogate where this heat threshold may be sustained over three days. At a GWL of +2°C this is unlikely anywhere, perhaps occurring only a handful of times in a century in Glasgow and in the Tyneside conurbation, England. However, this sustained heat is projected to be much more-frequent at a GWL of +4°C . Likely mediated by summer sea surface temperatures, this sustained heat becomes more likely around coastal regions at the higher GWL. In the central estimate, around Glasgow, this may occur during more than 1 in every 10 years.
When we have a defined frequency of a hazard that we need to be resilient to
ScotClimATE can be used for visualising the intensity of hazards expected with an identified frequency. The tool is most useful for understanding hazards that may occur a few times in a century. Figure 8 shows the hottest temperature expected to be exceeded only once in 50 years in the recent climate. These temperatures correspond with some of the hottest recorded temperatures in Scotland, such as during the July 2022 heatwave where heat exceeding 35°C was observed in the Scottish Borders (STV News, 2022; Met Office, 2026).
When we want to understand changes in hazards
The tool also allows users to visualise changes in extreme events. This is particularly useful when users want to understand the additional stress on a service from an extreme event due to global warming. This is shown for the 1‐in‐50 year threshold in Figure 9. At a GWL of +2°C this is 0 to 3°C higher than at +1°C. This projection suggests additional heat stress during rare extremes.
Then, at GWL of +4°C, the projected increase in this unusually high heat is 3 to 6○ across most of Scotland, with greater increases in eastern regions than in western regions. This is a substantial increase in hazardous temperature. This highlights an important message for climate adaptation in Scotland. While Scotland average temperature is expected to increase slower than the global average temperature (Section 7), the infrequent hottest days increase in temperature faster than the global average temperature.
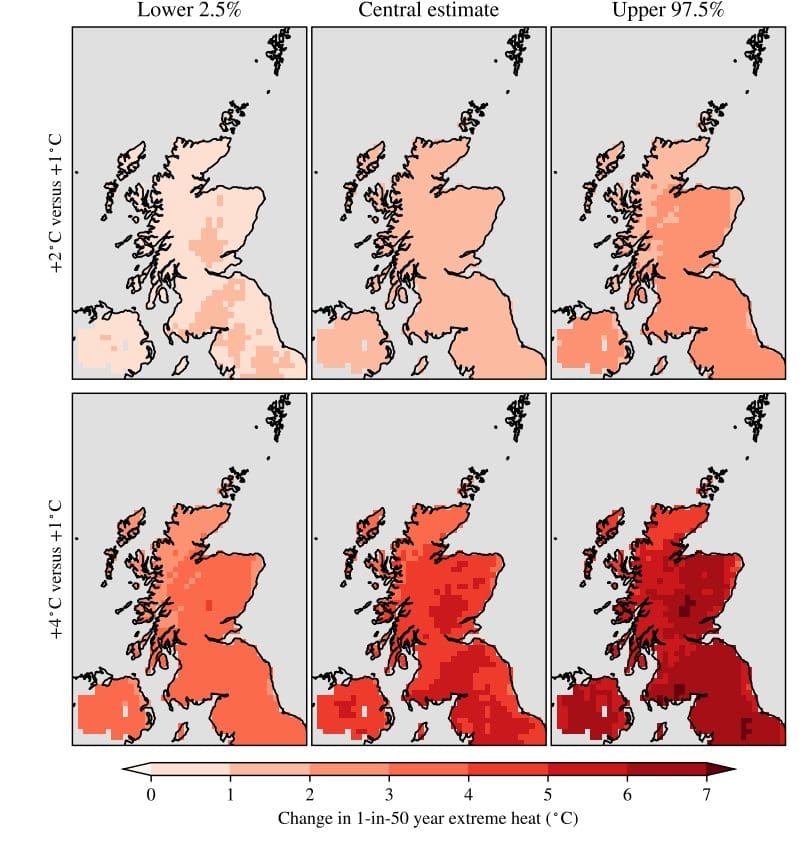
Figure 9: The change between different GWLs in the threshold of the hottest temperature expected to be exceeded in the 50-year return time in ScotClimATE. The top row shows the change at +2°C from +1°C and the bottom row shows the change at +4°C from +1°C. Columns show central estimates between a lower 2.5% and upper 97.5% confidence bounds of the results. 

Figure 10 shows projected changes in the 1 in 100 year 3‐day sustained rainfall at GWLs of +2°C and +4°C versus the recent climate. Mostly, these increases are projected at around 3 to 5% per ○C change in GWL. In Aberdeenshire, some fits even project a decrease in extreme precipitation. However, the greatest increases in extreme sustained precipitation generally correspond with the wettest areas across western and elevated areas.


Figure 10: The change between different GWLs in the threshold of the most rainfall accumulated over three days in a 100 year return time in ScotClimATE. The top row shows the change at +2°C from +1°C and the bottom row shows the change at +4°C from +1°. Columns show the central estimate, and lower and upper bounds of the 95% confidence interval (middle, left and right). Note, the Shetland Islands lie too close to the edge of the UKCP18 CPM domain (Kendon et al., 2019).
Conclusions
Extreme weather events are challenging to adapt to. Our analysis shows that in Scotland, extreme heat and rainfall will become more hazardous in a warming world. For exposed people, services and assets, risks from these hazards will increase unless adaptation measures are taken to reduce their vulnerability.
ScotClimATE adds to a growing set of online tools that public bodies can use to inform climate scenario analysis for adaptation planning. They can use SEPA Flood Maps to visualise flooding projections, the Local Authority Climate Service to visualise chronic and frequent hazards, and ScotClimATE to visualise unusual extreme events. In building ScotClimATE, the team have provided insights into how Scotland’s average temperature will warm with different global warming levels, and how the hottest and wettest days are likely to change aligned with GWLs.
In October 2025, users responded that the prototype version of ScotClimATE was useful for assessing changes in extreme heat. They generally agreed that its features were understandable and easy to use. Since then, we have drawn on their user feedback, input from the Scottish Government Adaptation Group and from a steering group of experts to improve the usability of the final tool and include projections of additional hazards useful in adaptation planning.
Suggested future development of ScotClimATE
A review at 12 to 24 months after launch could help users gain the most value from the tool. The review should gather feedback on how users engage with the tool, what has worked well, and where they have faced challenges. By learning from both successes and difficulties, the Scottish Government could better understand public sector needs for climate adaptation guidance and identify practical improvements to ScotClimATE.
The project behind ScotClimATE has translated insights from scientific research into a tool that public bodies can use to understand extreme weather events. Section 9 explains how the tool helps users identify climate hazards that are shared across different areas of Scotland. This can encourage collaboration and knowledge sharing between organisations about how to manage climate hazards and risk.
ScotClimATE could be developed into an educational resource beyond the framework of climate scenario analysis. The interface and visualisations are designed to be accessible by non‐specialists, and the projections it provides are of wider public interest than the identified PSCAN user base.
An objective of SNAP3 is that Scotland should be ‘a global hub for adaptation research,’ (Scottish Government, 2024). To this end, the Scottish Government identifies the need for international collaboration and knowledge exchange for the success of its education and research institutions. The methodology behind the scientific analysis of ScotClimATE is ready to be applied to other UK and to international case studies. Similar tools for other UK regions can use the same datasets, but regional climate would need to be suitably defined for each region.
The knowledge gained from developing and testing the online tool with users provides a framework for communicating climate science in a user-centred way. By sharing knowledge of projected climate hazards and adaptation measures internationally, researchers and public bodies could further progress adaptation efforts and deepen understanding of the shared challenge posed by climate change.
Outstanding questions
As we have highlighted in this report, the analysis in ScotClimATE is built only on a small number of underlying datasets. A more robust analysis of extreme events in Scotland should be built on many lines of evidence, as is done in robust attribution studies such as Otto et al., 2024; Philip et al., 2020; and Thompson et al., 2025. ScotClimATE was developed to meet an immediate practical need with a short delivery timescale. As a result, the depth of analysis possible was limited.
This means that ScotClimATE does not account for some aspects of hazards that have been identified in other studies. For instance, a potential collapse of South to North heat transport in the North Atlantic Ocean with increasing global temperatures. This is considered a low‐probability but high‐impact risk for Scotland (CCC, 2021, IPCC, 2023). Less ocean heat transport to UK waters could lead to a cooling climate in Scotland (Jackson et al., 2015). However, based on the range of possible fits to UKCP18 projections, this is virtually impossible in ScotClimATE, where Scotland average temperature is assumed to warm at a rate of 0.83 ± 0.10°C per °C increase in GWL.
New research is needed to quantify and project the possible – albeit low‐probability – hazard of cooling in Scotland. It may also be possible to make better use of existing scientific practice and expertise in Scotland. For example, a communication tool that visualises ongoing monitoring of the circulation in the North Atlantic (for example, Fox et al., 2025) may provide insight into the development of this hazard.
The analysis behind ScotClimATE provides insight into the statistics of extreme weather in Scotland. Further research and improvements to the statistical method could narrow the range of projections the tool offers. However, variation in how much Scotland’s temperatures may warm is likely to remain a major source of uncertainty.
The online tool is designed for a very specific purpose, but the framework that has been developed for visualising results is generic enough to incorporate other hazards and datasets using the same approach. We do not recommend repeating the analysis of the hazards provided in ScotClimATE during the lifetime of UKCP18 as it would not be useful – even as more observation data become available. Instead, the tool could be expanded to include other hazards as appropriate data is released. This could include projections of extreme storminess when high resolution projections of storm tracks become available, such as from the ongoing CANARI project.
References
Adaptation Scotland (2025). Public sector. Adaptation Scotland page on public sector participation. URL: https ∶ //adaptation.scot/our − work/public − sector − climate − adaptation − network/.
Arias, P. A. et al. (2021). Technical Summary. Tech. rep. Cambridge, United Kingdom and New York, NY, USA: IPCC, pp. 33–144. DOI: 10.1017/9781009157896.002.
Arnell, N. W. et al. (2025). “High‐Impact Low Likelihood Climate Scenarios for Risk Assessment in the UK”. In: Earth’s Future 13.12. e2025EF006946 2025EF006946, e2025EF006946. DOI: https ∶ //doi.org/10.1029/2025EF006946. eprint: https ∶ //agupubs.onlinelibrary.wiley.com/doi/pdf/10.1029/2025EF006946. URL: https ∶ //agupubs.onlinelibrary.wiley.com/doi/abs/10.1029/2025EF006946.
Auld, G., G. C. Hegerl, and I. Papastathopoulos (2023). “Changes in the distribution of annual maximum temperatures in Europe”. In: Advances in Statistical Climatology, Meteorology and Oceanography 9.1, pp. 45–66. DOI: 10.5194/ascmo − 9 − 45 − 2023. URL: https ∶ //ascmo.copernicus.org/articles/9/45/2023/.
Brown, B. (Oct. 14, 2025). CCC letter to Minister Hardy – advice on the UK’s adaptation objectives. Letter. Letter from the Chair of the Adaptation Committee to the Parliamentary Under Secretary of State. URL: https ∶ //www.theccc.org.uk/publication/letter − ccc −letter − to − minister − hardy − advice − on − the − uks − adaptation − objectives/.
Brown, S. J. (2020). “Future changes in heatwave severity, duration and frequency due to climate change for the most populous cities”. In: Weather and Climate Extremes 30, p. 100278. ISSN: 22120947. DOI: https ∶ //doi.org/10.1016/j.wace.2020.100278. URL: https ∶ //www.sciencedirect.com/science/article/pii/S2212094720300608.
CANARI (Climate Analysis, Attribution and Impacts) (2025). Climate modelling. CANARI project modelling approach. URL: https ∶ //canari.ncasdata.org/overview/climate − modelling/ (visited on 01/05/2026).
Catto, J. et al. (2024). “Improved Understanding and Characterisation of Climate Hazards in the UK”. In: Quantifying Climate Risk and Building Resilience in the UK. Ed. by S. Dessai et al. Cham: Springer International Publishing, pp. 131–144. ISBN: 978‐3‐031‐39729‐5. DOI: 10.1007/978 − 3 − 031 − 39729 − 5_9. URL: https ∶ //doi.org/10.1007/978 − 3 − 031 − 39729 − 5_9.
CCC (2021). Independent Assessment of UK Climate Risk. Tech. rep. The Third UK Climate Change Risk Assessment. Climate Change Committee. URL: https ∶ //www.theccc.org.uk/publication/independent−assessment−of−uk−climate−risk/ (visited on 11/26/2025).
Chan, S. C. et al. (2023). “New extreme rainfall projections for improved climate resilience of urban drainage systems”. In: Climate Services 30, p. 100375. ISSN: 2405‐8807. DOI: https ∶ //doi.org/10.1016/j.cliser.2023.100375. URL: https ∶ //www.sciencedirect.com/science/article/pii/S2405880723000365.
Climate Change (Scotland) Act 2009 (2009). English. URL: https ∶ //www.legislation.gov.uk/asp/2009/12/part/4.
Coles, S. (2001a). “Classical Extreme Value Theory and Models”. In: An Introduction to Statistical Modeling of Extreme Values. London: Springer London, pp. 45–73. ISBN: 978‐1‐4471‐3675‐0. DOI: 10.1007/978 − 1 − 4471 − 3675 − 0_3. URL: https ∶ //doi.org/10.1007/978 − 1 − 4471 − 3675 − 0_3.
— (2001b). “Extremes of Non‐stationary Sequences”. In: An Introduction to Statistical Modeling of Extreme Values. London: Springer London, pp. 105–123. ISBN: 978‐1‐4471‐3675‐0. DOI: 10.1007/978 − 1 − 4471 − 3675 − 0_6. URL: https ∶ //doi.org/10.1007/978 − 1 − 4471 − 3675 − 0_6.
Easterling, D. R. et al. (2016). “Detection and attribution of climate extremes in the observed record”. In: Weather and Climate Extremes 11. Observed and Projected (Longer‐term)
Changes in Weather and Climate Extremes, pp. 17–27. ISSN: 2212‐0947. DOI: https ∶ //doi.org/10.1016/j.wace.2016.01.001. URL: https ∶ //www.sciencedirect.com/science/article/pii/S2212094716300020.
Esri (July 2025). How To: Work with NetCDF Files in ArcGIS Pro. Esri Support Knowledge Base Article. URL: https ∶ //support.esri.com/en − us/knowledge − base/working − with − netcdfs − in − arcgis − pro − basics − 000037232 (visited on 10/29/2025).
Field, C. et al. (2012). Managing the Risks of Extreme Events and Disasters to Advance Climate Change Adaptation. A Special Report of Working Groups I and II of the Intergovernmental Panel on Climate Change. Cambridge, UK and New York, NY, USA: Intergovernmental Panel on Climate Change, p. 582. URL: https ∶ //www.ipcc.ch/site/assets/uploads/2018/03/SREX_Full_Report − 1.pdf.
Fowler, H. J. et al. (Mar. 2021). “Towards advancing scientific knowledge of climate change impacts on short‐duration rainfall extremes”. In: Philosophical Transactions of the Royal Society A: Mathematical, Physical and Engineering Sciences 379.2195, p. 20190542. ISSN: 1364‐503X. DOI: 10.1098/rsta.2019.0542. eprint: https ∶ //royalsocietypublishing.org/rsta/article − pdf/doi/10.1098/rsta.2019.0542/1441415/rsta.2019.0542.pdf. URL: https ∶ //doi.org/10.1098/rsta.2019.0542.
Fox, A. D., N. J. Fraser, and S. A. Cunningham (2025). “Seasonality of meridional overturning in the subpolar North Atlantic: density flux as a metric for understanding the Atlantic meridional overturning circulation”. In: Ocean Science 21.4, pp. 1735–1760. DOI: 10.5194/os − 21 − 1735 − 2025. URL: https ∶ //os.copernicus.org/articles/21/1735/2025/.
Gasparrini, A. et al. (July 2022). “Small‐area assessment of temperature‐related mortality risks in England and Wales: a case time series analysis”. In: The Lancet Planetary Health 6.7, e557–e564. ISSN: 2542‐5196. DOI: 10.1016/S2542 − 5196(22)00138 − 3. URL: https ∶ //doi.org/10.1016/S2542 − 5196(22)00138 − 3.
Grace, E. et al. (2025). Using future climate scenarios to support today’s decision making. en.
DOI: 10.7488/ERA/5567. URL: https ∶ //era.ed.ac.uk/handle/1842/43019.
Gründemann, G. J. et al. (2023). “Extreme precipitation return levels for multiple durations on a global scale”. In: Journal of Hydrology 621, p. 129558. DOI: 10.1016/j.jhydrol.2023.129558. URL: https ∶ //doi.org/10.1016/j.jhydrol.2023.129558.
Harrower, M. and C. A. Brewer (2003). “ColorBrewer.org: An Online Tool for Selecting Colour Schemes for Maps”. In: The Cartographic Journal 40.1. Tool available at colorbrewer2.org, pp. 27–37. DOI: 10.1179/000870403235002042. eprint: https ∶//www.tandfonline.com/doi/pdf/10.1179/000870403235002042. URL: https ∶ //www.tandfonline.com/doi/abs/10.1179/000870403235002042.
Hollis, D. et al. (2018). HadUK‐Grid gridded and regional average climate observations for the UK. URL: https ∶ //catalogue.ceda.ac.uk/uuid/4dc8450d889a491ebb20e724debe2dfb/.
IPCC (2005). Uncertainty Guidance Note for the Fourth Assessment Report of the Intergovernmental Panel on Climate Change. Accessed:28/11/2025. Intergovernmental Panel on Climate Change. URL: https ∶ //www.ipcc.ch/site/assets/uploads/2018/02/ar4 − uncertaintyguidancenote − 1.pdf.
– (2021). Summary for Policymakers. In: Climate Change 2021: The Physical Science Basis. Contribution of Working Group I to the Sixth Assessment Report of the Intergovernmental Panel on Climate Change. Report. In this citation, the specific figure is SPM.8. Cambridge, United Kingdom and New York, NY, USA: Cambridge University Press, pp. 3–32. DOI: 10.1017/9781009157896.001.
– (2023). Climate Change 2023: Synthesis Report. Contribution of Working Groups I, II and III to the Sixth Assessment Report of the Intergovernmental Panel on Climate Change. Report. Geneva, Switzerland: Intergovernmental Panel on Climate Change, pp. 35–115. DOI: 10.59327/IPCC/AR6 − 9789291691647. URL: https ∶ //www.ipcc.ch/report/ar6/syr/downloads/report/IPCC_AR6_SYR_FullVolume.pdf (visited on 05/20/2024).
Jackson, L. C. et al. (Dec. 2015). “Global and European climate impacts of a slowdown of the AMOC in a high resolution GCM”. In: Climate Dynamics 45.11. Received: 11 November 2014; Accepted: 23 February 2015; Published online: 11 March 2015., pp. 3299–3316. ISSN: 1432‐0894. DOI: 10.1007/s00382 − 015 − 2540 − 2. URL: https ∶ //doi.org/10.1007/s00382 − 015 − 2540 − 2.
Jones, P. D. and D. Lister (2004). “The development of monthly temperature series for Scotland and Northern Ireland”. In: International Journal of Climatology 24.5, pp. 569–590. DOI: https ∶ //doi.org/10.1002/joc.1017. eprint: https ∶ //rmets.onlinelibrary.wiley.com/doi/pdf/10.1002/joc.1017. URL: https ∶ //rmets.onlinelibrary.wiley.com/doi/abs/10.1002/joc.1017.
Kendon, E. et al. (Sept. 2019). UKCP Convection‐permitting model projections: Science report. Internal reviewers: Mike Bush, Richard Jones, Cath Senior; External reviewers: Brian
Hoskins, Erik Kjellström, Christoph Schär, Bart Van den Hurk. Exeter, UK: Met Office. URL: https ∶ //www.metoffice.gov.uk/pub/data/weather/uk/ukcp18/science − reports/UKCP − Convection − permitting − model − projections.pdf.
Kendon, M. et al. (2025). “State of the UK Climate in 2024”. In: International Journal of Climatology 45.S1, e70010. DOI: https ∶ //doi.org/10.1002/joc.70010. eprint: https ∶ //rmets.onlinelibrary.wiley.com/doi/pdf/10.1002/joc.70010. URL: https ∶ //rmets.onlinelibrary.wiley.com/doi/abs/10.1002/joc.70010.
Lee, R. et al. (2024). “Reclassifying historical disasters: From single to multi‐hazards”. In: Science of The Total Environment 912, p. 169120. ISSN: 0048‐9697. DOI: https ∶ //doi.org/10.1016/j.scitotenv.2023.169120. URL: https ∶ //www.sciencedirect.com/science/article/pii/S0048969723077501.
Lowe, J. A. et al. (Nov. 2018). UKCP18 Science Overview Report. Report. Updated March 2019. Exeter, UK: Met Office. URL: https ∶//www.metoffice.gov.uk/pub/data/weather/uk/ukcp18/science − reports/UKCP18 – Overview − report.pdf.
Masselot, P. et al. (Apr. 2023). “Excess mortality attributed to heat and cold: a health impact assessment study in 854 cities in Europe”. In: The Lancet Planetary Health 7.4, e271–e281. ISSN: 2542‐5196. DOI: 10.1016/S2542 − 5196(23)00023 − 2. URL: https ∶ //doi.org/10.1016/S2542 − 5196(23)00023 − 2.
Met Office (2003). Met Office Rain Radar Data from the NIMROD System. Dataset. URL: https ∶ //catalogue.ceda.ac.uk/uuid/82adec1f896af6169112d09cc1174499/.
- (2007). Weather Radar. Fact Sheet 15. Met Office. URL: https ∶ //artefacts.ceda.ac.uk/badc_datadocs/nimrod/factsheet15.pdf.
- (2019). UK Climate Regions Map. This map shows the standard areas (general regions) used by the Met Office when generating climatologies. URL: https ∶ //www.metoffice.gov.uk/research/climate/maps−and−data/about/regions−map (visited on 12/01/2025).
- (2024a). Local Authority Climate Service. The Met Office’s climate service for Local Authorities in the UK. URL: https ∶ //climatedataportal.metoffice.gov.uk/pages/lacs (visited on 12/26/2025).
- (2024b). Met Office launches new Local Authority Climate Service. Press release. Author: Press Office. Met Office. URL: https ∶ //www.metoffice.gov.uk/about− us/news − and − media/media −centre/weather− and−climate−news/2024/met−office−launches−new−local−authority−climate−service (visited on 10/09/2024).
Met Office (2026). UK Climate Extremes. Accessed: 2024‐02‐05. Met Office. URL: https ∶ //www.metoffice.gov.uk/research/climate/maps − and − data/uk − climate − extremes (visited on 02/05/2026).
Met Office Hadley Centre (2018a). UKCP18 Factsheet: Sea level rise and storm surge. Factsheet. Part of the UK Climate Projections 2018 suite of materials. Met Office Hadley Centre. URL: https ∶ //www.metoffice.gov.uk/binaries/content/assets/metofficegovuk/pdf/research/ukcp/ukcp18−fact − sheet − sea − level − rise − and − storm − surge.pdf (visited on 06/01/2025).
- (2018b). UKCP18 Global Projections at 60km Resolution for 1900‐2100. URL: https ∶ //catalogue.ceda.ac.uk/uuid/97bc0c622a24489aa105f5b8a8efa3f0/.
- (2018c). UKCP18 Regional Projections on a 12km grid over the UK for 1980‐2080. URL: https ∶ //catalogue.ceda.ac.uk/uuid/589211abeb844070a95d061c8cc7f604/.
- (2019). UKCP Local Projections on a 5km grid over the UK for 1980‐2080. URL: https ∶ //catalogue.ceda.ac.uk/uuid/e304987739e04cdc960598fa5e4439d0/.
- (Mar. 2021). UKCP18 Guidance: How to Bias Correct. Technical Guidance v2.1. Exeter, United Kingdom: Met Office. URL: https ∶//www.metoffice.gov.uk/binaries/content/assets/metofficegovuk/pdf/research/ukcp/ukcp18− guidance − − − how − to − bias − correct.pdf (visited on 10/20/2025).
Morice, C. P. et al. (2021). “An Updated Assessment of Near‐Surface Temperature Change From 1850: The HadCRUT5 Data Set”. In: Journal of Geophysical Research: Atmospheres 126.3. e2019JD032361 2019JD032361, e2019JD032361. DOI: https ∶ //doi.org/10.1029/2019JD032361. eprint: https ∶ //agupubs.onlinelibrary.wiley.com/doi/pdf/10.1029/2019JD032361. URL: https ∶ //agupubs.onlinelibrary.wiley.com/doi/abs/10.1029/2019JD032361.
Naszarkowski, N. A. L. et al. (2024). “Factors affecting severity of wildfires in Scottish heathlands and blanket bogs”. In: Science of the Total Environment 931, p. 172746. DOI: 10.1016/j.scitotenv.2024.172746.
O’Neill, S., S. F. Tett, and K. Donovan (2022). “Extreme rainfall risk and climate change impact assessment for Edinburgh World Heritage sites”. In: Weather and Climate Extremes 38, p. 100514. ISSN: 2212‐0947. DOI: https ∶ //doi.org/10.1016/j.wace.2022.100514. URL: https ∶ //www.sciencedirect.com/science/article/pii/S2212094722000937.
Ordnance Survey (2025a). A Guide to Coordinate Systems in Great Britain. Ordnance Survey documentation on National Grid and OSGB36 Terrestrial Reference Frame. Ordnance Survey. URL: https ∶ //docs.os.uk/more−than−maps/deep−dive/a−guide−to−coordinate−systems−in−great− britain/ordnance − survey − coordinate − systems/national − grid − and − the − osgb36 − trf (visited on 11/28/2025).
- (Nov. 2025b). OS Maps API Documentation: Layers and Styles. Technical documentation for the Ordnance Survey Maps API. Ordnance Survey. URL: https ∶ //docs.os.uk/os − apis/accessing − os − apis/os − maps − api/layers − and − styles (visited on 12/01/2025).
Otto, F. E. L. et al. (2024). “Formally combining different lines of evidence in extreme‐event attribution”. In: Advances in Statistical Climatology, Meteorology and Oceanography 10.2, pp. 159–171. DOI: 10.5194/ascmo − 10 − 159 − 2024. URL: https ∶ //ascmo.copernicus.org/articles/10/159/2024/.
Otto, F. E. (2017). “Attribution of Weather and Climate Events”. In: Annual Review of Environment and Resources 42.Volume 42, 2017, pp. 627–646. ISSN: 1545‐2050. DOI: https ∶ //doi.org/10.1146/annurev − environ − 102016 − 060847. URL: https ∶ //www.annualreviews.org/content/journals/10.1146/annurev − environ − 102016 − 060847.
Philip, S. et al. (2020). “A protocol for probabilistic extreme event attribution analyses”. In: Advances in Statistical Climatology, Meteorology and Oceanography 6.2, pp. 177–203. DOI: 10.5194/ascmo − 6 − 177 − 2020. URL: https ∶ //ascmo.copernicus.org/articles/6/177/2020/.
PSCAN User Survey (Oct. 2025). Feedback on the prototype tool. Survey conducted 15‐21 October, 2025.
Public Health Scotland (2025). Heat impacts on health in Scotland: Deaths 2005‐2024. URL: https ∶ //publichealthscotland.scot/publications/heat − impacts − on − health − in − scotland/heat − impacts − on − health − in − scotland − 28 − october − 2025/.
Rennie, A. F. et al. (2021). Dynamic Coast: The National Overview. Report. Centre of Expertise for Waters (CREW). URL: https ∶ //www.crew.ac.uk/sites/www.crew.ac.uk/files/publication/CREW_DC2_SYNOPSIS_FINAL%2Blink_0.pdf SciPy Community (2011). scipy.stats.genextreme. SciPy v1.11.3 Documentation. URL: https ∶ //docs.scipy.org/doc/scipy/reference/generated/scipy.stats.genextreme.html (visited on 12/01/2025).
Scottish Environment Protection Agency (Feb. 25, 2025a). Climate Change Allowances for Flood Risk Assessment in Land Use Planning. Version 6. Issued date: 25 February 2025. This guidance sets out required allowances for climate change that must be used for flood risk assessment following the adoption of National Planning Framework 4. Scottish
Environment Protection Agency (SEPA). URL: https ∶ //www.sepa.org.uk/media/jjwpxuso/climate − change − allowances − guidance_v6.pdf.
- (2025b). SEPA Flood Maps. A tool for flood risk management planning to identify actions, to manage flood risk and develop plans to tackle flooding. SEPA. URL: https ∶ //beta.sepa.scot/flooding/flood − maps/.
Scottish Government (2024). Scottish National Adaptation Plan (2024‐2029). Government Report. URL: https ∶ //www.gov.scot/publications/scottish − national − adaptation − plan − 2024 − 2029 − 2/documents/.
Scottish Government (2025). Climate Change Adaptation. Scottish Government page on Adaptation to climate change. URL: https ∶//www.gov.scot/policies/climate − change/climate − change − adaptation/.
Shepherd, T. G. (Mar. 2016). “A Common Framework for Approaches to Extreme Event Attribution”. In: Current Climate Change Reports 2 (1), pp. 28–38. ISSN: 2198‐6061. DOI: 10.1007/s40641 − 016 − 0033 − y. URL: https ∶ //doi.org/10.1007/s40641 − 016 − 0033 − y.
Simmonds, R. et al. (2022). A review of interacting natural hazards and cascading impacts in Scotland. Research Report. Available at: https ∶ //eprints.gla.ac.uk/267515/. Publisher: National Centre for Resilience. National Centre for Resilience. URL: https ∶ //eprints.gla.ac.uk/267515/.
STV News (July 2022). Hottest day in Scotland officially recorded as temperatures reach 35.1C at Floors Castle. Online news article, author Calum Loudon. URL: https ∶ //news.stv.tv/scotland/hottest − day − in − scotland − officially − recorded − as − temperatures − reach − 35 − 1c − at − floors − castle (visited on 01/05/2026).
Tett, S. F. B., C. Long, and S. J. Brown (2025). “Attribution of extreme precipitation related to a fatal derailment near Carmont, Scotland”. In: Environmental Research: Climate. Extreme Weather and Climate Event Attribution 4.3. Open Access, p. 035010. DOI: 10.1088/2752 − 5295/adeeb7. URL: https ∶ //dx.doi.org/10.1088/2752 − 5295/adeeb7.
Tett, S. F. B. et al. (2023). “The Impact of an Extreme Cloud burst on Edinburgh Castle”. In: Bulletin of the American Meteorological Society 104.10, E1807 –E1816. DOI: 10.1175/BAMS − D − 22 − 0196.1. URL: https ∶ //journals.ametsoc.org/view/journals/bams/104/10/BAMS − D − 22 − 0196.1.xml.
Thompson, V., S. Ermis, and M. Athanase (2025). “The need for multi‐method extreme event attribution”. In: Weather n/a.n/a. Early release at time of access. DOI: https ∶ //doi.org/10.1002/wea.7779. eprint: https ∶ //rmets.onlinelibrary.wiley.com/doi/pdf/10.1002/wea.7779. URL: https ∶ //rmets.onlinelibrary.wiley.com/doi/abs/10.1002/wea.7779.
UK Centre for Ecology and Hydrology (2025). HYRAD: HYdrological Radar data processing toolkit. (Visited on 12/01/2025).
Undorf, S et al. (2020). “Learning from the 2018 heatwave in the context of climate change: are high temperature extremes important for adaptation in Scotland?” In: Environmental Research Letters 15.3. Open Access, p. 034051. DOI: 10.1088/1748 − 9326/ab6999. URL: https ∶ //dx.doi.org/10.1088/1748 − 9326/ab6999.
van Vuuren, D. P. et al. (2011). “The representative concentration pathways: an overview”. In: Climatic Change 109.1, p. 5. ISSN: 1573‐1480. DOI: 10.1007/s10584 − 011 − 0148 − z. URL: https ∶ //doi.org/10.1007/s10584 − 011 − 0148 − z.
Verture (2025). Adaptation Scotland. Verture page on Adaptation Scotland Programme. URL: https ∶ //verture.org.uk/project/adaptation − scotland/.
WWA (2025). World Weather Attribution. World Weather Attribution homepage. URL: https ∶ //www.worldweatherattribution.org/10 − years − of − rapidly − disentangling − drivers − of − extreme − weather − disasters/.
Appendices
Figure 11: A diagram indicating which tool users can use to find projections for different hazards in Scotland.
Figure 12 The histogram in the left panel compares the GWL in the 2000 to 2020 reference period with the pre‐industrial baseline. Plotted are the number of HadCRUT5 (Morice et al., 2021) ensemble members in each 0.01°C bins. The histogram in the right panel shows estimates of the Scotland average temperature in the 2000 to 2020 reference period from 12km HadUK‐Grid data (Hollis et al., 2018). Plotted are the number of bootstraps of average temperature resampled from annual averages over the reference period in 0.001○C bins. In each plot a normal distribution is fit to ensemble members (left) and bootstraps (right). The mean, µ, and standard deviation, σ, are reported for these fitted distributions.
Following Equation 1, the central estimate of Scotland mean temperature can be expressed as
where TS0, α and TG0 are the mean values of the Gaussian distributions fit to the histograms of the three parameters in Figures 12 and 13(right). Additionally, the standard deviation of
the estimate of Scotland annual mean temperature at different GWL, σTS (TG), can be expressed with the standard deviation of each of the Gaussian fits to the histograms of
parameter estimates. The distribution of α being fit to the histogram of gradients of the bootstraps in Figure 13. The equation for the standard deviation of the probability distribution of estimate of TS is ∶
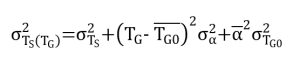
Values for the mean fit and standard deviation of each parameter are provided in Table 4.
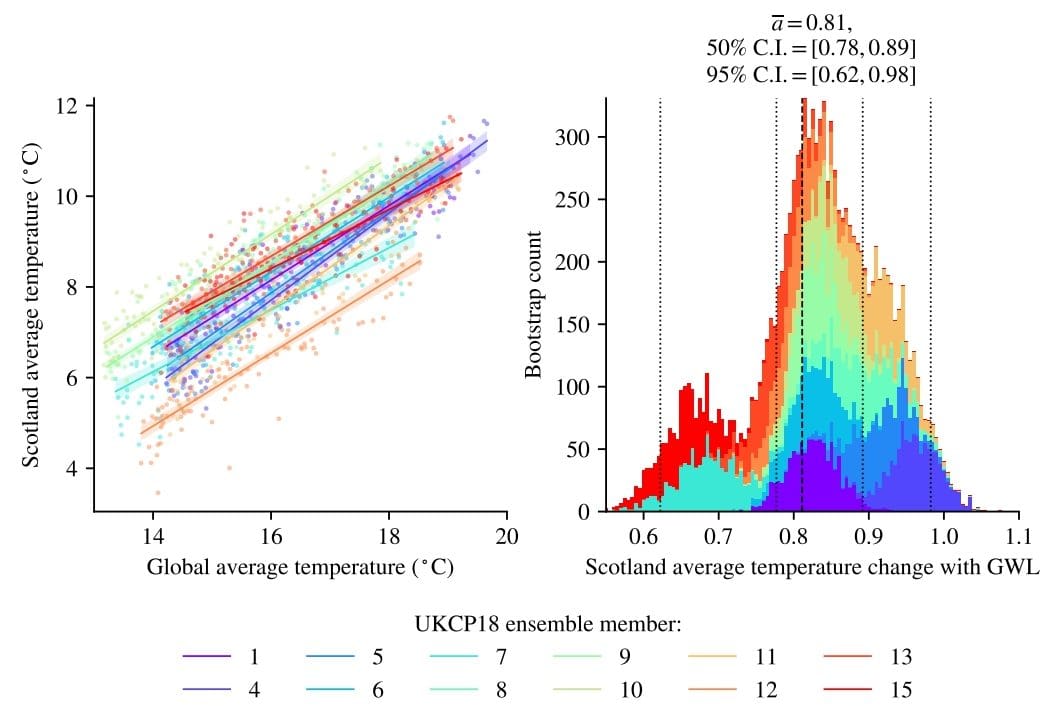
Figure 13: The left panel shows a scatter plot of the annual mean Scotland temperature in UKCP18 RCM ensemble members (Met Office Hadley Centre, 2018c) (colours) versus the respective global surface temperature in UKCP18 GCM simulations (Met Office Hadley Centre, 2018b). For each scatter, a linear best fit is made, with shading indicating the 95% confidence interval from 1000 bootstraps. The right panel shows a stacked histogram of the gradient of each bootstrap in the left panel; the coloured elements count the number of bootstrapped change in Scotland temperature per degree change in global temperature in 0.005°C bins.
Relationships between the location parameter and underlying climate are based on physical assumptions. For extreme heat, we have assumed that the hottest temperature each year changes linearly with Scotland average temperature,

(4)
where T ′ is the Scotland mainland average temperature anomaly from approximate present day conditions, T ′ ≡ TS − 8○C. Extreme rainfall events are assumed to follow the Clausius‐Clapeyron relation, scaling exponentially with increased Scotland average temperature,

(5)
In both cases, the scale parameter must be positive and a standard practice is used with the scale parameter scaling exponentially with the covariate,

(6)
When fitting such statistical models, the parameters tend to not be independent – with bootstrapping, repeating the fitting procedure to random resamples with replacement of the data, we have quantified the correlation between the different parameters (not included in this report). As such, for each fit, the shape is stationary. In ScotClimATE, shape ≡ −c following the convention used in the SciPy stats module (SciPy Community, 2011). For each fit, the five parameters c, loc0, loc1, scale0, scale1 are found by maximising the likelihood of the distribution describing them.
Figure 14 provides examples of non‐stationary GEV distributions fit to extreme heat versus Scotland average temperature. The changing probability of extreme heat being exceeded at different Scotland average temperature values can be expressed as lines intersecting the scattered data. For 1200 years of UKCP18 data, we see that half of the points lie above the one in 2 year line, but about one‐hundredth of the points lie above the one in 100 year line. In the left panel are fewer than 100 years of observation data, so the one in 100 year line is understood as an extrapolation of the underlying distribution.
The fits in Figure 14 illustrate how the changing location and scale of extreme events can be found using the wide range of UKCP18 simulated climate compared with the narrow range of observed climate in Scotland.
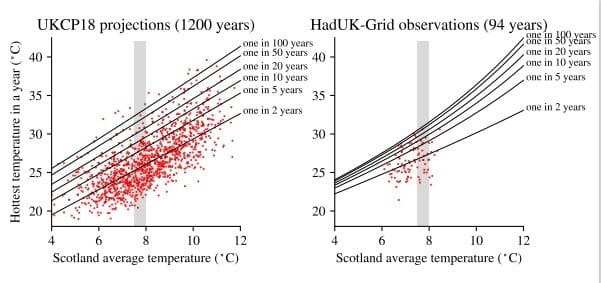
Figure 14: Examples of the central estimate of non‐stationary GEV fit to the hottest temperature each year in UKCP18 projections (left) and HadUK‐Grid data (right). Grey shading shows the range of Scotland climate identified for the 2000‐2020 reference period in Figure 3.
For any result in Scotland ClimATE there are ten parameters, two user set parameters and eight fitted parameters. Namely, the user sets a GWL and a return time or intensity threshold. There are three fitted parameters that map from GWL to Scotland average temperature and five that describe the statistical distribution of extreme events with changing Scotland climate.
We have used non‐parametric bootstrapping – resampling with replacement – to identify distributions of possible fits of the underlying data. The first three fitted parameters for
Scotland climate are independent of each other and carry their own uncertainty (Section 7). These closely follow Normal distributions (Figures 3 and 12).
The five parameters of the statistical distribution may have covariance with each other. This is described with a covariance matrix (Appendix C). Therefore, on top of the ten parameters,
the uncertainty is calculated using another three values of standard deviation and a 5×5 covariance matrix.
There are different methods for extracting confidence intervals from these. An analytical method can be implemented using the delta method. However, due to the short
development time of this project, and the adaptability where different components interface, we have calculated confidence intervals numerically.
One thousand random variates are generated for each set of the eight fitted parameters. Then, for each choice of user set parameters, there are one thousand possible results fit from all parameters. Confidence intervals correspond with the quantiles of those results ordered by value.
How to cite this publication:
Chaudhri, A.T, de Klerk, D, Tett, S (2026) ScotClimATE: a new Scotland Climate Analysis Tool for Extremes, ClimateXChange. DOI: 10.7488/era/6913
© The University of Edinburgh, 2026 Prepared by on behalf of ClimateXChange, The University of Edinburgh. All rights reserved. While every effort is made to ensure the information in this report is accurate, no legal responsibility is accepted for any errors, omissions or misleading statements. The views expressed represent those of the author(s), and do not necessarily represent those of the host institutions or funders.
This work was supported by the Rural and Environment Science and Analytical Services Division of the Scottish Government (CoE – CXC).
The authors would like to thank the steering group with representatives from the Scottish Government, SEPA, Scottish Water, The MetOffice, the Scottish Government Adaptation Team, and PSCAN for their feedback and support.
The authors would also like to thank Prof. Stuart Galloway at the University of Strathclyde and the Adaptation Team within the Scottish Government for their input and feedback on the development of this work. This work used JASMIN, the UK’s collaborative data analysis environment (https://www.jasmin.ac.uk), using computing resources provided to the project at no charge.
ClimateXChange
Edinburgh Climate Change Institute High School Yards
Edinburgh EH1 1LZ
+44 (0) 131 651 4783
As global temperatures rise, extreme weather events are already affecting people, infrastructure, services and places across Scotland.
To support forward-looking adaptation planning, decision-makers need practical ways to translate climate science into action. ScotClimATE was developed to meet this need by helping Scotland’s public bodies understand how extreme weather risks may evolve in a warmer world.
It allows decision-makers to explore projected changes in extreme weather events under different levels of global warming. It focuses on key hazards relevant to adaptation planning: extreme heat events, sustained heat over three days, extreme rainfall in a single day, and extreme rainfall sustained over three days.
The tool employs methods from scientific literature and applies them through a new analysis of UK Climate Projections (UKCP18), an up‐to‐date and well‐tested ensemble of climate projections for the UK.
It uses a simple model for projecting Scotland’s annual average temperature based on global warming level and statistical models of the intensity and return periods – measures of the magnitude of extreme events and their frequency – at different temperatures.
The tool was developed in collaboration with the Scottish Government Adaptation team, alongside user feedback from the Public Sector Climate Adaptation Network.
ScotClimATE is designed to meet the needs of Scotland’s public bodies for strategic adaptation planning.
- It provides interactive visualisations of projected changes in extreme heat events, sustained heat, extreme rainfall and extreme sustained rainfall.
- It allows users to visualise how magnitude and frequency of these extreme events change using UKCP18 data under global warming changes from +0°C to +4°C.
- Results are projected onto an interactive map of Scotland.
- The tool is designed for understanding infrequent, high-intensity events but does not provide projections for flooding, storminess or storm counts.
ScotClimATE fills a critical information gap in the adaptation toolkit, complementing existing tools – such as SEPA Flood Maps or the Local Authority Climate Service – by visualising low‐frequency, high‐impact extreme events. This helps complete the suite of resources needed for comprehensive climate scenario analysis.
Before using ScotClimATE, please refer to the guidance document for more information about using the tool and its limitations.
To try ScotClimATE, and to view guidance on how to use the tool, visit the Adaptation Scotland website.
For further information, please read the report.
If you require the report in an alternative format, such as a Word document, please contact info@climatexchange.org.uk or 0131 651 4783.