
This research was a rapid review presenting and examining evidence relating to climate change and digital connectivity such as:
- whether investment in digital connectivity can support reductions of greenhouse gas (GHG) emissions and, if so, how
- examples of relevant policies and impacts
- the best options for assessing emissions from digital connectivity and services in Scotland
- key evidence gaps in these areas.
Summary of findings
The research team has found mixed evidence of the decarbonisation impact of digital connectivity and whether it contributes to adaptation and a just transition. The main findings, based on the literature reviewed are:
- The Information Communications Technology (ICT) sector is a source of GHG emissions.
- ICT technology and digitalisation reduce GHG emissions in other industries.
- The GHG emissions associated with e-waste are of growing concern internationally.
- The indirect impact of ICT technologies can either lead to a net reduction in carbon emissions or to a net increase. Human behaviour plays a part in whether the indirect impacts on emissions are positive or negative.
- We are unable to say whether digital connectivity supports climate adaptation. With regard to a just transition, digital connectivity and ICT can have either a positive or a negative effect.
For more detailed information about the findings, please read the report.
If you require the report in an alternative format, such as a Word document, please contact info@climatexchange.org.uk or 0131 651 4783.
Scotland recognises the significance of a place-based transition to net zero greenhouse gas emissions (GHG). The Climate Change (Scotland) Act 2009 places importance on the role of local authorities in achieving this target. Therefore, it is a priority for the Scottish Government to facilitate area-wide and locally-led efforts as part of a just transition to net zero.
Across the 32 local authorities in Scotland, 17 have set net zero targets specific to tackling territorial GHG emissions generated in their geographical area (from agriculture, buildings, industry, land use and land use change and forestry, transport and waste). This is in direct comparison to 26 local authorities that have set net zero targets to reduce their organisational GHG emissions.
This research examines local authority climate-relevant strategies and policies within them; the potential of these policies to reduce emissions if they were scaled to the national level; and the barriers that local authorities face in implementing these policies. The study developed a register of 69 climate change strategies across all 32 local authorities.
Main findings
- Local authorities are modelling exemplary action on climate change across many fronts through the benefit of deep-rooted relationships with local stakeholders and unparalleled knowledge of their area. However, the level of detail and methodological evidence presented in climate change strategies are often sparse, with many strategies failing to model the scale of impact on GHG emissions.
- The study identified two policy areas with the potential for major impact on territorial greenhouse gas emissions:
- Nature-based solutions: a combination of individual policies to green derelict land, restore damaged peatland and afforestation.
- Net zero transport: several climate policy initiatives such as active transport, decarbonisation of public transport and low-emission vehicle licences for taxis.
- The impact on Scotland’s national territorial emissions, should all local authorities adopt the leading policies, from nature-based solutions (5,497 ktCO2e) and net zero transport (1,527 ktCO2e) amounts to an estimated total potential reduction of 7,024 ktCO2e by 2045. This is an indicative figure, illustrating the scale of change that could be possible.
- The Scottish Government have set a compelling ambition to closely support local authorities to develop locally owned and led climate action strategies to tackle territorial emissions. However, local authorities are limited by a lack of clarity on their roles and responsibilities, and by a lack of best practice guidance or frameworks across all the territorial emission categories. They face barriers including lack of data maturity, capacity, specialist skills, accountability and funding.
For further details, please read the report.
If you require the report in an alternative format, such as a Word document, please contact info@climatexchange.org.uk or 0131 651 4783.
December 2023
DOI: http://dx.doi.org/10.7488/era/4512
Executive summary
Background
Scotland recognises the significance of a place-based transition to net zero greenhouse gas emissions (GHG). As part of setting a target of net zero by 2045, the Climate Change (Scotland) Act 2009 places importance on the role of local authorities in achieving this target. Therefore, it is a priority for the Scottish Government to facilitate area-wide and locally-led efforts as part of a just transition to net zero.
Across the 32 local authorities in Scotland, 17 have set net zero targets specific to tackling territorial GHG emissions generated in their geographical area (from agriculture, buildings, industry, land use and land use change and forestry, transport and waste). This is in direct comparison to 26 local authorities that have set net zero targets to reduce their organisational GHG emissions.
This research examines local authority climate-relevant strategies and policies within them; the potential of these policies to reduce emissions if they were scaled to the national level; and the barriers that local authorities face in implementing these policies.
Main findings
We developed a register of 69 climate change strategies across all 32 local authorities. We found that local authorities are modelling exemplary action on climate change across many fronts through the benefit of deep-rooted relationships with local stakeholders and unparalleled knowledge of their area.
However, the level of detail and methodological evidence presented in climate change strategies are often sparse, with many strategies failing to model the scale of impact on GHG emissions.
From the 69 climate-related strategies, we selected six leading strategies for quantification and identified 13 policies within these that could be appropriate for scaling up. We undertook an initial estimate of the potential territorial emission reduction if they were replicated across all Scottish local authorities. We also assessed the likelihood for change at this scale, considering local authorities’ sphere of control, capacity and timescales, alongside the magnitude of potential change. Through this process we identified two policy areas with the potential for major impact on territorial greenhouse gas emissions:
- Nature-based solutions: a combination of individual policies to green derelict land, restore damaged peatland and afforestation.
- Net zero transport: several climate policy initiatives such as active transport, decarbonisation of public transport and low-emission vehicle licences for taxis.
The impact on Scotland’s national territorial emissions, should all local authorities adopt the leading policies, from nature-based solutions (5,497 ktCO2e) and net zero transport (1,527 ktCO2e) amounts to an estimated total potential reduction of 7,024 ktCO2e by 2045. This is an indicative figure, illustrating the scale of change that could be possible.
We found that the Scottish Government have set a compelling ambition to closely support local authorities to develop locally owned and led climate action strategies to tackle territorial emissions.
However, we also found that local authorities are limited by a lack of clarity on their roles and responsibilities, and by a lack of best practice guidance or frameworks across all the territorial emission categories. They face barriers including lack of data maturity, capacity, specialist skills, accountability and funding.
Recommendations
Local authorities could be further supported to develop their climate policies. We recommend the establishment of best practice guidance on the development of climate policies. This would help improve clarity and consistency across local authorities.
Further research could expand on the capacity and capability requirements to deliver local authority climate policies between now and 2045, including methods by which the resourcing needs could be met. Further investigation could help quantify the funding available for tackling each GHG inventory, where further funding might best be directed and methods for administrating funding to ensure that national ambitions can be met.
Glossary and abbreviations
|
BEIS |
Department for Business, Energy and Industrial Strategy |
|
ktCO2e |
Kilo-tonnes of carbon dioxide equivalent |
|
DESNZ |
Department for Energy Security and Net Zero |
|
GHG |
Greenhouse gas |
|
GHGI |
Greenhouse gas inventory |
|
IPCC |
Intergovernmental Panel on Climate Change |
|
KPI |
Key performance indicator |
|
LA |
Local authority |
|
LEZ |
Low emission zone |
|
LHEES |
Local Heat and Energy Efficiency Strategies |
|
LULUCF |
Land use, land use change and forestry |
|
SIC |
Standard Industrial Classification |
|
SSN |
Sustainable Scotland Network |
Introduction
Context
The recent parliamentary inquiry into the role of local government in delivering net zero stressed that it will be impossible for Scotland to reach net zero without local leadership spearheading area-wide decarbonisation efforts (Net Zero, Energy and Transport Committee, 2023). The inquiry recognised that achieving net zero cannot be dictated. It requires a collective effort between local government, which holds the local knowledge and fruitful partnerships across the public and private sectors, and national government which have the strategic capabilities and resources to support and coordinate local efforts.
The Scottish Government is continuing the drive toward empowering, building capacity, and providing the necessary foundations for local government to build their net zero programmes. The parliamentary inquiry also established that, while councils have at times been a model for net zero leadership, this needs to be rapidly scaled across all local authorities and all emission sectors in each local authority. The inquiry report noted that the Scottish Government must facilitate this scaling by providing local authorities with a comprehensive roadmap for net zero and “far more certainty than they have at present about the roles they are to play” (Net Zero, Energy and Transport Committee, 2023).
The Duties of Public Bodies: Reporting Requirements Order placed responsibilities on all public bodies, including local authorities, to report on scope 1 and 2 (and some scope 3) organisational emissions (Climate Change Order, 2015). As a result, all 32 local authorities have developed organisational emission inventories and in 2022 the Accounts Commission reported that 26 local authorities had developed organisational net zero targets (Audit Scotland, 2022). However, local authorities have some influence on certain emissions reduction beyond their organisational boundaries. These emissions produced within a local authority’s geographical area of responsibility are referred to as ‘territorial emissions’. Only 17 local authorities have developed territorial net zero targets and even fewer have developed policies for reducing territorial emissions. If this situation persists, it will present a major barrier to the success of Scotland’s national Climate Change Plan, which is heavily reliant on place-based and locally-led action (Scottish Government, 2020).
In their recent progress update to parliament, the Climate Change Committee noted that “momentum on a local level is increasing, but local action is uncoordinated” (Climate Change Committee, 2022, p. 53). There are pockets of exemplary action but also a lack of knowledge sharing across local authorities. This has led to policies being rolled out with different timescales, best practice not being disseminated and opportunities being missed to drive coordinated action across all local authorities. In November 2023 the Scottish Government launched a new Scottish Climate Intelligence Service to support local authorities to build capacity and capability for the development of area-wide programmes of emissions reduction for the benefit of their communities. This service will enable local authorities to deliver their own area-wide territorial net zero targets and to contribute to Scotland’s national commitment to net zero by 2045 (Improvement Service, 2023).
This research addresses some of the identified challenges by analysing the climate policies local authorities have developed to directly tackle territorial GHG emissions, and mapping their potential impact on territorial GHG emissions.
Project aims and research questions
The first aim of this project was to identify key GHG emission reduction policies developed by Scottish local authorities. We developed a comprehensive register of local authority climate-related strategies and associated policies and described the current action being taken by each local authority across all emission categories.
The second aim was to compile and undertake an initial estimate of the policies’ GHG emission reduction potential at both the local authority and national level. This aim was broken down into three sub-questions. Firstly, to identify what the key policies are that have significant GHG emission reduction potential. Secondly, to estimate their emissions reduction potential within their respective local authorities. Thirdly, to estimate what the emission reduction potential would be, should they be applied across all Scottish local authorities. This type of analysis has previously been conducted by the Edinburgh Climate Commission and Place-based Climate Action Network, although this was only in relation to policy scenarios at the local level (Williamson, et al., 2020).
The third aim was to engage with local authorities through a series of semi-structured interviews to understand how the most significant policies could be implemented across Scotland, including the role of Scottish Government and other public bodies in enabling this.
Overall, this project highlights area-based policy options for Scottish Government to consider for national deployment, whether as a statutory instrument, as in the case of Local Heat and Energy Efficiency Strategies (LHEES), or via other delivery approaches such as frameworks or guidance.
Defining the greenhouse gas emission inventory
The UK greenhouse gas inventory (GHGI) is published annually by the Department for Energy Security and Net Zero (DESNZ) and sets out the latest estimates in territorial GHG emissions for all 374 local authorities across the United Kingdom, including the 32 local authorities across Scotland. We have charted the latest DESNZ territorial GHGI publication data for Scotland (DESNZ, 2023) in Figure 1 below. This shows the total territorial GHG emissions split into the inventory categories (agriculture, buildings, industry, LULUCF, transport and waste) between 2005 and 2021. The dataset employs several different methodologies to calculate the spatially disaggregated emissions for each inventory category.

Table 1 provides a description of each of the GHGI categories. These are important for drawing boundaries around polices, determining which inventory a specific policy will impact.
|
Category |
Description |
|---|---|
Agriculture |
A variety of policy options exist for the mitigation of GHG emissions through agricultural practices. The most prominent options are improved crop and grazing land management, restoration of organic soils, and livestock manure management. |
Buildings |
Building emissions are typically tackled through policies implementing technological solutions to improve energy efficiency performance, or non-technological approaches such as land use management and planning legislation. There is a drive to move towards zero direct emission sources of heating and hot water, such as heat pumps, to decarbonise buildings. |
Industry |
Net zero emissions from industry is possible but challenging. Reduced materials demand, material efficiency, and circular economy solutions can reduce the need for primary production. Primary production policy options include switching to new processes that use low to zero GHG-producing fuels (e.g. electrification). |
Land Use, Land Use Change and Forestry |
Changes in how land is used impact’s terrestrial ability to store or release carbon to the atmosphere. Humans are changing the natural rate of flux through Land Use, Land Use Change and Forestry (LULUCF) and policies that seek to improve the quantity (e.g. afforestation) and quality (e.g. restoration) of natural sinks are important to preserving natures ability to retain and further sequester carbon. |
Transport |
Transport emissions are addressed through avoided journeys and modal shifts due to behavioural change, uptake of improved vehicle and engine performance technologies, electrification, low-carbon fuels, investments in related infrastructure, and changes in the built environment. Combined, these offer high potential for mitigating emissions from transport. |
Waste |
Management policies typically consist of waste prevention, minimisation, material recovery, recycling, and re-use. There is growing potential for indirect reduction of GHG emissions through principles of circular economy and design leading to decreased waste generation, lower raw material consumption, reduced energy demand and fossil fuel avoidance. |
It is possible for policies to transcend multiple emission inventories. For example, a policy that seeks to develop a green network to increase the level of active transport[1] by improving tree canopy coverage and hedgerows would impact a transport and LULUCF inventory. There are activities and emission changes that would impact both inventories in this instance.
Methodology
This section provides a summarised version of the research methodology. A more detailed methodology is available in Appendix 13.1.
A steering group was established to support the delivery of the project, and consisted of representatives from the Scottish Government, ClimateXChange, Sustainable Scotland Network (SSN), and the Turner & Townsend research team. Findings and outcomes were reported to the steering group for comments and to confirm the research direction throughout the project. The project was divided into three tasks.
Evidence review
Task 1 was to compile a comprehensive policy register to understand the current climate action being taken by each local authority. This register provides a useful tool to view and analyse individual climate policies across Scotland. We applied the following process:
- Search: our search began with reviewing information available through the “Wider Influence” tab of local authority climate change submissions to SSN (SSN, 2023b). Where gaps existed, we supplemented these by conducting an online search of local authority websites and other public body sources for the relevant policy documentation.
- Classify: we utilised a rapid evidence assessment (HM Treasury, 2020) to classify each policy based on its high-level data, including years of coverage, policy owner, whether the policy is monitored, and any associated targets.
- Select: we developed screening criteria based on Scottish Government priorities for the current project and used this to recommend six strategies of significance to progress to Task 2.
We presented the key findings to the steering group and our assessment of the selected strategies. We asked the steering group for advice on the selection of the six strategies. This resulted in the addition of geographical criteria to our selection assessment, to ensure the research considered local authorities from rural and island communities.
Quantitative research
For Task 2 we developed a GHG profile for each of the six strategies selected from Task 1. This involved identifying the emission boundary of each policy within the strategies and the quantification of the potential impact on territorial emissions of the respective local authority. We then proceeded to calculate an aggregated figure to estimate the policies’ potential impact if rolled out at the national level. We approached this by:
- Assessment boundary: GHG boundaries were established using GHG Protocol Action Standard (Greenhouse Gas Protocol, 2014) to apportion the relevant sinks and sources to each policy and estimate potential emission impacts. This was used to determine the likelihood and magnitude of change.
- Policy scenario emissions: in the first instance, we used existing activity and emission factor information from the local authority policies to develop policy scenario emissions estimates. In the absence of information, we applied Intergovernmental Panel on Climate Change guidance. We then used the HM Treasury Green Book to approximate changes and associated emissions values to provide national-level policy scenario figures.
The more comprehensive methodology in Appendix 13.1 explains in detail the range of approaches and methodologies applied in the assessment of GHG boundaries, development of the policy scenario emissions estimations and the limitations of this approach. The findings from Task 2 were presented to the steering group with the objective of selecting two of the most likely and impactful areas of policy to be considered for national deployment by local authorities. These were developed into policy briefings for Scottish Government.
Qualitative research
For Task 3 we conducted interviews with representatives from two local authorities to gain their views on wider implementation of the selected policy areas, including the roles of local authorities, Scottish Government and other public bodies. We planned a third interview with one further local authority however, we were not able to agree a time and date for the interview to take place in the timescales of this research.
A topic guide was developed and formed the basis of 45-minute semi-structured interviews on Microsoft Teams. These aimed to collect the comprehensive views on the likelihood of wider adoption of the policies, including practicability, the capacity and capability required to deliver a new policy. We also included other open-ended questions, encouraging participants to expand further on topics they deemed relevant. The data from interviews was collated in a thematic analysis grid and key themes were extracted using an analytical approach guided by participant views.
We combined the data from all sources (the evidence review, quantitative potential emissions modelling, discussions with the steering group, and the qualitative research) to discuss the key challenges and the possible approaches to adopting the climate policies at a national scale. The conclusion is presented in Section 11.
Review of existing evidence
Overview
The aim of this review was to understand the climate strategy and policy landscape across Scottish local authorities. We created a Climate Strategy Register that involved the collation of climate action plans from all 32 local authorities including individual sector strategies such as transport plans, waste plans and local development plans (Appendix 13.3).
This report makes a distinction between a climate strategy and a climate policy in the context of the documents reviewed. Policies feed into sector strategies, which feed into a climate change strategy.
Most local authorities reviewed already have a top-level document we define as a climate change strategy. A climate change strategy refers to several planned actions and policies designed to outline an organisation’s approach to tackling climate-related challenges in their local region. Climate change strategies encompass other nomenclature such as a ‘climate action plan’. A climate change strategy will typically cover ambitions for all GHG emission inventories and may link to separate sector strategies that set out in further detailed policies specific to a singular emission inventory. For example, a climate change strategy might reference a separate transport emission sector strategy.
A climate policy encompasses an individual action or set of actions that deliver ambitions set out by a climate strategy. Policies will typically include setting of targets and key performance indicators to measure and verify the success of the policy’s intended impact. For example, a transport sector strategy might include a policy to increase electric vehicle charging infrastructure, and a policy to implement a low emission zone (LEZ) in a city centre.
We used several sources of information to inform our review of existing evidence. We started with reviewing the “Wider influences” local authority climate change report submissions to SSN (SSN, 2023b). The wider influences section of SSN reports was completed with varying degrees of information but overall, the level of detail was sparse. We supplemented this gap by searching each of the local authority websites for their climate action strategies. We found various types of initiatives at different levels of hierarchy.
We identified 69 strategies relevant to climate change across the 32 local authorities. We developed short summaries of each strategy document, which are set out in Appendix 13.2.
We developed a screening matrix to rank each of the strategies against five criteria outlined in Table 2 and determined the level of maturity by assessing the level of evidence provided in a climate change strategy as yes / no / partial. Each of the strategies was then assigned a relevance score to identify those that closely aligned with the research objectives.
|
Screening criteria |
Description |
Maturity | |||
|
1 |
2 |
3 | |||
|
1 |
Scalability |
If the policy impacts a defined region, is there possibility for it to be scaled to cover a wider geographical location? |
N |
N |
Y |
|
2 |
Replicability |
Can the policy be easily replicated by other local authorities in Scotland? |
N |
Y |
Y |
|
3 |
Impacts |
Does the policy quantify the intended impacts (e.g. emissions reduction) and set targets against these? |
N |
Y |
Y |
|
4 |
Timescales |
The policy has a clear start and end date and where possible, has interim milestones and targets that will be used to measure progress. |
N |
P |
Y |
|
5 |
Resource |
Does the policy quantify the resourcing requirement to deliver the stated impacts (e.g. finance)? |
N |
P |
Y |
Although some strategies where much more detailed than others in terms of the detail provided against individual policies, all the strategies provided sufficient information for us to understand how they would lead to an impact of the GHG emissions in their area. However, quantified information about the level of impact a strategy had was often high-level, not valued as an impact on territorial GHG emissions, or left as an open ambition.[2]
Selected local authority strategies
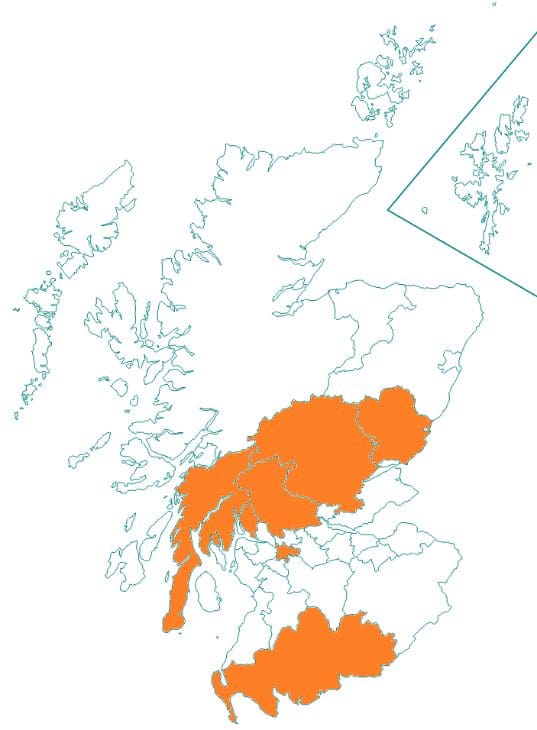
From the existing evidence review, we identified five climate change strategies that scored well across all of the screening categories. These climate change strategies were discussed with the steering group and we identified that all of the selected climate change strategies were across the central belt of the country. We therefore added a sixth strategy from a more rural local authority to ensure that we had a more diverse geographical spread. The six climate strategies matching the criteria were taken forward to the next task of valuating climate policies. The local authorities selected are shown in Figure 3 below.
|
Key |
Local authority |
Climate strategy name |
|
1 |
Argyll and Bute Council |
Decarbonisation Plan |
|
2 |
Stirling Council |
Climate and Nature Emergency Plan |
|
3 |
Perth & Kinross Council |
Climate Change Strategy and Action Plan |
|
4 |
Angus Council |
Sustainable Energy and Climate Action Plan |
|
5 |
Glasgow City Council |
Glasgow Climate Plan |
|
6 |
Dumfries and Galloway Council |
Carbon Neutral Strategic Plan |
In the following paragraphs, we present two example climate change strategies as representative of the strategies we reviewed.
Stirling’s Climate and Nature Emergency Plan was the highest-ranking strategy (table 3) we reviewed. This was due to the large array of topics covered, efficient writing style, the explanation of policies and how those could be translated into other local authorities and regions. It provided several emission impact figures for policies and actions to show the effect on the environment and highlighted how these would be resourced in the region. Stirling’s Climate and Nature Emergency Plan was also one of the few climate change strategies to mention their current territorial emissions, which is the key focus of this project. Mention of territorial emissions is usually a strong indicator that a climate change strategy would give thorough information around carbon impacts and implementation. Stirling’s Climate and Nature Emergency Plan estimated a territorial emission reduction of 1/3 between 2005 and 2018 and mapped out their future to show where the local authority wanted to be by 2030. This was one of many examples from Stirling’s Climate and Nature Emergency Plan that set it apart from other climate change strategies and provided a clear understanding of how the local authority wanted to meet their targets for territorial GHG emissions.
The Glasgow Climate Plan (Glasgow City Council, 2022) and Stirling Climate and Nature Emergency Plan (Stirling Council, 2022) were key examples of detailed climate change strategies that could be deployed to support a national transition to net zero. Both strategies gave detailed explanations of the current regional context which was pivotal in explaining why certain policies or actions had a greater impact than others. The strategies also highlighted the importance of developing and investing in climate policymaking to ensure polices they set are appropriate for the regions as well as the communities they serve, whilst aiming to minimise the (negative) impact on residents as much as possible. Another key area both strategies explore is the financial implications of initiatives, indicating whether projects are either already funded, part funded or if they are being financed. This is something the Glasgow Climate Plan provided details on more than any other climate strategy reviewed. Importantly, the strategies outlined the capacity requirements to adequately resource their polices and provided timebound milestones to monitor progress against.
Additional findings
Territorial emissions impact
Of the 69 climate change strategies, 56 either partially valued their emissions impact or failed to value the scale of their impact on GHG emissions at all. A common theme in the absence of territorial GHG emission impact was to apply a bespoke indicator as a measure of success, such as increasing the number of staff working remotely. The majority of climate change plans did not outline the methodologies applied in gathering and quantifying performance measures and targets, so it was often unclear how impacts would be measured.
The key aim of this research was to identify policies that could impact territorial GHG emissions in a major way. The top performing policies against the criteria were scored well because they quantified the anticipated impacts. Emissions were typically quantified as either a tonnage reduction in GHG emissions (tCO2e) or a percentage reduction against a baseline figure.
Resourcing, financing and timelines
56 of the 69 climate change strategies had fully or partially evidenced timescales for implementation and completion. adopt a unified approach.
The most mature climate change strategies also included considerations around cost, whether funding had been secured, who would be financing it and who would be delivering these policies. For example, Argyle and Bute’s Decarbonisation Plan (Argyll and Bute Council, 2021) outlines sources of funding against each individual policy, whether funding has been secured or still requires budget.
However, policies aimed at achieving the same outcome might do so on different timescales. There was no clear pattern across the climate change strategies on how timescales were decided upon. The exception to this rule was waste targets as they are set nationally, which is a good example of how other policy areas could do the same to territorial emissions and targets
Only 13 of the 69 climate change strategies cited their territorial emissions. Of those, only some set territorial emissions targets. It is not clear why this was the case. It could be due to local authorities not having updated information about their territorial emissions or because they were not confident in how they could enact change in their regions. Climate change strategies that specifically mentioned territorial emissions and set emissions targets for their area had more detailed action lists that went beyond council owned assets. This difference is important as it highlights some local authorities are being proactive in tackling territorial GHG emissions in the local authority area beyond just those of their own organisations.
Summary
The level of detail and consistency of targets and performance metrics showed that there was no clear and consistent approach to developing climate change strategies. This makes comparison and valuation of the climate strategies complex due to the non-uniform nature of presenting impact and the lack of detail around the methodological approaches applied.
The strategies we ranked high on our measures including scalability, replicability, and quantification of impacts, could form the basis of best-practice knowledge sharing, and setting of a national approach (see Appendix 13.1.1 for further detail). Our findings reflect those of recent research carried out by Environmental Standards Scotland (Environmental Standards Scotland, 2023) that recommended Scottish Government introduce a standardised Climate Plan template with mandatory reporting for local authorities. This recommendation would go some way to solving some of the challenges uncovered by this research.
Results of quantitative research
Overview
From the six climate strategies reviewed in detail (Figure 3), 61 distinct climate policies were extracted. The distribution of the policies across the GHG inventory categories is summarised in Figure 4.
Of the 61 policies extracted, most policies (26) targeted building emissions and are outside the scope of this research as they are covered by the exemplar LHEES approach that has already been rolled out nationally across all local authorities. This research intended to identify policies in other GHG inventory categories that have the same potential for rollout across local authorities. With building emissions excluded, the remaining 35 policies have the greatest numbers in transport (13), LULUCF (8) and industry (7) as shown in Figure 4.
Figure 4: Number of policies extracted, by GHG inventory.
Of the 35 policies, we could only collect sufficient information from 13 policies to be able to estimate potential GHG emission impact. These are described alongside example targets and KPIs in Appendix 13.5.
Policy scenario emissions
We analysed the 13 policies to estimate the potential GHG emission impact if they were to be scaled-up to the national level and enacted across all 32 local authorities. The potential GHG emission impacts are high-level indicative estimates using a basic methodological approach and incorporating multiple assumptions, as set out in Appendix 13.1.2 and 13.2. As such, the quantitative findings are indicative, illustrating the scale of potential impact that local authorities may have in tackling climate change. Further analysis would provide more accurate potential GHG impacts of policies.
The findings of this analysis are detailed Table 4. Each row in Table 4 contains a climate policy that originates from either a single local authority or multiple local authorities where policies were similar. Table 4 details that across the 13 policies assessed for their GHG emission impact, there is potential for an estimated 9 MtCO2e overall change to territorial emissions, or 22% of the current inventory emissions for Scotland.
The full breakdown of the indicative estimated potential impact on each individual local authority’s GHG inventory is presented in Appendix 13.6 and sources for the assumptions and conversion factors are included at Appendix 13.2.
For each of these 13 policies valued, we also show in Table 4 our assessment of the likelihood of each policy to cause a change in emissions if rolled out nationally to all local authorities, taking account sphere of control, capacity and capability, and the timescale over which a policy would be enacted. We also assessed the magnitude of the potential change. Both of these methodologies are outlined in IPCC guidelines (IPCC, 2006) and set out in Appendix 13.4. There will be widely ranging factors and contexts at an individual local authority level which have not been accounted for and that would significantly impact implementation of the policies assessed. In addition, there are critical wider factors such as future national policy development and available budget that were not incorporated into this quantitative analysis.
Findings
Comparing the policies evaluated in Table 4 with the Climate Change Plan sector envelopes (Scottish Government, 2020, p. 253) indicates that both LULUCF and transport policies have the greatest potential to impact territorial GHG emissions, with a high likelihood of the local authority being able to influence their outcome. Table 3 below shows estimated potential GHG emission reductions in these policy areas if implemented in each local authority.
The other policy areas evaluated may also compare favourably with the Climate Change Plan sector envelopes but local authorities have a more limited control on the outcomes. This is the case with policies relating to changes in agricultural practices. In addition, while seven industrial emission-related policies were present amongst the six climate strategies finalised, none sought to value their impact on territorial GHG emissions and provided limited definitive action. Instead, the industrial-emission-related policies opted for a model of getting organisations to sign up to climate change pledges. Policies that were either outside the local authorities’ sphere of influence, or policies that impacted centralised issues, such as waste management, were also not carried forward to interviews with local authorities.
|
Local authority |
1) Nature-based solutions |
2) Net zero transport | ||
|
Total LULUCF emissions (ktCO2e) |
Potential emission reduction (ktCO2e) |
Total Transport emissions (ktCO2e) |
Potential emission reduction (ktCO2e) | |
|
Aberdeen City |
31 |
-32 |
305 |
-63 |
|
Aberdeenshire |
357 |
-107 |
613 |
-72 |
|
Angus |
389 |
-52 |
235 |
-31 |
|
Argyll and Bute |
-532 |
-225 |
186 |
-24 |
|
City of Edinburgh |
70 |
-37 |
640 |
-139 |
|
Clackmannanshire |
24 |
-155 |
66 |
-15 |
|
Dumfries and Galloway |
-239 |
-59 |
571 |
-42 |
|
Dundee City |
23 |
-485 |
184 |
-40 |
|
East Ayrshire |
-31 |
-39 |
229 |
-34 |
|
East Dunbartonshire |
20 |
-41 |
113 |
-30 |
|
East Lothian |
194 |
-36 |
210 |
-30 |
|
East Renfrewshire |
23 |
-58 |
147 |
-38 |
|
Falkirk |
79 |
-115 |
327 |
-43 |
|
Fife |
345 |
-150 |
584 |
-101 |
|
Glasgow City |
68 |
-225 |
761 |
-170 |
|
Highland |
110 |
-1,489 |
598 |
-80 |
|
Inverclyde |
3 |
-55 |
106 |
-23 |
|
Midlothian |
52 |
-83 |
137 |
-26 |
|
Moray |
-167 |
-56 |
162 |
-26 |
|
Na h-Eileanan Siar |
951 |
-461 |
42 |
-8 |
|
North Ayrshire |
-32 |
-280 |
151 |
-37 |
|
North Lanarkshire |
90 |
-313 |
736 |
-97 |
|
Orkney Islands |
43 |
-181 |
29 |
-6 |
|
Perth and Kinross |
-140 |
-47 |
515 |
-42 |
|
Renfrewshire |
35 |
-76 |
301 |
-52 |
|
Scottish Borders |
-103 |
-51 |
261 |
-32 |
|
Shetland Islands |
572 |
-160 |
43 |
-7 |
|
South Ayrshire |
-55 |
-48 |
209 |
-31 |
|
South Lanarkshire |
-27 |
-152 |
666 |
-91 |
|
Stirling |
-150 |
-63 |
249 |
-25 |
|
West Dunbartonshire |
9 |
-56 |
127 |
-25 |
|
West Lothian |
48 |
-106 |
373 |
-51 |
|
Total |
2,059 |
-5,497 |
9,878 |
-1,527 |
Results of qualitative research
Overview
The results of the quantitative research found that policies in LULUCF and transport showed potential in having significant impacts on local authority territorial GHG emissions. To find out more about how these policies were developed, and the potential pathways to implementing similar policies at the national level, we interviewed local authorities who had leading policies in nature-based solutions and net zero transport.
Findings
The findings below combine evidence from our review of existing data and assessment of the key themes identified through thematic analysis of interviews.
Capacity and capability
It was clear from the interviews that lack of capacity to develop and deliver policies would likely hamper efforts in expanding policies across all local authorities in Scotland. We found that some local authorities had the resource and ability to hire specialist skills into the organisation. Through this they could actively engage with teams across the organisation to ensure policy ambitions were carried out. An example of this given by one respondent:
“It’s imperative to ensure that any planting of new trees considered multiple planning and climate aspects, impacting the species of tree selected, factoring in considerations about the future microclimate and requirements for future flood prevention.”
However, local authorities do not always know what skills they need to deliver on a policy ambition. One respondent explained that many policies require both multi-disciplinary expertise, such as project management, as well as specialist skills, such as ArcGIS[3], to properly manage the rollout of a policy.
One respondent explained that budget cuts mean that retaining enough resource within the organisation, with access to the right skills and expertise would be a defining factor in the success of climate policies’ targets. Respondents did signal that it was possible to access skills external to the local authority (e.g. through consultancy) but this was often ad hoc. Developing and implementing policies will require multi-year and decadal management to realise their full benefits. Not being able to retain the skills and resource within the local authority places their success at risk.
Data maturity
One of the respondents explained that having good quality data that is continually updated and shared across the organisation is critical to enabling policy development and delivery. The example provided was the data landscape for nature-based solutions policies, which is complex, onerous to compile and requires near-constant updating. For example, in the greening of derelict land, the classification of land as ‘derelict’ ebbs and flows as multiple stakeholders retain interest in the space. The local authority itself (potentially across multiple departments), private individuals, residents and developers may all have a stake in the use of the derelict land. Added to this is the difficulty of collecting accurate data about derelict land, such as carbon evaluation, existence of contaminants, appraisal of natural ecosystems and animal species, and importance to flood prevention. This information is needed to show causal links between greening derelict land and benefits such as heat reduction and carbon sequestration.
Data also enables a local authority to develop robust climate policies by identifying measurable KPIs and to set realistic timescales. Several climate change strategies we reviewed were at early stages of development and specifically referenced the need for additional research to complete the valuation of a policy’s impact. For example, several transport policies referenced other transport strategy documents in-development that sought to improve data maturity for the local area, and enable valuation of impacts and target setting. Timescales for the development of these strategies were not clear.
Collecting adequate data is key to the development, measurement, and success of a climate policy. However, the landscape is complex and demanding and interrelated to capacity and capability in the local authority as discussed above.
Geographical diversity
We found that the overarching aims of climate change strategies across Scotland are the same. However, sometimes these goals are were coupled with specific local issues. Therefore, motivations, KPIs, and targets by which the local authorities measure the performance of climate related policies often differ. This has a knock-on effect on the data and capacity needed to implement policy across diverse communities.
One clear example of this is in homeworking policies. In large island communities that have a widely dispersed rural communities, home working and flexible working has benefited commuters who do not need to travel great distances to reach their work location. One interviewee explained that the policy has helped island communities to overcome other issues such as the lack of public transport provision. Similar homeworking policies also exist in cities with a specific focus on reducing the amount of traffic congestion within the city centre at peak times. Both sets of policies have differing motivations for enacting homeworking polices but the end benefit of reduced air pollution is the same.
Accountability and ownership
We found that climate policies often span multiple departments within an organisation. In some circumstances this led to ambiguity around accountability for the successful delivery of a policy. One respondent explained that for nature-based climate policies, using afforestation as a specific case in point, the responsibility and budget for tree planting might fall with a local authority’s parks department. However, responsibility to actively manage LULUCF from a climate perspective might reside with the sustainability or planning departments. This leads to complexities around who in a local authority needs to be consulted for LULUCF projects and who has ultimate ownership of a policy being successfully enacted. Respondents referenced that it is not uncommon for there to be “a lot of silo working” across departments, so projects that might impact on a climate policy are not always communicated, or vice versa. Respondents also noted that there tends to be an aversion to taking on or sharing climate policy responsibilities because it is a change from how departments have functioned in the past,
“[we] have always done it this way so why would we do it another way”.
Funding
Funding, or the lack thereof, was a common theme across respondents. One respondent noted that there is a lack of funding available to commission external expertise, for example the delivery of a feasibility study. This hampered efforts to collect the information needed to develop robust policies and set realistic targets. It was clear from the strategies reviewed that only a few local authorities sought to quantify the funding requirement to deliver policies.
A strong theme was the lack of funding to attract and retain talent within the local authorities. One example given was that of senior planners, who are required within in a local authority to appropriately manage LULUCF. We were told:
“[Local authorities] advertised at between £39,000 and £48,000 per annum while the private sector advertises similar roles for between £48,000 and £68,00 per annum”.
This leads to expertise being stripped out of the public sector by the private sector after employees have gained a few years’ experience.
There are several avenues of funding available to Scottish local authorities. However, it was the view of respondents that funding was piecemeal, short-term where local authorities needed a longer-term financial commitment and finite, which leads to competition across local authorities. There was a view shared across respondents that funders such as Scottish Government and NatureScot should look to review how funding is administered. A model was suggested in which funders work directly with each individual local authority to identify areas where funding could have the greatest impact at the local level. There was appreciation though that both Scottish Government and NatureScot are themselves suffering from budget and resourcing pressures to many of the local authorities, which hampers efforts to change existing models.
Summary
While very limited, the qualitative evidence indicates that many of the barriers highlighted by the interviews are aligned to those presented in the climate strategy documentary review. Further, the interviews also indicate that these barriers are interlinked and require a holistic approach to be overcome. For example, the lack of funding directly impacts capacity and capability within local authorities to deliver climate policy. This in turn directly impacts the maturity of data across the sector and, again, the local authority’s ability to deliver robust climate policies.
Considering the identified barriers to enacting climate policies, local authorities have nevertheless made significant inroads to developing some best-in-class policies that go above and beyond national ambitions. This is evident in the detail and narrative presented in multiple climate strategies. This shows there is a major interest and commitment by local authorities to tackle their territorial emissions. While policymaking in this area is limited in its scope, scale and consistency, local authorities interviewed demonstrated keenness to increase action.
Combined results
Table 4 combines the quantitative and qualitative research’s estimated potential impacts for the policies should they be implemented nationally. Appendix 13.1.2 describes the methodology used to arrive at the figures included and Appendix 13.2 lists the sources used.
|
Inventory / Policy |
Current territorial emissions |
Potential National Policy emission impact estimate |
Interim target emission impact |
% change from current |
Likelihood |
Magnitude |
Interim target year |
Policy target year |
|
Agriculture |
7,985 |
-1,416 |
-907 |
-17.73% | ||||
|
Changes to Agricultural Practices |
-1,416 |
-907 |
-17.73% |
Possible |
Major |
2025 |
2030 | |
|
Buildings (not accounted) |
11,600 |
0 |
0 |
0.00% | ||||
|
Industry |
7,798 |
0 |
0 |
0.00% | ||||
|
LULUCF |
2,059 |
-5,497 |
-1,159 |
-266.94% | ||||
|
Greening of derelict land |
-2,167 |
N/A |
-105.23% |
Likely |
Major |
2025 |
2040 | |
|
Peatland restoration |
-2,530 |
-1,150 |
-122.86% |
Possible |
Major |
2030 |
2045 | |
|
Reforestation (1 million new trees per local authority) |
-800 |
-9 |
-38.85% |
Likely |
Moderate |
2030 |
2045 | |
|
Transport |
9,878 |
-1,527 |
-258 |
-24.02% | ||||
|
Active travel |
-793 |
N/A |
-16.59% |
Unlikely |
Major |
N/A |
2030 | |
|
Homeworking |
-0.31 |
N/A |
-0.00% |
Likely |
Minor |
N/A |
2026 | |
|
Low Emission Zone |
-129 |
N/A |
-1.30% |
Very likely |
Moderate |
N/A |
2030 | |
|
Public transport |
-169 |
-76 |
-1.71% |
Likely |
Moderate |
2030 |
2045 | |
|
Fleet vehicles |
-124 |
-26 |
-1.26% |
Likely |
Moderate |
2025 |
2030 | |
|
Council Business Travel |
-235 |
-118 |
-2.38% |
Very likely |
Moderate |
2030 |
2045 | |
|
LEV Taxi Licences |
-76 |
-38 |
-0.77% |
Likely |
Minor |
2032 |
2045 | |
|
Waste |
1,333 |
-541 |
-306 |
-40.57% | ||||
|
Waste Reduction Strategy |
-520 |
-290 |
-39.03% |
Likely |
Major |
2025 |
2045 | |
|
Council Waste Reduction |
-21 |
-16 |
-1.55% |
Very likely |
Moderate |
2030 |
2045 | |
|
Scotland Total |
40,653 |
-8,981 |
-2,629 |
-22.09% |
Policy briefing: Nature-based solutions
Background
Biodiversity loss and the destruction of natural habitats is directly linked to climate change. Scottish forests, peatlands and bogs contribute to healthy eco systems. These systems work to remove CO2 from our atmosphere and in some areas become large carbon sinks. According to the Biodiversity Intactness Indicator, Scotland has seen a 15% decline in its natural capital since 1950 with only 64% of our protected woodlands being in a favourable or recovering condition (Scottish Government, 2022).
|
Policy |
Nature-based solutions |
|
Description |
Changing land use – particularly on areas of derelict land – that directly improves carbon sequestration potential through improvements in management practices, afforestation, repairing damaged ecosystems such as peatland, and greening of derelict land. |
|
Potential estimated national impact |
-5.4 MtCO2e |
|
Broader impacts |
|
Figure 5 shows the total estimated impact on LULUCF territorial GHG emissions by each individual policy, moving the inventory from 2.1 MtCO2e emission per annum to (negative) -3.4 MtCO2e through a combination of three polices.
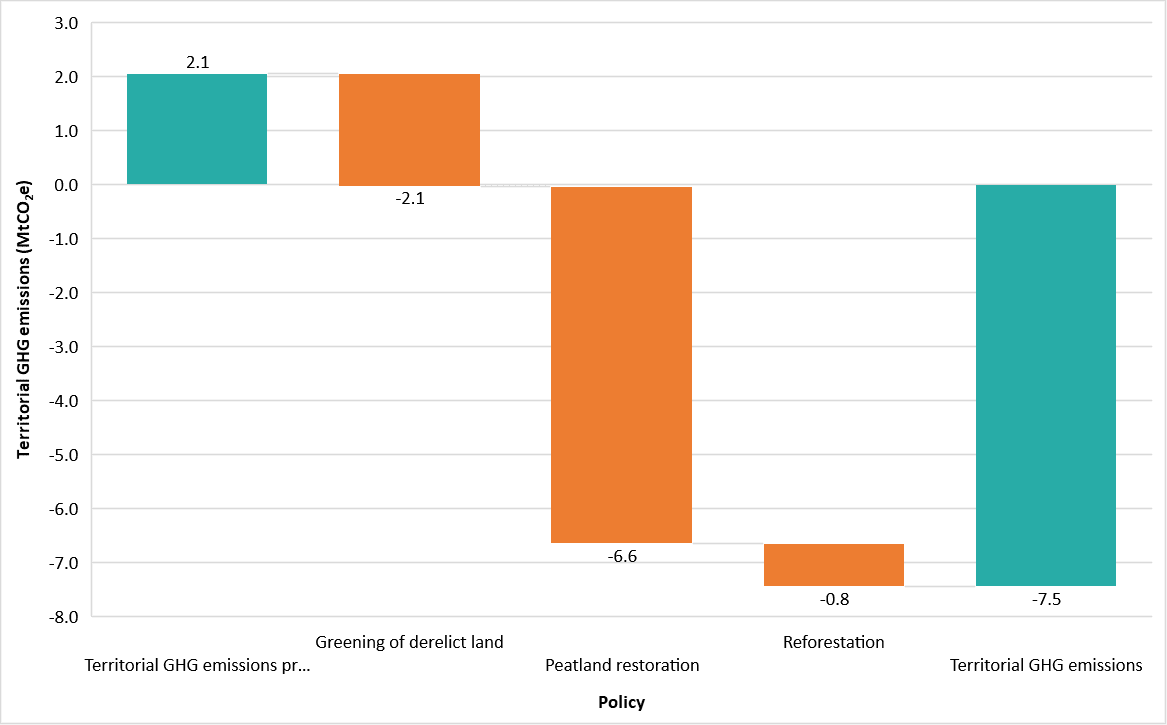
Figure 5: Potential impact on LULUCF territorial GHG emissions across Scotland for a nature-based solutions policy
Greening Derelict Land
The rewilding policy outlined in Glasgow’s Climate Plan (Glasgow City Council, 2022) was one of the most developed we found during the quantitative review. It was used as the foundation to value the potential impact of nation-wide greening of derelict land. NatureScot estimated the total area of urban vacant and derelict land in Scotland in 2017 to be 11,649 hectares (Nature Scot, 2022). Across Scotland, 35% (4,077 ha) of urban vacant and derelict land can be thought of as being uneconomic to develop and/or is viewed as suitable to reclaim for a ‘soft’ end use (i.e. non-built use). The most common new use for sites that were previously urban vacant and derelict land was for residential development, with 50% of sites reclaimed for this purpose (Nature Scot, 2022). Changing land use for derelict land comes with many challenges for local authorities to consider including potential decontamination, private ownership, stakeholder relations, and internal ownership of the policy (see findings from the qualitative research in Section 7).
We have given an interim target of 2025 for greening to reach an estimated net gain in carbon sequestration potential of 2.2 MtCO2e across Scotland by 2040. This figure is an upper bound estimate and was calculated on the basis of the following significant assumptions:
- 50% of the uneconomic land could be ’greened’ as described above.
- Derelict land is assumed to be neutral grassland that can be converted to coniferous woodland, applying carbon stock estimates (tC / ha) by habitat type and converting to MtCO2e (Carbon Rewild, 2020).
- Afforested trees would reach their peak potential sequestration between 16 and 25 years of age (Carbon Store, n.d.).
Peatland Restoration
Scotland’s Nature Agency estimates that Scotland has some 1.8 Mha of blanket bog, representing 23% of the total land area (NatureScot, 2023). It is estimated that up to 80% of the total peatland area (1.44 Mha) is damaged. We have drawn on several policies across three local authorities that had detailed peatland restoration ambitions. The policies we reviewed sought to meet the pace of restoration set by Scottish Government of 20,000 ha restored per annum, with a target of 250,000 ha restored by 2030 (Scottish Government, 2020). Maintaining this pace of change to 2045 would mean a potential restoration of 0.55 Mha of peatland by 2045. The International Union for Conservation of Nature (IUCN) estimates that up to 4.6 tCO2e per hectare could be reduced by restored peatland (IUCN, 2010). This produces an estimated carbon reduction potential of 2.5 MtCO2e.
A strong caveat to the total potential restoration area is that much of the peatland across Scotland is under private ownership. Local authorities have limited powers outwith their own land ownership and may face significant challenges in convincing some private landowners to restore the peat on their land. In the absence of clear data on the area of peatland under private ownership, or other ownership covenants, for the purposes of estimating a potential GHG emission reduction we have made the broad assumption that these challenges could be overcome. However, if these challenges cannot be overcome it would severely reduce achievable emissions reductions.
Afforestation
We have used Stirling’s Climate & Nature Emergency Plan (Stirling Council, 2022) reforestation policy to plant 360,000 new trees by 2030, and 1 million new trees by 2045 as the basis for the modelled figures. The average kilogram of carbon dioxide sequestered by a mature tree is between 10kg CO2 and 40kg CO2 depending on age, species, and growing environment (EcoTree, 2023). For the purposes of estimation, 25kgCO2 / tree / per annum has been used. Scaling this ambition to the national level, the total estimated removal of 0.8 MtCO2 per annum across Scotland.
There are significant assumptions that sit behind the above estimation. These include:
- Stirling’s policy does not specify the type of land that will be converted, the detailed timescales for planting (impacting when the new tree stock will be at maturity), nor the preferred species of tree to be reforested.
- The policy does not value the GHG emission impact of planting new trees.
- We have assumed that the afforested trees will sequester emissions at their peak potential (i.e. a mature forest). This means the estimated emissions removals are limited by the fact we have not modelled a progressive change in sequestration over time, accounting for the growth of new woodland, such as that outlined by the Woodland Carbon Code (UK Woodland Carbon Code, 2021).
Summary
During our research we found that local authorities were eager to develop and create policies for land use that could make a quantifiable impact. One common theme across all local authorities was the consideration of peatland as one of the most impactful policies to reduce their carbon emissions. There are abundant resources provided by the IUCN peatland code (IUCN, 2023) that local authorities could access to begin developing strong peatland restoration policies.
Policy briefing: Net zero transport
Background
Scotland has ambitious targets to reduce transport emissions to net-zero by 2045 (Transport Scotland, 2019a). Transport emissions are one of the largest GHG inventory categories, accounting for 24% of overall territorial emissions (DESNZ, 2023). This is reflected in the number of transport policies identified across local authority climate change strategies. The policies in the section below demonstrate how local authorities are driving forward transport solutions.
|
Policy |
Net zero transport |
|
Description |
Supporting the nation’s transition to net zero transport through a combination of policies tackling public and private transport methods, including promoting active travel and implementing low emission zones. |
|
Potential estimated national impact |
-1.5 MtCO2e |
|
Broader impacts |
|
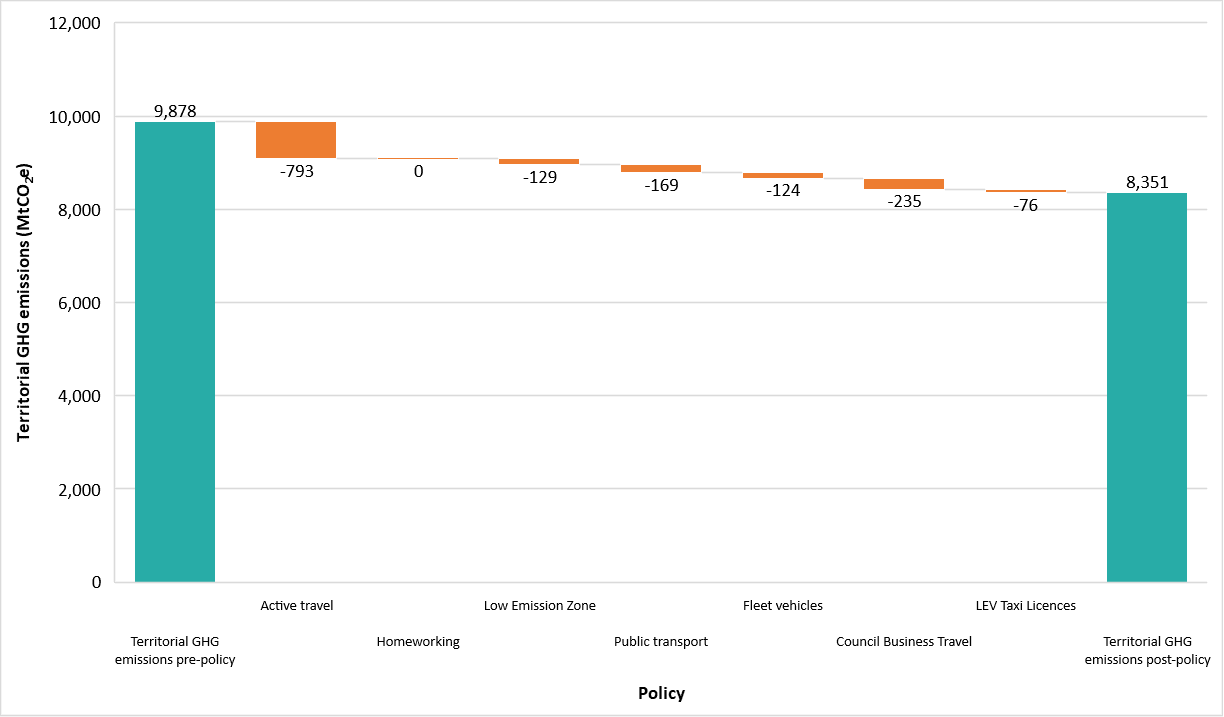
Figure 6: Potential impact on transport territorial GHG emissions across Scotland for a net zero transport policy
Figure 6 shows the total estimated impact on transport GHG emissions by each individual policy, moving the inventory from 9,878 MtCO2e emission per annum to 8,351 MtCO2e through a combination of seven polices.
The Scottish National Transport Strategy states that 40% of transport emissions come from fossil fuelled cars. Recognising the impact that internal combustion engine cars have, local authorities have started to introduce policies targeted specifically at reducing these emissions. (Transport Scotland, 2019a).
High private use car use does not just affect GHG emissions, it also has a significant impact on air quality, health and pedestrian safety. Private car use contributes to high pollutions levels and with transport contributing to 1/6 of Scotland’s particulate matter (PM10) it is clear this is an area for policy focus (Transport Scotland, 2019a).
Local authorities understand the need for potent policies to be in line with national targets such as the goal to reduce car kilometres driven by 20% by 2030. These range from encouraging more active travel through the creation of active travel corridors and implementing low emissions zones in congested zones.
Active transport
The figures for this policy were modelled using Argyll and Bute Council’s Decarbonisation Plan 2022-2025 (Argyll and Bute Council, 2021). £2.3 million has been invested in delivering a wide range of active travel initiatives such as improved pathways, community cycle repair stands, cycle parking and new cycling routes. Through a combination of similar initiatives, a viable aim would be to convert 47% of remaining road journeys of up to 3km to active travel, which was the average proportion of active travel journeys up to 3km in 2019 (Transport Scotland, 2019b). The Council has committed to develop an Active Travel Strategy that would drive the policy forward at a future stage, but up to this point, resource to deliver the policy is dependent on external funding awards and is not covered by council budgets.
Homeworking
This policy has been valued as a proportion of the 262,000 Scottish FTE public sector total workforce (Scottish Government, 2022) working from home for 50% of their contracted hours. Reducing the average commute of 20 km round trip to office locations made in 73% of circumstances by personal car (Scottish Government, 2022b). Further potential emission reductions could be achieved through reduced operation of offices, such as heating, lighting, equipment and other operational emissions, although these have not been factored into our current study. However, it should be noted that emissions from reduced transport are minimal due to increased emissions associated with staff working from home (Riley et al., 2021).
Low-emission zones
Currently, there are four low emission zones (LEZ) in Scotland with enforcement for Dundee, Aberdeen and Edinburgh being introduced in 2024. Glasgow’s LEZ is integrated with the City Development Plan 2, Glasgow Transport Strategy and their Climate Plan to implement the change. The LEZ has been operating since 2018 with the aim of encouraging more active travel and public transport use in the city centre. The policy was implemented in phases to ensure low levels of disruption for residents, which should be a key consideration if scaling this across Scotland. Using findings from the London LEZ (Mayor of London, 2023), we have assumed a 4% CO2 saving on emissions from transport on minor roads, to account for the fact LEZs will likely be operational in urban areas.
Decarbonisation of public transport
Climate targets published in the Stirling Climate & Nature Emergency Plan (Stirling Council, 2022) aim to reduce GHG emissions from public transport by an interim target of 25% in 2030, with an overall target of 75% by 2045. This has been extrapolated using population as a function to estimate the number of people served by public transport. However, the provision of public transport across Scotland is dependent on several factors, including sparseness of the population and socioeconomic circumstance, which are not accounted for in the potential emissions impact estimation. Further work should be undertaken to quantify the benefits.
Decarbonisation of fleet vehicles
This policy’s emissions were modelled using the estimated number of 28,800 fleet vehicles in the Scottish public sector (Scottish Futures Trust, 2022). We applied a conversion factor for assumed petrol cars, diesel LGVs and HGVs (BEIS, 2023). The average number of kilometres travelled annually is 12,000 km (Scottish Futures Trust, 2022). Post-conversion to EV emissions are zero, as per emission factor guidance. It is worth noting that EV technology for HGVs is under development and may not play a major role until post-2030 (Transport & Environment, 2023).
Council business travel
These emissions were estimated based on climate targets published in the Stirling Climate & Nature Emergency Plan (Stirling Council, 2022). The plan sets out the ambition of reducing baseline transport emissions (4,450 tCO2) by the interim target of 45% by 2030, and the overall target emission reduction of 90% by 2045. This has been applied across the other local authorities, using population as a proxy. Further research to quantify emissions for each local authority would need to be carried out to refine these estimates.
LEV taxi licences
Stirling Climate & Nature Emergency Plan (Stirling Council, 2022) sets out the authority’s commitment to 100% of all taxis operating in the region being EVs by 2045. Using this as a foundation, we have valued the policy ambition in potential national GHG territorial emission impact.
There are 20,396 taxi licences registered across the 32 local authorities in Scotland of which 9,928 were registered as of 2021 (Transport Scotland, 2021). 1.9% are thought to be ULEVS (DfT, 2023). The policy will seek to increase the share of ULEV licences to 100% by 2045 effectively curtailing the emissions from private car hire.
To calculate the GHG emission impact, we anticipate that the average number of kilometres travelled per annum per capita is 80.85 km taken from the average number of trips made in the UK, by mode of transport (DESNZ, 2023) across the population of Scotland (5,563,000). Assumed that most private hire taxis are diesel cars, we applied the emission factor for a diesel car from BEIS company reporting datasets (BEIS, 2023) to calculate a saving on emission of 76.36 ktCO2e.
Summary
It is clear from our research that transport is a key focus for all local authorities across Scotland due to the interlinked impacts spanning multiple socio-economic factors. Transport policies are very publicly visual in their delivery, making it easy for local authorities to point toward action being taken. In this section we have outlined some of the transport-related policies that could potentially be rolled out across Scotland’s local authorities. There is great potential to support local authorities to drive ambitious change in transport emissions, many of whom are already showing innovative solutions to enacting change in their local area. We have also given high-level estimates of potential emissions reductions if some of the most mature existing travel policies were scaled up.
Conclusions
Through pursuit of Local Heat and Energy Efficiency Strategies (LHEES), the Scottish Government has set the foundations for local authorities to drive their own locally led net zero agendas, directly tackling territorial greenhouse emissions from buildings. This research sought to investigate the role of local authorities in addressing emissions across other inventory categories, to replicate the success and best practice generated by LHEES.
From the evidence reviewed and from the interviews with local authorities, it is clear that there is local authority ambition to deliver climate policies that tackle local climate challenges, at the same time as delivering emissions reductions that go above and beyond national targets. Our climate strategy register details 69 current local authority climate-relevant strategies and describes the action being taken across all emission categories. We uncovered several climate change strategies that clearly detail intent, value their potential impacts and address resourcing and funding needs. Further research could be carried out to establish best-practice guidance on the development of climate policies, using existing local authority approaches as the foundation. This would help improve consistency across local authorities in how they value policy impacts and Scottish Government’s understanding of the resourcing, skills and funding needed to deliver.
This research assessed local authority strategies and policies to find where the most mature and impactful local authority climate policies have been developed. We scaled-up the emission reduction potential of the strongest of these local policies to give high-level-indicative estimates of what the impact could be in other local authorities and at a national level. Combining all of the analysis, we identified the greatest potential for impactful local authority controlled policies on territorial emissions to be within the LULUCF and transport categories.
For these to be implemented across Scotland, we found that the Scottish Government has a key role to play. They can provide effective leadership through facilitating best-practice knowledge sharing, improved access to skilled resource and targeted funding initiatives.
Territorial GHG policies are complex and data-driven, requiring specialist resource to develop and deliver, which we found does not always exist within individual local authorities. The Scottish Climate Intelligence Service has recently been launched in response to this barrier for many local authorities. Further research could expand on the capacity and capability requirements to deliver local authority climate policies between now and 2045, including methods by which the resourcing needs could be met.
Finally, funding is key to driving forward all the strategies and policies we have reviewed in this research. There are many pockets of funding available to local authorities to deliver climate policies. However, the interviews show that the funding is often piecemeal and short-term. Further investigation could help quantify the funding available for tackling each GHG inventory, where further funding might best be directed and methods for administrating funding to ensure that national ambitions can be met.
References
Argyll and Bute Council, 2021. Decarbonisation Plan 2022-2025, s.l.: s.n.
Audit Scotland, 2022. Scotland’s councils’ approach to addressing climate change. s.l.:s.n.
BEIS, 2022. Digest of UK Energy Statistics – Annual data for UK, 2021, London: Crown.
BEIS, 2023. Government conversion factors for company reporting of greenhouse gas emissions. [Online]
Available at: https://www.gov.uk/government/collections/government-conversion-factors-for-company-reporting
BEIS, 2023. Green Book supplementary guidance: valuation of energy use and greenhouse gas emissions for appraisal, London: Crown Commerical.
BEIS, 2023. UK Greenhouse Gas Emission Statistics: Frequently Asked Questions, London: Crown Copyright.
Carbon Rewild, 2020. Exploring the Carbon Capture Potential of Different Land Types. [Online]
Available at: https://carbonrewild.com/exploring-the-carbon-capture-potential-of-different-land-types/#:~:text=Wetlands%20are%20globally%20considered%20a,grow%20in%20or%20on%20water
Carbon Store, n.d. Carbon Sequestration. [Online]
Available at: https://carbonstoreuk.com/publications/carbon-sequestration-the-basics/#:~:text=As%20trees%20grow%2C%20the%20process,CO%E2%82%82%20as%20they%20are%20sequestering.
Climate Change Committee, 2022. Progress in reducing emissions in Scotland – 2022 Report to Parliament, s.l.: s.n.
Climate Change Order, 2015. Climate Change (Duties of Public Bodies: Reporting Requirements) (Scotland) Order 2015. s.l.:s.n.
DESNZ, 2023. Average number of trips by purpose and main mode. [Online]
Available at: Average number of trips by purpose and main mode
DESNZ, 2023. UK local authority and regional greenhouse gas emissions national statistics, 2005 to 2021. [Online]
Available at: https://www.gov.uk/government/statistics/uk-local-authority-and-regional-greenhouse-gas-emissions-national-statistics-2005-to-2021
[Accessed 01 November 2023].
DfT, 2023. NTS0409: Average number of trips and distance travelled by purpose and main mode: England, 2002 onwards, s.l.: Department for Transport.
EcoTree, 2023. How much CO2 does a tree absorb?. [Online]
Available at: https://ecotree.green/en/how-much-co2-does-a-tree-absorb
Environmental Standards Scotland, 2023. An investigation into the effectiveness of the systems in place to support local authorities in their duty to contribute to the delivery of climate change targets, s.l.: s.n.
Glasgow City Council, 2022. Glasgow’s Climate Plan, Glasgow: Glasgow City Council.
Greenhouse Gas Protocol, 2014. Policy and Action Standard: An accounting and reporting standard for estimating the greenhouse gas effects of policies and actions, s.l.: World Resources Institute.
HM Treasury, 2020. Magenta Book: Central Government guidance on evaluation, London: UK Government.
Improvement Service, 2023. Climate Intelligence Service. [Online]
Available at: https://www.improvementservice.org.uk/products-and-services/consultancy-and-support/climate-change/climate-intelligence-service
IPCC, 2006. Guidelines for National Greenhouse Gas Inventories, s.l.: s.n.
IUCN, 2010. Peatlands and Greenhouse Gas Emissions Reduction in Scotland, s.l.: IUCN.
IUCN, 2023. Peatland Code. [Online]
Available at: https://www.iucn-uk-peatlandprogramme.org/peatland-code-0
Mayor of London, 2023. Inner London Ultra Low Emission Zone Expansion One Year Report. [Online]
Available at: https://www.london.gov.uk/programmes-strategies/environment-and-climate-change/environment-and-climate-change-publications/inner-london-ultra-low-emission-zone-expansion-one-year-report?auHash=IxeIM3L6iJh-CwYvb2wek2UKMCSJvpOqMgtpRAMt5B8
Nature Scot, 2022. LLC3 Urban Vacant and Derelict Land, s.l.: s.n.
NatureScot, 2023. Blanket bog. [Online]
Available at: https://www.nature.scot/landscapes-and-habitats/habitat-types/mountains-heaths-and-bogs/blanket-bog#:~:text=Blanket%20bog%20is%20one%20of,23%25%20of%20our%20land%20area.
Net Zero, Energy and Transport Committee, 2023. The role of local government and its cross-sectoral partners in financing and delivering a net-zero Scotland, Edinburgh: The Scottish Parliament.
Scottish Futures Trust, 2022. Phasing out petrol and diesel cars & vans from public sector fleet, Edinburgh: Scottish Futures Trust.
Scottish Government, 2020. Update to the Climate Change Plan 2018 – 2032: Securing a Green Recovery on a Path to Net Zero, s.l.: s.n.
Scottish Government, 2022a. About public sector employment statistics. [Online]
Available at: https://www.gov.scot/publications/about-public-sector-employment-statistics/pages/local-government-employment/
Scottish Government, 2022b. Census data – Transport. [Online]
Available at: https://www.scotlandscensus.gov.uk/census-results/at-a-glance/transport/
Scottish Government, 2022. Biodiversity strategy to 2045: tackling the nature emergency, Edinburgh: ScotGov.
Scottish Government, 2022. Public Sector Employment in Scotland Statistics for 2nd Quarter 2022. [Online]
Available at: https://www.gov.scot/publications/public-sector-employment-scotland-statistics-2nd-quarter-2022/pages/6/
SSN, 2023b. Reporting: Public Bodies Climate Change Duties. [Online]
Available at: https://sustainablescotlandnetwork.org/reports
[Accessed 07 07 2023].
Stirling Council, 2022. Climate and Nature Emergency Plan 2021 – 2045, Stirling: Stirling Council.
Transport & Environment, 2023. Electric HGVs will soon be cheaper overall than diesels in the UK. [Online]
Available at: https://www.transportenvironment.org/discover/electric-hgvs-will-soon-be-cheaper-overall-than-diesels-in-the-uk/
Transport Scotland, 2019a. National Transport Strategy, Edinburgh: s.n.
Transport Scotland, 2019b. Transport and Travel in Scotland 2019: Results from the Scottish Household Survey, Edinburgh: s.n.
Transport Scotland, 2021. Scottish Transport Statistics, Glasgow: ScotGov.
Transport Scotland, 2022. Scottish Transport Statistics (2021) Personal and cross-modal travel, s.l.: Transport Scotland.
UK Woodland Carbon Code, 2021. 3.3 Project carbon sequestration. [Online]
Available at: https://www.woodlandcarboncode.org.uk/standard-and-guidance/3-carbon-sequestration/3-3-project-carbon-sequestration
Williamson, R., Sudmant, A., Gouldson, A. & Brogan, J., 2020. A Net-Zero Carbon Roadmap for Edinburgh, s.l.: PCAN & Edinburgh Climate Commission.
Appendices
Detailed methodology
Selection of climate strategies
The research identified 69 separate climate-related strategies across the 32 local authorities. To determine which were the key strategies to take forward to develop greenhouse gas emission boundaries, we designed five selection criteria to score each of the strategies against the metrics in 3.
We developed a screening matrix that ranked the strategies against five criteria outlined in Table 5 and determined the level of maturity on a scale of 1-3, assessing the level of evidence provided in a climate change strategy as yes / no / partial. We further embellished the five section criteria to ensure the strategies selected covered, as a collective, each of the six greenhouse gas emission inventories
Following presentation of the final policies selected with the steering group, a further consideration was made to ensure that at least one climate strategy from a local authority located outside of Scotland’s central belt was included, to ensure a better geographical spread. This resulted in the addition of Dumfries and Galloway Council to the climate boundary task.
Greenhouse gas emission boundaries and scenario emissions calculations and limitations
It is impractical to measure greenhouse gas emissions impact in real time from every chimney, exhaust, or acre of land use. GHG emission estimates are based on a series of models that estimate emissions from different sources (BEIS, 2023). The calculations performed for each of the scenario emissions is in line with international guidance (IPCC, 2006). We used government conversion factors for company reporting of greenhouse gas emissions (BEIS, 2023), Green Book supplementary guidance on the valuation of energy use and greenhouse gas emissions for appraisal (BEIS, 2023) and from IPCC guidance (IPCC, 2006). Other sources were researched from literature in the absence of standardised sets of emission factors.
The basic equation used to quantify scenario emissions is:
Equation 1: GHG scenario emissions
- Activity data is a variable that is changed by a policy. For example, a policy may look to reduce the number of kilometres travelled by private car.
- Emission factor is a constant that is used to convert the activity data to an impact. In most cases, this will be a GHG emission conversion factor.
- The impact estimate can either form a policy target or metric by which to measure success. Typically, this will be a GHG emission saving but it could also include other benefits (e.g. societal).
An example of this methodology in practice would be estimating GHG emissions from vehicles. The activity data might be the total number of kilometres travelled by that type of vehicle and the emission factor would be the amount of CO2 emitted per kilometre.
Emission factors for energy sources are either dependent on the fuel characteristics (for emissions of CO2) or how the fuel is burned, for example the size and efficiency of equipment used. For other sources, the emission factor can be dependent on a range of parameters, such as feed characteristics for livestock or the chemical reactions taking place for industrial process emissions. Emission factors are typically derived from measurements on several representative sources and the resulting factor applied to all similar sources in the UK.
This approach follows the ‘Tier 1’ approach as set out in IPCC guidance for national greenhouse gas inventories (IPCC, 2006):
|
Uncertainty → |
Tier 1 |
|
Detail and complexity → |
|
Tier 2 |
| ||
|
Tier 3 |
|
Table 5: Quantification of GHG emission impact
An example of how an emission factor was applied to an activity is converting 1 tonne of municipal waste to 1 tonne of recycled waste as part of a landfill reduction strategy. Using emission conversion factors from government conversion factors for company reporting (BEIS, 2023), 1 tonne of waste sent to landfill has a greenhouse gas intensity of 497 kgCO2e/tonne. A tonne of waste recycled has a greenhouse gas intensity of 21 kgCO2e/tonne. Comparisons made between the two indicate a net greenhouse gas benefit of avoiding waste going to landfill.
As noted in Table 5, this is a basic methodological approach, using emissions and conversion factors from representative sources not specific to Scottish local authorities. In some instances, population data has been used as a proxy where local authority specific data was not available. The activity data was also derived from a variety of sources encompassing a range of levels of confidence (see Appendix 13.2). As such there is a high level of uncertainty in the estimated projected emissions reductions.
Sources for emissions equations
As described in the methodology section above, the figures presented in Tables 3, 4, 12, 13, 14, 15 and 16 and Figures 5 and 6 used the basic equation activity data x emission factor. The emissions factors were primarily drawn from Green Book supplementary guidance: valuation of energy use and greenhouse gas emissions for appraisal (BEIS, 2023) and Guidelines for National Greenhouse Gas Inventories (IPCC, 2006). However, in some cases additional sources were drawn on. The activity data was calculated using a range of sources. The sources are presented in Table 7 below, by GHG inventory category.
Table 7: Sources for emissions calculations by inventory category
Climate change strategy register
|
Organisation |
Strategy |
Summary description (150-250 words) |
|---|---|---|
|
Aberdeen City Council |
Climate Change Plan |
This builds on Aberdeen’s route map to net zero and has many actions to reduce carbon emissions and build resilience. It includes their reported emissions, climate risks and adaptation, targets for buildings, mobility and behaviour change and how these are aligned to the SDGs. Actions include: low carbon/renewable energy installations, zero emission council fleet, upgraded street lighting and nature-based solutions for council owned land. |
|
Aberdeen City Council |
Electric Vehicle Framework |
This framework was released in 2021 and the objectives are to identify how the city’s charging infrastructure should be increased and managed, ensure that the Council’s policies and strategies facilitate a greater uptake of EVs, outline what supporting measures are required, identify the key groups that should be involved in delivering the framework and set out the costs involved in delivering the framework. Actions include to increase EV charge points, identify key groups that should be involved in delivering this framework, ensure the council’s policies and strategies facilitate a greater uptake of EVs. |
|
Aberdeen City Council |
Waste Implementation Plan and Policy |
This strategy sets out the plans to manage waste until 2025, introducing new waste infrastructure and recycling services. The main targets set in this document are; waste growth to be eliminated by 2015, for Aberdeen to be aligned with the Scottish Government’s Zero Waste Plan 2010, to introduce an organic waste collection for all households by 2016, develop facilities within the Aberdeen Area to recover resources and for no more than 5% of household waste to be landfilled by 2025. |
|
Aberdeen City Council |
Local Transport Strategy |
This strategy is broad and covers elements such as maintenance, management, support but have a focus on sustainable development and travel covering areas such as ultra low emission vehicles, school travel and climate change mitigation and adaptation. Objectives in this section include enabling development that reduces the need to travel and minimises the reliance in personal care use and facilitates sustainable travel methods of walking and cycling when land planning. Travel packs should be provided for users of workplaces and schools by developers so there is future planning for sustainable transport use. Aberdeen City has been making improvements to accessibility of EV chargers, developing a comprehensive publicly accessible charging network serving the City and the trunk and strategic road network in partnership with the Energy Saving Trust (Scotland), Transport Scotland and the Office for Low Emission Vehicles. EV charging points are also included in their LDP. |
|
Aberdeen City Council |
Local Housing Strategy |
The vision for this strategy is for the people of Aberdeen to live in good quality sustainable homes, which they can afford and that meet their needs. This strategy covers fuel poverty, climate change, homelessness issues and the condition of the housing stock. The fuel poverty targets are aligned with the national statutory targets set out by ScotGov. The key actions to achieve this include improving energy efficiency across housing, work with residents to obtain the best prices for heat and power, maximise their income and encourage them to reduce their carbon footprint. |
|
Aberdeen City Council |
Hydrogen Strategy and Action Plan |
The overall aim of this strategy is to position Aberdeen as an example for hydrogen technology by utilising transferable expertise form the oil and gas industry and the capacity for renewable energy generation in the NE of Scotland. Overall, this strategy has 7 areas covering; vehicle deployments, renewable hydrogen, refuelling infrastructure, non-transport applications, supply chain/makrey development, community and education and policy and education. Actions to deliver this plan include having a fleet of hydrogen vehicles and expand this to deploying hydrogen buses, to gain support there will be incentives such as free parking. These actions come soff the back of a second refuelling station (Aberdeen City Hydrogen Energy Storage Project). |
|
Angus |
Sustainable Energy and Climate Action Plan |
The climate action plan outlines multiple actions to be delivered across 2-6 years, with 2 actions funded through the Mercury programme. These include clean growth business units and Timmergreens low carbon housing-led regeneration scheme. Any PPIs are yet to be confirmed by the Mercury Programme and partners include Crown Estate Scotland, Scotland Innovation Centre and Zero Waste Scotland among others. There is also an action to deliver a maintenance and repair programme for historic buildings to ensure climate resilience across 6-10 years. The PPI will be the number of historic buildings retrofitted in partnership with Historic Environment Scotland and funding is yet to be confirmed. |
|
Angus |
Transition to Net Zero Action Plan |
The purpose of this Transition to Net Action Plan (2022 to 2030) is to ensure Angus Council meet the 2030 Scottish Government interim emissions reduction target of a 75% reduction in emission, enroute to the Net Zero target by 2045. From the base year of 2012/13 to the end of the financial year 2020/21, Angus Council reduced its emissions by 52.5%. Going forward to 2030, Angus Council must reduce its emissions by 5% each year to meet the 75% reduction target. The key themes identified below, will be used drive emission reductions within key operational areas to meet the 2030 interim emissions reduction target: Leadership, Governance & Procurement Buildings, Energy & Infrastructure Waste, Recycling & Circular Economy Fleet & Business Travel Land Use Adaptation Within each of these key themes, Action Plans containing emission reduction projects and initiatives have been developed. The progress of the Action Plans and Angus Councils Transition to Net Zero will be reviewed and reported annually in November (starting from 2023), alongside the Public Bodies Climate Change Duties Report. |
|
Angus |
Local Development Plan |
Sets out detailed policies and proposals to guide development and investment over a 10 year period. Reviewed every five years and used as a basis for determining planning applications. |
|
Argyll and Bute Council |
Decarbonisation Plan |
This plan is aligned with the Scottish emission reduction targets and covers waste, energy and transport consumption, transport, climate adaptation and offsetting. This includes climate commitments across these streams , the main themes are: Argyll and Bute Council to achieve 75% carbon reduction by 2030 and net zero before 2045, support a low carbon economy, lead by example and develop practices and partnerships that inspire low carbon behaviour and to make ‘Climate Friendly Argyll & Bute’ a recognised brand and underpin behaviours of council staff and customers. Targets includes a new waste strategy to transition not the Landfill Ban by 2025, additional solar installation to council assets and £2.9million external funding to active travel. |
|
Dumfries & Galloway |
Carbon Neutral Strategic Plan |
This policy consists of a wide range of quantified actions all aimed at reducing carbon emissions. The actions span across categories of; Agriculture, council buildings and streets, council transport, domestic, LULUCF, non domestic buildings, transport and waste. All individual actions within these categories have measures against them of first year of full impact of measures savings, 2025 annua savings (tCO2e) and 2030 annual savings (tCO2e). |
|
Dumfries & Galloway |
Active Travel Strategy |
Integrate the work of this strategy with that of the Regional Transport Strategy to facilitate sustainable travel: |
|
Dumfries & Galloway |
New Waste Management Infrastructure |
Proposals for new or extended waste management facilities will be expected to have given full consideration to the following criteria: National and Local waste plans; Sustainable transport principles; Environmental impacts; Site suitability. |
|
Dundee |
Climate Action Plan |
Dundee City Council are leading on four general actions with partners of SSN and Dundee Partnership. With SSN they are looking to adopt an emissions modelling tool to quantify the impact of Climate Action Plan actions, to inform future targets and present data in an interactive way but they do not have funding in place. With Dundee Partnership this local authority are looking to develop and trial a carbon budget for the Council but do not have funding in place. Dundee City Council have funding for the following two actions where they are collaborating with Dundee Partnership; Establish effective governance for the Climate Action Plan in partnership with public, private and community organisations and implement a system for monitoring and reporting progress and Develop the Sustainable Dundee communications strategy to raise awareness, communicate and engage people in the Climate Action Plan to promote prolonged behaviour change. |
|
Dundee |
Waste and Recycling Strategy Action Plan |
This strategy provides an update on actions taken to implement national policy and meet legislative requirements in Dundee and sets out the strategic direction for the Council going forward. It provides a clear action plan to ensure that waste is managed more efficiently, ensuring that every recycling opportunity is taken over the next five years in order to work towards national recycling targets and once again becoming “Scotland’s Recycling City”. |
|
East Ayrshire Council |
Local Development Plan (LDP) 2 |
LDP2 covers the whole of the East Ayrshire Council area and sets out the Council’s planning policy framework for all matters, including the environment. |
|
East Ayrshire Council |
Clean Green East Ayrshire Climate Change Strategy |
Plans on becoming a net zero council by 2030 and wider communities by 2045. |
|
East Ayrshire Council |
Ayrshire Growth Deal |
Signed in November 2020, this marked the culmination of five years’ work by the three Ayrshire councils, partner organisations and Scottish and UK Governments. It aims to deliver a series of projects to foster economic growth whilst addressing sustainability and climate change. |
|
East Ayrshire Council |
Community Renewable Energy (CoRE) |
Working closely with both the private sector and our partners at the University of Strathclyde and centred around the Cumnock area, this initiative will place East Ayrshire at the very centre of innovation and development of new approaches and technologies that are needed locally to make the move to net zero while also supporting the wider climate change aspirations for Scotland and the UK. Comprising a programme of Demonstrator Projects, CoRE has funding of £17m from the UK Government, together with £7.5m allocated by East Ayrshire Council as part of the Ayrshire Growth Deal. The projects will combine academic and commercial expertise, local resources and new and emerging technologies to move the area into a low carbon future. CoRE will include a Centre of Excellence in Cumnock and various developments linked to energy research and generation at different locations around the local area, including former mining sites. |
|
East Dunbartonshire |
Local Development Plan 2 |
The local development plan shows how the council plan to embed sustainability in their planning process. It includes policy around renewable energy and low carbon technologies including decentralised energy centres and heat networks. It also highlights in LDP policy 15 the need to set stricter requirements for carbon reduction via energy efficiency and renewable use. |
|
East Dunbartonshire |
East Dunbartonshire Sustainability and Climate Change Framework (‘SCCF’) & Sustainability and Climate Change Framework Action Plan |
Sets a framework for strategic, cross-Council approach to sustainability, including corporate carbon reduction. The policy explores several areas but fails to move away from council owned assets and fails to explore territorial ones. |
|
East Dunbartonshire |
East Dunbartonshire Council Active Travel Strategy |
Supplements the Local Transport Strategy, seeking to improve opportunities for transport powered by human physical activity as an alternative to motorised transport. It gives a more detailed explanation on the benefits of improved active travel links for ED and shows how they will be implemented. |
|
East Dunbartonshire |
East Dunbartonshire Local Transport Strategy |
Sets out the Council’s transport policy, presents Transport Planning Objectives and co-ordinates future priorities to enhance transport and travel in East Dunbartonshire including enabling a shift to environmentally, socially and economically sustainable transport. It includes are of focus such as |
|
East Lothian |
East Lothian Climate Change Strategy |
East Lothians climate plan outlines how the council want to meet their Net Zero targets. It focuses on council owned emissions and does not mention council wide emissions in much detail. It includes outcomes on the following areas |
|
East Lothian |
East Lothian Transport Strategy |
East Lothian Councils Transport policy identifies Sustainable Transport, Active Travel, Air Quality and resilient transport networks and infrastructure as key focus areas. The polices work to ensure East Lothian is well-connected, healthy and active, where active travel and sustainable transport methods are embedded in local area plans. |
|
East Lothian |
East Lothian Local Development Plan |
East Lothians Local Development Plan and supplementary planning guidance set out a framework to support and encourage low carbon lifestyles and the transition needed to achieve decarbonisation. Planners actively seek provision where necessary of green networks, paths, active travel routes, open space and Sustainable Drainage Systems in new housing developments. The LDP helps to build a picture of how East Lothian see their built environment in the future but fails to mention any quantitative impacts that this may include. |
|
East Lothian |
Active Travel Improvement Plan |
Locally, the Active Travel Improvement Plan (ATIP) is one of four supporting plans to East |
|
East Renfrewshire |
Local Development Plan 2 |
The LDP2 sets out a long-term strategy and a policy framework to guide future development, sustainable and inclusive economic growth and regeneration. Delivering sustainable development across East Renfrewshire is supported through a number of strategic policies. |
|
Edinburgh |
Climate Strategy |
This strategy sets a target for Edinburgh to be net zero and climate resilient by 2030. This strategy is based on six key actions being; improving energy efficiency in homes and buildings, a citywide programme for heat and energy generation and distribution infrastructure, decarbonising public transport, renewing climate adaptation efforts, supporting behaviour change of citizens and growing the green economy. |
|
Edinburgh |
City Plan 2030 |
The City Plan 230 is very specific to Edinburgh’s future developments. This plan includes spatial strategy, policies, proposals within the city and maps to accompany these with an action plan detailing specifics. The plan covers the city until 2032 and aims to plan the city in a way that responds to climate change, social inequalities, and commits to eliminating poverty, ensure residents have enough money to live, have opportunities to work and plentiful learning opportunities. |
|
Edinburgh |
City Mobility Plan |
The main goals of this plan is to ensure that the people, goods and services of Edinburgh are able to travel around the city in a way that is safe, sustainable, efficient and beneficial to all. The main target that the actions in this plan are centred around is for by 2030 to lower the number of kilometres travelled by car in Edinburgh to reduce by 30% aligning with the net zero target for the city of 2030. |
|
Falkirk |
Climate Emergency Update |
The Climate Emergency Strategy will set out how the Council intends to reach their organisational and national net zero target. The strategy includes points on • fleet decarbonise • Decarbonise Council, operational, building stock (will be contained within the Local Heat and Energy Efficiency Strategy); • reduce emissions from waste; and • support territorial decarbonisation (this will require some level of community engagement. The plan also mentions community owned solar growth, hydrogen innovation and EV charging which would have impacts on territorial emissions, however, does not go into much detail around data and figures. |
|
Fife |
Zero Waste Fife – Resource Strategy and Action Plan 2018-2028 |
In 2011 the Zero Waste Plan was superseded by a new strategy that addressed the obligations and opportunities presented by the Waste (Scotland) Regulations 2012. It outlined further improvements to the kerbside recycling service, and treating unsorted waste to recover accessible recycle and energy. Additional efforts focused on the development of new business avenues for Fife’s two landfill sites to maintain income levels, and the potential development of an arms-length organisation to develop and operate waste treatment infrastructure on behalf of the Council. A further revision of the Zero Waste Strategy in 2015, took account of developments in household waste recycling and the development of waste management infrastructure (anaerobic digestion facility for the treatment of organic waste). It also took account of the Scottish Government recycling targets and the implementation of the biodegradable municipal waste landfill ban in 2021. |
|
Fife |
Climate Fife: Sustainable Energy and Climate Action Plan |
Climate Fife is Fife’s response to the climate emergency. The plan sets out the strategy which underpins Climate Fife, presenting: • a vision for where Fife Council wants to be, and the themes and programmes to show where actions are needed and how this will be supported. |
|
Fife |
Fife Local Transport Strategy |
Fife Local Transport Strategy does a good job at outlining Fife’s transport future and when paired with the climate Fife plan will focus on reducing the need to travel by settlement and development planning and smart technology; promoting active travel, increasing vehicle efficiencies, making public transport more popular and increasing the uptake of ULEV (ultra-low emission vehicles) such as hybrid-electric, full-electric and hydrogen fuel vehicles. |
|
Glasgow |
Glasgow Climate Plan |
The plan aims to address the climate and ecological emergency by: |
|
Glasgow |
City Development Plan |
Glasgow’s City Development plan outlines key areas of interest for planning consent and ensures that Glasgow meets its built environment goals around sustainability. This includes lots of planning consent around buildings and homes which make up most of the document. |
|
Glasgow |
Energy and Carbon Masterplan |
The Energy and Carbon Masterplan (ECM) sets out a vision of a transformed energy economy for Glasgow that is based on low carbon and increasingly de-centralised energy sources that are better able to meet Glasgow’s energy needs and help Glasgow tackle climate change. The ECM builds and extends the current collaborative working arrangements on energy and sustainability in the city through the work of the Sustainable Glasgow initiative and is a key strategy in helping deliver Glasgow’s aspirations to become one of Europe’s most sustainable cities. |
|
Glasgow |
Glasgow City Council Resource and Recycling Strategy |
Glasgow City Council Resource and Recycling Strategy |
|
Glasgow |
Glasgow Transport Strategy |
Glasgow Transport Strategy 2022 looks to deliver and expand on the following objectives: |
|
Highlands |
Carbon CLEVER |
Highland council-led initiative with a target of a carbon neutral Inverness in a low carbon Highlands by 2025 |
|
Inverclyde |
Inverclyde Net Zero Strategy |
The net zero strategy has two targets, a delivery of carbon footprint reductions of 73% between 2021-2030 |
|
Inverclyde |
Inverclyde Waste Strategy |
The Council has implemented a large waste minimisation and recycling programme in terms of both infrastructure and promotion. The programme included kerbside recycling for various types of waste, education on how to reduce and recycle waste and generating energy from waste and circular economy principals. |
|
Midlothian |
Midlothian Climate Change Strategy |
The strategy sets out a clear vision and set of objectives, to highlight what we can, and must do to combat climate change and highlights some of the challenges to achieving this. It focuses on a number of themes including Energy Efficiency; Recycling & Waste; Sustainable Development; Sustainable Travel; Business Processes; Carbon Management; Governance & Management; and Risk. |
|
Midlothian |
Midlothian Active Travel Strategy |
Promotes an Active Travel culture where walking and cycling become the normal choice for everyday journeys. The plan outlines future planning around walking and cycling routes, increasing safety for non-car users and school walking safety. |
|
Moray |
Climate Change Strategy |
This Climate Change Strategy identifies the key areas that the Council will prioritise within available resources to not only help reduce its own impact on the environment, but how it will seek to influence and encourage the wider community. The Strategy and Action plan detail a range of measures that will contribute directly to achieving key outcomes. Details of how the key actions will be delivered, along with timescales, targets and resource requirements, will be further developed and defined, and be subject to regular review. This Climate Change Strategy comprises the council’s response to the national and international priority of tackling climate change and shall be taken account of in all future planning and policy work undertaken by Moray Council. The policy lacks quantitative data. |
|
Moray |
Local Development Plan |
The Moray Local Development Plan (MLDP) 2020 sets how the Council sees the MLDP area developing over the next 10 years and beyond and covers the administrative area of Moray Council, minus the southern part which falls within the Cairngorm National Park which prepares its own LD. Alongside National Planning Framework 4 (NPF4), the MLDP forms the Development Plan for Moray. |
|
North Ayrshire |
Environmental Sustainability and Climate Change Strategy |
The North Ayrshire climate strategy outlines the key focus areas for them to meet net zero. It includes both territorial emissions and council owned in great detail. Some of the key areas include: •Progress and monitor the Net Zero Carbon Roadmap, with milestones to be reported quarterly to the Head of Service and to Cabinet every six months Council’s through the corporate performance monitoring framework |
|
North Ayrshire |
Electric Vehicles Strategy |
The aim of the Council’s Electric Vehicle strategy is to increase the number of EVs being used throughout North Ayrshire by creating a robust network of EV charge points. The strategic objectives of the EV Strategy are as follows: |
|
North Ayrshire |
Zero Waste Strategy |
The Council were 1 of only 9 Scottish local authorities who exceeded the Scottish Government’s Zero Waste Plan target to recycle over 50% of household waste by 2013, and are currently one of the top performing Councils for recycling in Scotland, highlighting the success of the previous strategy due to their previous strategy. This new strategy outlines the following key areas they want to achieve: Recycle 60% of household waste by 2020; • Cease disposal of Biodegradable Waste to landfill by 31st December 2020; • Recycle 70% of all waste by 2025; and • Reduce the waste disposed of to landfill to a maximum of 5% by 2025. The strategy remains focussed on the waste hierarchy, which identifies waste prevention as the most preferred option, followed by re-use, recycling, and treatment/energy recovery, and then disposal as the final option. |
|
North Ayrshire |
Local Development Plan 2 |
The LDP sets out the planning and built environmental context for the council region. The plans are based around buildings, spaces and infrastructure and does not outline how they will be achieved. |
|
North Lanarkshire |
Active Travel Policy |
The strategy includes targets to work towards a council with active travel provisions with different interventions necessary to achieve each strategy aspect. The strategy focuses on fostering collaboration across the council’s remit and suggests exploring feasibility of developing cross boundary links for active travel with other local authorities and partners. |
|
Orkney Islands |
Orkney Sustainable Energy Strategy |
Developed in partnership with Orkney Islands Council, Highlands and Islands Enterprise (HIE), Community Energy Scotland and the OREF (Orkney Renewable Energy Forum) working to reduce island’s dependency on fossil fuels. |
|
Orkney Islands |
Sustainable & Active Travel |
Contribute to the health and wellbeing of the people of Orkney. |
|
Perth & Kinross |
Climate Change Strategy and Action Plan |
The strategy covers: transport, buildings and energy, business and industry, waste and circular economy, land use, education and engagement, climate resilience. Within each theme there are quantified targets and 4-5 sub-themes with KPIs attached to measure progress against a baseline value. Each category includes a exemplar case study of how this policy aspect will be progressed. |
|
Renfrewshire |
Plan for Net Zero (Phase 2) |
The plan has five key actions: 1. detailed phase plan to 2030, 2. quantified delivery plans, 3. verifying, adopting, and updating emissions modelling tool, 4. developing a carbon budget for Renfrewshire council, 5. developing an adaptation plan for Renfrewshire. The policy categories cover: clean energy, sustainable transport, circular economy, connected communities and resilient place. |
|
Scottish Borders |
Climate Change Route Map |
The climate change route map emphasises collaboration, talking about climate risks/vulnerabilities and undertaking strategic environmental assessments. The categories covered are: resilience, transport use, nature based solutions, energy, waste management, adaptation, behaviour change. The policy document outlines progress to date up to 2021. |
|
Shetland Islands |
Shetland’s Climate Change Strategy |
Shetland Partnerships overarching framework of Shetland’s strategic plan to address climate change. Content currently under development by Shetland Partnership Climate Change Steering Group. |
|
South Ayrshire |
Sustainable Development & Climate Change Framework |
The sustainability strategy has three key themes: 1. Sustainable Council: reducing the corporate GHG emissions and improving the wider environment, 2. Sustainable environment: protecting and enhancing the environment while improving the health, well-being and livelihoods of local communities, and 3. Sustainable Community: supporting local communities to limit GHG emissions, adapt to climate change impacts and improve their local environment. |
|
South Lanarkshire |
Sustainable Development and Climate Change Strategy 2 |
The policy builds upon their 2017 to 2022 climate change strategy and covers health and wellbeing, climate justice, transport, energy, greenspaces, community, waste, protect environment, nature-based solutions, green economy, circular economy, and business transition. Each category has key actions listed out, with progress to-date outlined within document and 5 year improvement actions specified to reach each aim. |
|
Stirling |
Climate and Nature Emergency Plan |
The strategy covers: energy use and generation, transport, resource efficiency, nature and biodiversity, and climate adaptation. It lists ~5 key priorities for each objective, outlines progress to date, includes final targets and interim targets and measures of progression. The national ScotGov targets have been translated to be applicable to Stirling Council area and Stirling Council specifically, and they have used 2005 as their GHG emission base year from which to measure any progress. The policy also notes which other council policies are required to reach the objectives (e.g., the local development plan is integral to advance the objectives listed in the energy use and generation section of the policy document. |
|
West Dunbartonshire |
Climate Change Action Plan |
This plan implements our Climate Change Strategy through a series of high-level actions for the short, medium and long term, setting out the need for action and a high-level framework. |
|
West Dunbartonshire |
Climate Change Strategy |
An overarching Strategy setting the foundation for a plan of action for 2021-22 and beyond and is a response to Scotland’s Climate Emergency and 2045 net zero carbon reduction target. |
|
West Dunbartonshire |
The West Dunbartonshire Energy Centre |
Scotland’s largest water source heat pump installation to date to help Council transit towards net zero. £20 million project, of which the £6.1 million came from Low Carbon Infrastructure Transition Programme |
|
West Dunbartonshire |
Local Development Plan 2 (LDP2) |
Seeks to ensure that new development in West Dunbartonshire is aligned with the goal to achieve net zero through net zero carbon buildings, clean energy generation, green infrastructure, etc. |
|
West Dunbartonshire |
WDC Local Housing Strategy |
Details how the Council and stakeholders will address and support housing, including fuel poverty, etc. |
|
West Lothian |
Climate Change Strategy |
This Strategy aims to ensure that activities to tackle climate change to contribute to the achievement of the outcomes identified within the council’s Corporate Plan (2018-2023) and the West Lothian Local Outcomes Improvement Plan (LOIP) (2013-23). |
|
West Lothian |
Adaptation Action Plan |
The Action Plan identifies seven adaptation outcomes which the council will work towards through implementing over 70 actions over the next 6 years (2022 -28). |
|
West Lothian |
West Lothian Local Outcomes Improvement Plan (LOIP) |
The mechanism by which Community Planning Partnerships deliver improved outcomes for their communities. They are based on a clear understanding of local needs and reflect agreed local priorities, as well as the National Performance Framework developed by the Scottish Government. |
Quantifying impact
In the development of the emission boundaries, we applied two measures of assessing impact: Likelihood and Magnitude.
Likelihood
Likelihood is defined as the probability or chance that a given policy will achieve its intended impact or target. We have applied IPCC Guidance (IPCC, 2006) to determine likelihood as outlined in Table 8.
|
Likelihood |
Description |
Probability |
|
Very Likely |
Reason to believe the effect will happen (or did happen) because of the policy. |
90-100% |
|
Likely |
Reason to believe the effect will probably happen (or probably happened) because of the policy. |
66-90% |
|
Possible |
Reason to believe the effect may or may not happen (or may or may not have happened) because of the policy. About as likely as not. Cases where the likelihood is unknown or cannot be determined should be considered possible. |
33-66% |
|
Unlikely |
Reason to believe the effect probably will not happen (or probably did not happen) as a result of the policy. |
10-33% |
|
Very unlikely |
Reason to believe the effect will not happen (or did not happen) because of the policy. |
0-10% |
There are several considerations made when assessing the likelihood, a policy has in achieving its intended outcomes.
- Sphere of control: a measure of how much control a local authority has over whether action is taken against a policy. This ranges on a scale from absolute where a policy is enacted through legislation, through to voluntary where a policy results in stakeholders making a pledge.
- Capacity and capability: whether the local authority have the resources it needs to actively measure and enforce the provisions within a policy once it is active.
- Timescale: the impacts of policies may require consistent action taken over several years, or even decades. This can prove difficult as socioeconomic needs shift over time meaning that policies may also need to adapt over time, changing impacts and targets.
An example of a policy that is ‘very likely’ to meet its intended targets is a Low Emission Zone whereby a local authority has absolute ability to determine the classification of vehicles that enter its zone. Compare this to a policy improving active travel provision whereby the intended benefits are somewhat dependent on stakeholders enacting the policy out of their own free-will.
Magnitude
Magnitude is a simple measure of a policy’s potential impact on an inventory’s emissions. Following IPCC guidance (IPCC, 2006), we have set the following impact boundaries to rank the valued policies:
|
Magnitude |
Description |
Impact |
|---|---|---|
|
Major |
The effect significantly influences the effectiveness of the policy or action. The change in GHG emissions or removals is likely to be significant in size. |
>10% |
|
Moderate |
The effect influences the effectiveness of the policy or action. The change in GHG emissions or removals could be significant in size. |
1-10% |
|
Minor |
The effect is inconsequential to the effectiveness of the policy or action. The change in GHG emissions or removals is insignificant in size. |
<1% |
Policy descriptions
Table 10: Descriptions of 13 climate policies collated from six chosen local authorities for valuation, including example targets and KPIs set by the local authorities
|
Inventory / Policy |
Description |
Example targets and KPIs from local authorities |
|---|---|---|
|
Agriculture | ||
|
Changes to Agricultural Practices |
Changes in agricultural methods to reduce the use of nitrogen fertilisers, changes in animal feeds, reduced intensity of livestock production and improvements in waste management. |
This policy consists of a wide range of quantified actions all aimed at reducing carbon emissions. All individual actions within these categories have measures against them of first year of full impact of measures savings, 2025 annual savings (tCO2e) and 2030 annual savings (tCO2e). |
|
LULUCF | ||
|
Greening of derelict land |
Identify and utilise Vacant and Derelict Land for greening and rewilding in combination with renewable energy generation measures and reducing flood risk. |
% VDL used for renewable energy generation |
|
Peatland restoration |
Increase investment in peatland restoration in the region to enhance biodiversity and increase capacity for carbon sequestration. |
Percentage emissions reduction. 20,000 hectares restored per annum 250,000 hectares restored by 2030 |
|
Reforestation (1 million new trees per local authority) |
Protecting and enhancing existing ecosystems and biodiversity through reforestation. |
Plant 80,000 new trees by 2023; 360,000 by 2030 and 1,000,000 by 2045. |
|
Transport | ||
|
Active travel |
Encouraging walking and cycling for shorter journeys rather than the use of personal cars. |
Many journeys are relatively short and could easily be undertaken by walking or cycling. In 2017 |
|
Homeworking |
Promote homeworking and videoconferencing to reduce traffic congestion, as part of a range of effective working practices. |
Number of staff working remotely. |
|
Low Emission Zone |
Reduce emissions from transport in city centres and improving air quality by expanding low emissions zone. |
Percentage transport emissions |
|
Public transport |
Work with transport stakeholders in the city to support rapid transition to cleaner public transport as part of the City’s Low Emissions Zone. |
% change in PM 10 at each monitoring location, averaged over a three-year period. |
|
Fleet vehicles |
Deliver rapid transition of council’s fleet to electric, supporting the city’s existing fleet strategy’s target of becoming low carbon by 2030. |
Share of low emission vehicles in the overall modal split – % change |
|
Council Business Travel |
Replace modes of council business transport with low emission alternatives. |
45% reduction in transport emissions by 2030 against a 4,450tCO2 baseline. |
|
LEV Taxi Licences |
Make it compulsory for taxi licences granted depending on whether the mode of transport is a low emissions vehicle. |
100% of new taxi licences that are EV by 2032 |
|
Waste | ||
|
Waste Reduction Strategy |
Detailing how the region will help reduce, reuse and recycle, detailing corporate standards, targets and staff guidance for our waste activities, including improving infrastructure. |
By 2025 – 95% reduction of landfill waste (as part of a suite of other initiatives) |
|
Council Waste Reduction |
Reduce the amount of council-generated waste going to landfill. |
70% reduction of waste going to land fill by 2030 against a 892t 2019 baseline |
Valuing greenhouse gas emissions
Table 21: Total territorial greenhouse gas emissions (ktCO2e), by inventory (BEIS, 2022)
|
Local authority |
Territorial greenhouse gas emissions (ktCO2e) | ||||||
|---|---|---|---|---|---|---|---|
|
Agriculture |
Buildings |
Industry |
LULUCF |
Transport |
Waste |
Total | |
|
Aberdeen City |
32 |
585 |
236 |
31 |
305 |
30 |
1,218 |
|
Aberdeenshire |
1,083 |
579 |
244 |
357 |
613 |
117 |
2,993 |
|
Angus |
264 |
249 |
117 |
389 |
235 |
9 |
1,263 |
|
Argyll and Bute |
297 |
198 |
85 |
-532 |
186 |
23 |
257 |
|
City of Edinburgh |
37 |
1,203 |
213 |
70 |
640 |
73 |
2,236 |
|
Clackmannanshire |
24 |
103 |
290 |
24 |
66 |
5 |
512 |
|
Dumfries and Galloway |
1,555 |
350 |
185 |
-239 |
571 |
17 |
2,439 |
|
Dundee City |
5 |
353 |
63 |
23 |
184 |
14 |
642 |
|
East Ayrshire |
330 |
238 |
78 |
-31 |
229 |
11 |
855 |
|
East Dunbartonshire |
27 |
237 |
28 |
20 |
113 |
40 |
465 |
|
East Lothian |
112 |
217 |
552 |
194 |
210 |
29 |
1,313 |
|
East Renfrewshire |
43 |
196 |
9 |
23 |
147 |
3 |
421 |
|
Falkirk |
61 |
308 |
1,454 |
79 |
327 |
68 |
2,298 |
|
Fife |
308 |
741 |
1,143 |
345 |
584 |
138 |
3,260 |
|
Glasgow City |
13 |
1,293 |
380 |
68 |
761 |
196 |
2,710 |
|
Highland |
638 |
526 |
458 |
110 |
598 |
80 |
2,410 |
|
Inverclyde |
31 |
151 |
46 |
3 |
106 |
3 |
340 |
|
Midlothian |
70 |
189 |
48 |
52 |
137 |
18 |
513 |
|
Moray |
261 |
228 |
313 |
-167 |
162 |
37 |
834 |
|
Na h-Eileanan Siar |
81 |
66 |
22 |
951 |
42 |
22 |
1,184 |
|
North Ayrshire |
135 |
258 |
349 |
-32 |
151 |
30 |
891 |
|
North Lanarkshire |
79 |
636 |
313 |
90 |
736 |
78 |
1,932 |
|
Orkney Islands |
239 |
44 |
14 |
43 |
29 |
4 |
373 |
|
Perth and Kinross |
408 |
353 |
89 |
-140 |
515 |
81 |
1,307 |
|
Renfrewshire |
50 |
370 |
120 |
35 |
301 |
27 |
903 |
|
Scottish Borders |
767 |
251 |
103 |
-103 |
261 |
13 |
1,292 |
|
Shetland Islands |
107 |
42 |
34 |
572 |
43 |
4 |
801 |
|
South Ayrshire |
296 |
239 |
168 |
-55 |
209 |
10 |
867 |
|
South Lanarkshire |
341 |
652 |
208 |
-27 |
666 |
33 |
1,874 |
|
Stirling |
182 |
204 |
178 |
-150 |
249 |
45 |
709 |
|
West Dunbartonshire |
21 |
179 |
46 |
9 |
127 |
7 |
390 |
|
West Lothian |
89 |
362 |
211 |
48 |
373 |
67 |
1,150 |
|
Total |
7,985 |
11,600 |
7,798 |
2,059 |
9,878 |
1,333 |
40,653 |
Table 32: Estimated potential impact on greenhouse gas emissions (ktCO2e) from Agriculture and LULUCF policies
|
Local authority |
Agriculture |
LULUCF | ||||||
|---|---|---|---|---|---|---|---|---|
|
Total Agriculture emissions |
Changes to Agricultural Practices |
Total policy impact |
Total LULUCF emissions |
Greening of derelict land |
Peatland restoration |
Reforestation (1 million new trees per LA) |
Total policy impact | |
|
Aberdeen City |
32 |
-6 |
-6 |
31 |
-7 |
0 |
-25 |
-32 |
|
Aberdeenshire |
1,083 |
-193 |
-193 |
357 |
-15 |
-67 |
-25 |
-107 |
|
Angus |
264 |
-47 |
-47 |
389 |
-27 |
-1 |
-25 |
-52 |
|
Argyll and Bute |
297 |
-53 |
-53 |
-532 |
-11 |
-189 |
-25 |
-225 |
|
City of Edinburgh |
37 |
-7 |
-7 |
70 |
-12 |
-1 |
-25 |
-37 |
|
Clackmannanshire |
24 |
-5 |
-5 |
24 |
-60 |
-70 |
-25 |
-155 |
|
Dumfries and Galloway |
1,555 |
-275 |
-275 |
-239 |
-34 |
0 |
-25 |
-59 |
|
Dundee City |
5 |
-1 |
-1 |
23 |
-448 |
-12 |
-25 |
-485 |
|
East Ayrshire |
330 |
-58 |
-58 |
-31 |
-14 |
0 |
-25 |
-39 |
|
East Dunbartonshire |
27 |
-5 |
-5 |
20 |
-16 |
0 |
-25 |
-41 |
|
East Lothian |
112 |
-20 |
-20 |
194 |
-10 |
-2 |
-25 |
-36 |
|
East Renfrewshire |
43 |
-8 |
-8 |
23 |
-33 |
0 |
-25 |
-58 |
|
Falkirk |
61 |
-11 |
-11 |
79 |
-53 |
-37 |
-25 |
-115 |
|
Fife |
308 |
-50 |
-50 |
345 |
-122 |
-3 |
-25 |
-150 |
|
Glasgow City |
13 |
-2 |
-2 |
68 |
-199 |
-1 |
-25 |
-225 |
|
Highland |
638 |
-113 |
-113 |
110 |
-250 |
-1,214 |
-25 |
-1,489 |
|
Inverclyde |
31 |
-4 |
-4 |
3 |
-29 |
-1 |
-25 |
-55 |
|
Midlothian |
70 |
-12 |
-12 |
52 |
-22 |
-36 |
-25 |
-83 |
|
Moray |
261 |
-47 |
-47 |
-167 |
-3 |
-28 |
-25 |
-56 |
|
Na h-Eileanan Siar |
81 |
-15 |
-15 |
951 |
-2 |
-434 |
-25 |
-461 |
|
North Ayrshire |
135 |
-24 |
-24 |
-32 |
-249 |
-7 |
-25 |
-280 |
|
North Lanarkshire |
79 |
-14 |
-14 |
90 |
-239 |
-49 |
-25 |
-313 |
|
Orkney Islands |
239 |
-42 |
-42 |
43 |
-7 |
-149 |
-25 |
-181 |
|
Perth and Kinross |
408 |
-74 |
-74 |
-140 |
-8 |
-14 |
-25 |
-47 |
|
Renfrewshire |
50 |
-11 |
-11 |
35 |
-51 |
-1 |
-25 |
-76 |
|
Scottish Borders |
767 |
-133 |
-133 |
-103 |
-13 |
-13 |
-25 |
-51 |
|
Shetland Islands |
107 |
-18 |
-18 |
572 |
-1 |
-134 |
-25 |
-160 |
|
South Ayrshire |
296 |
-53 |
-53 |
-55 |
-20 |
-3 |
-25 |
-48 |
|
South Lanarkshire |
341 |
-61 |
-61 |
-27 |
-79 |
-48 |
-25 |
-152 |
|
Stirling |
182 |
-32 |
-32 |
-150 |
-28 |
-11 |
-25 |
-63 |
|
West Dunbartonshire |
21 |
-4 |
-4 |
9 |
-31 |
-1 |
-25 |
-56 |
|
West Lothian |
89 |
-16 |
-16 |
48 |
-77 |
-4 |
-25 |
-106 |
|
Total |
7,985 |
-1,416 |
-1,416 |
2,059 |
-2,167 |
-2,530 |
-800 |
-5,497 |
Table 13: Estimated impact on greenhouse gas emissions (ktCO2e) from Transport policies
|
Local authority |
Transport | ||||||||
|---|---|---|---|---|---|---|---|---|---|
|
Total Transport emissions |
Active travel |
Homeworking |
Low Emission Zone |
Public transport |
Fleet vehicles |
Council Business Travel |
LEV Taxi Licences |
Total | |
|
Aberdeen City |
305 |
-33 |
-0.01 |
-5 |
-7 |
-5 |
-10 |
-3 |
-99 |
|
Aberdeenshire |
613 |
-38 |
-0.01 |
-6 |
-8 |
-6 |
-11 |
-2 |
-112 |
|
Angus |
235 |
-17 |
-0.01 |
-3 |
-4 |
-3 |
-5 |
-1 |
-49 |
|
Argyll and Bute |
186 |
-12 |
0.00 |
-2 |
-3 |
-2 |
-4 |
-1 |
-37 |
|
City of Edinburgh |
640 |
-76 |
-0.03 |
-12 |
-16 |
-12 |
-22 |
0 |
-221 |
|
Clackmannanshire |
66 |
-7 |
0.00 |
-1 |
-2 |
-1 |
-2 |
-1 |
-22 |
|
Dumfries and Galloway |
571 |
-22 |
-0.01 |
-3 |
-5 |
-3 |
-6 |
-2 |
-65 |
|
Dundee City |
184 |
-21 |
-0.01 |
-3 |
-5 |
-3 |
-6 |
-1 |
-63 |
|
East Ayrshire |
229 |
-18 |
-0.01 |
-3 |
-4 |
-3 |
-5 |
-2 |
-53 |
|
East Dunbartonshire |
113 |
-16 |
-0.01 |
-3 |
-3 |
-2 |
-5 |
-1 |
-46 |
|
East Lothian |
210 |
-16 |
-0.01 |
-3 |
-3 |
-2 |
-5 |
-1 |
-47 |
|
East Renfrewshire |
147 |
-14 |
-0.01 |
-2 |
-3 |
-2 |
-4 |
-12 |
-52 |
|
Falkirk |
327 |
-23 |
-0.01 |
-4 |
-5 |
-4 |
-7 |
0 |
-68 |
|
Fife |
584 |
-54 |
-0.02 |
-9 |
-12 |
-9 |
-16 |
-2 |
-159 |
|
Glasgow City |
761 |
-92 |
-0.04 |
-15 |
-20 |
-14 |
-27 |
-2 |
-268 |
|
Highland |
598 |
-34 |
-0.01 |
-6 |
-7 |
-5 |
-10 |
-17 |
-116 |
|
Inverclyde |
106 |
-11 |
0.00 |
-2 |
-2 |
-2 |
-3 |
-2 |
-35 |
|
Midlothian |
137 |
-14 |
-0.01 |
-2 |
-3 |
-2 |
-4 |
-1 |
-40 |
|
Moray |
162 |
-14 |
-0.01 |
-2 |
-3 |
-2 |
-4 |
-1 |
-41 |
|
Na h-Eileanan Siar |
42 |
-4 |
0.00 |
-1 |
-1 |
-1 |
-1 |
-1 |
-12 |
|
North Ayrshire |
151 |
-19 |
-0.01 |
-3 |
-4 |
-3 |
-6 |
-1 |
-57 |
|
North Lanarkshire |
736 |
-49 |
-0.02 |
-8 |
-11 |
-8 |
-15 |
-6 |
-149 |
|
Orkney Islands |
29 |
-3 |
0.00 |
-1 |
-1 |
-1 |
-1 |
0 |
-10 |
|
Perth and Kinross |
515 |
-22 |
-0.01 |
-4 |
-5 |
-3 |
-7 |
-1 |
-65 |
|
Renfrewshire |
301 |
-26 |
-0.01 |
-4 |
-6 |
-4 |
-8 |
-4 |
-79 |
|
Scottish Borders |
261 |
-17 |
-0.01 |
-3 |
-4 |
-3 |
-5 |
-1 |
-49 |
|
Shetland Islands |
43 |
-3 |
0.00 |
-1 |
-1 |
-1 |
-1 |
0 |
-10 |
|
South Ayrshire |
209 |
-16 |
-0.01 |
-3 |
-4 |
-3 |
-5 |
-1 |
-48 |
|
South Lanarkshire |
666 |
-47 |
-0.02 |
-8 |
-10 |
-7 |
-14 |
-6 |
-141 |
|
Stirling |
249 |
-14 |
-0.01 |
-2 |
-3 |
-2 |
-4 |
-1 |
-40 |
|
West Dunbartonshire |
127 |
-13 |
0.00 |
-2 |
-3 |
-2 |
-4 |
-1 |
-38 |
|
West Lothian |
373 |
-27 |
-0.01 |
-4 |
-6 |
-4 |
-8 |
-2 |
-79 |
|
Total |
9,878 |
-793 |
-0.31 |
-129 |
-169 |
-124 |
-235 |
-76 |
-1,527 |
Table 44: Estimated potential impact on greenhouse gas emissions (ktCO2e) from Waste policies
|
Local authority |
Waste | |||
|---|---|---|---|---|
|
Total Waste emissions |
Waste Reduction Strategy |
Council Waste Reduction |
Total | |
|
Aberdeen City |
30 |
-16 |
-0.86 |
-17 |
|
Aberdeenshire |
117 |
-27 |
-0.98 |
-28 |
|
Angus |
9 |
-8 |
-0.44 |
-8 |
|
Argyll and Bute |
23 |
-11 |
-0.33 |
-12 |
|
City of Edinburgh |
73 |
-47 |
-1.96 |
-49 |
|
Clackmannanshire |
5 |
-4 |
-0.20 |
-4 |
|
Dumfries and Galloway |
17 |
-22 |
-0.57 |
-23 |
|
Dundee City |
14 |
-16 |
-0.56 |
-17 |
|
East Ayrshire |
11 |
-10 |
-0.46 |
-10 |
|
East Dunbartonshire |
40 |
-9 |
-0.41 |
-9 |
|
East Lothian |
29 |
-8 |
-0.41 |
-9 |
|
East Renfrewshire |
3 |
-5 |
-0.36 |
-5 |
|
Falkirk |
68 |
-12 |
-0.61 |
-13 |
|
Fife |
138 |
-38 |
-1.41 |
-39 |
|
Glasgow City |
196 |
-78 |
-2.38 |
-81 |
|
Highland |
80 |
-29 |
-0.90 |
-30 |
|
Inverclyde |
3 |
-5 |
-0.29 |
-5 |
|
Midlothian |
18 |
-8 |
-0.35 |
-8 |
|
Moray |
37 |
-7 |
-0.36 |
-7 |
|
Na h-Eileanan Siar |
22 |
-5 |
-0.10 |
-5 |
|
North Ayrshire |
30 |
-10 |
-0.51 |
-10 |
|
North Lanarkshire |
78 |
-35 |
-1.29 |
-37 |
|
Orkney Islands |
4 |
-4 |
-0.08 |
-4 |
|
Perth and Kinross |
81 |
-13 |
-0.58 |
-14 |
|
Renfrewshire |
27 |
-14 |
-0.68 |
-15 |
|
Scottish Borders |
13 |
-10 |
-0.44 |
-11 |
|
Shetland Islands |
4 |
-3 |
-0.09 |
-3 |
|
South Ayrshire |
10 |
-8 |
-0.43 |
-9 |
|
South Lanarkshire |
33 |
-30 |
-1.22 |
-32 |
|
Stirling |
45 |
-7 |
-0.35 |
-7 |
|
West Dunbartonshire |
7 |
-9 |
-0.33 |
-9 |
|
West Lothian |
67 |
-12 |
-0.69 |
-12 |
|
Total |
1,333 |
-520 |
-20.62 |
-541 |
Table 15: Estimated potential impact on total territorial greenhouse gas emissions (ktCO2e), by inventory
|
|
Territorial greenhouse gas emissions post policy (ktCO2e) | ||||||
|
Local authority | |||||||
|
Agriculture |
Buildings |
Industry |
LULUCF |
Transport |
Waste |
Total | |
|
Aberdeen City |
25 |
585 |
236 |
-1 |
241 |
13 |
1,100 |
|
Aberdeenshire |
889 |
579 |
244 |
250 |
541 |
89 |
2,593 |
|
Angus |
217 |
249 |
117 |
337 |
203 |
0 |
1,124 |
|
Argyll and Bute |
245 |
198 |
85 |
-757 |
162 |
11 |
-57 |
|
City of Edinburgh |
30 |
1,203 |
213 |
33 |
501 |
24 |
2,003 |
|
Clackmannanshire |
19 |
103 |
290 |
-131 |
51 |
0 |
334 |
|
Dumfries and Galloway |
1,280 |
350 |
185 |
-298 |
529 |
-5 |
2,041 |
|
Dundee City |
4 |
353 |
63 |
-462 |
144 |
-2 |
100 |
|
East Ayrshire |
272 |
238 |
78 |
-70 |
195 |
0 |
714 |
|
East Dunbartonshire |
22 |
237 |
28 |
-22 |
84 |
31 |
380 |
|
East Lothian |
92 |
217 |
552 |
157 |
179 |
20 |
1,218 |
|
East Renfrewshire |
35 |
196 |
9 |
-35 |
109 |
-2 |
312 |
|
Falkirk |
50 |
308 |
1,454 |
-36 |
284 |
56 |
2,115 |
|
Fife |
258 |
741 |
1,143 |
195 |
483 |
99 |
2,919 |
|
Glasgow City |
11 |
1,293 |
380 |
-157 |
591 |
115 |
2,232 |
|
Highland |
526 |
526 |
458 |
-1,379 |
518 |
50 |
699 |
|
Inverclyde |
27 |
151 |
46 |
-53 |
83 |
-2 |
253 |
|
Midlothian |
57 |
189 |
48 |
-31 |
112 |
10 |
385 |
|
Moray |
214 |
228 |
313 |
-223 |
136 |
29 |
699 |
|
Na h-Eileanan Siar |
66 |
66 |
22 |
490 |
35 |
17 |
696 |
|
North Ayrshire |
111 |
258 |
349 |
-312 |
114 |
20 |
540 |
|
North Lanarkshire |
65 |
636 |
313 |
-223 |
639 |
41 |
1,471 |
|
Orkney Islands |
197 |
44 |
14 |
-138 |
22 |
0 |
139 |
|
Perth and Kinross |
334 |
353 |
89 |
-187 |
474 |
68 |
1,130 |
|
Renfrewshire |
38 |
370 |
120 |
-41 |
249 |
12 |
749 |
|
Scottish Borders |
634 |
251 |
103 |
-154 |
230 |
2 |
1,065 |
|
Shetland Islands |
89 |
42 |
34 |
412 |
37 |
0 |
614 |
|
South Ayrshire |
242 |
239 |
168 |
-103 |
178 |
2 |
727 |
|
South Lanarkshire |
280 |
652 |
208 |
-178 |
575 |
2 |
1,538 |
|
Stirling |
150 |
204 |
178 |
-213 |
224 |
38 |
580 |
|
West Dunbartonshire |
17 |
179 |
46 |
-47 |
102 |
-2 |
296 |
|
West Lothian |
73 |
362 |
211 |
-58 |
323 |
55 |
965 |
|
Total |
6,570 |
11,600 |
7,798 |
-3,438 |
8,351 |
792 |
31,672 |
Table 56: Percentage change in territorial greenhouse gas emissions (ktCO2e) from implementing policies
|
|
Percentage change in territorial greenhouse gas emissions | ||||||
|
Local authority | |||||||
|
Agriculture |
Buildings |
Industry |
LULUCF |
Transport |
Waste |
Total | |
|
Aberdeen City |
-20.0% |
0.0% |
0.0% |
-101.9% |
-20.8% |
-56.1% |
-9.7% |
|
Aberdeenshire |
-17.9% |
0.0% |
0.0% |
-30.1% |
-11.7% |
-23.8% |
-13.4% |
|
Angus |
-17.8% |
0.0% |
0.0% |
-13.5% |
-13.4% |
-94.4% |
-11.0% |
|
Argyll and Bute |
-17.7% |
0.0% |
0.0% |
42.3% |
-12.8% |
-51.3% |
-122.0% |
|
City of Edinburgh |
-18.3% |
0.0% |
0.0% |
-53.5% |
-21.7% |
-66.9% |
-10.4% |
|
Clackmannanshire |
-19.6% |
0.0% |
0.0% |
-637.1% |
-22.1% |
-92.1% |
-34.9% |
|
Dumfries and Galloway |
-17.7% |
0.0% |
0.0% |
24.6% |
-7.3% |
-130.4% |
-16.3% |
|
Dundee City |
-22.3% |
0.0% |
0.0% |
-2113.7% |
-21.7% |
-117.2% |
-84.5% |
|
East Ayrshire |
-17.5% |
0.0% |
0.0% |
126.5% |
-15.0% |
-95.5% |
-16.6% |
|
East Dunbartonshire |
-18.3% |
0.0% |
0.0% |
-211.1% |
-26.1% |
-22.8% |
-18.3% |
|
East Lothian |
-18.3% |
0.0% |
0.0% |
-18.6% |
-14.5% |
-29.8% |
-7.3% |
|
East Renfrewshire |
-18.5% |
0.0% |
0.0% |
-255.7% |
-25.6% |
-175.4% |
-25.9% |
|
Falkirk |
-18.2% |
0.0% |
0.0% |
-146.3% |
-13.1% |
-18.9% |
-7.9% |
|
Fife |
-16.3% |
0.0% |
0.0% |
-43.5% |
-17.3% |
-28.4% |
-10.4% |
|
Glasgow City |
-16.7% |
0.0% |
0.0% |
-330.9% |
-22.4% |
-41.3% |
-17.7% |
|
Highland |
-17.7% |
0.0% |
0.0% |
-1354.6% |
-13.3% |
-37.4% |
-71.0% |
|
Inverclyde |
-11.7% |
0.0% |
0.0% |
-2100.5% |
-21.6% |
-158.5% |
-25.5% |
|
Midlothian |
-17.6% |
0.0% |
0.0% |
-160.3% |
-18.8% |
-44.6% |
-25.1% |
|
Moray |
-17.8% |
0.0% |
0.0% |
33.3% |
-16.0% |
-19.9% |
-16.3% |
|
Na h-Eileanan Siar |
-18.0% |
0.0% |
0.0% |
-48.5% |
-18.2% |
-21.2% |
-41.2% |
|
North Ayrshire |
-17.9% |
0.0% |
0.0% |
876.1% |
-24.3% |
-33.5% |
-39.4% |
|
North Lanarkshire |
-17.4% |
0.0% |
0.0% |
-346.8% |
-13.1% |
-47.1% |
-23.8% |
|
Orkney Islands |
-17.7% |
0.0% |
0.0% |
-423.4% |
-21.4% |
-93.4% |
-62.6% |
|
Perth and Kinross |
-18.1% |
0.0% |
0.0% |
33.6% |
-8.1% |
-16.9% |
-13.5% |
|
Renfrewshire |
-22.9% |
0.0% |
0.0% |
-216.1% |
-17.1% |
-55.8% |
-17.1% |
|
Scottish Borders |
-17.3% |
0.0% |
0.0% |
49.7% |
-12.1% |
-84.7% |
-17.5% |
|
Shetland Islands |
-16.8% |
0.0% |
0.0% |
-28.0% |
-15.0% |
-91.2% |
-23.4% |
|
South Ayrshire |
-18.0% |
0.0% |
0.0% |
87.0% |
-14.7% |
-84.2% |
-16.2% |
|
South Lanarkshire |
-18.0% |
0.0% |
0.0% |
570.8% |
-13.7% |
-94.9% |
-17.9% |
|
Stirling |
-17.8% |
0.0% |
0.0% |
42.3% |
-10.2% |
-16.6% |
-18.1% |
|
West Dunbartonshire |
-18.0% |
0.0% |
0.0% |
-613.8% |
-19.4% |
-121.7% |
-24.1% |
|
West Lothian |
-18.4% |
0.0% |
0.0% |
-222.0% |
-13.6% |
-18.5% |
-16.1% |
|
Total |
-17.7% |
0.0% |
0.0% |
-266.9% |
-15.5% |
-40.6% |
-22.1% |
© Published by Turner & Townsend, 2023 on behalf of ClimateXChange. All rights reserved.
While every effort is made to ensure the information in this report is accurate, no legal responsibility is accepted for any errors, omissions, or misleading statements. The views expressed represent those of the author(s), and do not necessarily represent those of the host institutions or funders.
Active transport typically means a human-powered form of transport such as walking or cycling. ↑
For example, a policy might be to increase the number of journeys under 5km completed by active travel. ↑
ArcGIS is a family of client, server, and online geographic information system (GIS) that enables users to create, analyse, visualise, and share spatial data such as maps. ↑
The Scottish Government’s draft Energy Strategy and Just Transition Plan emphasises the importance of local and community energy projects for supporting Scotland’s net zero and just transition ambitions.
This study examines how those projects can help deliver against these ambitions within devolved powers. The research explored developments in local and community energy and assessed key innovations, opportunities and barriers, and how to leverage those projects to support Scotland’s National Just Transition Outcomes (NJTOs).
The report contains:
- Six overarching recommendations to help increase the contribution of the local and community energy sectors to Scotland’s Just Transition.
- A set of 19 evidence-based actions to increase local and community energy as the Scottish Government develops the final version of its flagship Energy Strategy and Just Transition Plan.
Summary findings
- Local and community energy can directly contribute to all eight of Scotland’s National Just Transition Outcomes.
- There are key barriers to delivering against these outcomes across sectors:
- limited resources to build capacity for local and community energy projects in underserved areas
- challenges around skills and project delivery processes particularly within local authorities
- justice and equity issues within projects themselves
- lack of appropriate finance and business models
Further details on the findings can be found in the report attached.
Podcast and blog
Dr Jess Hogan from Regen gives an overview of this project and the findings in episode 12 of our podcast: Evidence for climate policy in Scotland
A blog post summarising the podcast interview is also available on our website: Project snapshot: Benefits of local and community energy
DOI: http://dx.doi.org/10.7488/era/3892
Executive summary
Aims
The Scottish Government’s draft Energy Strategy and Just Transition Plan emphasises the importance of local and community energy projects for supporting Scotland’s net zero and just transition ambitions.
This study aimed to understand how those projects can help deliver against these ambitions within devolved powers. The research explored developments in local and community energy and assessed key innovations, opportunities and barriers, and how to leverage those projects to support Scotland’s National Just Transition Outcomes (NJTOs).
The methodology included a literature review, interviews with citizens, local and community energy practitioners and other key energy and just transition stakeholders (including just transition experts and researchers; local authorities; fuel poverty and third sector charities; energy finance and investment stakeholders; energy developers and networks; and those working in local energy innovation initiatives such as the Prospering from the Energy Revolution programme and a deliberative ‘People’s Panel’ with Scottish citizens.
Findings
- Looking at evidence from Scotland and across the UK, we have found that local and community energy can directly contribute to all eight of Scotland’s National Just Transition Outcomes.
- There are key barriers to delivering against these outcomes across sectors: limited resources to build capacity for local and community energy projects in underserved areas; challenges around skills and project delivery processes particularly within local authorities; justice and equity issues within projects themselves; and lack of appropriate finance and business models.
Recommendations
We set out six overarching recommendations to help increase the contribution of the local and community energy sectors to Scotland’s Just Transition, and provide a set of 19 evidence-based actions to increase local and community energy as the Scottish Government develops the final version of its flagship Energy Strategy and Just Transition Plan.
The recommendations are designed for Scottish Government policymakers and other key partners, including local government, delivery bodies, the energy industry, communities and wider stakeholders working across energy, heat in buildings, transport, land use and planning, economic development, communities and fuel poverty. There are also wider lessons for those developing local and community energy approaches across the UK and Europe with a just transition in mind.
- Increase community capacity and outreach, including resource for and awareness of the local and community energy sectors to support capacity-building, effective project development and outreach, particularly in typically excluded communities.
- Support the development of new local and community energy models, including the skills, resource and networks required for communities and local authorities to fully embrace them.
- Enhance community ownership of energy and governance of projects, ensuring these are accessible, accountable and transparent, with proactive inclusion of marginalised and excluded groups.
- Increase participation and engagement, ensuring that all groups and communities have a fair opportunity to engage with local and community energy projects, to help participate in governance and decision making, and shape projects from the beginning.
- Develop sustainable finance, funding and investment models that ensure those who can’t afford to pay are not excluded and that maximum value is retained locally, with just transition outcomes explicitly prioritised.
- Open up benefits of local and community energy projects to as wide a range of people and places as possible, from decarbonisation and bill savings, to skills, through to supply chains.
Abbreviations table
| CARES | Community and Renewable Energy Scheme |
| ESJTP | Energy Strategy and Just Transition Plan |
| LAEP | Local Area Energy Planning |
| LCE | Local and Community Energy |
| LHEES | Local Heat and Energy Efficiency Strategies |
| NJTO | National Just Transition Outcomes |
| PPA | Power Purchase Agreement |
| RESOP | Regional Energy System Optimisation Planning |
| SSEN | Scottish and Southern Electricity Networks |
| SPEN | Scottish Power Energy Networks |
| DNO | District Network Operator |
Introduction
Community energy in Scotland
For over a decade, Scotland has strived to lead the way in local and community energy, with a Scottish Government target to reach two gigawatts of installed local and community-owned capacity by 2030 (Scottish Government, 2021a).
While aspects of energy policy and regulation in the UK are reserved, limiting the work that Scottish Government can do to fully enable local and community energy in Scotland, the Scottish Government has fostered a favourable policy environment for this sector. This is mainly through providing funding via the Community and Renewables Energy Scheme (CARES) to support the development and delivery of local and community energy projects. CARES has supported over 800 projects and 1000 organisations with over £61 million in funding (Scottish Government 2023b).
More recently, the Scottish Government has supported local authorities to deliver their own Local Heat and Energy Efficiency Strategies, which will set the foundation for more local energy systems and initiatives (2022a). Alongside this, there has been the announcement of the Onshore Wind Sector Deal (Scottish Government 2023c) – a shared commitment between the Scottish Government and industry to deliver against Scotland’s ambition of 20 gigawatts of onshore wind by 2030, in a way that aligns with the principles of a just transition.
Within this positive context, there are clear opportunities to further accelerate Scotland’s good work on local and community energy so far. Local and community energy, such as community-owned wind and solar, or district heat projects led by local authorities, can provide substantial social, economic and environmental benefits to people, places and a range of other stakeholders.
The benefits of local and community energy include: new revenue streams for local areas; new business and investment opportunities; reduced emissions; climate education and outreach; climate adaptation and resilience; improved capacity in local communities; new skills and job creation; and reduced fuel poverty (Ford et al., 2019; Gooding et al., 2020; PwC, 2022). Community and local energy also provides an opportunity to make Scotland’s net zero transition more local, democratic and inclusive, with energy projects and solutions better tailored to local needs.
These diverse benefits mean that local and community energy is well placed to contribute to achieving against Scotland’s eight National Just Transition Outcomes (NJTO) (Box 1). The National Just Transition Outcomes are a set of goals designed by Scottish Government, informed by the Just Transition Commission (2023), to help mitigate the risks of climate action and unlock the opportunities that a just transition presents across sectors and policy areas (Scottish Government 2022b). Within the context of the finalisation of the Energy Strategy and Just Transition Plan (ESJTP) and aligned policies such as the Heat in Buildings Strategy, local and community energy could thus have a significant role to play.
Methodology
In this report, we outline how to develop the local and community energy sector in Scotland in such a way that it delivers against Scotland’s NJTOs. To do so, we conducted a three-step research approach (these are detailed in appendices A and B). First, we conducted an extensive review of academic, policy and project literature and case studies. This allowed us to understand the most recent thinking and developments in the local and community energy space, and identify key just transition trends and issues.
Second, we interviewed 22 expert stakeholders. These included: community energy organisations; just transition experts and researchers; local authorities; fuel poverty and third sector charities; energy finance and investment; energy developers and networks; and those working in local energy innovation initiatives such as the Prospering from the Energy Revolution programme (UKRI, 2023). These stakeholders were chosen to give a breadth of perspectives on leveraging local and community energy for just transition outcomes beyond energy specialists alone, and to understand any key points of conflict between sectors and stakeholders.
Third, we conducted a “People’s Panel” with 22 Scottish citizens, most of whom were from lower income areas of the country. This helped to understand the opportunities and barriers people faced to participating in local and community energy projects, and how these sectors could best be opened up to improve buy-in from communities and provide diverse NJTO benefits to people and places.
There was higher representation from both citizens and local and community energy practitioners than renewable energy developers and businesses in this process. This was deliberate, because citizens and local and community organisations, particularly those working on just transition issues, have not always been involved in such discussions, yet can provide crucial insights on how to best open up local and community energy for a wider range of just transition outcomes. This means that our findings in turn reflect the perspective of those stakeholders more. Further engagement with energy developers and businesses would help make recommendations more robust.
| Box 1: Scotland’s eight National Just Transition Outcomes1. Citizens, communities and place: empowering and invigorating communities and strengthening local economies
2. Jobs, skills and education: equipping people with the skills, education and retraining required; providing access to green, fair and high-value work 3. Fair distribution of costs and benefits 4. Business and economy: supporting a strong, dynamic and productive economy, making Scotland a great place to do business 5. Adaptation and resilience: identifying risks and planning for long-term resilience against climate risks 6. Environmental protection and restoration 7. Decarbonisation and efficiencies 8. Further equality and human rights implementation and preventing new inequalities from arising |
What is local and community energy?
The Local Energy Policy Statement (Scottish Government 2021a) outlines three main categories of community and local energy projects (Table 1).
Across these categories, 908 megawatts of Scotland’s 2 gigawatt target for local and community energy has been delivered. This includes a mix of community energy projects, local authority energy projects, social and housing association developments, public sector investments, as well as initiatives in businesses and on farms and estates.
Table 1. Three categories of local and community energy per the Local Energy Policy Statement (2021)
| Model | Definition |
| Community energy | The delivery of community-led renewable energy projects, whether wholly owned and/or controlled by communities, or through partnerships with commercial or public sector partners. The Scottish Government views community-led energy projects as a priority within the wider local energy landscape. |
| Local energy | More wide ranging, involving a variety of different organisations (public, private, and community sector), who can deliver an energy service/project for the benefit of local people operating within a defined geographical area. |
| Local energy systems | Local energy systems find ways to link the supply and demand of energy services within an area across electricity, heat and transport, deliver real value to everyone in local areas, and support the growth of vibrant, net zero local economies. |
Although they share a number of key features, community energy, local energy and local energy systems do have distinct differences.
Community energy is typically characterised by grassroots action, where a community (either a community of place or of shared interest) comes together to design, implement, and manage a renewable energy asset or project. This might be a community energy generation project, such as a wind turbine or solar panels, or a heat, retrofit or transport scheme. These are often driven by a shared mission to deliver environmental, social and economic value for a specific place, with democratic input and governance (Brummer 2018; Creamer et al. 2020; Stewart 2021; Hanke et al. 2021).
Local energy and local energy systems are more diverse. They tend to have less of a primary focus on communities, and can be delivered though multi-stakeholder collaborations, often led by local authorities or the public sector, or through public-private collaborations (Ford et al., 2019; UKRI and Regen, 2022). They are less like the grassroots model seen in community energy and more akin to local authority-led or partnership approaches (Devine-Wright, 2019).
Value against Scotland’s NJTOs
Table 2. Value from local and community energy across National Just Transition Outcomes
| National Just Transition Outcome | Advantage of local and community energy |
| 1. Citizens, communities and place | Stronger inclusion of citizens in energy decision making and design; retention of value through local ownership; social and economic benefit such as new revenue and skills opportunities; local development and investment; energy projects reflective of local need. |
| 2. Jobs, skills and education | New job opportunities in installation, fitting, retrofit, and energy advice; grassroots education and upskilling; maximising local supply chains. |
| 3. Fair distribution of costs and benefits | Benefits for typically excluded communities through collective, public or private funding; new models to support uptake of low carbon technologies. |
| 4. Business and economy | Role for businesses and investors, particularly in local energy systems; new business models and opportunities in areas such as data, flexibility and innovation. |
| 5. Adaptation and resilience | Community-led responses to climate adaptation and resilience; holistic local climate and energy planning. |
| 6. Environmental protection and restoration | Community-led responses to protection and restoration; holistic local climate and energy planning. |
| 7. Decarbonisation and efficiencies | Local, tailored approach to energy and buildings decarbonisation; grassroots outreach and education; local network building and knowledge-sharing. |
| 8. Equality and human rights | Inclusive engagement; advocacy and representation; more democratic ownership and governance; locally-tailored solutions targeted at addressing e.g. fuel poverty. |
Different models of local and community energy will have different implications for Scotland’s NJTOs. Community-owned energy generation, for instance, is particularly strong on citizens, communities and place, by bringing people together to deliver projects and generating new revenues for local economic development. Community-owned energy generation projects also tend to be strongly motivated by climate and environmental outcomes (Community Energy Scotland, 2022; Community Energy England, 2022; Stewart, 2021).
Local energy and local energy systems tend to focus more on delivering economic value, such as a larger-scale return on investment for stakeholders, and new jobs and skills in retrofit, system installation, maintenance, etc. (Ford et al., 2019; Gooding et al., 2020; PwC 2022).
- Table 2 above outlines the high-level opportunity of local and community energy approaches for Scotland’s NJTOs. Table 3 illustrates the value that each main category has had so far for each of the NJTOs (Low = low value for NJTO) based on our review of empirical research and engagement with local and community energy stakeholders. A detailed qualitative analysis of these relationships across community energy, local energy, and local energy systems can be found in Appendix C
Appendix C: Local and community energy just transition outcome impacts.
Table 3. Illustration of how priorities for local and community energy vary against the eight NJTOs
| Community energy | Local energy | Local energy systems | |
| 1. Citizens, communities, place | High | Medium | Medium |
| 2. Jobs, skills, education | Medium | High | High |
| 3. Distribution of costs | Medium | Low | Low |
| 4. Business & economy | Low | Medium | High |
| 5. Adaptation & resilience | Low | Low | Medium |
| 6. Environment protection & restoration | High | Low | Low |
| 7. Decarbonise & efficiencies | High | High | High |
| 8. Equality and human rights | Medium | Medium | Low |
Table 3 and Appendix C highlight important qualitative differences in how community energy, local energy, and local energy systems deliver value against different NJTOs. However, projects can vary substantially within these broad categories. This also leads to variations in impact on NJTOs.
For example, a local energy project that focuses on decarbonising council buildings, such as leisure centres or commercial properties, will contribute less to NJTOs 1, 3 and 8 than one that supports council housing tenants to decarbonise their homes. A community energy project which uses generation assets to provide new revenues to deliver energy advice and local environmental protection will also contribute more towards NJTOs 1, 2, 6 and 7 than wind turbines installed on a farm or estate.
As such, supporting a balance of different types of projects across regions and areas can help contribute to all of Scotland’s just transition outcomes, allowing projects to meet local need. Projects themselves can also be supported to become fairer and more inclusive, which we deal with later in this report.
Just transition: processes and outcomes
Outcomes are only one part of the picture. As the Scottish Government (2021b) highlights, a just transition is also about process. This means that projects should be designed to enable people to take part in decision-making around the project. Who owns, gets a say, participates in, pays for and benefits from local and community energy projects all have implications for how just projects are considered to be by communities.
From our review of academic evidence and stakeholder engagement, we identified four key dimensions along which projects vary, with implications for how just they are considered to be. These dimensions are applicable to all types of local and community energy and should be considered together (Table 4).
Table 4: Key dimensions for ‘just’ local and community energy projects
| Dimension | Best practise for “just” outcomes |
| Ownership and governance | Democratic, accessible, and accountable ownership, with proactive involvement of diverse citizens and stakeholders in decision making. |
| Participation and engagement | Meaningful, proactive engagement with a diverse range of citizens and communities, people supported to help co-design projects from early stages and on an ongoing basis. |
| Finance, funding and investment | Transparent financial models that prioritise multiple just transition outcomes and do not exclude based on ability-to-pay. |
| Benefit and beneficiaries | Benefits realised socially, economically and environmentally for people and places first and foremost (including in jobs and skills, healthier homes and environmental protection), both individually and collectively where possible. Diverse opportunities for businesses, investors and industry. |
From this analysis, leveraging local and community energy for a just transition means: expanding local and community energy across regions as a whole; and creating the right policy and delivery environment to enable projects to be more just in their processes and outcomes.
In the next section, we provide a high-level overview of key models and developments in each sector. The remainder of the report then provides recommendations for Scottish and Local Government policymakers and delivery bodies working across energy, heat in buildings, transport, land use and planning, economics, local government, communities and fuel poverty.
While this report does not represent Scottish Government policy, it makes recommendations to inform the role of local and community energy in key national policies, including the forthcoming final ESJTP as well as delivery of adjacent strategies such as implementation of Local Heat and Energy Efficiency Strategies (LHEES) and wider Heat in Buildings Strategy, Community Wealth Building, and Local Development Plans under National Planning Framework 4.
Community energy
Community energy has flourished in Scotland during the last decade, with 101 megawatts of community-owned generation capacity reported to be in operation or in-development as of December 2022 (Scottish Energy Statistics Hub 2023). Many other projects are also in motion e.g. decarbonisation of heat and transport. This is illustrated in the illustration opposite which shows a community using renewable energy.
The Community and Renewable Energy Scheme (CARES), administered by Local Energy Scotland, has provided over £60 million development and capital support. Community energy has thus enjoyed a favourable devolved policy ecosystem. Key developments in the community energy sector are as follows:
‘Traditional’ community ownership and community shared ownership generation projects; Rooftop solar and ‘traditional’ wind projects on community land and buildings; many-to-many power purchase agreements with public sector and commercial offtakers; exploring opportunities to link with community-owned land and housing
Community-owned electric vehicle charging, sometimes paired with car sharing.
Generation and supply
Heat and energy efficiency
Transport
Decarbonisation of community buildings using heat pumps and energy efficiency, providing lower bills to help keep social spaces open and warm hubs over winter; exploring potential for district heat networks and bulk purchase of heat pumps; community-led efficiency and retrofit programmes.
Just transition outcome contribution: citizens, communities and place; climate adaptation and resilience; environmental protection and restoration; decarbonisation and efficiencies; equality and human rights.
Key developments
Generation and supply
Since the winding down of the UK Government Feed-In Tariff – replaced by the less lucrative Smart Export Guarantee – community energy generation in Scotland and the UK has been forced to rely on other models.
This has often taken the form of Power Purchase Agreements (PPAs) with local stakeholders such as councils, colleges, businesses and hospitals – or directly with utility companies (Community Energy England 2022; Crown Commercial Services 2020).
PPA’s are arrangements where either utilities or local bodies can purchase energy from community-owned generation for a fixed term at a fixed price. In the case of Edinburgh Solar Cooperative, for instance, the Cooperative installed solar panels on a number of City of Edinburgh Council buildings (City of Edinburgh Council 2014). The solar panels provide some of the electricity generated to the buildings on which they are installed at a reduced rate compared to typical market tariffs. This is facilitated by a Power Purchase Agreement.
The traditional model of selling energy to the national grid is also still used, particularly with larger-scale wind and solar projects using local or community land which are better-placed to make a return than smaller installations (Community Energy England, Scotland, Wales 2022). This in turn provides community benefit funding which can be used to deliver against just transition outcomes. In particular, state of the sector reports show that this has been used for:
- Building capacity in communities through social gathering, engagement, and outreach
- Delivering energy advice and advocacy and helping people in fuel poverty
- Promoting climate education through hosting workshops, events and cafes
- Developing climate adaptation measures, such as investing in green spaces or nature restoration
Heat and energy efficiency
Decarbonisation of community buildings has been the predominant form of community heat progress in Scotland (Local Energy Scotland, 2023a). This includes installing efficiency measures and heat pumps to reduce bills for public and shared use buildings e.g. community centres. This can help reduce costs for running community spaces, provide sustainable and warm social centres for local residents and support education around new technologies or initiatives.
More ambitious heat projects are being explored, such as bulk purchase of heat pumps for local homes and district heat networks, for instance by Local Energy Scotland’s CARES-funded Community Heat Development Programme (2023b).
However, these remain expensive and complex undertakings for community organisations at present. The legal, financial and technical expertise required is significant, meaning organisations that rely on volunteers and limited resource struggle to deliver them effectively. Within Local Heat and Energy Efficiency Strategies (LHEES), there is scope for communities to work with local authorities to identify opportunities and deliver such projects in partnership. Projects elsewhere in the UK, such as Swaffham Prior, show how community heat and community energy generation can work together in partnership with local authorities and the private sector to deliver such projects successfully (Cambridgeshire Country Council, 2023).
There have also been advances in community approaches to energy efficiency and retrofit. Community organisations such as the Carbon Coop in Manchester (People Powered Retrofit, 2021), Loco Home Retrofit in Glasgow (2023), and the Heat Project Blairgowrie (2023) have been supporting homeowners to install energy efficiency measures along with low carbon technologies such as heat pumps and solar panels.
This provides new opportunities to support people in often disadvantaged or excluded communities to decarbonise, and jobs, skills and education opportunities for local businesses and tradespeople.
Transport
Local and community transport projects have broadly taken the form of electric vehicle (EV) charging points, either supplied by local generation assets as funded by Brighton Energy Coop’s Community Solar Accelerator Grant scheme (2021), or as assets themselves, creating revenue through subscription and pay-as-you-go tariffs as with the Charge My Street initiative (2023).
EV charging is seen as a relatively low-risk project by community energy stakeholders spoken to as part of this research. However, installing chargers does rely on locational factors such as the availability of network capacity and parking facilities, as well as people using the chargers themselves to generate revenue (typically more affluent groups – see Hopkins et al., 2023).
Local energy
Local energy has experienced considerable growth in recent years, and has become increasingly salient in energy policy thinking.
Recent research estimates that 1 in 5 UK local authorities now have some form of local energy project, which can take various forms across a range of scales (Arvanitopoulos et al. 2022).
Similar to community energy, local energy tends to encompass generation and supply projects,
heat and energy efficiency schemes, and transport solutions. This is illustrated in the image opposite which shows a variety of buildings being served by the same energy source in a community. Local energy includes:
Local authorities delivering e-bikes, EV charging etc., EV charging in social and housing and associations.
Local authorities delivering Community Wealth Building-style (CWB) projects (North Ayrshire) and solar in council housing; solar and storage in social/housing associations; commercial and business properties installing own technologies.
Generation and supply
Heat and energy efficiency
Transport
Local authority and commercial district heat networks (Edinburgh Vattenfall) and heat pumps, including in leisure centres; place-based energy efficiency approaches; commercial and business properties installing own technologies.
Just transition outcome contribution: citizens, communities and place; jobs, skills and education; fair distribution of costs and benefits; decarbonisation and efficiencies; equality and human rights (when targeted at lower income households).
Key developments
Generation and supply
At a local level, local authorities, housing associations and social housing providers are increasingly decarbonising their electricity supply (UKRI and Regen 2022). This has mostly taken the form of installing solar panels (often with battery storage) in their housing stock to reduce bills for tenants, and in a wider decarbonisation of public, commercial and industrial buildings.
Often working with low income social housing tenants directly, this has created value for decarbonisation and efficiencies, and had a further impact on equality and human rights through tackling fuel poverty. Compared to community energy, local authorities have direct access to their own housing stock, making installation of measures for lower income groups more straightforward. Delivering measures is still challenging for the private rented or owner-occupier sectors, however.
Some local authorities such as North Ayrshire Council (2020) have been leading the way to deliver just transition value, through advancing plans for using council-owned energy generation to fund work addressing fuel poverty, as well as energy efficiency and Community Wealth Building programmes (Figure 1). In addition to contributions to the just energy transition, this also has the potential to deliver jobs, skills and education, as well as provide a strong boost to citizens, communities and place through enabling local value generation, retention, and more open decision making.
Revenues reinvested in local economy, eg:
- Tackling fuel poverty
- New jobs and skills
- Local business and economic development
- Other energy projects
- As per local need
Money generated predominantly from exporting to the grid, or supplying energy to local public and commercial buildings.
Local authority sources investment to develop municipal electricity generation assets, such as a wind or solar farm (or both).
Figure 1. Local authority-led generation for community wealth building example
Heat and energy efficiency
Alongside generation, the same organisations have been installing heat pumps, often in housing stock but more often to serve larger commercial and public sector buildings. Local authorities have been leading on place-based energy efficiency schemes, with LHEES underway and due to be delivered in late 2023.
As with community energy, these carry benefits for decarbonisation and efficiencies, taking a more tailored, place-based approach to reducing housing stock emissions, while supporting lower income and excluded groups to transition to low carbon technologies (Regen 2022).
Several local authorities, such as Midlothian Council (2022) and Stirling (FES, 2023), are also delivering larger heat network projects to serve a mix of domestic, industrial and commercial properties. This can create wider business and economy opportunities for investors and developers, generating new work and business for local places.
Transport
Beyond coordinating public transport and decarbonising their own transport fleets, local energy transport initiatives today typically take the form of e-bike services led by local authorities, charging in social and housing association properties, or public electric vehicle charging and car clubs. The Plugged-in Communities Scotland Fund (Energy Savings Trust, 2023), for instance, provides funding for community transport organisations – often housing associations – to deliver car clubs and charging for their tenants and the wider community. In terms of value for just transition outcomes, this can support decarbonisation and efficiencies through encouraging more active and public travel, although can be restrictive for those outside of city centres or without driving licenses.
Local energy systems
Often known as ‘integrated’ or ‘smart’ local energy systems, local energy systems have become increasingly prominent in the local energy landscape.
Spearheaded largely by the Prospering from the Energy Revolution programme (2023), local energy systems bring together a combination of generation, storage, heat, transport and demand at a local level. This is done using physical infrastructure, digital platforms and local energy markets.
These have generally taken trial form at a town or city level and are usually led by local authorities, in conjunction with a wide consortium including communities, academia, businesses and developers. This is illustrated in an image below which shows how solar, wind and heat pump energy sources can be integrated into community energy supplies.
This has been the case in the landmark Bristol City Leap project, for instance, delivered in partnership with Bristol City Council, industrial partners Amaresco, community organisations, and developers Vattenfall (Bristol City Leap, 2022). The project will install and operate new solar, wind, heat pumps and networks, EV charging and energy efficiency measures in homes and businesses across the city to help meet their 2030 climate targets.
’Integrated’ or ’smart’ local energy systems, largely at innovation stage, now moving more into business-as-usual. Bringing together a combination of electricity, heat, transport, storage and demand at a local level, using smart technologies and digital platforms.
Just transition outcome contribution: jobs, skills and education; business and economy; decarbonisation and efficiencies.
Key developments
Still in their early stages, integrated local energy systems provide a range of opportunities against each of Scotland’s NJTOs, particularly on jobs, skills and education and business and economy. They also provide opportunities for installers, energy businesses and developers, data scientists, engineers and project managers (UKRI and Regen 2022; Chitchyan and Bird 2022).
Within integrated local energy systems, there is also scope to build community benefit and ownership of generation or district heat assets. As part of the current Bristol City LEAP project, a £1.5 million Community Energy Fund has been included as part of the deal to help communities develop their own local energy solutions and hold a stake in the wider initiative (in addition to the LEAP project creating an estimated 1,000 jobs across planning, design, data, installation and retrofit, and deliver £2.8 million to local community projects).
However, these systems can be big undertakings, requiring significant public and private finance to deliver. Given their novelty, they can be seen as risky, and some policy and regulatory issues still remain at UK level (see Section 1.128).
Local energy planning
Local energy planning is becoming a key function of local authorities in Scotland and across the UK. In Scotland, this has at least partly been driven by Scottish Government requiring Councils to develop their Local Heat and Energy Efficiency Strategies (LHEES), setting out the long-term plan for decarbonising heat in buildings and improving their energy efficiency across an entire local authority area (Scottish Government, 2022a).
Some local authorities, such as Dundee City Council with their Regional Energy System Optimisation Planning (RESOP) project (Scottish and Southern Electricity Networks, 2022), have voluntarily broadened out into local area energy planning (LAEP) to include generation, transport and storage as well as heat and efficiency. Stirling and Clackmannanshire have also delivered a Regional Energy Masterplan which covers a similar scope (Engage Stirling, 2023).
Distribution network operators play a key part in this, supporting local stakeholders to develop plans for network investment and system design, with an increased focus on local planning and delivery under their new funding obligations. Ofgem’s Review of Local Energy Institutions and Governance, and Regional System Planning consultations are now exploring what is likely to be a prominent future role for local and community energy in the energy system (Ofgem 2023).
This new prominence of local energy planning can support the development of local energy projects and systems, in close tandem with communities and citizens. It can also allow local authorities to better plan their decarbonisation efforts, and begin to mobilise necessary local skills and finance.
Outside of LHEES, there is no set standard for the level of energy planning local authorities or stakeholders are currently expected to deliver – in Scotland or across the UK. The level of skills and resource that local authorities have in-house can also vary substantially, making it difficult to deliver more ambitious projects consistently across the country.
Recommendations
It is clear that different forms of local and community energy can make a significant contribution to Scotland’s eight National Just Transition Outcomes. New developments, particularly in community heat and efficiency, local energy systems and local energy planning, also present new opportunities.
However, key barriers remain to realising these at scale. Local or community-owned energy is also not automatically more ‘just’ than larger-scale developments. Who owns, governs, participates in, funds and benefits from local and community energy projects will impact how ‘just’ they ultimately are. Leveraging local and community energy for just transition outcomes thus means:
- Better enabling the delivery of more projects in more places
- Making sure projects embed just transition principles throughout
To support this, we have developed the following six key overarching recommendations for Scottish policymakers and delivery bodies, energy industries, communities and wider stakeholders, which can help unlock local and community energy going forward:
- Increase community capacity and outreach: Increase resource for and awareness of local and community energy, to support capacity-building and effective project engagement – particularly in underserved communities.
- Support delivery and innovation: Support the development of new local and community energy models, including the skills and networks required for community and local authorities to fully embrace them.
- Enhance ownership and governance: Expand community and local ownership of energy, ensuring that ownership and governance of projects are accessible, accountable and transparent, with proactive inclusion of marginalised or excluded groups.
- Increase participation and engagement: Ensure that all groups and communities can realistically engage with local and community energy projects, to participate in governance and decision making, and shape ideas from the beginning.
- Develop finance, funding and investment: Develop sustainable finance and business models that ensure those who can’t afford to pay are not excluded from participation or benefit and that maximum value is retained locally, with just transition outcomes explicitly prioritised.
- Open up benefits to beneficiaries: Open the benefits of local and community energy projects to as wide a range of people and places as possible, including everything from household decarbonisation and bill savings, to skills and supply chains.
These recommendations are applicable across community energy, local energy, and local energy systems. The following sections give specific actions to realise these, and explain how these suggested actions are supported by research.
Increase community capacity and outreach
Recommendation 1: Increase resource for and awareness of local and community energy, to support capacity-building and effective project engagement – particularly in underserved communities.
Community energy projects often aim to target lower income areas, to challenge fuel poverty and deliver benefits to often disadvantaged places (Stewart 2021; Community Energy Scotland 2022; Community Energy England 2022; Cairns et al 2023). However, projects in lower income areas can still be few and far between. Community energy literature highlights that in Scotland, the UK and more broadly, areas of higher deprivation and places without strong existing development associations or community energy groups can struggle to develop and participate in community energy projects (Hanke et al 2021; Brummer 2018).
Although Scotland has fostered a favourable policy environment for community energy, community energy organisations and third sector stakeholders recognise this issue, and note that there remains a lack of consistent capacity and resource within communities to deliver or participate in projects at a wider scale.
This makes it challenging for more communities to participate in community energy, local energy developments, or to pursue shared ownership arrangements. Expanding resource for capacity building and raising awareness for local and community energy would help develop National Just Transition Outcomes in these areas.
Action: Run a large-scale awareness-raising campaign around community energy, the potential benefits it brings, and entry points for communities
Our research with community energy stakeholders, third sector organisations working directly with the public, and citizens in our People’s Panel has shown that awareness of community energy among the general public remains low. Of the 22 participants in our People’s Panel, only one had heard of community energy prior to this engagement. Community energy groups and wider community organisations also reported encountering a lack of awareness when they engage in new areas.
To deliver more community energy projects for just transition outcomes, there is a need to improve awareness of the sector, and its possibilities, across the board.
Action: Support the hiring of local and community energy development officers at a more consistent local level
Research from Slee (2020) highlights that the success of community energy projects largely depends on there being skilled and knowledgeable actors with local as well as business and technical knowledge in a particular community. At present, Local Energy Scotland have eight regional development officers. However, this is not seen by local, community or energy innovation stakeholders as granular enough to build meaningful local capacity in diverse communities across the country.
Local and community energy stakeholders (again highlighted by Slee, 2020) likewise cited that it is often the same organisations, groups and development trusts which apply for funding because they know the process and have some capacity and expertise already, with limited applications from new groups or areas.
To better unlock new projects in new areas for just transition outcomes, skilled development officers employed at a more granular spatial scale, such as local authority for instance, could allow for more targeted local development and encourage better links between local authorities and communities.
Action: Expand CARES funding to provide a wider range of support, such as capacity building and more substantial core staff resource for community energy organisations
The CARES programme, managed by Local Energy Scotland, successfully supports community energy projects in Scotland with loans, grants, and procedural assistance. To date, it has been one of the first ports-of-call for community energy. However, local and community energy stakeholders called for two key improvements to be made to the CARES programme.
Firstly, local and community energy stakeholders argue that CARES may benefit from being more flexible in its funding criteria across calls and programmes. Organisations involved in our research noted there is not enough funding available to build capacity or pay community energy volunteers for their time without there first being a project in place, which makes it difficult to develop sustainable projects, particularly in new areas, or retain people to drive projects forward. Enabling more funding for capacity building and core community energy staff in particular would allow existing projects to expand, explore new models and options and help more projects to come to fruition in new and different places.
Action: Develop a roadmap of the support that CARES provides throughout the project process to make it clearer to local and community organisations
Second, our research participants commented that the support that CARES can offer to community organisations, particularly once a project has been established, is not always clear. Signposting to the website is useful but once there, community organisations note that specifics on the support available at different project stages is lacking in detail. An accessible, easy-to-navigate roadmap outlining precisely the support available at each stage of different types of project (wind, solar, hydro, generation, heat, transport, etc.) would help demystify this for prospective new community energy organisations.
Support delivery and innovation
Recommendation 2: Support the development of new local and community energy models, including the skills and networks required for community and local authorities to fully embrace them.
Innovation has been a cornerstone for both local and community energy. Community energy has often innovated by necessity, while local energy systems such as those trialled under the Prospering from the Energy Revolution programme have pushed innovation at the nexus of technology, business models and regulation in recent years. These innovations present new opportunities to deliver against just transition outcomes which the Scottish Government can more effectively support.
Action: Build on Heat in Buildings and Net Zero Skills Strategies to include training around local energy systems for local authorities and interested industry stakeholders
A wealth of evidence already exists on the opportunity, barriers and operationalisation of local energy systems across the UK (Regen 2023; Energy Systems Catapult 2022).
A key challenge that remains relates to the lack of skills within local authorities to spearhead local energy system developments (Chitchyan and Bird, 2022). While LHEES has improved local energy understanding, local authority stakeholders note that there is still often a lack of skills (and resource) for local energy projects in general. These skills gaps include creating appropriate partnerships, engaging the community, knowledge-sharing and developing successful business models and governance structures within current regulatory frameworks.
Developing flexible, modular training with bodies such as Skills Development Scotland or the Improvement Service, or learning from knowledge-sharing initiatives such as the GreenSCIES local energy Centre for Excellence (UKRI and Regen 2022) could help to overcome this issue, and help contribute to the capacity within local authorities to take local energy projects forward.
Action: Work with prospective public and commercial sector stakeholders to promote community energy as an option for their energy supply
In the absence of a steady revenue stream for community energy generation projects, some are increasingly exploring Power Purchase Agreements (PPAs) with public and commercial organisations.
These PPAs can help to provide revenues through which community energy can deliver across all NJTOs to some degree (depending on local need and ambition). Bringing several PPAs together (i.e. selling community generated electricity across several sites to feed a single community benefit fund) can also make projects more attractive to local businesses and investors.
However, community organisations within our research noted they often struggle to find suitable organisations or to explain to key individuals within the organisation why this would benefit them and their local community.
The Scottish Government could support this process by convening public and commercial sector energy users to raise wider awareness of local or community energy power purchase arrangements, and highlight the option of partnership with community energy in public and commercial sector procurement guidance.
Action: Develop new funding models for local and community approaches to energy efficiency, retrofit and advice
Energy efficiency and retrofit services have been a rapid growth area for community energy. However, stakeholders note that community-led efficiency and retrofit relies heavily on short-term competitive grant funding, with business models still in early stages. This makes it challenging to develop effective, sustainable community-led solutions.
To enable this value, community organisations working in this space note there is a need to support them to develop new business and delivery models, potentially in partnership with local authorities. Building on existing funding routes such as CARES, the future National Public Energy Agency could work with community and local partners to support the coordination of investment and development of new community efficiency and retrofit funding arrangements.
Action: Work with the Convention of Scottish Local Authorities (COSLA) and local authorities directly to identify and address key friction points within the local energy planning, approval and delivery processes
In our People’s Panel, participants noted that communities and local authorities should face a minimum of red tape in getting projects up-and-running, allowing them to innovate, demonstrate and deliver value sooner. Local authority stakeholders also noted that this is a key issue.
Because projects must navigate a range of local authority departments and sign-off processes (not including wider processes such as securing grid connections and meeting regulatory requirements), they can be held-up or fail due to political timeframes and pressures such as local or Scottish Government elections. There is thus a need to ensure that projects can progress more efficiently within and alongside these democratic processes. Local authority stakeholders and examples from other local energy projects such as GreenSCIES in London suggest that streamlined project processes within local authorities (potentially with a single embedded local energy officer) would help to ensure projects can progress overall, both within election cycles and in the longer-term.
Enhance ownership and governance
Recommendation 3: Expand community and local ownership of energy, ensuring that ownership and governance of projects are accessible, accountable and transparent, with proactive inclusion of marginalised or excluded groups.
Who owns local and community energy projects can have a direct impact on how much they contribute to just transition outcomes. Research from Aquatera (2021) compared 9 community owned winds farms against 4 commercial wind farms and found that the community-owned wind turbines in Scotland have generated, on average, 34x more in community benefit payments than the developer-led projects.
Where projects are locally or community owned – particularly by communities and local authorities – evidence suggests that the main outcomes tend to be aligned with just transition principles (Stewart 2021; Creamer et al 2019; Hanke et al 2021). This can also enable more value to be captured locally overall than, say, projects led by developers alone. As such, enabling more local and community ownership of energy can help to deliver greater value against just transition outcomes.
Community and local ownership is not fairer by default, however, with a need to ensure that ownership and governance structures are fair, accessible, and transparent (see Section 1.14).
Action: Develop clear targets for community energy
Although cited as a priority for Scottish Government in the Local Energy Policy Statement, community-owned projects account for only 11.1% – 101 megawatts – of total operational local and community energy capacity as of December 2023 (Scottish Government Energy Statistics Hub, 2023). Scottish Government does have a target of 2 gigawatts operational local and community energy by 2030. However, this target also includes non-community owned projects such as public sector and local authority projects, and projects led by farms and estates.
Research shows that clarity in government targets can provide a signal to stakeholders to help stimulate innovation and action among businesses, developers, and communities towards net zero – including in community energy when paired with wider measures and support (Hewitt et al 2019; Yeow et al 2017). Community energy and just transition stakeholders similarly note that making clear how much of the 2030 target is expected to be community-owned would set a clearer vision for communities overall.
As a means to stimulating more community ownership and innovation and redoubling this ambition within the final ESJTP, the Scottish Government could outline how much of the remaining 2 gigawatt target is to be met by new community-owned projects specifically.
Action: Enable greater community ownership through local energy planning
Identified by both local authority and wider local energy stakeholders, local energy planning presents a new opportunity to support community ownership and more democratic input on local energy ambitions overall. Within local energy planning processes, such as LHEES, LAEP or heat network zoning, local authorities can identify sites that would be appropriate for community energy projects, particularly generation and heat, and work with community organisations to develop them.
In theory, this is a win-win situation: community energy organisations have a wider scope of potential projects, while local authorities can be supported by community organisations to deliver against their energy ambitions.
Action: Develop the potential for local authority shared ownership
While the Scottish Government has set out its principles for community shared ownership of renewable energy developments (2019), there is no similar guidance at present for local authorities. With the development of the Regional System Planner at UK-level and other trends towards greater local authority participation in energy decision making and projects (Ofgem, 2023; PwC, 2022; Green Finance Institute, 2022), local energy and finance stakeholders highlight that this could be a useful vehicle for establishing more local ownership of energy assets.
Where communities are deemed less-well equipped to participate in shared ownership, providing guidance for local authorities to invest in shared ownership projects could create a new avenue to capture value from larger developments, potentially creating new local authority revenue streams or community benefit funds. This is already included in shared ownership guidance in Wales, for instance (Welsh Government, 2022). Building on Scottish Government’s existing Community Shared Ownership Best Practice Principles (Scottish Government, 2019), working with COSLA to understand the potential role and opportunity for local authorities in shared ownership arrangements could be a useful undertaking.
Participation and engagement
Recommendation 4: Ensure that all groups and communities can realistically engage with local and community energy projects, to participate in governance and decision making, and shape ideas from the beginning.
Often those groups typically already excluded or disadvantaged in society also face risk of exclusion within local and community projects (Knox et al 2022). Without ensuring that those most at-risk of exclusion can engage and participate directly, there is a risk that projects do not reflect the needs of those groups and people, and that those people are in turn excluded from wider benefit. Table 6 illustrates key barriers for specific excluded groups as identified in our academic literature review.
Expanding capacity and outreach as outlined in Recommendation 1 can go some way to overcoming this issue. However, it is important to consider the specific needs of these groups to ensure they can participate in, and benefit from local and community energy projects. This includes paying attention to project design, engagement, decision making, governance and benefit allocation (Knox et al 2022; Huggins 2022).
Table 6: Groups with additional barriers to engagement and participation
| Group | Key barrier(s) | Need |
| Low income | Upfront financial cost of share-based community energy; material time and resources. | Exemption from up-front costs; tailored, rewarding and inclusive engagement; alleviated responsibility for legal, procedural or technical issues. |
| Disabled people | Additional/unique energy needs; material time and resources. | Tailored, rewarding and inclusive engagement; deeper understanding of need; alleviated responsibility for legal, procedural or technical issues by qualified or experienced actors. |
| Migrant and ethnic minority communities | Language, communication and engagement; ownership and legal rights. | Tailored, rewarding and inclusive engagement; multilingual and accessible resources (on energy but also in housing and legal rights). |
| Older people | Understanding of new technologies or systems; communication and engagement. | Tailored, rewarding engagement and support; alleviated responsibility for legal, procedural or technical issues by qualified or experienced actors. |
| Private rented sector | Ownership and legal rights. | Clear outlining of responsibilities; working with PRS landlords and tenants to shape potential project frameworks. |
| Residents of flats and tenements | Ownership and legal rights; physical and housing. | Multi-occupancy building solutions; projects with more holistic local benefit; working with PRS landlords and tenants to shape potential project frameworks. |
| Rural and off-gas grid | Physical and housing. | Tailored solutions; support with local energy infrastructure. |
| Young people | Ownership and legal rights; finance and governance. | Tailored engagement; consideration of future generations in project and policy planning. |
Action: Ensure best practice principles for co-design and engagement
Ensuring as many people as possible can help to shape, participate in and benefit from local and community energy requires proactive, targeted and meaningful engagement with all groups within a community or area – particularly those most disadvantaged or at risk of exclusion already.
To do so, our People’s Panel echoed that there is a need for a shared standard of best practice in community engagement across local and community energy projects, starting at the earliest possible stage with broad promotion, to allow citizens and communities to meaningfully co-design projects from the very beginning. As highlighted above, using trusted intermediaries can be one effective way of reaching groups most at-risk of exclusion, although other methods such as targeted doorstep or community engagement may be more appropriate in some circumstances.
Several organisations such as the Scottish Community Development Centre and Project LEO in Oxfordshire have already created standards for community engagement and local energy respectively (Huggins 2022). For example, the Scottish Government and COSLA recently delivered their own ‘Planning With People’ initiative which outlines best practice for community engagement on local health and social policy. The Scottish Government has also been leading a trial of green participatory budgeting. This activity can provide useful groundwork for increasing local and community energy.
Our research therefore suggests that the Scottish Government should build on other examples of best practice, such as the Good Practice Principles for Community Benefit in Onshore Wind Developments (2019) and encourage local authorities, community energy groups, developers and relevant stakeholders to adopt a shared best practice standard for citizen and community engagement in all new local and community energy projects.
Action: Make governance of projects more transparent, inclusive and accountable
Once projects are established, how they are then governed (who makes decisions, what the processes for decision making look like) has key justice implications. Issues have been noted in the energy justice literature (see Hanke et al 2021), for instance, with community benefit funds that are determined by developers and spent largely by those more active and engaged members of a community, excluding those more socially isolated, meaning outcomes could fail to reflect their needs.
Likewise, experience from previous innovation projects shows that local projects can be decided by leading partners and organisations, with limited local or community direction. Ensuring proactive engagement with communities and inclusive, accountable governance structures that do not rely on people paying money to participate can help increase public support and promote fairer outcomes and processes.
Action: Formalise the role of third sector and advocacy organisations as trusted intermediaries
Trusted intermediary organisations such as fuel poverty charities, community groups, mutual aid initiatives, faith groups and third sector more generally are crucial to supporting people into local and community energy projects, and net zero more widely (Slee, 2020; Stewart, 2021). Such organisations can support engagement and outreach with often-excluded communities, and help to advocate for their needs within policy, project and development processes.
However, third sector and fuel poverty stakeholders note consistently that these organisations are under resourced – an issue made especially acute during the recent energy crisis (Citizens Advice, 2023). This means that although many organisations are open to supporting energy and just transition projects, they are severely limited in their capacity to do so. Funding for these organisations tends to be competitive on an annual basis, meaning that staff spend a lot of time applying for the next round of support. This also means that longer-term capacity building, upskilling, and working with people and places is difficult.
Third sector stakeholders working in equalities and fuel poverty in particular, along with just transition researchers, highlight that more stable, longer-term resourcing for trusted intermediary organisations such as their own (including established community energy groups) would help to enable better capacity building and representation of excluded communities, along with clarifying the role Scottish Government expects these organisations to play across the ESJTP. The Climate Policy Engagement Network could provide one forum for engagement with these partners.
Develop finance, funding and investment
Recommendation 5: Develop sustainable finance and business models that ensure those who can’t afford to pay are not excluded from participation or benefit, and that maximum value is retained locally with just transition outcomes explicitly prioritised.
Local and community energy projects rely on a range of finance and funding sources (Cairns et al. 2023). Where this funding comes from, who pays, and what happens to the revenues are all important just transition questions.
All funding types can support NJTOs and a wider just transition in theory, but not necessarily by default (as discussed in section 3).
Table 7 outlines the key issues with different funding models. As such, supporting a just transition means ensuring that finance, funding and investment are fundamentally aligned with just transition outcomes first and foremost.
Table 7. Overview of finance and funding sources for local and community energy
| Type | Overview | Types of projects | Risks and barriers |
| Share offer | Citizens buy shares in a community or shared project, for a small return on investment (proportionate to size of share) and say in decision making. | Community energy (generation, supply, heat, transport, services); shared ownership. | Only people with money to invest get a share of ownership or say in decision making; investors are not always local. |
| Grant and innovation | Innovation funders such as UKRI provide grant funding for new projects. | Partnership; research, innovation and demonstration; development. | Often focussed on ’cutting edge’ tech innovations with limited consideration of social, replicability or more incremental changes; can prioritise innovation-first with just transition impacts secondary; limited accountability or legacy. |
| Public | Government or similar, such as CARES or the Low Carbon Infrastructure Transition Programme (the latter now closed). | Community energy; local authority. | Limited amounts available; funding can be designed for a specific or narrow purpose. |
| Public-private finance | Public sector such as a local authority (or community group) works with private investors or businesses to raise capital for projects. | Integrated local energy systems (local authority-led, see Bristol City LEAP); larger community energy projects. | Projects often need to be larger-scale; just transition may be a secondary consideration. |
| Community benefit payments | Community benefit payments, either from developers, networks, or via private philanthropy. | Community energy predominantly, although could be leveraged by public bodies such as local authorities. | More active community members decide how funds are spent; risk of prescribing what communities should do with their funds; potential for some communities to lose out. |
From this analysis, there are four key issues for just transition outcomes:
- Share offers are often exclusionary of lower income groups within community or shared ownership. However, individual projects can stipulate exemptions to ensure people can still participate, with a need to encourage this on a consistent basis.
- Grant and innovation funding is often short-term and overly innovation-focussed, with a lack of support for scaling-up or more social and business model innovation. It can also prioritise innovation first with just transition value treated as secondary, while projects often wind down with no lasting legacy for communities.
- Public funds are available and welcome, such as in the recent Heat Networks Fund, although there is a strong sense that these are not adequate at present for local authorities to fully deliver LHEES, for instance, or for community energy projects to be established at scale.
- Private finance is playing an increasing role in local authority and larger-scale integrated projects, such as Bristol City LEAP. However, stakeholders interviewed across different sectors are cautious about previous experiences with the Public Finance Initiative and the risk that private investment may lead to value leaving local areas.
Action: Explore new private sector funding models for local and community energy
With more public-private finance models, there are various opportunities for businesses and organisations to invest in local and community energy projects, which in turn can support other just transition outcomes (such as decarbonisation & efficiencies, and citizens, communities & place). Many already do invest in community energy share offers, via community or municipal bonds, or through partners such as Triodos Bank and Abundance Investment.
However, stakeholders in the finance and investment space note that without the Feed-In Tariff, the return for local or community projects is generally less attractive unless projects get to a larger scale (e.g. a high number of aggregated PPA agreements or more ambitious integrated local energy systems).
Closer working between the Scottish Government and the Scottish National Investment Bank (SNIB) on community and local energy is one viable option to help to overcome this issue. While the SNIB typically invests in £1 million+ projects, it could begin to work closely with local and community sectors to develop new models and instruments and help build better financial networks. It could also help aggregate projects to create a larger, packaged proposition which is more lucrative to investors. 3Ci’s (2022) regional net zero investment forum, which brings together the finance community, local authorities, policymakers, developers, businesses and community enterprises in different regions across the UK, has already made some progress on this.
Action: Incentivise just transition outcomes in policy, procurement, and funding decisions around local energy projects or systems – especially where commercial, innovation or private finance are involved
There is also general understanding across stakeholders that private investment has a strong role to play in reaching net zero and delivering more ambitious local projects (Green Finance Institute 2022; UKRI and Regen, 2022a). Our People’s Panel participants likewise told us that it does not strictly matter where money comes from, so long as the primary beneficiaries are people and places first, with strong consideration of just transition outcomes and an offer of shared ownership as standard.
To ensure this, where innovation or private finance is involved in local and community energy projects, there is a need for just transition guidance in funding and procurement processes. This should also be considered together with Community Wealth Building and relevant National Planning Framework legislation.
Action: Ensure adequate strategic funding for local energy delivery (and beyond)
Beyond project funding models, local authorities note that short-term annual budget cycles make it difficult to develop longer-term projects or strategies. Local authority and wider UK local energy stakeholders note that this current model of funding has led to a disparity across local authorities in energy efficiency schemes in particular, with many drastically underspending on their allocated budgets.
This makes it difficult to mobilise local jobs and skills to meet decarbonisation and efficiency plans (and fuel poverty targets), limiting the appetite for businesses to emerge, upskill, or retrain to deliver on these ambitions – and for investors. Skills and jobs for the delivery of energy projects are a well-cited and evidenced barrier to progress here more generally (Chitchyan and Bird, 2022; UKRI and Regen, 2022b). This was also highlighted in the Scottish Parliament’s ’Role of local government and its cross sectoral partners in and delivering a net-zero Scotland’ report (Scottish Parliament, 2023).
Our research shows the importance of reviewing funding required for the on-the-ground delivery of local energy plans and projects such as LHEES, and reforming existing budgets and processes to allow for more strategic, longer-term planning and investment. Much of this work is already underway in the delivery of the Heat in Buildings Strategy. As such, there is a need for the Scottish Government to accelerate efforts with local authorities to develop more appropriate funding models, and deliver long-term budgetary plans as a signal to investors, and to industry, to mobilise skills and supply chains.
Open up benefits and beneficiaries
Recommendation 6: Open the benefits of local and community energy projects to as wide a range of people and places as possible, including everything from household decarbonisation and bill savings to skills and supply chains.
As evidenced throughout this report, local and community energy can carry substantial benefit against Scotland’s NJTOs and for local people and places more broadly.
However, not everyone can currently experience those benefits directly, due to financial, physical or other reasons. For instance, people on low incomes will struggle to buy in to community share offers and so will not receive any financial return from projects, nor have a say in project governance.
Similarly, people in the private rented sector or multi-occupancy buildings will struggle to benefit from initiatives which include new technologies or energy efficiency measures due to legal and physical challenges.
In addition, some of the benefits identified in previous sections of this report have yet to be fully enabled. This includes the realisation of new jobs and skills, which is a common issue in net zero energy delivery more broadly (Chitchyan and Bird, 2022; UKRI and Regen 2022b).
Beyond the recommendations already provided, there is thus a need to consider how to enable benefits of all kinds that reach a wider number of people, and that carry impact against Scotland’s net zero, energy and just transition ambitions at scale.
Action: Conduct policy engagement with identified groups (e.g. low incomes, those in the private rented sector and multi-occupancy buildings) to establish new ways for them to participate in and benefit from local and community energy projects
Where local or community energy projects include installing measures in people’s homes which deliver financial, health or environmental value – such as solar and storage, heat pumps, heat networks, efficiency or as part of wider local energy systems – certain groups face key barriers to benefitting directly.
Research such as that by Knox et al (2022) outline how people living in the private rented sector in particular will struggle to participate and experience benefit due to legal questions over ownership and responsibility. This is also true of those living in flats with different housing tenures.
People living on lower incomes will likewise struggle to invest in community share offers, meaning they have limited opportunity to gain individual returns or participate in the governance of projects that require up-front investment as a result.
As such, there is a need to work directly with these groups, tenant associations such as Living Rent, landlords and local authorities to develop frameworks that allow people living in those situations to also participate and benefit. As outlined by our People’s Panel, this should also encourage projects to deliver wide benefits to the local community, not based solely on ability to pay or invest.
Action: Work with education and training providers, industry, and local energy stakeholders to set out the skills and business opportunities for local and community energy
Local jobs and skills are often slated as a key opportunity from local and community energy, including within the Scottish Government’s Local Energy Policy Statement (2021). However, these opportunities are still to materialise at scale in Scotland and the UK more broadly, with a stubborn reliance on volunteers in the community sector in particular (Institute for Public Policy Research, 2023; UKRI and Regen, 2022; Community Energy Scotland 2022; Climate Change Committee 2023).
Reviewing the Heat in Buildings Supply Chain Delivery Plans and Climate Emergency Skills Action Plan (CESAP) could provide an opportunity to outline requirements for local energy skills specifically. This could include working with energy and training organisations such as Skills Development Scotland and local and community energy partners including industry and local authorities, to provide a clear analysis of opportunities within the local and community energy sectors.
This could also include specific assessment of the jobs and skills needed to deliver on the 2 gigawatt target (and to enable local and community energy at scale more broadly), and an articulation of pathways for people and businesses to access new opportunities.
Policy dependencies and responsibilities
Policy dependencies
Outside of the immediate local and community energy policy space, there are some key policy interdependencies that should be considered when aiming to better enable local and community energy approaches. Working across these areas will be crucial to ensuring effective delivery of local and community energy going forward.
Based on the research covered in this report and Regen’s own critical analysis, Table 8 sets out potential additional actions for a (non-exhaustive) list of key dependencies that could help move local and community energy forwards for just transition outcomes.
Table 8: Policy dependencies and suggested actions
| Policy/area | Suggested action(s) |
| Community Wealth Building | Explore the specific findings from the current Community Wealth Building consultation (2023) around local and community energy, in light of the analysis and recommendations presented within this work. |
| Heat in Buildings (HiB) Strategy | Identify opportunities for local and community models to formally support a more inclusive heat and efficiency transition within LHEES, including reaching those in the private rented sector.Develop local and community demonstration projects targeted to support those in fuel poverty and assess their scalability, in line with Scottish Government statutory targets to eradicate fuel poverty by 2040. |
| National Public Energy Agency | Establish role of NPEA in supporting community energy, heat and efficiency approaches, and expected role in supporting local authority project delivery, including potential for coordinating investment. |
| National Planning Framework 4 | Prioritise community projects and ensure consideration of community ownership opportunities in planning decisions, particularly which speak to just transition outcomes and key climate adaptation, resilience, and environmental protection standards. |
| Land reform and community right-to-buy | Research the viability of community-owned land and energy together, with a focus on the business model and widening access to identify suitable sites both rurally and in towns and cities.This should include local authorities as a potential buyer/seller of land, and discussions with partners such as Crown Estate Scotland. |
| Heat Networks (Scotland) Act (2021) | Ensure timely delivery of the regulatory provisions set out in the Heat Networks Act within the 2024 timeframe to enable rollout and acceleration of heat networks across Scotland, particularly for local authorities.Encourage consideration of local and community approaches that can enable better just transition outcomes and benefits for other key dependencies, such as in tackling fuel poverty. |
Reserved policy areas
As aspects of energy policy and regulation in the UK are reserved, there are limitations to the work that Scottish Government can do to fully enable local and community energy. Many of the policies required to support local and community energy – particularly in energy market regulations which govern electricity supply, Feed-in Tariffs or Contracts for Difference, and recognising the value that local energy systems can offer to the energy system more widely within regulatory incentives – are not within the Scottish Government’s remit.
However, there are a number of key reform packages and opportunities currently open to the Scottish Government to seek to influence the UK Government to promote Scotland’s local and community energy and just transition ambitions. These include but are not limited to:
- Review of Electricity Market Arrangements (DESNZ, REMA)
- Contracts for Difference (DESNZ, separately and under REMA)
- Review of Local Governance and Institutions and the development of the regional energy strategic planner (Ofgem)
- Grid connections reform (Ofgem, National Grid ESO)
Table 9 gives a high-level overview of key reserved issues. This sets out some of the primary issues, how primed each currently is for delivery, and some suggestions for what is required to meet Scotland’s local and community energy and just transition ambitions at once.
Table 9: Reserved issues
| Issue | Issue | Need | Opportunities for influence | Benefit |
| Revenue certainty | Absence of Feed-in Tariff and comparatively low Smart Export Guarantee makes for challenging financial proposition. | Predictable revenue stream for local and community generators, potentially through a Contracts for Difference scheme or similar. | Reform of Contracts for Difference and Review of Electricity Market Arrangements. | Revenue certainty for new projects, allowing for expansion of LCE overall and new income for JT outcomes. |
| Grid connections | LCE struggling to compete with established developers for grid connections, long delays in queue management. | Priority (or parity) within grid connections process, recognising value of LCE; more proactive collaboration from DNOs to support LCE in the process. | Ofgem grid connections review, ongoing engagement with DNOs (particularly SPEN and SSEN with Just Transition strategies). | LCE can connect to the grid more easily, allowing projects to come online faster and generate benefit. |
| Centralised planning of energy system | Energy system planning still very centralised in the UK, with limited local input at present. | Energy system planning that recognises opportunity of LCE and includes local and community partners within the process directly. | Regional Energy Strategic Planner consultation and detailed design phase (next step of review of Local Governance and Institutions), DNO move towards system optimiser role; Consultation on Distributed Flex. | More localised thinking in energy system planning, with more locally-minded solutions and value. |
Conclusions
This report has analysed the potential role of local and community energy in delivering against Scotland’s National Just Transition Outcomes. This analysis and the subsequent recommendations have been informed by extensive review of literature and research, stakeholder engagement and discussion with citizens directly via our People’s Panel.
From this analysis, it is clear that local and community energy can be a critical part of Scotland’s just transition ambitions, contributing across all of Scotland’s National Just Transition Outcomes. This contribution could be supported through locally-tailored solutions and maximising inclusive ownership, participation, governance and benefit captured from Scotland’s immense energy landscape.
Enabling this requires supporting the growth of the local and community sectors overall, and building just transition principles into those projects and processes. The ambitions and recommendations throughout this report set out how to achieve this in practise, with key actions for Scottish policymakers and delivery partners.
Our research has also found key barriers to delivering against these outcomes across sectors: limited resources to build capacity for local and community energy projects in underserved areas; challenges around skills and project delivery processes particularly within local authorities; justice and equity issues within projects themselves; and lack of appropriate finance and business models.
Beyond the research and recommendations presented here, we identified other areas that would benefit from further, specific exploration within the local and community energy and wider energy sectors. These are:
- community ownership of land and housing, the role of local authorities in supporting these and how energy can be brought together within that; and,
- repowering and end-of-life onshore wind projects, and how local authorities and communities can start to take ownership of these; as many wind farms come to the end of their first contracts, there is a need to work with local energy stakeholders and developers to fully understand the potential for community ownership.
While relevant, more detailed analysis of these two issues would help shine a light on potential further opportunities for the local and community energy sectors, and on the delivery of even further value against Scotland’s National Just Transition Outcomes.
References
3Ci (2022). Regional investment forum https://www.3ci.org.uk/3ci-and-third-party-events/regional-net-zero-investment-forum-glasgow Accessed May 2023
Aquatera (2021). Community owned wind farms have paid their communities 34 times more than commercial counterparts https://www.aquatera.co.uk/news/community-owned-wind-farms-have-paid-their-communities-34-times-more-than-commercial-counterparts Accessed May 2023
Arvanitopoulos, T., Wilson, C. and Ferrini, S. (2022). Local conditions for the decentralization of energy systems, Regional Studies https://doi.org/10.1080/00343404.2022.2131756
Bird, C. and Chitchyan, R. (2023). Smart local energy systems: Training needs and provision. EnergyREV, University of Strathclyde Publishing: Glasgow, UK. ISBN 978-1-914241-36-9
Brighton Energy Coop (2021). Community solar accelerator https://www.brightonenergy.org.uk/2021/10/bec-launches-community-solar-accelerator-grant-scheme/ Accessed October 2023
Bristol City LEAP (2022). https://www.bristolcityleap.co.uk/ Accessed June 2023
Brummer, V. (2018). Community energy – benefits and barriers: A comparative literature review of community energy in UK, Germany and the USA: the benefits it provides for society, and the barriers it faces. Renewable and Sustainable Energy Reviews, 94, 187-196 https://doi.org/10.1016/j.rser.2018.06.013
Cairns, I., Hannon, M., Braunholtz-Speight, T., McLachlan, C., Mander, S., Hardy, J., Sharmina, M. and Manderson, E. (2023). Financing grassroots innovation diffusion pathways: the case of UK community energy https://doi.org/10.1016/j.eist.2022.11.004
Cambridgeshire County Council (2023). About Swaffham Prior’s Heat Network. https://www.cambridgeshire.gov.uk/residents/climate-change-energy-and-environment/climate-change-action/low-carbon-energy/community-heating/swaffham-prior-heat-network/about-swaffham-priors-heat-network Accessed October 2023
Charge My Street (2023). Charge My Street https://chargemystreet.co.uk/ Accessed October 2023
Chitchyan, R. and Bird, C. (2022). Skills for Smart Local Energy System: Integrated case study report. EnergyREV, University of Strathclyde Publishing: Glasgow, UK. ISBN 978-1-914241-10-9
Citizens Advice (2023). “Our bleakest-ever start to the year” – number of people helped by Citizens Advice at record high. https://www.citizensadvice.org.uk/about-us/about-us1/media/press-releases/our-bleakest-ever-start-to-the-year-number-of-people-helped-by-citizens-advice-at-record-high/#:~:text=The%20number%20of%20people%20helped,the%20enormous%20pressures%20facing%20households. Accessed August 2023
City of Edinburgh Council (2014). Edinburgh Community Solar Cooperative Proposal – referral from Corporate Policy and Strategy Committee. https://democracy.edinburgh.gov.uk/Data/Transport%20and%20Environment%20Committee/20140114/Agenda/item_no_84_-_edinburgh_community_solar_co-operative_proposal_-_referral_from_the_corporate_policy_and_strategy_comm.pdf
Climate Change Committee (2023). A Net Zero Workforce. https://www.theccc.org.uk/wp-content/uploads/2023/05/CCC-A-Net-Zero-Workforce-Web.pdf Accessed 3rd October 2023
Community Energy Scotland (2022). State of the Sector report. https://communityenergyscotland.org.uk/wp-content/uploads/2022/06/UK-State-of-the-Sector-Report-2022_Full_Version.pdf Accessed May 2023
Community Energy England (2022). State of the Sector report. https://communityenergyengland.org/files/document/626/1655376945_CommunityEnergyStateoftheSectorUKReport2022.pdf Accessed May 2023
Creamer, E., Taylor Aiken, G., van Veelen, B., Walker, G., and Devine-Wright, P. (2019). Community renewable energy: What does it do? In Walker and Devine-Wright (2008) Ten years on. Energy Research and Social Science, 57 https://doi.org/10.1016/j.erss.2019.101223
Crown Commercial Services (2020). Introduction to Power Purchase Agreements. https://assets.crowncommercial.gov.uk/wp-content/uploads/Power-Purchase-Agreements-PPA-An-Introduction-to-PPAs.pdf Accessed November 2022
Devine-Wright, P. (2019). Community versus local energy in a time of climate emergency, Nature Energy, 4, 894-896 https://doi.org/10.1038/s41560-019-0459-2
Energy Savings Trust (2023. Plugged-in communities Scotland https://energysavingtrust.org.uk/grants-and-loans/plugged-communities-grant-fund/ Accessed October 2023
Energy Systems Catapult (2023). Smart local energy systems https://es.catapult.org.uk/tools-and-labs/our-place-based-net-zero-toolkit/smart-local-energy-systems/#:~:text=A%20Smart%20Local%20Energy%20System,quickly%20and%20more%20cost%20effectively. Accessed May 2023
Engage Stirling (2023). Stirling and Clackmannanshire Regional Energy Masterplan https://engage.stirling.gov.uk/en-GB/projects/regional-energy-masterplan Accessed June 2023
FES (2023). Stirling Renewable Heat Project. https://www.fes-group.co.uk/project/stirling-energy-centre-and-district-heating-scheme/ Accessed October 2023
Ford, R., Maidment, C., Fell, M., Vigurs, C. and Morris, M. (2019). A framework for understanding and conceptualizing smart local energy systems https://www.energyrev.org.uk/media/1298/energyrev-sles-frameworkv4.pdf
Gooding, L., Ford, R. and Bray, R. (2020). 40 benefits of smart local energy systems https://www.energyrev.org.uk/news-events/blogs/40-benefits-of-smart-local-energy-systems-highlighting-diversity-of-impacts-on-stakeholders/ Accessed May 2023
Green Finance Institute (2022). Mobilising local net zero investments: challenges and opportunities for local authority financing https://www.ukri.org/wp-content/uploads/2022/07/IUK-18082022-MobilisingNetZeroInvestments.pdf Accessed 3rd October 2023
Hanke, F., Guyet, R., and Feenstra, M. (2021). Do renewable energy communities deliver energy justice? Exploring insights from 71 European cases https://doi.org/10.1016/j.erss.2021.102244
Hewitt, R. J., Bradley, N., Compangucci, A. B., Barlagne, C., Ceglarz, A., Cremades, R., McKeen, M., Otto, I. M. and Slee, B. (2019). Social Innovation in Community Energy in Europe: A Review of the Evidence. Frontiers in Energy Research, Vol. 7. https://doi.org/10.3389/fenrg.2019.00031
Hopkins, E., Potoglou, D., Orford, S. and Cipcigan, L. (2023). Can the equitable rollout of electric vehicle charging infrastructure be achieved? Renewable and Sustainable Energy Reviews https://doi.org/10.1016/j.rser.2023.113398
Huggins, S. (2020). Developing and ethical framework for local energy approaches https://project-leo.co.uk/wp-content/uploads/2020/11/Project-LEO-ethical-framework-2020-final_ext.pdf
Institute for Public Policy Research (2023). From missed chances to green advances: the case for a green industrial strategy. https://www.ippr.org/research/publications/from-missed-chances-to-green-advances Accessed 5th October 2023
Just Transition Commission (2023). https://www.justtransition.scot/ Accessed October 2023
Knox, S., Hannon, M., Stewart, F., and Ford, R. (2022). The (in)justices of smart local energy systems: A systematic review, integrated framework, and research agenda. Energy Research and Social Science https://doi.org/10.1016/j.erss.2021.102333
Local Energy Scotland (2023a). Heat https://localenergy.scot/hub/heat Accessed May 2023
Local Energy Scotland (2023b). Community heat development programme https://localenergy.scot/funding/community-heat-development-programme/ Accessed May 2023
Loco Home Retrofit (2023). https://locohome.coop/about/ Accessed May 2023
Midlothian Council (2022). From waste to low carbon heating for Midlothian homes https://www.midlothian.gov.uk/news/article/3449/from_waste_to_low-carbon_heating_for_midlothian_homes
North Ayrshire council (2020). Community Wealth Building strategy https://www.north-ayrshire.gov.uk/Documents/nac-cwb-strategy-brochure.pdf Accessed May 2023
Ofgem (2023). Local energy system governance for a net zero future. https://www.ofgem.gov.uk/news-and-views/blog/local-energy-system-governance-net-zero-future Accessed 3rd October 2023
People Powered Retrofit (2021). https://carbon.coop/portfolio/people-powered-retrofit/ Accessed June 2023
PwC (2022). Accelerating Net Zero Delivery: Unlocking the benefits of climate action in UK city-regions https://www.ukri.org/wp-content/uploads/2022/03/IUK-090322-AcceleratingNetZeroDelivery-UnlockingBenefitsClimateActionUKCityRegions.pdf Accessed May 2023
Regen (2022). The local delivery of clean heat https://regensw.wpenginepowered.com/wp-content/uploads/Regen-Local-Delivery-of-Heat.pdf Accessed May 2023
Regen (2022). Delivering local benefit from offshore renewables https://regensw.wpenginepowered.com/wp-content/uploads/Delivering-local-benefit-from-offshore-renewables.pdf Accessed May 2023
Regen (2023). Community Energy. https://www.regen.co.uk/community-energy/ Accessed December 2023
Scottish and Southern Electricity Networks (2022). SSEN partners with visionary Dundee City Council on £343,000 RESOP project https://www.ssen.co.uk/news-views/2020/2020-ssen-partners-with-dundee-city-council-resop-project/ Accessed May 2023
Scottish Energy Statistics Hub (2023). Local Energy https://scotland.shinyapps.io/sg-scottish-energy-statistics/?Section=LocalEnergy&Chart=LocalRenewables Accessed May 2023
Scottish Government (2019). Good Practice Principles for Shared Ownership of Onshore Renewable Energy Developments https://www.gov.scot/publications/scottish-government-good-practice-principles-shared-ownership-onshore-renewable-energy-developments/ Accessed May 2023
Scottish Government (2021a). Local energy policy statement https://www.gov.scot/publications/local-energy-policy-statement/ Accessed May 2023
Scottish Government (2021b). Just Transition – a Fairer, Greener Scotland: Scottish Government response https://www.gov.scot/publications/transition-fairer-greener-scotland/ Accessed May 2023
Scottish Government (2021c). Heat in Buildings Strategy https://www.gov.scot/publications/heat-buildings-strategy-achieving-net-zero-emissions-scotlands-buildings/ Accessed May 2023
Scottish Government (2022a). Local Heat and Energy Efficiency Strategies and delivery plans – guidance https://www.gov.scot/publications/local-heat-energy-efficiency-strategies-delivery-plans-guidance/pages/2/ Accessed March 2023
Scottish Government (2022b). Scottish Government, 2022. What are Scotland’s National Just Transition Outcomes? https://consult.gov.scot/just-transition/scotlands-just-transition-outcomes/ Accessed January 2023
Scottish Government (2023a). Draft energy strategy and just transition plan https://www.gov.scot/publications/draft-energy-strategy-transition-plan/ Accessed May 2023
Scottish Government (2023b). Renewable and low carbon energy. https://www.gov.scot/policies/renewable-and-low-carbon-energy/local-and-small-scale-renewables/ Accessed May 2023
Scottish Government (2023c). Onshore wind sector deal https://www.gov.scot/publications/onshore-wind-sector-deal-scotland/ Accessed September 2023
Scottish Government (2023d). Cities and regions: community wealth building https://www.gov.scot/policies/cities-regions/community-wealth-building/ Accessed May 2023
Scottish Parliament (2023). The role of local government and its cross-sectoral partners in delivering a net zero Scotland https://digitalpublications.parliament.scot/Committees/Report/NZET/2023/1/23/2c9752ff-eb3f-4273-8f78-e726676a3b6e#Introduction Accessed May 2023
Slee, B. (2020). Social innovation in community energy in Scotland: Institutional form and sustainability outcomes. Global Transitions, Vol. 2, https://doi.org/10.1016/j.glt.2020.07.001
Stewart, F. (2021). All for sun, sun for all: Can community energy help overcome socioeconomic inequalities in the uptake of low carbon technologies? Energy Policy, 157 https://doi.org/10.1016/j.enpol.2021.112512
Sustainable Energy Futures Led (2023). Enabling decentralized energy innovation. Available at: https://www.ukri.org/wp-content/uploads/2023/02/IUK-03022023-Enabling-Decentralised-Energy-Innovation.pdf Accessed May 2023
The Heat Project Blairgowrie (2023). https://www.theheatproject.org/ Accessed October 2023
UKRI (2023). Prospering from the Energy Revolution https://www.ukri.org/what-we-do/our-main-funds-and-areas-of-support/browse-our-areas-of-investment-and-support/prospering-from-the-energy-revolution/#:~:text=The%20’prospering%20from%20the%20energy,and%20creating%20high%2Dvalue%20jobs. Accessed 10th October 2023
UKRI and Regen (2022a). Smart local energy systems: finance and investment https://www.ukri.org/publications/smart-local-energy-systems-finance-and-investment/ Accessed October 3rd 2023
UKRI and Regen (2022b). Smart local energy systems: skills and capabilities https://www.ukri.org/publications/smart-local-energy-systems-skills-and-capabilities/ Accessed May 2023
Welsh Government (2022). Local and shared ownership of energy projects in Wales. https://www.gov.wales/sites/default/files/publications/2022-06/guidance-local-and-shared-ownership-of-energy-projects-in-wales_0.pdf Accessed 3rd October 2023
Yeow, J., Rigby, J. and Li, Y. (2017). The Effect of a Government Target for the Procurement of Innovation: The Case of the UK’s Small Business Research Initiative. In: Thai, K. (eds) Global Public Procurement Theories and Practices. Public Administration, Governance and Globalization, vol 18. Springer, Cham. https://doi.org/10.1007/978-3-319-49280-3_7
Appendices
Appendix A: Methodology
We used three key methods in the delivery of this project. These were:
- Systematic review of academic and policy literature
- Interviews with key stakeholders
- Deliberative “People’s Panel” with Scottish citizens (Appendix B)
These methods were selected to give us as rounded a view of the opportunities and barriers for local and community energy as possible. More details on review and interviews are given below, with a more extensive overview of the People’s Panel in Appendix B.
Systematic review of academic and policy literature
Leveraging previous academic expertise of the project team, we conducted a review of relevant literature in the field of local and community energy with reference to a just transition. In total, we reviewed nearly 100 documents, including peer-reviewed journal articles, consultant reports, case studies, and policy documents from the Scottish and UK Governments.
Articles were sourced using search terms in Google Scholar. We first searched “local energy”, “community energy”, and “just transition”. We then expanded our search to include local/community energy and the different just transition outcomes.
Policy documents were sourced from the Scottish and UK Government websites, online search engine searches, and early informal interviews with key local and community energy policy experts. Within Regen we have vast experience of the local and community energy space, including developing the Community Energy England, Scotland and Wales state of the sector reports for 2021; delivering ongoing engagement and convening with community energy organisations and the wider energy sector via our network-funded communities programme (Regen 2023); and advocating for community energy within policy and regulatory consultations such as delivering benefits from offshore wind (and supporting community organisations to do the same). Finally, we sourced cases by reviewing innovation projects such as Prospering from the Energy Revolution, and through asking stakeholders for recent developments.
Once documents were sourced, they were reviewed for evidence and analysis around the eight NJTOs specifically, as well as lessons for delivering more just processes and outcomes. These were collated within a single spreadsheet, with this spreadsheet then discussed by the project team to establish key themes and content.
Interviews with key stakeholders
Once this review was complete, we interviewed 22 key expert stakeholders working across local and community energy, community energy organisations, local authorities, innovation, renewable energy businesses, equalities and social justice, just transitions, and third sector. This diverse base of people was chosen to help give a rounded view not just of local and community energy, but to glean insights from relevant sectors to help shape a future look at local and community energy to ensure it works for NJTOs. These were identified through existing Regen, Scottish Government and industry networks.
It is worth noting that there was higher representation from both citizens and local and community energy practitioners than e.g. renewable energy developers and businesses in this process. This was deliberate – citizens and local and community organisations, particularly those working on just transition issues, have been less often engaged in such discussions yet can provide crucial insights on how to best open up local and community energy for a wider range of just transition outcomes. However, recommendations in turn reflect more the perspective of those stakeholders. Further engagement with energy developers and businesses would help make recommendations more robust.
These interviews took place online during the months of February-April 2023. Each lasted between 45 minutes and 1 hour. Feedback was anonymised during the analysis process. We asked specifically where people had seen local and community energy working for just transition outcomes already, the key issues that local and community energy might face in working for just transition outcomes or processes, where they felt local and community energy could add more JT value with the right support, and how we could best enable this (relevant to people’s area of expertise). Questions were developed from a combination of evidence from the literature review, and to target the key research aims of the work agreed at project inception.
To supplement, we also held an informal online workshop of local and community energy stakeholders in the UK, to discuss these themes in an open forum with experts from a more technical and specialist perspective. In this workshop, stakeholders included some of those interviewed, but were mostly made up of local and community energy stakeholders from outside Scotland, allowing us to glean a more rounded view of the sector and recent developments elsewhere in the UK. This workshop did not influence recommendations directly, but rather helped us track any new and emerging trends in this space identify key just transition questions (particularly around local project processes, innovation, system operation and governance) for further investigation in the Scottish context.
Appendix B: People’s Panel
To fully understand how local and community energy can support all communities and regions across Scotland, Regen commissioned Shared Future to co-design and run a People’s Panel.
A People’s Panel is a deliberative process, bringing together citizens from a sample of the population to learn about a topic and ‘co-design’ policy recommendations. People’s Panels, and other types of deliberative processes, are particularly powerful tools for addressing policy issues that impact and involve people. They allow for ideas – such as different models of community and local energy – to be tested amongst the target population, they help explore barriers around engagement and participation, and they add democratic legitimacy to policy development. The goal of our People’s Panel was to answer the question:
“The way we use energy in our homes and communities is changing, with many communities and councils developing their own solutions.
How should this be done so that it involves and benefits people in a fair way?”
To address this question, Shared Future recruited 22 people from across Scotland to participate in four online sessions over the course of three weeks. In these sessions, participants hear from ‘expert witnesses’ who present on the relevant topic of the day in clear terms, with participants discussing what they’ve heard and questioning witnesses for more information.
Expert witnesses were chosen by the wider project team (including our academic steering group) as people who either (a) were considered experts or leading practitioners in their field, and/or (b) led an interesting real-world case study. This did not include a “traditional” commercial renewable energy developer. Experts were briefed extensively by the Shared Future team as an impartial partner, to eliminate biases and ensure that presentations were as clear and understandable as possible. The aim was not to promote local and community energy, but to present participants with different models, examples and ideas to understand their perspectives. We had two expert witnesses per each session, covering:
- How the energy system works and how it is changing to become more local and renewable (energy systems expert Calum Watkins – Smarter Grid Solutions, and local energy expert Rebecca Windermere – Regen)
- Community energy (Glasgow Community Energy; Local Energy Scotland who replaced Community Energy Scotland due to scheduling clashes)
- Local energy (North Ayrshire Council; the Blairgowrie Heat Project; smart local energy expert Jess Britton – UKERC) and
- Larger developments and shared ownership (Ripple Energy, Local Energy Scotland)
From these sessions with witnesses and wider discussions, participants then deliberated and worked together to identify 20 key principles for developing local and community energy such that it involves and benefits people in a fair way. These are grouped into 7 key themes (below).
Of these participants, only 1 had heard of local or community energy before. A stratified random sample of the population was used to gain perspectives from people who had not worked in this space before, and from diverse social and economic backgrounds. The same 22 participants attended each session, and were paid £110 each in vouchers of their choosing for their time.
Theme 1) Definitions
This theme relates to clarity of definitions surrounding the energy project itself, the roles and responsibilities of those involved, and the budget.
It includes three principles:
- How the project will work is clear; how long it will last, what are the personal and community benefits of being involved etc. This is made easy to understand.
- It has been agreed and is clear what roles and responsibilities there are and how much time commitment is needed by people who want to take part. This will enable people to play to their strengths and feel ownership.
- Transparency of the budget is clear to all.
Theme 2) Goals and outcomes
This theme brings focus to how aims, success metrics, shared values, priorities, and benefits are established within local and community energy developments.
It includes four principles:
- The aims of the project and what success looks like is clear to all and has been agreed by consensus.
- Shared values are agreed by all involved.
- Priorities are set but, not everything at once, start small and scale it up as more people get interested.
- Fairness: everyone has to benefit, with benefits being evenly distributed.
Theme 3) Participation
This theme takes a very broad view of issues related to participation, including raising awareness of local and community energy generally, engagement and promotion within the community itself, participation opportunities across the whole community, and routes for democratic governance structures.
This theme includes six principles:
- There must be large-scale awareness-raising of the concept of community/local energy so that everyone understands its benefits and what your individual / community entry point might be.
- Developers should be mandated to engage with communities at the earliest possible stage (before planning) to ensure that benefits are relevant to the community and to ensure that there is forward planning so that the community is happy with how the land, and any infrastructure, will be developed or left at the end of the project.
- The project is well promoted to everyone within the community.
- Collaboration is encouraged so that lots of people can get involved and work together sharing lots of ideas.
- Flexibility means that input can be heard from all parts of the community.
- The way that decisions are made is clear and agreed. It is democratic so people are able to express views, and misgivings, it is not controlled by one person and all who have a share (no matter how small) have a vote. At least a proportion of shares must be affordable for those on a low income. Changes are consulted on.
Theme 4) Support and risk
This theme talks to the processes of delivering local and community energy developments, ensuring that support is provided to the community to support project engagement or delivery, and that risks to the community are minimised.
It includes two principles:
- There is support in place all the way through the project so that no-one feels left alone and appropriate extra training is provided. Funding for community-sourced leadership roles should be mandated where it supports equitable and consistent involvement.
- No unnecessary risks are taken.
Theme 5) Local use of energy
This theme relates to Panel members’ perspectives that energy generated locally should also be used locally. It includes one principle:
- Wherever possible the energy generated should be used by the local community.
Theme 6) Shared ownership opportunities
This theme focuses specifically on shared ownership energy models and talks to the mechanisms through which people can get involved with shared ownership projects.
It includes two principles:
- In a shared ownership project, there must be the opportunity to invest throughout the lifetime of the project and a clearly defined timeframe for how long it will remain publicly owned.
- In shared ownership projects, developers should have profits capped at a percentage level to ensure they are not making excessive profits whilst there are any households left sitting in the cold.
Theme 7) Roles for government
This theme speaks to the structures that need to be put in place to support the fair growth of community and local energy across Scotland. While many of the other principles and themes relate to specific instances of community and local energy development, this theme is more focussed on widespread action and equality of opportunity across the country.
It includes two principles:
- There has to be conclusive and resounding support (investment and policy) from all levels of government that mean widespread community and local energy is a reality across all our communities.
- To help ensure fairness, national government needs to ensure that all councils are a) able to invest in community energy projects and be held to account if they don’t do so and b) face a minimum of red tape in achieving innovation.
Support for Principles by theme
This theme
Figure 1 depicts the degree of support held by Panel members for each principle, grouped according to the seven themes outlines above.
Across all themes and principles, the average ratio of support (strongly support and support) to opposition (oppose and strongly oppose) is 52:1. For every vote of opposition, there were 52 votes in support, with only 6 total votes opposing principles in total, showing overwhelming agreement with almost all principles developed.
Appendix C: Local and community energy just transition outcome impacts
Table: Community energy
| Local and community energy approach | Generation and supply | Heat and energy efficiency | Transport |
| Overview | Community owned wind turbines or solar panels, usually on shared buildings or land. | Clean heating technologies in local buildings or community centres; district heating networks; collective | Community electric vehicle car sharing, charging, and active travel initiatives. |
| Citizens, communities and place | Democratic ownership and governance for local interest. Revenues used to develop local places and bring people together around a collective, locally owned good. | Locally tailored solutions; ’warm spaces’, reduced bills for community hubs; learning and dissemination; bringing people together around a collective local good. | Travel solutions reflective of local places, access to vehicles and infrastructure. |
| Jobs, skills and education | New roles in capacity building and development; potential for using community benefit to deliver training or employment opportunities, CE groups often conduct climate education and outreach. | Installation of new technologies requires jobs in trades and engineering; training for those shifting from gas to clean heating, and providing EE solutions, sharing lessons from decarbonised community spaces. | Can support switch to new climate-friendly behaviours, such as active travel or electric vehicle use. |
| Fair distribution of costs and benefits | Money raised from public funds and by those with capital, with benefit then realised in the community. However, typically only those who contribute financially get a say, plus a direct return on investment. | Benefits depend on type of project. Scope to raise substantial capital but technical barriers such as location of demand, building type, housing tenure etc. Can help link people to support, improving health and social outcomes. | Access to new modes of transport for people who otherwise may not be able to afford it; social and health benefits funded by community share offer or public funds. |
| Business and economy | Limited business and economy impact, although opportunities for businesses to benefit through decarbonisation and investment. | Opportunity for new clean heat businesses to deliver projects on-the-ground. | EV charging and infrastructure providers, better connected places opening new opportunities for people in work and leisure. |
| Adaptation and resilience | Revenues used for climate adaption such as defences in flood-prone areas, or making buildings more efficient to deal with extreme temperatures. | Less reliance on fossil fuels for heating; more efficient and comfortable buildings. | Less dependence on fossil-based transport; improved health outcomes through reduced emissions and greater mobility. |
| Environmental protection and restoration | CE volunteers often tie-in work with local climate and environmental action, such as tending to communal green spaces and community gardening. | Less direct benefit here. | Less direct benefit here. |
| Decarbonisation and efficiencies | Directly contributing to decarbonising of electricity supply, revenues can be used to decarbonise local buildings. | Direct decarbonisation of heat, often paired with energy efficiency, improved health and social outcomes. | Direct decarbonisation of transport and increased use of active alternatives. |
| Equality and human rights | Democratic ownership of renewable energy redistributes power from large companies to local people. Scope to redress inequalities locally and support e.g. child and fuel poverty. | Potential to deliver clean heat at a local level, overcoming some of the financial and social barriers faced by particularly lower income groups | Better connected people and places; reduced rates of ‘transport poverty’; more options for people to travel locally. |
Table: Local energy
| Local and community energy approach | Generation and supply | Heat and energy efficiency | Transport |
| Overview | Wind turbines, solar PV and hydro projects led predominantly by local authorities, social housing providers, or the public sector. | Clean heating technologies (e.g., heat pumps, district heat networks) and efficiency measures (e.g., insulation) delivered in social or council housing stock. | Electric vehicle charging infrastructure, active travel initiatives such as e-bikes. |
| Citizens, communities and place | Locally owned energy projects, generating revenue for e.g. fuel poverty alleviation and Community Wealth Building. | Heat pumps and efficiency in council, social, or public sector buildings and district heat networks serving local houses, businesses and industry. | Travel solutions reflective of local places, access to vehicles and infrastructure. |
| Jobs, skills and education | Typically larger-scale revenues compared to community model for e.g. delivering energy efficiency, requiring skills in trades and installation. | Can require significant numbers of workers to deliver – training opportunities for trades and gas engineers. | Can support switch to new climate-friendly behaviours, such as active travel or electric vehicle use. |
| Fair distribution of costs and benefits | Public or private finance leveraged for more ’just’ outcomes such as addressing fuel poverty. Risk that benefits to the community are limited — need for meaningful community input/ownership/just transition value to maximise benefits. | Public or private finance leveraged for more ’just’ outcomes, often delivering clean heating directly. Can help link people to support, improving health and social outcomes However, can be exclusive of those in the private rented sector, and reliant on grant support / limited local coverage. | Public or private finance to fund initiatives for public, although can often be limited to central urban areas. |
| Business and economy | Opportunity for renewable energy developers and businesses to deliver projects, improved local development leading to more active economic participation. | Opportunities for clean heat developers on heat networks in particular, and for heat pump developers. | Opportunities for e.g. e-bike companies or EV charging providers. |
| Adaptation and resilience | Dependant on how revenues are spent. | Less reliant on fossil fuels for heating, more efficient and comfortable buildings. | Less direct benefit here. |
| Environmental protection and restoration | Dependant on how revenues are spent. | Less direct benefit here. | Less direct benefit here. |
| Decarbonisation and efficiencies | Direct decarbonisation of electricity supply in council or social building stock. | Direct decarbonisation of heat, often paired with energy efficiency, improved health and social outcomes. | Direct decarbonisation of transport and increased use of active alternatives. |
| Equality and human rights | Less direct equalities impact, but can use strong engagement and CWB principles to deliver against e.g. child poverty or develop more inclusive projects. | Opportunity to deliver clean heat at a local level, tailoring to local need, overcoming some of the financial and social barriers faced by particularly lower income groups. | Better connected people and places; reduced rates of ‘transport poverty’. |
Table: Integrated local energy systems
| Overview | Typically larger-scale (town or city-wide) interconnected electricity generation, supply, demand, storage, transport, heat, and efficiency. Brought together at a local level using data and digitalisation. |
| Citizens, communities and place | Well-connected energy systems across all energy vectors, tailored to local need and maximising local value through optimised energy sharing, smart supply and demand. |
| Jobs, skills and education | Range of jobs and skills required, from project management to data science to trades, installers, legal support and policy expertise. |
| Fair distribution of costs and benefits | Public or private finance leveraged for more ’just’ outcomes. Risk that benefits to the4 community are limited. Also exclusive of private rented sector. Need for meaningful community input/ownership. |
| Business and economy | Range of business opportunities in: energy innovation and optimisation, data science, software development, trades and installation, renewable energy developers, transport and service providers. |
| Adaptation and resilience | Less direct benefit here, although can be matched up with local adaptation and resilience ambitions. |
| Environmental protection and restoration | Less direct benefit here, although can be matched up with local environmental protection and restoration ambitions. |
| Decarbonisation and efficiencies | Direct decarbonisation of energy, more efficient buildings, and cleaner transport. Can also support cost-effective grid decarbonisation. |
| Equality and human rights | Less direct benefit here. |
© The University of Edinburgh
Prepared by Regen on behalf of ClimateXChange, The University of Edinburgh. All rights reserved.
While every effort is made to ensure the information in this report is accurate, no legal responsibility is accepted for any errors, omissions or misleading statements. The views expressed represent those of the author(s), and do not necessarily represent those of the host institutions or funders.
www.climatexchange.org.uk
If you require the report in an alternative format such as a Word document, please contact info@climatexchange.org.uk or 0131 651 4783.
The purchase of goods, services and works can account for more than 70% of a public body’s overall greenhouse gas emissions in Scotland. These are referred to as indirect scope 3 emissions. Targeting these could result in significant emissions reduction across public bodies.
However, there are many challenges for public bodies in measuring, comparing and reporting these emissions. The goal of this research was to provide evidence for practical approaches and tools that public bodies can use to better understand and thereby reduce their indirect scope 3 emissions.
Methods included interviews and surveys with 72 public bodies and 67 suppliers, review of 75 relevant supply chain emission and related methodologies and tools.
Summary of findings
- Spend-based methodologies, which estimate emissions based on the financial value of goods and services, are the most commonly used. These can be useful to identify the areas of spend on procurement that produce the most estimated emissions. However, they only focus on lowering spend, rather than on reducing emissions, and do not provide sufficient detail on emissions throughout the supply chain. They are of limited use in that they can be used to identify emission hotspots but are not suitable for trends. They can also deter a ‘spend to save’ approach and perversely favour procurement of cheaper, less environmentally friendly options.
- Public bodies rely on spend-based methodologies due to limited availability of supply chain emissions data, and lacking time or resources to implement more sophisticated models.
- Public bodies are increasingly seeking emissions data from suppliers to help with more detailed understanding of emissions.
- Tools such as analytical tools and software improve data accuracy and detail, and may allow public bodies to integrate supplier data, where available.
- Tools used range from free to very costly. Some public bodies may seek to offset the cost by using the data to identify cost savings, which may also result in emissions reduction.
- A better understanding of supply chain emission methodologies and tools, and their limitations would be beneficial to some public bodies.
- There is varying confidence in applying relevant climate requirements within contracts, with some uncertainty regarding relevant clauses and limited use of climate related supplier selection requirements.
- Challenges faced by suppliers include how to assess and reduce their emissions, and public body requirements, which may include reporting of their emissions into multiple portals or systems.
For a full list of findings and further details please read the report.
If you require the report in an alternative format such as a Word document, please contact info@climatexchange.org.uk or 0131 651 4783.
Scotland is part of the UK Emissions Trading Scheme (UK ETS), the United Kingdom’s carbon emissions trading scheme. The scheme places an overall limit on emissions from large industrial sites and airlines, and facilitates the trading of emissions allowances within this limit.
The Scottish Government would like to understand how emissions from sites subject to the UK ETS are likely to evolve over the transition to net zero greenhouse gas emissions and the implications of steadily reducing the number of permits in the emissions trading scheme.
This study introduced a UK ETS accounting mechanism to the Scottish TIMES model, which is a diagnostic tool to help understand the key inter-relationships across the energy system. This will enable the Scottish Government to investigate these questions.
The Scottish TIMES model is being used by the Government to produce a new net zero pathway for Scotland to support its new Climate Change Plan.
Scottish TIMES does not distinguish between ETS and non-ETS emissions. By adding this capability, ETS emissions can be constrained separately to the overall Scottish emissions target.
The proportion of emissions subject to ETS was estimated for each sub-sector of Scottish TIMES and used to calculate ETS emissions in the model. A flexible mechanism was created to try to enable future changes to the UK ETS to be easily implemented. We created example scenarios with emission constraints and taxes for ETS emissions. A series of tests demonstrated that the model was working correctly.
For further information, please download the report.
If you require the report in an alternative format such as a Word document, please contact info@climatexchange.org.uk or 0131 651 4783.
December 2023
DOI: http://dx.doi.org/10.7488/era/3889
Executive summary
Aims and findings
Scotland is part of the UK Emissions Trading Scheme (UK ETS), the United Kingdom’s carbon emissions trading scheme. The scheme places an overall limit on emissions from large industrial sites and airlines, and facilitates the trading of emissions allowances within this limit.
The Scottish Government would like to understand how emissions from sites subject to the UK ETS are likely to evolve over the transition to net zero greenhouse gas emissions and the implications of steadily reducing the number of permits in the emissions trading scheme.
This study introduced a UK ETS accounting mechanism to the Scottish TIMES model, which is a diagnostic tool to help understand the key inter-relationships across the energy system. This will enable the Scottish Government to investigate these questions.
The Scottish TIMES model is being used by the Government to produce a new net zero pathway for Scotland to support its new Climate Change Plan.
Scottish TIMES does not distinguish between ETS and non-ETS emissions. By adding this capability, ETS emissions can be constrained separately to the overall Scottish emissions target.
The proportion of emissions subject to ETS was estimated for each sub-sector of Scottish TIMES and used to calculate ETS emissions in the model. A flexible mechanism was created to try to enable future changes to the UK ETS to be easily implemented. We created example scenarios with emission constraints and taxes for ETS emissions. A series of tests demonstrated that the model was working correctly.
Recommendations
Based on our research, we recommend that the Scottish Government consider:
- reviewing the ETS sites against the Scottish Greenhouse Gas Statistics to ensure that the data in both are accurate and consistent.
- cross-referencing the ETS site emissions and energy consumption, the Scottish Greenhouse Gas Statistics and the Scottish energy balance, to ensure that all sites in Scotland that are required to participate in the ETS are registered.
- ensuring the representation of gas networks in Scottish TIMES is consistent across the model and that the emission coefficients reflect all gas system losses.
- reviewing modelled emissions against actual emissions for the year 2020 to identify sectors of the economy where unrealistic decarbonisation pathways might have been created, and constrain those pathways appropriately.
Abbreviations
| AR4 | Assessment Report 4 from the IPCC |
| AR5 | Assessment Report 5 from the IPCC |
| CCP | Climate Change Plan |
| CHP | Combined heat and power |
| EU ETS | European Union Emissions Trading Scheme |
| GHG | Greenhouse gas |
| IEA | International Energy Agency |
| IPCC | Intergovernmental Panel on Climate Change |
| MW | Megawatts |
| OPRED | Offshore Petroleum Regulator for Environment and Decommissioning |
| PFC | Perfluorocarbons |
| SEPA | Scottish Environment Protection Agency |
| TIMES | An energy system model generator developed by the Energy Technology Systems Analysis Program (ETSAP), which is an International Energy Agency technology collaboration programme. |
| UK ETS | United Kingdom Emissions Trading Scheme |
| UNFCCC | United Nations Framework Convention on Climate Change |
Introduction
Scotland is part of the UK Emissions Trading Scheme (UK ETS). The Scottish Government wishes to: (i) understand how emissions from sites subject to ETS are likely to evolve over the transition to net zero; and, (ii) understand the implications of steadily reducing the number of permits in the emissions trading scheme on the transition.
The Scottish TIMES model is being used as part of a suite of analyses to inform a new net zero pathway for Scotland to support a new Climate Change Plan. The Scottish TIMES energy system model is built using the TIMES platform, which is developed by an International Energy Agency (IEA) technology collaboration programme and used in 63 countries. It contains a detailed and up-to-date depiction of all Scottish energy flows and greenhouse gas (GHG) emissions. It explores the potential future benefits of a wide range of low-carbon fuels and technologies.
Scottish TIMES currently does not distinguish between ETS and non-ETS emissions. Adding this capability to Scottish TIMES would enable ETS emissions to be constrained separately to the overall Scottish emissions target, or for different targets to be used for ETS and non-ETS emissions.
UK emissions accounting
The United Kingdom (UK) uses a range of approaches to emissions accounting for different applications:
- The United Nations Framework Convention on Climate Change (UNFCCC) accounting follows UNFCCC guidelines (e.g. moving from Assessment Report 4 (AR4) to Assessment Report 5 (AR5) global warming potentials by the end of 2024; counting F-gases separately).
- UK Climate Change Act 2008: restricts emissions of 6 GHGs/groups of GHGs.[1] The Scottish emissions budget includes all international aviation and shipping, and the UK Government has agreed to include international aviation and shipping from Carbon Budget 6 (2033–2037).
- The UK ETS applies to regulated activities that result in greenhouse gas emissions, including combustion of fuels on a site where combustion units with a total rated thermal input exceeding 20 megawatts (MW) are operated (except in installations where the primary purpose is the incineration of hazardous or municipal waste) (UK Government, 2023). Sites in Northern Ireland are excluded as these are part of the EU ETS instead. The UK ETS also includes domestic aviation and flights to Gibraltar and the European Economic Area. Other international aviation and all shipping are not included but could be in the future. Scottish participants can trade with the rest of the UK and might be able to trade with other non-UK ETSs in future.
- Some other schemes include non-UK emissions, for example for biomass sustainability.
We aimed to develop an emissions aggregation structure in Scottish TIMES in which all of these applications could be accounted for easily and transparently. We designed the approach to be relatively flexible to changes in these schemes (e.g. for shipping to be added to the ETS in the future).
Scottish UK ETS emissions
The UK ETS replaced the UK’s participation in the European Union Emissions Trading Scheme (EU ETS) on 1 January 2021. It covers emissions from two broad parts of the economy (UK Government, 2023a):
- Large industrial sites and power stations.
- Domestic aviation and flights to Gibraltar and the European Economic Area.
Each static site in the UK is treated individually. Regulation is devolved, with the Scottish Environment Protection Agency (SEPA) regulating Scottish sites. There are 72 sites in total in Scotland. Table 1 shows that most emissions are from a small number of power stations and large industrial plants.
All UK offshore oil and gas sites are regulated by the Offshore Petroleum Regulator for Environment and Decommissioning (OPRED) rather than SEPA. Many of these sites will be in Scottish waters. As Scottish TIMES does not cover offshore emissions, these were not included in this study. Offshore emissions are not part of Scottish territorial emissions and therefore are not included in Scotland’s Climate Change Plan either.
Aviation emissions are regulated in the country in which the operator is registered. Only one airline (Loganair) is registered in Scotland but many more aviation emissions involve Scotland.
Structure of this report
The methodology we used is discussed in Section 4. Section 5 analyses Scottish emissions covered by the ETS and derives ETS fractions for each Scottish TIMES sub-sector. Section 6 describes how we implemented ETS emissions accounting in Scottish TIMES. Section 6 discusses our quality assurance approach.
Method
The analytical approach we used is summarised in Figure 1.
The key challenges were estimating the fraction of emissions from each Scottish TIMES sub-sector that are covered by the UK ETS, or might be covered in future, and then to implement an accounting system for these emissions in Scottish TIMES.
The fraction of emissions covered by the UK ETS was estimated using two approaches. First, all ETS emission stationary sites and each overall emission category was assigned to a Scottish TIMES sub-sector (Sections 5.1 and 5.2). The total emissions in each sub-sector were then compared to estimate the fraction of emissions in the sub-sector covered by the UK ETS. A separate analysis was carried out for international aviation emissions, as only international flights to the EU are included in the UK ETS and only UK-wide statistics on flights were available from ETS statistics. Instead, an analysis of flights from Scottish airports was used to estimate the fraction of fuel use for EU destinations (Section 5.3).
A detailed accounting system for ETS and non-ETS emissions was implemented in the “ets_ucl” branch of Scottish TIMES by sub-sector (Section Error! Reference source not found.). A number of wider model changes were required to implement this accounting system. New example scenarios were created to separately limit ETS emissions from total emissions (Section Error! Reference source not found.) and to apply a carbon tax on ETS emissions (Section Error! Reference source not found.). The revised model was checked carefully to ensure that all emissions were covered (Section Error! Reference source not found.).
Table 1: Summary of Scottish sites subject to the UK ETS and their associated GHG emissions
| Description | Number of sites | GHG emissions (ktCO2e) | |
|---|---|---|---|
| 2021 | 2022 | ||
| Production of electricity | 16 | 1973 | 2181 |
| Manufacture of other organic basic chemicals | 2 | 1289 | 1304 |
| Manufacture of refined petroleum products | 2 | 910 | 1149 |
| Extraction of natural gas | 5 | 552 | 574 |
| Steam and air conditioning supply | 1 | 564 | 530 |
| Manufacture of cement | 1 | 459 | 444 |
| Extraction of crude petroleum | 2 | 350 | 322 |
| Distilling, rectifying and blending of spirits | 10 | 246 | 267 |
| Distribution of gaseous fuels through mains | 6 | 203 | 215 |
| Manufacture of hollow glass | 2 | 189 | 199 |
| Manufacture of basic pharmaceutical products | 2 | 136 | 130 |
| Manufacture of veneer sheets and wood-based panels | 3 | 96 | 77 |
| Aluminium production | 1 | 61 | 51 |
| Manufacture of other rubber products | 1 | 57 | 45 |
| Manufacture of paper and paperboard | 2 | 57 | 39 |
| Tertiary education | 2 | 33 | 32 |
| Manufacture of other food products | 1 | 30 | 27 |
| Treatment and disposal of non-hazardous waste | 1 | 20 | 22 |
| Defence activities | 2 | 24 | 21 |
| Manufacture of plastics in primary forms | 1 | 18 | 16 |
| Operation of dairies and cheese making | 1 | 11 | 10 |
| Manufacture of other non-metallic mineral products | 2 | 8 | 8 |
| Manufacture of basic iron and steel and of ferro-alloys | 2 | 10 | 7 |
| Manufacture of bricks, tiles and construction products, in baked clay | 1 | 6 | 6 |
| Quarrying of ornamental and building stone, limestone, gypsum, chalk and slate | 1 | 7 | 6 |
| Forging, pressing, stamping and roll-forming of metal; powder metallurgy | 1 | 9 | 4 |
| Engineering activities and related technical consultancy | 1 | 2 | 1 |
Figure 1. Analytical approach taken by this project
Analysis of emissions covered by the UK ETS
In Scottish TIMES, emissions accounting could be implemented at the level of sectors (e.g. industry; transport), sub-sectors or individual technologies. Sectors can be quite broad in nature so applying the scheme across a whole sector would be inappropriate as emissions could be cut in areas not subject to the ETS. As individual technologies require a level of detail for the real-world economy that is not available in the model (e.g. categorising all food and drink industries in what is a very diverse sector), this was not a practical option. We therefore estimated fractions by sub-sector and where possible chose our sub-sectors to reflect sites that were likely or not to be part of the ETS.
Table 2 shows the Scottish TIMES sub-sectors that were used to categorise ETS activities and Scottish Greenhouse Gas Statistics data. Sites with larger emissions such as refineries, upstream oil and gas and chemical plants are in sub-sectors where most emissions are subject to the ETS.
Table 2: Scottish TIMES sectors, sub-sectors, and descriptions
| Sector | Description | Sub-sector | Description |
|---|---|---|---|
| AGR | Agriculture | Crops & livestock | Crops & livestock |
| Energy | Energy | ||
| Land use | Land use and forestry | ||
| All | Gas distribution | Gas distribution networks | |
| ELC | Electricity generation and power grids | EfW | Energy from waste plants |
| Other | All other generation | ||
| IND | Industry | ICH | Chemicals |
| ICM | Cement | ||
| IFD | Food, drink, and tobacco | ||
| IIS | Iron & steel | ||
| INF | Non-ferrous metals | ||
| INM | Non-metallic minerals | ||
| IPP | Paper | ||
| IOFFD | Off-road mobile machinery | ||
| IOI | Other industry | ||
| PRC | Processing and infrastructure | Bioenergy | All bioenergy processes |
| Uranium | Nuclear fuel production | ||
| Refineries | Oil refinery | ||
| Waste | Waste processes | ||
| Other fossil | e.g. coke manufacturing | ||
| RES | Residential | RH | All heating |
| Other | Other | ||
| RSR | Resources and trade | Mining | UK resource extraction |
| Upstream oil and gas | Upstream processing | ||
| SER | Services | SH | High-consumption heating |
| Other | Other | ||
| TRA | Transport | TAD | Domestic aviation |
| TAI | International aviation | ||
| TB | Buses | ||
| TC | Cars | ||
| TH | Heavy goods vehicles | ||
| TL | Light goods vehicles | ||
| TR, TF | Rail passengers and freight | ||
| TSD | Domestic shipping | ||
| TSI | International shipping | ||
| TW | Two-wheel vehicles | ||
| Other | Other |
Scottish Emissions Inventory
Scotland publishes Scottish Greenhouse Gas Statistics annually (hereafter “Emissions Inventory”). For each entry in the Emissions Inventory (Scottish Government, 2023), we added two fields representing the most appropriate Scottish TIMES sector and sub-sector from Table 2. Sectors and sub-sectors were allocated according to the following fields in the Emissions Inventory: Climate Change Plan (CCP) category, Intergovernmental Panel on Climate Change (IPCC) codes and source name.
Some emissions are not explicitly represented in Scottish TIMES and were categorised as “None”. The sources of these emissions are listed in Table 4 summarises the allocation of Scottish GHG emissions in 2021 to each of the Scottish TIMES sub-sectors. One of the challenges is that the IPCC codes used in the inventory do not map easily onto technologies in the energy system. In some cases, a technology produces emissions that map onto more than one IPCC code. For example, industrial plants with process emissions map to both combustion and process emissions codes. Another challenge is that some IPCC codes aggregate emissions from a diverse set of plants, particularly “Other industrial combustion” (IPCC code 1A2gviii) and “Miscellaneous industrial/commercial combustion” (1A4ai), which together accounted for almost 7% of Scottish emissions in 2021. These codes were both allocated to the “industrial other (IOI)” sub-sector.
It is likely that emissions from some of the other industrial sectors, and possibly also the service sector, are included in these two codes and hence allocated to the IOI sub-sector.
Scottish ETS emissions for stationary sites
The UK ETS publishes a compliance report containing emissions for each site and each airline. We used the 2023 publication (UK Government, 2023b).
We assigned each of the 72 sites in Scotland subject to the ETS individually to a Scottish TIMES sub-sector. One challenge was that the NACE description did not always accurately describe the plant operation. For example, the Sullom Voe Terminal description is extraction of natural gas, but it is primarily an oil terminal. The Shell UK Limited Fife NGL Plant description is manufacture of refined petroleum products, but plant best fits into the chemical industry rather than the oil refining sector.
Matching Scottish ETS emissions to Inventory emissions
We checked this designation and also assigned IPCC codes that were consistent with the Emissions Inventory where possible. This is challenging for oil and gas upstream and downstream sectors in particular as these are broad and complex in Scotland, so a good understanding of the sector is required to properly assign the plants to the Inventory. For example, Grangemouth combined heat and power (CHP) plant is counted under chemicals in the Inventory, while Grangemouth Infrastructure is counted under refineries, despite both being CHP plants at the same site.
One approach we used was to compare site emissions against the NAEI “Large Point Sources” emissions dataset for the year 2021 (UK Government, 2023c). However, there were notable errors and omissions in the version of the data source we consulted, with several sites having CO2 emissions missing and many sites having incorrect location data (e.g. Scottish sites categorised in other UK countries, and vice versa), so not all sites could be identified in the Inventory.
Table 3. In total, they comprised only 0.5% of Scottish emissions in 2021.
Table 4 summarises the allocation of Scottish GHG emissions in 2021 to each of the Scottish TIMES sub-sectors. One of the challenges is that the IPCC codes used in the inventory do not map easily onto technologies in the energy system. In some cases, a technology produces emissions that map onto more than one IPCC code. For example, industrial plants with process emissions map to both combustion and process emissions codes. Another challenge is that some IPCC codes aggregate emissions from a diverse set of plants, particularly “Other industrial combustion” (IPCC code 1A2gviii) and “Miscellaneous industrial/commercial combustion” (1A4ai), which together accounted for almost 7% of Scottish emissions in 2021. These codes were both allocated to the “industrial other (IOI)” sub-sector.
It is likely that emissions from some of the other industrial sectors, and possibly also the service sector, are included in these two codes and hence allocated to the IOI sub-sector.
Scottish ETS emissions for stationary sites
The UK ETS publishes a compliance report containing emissions for each site and each airline. We used the 2023 publication (UK Government, 2023b).
We assigned each of the 72 sites in Scotland subject to the ETS individually to a Scottish TIMES sub-sector. One challenge was that the NACE[2] description did not always accurately describe the plant operation. For example, the Sullom Voe Terminal description is extraction of natural gas, but it is primarily an oil terminal. The Shell UK Limited Fife NGL Plant description is manufacture of refined petroleum products, but plant best fits into the chemical industry rather than the oil refining sector.
Matching Scottish ETS emissions to Inventory emissions
We checked this designation and also assigned IPCC codes that were consistent with the Emissions Inventory where possible. This is challenging for oil and gas upstream and downstream sectors in particular as these are broad and complex in Scotland, so a good understanding of the sector is required to properly assign the plants to the Inventory. For example, Grangemouth combined heat and power (CHP) plant is counted under chemicals in the Inventory, while Grangemouth Infrastructure is counted under refineries, despite both being CHP plants at the same site.
One approach we used was to compare site emissions against the NAEI “Large Point Sources” emissions dataset for the year 2021 (UK Government, 2023c). However, there were notable errors and omissions in the version of the data source we consulted, with several sites having CO2 emissions missing and many sites having incorrect location data (e.g. Scottish sites categorised in other UK countries, and vice versa), so not all sites could be identified in the Inventory.
Table 3: Emission sources in the Scottish Inventory not represented in Scottish TIMES
| Source | Source (continued) |
| Abandoned oil wells (offshore) | Oil Terminal: Venting |
| Abandoned oil wells (onshore) | Oil transport fugitives: pipelines (onshore) |
| Accidental fires – dwellings | Oil transport fugitives: pipelines (to shore) |
| Accidental fires – other buildings | Oil transport fugitives: road tankers |
| Accidental fires – vehicles | Onshore natural gas gathering |
| Agricultural engines | Onshore natural gas production (conventional) |
| Anaerobic Digestion (other) | Onshore oil production (conventional) |
| Closed Coal Mines | Onshore oil production: gas flaring |
| Coal storage and transport | Onshore oil well exploration (conventional) |
| Composting (at household) | Open-cast coal |
| Deep-mined coal | Petroleum processes |
| Domestic Closed Stove – Basic | Recreational use of N2O |
| Domestic Closed Stove – EcoDesign | Road vehicle engines |
| Domestic Closed Stove – Upgraded | Sewage sludge decomposition |
| Domestic Fireplace – Standard | Sewage sludge decomposition in private systems |
| Domestic Outdoor | Small-scale waste burning |
| Gas Terminal: Gas Flaring | Total composting (non-household) |
| Gas Terminal: Other Fugitives | Upstream Gas Production – flaring |
| Gas Terminal: Venting | Upstream Gas Production – fugitive emissions |
| Incineration | Upstream Gas Production – Offshore Well Testing |
| Incineration – chemical waste | Upstream Gas Production – venting |
| Incineration – clinical waste | Upstream Gas Production: direct process emissions |
| Incineration – sewage sludge | Upstream Oil Production – flaring |
| Industrial engines | Upstream Oil Production – fugitive emissions |
| Industrial Waste Water Treatment | Upstream Oil Production – Offshore Oil Loading |
| Marine engines | Upstream Oil Production – Offshore Well Testing |
| Mechanical Biological Treatment – Anaerobic Digestion | Upstream Oil Production – Onshore Oil Loading |
| Mechanical Biological Treatment – Composting | Upstream Oil Production – venting |
| N2O use as an anaesthetic | Upstream Oil Production: direct process emissions |
| Oil Terminal: Gas Flaring | Well exploration (unconventional gas): all sources |
| Oil Terminal: Other Fugitives |
Table 4. Allocated Scottish GHG emissions in each Scottish TIMES sub-sector in the year 2021. Units: MtCO2e
| Sector | Sub-sector | GHG | Sector | Sub-sector | GHG | |
| AGR | Crops & livestock | 6.9 | RES | Other | 0.2 | |
| AGR | Energy | 0.9 | RES | RH | 5.8 | |
| AGR | Land use | 0.4 | RSR | Mining | 0.0 | |
| All | Gas distribution | 0.2 | RSR | Upstream oil and gas | 1.6 | |
| ELC | EfW | 0.3 | SER | Other | 0.4 | |
| ELC | Other | 1.3 | SER | SH | 1.1 | |
| IND | ICH | 2.3 | TRA | Other | 0.2 | |
| IND | ICM | 0.5 | TRA | TAD | 0.2 | |
| IND | IFD | 0.6 | TRA | TAI | 0.4 | |
| IND | IIS | 0.0 | TRA | TB | 0.3 | |
| IND | INF | 0.1 | TRA | TC | 4.7 | |
| IND | INM | 0.1 | TRA | TH | 1.9 | |
| IND | IOFFD | 0.5 | TRA | TL | 1.8 | |
| IND | IOI | 3.5 | TRA | TR, TF | 0.1 | |
| IND | IPP | 0.1 | TRA | TSD | 1.7 | |
| PRC | Bioenergy | 0.0 | TRA | TSI | 0.3 | |
| PRC | Other fossil | 0.1 | TRA | TW | 0.0 | |
| PRC | Uranium | 0.0 | None | 0.2 | ||
| PRC | Refineries | 1.3 | Total | 41.6 | ||
| PRC | Waste | 1.5 |
We encountered similar challenges as those for the Emissions Inventory described in Section 5.1. For example, glass manufacturers have process emissions (2A3: “glass production”) but most of their emissions are from combustion and are aggregated with many other industries in “Other industrial combustion” (1A2gviii). Some of these sites did not have CO2 emissions recorded in the NAEI “Large Point Sources” emissions dataset (UK Government, 2023c), perhaps because they are split across IPCC codes. We could not find some other Scottish industrial plants included in the ETS in the NAEI “Large Point Sources” emissions dataset at all.
Recommendation: review the ETS site emissions against the NAEI “Large Point Sources” emissions dataset to ensure that the data in both are accurate and consistent, and investigate causes of any discrepancies.
Only three of eighteen plants[3] generating electricity using waste as a feedstock in Scotland are included in the ETS. Installations where the primary purpose is the incineration of hazardous or municipal waste are currently excluded from the ETS.
ETS fractions by sub-sector for Scottish TIMES
We added GHG emissions by sub-sector and calculated the fraction of ETS emissions over the total emissions reported in the inventory. For this, we only considered the GHG emissions that are reported in the current ETS – CO2 and F-gases for aluminium production.[4]
Table 5 shows the fractions for each of the Scottish TIMES sectors/subsectors. In two sub-sectors, ETS emissions exceeded total emissions. For INM (non-metallic minerals), this resulted from combustion emissions from glass production being recorded in “Other industrial combustion”, as discussed above. The discrepancy for waste was for a single plant with negligible emissions.
The ETS fractions used in Scottish TIMES were mostly the same or similar to the fractions calculated from emissions statistics. No fractions exceeded 1 (i.e. total emissions). We reallocated IOI (industrial other) total emissions to other industrial sectors where the emission statistics fraction exceeded 1 as we assumed that the discrepancy was caused by emissions being erroneously recorded in IOI. The lower total emissions caused the IOI fraction to increase slightly. We assumed that all fossil fuel resource extraction is subject to the ETS. Offshore extraction is counted in a special category outside of Scotland in the ETS and is not included in Scottish TIMES.
It was necessary to choose ETS fractions for low-carbon technologies that have not been constructed in Scotland but might be in the future. We assumed:
- All plants with carbon capture and storage (CCS) will be subject to the ETS as we expect them to be large to benefit from economies of scale to capture and sequester CO2.
- All large hydrogen production plants will be subject to the ETS. Small electrolysers at refuelling stations were excluded.
- All negative emission technologies, including biomass with CCS and direct air capture, are counted using a separate negative emissions category. These could be included in the ETS in future.
Table 5: Fraction of Scottish ETS sites over total reported emissions by Scottish TIMES sector/sub-sector. All emission data have units MtCO2e. * See Section 5.4 for the calculation of the international aviation fraction
| Scottish TIMES code | ETS sites | Included in UK ETS? | Total Scottish emissions 2021 | ETS/Total Emissions | |||||
|---|---|---|---|---|---|---|---|---|---|
| Sector | Sub-sector | Number | Emissions | CO2 | PFC | CO2 | PFC | Stats | Model |
| AGR | Crops & livestock | 0 | Yes | 0.3 | 0 | 0.00 | |||
| AGR | Energy | 0 | Yes | 0.9 | 0 | 0.00 | |||
| AGR | Land use | 0 | Yes | -4.0 | 0 | 0.00 | |||
| All | Gas distribution | 0 | Yes | 0.0 | 0 | 0.00 | |||
| ELC | EfW | 3 | 0.0 | Yes | 0.3 | 0.06 | 0.06 | ||
| ELC | Other | 11 | 1.3 | Yes | 1.3 | 0.99 | 1.00 | ||
| IND | ICH | 6 | 2.1 | Yes | 2.3 | 0.90 | 0.90 | ||
| IND | ICM | 1 | 0.5 | Yes | 0.5 | 1.00 | 1.00 | ||
| IND | IFD | 12 | 0.3 | Yes | 0.5 | 0.52 | 0.52 | ||
| IND | IIS | 3 | 0.0 | Yes | 0.0 | 0.85 | 0.85 | ||
| IND | INF | 1 | 0.1 | Yes | Yes | 0.1 | 0.004 | 0.83 | 0.83 |
| IND | INM | 6 | 0.2 | Yes | 0.1 | 4.07 | 1.00 | ||
| IND | IPP | 2 | 0.1 | Yes | 0.1 | 0.74 | 0.74 | ||
| IND | IOFFD | 0 | Yes | 0.5 | 0 | 0.00 | |||
| IND | IOI | 6 | 0.2 | Yes | 3.2 | 0.05 | 0.06 | ||
| PRC | Refineries | 2 | 1.3 | Yes | 1.3 | 1.00 | 1.00 | ||
| PRC | Waste | 1 | 0.0 | Yes | 0.0 | 3.51 | 0.00 | ||
| PRC | Other | 0 | Yes | 0.0 | 1.00 | ||||
| PRC | DAC | 0 | Yes | 0.0 | 1.00 | ||||
| RES | Other | 0 | Yes | 0.2 | 0 | 0.00 | |||
| RES | RH | 0 | Yes | 5.8 | 0 | 0.00 | |||
| RSR | Fossil supply | 0 | Yes | 0.0 | 0 | 1.00 | |||
| RSR | Upstream oil and gas | 14 | 1.3 | Yes | 1.5 | 0.84 | 0.84 | ||
| SER | Other | 0 | Yes | 0.0 | 0 | 0.00 | |||
| SER | SH | 4 | 0.1 | Yes | 0.9 | 0.06 | 0.06 | ||
| TRA | TAD | 0 | Yes | 0.2 | 0 | 1.00 | |||
| TRA | TAI | 0 | Yes | 0.4 | 0 | 0.68* | |||
| TRA | TB | 0 | Yes | 0.3 | 0 | 0.00 | |||
| TRA | TC | 0 | Yes | 4.7 | 0 | 0.00 | |||
| TRA | Other | 0 | Yes | 0.2 | 0 | 0.00 | |||
| TRA | TH | 0 | Yes | 1.8 | 0 | 0.00 | |||
| TRA | TL | 0 | Yes | 1.8 | 0 | 0.00 | |||
| TRA | TR, TF | 0 | Yes | 0.1 | 0 | 0.00 | |||
| TRA | TSD | 0 | Yes | 1.7 | 0 | 0.00 | |||
| TRA | TSI | 0 | Yes | 0.3 | 0 | 0.00 | |||
| TRA | TW | 0 | Yes | 0.0 | 0 | 0.00 | |||
| Total | 72 | 7.3 | 41.3 | 0.004 | 0.18 | 0.18 | |||
Scottish ETS aviation emissions
Aviation ETS emissions are regulated in the UK country in which the operator is registered. Only one operator is registered in Scotland – Loganair – but many operators registered elsewhere operate in Scotland.
All domestic flights are included in the ETS. International flights to EU destinations are also included but flights to other destinations are currently excluded. It was therefore necessary to estimate the proportion of international flight emissions to EU destinations.
Bunker fuel consumption is an appropriate proxy for emissions, but no data are available on fuel use to EU and non-EU destinations. Instead, we used airport passenger statistics from the Civil Aviation Authority (CAA), Table 12.1, which contains the number of passengers flying from each UK airport to each overseas airport (CAA, 2023). One flight from a Scottish airport had destination “Unknown”. It was removed from the statistics as the small number of passengers would have negligible impact on the analysis.
Since non-EU destinations are generally more distant than EU destinations, we used the number of passengers multiplied by the distance to each overseas airport as a proxy for fuel use. This approach implicitly assumed that aeroplanes to EU and non-EU destinations have similar fuel use efficiencies. We calculated each flight distance from the coordinates of the Scottish and overseas airports using the Haversine formula (assuming the Earth is a perfect sphere) with airport location data from openflights.[5]
We carried out the analysis for the years 2015-2022. Figure 2 shows the fraction of passengers and the fraction of passengers multiplied by distance (proxy fuel use) travelling from Scotland to EU destinations. Prior to the COVID-19 pandemic, around 68% of proxy fuel use was for EU destinations, with a small upward trend over time. In 2021, when there were many international travel restrictions, EU fuel use increased to more than 80% of the total, but this reduced towards the long-term average in 2022. We therefore assumed a fraction of 68% in Scottish TIMES in line with the average excluding the year 2022.
Figure 2. Fraction of international passengers and fraction of (international passengers x distance) to EU destinations from Scotland. Only EU flights are included in the UK ETS. The graph shows the proportion of passengers flying to the EU each year from 2015–2022, and also the distance-weighted proportion as this is likely a better proxy for fuel consumption and hence emissions.
Scottish TIMES UK ETS implementation
We implemented a new ETS emission accounting scheme in Scottish TIMES. This was designed to count all emissions, including those subject and not subject to the ETS, as a quality assurance step to ensure that all emissions were counted appropriately.
We added nine new emission counters categories to Scottish TIMES to account for the ETS and non-ETS emissions. These are described in Table 6. Five categories cover aviation and shipping, with domestic and international travel counted separately and EU and non-EU aviation counted separately. Emissions from stationary sites covered by the ETS or likely to be covered in the future are in SITE-ETS, while those not covered by the ETS are in NON-ETS. SITE-NEG-EMIS is used for future technology-based negative emissions (i.e. excluding nature-based solutions). Finally, LULUCF counts land-use and forestry emissions, including nature-based negative emissions.
For each of these categories, we defined separate emissions counters for CO2, CH4 and N2O. For example, for AIR-UK, we defined AIR-UK-CO2, AIR-UK-CH4 and AIR-UK-N2O. For SITE-ETS and NON-ETS, we additionally defined counters for HFCs. Defining separate counters enables future changes to the UK ETS in which GHGs other than CO2 are added to the scheme to be easily represented in Scottish TIMES.
We created two new model scenarios:
- “GHG_Targets_ETS_non-ETS” demonstrates how emissions subject to the ETS could be limited separately from other emissions. The inclusion and role of negative emissions should be considered carefully when setting fixed or upper limits on ETS emissions and choosing the level of those emissions each year.
- “GHG_ETS_tax” demonstrates how a tax could be applied to emissions subject to the ETS. This would be the equivalent of a minimum traded carbon price for the market.
The revised model produces no errors. Our testing concluded that all ETS and non-ETS emissions are accounted for correctly.
Table 6. ETS emission counters added to Scottish TIMES
| Name | Description |
|---|---|
| SHIP-UK | Domestic shipping (always outside the UK ETS) |
| SHIP-INT | International shipping (always outside the UK ETS) |
| AIR-INT-NON-EU | International aviation outside the UK and EU |
| AIR-INT-EU | International aviation in the EU that is currently included in the ETS |
| AIR-UK | Domestic aviation |
| SITE-ETS | Emissions from a site subject to the ETS |
| NON-ETS | Emissions not subject to the ETS |
| SITE-NEG-EMIS | A plant producing negative emissions (BECCS or DACCS); excludes plants in industry using biomass and any plants co-firing or using waste as a feedstock |
| LULUCF | Land use, land use change and forestry emissions |
Quality assurance
Emissions attribution to Scottish TIMES sub-sectors for the ETS and the Scottish Inventory was carried out by Francisca Jalil-Vega and reviewed by Paul Dodds. Issues were discussed with experts from the Scottish Government.
Our testing of the revised Scottish TIMES model identified no implementation issues.
The international aviation analysis and all model analysis spreadsheets were created by Paul Dodds and checked by Francisca Jalil-Vega.
Conclusions and recommendations
The Scottish Government wants to understand how emissions from sites subject to the UK ETS are likely to evolve over the transition to net zero. We added ETS accounting to the Scottish TIMES model and created example scenarios with emission constraints and taxes for ETS emissions. Scottish TIMES is being used to produce a new net zero pathway for Scotland to support its new Climate Change Plan, but did not previously distinguish between ETS and non-ETS emissions.
ETS emissions accounting required an estimate of the proportion of emissions subject to ETS for each sector and sub-sector of the model. We analysed ETS and overall emission data for the year 2021 to assess these proportions. We also estimated the proportion of international aviation fuel used for flights to EU destinations as these are included in the UK ETS while destinations outside the EU are not.
We noted some unusual trends in the statistics and so we recommend that the Scottish Government:
- reviews ETS sites against the Emissions Inventory to ensure that the data in both are accurate and consistent
- cross-references the ETS site emissions and energy consumption, the Scottish emissions inventory and the Scottish energy balance to ensure that all sites in Scotland that are required to participate in the ETS are registered.
We implemented a branched version of the Scottish TIMES model at a sub-sector resolution using a flexible mechanism to try to enable future changes to the UK ETS to be easily implemented. A number of model changes were required to enable ETS accounting to function correctly, particularly to the representation of gas networks, which would benefit from a review to ensure they are modelled consistently across Scottish TIMES and that the assumptions used are reflected in the gas emission intensities.
Our comparison of the outputs identified some unexpected discrepancies between modelled emissions in 2020 and actual emissions in 2021, so we recommend that these are compared to identify sectors of the economy where unrealistic decarbonisation pathways might have been projected, and to constrain those pathways appropriately.
References
CAA (2023) UK airport data. Civil Aviation Authority. https://www.caa.co.uk/data-and-analysis/uk-aviation-market/airports/uk-airport-data/. Accessed 23 August 2023.
Dodds, P. E. (2021) Review of the Scottish TIMES energy system model. http://dx.doi.org/10.7488/era/793
Scottish Government (2023) Scottish Greenhouse Gas Statistics 2021. https://www.gov.scot/publications/scottish-greenhouse-gas-statistics-2021. Accessed 13 August 2023.
UK Government (2023a) Guidance: Participating in the UK ETS. https://www.gov.uk/government/publications/participating-in-the-uk-ets/participating-in-the-uk-ets. Accessed 20 July 2023.
UK Government (2023b) UK ETS Recorded Emissions and Surrendered Allowances Data. https://reports.view-emissions-trading-registry.service.gov.uk/ets-reports/section5/20230601_Compliance_Report_Emissions_and_Surrenders.xlsx. Accessed 13 August 2023.
UK Government (2023c) Emissions from NAEI large point sources. https://naei.beis.gov.uk/data/map-large-source. Accessed 20 July 2023.
If you require the report in an alternative format such as a Word document, please contact info@climatexchange.org.uk or 0131 651 4783.
© Produced by UCL Consulting 2023 on behalf of ClimateXChange. All rights reserved.
While every effort is made to ensure the information in this report is accurate, no legal responsibility is accepted for any errors, omissions or misleading statements. The views expressed represent those of the author(s), and do not necessarily represent
those of the host institutions or funders.
- The Climate Change Act 2008 covers CO2, CH4, N2O, HFCs, PFCs, SF6 and NF3. NF3 was added in 2023. The base year for CO2, CH4 and N2O is 1990, and for the other gases it is 1995. ↑
- NACE is “Nomenclature of Economic Activities”, the European statistical classification of economic activities. ↑
- List of Scottish Energy from Waste plants from SEPA: https://www.sepa.org.uk/regulations/waste/energy-from-waste/energy-from-waste-sites/ ↑
- https://www.legislation.gov.uk/eudr/2003/87/annex/I ↑
- https://openflights.org/data.html ↑
The Scottish and global net zero transition presents substantial economic opportunities for Scotland. For the Scottish Government to successfully design net zero and economic policy, it must clearly assess and understand relative economic strengths, weaknesses, opportunities and threats of Scotland’s net zero and climate adaptation economy.
However, the existing data have many gaps, and policymakers often lack the necessary frameworks to make analytically informed decisions on the priorities for economic intervention and just transition policy design.
This report provides baseline data and assessment of the economic potential of the onshore wind, offshore wind, and hydrogen sectors using a novel methodology. It breaks down and measures these sectors into distinct economic value chain activities such as project development, manufacturing, installation, operation and maintenance, specialised consultancy services and end-of-life. The methodology is applicable to other sectors.
Summary of findings
- The research identified that the onshore and offshore wind sectors share many strengths, weaknesses, opportunities and threats. For example, the vast majority of turnover in both sectors comes from installation, operation and maintenance activities.
- Differences in these value chain stages between the sectors arise largely due to differences in their maturity in Scotland – the higher levels of installed onshore wind capacity results in increased turnover from operation and maintenance, while for the rapidly growing offshore wind sector, installation represents the highest share of turnover.
- Manufacturing is another point of contrast between the sectors; potentially related to the wider array of components available for manufacture, offshore wind provides a much larger share of manufacturing turnover.
- The outlook for the hydrogen sector is relatively uncertain due its immature and unproven nature, and current debate regarding possible future uses.
- The outlook for the onshore and offshore wind sectors is more certain since they are already established and commercially viable global markets. These sectors have good prospects for strong growth in Scotland, with the biggest economic growth expected in offshore wind, driven by strong domestic and international demand and the need to increase installed capacity.
Further details on the findings can be found in the report attached.
If you require the report in an alternative format such as a Word document, please contact info@climatexchange.org.uk or 0131 651 4783.