
The Scottish Government’s Carbon Calculator for wind farms on Scottish peatlands was developed in 2008, to calculate the impact of wind farm development on peatland carbon stocks in Scotland and thereby support decision making. Electricity generation emission factors are updated annually, but no major revisions have been made to the Carbon Calculator since 2014.
Aims
The increased focus on the transition to net zero might affect the suitability of the Carbon Calculator for future use. This research conducted a detailed review of the latest spreadsheet version of the Carbon Calculator (v2.14), which mirrors the web version (v1.8.1). It provides an evidence base for future considerations and recommendations.
This review has initiated further discussions and highlighted the need for ongoing engagement, which will be instrumental in the development of the Carbon Calculator.
Key findings
Based on the findings of a technical assessment, evidence review and quality control mechanisms, the report recommends that when considered against recent policy updates and advancements in science, the Carbon Calculator, in its current form, should be updated. Each area of the Carbon Calculator was assessed for scientific accuracy and data availability:
- The ‘payback time and CO2 emissions’ are not relevant/consistent with the findings of the technical assessment and literature review. It is important to consider whether emissions due to turbine life and back up are required, given new planning policy and the applicability of whole lifecycle carbon assessments.
- For all peat-related areas of the Carbon Calculator, as well as the forestry area, accuracy is lacking in one or more methodologies, use of emission factors and assumptions.
- While some data are accessible to users, it is not clear if they are able to accurately obtain some of that data – in particular, for variables that drive the results (the water table depth and extent of drainage), which could affect the accuracy of outputs.
This study is the first phase of a review of the Carbon Calculator. The findings of the report will be used to inform the next phase.
For further details, please read the report.
If you require the report in an alternative format, such as a Word document, please contact info@climatexchange.org.uk or 0131 651 4783.
Research completed: July 2024
DOI: http://dx.doi.org/10.7488/era/5506
Executive summary
The Scottish Government’s Carbon Calculator for wind farms on Scottish peatlands was developed in 2008, to calculate the impact of wind farm development on peatland carbon stocks in Scotland and thereby support decision making. Electricity generation emission factors are updated annually, but no major revisions have been made to the Carbon Calculator since 2014.
Aims
The increased focus on the transition to net zero might affect the suitability of the Carbon Calculator for future use. This research conducted a detailed review of the latest spreadsheet version of the Carbon Calculator (v2.14), which mirrors the web version (v1.8.1). It provides an evidence base for future considerations and recommendations.
This review has initiated further discussions and highlighted the need for ongoing engagement, which will be instrumental in the development of the Carbon Calculator.
Key findings
Based on the findings of a technical assessment, evidence review and quality control mechanisms, we recommend that when considered against recent policy updates and advancements in science, the Carbon Calculator, in its current form, should be updated. Each area of the Carbon Calculator was assessed for scientific accuracy and data availability:
- The ‘payback time and CO2 emissions’ are not relevant/consistent with the findings of the technical assessment and literature review. It is important to consider whether emissions due to turbine life and back up are required, given new planning policy and the applicability of whole lifecycle carbon assessments.
- For all peat-related areas of the Carbon Calculator, as well as the forestry area, accuracy is lacking in one or more methodologies, use of emission factors and assumptions.
- While some data are accessible to users, it is not clear if they are able to accurately obtain some of that data – in particular, for variables that drive the results (the water table depth and extent of drainage), which could affect the accuracy of outputs.
In addition to the technical assessment, the research has triggered the need to examine the wider planning and consenting context through the following questions:
Does the calculator need to consider the lifecycle emissions of the wind farm, or could the focus be purely on the impact of development on peat?
Well established methods and tools are available to undertake Whole Life Carbon Assessments (e.g. PAS2080), including forthcoming offshore wind carbon footprinting guidance. This aspect of the Carbon Calculator might not be necessary as it replicates these approaches. Instead, it may be more beneficial to concentrate efforts on analysing the specific impacts of development on peatlands/habitat carbon emissions.
Is the output of the Carbon Calculator useful as a decision-making tool?
Since the inception of the Carbon Calculator, it has become clearer that improving and restoring biodiversity is important to tackling climate change. This progress is reflected the National Planning Framework 4’s mitigation hierarchy.
As the UK transitions to net zero, the current ‘carbon payback’ approach becomes less relevant, as it compares development emissions to the counterfactual of electricity generated by fossil fuels. The focus should shift to evaluating the impact of the developments on the natural environment, specifically, whether it improves the environment and sequesters CO2 effectively.
To better assess the development’s impact on peatland carbon emissions, the timeline for achieving ‘carbon payback’ or ‘carbon neutrality’ should consider land-based emissions. For example, ‘payback time’ could be defined as the period needed to restore peatland to a ‘near pristine’ condition from a reported baseline, compared to the site’s baseline emissions without development and counterfactual scenarios for non-peaty sites, and Scotland’s widespread peatland restoration efforts.
Should the Carbon Calculator incorporate other land use types?
This would offer a more comprehensive view of the carbon impact on other land use types, as compared to the carbon impact on peatland. This aspect should be evaluated considering Scotland’s evolving biodiversity net gain requirements, current Peatland Management Plans (PMP), Habitat Management Plans (HMP), and their anticipated updates.
Are the quality controls sufficient?
There are no in-built quality control mechanisms within the Carbon Calculator. Due to its complexity and skillsets required to review the data outputs, the Carbon Calculator is not used as a decision-making tool in the capacity it is intended. Additional quality controls would be beneficial.
The future of the Carbon Calculator
In addition to the technical review, the report also considers the future of the Carbon Calculator in terms of a review of incorporating high-resolution spatial data (HRSD) and/or peatland condition categories (from the Peatland Carbon Code), and applicability of the Carbon Calculator to other developments.
Integrating HRSD into the Carbon Calculator would enable an understanding of land cover types, providing proxies for peat condition and water table depth. This could reduce the need for manual site surveying for data collection and enable wider evaluation of the site.
We recommend that the integration of HRSD is explored for future versions of the Carbon Calculator, to ascertain the level of accuracy these enhancements could bring (i.e. through reduced manual inputs and/or quality controls). This can be done in conjunction with the findings from Scottish Government’s exploration of a national LiDAR mapping scheme.
The Peatland Code’s emission calculator provides emission factors to calculate the average net emissions from peatland in various conditions, based on the UK inventory. Whilst not Scotland-specific, integration of the peatland condition categories could provide a recognised approach to quantifying the benefits of peatland restoration activities.
There is potential for the Carbon Calculator to be adapted and applied to grid infrastructure and other development types on peatland and carbon rich soils, even though it is currently employed solely for wind farm developments. There are no concerns on the Carbon Calculator’s ability to be used on projects of all sizes. However, to be applied to different infrastructure types, consideration would need to be given to their unique spatial aspects, e.g. the effects of shading and effect of excess heat for solar farms. Further research is needed to understand the implications of other infrastructure developments on peatland and carbon rich soils prior to extending the applicability of the Carbon Calculator.
Glossary / Abbreviations
|
Baseline |
Current baseline represents existing GHG emissions from the project boundary site prior to construction and operation of the project under consideration (IEMA, 2022). |
|
Carbon-rich soils |
Organo-mineral and peat soils are known as carbon-rich soils. A peat soil is defined in Scotland as when soil has an organic layer at the surface which is at least 50cm deep. Organo-mineral soil or peaty soil is soil which has an organic layer at the surface less than 50cm thick and overlies mineral layers (e.g. sand, silt and clay particles). There is also a relatively rare group of soils in Scotland known as humose soils. These have organic rich layers with between 15 and 35% organic matter. These are mineral soils but also considered to be carbon rich. |
|
Dissolved Organic Carbon |
fraction of organic carbon that can pass through a filter with a pore size between 0.22 and 0.7 micrometres. |
|
High-Resolution Spatial Data |
High-resolution spatial data refers to detailed information about the Earth’s surface captured with exceptional precision by satellite imagery. |
|
Life Cycle Assessment |
A Life Cycle Assessment (LCA) is a methodology for assessing environmental impacts associated with all the stages of the life cycle of a commercial product, process, or service. |
|
PAS 2080 |
PAS 2080 is a globally applicable standard for managing carbon in infrastructure. The standard looks at the whole value chain of a project and aims to reduce carbon and cost through design, construction, and use. |
|
Particulate Organic Carbon |
fraction of organic carbon that can’t pass through a filter with a pore size between 0.22 and 0.7 micrometres. |
|
Payback period |
Payback period is used within the Carbon Calculator to estimate the time it will take for a wind farm to ‘offset’ the greenhouse gases emitted. I.e., the displacement of the carbon ‘costs’ of construction with the carbon ‘savings’ due to the displacement of grid-based electricity generation from non-renewable sources. |
|
Peat |
Peat is organic material formed when dead plant material collects in cool, waterlogged conditions where there is very little oxygen, it breaks down slowly forming a layer of mainly organic matter. |
|
Peat soil |
(organic soil) in Scotland is defined as soil with a surface peat layer with more than 60% organic matter and of at least 50cm thickness. |
|
Peaty soils |
(organo-mineral soil) have a shallower peat layer at the surface less than 50cm thickness over mineral layers. |
|
Peatland |
Under NPF4, peatland is defined by the presence of peat soil or peaty soil types. This means that “peat-forming” vegetation is growing and actively forming peat, or it has been grown and formed peat at some point in the past. Peatlands can include blanket bog, upland raised bog, lowland raised bog and fens. |
|
Peatland Code |
The Peatland Code is a voluntary certification standard in the UK and is designed for peatland restoration projects aiming to market the climate benefits of restoration. The Peatland Code ensures that restoration projects are credible and deliverable, providing assurances to carbon market buyers. The Peatland Code defines ‘peatland’ as ‘areas of land with a naturally accumulated layer of peat, formed from carbon-rich dead and decaying plant material under waterlogged conditions’. |
|
Peat Management Plan |
A peat management plan (PMP) is an operational plan in development projects on peat, describing baseline peat conditions, detail on excavation and reuse volumes, classification of the excavated material, how the excavated peat will be handled, stored, reinstated or other use or disposal. |
|
Peatland Restoration |
Carrying out an intervention which in combination with natural processes improves the hydrological function and coverage and good condition of priority peatland habitat vegetation, aiming to result in a peatland that is actively forming peat and sequestering carbon. Further detail will be stated in the Peatland Standard (under preparation). |
|
Priority Peatland Habitat |
Peatland National Vegetation Classification communities noted as a Priority Peatland Habitat are: M1, M2, M3, M15, M17, M18, M19, M20 and M25, together with their intermediates. These have been recognised under the Scottish Biodiversity Framework as being important to protect for their conservation and biodiversity value. |
|
Scottish Environment Protection Agency |
The Scottish Environment Protection Agency is Scotland’s principal environmental regulator, its main role is to protect and improve Scotland’s environment. |
|
Whole life carbon |
Assessment of emissions associated with an asset over its entire life; encompassing its development, operation, and end-of-life. |
|
CH4 |
Methane |
|
CO2 |
Carbon Dioxide |
|
DOC |
Dissolved organic carbon |
|
ECU |
Energy Consents Unit |
|
EIA |
Environmental Impact Assessment |
|
ESA |
European Space Agency |
|
GHG |
Greenhouse Gas |
|
GIS |
Geographic Information Systems |
|
HRSD |
High-Resolution Spatial Data |
|
IPCC |
Intergovernmental Panel on Climate Change |
|
JHI |
James Hutton Institute |
|
kWh |
Kilowatt-Hour |
|
LCA |
Life Cycle Assessment |
|
LiDAR |
Light Detection and Ranging airborne mapping technique |
|
MW |
Megawatt |
|
MWh |
Megawatt-Hour |
|
NASA |
National Aeronautics and Space Administration |
|
NPF4 |
National Planning Framework 4 |
|
N2O |
Nitrous Oxide |
|
PEAG |
Scottish Government’s Peatland Expert Advisory Group |
|
PMP |
Peat Management Plan |
|
POC |
Particulate Organic Carbon |
|
SAR |
Synthetic Aperture Radar |
|
SEPA |
Scottish Environment Protection Agency |
|
IUCN |
International Union for Conservation of Nature |
|
WLCA |
Whole lifecycle carbon assessment |
Introduction
Background
The Scottish Government’s Carbon Calculator for wind farms on Scottish peatlands (hereafter referred to as ‘the Carbon Calculator’) was developed in 2008 and updated in 2011 and 2014. It was developed due to concerns raised about the reliability of methods used to calculate the time taken for these facilities to reduce greenhouse gas emissions, combined with an increasing public policy demand for renewable energy following Scotland’s commitments at the time to reduce greenhouse gas emissions by reducing the use of fossil fuels for energy generation, principally; Scottish Planning Policy 6: Renewable Energy to deliver renewable energy in a way that “affords appropriate protection to the natural and historic environment without unreasonably restricting the potential for renewable energy development” (Scottish Government, 2007).
The Carbon Calculator was developed to ‘support the process of determining wind farm developments in Scotland. The tool’s purpose is to assess, in a comprehensive and consistent way, the carbon impact of wind farm developments. This is done by comparing the carbon costs of wind farm developments with the carbon savings attributable to the wind farm.’ (Nayak et al, 2008). The output of the Carbon Calculator compares the carbon costs of a wind farm development with the carbon savings attributable to the production of renewable energy (when compared to a counterfactual alternative). Electricity generation emission factors are updated annually, but no major revisions have been made to the Carbon Calculator since 2014.
The Scottish Environment Protection Agency (SEPA) developed the Carbon Calculator into a web Carbon Calculator (C-CalcWebV1.0), which has been available since 2016. The calculator is currently owned by the Scottish Government and is hosted and maintained by SEPA. The Carbon Calculator is currently used by developers to submit project carbon assessments. These submissions are then evaluated by the Energy Consents Unit (ECU) as part of the application for consent.
An evolving legislative, policy, science, and technology landscape
In the 16 years since the Carbon Calculator’s inception, there has been an increased focus on the transition to net zero, with updates to Scottish legislation and policy reflecting this shift. Key legislation and policy drivers include:
- The Climate Change (Emissions Reduction Targets) (Scotland) Act 2019 (updated): sets a key driver for Scotland to deliver and meet its carbon reduction targets.
- Scotland’s National Planning Framework 4 (NPF4) (adopted in February 2023): sets the framework for development across Scotland, including renewable energy. NPF4 includes national planning policies which set out ‘to protect carbon-rich soils, restore peatlands and minimise disturbance to soils from development’. Policy 5 sets out a mitigation hierarchy[1], and new development proposals on peatlands, carbon-rich soils, and priority peatland habitat are only supported in certain limited circumstances, including renewable energy generation. The policy also outlines the need for a site-specific assessment (such assessments may include peat depth surveys, Peat Landslide Hazard Risk Assessment, and detailed habitat and condition surveys) to identify the likely net effects of the development on climate emissions and loss of carbon. The mitigation hierarchy can be achieved through the Construction Environmental Management Plan, Habitat Management Plan (HMP), and Peat Management Plan (PMP), developed at the application stage.
There have also been significant advancements in science and technology during this period. The collective understanding of peatland science has evolved, and research, technology, and collaborative groups have fostered a greater understanding of the science, with the likes of the Peatland Code and NatureScot National Peatland Plan emerging as a result. This new legislative, policy and science landscape highlight the need for a comprehensive review of the Carbon Calculator’s original design and purpose.
Aim of the report
This report provides the findings of a technical assessment of the latest spreadsheet version of the Carbon Calculator (v2.14), which mirrors the web-version (v1.8.1) to determine if in its current form it remains fit for purpose, considering recent policy updates, the ongoing transition to net zero, and advancements in science. Furthermore, the report provides an evidence base for future considerations and explores how the Carbon Calculator could be improved via Peatland Code category integration, use of High-Resolution Spatial Data (HRSD), and improved quality controls.
Carbon Calculator Technical Assessment
Overview
The Carbon Calculator features numerous components used to assess the carbon impact of wind farm developments on Scottish peatland. The Carbon Calculator is split into the areas shown in Table 1. Appendix 11.3 provides a detailed breakdown of each section, including their specific calculations and assumptions.
Table 1: Carbon Calculator Section
|
Areas of the Carbon Calculator |
Report Section |
|
Data inputs |
3.2 |
|
The core input data, forestry input data, and construction input data tabs are used by the user to insert key variables into the Carbon Calculator, to inform the development’s estimated payback time and CO2 emissions. | |
|
Payback time and CO2 emissions |
3.3 |
|
Collates the results from each area of the Carbon Calculator and presents the carbon payback period and carbon intensity per kWh electricity generated. | |
|
Wind farm CO2 emission savings |
3.4 |
|
Savings are calculated against the electricity generated by coal, a fossil-fuel mix, and the UK average grid mix, multiplied by the wind farm’s lifetime electricity generation at the time of the development’s application. | |
|
Emissions due to turbine life |
3.5 |
|
Emissions associated with turbine life (manufacturing, construction, and decommissioning) are presented based on user input or estimated based on installed capacity. Emissions associated with foundations (concrete) are calculated separately. | |
|
Loss of carbon due to back up power generation |
3.6 |
|
Emissions associated with back up requirements are calculated against the electricity generated by coal, a fossil-fuel mix, and the UK average grid mix, multiplied by the wind farm’s lifetime electricity generation. | |
|
Loss of carbon fixing potential of peatlands |
3.7 |
|
Quantification of the annual carbon sequestration from bog plant fixation (without the wind farm) and thereby the loss as a result of development. | |
|
Loss of soil CO2 |
3.8 |
|
Emissions associated with loss of soil organic carbon from the peat removed and peat drained. | |
|
CO2 loss by DOC and POC loss |
3.9 |
|
CO2 losses from dissolved organic carbon (DOC) and particulate organic carbon (POC) within waters in drained land that has been restored. | |
|
Loss of carbon due to forestry loss |
3.10 |
|
Loss of future carbon sequestration associated with forest felling as part of the wind farm development. | |
|
Carbon saving due to improvement of peatland habitat |
3.11 |
|
Estimates the reduction in GHG emissions due to restoration following the end of the wind farm’s lifespan. |
The assessment provides a review of each area of the Carbon Calculator as outlined in Table 1. Each section consists of the following:
- Assessment findings – narrative summarising the findings from the technical assessment and evidence review. For the technical areas of the Carbon Calculator a Red, Amber, Green (RAG) rating has been provided to illustrate the technical accuracy and data availability of each area. It uses the colour rating system presented in Table 2.
- Key considerations and questions – considers the key takeaways from the assessment, and outlines questions for policy decision makers when considering revisions to the current Carbon Calculator.
|
RAG |
Criteria: Scientific accuracy |
Criteria: Usability |
|
White |
Not applicable (rationale explained within narrative). | |
|
Green |
The methodologies, use of emissions factors and assumptions are relevant and consistent with best practice. |
Data is site/project specific, is available to the Carbon Calculator user, and supports an accurate outcome. |
|
Amber |
Accuracy is lacking in one or more methodologies, use of emissions factors and assumptions. |
There is some uncertainty around the data availability. |
|
Red |
The methodologies, use of emissions factors and assumptions are not relevant/consistent with findings of the literature review. |
Data is not site specific/ is inaccessible/unavailable to the user. |
Assessment findings: Data inputs
Scientific accuracy
The scientific accuracy of the data inputs is provided as part of the narrative within the assessment findings for the corresponding technical areas of the Carbon Calculator (Sections 3.3-3.11). Therefore, no RAG rating has been provided.
Usability
The following commentary applies to the Carbon Calculator’s core input data. Specific commentary relating to data inputs of the technical areas of the Carbon Calculator are covered within the corresponding sections of this report (Sections 3.3-3.11).
- The user is required to input a high number of variables (i.e. for the core input data, 70 input variables are required).
- Each input variable requires an expected value, as well as a minimum and maximum range, therefore over ~200 input variables are required in total for core inputs.
- For infrastructure design related inputs (wind farm characteristics, borrow pits, foundations, access tracks, cable trenches and peat excavated) the values are well defined based on the wind farm design, therefore the minimum and maximum ranges could represent unnecessary data requirements for design related inputs given their level of certainty. If still viewed as necessary in some instances, a minimum and maximum range could be automated, and/or an optional requirement for users.
Key consideration: Minimum and maximum data inputs
Wind farm characteristics – consider removal/option to ‘opt out’ of minimum and maximum variables where site specific data is known and can be evidenced by the user.
Peat variables – Review the minimum and maximum parameters for peat variables and explore replacing with individual infrastructure specific inputs (i.e. Turbine 1, 2 etc). Industry feedback indicated that prior to completing the Carbon Calculator, users proactively aim to reduce the impact of development on peat through the design process. If there is large variation in peat parameters around the site, should more detailed site-specific data be captured (to reflect the construction and forestry ‘areas’, and/or align with the PMP reporting where individual infrastructure outputs are provided) as an alternative?
Assessment findings: Payback time and CO2 emissions
Scientific accuracy
- Although the calculations that produce the payback time and CO2 emissions are accurate (i.e. there are no errors in them), the carbon payback time that is generated (measured against the current fossil-mix of electricity generation) is a significant simplification which does not present an accurate representation of future payback. This is because the payback calculations assume a consistent counterfactual for the lifetime of the wind farm. However, as we transition to net zero, the National Grid is rapidly decarbonising and forecast to be near net zero by 2035 (DESNZ, 2023).
Usability
- Payback combines infrastructure emissions (embodied carbon from wind turbines and their construction) with site-specific factors associated with peatland disturbance, and/or management. Emissions from the wind turbine manufacturing make up the largest proportion of the emissions, and so in this context, the overall carbon impact on peat (i.e. all peat related carbon calculations) appears to the user as a small proportion.
- Currently there are no official guidelines about what constitutes an acceptable or unacceptable payback time, which would benefit both users and decision makers in determining ‘what good looks like’ for land based emissions.
Key consideration: Is the output of the Carbon Calculator useful as a decision-making tool?
As the National Grid transitions to net zero, the presented ‘savings’ (comparison to fossil generated electricity) become less relevant. It may be more appropriate to consider the ‘payback time’ as the time taken to restore the peatland condition to ‘near pristine’ from a reported baseline. To inform this, the sources of emissions could be split out and reported separately:
- Emissions resulting from land use change (the impact on land carbon emissions as a result of the development including all peatland and other carbon rich soil related carbon sources), should be compared against the project site’s baseline emissions.
- Emissions associated with the construction, operation, and decommissioning (Whole Lifecycle Carbon Assessment (WLCA)) of the wind farm. To aid decision making, this should be benchmarked against industry best practice, and/or compared against the whole life carbon impact of the counterfactual (e.g. gas turbine plant). Although this may be included within a WLCA, in which case this function is not required.
- The carbon intensity of electricity generated could primarily be compared against i) the current back-up energy source of natural gas and ii) against the UK average (considering future decarbonisation) if not done so via a WLCA.
Key consideration: Is the focus of the Carbon Calculator correct?
Currently, the main use within decision making is the payback period. However, this is based on the counterfactual of electricity generated by fossil fuels. Focusing on land-based emissions and the impact of development on peatland, an alternative would be to consider the baseline site conditions and ‘payback’ time to a restored site (see 3.3.3 for suggested approach). There is widespread action to restore degraded peatland across Scotland (Scottish Government, 2024), it could be expected that if a wind farm is not developed, the sites would be restored through a variety of financial mechanisms such as the Peatland Code, and Scottish Government funding (ibid). Another relevant counterfactual could include the land-based emissions from a non-peaty site. Whether a counterfactual payback period should be updated to reflect this context is an important consideration.
Key consideration: Does the Carbon Calculator need to consider the lifecycle emissions of the wind farm, or could the focus be purely on the impact of development on peat and other carbon rich soils?
In order to demonstrate a minimisation of emissions, established methods and tools are available to undertake WLCA (e.g. PAS2080), which will include materials, construction, operational and decommissioning emissions of the entire wind farm. NPF4 Policy 2 (climate mitigation and adaptation) states that all proposals will be ‘be sited and designed to minimise lifecycle greenhouse gas emissions as far as possible.’ Given the new policy context in combination with the Carbon Calculator’s core aim (to determine the impact of development on peatland carbon emissions), key considerations include:
- Whether the lifecycle emissions of a wind farm need to be included in the Carbon Calculator?
- Could the calculations in the Carbon Calculator solely be focused on the impact of the development on peatland emissions?
- Is the presentation of the current payback output necessary or appropriate for decision making?
Assessment findings: Wind farm CO2 emission savings
Scientific accuracy
- The UK grid average is forecast to be broadly decarbonised by 2035 (BEIS, 2020). Using the current grid average (DESNZ, 2023) across the lifetime of the wind farm project represents a ‘static’ coefficient which is not representative of long-term UK grid decarbonisation over time. Additionally, over time as the grid average decarbonises this comparison will not show an operational benefit of using renewable energy.
- The UK generates ca. 1% of electricity from coal (Statista, 2024). The emissions factors in the Carbon Calculator are updated annually. If users apply the current (optional) coal factor, this factor is also a ‘static’ coefficient. Coal is due to be phased out completely by the end of September 2024 (BEIS, 2021), and therefore the ‘coal-fired electricity generation’ comparison should be removed as it is not a representative comparison.
- Renewable energy from wind and solar is not guaranteed and therefore a backup is required. Currently, where back up for renewables is required, gas peaking plants provide additional capacity. As we transition to a zero-carbon grid, natural gas will continue to be used to support both renewable back-up and additional demand (BEIS, 2020). There is also work ongoing nationally (Great Grid Upgrade, (National Grid, 2024)) to improve infrastructure and connectivity which will reduce the reliance on back-up energy requirements.
- Most of Scotland’s electricity demand is already met by renewables (Scottish Government, 2024). There is an opportunity to increase renewables across the UK and for exports, however, this will require appropriate infrastructure.
- The counterfactual emission factors only include electricity generation (i.e. the emissions associated with burning fossil fuels to generate electricity). They exclude the development of the infrastructure (i.e. the power station). Therefore, savings are based on operational energy efficiency, there is no consideration to the embodied carbon or operational maintenance of the alternative power.
- Noting the transition to net zero, consideration needs to be given to the appropriateness of represented savings.
Usability
- This section of the Carbon Calculator is used to calculate the Wind farm CO2 emissions. The input variables which inform it are acceptable in terms of usability.
See Section 3.3.4 Key consideration: Is the focus of the Carbon Calculator correct?
Assessment findings: Emissions due to turbine life
Scientific accuracy
- The methodology for estimating emissions is based on turbine capacity derived from the regression analysis of data points found within a selection of papers dated between 2002 and 2006. The wind industry has evolved in the last 20 years and these assumptions are outdated, for the following reasons:
- The average onshore wind turbine has increased over recent years to 2.5-3MW (National Grid, n.d.). the references within the current Carbon Calculator are based on studies around 1MW (Lenzen and Munksgaard, 2002; Ardente et al., 2006; Vestas, 2005) and have a direct correlation between turbine MW and embodied carbon (i.e. the greater the power, the higher the embodied carbon), however due to technology advancements (i.e. lightweighting), increased power may not require increased materials. The methodology should be updated to consider more recent manufacturer lifecycle assessments.
- The physical size of UK wind turbines (i.e. height and turbine span) have increased.
- The Carbon Calculator uses an emissions factor for reinforced concrete taken from The Concrete Centre (2013). This reference has been superseded with the most recent market data being available for 2023 (Concrete Centre, 2023) and should be updated.
- Estimations only account for lifetime emissions attributed to turbine structures and concrete hard standings. The methodology disregards emissions from the manufacture, construction, and disassembly of other wind farm assets (e.g., site fences, access tracks, battery storage, etc) (Appendix 10.1). Carbon emissions resulting from the transport of labour and materials to the construction-site is also excluded. This underestimates emissions and does not align to common WLCA practice (e.g., PAS 2080).
- Emissions exclude decommissioning; due to the uncertainty in this area this would be difficult to estimate, however it should be recognised that decommissioning activities would result in additional disruption to peat. With the net zero transition and increasing energy demand it is likely that sites will be repowered rather than decommissioned. However, as wind farm developments are only provided with consent to operate for fixed period (and should be followed by decommissioning), it may not be appropriate to include this functionality.
Usability
- Many lifecycle assessments for wind turbines include foundations (e.g. Vesta, n.d.). Therefore the ‘carbon dioxide emissions from turbine life’ variable may result in double counting of construction emissions when using the ‘direct input of total emissions’ option if not split out by the turbine provider and/or Carbon Calculator user, when paired with foundations and hardstanding emissions, and/or the construction input data tab.
- As this is a significant part of the assessment, lifecycle emissions should be modelled on site specific data.
- Depending on the size of the development, developers may be required to submit an Environmental Impact Assessment (EIA), including a WLCA. Scottish Government is preparing Planning and Climate Change guidance, which includes consideration of information sources, tools, methods and approaches (including WLCAs) that can be used to demonstrate whether and how lifecycle greenhouse gas emissions of development proposals have been minimised. For reference, there is currently an industry standard approach for wind farm LCA being developed for offshore wind developments through the Offshore Wind Sustainability JIP (anticipated to be released by the end of 2024) (The Carbon Trust, 2022).
See Section 3.3.4 Key consideration: Is the focus of the Carbon Calculator correct?
See Section 3.3.5 Key consideration: Does the Carbon Calculator need to consider the lifecycle emissions of the wind farm, or could the focus be purely on the impact of development on peat?
Assessment findings: Emissions due to back up power generation
Scientific accuracy
- Back up requirements are typically modelled using the guidance note assumption of 5% of the wind farm capacity following guidance within the Carbon Calculator (Dales et al, 2004). The wind industry has evolved in the last 20 years. From a review of literature and current policy, there are no specific requirements for back-up in planning applications for renewable energy. As the National Grid decarbonises (DESNZ, 2023) back-up will increasing be supplied by other renewable energy. Therefore, this area of the Carbon Calculator could be redundant.
- Emissions associated with back up are calculated based on a grid connection. See Section 3.4 regarding selection of counterfactual emission factors. There are other options such as interconnections, energy storage solutions and nuclear that provide alternatives (National Grid, 2024).
Usability
- The input variable is acceptable in terms of usability.
Key consideration: Should the Carbon Calculator include ‘Back-up requirements’?
From a review of literature and current policy, there are no specific requirements for back-up in planning applications for renewable energy, As the National Grid decarbonises (DESNZ, 2023) back-up will increasing be supplied by other renewable energy. Where back-up requirements are specified, it’s anticipated that these would be included within an WLCA. Therefore, this area of the Carbon Calculator could be redundant.
Assessment findings: Loss of CO2 fixing potential
Scientific accuracy
- This section of the Carbon Calculator quantifies the annual carbon sequestration from bog plant fixation (without the wind farm). The loss of carbon fixing potential is calculated from user inputs for the area which peat is removed (m2) as well as the area affected due to drainage (m2). Loss of CO2 fixing potential has a low significance within the outputs of the Carbon Calculator (typically 1-2% of the total lifetime emissions), most land-based CO2 losses due to wind farm development are associated with soil organic matter (see Appendix 11.3).
- Loss of carbon fixation is calculated based on the lifetime of the wind farm and time required until full peatland functioning is restored. No consideration is given to the condition the peatland will be restored to.
- The Carbon Calculator currently assumes that peatland is in a pristine condition and therefore is a net carbon sink. However, 80% of UK peatland is already degraded (NatureScot, 2015). Degraded peatland is likely to be a net source of emissions rather than a sink (NatureScot, 2015).
- The Carbon Calculator assumes a constant rate of carbon fixation over time, failing to take account for the impact of changing climatic conditions e.g. increased frequency of drought. See key consideration 3.7.4 on the impacts of climate change.
- The condition of the peatland is influenced by vegetation composition (Marshall et al, 2021), and degraded peat is associated with changes to vegetation structure with scrubbier species to the disadvantage of characteristic peatland species (NatureScot, n.d.). Literature was located which described the known link between ecosystem resilience and peatland vegetation (Speranskaya et al, 2024), and highlighted that the interactions between temperature, precipitation, nitrogen deposition, and atmospheric CO2 and their effects can be a result of vegetation composition (Heijmans et al, 2008).
- The literature review indicates that the Carbon Calculator’s current output for ‘loss of carbon fixation potential’ may not be accurate, because: i) the current condition of peatland may not be pristine, and may therefore have a lower carbon fixation rate, and ii) there is considerable uncertainty in the ability to restore peatland to its fully functioning ‘pristine’ state so the future fixation rate may be overestimated.
- However, no research was located which presented the relationship between peatland condition and bog fixing potential, or updated fixation emission factor rates. This is anticipated to be because other methodologies (e.g. Evans et al, 2023) do not explicitly assess the loss of bog fixing potential, but instead assess the ‘Net Ecosystem Production of the peatland’. There was also no literature located to explain how the interaction between vegetation and hydrology impacts carbon fixing potential, and so the degree to which peatland condition impacts the carbon fixation value in the Carbon Calculator is uncertain and represents an evidence gap.
- This review is unable to conclusively determine the accuracy of this area of the Carbon Calculator and whether carbon fixation is accurately represented. Although carbon fixation represents a very small proportion of the total emissions, the current assumption is likely to represent a worst case (in terms of emissions) and may be suitable in the absence of other literature to inform it. This area of the Carbon Calculator could be superseded through the integration of the Peatland Code which uses the UK inventory and includes carbon sequestration (e.g. carbon fixation from bog plants) within its net emission factors.
Usability
- Carbon fixed by bog plants is a user input (a guidance note within the Carbon Calculator states ‘the Scottish National Heritage use a value of 0.25tC/ha/yr.’ however the guidance which informs this is no longer available, and this is highlighted as an evidence gap.
Key consideration: Should the baseline condition of peatland be incorporated in the Carbon Calculator?
Whilst the loss of CO2 fixing potential will remain the same, degraded peatland is likely to be a net source of emissions rather than a sink (ibid) and there is no consideration of these emissions within the Carbon Calculator. Other reasons for incorporating the baseline condition and replication of the Peatland Code’s calculation methodology are provided within this report (see Section 3.11.1). The use of HRSD could support the identification of peatland condition.
Key consideration: Impacts of climate change
Carbon fixing potential of blanket bogs (which make up 90% of Scotland’s peatland) is anticipated to decline/be under threat by 2050-80 when considering the impact of climate change (Ferretto et al, 2019). The impact of climate change on peat has not previously been considered, however is of growing concern. Degraded peatlands are less resilient to the impacts of climate change, so the emissions will change proportionally more in degraded versus pristine peatland. Climate change is also likely to make successful restoration more challenging Norby et al (2019), although it has also been indicated that successful restoration of degraded/actively eroded sites could see the greatest CO2 improvements (Evans et al, 2023), there is variation in results of the impacts of climate change on carbon fluxes following restoration (see Section 3.11 for more information).
Assessment findings: Loss of soil CO2
Scientific accuracy: Peat removed
- Calculating volume of peat removed:
- The Carbon Calculator uses an appropriate methodology for calculating the volume of peat removed for borrow pits, turbine foundations, hard-standing and access tracks, as well as any additional peat.
- However, the use of averages may be producing a less accurate result than if actual numbers for each infrastructure feature (i.e. turbine foundation #1,2,3 etc) were inputted, as carried out in PMPs. This was reflected in industry feedback where it was highlighted that excavation volumes shown in the PMP are more realistic than what is shown in the Carbon Calculator.
- Calculating CO2 loss from removed peat:
- This is the largest source of peatland related carbon emissions because of development.
- The carbon content of dry peat and dry soil bulk density are important parameters which drive the outputs of the Carbon Calculator. Sensitivity analysis (Appendix 10.2) demonstrates the correlation between carbon content of dry peat and dry soil bulk density and carbon losses from soil organic matter. Halving the data input values of either independent variable has the impact of a 60% reduction on emissions associated with carbon losses from soil organic matter.
- Literature review findings indicate that carbon content of dry peat has a typical range of 50% to 55% and dry soil bulk density a range of 0.06 to 0.25 gcm3 (e.g., Chapman et al., 2009; Ratcliffe et al., 2018; Heinemeyer et al., 2018; Howson, 2021, Lindsay, 2010; Parry and Charman, 2013; Levy and Gray, 2015; Carless et al., 2021; Howson et al., 2022).
- The calculation methodology is appropriate.
- The Carbon Calculator assumes a worse-case scenario that all peat removed is destroyed and the carbon content is lost. Although in practice peat is often relocated, which should be more favourable, subject to it being sensitively relocated (SEPA, 2012; IUCN, 2023), there is an evidence gap in literature which illustrates successful peat relocation (i.e. via emissions rates from relocated excavated peat). In the absence of evidence, the assumption that the carbon content will be lost over time is an appropriate worst-case conclusion.
Usability: (Peat removed)
- Calculating volume of peat removed:
- The ‘average depth of peat at site’ input variable in the ‘characteristics of peatland before wind farm development’ is not applied to any of the calculations in the Carbon Calculator. However, the ‘average depth of peat removed’ from each development feature (i.e. ‘average depth of peat removed from borrow pit, hard standing, turbine foundations’) is applied to calculate the quantity of peat removed. This provides greater accuracy than the singular ‘average depth of peat at site’ variable which could be removed from the Carbon Calculator.
- Mirroring the assessment findings from 3.8.1, the data inputs for peat depth provide an average peat depth for each development feature type (e.g. ‘average depth of peat removed from turbine foundations’) they are not specific to each individual feature on which the average is may up of. For example, there will be multiple turbine foundations. The use of an average in this context may be a poor representation of the spatial variability in peat cover, as well as the positioning of infrastructure within that peat cover. This is particularly relevant where there are different peat conditions, depths and land use types across a site. Peat depth is not uniform and varies over short distances due to the underlying topography (Parry et al., 2014). Under blanket peat thickness is typically 0.4–6 m; it can be up to ten metres and often more in raised bogs, and in fens is 0.4–5m. Peat soil is defined as requiring a depth of 0.5m and a surface peat layer containing more that 60% organic matter (NatureScot, 2023). A more detailed data input, like the ‘construction and forestry input data’ sheets and/or reflecting how peat is reported in the PMP (i.e. by turbine, borrow pit etc.) could allow for a more accurate assessment of the quantity of peat removed.
- NPF4 requires consideration of peaty soils, peat soil and peatland. Whilst the Carbon Calculator can be used in its current form on any peatland and responds appropriately to shallow peat depths (inputted as averages for each infrastructure type) a more specific data input for peat depth from each area where peat is removed would allow for better differentiation between different depths.
- Calculating CO2 loss from removed peat:
- Carbon content of dry peat and dry soil bulk density are user inputs. Whilst the exact metrics will be site specific, industry feedback indicated that these data inputs were difficult to obtain due to the lab analysis requirements (to obtain accurate data peat samples requiring drying out for long periods of time) and are therefore often based on assumptions, with one user utilising the von post scale. The ranges identified from the literature review could be incorporated into the Carbon Calculator as recognised minimum and maximum parameters to inform an inbuilt quality control measure.
Key consideration: replace the use of averages with infrastructure specific inputs
This approach would provide more accurate outputs and replicate how peat is reported in the PMP.
Key consideration: Reuse of removed peat
Feedback from industry indicated that where possible projects seek to relocate peat (excavate peat for development and then reuse it where there is a need e.g. due to cut and fill balance) rather than remove from site. There were concerns the Carbon Calculator assumes a worse-case scenario. Consideration of whether the Carbon Calculator should incorporate an option to include peat reuse needs to be weighed up against whether this would be appropriate, as the reuse of peat is site specific, i.e. there will be limited sites with options appropriate for peat reuse, and unless peat for reuse is handled carefully it is likely to oxidise over time and lose carbon to the atmosphere. Options for positive reuse are highlighted as an evidence gap and would require additional research prior to updating the Carbon Calculator.
Key consideration: Incorporate minimum and maximum parameters into the Carbon Calculator for the carbon content of dry peat and dry soil bulk density variables
These two variables have a significant impact on the Carbon Calculator output. The literature review has identified an acceptable range for both variables which could act as parameters and inform quality control.
Key consideration: the use of HRSD
A recent study from JHI explored the mapping of soil profile depth, bulk density and carbon stock in Scotland using remote sensing and spatial covariates (Aitkenhead and Coull, 2020), Although further research is required to determine the appropriateness of this approach, in relation to bias in datasets, model complexity and comparison, model performance, and separate models for interrelated properties, and further engagement with JHI and NatureScot on the role of HRSD in this context is recommended as a next step.
Scientific accuracy: Peat drained
- Calculating volume of peat drained:
- Volume of peat drained is calculated based on the depth of the drain and the extent of drainage. However, accurately establishing drainage efficacy is complicated as it affected by other parameters which are not well documented, and the changes brought about by drainage are expressed over a long period of time (IUCN, 2014).
- In pristine peatland the water table is typically close to the surface. As a result of excavation, drainage causes a drop in the water table (Irish Peatland Conservation Council, n.d.). This stimulates soil respiration and the release of carbon (Ma et al., 2022).
- Drainage also leads to subsidence (Ma et al., 2022) (IUCN, 2014). Subsidence should be measured alongside the water table depth to fully inform the likely extent of drainage.
- Drainage can be influenced by distance between ditches, hydraulic conductivity, and slopes (Price et al, 2023).
- There is a linear relationship between age of a drain and the cumulative carbon lost (Evans et al, 2021).
- Within degraded peat, the local formation of drainage ‘pipes’ is common, therefore possibly enhancing the extent of drainage.
- Despite research in the area there is an evidence gap in understanding what a suitable average is, and the methodologies to define the extent of drainage are difficult to apply.
- Volume of peat drained is calculated based on the depth of the drain and the extent of drainage. However, accurately establishing drainage efficacy is complicated as it affected by other parameters which are not well documented, and the changes brought about by drainage are expressed over a long period of time (IUCN, 2014).
- Calculating CO2 loss from drained peat:
- In flooded soils, CO2 emissions are equalled or exceeded by fixation leading to near-zero emissions or net carbon sequestration, whilst in drained soils CO2 emissions exceed fixation leading to net emissions. The carbon emissions associated with peat drainage are calculated based on the difference between emissions from drained land and emissions from undrained land.
- If site is not restored after decommissioning: The Carbon Calculator assumes a worse-case scenario that all carbon is lost (i.e. full drainage) following the same approach as removed peat. Due to the uncertainty in the parameter of the extent of drainage, this approach provides an appropriate worst-case scenario.
- If site is restored after decommissioning: The Carbon Calculator calculates emissions from drained land against the lifetime of the wind farm, restoration period (as defined by the user) and considers the number of flooded days per year based on IPCC (1997) assumptions, which should be updated to reflect more recent literature (see below ‘calculating emission rates from soils’). Due to the uncertainty around end-of-life and decommissioning it may be more appropriate to assume a worse-case scenario (i.e. assume site is not restored after decommissioning), and separately account for the benefits from restoration within the ‘CO2 gain – site improvement’ tab so that it is reported separately to the impact during the lifetime of the wind farm.
- See Section 3.8.1 for commentary on ‘carbon content of dry peat’ and ‘dry soil bulk density’ data inputs.
- Calculating emission rates from soils:
- The purpose of this calculation is to determine the loss of soil carbon in the peatland as a result of a wind farm development. This is calculated from the total carbon loss from physically removed peat, and total carbon loss from peat drainage.
- There are two approaches included within the Carbon Calculator – the IPCC methodology is a default approach and excludes any site detail; the model used by Nayak et al, 2008 is provided as a site-specific option. Users have the option to use either the IPCC (1997) methodology or the site-specific methodology. However, the Carbon Calculator states the site-specific method must be used for planning applications. If the IPCC (1997) methodology is redundant, it should be removed from the Carbon Calculator.
- IPCC 1997:
- This has been superseded by the 2014 Wetland Supplement.
- Whilst the Carbon Calculator does not include N2O (as it uses IPCC (1997) emission factors), the implications of this are small, and further updates could be made to include this. Whilst not expected to be a significant emission (ca. 2%) and dependent on the nutrient content of soils, it could be incorporated based on nitrogen content of soil samples. Where relevant (in the instance of intensive farming) N2O emissions could be comparable to CH4 .
- The IPCC emission factors referenced are Tier 1, and therefore not representative of Scotland’s peatlands. The factors are mainly based on warm season data, and peatlands in colder climates are likely to emit less (Hongxing and Roulet, 2023).
- Although these Tier 1 emissions factors could be updated by those represented by Evans et al, 2023 (Tier 2) and used within the 2021 update to the Emissions Inventory for UK Peatlands, they may not be fully representative of Scotland (which is wetter, and agriculture is predominantly less intensive). Furthermore, the Carbon Calculator states the site-specific method must be used for planning applications. It is therefore recommended that the IPCC (1997) methodology is removed due to the greater accuracy that the site-specific methodology can provide.
- Nayak et al, 2008:
- Calculates emissions factors via a bespoke methodology. Two options for type of peatland provided: acid bog, and fen (core data inputs). This covers the four main peatland habitats in Scotland; blanket bog (acid bog), raised bog (acid bog), fen (fen) and bog woodland (acid bog).
- The methodology equations for CO2 and CH4 emissions are derived by regression analysis, considering the average annual air temperature and average water table depth. Whilst the methodology does not directly refer to peatland condition, it incorporates air temperature and water table depth which is a good proxy in establishing emission rates (Tiemeyer et al., 2020) (Ma et al, 2022), as the water table has a significant influence on peatland CO2 and CH4 emissions (Huissteden et al, 2016, Evans et al, 2021). Empirical relationships between water table depth and CH4 and CO2 emissions defined by Evans et al (ibid) enable it to be used to calculate carbon emissions, as illustrated by Evans et al (2023).
- The evidence base for the methodology uses multiple peer reviewed studies (Bubier et al. 1993, Martikainen et al. 1995, Silvola et al. 1996, MacDonald et al. 1998, Nykänen et al, 1998, Alm et al. 1999), the analysis includes a robust sensitivity analysis which supports accuracy. However, the studies referenced reflect boreal peatland, and this element of the Carbon Calculator could be updated to reflect more recent literature ( (Evans et al, 2021), (Evans et al, 2023), (Ojanen and Minkkinen, 2019), (Wilson et al, 2016), (Tieymer et al, 2016)) which reflects a temperate climate and/or accounts for land use type.
Usability: Peat drained
- Calculating volume of peat drained:
- The volume of peat drained is highly sensitive to the user input for the ‘average depth of peat removed’ from each development feature (i.e. ‘average depth of peat removed from borrow pit, hard standing, turbine foundations’); increasing the depth and/or extent of drainage directly correlates with the volume of peat effected by drainage. This volume feeds into the calculations for CO2 loss from drained peat.
- The average water table depth and extent of drainage is a user input. These parameters vary depending on the specific site, and within the site itself. Authors of the Carbon Calculator, Nayak et al (2008) underline the importance of accuracy in the choice of these inputs. However, the cost of correctly following the methodologies presented in the Carbon Calculator were highlighted by industry stakeholders as ‘prohibitively high’ for projects that may not obtain planning consent.
- Average water table depth variable: The Carbon Calculator describes this variable as the upper boundary of the groundwater. Considerable variety in the method used to obtain the ‘average water table depth’ by users was observed – from obtaining an average depth via hydrologists, to using the water table depth from a previous similar site. Evidence of the hydrology calculations to inform user inputs were not assessed as part of this research, and could merit further research in conjunction with a review of other EIA deliverables and their applicability to the Carbon Calculator’s data inputs. The narrow timescales associated with the preparation of planning documents (i.e. EIA) present a challenge in obtaining reliable information, and the current approach does not account for the temporal changes of the water table. The Carbon Calculator output likely only represents a ‘snapshot’ which consequently, in combination with the variety in approaches to obtaining the variable, may be inaccurate.
- Average extent of drainage around drainage features at site’ variable: Industry feedback on this variable’s method was resolute in it being impractical to collect this data (due to both time requirements and associated cost) during planning timescales. Despite reviewing available evidence, a practical methodology (i.e. within planning timescales) to inform this variable could not be identified.
- Calculating CO2 loss from drained peat:
- See Section 3.8.2 for commentary regarding carbon content of dry peat and dry soil bulk density.
- Emission rates from soils:
- See Section 3.8.2 for commentary regarding emission rates from soils.
Key consideration: update the methodology for emissions rates from soils
The methodology should incorporate recent literature and a temperate peatland that reflects the Scottish context, it should also acknowledge the role of the mean annual water table depth, which has been identified as the overwhelmingly dominant control on CO2 fluxes (Evans et al, 2021). The literature review identified papers which should be reviewed when undertaking this update:
- Tiemeyer et al (2020)’s ‘A new methodology for organic soils in national greenhouse gas inventories: Data synthesis, derivation and application’ incorporates HRSD and uses water table data to determine Germany’s GHG estimate for organic soils at a National level, which it states could be applied at a project level.
- Evans et al (2023) ‘Aligning the Peatland Code with the UK peatland inventory’ provides an overview of low-cost methodologies to obtain site data to inform peat-carbon variables, including water table depth and reference to ‘Eyes on the bog’ methodologies (Lindsey et al, 2019).
Key consideration: should the Carbon Calculator account for emissions from drainage ditches?
Although the extent of drainage is captured in the Carbon Calculator, drainage ditches represent an additional source of CH4 emissions from drained organic soils (Peacock et al, 2021) which are not currently included in the calculations. Emissions from ditches are captured in the IPCC’s 2014 Wetlands supplement and could be applied to developments if the Carbon Calculator were to specify to peat condition, to replicate the approach used in the Peatland Code (Evans et al, 2023). The inclusion of drainage ditches could also be informed by the use of HRSD (see 3.8.12).
Key consideration: Investigate the use of HRSD in measuring water table depth
HRSD can be utilised to ascertain water table depth and provide historic trends. This could enhance the accuracy of Carbon Calculator when combined with ground truthing. For more information, please see Section 5. This could also inform Quality Control Mechanisms.
Key consideration: to what extent can assumptions/parameters, and HRSD be used to inform ‘Average extent of drainage around drainage features at site’?
The current methodology to obtain the extent of drainage is viewed as being impractical within planning timescales. Whether this variable (using an indicative assumption) should be automated, and/or include parameters, requires careful consideration, particularly as it is a highly sensitive input. The IUCN classifies drained peatland as that which lies within 30m of an active drain, (IUCN, 2022). The literature review was unable to determine a range to inform parameters on this variable, although it did identify a paper where GIS was utilised to establish surrounding drainage areas (Sallinen et al, 2019). The role of HRSD in informing this input variable should be considered in conjunction with other efforts being undertaken to establish better accuracy in quantifying drainage impacts. This includes work undertaken (and ongoing) at the James Hutton Institute (e.g. Aitkenhead et al, 2016, the Peat Mothership Project (2024)) to inform the best approach. Discussion of the draft report highlighted an additional study utilising HRSD to provide a national scale map of Scotland’s individual drainage channels and erosion features (Macfarlane et al, 2024) which would further inform the role of HRSD in this context and Section 3.8.10.
Key consideration: what quality control mechanisms are needed to enable a consistent (and accurate) approach to obtaining WTD and extent of drainage?
Industry feedback consistently highlighted concerns around the time and cost in obtaining the input variables required for extent of drainage and water table. These variables have a significant bearing on the carbon outputs, and so the approach to obtaining them should be uniform and feasible within planning timescales. This could be remedied through further engagement, the subsequent development/updating of guidelines (i.e. Guidance on Developments on Peatland, 2017), and/or the provision of training (to users and decision makers) and reinforced through the appropriate use of quality controls. This data could then go on to inform a national dataset of measurements.
Assessment findings: CO2 loss by Dissolved Organic Carbon (DOC) and Particulate Organic Carbon (POC) loss
Scientific accuracy
- This area of the Carbon Calculator determines the gross loss of soil carbon from both DOC and POC loss following peat drainage. Only restored formerly drained land is included in this calculation because if land is not restored, the carbon lost has already been counted as carbon dioxide via ‘CO2 loss from drained peat’ (Section 3.8.7). CO2 loss by DOC and POC has a low significance within the outputs of the Carbon Calculator, most CO2 losses due to wind farm development is associated with soil organic matter (see Appendix 10.2).
- The Carbon Calculator advises that “No POC losses for bare soil included yet. If extensive areas of bare soil is present at site need modified calculation (Birnie et al, 1991)”.
- Assuming site restoration, DOC and POC are calculated for the period (years) of site restoration (i.e. the time between the year of site improvement and the year of the sites habitat and hydrology being restored).
- Emissions are calculated based on a percentage of the total gaseous losses of carbon from improved/restored land, these are based on averages from Worrall (2009) which provide the following:
- DOC – 26% (7-40%)
- POC – 8% (4-10%)
- These assumptions (including the minimum and maximum) are tied into the Carbon Calculator (i.e. not editable by the user). DOC has a broad range, which could be causing some inaccuracy in the results. The Carbon Calculator’s assumption that DOC and POC loss is only applied to restored formerly drained sites may be underestimating DOC and POC emissions for sites which have eroding peatland.
- The Peatland Code methodology Smyth et al. (2015) uses DOC and POC emission factors (reflecting condition type) which follow Tier 1 default values for drained and rewetted temperate peatlands developed for the IPCC Wetland Supplement (IPCC, 2014). Evans et al (2023) note for DOC that few limited UK studies have been published, and other studies fall outside the UK-relevant climatic region; and similar for POC; few additional POC flux estimates exist to enable refinement. Although some recent UK evidence indicates DOC increases may be larger or smaller depending on the peatland type, there is insufficient DOC flux data across the range of UK peat types and condition classes to support a full country specific approach (ibid).
- Pickard et al (2022) found that increased DOC concentrations were detected in areas of drained peatland relative to non-drained peatland from the UK’s largest tract of blanket bog in the Flow Country of northern Scotland. These findings could be incorporated into the Carbon Calculator, however, as they represent one study based on a unique area of pristine peatland, a more conservative approach is recommended until further research is available.
- Discussion of the draft report raised an additional study from the Whitlee wind farm development exploring the effect of development phasing in relation to DOC and POC loss over a ten-year timespan, we suggest that further review incorporates the findings from this study.
Usability
- DOC and POC calculations require no inputs from the user.
Key consideration: align DOC and POC with the 2014 IPCC Wetland Supplement
For the purposes of the Carbon Calculator, emissions factors for DOC and POC could be applied to projects based on the peat condition, utilising the IPCC 2014 methodology, replicating the Peatland Code (Evans et al, 2023) which uses the UK inventory emissions factors. This would replace the current methodology but is more robust as the studies used to inform these default factors were based partly on a small number of UK studies (including two from Worrall), rather than a single study as currently used. This approach would have the added benefit of capturing DOC and POC emissions that are already occurring on eroding peatland and provide greater accuracy. The literature review highlighted an evidence gap where additional research is required to provide more specific DOC and POC estimations, building on the findings from Pickard et al (2022).
Assessment findings: CO2 losses associated with loss of forest
Scientific accuracy (simple)
- The simple methodology for forestry CO2 loss uses figures obtained from a single source (Cannell, 1999). Loss of future carbon sequestration is calculated by multiplying an emission factor by the area of forestry and lifetime of the wind farm. In the simple methodology this is a user input, “estimated carbon sequestered (t C ha-1 yr-1)”. The guidance note provides an assumption of 3.6 tC ha-1 yr-1 for yield class 16 m3 ha-1 y-1 (Cannell, 1999). Whilst this is comparable with an average (over 200 years) from the Woodland Carbon Code (Yield 16, 1.7m spacing, thinned) Woodland Carbon Code, 2024) it doesn’t consider aspects such as species, age, density etc of the site-specific parameters. Therefore, a level of uncertainty/ error can be inferred for users with differing site characteristics (tree species).
- There is no consideration of emissions associated with the felling activities. Whilst this is likely to be insignificant, it could be incorporated into the Carbon Calculator for completeness.
- There is no consideration of emissions associated with the loss of carbon stock (i.e. if the felled forest wood is destroyed), which depending on the use of the wood could be relevant (e.g. if the timber is burnt).
- There is no consideration of the impact on the peatland of removing the trees (where forestry is located on peatland). Whilst expected to have a positive impact over time on peatland restoration, it is acknowledged that further research is required in this area (Howson et al, 2021; IUCN, 2020).
- Based on our sensitivity analysis results (Table 3) from the simple and detailed methodology vary significantly based on similar parameters:
Table 3: Forest methodologies sensitivity analysis
|
Simple methodology | |||||||||
|
Data inputs |
Area of forestry plantation to be felled (ha) |
100 | |||||||
|
Average rate of carbon sequestration in timber (tC ha-1 yr-1) |
3.6 | ||||||||
|
tCO2e |
33,003 | ||||||||
|
Detailed methodology (presenting a reference scenario comparable to the simple methodology and subsequently scenario adjustments to consider the sensitivity of each input variable) | |||||||||
|
Data inputs |
Reference scenario |
Scenario 1 |
Scenario 2 |
Scenario 3 |
Scenario 4 |
Scenario 5 | |||
|
(Peat type) |
(Species) |
(Age) | |||||||
|
Soil type |
Deep peat |
Peaty gley | |||||||
|
Area to be felled (ha) |
100 | ||||||||
|
Width of forest around felled area (m) |
1 | ||||||||
|
Tree species |
Scots pine |
Sitka spruce | |||||||
|
Age (yrs.) |
10 |
5 |
20 |
40 | |||||
|
tCO2e |
99,465 |
90,149 |
110,282 |
98,170 |
100,625 |
96,990 | |||
- This is due to the simple methodology not accounting for/underestimating the following:
- Tree species and age.
- cleared forest emissions (currently labelled ‘carbon sequestration in soil under trees’ in the detailed methodology).
- Underestimating the amount of carbon lost due to felling in comparison to the detailed methodology (likely because of the additional variables that inform the detailed methodology – light interception and primary production).
Usability (simple)
- The input variables are acceptable in terms of usability. However, there is the potential for error with the current input variables guidance. The Carbon Calculator notes that sequestration rate is dependent on the yield class of the forestry. The guidance note provides an assumption of 3.6 tC ha-1 yr-1 for yield class 16 m3 ha-1 y-1. No guidance is provided as to how the species of tree influences yield class, although poplar, Sitka, and beech CO2 sequestration rates are provided in the separate user Guidance document, they are not visible in the Carbon Calculator. Enhanced user guidance and/or reference to sources of information (e.g. The Woodland Carbon Code) could be provided.
Scientific accuracy (detailed)
- The detailed method uses similar principles to the simple method, however, differs in its calculation of ‘the average carbon sequestered per year’, it requires additional user input (‘forestry input data tab’) to account for carbon loss based on soil type, species, and age of forestry, and provides a more complete account of the emissions from forestry in comparison to the simple methodology (see Table 3) .
- The method which informs these calculations (Xenakis et al, 2008) is comprehensive in calculating emissions from forestry. It uses the uses 3-PG (Landsberg, J.J., Waring, R.H., 1997). A generalised model of forest productivity using simplified concepts of radiation-use efficiency, carbon balance and partitioning, and builds on this to incorporate a soil organic matter decomposition mode, incorporating differences due to age of forestry at felling. The model has been calibrated and tested for commercial plantations of Scots pine in Scotland.
- ‘Carbon sequestration in soil under trees’: is noted within the Carbon Calculator as ‘more data needed’. ‘ It states that the aim of this calculation is to ‘account for the respiration from newly felled and disturbed soil, so as to include respiration from fresh plant inputs, from background soil organic matter decomposition, and from the disturbance of soil resulting in the release of additional carbon from soil aggregates. Different types of management disturbance should be considered’. This is labelled as ‘Cleared Forest Floor Emissions’ within the Carbon Calculator. It later states that this information is not yet available, so as an interim measure, carbon sequestration in soil under trees (including background respiration from soil organic matter decomposition and respiration from fresh plant input) is used.
- The two emissions factors currently used for the ‘Carbon sequestration in soil under trees’ are based on two studies located in Scotland which is appropriate. However, both studies assumes that forestry is on peaty soils, which may not be the case for all forestry inputs. Given that this element of the Carbon Calculator was originally planned to account for the ‘Cleared Forest Floor Emissions’ only (see previous paragraph), the emissions factors used in lieu of this are possibly overestimating the carbon sequestration associated with soil under trees. Since this literature was published, there has been further research to understand the relationship between carbon emissions and newly felled/disturbed soils (West, 2011) (Matthews et al. 2012), these studies have informed the development of the Woodland Carbon Code (2024).
- The detailed methodology also provides a calculation to determine the capacity factor for the turbines at the site. This is dependent on tree height, forest width and distance of the forest from the turbine. Although this methodology appears scientifically correct in terms of the measurements being used, none of the references provide justification of the overarching rationale/purpose of this calculation. Some of the references used for wind speed calculations are over 20 years old and it’s unclear whether these factor in the impacts of climate change on wind speeds. The technological advances in turbine functionality (and the extent to which they are impacted by forestry) needs to be considered. It is also reasonable to assume that the potential capacity of the wind turbines and influence of forestry on a wind turbine’s power curve will be considered by developers when establishing the Levelised Cost of Electricity (i.e. site feasibility) for a development. Overall, the appropriateness of this calculation in the context of the Carbon Calculator’s purpose is questionable and should be removed (see 3.3.4 Key consideration: Is the focus of the Carbon Calculator, correct?).
Usability (detailed)
- Feedback from industry engagement highlighted that the detailed methodology is not used as the number of input variables required is perceived as onerous/requiring specialist support.
- The forestry input data tab provides two options for soil types provided: peaty gley and deep peat. This appropriately covers both peat (organic) soils and peaty (organo-mineral) soils.
- The forestry input data tab provides two options for species: Scots pine and Sitka spruce. Scots pine is the main species in bog forests (NatureScot, n.d) the inclusion of other species may be beneficial in providing a more accurate output.
- The separate user Guidance document states the following: ‘Loss from soils of non-forested land is given by the estimated rate of carbon loss for two peat depths taken from Zerva et al (2005) for peaty gley (peat depth 5 to 50cm = 3.98 t C ha-1yr-1), and Hargreaves et al (2003) for deep peat (peat depth>50cm = 5.00 t C ha-1 yr-1)’. The reference to ‘non-forested land’ in the Guidance may be an error given the references used.
- Emissions from felling and transportation are a user input; these could be estimated based on assumptions and utilisation of UK Government emission factors. The existing guidance notes provide outdated references (Morison et al, 2011). The most up-to-date UK Government emission factors should be used and could be automated within the Carbon Calculator.
Key consideration: Replace the simple and detailed methodologies with one approach, informed by Woodland Carbon Code calculations
Although the detailed forestry methodology is comprehensive, it is perceived as onerous/requiring specialist support by users, and so in many applications the simple methodology is used. The simple methodology is likely to be underestimating carbon impacts. In turn, the detailed methodology may be providing inaccuracies in relation to ‘Carbon sequestration in soil under trees’. The comprehensive nature of the detailed approach also has implications for the ability to ‘futureproof’ the Carbon Calculator. The equations which inform it and the formula within the Calculator, are complicated and difficult to interpret without advanced excel skills. This presents a risk when undertaking future updates to the Carbon Calculator.
Having one option in the Carbon Calculator which strikes a balance between inputs required and the generation of an accurate output is an important consideration. The Woodland Carbon Code’s (WCC) (Woodland Carbon Code, 2024) calculator includes a wider range of tree species with rates based on spacing (m), yield class, management type and age. The WCC is supported by Scottish Forestry and has undergone independent validation and verification. It provides a credible dataset that is reviewed and updated regularly. To enable a more robust output, the sequestration rates ‘Biomass Carbon Lookup Table’ could be replicated in the Carbon Calculator and aligned with the WCC to enable consistency in reporting methods.
Key consideration: Remove the option to affect the wind turbine’s capacity factor via the forestry inputs tab
The calculations that inform this appear to go beyond the remit of this Section’s purpose in calculating the CO2 losses associated with forestry. More rationale on why this is not appropriate and should be removed is provided in Section 3.10.3 bullet point 6.
Key consideration: Use of HRSD in determining forestry inputs
The role of HRSD and whether it could be utilised to determine key input variables for forestry and/or estimated carbon stocks (see Tolan et al, 2024, Cheng et al, 2024, which use cutting edge technology to estimate carbon stocks) should be explored in collaboration with forestry organisations (i.e. Scottish Forestry, NatureScot, Forestry and Land Scotland, Forest Research). There are several open resources that could inform this (i.e. Scottish Forestry Map viewer (Scottish Forestry, n.d.), Habitat Land Cover Map of Scotland (2024), Scottish Remote Sensing Portal (Scottish Government, n.d.)). Process-based modelling, data assimilation and remote sensing has been applied by the University of Edinburgh to quantify carbon stock changes, and remote sensing is used by Forest Research to accurately map woodland.
Assessment Findings: CO2 gains from site improvement
Scientific accuracy
- This area of the Carbon Calculator estimates the reduction in GHG emissions due to restoration of the site. The calculation for this area of the tab replicates the calculation used to ascertain loss of soil CO2 (peat drained) (Nayak et al, 2008), and so the findings from 3.8.7 and 3.8.8 are also relevant to this section.
- The current calculations assume that restoration will be successful, and that peatland will be restored to pristine condition. The UK Inventory and Peatland Code transitions land from degraded condition categories to ‘modified bog’ upon restoration, it does not apply the ‘near-natural’ emission factor to restored peatland, recognising the difficulty in fully restoring peatland to the full sequestration potential.
- It is difficult to accurately model emission reductions associated with restoration at pre-planning phases – in particular, the ‘depth of peat above the water table after restoration.’ There are several restoration activities (hydrology and habitat ‘yes/not applicable’ inputs) within the Carbon Calculator are assumed to occur post wind farm operation (>20 years in the future), although these are not linked to any calculations.
- Undisputed, is that the restoration of degraded sites should be a priority, and the benefits of such activities are well documented. However, there is variation in understanding the impact of restoration on carbon savings. How restoration affects carbon fluxes and storage on degraded sites shows variety in the potential results. Peatland recovery is not instantaneous (Gatis et al.,2023, Alderson et al, 2019), with interventions taking at least 5 years or more for ecosystems changes to stabilise (Gregg et al., 2021). Artz et al. (2012) note that carbon savings are dependent on the starting condition prior to restoration with some research indicating that severely degraded sites take longer to achieve emissions reduction than less affected peatlands. Restoring the carbon ‘sink’ functionality of a degraded peatland is possible, however this may take decades, and be dependent on the initial level of site degradation (Gregg et al., Ibid). Lindsay (2010) notes that peat accumulation in blanket bogs can be half that of raised bog due to warmer climatic conditions and suggests a timeframe of around four decades before restoration to a fully functional bog can achieve net carbon gain, although emissions reduction will occur much earlier. Although there can be short term CH4 fluxes because of restoration the long-term carbon savings can negate this short-term effect (Emsens et al., 2021– note this study relates to fen bogs, but also highlights the important role of vegetation establishment). Evans et al. (2022) note that independent modelling studies by Heinemeyer et al. (2019) for the Defra Peatland-ES-UK (Defra BD5104) project, and Simon et al. (2021) for the BEIS review of UK GGR potential both suggested that degraded peatlands have the potential to accumulate carbon rapidly, and therefore that the CO2 sequestration potential of peat restoration may have been significantly underestimated. The current methodology does not take these considerations into account.
- Future climate conditions (e.g. rising temperatures, extreme weather events) could affect the ‘success’ of peat restoration (i.e., carbon accumulation). Climate change is noted to exacerbate ecological stresses on less resilient, managed peatlands over the next 60 years, leading to more rapid losses of stored peat carbon (Worral et al, 2010) (Ferretto et al, 2019) (Natural England, 2020). Any estimates made have a high level of uncertainty, given the relatively short timeframe of restoration in the context of a wind farm’s lifespan.
- The calculations for site restoration are sensitive to water table depth changes, pre- and post-restoration (Appendix 11.3). Water table has a significant influence on peatland CO2 and CH4 emissions (see section 3.8.7). However, there is limited empirical data to provide a high level of certainty in relation to future carbon stocks and carbon flux; carbon benefits can be difficult to quantify and affected by environmental conditions on a site-by-site basis (Wille et al, 2023), Gregg et al. (2021) state in relation to blanket bogs, raised bogs and fens that ‘large spatial variability has been shown and studies have often been carried out at the same sites or regions’, blanket bogs are less responsive to drainage and rewetting alone, but can be beneficial when coupled with peatland stabilisation and re-establishment of vegetation cover, the role of vegetation as well as hydrology in site restoration should therefore be taken into account. Further research is required in the context of restoration, including blanket bog rewetting (Evans et al., 2014; Williamson et al., 2017), and restoration of plantations to semi-natural peatland.
- See also the commentary on ‘emission rates from soils’ within Section 203.8.
Usability
- Calculations within this tab are based on the changes to water table depth pre- and post-restoration of peat (inputted by the user) and the calculated emission rates from soils. It has been noted that small changes to the figures for water table depth can significantly increase the value of carbon gains due to peat restoration. Although the methodology for ‘Water table depth after improvement’ variables indicate an optimal water table level is ‘probably just below the surface (-10 to -6 cm)’, within planning timescales the future water table depth (and other associated variables) can only be approximated. When accounting for the high level of uncertainty regarding restoration, the question of whether this element of the Carbon Calculator should be conventionalised to replicate the Peatland Code’s calculations and guidance requires consideration.
- See also commentary on ‘emission rates from soils’ within Section 203.8.
See 3.3.3 key consideration: is the output of the Carbon Calculator useful as a decision-making tool?
The timeframe for achieving a ‘carbon payback’ or ‘carbon neutrality’ should be considered on a land for land basis (e.g. restoration gains vs construction losses) instead of relying on savings from generation. More information on how this should be presented is provided in 3.3.3.
Key consideration: the Carbon Calculator should be updated to replicate the Peatland Code
Site restoration should explore the option to replicate elements of the Peatland Code’s approach, including its requirements around restoration success. In particular, the Peatland Code utilises up-to-date emissions factors (aligned with the UK inventory), and includes a 15% sensitivity buffer to accommodate the risk of future carbon losses (e.g., restoration failure) (see Section 4 on the Peatland Code). Establishing a baseline condition that reflects the Peatland Code’s classification, would simplify the input required for site restoration (by then selecting the appropriate condition post-restoration). Considering the degree of uncertainty, this is appropriate and could prevent the risk of inaccuracy and/or ‘fixing’ of the current variables. This would negate the use of ‘carbon fixing’, ‘loss of DOC and POC’, and ‘peat drainage after restoration’ calculations. By bringing different funding mechanisms together, this alignment could also support data collection at a national restoration level. Through our engagement with the Peatland Expert Advisory Panel, it was determined that the full implementation of the Peatland Code on development sites is not suitable. Further dialogue with the Peatland Code representatives is recommended to identify the optimal approach for this consideration.
Key consideration: Quality control should review the Carbon Calculator in conjunction with the Peat Management Plan (PMP) and Habitat Management Plan (HMP)
In determining whether a development should be built on peatland, a key decision factor should be the extent to which the developer is able to illustrate site restoration post installation, reflecting the requirements of NPF4 (mitigation hierarchy) and Good Practice restoration Guidance (e.g. NatureScot, Peatland Code). Resilient restoration through credible restoration techniques which prioritise vegetation establishment and a return to high water tables are critical components of this. The remit of the Carbon Calculator is to determine whether the carbon impact of the development on peatland is acceptable, any carbon savings from site restoration should be reviewed holistically in conjunction with a robust PMP and HMP that evidences credible restoration techniques. To inform this, a review of the requirements for key EIA deliverables (i.e. PMP, HMP, Carbon Calculator) could be undertaken, to enable a streamlined decision-making process.
Summary
Based on the findings from the technical assessment and evidence review, Table 4 presents a summary of the Carbon Calculator’s scientific accuracy and data usability ratings.
Table 4. Carbon Calculator areas summary
|
Areas of the Carbon Calculator |
RAG rating Scientific accuracy |
RAG rating Data usability | |
|
3.2 |
Data inputs |
– | Amber |
|
3.3 |
Payback time and CO2 emissions | Red | Amber |
|
3.4 |
Wind farm CO2 emission savings | Red | Green |
|
3.5 |
Emissions due to turbine life | Red | Amber |
|
3.6 |
Loss of carbon due to back up power generation | Red | Green |
|
3.7 |
Loss of carbon fixing potential of peatlands | Amber | Amber |
|
3.8 |
Loss of soil CO2 |
– |
– |
| Amber | Amber | |
| Red | Red | |
|
3.9 |
CO2 loss by DOC and POC loss | Amber |
– |
|
3.10 |
Loss of carbon due to forestry loss |
– |
– |
| Red | Amber | |
| Amber | Red | |
|
3.11 |
Carbon saving due to improvement of peatland habitat | Red | Red |
In summary, the ‘payback time and CO2 emissions’ is not relevant/consistent with the findings of the technical assessment and literature review. The focus of the Carbon Calculator (3.4) requires revisiting, with consideration of whether 3.5. and 3.6. are required considering new planning policy and applicability of WLCAs.
Accuracy is lacking in one or more of the following: methodologies, use of emission factors and assumptions, for all peat-related areas of the Carbon Calculator, as well as the forestry area. The usability of the Carbon Calculator presents a more varied picture, with some data accessible to the user. However, there was uncertainty in the ability to accurately access some of the data required for the Carbon Calculator – in particular, for variables that drive the results, which could have a material bearing on the accuracy of outputs.
Further commentary is provided in 7. Conclusion and recommendations.
SWOT analysis
Table 5 presents the strengths, weaknesses, opportunities, and threats of the current Carbon Calculator identified from this Report’s findings:
Table 5: SWOT analysis
|
Strengths |
|
|
Weaknesses |
|
Accuracy
|
|
Usability
|
|
Opportunities |
|
|
Threats |
|
Evaluation of Peatland Code
The IUCN Peatland Code is a voluntary certification standard for UK peatland (fens and bogs) projects seeking financial benefits from restoration activities through ‘carbon units.’ The code provides a framework for the validation and verification of greenhouse gas reductions.
The principle of the Peatland Code is classification of land use or peatland condition pre-restoration and post-restoration. In the following subsections we explore the value add of integrating this categorisation into the Carbon Calculator, focusing on bog peatland.
The Carbon Calculator does not currently fully align with the Peatland Code; there are opportunities to replicate elements of the Peatland Code within the Carbon Calculator, as well as aligning emission factors.
Overview of the Peatland Code
The Peatland Code encompasses a simplified methodology to quantify the effect of peatland restoration on land emissions, for the purpose of verification for ‘carbon units.’ The Peatland Code considers accuracy and reliability when quantifying the climatic benefits of peatland restoration. As such key requirements on projects include:
- Validation and Verification: There is a requirement for restoration projects to undertake third-party validations and verifications to ensure climate benefits are quantifiable, additional, and permanent.
- Management and monitoring plan: all projects are required to have a restoration management plan for the duration of the project. The monitoring plan should track the peatland condition over time.
- Management of Permanence: to manage the risk of project permanence, a 15% risk buffer is applied to emission reduction calculations. This acknowledges the risk of future carbon losses; either from emissions associated with restoration activities (e.g. fuel use) or to future peatland restoration failure.
Bog emissions calculator
The bog emissions calculator requires four inputs (area, project duration, pre-restoration condition and post-restoration condition) (Table 6) from which emission reductions (tCO2e) are calculated from a ‘emissions lookup table’ across 100-year period (Table 7). The emission factors have been developed to align with the UK Greenhouse Gas Inventory, based on recent research from the UK Centre for Ecology & Hydrology, and the JHI (Evans et al, 2023). The difference between the pre- and post-restoration emission factors provides the carbon reductions achieved through restoration.
Table 6: Peatland Code Condition Categories (bogs)
|
Pre-Restoration (Baseline) Condition Category |
Post-Restoration Condition Category |
|
|
Table 7: Peatland Code Bog Emission Factors
|
Peatland Condition |
tCO2e/ha/year | ||
|
Baseline / Pre-restoration |
Post-restoration |
Pre-restoration |
Post-restoration |
|
Actively Eroding: Hagg/ Gully |
Revegetated |
17.72 |
3.42 |
|
Actively Eroding: Flat Bare |
Revegetated |
17.72 |
3.42 |
|
Drained: Artificial |
Rewetted Modified Bog |
3.32 |
0.32 |
|
Drained: Hagg/ Gully |
Rewetted Modified Bog |
2.51 |
0.32 |
|
Modified |
Rewetted Modified Bog |
2.51 |
0.32 |
|
Near natural |
Near natural |
0.32 |
0.32 |
Fen emissions calculator
The fens emissions calculator requires three inputs for both the pre- and post-restoration scenarios (land use classification, average annual water table depth and average peat depth) (Table 8), from which emissions from peat are calculated. Unlike the bogs emission calculator the emission factors are locked, however are understood to be a combination of Tier 1 and 2 emission factors (IPCC), and emission estimated derived from the site’s effective water table depth (Evans et al. 2021).
|
Fen Land Uses | |
|
|
Benefits and drawbacks
Based on our findings of the Carbon Calculator’s technical assessment (see Section 3) and review of the Peatland Code, Table 9 provides a high-level summary of the benefits and drawbacks of integrating the Peatland Code’s methodology and emission factors within the Carbon Calculator.
Table 9: Peatland Code Summary
|
Benefits |
Drawbacks |
|
|
Recommendations for the Carbon Calculator
The Peatland Code provides an established methodology to quantify GHG benefits across the UK. Aligning with this methodology could improve the accuracy of baseline carbon flux and consistency in reporting the benefits of restoration activities. However, through our engagement with the Peatland Expert Advisory Panel, it was determined that the full implementation of the Peatland Code on development sites is not suitable. Further dialogue with the Peatland Code representatives is recommended to identify the optimal approach for the following opportunities for the Carbon Calculator:
- The condition categories could be replicated to establish a more representative baseline and subsequent restoration status. The Carbon Calculator currently assumes peatland is pristine and presents a worse-case scenario in terms of carbon lost, however lost carbon may not be fairly attributed to the wind farm development.
- Whilst the emission factors may not be wholly representative of Scotland (based on a UK average) they are widely recognised as best practice. Integration of the peatland condition categories could provide a recognised approach to quantifying the benefits of peatland restoration activities (site improvements tab).
- Use of a risk buffer (measure of uncertainty) within the site improvements tab.
- If building on degraded peatland, the Carbon Calculator could include a requirement on developers to improve condition of the site through the project’s lifespan. The principles of the Peatland Code could be used to inform guidance on this.
High Resolution Spatial Data (HRSD)
A literature review (Appendix 11.4) of eight data sources was conducted to identify HRSD measures that could indicate the presence and condition of peat. The following subsections provide analysis of the benefits and drawbacks of HRSD, and how it might improve the Carbon Calculator’s accuracy.
Summary of HRSD methodologies
To date, multiple types of imagery have been used to varying degrees of success (Table 10).
Table 10: HRSD summary of findings
|
#1: Optical/near infrared spectral imaging |
Method |
ESA’ Sentinel 2, NASA LandSat |
|
Author |
Pontone et al., 2024. | |
|
Benefits |
| |
|
Drawbacks |
| |
|
#2: Infrared Land Surface Temperature |
Method |
MODIS TERRA Grid data |
|
Author |
Worrall et al. 2019 | |
|
Benefits |
| |
|
Drawbacks |
| |
|
#3: Synthetic Aperture Radar (SAR) |
Method |
Sentinel 1 VV/VH Backscatter |
|
Author |
Toca et al. 2023, Pontone et al. 2024, Lees et al. 2020 | |
|
Benefits |
| |
|
Drawbacks |
| |
|
#4: InSAR |
Method |
Sentinel 1 Interferometry, Intermittent Small Baseline Subset method |
|
Author |
Bradley et al. 2022, Alshammari et al. 2018 | |
|
Benefits |
| |
|
Drawbacks |
| |
|
#5: LiDAR |
Method |
Bespoke airborne LiDAR |
|
Author |
Carless et al. 2019 | |
|
Benefits |
| |
|
Drawbacks |
|
Summary of literature review findings
For optical based imagery (#1 and #2) cloud cover often limits the number of temporal snapshots captured, although it has not been successful in providing a good measure of condition, it can provide an understanding of landcover, including vegetation.
Active based sensing (#3, #4 and #5) can be coupled with landcover information provided from optical based imagery to provide a holistic understanding of peat condition and water table depth proxies. LiDAR data, as demonstrated by #5, is very useful for mapping topographical features such as draining channels and flow paths in high resolution but is expensive to obtain in real-time, given these features are relatively stable, LiDAR surveys commissioned over a wide area (i.e. a National Scheme) would be a useful dataset for identifying hydrological features that could inform the Carbon Calculator inputs. Our findings indicate that SAR data, coupled with the methodologies referenced in #3 and #4 appears to be the most promising in both its ability to capture hydrological condition of peat (including water depth) and the ability to obtain temporal imagery. More information on ESA’s Sentinel 1 platform is provided in Appendix 11.4. The limiting resolution of this approach may reduce the accuracy for small and/or spatially varying sites, but is advantageous over the deployment of ground-based sensors in that:
- It provides continual mapping across the whole site, compared to a sparse deployment of specific ground-based sensors.
- Archival data and repeated visits provide a longer temporal dataset from which to establish condition compared to ground-based sensors placed for a discrete time interval.
Future trends show a rise in popularity for SAR data products, with companies like Umbra offering high-resolution (1m) options, mitigating some of the current limitations. However, as SAR is unable provide landcover information, combining it with optical imaging could yield the most informative and accurate maps.
Although not assessed as part of this review, it is understood that Scottish Government is exploring a national LiDAR scheme with repeat collections every few years, which could track the stability, loss, and/or growth of peatlands. LiDAR alongside optical SAR and InSAR data could provide key data to inform the Carbon Calculator.
Recommendations for the Carbon Calculator
Scottish Government is exploring a national LiDAR scheme with repeat collections every few years, the results of this could be integrated into the Carbon Calculator, and reviewed to understand whether any further use of HRSD would provide additional transparency and support accuracy, over and above the following:
- Integrating HRSD into the Carbon Calculator, through a model which combines #1, #3 & #4 HRSD types, would enable an understanding of i) land cover types, providing proxies for ii) peat condition, and iii) water table depth, as well as the provision to understand the history of prospective sites to better inform peat condition. It could therefore also be used to inform subsequent monitoring activities. The condition of peat is causally related to the emission and sequestration of carbon sequestration and since this not currently considered by the Carbon Calculator, adding this capability would provide a step change in improving the accuracy of the Carbon Calculator. The water table depth is currently considered in the Carbon Calculator but requires manual surveying. Adopting the remote sensing approach would be advantageous in providing consistent and temporal measurements that would improve the accuracy between sites and support quality control.
- Integrating remote sensing into the Carbon Calculator will depend on having data products that are deemed accurate enough and are readily available at little or no cost. The products from TerraMotion (#4) would appear to be the most promising for peat condition but further stakeholder engagement would be needed to determine whether their offering suffices both in accuracy and cost, over and above the nationwide LiDAR scheme being explored by Scottish Government.
- An additional piece of work could be carried out to explore a proof-of-concept data product that brings together the surface motion, water table depth and vegetation cover measures identified in the review. Combining all three types of data is likely to provide the most informative and accurate measure of presence and condition of peat. The output should be validated against a typical ground-based survey carried out by an organisation using the Carbon Calculator.
Quality Control Mechanisms
Decision makers that utilise the outputs of the Carbon Calculator include the Energy Consents Unit (ECU) and local planning authorities. ECU review applications for consent for the construction, extension and operation of electricity generating stations with capacity more than 50MW. Applications below this threshold are reviewed by the relevant local planning authority. Following engagement with ECU, it has been ascertained that the existing quality assurance processes undertaken to evaluate and support decision-making would benefit from significant enhancement. Due to the Carbon Calculator’s complexity and the skillsets required to review the data outputs, it is ascertained that the Carbon Calculator is not currently used as a decision-making tool in the capacity it was intended but is used to check the credibility of the ‘payback period.’
Recommendations for the Carbon Calculator
The following actions are recommended to improve the utility of the Carbon Calculator as a decision-making instrument:
- The Carbon Calculator should have automated mechanisms for input variables that exceed acceptable error margins or contradict other variables.
- A guidance document should be produced to support developers, ECU, and local planning authorities on the key drivers of peat-related carbon emissions and potential variances (i.e. carbon fluxes), this could be done through the updating of existing guidelines (i.e. Guidance on Developments on Peatland, 2017).
- The decision to build on peatland should consider the developer’s ability to demonstrate post-installation site restoration, in line with NPF4 and Good Practice restoration Guidance (e.g. NatureScot, Peatland Code). Resilient restoration through credible restoration techniques which prioritise vegetation establishment and a return to high water tables are critical components of this. The Carbon Calculator’s purpose is to assess the carbon impact of the development on peatland. Carbon savings from site restoration should be reviewed holistically alongside a robust PMP and HMP. A review of the requirements for key EIA deliverables in terms of the inputs they require could benefit quality control and streamline the decision-making process.
A further consideration is that through the implementation of the above recommendations, Quality-controlled application data could contribute to a national database.
Carbon Calculator applicability
Based on our findings, this section explores the Carbon Calculator’s applicability as a decision-making Carbon Calculator across proposals for alternative infrastructure (e.g., transmission and distribution, battery storage options) and renewable energy development (e.g., solar) on peatland and carbon rich soils within Scotland. Whilst the Carbon Calculator, in its current form, would not be fully applicable to alternative development proposals, modifications can be made to increase transferability. Table 12Table provides some considerations against each area of the Carbon Calculator.
|
RAG |
Criteria |
Green |
Fully transferable to alternative developments |
Amber |
Limited modifications required to enable the Carbon Calculator to be used for other developments |
Red |
Area would require significant work to enable the Carbon Calculator to be used for other developments |
Table 12: Increasing Carbon Calculator applicability (Note Section 3 recommendations apply to the below).
|
Areas |
RAG |
Potential modification/considerations |
|---|---|---|
|
Data inputs | Amber |
Data inputs would need reviewing to cover the characteristics of other renewable technologies and developments. |
|
Payback time and CO2 emissions | Amber |
Payback time may not be an appropriate measure for all asset types. |
|
Carbon emission savings from wind farms | Amber |
Minor modifications would be required to calculate back-up requirements for other renewable energy assets. For some developments (e.g. battery storage) this area may not be relevant. |
|
Emissions due to turbine life | Red |
Currently wind farm specific, however data inputs and assumptions could be modified to allow for a broader selection of assets / technologies (e.g. drop-down selection for technology option). |
|
Loss of carbon due to back up power generation | Amber |
Minor modifications would be required to calculate back-up requirements for other renewable energy assets. For some developments (e.g. battery storage) this area may not be relevant. |
|
Loss of carbon fixing potential of peatlands | Amber |
For wind turbines this area of the Carbon Calculator considers the loss of future carbon fixation through the removal of peat. As the turbines are tall and provide little shading there is minimal impact to the wider area. However, consideration would need to be given to the spatial factors of alternative technologies. For example, if solar panels shade large areas of peatland this is likely to affect the sequestration rate of bog plants. There may also be impacts to peatland carbon cycling through the heat projected into the ground. There is a need for further research to understand the full implications (NatureScot, 2022). |
|
Loss of carbon stored within peatlands | Green |
Methodologies are relevant to any development on peatland. |
|
Loss of carbon due to leaching of DOC & POC | Green |
Methodologies are relevant to any development on peatland. |
|
Loss of carbon due to forestry loss | Green |
Methodologies are relevant to any development on peatland. |
|
Carbon saving due to improvement of peatland habitat | Green |
Methodologies are relevant to any development on peatland. |
Recommendations for the Carbon Calculator
In summary, although amendments would be required to the data inputs, wind turbine related emissions, and the presentation of ‘payback’ and carbon emission savings, the majority of methodologies for the peatland related calculations are relevant to any development on peatland. Whilst currently employed solely for wind farm developments, there is potential for the Carbon Calculator to be adapted to apply to grid infrastructure and other development types on peatland and carbon rich soils. There are no concerns on the Carbon Calculator’s ability to be used on projects of all sizes. However, to be applied to different infrastructure types, it is essential to consider their unique spatial characteristics, such as the shading effects and excess heat generated by solar farms. Further research and engagement are necessary to thoroughly understand how these factors impact peatland and carbon-rich soils before extending the Carbon Calculator to other development types.
Conclusion and recommendations
Conclusion
This report concludes that, based on the findings of a technical assessment, evidence review and quality control mechanisms, we recommend updating the Carbon Calculator in its current form to align with recent policy updates and advancements in science.
Our conclusions and recommendations set out how the Carbon Calculator could be updated through:
- Section 8.2: Addressing ‘big picture’ questions regarding the Carbon Calculator’s current remit to inform future decision making.
- Section 8.3: Making a series of updates to the current Carbon Calculator to bring it in line with scientific understanding and improve its accuracy.
Further areas of research due to evidence gaps identified during the literature review are summarised in Section 8.4.
Overarching considerations to inform future decision making
Key consideration: Does the calculator need to consider the lifecycle emissions of the wind farm, or could the focus be purely on the impact of development on peat? (Section 3.3.5)
Well-established methods and tools are available to undertake Whole Life Carbon Assessments (e.g. PAS2080). NPF4 Policy 2 (climate mitigation and adaptation) states that all proposals will be “be sited and designed to minimise lifecycle greenhouse gas emissions as far as possible.” Given this context, it is pertinent to question the necessity of the Carbon Calculator in replicating these existing approaches. Instead, it may be more beneficial to concentrate efforts on analysing the specific impacts of development on peatland/habitat carbon emissions. Key considerations include:
- Whether the lifecycle emissions of a wind farm need to be included in the Carbon Calculator?
- Could the calculations in the Carbon Calculator solely be focused on the impact of the development on peatland/habitat carbon emissions?
- Is the presentation of the current payback output necessary or appropriate for decision making?
Key consideration: Is the output of the Carbon Calculator useful as a decision-making tool? (Section 3.3.3)
Since the inception of the Carbon Calculator, scientific advancements have deepened our understanding of the interplay between nature and climate change. This progress is reflected in NPF4’s mitigation hierarchy and Policy 3b, which require substantial biodiversity improvements alongside restoration and offsetting requirements. In this context, it is important to acknowledge that carbon emissions sources should be segregated and reported separately to facilitate informed decision-making.
As the UK transitions to net zero, the current carbon payback’ approach (comparing development emissions to the counterfactual of electricity generated by fossil fuels) becomes less relevant. The focus should shift to evaluating the developments on the natural environment, specifically, whether it improves the environment and sequesters CO2 effectively. This method is more insightful than balancing combined wind farm and peatland emissions against ‘carbon payback,’ which does not provide significant insights.
To better assess the carbon impact on peatland, the timeline for achieving ‘carbon payback’ or ‘carbon neutrality’ should consider land-based emissions. For example, ‘payback time’ could be defined as the period needed to restore peatland to a ‘near pristine’ condition from a reported baseline, compared to the site’s baseline emissions without development and counterfactual scenarios for non-peaty sites, considering Scotland’s widespread peatland restoration efforts (refer to Section 3.3.3 for more details).
Key consideration: Should the Carbon Calculator incorporate other land use types?
Considering the previous point, it’s important to consider whether the Carbon Calculator should be updated to account for various land use and habitat types. This would offer a more comprehensive view of the carbon impact on other land use types, as compared to the carbon impact on peatland. This aspect should be evaluated considering Scotland’s evolving Biodiversity Net Gain requirements, current PMPs, HMPs, and their anticipated updates.
Key consideration: The current quality control mechanisms are insufficient
The scope of this report was to identify the key updates or improvements which would bring the tool in line with current scientific understanding and improve the accuracy to better inform decision making. However, this report concludes that due to its complexity and skill sets required to review the data outputs, the Carbon Calculator is not currently used as a decision-making tool. Section 6 on Quality Controls provides more detail on the rationale behind this, and provides recommendations to improve the current approach, which should be considered ahead of updating the Carbon Calculator.
Key updates to bring the Carbon Calculator in line with scientific understanding and improve accuracy
Updates to the current Carbon Calculator
This report concludes that the current Carbon Calculator is no longer up to date following advancements in science, but it could be brought in line with scientific understanding and improved accuracy through the updates to the following:
3.2 Data inputs:
To improve data usability, explore options to integrate the Carbon Calculator and/or allowance for easy transfer from/to input variables that align with/can be obtained directly from other sources, i.e. Peatland Management Plan, Hydrological Assessment, HMP, and (in future) WLCA.
- 3.3 Payback time and CO2 emissions:
Section 8.2 concludes that this area requires a significant update to accurately reflect a carbon ‘payback time’ in relation to land use emissions, and so updating the technical elements of its current calculation approach (Section 3.3.1) would not be appropriate.
- 3.4 Wind farm CO2 emission savings, 3.5 Emissions due to turbine life and 3.6 Loss of carbon due to back up power generation:
Section 8.2 concludes that these areas of the Carbon Calculator are not required. Updating the respective technical elements of each where inaccuracies have been identified would not be appropriate.
- 3.7 Loss of carbon fixing potential of peatlands:
To improve both scientific accuracy and data usability the baseline condition of peatland should be incorporated into the Carbon Calculator, the inclusion of the Peatland Code’s calculation methodology may make this area of the Carbon Calculator redundant (Section 3.7.3).
- 3.8 Loss of soil CO2:
- To significantly improve the scientific accuracy and data usability of this area:
- Incorporate minimum and maximum parameters into the Carbon Calculator for the carbon content of dry peat and dry soil bulk density variables (Section 3.8.5).
- Update the methodology for emissions rates from soils to reflect more recent literature and Scottish context (see Section 3.8.9 for more information).
- Account for emissions from drainage ditches (Section 3.8.10).
- Replace the use of averages with infrastructure specific inputs to replicate how peat is reported on in the PMP.
3.9 CO2 loss by DOC and POC loss:
To improve scientific accuracy, align DOC and POC with the 2014 IPCC Wetland Supplement, replicating the Peatland Code’s calculation methodology (Section 3.9.3).
3.10 Loss of carbon due to forestry loss:
To improve both scientific accuracy and data usability:
- Replace the simple and detailed methodologies with one approach, informed by Woodland Carbon Code calculations (Section 3.10.5) and HRSD.
- Remove the option to affect the wind turbine’s capacity factor via the forestry inputs tab (Section 3.10.6).
3.11 Carbon saving due to improvement of peatland habitat:
To significantly improve scientific accuracy and data usability, Update the Carbon Calculator to replicate the Peatland Code’s principles (Section 3.11.3).
5. High Resolution Spatial Data (HRSD):
HRSD has the potential to improve and enhance the data usability of the Carbon Calculator and could support quality control mechanisms. Recommendations include:
- Consider options to integrate HRSD into the Carbon Calculator to enable an understanding of i) land cover types, providing proxies for ii) peat condition, and iii) water table depth, as well as the provision to understand the history of prospective sites to better inform peat condition, drainage variables, and subsequent monitoring activities. This could act as a quality control measure against inputted variables.
- Further engagement with JHI and other key stakeholders involved in HRSD within Scotland (i.e. Nature Scot, CivTech) is recommended to enable a joined-up and effective approach to the solution developed.
Further research
This review has identified the following evidence gaps that necessitate further research and/or engagement:
- Further research is required to understand the impacts of climate change on the carbon fixing potential of peatlands.
- Further research is required to understand whether the option to reuse peat elsewhere would be appropriate.
- Further research required into the link between peatland condition and bog plant fixing potential, or on updated fixation emission factor rates (if appropriate).
- Further research is required to identify a suitable ‘average extent of drainage.’
- Further research is required to provide more specific DOC and POC estimations.
- Further research is required to understand whether HRSD could inform the carbon content of dry peat and dry soil bulk density variables.
- Further research on the impact on peatland from the removal of trees (where located on peatland and other carbon rich soils).
- Further research is necessary to understand how the spatial variability of different development types could impact peatland and carbon-rich soils.
References
Aitkenhead M, Coull M. (202) Mapping soil profile depth, bulk density and carbon stock in Scotland using remote sensing and spatial covariates. Eur J Soil Sci. 71: 71: 553–567.
Alderson, DM, Evans, MG, Shuttleworth, EL, Pilkington, M, Spencer, T, Walker, J & Allott, TEH (2019), ‘Trajectories of ecosystem change in restored blanket peatlands’, Science of the Total Environment, vol. 665, pp. 785-796.
Alm, J., Saarnio, S., Nykänen, H., Silvola, J. & Martikainen, P.J. (1999) Winter CO, CH and NO fluxes on some natural and drained boreal peatlands. Biogeochemistry, 44 (2), 163–186.
Alshammari, L., Large, D.J., Boyd, D.S., Sowter, A., Anderson, R., Andersen, R. and Marsh, S. (2018). Long-term peatland condition assessment via surface motion monitoring using the ISBAS DInSAR technique over the Flow Country, Scotland. Remote Sensing, 10(7), 1103.
Ardente F., Beccali M., Cellura M., Lo Brano V. (2008). Energy performance and life cycle assessment of an Italian wind farm. Renewable and Sustainable Energy Reviews, 12, 200–217.
Artz, R.R.E., Donnelly, D., Andersen, R., Mitchell, R., Chapman, S.J., Smith, J., Smith, P., Cummins, R., Balana, B., Cuthbert, A. (2012). Managing and restoring blanket bog to benefit biodiversity and carbon balance – a scoping study. Commissioned Report (in preparation). Scottish Natural Heritage.
BEIS (2020). Powering our Net Zero Future Energy White Paper CP 337. HM Government. https://assets.publishing.service.gov.uk/media/5fdc61e2d3bf7f3a3bdc8cbf/201216_BEIS_EWP_Command_Paper_Accessible.pdf
BEIS (2021). End to coal power brought forward to October 2024. Press Release. HM Government. https://www.gov.uk/government/news/end-to-coal-power-brought-forward-to-october-2024
Bubier, J., Moore, T. & Roulet, N. (1993) Methane emissions from wetlands in the mid-boreal region of northern Ontario, Canada. Ecology, 74, 2240–2254.
Cannell, M.G.R., Milne, R., Hargreaves, K.J., Brown, T.A.W., Cruickshank, M.M., Bradley, R.I., Spencer, T., Hope, D., Billett, M.F., Adger, W.N. and Subak, S. (1999). National inventories of terrestrial carbon sources and sinks: the UK experience. Climatic Change, 42, 505-530.
Carbon Trust (2022). Offshore Wind Sustainability JIP. Offshore Wind Sustainability JIP | The Carbon Trust
Carless, D., Luscombe, D.J., Gatis, N., Anderson, K. and Brazier, R.E. (2019). Mapping landscape-scale peatland degradation using airborne lidar and multispectral data. Landscape Ecology, 34, 1329-1345.
Carless, D., Kulessa, B., Booth, A.D., Drocourt, Y., Sinnadurai, P., Street-Perrott, F.A., Jansson, P. (2021). Geoderma, 402.
Chapman, S., Bell, J., Donnelly, D., Lilly, A. (2009). Carbon stocks in Scottish Peatlands. Soil Use and Management 25(2), 105 – 112.
Cheng, F.; Ou, G.; Wang, M.; Liu, C (2024) Remote Sensing Estimation of Forest Carbon Stock Based on Machine Learning Algorithms. Forests 2024, 15, 681.
Concrete Centre (2023). Embodied carbon of concrete – Market Benchmark. Embodied carbon of concrete – Market Benchmark (concretecentre.com)
Chapman, S., Artz, R. and Donnelly, D. (2012). Carbon savings from peat restoration. Climate Exchange, pp.1-17.
Dale, L., Milborrow, D., Slark, R. and Strbac, G. (2004). Total cost estimates for large-scale wind scenarios in UK. Energy Policy, 32(17), 1949-1956.
DESNZ (2023). Greenhouse gas reporting: conversion factors 2023. HM Government. https://www.gov.uk/government/publications/greenhouse-gas-reporting-conversion-factors-2023.
DESNZ (2023). Energy and emissions projections: 2021 to 2040. HM Government.
Emsens, W., Verbruggen, E., Shenk, P., Liczner, Y. (2021). Degradation legacy and current water levels as predictors of carbon emissions from two fen sites. Mires and Peat, 27(14), 15 pp.
Evans, C.D., Page, S.E., Jones, T., Moore, S., Gauci, V., Laiho, R., Hruška, J., Allott, T.E., Billett, M.F., Tipping, E. and Freeman, C. (2014). Contrasting vulnerability of drained tropical and high‐latitude peatlands to fluvial loss of stored carbon. Global Biogeochemical Cycles, 28(11), 1215-1234.
Evans, C.D., Peacock, M., Baird, A.J., Artz, R.R.E., Burden, A., Callaghan, N., Chapman, P.J., Cooper, H.M., Coyle, M., Craig, E. and Cumming, A. (2021). Overriding water table control on managed peatland greenhouse gas emissions. Nature, 593(7860), 548-552.
Evans, M.G., Alderson, D.M., Evans, C.D., Stimson, A., Allott, T.E., Goulsbra, C., Worrall, F., Crouch, T., Walker, J., Garnett, M.H. and Rowson, J. (2022). Carbon loss pathways in degraded peatlands: New insights from radiocarbon measurements of peatland waters. Journal of Geophysical Research: Biogeosciences, 127(7), e2021JG006344.
Evans, C., Artz, R., Burden, A., Clilverd, H., Freeman, B., Heinemeyer, A., Lindsay, R., Morrison, R., Potts, J., Reed, M. & Williamson, J. (2022, updated 2023) Aligning the Peatland Code with the UK peatland inventory. Report to the Department for Business, Energy and Industrial Strategy, Centre for Ecology and Hydrology, Bangor. 88pp.
Ferretto, A., Brooker, R., Aitkenhead, M., Matthews, R. and Smith, P., 2019. Potential carbon loss from Scottish peatlands under climate change. Regional Environmental Change, 19, 2101-2111.
Gatis, N., Benaud, P., Anderson, K. et al. (2023) Peatland restoration increases water storage and attenuates downstream stormflow but does not guarantee an immediate reversal of long-term ecohydrological degradation. Sci Rep 13, 15865. https://doi.org/10.1038/s41598-023-40285-4
Gregg, R., Elias, J.L., Alonso, I., Crosher, I.E., Muto, P. and Morecroft, M.D. (2021). Carbon storage and sequestration by habitat: a review of the evidence. Natural England, York. NERR094.
Gunther, A., Barthelmes, A., Huth, V., Joosten, H., Jurasinski, G., Koebsch, F., Couwenberg, J. (2024). Prompt rewetting of drained peatlands reduces climate warming despite methane emissions. Nature Communications, 11(1644).
He, H., Roulet, N.T. (2023). Improved estimates of carbon dioxide emissions from drained peatlands support a reduction in emission factor. Communications Earth & Environment, 4(1), p.436.
Heijmans, M.M.P.D., Mauquoy, D., van Geel, B. and Berendse, F. (2008), Long-term effects of climate change on vegetation and carbon dynamics in peat bogs. Journal of Vegetation Science, 19: 307-320. https://doi.org/10.3170/2008-8-18368
Heinemeyer, A., Asena, Q., Burn, W.B., Jones, A.L. (2018). Geo: Geography and Environment.
Howson, T.R. (2021). A comparison of the hydrology, hydrochemistry, and aquatic carbon flux from intact, afforested and restored raised and blanket bogs. PhD thesis, University of Leeds.
Howson, T., Chapman, P. J., Shah, N.,Anderson, R., & Holden, J. (2021). The effect of forest-to-bog restoration on the hydrological functioning of raised and blanket bogs. Ecohydrology, e2334.
Howson, T.R., Chapman, P.J., Holden, J., Shah, N., Anderson, R. (2022). A comparison of peat properties in intact, afforested and restored raised and blanket bogs. Soil Use and Management, 39(1), 104-121.
Van Huissteden, J., van den Bos, R. and Marticorena Alvarez, I. (2016) ‘Modelling the effect of water-table management on CO2 and CH4 fluxes from peat soils’, Netherlands Journal of Geosciences – Geologie en Mijnbouw, 85(1), pp. 3–18.
IEMA (2022). Assessing Greenhouse Gas Emissions and Evaluating their Significance.
Irish Peatland Conservation Council. (n.d.). Restoration of Drained Peatlands. Available at: Restoration of Drained Peatlands Irish Peatland Conservation Council (ipcc.ie)
IUCN, (2014). Briefing Note No3. Impact of artificial drainage on peatlands. 3 Drainage final – 5th November 2014.pdf (iucn-uk-peatlandprogramme.org)
IUCN, (2020). POSITION STATEMENT: Peatlands and Trees. IUCN UK PP Peatlands and trees position statement 2020.pdf (iucn-uk-peatlandprogramme.org)
IUCN, (2023). Peatland Code 2.0. IUCN National Committee United Kingdom. https://www.iucn-uk-peatlandprogramme.org/sites/default/files/2023-03/Peatland%20Code%20V2%20-%20FINAL%20-%20WEB_2.pdf
IUCN, (2023). Peatlands and Development. IUCN National Committee United Kingdom. Peatland and Development March 2023 – FINAL.pdf (iucn-uk-peatlandprogramme.org)
IPCC (2014) 2013 Supplement to the 2006 IPCC Guidelines for National Greenhouse Gas Inventories: Wetlands, Hiraishi, T., Krug, T., Tanabe, K., Srivastava, N., Baasansuren, J., Fukuda, M. and Troxler, T.G. (eds). Published: IPCC, Switzerland
Lees, K.J., Artz, R.R., Khomik, M., Clark, J.M., Ritson, J., Hancock, M.H., Cowie, N.R. and Quaife, T. (2020). Using spectral indices to estimate water content and GPP in Sphagnum moss and other peatland vegetation. IEEE Transactions on Geoscience and Remote Sensing, 58(7), 4547-4557.
Lenzen M., Munksgaard J. (2002). Energy and CO2 life-cycle analyses of wind turbines Review and applications. Renewable Energy, 26, 339-362.
Levy, P.E., Gray, A. (2015). Greenhouse gas balance of a semi-natural peatbog in northern Scotland. Environmental Research Letters, 10(9).
Lindsay R. (2010). Peatbogs and carbon: a critical synthesis to inform policy development in oceanic peat bog conservation and restoration in the context of climate change. University of East London, Environmental Research Group.
Lindsay, R., Clough, J., Clutterbuck, B., Bain, C., Goodyer, E., (2019). Eyes on the Bog. IUCN Peatland Programme https://www.iucn-uk-peatlandprogramme.org/sites/default/files/header-images/Eyes%20on%20the%20Bog%20Manual.pdf.
Ma, L., Zhu, G., Chen, B., Zhang, K., Niu, S., Wang, J., Ciais, P., Zuo, H. (2022). A globally robust relationship between water table decline, subsidence rate, and carbon release from peatlands. Communications Earth & Environment, 3 (254).
MacDonald, J.A., Fowler, D., Hargreaves, K.J., Skiba, U., Leith, I.D. & Murray, M.B. (1998) Methane emission rates from a northern wetland: response to temperature, water table and transport. Atmospheric Environment, 32(19), 3219–3227
Macfarlane, F., Robb, C., Coull, M., McKeen, M., Wardell-Johnson, D., Miller, D., Parker, T. C., Artz, R. R. E., Matthews, K., & Aitkenhead, M. J. (2024). A deep learning approach for high-resolution mapping of Scottish peatland degradation. European Journal of Soil Science, 75(4), e13538.
Marshall, C., Bradley, A.V., Andersen, R. and Large, D.J. (2021) Using peatland surface motion (bog breathing) to monitor Peatland Action sites. NatureScot Research Report 1269.
Martikainen, P.J., Nykiinen, H., Alm, J. & Silvola, J. (1995) Changes in fluxes of carbon dioxide, methane and nitrous oxide due to forest drainage of mire sites of different trophy. Plant and Soil, 168, 571–577
Morison, J. Matthews, R.W. Miller, G. Perks, M. Randle, T. Vanguelova, E. White, M. and Yamulki, S. (2012) Understanding the Carbon and Greenhouse Gas Balance of UK Forests. Forestry Commission, Edinburgh.
Natural England and RSPB (2020). Climate Change Adaptation Manual (NE751) – Evidence to support nature conservation in a changing climate. Royal Society for the Protection of Birds. http://publications.naturalengland.org.uk/publication/5679197848862720
NatureScot (n.d.). Restoring Scotland’s Peatlands. Restoring Scotland’s Peatlands | NatureScot
NatureScot (n.d.). Peatland ACTION case study: What’s the connection between peat and nature? https://www.nature.scot/doc/peatland-action-case-study-whats-connection-between-peat-and-nature
NatureScot (2015). Scotland’s National Peatland Plan: Working for our future. NatureScot/ NàdarAlba. https://www.nature.scot/doc/scotlands-national-peatland-plan-working-our-future
NatureScot (2022). General pre-application and scoping advice for solar farms. General pre-application and scoping advice for solar farms | NatureScot
NatureScot (2023) Advising on peatland, carbon-rich soils and priority peatland habitats in development management. Advising on peatland, carbon-rich soils and priority peatland habitats in development management | NatureScot
National Grid (2024). Clean energy: what happens when the wind isn’t blowing, and the sun isn’t shining? Stories, Energy Explained. National Grid. https://www.nationalgrid.com/stories/energy-explained/what-happens-when-wind-isnt-blowing-sun-isnt-shining
National Grid (2024). The Great Grid Upgrade. The Great Grid Upgrade | Making our electricity fit for the future (nationalgrid.com)
National Grid (n.d.). Onshore vs offshore wind energy: what’s the difference? Onshore vs offshore wind energy: what’s the difference? | National Grid Group
Nayak, D.R., Miller, D., Nolan, A., Smith, P. and Smith, J.U. (2008). Calculating carbon savings from wind farms on Scottish peat lands: a new approach. Scottish Government. https://www.gov.scot/publications/calculating-carbon-savings-wind-farms-scottish-peat-lands-new-approach/pages/0/
Nayak, D.R., Miller, D., Nolan, A., Smith, P. and Smith, J.U. (2010). Calculating carbon budgets of wind farms on Scottish peatlands. Mires and Peat, 4(9), 1-23.
Norby RJ, Childs J, Hanson PJ, Warren JM. (2019) Rapid loss of an ecosystem engineer: Sphagnum decline in an experimentally warmed bog. Ecol Evol. 9: 12571–12585.
Nykänen, H., Alm, J., Silvola, J., Tolonen, K. & Martikainen, P.J. (1998) Methane fluxes on boreal peatlands of different fertility and the effect of long-term experimental lowering of the water table on flux rates. Global Biogeochemical Cycles. 12, 53–69.
Ojanen, P. and Minkkinen, K. (2019) The dependence of net soil CO2 emissions on water table depth in boreal peatlands drained for forestry. Mires and Peat, Volume 24 (2019), Article 27, 1–8,
Parry, L.E., Charman, D.J. (2013). Modelling soil organic carbon distribution in blanket peatlands at a landscape scale. Geoderma, 211-212, 75-84.
Parry, L.E., West, L.J., Holden, J., Chapman, P.J. (2014). Evaluating approaches for estimating peat depth. Journal of Geophysical Research: Biogeosciences, 119(4), 567– 576.
Peat Mothership (2024). About the Project. Peat Mothership. https://www.peatmothership.org/
Peacock, M., Audet, J., Bastviken, D., Futter, M.N., Gauci, V., Grinham, A., Harrison, J.A., Kent, M.S., Kosten, S., Lovelock, C.E. and Veraart, A.J., (2021) Global importance of methane emissions from drainage ditches and canals. Environmental Research Letters, 16, 044010.
Pickard, A. E., Branagan, M., Billett, M. F., Andersen, R., and Dinsmore, K. J (2022).: Effects of peatland management on aquatic carbon concentrations and fluxes, Biogeosciences, 19, 1321–1334
Pontone N., Millard K., Thompson D.K., Guindon L., & Beaudoin A. (2024). A hierarchical, multi‐sensor framework for peatland sub‐class and vegetation mapping throughout the Canadian boreal forest. Remote Sensing in Ecology and Conservation. https://doi.org/10.1002/rse2.384
Price, J.S., McCarter, C.P. and Quinton, W.L. (2023). Groundwater in Peat and Peatlands. Groundwater Project. Guelph, Ontario, Canada, 108 pp. ISBN: 978-1-77470-015-0.
Ratcliffe, J.L., Payne, P.J., Sloan, T.J., Smith, B., Waldron, S., Mauqouy, D., Newton, A., Anderson, A.R., Henderson, A., Anderson, R. (2018). Mires and Peat, 23(3), 1-30.
Sallinen, A., Tuominen, S., Kumpula, T. and Tahvanainen, T. (2019). Undrained peatland areas disturbed by surrounding drainage: a large-scale GIS analysis in Finland with a special focus on aapa mires. Mires and Peat, 24(38), 1-22.
Scottish Forestry (n.d.) Scottish Forestry Map Viewer. Scottish Forestry – Scottish Forestry Map Viewer
Scottish Government (n.d). Scottish Remote Sensing Portal. Scottish Remote Sensing Portal | Scottish Government (remotesensingdata.gov.scot)
Scottish Government (2007) Scottish Planning Policy 6 Renewable energy. Withdrawn. ISBN: 9780755965526
Scottish Government, Scottish Natural Heritage, SEPA (2017) Peatland Survey. Guidance on Developments on Peatland.
Scottish Government (June 2024) Energy Statistics for Scotland Q1 2024 Figures
Scottish Government (2023) Onshore wind sector deal, Energy and Climate Change Directorate, ISBN: 9781835213810
Scottish Government (2024) Record high peatland restoration. Press release. https://www.gov.scot/news/record-high-peatland-restoration/
Scottish Government (2024). Scotland Habitat and Land Cover Map – 2022. https://www.data.gov.uk/dataset/fb20f816-d3cb-433b-9cd5-0e0b8eea7367/scotland-habitat-and-land-cover-map-2022
SEPA (2012). Developments on Peat and Off-Site Uses of Waste Peat. Scottish Environment Protection Agency. https://www.sepa.org.uk/media/287064/wst-g-052-developments-on-peat-and-off-site-uses-of-waste-peat.pdf
Silvola, J., Alm, J., Ahlholm, U., Nykänen, H. & Martikainen, P.J. (1996) CO2 fluxes from peat in boreal mires under varying temperature and moisture conditions. Journal of Ecology, 84, 219–228.
Smith, J.U., Graves, P., Nayak, D.R., Smith, P., Perks, M., Gardiner, B., Miller, D., Nolan, A., Morrice, J., Xenakis, G. and Waldron, S. (2011). Carbon Implications of Wind farms Located on Peatlands–Update of the Scottish Government Carbon Calculator Carbon Calculator. Scottish Government, Scotland.
Smyth, M.A., Taylor, E.S., Birnie, R.V., Artz, R.R.E., Dickie, I., Evans, C., Gray, A., Moxey, A., Prior, S., Littlewood, N. and Bonaventura, M. (2015) Developing Peatland Carbon Metrics and Financial Modelling to Inform the Pilot Phase UK Peatland Code. Report to Defra for Project NR0165, Crichton Carbon Centre, Dumfries.
Speranskaya, L., Campbell, D. I., Lafleur, P. M., and Humphreys, E. R. (2024) Peatland evaporation across hemispheres: contrasting controls and sensitivity to climate warming driven by plant functional types, Biogeosciences, 21, 1173–1190.
Statista (2024). Electricity generation in the United Kingdom (UK) from 2010 to 2022, by source. UK: power supply mix 2022 | Statista
Tiemeyer, B., Albiac Borraz, E., Augustin, J., Bechtold, M., Beetz, S., Beyer, C., Drösler, M., Ebli, M., Eickenscheidt, T., Fiedler, S., Förster, C., Freibauer, A., Giebels, M., Glatzel, S., Heinichen, J., Hoffmann, M., Höper, H., Jurasinski, G., Leiber-Sauheitl, K., Peichl-Brak, M., Roßkopf, N., Sommer, M. and Zeitz, J. (2016), High emissions of greenhouse gases from grasslands on peat and other organic soils. Glob Change Biol, 22: 4134-4149.
Tiemeyer, B., Freibauer, A., Albiac Borraz, E., Augustin, J., Bechtold, M.m Beetz, S., Beyer, C., Ebli, M., Eickenscheidt, T., Fiedler, S., Förster, C., Gensior, A., Giebels, M., Glatzel, S., Heinichen, J., Hoffmann, M., Höper, H., Jurasinski, G., Laggner, A., Leiber-Sauheitl, K., Peichl-Brak, M., Drösler, M. (2020). A new methodology for organic soils in national greenhouse gas inventories: Data synthesis, derivation and application. Ecological Indicators, Volume 109, 2020, 105838, ISSN 1470-160X.
Toča, L., Morrison, K., Quaife, T., Artz, R.R.E. and Gimona, A. (2023). Restored Scottish Blanket Bog Monitoring Using Time Series of Optical and Radar Satellite Data. In IGARSS 2023-2023 IEEE International Geoscience and Remote Sensing Symposium, 2708-2710.
Tolan, J., Yang, H-I., Nosarzewski, B., Couairon, G., Vo, H.V., Brandt, Spore, J., Majumdar, S., Haziza, D., Vamaraju, J., Moutakanni, T., Bojanowski, P., Johns, T., White, B., Tiecke, T., Couprie, C. (2024) Very high resolution canopy height maps from RGB imagery using self-supervised vision transformer and convolutional decoder trained on aerial lidar, Remote Sensing of Environment, Volume 300, 113888,ISSN 0034-4257.
JHI (2024). First-ever flux tower on forested peat to measure landscape scale emissions The James Hutton Institute. https://www.hutton.ac.uk/first-ever-flux-tower-on-forested-peat-to-measure-landscape-scale-emissions/
Vestas (2005). Life cycle assessment of offshore and onshore wind power plants based on Vestas V90-3.0 MW turbines. Vestas Wind Systems A/S Alsvej 21, 8900 Randers, Denmark, pp.59. www.vestas.com.
Vestas (n.d.) Life Cycle Assessments of our turbines. Life Cycle Assessments (vestas.com)
Watmough, S., Gilbert-Parkes, S., Basiliko, N., Lamit, L.J., Lilleskov, E.A., Andersen, R., del Aguila-Pasquel, J., Artz, R.E., Benscoter, B.W., Borken, W. and Bragazza, L. (2022). Variation in carbon and nitrogen concentrations among peatland categories at the global scale. Plos One, 17(11), 0275149.
West, V. (2011). Soil Carbon and the Woodland Carbon Code, Forestry Commission, Edinburgh.
Wille, E. A., Lenhart, C. F., & Kolka, R. K. (2023). Carbon dioxide emissions in relation to water table in a restored fen. Agricultural & Environmental Letters, 8, e20112.
Williamson, J., Rowe, E., Reed, D., Ruffino, L., Jones, P., Dolan, R., Buckingham, H., Norris, D., Astbury, S. and Evans, C.D. (2017). Historical peat loss explains limited short-term response of drained blanket bogs to rewetting. Journal of Environmental Management, 188, 278-286.
Wilson, D., Blain, D., Couwenberg, J., Evans, C.D., Murdiyarso, D., Page, S.E., Renou-Wilson, F., Rieley, J.O., Sirin, A., Strack, M., and Tuittila, E.-S., (2016) Greenhouse gas emission factors associated with rewetting of organic soils. Mires and Peat, Volume 17 (2016), Article 04, 1–28.
Woodland Carbon Code (2024). Home- UK Woodland Carbon Code. Woodland Carbon Code https://woodlandcarboncode.org.uk/.
Worrall, F., Chapman, P., Holden, J., Evans, C., Artz, R., Smith, P. and Grayson, R. (2010). Peatlands and climate change. Report to IUCN UK Peatland Programme, Edinburgh. https://www.iucn-ukpeatlandprogramme.org/scientificreviews
Worrall, F., Boothroyd, I.M., Gardner, R.L., Howden, N.J., Burt, T.P., Smith, R., Mitchell, L., Kohler, T. and Gregg, R. (2019). The impact of peatland restoration on local climate: Restoration of a cool humid island. Journal of Geophysical Research: Biogeosciences, 124(6), pp.1696-1713.
Appendices
The following appendices open a download link to each of the spreadsheets.
Appendix 1 Technical assessment (opens spreadsheet)
Appendix 2 Sensitivity Analysis (opens spreadsheet)
Appendix 3 – High Resolution Spatial Data (HRSD) Assessment (opens spreadsheet)
© The University of Edinburgh, 2025
Prepared by AECOM on behalf of ClimateXChange, The University of Edinburgh. All rights reserved.
While every effort is made to ensure the information in this report is accurate, no legal responsibility is accepted for any errors, omissions or misleading statements. The views expressed represent those of the author(s), and do not necessarily represent those of the host institutions or funders.
If you require the report in an alternative format such as a Word document, please contact info@climatexchange.org.uk or 0131 651 4783.
Avoid – by removing the impact at the outset, Minimise – by reducing the impact, Restore – by repairing damaged habitats, Offset – by compensating for residual impact that remains, with preference to on-site over off-site measures. ↑
The Scottish Government’s Climate Change Plan Update sets out an ambition for the agriculture sector to reduce emissions by 31% from 2019 levels by 2032. It also sets a commitment to “work with the agriculture and science sectors regarding the feasibility and development of a SMART target for reducing Scotland’s emissions from nitrogen (N) fertiliser.”
The agricultural sector is dependent on N inputs, both organic and inorganic. The inefficient use of these inputs creates N wastage, impacting air and water quality and the climate.
The global nature of the issue provides an opportunity for Scottish agriculture to learn from other countries on how to improve Nitrogen Use Efficiency (NUE), i.e. taking action to reduce agricultural N losses while maintaining and supporting the sector in terms of income and yield.
This report explores the potential for setting a NUE target for agriculture in Scotland. It examines N flows found in Scottish agriculture as shown in the Scottish Nitrogen Balance Sheet (SNBS). It provided a clear analysis of the opportunities and barriers.
Conclusions
While this research identified opportunities for setting a NUE target for Scottish agriculture, more work is needed to fully understand the following elements:
- differential flows for each sector
- make appropriate changes to the SNBS
- ensure that the role of legumes in emissions reduction is fully integrated and
- carefully plan communication to achieve support from the farming sector.
A NUE target is not currently the most appropriate option for Scotland, the report concludes. This is partially due to the methodology in the current SNBS.
For further information on the findings, barriers and opportunities, please download the report.
If you require the report in an alternative format, such as a Word document, please contact info@climatexchange.org.uk or 0131 651 4783.
Research completed March 2024
DOI: http://dx.doi.org/10.7488/era/5316
Executive summary
Background
The Scottish Government’s Climate Change Plan Update (CCPu) sets out an ambition for the agriculture sector to reduce emissions by 31% from 2019 levels by 2032, and a commitment to “work with the agriculture and science sectors regarding the feasibility and development of a SMART target for reducing Scotland’s emissions from nitrogen (N) fertiliser.”
The agricultural sector is dependent on N inputs, both organic and inorganic. The inefficient use of these inputs creates N wastage, impacting air and water quality and the climate. The global nature of the issue provides an opportunity for Scottish agriculture to learn from other countries on how to improve Nitrogen Use Efficiency (NUE), i.e. taking action to reduce agricultural N losses while maintaining and supporting the sector in terms of income and yield.
This report explores the potential for setting a NUE target for agriculture in Scotland. It examines N flows found in Scottish agriculture as shown in the Scottish Nitrogen Balance Sheet (SNBS), providing a clear analysis of the opportunities and barriers.
Key findings
Whilst there is theoretical potential for setting a NUE target for Scotland, there are practical obstacles that policy makers would need to overcome for the target to be implemented.
This research argues sector specific NUE values are not currently feasible due to the calculation set-up in the SNBS and the assumption that production will remain stable, with only inputs decreasing.
- We suggest that the SNBS calculations need refinement to attribute flows of N to the different measures and sectors. In the current version of the SNBS, the NUE calculations do not align directly with what happens in practice because there are overlaps and movements of N flows between the different agricultural sectors.
- These are not easily viewed in isolation and not necessarily attributed to the correct sector. For example, mitigation measures around manure management will, in practice, be mainly implemented by the livestock sector but will, in the current calculations, be attributed to the arable sector because they are linked to reduced emissions from spreading of organic matter to soils.
Opportunities
- The SNBS would offer an effective data source for setting and monitoring progress towards a single nationwide NUE target that covers all sectors.
- Many mitigation measures with known impacts on reducing N waste and improving N use are already in use in Scotland. Measures with the greatest potential improvement on NUE are
- nitrification inhibitors
- improving livestock nutrition, and
- improving livestock health.
- Note – that the improvement reflects implementing the relevant measure individually and does not consider any combination effects or interactions with other measures.
- The lowering of N-related emissions through reaching a NUE target will positively contribute to other emission reduction targets and the potential for an increase in farm business profitability.
Barriers
- Since a sector specific NUE target is currently not feasible, the remaining option is a single nationwide target.
- However, the arable, horticultural and livestock sectors would need to implement distinct mitigation measures, start from differing baselines, and will react inconsistently to implemented changes. This is partially due to the current limitations in the SNBS, but also due to the much lower baseline of current NUE values, setting a nationwide NUE target might cause the livestock sector to feel unfairly targeted.
- Some mitigation measures require significant capital expenditure to implement.
- The concept of NUE is complex and clear communication is required to ensure that targets and measures are clearly understandable and achievable to generate support from the farming sector.
- We examined different scenarios to model a potential target. The table below shows an achievable target and one that is more ambitious. The 2045 (Ambitious) scenario is based on transformational change across the sector.
|
Potentially achievable NUE estimates (%) | |||||
|
2021 (Current) |
2030 |
2040 |
2045 |
2045 (Ambitious) | |
|
Whole agriculture |
27.2 |
33.7 |
35.7 |
38.2 |
40.9 |
- No country currently uses a standalone NUE target. Several countries have set N-related targets, some of which include information on NUE. Notably, the Colombo Declaration represents the first time that governments are collaborating on a global N management target on N waste.
Conclusions and recommendations
While this research identified opportunities for setting a NUE target for Scottish agriculture, more work is needed to fully understand the following elements:
- differential flows for each sector
- make appropriate changes to the SNBS
- ensure that the role of legumes in emissions reduction is fully integrated and
- carefully plan communication to achieve support from the farming sector.
A NUE target is not currently the most appropriate option for Scotland. This is partially due to the methodology in the current SNBS.
Recommendations
- Explore the potential for a more granular breakdown, and accurate representation of N flows in the SNBS. This may be difficult but would significantly help both monitoring and setting of a SMART NUE target.
- Creating a NUE target requires considering several criteria including mitigation measures, current uptake, applicability, expected future uptake, timescales, and sector breakdown. It is important to understand that other agricultural practices may impact N flows, as will changes in the size of agricultural sectors, and achieving these targets in practice will require supporting instruments to encourage the uptake of these measures. This research recommends that:
- N waste be considered as a target instead of a NUE target and that a SMART analysis is carried out to explore a N waste target further. Opportunities for setting a N waste reduction target include:
- It is an easier concept to communicate to the farming community.
- It values any N as a resource until it is lost as waste, creating options for greater collaboration between the arable, horticulture and livestock sectors. Any potential bias towards a sector will be avoided.
- A N waste target would achieve reductions in national NUE thereby achieving the same objectives without the current issues around NUE targets.
- Experience of the United Nations Environment Assembly and the Green Deal’s Farm to Fork targets has shown more potential in successfully reducing N pollution when focusing on reducing N waste over NUE targets as a policy option.
- If a decision is made to set a NUE target, the underlying assumptions should first be updated based on latest available evidence, for example using the updated Up to date Farm Census data. would strengthen any underlying assumptions and may directly influence the potential for the mitigation measures, particularly relating to slurry and manure management.
- The SNBS be improved by assigning distinct N flows to N waste and N re-use. A SMART target analysis for N waste will be beneficial to set a challenging and realistic target.
Glossary / Abbreviations table
Table 1: Glossary/ abbreviations table
|
Term/acronym |
Definition |
|
CCPu |
Climate Change Plan Update |
|
CO2 |
Carbon Dioxide |
|
EUNEP |
European Union Nitrogen Experts Panel |
|
GHG |
Greenhouse gas |
|
INMS |
International Nitrogen Management System |
|
kt N / yr |
kilo tonnes of nitrogen per year |
|
MtCO2e |
Million tonnes of carbon dioxide equivalent |
|
N |
Nitrogen |
|
N2 |
Di-nitrogen |
|
NH3 |
Ammonia |
|
NH4+ |
Ammonium |
|
NO3– |
Nitrate |
|
N2O |
Nitrous Oxide |
|
NUE |
Nitrogen Use Efficiency |
|
NVZ |
Nitrate Vulnerable Zones |
|
PESTLE |
Political, Economic, Social, Technical, Legal, Environmental |
|
REA |
Rapid Evidence Assessment |
|
SNBS |
Scottish Nitrogen Balance Sheet |
|
SWOT |
Strengths, Weaknesses, Opportunities, Threats |
|
UNEP |
United Nations Environment Program |
Introduction
Nitrogen and its relevance to agriculture
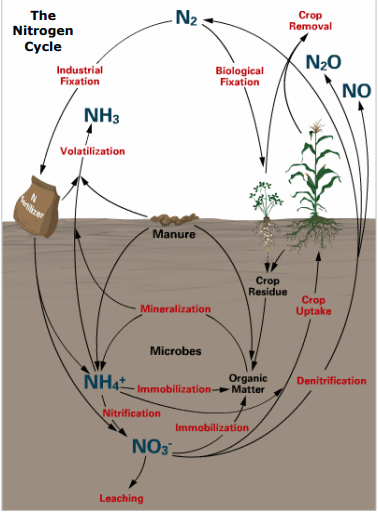 Crops require nitrogen (N) to maximise growth. Most crops take up N from the soil in the form of nitrate (NO3-). NO3– in soils come from three major sources, the application of organic livestock manures, the application of inorganic N fertilisers and nitrogen fixing plants such as legumes. During harvest and through grazing, N is removed from the system. N can also be lost from soil through NO3– leaching and through emissions of ammonia (NH3) and nitrous oxide (N2O). The N cycle (Figure 1) shows how different forms of N flow through the agricultural system.
An excess of N can both directly and indirectly lead to soil, water and air quality deterioration which is detrimental to human and ecosystem health (e.g., affecting respiratory systems and reducing oxygen in water). According to the IPCC AR5 Synthesis Report, N2O has a global warming potential (GWP) 273 times that of carbon dioxide (CO2) over a 100-year timescale. In Scotland N2O is responsible for a quarter of the agriculture sector’s total GHG emissions.
More detail can be found in Appendix A on the process of leaching, the effects of eutrophication and how N2O and NH3 are emitted from agricultural sources and in Appendix B on the chemical processes of N conversion.
Nitrogen Use Efficiency
Nitrogen use efficiency (NUE) describes the ratio between total N input (e.g., fertiliser) and total N output (e.g., harvested product) expressed as a percentage (%). Figure 2 presents a visual example of NUE.
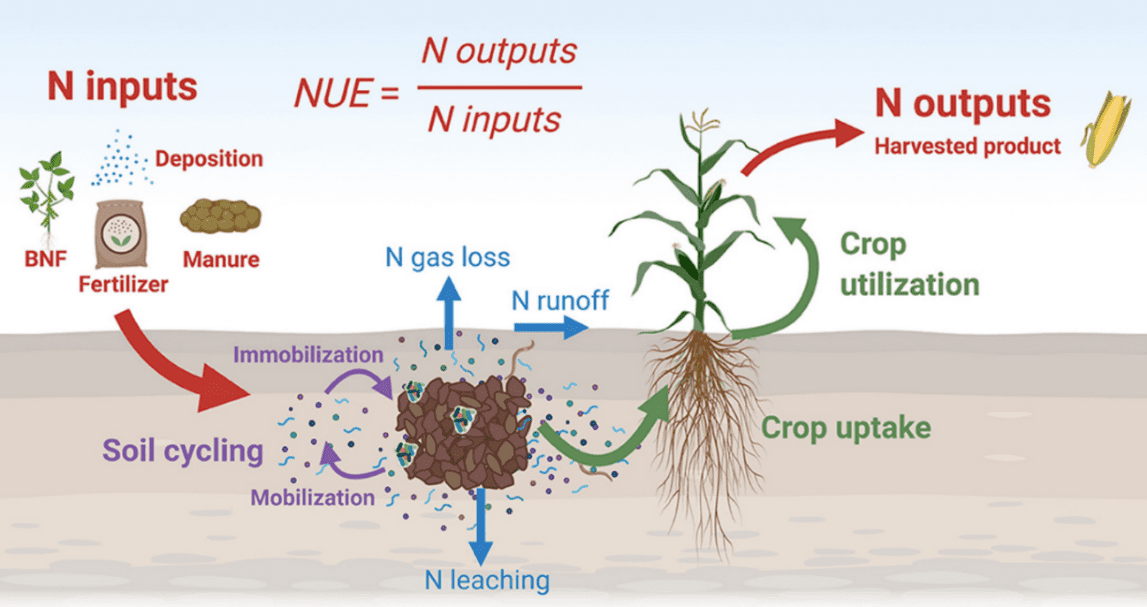
Figure 2. NUE diagram. Source: Udvardi et al., 2021
NUE gives an indication of the efficiency of crop utilisation of N. Generally, the higher the percentage NUE the better as this means less loss of N to air and water and indicates the crop is efficient in the uptake of N. However, pushing the ratio too high (for example over 90% in a cereal crop) can indicate ‘soil nutrient mining’ leaving not enough available N to maintain healthy crop growth and soil ecosystems (Sanchez, 2002). When NUE is too low (less than 50% in cereal crops), a large amount of N is likely being lost to the water and air. An ideal NUE would therefore be between 50% and 90%. NUE efficiency is also greatly impacted by climatic conditions, with changes in microbial activity in drought and frozen soils, along with increased risk of denitrification or leaching when soils are waterlogged.
NUE values are therefore both indicators of resource efficiency and markers for improvement. Key factors influencing NUE include crop type and rotation, soil pH and texture, climate, ammonia, leaching, biological utilisation of N and N management amongst others. As such, an absolute NUE reference value cannot be universally applied and will need to be understood and optimised for specific systems.
Nitrogen and NUE targets in other countries
Introduction
A Rapid Evidence Assessment (REA) seeking evidence relating to the setting and use of nitrogen and NUE targets was undertaken and identified peer-reviewed academic literature as well as government policies and websites. The review also identified grey literature sources such as farming and industry press reports. This search included, but was not limited to, targets for NUE, N emissions and N fertiliser use. The methodology can be found in Appendix C. The review focussed on identifying:
- Relevant scientific research on NUE target setting (4.2)
- Countries with N-related target/s, including types, values and timeframes (4.3)
- Relevance to Scottish agriculture, agricultural sectors and N flows (4.4).
Research on NUE target setting
This section includes information found through the REA on global NUE trends and relevant scientific research on the possibility of setting a NUE target including the necessary considerations (e.g., differences in farming sectors). 95 sources of literature were reviewed through the REA, 38 of which were from the UK, 32 from European countries and the remaining from other countries from around the world. Search strings used to gather this data can be found in Appendix C.
The NUE trend in the UK shows an increase from 1961 to 2014 (Lassaletta, L et al., 2014) which is likely a response to both regulation and market forces (for example the Nitrates Directive and changes in farm incomes). A full list of country-specific changes (%) in NUE values from 1961 to 2014 can be found in Appendix D. Following on from these observations, the research discussed below highlights the requirements and considerations for setting a NUE target.
Studies such as Quemada et al., 2020 collected farm-level data from 1240 farms across Europe and through statistical analysis, present NUE targets for different agricultural systems (e.g., 23% for a pig farm and 61% for an arable farm) which demonstrates the possibility of setting farm-level NUE targets. However, the study also highlights the importance of how differences in farming sectors will impact target setting.
A study conducted by Antille et al., 2021 states that there is no universal method for the calculation and reporting of NUE across all agricultural sectors. Furthermore, research projects which provide recommendations for NUE targets also suggest that such targets could be dependent on the agricultural system and its management, as well taking the ‘4R nutrient stewardship’ approach (right fertilizer type, right amount, right placement and right time) (Waqas et al., 2023). These approaches are country and region specific, dependent on climate, farmer knowledge, technological advancement and availability.
The EU Nitrogen Experts Panel (EUNEP) (initiated by an industry-based organisation ‘Fertilizers Europe’) recommends a maximum NUE of 90% (Duncombe, 2021), with an ‘ideal range’ of 50% to 90%. This range has been set to reflect that a NUE value below 50% is likely to result in N lost to the environment, while a value above 90% could result in soil N mining. Further detail is given in section 3.2. Whilst it is important to note that values will vary according to context (soil, climate, crop etc), the identification of this ‘ideal range’ by the EUNEP helps us to understand the opportunity and potential for setting a NUE target.
The research has highlighted that whilst it is possible to set NUE targets, there are a number of variables which impact upon setting a NUE target. These variables include the differences in farming sectors, differences in farming management, a lack of universal calculation and reporting of NUE, country / region specificity and climate.
N targets by country – types and policy context
There are currently no standalone country level NUE targets. Several countries, however, have set N targets through various means, some of which include information or actions on NUE. The review of approaches and literature can be summarised as having three main reasons/drivers for introducing N targets, these are all focused on responding to environment and climate impacts of N emissions:
- To lower GHG emissions
- To improve water quality
- To improve air quality
The underlying impact of N-related targets all seek to reduce N waste[1], however, the two primary mechanisms differ in their points of measurement. Some targets are set to reduce N emissions whilst others are set to improved water or air quality. Table 2 gives an overview of existing initiatives across the world and their main N target with relation to agriculture. Many are relatively vague and reflect the difficulty in setting firm policy across regions or countries. No set value was found for the targets in table 2 that do not include a percentage or numeric change. These initiatives or legislation are described in further detail below.
Table 2. Overview of existing initiatives on N targets.
|
Initiatives and country |
N target |
|---|---|
|
Colombo Declaration 2019, United Nations Environment Programme |
Halve N waste by 2030 |
|
Climate Change Response (Zero Carbon) Amendment Act 2019, New Zealand |
Reduce N2O emissions to net zero by 2050 |
|
Nitrates Directive 1991, EU |
Reduce NO3 losses from agricultural sources |
|
National Emissions reduction Commitments Directive 2016, EU |
Reduce NH3 emissions from agriculture |
|
Farm to Fork Strategy 2020, EU |
Reduce nutrient losses by at least 50% |
|
Harmony rules, Denmark |
Limit N inputs to land from livestock manure |
|
Climate Action Plan 2021, Ireland |
Improve NUE |
|
Green transition of the agricultural sector 2021, Denmark |
Reduction of N emissions by 10,800 tonnes by 2027 |
|
French Climate and Resilience Law 2021, France |
Reduction of N2O emissions by 15% of 2015 levels and NH3 emissions by 13% of 2005 levels by 2030 |
|
National Emissions Ceilings Regulations 2018, UK |
Reduction commitments for NH3 of 16% by 2030 relative to 2005 levels |
|
Wales, UK |
Reduction of agricultural GHG emissions by 28% by 2030 compared to 1990 |
International action
The UN Environment Program (UNEP) previously considered ‘an aspirational goal for a 20% relative improvement in full-chain NUE by 2020’ (Sutton et al., 2014). However, Sutton et al., (2021) found that this could lead to an unfair distribution of effort whereby everyone had to increase their NUE by a relative amount. If this was the case a farm currently operating with high efficiency, e.g., 60% NUE, would have to increase by 12% to reach this 20% target. Whereas a farm operating with low efficiency e.g., 10% NUE, would have to increase by 2% to reach the same 20% target.
To overcome this unfair distribution, a target to halve N waste was seen as a more equitable approach as less waste means less action is needed. For example, to reduce N waste by 50%, a farm with higher N waste e.g., 100t N/yr would have to reduce by 50 t N/yr and a farm with less N waste e.g., 10 t N/yr would have to reduce by 5t N/yr. Therefore, the largest effort needed is placed on farms with higher N waste (low NUE) as opposed to farms already operating with high efficiency (high NUE).
Alongside the support from the UNEP and the technical support of the International Nitrogen Management System (INMS), the Colombo Declaration represents the first-time that governments are collaborating on an ambitious, quantitative, and global N management target by seeking to cut N waste by 50% across the world.
Outside Europe
New Zealand’s Climate Change Response (Zero Carbon) Amendment Act 2019 includes a target to reduce N2O emissions to net zero by 2050. Canada (which has set a target to reduce fertiliser emissions by 30% by 2030) applies a region-specific approach due to the vast expanse of the country having variable meteorological conditions.
The European Union
The Nitrates Directive (1991) aims to protect water quality across Europe by preventing nitrate losses from agricultural sources through the promotion of good farming practices and includes limitations on N application from manures. Nitrate Vulnerable Zones (NVZs) are areas where the water bodies, such as lakes or rivers, are considered ‘at risk’ because there they have more than 50 mg/l of NO3– or are eutrophic. Farmers in these areas must comply with rules set out in the Member States’s action programmes to reduce the risk and the Managing Authorities need to report on NO3– concentrations in ground and surface waters. The Directive does not focus on N emissions other than NO3–. While the Nitrates Directive has driven a reduction in nutrient application over the last 30 years, targets have failed to improve NUE in many areas with reported high levels of N surplus (N remaining beyond plant and soil requirements) found in the Netherlands, Belgium, north-west Germany, Luxembourg and Brittany in France.
The National Emissions reduction Commitment (NEC) Directive (2016) is the current primary European regulation requiring actions to improve air quality and sets targets for reduction in the emissions of key air pollutants. This is important in an agricultural context due to the inclusion of setting reduction targets for NH3. Target reductions are specific to each Member State and vary significantly with the target NH3 reduction for 2030 ranging from 1% for Estonia and 32% for Hungary.
The European Green Deal (2019) is the EU’s holistic plan to achieve net zero GHG emissions across the EU, while improving biodiversity and human health. The Farm to Fork strategy (2020) includes targets to reduce the use of N fertilisers and losses of N to the environment to support improvements in air and water quality and to reduce emissions of GHGs. The strategy sets a target to reduce nutrient losses by at least 50%, while ensuring that there is no deterioration in soil fertility. The European Commission expect this to reduce the use of fertilisers by at least 20% by 2030.
Considering the European wide scope of the directives and strategies to reduce N pollution, our study findings were surprising in that examples of nationwide NUE targets are limited. Whilst no country has a standalone NUE target, some countries such as Ireland and Denmark have incorporated NUE as an ‘action’ as part of a programme or another target (e.g., GHG target).
The Danish example relates to the historic, 1980 ‘Good Agricultural Practice Program’ where increasing NUE was part of a suite of actions to reduce N use. This program was unsuccessful in limiting emission effects and as such ‘harmony rules’ were introduced, which, along with other measures, increased the Danish national NUE to an average of 40%. The Danish harmony rules prescribe the minimum area that a livestock farm must have for spreading livestock manure from their livestock production, thus limiting N inputs to land from livestock manure (Sommer and Knudsen., 2021).
Ireland’s Climate Action Plan 2021 put forward a suite of actions to deliver their GHG target that includes N. Action 359 details the implementation of ‘a suite of measures to improve NUE’. Teagasc, who is leading this action, sees that there is room for improvement across Irish dairy farms with an industry target of 35% NUE “set for farmers to achieve in the coming years” – an improvement of 10% from the current NUE of 25%.
Also in 2021, Denmark introduced the ‘Green transition of Danish agriculture’ which has set an agricultural target to reduce GHG emissions by 55-60% by 2030, including a reduction of N emissions by 10,800 tonnes by 2027. The specific impacts on the aquatic environment are further covered through their Action Plan on the Aquatic Environment III which has targets to reduce N leaching.
France, through the French Climate and Resilience Law 2021, have set targets for reduction of N2O emissions by 15% of 2015 levels and NH3 emissions by 13% of 2005 levels by 2030 (Hawley., 2022). This law includes measures to reduce the use of mineral N fertilisers.
The United Kingdom
In the UK, there are N relevant targets at both UK-wide and devolved levels. Nitrate vulnerable zones (NVZ), designated as part of the Nitrates Directive (1991), aim to reduce nitrate water pollution by encouraging good farming practice. Areas where the concentration of nitrate in water exceed 50 mg/l in ground and/or surface waters have been designated as NVZs. There are at least 70 NVZs in England and Wales, covering 55% of agricultural land in England and 2.3% of Wales. Five areas of Scotland (Lower Nithsdale, Lothian and Borders, Strathmore and Fife (including Finavon), Moray, Aberdeenshire / Banff and Buchan, and Stranraer Lowlands) have been designated as NVZs.
The National Emissions Ceilings Regulations (NECR) (2018) commits the UK to reduce NH3 of 8% by 2020 and 16% by 2030, both relative to 2005 levels. The 2020 target was not met, but there has been a 12% reduction since 2005[2]. The NECR also contains reduction targets for nitrogen oxides (NOx), of 55% by 2020 (which was met) and 73% by 2030 but agriculture is a less important source.
Wales have set a target of reducing its total agriculture specific GHG emissions by 28% by 2030 compared to 1990. There are currently no UK-wide agriculture specific GHG emissions reduction targets, however, there is a UK-wide target of net zero by 2050, and agriculture will play an important role in achieving this target. For example, Defra has implemented new regulations on the use of urea fertilisers from 2023, which means that only urease-inhibitor treated or protected urea fertilisers may be used throughout the year, while untreated/unprotected urea fertilisers may only to be used from 15th January to 31st March each year. This regulation is expected to deliver an 11kt reduction in ammonia emissions by 2024/2025.
Why set a NUE target in Scotland?
It is important to consider the size and balance of the different Scottish agricultural sectors to understand the NUE potential of each sector. This section provides detail on the different forms of N found in Scottish agriculture, their impact on flows of N and how they can be targeted to improve NUE. A list of mitigation measures to improve NUE can be found in Appendix E and the impacts of these measures on NUE in Scotland are discussed in section 6.2.
The most recent Scottish GHG Statistics (2021) states that 2MtCO2e of N2O was emitted from the agricultural sector, which is a quarter of Scotland’s agriculture sector’s total GHG emissions and 2/3rds of total N2O emissions. N2O is emitted from soils after the application of N-fertilisers and manures (Brown, 2021). In addition, 90% of Scotland’s total NH3 emissions are attributed to the agricultural sector. Tackling the emissions of these pollutants will directly contribute to the following Scottish Government policies and ambitions:
- The Nitrates Directive is the basis of Scotland’s five NVZs under the Nitrate Vulnerable Zones (Scotland) Regulations 2008[3],
- the Scottish Government’s Biodiversity strategy to 2045: tackling the nature emergency, has the ambition of “restored and regenerated biodiversity across the country by 2045”,
- the Scottish Government’s Cleaner Air for Scotland 2 delivery plan
- the Pollution Prevention and Control (Scotland) Regulations 2012,
- target 7 of the Kunming-Montreal Global Biodiversity Framework to ‘reduce excess nutrients lost to the environment by at least half including through more efficient nutrient cycling and use’. The UK is a signatory to this framework and Scotland signed the associated Edinburgh Declaration,
- National GHG targets set by the Climate Change (Emissions Reduction Targets) (Scotland) Act 2019
- the CCPu sets out an ambition for the Scottish agriculture sector to reduce emissions by 31% from 2019 levels by 2032, and a commitment to “work with the agriculture and science sectors regarding the feasibility and development of a SMART target for reducing Scotland’s emissions from nitrogen (N) fertiliser.”
Understanding N flows in Scotland
In recognition of the potential for reducing N to reduce total GHG emissions, the Climate Change (Emissions Reduction Targets) (Scotland) Act 2019 set requirements for Scottish Ministers to create a Scottish Nitrogen Balance Sheet (SNBS) from 2022 (Figure 3). The N flows in the SNBS combine data across all sectors of the economy and environment forming an evidence base to support the optimal use of N across all economic sectors to achieve optimal economic and environmental outcomes. While the SNBS was published in 2022, the data within it relates to 2019. Scotland is currently the only country to have planned to regularly update a cross-economy and cross-environment N balance sheet.
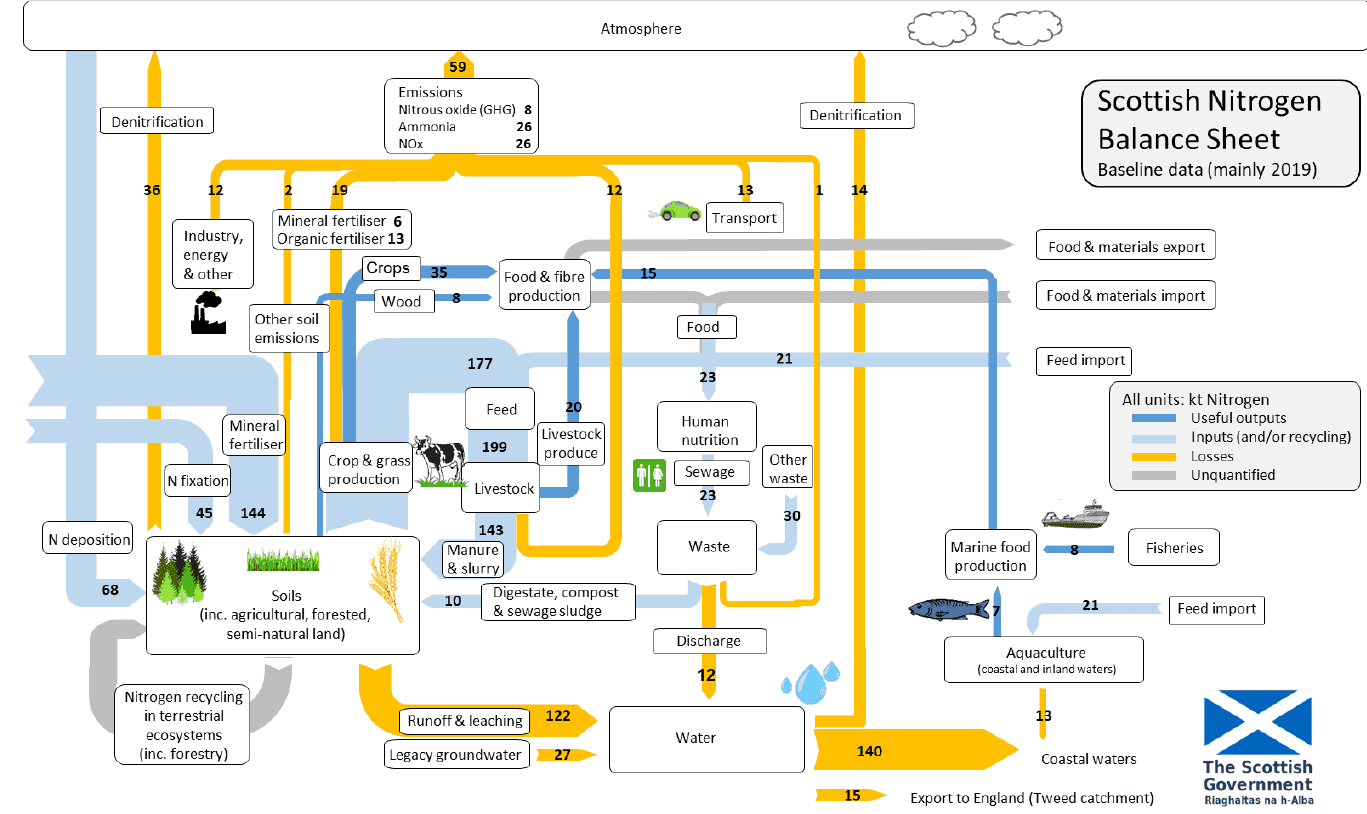
Figure 3. Scottish Nitrogen Balance Sheet (baseline data (mainly 2019)). Source: 3. Results from the initial version of the Scottish Nitrogen Balance Sheet – Establishing a Scottish Nitrogen Balance Sheet – gov.scot (www.gov.scot)
The annual SNBS report to the Scottish Parliament presents an assessment of:
- progress towards implementing proposals and policies relevant to improving NUE in Scotland,
- any future opportunities for improving NUE in Scotland, and
- how NUE is expected to contribute to the achievement of future emissions reduction targets (as per section 98 of the Climate Change (Emissions Reduction Targets) (Scotland) Act 2019)
In 2022, the SNBS report published NUE values for agriculture as a whole sector (27%) with more granular figures of 65% for crop production NUE and 10% for livestock feed conversion. This valuable baseline shows NUE’s potential for improvement which can reduce emissions from all forms of N to support improvements in air and water quality with positive implications to both human (Pozzer et al., 2017) and biodiversity health (Houlton et al., 2019). While the SNBS is a valuable baseline for improving N management it is important to note the specificities of its set-up particularly on how different quantities of N are attributed to different sectors and how this relates to what happens in practice (more detail on this can be found in Section 6.5).
Research has found that the global arable NUE is 35%. When we do not consider all the variables which impact NUE and NUE target setting, as discussed in sections 3.2 and 4.2, the Scottish arable NUE of 65% appears to compare well to international data, however, some EU countries have arable NUEs of up to 77%, showing there may be room for improvement. The 2022 SNBS report states total N losses from agriculture to the environment amount to 30.2 kt N/yr as air pollutants (NH3, nitrogen dioxide (NO2) and N2O) and 104 kt N/yr from runoff and leaching from agricultural soils.
Targeting different forms of N
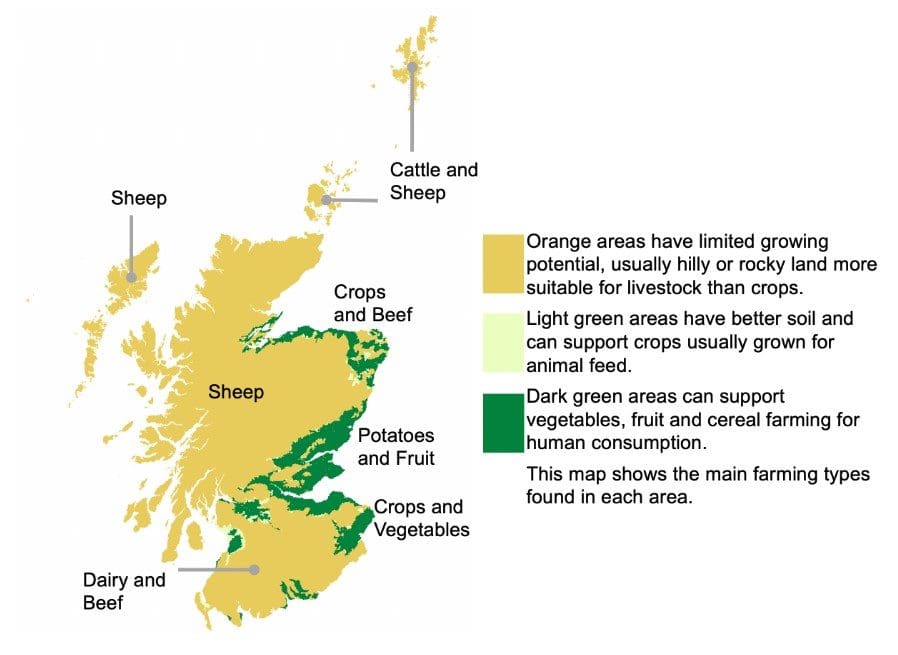 Figure 4 Scottish agricultural sectors (Scottish Agricultural Census June 2021)
The different N inputs and outputs of Scottish agriculture are described below (also see Figure 3). Most of Scotland’s 5.64 million ha of agricultural area is best suited to livestock farming with a significant proportion occupied by cattle and sheep in Less Favoured Areas (LFAs) (55% or 3,159,137 ha) followed by crops and grass (1,885,701 ha), shown in Figure 4. Non-LFA cattle and sheep (107,712 ha) and specialist dairy (106,935 ha) are large sources of N in manure. More intensive sectors such as pigs and poultry do not have a direct correlation between NUE and land area, however they are significant sources of manures and contribute to N inputs. These areas are used to track N flows from the SNBS against sectors of particular potential in section 4.4.2. Note that forestry and aquaculture are out of scope of this project but will have impacts on Scottish N flows.
NUE varies between different Scottish farm types as the biological utilisation of N influences the potential NUE. The SNBS shows that livestock farms currently have a lower NUE (10%) than arable farms (65%). This is partly due to the relative inefficiency in the conversion of ingested N in feed converting to stable N within livestock products (milk and meat).
N Inputs
Fertiliser as the N input
The SNBS details that one of the largest flows of N in Scotland (143.8 kt N/y) is the use of inorganic fertiliser on arable crops and grass, with 62.1kt of this inorganic N applied to crops per year and 81.7kt going to grass [4]. The British Survey of Fertiliser practice states that in 2022, 63 kg N/ha were applied on average to all crops and grass in Scotland.
There is little information on N use in Scottish horticulture and permanent crops. Nonetheless, N fertiliser recommendations for vegetables, minority arable crops, bulbs, soft fruit and rhubarb crops exist. The high value of many of these crops and the technological advances taking place in this sector facilitate a higher degree of precision in management (e.g., GPS use for N application, leaf N monitoring, fertiliser application within irrigation water etc), which allows a better understanding of N flows in these systems. Targeted N applications could lead to reductions in inputs and waste thereby improving overall NUE for these crops. However, to date there are no recommended NUE levels for these specialist crops, thus more research is needed to understand the impact of reduced N applications on crop health and yield.
The evidence relating to the N requirements for the majority of crop and grass areas in Scotland is well described within the technical notes, and recommendations for NUE targets could build upon the evidence supporting these recommendations. Like specialist crops, improvements in fertiliser practices and technology can support improvements in N applications which will help matching of N inputs to crop requirements with greater precision and thus improves NUE.
Livestock Feed intake as the N input
The optimum levels for dietary crude protein are often exceeded to ensure that N intake does not limit either growth or welfare. This excess of N supply in the diet results in surplus N being excreted through manure and urine leading to N losses. Cattle cannot efficiently convert dietary N (efficiency ranging between 22-33%) and therefore, on average, 75% of consumed N is wasted, mainly through excretion. Matching N supply in feed with livestock requirements is part of ‘precision livestock feeding’ which can increase farm profitability, reduce emission intensity of methane (Rooke et al., 2016) and reduce N intake and excretion. Reductions to NH3 and N2O emissions from livestock sources due to precision feeding vary widely. However, studies have found that a reduction in crude protein of 2% leads to a 24% reduction in NH3 emissions in broilers, and a 1% crude protein reduction in pig feed results in a 10% reduction in NH3 emissions (Santonja, 2017).
The SNBS found one of the largest N flows is N excreted by livestock (142.9 kt N/y). The control of N levels added to soil from livestock directly impacts the input part of the livestock NUE calculation. A NUE target aimed at the livestock sector may be most impactful as it currently has the lowest NUE (10%) whilst also covering the largest amount of agricultural land (combined total of 3.3 million ha) meaning even a small, targeted improvement in NUE for livestock could have a significant impact on the overall N budget.
N Outputs
Ammonia as the output
NH3 from agricultural sources produces particulate matter which can impact human health, causing diseases such as cardiovascular and respiratory disease. In addition, NH3 emissions can result in the long-range transport of N compounds and this N deposition can cause acidification and eutrophication. Scottish agriculture accounts for 90% of total NH3 emissions, which have decreased by 12% over the last 30 years. NH3 is tied specifically to the (housed) livestock sector, with most emissions (35% of NH3 emissions) coming from cattle manure management. Livestock housing and storage of manure is responsible for 10.5kt N/y in the form of NH3 emissions, therefore improvements targeted at this sector would directly improve NUE. Examples of mitigation measures which can be introduced to lower the NH3 emissions in this sector are detailed in Table 3 under section 6.2.1 and include slurry store covers and slurry acidification.
Use of urea based inorganic fertilisers can lead to significant losses of NH3. High temperatures and winds at the time of fertiliser application or very dry conditions can lead to high levels of NH3 volatilisation (the conversion of NH4+ to NH3 gas) with a significant proportion of the N being lost and unavailable to the plants. A useful mitigation measure is the use of urease inhibitors with urea fertilisers to reduce these emissions.
Nitrate leaching as the output
Excessive leaching of N from agricultural activity can lead to water pollution and eutrophication which can then result in the loss of aquatic biodiversity and GHG emissions. The SNBS shows N run-off and leaching from crops and arable land as 45.5 kt N/yr and from grass as 58.5 kt N/yr. This N is lost as NO3–, which is readily mobile in soil water or runoff. Any N that is lost from the soil is no longer available to plants thereby lowering the potential NUE and increasing agricultural pollution.
According to Adaptation Scotland, Scotland is predicted to experience an increase in rainfall, with intense, heavy rainfall events increasing in both winter and summer. This has the potential to increase N leaching as soil moisture controls both crop N uptake and N leaching (McKay Fletcher et al., 2022). In addition, Scotland’s topography affects the rate of run-off as steep slopes promote surface run-off. When considering Scotland’s topography and the predicted change in rainfall, the potential for leaching will increase and continue to negatively affect water quality. Those areas currently most at risk are classified as NVZs.
Nitrous oxide emissions as the output
N2O is a GHG that accumulates in the atmosphere and directly contributes to climate change. The SNBS shows 5.9kt N2O per year is emitted from the agriculture sector. This includes 0.9kt from livestock (including manure management), 3.8kt from soil management (including mineral fertiliser use), and 1.2kt of indirect emissions (from N deposition and NO3– leaching). N2O is produced in the process of denitrification, where denitrifying bacteria under conditions where oxygen is limited (for example waterlogged soils) use the NO3– available in soil. By using the NO3–in soil, these bacteria reduce the NO3– available by plants potentially negatively impacting yield. In conditions where NO3– is available in excess denitrification can reduce NO3– losses through leaching. However, since N2O is produced in the process, negative impacts on climate are the result. Total elimination of N2O emissions from agriculture is not possible; however, some mitigation is possible through improvements in soil conditions and avoidance of N fertiliser application under wet conditions (Munch and Velthof, 2007).
Crop and livestock outputs
Crop and livestock products are the useful outputs of N from agriculture. In Scotland these account for 54.5kt N per year. This value includes livestock products, including meat, milk, eggs, and wool, and harvested crops used for food for human consumption (but excludes crops for animal feed or fodder). Useful crop outputs also include seed, feed and straw, but these are retained in the agricultural system and so are not final outputs.
Cereals, explicitly for alcohol production, accounts for the largest useful output flow in Scotland at 20.5kt N, followed by livestock products at 19.6kt N and crop product for human consumption at 12.2kt N (all values per year).
Optimising the quantity of N recovered in these outputs i.e. the N is taken up by the plant or animal and used to increase growth, relative to the quantity of inputs (feed and fertiliser) is key to reducing N waste and improving NUE. Managing the quantity of N application to meet crop and livestock requirements alongside the soil conditions will improve the overall NUE.
Viability of a SMART Target for NUE in Scotland
This section looks at the viability of setting a NUE target for Scotland and provides a summary of the risks and benefits of setting a Specific, Measurable, Achievable, Relevant, and Time-Bound (SMART) NUE target in Scotland and presents how a range of influences can support or hinder the achievement of a NUE target. Information on N targets in other countries was considered and analysed for their applicability to Scotland. Since no other country has a standalone NUE target, we had to rely on information on other N targets for our analysis and transfer these finding to a NUE target for Scotland. The methodology can be found in Appendix F.
Analysis Tools
SWOT analysis
Strengths, weaknesses, opportunities, and threats (SWOT) of setting N-related targets were analysed based on the information gathered on N targets in other countries. We also included analysis of GHG and climate related targets where relevant to increase the body of information. This information was then used to assess applicability of setting a NUE target for Scottish agriculture with the limitation that the analysis was based on N, GHG and climate related, rather than NUE specific targets. The SWOT analysis shows a range of influences which can support or hinder the achievement of a NUE target. The full SWOT analysis can be found in Appendix F.
PESTLE analysis
Setting NUE and other N targets are subject to a range of enablers and barriers. Therefore, a political, economic, social, technical, legal, and environmental (PESTLE) analysis was undertaken to assess the feasibility of setting a NUE target for Scottish agriculture, again, with the limitation that the analysis was based on N, GHG and climate related rather than NUE specific targets. The PESTLE assessment took place following the SWOT analysis to ensure the findings from the SWOT were assessed and, if relevant, included into the PESTLE categories. The full PESTLE analysis can be found in Appendix F.
Discussion
Supporting a SMART NUE target
The SNBS is reviewed and updated annually and provides a source of data for measuring and monitoring the changes in NUE and thus the progression of a NUE target. In addition, all mitigation measures identified in section 6.2 and analysed for their effect on Scottish agriculture NUE are captured by the SNBS. The use of the SNBS enables a measurable target. This was identified as a strength and technical enabler in the analysis of setting a NUE target.
Another strength and technical enabler identified through the analysis includes the mitigation measures required to achieve a NUE target. N-related mitigation measures are well understood, and many are relatively low cost and already practiced in Scottish agriculture (e.g., use of catch and cover crops) which makes reduction in N losses achievable. Furthermore, measures continue to be developed through additional research e.g. in Canada to understand the emission reduction potential, costs and benefits of different measures at farm level.
Section 6.4 recommends years 2030, 2040 and 2045 as deadlines which would ensure a NUE target is time-bound. These years align with other emission targets set in Scottish Government which may affect agriculture and therefore complement a new, potential NUE target. Including three timed steps into a binding target would also help measure the progression of the NUE target whilst also encouraging the delivery of high reductions.
A NUE target would be relevant in meeting statutory emission reduction targets. Introducing a NUE target would lower N-related emissions and would therefore contribute to other emissions reduction targets, for example the CCPu which aims to reduce agricultural GHG emissions by 31% from 2019 levels by 2032. Similarly, a NUE target would be relevant to several other environmental issues as the implementation and success of a NUE target would have multiple benefits for example, improvements to water quality, air quality (Sutton et al., 2014), human health and biodiversity (Houlton et al., 2019).
The SWOT and PESTLE analysis identified influences needed to support a specific and achievable NUE target by detailing opportunities which could assist with the implementation of such a target. Regulatory instruments include BAT/mitigation measures and fertiliser use limits, economic instruments include taxes and subsidies, and communicative instruments include extension services and awareness (Oenema et al., 2011).
Other positive influences include an increase in farm profitability following the implementation of mitigation measures such as precision livestock feeding and matching N supply to demand) which was found as a strength and economic enabler through the analysis. Moreover, through the introduction of a NUE target, there would be an opportunity to involve advisors and consultants which may also lead to the implementation of better advice and practice regarding N use in Scottish agriculture.
Hindering a SMART NUE target
All analysis was based on N targets rather than NUE targets due to the lack of any NUE specific targets in other countries. Therefore, clear evidence on NUE targets is lacking and the analysis of a NUE target for Scotland is based on assumptions through transferring information from N-related targets to NUE.
To achieve any potential NUE targets a range of new techniques, technologies and systems would be required. These are referred to as mitigation measures. There is already a good body of evidence and supporting examples of the implementation of mitigations. These have been identified as a strength and enabler as some examples such as variable rate N application (precision farming) can save farmers money on inputs by only purchasing and applying N as needed. Others, however, require significant capital expenditure with upfront investment of time and money required to implement some of the mitigation measures (for example, low emission slurry application equipment). This has also been identified as a weakness and economic barrier which may be experienced by Scottish farmers. This could directly impact upon the achievability of a NUE target. Similarly, several barriers to uptake of mitigation measures were identified as a threat through the SWOT analysis. Barriers include lack of awareness and knowledge of why and how to improve N use, and farmer’s personal beliefs, both of which may lead to Scottish farm managers finding it difficult to quantify the benefits to their business and understand the relevance of a NUE target. These barriers would generally hinder the achievability of a NUE target.
In trying to make a NUE target relevant in terms of meeting statutory emission reduction targets, there is a risk when reducing N-related emissions, through mitigation measures, that pollution-swapping takes place. An example of this is the decrease in NH3 emissions and an increase in N2O emissions (due to nitrification/denitrification processes) when using slurry injection (a type of low emission slurry application) compared to surface application. Pollution-swapping as an unintended consequence of some mitigation measures was identified as a threat and environmental barrier in introducing a NUE target.
Farmers’ perception of a national NUE target for Scotland may limit target achievability. Scottish farmers may not understand how their practices impact NUE and how introducing on-farm mitigation measures may impact on a general NUE target for Scottish agriculture. For example, questions may arise on how many and at what frequency the relevant mitigation measures need to be introduced by each farmer to achieve this overarching target. To overcome this, some farmers may respond more positively to several more specific targets, for example a reduction of fertiliser input (by a certain amount and by a certain date). Alternatively, ensuring a NUE target is accompanied with very specific and relevant action points on how this NUE target would be achieved so that farmers have a clear understanding on what is expected of them and their farming system to contribute to a national NUE target.
The time taken to create and process the appropriate legislation for a NUE target can be uncertain and longwinded. This process has the potential to directly impact the time-bound element of a SMART NUE target.
In the Netherlands, an ambitious target led to civil unrest where more than 10,000 Dutch farmers have been protesting following government plans to reduce N emissions. Similarly, when targets or limits are seen to be a barrier to economic performance, implementation of new regulation can become challenging, as is seen in the case of revising the approach towards Nutrient Neutrality in England. The use of a SMART target is therefore critical to avoid the implementation of a policy which is neither appropriate nor achievable.
In the main, these examples relate to current exceedances of regulations under the Habitats or Nitrates directives, follow a long period of previous actions and constraints on the farming sector and relate to farming systems which are very different to those present within Scotland. In addition, these regulations are not focused on NUE but rather on the achievement of environmental targets and so do not consider the productive potential of the sector. Notwithstanding these differences, these risks do indicate the importance of well formulated targets, based on sound scientific understanding and with a clear plan for consultation and implementation on their achievement and delivery.
The political and legal barriers identified include the potential for pushback on mitigation measures which are seen to reduce productive output and a concern that Scottish farmers may not comply with regulatory requirements. This could directly impact upon the achievability of a NUE target.
Development of a NUE target for Scotland
Assessment using the Scottish Nitrogen Balance Sheet
The SNBS has been used as a baseline to assess how practices that influence N pools or flows may impact the agricultural NUE value. This dataset contains values for key sectors, pools (stores of N within parts of the N cycle e.g. in manure, in soils or in livestock/crops), and flows of N (movement of N into different pools as the N form changes or is taken up by plant or animals). These flows include inputs to the system (e.g. fertilisers, animal feed), useful outputs (e.g. meat, cereals), and waste (e.g. NO3– leaching, NH3 emissions). Each of these flows have a value in kt N/yr assigned. The NUE is improved by either increasing the output flow values or reducing input and waste flow values. This can be modelled by estimating the impact of a mitigation measure (e.g. improved nutrient planning or reduced protein livestock feed) and applying these values to the relevant N flow in the SNBS (for improved nutrient planning this would be reduced inputs of fertiliser and reduced N emissions to atmosphere). This produces estimates for N flows that can then be summarised in NUE calculations as currently setup in the SNBS, resulting in estimates of improved NUE values (see Appendix E for a detailed methodology and all assumptions).
Mitigation measures
The effect of mitigation measures on Scottish agriculture’s NUE
This section presents and discusses the effects of 18 different mitigation measures on the current NUE of Scottish agriculture.
The table below presents modelled estimates for the NUE of Scottish agriculture, by individual measure and at each future projected target year. The values reflect implementing the relevant measure individually and compared to the current whole-agriculture NUE of 27.2% (i.e. preventing soil compaction may improve total NUE by 0.1% by 2030). The results show the impact for the relevant measure in isolation and do not reflect any combination effects for interactions with other measures. Further detail on the assumptions and methodology can be found in Appendix E. The 2030, 2040 and 2045 scenarios are based on minimal change, continuing recent trends of recent changes in uptake, but including greater increases where there is precedent to, e.g. low emissions spreading techniques all increasing to 95% by 2030 as this will be required under the New General Binding Rules on Silage and Slurry. However, the 2045 Ambitious scenario is based on a transformational change across the sector where there is greater effort to improve NUE to meet a legally binding target. Therefore, the improved NUE in the 2045 and 2045 (Ambitious) scenarios may be viewed as the range where a target may be set, where the lower bound of the range (2045 scenario) is more achievable, while the higher bound (2045 (Ambitious) scenario) would require more effort across stakeholders to be achieved but is a better value.
Table 3 List of mitigation measures and their effect on Scottish agriculture NUE (%) compared to the current whole agriculture NUE of 27.2%. The two 2045 scenarios can be viewed as an ideal range for NUE; where the lower bound (2045 scenario) reflects changes to agriculture planned to come in (current and upcoming legislation, expert judgement on technological developments etc.); while the upper bound (2045 ambitious scenario) reflects the possibility for a greater push from industry and government to improve NUE (financial incentives, increased awareness of N management, etc.).
|
Measure |
2030 |
2040 |
2045 |
2045 (Ambitious) |
|
Avoid excess N |
31.23% (-3.02%) |
31.90% (-3.48%) |
31.90% (-3.48%) |
33/41% (-5.59%) |
|
VRNT |
27.66% (-0.43%) |
27.96% (-0.72%) |
28.41% (-1.16%) |
30.40% (-3.02%) |
|
Urease Inhibitors |
27.57% (-0.35%) |
28.08% (-0.86%) |
28.35% (-1.12%) |
28.70% (-1.47%) |
|
Improving nutrition |
27.26% (-0.03%) |
27.30% (-0.07%) |
28.27% (-1.04%) |
28.26% (-1.03%) |
|
Novel crops |
27.44% (-0.22%) |
27.52% (-0.29%) |
27.77% (-0.55%) |
27.81% (-0.58%) |
|
Low emission spreading |
27.62% (-0.39%) |
27.62% (-0.39%) |
27.62% (-0.39%) |
27.62% (-0.39%) |
|
Rapid incorporation |
27.26% (-0.09%) |
27.31% (-0.09%) |
27.34% (-0.11%) |
27.47% (-0.24%) |
|
Low emission housing |
27.24% (-0.02%) |
27.27% (-0.04%) |
27.28% (-0.06%) |
27.43% (-0.20%) |
|
Improving livestock health |
27.64% (-0.42%) |
28.02% (-0.80%) |
27.32% (-0.09%) |
27.43% (-0.20%) |
|
Slurry cover |
27.25% (-0.02%) |
27.28% (-0.05%) |
27.03% (-0.07%) |
27.33% (-0.10%) |
|
Optimal soil pH |
27.25% (-0.02%) |
27.29% (-0.06%) |
27.30% (-0.07%) |
27.30% (-0.07%) |
|
Nitrification inhibitor |
27.23% (-0.01%) |
27.24% (-0.02%) |
27.25% (-0.02%) |
27.25% (-0.03%) |
|
Improving GI + genomic tools |
27.23% (0.00%) |
27.23% (-0.01%) |
27.23% (-0.01%) |
27.25% (-0.03%) |
|
Slurry acidification |
27.23% (0.00%) |
27.24% (-0.01%) |
27.24% (-0.01%) |
27.25% (-0.02%) |
|
Preventing soil compaction |
27.23% (-0.01%) |
27.24% (-0.01%) |
27.24% (-0.02%) |
27.24% (-0.02%) |
|
Use of catch and cover crops |
27.27% (-0.05%) |
27.34% (-0.11%) |
27.37% (-0.15%) |
27.38% (-0.18%) |
|
Legume-grass mixtures |
– |
– |
– |
– |
|
Grain legumes in crop rotations |
– |
– |
– |
– |
There are potential interactions/overlaps between several of these measures. Where this occurs, measures cannot be applied on the same unit (area of land/head of livestock) at the same time as they are mutually exclusive. We have avoided double counting these effects by resolving the total maximum applicability across overlapping measures i.e. the combination of measures cannot exceed the total land available to apply the measure to.
The key outcomes are:
- The measures with the greatest potential improvement on NUE are nitrification inhibitors, improving livestock nutrition, and improving livestock health.
- Nitrification inhibitors are more effective at improving NUE than urease inhibitors as they can be applied to a greater proportion of fertiliser products used in Scotland (both NO3– and urea-based products, while urease inhibitor can only be applied to urea-based products).
- Improving livestock nutrition will improve NUE by reducing the overall quantity of N being fed to livestock while maintaining liveweight yield.
Measures that are based on the use of legume crops were not included in the modelling of the new NUE values, as the reduced requirement for inorganic fertiliser input will be offset by increased biological fixation of N from the atmosphere. Both flows are included in the N input values when calculating NUE in the SNBS. Therefore, the total N inputs levels will stay constant, as will the outputs, and so there is no impact on NUE. However, there are benefits of legume crops beyond an improvement to NUE, which should be considered, namely the effects of reduced requirement for inorganic fertiliser inputs (lower GHG emissions), improved soil health and soil function, and reduced costs. This is likely to be economically beneficial to the farmer, as soil health benefits the local ecosystem and improves resilience, reduced fertiliser use avoids emissions from manufacture and transportation of inorganic fertiliser; all of which are benefits from moving to a circular economy.
Potential N savings through implementation
The table below summarises the potential savings of N inputs of mineral fertiliser in both absolute values in kt N yr-1, and relative to the quantity in the current SNBS as a %. The values presented here include fertiliser use savings due to legume-based measures (legume-grass mixtures, and legumes in crop rotations). The effect of these measures is not included in calculations of NUE due to the assumption that the saved fertiliser N application will be replaced by increased N deposition from the atmosphere.
Table 4 Absolute values of N inputs of mineral fertiliser saved in kt N per year and as % of the quantity in the current SNBS when all modelled measures are included. The two 2045 scenarios can be viewed as an ideal range for NUE; where the lower bound (2045 scenario) reflects changes to agriculture planned to come in (current and upcoming legislation, expert judgement on technological developments etc.); while the upper bound (2045 ambitious scenario) reflects the possibility for a greater push from industry and government to improve NUE (financial incentives, increased awareness of N management, etc.).
|
Year |
2021 (kt N yr-1) |
Savings (kt N yr-1) |
Savings (%) |
Savings (kt CO2e yr-1) |
|
2030 |
143.78 |
36.36 |
25.29 |
160.09 |
|
2040 |
143.78 |
44.16 |
32.12 |
213.41 |
|
2045 |
143.78 |
53.14 |
37.96 |
248.56 |
|
2045 (Ambitious) |
143.78 |
78.22 |
-54.40 |
361.15 |
Recommended criteria for target(s) setting for Scotland
When modelling the NUE improvements and the establishment of potential targets, the key criteria for consideration are listed below.
Mitigation measures
The measures/farming practices that have been included for modelling are the result of literature searches and expert judgement. Measures that impact N flows in agricultural systems, and the relevant data, were extracted from literature. These were then reviewed to ensure applicability to Scotland, and any other measures that were identified by experts as being important were also researched.
Current uptake
The current uptake provides a basis from which to estimate what future uptake may be possible and the likely rate of additional implementation. It also supports the calculation of a baseline or counterfactual against which change can be measured. These values come from the same sources which have provided the NUE impact values (see Appendix E for detail on current uptake for each measure).
Applicability
The applicability values refer to the portion of a SNBS N flow that a measure’s impact value can apply to. Expected future uptake
The expected future uptake values are estimates based on expert judgment and consultation within the project team. The values for each measure can be found in Appendix E and are additional to the current uptake levels. These values increase over time to reflect increasing commitment to NUE improvements. The two 2045 scenarios can be viewed as an ideal range for NUE; where the lower bound (2045 scenario) reflects changes to agriculture planned to come in (current and upcoming legislation, expert judgement on technological developments etc.); while the upper bound (2045 ambitious scenario) reflects the possibility for a greater push from industry and government to improve NUE (financial incentives, increased awareness of N management, etc.). The expected future uptake ranges from 1% to 100% depending on the measure and scenario. For example, soil compaction was only expected to increase by 2% even in the 2045 (Ambitious) scenario as it was assumed that where soil compaction is occurring most farmers will already be taking steps to improve it. While low emission spreading techniques increased to 95% by 2030 to reflect the New General Binding Rules on Silage and Slurry. A full example is provided in Appendix G.
Timescales
We modelled potential NUE targets for Scottish agriculture for 2030, 2040, and 2045. These were chosen to align with Scotland’s Climate Change Act 2019 with a target date of 2045 for reaching net zero GHG emissions.
One NUE target for Scottish agriculture or per sector?
Currently, the arable sector is more N efficient than the livestock sector (65% and 10% respectively). This difference is due to inherent qualities of livestock systems with animals unable to process N as protein as efficiently as plants uptake N. The current NUE should, however, be seen as a baseline, and the scale of improvements from this should be the focus rather than an absolute target applicable to all sectors and systems. The majority of measures included in the modelling of NUE improvements target the soil N pools (arable and grass land), therefore separate targets for each sector are advisable.
Analysis of recommendations
The table below presents the estimated NUE values in 2030, 2040, and 2045 based on increased uptake of on-farm measures. As well as an additional value for the year 2045 where increased ambition has been included in the projected uptake values.
Table 5. Potentially achievable NUE estimates in 2030, 2040 and 2054 based on increased uptake of on-farm measures. The two 2045 scenarios can be viewed as an ideal range for NUE; where the lower bound (2045 scenario) reflects changes to agriculture planned to come in (current and upcoming legislation, expert judgement on technological developments etc.); while the upper bound (2045 ambitious scenario) reflects the possibility for a greater push from industry and government to improve NUE (financial incentives, increased awareness of N management, etc.).
|
Potentially achievable NUE estimates (%) | |||||
|
2021 (Current) |
2030 |
2040 |
2045 |
2045 (Ambitious) | |
|
Whole agriculture |
27.2 |
33.7 |
35.7 |
38.2 |
40.9 |
The NUE values that are modelled in this study are based on the selected measures, and the achievement of these NUE targets rely on their implementation. Other agricultural practices may impact N flows, as will changes in the size of agricultural sectors.
Similarly, the NUE values that have been calculated are based on the levels of implementation that have been included in the modelling. Achieving these targets in practice will require supporting instruments to encourage the uptake of these measures. As stated in Section 6.2.1, the NUE values in the above table for 2030 and 2040 reflect assumptions on uptake based on minimal change and not a transformational change to the sector (such as the setting of a target). Therefore, these values should not be viewed as potential targets for these years, but as indicators of the feasibility of improvements to NUE in Scottish agriculture.
Sector specific NUE values are not currently feasible due to the calculation set-up in the current SNBS (which flows are considered as inputs/outputs for arable and livestock), and the assumption made in the modelling that production will not increase and only inputs will decrease. This set-up leads to results that make it seem that the arable sector is mining N, which is not the case. Improvements to the set-up of calculations to overcome this barrier are outlined in Section 6.5 below.
Guidance for future implementation
In the current version of the SNBS, the NUE calculations do not align directly with what happens in practice in the different agricultural sectors because there are overlaps and movements of N flows between the different agricultural sectors that are not easily viewed in isolation. For example, in practice, improvements to NUE due to implementation of manure management measures will largely be implemented by the livestock sector. However, given the current set-up of the calculations in the SNBS, N flows related to manure management may not be attributed to the livestock sector NUE values as they will reduce emissions from spreading of organic matter to soils, which would be reported in the arable sector calculation. This would make it more difficult to use the SNBS to set and measure sectoral targets. Therefore, accurately monitoring the changes in NUE and attributing these changes to the correct sector would be important if considering sectoral targets. Accurately representing N flows in the SNBS to the relevant sector may be difficult, due to, for example, data availability, different ways data is collected across mitigation measures and sectors and difficulties in correctly separating overlaps and movements of N flows between the different agricultural sectors, however, could significantly help the feasibility of achieving and monitoring NUE targets.
When reflecting the potential impacts of mitigation measures on the values in the SNBS, certain hurdles resulting from the disaggregation of flows make it more difficult and possibly less accurate. More details of these hurdles, and how they were overcome, can be found in Appendix E, but a key example here is the use of slurry acidification on livestock slurry. In the SNBS there is one flow of N from manure management to atmosphere which includes all manure storage types and all livestock types. However, the implementation potential and mitigation impact potential will vary between storage and livestock types. This required an assumption to be made on the breakdown of this manure management N flow so that the appropriate uptake levels and impact values can be applied to the correct portion of the total N value (in this instance the Scottish Agricultural Census was used). This can be considered a sound approach to reflect the mitigation measures in the current SNBS, however going forward, to improve the ease and accuracy with which targets can be projected and improvements can be measured, a more granular breakdown on the N flows in the agricultural sector in the SNBS are required.
Conclusions
A NUE target for Scotland
The rationale behind setting a NUE target for Scotland is to reduce the impacts of N wastages to the environment to lower GHG emissions and improve water and air quality. NUE values can be used as indicators for N resource use efficiency and as markers for improvement. Scotland is in the unique position to use and regularly update a cross-economy and cross-environment N Balance Sheet (SNBS). The SNBS provides a valuable baseline in the current performance of Scottish agriculture and provides a tool to tackle all forms of N pollution.
However, setting a NUE target is not without challenges and nowhere in the world has yet set a NUE target. NUE values are impacted by various factors (soil type, climate, crop type, livestock type, etc). Whilst research shows that the ideal range for NUE is between 50-90%, it is crucial to understand the different forms of N inputs and outputs and to allocate these correctly to the different farming sectors.
As no other country has yet set a standalone NUE target, we had to solely rely on other N-related targets for our evidence base. Our analysis of the viability of setting a NUE target for Scotland is therefore based on assumptions through transferring information from N-related targets to NUE.
The SWOT and PESTLE analysis carried out in this study highlighted several factors which can influence the success of a SMART NUE target for Scottish agriculture. Importantly, the use of the SNBS would make the target measurable and the fact that many N-related mitigation measures are well understood and already practiced in Scottish agriculture would make the target achievable. However, some mitigation measures require significant capital expenditure, such as slurry management equipment, or increased ongoing investment, such as nitrification inhibitors, or a change in focus, such as better-balanced protein in livestock feed. These changes would need support from the farming sector. Using NVZ regulations as an example, a small study conducted in 2016 (Macgregor and Warren 2016) showed that some farmers regarded the NVZ regulations as “burdensome and costly”. To avoid similar responses to setting NUE targets, farmers would need to be able to quantify the benefits to their business and understand the relevance of a NUE target for climate and the environment. It is therefore important to accompany NUE targets with specific actions points expected by farming businesses. Providing funding to farmers to help implement mitigation measures and share knowledge on the impact to their businesses, the climate, water quality, air quality and biodiversity is likely to aid faster and easier uptake of these measures.
Looking at initiatives worldwide, we know that N use can be targeted in many different forms (fertiliser use, livestock diet, reduction of N waste, reduction of emission of air pollutants, etc.) and alongside the proven mitigation measures discussed above, it is clear that improvements to NUE are achievable.
Modelling NUE improvements using the SNBS
In this study, the SNBS has been used to model NUE improvements by estimating the impact of a mitigation measure and applying these values to the relevant N flow in the SNBS. It is important to note that these results show the impact for the relevant measure in isolation so do not reflect any combination effects for interactions with other measures. In the arable sector, the mitigation measures with the greatest potential to improve NUE are the use of variable rate N application (precision farming) and the use of nitrification inhibitors potentially increasing NUE to 28.8% and 29.7%, respectively, by 2045. In the livestock sector, improving nutrition and improving livestock health (NUE of 31.7% and 29.4% respectively by 2045) have the greatest potential. Overall, the modelling suggests that total NUE of Scottish agriculture could be increased to 38.2-40.9% by 2045, depending on the level of implementation of mitigation measures.
Sector specific NUE values are not presently feasible due to the calculation set-up in the SNBS and the assumptions that production will remain stable, with only inputs decreasing. In the current version of the SNBS, the NUE calculations do not align directly with what happens in practice in the different agricultural sectors because there are overlaps and movements of N flows between the different agricultural sectors that are not easily viewed in isolation and not necessarily attributed to the correct sector. For example, mitigation measures around manure management will, in practice, be mainly implemented by the livestock sector but will, in the current calculations, be attributed to the arable sector because they are linked to reduced emissions from spreading of organic matter to soils.
The feasibility of a NUE target for Scotland
This research indicates that a NUE target for Scotland is not currently feasible. We see potential for such a target in the future but recommend to first consider several points for improvement.
- The SNBS. Improvements to the calculations and attributions of flows of N to the different measures and sectors are required. The modelling for this report depends on assumptions and figures from another CXC report (Eory, et al., 2023). We recommend updating this data with real on farm data to better inform assumptions that follow from it.
- The sectors. Currently, the arable sector is more N efficient than the livestock sector (65% and 10% respectively). Sector specific targets would be helpful due to differences in current NUE, N inputs and N wastages but this is presently not possible due to the current limitations in the SNBS.
- The mitigation measures. More data on the impacts of mitigation measures under Scottish conditions would increase the accuracy of modelling achievable aims. Since NUE values are both indicators of resource efficiency and markers for improvement, it is possible to focus on mitigation measures with the most potential to improve NUE values.
- Farmers. It is highly important to ensure that targets and measures are clearly understandable and achievable for farmers to create support from the farming sector.
A potential target figure?
If a NUE target was set, this could be in line with the modelled potential NUE estimates of 38.2-40.9% by 2045, depending on mitigation measure implementation. To achieve greater improvement, a combined push from industry and government (financial incentives, increased awareness of N management, etc.) is required. This additional push is reflected in our ‘Ambitious scenario’.
However, based on our research findings, the barriers identified to implementing an achievable and successful NUE target and the need for farmer and industry support to achieve changes in practices and expectations, we conclude that focusing on reducing N waste is likely to have more success than NUE targets as a policy option. Experience from the United Nations Environment Assembly’s discussions on N and the Green Deal’s Farm to Fork targets, has shown more success in including the reduction of N pollution in policy when focusing on N waste over NUE targets. NUE can instead be used as a technical tool to mark improvements, with the SNBS key to setting a baseline and providing a visualisation of the combined impacts of implemented mitigations measures over time. We therefore recommend setting a target for N waste.
An alternative – a N waste target?
Opportunities for setting a N waste reduction target include:
- It is an easier concept to communicate to the farming community and other N producing sectors.
- It gives the opportunity to value any N as a resource until it is lost as waste, creating options for greater collaboration between the arable, horticulture and livestock sectors. Any potential bias towards a sector will be avoided.
- Each individual farmer and land manager would be encouraged to reduce N waste for the economic and environmentally beneficial outcomes. The positive messages around a N waste target would be likely to create support from the farming sector.
- Achievements towards an N waste target would achieve reductions in national NUE thereby achieving the same objectives without the current issues around NUE targets.
Following the Colombo Declaration of 50% reduction of N waste and the Green Deal target of reducing nutrient waste by 2030, a reduction of 50% of N waste in Scottish agriculture would align with other examples. However, we recommend further research to determine a realistic N waste target for Scotland.
Research gaps for setting a N waste target
In the SNBS, N flows would need to be properly assigned to N waste and N re-use. Legumes would need to be included in the SNBS because N waste is likely to be lower than N input. A SMART target analysis for N waste would be beneficial to set a challenging and realistic target. It would be helpful to closer investigate the relationship between N waste and NUE targets if a NUE target is the long-term aim.
References
Antille, D. L., Moody, P. W. 2021. Nitrogen use efficiency calculators for the Australian cotton, grain, sugar, dairy and horticulture industries. Environmental and sustainability indicators, ELSEVIER.
Adaptation Scotland 2021 Climate Projections for Scotland Summary. https://www.adaptationscotland.org.uk/application/files/1316/3956/5418/LOW_RES_4656_Climate_Projections_report_SINGLE_PAGE_DEC21.pdf
Barnes, A., Bevan, K., Moxey, A., Grierson, S. and Toma, L., 2022. Greenhouse gas emissions from Scottish farming: an exploratory analysis of the Scottish Farm Business Survey and Agrecalc. Scotland’s Rural College.
Brown, P., Cardenas, L., Choudrie, S., Del Vento, S., Karagianni, E., MacCarthy, J., Mullen, J., Passant, N., Richmond, B., Smith, H., Thistlethwaite, G., Thomson, A., Turtle, L. & Wakeling, D. (2021) UK Greenhouse Gas Inventory, 1990 to 2019. Ricardo Energy & Environment, Department for Business, Energy & Industrial Strategy, London quoted in Climate Exchange, 2023, Scenarios for emissions reduction targets in Scottish agriculture.
Duncombe, J. (2021). Index suggests that half of nitrogen applied to crops is lost, Eos, 102. https://doi.org/10.1029/2021EO162300.
Emmerling, C., Krein, A. and Junk, J., 2020. Meta-analysis of strategies to reduce NH3 emissions from slurries in European agriculture and consequences for greenhouse gas emissions. Agronomy, 10(11), p.1633. https://www.mdpi.com/867332
Eory, V., Topp, K., Rees, B., Jones, S., Waxenberg, K., Barnes, A., Smith, P., MacLeod, M. and Wall, E., 2023. A scenario-based approach to emissions reduction targets in Scottish agriculture. Scotland’s Rural College. http://dx.doi.org/10.7488/era/3048
Eory, V., MacLeod, M., Topp, C.F.E., Rees, R.M., Webb, J., McVittie, A., Wall, E., Borthwick, F., Watson, C.A., Waterhouse, A. and Wiltshire, J., 2015. Review and update the UK agriculture MACC to assess the abatement potential for the 5th carbon budget period and to 2050: Final report submitted for the project contract “Provision of services to review and update the UK agriculture MACC and to assess abatement potential for the 5th carbon budget period and to 2050”.
EU Nitrogen Expert Panel (2015) Nitrogen Use Efficiency (NUE) – an indicator for the utilization of nitrogen in agriculture and food systems. Wageningen University, Alterra, PO Box 47, NL-6700 Wageningen, Netherlands.
Germán Giner Santonja, Konstantinos Georgitzikis, Bianca Maria Scalet, Paolo Montobbio, Serge Roudier, Luis Delgado Sancho; Best Available Techniques (BAT) Reference Document for the Intensive Rearing of Poultry or Pigs; EUR 28674 EN; doi:10.2760/020485
Hawley, J., 2022. A comprehensive approach to Nitrogen in the UK.
Hellsten, S., Dalgaard, T., Rankinen, K., Tørseth, K., Bakken, L., Bechmann, M., Kulmala, A., Moldan, F., Olofsson, S., Piil, K. and Pira, K., 2019. Abating N in Nordic agriculture-Policy, measures and way forward. Journal of Environmental Management, 236, pp.674-686.
Houlton, B.Z., Almaraz, M., Aneja, V., Austin, A.T., Bai, E., Cassman, K.G., Compton, J.E., Davidson, E.A., Erisman, J.W., Galloway, J.N. and Gu, B., 2019. A world of cobenefits: solving the global nitrogen challenge. Earth’s future, 7(8), pp.865-872.
Jenkins, B., Avis, K., Willcocks, J., Martin, G., Wiltshire, J. and Peters, E., 2023. Adapting Scottish agriculture to a changing climate-assessing options for action. Ricardo Energy & Environment.
Lassaletta, L., Billen, G., Grizzetti, B., Anglade, J., Garnier, J. 2014. 50 year trends in nitrogen use efficiency of world cropping systems: the relationship between yield and nitrogen input to cropland. Environ. Re. Lett.9. 111005.
Macgregor, C.J. and Warren, C.R., 2016. Evaluating the impacts of nitrate vulnerable zones on the environment and farmers’ practices: a Scottish case study. Scottish Geographical Journal, 132(1), pp.1-20.
McKay Fletcher, D., Ruiz, S., Williams, K., Petroselli, C., Walker, N., Chadwick, D., Jones, D.L. and Roose, T., 2022. Projected Increases in Precipitation Are Expected To Reduce Nitrogen Use Efficiency and Alter Optimal Fertilization Timings in Agriculture in the South East of England. ACS Es&t Engineering, 2(8), pp.1414-1424.
Munch, J.C. and Velthof, G.L., 2007. Denitrification and agriculture. In Biology of the nitrogen cycle (pp. 331-341). Elsevier.
Oenema, O., Bleeker, A., Braathen, N.A., Budňakova, M., Bull, K., Čermak, P., Geupel, M., Hicks, K., Hoft, R., Kozlova, N. and Leip, A., 2011. Nitrogen in current European policies. In The European nitrogen assessment (pp. 62-81).
Pozzer, A., Tsimpidi, A.P., Karydis, V.A., De Meij, A. and Lelieveld, J., 2017. Impact of agricultural emission reductions on fine-particulate matter and public health. Atmospheric Chemistry and Physics, 17(20), pp.12813-12826
Quemada, M., Lassaletta, L., Jensen, L. S., Godinot, O., Brentrup, F., Buckley, C., Foray, S., Hvid, S. K., Oenema, J., Richards, K. G., Oenema, O. 2020. Exploring nitrogen indicators of farm performance among farm types across several European case studies. ELSEVIER. Agricultural Systems, Vol 177. https://doi.org/10.1016/j.agsy.2019.102689
Rooke, J.A., Miller, G.A., Flockhart, J.F., McDowell, M.M. and MacLeod, M., 2016. Nutritional strategies to reduce enteric methane emissions.
Sanchez PA. 2002 Soil fertility and hunger in Africa. Science 295, 2019-20.
Sommer, S.G. and Knudsen, L., 2021. Impact of Danish livestock and manure management regulations on nitrogen pollution, crop production, and economy. Frontiers in Sustainability, 2, p.65823
Sutton, M.A., Howard, C.M., Kanter, D.R., Lassaletta, L., Móring, A., Raghuram, N., Read, N., 2021. The nitrogen decade: mobilizing global action on nitrogen to 2030 and beyond. Elsevier. One Earth Volume 4, Issue 1, p10-14. https://doi.org/10.1016/j.oneear.2020.12.016
Sutton, M.A., Skiba, U.M., Van Grinsven, H.J., Oenema, O., Watson, C.J., Williams, J., Hellums, D.T., Maas, R., Gyldenkaerne, S., Pathak, H. and Winiwarter, W., 2014. Green economy thinking and the control of nitrous oxide emissions. Environmental Development, 9, pp.76-85.
Udvardi, M., Below, F.E., Castellano, M.J., Eagle, A.J., Giller, K.E., Ladha, J.K., Liu, X., Maaz, T.M., Nova-Franco, B., Raghuram, N. and Robertson, G.P., 2021. A research road map for responsible use of agricultural nitrogen. Frontiers in Sustainable Food Systems, 5, p.660155
United Nations Environment Programme, Global Partnership on Nutrient Management, & International Nitrogen Initiative (2013). Our Nutrient World: The Challenge to Produce More Food and Energy with Less Pollution. https://wedocs.unep.org/20.500.11822/10747.
Van Grinsven, H. J. H., ten Berge, H. F. M., Dalgaard, T., Fraters, B., Durand, P., Hart, A., Hofman, G., Jaconsen, B. H., Lalor, S. T. J., Lesschen, J. P., Osterburg, B., Richards, K. G., Techen, A. K., Vertes, F., Webb, J., Willems, W. J. 2012. Management, regulation and environmental impacts of nitrogen fertilization in northwestern Europe under Nitrates Directive; a benchmark study. Article, Vol. 9. Issue 12. 5143-5160.
Waqas, M., Hawkesford, M.J., Geilfus, C.M. 2023. Feeding the world sustainably: efficient nitrogen use. Trends in Plant Science. Volume 28, Issue 5. Pages 505-508. https://doi.org/10.1016/j.tplants.2023.02.010.
Appendix / Appendices
Appendix A: Nitrogen and its relevance to agriculture
Leaching and the effects on eutrophication
Leaching is the loss of N (as nitrate) as water drains through the soil moving nitrate away from the root zone. Both organic forms of N (such as slurry and manures) and inorganic fertilisers are liable to leaching. When nitrate is leached from soils, it can enter watercourses contributing to environmental problems such as eutrophication. Eutrophication is an accumulation of nutrients in watercourses causing excessive plant and algal growth resulting in reduced water quality and impacts upon fish, invertebrates and plant diversity. The extent of leaching is determined by factors such as soil type, crop cover, land management methods, geological characteristics and meteorological conditions prior to, during and following the application of the nutrients.
How NH3 is emitted from agricultural sources
Loss of ammonia which is a significant air pollutant impacting upon both human health and biodiversity (respiratory harms and nutrient enrichment of sensitive habitats) is common from agricultural systems. Ammonia is lost through volatilisation of ammonium (NH4+).
How N2O is emitted from agricultural sources
Nitrous oxide is emitted in the process of denitrification, a bacterial process in waterlogged soils that converts nitrate to nitrous oxide and N2 (for more explanation regarding the chemical processes involved please see Annex F). N2O is a potent greenhouse gas and forms a significant contribution to agriculture’s impact on climate warming.
Appendix B: Chemical processes of Nitrogen
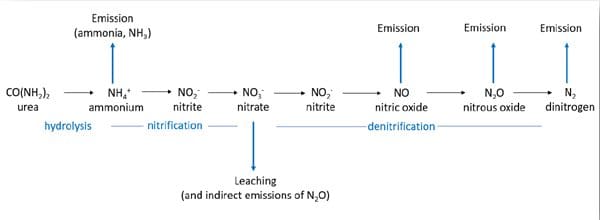
Appendix C: Rapid evidence assessment methodology
The Rapid Evidence Assessment (REA) methodology used for this project aligns with NERC methodology and comprised of the following steps.
- Define the search strategy protocol, identify key search words or terms, define inclusion/exclusion criteria. A list of key words, terms and search strings were created and reviewed by the project steering group to direct the REA review to the most relevant sources.
- Searching for evidence and recording findings. Literature was searched using Google Scholar, utilising our accounts with Science Direct and Research Gate to access restricted PDF’s where required. When searching through Government websites (to find policy initiatives and associated targets), the search engine Google was used. Searches were divided into academic literature and government websites (including farming press and industry). A unique search reference was assigned for each individual search, and the date, search string used, total number of results found, and the total number of relevant papers found were recorded. Examples of search strings include:
- “Nitrogen” “target” “Europe”
- NH3 target agriculture
- Nitrate leaching target
- Emission reduction target Denmark
All results were recorded in an excel spreadsheet with information extracted on the following:
- Country
- Target
- Target timeframe
- Benefits and risks/challenges of proposed target
- Mitigation measures (introduced, planned and proposed/suggested)
A RAG (red, amber, green) rating was also assigned for each source, based on the following criteria:
|
Description |
Rating |
|
Quality | |
|
Peer reviewed journal, sound data sources and methodology |
Green |
|
Government funded research reports, sound data sources and methodology |
Green |
|
International Nitrogen Management System (INMS) |
Green |
|
Research funded by NGOs (e.g. AHDB), sound data sources and methodology |
Amber |
|
Work is unreliable because of unreliable data sources, or limited sources, or because the method is not robust |
Red |
|
Information from websites, blogs etc., of unknown quality |
Red |
|
Relevance | |
|
Timeframe: within last 10 years |
Green |
|
Timeframe: within last 20 years |
Amber |
|
Timeframe: older than 20 years |
Red |
- Screening. Sources of evidence were then screened initially by title and then accepted papers were screened again using the summary or abstract. Literature was screened for information on the following inclusion criteria:
- Nitrogen target (including but not limited to target for NUE or nitrogen emissions, or nitrogen fertiliser use, or nitrogen deposition)
- Benefits and risks of introducing a target
- Mitigation methods that improve NUE, or decrease nitrogen inputs
- Extract and appraise the evidence. The screening provided an organised list of papers which enabled evidence to be extracted directly from the literature into the report. Literature extracted also guided the internal workshop and supported information included in the SWOT and PESTLE tables.
How was the evidence found used. Evidence gathered from the REA was used to identify the different types of N targets used in other countries and provided a discussion following examples of the relevance of these targets to Scottish agriculture (section 4). The evidence was also used to identify the benefits and risks of setting a NUE target for Scotland and assisted the SWOT and PESTLE analysis (section 5) and to inform criteria and underpin recommendations for setting an appropriate target/s for Scotland.
Appendix D: Country-specific changes (%) in NUE values from 1961 to 2014
Table 6: Country-specific changes (%) in NUE values from 1961 to 2014 (Our World in Data)
|
Country or region |
Year |
Relative change (%) | |
|---|---|---|---|
|
1961 (%) |
2014 (%) | ||
|
Denmark |
39.68 |
74.29 |
87 |
|
Finland |
34.51 |
57.08 |
65 |
|
France |
37.89 |
73.87 |
95 |
|
Germany |
37.71 |
62.62 |
97 |
|
Greece |
65.22 |
50.25 |
11 |
|
Hungary |
45.26 |
92.95 |
105 |
|
Iceland |
0.38 |
0.21 |
43 |
|
India |
43.73 |
34.34 |
21 |
|
Indonesia |
48.2 |
80.38 |
67 |
|
Ireland |
77.02 |
86.9 |
13 |
|
Italy |
47.85 |
52.64 |
10 |
|
Japan |
37.36 |
27.87 |
25 |
|
Latvia |
58.75 |
61.41 |
5 |
|
Luxembourg |
49.71 |
18.29 |
63 |
|
Malaysia |
42.81 |
262.09 |
512 |
|
Mexico |
75.78 |
45.74 |
40 |
|
Netherlands |
18.15 |
37.1 |
104 |
|
New Zealand |
10.26 |
5.23 |
49 |
|
North Korea |
49.68 |
41.85 |
16 |
|
Norway |
20.08 |
20.35 |
1 |
|
Poland |
48.16 |
45.27 |
6 |
|
Portugal |
33.39 |
19.2 |
42 |
|
Romania |
40.8 |
107.17 |
163 |
|
Russia |
64.37 |
125.2 |
95 |
|
Sweden |
43.15 |
53.01 |
23 |
|
Switzerland |
50.53 |
36.66 |
27 |
|
UK |
28.36 |
66.69 |
135 |
|
USA |
71.9 |
71.61 |
0 |


info@climatexchange.org.uk
+44(0)131 651 4783
@climatexchange_
www.climatexchange.org.uk

© Published by Institution, 202X on behalf of ClimateXChange. All rights reserved.
While every effort is made to ensure the information in this report is accurate, no legal responsibility is accepted for any errors, omissions or misleading statements. The views expressed represent those of the author(s), and do not necessarily represent those of the host institutions or funders.
Appendix E: Analysis & recommendation development Methodology
- Data collection
Relevant measures were collated from results of the REA. The impact factors for these measures on N flows was extracted into an excel file.
- Data extraction
All relevant data points were extracted from the papers into an Excel spreadsheet manually.
- Data appraisal
A RAG rating was applied to all data sources based on the quality of the data (including publishing date, assumptions made, applicability etc.). Where data was considered to be very poor quality, alternative sources to fill or improve this data point were sourced.
- Mapping
Relevant mitigation measures were mapped on to the SNBS according to what nitrogen flows they impacted. This allowed for accurate modelling of the change in nitrogen flow, and subsequently nitrogen use efficiency, if the measures are implemented at the estimated uptake rates in the given years.
- Calculations
Once the impact values had been mapped on to relevant N flows, they were evaluated to ensure that the theory behind these values relate and can therefore be applied to the values in the SNBS. This involved ensuring that each measure had a relative impact value as percentage, and that the baseline is applicable to that in the SNBS.
Applicability: the portion of the relevant flow in the SNBS that the measure/impact value applies to e.g. emissions from livestock are grouped in one flow in the SNBS, and so a measure/impact value relevant to only dairy animals can only be applied to a portion of the N flow value. There were several sources used to determine this granularity of application. For livestock sectors the Scottish agricultural census data was used. The total livestock number in heads was divided by the total number of livestock from all sectors and reported as a percentage. Fertiliser use was determined from data within the Agricultural SMT produced by ADAS.
Some measures that include N fixation may not improve NUE but will reduce mineral N inputs.
Current uptake: An estimation of the portion of the relevant N flow that is subject to the impact of the measures. This is subtracted from the overall applicability as the impact is already considered in the current NUE values. In this way double counting of impacts is avoided.
Maximum future impact: Calculated as applicability minus current uptake, multiplied by the impact value. This calculates the impact the measure may have if implemented on all remaining applicable units. The value is then multiplied by the projected future uptake value in each of the time points to produce an estimate for the impact that could be expected.
- Quality Assessment
All data inputs, calculations, and outputs of this task were reviewed internally by the sector experts to ensure robustness and validity. Where possible the results were also compared to peer reviewed literature to ensure that they were consistent with the current scientific understanding.
- Assumptions around SNBS
There is no flow that relates to N from soil into grass, so impacts on this could not be quantified in the SNBS.
Crop residue N is recycled within the system. Therefore, this flow is not considered in the NUE calculations in the SNBS, and so any impacts to crop residue N due to implementation of measures will not be reflected in an improvement to NUE. To compensate for this, improvements to crop residue N was modelled as a reduction in N inputs from fertilisers.
There is around 30kt N unaccounted for through livestock flows. This is perhaps accounted for in what is considered in the report as ‘stocks’ – i.e. an amount of N in living livestock at any one time.
Appendix F: Description of measures and assumptions
In the following tables, where the source is given as “other CXC paper” this is referring to the paper Eory, V., et al. (2023) and “MACC Update” refers to the paper Eory V., et al. (2015).
- Preventing soil compaction
Approximately 20% of arable land in Scotland is susceptible to soil compaction and is therefore eligible to have compaction prevention applied. This measure is expected to increase yields and crop residue N, and so is assumed to reduce mineral N requirements.
|
Paper |
CXC |
CXC |
CXC |
CXC |
CXC |
CXC |
|
Sector |
Arable |
Grassland |
Arable |
Grassland |
Arable |
Grassland |
|
N Effect |
Crop Residue N |
Crop Residue N |
Yield |
Yield |
N2O Emission Factor |
N2O Emission Factor |
|
Value |
2% |
1% |
2% |
1% |
-6% |
-6% |
|
Applicability |
20.00% |
20.00% |
20.00% |
20.00% |
20.00% |
20.00% |
|
Current Uptake |
0% |
0% |
0% |
0% |
0% |
0% |
|
Maximum Future Impact |
2.00% |
1.00% |
2.00% |
1.00% |
-6.00% |
-6.00% |
|
Uptake 2030 |
1% |
1% |
1% |
1% |
1% |
1% |
|
Uptake 2040 |
2% |
2% |
2% |
2% |
2% |
2% |
|
uptake 2045 |
2% |
2% |
2% |
2% |
2% |
2% |
|
2030 |
-0.01% |
-0.01% |
-0.01% |
-0.01% |
-0.04% |
-0.04% |
|
2040 |
-0.03% |
-0.02% |
-0.03% |
-0.02% |
-0.10% |
-0.10% |
|
2045 |
-0.04% |
-0.02% |
-0.04% |
-0.02% |
-0.13% |
-0.13% |
- Optimal soil pH
This measure involves applying lime to soils to ensure that soil pH is in the optimal range for N availability. This means that when applying N fertilisers there will be less excess N as it will be more bioavailable and taken up by crops. This has been found to increase crop residue N and yield, both by 6%, while reducing the emission of N2O by 3%, in arable and grassland. It has previously been assumed that approximately 9% of arable land and 22% grassland are applicable to have pH optimised.
|
Paper |
CXC |
CXC |
CXC |
CXC |
CXC |
CXC |
|
Sector |
Arable |
Grassland |
Arable |
Grassland |
Arable |
Grassland |
|
Nitrogen Effect |
Crop Residue N |
Crop Residue N |
Yield |
Yield |
N2O Emission Factor |
N2O Emission Factor |
|
Value |
6% |
6% |
6% |
6% |
-3% |
-3% |
|
Applicability |
9.00% |
22.00% |
9.00% |
22.00% |
9.00% |
22.00% |
|
Current Uptake |
0% |
0% |
0% |
0% |
0% |
0% |
|
Maximum Impact in Future |
-0.56% |
-1.37% |
0.56% |
1.37% |
-0.27% |
-0.66% |
|
2030 |
-0.17% |
-0.41% |
0.17% |
0.41% |
-0.08% |
-0.20% |
|
2040 |
-0.22% |
-0.55% |
0.22% |
0.55% |
-0.11% |
-0.26% |
|
2045 |
-0.42% |
-1.03% |
0.42% |
1.03% |
-0.20% |
-0.50% |
|
Uptake 2030 |
30% |
30% |
30% |
30% |
30% |
30% |
|
Uptake 2040 |
40% |
40% |
40% |
40% |
40% |
40% |
|
uptake 2045 |
75% |
75% |
75% |
75% |
75% |
75% |
- Use of catch/cover crops
Catch/cover crops are non-productive plants cultivated between catch crops with the effect of taking up excess N that was left in soil, having not been taken up by the preceding cash crop. This reduces the amount of N (in the form of NO3– ) that is lost in leaching by 45%. The applicability of this measure to crops has previously been set to 34%.
|
Paper |
MACC Update |
|
Sector | |
|
Nitrogen Effect |
Frac_Leach |
|
Value |
-45% |
|
Applicability |
34.00% |
|
Current Uptake |
30.00% |
|
Maximum Future Impact |
-10.71% |
|
2030 |
-0.75% |
|
2040 |
-1.82% |
|
2045 |
-2.36% |
|
Uptake 2030 |
7% |
|
Uptake 2040 |
17% |
|
uptake 2045 |
22% |
- Variable rate nitrogen application
Variable rate nitrogen application (VRNT) is where a digital map or real-time sensors supports a decision tool that calculates the N needs of the plants, transfers the information to a controller, which adjusts the spreading rate (Barnes et al. 2017). This measure is applicable to all land that receives fertiliser. 2-22% of farms use precision farming technologies and 16% used variable rate application, though only 11% use yield mapping (25% cereal farms, 18% other crop farms, 5% pig/poultry and dairy farms, 2% grazing livestock farms, 11% mixed farms). This measure can increase yield, reduce fertiliser use rates, and increase crop residue N. As with all measures yield is kept constant with current levels, and crop residue N is considered through a decrease in N fertilisation. Therefore, this measure is modelled as a decrease to N inputs through three mechanisms.
|
Paper |
CXC |
CXC |
CXC |
CXC |
CXC |
CXC |
|
Sector |
Crop |
Grassland |
Crop |
Grassland |
Crop |
Grassland |
|
Nitrogen Effect |
N fertilisation rate |
N fertilisation rate |
Crop yield |
Crop yield |
Crop residue N |
Crop residue N |
|
Value |
-5% |
-5% |
-3% |
-3% |
-3% |
-3% |
|
Applicability |
100.00% |
100.00% |
100.00% |
100.00% |
100.00% |
100.00% |
|
Current Uptake |
21.50% |
2.00% |
21.50% |
2.00% |
21.50% |
2.00% |
|
Maximum Impact in Future |
-3.93% |
-4.90% |
-2.36% |
-2.94% |
-2.36% |
-2.94% |
|
2030 |
-0.27% |
-0.34% |
-0.16% |
-0.21% |
-0.16% |
-0.21% |
|
2040 |
-0.67% |
-0.83% |
-0.40% |
-0.50% |
-0.40% |
-0.50% |
|
2045 |
-0.86% |
-1.08% |
-0.52% |
-0.65% |
-0.52% |
-0.65% |
|
Uptake 2030 |
7% |
7% |
7% |
7% |
7% |
7% |
|
Uptake 2040 |
17% |
17% |
17% |
17% |
17% |
17% |
|
uptake 2045 |
22% |
22% |
22% |
22% |
22% |
22% |
- Urease Inhibitors
Urease inhibitors slow down the hydrolysis of urea to ammonia when urea-based fertilisers are applied to soils, reducing ammonia emissions and increasing the N available to plants.
|
Paper |
CXC |
CXC |
CXC |
|
Sector |
Crop |
Crop |
Crop |
|
Nitrogen Effect |
N2O Emission Factor |
N leaching |
N fertilisation rate |
|
Value |
-27% |
-13% |
-17% |
|
Applicability |
8.40% |
8.40% |
8.40% |
|
Current Uptake |
0.00% |
0.00% |
0.00% |
|
Maximum Impact in Future |
-2.27% |
-1.10% |
-1.41% |
|
2030 |
-0.56% |
-0.27% |
-0.35% |
|
2040 |
-1.35% |
-0.65% |
-0.84% |
|
2045 |
-1.75% |
-0.85% |
-1.09% |
|
Uptake 2030 |
25% |
25% |
25% |
|
Uptake 2040 |
60% |
60% |
60% |
|
uptake 2045 |
77% |
77% |
77% |
- Nitrification Inhibitor
|
Paper |
CXC |
CXC |
|
Sector |
Crop |
Crop |
|
Nitrogen Effect |
N2O Emission Factor |
N2O Emission Factor |
|
Value |
-60% |
-30% |
|
Applicability |
7.50% |
36.50% |
|
Current Uptake |
0.00% |
0.00% |
|
Maximum Impact in Future |
-4.50% |
-10.95% |
|
2030 |
-0.53% |
-1.28% |
|
2040 |
-1.27% |
-3.10% |
|
2045 |
-1.65% |
-4.02% |
|
Uptake 2030 |
12% |
12% |
|
Uptake 2040 |
28% |
28% |
|
uptake 2045 |
37% |
37% |
- Improved Nutrition
Improving the nutrition of livestock can involve matching N in feed to the needs of the animal, improving the availability of N in the feed to animal, improving the digestibility of the feed so that more N is utilised by the animal and converted to liveweight. This can reduce N inputs and/or reduce N losses while keeping useful N outputs constant, and so increases NUE. From previous modelling of this measure in Scotland it was found that the N content of feed could be reduced by 2% in beef, poultry, and dairy, while excreted N could be reduced by 5% in pigs and 2% in sheep. The applicability of this measure for each livestock type is based on the proportion of total livestock units of each livestock type based off the Scottish Agricultural Census. The current uptake is based off data from previous reports modelling this measure in Scotland.
|
Paper |
CXC |
MACC (2020) |
MACC (2020) |
MACC (2020) |
CXC |
|
Sector |
Beef |
Pigs |
Poultry |
Dairy |
Sheep |
|
Nitrogen Effect |
Feed |
N Excreted |
Feed |
Feed |
N excreted |
|
Value |
2% |
5% |
2% |
2% |
-2% |
|
Applicability |
42.46% |
11.50% |
10.35% |
10.84% |
23.03% |
|
Current Uptake |
20.00% |
80.00% |
80.00% |
80.00% |
20.00% |
|
Maximum Impact in Future |
0.68% |
0.12% |
0.04% |
0.04% |
-0.37% |
|
2030 |
0.08% |
0.01% |
0.00% |
0.01% |
-0.04% |
|
2040 |
0.19% |
0.03% |
0.01% |
0.01% |
-0.10% |
|
2045 |
0.25% |
0.04% |
0.02% |
0.02% |
-0.14% |
|
Uptake 2030 |
12% |
12% |
12% |
12% |
12% |
|
Uptake 2040 |
28% |
28% |
28% |
28% |
28% |
|
uptake 2045 |
37% |
37% |
37% |
37% |
37% |
- Improved health
This measure includes eliminating issues including worms, liver fluke, and lameness, increasing the productivity/efficiency of the animals. While in theory 100% of the herd could have improved health (the stance taken in CXC A scenario), an 80% applicability value was chosen, following the assumption in CXC marginal abatement. This will produce a slightly more conservative estimate of the impact on NUE, to allow for not all diseases/health issues that contribute to lower productivity being treatable/eradicated, and a portion of the herd that may already be achieving higher health. Previous studies focusing on improving livestock health to mitigate nutrient loss, greenhouse gas loss etc. focused on the mechanism of increased productivity. Therefore, as we are keeping yields constant in this model the increased productivity is factored in as a reduction in feed inputs.
|
Paper |
CXC |
CXC |
CXC |
|
Sector |
Dairy |
Beef |
Sheep |
|
Nitrogen Effect |
Milk Yield |
Liveweight |
Liveweight |
|
Value |
6% |
6% |
10% |
|
Applicability |
41.63% |
24.05% |
8.21% |
|
Current Uptake |
0.00% |
0.00% |
0.00% |
|
Maximum Future Impact |
2.66% |
1.53% |
0.86% |
|
2030 |
0.80% |
0.46% |
0.26% |
|
2040 |
1.50% |
0.87% |
0.49% |
|
2045 |
1.95% |
1.13% |
0.63% |
|
Uptake 2030 |
30% |
30% |
30% |
|
Uptake 2040 |
57% |
57% |
57% |
|
uptake 2045 |
73% |
73% |
73% |
- Livestock Genetics
Livestock genetics techniques can be used with various goals including increasing productivity, climate resilience, or reducing emissions. For improving NUE of livestock systems the key goal is increasing efficiency i.e. increasing the utilisation of N and yield of livestock products, compared to the feed N intake levels. The uptake of using better genetic material is only around 20-25% in the dairy herd, and still lower in the beef herd (Defra 2018). The outcomes of this measure will depend on the breeding tools used and the breeding goal chosen. Three more specific measures have been gathered from the literature, and their potential impact on NUE has been modelled. These are:
- Increased uptake of the current approach in the dairy herd,
- Using the current breeding goals but enhancing the selection process by using genomic tools, in dairy and beef,
- New breeding goals to include lower GHG emissions, using genomic tools.
In 2018 usage of improved genetic material was reported as 20-25% in the dairy herd, and less in the beef herd. However, several previous projects modelling similar measures set the current uptake at 0% of both dairy and beef herds.
|
Paper |
CXC |
CXC |
CXC |
|
Sector |
Dairy |
Dairy |
Beef |
|
Nitrogen Effect |
Milk yield |
Milk protein |
Liveweight |
|
Value |
1% |
1% |
0% |
|
Applicability |
10.84% |
10.84% |
42.46% |
|
Current Uptake |
60.00% |
60.00% |
25.00% |
|
Maximum Future Impact |
0.04% |
0.04% |
0.08% |
|
Uptake 2030 |
15% |
15% |
5% |
|
Uptake 2040 |
25% |
25% |
10% |
|
uptake 2045 |
35% |
35% |
20% |
|
2030 |
0.00% |
0.00% |
0.00% |
|
2040 |
0.00% |
0.00% |
0.00% |
|
2045 |
-0.01% |
-0.01% |
-0.03% |
- Slurry acidification
Livestock excreta is susceptible to N volatilization, leading to losses to the atmosphere using storage, and leaching during spreading. Acidification of slurry can immobilize the N and reduce these losses. The impact of acidification is largely measured and reported in reductions to emissions, however, as the emissions values are not considered in the NUE calculations this has to be transformed to an impact on inputs. Higher N in slurry will increase yields/maintain yields with lower inputs. Therefore, in this model we include the impact of slurry acidification as a reduced input of N to land receiving fertiliser.
|
Paper |
CXC |
CXC |
CXC |
MACC Update |
MACC Update |
MACC Update |
|
Sector |
Dairy |
Beef |
Pigs |
Dairy |
Beef |
Pigs |
|
Nitrogen Effect |
NH3 Volatilisation |
NH3 Volatilisation |
NH3 Volatilisation |
N2O Emission |
N2O Emission |
N2O Emission |
|
Value |
-75% |
-75% |
-75% |
-23% |
-23% |
-23% |
|
Applicability |
2.28% |
0.85% |
2.19% |
2.28% |
0.85% |
2.19% |
|
Current Uptake |
0.00% |
0.00% |
0.00% | |||
|
Maximum Future Impact |
-1.71% |
-0.64% |
-1.64% |
-0.52% |
-0.20% |
-0.50% |
|
Uptake 2030 |
7% |
7% |
7% |
7% |
7% |
7% |
|
Uptake 2040 |
17% |
17% |
17% |
17% |
17% |
17% |
|
uptake 2045 |
22% |
22% |
22% |
22% |
22% |
22% |
|
2030 |
-0.12% |
-0.04% |
-0.11% |
-0.04% |
-0.01% |
-0.04% |
|
2040 |
-0.29% |
-0.11% |
-0.28% |
-0.09% |
-0.03% |
-0.09% |
|
2045 |
-0.38% |
-0.14% |
-0.36% |
-0.12% |
-0.04% |
-0.11% |
- Slurry store cover
Based on an impermeable slurry cover. Impact and uptake values taken from previous CXC paper. The flow in the SNBS does not distinguish between NH3 emissions from housing and spreading and N2O emissions from animal husbandry in general. The portion of each of these gaseous emissions was then extrapolated from the SMT. An impermeable cover is applicable to 100% of slurry tanks and lagoons as there is no available uptake data.
|
Paper |
CXC |
CXC |
CXC |
CXC |
CXC |
CXC |
|
Sector |
Dairy |
Dairy |
Beef |
Beef |
Pigs |
Pigs |
|
Nitrogen Effect |
NH3 Volatilisation |
N2O Emission |
NH3 Volatilisation |
N2O Emission |
NH3 Volatilisation |
N2O Emission |
|
Value |
-80% |
-100% |
-80% |
-100% |
-80% |
-100% |
|
Applicability |
6.25% |
2.71% |
0.85% |
0.85% |
4.26% |
4.26% |
|
Current Uptake |
0.00% |
0.00% |
0.00% |
0.00% |
24.00% |
24.00% |
|
Maximum Future Impact |
-5.00% |
-2.71% |
-0.68% |
-0.85% |
-2.59% |
-3.23% |
|
Uptake 2030 |
18% |
18% |
18% |
18% |
18% |
18% |
|
Uptake 2040 |
43% |
43% |
43% |
43% |
43% |
43% |
|
uptake 2045 |
55% |
55% |
55% |
55% |
55% |
55% |
|
2030 |
-0.88% |
-0.47% |
-0.12% |
-0.15% |
-0.45% |
-0.57% |
|
2040 |
-2.13% |
-1.15% |
-0.29% |
-0.36% |
-1.10% |
-1.37% |
|
2045 |
-2.75% |
-1.49% |
-0.37% |
-0.47% |
-1.42% |
-1.78% |
- Low Emission Housing
Acid air scrubbers can remove nitrogen from air, reducing NH3 emissions, which can then be applied to soils as N fertiliser, and essentially recovering more N in useful outputs by reducing waste N in emissions. Approximately 90% of recovered N can be reinput into the soil. The removal efficiency depends on the specific machinery used and approximately 90% can be expected for acid air scrubbers.
|
Paper |
Comparing environmental impact of air scrubbers for ammonia abatement at pig houses: A life cycle assessment (sciencedirectassets.com) |
Comparing environmental impact of air scrubbers for ammonia abatement at pig houses: A life cycle assessment (sciencedirectassets.com) |
|
Sector |
Pigs |
Poultry |
|
Nitrogen Effect |
Recovering emissions |
Recovering emissions |
|
Value |
-81% |
-81% |
|
Applicability |
12% |
10% |
|
Current Uptake | ||
|
Maximum Impact in Future |
-9.32% |
-8.38% |
|
Uptake 2030 |
7% |
7% |
|
Uptake 2040 |
17% |
17% |
|
uptake 2045 |
22% |
22% |
|
2030 |
-0.65% |
-0.59% |
|
2040 |
-1.58% |
-1.42% |
|
2045 |
-2.05% |
-1.84% |
- Novel Crops
Novel crops (crops with improved NUE) is designed to reflect the impact of growing new cultivars of crops that can maintain (or improve yields) with a lower requirement for N inputs as fertiliser. Previous
|
Paper |
MACC Update |
|
Sector |
Arable |
|
Nitrogen Effect |
N fertilisation rate |
|
Value |
-9% |
|
Applicability |
70.00% |
|
Current Uptake |
0.00% |
|
Maximum Impact in Future |
-6.30% |
|
2030 |
-13.23% |
|
2040 |
-2.52% |
|
2045 |
-4.73% |
|
Uptake 2030 |
30% |
|
Uptake 2040 |
40% |
|
uptake 2045 |
75% |
- Rapid Incorporation
|
Paper |
SMT |
|
Sector | |
|
Nitrogen Effect |
NH3 Volatilisation |
|
Value |
-41% |
|
Applicability |
100% |
|
Current Uptake |
26% |
|
Maximum Impact in Future |
-30.34% |
|
Uptake 2030 |
12% |
|
Uptake 2040 |
28% |
|
uptake 2045 |
37% |
|
2030 |
-9.10% |
|
2040 |
-8.60% |
|
2045 |
-11.12% |
- General Assumptions:
- Take the total inputs and subtract the total loss to atmosphere as NH3 and loss to run off and leaching
- Maybe assume that N2 and NOx stay constant, NH3 and N2O, estimate the losses and subtract from inputs
- Ignore crop residue N, check how this impacts flow
- Increased N fixation will lead to reduced mineral fertiliser inputs, balance out
- Reduced losses (N2O, NH3, leaching) will reduce inputs in equal amounts (may need to apply a percentage to this, as farmers may only reduce inputs by 80%, may have to look into the literature)
- Maintain yield (useful outputs), and so any change to output will be modelled as a change to inputs. This is based on the principle that there will be economic drivers at play that will mean on a Scotland wide scale production levels will be maintained, and so if there is a yield increase/decrease on one farm this will be balanced out by the converse on a different farm. Any yield increase/decrease will be felt as the converse in inputs – feed, fertiliser etc. will be reduced in line with the estimated increase of milk, liveweight, crop, etc.
- All legume measures will not impact NUE as any saving in N fertilisation will be balanced by increased biological fixation.
- Assumed that legumes are included once in every five years. Therefore, a fertiliser saving is felt in two of every five years and so impacts 40% of the mineral fertiliser input to crops flow (one year (20%) will be saved from the legume cycle, and one year (20%) from the subsequent crop year due to residual soil N).
- Within the SNBS, nitrogen flows to or from livestock pools were given as a single value for all livestock, rather than by type. However, the measures relating to livestock were species-specific (e.g. slurry acidification in dairy slurry and pig slurry). To compensate for this the number of heads of each livestock type (from the Scottish agricultural census) was converted to livestock units, and then the proportion of total livestock amount of each type was calculated and applied to the relevant measures.
- A single flow value is provided in the SNBS for all mineral fertiliser to crops and all mineral fertilisers to grass, however several of the measures only impact a certain type of fertiliser or may have a different impact depending on the type of fertiliser.
Appendix G: SWOT and PESTLE Analysis
The risks and benefits to Scotland from determining a NUE target were determined through giving consideration to numerous avenues of information and data. Evidence gathered following the completion of Task 1 (evidence review) focusing upon risks and benefits of setting NUE targets in other countries were collated and analysed. This was followed by an internal workshop, led by key experts within the agricultural field, to determine the applicability of the information to Scotland, during which time additional risks and benefits were identified. Following the internal Workshop, a more detailed study of the aspirations and trends in agricultural practices set by the Scottish Government was undertaken. The SWOT (strengths, weaknesses, opportunities, threats) and PESTLE (political, economic, sociological, technological, legal and environmental) tables were populated to better understand the complexities of the information gathered by Ricardo, with the analysis tools providing a summary of the risks and benefits of setting a NUE target in Scotland and demonstrating how a range of influences can support or hinder the achievement of a NUE target. The points presented in both the SWOT and PESTLE analysis have varying degrees of severity therefore a judgment on overall supporting and hindering influences cannot be made on the number of points alone.
SWOT
Strengths, weaknesses, opportunities, and threats (SWOT) of setting N-related targets were analysed based on the information gathered on N targets in other countries. We also included analysis of GHG and climate related targets where relevant to increase the body of information. This information was then used to assess applicability of setting a NUE target for Scottish agriculture with the limitation that the analysis was based on N, GHG and climate related rather than NUE specific targets. The SWOT analysis shows a range of influences which can support or hinder the achievement of a NUE target.
|
Strengths of a NUE target |
Weaknesses of a NUE target | |
|---|---|---|
|
Internal |
|
|
|
O Opportunities presented by having a NUE target |
Threats presented by having a NUE target | |
|
External |
|
Threats to achieving a NUE target
|
PESTLE
Setting NUE and other N targets are subject to a range of enablers and barriers. Therefore, a political, economic, social, technical, legal, and environmental (PESTLE) analysis was undertaken to assess the feasibility of setting a NUE target for Scottish agriculture, again, with the limitation that the analysis was based on N, GHG and climate related rather than NUE specific targets. The PESTLE assessment took place following the SWOT analysis to ensure the findings from the SWOT were assessed and, if relevant, included into the PESTLE categories.
|
Enablers |
Barriers | |
|
Political |
|
|
|
Economic |
|
|
|
Social |
|
|
|
Technical |
|
|
|
Legal |
|
|
|
Environmental |
|
|
Appendix H: Worked example
To aid in understanding the approach taken to calculate the impact of each measure on the NUE worked example, for slurry acidification has been presented below.
Slurry acidification can reduce the NH3 volatilisation at the storage stage by 75% for dairy, beef and pigs. It will also reduce N2O at the spreading stage by 23%. This measure cannot be applied on all managed livestock manure, and can be applied only where slurry is stored in tanks. Approximately, 41%, 4%, and 38% of dairy, beef, and pig excreta is on a slurry system, respectively, and approximately 50% is in slurry tanks rather than lagoons, for each livestock type. Therefore, this measure can be applied to approximately, 21%, 2%, and 19% of all dairy, beef, and pig excreta.
The relevant flows with the SNBS for these two impact values are N2O emissions from animal husbandry (including manure management), with a value of 0.92 kt N yr-1, and NH3 from housing and storage of manure, with a value of 10.5 kt N yr-1.
These flow values represent the absolute quantity of N transferring from the excreta pool to the atmosphere, for all livestock and storage types. Of total livestock units in Scotland, approximately 42% are beef, 11% are dairy, and 12% are pigs.
The uptake levels of this measure in 2030 is estimated to be 7%.
The current uptake is assumed to 0%.
The applicability of this measure on dairy is:
Portion of livestock that are dairy animals * portion of dairy excreta suitable for acidification
0.11 * 0.21
= 0.0228
Therefore, the impact of slurry acidification on the dairy sector is:
Applicability * (1-Current Uptake) * Impact Value * 2030 Uptake
0.0228 * (1-0.00) * -0.75 * 0.07
= -0.12%
Apply this to the absolute value for dairy from the SNBS:
10.5 * 0.0012
= 0.0126 kt N yr-1
This calculation is carried out for all three livestock types, and for the N2O value. The total N saved is 0.03 kt N yr-1, which is subtracted from the quantity of mineral fertiliser applied to soils:
143.78 – 0.03
= 143.74 kt N yr-1
The NUE is recalculated taking into account the new mineral fertiliser quantity:
(Inputs / Outputs) * 100
(200.08 / 54.48) * 100
= 27.23%
© The University of Edinburgh, 2024
Prepared by Ricardo PLC on behalf of ClimateXChange, The University of Edinburgh. All rights reserved.
While every effort is made to ensure the information in this report is accurate, no legal responsibility is accepted for any errors, omissions or misleading statements. The views expressed represent those of the author(s), and do not necessarily represent those of the host institutions or funders.
ClimateXChange
Edinburgh Climate Change Institute
High School Yards
Edinburgh EH1 1LZ
+44 (0) 131 651 4783
N waste is reactive nitrogen (Nr) that is not used in the nitrogen cycle. Higher N waste reduces NUE. ↑
The 2021 total is an adjusted total to consider compliance, meaning the contribution of emissions from non-manure digestate spreading is removed ↑
A NVZ designation limits the total amount of N (from livestock manure) that can be applied to agricultural land in that area. Scottish NVZ designation is reviewed every four years and nitrate concentrations in surface and ground water are measured by The Scottish Environment Protection Agency (SEPA). ↑
N fertilisers are used most commonly in the forms of ammonium nitrate and to a lesser extent urea both as a solid prill (pellet) which is spread using a broadcast spreader. ↑
Land use transformation, and related reductions in greenhouse gas emissions, will be necessary to achieve Scotland’s ambitions to reach net zero emissions by 2045, as well as biodiversity and climate change targets.
A variety of support systems for land use transformation, such as financial support and advice, are already in place.
This study aims to understand how and why land managers engage, or don’t engage, with these support systems, to inform how policy could be best deployed to accelerate the process of change.
Findings
There is substantial evidence for land manager behaviour and decision making that influences engagement with support systems. Their decisions are determined by a range of interacting internal and external factors, primarily related to financial, practical and cultural influences.
- Overall, the public sector grant-giving support network is logical and straightforward to use.
- The administrative burden associated with applying to schemes is a barrier to engagement.
- Land managers often decide whether to engage with support and advice based on confidence in its source. For example, farmers are more likely to trust advisers that have a practical farming background over those from a consulting or academic background.
- Land managers in Scotland primarily access public funding support. Some access private finance to supplement their income or achieve specific goals.
- The breadth of support sources is confusing for some land managers.
- Applicants would prefer administrative simplicity and greater flexibility.
- Improved accessibility and flexibility will not, by themselves, increase overall engagement with land use change. Other measures, such as attractive payment rates, sufficient technical advice and training and management flexibility, will also be needed.
If you require the report in an alternative format, such as a Word document, please contact info@climatexchange.org.uk or 0131 651 4783.
Research completed October 2023
DOI: http://dx.doi.org/10.7488/era/5005
Executive summary
Introduction
Land use transformation (and related reductions in greenhouse gas emissions) will be necessary to achieve Scotland’s ambitions to reach net zero emissions by 2045 as well as biodiversity and climate change targets. A variety of support systems for land use transformation, such as financial support and advice, are already in place. This study aims to understand how and why land managers engage, or not, with these support systems. This helps inform how policy could be best deployed to accelerate the process of change.
Influences on land manager decision making
We found substantial evidence for land manager behaviour and decision making that influences engagement with support systems. Their decisions are determined by a range of interacting internal and external factors, primarily related to financial, practical and cultural influences, which can be enabling or restricting, such as:
- personal values and knowledge
- perceived loss of control
- social norms/pressures
- trust in sources of information and advice e.g. land agents
- administrative burdens/transaction costs
- financial incentives
- awareness and understanding
- clarity of the benefits of change.
Restrictive barriers are compounded by context specific factors that vary across individual businesses, such as tenure, business scale and biophysical constraints.
Findings
Overall, the public sector grant-giving support network is logical to use. Most schemes are accessed through the Rural Payments and Inspections Division (RPID) portal. Other schemes are straightforward with regard to procedures. The RPID portal only requires one set of login credentials to access a wide range of support systems. Support systems under this umbrella are easy to access and do not require additional login credentials.
The administrative burden associated with applying to schemes, i.e. form filling, is a barrier to engagement. Procedural support (i.e. form filling by an adviser) is widely available from both public and private advisory sources but requires additional resource to procure. This is distinct from practical support, such as site-specific implementation advice, which was frequently mentioned by stakeholders as key to facilitating the uptake of environmental management practices and yet less readily available.
Land managers often decide whether to engage with support and advice based on confidence in its source. For example, farmers are more likely to trust advisers or organisations that have a background in practical farming over those from a consulting or academic background.
Land managers in Scotland primarily access public funding support. Some access private finance to supplement their income or achieve specific goals. Those accessing private finance generally do it to avoid the conditionality of public funding support and retain operational control over the management of their land. Combining Agri-Environment Schemes and e.g. the Peatland Code is perceived as overly cumbersome, with interactions between schemes, different application dates and the need to demonstrate additionality proving complex.
The breadth of support sources is confusing for some land managers. Better alignment, or at least signposting between sources, would be helpful. Ideally this needs to be via people as well as (rather than just) an online portal. This will enable land managers to choose the correct support more readily, according to their own circumstances.
Applicants would prefer administrative simplicity and greater flexibility. Therefore, efforts to streamline application and monitoring processes, reduce information burdens, widen application windows and vary contract lengths, are justifiable.
Administrative touch points and contractual constraints are only one influence on land manager behaviour. Improved accessibility and flexibility will not, by themselves, increase overall engagement with land use change. Other measures will also be needed such as attractive payment rates, sufficient technical advice and training, and management flexibility. Further research from workshops with potential support recipients, ideally out of peak summer work season, would help understand how future engagement can be maximised.
Abbreviations table
|
AECS |
Agri-Environment Climate Scheme |
|
ARE |
Agriculture and Rural Economy Directorate |
|
BPS |
Basic Payment Scheme |
|
ENFOR |
Environment and Forestry Directorate |
|
FAS |
Farm Advisory Service |
|
FGS |
Forestry Grant Scheme |
|
JHI |
The James Hutton Institute |
|
MLDT |
Modern Limited Duration Tenancy |
|
NFUS |
National Farmers’ Union Scotland |
|
NGO |
Non-Governmental Organisation |
|
LDT |
Limited Duration Tenancy |
|
LFA |
Less Favourable Area |
|
LFASS |
Less Favourable Area Support Scheme |
|
PCC |
Peatland Carbon Code |
|
QMS |
Quality Meat Scotland |
|
RPID |
Rural Payments and Inspections Division |
|
RSABI |
Rural Payments and Services |
|
RSPB |
Royal Society for the Protection of Birds |
|
WT |
Woodland Trust |
|
SAF |
Single Application Form |
|
SAOS |
Scottish Agricultural Organisation Society |
|
SCF |
Scottish Crofting Federation |
|
SEPA |
Scottish Environment Protection Agency |
|
SLE |
Scottish Land and Estates |
|
SLDT |
Short Limited Duration Tenancy |
|
SOPA |
Scottish Organic Producers’ Association |
|
SRUC |
Scotland’s Rural and Agricultural College |
|
SUSSS |
Scottish Upland Sheep Support Scheme |
|
SSBSS |
Scottish Suckler Beef Support Scheme |
|
STFA |
Scottish Tennant Farmers’ Association |
|
WCC |
Woodland Carbon Code |
Introduction
Rural land use in Scotland directly supports the national economy, rural communities, and local businesses. Sustainable land use holds a key role delivering Scotland’s biodiversity goals and response to climate change. Agriculture is the second largest source of greenhouse gas emissions in Scotland, behind the transport sector, with emissions largely coming from livestock and soils.[1] In order to achieve biodiversity recovery and climate mitigation and adaptation, agricultural transformation is required to reduce emissions, and capture carbon in vegetation and soils. A continued, long-term expansion and integration of regenerative agriculture, afforestation and peatland restoration will be necessary and is currently underway as part of the plan to achieve Scotland’s net zero targets.
This research was undertaken to gain a better understanding of the key influences that have a bearing on land manager decision making, including their motivations, what they want to achieve for their operation and their appetite for change.
The aims of the project were to map current support services across different land use sectors to inform our understanding of a land manager’s ability to make decisions and access funding and advice for different land uses. One of the key influences on land manager decision making is their awareness and engagement with support systems. “Support systems”, for the purpose of this report, refers to all sources of support that a land manager in Scotland could access to aid their management of their operation. This includes the following sources:
- Public funding support (e.g. Agri-Environment Climate Scheme (AECS))
- Private funding support (e.g. Woodland Carbon Code (WCC))
- Procedural and practical support from advisors, both public and private (e.g. Farm Advisory Service (FAS))
- Informal networks (Family, friends, and peers)
We looked at availability and links between existing and relevant land use information systems, support services, and current incentives for land use transformation which are directly related to achieving Net Zero and/or nature restoration.
Through stakeholder interviews and other evidence, we established where, when and how different rural land managers interact with the systems and services; we then collated the evidence for issues and barriers to access them. The results are presented using SWOT and PESTLES analysis, conclusions, and visualisations.
When we defined “land manager” we focussed our research on managers of agricultural land, including moorland, peatland and forestry, whether that be farmers, crofters, large estates or organisations such as NGOs.
Understanding land manager behaviour in relation to their awareness of, and drivers of actions that support (or not) environmental outcomes is complex. Decisions and outcomes in this area are a result of multiple interactions between agronomic, cultural, social and psychological factors, all of which sit within the national, regional and specific site context (Mills et al, 2016). Therefore, understanding land manager engagement with current support systems will prove equally complex.
To further our understanding, we carried out an evidence review of the literature. This informed the design of typical land manger archetypes to facilitate the analysis of how specific sectors in Scotland are engaging and accessing support systems. Please see Table 6 in Appendix B for the longlist of archetypes. The long list was used to gather further data, through stakeholder interviews, from both support providers and receivers, across the spectrum of land manager sectors in Scotland. Twenty-five stakeholder interviews were conducted, with participants ranging from support recipients such as crofters and farmers, to support providers and academics. Views from the agriculture, forestry and peatland sectors were captured. Attitudes relating to land managers’ ability and willingness to engage with support systems as well as what determines the level of engagement with these systems were explored. This included the types of support available, their pros and cons, as well as whether they were felt to be accessible, credible and available.
Reflecting its relative prominence within public expenditure and land-based businesses in rural areas, agriculture dominates much of published literature on land-use support. This evidence was supplemented by feedback from stakeholder interviewees, including individuals representing other sectors. The final step was to map the experience of six chosen, prioritised, archetypes in more detail. These are presented in section 6.2.
Full details of our methodology can be found in Appendix A-D.
This study included:
- Carrying out a rapid literature review. (methodology in Appendix D)
- Identifying and mapping the most prominent existing and relevant land use information systems, support services and the current incentives for land use transformation directly related to achieving Net Zero and/or nature restoration. (Appendix A)
- Developing typologies for land managers who might engage with these systems. (Appendix B)
- Agreeing a discussion guide (see Appendix C) for semi-structured interviews.
- Identifying a list of target candidate interviewees who were chosen to represent recipients of support, providers of information and advice, and academic experts. (Appendix C)
- Analysis of where, when, and how land managers interact with the systems and services.
- Presentation of evidence for issues and barriers to access these systems and services from the stakeholder interviews.
Introduction to land manager decision making
The literature is consistent in reporting that land manager decision making, regarding the use and management of their land, and therefore support system engagement, is influenced by both internal and external factors which combine to create individual circumstances. (Buamgart-Getz et al. 2012; Mills et al. 2016; Barnes et al. 2021; Conti et al. 2021; Thompson et al. 2021a).
These factors affect a land manager’s willingness and ability to adopt environmental management practices. The importance of this is underlined by the fact that climate is the most important element of agricultural productivity in many instances (Scottish Government, 2012). Therefore, once bio-physical conditions (an external factor in itself) have determined what management measures are suitable for a land manager, the wider range of internal/external factors will influence engagement with specific support systems offering funding, information, advice, and training. Table 1 below displays the different internal and external factors that influence land manager decision making, as identified by Thompson et al. (2021a).
Table 1 – Internal and external factors influencing land manager decision making – (adapted from Thompson et al. (2021a)).
|
Factor |
Description | |
|
Internal |
Risk perception |
Extent to which a land manager is open to changing practices. |
|
Values |
Extent to which a land manager has a positive view of environmental measures. | |
|
Knowledge |
Extent to which a land manager understands how to implement environmental measures and how these compare to other potential land uses such as recreation, housing, renewables etc. | |
|
Socio demographic, age and location |
Specific land manager characteristics, including sociodemographic background, education, age and location. | |
|
External |
Funding, cost and policy indicators |
Access to funding (e.g. subsidies, private investment), cost of changing practices and perception/stability of the policy environment. |
|
Land characteristics |
Key characteristics, such as farm size, tenure, type (arable, mixed, dairy etc.), biophysical condition, whether there is currently active land management. | |
|
Support system accessibility |
Complexity and accessibility of support systems, i.e. how complicated support systems are perceived. | |
|
Knowledge availability, sharing, and awareness |
Land manager knowledge of alternative practices and preference of farmer on method of engaging with wider network and support systems (verbal, formal etc.) | |
|
Cultural |
Networks and connectivity, social norms (what is perceived to be right and wrong) and influence of peer group. |
The way these factors affect and interplay with land manager willingness – and their ability to adopt environmental practices – are shown in Figure 1 (after Mills et al. (2016)). For example, a land manager with limited resources, reliant on informal networks of support, with a strong anti-change personal attitude is unlikely to engage with environmental practices and support systems. Another land manager with higher access to finance, human and social capital, more formalised support networks and a positive outlook on environmental practices would be more likely to engage.
Figure 1 – Factors influencing land manager engagement, willingness and ability to adopt (from Mills et al. 2016).
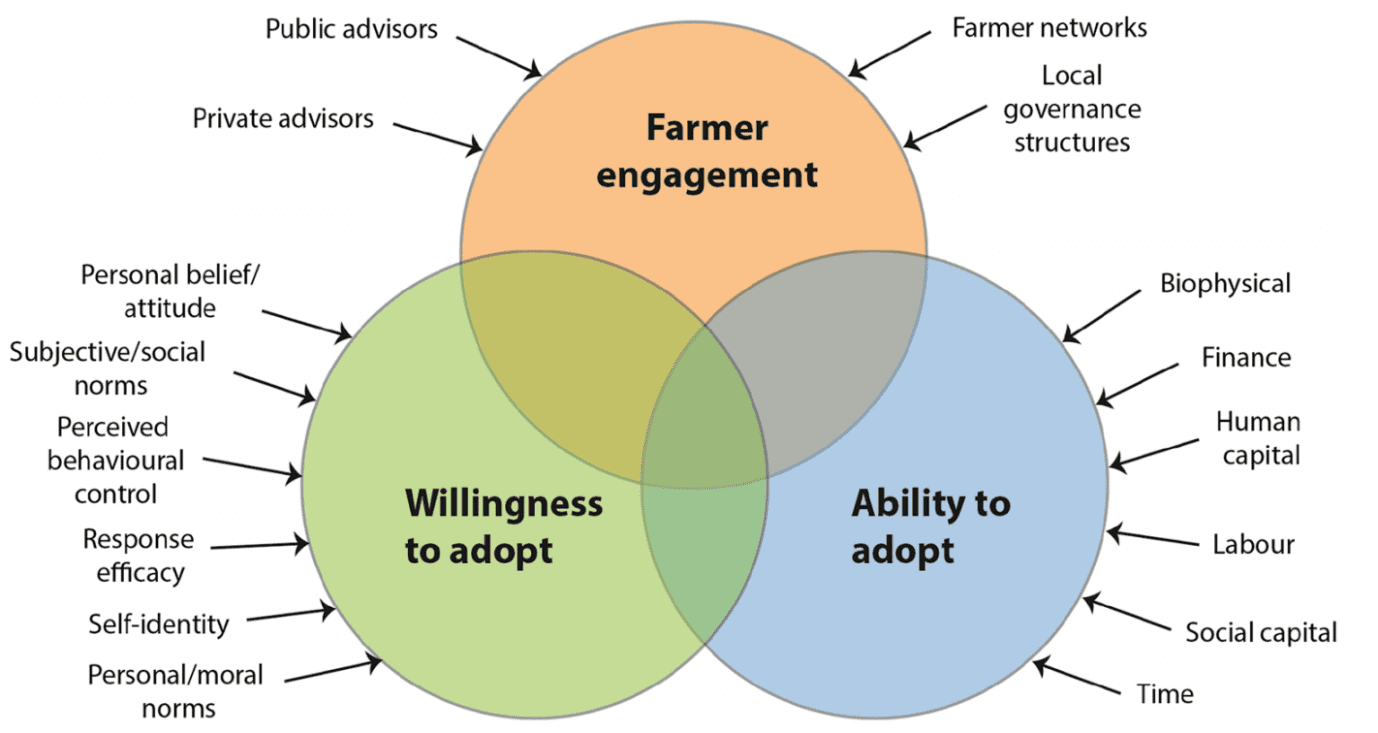
These examples are clearly extreme ends of the spectrum. Landowners will all have a unique set of factors that influence their decision making when it comes to adopting environmental practices and engaging with specific support systems. It is for this reason that understanding and predicting land manager environmental behaviour and engagement with support systems is complex.
It is important to note that most of the literature on the subject of land manager engagement/motivations with support systems focuses on farmers. For example, (Sutherland et al. 2011) who state “research into actor influences on land use change (attitudes, motivations and objectives held by individuals and groups) has traditionally focused on single sectors, particularly farming. Neither is the range of landholding entities addressed, as emphasis is typically on private owners.”
Some studies (Ambrose-Oji, 2019; Tyllianakis et al. 2023) have explored wider land manager engagement with support systems in detail, however the focus in the academic literature remains centred on farmers. The reasons behind this focus are not currently clear, but it may be due to the large engagement of the agricultural industry with support systems, particularly financial support.
We have attempted to fill this gap in the literature through targeted stakeholder interviews with individuals representing land managers outside, as well as within, the agricultural industry.
Our evidence review has suggested that engagement with current support systems is primarily influenced by certain personal values and knowledge, perceived loss of control, excessive administrative burdens/transaction costs, a lack of credible financial incentives, a lack of awareness, understanding and clarity of the benefits of certain support schemes and social norms/pressures. These barriers are then further compounded by context specific factors that vary across individual businesses, such as tenure, business scale and biophysical constraints.
Land manager engagement with support systems is discussed in more detail in Section 6
Review of support systems
The next stage of this study attempted to identify the current land use support systems that land managers are engaging with in Scotland. This allowed us to map current support services across sectors in Scotland. Once we established the variety of support systems, we could begin to understand how land managers are interacting and engaging with these systems, whilst identifying key barriers and opportunities that could be used to inform future policy support.
We achieved this by firstly identifying a range of typical land manager archetypes in Scotland, followed by a review of all visible support systems identified through academic and grey literature review.
More detail on the types of support available is given in Appendix A Support in terms of funding is available from Government and the Private sector. Advice and information can be sought from direct Government sources plus third-party sources funded by Government (e.g. the Farm Advisory Service) but also independent third-party provision. Third sector, charities and Non-Governmental Organisations also provide landowners with advice and funding to undertake measures that align with their objectives.
Initial land use support system mapping
The infographic on the following page (Figure 2) displays a high-level mapping overview of the current land use support systems in Scotland and the extent to which land managers are engaging with each. Most land managers engage with government agency support and funding, with agricultural land managers doing this to a greater extent. This is mostly limited to schemes such as BPS and LFASS as these offer large rewards for less administrative actions compared to other schemes, such as AECS. Other land managers are more likely to be engaging with corporate buyers and private sector sources of support, such as emerging natural capital opportunities.
Figure 2 demonstrates clearly that the land manager support network in Scotland is a complex entity, with different land managers drawing from a wide range of support sources. Whilst it has not been possible to quantify the exact support flows between support providers and support receivers, we have provided an indication of the overall network and flow of support in Scottish Agriculture, helping us map current land manager engagement with support systems.
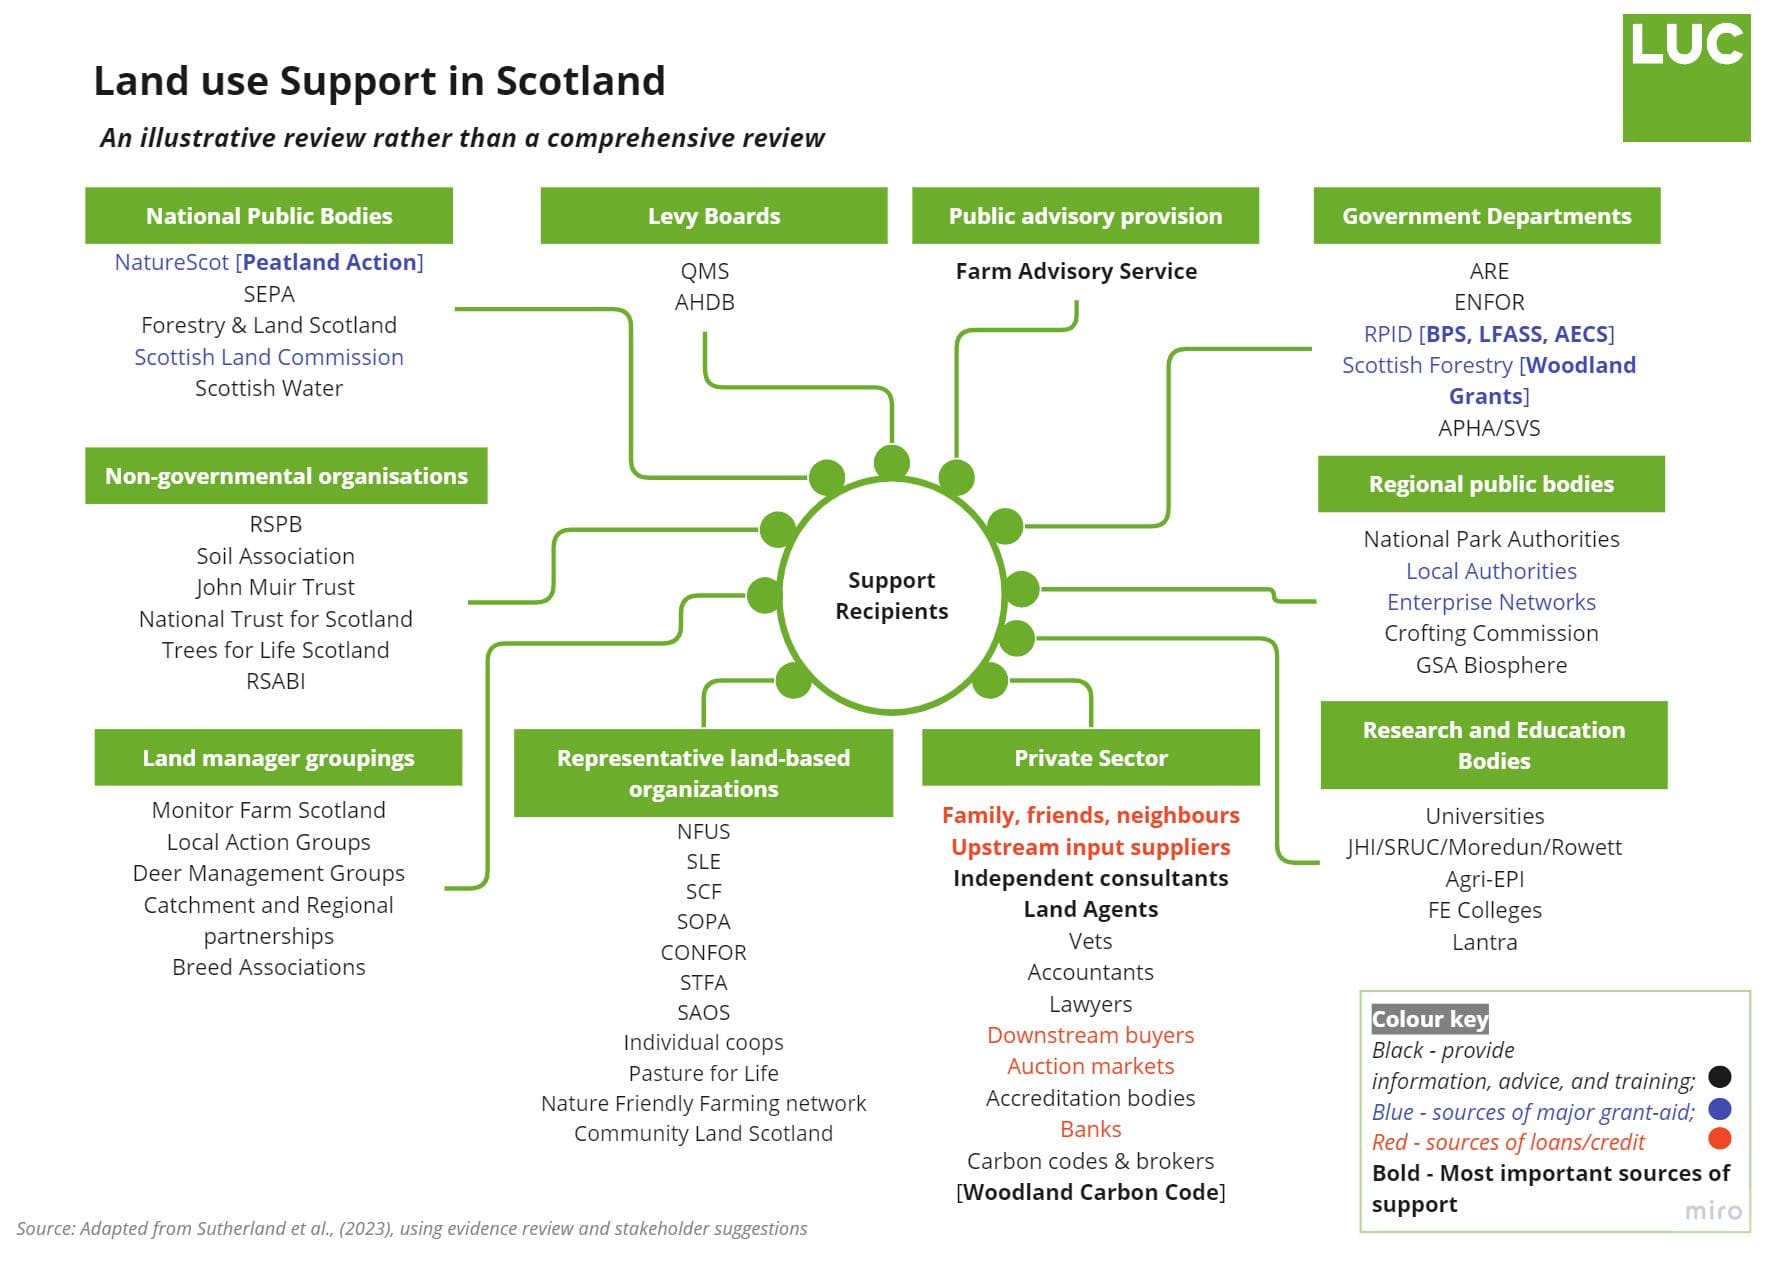
Figure 2 – Land use support system providers in Scotland. Source: Adapted from Sutherland et al. (2023)
Stakeholder views on engagement with support systems
It was recognised from the outset that the results of the evidence review must be calibrated against the lived experience of key stakeholders. We were able to conduct 25 interviews, and had scheduled to supplement this with additional workshops, but it proved very difficult to gain substantive input from planned workshops due to the timing overlap with the peak summer workload alongside harvesting.
We have captured the results of the stakeholder feedback below. This should be read alongside the review of the literature which is presented in section 7. Whilst there are significant similarities between the evidence from the literature review and stakeholder perceptions from the interviews, we recognise that this evidence would be usefully supplemented by a more in-depth form of action research with a wider stakeholder group, in particular potential support recipients, which would help to deliver more substantive results.
Factors influencing land managers’ decisions.
Stakeholder interviewees identified many factors influencing the ability and willingness of land managers to change management practices and/or land use patterns. Although varying in terms of emphasis and specific examples offered, there was a high degree of agreement across stakeholders (and consistency with the literature) regarding the main categories of (interacting) influences, which can be summarized as follows:
Confidence and understanding
Land management involves a range of tasks requiring both practical skills (e.g. handling livestock and machinery) but also organizational (e.g. resource allocation) and strategic (e.g. business planning). Changing land management practices and/or land use patterns requires expanding this skill set. However, not all land managers currently have the necessary skills, leading to many having a low understanding of how to change and low confidence in abilities to change successfully. Conflicting messages about the definitions, relative merits and compatibility of different practices (e.g. afforestation, regenerative agriculture) cause significant confusion, reinforcing an underlying wariness of changing unnecessarily.
Indeed, stakeholders were concerned that basic awareness amongst many land managers of requirements for change under both future agricultural policy, but also private supply-chain pressures, is still very low. Clearer and more consistent messaging from government and industry leaders would help, particularly if it was accompanied by more detail on practical support measures, including funding levels, the provision of information, advice and training, and any implications for future eligibility for land-related tax breaks and other public funding sources.
Resource constraints
Although any given parcel of land can be used for a variety of purposes, its underlying natural capital and biophysical characteristics (e.g. climate, topography, soils) exert a significant influence over its inherent suitability for different uses. Consequently, land managers do not all face the same land use possibilities to deliver particular ecosystem services. The Less Favoured Area (LFA) designation recognizes this in agricultural production terms but variation in suitability to deliver other ecosystem services is also recognized through various environmental designations (and indeed spatial targeting of agri-environment measures).
Farm type provides a convenient, albeit crude, indicator of likely flexibility in agricultural land use, with many hill and upland livestock farms being particularly constrained. The JHI Agricultural Land Capability Map (and equally the forestry suitability map) offers a more refined indication, but greater use of maps to categorise potential to deliver wider, environmental services would be helpful. For example, High Nature Value (HNV) farming.
Beyond biophysical constraints, farm businesses are also constrained by the availability and quality of other resources – in particular, working capital, equipment and labour. Stakeholders stressed that many farm businesses operate on very slim margins and are risk averse, limiting the scope for experimentation and investment in new management practices or forms of land use. Financial support can help to overcome this, as can support scheme contracts’ length and flexibility. However, labour scarcity and the relentless nature of farming often leave little spare time to devote to engaging with the process of change.
Geographical remoteness and/or poor communications connectivity can add further challenges. So can small scale – smaller businesses with fewer resources (especially labour) typically lack both the economies of scale and flexibility available to larger businesses to accommodate/experiment with change. This limits their ability to be creative and do something different. Some larger businesses have recruited in-house expertise and/or they directly commission academic and other consultants, particularly in relation to emerging nature-based solutions and rewilding exercises.
Transaction costs
The transaction costs of seeking information, advice, training, and external funding to implement change can be significant. To make it easy for all applicants, sources of information, advice, training and funding should be easy to locate. Administrative processes for applications, monitoring and reporting should be simple and accessible, including in their choice of language and terminology.
Stakeholders acknowledged that accountability for public expenditure necessarily requires a degree of bureaucratic oversight. However, they expressed concern that the complexity of some funding schemes[2] was a deterrent to some applicants, including those with little spare time and/or an unfamiliarity with administrative processes. This phenomenon was described as ‘form anxiety’. The difficulties of coordinating across multiple sources of information, advice and training were recognized, and it was suggested that clearer signposting and the use of one-stop-shops would be welcome.
Smaller businesses lacking the staff and/or finance to hire specialist advisors may be particularly affected by transaction costs, facing a proportionately greater burden than larger businesses. For example, there is often a fixed cost element to application processes regardless of the level of funding sought and having to seek information directly rather than being able to delegate to staff can have a high opportunity cost.
Tenure
Farm tenure exerts a direct influence over land managers’ ability to undertake change, particularly between different land uses. Specifically, whilst owner-occupiers have the freedom to choose how they manage their land, tenants are constrained by the terms of their lease. The degree of restriction varies across different types (e.g. length) of tenancy, with crofting tenure adding some further complexities, particularly in relation to common grazing.
In most cases, agricultural tenancies restrict the range of land use activities permitted. For example, afforestation and non-agricultural enterprises are typically precluded from leases by default (although may be agreed via negotiation). Moreover, non-agriculturally productive parcels of land (e.g. pre-existing woodland, riparian habitats) are often excluded from the area covered by a lease. Consequently, the ability of many tenants to implement and benefit from land use change is currently constrained.
However, some stakeholders believed that the issues around tenure constraints had become better understood in recent years and were hopeful that the forthcoming Agriculture Bill would address many of them.
Motivations and norms
Beyond the practical constraints suggested above that influence a land manager’s ability to change, willingness to change is also affected by various factors. In particular, by an individual land manager’s attitude towards and motivation for land management and by cultural norms held by family, friends and peer groups.
Land managers need to perceive how change fits with business viability and continuity. Some land managers (e.g. rewilding estates, NGOs) may be motivated to undertake change primarily by seeking environmental improvements. Others may be more motivated by the traditional farming values centred around food production, and they be more fundamentally opposed to activities perceived as incompatible with growing or rearing consumable produce. The latter is particularly relevant to debates around afforestation and (to a lesser extent) peatland restoration.
Many land managers are starting from a mainstream farming perspective, although not all are; other groups are perhaps more open to change such as community groups, foresters and horticultural producers. Stakeholders suggested that variation in willingness to change was likely to be significant across the full population of land managers and would complicate any targeting of encouragement to change.
Stakeholders also noted that willingness to change could ultimately be influenced by financial pressures, whether via public finding or market signals, but that sustainable change would require cultural shifts – winning hearts and minds. This implies a need for clear industry leadership backed-up by the provision of information, advice and training plus (probably) encouragement for generational renewal. Negative perceptions of bureaucracy and of support payments simply flowing to advisers (a ‘consultants charter’) are widespread.
Types and sources of support
Stakeholders identified different types of support for land managers, distinguishing funding from other forms of support.[3]
Funding
Funding was further divided into public and private, although the emphasis was very much upon public funding. Public funding for land management is dominated by agricultural support, notably decoupled area payments plus limited voluntary coupled support. Significant funding is also available for forestry and peatland restoration, plus wider agri-environmental schemes, innovation funds and various capital grant schemes. Public funding is also available to land-based businesses from other sources, such as the Enterprise Networks (see Table 2 for listing).
Stakeholders regarded public funding as essential to achieving management and land use change; in particular to offer financial incentives (or at least reduce disincentives) to make change worthwhile and to encourage any necessary capital investments. However, it was noted that inflation continues to erode the real terms value of public funding, decreasing the leverage that it has over management decisions.
Private funding for changing land management is also available. For example, there are high-profile cases of new and large landowners essentially self-funding and/or harnessing emerging environmental funding mechanisms. The latter include the Woodland Carbon Code and the Peatland Code.
However, the accessibility of such mechanisms to all land managers (e.g. tenants, common grazing, smaller holdings, community owners) is imperfect. Moreover, considerable uncertainty exists over the future value of carbon credits, and the possibility of claims over them by downstream supply-chain partners. Consequently, notwithstanding Scottish Government aspirations to increase private funding, stakeholders expressed some scepticism about the potential of private funding to replace public funding.
Non-funding support
Stakeholders also sub-divided non-funding support, into procedural support to help land managers navigate bureaucratic processes (e.g. advice on how to complete application forms, enrol in training programmes) and support to help with actual activities on-the-ground (e.g. training in new management practices). Both were regarded as necessary, but the degree of procedural support required relates back to concerns about transaction costs.
Procedural support tends to either take the form of information and general advice provided by the source of any funding, or the form of professional assistance to comply with application and reporting processes. For example, public funding is accompanied by online (and sometimes print) public guidance material plus online, phone and (sometimes) face-to-face advice on (e.g.) eligibility criteria, payment rates and evidence requirements. Private sources (e.g. land agents, consultants) often mirror this, but also offer further hands-on assistance to gather necessary data and complete paperwork plus more bespoke advice for individual land managers.
Practical support is similarly available in different forms from a variety of sources. Indeed, stakeholders emphasized the huge variety of forms and sources (see Table 2 for listing). For example, information is available via print and social media from public (e.g. Scottish Government, NatureScot, SEPA, Universities), private (e.g., levy bodies, consultants, input suppliers) and third-sector (e.g. NGOs) providers and advice can be offered one-to-one or one-to-many[4] either online or face-to-face. Moreover, face-to-face may involve a simple meeting or a site visit or demonstration. Vocational training (e.g. via Lantra or colleges) tends to involve face-to-face events, but online training can suit some strategic and planning type skills development. Stakeholders suggested that the breadth of support sources was confusing for some land managers and better alignment or at least signposting between sources would be helpful, although signposting ideally needs to be via people as well as (rather than just) an online portal, for land managers to define the correct source of support for their own individual circumstances.
Importantly, stakeholders also stressed the role of informal sources of information and advice. For example, family and friends plus unrelated business professionals (e.g. accountants, vets). Peer group networks (local but also international) of like-minded people can also be important – indeed some stakeholders identified these as particularly relevant for emerging practices such regenerative agriculture and agro-forestry which some stakeholders regarded as not well-served by more formal support mechanisms. Peer networking can be encouraged through trained facilitators and funding.
Availability, accessibility and relevance
Uptake of information, advice and training requires land managers to trust the source and to see the relevance of what is being offered. This poses a demand-side challenge in persuading land managers of the need for change and relates back to points made above regarding the need for clear, consistent messaging from government and industry leaders to set the tone – particularly in relation to strategic business skills and new technical skills.
However, it also poses supply-side challenges in terms of the availability and accessibility of information, advice and training. Government only has leverage of this through either direct provision itself, or funding of third parties to provide support. Stakeholders noted that availability was already patchy geographically and in terms of specialist topics. Moreover, they were not confident that public funding levels would be sufficient to cover all future requirements – implying a need to prioritise particular topics or groups of land managers, and/or to rely more upon online and one-to-many methods (despite experiential, hands-on learning being viewed as more effective).
Citing diminishing returns and the 80/20 rule[5], some questioned the merits of trying to accommodate all ‘hard to reach’ groups (e.g. smaller producers, new entrants, women, the very young, those with poor mental health). However, the Women in Agriculture initiative was cited as a good example of targeting.
Furthermore, even if future funding was sufficient, stakeholders were not confident that sufficient appropriate advisors would be available in the short-term. Trust depends on perceived credibility and, rightly or wrongly, in many cases this requires advisors to have agricultural backgrounds – yet the types of management and land use changes required extend beyond agriculture. This implies a need to upskill existing advisors but also to recruit advisors from different backgrounds – either to work in teams or (hopefully) to be accepted as credible by land managers.
Stakeholders offered a variety of solutions to this problem, including allowing the Farm Advisory Service (FAS) to evolve in terms of its modes of operation and topic overage but also to sub-contract other independent and/or specialist advisers (including existing land managers) as appropriate. Deployment of RPID staff to offer advice as well as conducting inspections was also suggested, reminiscent of previous policy eras and also, to some extent, emulating more recent practice in forestry and catchment management.
The use of facilitators rather than advisors was supported by some stakeholders, reflecting (possibly) easier recruitment (technical expertise is less essential than people skills) and perceived advantages of facilitated experiential learning rather than expert instruction.
It was also suggested that advisors should be included more formally in policy design and monitoring processes since they are well placed to offer insights into how ideas will be received and implemented on-the-ground. It was noted that total formal advisory capacity includes those working for input (e.g. seed, feed, fertiliser) suppliers as well as those aligned with FAS or working independently.[6]
Table 2 – Cited examples of support
|
Category |
Funding (for investment, working capital and income support) |
Info/advice/training (via print & social media, online, telephone, face-to-face, demonstrations, one-to-one, one-to-many etc). |
|
Private, independent |
Loans. Equity partners. Crowdfunding. Impact bonds. Carbon markets. |
SAC Consulting, ADAS, Land Agents. Forest Carbon. Scottish Agronomy. Smaller independent consultancies (e.g., 5 AGM, ScotFWAG). Vets. Accountants. Contractors. Ringlink Scotland. |
|
Private, tied |
Input suppliers and marts (credit lines). Downstream buyers (credit lines, grants). |
Feed/Fertiliser/Seed/Machinery suppliers. Banks. Downstream supply-chain. |
|
Public, national |
Ag and forestry support/grants. Research grants. Peatland Action grants. |
Scottish Government. SEPA. Forestry & Land Scotland. FAS. Scottish Land Fund. |
|
Public, local |
RPID Area Offices; RLUPs; National Parks. | |
|
Research body |
Grants. |
SRUC, JHI, Mordun, Universities EPI-Agri |
|
NGO |
Woodland Trust grants. |
RSPB, Wildlife Trusts, Soil Association. Lantra. |
|
Land manager organization, formal |
QMS. AHDB. SAOS. Confor. RICS. STFA. NFUS. SLE. SCF. NBA. NSA. DMG. Monitor Farms. | |
|
Land manager organization, informal |
Peer-to-peer. Innovative Farmers. Pasture for Life. Nature Friendly Farming Network. | |
|
Neighbours/personal network |
Business partners. |
Neighbours. Business partners. |
|
Family |
Friends and family. Non-farming income. |
Inter-generational. |
|
Generic business support |
Loans. |
Enterprise Networks, Business Gateway. Local Authorities. Banks |
Land manager experiences of support systems
As part of this research project, we attempted to identify and map all existing and relevant land use information systems, support services and the current incentives for land use transformation directly related to achieving Net Zero and/or nature restoration. An outline of all the support schemes identified can be found in Appendix A. We then collected additional information on a sub-set of current support systems administered by the Scottish Government, to explore specific touch points for land managers. To frame this exercise, we firstly mapped the main agencies within the Scottish government that are responsible for the relevant land manager support systems (Figure 3).
Figure 3 underlines that multiple agencies are responsible for providing and administrating support to land managers in Scotland. This has the effect of increasing administrative burdens for land managers if systems across agencies are not in sync in terms of data collection and system operation.
Figure 3 – Agencies responsible for land manager support in Scottish Government
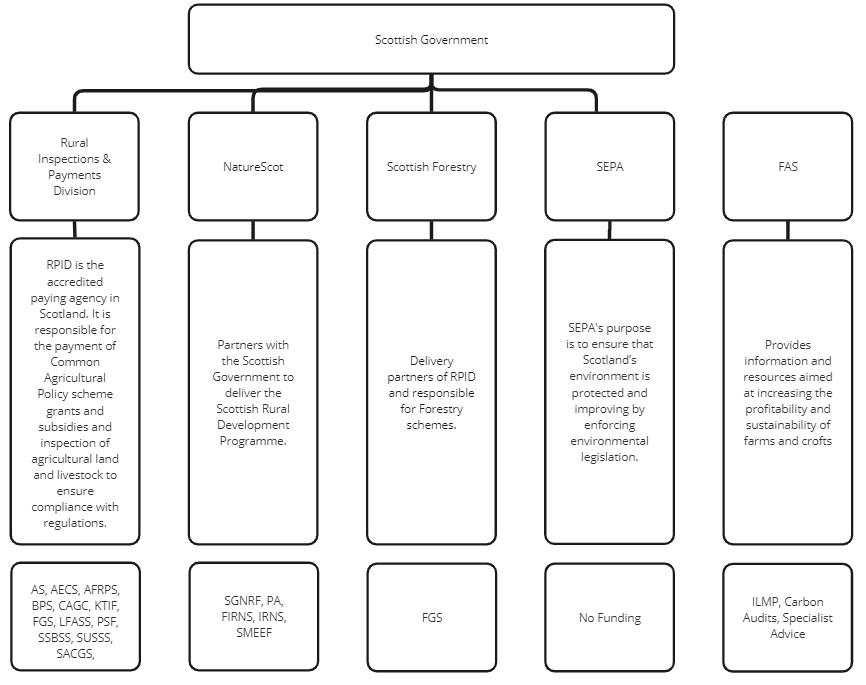
Insights from the literature
We can gain significant insight from published grey literature about where, when, and how land managers interact with support systems and services. There are three highly relevant published pieces of work. The first is the RPID customer satisfaction survey (RPID, 2021), where RPID customers gave their views on the application process and how it could be improved. 2147 customers filled in this survey, providing a robust sample size to gather insights from. The second piece of work is the NatureScot Research Report 1254 (NatureScot, 2021), where biodiversity outcomes were evaluated. This included a quick survey of applicants’ views on the application process. The third piece of work is ‘Doing Better Initiative to Reduce Red Tape for Farmers & Rural Land Managers’ (SRUC, 2014) where regulations (or their implementation) that impinge on business decisions were identified and solutions were put forward to address these.
Administrative burdens
The general literature review (reported in Section 7) and Stakeholder views (reported in Section 5) revealed that the administrative burden and ‘form anxiety’ associated with support schemes can significantly affect land manager engagement with support systems.
We can relate this to the RPID survey responses, in particular the question ‘Applications made to other schemes in the last twelve months’. Interestingly, 77% of RPID customers stated that they did not make another application to another non-SAF (Outside BPS, LFASS, AECS, FGS) scheme in the last 12 months.
Groups who had not made another scheme application are compared below:
- More owners (80%) than tenants (74%) and business partners (70%);
- More other businesses (84%) and farms (79%) than crofts (73%);
- More older (84%) than younger (66%) customers; and
- More customers that completed their SAF with support (81%) than those that completed it on their own (74%).
This would suggest that for the majority of RPID customers, the main support systems they are engaging with fall within the bracket of the SAF administrative process. It appears that many land managers are only engaging with SAF and not applying for schemes outwith this (e.g. AECS, Peatland Action etc.). Although it is difficult to draw conclusions from this question alone, the supporting evidence from this report would suggest that the administrative burdens are a considerable factor in preventing land managers from engaging with other support systems outside their SAF application.
For instance, the RPID survey found that a substantial number of RPID customers felt that application processes were too complicated, or the application forms were too long or complicated. When asked what customers’ main reasons for dissatisfaction with information from RPID, the main two reasons given were:
- The application process is too complicated (53%)
- Application forms are too long/complicated (52%)
Furthermore, in the 2013 RPID customer satisfaction survey, the most common reason for dissatisfaction with information from RPID was ‘not enough information being available’ (29%). This suggests that the administrative burden involved with applying for rural funding schemes has become a more significant influence on farmer decisions in the period between 2013-2021.
The challenges of administrative burdens are further reinforced when customers were asked about the ‘aspects of RPID’s performance customers would like to see improved’ where the most popular answer was ‘application forms are easy to complete’ (42%). One respondent was quoted:
“Website and all forms etc. need to be rewritten and simplified. They need to be clear and concise and user friendly. Use words not acronyms. Use far fewer words.”
We find further evidence to support this in SRUC (2014) where a list of recommendations is provided to the Scottish Government on how to reduce red tape burdens placed on farmers and land managers. Recommendation 5 states that an IT system should be developed that reduces the form filling burden for farmers and land managers – reducing administration costs. This recommendation also suggests that a full review of data requests from farmers and land managers is undertaken to ensure that duplication is minimised.
Despite this point being raised in 2014, the findings from the RPID survey suggest that from 2013 to 2021 administrative burdens on land managers applying for government support schemes have increased.
Support required to access funding
There is also substantial evidence that suggests that many land managers in Scotland require support to submit applications to financial support systems. Evidence for this is provided by the RPID survey, where the following three points were cited as the reasons why customers needed some support with their Single Application Form submission:
- Personal (e.g., first time completing form, learning disability) – 43%
- Mistakes (e.g., want to avoid mistakes) – 41%
- Forms (e.g., difficulty accessing forms, take too long to complete) – 34%
This would suggest that many land managers find the current administrative processes involved with submitting applications to support systems a significant barrier to engagement and require support to ensure that they can access these. The response to this question suggests that the current complexity is leading landowners to obtain procedural support to complete their applications.
Of those that are using procedural support to complete applications, SRUC agents are the most common support agents being used (48% of cases). Interestingly, other business (not farmers) used commercial agents to support applications 51% of the time.
Land manager support system mapping
This section presents three infographics (drawn from RPID survey data and our findings from the previous sections of this study) representing the typical land manager pathways to access agricultural support systems in Scotland. Each infographic is broken down into four main sections (from left to right). The first section, motivations, highlights the broad overarching motivations that a land manager is looking to achieve within their business objectives. This includes motivations such as ‘business support’ and ‘woodland establishment’. The following section highlights the agency touchpoints that a land manager will engage with if they decide to follow one or multiple of the previous motivations. This includes both the agency (such as RPID) and the specific scheme that relates to that motivation (such as the Forestry Grant Scheme for Woodland establishment). The third section shows the administrative actions that are associated with engaging with each different support scheme, including information such as what IT system is used (e.g. RPID portal) and if support is generally needed by a third party. The final section details what kind of login credentials are needed for each administrative action and if these are shared or unique for each scheme.
Figure 4 represents all the pathways open to land managers, providing an overview of the support system landscape. Figure 5 highlights the pathways that a typical farming land manager could take. Figure 6 highlights the pathway that a non-farming land manager, such as an estate, could take. The following sub-sections draw out some of the key findings and help understand where, when and how land managers interact with support systems and services.
Figure 4 – land manager support system map
This figure presents an overview of all the motivations, touchpoints and administrative actions that a land manager could undertake if they were to take certain pathways. Key points from this infographic include:
- It appears that land managers only need to have one login credential to access all support services via RPID (Rural Payments and Inspections Division) in Scotland. This is the RPID portal login, where land managers can access the SAF, AECS application, SSBSS & SUSSS form and FGS application. For those schemes not under the umbrella of the RPID portal (Peatland Action), online submissions are required that do not require login credentials (FAS applications still require RPID Business Reference Number however). This would suggest that login credentials do not pose a significant barrier to land manager engagement with support systems.
- Regarding touch points, RPID is the agency that land managers are most likely to be engaging with for funding. This is because the most popular support schemes (BPS, LFASS, AECS etc.) are administrated through this agency. Other support schemes that are not administrated by RPID, such as the Forestry Grant Scheme, are still accessed through the RPID portal. FAS and Peatland Action support schemes are accessed outwith the RPID portal, but require relatively simple administrative inputs to complete.
- Overall, the RPID public sector support system network is administratively logical from a high-level perspective. The majority of schemes are accessed through the RPID portal, and those that are not are procedurally straightforward in terms of required steps. However, the level of detailed information needed by certain schemes makes accessing a wide range of these extremely challenging for some land managers in Scotland (recalling from section 5 that land managers differ widely with respect to skills and confidence to tackle administrative processes and implement management changes). For example, AECS applications are considered very complex due to the level of information that needs to be provided along with the lengthy application form/process. Furthermore, Forestry Grant Scheme applications require a level of detail that is beyond most typical land managers’ (farmers etc.) knowledge, leading to a reliance on external specialists to complete applications.
- On the whole, this would suggest that the complexities in land manager support systems, including the level of detail needed for specific applications are reducing engagement with systems that could encourage improved environmental management practices. This does not take into account private schemes, such as the Woodland Carbon Code, which would only add to this complexity.
- All other things being equal, administrative simplicity is preferable to complexity and (for applicants) greater flexibility is preferred. Hence efforts to, for example, streamline application and monitoring processes, reduce information burdens, widen application windows and vary contract lengths, are justifiable. However, accountability for public expenditure requires a degree of bureaucracy to ensure that funds are disbursed and used as intended, and simplicity and flexibility for applicants may impose additional complexity for administrators. Consequently, there are trade-offs, and the scope for improvements in process design alone will typically be limited.
- This implies that other steps need to be taken to improve accessibility, including the provision of additional procedural information and advice – which necessarily incurs additional public administrative costs, raising familiar questions regarding the appropriate degree of such assistance and whether it should be universal or targeted at specific groups.
- Moreover, administrative touch-points and contractual constraints are only one influence on land manager behaviour, implying that improved accessibility and flexibility will not by itself increase overall engagement with land use change. Other measures will also be needed. For example, attractive payment rates, sufficient technical advice and training, and support for capital investments.
Figure 5 – farmer decision pathway map
This figure presents an indicative pathway through the support systems that would be taken by a land manager (farmer) who does not have any specific environmental goals (woodland establishment, peatland restoration) but would like to improve the efficiency of their operation and reduce their overall impact on the environment. It is important to stress that this pathway is indicative, and it is not intended to represent all farmers in all locations. In reality, as explained in the literature review in section 7 later, all land managers will have a unique set of motivations, barriers and opportunities regarding land management practices that will affect their engagement with support systems. The findings from this infographic are summarised below:
- The majority of farming land managers will be engaging with support systems that are accessed through the SAF process (BPS etc.) as these are familiar and provide a high level of financial support for a relatively small administrative and practical input.
- Land managers of this type could also be engaging with AECS. This provides the land manager with an opportunity to improve the economic performance of their operations, whilst also benefitting the environment. Land managers will often choose options that require the smallest practical/administrative inputs compared to financial returns. Many land managers will require support from a third party to complete their AECS application due to the complexity of information required.
- Many land managers of this type will rely on FAS and other agents, along with informal networks, to provide procedural support to their applications to support systems. This is because farming land managers are often time-poor due to their focus on practical activities on farm, relying on others to assist with the administrative processes of applying to support schemes.
Figure 6 – Non-farmer decision pathway map
This figure presents an indicative pathway through the support systems that would be taken by a land manager (non-farming) who is looking to diversify the use of their land, improving economic and environmental performance simultaneously. Again, it is important to stress that this pathway is indicative, and it is not intended to represent all non-farming land managers in all locations. In reality, as explained in the literature review, all land managers will have a unique set of motivations, barriers and opportunities regarding land management practices that will affect their engagement with support systems. The findings from this infographic are presented below:
- Non-farming land managers are much more likely to engage with a wider range of support systems outwith those administered by RPID. This may be due to a mixture of different beliefs, fewer/different constraints on time and resources and more desire to diversify income streams to ensure financial resilience.
- These land managers still often rely on external specialists to assist with certain elements of the application process, such as external forestry consults when applying for the Forest Grant Scheme.
 Figure 4. Land manager support system map
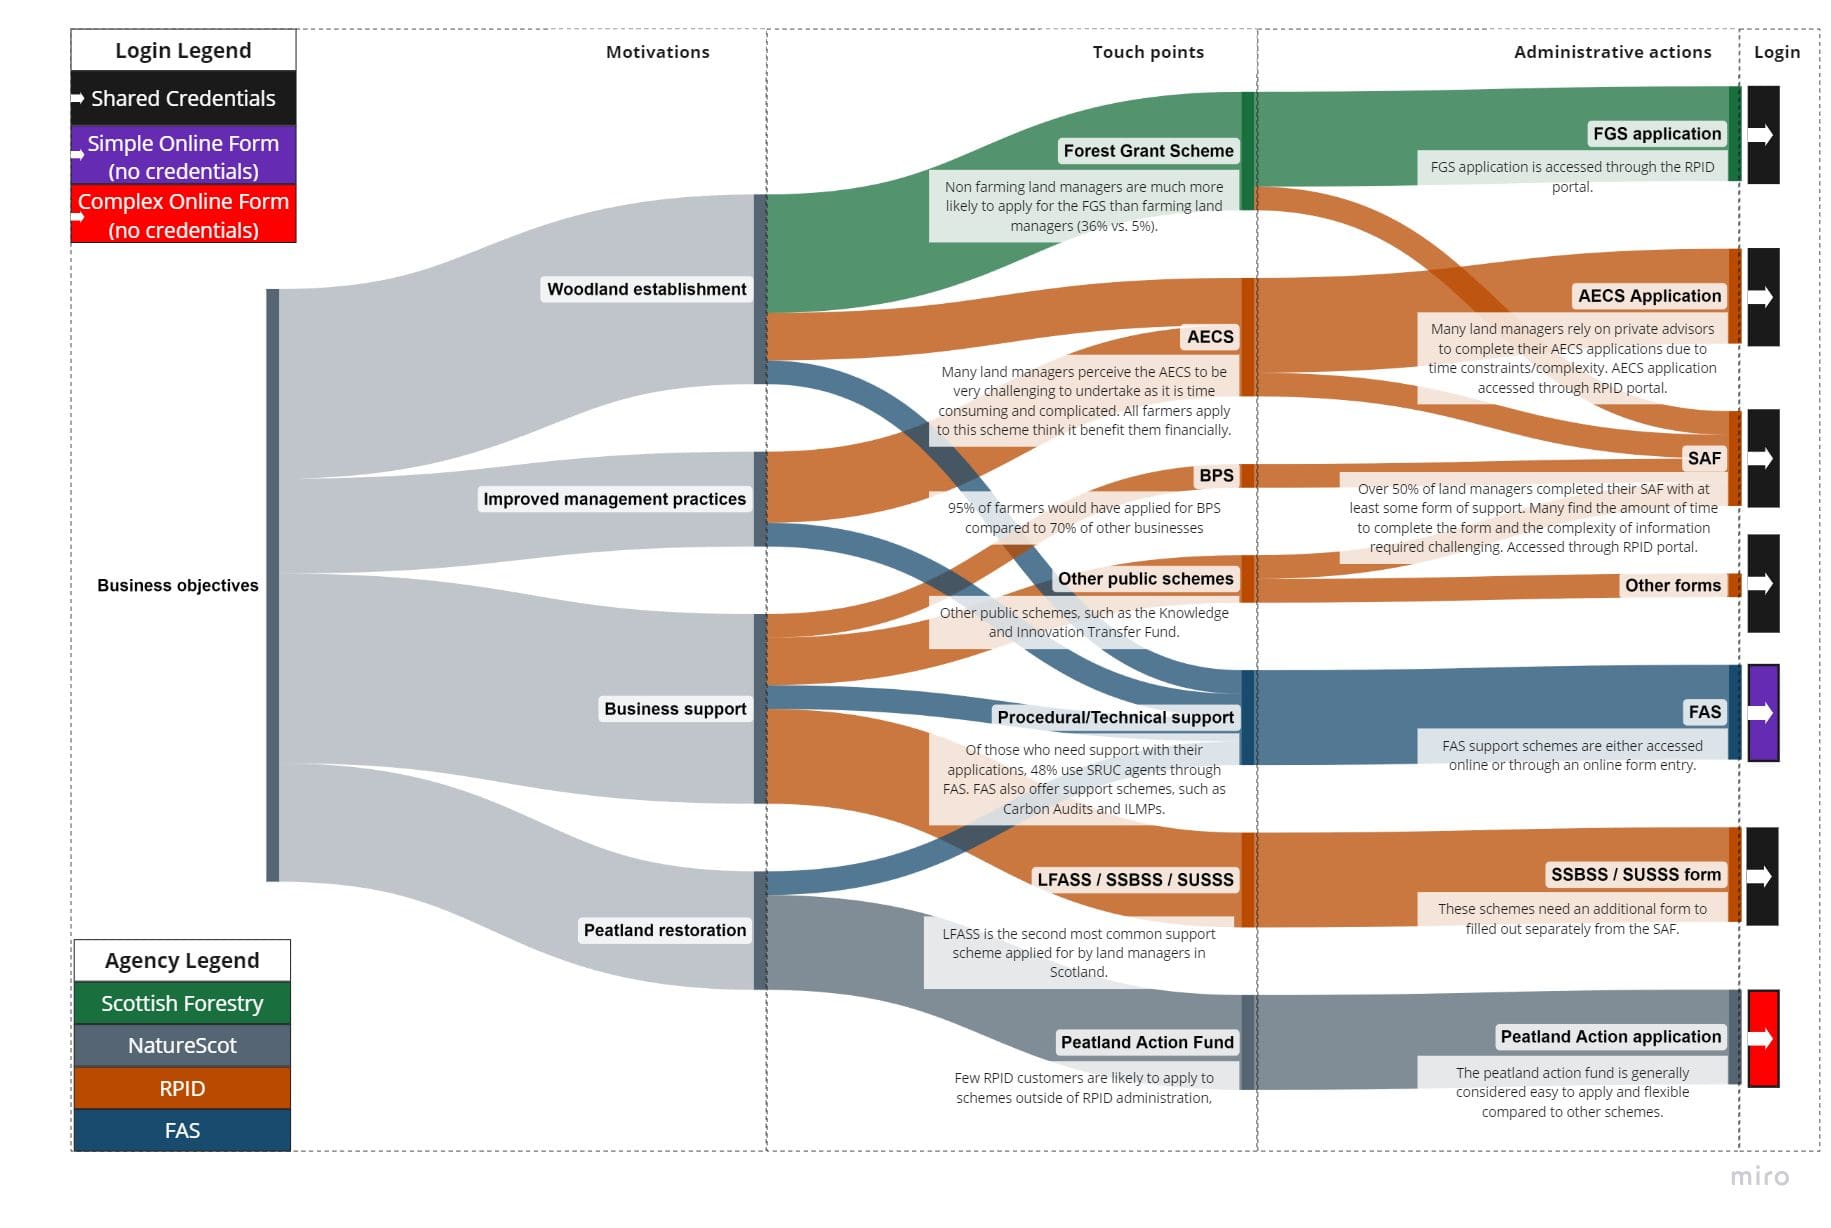 Figure 4. Land manager support system map
Figure 5 – farmer decision pathway map (N.B. this is indicative and not intended to represent all farmers in all locations.)
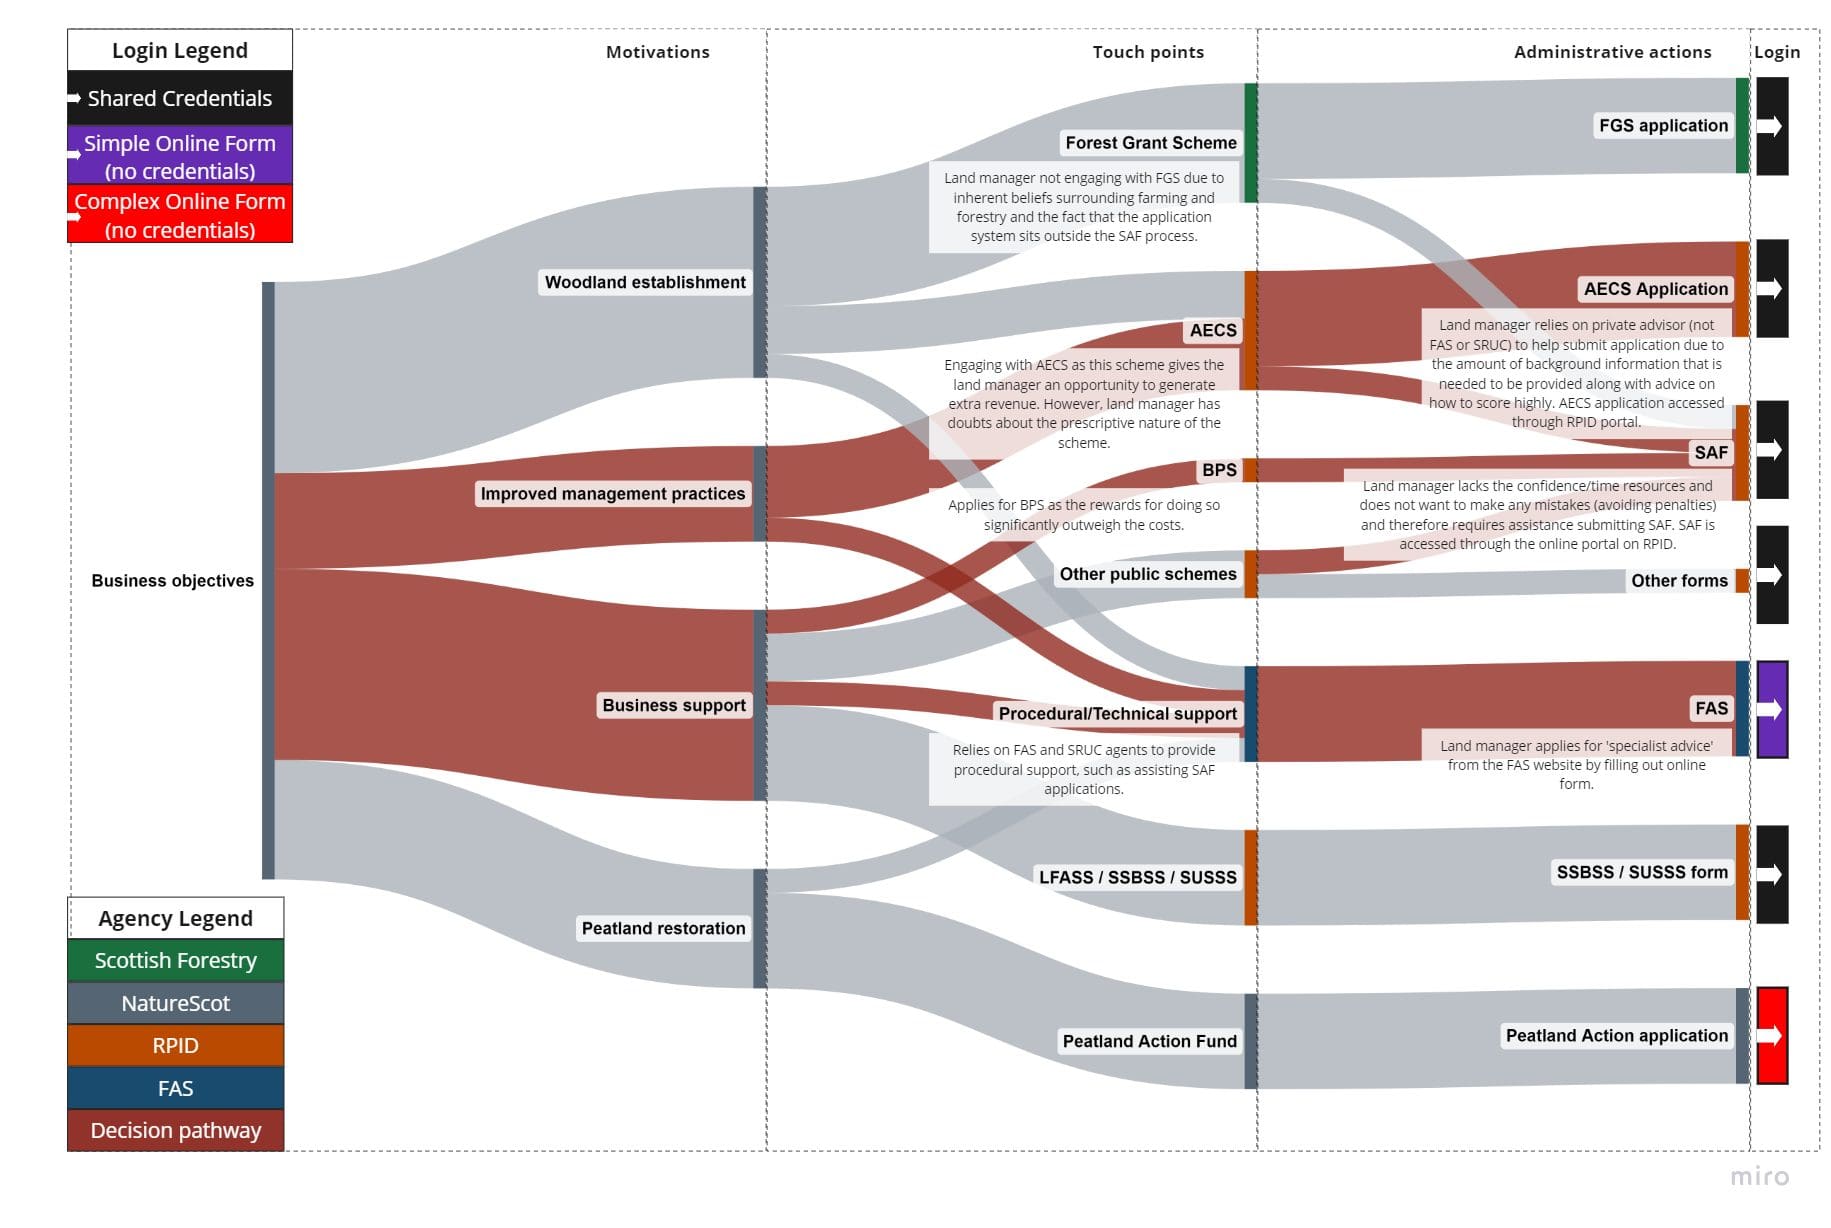 Figure 5 – farmer decision pathway map (N.B. this is indicative and not intended to represent all farmers in all locations.)
Figure 6 – Non-farmer decision pathway map (N.B. this is indicative and not intended to represent all non-farming land managers in all locations.
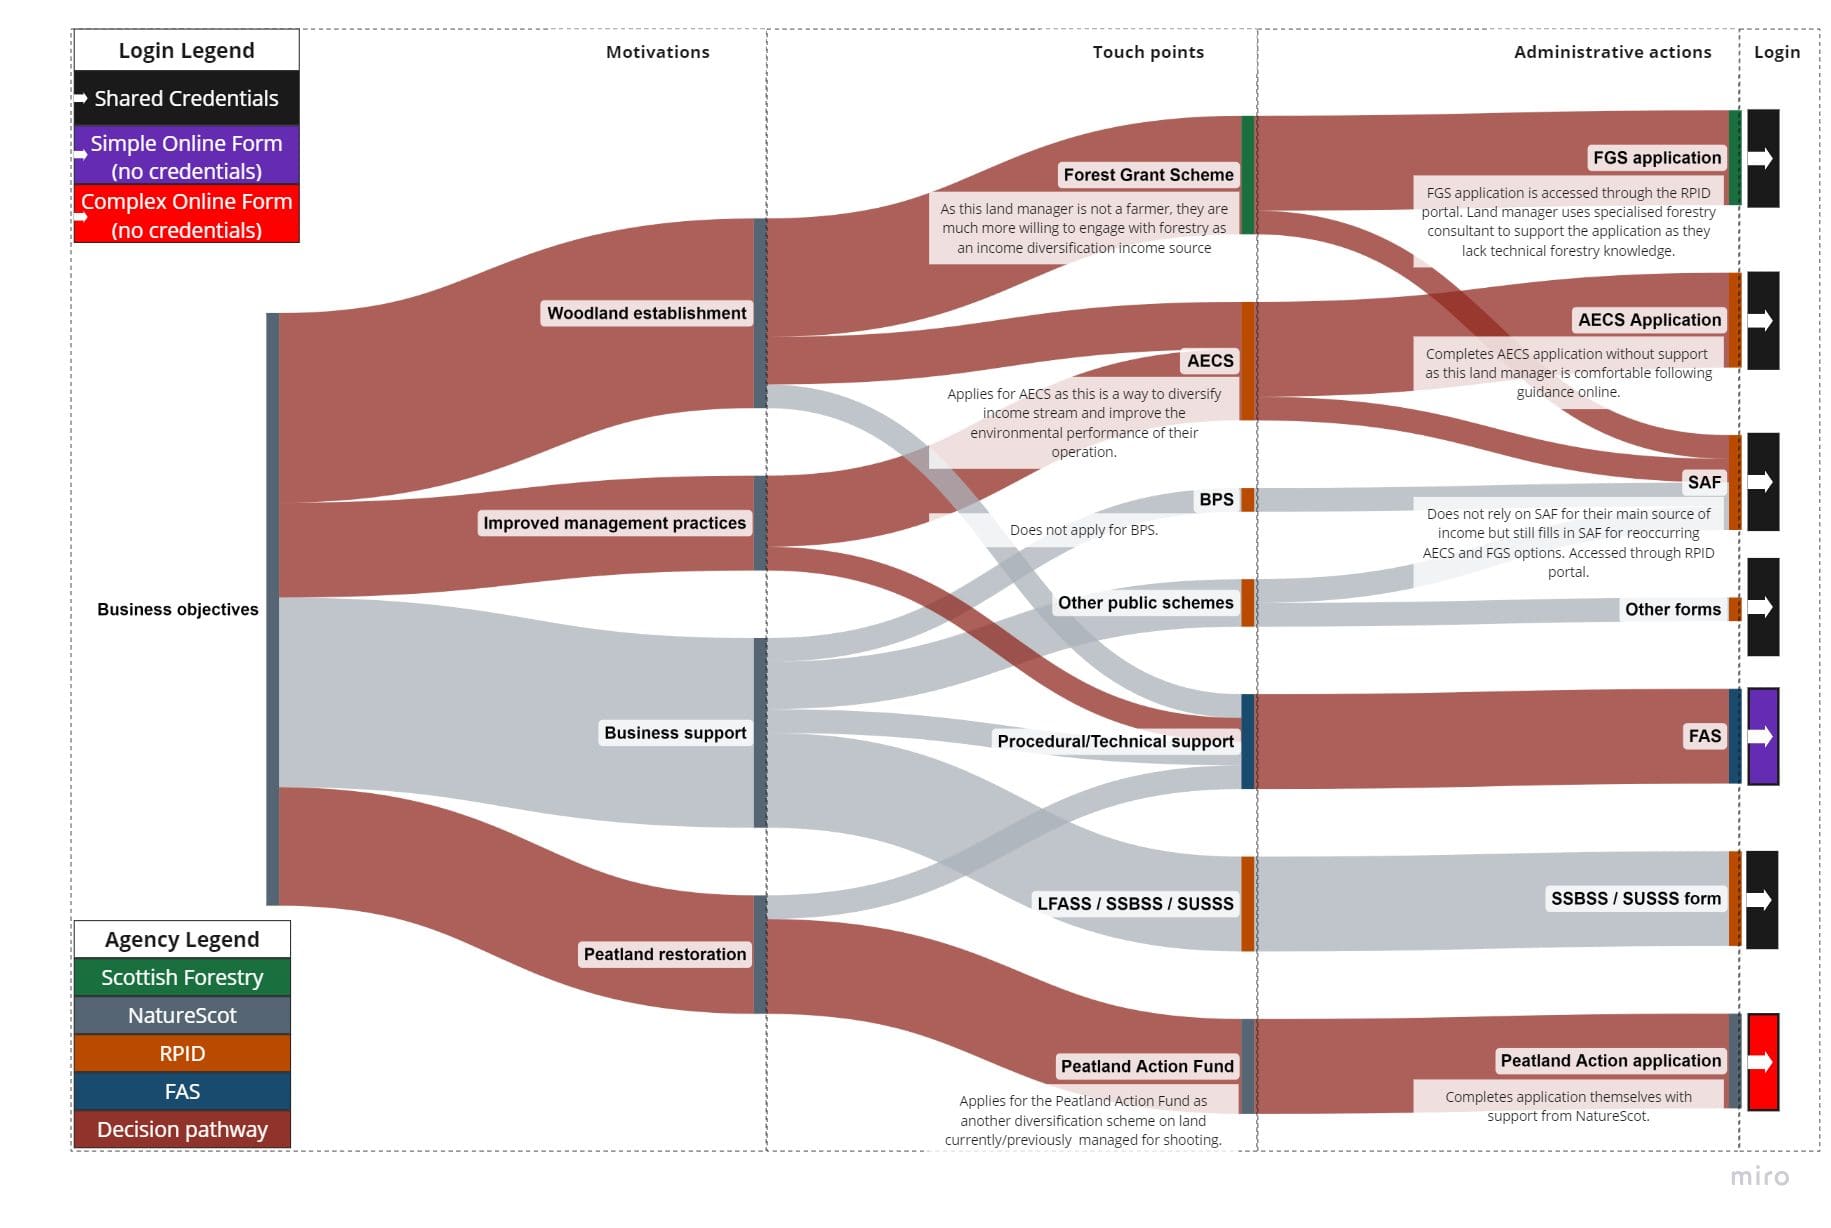
Land manager attitudes – a review of the literature
Factors affecting engagement with support schemes
The literature review highlighted that internal factors such as attitudes, beliefs and personal values can have a significant impact on engagement with support systems.
Values and knowledge
It was recognised as far back as the 1970’s (Gasson 1973) that farmers do not always make financially rational decisions and that a range of social and intrinsic factors may also be prioritised; risk perception, values and knowledge are particularly influential in business decision making.
Land managers, in particular farmers, generally have a strong sense of self and are often influenced by their intrinsic values. This theme can be explored when looking at land manager attitudes towards planting trees on their land. Historic literature suggests that land managers have a resistance to creating woodland and forests, due to traditional values surrounding the belief that measurable productivity and growth are their traditional core purpose. Burton et al. (2008) explores the importance of the ‘good farmer’ identity, where social status and personal validation is derived by the evidence of delivering a skilled role on landscapes, i.e. livestock farming. Burton (2004) concludes that planting woodland and forest (afforestation), as well as engagement with other non-farming activities, represents both a loss in productive output and a symbolic loss of the opportunity to demonstrate farming skill and knowledge.
Farmers often resist afforestation on this basis, with agriculture and forestry historically being viewed as competitors for land rather than complementary land management practices that could be adopted as a sustainable approach to single proprietary unit diversification (Nicholls, 1969; Hopkins et al. 2017). Therefore, as many farmers perceive themselves to be farmers only, they are unwilling to change their practices due to inherent values that are tied to their current activity. This trend is likely to be seen across most landowners, not just restricted to afforestation, who will possess their own objectives, values and knowledge. For example, Moxey et al. (2021) note that the willingness to participate in peatland restoration schemes is highly variable, and that cultural ties shape attitudes towards restoration activities.
On the other hand, some land managers have intrinsic values that prioritise attempting to balance the need for a productive enterprise and protecting/enhancing the environment. Mills et al., (2017) found that it was common to hear that farmers were attempting to find a balance between production and environmental management, which were not always seen as conflicting needs.
This is reflected by the well documented finding that farmers (and land managers as a whole) are often willing to adopt environmental measures if they are perceived to increase the efficiency of on farm activities and therefore prove cost effective (Feliciano et al. 2014). For example, Farsted et al. (2022) noted that climate mitigation measures are mainly perceived as, treated as, and appreciated for offering farm-beneficial functions other than climate change mitigation by Norwegian farmers. This is also reflected in the Farm Practices Survey (2022) where 44% of farmers thought that reducing emissions would improve farm profitability and that the main motivation for farmers to take action to reduce GHGs on farm was that it was considered good business practice (84%).
Unsurprisingly, those land managers that are personally concerned/motivated to address climate change are more likely to be undertaking environmental management measures on their land. Those who are less engaged are likewise less likely to be undertaking environmental management practices.
Ease of transition, control and risk perception
An important aspect of land manager engagement with support systems is the perceived degree of control afforded by the available schemes and the ease of operational transition.
Academic literature in this area has focused on exploring the barriers that prevent uptake of Agri-Environment Schemes (AES), specifically focusing on schemes that restrict land manager’s ability to control and own the final product that is being delivered. For example, Lampkin et al. (2021) suggest that a top-down prescriptive approach of some AESs has failed to engage farmers in a way that would give them ownership of the delivery of environmental goods. This view is supported by Daxini et al. (2019) who found that the intention to follow a Nutrient Management Plan is primarily driven by perceived behavioural control.
Thompson et al. (2021) further suggest that farmers are more likely to participate in AESs if they retain some control over implementation, which requires flexible terms and regular monitoring. Therefore, it appears an important element of how land managers engage with current support systems involves analysing the degree to which each support system will affect operational control.
Another key internal factor that will influence land manager engagement with support systems is risk perception. Multiple sources suggest that the clarity and certainty of the final objective of any support scheme is important to its uptake and success. Analysis from the James Hutton Institute (Rajagopalan and Kuhfuss, 2017) suggested that the uptake of the Agri-Environment Climate Scheme (AECS) was restricted by the lack of flexibility in options, along with the uncertainty on the environmental outcome due to the influence of external factors outside of the land managers’ control (climate, pests etc.)
Kuhfuss et al. (2018) also suggest the success of AES may vary depending on the clarity of the objectives and perceived challenges in achieving them. For example, afforestation is a relatively easy concept to understand and is generally low risk, however peatland restoration is much more difficult conceptually and is seen as a higher risk option. Indeed, peatland restoration may seem to be of high risk because UK peatlands are at the southern limit in the northern hemisphere and therefore at risk due to anticipated climatic changes.
The tolerance of land manager to the inherent risks that are involved with engaging with support schemes that require alterations in management practices is an important factor in determining uptake.
Socio-demographic, age and education
The traditional view within the literature is that older land managers are less willing to change land management practices and that younger and more educated farmers are more willing to adopt new practices and engage with environmental support schemes. Sutherland et al. 2016; Mills et al. 2016; Brown, 2019)
This is often supported by evidence that younger people have a higher degree of environmental concern, risk tolerance and openness to new practices (Dessart et al. 2019). Therefore, younger land managers may be more able to engage with support systems and understand the requirements and trade-offs involved. Benni et al. (2022) reported that the age and education of farmers was not found to affect time requirements to fill in administrative burdens. This suggests that the transaction costs associated with support systems does not interplay with age and education levels of applicants.
When analysing the factors behind farmers’ adoption of ecological practices, Thompson et al. (2023) found that socio-economic factors were insignificant more often than they were significant. Despite these findings, Tyllianakis and Martin-Ortega (2021) argue that the evidence base suggests that wealthier land managers stand to gain more than less wealthy land managers in enrolling in AESs. The impact of socio-economic and demographic factors on land manager engagement is therefore likely to vary considerably across different sectors and organisational structures.
Engagement and trust of official advice vs. informal networks
Due to the rise of information available (mainly through the expansion of digital services), answers can be found to many real-world and agricultural issues and questions online. Rust et al. (2021) suggest that farmers have previously often relied on in-person advice from traditional ‘experts’, such as agricultural advisors, to inform farm management practices. Sutherland et al. (2013) stress the importance of the perceived credibility of sources of advice. This view is supported by Daxini et al. (2019) who found that trust in technical sources of information (e.g. advisor and discussion group) is found to be a more influential determinant of farmers’ attitude, subjective norm and perceived behavioural control than trust in social information sources (e.g. family and the media).
Nonetheless, Birner et al. (2006) and Sutherland et al. (2022, 2023) highlight the breadth of sources of information, advice and training utilised by land managers, encompassing family and friends, peer groups, accountants, vets, input suppliers, private consultants, NGOs and public sector bodies, accessed in different modes including via print and social media, online, one-to-one meetings, group meetings and events/demonstrations.
This is discussed further by Rust et al. (2021), who suggest that farmers are now changing their information sources due to the rise of online sources of knowledge and advice, foregoing traditional ‘expert’ advice in preference for peer-generated information. They found that farmers regularly use online sources to access soil information and often changed practices based on information from social media. Results from their survey suggested that farmers placed more trust in other farmers and peer networks rather than traditional ‘experts’, particularly those from academic and government institutions, who they believed were not empathetic with the farmers’ needs.
This could be further compounded by many farmers deciding not to engage with advisory services at all. Dunne et al. (2019) found that almost one-third of farmers in Ireland were not using extension services and a further third had contracts with private sector and public sector advisors.
Research from the James Hutton Institute (Hopkins et al. 2020) also found that new entrants to farming are less likely to engage with subsidies and support systems than existing farmers in the sector. In particular, new entrants did not think that the ‘official’ Farm Advisory Service (FAS) and the Scottish Government were helpful when starting their enterprise. This finding is mirrored by Labarthe et al. (2022), who suggest that new entrants to agriculture are often disconnected from knowledge structures, as they often operate businesses that are not typically addressed by advisory services. Other ‘hard to reach’ or less engaged groups can include women farmers and those suffering from poor mental health (Hurley et al. 2022).
Understanding how land managers engage with knowledge networks and their trust of these networks is an important factor in determining their experience of support systems. By improving farmers’ awareness, it is expected that changes in behaviour would be reflected in the adoption of improved management practices. However, Okumah et al. (2021) argue that the limited research in this area so far has shown that the link between awareness and adoption exists. This link is indirect and is mediated and moderated by other factors. Nevertheless, on balance, it seems that hypothetically, with all factors being equal, more awareness is better than less awareness.
Summary
The willingness of land managers to engage with forms of support for changing management practices and land use patterns is influenced by a number of internal factors. These include the compatibility of change with land managers’ self-identify of what it means to be a land manager, particularly a farmer – something that is ingrained and often inter-generational, making it difficult to alter in the short-term. Similarly, inflexible management prescriptions are at odds with cherished decision-making autonomy and change can be perceived as incurring higher than acceptable levels of risk, although attitudes can be softened if prescriptions align with personal or business objectives.
Weak confidence and understanding regarding the purpose and practicalities of change reinforce business-as-usual, with a lack of trust in the credibility and relevance of available sources of information, advice and training further constraining engagement. Such internal factors vary across individual land managers, but there is some evidence that greater openness to change may be associated with (younger) age and (greater) education but also that some groups, including women, new entrants with no prior experience and people suffering from poor mental health, may be further disconnected from support systems.
External factors influencing land manager engagement with support schemes
Alongside the internal factors identified above, there are significant external factors that influence land manager behaviours, including the physical, environmental, business structure, financial, knowledge availability, social norms and time factors on land management.
Funding, costs and policy indicators
As with any business operation, the need to generate revenue to ensure the survival of the business is a high priority for any land manager. The majority of land managers, especially tenants, seek to make a profit from their land. Therefore, financial considerations are paramount to the landowners’ decision-making process, underlining the importance of support schemes and their potential to influence change.
Previous research has indicated that given the unpredictability of agricultural and land-based activities, only when economic conditions were stable could land managers focus on other activities – including environmental considerations (Scottish Government, 2012). Measures that do not guarantee financial benefits – e.g., that may have a negative impact on production or come at a cost to the farmer – are unlikely to be adopted in the absence of other tangible benefits.
In the latest Farm Practices Survey (2022), 32% of farmers who were already taking actions to reduce GHG emissions stated that environmental measures were too expensive to implement. This may explain why Ruto and Garrod (2009) found payment rates to be a key driver and Pineiro et al. (2021) conclude that interventions that lead to short term financial benefits have higher adoption rates than those that concentrate on delivering ecological service provision. This view is supported by Mills et al. (2016) who state that current financial incentives and regulatory approaches have had a degree of success in encouraging environmental practices, but these are ultimately transient drivers that have not led to long-term sustainability.
Within this, policy uncertainty may further hinder the uptake of environmental land management practices. Kuhfuss et al. (2018) describe these uncertainties as:
- differences in sources in funding (public vs private)
- eligibility rules
- financial uncertainty of prices in the carbon markets and
- potential emerging markets that may provide better results.
This is further compounded by whether a payment by results or an activity model is used. Moxey at al. (2021) reinforce this point by suggesting that peatland restoration work is hindered by the perceived ineligibility for agricultural support payments, tax breaks and concerns over future support arrangement and carbon market fluctuations.
Bio-physical constraints, tenure and structure
Environmental constraints often limit which environmental measures can be implemented on a spatial scale. Location, climate and environmental quality are key determinants of which support schemes are viable for a land manager’s piece of land as they affect what is implementable practically in local conditions in relation to opportunities. An example of this is the large amount of peatland and moorland that provides potential for peat bog restoration management practices: in these locations woodland planting should be discouraged (Lampkin et al. 2021). Paulus et al. (2022) provide further evidence to support this point by suggesting that environmental management practices are more likely to be implemented on sites with unfavourable agricultural conditions.
Two more important factors are the size of the enterprise and the tenure of the land. Regarding tenure, a meta-analysis of 46 studies (Baumgart-Getz et al. 2012) looking at the adoption of best-management practices found secure tenure to be a positive indicator of adoption, and the findings are likely to apply to climate friendly measures as well. This suggests that land managers who either own their land or are on secure tenancies with a good relationship with their landlord are more likely to adopt environmental measures due to the long-term security that their tenure status affords them.
Multiple sources within the literature also suggest that larger enterprises may be more willing and able to engage with support systems, particularly those with environmental outcomes (Mills et al. 2013; Paulus et al. 2022). Smaller enterprises are likely to have fewer opportunities to take elements out of production and fewer resources to apply without impacting their net income.
Ease of access to support
A key determinant of engagement with support systems is the perceived and actual accessibility of these schemes.
If a scheme is considered to be straightforward and easy to apply for, there is likely to be high engagement. The opposite is true of a scheme that is considered complex and time consuming. For example, for land managers the administrative load (transaction costs) and time commitment is often the determining factor on whether to participate or not. A common criticism of AESs is that they often carry high transaction costs, especially in comparison to more traditional support schemes (Kuhfuss et al. 2018).
Lampkin et al. (2021) suggest that schemes have become increasingly complex, partially in response to regulatory, audit and compliance issues. The administrative burden can also vary across enterprise type, with Benni et al. (2022) finding that dairy producers face substantially higher transaction costs than arable producers. Furthermore, once schemes are in place, the ongoing maintenance requirement for many AES (reporting etc.) can prove a further barrier to uptake (MacKay & Prager, 2021).
The Peatland Code can be used to understand some of the accessibility issues found in the Scottish agricultural sector. Moxey et al. (2021) suggest that the administrative burden associated with applying for joint funding via AESs and via the Peatland Code is perceived as overly complex, with interactions between them further increasing this. The study notes that the issue of interacting schemes occurs when having to demonstrate additionality, aligning funding cycles between different sources and coordinating across multiple land managers and investors.
Novo et al. (2021) also found that challenges in understanding the application process and funding mechanism were a barrier mentioned by interviewees in their study regarding the peatland carbon code.
Therefore, the perceived and actual transaction costs associated with support systems are a barrier to uptake. When looking to address this, Westway et al. (2023) caution that simplicity is important to encourage uptake, however oversimplification of schemes can lead to unintended consequences and needs to be balanced against public accountability for expenditure.
Knowledge availability, sharing and awareness
Engagement with support schemes and uptake of specific on farm measures is frequently linked with the knowledge and understanding of the individual land manager (Toma et al. 2018).
A lack of knowledge and understanding has been frequently cited as a key barrier to new management practices. This is further enhanced when new technological and informational processes are needed for alternative practices and if the costs/benefits are not clear or easy to judge. This finding is supported by results from the Farm Practitioner Survey (2022), where the most reported reason for not taking action was being unsure on what to do due to too many conflicting views (44%). These informational barriers are important as 30% responded that a lack of information was another key reason for not taking action.
This sentiment is echoed by two specific examples in Scotland. Firstly, Moxey et al. (2021) found that the awareness of the need for and benefits of peatland restoration is generally not well known amongst land managers, along with the voluntary market of the Peatland Code. Secondly, Lozada & Karley (2022) suggest that more evidence and greater awareness are needed amongst land managers about the financial and social outcomes of agroecological practices to facilitate uptake.
There is also evidence that land managers have a difference in ability to adopt new practices due to a variance in resources. Larger scale land management operations may have more resources and the ability to bring in consultants and agents for any new opportunities and land management practices. This is in comparison to smaller scale land managers who may not be able to approach new opportunities in the same manner due to (e.g.) a lack of time and cash plus higher overhead and transaction costs and less scope to cope with risk.
As an example, it has been suggested that small scale agroecological farmers might disproportionately suffer from a lack of access to incentives, despite delivering to environmental policy targets, or see incentive schemes as contrary to their farming ethos (Lozada & Karley 2022). This involves access to specialist advisors, where more profitable enterprises will be able to access specific advice on a more frequent basis compared to less profitable enterprises.
Social norms
As seen in section 4.2 above, farmers do not always make rational economic decisions and are influenced by societal goals and norms (Mills et al. 2017), the influence of a land manager’s peer group is likely to determine the extent to which they engage with specific support systems and management practices. This is observed in multiple studies (Kuhfuss et al. 2016: Cullen et al. 2020; Cusworth, 2020) where peer behaviour has been deemed to influence land manager uptake of environmental practices to a varying degree through framing of what it means to be a ‘good farmer’.
Howley et al. (2021) suggest that social norms can be harnessed to encourage pro-environmental behaviours in land managers. The researchers found that providing farmers with an opportunity to demonstrate their “green credentials” to their peer group can encourage conservation practices.
Summary
The ability of land managers to engage with changing management practices and land use patterns is influenced by a number of external factors. At a practical level, biophysical characteristics, and the area of land available will determine the suitability of alternative practices and land uses, but also the scope for experimentation and risk management. Equally, tenancy restrictions may impose legal constraints on freedom to change.
As businesses, the financial consequences of making changes matters. Funding needs to cover actual cash costs but also opportunity costs (time, income forgone) and transaction costs. The latter arise from application and reporting processes, both for funding and/or non-funding support, and can be disproportionately burdensome for smaller land managers. Separately, access to support can vary in terms of eligibility but also the availability of information, advice and training. Importantly, internal factors such as social norms and peer group pressure strongly influence land managers’ self-identity. This affects their perception of whether different management practices and land use patterns are compatible with their own values.
Discussion guide
The findings from the literature review suggested that we should focus on three main themes when we were drilling into the details with key stakeholders:
- identify the main determinants of ability and willingness to change land use and land management practices, to give us a clearer understanding of the key factors that influence land manager decision making, including their motivations, what they want to achieve for their business or organisation, and their appetite to change.
- focus on the existing support systems that land managers are engaging with and their experiences of doing so. This allowed us to identify and map all existing and relevant land use information systems, support services and the current incentives for land use transformation directly related to achieving Net Zero and/or nature restoration and understand some of the key barriers/opportunities regarding land manager engagement with these systems.
- explore how land managers are accessing these support systems, which allowed us to explore where, when and how the land managers interact with the systems and services.
The interview methodology and more detail on the interview questions can be found in Appendix C, and the findings are summarised above in section 5.
SWOT & PESTLE analysis
This section provides the details of a SWOT and PESTLE analysis on the current land manager support systems in Scotland and were informed by the literature review and stakeholder engagement exercises.
8.1 SWOT analysis
|
Strengths |
Weaknesses |
|
|
|
Opportunities |
|
|
|
8.2 PESTLE analysis
|
Political |
|
|
Economic |
|
|
Social |
|
|
Technological |
|
|
Legal |
|
|
Environmental |
|
Conclusions
Our research has reinforced existing findings in the literature surrounding land manager behaviour and decision making. Reflecting its relative prominence within public expenditure and land-based businesses in rural areas, agriculture dominates much of published literature on land use support and this was supplemented by stakeholder interviews, including with individuals representing other sectors.
The key message is that land manager engagement with support systems is determined by a range of interacting internal and external factors. These relate to financial, practical and cultural influences on both willingness and ability to engage. This is supported by the following conclusions:
- The administrative systems associated with land use support in Scotland are perceived as logical from a high-level perspective. Most interactions with the system are through the RPID portal, which only requires one set of login credentials to access a wide range of support systems. Those support systems not under this umbrella are easy to access.
- However, the administrative burden associated with applying to these schemes, i.e. form filling, is the main barrier to engagement. Some land managers have more resources available to absorb this administrative burden, such as large estates, investment owners and rewilding estates. If several schemes are appropriate this burden will increase.
- Procedural support (i.e. form filling by an advisor on behalf of a land manager) is widely available from both public (FAS, SAC) and private advisory sources. However, this is distinct from practical support, such as site-specific implementation advice, which was frequently mentioned by stakeholders as key to facilitating the uptake of environmental management practices, and yet less readily available, and can depend on location.
- We found that land managers often decide whether to engage with support and advice based on the credence of its source. For example, farmers are more likely to trust advisers/organisations that have a background in practical farming over those from a consulting/academic background.
- Another key determinant of engagement with support systems was the level of control associated with outcomes/management practices. Stakeholders mentioned that the perceived prescriptive nature of AECS and forestry related grants would prevent land managers from choosing to access these support services.
- Land managers in Scotland primarily access public funding support, with some accessing private finance to supplement their income or achieve specific goals. For those accessing private finance, this is generally done to avoid the conditionality of public funding support and retain operational control over the management of their land.
- A lack of knowledge and understanding has been frequently cited as a key barrier to new management practices. This is further enhanced when new technological and informational processes are needed for alternative practices and if the costs/benefits are not clear or easy to judge.
Going forwards, administrative simplicity is preferable to complexity and (for applicants) greater flexibility is preferred. Therefore, efforts to streamline application and monitoring processes, reduce information burdens, widen application windows and vary contract lengths, are justifiable. However, accountability for public expenditure requires a degree of bureaucracy to ensure that funds are disbursed and used as intended, and simplicity and flexibility for applicants may impose additional complexity for administrators. Consequently, there are trade-offs, and the scope for improvements in process design alone will typically be limited.
As our literature findings highlight, administrative touch points and contractual constraints are only one influence on land manager behaviour. This implies that improved accessibility and flexibility will not by itself increase overall engagement with land use change. Other measures will also be needed such as attractive payment rates, sufficient technical advice, training and management flexibility.
References
Abdul-Salam, Y., Ovando, P., and Roberts, D. (2022) ‘Understanding the economic barriers to the adoption of agroforestry: A Real Options analysis’, Journal of Environmental Management, 302. https://doi.org/10.1016/j.jenvman.2021.113955
Ambrose-Oji, B. (2019) Characterising land managers to support woodland creation efforts in Scotland. Available at: wcscotland_review_of_typologies_and_segmentation_march2019.v2_f96crvh.pdf (forestresearch.gov.uk)
Ashton, L. and Bradshaw, B. (2023) ‘Enabling conditions for scaling natural climate solutions in Canada’s agriculture sector’, Nature-Based Solutions, pp.100071.
Barnes, AP; Thompson, B; Toma, L. (2022) ‘Finding the ecological farmer: a farmer typology to understand ecological practices within Europe’, Current Research in Environmental Sustainability, 4, pp. 100125, https://doi.org/10.1016/j.crsust.2022.100125.
Baumgart-Getz, A., Prokopy, L.S. and Floress, K. (2012) ‘Why farmers adopt best management practice in the United States: A meta-analysis of the adoption literature’ ,Journal of Environmental Management, 96(1), pp.17-25.
Benni, N.E., Ritzel., Heitkamper, K., Umstatter, C., Zorn, A. and Mack, G. (2022) ‘The cost of farmers’ administrative burdens due to cross-compliance obligations’, Journal of Environmental Planning and Management, 65 (5), pp. 930-952.
Birner, R., Davis, K., Pender, J., Nkonya, E., Anandajayasekeram, P., Ekboir, J.M., Mbabu, A.N., Spielman, D.J., Horna, D., Benin, S. and Kisamba-Mugerwa, W. (2006) From” best practice” to” best fit”: a framework for designing and analyzing pluralistic agricultural advisory services (No. 4). International Food Policy Research Institute (IFPRI).
Boufous, S., Hudson, D. and Carpio, C. (2023) ‘Farmers’ willingness to adopt sustainable agricultural practices: A meta-analysis’, PLOS Sustainability and Transformation, 2(1), pp.e0000037.
Bowditch, E. A. D., McMorran, R., and Smith, M. A. (2023) ‘Right connection, right insight engaging private estate managers on woodland expansion issues in times of uncertainty’, Land Use Policy, 124. https://doi.org/10.1016/j.landusepol.2022.106437
Braito, M., Leonhardt, H., Penker, M., Schauppenlehner-Kloyber, E., Thaler, G. and Flint, C.G. (2020) ‘The plurality of farmers’ views on soil management calls for a policy mix’, Land Use Policy, 99, pp.104876.
Broadmeadow, S., Nisbet, T., Palmer, R., Webb, L., Short, C., Chivers, C.A., Hammond, J., Lukac, M., Miller, A., Gantlett, R. and Clark, J. (2023) ‘Incorporating technical and farmer knowledge to improve land use and management for natural flood management in lowland catchments’, Land Use Policy, 128, pp.106596.
Brown, C., Kovacs, E.K., Zinngrebe, Y., Albizua, A., Galanaki, A., Grammatikopoulou and Villamayor-Tomas, S. (2019) Understanding farmer uptake of measures that support biodiversity and ecosystem services in the Common Agricultural Policy (CAP): An EKLIPSE Expert Working Group Report. Wallingford: Centre for Ecology & Hydrology.
Brown, I. (2020) ‘Challenges in delivering climate change policy through land use targets for afforestation and peatland restoration’, Environmental Science and Policy, 107, pp. 36–45. https://doi.org/10.1016/j.envsci.2020.02.013
Burton, J.F. (2004) ‘Seeing Through the ‘ Good Farmer’s’ Eyes: Towards Developing an Understanding of the Social Symbolic Value of ‘Productivist’ Behaviour’, Sociologia Ruralis, 44 (2), pp. 195-215.
Burton, J.F., Kuczera, C. and Schwarz, G. (2008) ‘Exploring Farmers’ Cultural Resistance to Voluntary Agri-Environment Schemes’, Sociologia Ruralis, 48, pp. 16-37.
Burton, R.J. and Farstad, M. (2020) ‘Cultural lock‐in and mitigating greenhouse gas emissions: The case of dairy/beef farmers in Norway’, Sociologia Ruralis, 60(1), pp.20-39.
Burton, V., Metzger, M.J., Brown, C. and Moseley, D. (2019) ‘Green Gold to Wild Woodlands; understanding stakeholder visions for woodland expansion in Scotland’, Landscape Ecology, 34, pp. 1693–1713. https://doi.org/10.1007/s10980-018-0674-4
Carmen, E., Waylen, K., Marshall, K. and Ellis, R. (2023) Appraising Key Stakeholders and Institutions Relevant to Catchment-based Nature-based Solutions (NbS) in Scotland. Available at: https://www.hutton.ac.uk/sites/default/files/files/23_03_28_D2-2_M4A_Stakeholder_Inst_analysis.pdf
Conti, C., Zanello, G. and Hall, A. (2021) ‘Why are agri-food systems resistant to new directions of change? A systematic review’, Global Food Security, 31, pp.100576.
Creamer, E. (2015) ‘The double-edged sword of grant funding: a study of community-led climate change initiatives in remote rural Scotland’, Local Environment, 20 (9), pp. 981-999.
Cullen, P., Ryan, M., O’Donoghue, C., Hynes, S., Ó hUallacháin, D. and Sheridan, H. (2020) ‘Impact of farmer self-identity and attitudes on participation in agri-environment schemes’, Land Use Policy, 95, pp. 104660.
Cusworth, G. (2020) ‘Falling short of being the ‘good farmer’: Losses of social and cultural capital incurred through environmental mismanagement, and the long-term impacts agri-environment scheme participation’, Journal of Rural Studies, 75, pp. 164-173.
Daxini, A., Ryan, M., O’Donoghue, C. and Barnes, A.P. (2019) ‘Understanding farmers’ intentions to follow a nutrient management plan using the theory of planned behaviour’, Land Use Policy, 85, pp.428-437.
Dde Boon, A., Sandström, C. and Rose, D.C. (2022) ‘Perceived legitimacy of agricultural transitions and implications for governance. Lessons learned from England’s post-Brexit agricultural transition’, Land Use Policy, 116, pp.106067.
Department for Environment, Food & Rural Affairs. (2022) National Statistics – Farm Practices Survey February 2022. Available at: Farm practices survey February 2022 – greenhouse gas mitigation practices – GOV.UK (www.gov.uk)
Dessart, F.J., Barreiro-Hurlé, J. and Van Bavel, R. (2019) ‘Behavioural factors affecting the adoption of sustainable farming practices: a policy-oriented review’, European Review of Agricultural Economics, 46(3), pp.417-471.
Dunne, A., Markey, A. and Kinsella, J. (2019) ‘Examining the reach of public and private agricultural advisory services and farmers’ perceptions of their quality: the case of county Laois in Ireland’, The Journal of Agricultural Education and Extension, 25(5), pp.401-414.
El Benni, N., Ritzel, C., Heitkämper, K., Umstätter, C., Zorn, A. and Mack, G. (2022) ‘The cost of farmers’ administrative burdens due to cross-compliance obligations’, Journal of Environmental Planning and Management, 65(5), pp.930-952.
Ensor, J. and de Bruin, A. (2022) ‘The role of learning in farmer-led innovation’, Agricultural Systems, 197, pp.103356.
Farstad, M., Melås, A.M. and Klerkx, L. (2022) ‘Climate considerations aside: What really matters for farmers in their implementation of climate mitigation measures’, Journal of Rural Studies, 96, pp.259-269.
Feliciano, D., Hunter, C., Slee, B. and Smith, P. (2014) ‘Climate change mitigation options in the rural land use sector: Stakeholders’ perspectives on barriers, enablers and the role of policy in North East Scotland’, Environmental Science & Policy, 44, pp.26-38.
Garforth, C., Angell, B., Archer, J. and Green, K. (2003) ‘Improving farmers’ access to advice on land management: lessons from case studies in developed countries’, Agricultural Research and Extension Network Paper, 125.
Gasson, R. (1973) ‘Goals and Value of Farmers. Journal of Agricultural Economics’, 24 (3), pp. 521-542.
Glenk, K., Thomson, SG., Burns, J., Liebe, U., and Potts, J. M. (2022) Perceived legitimacy of agricultural support and priorities for a future support scheme in Scotland. SRUC.
Hill, B. and Bradley, D. (2023) ‘Goals and values of farmers revisited: Gasson fifty years on’, Journal of Agricultural Economics, 75, pp. 108-113.
Hill, I. and Mole, K. (2022) State of the Art Review Supporting rural businesses NICRE SOTA Review No 4: July 2022. Available at: (PDF) State of the Art Review Supporting rural businesses (researchgate.net).
Hopkins, J., Sutherland, L-A., Ehlers, M-H., Matthews, K., Barnes, AP., & Toma, L. (2017) ‘Scottish farmers’ intentions to afforest land in the context of farm diversification’, Forest Policy and Economics, 78, pp. 122 – 132. https://doi.org/10.1016/j.forpol.2017.01.014.
Hopkins, J., Sutherland, L.-A., Calo, A., Barlagne, C., Wardell-Johnson, D., Barnes, A., Thomson, S., Mcmillan, J., and Spencer, M. (2020) New entrants: their potential contribution to farming in Scotland by 2023. Available at: Research_Note_New_Entrants_final_RD242_published.pdf (hutton.ac.uk)
Howley, P. and Ocean, N. (2021) ‘Doing more with less: leveraging social norms and status concerns in encouraging conservation farm practices’, Land Economics, 97(2), pp.372-387.
Howley, P. and Ocean, N. (2022) ‘Can nudging only get you so far? Testing for nudge combination effects’, European Review of Agricultural Economics, 49(5), pp.1086-1112.
Hurley, P., Lyon, J., Hall, J., Little, R., Tsouvalis, J., White, V. and Rose, D.C. (2022) ‘Co‐designing the environmental land management scheme in England: the why, who and how of engaging ‘harder to reach’ stakeholders’, People and Nature, 4(3), pp. 744-757.
Ingram, J., Chiswella, H., Mills, J., Debruyne, L., Cooreman, H., Koutsouris, A., Pappa, E. and Marchand, F. (2018) ‘Enabling learning in demonstration farms: A literature review’, International Journal of Agricultural Extension, 6(3), pp.29-42.
Ingram, J., Mills, J., Black, J.E., Chivers, C.A., Aznar-Sánchez, J.A., Elsen, A., Frac, M., López-Felices, B., Mayer-Gruner, P., Skaalsveen, K. and Stolte, J. (2022) ‘Do Agricultural Advisory Services in Europe Have the Capacity to Support the Transition to Healthy Soils?’, Land, 11(5), p.599.
Interreg. (n.d.). What Scottish stakeholders think of the Agri-environment Climate Scheme and how it could be improved. Available at: https://northsearegion.eu/media/15256/scottish-aes-policy-report-what-scottish-key-stakeholders-think-of-the-scottish-agri-environment-scheme-and-how-it-could-be-improved.pdf (Accessed on 12/05/2024).
Irwin, R., Short, I., Mohammadrezaei, M. and Dhubháin, Á.N. (2023) ‘Increasing tree cover on Irish dairy and drystock farms: The main attitudes, influential bodies and barriers that affect agroforestry uptake’, Environmental Science & Policy, 146, pp.76-89.
King, P., Martin-Ortega, J., Armstrong, J., Ferré, M. and Bark, R.H. (2023) ‘Mainstreaming nature-based solutions: What role do Communities of Practice play in delivering a paradigm shift?’, Environmental Science & Policy, 144, pp.53-63
Klerkx, L., De Grip, K. and Leeuwis, C. (2006) ‘Hands off but strings attached: the contradictions of policy-induced demand-driven agricultural extension’, Agriculture and Human Values, 23, pp.189-204.
Klerkx, L. and Proctor, A. (2013) ‘Beyond fragmentation and disconnect: Networks for knowledge exchange in the English land management advisory system’, Land use policy, 30(1), pp.13-24.
Klerkx, L. (2020) ‘Advisory services and transformation, plurality and disruption of agriculture and food systems: towards a new research agenda for agricultural education and extension studies’, Journal of Agricultural Education and Extension, 26(2), pp.131-140.
Knierim, A., Boenning, K., Caggiano, M., Cristóvão, A., Dirimanova, V., Koehnen, T., Labarthe, P. and Prager, K. (2015) ‘The AKIS concept and its relevance in selected EU member states’, Outlook on Agriculture, 44(1), pp.29-36.
Knook, J., Eory, V., Brander, M. and Moran, D. (2020) ‘The evaluation of a participatory extension programme focused on climate friendly farming’, Journal of Rural Studies, 76, pp.40-48.
Kreft, C., Finger, R. and Huber, R. (2023) ‘Action‐versus results‐based policy designs for agricultural climate change mitigation’, Applied Economic Perspectives and Policy. https://doi.org/10.1002/aepp.13376.
Kuhfuss, L., R. Preget, S. Thoyer, N. Hanley, and P. Le Coent. (2016) ‘Nudges, social norms and permanence in agri-environmental schemes’, Land Economics, 92(4), pp. 641–655.
Kuhfuss, L., Rivington, M., and Roberts, M. (2018) The “Payment for Ecosystem Services” approach-relevance to climate change Defining “Payments for Ecosystem Services.”. Available at:The ‘Payment for Ecosystem Services’ approach – relevance to climate change (climatexchange.org.uk).
Lebarthe, P., Sutherland, L.A., Laurent, C., Nguyen, G., Tisenkopfs, T., Triboulet, P., Bechtet, N., Bulten, E., Elzen, B., Madureira, L. and Noble, C. (2022) ‘Who are Advisory Services Leaving Out? A Critical Reflection on ‘Hard to Reach’Farmers’, EuroChoices, 21(1), pp.50-55.
Lampkin, N., Shrestha, S., Sellars, A., Baldock, D., Smith, J., Mullender, S., Keenleyside, C., Pearce, B. and Watson, C. (2021) Preparing the Evidence Base for Post-Brexit agriculture in Scotland – case studies on alternative payments. Available at: Preparing the Evidence Base for Post-Brexit agriculture in Scotland – case studies on alternative payments — SRUC, Scotland’s Rural College.
Lawrence, A., and Dandy, N. (2014) ‘Private landowners’ approaches to planting and managing forests in the UK: What’s the evidence?’, Land Use Policy, 36, pp.351–360. https://doi.org/10.1016/j.landusepol.2013.09.002
Lawrence, A., Deuffic, P., Hujala, T., Nichiforel, L., Feliciano, D., Jodlowski, K., Lind, T., Marchal, D., Talkkari, A., Teder, M. and Vilkriste, L. (2020) ‘Extension, advice and knowledge systems for private forestry: Understanding diversity and change across Europe’, Land Use Policy, 94, pp.104522.
Lawrence, A., Deuffic, P., Hujala, T., Nichiforel, L., Feliciano, D., Jodlowski, K., Lind, T., Marchal, D., Talkkari, A., Teder, M. and Vilkriste, L. (2020) ‘Extension, advice and knowledge systems for private forestry: Understanding diversity and change across Europe’, Land Use Policy, 94, pp.104522.
Leloup, H., Bulten, E., Elzen, B., Prazan, J. and Zarokosta, E. (2022) ‘Socio‐Technical Scenarios as a Tool to Improve Farm Advisory Services’, EuroChoices, 21(1), pp.32-39.
Lozada, L. M., and Karley, A. (2022) The adoption of agroecological principles in Scottish farming and their contribution towards agricultural sustainability and resilience. Available at: SEFARI-FFCC Agroecology in Scotland March 2022.pdf.
MacKay, R. and Prager, K. (2021) ‘The dilemma of upland footpaths–understanding private landowner engagement in the provision of a public good’, Scottish Geographical Journal, 137(1–4), pp.131–157. https://doi.org/10.1080/14702541.2021.1994150
Mahon, M., Farrell, M. and McDonagh, J. (2010) ‘Power, positionality and the view from within: agricultural advisers’ role in implementing participatory extension programmes in the Republic of Ireland’, Sociologia Ruralis, 50(2), pp.104-120.
Mills, J., Gaskell, P., Reed, M., Short, C.J., Ingram, J., Boatman, N., Jones, N., Conyers, S., Carey, P., Winter, M., and Lobley, M. (2013) Farmer attitudes and evaluation of outcomes to on-farm environmental management. Report to Defra. Project Report. CCRI, Gloucester.
Mills, J., Gaskell, P., Ingram, J., Dwyer, J., Reed, M. and Short, C. (2016) Engaging farmers in environmental management through a better understanding of behaviour. Agriculture and Human Value. Available at: Engaging farmers in environmental management through a better understanding of behaviour (robyorke.co.uk)
Mills, J., Chiswell, H., Gaskell, P., Courtney, P., Brockett, B., Cusworth, G. and Lobley, M. (2021) ‘Developing farm-level social indicators for agri-environment schemes: a focus on the agents of change’, Sustainability, 13(14), pp.7820.
Moxey, A. P., McCracken, DI., and Thomson, S. (2021) Environmental conditionality on direct payments to land managers. Available at: https://pure.sruc.ac.uk/en/publications/environmental-conditionality-on-direct-payments-to-land-managers
Moxey, A., Smyth, M.A., Taylor, E. and Williams, A.P. (2021) ‘Barriers and opportunities facing the UK Peatland Code: A case-study of blended green finance’, Land Use Policy, 108, pp.105594.
Mustin, K., Newey, S. and Slee, B. (2017) ‘Towards the construction of a typology of management models of shooting opportunities in Scotland’, Scottish Geographical Journal, 133(3-4), pp.214-232.
Nicholls, D.C. (1969) ‘The Use of Land for Forestry within the Proprietary land unit’, Forestry Commission Bulletin No. 39.
Novo, P., Sposato, M., Maynard, C. and Genk, K. (2021) Understanding the experiences of peatland restoration in Scotland. Available at: https://era.ed.ac.uk/handle/1842/37697
Ocean, N. and Howley, P. (2021) ‘Using choice framing to improve the design of agricultural subsidy schemes’, Land Economics, 97(4), pp.933-950.
Okumah, M., Chapman, P.J., Martin-Ortega, J. and Novo, P. (2018) ‘Mitigating agricultural diffuse pollution: Uncovering the evidence base of the awareness–behaviour–water quality pathway’, Water, 11(1), p.29.
Okumah, M., Martin-Ortega, J. and Novo, P. (2018) ‘Effects of awareness on farmers’ compliance with diffuse pollution mitigation measures: A conditional process modelling’, Land Use Policy, 76, pp.36-45.
Okumah, M., Martin-Ortega, J., Chapman, P.J., Lyon, c. and Novo, P. (2019) Behavioural impacts of Northern Ireland’s Funded Soil Sampling and Training Schemes 2017-2019. Available at: http://wp.lancs.ac.uk/rephokus/
Okumah, M., Martin-Ortega, J., Novo, P. and J. Chapman, P. (2020) ‘Revisiting the determinants of pro-environmental behaviour to inform land management policy: A meta-analytic structural equation model application’, Land, 9(5), pp.135.
Okumah, M., Chapman, P.J., Martin-Ortega, J., Novo, P., Ferre, M., Jones, S., Pearson, P. and Froggatt, T. (2021) ‘Do awareness-focussed approaches to mitigating diffuse pollution work? A case study using behavioural and water quality evidence’, Journal of Environmental Management, 287, pp.112242.
Okumah, M., Martin-Ortega, J., Chapman, P.J., Novo, P., Cassidy, R., Lyon, C., Higgins, A. and Doody, D. (2021) ‘The role of experiential learning in the adoption of best land management practices’, Land Use Policy, 105, pp.105397.
Paulus, A., Hagemann, N., Baaken, M.C., Roilo, S., Alarcón-Segura, V., Cord, A.F., Beckmann, M. (2022) ‘Landscape context and farm characteristics are key to farmers’ adoption of agri-environmental schemes’, Land Use Policy, Volume 121, pp.106320. https://doi.org/10.1016/j.landusepol.2022.106320.
Piñeiro, V., Arias, J., Elverdin, P., Ibáñez, A., Morales Opazo, C.,Prager, S. and Torero, M. (2021) Achieving sustainable agricultural practices. From incentives to adoption and outcomes. Washington: International Food Policy Research Institute (IFPRI).
Prager, K. (2022) ‘Implementing policy interventions to support farmer cooperation for environmental benefits’, Land Use Policy, 119, pp.106182.
Quinn, B., McKitterick, L., Tregear, A. and McAdam, R. (2021) ‘Trust in the programme: An exploration of trust dynamics within rural group-based support programmes’, Journal of Rural Studies, 88, pp.326-336.
Rajagopalan, D., and L. Kuhfuss. (2017) Agri-Environmental Concerns and the Potential for Catchment-Scale Cooperation near Five Case-Study Research Farms in Scotland: an overview of the initial scoping exercise. The James Hutton Institute.
Reissig, L., Stoinescu, A. and Mack, G. (2022) ‘Why farmers perceive the use of e-government services as an administrative burden: A conceptual framework on influencing factors’, Journal of Rural Studies, 89, pp.387-396.
Ritzel, C., Mack, G., Portmann, M., Heitkämper, K. and El Benni, N. (2020) ‘Empirical evidence on factors influencing farmers’ administrative burden: A structural equation modelling approach’, Plos one, 15(10), pp.e0241075.
Rust, N.A., Stankovics, P., Jarvis, R.M., Morris-Trainor, Z., de Vries, J.R., Ingram, J., Mills, J., Glikman, J.A., Parkinson, J., Toth, Z. and Hansda, R. (2021) ‘Have farmers had enough of experts?’, Environmental Management, 69, pp.31-44.
Ruto, E. and Garrod, G. (2009) ‘Investigating farmers’ preferences for the design of agri-environment schemes: a choice experiment approach’, Journal of Environmental Planning and Management, 52(5), pp.631-647.
Schaub, S., Ghazoul, J., Huber, R., Zhang, W., Sander, A., Rees, C., Banerjee, S. and Finger, R. (2023) ‘The role of behavioural factors and opportunity costs in farmers’ participation in voluntary agri‐environmental schemes: A systematic review’, Journal of Agricultural Economics, 74(3), pp.617-660.
Schulte, I., Eggers, J., Nielsen, J.Ø. and Fuss, S. (2022) ‘What influences the implementation of natural climate solutions? A systematic map and review of the evidence’, Environmental Research Letters, 17(1), pp.013002.
Scottish Government. (2012). Agriculture and Climate Change: Evidence on Influencing Farmers Behaviours. Available at: Agriculture and Climate Change: Evidence on Influencing Farmer Behaviours – Research Findings – gov.scot (www.gov.scot).
Scottish Government. (2021). Scottish Government Rural Payments and Inspections Division (RPID) Customer Satisfaction Survey 2021 Scottish Government Rural Payments and Inspections Division (RPID) Customer Satisfaction Survey 2021. Available at: Rural Payments and Inspections Division (RPID): customer satisfaction survey 2021 – gov.scot (www.gov.scot).
Slee, B. (2014) WEAG recommendation No 10: Increasing the integration of farming and forestry in Scotland: a summary of recent research. Available at: WEAG recommendation No 10: Increasing the integration of farming and forestry in Scotland: a summary of recent research (climatexchange.org.uk).
Sligo, F.X. and Massey, C. (2007) ‘Risk, trust and knowledge networks in farmers’ learning’, Journal of Rural Studies, 23(2), pp.170-182.
Sutherland, L.A., Mills, J., Ingram, J., Burton, R.J., Dwyer, J. and Blackstock, K. (2013) ‘Considering the source: Commercialisation and trust in agri-environmental information and advisory services in England’, Journal of Environmental Management, 118, pp.96-105
Sutherland, L-A., Toma, L., Barnes, A. P., Matthews, K. B., and Hopkins, J. (2016) ‘Agri-environmental diversification: Linking environmental, forestry and renewable energy engagement on Scottish farms’, Journal of Rural Studies, 47, pp.10–20. https://doi.org/10.1016/j.jrurstud.2016.07.011
Sutherland, L-A., Barlagne, C. and Barnes, A.P. (2019) ‘Beyond ‘hobby farming’: towards a typology of non-commercial farming’, Agriculture and Human Values, 36, pp. 475-493.
Sutherland, L.-A., Macleod, K., Koronka, J., Kuhfuss, L., & Blackstock, K. (2021) Attitudes and drivers of behaviours of landowners/land managers towards Land use change associated with Climate Change Plan targets. Available at: PAWSA-Land-Manager-Behaviours-in-relation-to-the-environment-and-climate-change-24-June-2021.pdf (hutton.ac.uk).
Sutherland, L.A. and Labarthe, P. (2022) ‘Introducing ‘microAKIS’: a farmer-centric approach to understanding the contribution of advice to agricultural innovation’, The Journal of Agricultural Education and Extension, 28(5), pp.525-547.
Sutherland, L.A., Madureira, L., Elzen, B., Noble, C., Bechtet, N., Townsend, L., Zarokosta, E. and Triboulet, P. (2022) ‘What Can We Learn from Droppers and Non‐adopters About the Role of Advice in Agricultural Innovation?’, EuroChoices, 21(1), pp.40-49.
Sutherland, L-A., Adamsone-Fiskovica, A., Elzen, B., Koutsouris, A., Laurent, C., Straete, E.P. and Labarthe, P. (2023) ‘Advancing AKIS with assemblage thinking’, Journal of Rural Studies, 97, pp. 57-69.
Thomas, E., Riley, M. and Spees, J. (2020) ‘Knowledge flows: Farmers’ social relations and knowledge sharing practices in ‘Catchment Sensitive Farming’, Land use policy, 90, pp.104254.
Thompson, B., Morrison, R., Stephen, K., Eory, V., Ferreira, J., Vigors, B., Degiovanni, H. B., Barnes, A., and Toma, L. (2021a) Behaviour change and attitudes in the Scottish agricultural sector-a rapid evidence assessment. Available at: Behaviour change and attitudes in the Scottish agricultural sector – a rapid evidence assessment (ed.ac.uk).
Thompson, B., Leduc, G., Manevska‐Tasevska, G., Toma, L. and Hansson, H. (2023) ‘Farmers’ adoption of ecological practices: A systematic literature map’, Journal of Agricultural Economics, 75, pp. 84-107.
Thomson, SG., Moxey, A. P., and Hall, J. (2021b) The Transition to Future (Conditional) Agricultural Support – NFU Scotland’s Approach. Available at: 0521 NFUS Proposals For Future (Conditional) Support.pdf.
Toma, L., Barnes, A. P., Sutherland, L. A., Thomson, S., Burnett, F., and Mathews, K. (2018) ‘Impact of information transfer on farmers’ uptake of innovative crop technologies: a structural equation model applied to survey data’, Journal of Technology Transfer, 43(4), pp. 864-881.
Turner, J.A., Horita, A., Fielke, S., Klerkx, L., Blackett, P., Bewsell, D., Small, B. and Boyce, W.M. (2020) ‘Revealing power dynamics and staging conflicts in agricultural system transitions: case studies of innovation platforms in New Zealand’, Journal of Rural Studies, 76, pp.152-162.
Tyllianakis, E. and Martin-Ortega, J. (2021) ‘Agri-environmental schemes for biodiversity and environmental protection: How we are not yet “hitting the right keys”’, Land Use Policy, 109, pp.105620.
Tyllianakis, E., Martin-Ortega, J., Ziv, G., Chapman, P.J., Holden, J., Cardwell, M. and Fyfe, D. (2023) ‘A window into land managers’ preferences for new forms of agri-environmental schemes: Evidence from a post-Brexit analysis’, Land Use Policy, 129, pp.106627.
Vrain, E. (2015) Factors influencing farmer uptake of water pollution mitigation measures: The role of farm advice (Doctoral dissertation, University of East Anglia). Available at: (PDF) Factors influencing farmer uptake of water pollution mitigation measures: The role of farm advice. (researchgate.net)
Westaway, S., Grange, I., Smith, J. and Smith, L. (2023) ‘Meeting tree planting targets on the UK’s path to net-zero: A review of lessons learnt from 100 years of land use policies’, Land Use Policy, 125, pp.106502.
Wood, B.A., Blair, H.T., Gray, D.I., Kemp, P.D., Kenyon, P.R., Morris, S.T. and Sewell, A.M. (2014) ‘Agricultural science in the wild: A social network analysis of farmer knowledge exchange’, PloS one, 9(8), pp.e105203.
Yang, W. and Knook, J. (2021) ‘Spatial evaluation of the impact of a climate change participatory extension programme on the uptake of soil management practices’, Australian Journal of Agricultural and Resource Economics, 65(3), pp.539-565.
Yang, W. and Wang, L. (2022) ‘Impact of farmer group participation on the adoption of sustainable farming practices—spatial analysis of New Zealand dairy farmers’, Farmer’s Oranizations and Sustainable Development, 94(3), pp. 707-717.
Appendices
Appendix A – Support system overview
As part of the desk-based research element of this report, we attempted to discover as many of the existing official support systems available to land managers in Scotland as possible. This included visiting Scottish Government resources, such as the Rural Payments and Services website[7], along with an internet trawl through other resources – such as NatureScot’s summary of the Agri-Environment and Climate Scheme[8]. We used this information to compile Table 5 below, giving a summary of all the available sources of support and an indication, where possible, of how land managers are engaging with this support system.
To help understand how land managers are engaging with support systems, we identified and defined the key support system providers. These are outlined below:
Government – publicly funded support systems. These can come in the form of general funding support schemes (such as BPS) or more targeted schemes with environmental objectives (AECS). Government funding also underpins other forms of support, such as the Farm Advisory Service. Generic, rather than agricultural-specific business funding is also available from local and central government, but is generally regarded as less relevant to land managers.
Private sector – Land managers routinely access private sector funding in the form of overdrafts and loans offered by banks, plus calling upon personal networks (friends and family). Other sources of short-term credit include auction markets and input suppliers. More novel funding sources such as crowdfunding and impact bonds have emerged in recent years, as have voluntary carbon markets e.g. the Woodland Carbon Code and the Peatland Code.
Knowledge networks and advisory services – Land managers draw on a range of informational support when making decisions. This includes direct government sources plus third-party sources funded by government (e.g. the Farm Advisory Service) but also independent third-party provision. The latter includes advisory services tied to input suppliers as well as independent consultants but also, importantly, less formal reliance upon friends and family plus peer-to-peer networks.
Third sector, charities and NGOS – Certain groups with defined goals, such as nature protection and restoration, also provide landowners with advice and funding to undertake measures that align with their objectives. These groups are often landowners themselves.
Table 5: Support scheme overview
|
Scheme |
Primary[9] Type of support |
Description |
Project providers |
Support providers |
Land manager experience of support system |
|---|---|---|---|---|---|
|
Decoupled area payments: Basic Payment Scheme/Greening/LFASS (also National Reserve) |
Financial |
The Basic Payment Scheme (BPS) acts as a safety net for farmers and crofters by supplementing their main business income. Greening is a top-up to the BPS. The National Reserve helps new and young farmers who do not automatically qualify for BPS entitlements. LFASS (Less Favoured Area Support Scheme) is a separate decoupled area payment, but covers most farm businesses, particularly beef and sheep farms. Payment rates per ha vary according to geography. |
Croft, Grazing, Mixed farm, Arable, Dairy, Pig & Poultry, Soft fruit, Estate (multi), Community ownership |
Government agencies |
Many land managers, particularly farmers, rely on basic annual payments to ensure profitability in their enterprises. For example, even with support payments, only 60% of dairy farms were profitable in 2018.[10] Those in the crofting and grazing industry have relied on support on the basis of what businesses ‘have’ or ‘had’ rather than what they ‘do’.[11] LFASS calculation methods have resulted in many businesses with historically managed higher livestock numbers getting overcompensated whilst other units that have since grown are not receiving full support payment levels to reflect their higher production and activity levels. |
|
Voluntary Coupled Support (VCS): Suckler Beef Support Scheme (SBSF)/Scottish Upland Sheep Support Scheme (SUSSS) |
Financial |
The SBSF and SUSSS are supplementary payments per selected animal, available to suckler beef and sheep farms in selected areas. |
Suckler beef and sheep farms |
Government agencies |
An attempt to target support payments at particularly vulnerable types of farming receiving low decoupled support. |
|
Woodland Carbon Code |
Financial |
The Woodland Carbon Code (WCC) is the UK’s voluntary carbon standard for woodland creation projects. It provides reassurance about the carbon savings that woodland projects may realistically achieve. |
Estate (multi) Estate (sporting) Estate (conservation) Charity organisation Estate (investment) Commercial forestry Community ownership |
Corporate buyers Government agencies |
Preliminary results of the analysis of Project Design Documents suggest that carbon is only one consideration amongst other factors. This is demonstrated by differences in planting and management decisions, which affect the type and uses of the woodland created. This is corroborated by interviews with developers and landowners, who expressed a wide range of interests and intentions behind woodland creation.[12] |
|
Peatland Carbon Code |
Financial |
The Peatland Code is a voluntary certification standard for UK peatland projects wishing to market the climate benefits of restoration. It provides assurances to carbon market buyers that the projects they are investing in are credible and deliverable. |
Estate (multi) Estate (sporting) Estate (conservation) Charity organisation Estate (investment) Commercial forestry Community ownership |
Corporate buyers Government agencies |
The Peatland Code itself is largely unknown amongst land managers and restoration practitioners. As a comparator, awareness of the Woodland Carbon Code is notably greater, as is its uptake. |
|
Peatland Action |
Financial |
The main source of public funding for peatland restoration, covering a proportion of upfront capital. |
Estate (multi) Estate (sporting) Estate (conservation) Charity organisation Estate (investment) Commercial forestry Community ownership |
Government agencies |
Proactive raising of awareness by NatureScot and iterative changes to payment rates and terms and conditions have achieved relatively high uptake rates, but the pace needs to quicken further if ambitious restoration targets are to be met. |
|
Agri-Environment Climate Scheme |
Financial |
The Agri-Environment Climate Scheme (AECS) promotes land management practices which protect and enhance Scotland’s natural heritage, improve water quality, manage flood risk and mitigate and adapt to climate change. About £30-40 million is awarded annually to land managers. |
All |
Government agencies |
Over 3,200 farmers, crofters and land managers have AECS contracts out of the regular 18,000 CAP claimants. The AECS covers 1,16 million hectares of agricultural land under management contracts representing about 20% of agricultural land. Comments on the application process include: “Guidance is awful even for someone who has much experience in this area such as an agent/manager like myself. It is difficult to find all the information on the internet and too bureaucratic. Guidance can change. Before, there was a booklet to guide you through everything, but now it is on the internet and can change with little knowledge of changes that may have happened to various measures/payments etc.” “It’s a 5-year scheme so there can be problems when planning, as it is difficult to change options and areas during the scheme, which is sometimes important in arable rotations to get the best from the land”. “Not difficult for an adviser, but it would be a lot of problems for a farmer, on his own, to do” |
|
Forestry Grant Scheme |
Financial |
The Forestry Grant Scheme supports 1) the creation of new woodland and 2) the sustainable management of existing woodlands. There are eight categories under which support can be applied for; agroforestry, woodland creation, forest infrastructure, woodland improvement grant, sustainable management of forests, tree health, harvesting and processing and forestry co-operation. |
Estate (multi) Estate (sporting) Estate (conservation) Charity organisation Estate (investment) Commercial forestry Community ownership All farming archetypes |
Government agencies |
Some farmers are put off engaging with this support system due to inherent views that planting trees is not what a typical ‘good farmer’ would do – representing a lack of skill that may reduce their standing amongst peers. Some farmer archetypes also do not engage with this support system as it is outwith the administrative system that they normally engage with. The MacKinnon Report[13] attempted to identify the key administrative barriers in current support schemes and propose solutions to remove some of the burden on scheme applicants. This may have led to a streamlined application process to this support scheme. |
|
Sustainable Agriculture Capital Grant Scheme |
Financial |
The Sustainable Agriculture Capital Grant Scheme (SACGS) provides support to businesses so that they can invest in equipment to reduce harmful ammonia emissions and reduce adverse impacts on water quality resulting from the storage and spreading of livestock slurry and digestate. |
Grazing Mixed farm Dairy Pig & Poultry Arable Estate (multi) |
Government agencies |
There is little evidence on how land managers are engaging with this support system. |
|
Scottish Land Fund |
Financial |
The Scottish Land Fund is a programme which supports community organisations across Scotland to own land, buildings, and other assets. |
Public Community ownership |
Charity Government agencies |
A recent evaluation report of the Scottish Land Fund[14] found that 92% of applicants rated the overall process involved in the fund as either good or very good. The report concluded that the “fund is highly valued and seen as a vital tool for community groups who wish to transform land and buildings in their local areas.” On this evidence, it would appear that land managers are positively engaging with this support system. |
|
Preparing for Sustainable Farming |
Knowledge |
This scheme helps farmers and crofters to further their understanding of how farming and food production can be even more economically and environmentally sustainable. Scottish farmers can claim funding for carbon audits, soil sampling and analysis and animal health and welfare interventions. |
Croft, Grazing, Mixed farm, Arable, Dairy, Pig & Poultry, Soft fruit, Estate (multi), |
Government agencies |
There is little evidence on how land managers are engaging with this support system. |
|
Knowledge Transfer and Innovation Fund |
Knowledge |
The scheme has two aims: 1) to promote skills development and knowledge transfer in the primary agricultural sector and 2) deliver innovation on-the-ground improvements in agricultural competitiveness, resource efficiency, environmental performance and sustainability. |
Croft, Grazing, Mixed farm, Arable, Dairy, Pig & Poultry, Soft fruit, Estate (multi) |
Government agencies |
The Farm Advisory Service[15] have published multiple reports summarising the activities undertaken as part of the Knowledge Transfer and Innovation Fund. For example, the project ‘Agroforestry in Action’ highlighted that their agroforestry advice videos have had over 8,000 views at the time of writing in 2021. |
|
Nature Restoration Fund |
Financial |
The Nature Restoration Fund (NRF) is a competitive fund launched in July 2021, which specifically encourages applicants with projects that restore wildlife and habitats on land and sea and address the twin crises of biodiversity loss and climate change. |
Estate (multi) Estate (sporting) Estate (conservation) Charity organisation Estate (investment) Community ownership |
Government agencies |
We found little evidence on how land managers are engaging with this support system other than a published list of successful projects. |
|
The Water Environment Fund |
Financial |
The Water Environment Fund is targeted on projects which will derive the greatest benefit to Scotland’s rivers and neighbouring communities. |
All |
Government agencies |
We found little evidence on how land managers are engaging with this support system. |
|
Advisory Services (FAS) |
Knowledge |
The Farm Advisory Service (FAS) offers a range of advisory services to Scottish farmers, such as livestock and soil management, water management, specialist advice and integrated land management plans (ILMPs). FAS is part of the Scottish Rural Development Programme (SRDP) which is funded by the Scottish Government, providing information and resources aimed at increasing the profitability and sustainability of farms and crofts. |
Croft, Grazing, Mixed farm, Arable, Dairy, Pig & Poultry, Soft fruit, Estate (multi) |
Government agencies |
A recent evaluation of the FAS service concluded that “Overall, there is clear evidence that the FAS One to Many service has delivered a wide-ranging programme which, insofar as we have data, appears to be well-regarded by those who use it.” Highlighted points include those below: Delivering over 800 events over a range of geographical locations, with consistently high feedback. As many as 15,656 people attended these events between 2016/17 and 2019/20. Provision of a small farm and crofter subscription service, providing subsidised advice to 2, 188 crofters and 287 small farms in 2019/20. Providing technical information, including a Farm Management Handbook. Between January 2020 and August 2020, 108,674 technical documents were downloaded. It would therefore appear that land managers, in particular farmers, in Scotland are engaging heavily with this support service. |
|
Farmer Clusters |
Knowledge |
Farmer Clusters are groups of farmers and land managers that come together under the guidance of a ‘facilitator’ or advisor to work cohesively in their locality. The approaches can differ, with sources of funding varying across Britain. Currently, only two Farm Clusters are registered in Scotland. |
Croft, Grazing, Mixed farm, Arable, Dairy, Pig & Poultry, Soft fruit, Estate (multi), |
Charity |
We found little evidence on how land managers are engaging with this support system. |
|
Monitor farms/forests |
Knowledge |
Monitor farms are managed by Quality Meat Scotland and AHDB Cereals and Oilseeds as a form of demonstration farm for new practices and innovative technologies. Improving carbon performance is one of the key themes of this. |
Croft, Grazing, Mixed farm, Arable, Dairy, Pig & Poultry, Soft fruit, Estate (multi), |
Government agencies |
A previous report from 2014 highlighted that monitor farms have been successful in practical and effective knowledge exchange and delivered a positive impact on farm practices and performance. More recent evaluation of engagement with this support system is not available. |
|
Carbon positive |
Knowledge |
Managed by SAOS as a platform for collating farm data on natural capital and carbon footprints |
Croft, Grazing, Mixed farm, Arable, Dairy, Pig & Poultry, Soft fruit, Estate (multi), |
Private sector |
We found little evidence on how land managers are engaging with this support system. |
|
Croft Woodlands and Crofting MOREwoods |
Knowledge |
The Woodland Trust’s “Croft Woodlands” advisory team offers crofters, smallholders and common grazing committees free advice on tree planting as well as training, educational resources, assistance with grant applications and funding for tree planting. |
Croft, Grazing, Mixed farm, Estate (multi), |
Private sector Charity Government agencies |
From 2015 to 2020, this support scheme supported the planting of over a million trees in the Crofting Counties and helped bring over 1000ha of woodland into sustainable management. |
|
The Facility for Investment ready Nature in Scotland |
Finance |
Through the Facility for Investment Ready Nature in Scotland (FIRNS), grants of up to £240,000 will be offered to organisations and partnerships to help develop a viable business case and financial model, to attract investment in projects that can restore and improve the natural environment. |
All |
Government Agencies |
We found little evidence on how land managers are engaging with this support system. |
|
Facility for Investment Ready Nature Scotland Grant Scheme |
Finance |
The FIRNS is a joint initiative between NatureScot, the Esmée Fairbairn Foundation and the National Lottery Heritage Fund Supporting the development of environmental projects in Scotland that: -align with the Scottish Government’s Interim Principles for Responsible Investment in Natural Capital -aim to value and monetise ecosystem services derived from the restoration of natural capital assets, in a model that will attract and repay investment or support an investment model that can be scaled up and duplicated elsewhere. |
Charity organisation Community organisation Local Government |
Government Agencies |
Seven projects have been selected to be funded by FIRNS. |
|
Private agricultural consultancies |
Knowledge |
Private consultancies offer a range of management and consultancy services to rural land managers, providing support and guidance. This usually focuses on commercial development of the business and can include advice on estate management, planning, building consultancy, renewables and tax and funding advice. |
Estate (multi) Estate (sporting) Estate (investment) Commercial forestry Community ownership All farming archetypes |
Private sector |
We found that all archetypes are engaging with private agricultural consultancies to some extent. Some are using these services to offer procedural support, such as help completing application forms etc. whereas others are using more specialised services, e.g. forestry. |
Appendix B – Archetype methodology
Archetype identification
The first priority was to define a baseline list of Scottish land manager archetypes[16] in discussion with the project steering group.
Archetypes are a useful tool when trying to simplify the heterogeneity of land managers in Scotland and provide context to the following sections of analysis. The simplified archetypes were then used to underpin the mapping elements of this study. Firstly, archetypes were used to provide a high-level overview of how different land managers are engaging with support systems in Scotland. Secondly, the archetypes were used to identify potential climate change mitigation project providers in Table 6 below. Thirdly, archetypes were discussed with participants at the stakeholder workshop to explore the extent to which each archetype is interacting with support systems in the manner to which is expected based on stakeholder interviews and our literature review.
The following archetypes have been informed by Mills et al. (2017) (see Figure 1) where three main factors are defined that influence a land manager’s willingness and ability to undertake environmental management.
These are listed below:
- Willingness to adopt – willingness of land managers to undertake environmental land management practices and the intrinsic factors (e.g., motivations, beliefs, social norms) affecting land managers environmental behaviours.
- Farmer Engagement – where land managers enter into dialogue, discussion and collective problem framing with those who hold environmental knowledge and expertise.
- Ability to adopt – farm characteristics (e.g., tenancy, scale, skills and capital constraints), that influence land manager’s decision making in relation to environmental management and their ability to adopt new practices.
Mills et al. (2017) found that land managers tend to exhibit different sub-optimal positions within this conceptual framework. These positions are found below:
- Willing and engaged only – willingness to undertake environmental management activities on their land, but this has not translated into behaviour because the manager does not have the ability to do so.
- Able and engaged only – undertaking environmental management and has engaged with advice, but lacks sustained motivation to maximise environmental benefits.
- Willing and able only – actively undertaking environmental management, but has not engaged with any advice which means that land is not delivering its full environmental potential.
- Disengaged – not engaged with any environmental management, either because they were not willing, they do not have capacity, or they dislike outside interference or are concerned with loss of control or management flexibility.
Some characteristics are more readily observable than others. For example, farm type, size and tenure status are recorded routinely, levels of financial, human and social capital or personal attitudes less so. Nevertheless, it is possible to construct example archetypes that can be used to explore how different configurations may affect land use decisions.[17] The Table on the following page is an attempt to illustrate a broad range of potential land manager archetypes in Scotland. This has been arranged primarily based on activity, as this is the most observable difference between land manager types. We have provided a hypothesis of the likely size, tenure and engagement along with a brief description of key characteristics and indication of location. Words in bold indicate that this characteristic applies to the archetype.
In further developing these archetypes, we hypothesized additional influences on ability and willingness to change land management/use:
- Tenure restrictions (particularly short-term leases and crofting tenure, notably common grazing) constrain automatic freedom to change (and reap rewards);
- Small scale incurs proportionally higher transaction (e.g., application) costs, although transaction costs also deter larger land managers. Small scale also constrains availability of labour/capital/land to make changes.
- Availability of advisers (particularly for non-traditional topics) perceived as credible and relevant is limited, especially/ in remoter areas.
- General lack of policy certainty also deters change.
- Biophysical conditions constrain land use options.
- Financial circumstances constrain ability to change – but also affect relative importance (leverage) of public funds e.g., market revenues and/or non-land income may matter more, making some land managers less responsive to policy (i.e., opportunity cost vary) even if public funding is generous.
- All of the previous influences are mediated through cultural identities, social norms and personal motivations – willingness to change will vary within any given category of activity, size, tenure, region, biophysical circumstances and financial circumstances.
Archetype table
Table 6 – Archetypes
|
Activity |
Size |
Tenure |
Description |
Region |
Priority* |
|---|---|---|---|---|---|
|
Crofting |
Small Medium Large |
Crofting Tenant Crofting Owner |
Traditional small-scale sheep and suckler cow producers in highlands and islands LFA area with a small area of arable crops grown for livestock feed on the croft with the livestock grazing on the common grazing (which is shared with multiple crofters in the township). There are around 20,000 crofts in Scotland. |
Highlands & Islands North East South East South West All |
YES |
|
Grazing (mixed beef and sheep) |
Small Medium Large |
Tenant (LDT/SLDT/MLDT) Tenant (grazing) Tenant (secure) Owner |
Single or multiple farms managed solely for beef and sheep purposes. Typically, they possess the lowest earnings of any farm types which may limit ability to adopt environmental measures. |
Highlands & Islands North East South East South West All | |
|
Mixed Farm |
Small Medium Large |
Tenant (LDT/SLDT/MLDT) Tenant (grazing) Tenant (secure) Owner |
Single or multiple farms managed (either all owned or mixture between tenanted and seasonal lets) across Scotland, enterprises vary, from specialist pig, dairy, arable, beef and sheep units to soft fruit and veg growing. Can vary in size/output/profitability. |
Highlands & Islands North East South East South West All |
YES |
|
Arable |
Small Medium Large |
Tenant (LDT/SLDT/MLDT) Tenant (grazing) Tenant (secure) Owner |
Single or multiple farms managed solely for arable purposes. Concentrated in the South East/North East and generally make lower profits than other activities such as specialist horticulture and dairy. Around 10% of Scotland’s total agricultural area in 2019 was arable land. |
Highlands & Islands North East South East South West All | |
|
Dairy |
Small Medium Large |
Tenant (LDT/SLDT/MLDT) Tenant (grazing) Tenant (secure) Owner |
Single or multiple farms managed solely for dairy purposes. Generally the most profitable type of enterprise in Scotland which may increase their ability to adopt environmental practices. Often possess a large environmental impact. In 2021 dairy cows numbered 174,200 in Scotland. |
Highlands & Islands North East South East South West All |
YES |
|
Intensive pig & poultry |
Small Medium Large |
Tenant (LDT/SLDT/MLDT) Tenant (grazing) Tenant (secure) Owner |
Single or multiple farms managed solely for pig & poultry purposes. As of 2020 there were 14.4 million poultry and 337 thousand pigs. |
Highlands & Islands North East South East South West All | |
|
Soft fruit |
Small Medium Large |
Tenant (LDT/SLDT/MLDT) Tenant (grazing) Tenant (secure) Owner |
Single or multiple farms managed solely for soft fruit purposes. In 2020 the estimated total area of soft fruit was 2,200 hectares. |
Highlands & Islands North East South East South West All | |
|
Estate (Multi farm/croft) |
Small Medium Large |
Tenant (LDT/SLDT/MLDT) Tenant (grazing) Tenant (secure) Owner |
Similar to a farm owner, may employ a factor or a land agent to have day to day responsibility for the land management interests and overseeing the entire estate incl. tenants, will likely have other land based income such as renewables, forestry, holiday/residential lets, sporting etc. |
Highlands & Islands North East South East South West All | |
|
Estate (Sporting) |
Small Medium Large |
Tenant (LDT/SLDT/MLDT) Tenant (grazing) Tenant (secure) Owner |
Estate that is managed solely for sporting purposes. Willingness to adopt is constrained by the desire to keep sporting estate, e.g. deer and grouse, in its current state. However, environmental management is often a priority for these land managers. |
Highlands & Islands North East South East South West All |
YES |
|
Estate (Conservation) |
Small Medium Large |
Tenant (LDT/SLDT/MLDT) Tenant (grazing) Tenant (secure) Owner |
Purchased for environmental ethical reasons, usually removed from agricultural production and returned to nature through rewilding (tree planting, peatland restoration). Pro-environmental goals of land management increase willingness to adopt however unlikely to engage with wider advice. |
Highlands & Islands North East South East South West All | |
|
Charity organisation |
Small Medium Large |
Tenant (LDT/SLDT/MLDT) Tenant (grazing) Tenant (secure) Owner |
Purchased and managed for environmental reasons, may carryout limited agricultural activity using livestock to graze habitats. Main activity is nature restoration/conservation. Reliance on charitable funding could constrain the ability to adopt. |
Highlands & Islands North East South East South West All |
YES |
|
Public ownership |
Small Medium Large |
Tenant (LDT/SLDT/MLDT) Tenant (grazing) Tenant (secure) Owner |
Land owned and managed by public bodies (including Local Authorities). Examples of this could be the MoD, who own 64,900 hectares in Scotland. Normally managed with a primary function in mind, such as training zones. |
Highlands & Islands North East South East South West All | |
|
Estate (Investment) |
Small Medium Large |
Tenant (LDT/SLDT/MLDT) Tenant (grazing) Tenant (secure) Owner |
Land managed with investment priorities, either through natural capital (carbon offsetting) or commercial production of timber. Often used to offset internal carbon emissions of large corporations (such as Aviva) and therefore disengaged with wider support systems. |
Highlands & Islands North East South East South West All |
YES |
*Priority – this column indicates that this archetype was identified as a priority for this research project by the steering group.
Appendix C – Interview methodology
Interview methodology for land use support
A Discussion Guide (see below) for semi-structured interviews was developed and a list of target candidate interviewees was also drawn-up and agreed. Candidate interviewees were chosen to represent recipients of support, providers of information and advice, and academic experts.
Semi-structured interviews were arranged in advance by email and conducted mostly by video conferencing with some conducted by mobile phone. Interviews lasted 25 to 85 minutes and occurred between 17th June and 3rd August 2023. Overall, 25 interviews were conducted with 28 interviewees (plus one by email only). The list of interviewees is shown in the table below.
Written notes were taken during interviews, and subsequently converted into reflective summaries immediately afterwards to capture key insights. The use of formal thematic coding and software analysis was not deployed and, to protect commercial confidentialities, no quotes have been attributed to individual interviewees.
Table 7 – Interviewee’s organisation
|
Interviewee’s organisation |
Principally representing |
|
Confor |
Support recipients |
|
Scottish Tenant Farmers Association |
Support recipients |
|
Community Land Scotland |
Support recipients |
|
NFUS |
Support recipients |
|
Rewilding Scotland (email only) |
Support recipients |
|
SCF |
Support recipients |
|
Milk Suppliers Association |
Support recipients |
|
Institute of Auctioneers & Appraisers in Scotland |
Support recipients |
|
Scottish Land and Estates |
Support recipients |
|
Pasture for Life |
Support recipients |
|
RSPB Scotland |
Support provider |
|
Lantra |
Support provider |
|
Scottish Agricultural Organisation Society |
Support provider |
|
South of Scotland Enterprise |
Support provider |
|
Independent Forestry Consultant |
Support provider |
|
Forest Carbon |
Support provider |
|
Peatland Code |
Support provider |
|
SAC Consulting |
Support provider |
|
ScotFWAG |
Support provider |
|
Soil Association |
Support provider |
|
Agricultural Industries Confederation |
Support provider |
|
Future Ark and FLS non-exec Director |
Support provider |
|
University of Leeds |
Academic expert |
|
University of Gloucestershire |
Academic expert |
|
University of Aberdeen |
Academic expert |
|
Royal Agricultural University |
Academic expert |
|
James Hutton Institute |
Academic expert |
As with all efforts to canvass opinion from industry stakeholders, the approach taken was limited by the resources and time available to conduct interviews – further interviews might have produced additional insights. Moreover, it is possible that the profile of interviewees or selective answering of questions by them could bias reported findings. However, there was a high degree of consistency across interviews (and with the literature) in terms of the issues identified, implying that participation was in good faith.
Discussion guide
- What factors influence land managers’ ability to adopt new management practices and/or land uses?
- What factors influence land managers’ willingness to adopt new management practices and/or land uses?
- What types of support are required? What determines engagement with them?
- What sources of support are available? Any pros and cons for different sources?
- What mode of (non-funding) support are available? Any pros and cons for different modes?
- What affects the availability, accessibility and credibility of (non-funding) support?
Appendix D – Literature review methodology
We undertook a focused literature review to identify existing policy and research relating to existing support systems in the agricultural industry in Scotland. In order to conduct a robust, rapid evidence review, key search terms were agreed with the steering group. Search terms were applied to both academic search functions and generic search providers. This ensured a wide range of academic and grey literature was captured. Search terms can be found below in Table 8.
Table 8 – Search terms
|
Theme |
Search term |
|
Support systems |
Land manager; support systems, access to funding, grants, loans, barriers to funding, barriers to finance, incentives (Scotland, UK) Low-carbon farming; support systems, access to funding, grants, loans, barriers to funding, barriers to finance, incentives (Scotland, UK) Financing land support measures (Scotland, UK) Land use change support systems (Scotland, UK) Green finance and agriculture (Scotland, UK) Private finance and agriculture (Scotland, UK) Government support of; rural economy, rural environmental objectives, agricultural environmental objectives (Scotland, UK) Additional terms for specific support systems: Forestry grant scheme, woodland grants, woodland carbon code, peatland code, conservation funding, peatland advisory services, Peatland Action, Nature restoration fund (Scotland, UK) |
|
Land manager decision making and motivations |
Path dependence in Scottish Agriculture. Land manager; decision making, motivations, motivations in seeking change, land use change, access to knowledge, access to skills, knowledge sharing, advice, training, information gathering, barriers to change, sunk costs and stranded assets (Scotland, UK) Agricultural; decision making, motivations, motivations in seeking change, land use change, access to knowledge, access to skills, knowledge sharing, advice, training, information gathering, barriers to change, sunk costs and stranded assets. (Scotland, UK) Land manager; diversification activities. (Scotland, UK) Agricultural; diversification activities. (Scotland, UK) Land manager; experience of support systems, engagement with support systems, experience of funding, experience with subsidies, experience of applications, experience with support systems. (Scotland, UK) Agricultural; experience of support systems, engagement with support systems, experience of funding, experience with subsidies, experience of applications, experience with support systems. (Scotland, UK) |
Key
Words in bold are the truncated search term, with the phrases following added onto the stem to broaden the use of the stem word. Where (Scotland, UK) is indicated, these terms will be added to the end of each search term in that group.
© The University of Edinburgh, 2024
Prepared by LUC on behalf of ClimateXChange, The University of Edinburgh. All rights reserved.
While every effort is made to ensure the information in this report is accurate, no legal responsibility is accepted for any errors, omissions or misleading statements. The views expressed represent those of the author(s), and do not necessarily represent those of the host institutions or funders.
Scottish Greenhouse Gas Statistics 2021. Accessed 15/02/2024 ↑
The level of detail offered by stakeholders regarding specific public funding schemes varied, but most suggested that agri-environmental type schemes were more complex to enrol in. ↑
Although in practice there may be some overlap since funding may be made available to facilitate interaction with other forms of support. For example, grants to attend training sessions. ↑
i.e. one advisor to one land manager or one advisor to many land managers ↑
The Pareto principle (also known as the 80/20 rule) states that roughly 80% of outcomes come from 20% of input effort. ↑
For example, the AIC estimates that its members deploy c.125 staff in Scotland under Feed Adviser Register (FAR) system, which compares with c.140 FBBASS accredited advisers. ↑
https://www.ruralpayments.org/ ↑
https://www.nature.scot/doc/scotlands-agri-environment-and-climate-scheme-summary ↑
Financial support is normally accompanied by at least the provision of information but sometimes also more interactive advice. ↑
https://www.webarchive.org.uk/wayback/archive/20220804182342/https://www.gov.scot/publications/dairy-sector-climate-change-group-report-2/documents/ ↑
https://www.gov.scot/binaries/content/documents/govscot/publications/independent-report/2021/06/blueprint-sustainable-integrated-farming-crofting-activity-hills-uplands-scotland/documents/hill-upland-crofting-group/hill-upland-crofting-group/govscot%3Adocument/hill-upland-crofting-group.pdf ↑
https://www.hutton.ac.uk/sites/default/files/files/WCC%20Poster%20Website.pdf ↑
https://www.gov.scot/binaries/content/documents/govscot/publications/corporate-report/2016/12/mackinnon-report/documents/analysis-current-arrangements-consideration-approval-forestry-planting-proposals-pdf/analysis-current-arrangements-consideration-approval-forestry-planting-proposals-pdf/govscot%3Adocument/Analysis%2Bof%2Bcurrent%2Barrangements%2Bfor%2Bthe%2Bconsideration%2Band%2Bapproval%2Bof%2Bforestry%2Bplanting%2Bproposals.pdf ↑
https://www.gov.scot/binaries/content/documents/govscot/publications/research-and-analysis/2021/03/scottish-land-fund-evaluation/documents/scottish-land-fund-evaluation/scottish-land-fund-evaluation/govscot%3Adocument/scottish-land-fund-evaluation.pdf ↑
https://www.fas.scot/publication-type/ktif-reports/ ↑
a very typical example of a certain person or thing. ↑
e.g.: Mustin, K., Newey, S. and Slee, B., 2017. Towards the construction of a typology of management models of shooting opportunities in Scotland. Scottish Geographical Journal, 133(3-4), pp.214-232.; Sutherland, L-A., Barlagne, C. and Barnes, A.P. 2019 Beyond ‘hobby farming’: towards a typology of non-commercial farming; Barnes, AP; Thompson, B; Toma, L. 2022 Finding the ecological farmer: a farmer typology to understand ecological practices within Europe. ↑
Completed in September 2024
DOI: http://dx.doi.org/10.7488/era/5006
Executive summary
Purpose
Collaborative landscape management is the enhancement of ecosystems via combined efforts of multiple farmers and land managers across a landscape. It has potential to help meet Scottish Government targets associated with addressing biodiversity loss and climate change.
This research, commissioned by Scottish Government, investigated a variety of models and experiences of collaboration to explore how support for collaborative landscape management in Scotland could be provided. This can help inform how such support may be incorporated in the Agricultural Reform Programme and other relevant policy areas.
Key findings
Overall, stakeholders were keen to see that we build on what exists already, rather than reinventing the wheel.
Relevant examples of collaboration in Scotland:
- Facility for Investment Ready Nature in Scotland (FIRNS)
- Deer Management Groups
- Tweed Forum
- Working for Waders (led by the RSPB)
- Findhorn Watershed Initiative
The English farmer cluster model is also considered successful in bringing farmers together and initiating and planning for collaborative activities. This is beginning to be replicated in Scotland, for instance in Strathmore, Moray, Lunan Burn and West Loch Ness, mainly supported by the Game and Wildlife Conservation Trust.
International examples:
- Landscape Enterprise Networks (efforts are underway to develop LENs in Leven and elsewhere in Scotland).
- The FASB initiative in Brazil
- The Cevennes National Park in France
- The EU Interreg Partridge project
Success factors, required support and opportunities
Informed by the main success factors in these examples, as well as their own knowledge and experience, stakeholders identified the following support needs:
- Facilitation to bring groups together and enable planning, preparation for and implementation of collaborative landscape management approaches. This includes long-term funding and training for facilitators. This could be provided through a mechanism akin to the Countryside Stewardship Facilitation Fund delivered in England by DEFRA, or expanding the Farm Advisory Service.
- Long-term funding dedicated to incentivising and supporting implementation of collaborative activities. This could include investing in existing collaborative structures, such as farmer clusters, Regional Land Use Partnerships, Landscape Enterprise Networks and Deer Management Groups. Greater accessibility and flexibility of funding are needed to encourage engagement in collaborative landscape management.
- Encouraging private sector investment to incentivise engagement in collaborative landscape management and enable greater flexibility for context-specific, bespoke projects. This could be encouraged by increasing the scale of FIRNS and completing development of NatureScot’s Landscape Scale Natural Capital Tool. The Scottish Government could also actively broker direct connections between farmers and private-sector organisations.
- Training, conferences and knowledge sharing to foster a culture of collaboration.
- Monitoring, evaluation and communication about the benefits of collaborative landscape management approaches. For example, through building on data such as NatureScot’s Ecological Surveys and Natural Capital Tool, as well as community science approaches.
- Coordinated support for collaboration, both across government policies and between government and other stakeholders. Collaboration may be incentivised by increasing support points in the Agri-Environment Climate Scheme and Nature Restoration Fund.
Gaps and opportunities for future research and innovation
We have found tensions between stakeholders’ preferences for greater incentives and the importance of regulation, as well as between simplicity and flexibility of support mechanisms. Private sector involvement may incentivise flexible collaboration. However, approaches that ensure private-sector-led nature restoration initiatives remain responsible and accountable, whilst making favourable returns on investment, need to be explored.
Glossary / Abbreviations table
|
Collaborative landscape management |
Enhancement of ecosystems via the combined efforts of multiple farmers and land managers across a landscape (Westerink et al., 2017). |
|
AECS |
Agri-environment climate scheme |
|
Biodiversity |
The variability among living organisms from all sources including terrestrial, marine and other aquatic ecosystems and the ecological complexes of which they are a part (Intergovernmental Science-Policy Platform on Biodiversity and Ecosystem Services). |
|
CSFF |
Countryside Stewardship Facilitation Fund |
|
DMGs |
Deer Management Groups |
|
ECAF |
Environmental Cooperation Action Fund |
|
Facilitation |
Activities provided by an individual or organisation to run meetings, foster relationships, discussions, planning and learning. May also include coordination of administrative tasks for groups of collaborators (Leach and Sabatier, 2003). |
|
FAS |
Farm Advisory Service |
|
FIRNS |
Facility for Investment Ready Nature in Scotland |
|
GWCT |
Game and Wildlife Conservation Trust |
|
LENS |
Landscape Enterprise Networks |
|
LEAF |
Linking Environment and Farming |
|
Natural capital |
Defined by NatureScot as: A term for the habitats and ecosystems that provide social, environmental and economic benefits to humans. |
|
NGOs |
Non-governmental organisations |
|
NRF |
Nature Restoration Fund |
|
RLUPs |
Regional Land Use Partnerships |
|
RSPB |
Royal Society for the Protection of Birds |
|
SAOS |
Scottish Agricultural Organisation Society |
|
SAC |
The Scottish Agriculture Consultants |
Acknowledgements
The authors would like to thank all the stakeholders who participated in this study, Antonia Boyce for review and project management support, and Alhassan Ibrahim for review.
Introduction
Context
It is widely acknowledged that transformative change is needed to address biodiversity loss and climate change at pace and at scale. The Scottish Government has therefore set ambitious targets to meet ‘Net Zero’ by 2045 and proposed nature restoration targets for the same period, for inclusion in a Natural Environment Bill. Meeting these targets will require collaboration across the boundaries of individual farms and land holdings, to match land management to the scale of habitats, catchments, and landscapes.
Defining collaborative landscape management
Various definitions of collaborative landscape management exist. For the purpose of this report, we use the definition: enhancement of ecosystems via the combined efforts of multiple farmers and land managers across a landscape (Westerink et al., 2017). Academic literature indicates such approaches can enable positive outcomes for nature and climate change (Kuhfuss et al., 2019), increasing information flows and learning (Prager and Creaney, 2017), as well as reducing the likelihood of conflicting or duplicate efforts by neighbours (Westerink et al., 2017). In so doing, they may offer better value for public money.
However, it cannot be assumed that farmers and land managers are able and willing to collaborate across a landscape. Collaboration requires time and effort. Support mechanisms such as agri-environment schemes have historically been directed at the level of individual farms, rather than at the landscape scale. Scottish Government are therefore keen to understand more about how to create a supportive policy environment for collaborative land management practices.
Existing research on collaboration between farmers indicates that it often depends on long-term relationships and knowledge-sharing, supported by facilitators (Kuhfuss et al., 2019). Where farmer groups already exist, their facilitators are known to be a key influence on farmers’ learning (Prager and Creaney, 2017). The importance of facilitators is also true for other types of landscape-scale collaborations (Waylen et al., 2023). This is especially relevant as other types of landscape-scale partnerships also exist in Scotland, such as Rural Land Use Partnerships (RLUPs), Deer Management Groups (DMGs), and voluntary catchment management partnerships. Ongoing research on collaborative management interventions (JHI-D4-1[1]), in the Scottish Government’s Strategic Research Programme also emphasises the importance of peer-to-peer learning and building on social capital.
There are therefore a variety of models and experiences of collaboration, from which lessons may be drawn. To enable collaborative landscape management for conservation and climate change outcomes, it is therefore important to identify what existing networks and institutions can be built on and how. This will help to establish what approach(es) for supporting collaborative landscape management will be most worthwhile, and feasible, to include in the future agricultural support framework and other policy developments. To assist in understanding how collaborative landscape management can best be supported, the Scottish Government commissioned this CXC study, in which we built on key concepts and insights from the academic literature and explored this issue with key expert stakeholders in Scotland.
Aim
This study engaged with agricultural and conservation stakeholders (including farmers, land managers, conservationists, and academic experts), in Scotland. We explored their expert opinions regarding how collaborative landscape management can be supported to deliver positive outcomes for climate and nature in Scotland. Specifically, we addressed the following research questions:
- What examples of effective support for collaborative landscape scale activities may be identified and what lessons may be learned from them?
- What should support measures look like, to enable farmers and land-managers to engage in collaborative landscape management? What are their relative advantages and disadvantages? How might they enrich and elaborate on existing approaches?
- What are the barriers and opportunities for uptake of collaborative landscape management?
- What benefits can collaborative approaches achieve, and how may they be monitored and evaluated?
The research involved stakeholder engagement through an online survey and in-person workshop, both conducted in June 2024. The methodology is explained in Appendix A.
Stakeholders’ experiences of collaborative landscape management
Stakeholders were keen to emphasise the importance of building on what exists already, rather than ‘reinventing the wheel’. This section therefore identifies existing examples of collaborative landscape management and draws lessons from them in terms of what is working well and what is challenging.
Examples of success
Stakeholders identified a range of examples of collaborative landscape approaches that they perceived as successful, within Scotland, across the UK, and internationally. Existing examples in Scotland included the following:
- The Facility for Investment Ready Nature in Scotland (FIRNS), delivered by NatureScot in collaboration with the Scottish Government. FIRNS is currently supporting 29 projects to improve their readiness to attract private sector investment. FIRNS is also stimulating flows of information and relationship-building via its ‘Community of Practice’ forum.
- The Deer Management Groups are helping to pool information about landscape-scale biodiversity and are encouraging collaboration by bringing people together to work on a common issue (deer management). Groups are entirely different in composition but all work at landscape scale. Initially, this was primarily to manage a single resource (deer), but over the last ten years there has been a shift towards landscape planning in the public interest, including peatland restoration, woodlands and communities. These collaborative mechanisms have been well established but are currently facing a lack of funding for continuation of this work.
- The Tweed Forum are carrying out a great amount of work around river management through building trust among different stakeholders, to engage them in landscape-scale nature restoration. They have successfully improved water quality at the catchment scale, via a collaborative approach.
- The Working for Waders initiative in Strathspey is an example of an environmental NGO funded landscape scale project. It involves a range of different stakeholders, including farmers and the Royal Society for the Protection of Birds (RSPB), to protect and restore habitat for waders in Scotland.
- The ‘Findhorn Watershed Initiative’ have achieved success in winning Just Transition funding to support building partnerships among different stakeholders for collaborative landscape management approaches. This funding allows for not just the restoration work but also building social capital and socio-economic aspects.
- The Dee Invasive Non-Native Species Project (DINNs) has a lot of farmers working collaboratively and has good examples of large-scale projects that have achieved funding with relative ease. They were described as ‘doing what they say on the tin’ within their work, one example being bringing people together to collaborate on the removal of Himalayan Balsam (an invasive plant species) in their landscape.
- The Cairngorms Nature Index (CNI), built on an example from The Norwegian Institute for Nature Research (NINA), collects data around health of habitats, species and ecosystems and attempts to put it into a standardised format that people can draw on. This has potential to inform clusters in the areas, however this link is not currently there.
The main example from England, which stakeholders spoke highly of, was farmer clusters:
- Farmer clusters are showing success in bringing farmers together and initiating and planning for collaborative activities. This is especially the case where they receive support from the Countryside Stewardship Facilitation Fund (CSFF) delivered by DEFRA. The CSFF supports the time and resources needed for facilitators to arrange meetings, create opportunities for information sharing and conduct administrative tasks. Specific examples that participants mentioned, included the North East Cotswold Farmer Cluster and the Selborne Landscape Partnership.
A wide range of international examples of collaborative landscape management were cited. The full list is included in Appendix B. Some key examples included:
- Landscape Enterprise Networks are helping to build networks of farmers and land managers in multiple countries.
- The FASB initiative in Brazil is supporting local-level nature restoration initiatives by creating collaborative working groups, facilitating peer-to-peer learning, and supporting existing local-level initiatives.
- The Cevennes National Park in France is achieving strong engagement from landowners, by working hand-in-hand with them.
- The EU Interreg Partridge project was considered successful in ensuring consistency for managing species across landscapes.
- The Netherlands is generally considered to have a strong culture of collaboration among farmers. Indeed, collaboration is compulsory for some types of agricultural support.
What is working well?
We draw the following lessons from the above examples of success, regarding what is working well in supporting collaborative landscape management.
Facilitation
The examples of success emphasise the importance of providing a forum for groups of farmers, land managers and other stakeholders to come together in the first place, share ideas, plan and build trusting relationships. One survey respondent emphasised the importance of leadership and building trust: “…a note about how important it is to have trusted people in the area you’re working in, well respected. Leadership and trust is important.” Farmer clusters have been particularly successful in England for encouraging local collaboration between landowners. The perceived success of these English farmer clusters was largely attributed to the fact they can benefit from the CSFF, which supports the time and resources needed for facilitators to arrange meetings, create opportunities for information sharing and conduct administrative tasks. This can help bring farmers and land managers together, in the first place, to agree objectives and plan for long-term and evolving goals/projects to maintain engagement within the group.
Bespoke projects
Bringing groups of farmers and land managers together around a specific, common issue can be particularly effective, as this helps provide a clear reason and motivation for why collaborative landscape management is needed. If different farmers and land managers are able to relate with each other around challenges that they are facing, this can encourage strong relationships between them. The Tweed Forum was raised, by both conservation organisations and farmers, as an example of positive work being carried out around river management. It has focused on bringing local land managers and farmers together to tackle issues such as water quality and run-off. Their approach centres on strong leadership and trust building. Similarly, the Riverwoods project was mentioned as a successful network working towards creation of riverbank woodlands and healthy river systems across Scotland. The Deer Management Groups described themselves as a particular example of a bespoke arrangement, in that they bring people together to work on the specific issue of deer management. “… we represent 50 deer management groups which cover something like 3 million hectares of the uplands, the groups are entirely different in composition but all of them working at landscape scale, initially to manage a resource, which was deer”. Other examples that focused on management of a particular issue included management of beavers, management of habitats for partridge in the EU Interreg project, and removal of Himalayan Balsam in the Dee catchment. A farmer representative used these examples to argue that one-size-fits-all approaches are not always appropriate. He thus emphasised the importance of tailoring collaborative landscape management to specific contexts.
Forums for sharing and learning
Forums for sharing knowledge and experience were considered factors for success in several of the examples above. Such forums can help communicate the benefits of collaborative landscape management, as well as enable learning that could help others to achieve these benefits elsewhere. The FIRNS ‘Community of Practice’ was considered a useful forum by many stakeholders. This focuses on ensuring farmers, land managers and other stakeholders are informed and able to engage in, and see benefits from, environmental markets and private investment in natural capital. For instance, a representative from Bioregioning Tayside suggested that the “community of practice model has been very effective across Scotland and a smaller ‘sister’ fund to FIRNS would be helpful”. A Leven LENS representative stressed that whilst the term ‘communities of practice’ has become a slight buzzword, communities of practice are really important for building channels of communication. Examples of other successful forums included ‘study tours’ (in which farmers visit others in another location to share knowledge and learning), the CSFF conference in England, and the Farm Advisory Service (FAS), which helps farmers to stay informed of new initiatives as they come onstream.
Integrated support
Involving various stakeholder groups in supporting collaborative landscape management was also a factor in the success of the examples above. This includes involving stakeholders beyond just government and the agriculture sector. For instance, LENS are bringing private and public-sector organisations together to broker negotiations, and eventually transactions for organising the buying and selling of nature-based solutions. The Working with Waders project is achieving success in Strathspey, through funding from non-governmental organisations (NGOs) and collaboration between NGOs and farmers. Projects like this show that NGOs are willing to collaborate on and fund projects, and that involving a wide range of stakeholders can generally increase capacity for collaborative landscape management in Scotland.
What is challenging?
The catalogue of successful examples of collaborative landscape management signifies that there is a breadth of positive collaboration taking place, which may be learned from and built upon. However, stakeholders also highlighted significant challenges faced for promoting collaborative landscape management approaches, which are explained as follows.
Inadequate facilitation and limited culture of collaboration
Stakeholders perceived poor facilitation and poor communication as preventative to collaboration. For long-term collaboration to work, stakeholders considered the choice of facilitator and engagement methods as key, suggesting consultations cannot be the only engagement method moving forwards. Collaborative projects benefit from a trustworthy, engaging, non-biased and pragmatic facilitator, who regularly stays in touch with participants and is willing to adapt their facilitation method based on the group’s needs. In the workshop, stakeholders perceived that support for facilitation is currently limited, which limits the availability of skilled facilitators to effectively support collaborations.
Stakeholders acknowledged that there is not generally a culture of collaboration between different farmers and land managers, or between the different government and non-governmental sectors involved in supporting collaborative landscape management, due to a historical culture of competition. The current competitive culture results in situations where new approaches, data and technologies are being copyrighted for individual financial gain, rather than shared and used collaboratively with other farmers and landowners for common benefit. Stakeholders in the survey, suggested this can result in hesitancy to engage and trust in new processes, as well as lose out on the benefits of collaboration between different sectors and organisations. For example, the projects listed in Section 5.1 show that NGOs are willing to work with farmers to fund and support collaborative projects. However, they do not currently benefit from agricultural support, which could widen their impact.
Unsuitable funding mechanisms
Our findings revealed a perception, among stakeholders, that current agricultural support is not suitable for supporting collaborative landscape management. Stakeholders consider existing agricultural support, particularly Agri-Environment Climate Scheme (AECS) and Nature Restoration Fund payments, as complicated, restrictive and competitive. This was considered a challenge for engaging in any kind of positive management for biodiversity and the climate, including collaborative approaches. According to stakeholders, the process of acquiring funding has a tendency to be extremely complex and time consuming, with ineffective mechanisms for distributing or releasing funds in a timely manner. Stakeholders also indicated that there is a lack of legal and legislative knowledge amongst farmers and landowners, and this is limiting their ability to apply for funding. Applications for funding, therefore, require a huge amount of effort and monetary investment. Indeed, the costs of initiating collaborations and preparing applications for grants and incentives, were considered significant challenges for engaging in collaborative landscape management. For example, a representative from the Deer Management Groups cited the financial burden of simply preparing an application as a major disincentive for farmers to engage in collaborative landscape management.
Stakeholders considered the competitive nature of funding to exacerbate this, as there are significant costs involved in starting-up and applying for funding, but limited chance of success. Farmer representatives, in particular, agreed that when funding is competitive many farmers simply will not bother applying, as the high cost of applications, combined with the high risk of failure, simply makes it not worthwhile. Multiple stakeholders agreed this structure puts smaller farmers and land managers at a disadvantage and favours large landowners, who have sufficient time and resources for making applications and absorbing fines that could occur through mistakes.
Stakeholders also perceived that, with the exception of getting extra points for collaborative projects in AECS, there is currently a lack of funding designed specifically to support collaboration. Stakeholders expressed concerns that existing grant funding is short term in nature (e.g. for AECS is only a 5-year agreement), which does not lend itself to building collaborations or implementing long term changes at a landscape scale. Additionally, AECS funding is points-based, meaning farmers are in competition with each other to meet the points threshold. This was considered a disincentive to engaging in collaboration.
Existing mechanisms for supporting collaboration were also considered too restrictive, in terms of the types of landscape management options that could be funded. Stakeholders emphasised that a one-size-fits-all approach will never work, and policy support for collaborative landscape management must take this into account. A farmer representative highlighted the geographic differences across landscapes and catchments. He emphasised that even the top of a hill and the bottom of the hill can be very different, and different landowners will have different needs. This is true not just of the physical landscape but also in farming techniques, revenue, or funding streams. As one survey response stated: “Single outcome objectives can limit participation and success”.
Siloed and top-down governance
Stakeholders raised further challenges, related to the approach taken by government, that they thought were hindering support for collaborative landscape management. In the workshop, although farmer representatives stated that the Government has been very imaginative, and that successes should not be forgotten, they also highlighted shortcomings in the Government’s approach. Stakeholders expressed a sentiment that the Government have not listened to them enough, despite continually providing feedback. They perceived this top-down approach from government as perpetuating power imbalances that favour some views about land use and management, over others, and do not offer any real help for farmers.
There was also a feeling that current policy exists in a siloed system in which agriculture, forestry and biodiversity policy do not interact. This can result in complexity and contested interests between different siloes and thus reduce political will and ability to act in support of collaborative landscape management. Some stakeholders, such as a representative from Scottish Environment LINK in the workshop, thought that existing initiatives were “very messy at the government level”. He argued that there are too many different targets and proposed initiatives, which, at the level of implementation at the landscape scale: “no one knows how it is supposed to fit together”. Some agricultural stakeholders also suggested that policies such as the Wildlife Bill and the Land Reform Agenda actually discourage collaboration, because they encourage fragmentation of land ownership.
Limited evidence for the benefits of collaborative landscape management
Stakeholders highlighted that there is limited awareness of successful examples of collaborative landscape management projects and their impacts. They considered this a barrier to promoting favourable attitudes and motivations for collaborative landscape management approaches. It is not always possible to imagine something you have never seen, and positive examples are needed for farmers and land managers to understand the potential benefits of collaborative landscape management. For example, a representative from Bioregioning Tayside felt that a lack of awareness around existing solutions has led to a lack of comprehension around how land could be managed to help deal with extreme weather events. Some stakeholders also highlighted successful landscape collaboration projects along the River Spey and the River Dee, but stressed that their impacts are limited by a lack of communication and knowledge-sharing amongst one another.
Stakeholders’ needs and aspirations for collaborative landscape management
Stakeholders were forthcoming in suggesting the types of support that they thought would enable and enhance collaborative landscape management. This section discusses the types of support that were suggested, as well as potential opportunities that could be taken.
What types of support are needed?
Stakeholders suggested a range of support mechanisms that they thought would help to deliver positive outcomes for climate and nature in Scotland
Support for facilitation of collaboration
Stakeholders considered facilitation as essential for organising collaborative landscape management approaches. This was considered important by stakeholders from across the range of perspectives represented in both the workshop and the survey. When asked how important facilitation of collaboration was for collaborative landscape management, 17 of 20 survey respondents agreed it was essential, with the remaining 3 suggesting it was somewhat important, as shown in Figure 1.
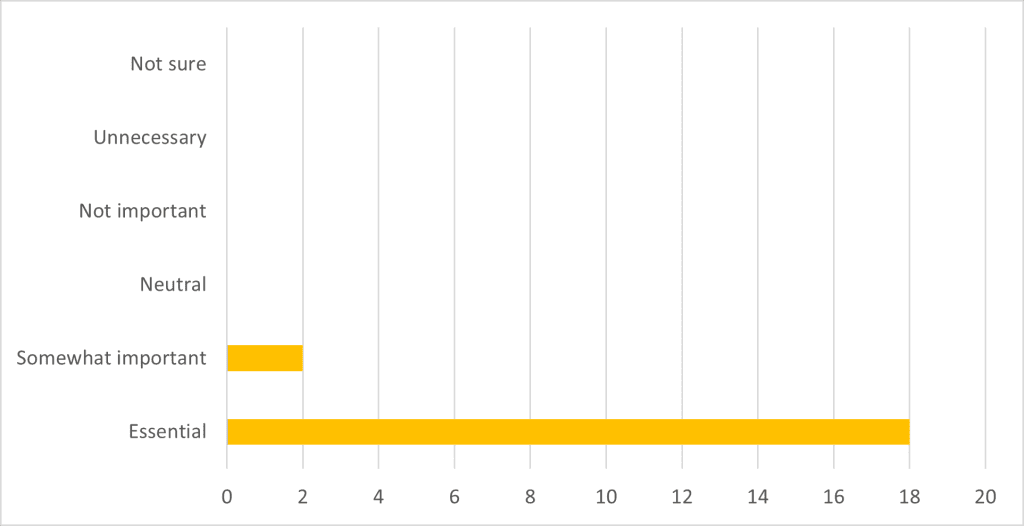
Facilitators can help, practically, to bring farmers and land managers together, from across a landscape, and help them to form groups that engage in collaborative activities together. In the survey responses, farmers, in particular, emphasised the importance of facilitators engaging with individuals, not just in a group setting, providing opportunities for social interaction, and establishing the conditions under which groups of farmers would be willing to collaborate. Others emphasised the importance of facilitators for building trust and long-term relationships, and who listen to and understand local needs and aspirations. For instance, a representative of a conservation NGO, stated: “To enable the group to come together and get underway, there needs to be a person who is good at bringing the group together and keeping them together.”
Facilitators were considered useful for helping groups of farmers and land managers set clear goals and expectations, incorporating different individual goals and expectations. This was emphasised by another representative of a conservation NGO in the survey: “There needs to be clear objectives and purpose established from the start, so everyone is clear as to why they are collaborating and what outcomes are expected. There should be a clear project plan with clear timelines”. In the workshop, it was suggested that encouraging facilitators to develop formally constituted agreements with groups they work with, can help encourage those groups to take risks associated with collaboration.
Stakeholders also thought that facilitators can help build the capacity of groups to ‘get things done’. This includes helping farmers and land managers to collect data for assessing biodiversity on their land, and then preparing maps and models of collaborative projects and their intended effects. It also includes supporting applications for funding to support collaborative landscape management projects, by conveying information and guidance about funding schemes, and then ensuring applications are prepared correctly, and in a professional format (which one existing farmer cluster facilitator stressed as highly important when groups are first starting up).
Stakeholders recognised that effective facilitation requires skilled individuals and appropriate investment in their training, time and resources. Facilitators need a wide-ranging set of skills, including: project management, mapping, monitoring and evaluation, diplomacy to manage competing interests, awareness of funding schemes, experience of funding applications, a combined understanding of both agricultural economics and biodiversity, and an ability to draw information from across relevant sectors. Stakeholders therefore stressed that facilitators themselves need to be supported, through training, and funding to pay for their time, skills and training.
In the survey, we asked stakeholders how long they thought support for facilitation of collaborative landscape management projects should last. As shown in Figure 2, the highest proportion of respondents thought support for facilitation should last 2-5 years (n=7), and the second highest proportion thought support should last 5-10 years (n=5). This emphasises the value of long-term support for facilitation.
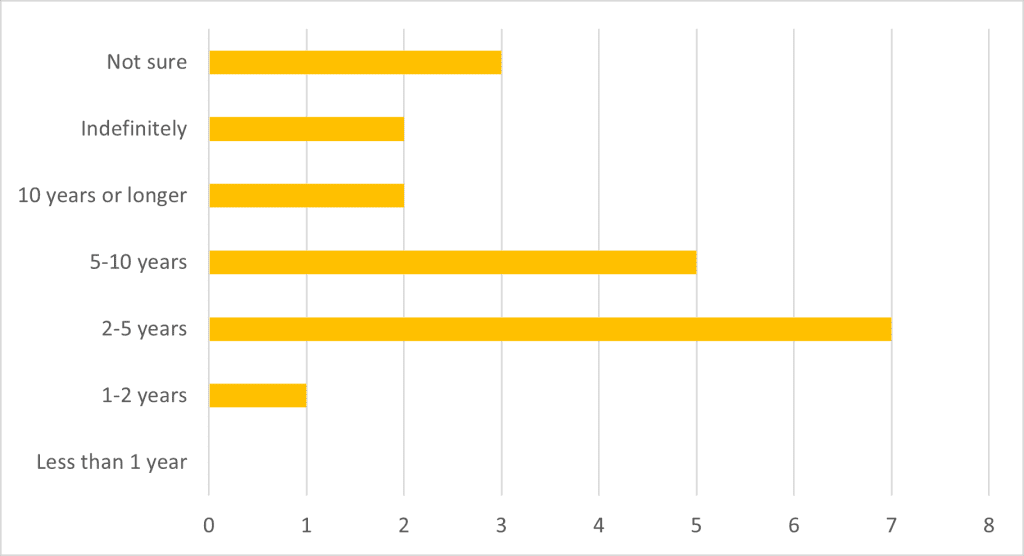
Funding to incentivise and implement collaborative activities
Perhaps unsurprisingly stakeholders, across the board, considered financial incentives and funding for implementation as imperative for supporting farmers and land managers to engage in collaborative landscape management activities. As noted in Section 5.3, stakeholders considered existing agricultural support schemes, such as Agri-Environment Climate Schemes (AECS) and Nature Restoration Fund (NRF) as currently unsuited for supporting collaboration. There was therefore a strong push for ‘holistic’ funding for landscape-scale collaboration that would cover support for the full range of different aspects involved in collaborative landscape management. This included:
- Start-up funding to help form groups in the first place.
- Capital funding to help groups acquire resources, such as machinery, and other materials needed to implement a collaborative project.
- Revenue funding for ongoing land management.
- Funding for tasks such as mapping and surveying biodiversity.
- Funding for administrative tasks such as writing and formatting applications.
- Funding for monitoring, evaluation and knowledge sharing.
- Funding for communications and publicity.
Farmers, especially, stressed financial incentives as the single most important support measure for encouraging collaborative landscape management. However, they suggested that it is essential for funding to align with farmers’ interests, rather than simply being lucrative. In the workshop, one cluster farmer stated, strongly: “the motivation to do the best for the environment is there, but the support is not coming. The government need to up their game and provide incentives. Farmers will go along, as long as they are paid, but we need help to do that”.
All stakeholders did recognise, however, that such holistic funding for collaborative landscape management would be expensive, and thus thought it would be challenging for public sector funding alone to provide this. In both the survey and the workshop, stakeholders showed interest in private sector investment as an alternative, or additional, source of funding for supporting collaborative landscape management. One advantage of this, that stakeholders identified, is that many businesses already have environmental targets and are ready and willing to invest in efforts to improve biodiversity and climate change outcomes. This may be for financial benefits (through nature finance), or to improve their reputation. Representatives from the Deer Management Groups and LENS explained that they are already working successfully with investment from private businesses, whilst several stakeholders cited FIRNS as an initiative that could help to build opportunities for private sector investment. One stakeholder, from Bioregioning Tayside, suggested that the government could encourage access to private sector funding by facilitating direct connections between groups of farmers and corporations with an interest in investing in them (such as large supermarkets). Another stakeholder, from a land agency cautioned about over-reliance on the private sector, noting that private sector investment is profit-driven and can make nature a marketable commodity.
The survey asked respondents to rank the importance of support for implementation of a collaborative landscape management project, shown in Figure 3. The highest proportion thought support should last 5-10 years (n=7) and the second highest proportion thought it should last for 2-5 years (n=6). This indicates the importance of medium-to-long-term support for collaborative landscape management projects to be successful.
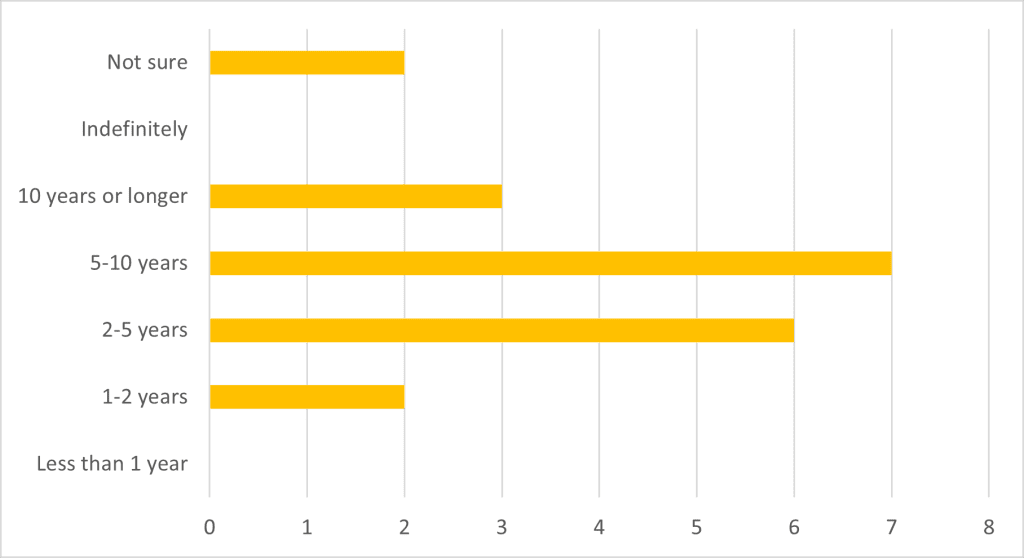
Education and advocacy
Whilst there was universal agreement on the importance of financial incentives, in the workshop, several stakeholders noted the importance of creating longer-term changes in attitudes and behaviour. Some stakeholders suggested that farmers, land managers, and others whose businesses depend on land and agriculture, need to understand the potential benefits of collaborative approaches to nature restoration for their business models. For example, crop production benefits from the presence of pollinating insects, so there is an inherent benefit to crop farmers managing land to protect those insects at the landscape scale. One stakeholder even questioned whether farmers and land managers should receive payment in instances where biodiversity is good for their businesses. However, there was some disagreement with this, especially from farmers, who argued that they already have the knowledge and motivation for nature restoration, they just need the funding.
Increasing flows of knowledge, information and learning about the benefits of biodiversity emerged as an important incentive, in addition to funding. This was considered a potential opportunity to encourage longer-term changes in attitudes and motivations that would promote management of land for positive nature restoration and climate change outcomes. Such changes could reduce dependence on financial incentives for collaborative landscape management. This emphasises the importance of increasing the visibility of successful collaborative projects, including through communication between projects and increasing opportunities for advocacy and information sharing.
Collaborative culture
In the workshop, several stakeholders suggested ways in which a collaborative culture may be encouraged in Scotland. A farmer representative pointed to the French agricultural support system as a positive example of a collaboration being encouraged. There was also some discussion around the idea that collaboration could be made compulsory to ensure it happens. A farmer representative asserted that this could be necessary, because in cases where voluntary schemes for collaboration have ended, collaborative action has stopped, or even been reversed. Such a compulsory approach is taken in the Netherlands, where there is a long history of group/cluster development, apparently with some success. However, for a compulsory approach to be successful in Scotland, stakeholders thought there would be a need for major group development across farmers and land managers. The idea of a compulsory approach was also criticised by a land agent, who thought it would be politically undesirable to implement and enforce. A representative from Scottish Land and Estates suggested a culture of collaboration could be created through a compromise of points-based awards for collaboration within Tier 2 agricultural support payments and then making collaboration compulsory in Tier 3 support. This was contested by a conservation NGO, as points for collaboration already exist in AECS and the NRF. Nonetheless, these points systems could be increased in scale, to incentivise collaborative activities.
Simplicity and flexibility.
As explained in Section 5.3, there was a strong sentiment, across all of the participating stakeholders, that current support measures, such as AECS, are too complicated to effectively support collaborative landscape management. There is therefore huge demand for simplified application processes. As shown in Figure 4, 17 survey respondents considered the accessibility of application processes to be essential, whilst the remaining 3 considered it somewhat important.
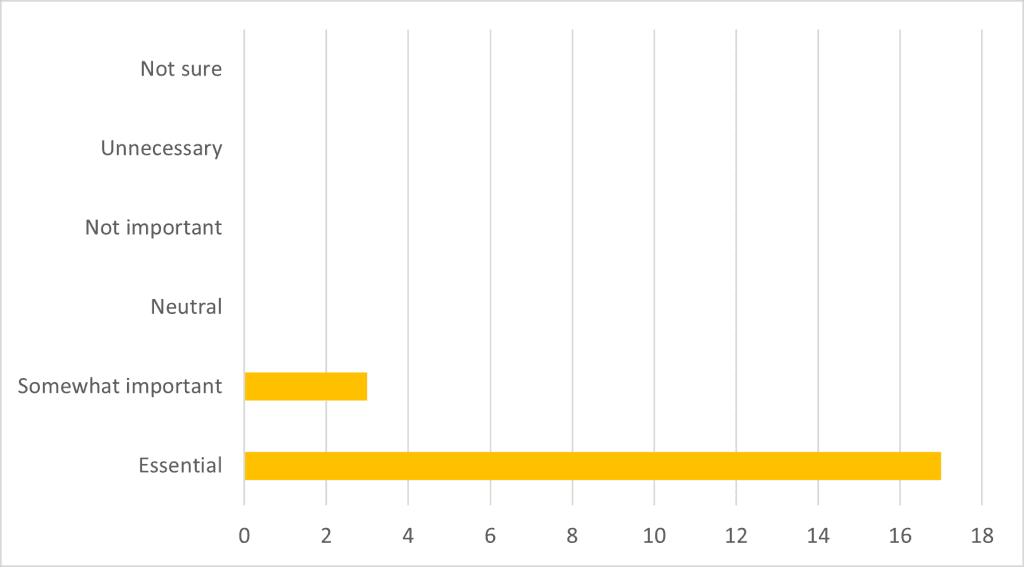
Stakeholders also wanted to see greater flexibility, in terms of the types of landscape management options for biodiversity restoration that farmers can access support for. Stakeholders highlighted a need for different types of collaboration in different landscapes for different purposes, and a need for bespoke funding, information and facilitation to be tailored to different contexts. For example, one representative from Bioregioning Tayside called for measures that “allow for agency and different interpretations, depending on context.” Similarly, one member of a farmer cluster suggested a need for different measures, and different governance structures, for collaboration in different regions, citing an example from France, in which different regions are supported in different ways. Another cluster farmer contended that flexibility is needed within specific landscapes, not just across different regions, and suggested that support measures could be tailored to specific habitats. Specific options that stakeholders wanted to see funding for included: planting trees, using grasslands to sequester carbon, mixed livestock and forest farming, reducing fertiliser use, and adoption of hydrogen as a fuel.
There were also calls for flexibility in terms of allowing for the fact that mistakes might be made during the implementation of collaborative landscape management approaches. Farmers were keen not to be punished too harshly for this and thought greater lenience would help reduce the risk of them engaging in collaborative landscape management. This was considered especially important for encouraging smaller farmers and land managers to engage in nature restoration. Stakeholders from Scottish Agricultural Organisation Society (SAOS) and Bioregioning Tayside thought the government needed to ‘let go’ of its risk aversion and accept that not all projects will work.
These calls for simplicity and flexibility must, obviously, be measured against a need for regulation and accountability, to ensure that collaborative landscape management is done effectively and makes best use of public funds. This was acknowledged by stakeholders, to some extent, though there was a strong push to favour flexibility and incentives over regulation. There is also a potential tension between demands for flexibility and demands for simplicity. The greater the variety of options that are offered, the greater the complexity of support required.
Integrated approach
Stakeholders indicated a need for clear and joined-up support and advice from Scottish Government. In the survey, 16 out of 20 survey respondents felt that navigating complex and contested interests and priorities was essential, the remaining 4 felt it was somewhat important, as shown in Figure 5, below.
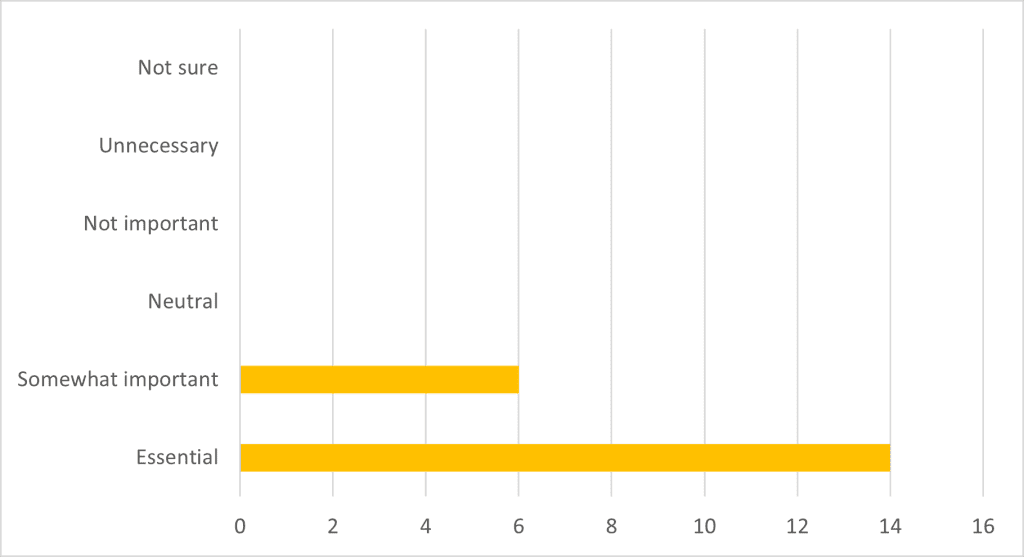
Taking an integrated approach to designing and implementing support, as well as governance of collaborative landscape management was considered a solution that could help navigate this complexity and contestation, as well as balance flexibility with accountability and simplicity. Stakeholders strongly suggested that for policies to successfully support collaborative landscape management, they must be joined-up and ensure they complement each other. To aid this, stakeholders wanted to see greater integration of different sectors, policies and government departments, as well as regular and meaningful engagement with stakeholders, to listen to their needs. For example, non-governmental organisations, such as the RPSB, LENs, Bioregioning Tayside and the Deer Management Groups, who are already doing collaborative work with farmers and land managers at a landscape scale, stated they would benefit from increased collaboration with the government and agricultural sector. Such a collaborative approach was perceived, by stakeholders, as advantageous, because working across sectors could help to improve simplicity and efficiency of support for collaborative land management, as well as build on existing efforts to increase the scale of collaborative landscape management. However, there could be a danger that involvement of other sectors could diminish support for agriculture. Some stakeholders were therefore careful to ensure that agricultural funding stays ringfenced.
Monitoring, evaluation and knowledge-sharing
Stakeholders also emphasised the importance of support for monitoring and evaluation of collaborative landscape management approaches. In particular, they thought this should involve support for understanding and mapping the biodiversity that exists in a landscape, and then assessing the impacts of collaborative projects on this biodiversity, over time. Stakeholders suggested a range of approaches for understanding the success or efficacy of collaborative landscape management projects. This included more informal opportunities for learning and sharing knowledge, as well as more structured approaches to formal monitoring and evaluation. In terms of learning and sharing knowledge, ‘study tours’ (where groups of farmers visit farmers in another location to learn from each other), and forums such as conferences and the FIRNS ‘community of practice’, were considered important for encouraging reflection and learning about collaborative landscape management. Stakeholders suggested several potential benefits of such opportunities for learning and sharing knowledge. In the workshop, one land agent thought they could help farmers and land managers understand what work is needed to manage landscapes for nature restoration in their local areas, and understanding how collaborations may be set up. A cluster farmer thought they could be used for sharing how business and funding decisions and agreements are made.
In terms of more formal, or structured, monitoring and evaluation, the importance of setting ‘baselines’ and maps of the biodiversity that exists in a landscape, at the start of a project, were considered essential by a range of stakeholders in both the survey and the workshop. For instance, a survey respondent from a conservation NGO stated that monitoring and evaluation should be conducted: “on a project scale by establishing the baseline and then how the project has moved beyond this”. In other words, farmers and land managers should establish what biodiversity exists in a landscape at the outset of a project, and then assess the success of the project according to whether and by how much biodiversity improves during the implementation of the project. This was reflected by similar suggestions across the survey and the workshop, with stakeholders indicating a need for farmers to be assisted in producing such baselines and associated maps. However, a GWCT representative in the workshop contended that such baselines of biodiversity need to be conducted at the level of individual farms, before they can be done at the landscape scale.
As is often the case when discussing approaches for monitoring and evaluation, there was tension between assessing standardised indicators of biodiversity and exploring more contextual, qualitative experiences. In the survey, several respondents, across different perspectives, called for monitoring and evaluation in relation to general standards of biodiversity, such as standardised ‘measurement, recording and verification’ frameworks. In contrast, other survey respondents emphasised the importance of context-specific monitoring and evaluation that takes specific, landscape-scale objectives into account and includes qualitative data regarding people’s relationships with the landscape and the biodiversity within it. One farmer specifically objected to ‘simplified biodiversity metrics.’ A respondent from a conservation NGO suggested that monitoring and evaluation should include recreational and cultural elements, as well as those related to biodiversity and climate outcomes. This was reflected by the strong sentiment in the workshop around the importance of flexibility and context-specific approaches. Striking a balance between standardised and context-specific approaches to monitoring and evaluation therefore remains a challenge.
Opportunities for supporting collaboration
Further to the needs for support, outlined above, stakeholders suggested several opportunities for improving support for collaborative landscape management. Again, stakeholders were keen to emphasise the importance of building on existing efforts, rather than ‘reinventing the wheel’.
Existing structures for enabling collaboration
Stakeholders suggested several existing initiatives that could be invested in to help consolidate and encourage uptake of collaborative landscape management approaches. Farmer clusters, which were considered a successful example of collaborative landscape management approaches, are beginning to be developed in Scotland. Thus far, these have largely been supported by the Game and Wildlife Conservation Trust, and exist in Strathmore, Moray, Lunan Burn, and West Loch Ness. Efforts are also underway to develop LENs in Leven and elsewhere. Stakeholders also suggested that the Regional Land Use Partnerships and Deer Management Groups already have structures in place for encouraging collaboration, and these could be built upon. Several stakeholders suggested that investment in these existing structures for networking and collaboration should be increased, particularly the Regional Land Use Partnerships (RLUPs) and FIRNS Community of Practice. Funds such as the Just Transition Fund may also be used to support building partnerships, as in the given example of the Findhorn Watershed Initiative.
Funding and training for facilitators
For supporting facilitation, specifically, stakeholders advocated for the English Countryside Stewardship Facilitation Fund’ (CSFF) to be adopted in Scotland. Some also highlighted that some support for facilitation was included in the Environmental Cooperation Action Fund (ECAF), although this closed in 2017, without having issued any funding. Some stakeholders suggested something similar could be incorporated into Scottish Government’s Tier 1 and Tier 2 agricultural support mechanisms. In terms of providing training to create a cadre of skilled facilitators, the Farm Advisory Service (FAS) were considered well-placed to contribute to this. Their services already include communicating and explaining new support schemes as they come online. It was suggested this could be expanded to provide opportunities for learning and training for facilitators, as well as delivering proactive facilitation of collaborative projects.
Incentives and funding for implementation
Stakeholders were keen for funding and financial incentives to support collaborative landscape management approaches. In terms of financial incentives for farmers to engage in collaborative activities, stakeholders considered the current incorporation of points for collaborative projects within Agri-environment Climate Scheme (AECS) payments as a positive, and suggested that the availability of points for collaboration should be expanded. Similarly, several stakeholders suggested including a collaborative element in the Nature Restoration Fund. Incentivising collaborative landscape management within the Basic Payment Scheme was also considered an opportunity.
Private sector investment
Many stakeholders, particularly those representing agri-environment NGOs, acknowledged that providing holistic financial support for collaborative landscape management would be expensive. It may not be possible for such support to be entirely provided by the public sector. Stakeholders were therefore keen to see greater private sector investment to support incentivisation and implementation of collaborative landscape management activities. Conservation NGOs highlighted that current ‘rewilding’ initiatives are already funded mostly through private business, including foreign investors. Exploring similar opportunities to support collaborative landscape management could therefore offer a solution to increasing financial incentives for this.
Various stakeholders highlighted opportunities to incentivise private companies to support collaborative landscape management. Some thought food companies could partner with or invest in collaborative groups of farmers, particularly local businesses operating within the same landscape. This was also thought to result in shorter supply chains, which could further complement biodiversity and climate goals. Others thought larger businesses (such as large supermarkets or chain restaurants) could be encouraged to build reputational capital in Scotland at a large scale, by investing in biodiversity and climate outcomes. Stakeholders highlighted that most businesses now have environmental targets and have an interest in contributing to positive outcomes for nature and climate. However, they still need a push from Government to take the initiative. Some stakeholders thought the role of Scottish Government could be to facilitate direct connections between farmer groups and private sector funders, whilst others suggested mandating companies to conduct ‘nature impact disclosures’ could push them to invest in nature restoration.
Existing initiatives that encourage private sector investment in natural capital were also considered useful for stimulating private sector investment. In particular, stakeholders spoke positively about the Facility for Investment Ready Nature in Scotland (FIRNS), and saw increasing the investment and scale of this as an opportunity for supporting collaborative landscape management. A ‘Landscape Scale Natural Capital Tool’, is also being developed by NatureScot, to assess and value natural capital assets across a landscape. There was a strong appetite, particularly among those representing farmer clusters, for further development of this, in partnership with private companies who have nature restoration goals. Some agricultural stakeholders also highlighted the opportunity for new forms of land tenancy, in which natural capital gets integrated into the value of a farm. They thought this could incentivise groups of farmers to collaborate, to increase the value of natural capital across a landscape.
Advocacy and education
Increasing advocacy, education and information flows was considered a useful approach for highlighting the benefits of collaborative landscape management for nature and climate, as well as businesses that depend on the land for productivity. Several stakeholders suggested that building on the existing approach taken by the FAS could be an opportunity to promote this. The FAS already help to communicate and explain information about new initiatives, as they come onstream. Stakeholders therefore considered them well-placed to facilitate communication and sharing of information about successful examples of collaborative landscape management projects, as well as improving understanding of the benefits of managing landscapes for positive nature and climate outcomes. Other suggested opportunities to increase knowledge and information flows about collaborative landscape management included: advocacy campaigns and training, conferences, ‘study tours’, and ‘place-based apprenticeships’ to increase awareness of environmental challenges for young farmers.
Some agricultural representatives also proposed that the farming media, and events, such as the Royal Highland Show, could do more to communicate the benefits of collaborative landscape management and provide recognition of successful collaborations. Printed, online or, podcast media, particularly those that farmers are actively listening to, represent an opportunity to highlight the need for collaborative landscape management. The wider group was in agreement and a representative from Scottish Land and Estates suggested their ‘Helping it Happen’ awards could incorporate a collaboration category to reward and promote collaborative approaches.
Creating a culture of collaboration
The opportunities presented above emphasise the importance and potential benefits of building on existing initiatives. Stakeholders were keen for a culture of collaboration to be created, in which all stakeholders are involved. Several stakeholders commended this engagement, as a useful step in taking stock of existing collaborations and involving stakeholders in planning support for collaborative landscape management. They were therefore keen for further such engagements. Some stakeholders, such as LENs and the Strathmore Farmer Cluster thought that accreditation of collaborative groups as ‘trusted operators’ would help consolidate their positions and encourage further collaboration. Stakeholders thought that greater integration across policies, as well as across sectors would help encourage collaboration. However, stakeholders acknowledged this is complex and agreed that agricultural support must remain ringfenced.
Monitoring and evaluation
Stakeholders also suggested several existing initiatives that could be built on to assist monitoring and evaluation of collaborative landscape management approaches. Farmer cluster groups were again highlighted as examples of best practice, in this case for developing standards and creating opportunities for data collection. For example, the Strathmore Cluster are currently using hand-held mapping systems for mapping key species. Deer Management Groups were also raised as an existing structure that could help to lead, pool and disseminate data. Similarly, Bioregioning Tayside are using ‘community science’, to involve local communities in monitoring biodiversity in their local area. Stakeholders thought such approaches could be useful for monitoring the effects of collaborative landscape management on biodiversity.
Increasing ‘open access’ to data, mapping and modelling also has the potential to help land managers and communities understand why change is needed. The Landscape Scale Natural Capital Tool, being developed by NatureScot was considered a useful initiative to support access to data. This is taking a holistic approach to recording different elements of a landscape, and their condition, such as soil types, or water quality. This tool could prove useful for understanding and mapping what is needed for positive outcomes for nature and climate, and could be used by collaborative groups to plan and set goals. Open access to such data could also allow groups to feel some ownership over it. However, stakeholders did raise the question of how and by whom data collection and mapping should be paid for. Some emphasised the fact that this too needs to be funded and facilitated.
Other useful data sources that stakeholders suggested, included ecological surveys and apps being rolled out by NatureScot, as part of the Agricultural Reform Programme, and the Linking Environment And Farming (LEAF) Sustainable Farming Review or data platforms like Omnia (a digital information tool for supporting farm management). One participant indicated that mobile apps for recording biodiversity, are being developed for biodiversity credit schemes. Several stakeholders also indicated that bringing in independent reviewers, such as universities and expert ecologists, could help to support monitoring and evaluation.
Conclusions
In this section, we draw conclusions in relation to what is currently working well, what is needed and what opportunities may be built upon for supporting collaborative landscape management. We also highlight some gaps and opportunities for further research and innovation. The conclusions are based on the input from stakeholders in this study. They are particularly relevant to the Scottish Government’s Agricultural Reform Programme but may also be relevant to other groups with resources and capacity to support collaborative landscape management.
What is working well?
It is important to build on existing initiatives and avoid reinventing the wheel. Successful collaborations in Scotland provide examples for how to bring people together and build relationships across landscapes and could thus be supported to build on their existing work. Stakeholders also consider that the English farmer cluster model works well. This is beginning to be replicated in Scotland. The main factors supporting these examples’ success were support for facilitation, bespoke projects that bring people together to work on an issue of common interest, forums for sharing knowledge and experience, and an integrated approach to supporting collaboration.
What support is needed?
Although the examples of success are encouraging, stakeholders thought that collaborative landscape management is currently hindered by limited support for facilitation, scarcity of suitable incentives and funding for implementation, poorly integrated approaches to support, and limited evidence of successful collaborations. Overall, Scotland was considered to lack a collaborative culture among farmers and land managers.
Facilitators are required to bring groups together and enable planning, preparing for and implementation of collaborative landscape management approaches. Support for facilitators is therefore required in the form of training, to develop their skillsets, as well as funding to pay for their time and skills.
Stakeholders also require incentives and long-term funding for development and implementation of collaborative landscape management activities. Encouraging private sector investment could act as an incentive, as well as supplementing public sector funding for implementation of collaborative activities. Balancing accessibility and flexibility of funding, with quality control and regulation, is a challenge, but stakeholders strongly thought that greater accessibility and flexibility are needed to encourage engagement in collaborative landscape management. Support for bespoke projects, perhaps utilising private sector funding, or tailored support for different landscapes and regions could help resolve this.
Education and advocacy are considered necessary to change attitudes and highlight the benefits of collaborative landscape management. This would be aided by support for monitoring and evaluation that demonstrates the effects of collaborative approaches. A culture of collaboration may also be fostered through an integrated approach to supporting collaborative landscape management. Stakeholders are keen for integrated policies within government, as well as involvement of actors beyond those directly involved in government and the agriculture sector.
What opportunities exist?
Existing examples of collaborative structures, such as farmer clusters, Regional Land Use Partnerships, Landscape Enterprise Networks and Deer Management Groups may be used as foundations for future collaborative landscape management approaches. Investing in them could thus help to consolidate and enhance uptake of collaborative landscape management approaches.
Funding for facilitation may be supported by adapting the English Countryside Stewardship Facilitation Fund for Scotland. The approach of the Farm Advisory Service could be elaborated to include training a cadre of skilled facilitators for collaboration.
Incentives for collaboration may be built into the Agri-Environment Climate Scheme and the Nature Restoration Fund, through increasing the points available for collaborative approaches in these schemes. Opportunities exist to increase private sector investment in collaborative landscape management, including increasing the scale of the Facility for Investment Ready Natural Capital in Scotland (FIRNS), and completing development of NatureScot’s Landscape Scale Natural Capital Tool. The Scottish Government could also play a useful role by actively facilitating connections between farmers and private-sector organisations, such as local businesses and larger scale supermarkets and chain restaurants.
Building on existing initiatives and networks could also help foster a culture of collaboration. This could include increasing opportunities for training, conferences and knowledge sharing, as well as communicating the benefits of collaborative landscape management approaches. There is growing access to data, including NatureScot’s Ecological Surveys and their developing Landscape Scale Natural Capital Tool, as well as other sources and types of knowledge, including participatory approaches like Bioregioning Tayside’s community science. These could help improve understanding of the effects of collaborative approaches, whilst promotion of collaborative landscape management approaches via the Farm Advisory Service, farming media and agricultural events could help raise awareness.
Gaps and opportunities for future research and innovation
The results of this project identified several tensions. Stakeholders appeared to prefer encouragement for collaboration via increasing incentives, but there was acknowledgement of the importance of regulation. They also requested both simplicity and flexibility to support context-specific, bespoke projects, but simplicity and flexibility are not always easily enabled together.
Private sector investment may help to increase incentives and provide some of this flexibility, but it will require caution to ensure standards continue to be met. Exploring and testing mechanisms for involving the private sector in a way that ensures responsible and accountable nature restoration, whilst making favourable returns on investment is an important opportunity for research and innovation.
Stakeholders also highlighted the importance of integration across government policies and between government and other stakeholders. However, questions about how such forms of integration may be achieved and who should be responsible for coordinating them, remain unresolved. Further research and innovation on the topic of integration is therefore important.
Although this study identified and engaged with a range of stakeholders and initiatives, the timescale for this project required tight targeting. Further engagement and a more in-depth appraisal would be beneficial. In particular, the 2024 UK General Election hindered engagement with UK Government stakeholders involved in collaborative landscape management approaches. Further engagement with the Farm Advisory Service could also be useful. It may also be enlightening to conduct a more in-depth appraisal of international examples of support for collaborative landscape management.
References
HODGE, I. 2024. The potential for local environmental governance: A case study of Natural Cambridgeshire. Journal for Nature Conservation, 79, 126631.
KUHFUSS, L., BEGG, G., FLANIGAN, S., HAWES, C. & PIRAS, S. 2019. Should agri-environmental schemes aim at coordinat-ing farmers’ pro-environmental practices? A review of the literature.
LEACH, W. & SABATIER, P. 2003. Facilitators, coordinators, and outcomes. Promise and Performance Of Environmental Conflict Resolution. RFF Press.
PRAGER, K. 2015. Agri-environmental collaboratives as bridging organisations in landscape management. Journal of Environmental Management, 161, 375-384.
PRAGER, K. 2022. Implementing policy interventions to support farmer cooperation for environmental benefits. Land Use Policy, 119, 106182.
PRAGER, K. & CREANEY, R. 2017. Achieving on-farm practice change through facilitated group learning: Evaluating the effectiveness of monitor farms and discussion groups. Journal of Rural Studies, 56, 1-11.
RILEY, M., SANGSTER, H., SMITH, H., CHIVERRELL, R. & BOYLE, J. 2018. Will farmers work together for conservation? The potential limits of farmers’ cooperation in agri-environment measures. Land Use Policy, 70, 635-646.
RUNHAAR, H. & POLMAN, N. 2018. Partnering for nature conservation: NGO-farmer collaboration for meadow bird protection in the Netherlands. Land Use Policy, 73, 11-19.
WAYLEN, K. A., BLACKSTOCK, K. L., MARSHALL, K. & JUAREZ-BOURKE, A. 2023. Navigating or adding to complexity? Exploring the role of catchment partnerships in collaborative governance. Sustainability Science, 18, 2533-2548.
WESTERINK, J., JONGENEEL, R., POLMAN, N., PRAGER, K., FRANKS, J., DUPRAZ, P. & METTEPENNINGEN, E. 2017. Collaborative governance arrangements to deliver spatially coordinated agri-environmental management. Land Use Policy, 69, 176-192.
Appendices
Appendix A. Methodology
We began by identifying a conceptual framework of factors likely to enable collaborative landscape management. We then invited people with knowledge and interest in agriculture, land management and conservation in Scotland to share their perspectives in a stakeholder engagement in June 2024. This involved two activities: 1) a consultation, via an online survey; and 2) a stakeholder workshop, held in person, in Perth on 25th June 2024. Each of these invited a range of stakeholders to respond to discussion questions, structured around a conceptual framework based on existing research about factors that support collaborative landscape management. Each engagement approach engaged 20 stakeholders. The survey was anonymous, so it is difficult to say precisely how many stakeholders contributed overall, but based on the organisations represented in each activity, we estimate around 30 stakeholders contributed overall. This yielded expert insights regarding lessons learned from experience of existing support for collaboration, as well as aspirations, needs, and interests of those involved in promoting and delivering collaborative landscape management. Below we first describe the conceptual framework, and then summarise the two stakeholder engagement activities, and how the resulting data were analysed.
Conceptual framework
A growing number of studies exist that identify and suggest factors that can contribute to supporting collaborative landscape management. These elements are brought together by Westerink et al. (2017), into a framework which suggests that to support collaborative landscape management, it is important to consider the following characteristics:
- Coordinating the collective effort of landholders across a landscape, and ensuring their efforts complement each other.
- Promoting the involvement of both governmental and non-governmental actors in processes of decision making around landscape management
- Enabling monitoring and learning from the effects of landscape management approaches
A range of specific factors have been suggested by various authors to help in enabling these characteristics (Hodge, 2024, Prager, 2015, Prager, 2022, Riley et al., 2018, Runhaar and Polman, 2018) These include:
- Building on existing relationships and collaborative activities.
- Skilled facilitation.
- Ensuring sufficient time, funding and resources are available, especially for facilitation.
- Setting clear and realistic expectations.
- Balancing top-down governance and bottom-up initiative.
- Navigating complex and contested interests and priorities.
- Learning, monitoring and knowledge exchange.
- User-friendly procedures for accessing incentives.
In this research, we used the above characteristics and specific factors to structure the questions for response in the consultation and discussion in the workshop, whilst remaining open-minded to responses emerging from beyond this framework.
Online consultation survey
The survey, administered online via Qualtrics, consisted of a mixture of open-ended and multiple-choice questions, which were structured around the factors that the conceptual framework identifies as important to consider for supporting collaborative landscape management. The open-ended questions asked stakeholders for their views on: supportive factors for collaborative landscape management; barriers to collaboration; the ideal roles of government and non-government actors; and understanding the impacts of collaborative activities. The multiple-choice questions asked stakeholders to rate how important they thought various factors would be in supporting collaborative landscape management, as well as how long they thought support should last for. The full list of questions is available in Appendix B.
In-person workshop
The workshop, held in-person at the Perth Subud Centre on 25th June 2024, brought together a group of 20 stakeholders to deliberate what was needed to support collaborative landscape management in a Scottish context. To provide a backdrop for the workshop discussions, the workshop began with a brief presentation by an academic expert on lessons for thinking about collaborative landscape management from elsewhere, followed by presentation of initial results from the online survey. Stakeholders were then asked to discuss the following set of four questions, based on the conceptual framework, in small groups, and list their responses:
- What is currently working well in terms of support for collaborative landscape management (drawing on examples from within Scotland and elsewhere)?
- What barriers exist for collaborative landscape management (drawing on examples from within Scotland and elsewhere)?
- In general, what types of support are needed to enable collaborative landscape management?
- How can learning and knowledge exchange about collaborative landscape management be supported?
The small group activity was followed by a full group session, in which stakeholders were asked to consider and discuss the question of how support for collaborative landscape management in Scotland could be done better, and then finally to note down suggested next steps. The full programme for the workshop is available in Appendix C
Recruitment of stakeholders
To recruit stakeholders for both the survey and workshop, we capitalised, initially, on contacts held by the research team with farmer clusters and non-governmental organisations working on biodiversity restoration and climate outcomes. We then expanded the selection through these networks, as well as via recommendations from Scottish Government partners. All of the stakeholders were invited to participate in both the survey and the workshop, though not all were able to participate in both. This resulted in a group of stakeholders who represented a range of different perspectives, including: farmers, farmer cluster facilitators, land agents, landowners, academic experts, and non-governmental organisations working in agriculture, land management and conservation. We also invited organisations involved in administering the Farm Advisory Service, but did not receive a response. Overall, 20 stakeholders participated in the survey and 20 (not all the same people) attended the workshop. These are listed in Table 1, below.
|
Sector represented |
Organisations |
|
Farmer clusters |
West Loch Ness Farm Cluster; Lunan Burn Wildlife Cluster; Strathmore Wildlife Cluster; Buchan Farm Cluster; Moray Farm Cluster |
|
Agri-environment NGOs |
Bioregioning Tayside; Linking Environment and Farming; South of Scotland Enterprise; ScotFWAG; Scottish Agricultural Organisation Society; Scottish Environment LINK; Leven Landscape Enterprise Networks |
|
Conservation NGOs |
SEDA Land; GWCT; RSPB Scotland; Forth Rivers Trust; Deer Management Groups |
|
Landowners/estates |
Crown Estate Scotland; Scottish Land and Estates |
|
Land agents |
Sylvestris |
|
Academic institutions |
The James Hutton Institute; University of Aberdeen |
|
Environmental agencies |
NatureScot |
|
Other |
Individual Consultant |
Overall, this stakeholder engagement included representation from a range of stakeholders involved in agriculture, conservation and land management. Existing farmer clusters, in particular, were well-represented, as were agri-environment and conservation NGOs. However, the tight targeting for this project meant that it was not possible for all possible stakeholders to be included. Perspectives from providers of farmer advisories could have been better represented, as could land agencies and the private sector. A UK Government General Election also hampered efforts to include perspectives from UK Government agencies involved in collaborative landscape management. The focus of the study on agriculture also meant that perspectives associated with other land uses, such as forestry and recreation, were not represented. The findings therefore strongly reflect farming and conservation perspectives and, whilst this is relevant to the agricultural reform programme, further studies may be enriched through inclusion of a wider range of perspectives.
Analysis
By design, both the survey and the workshop produced mainly qualitative data, regarding stakeholders’ views on what was needed to support collaborative landscape management. The data was collated by the research team into sets of summary notes, which we read through, carefully, and identified themes across the stakeholders’ responses. For rigour, we compared themes from the survey against those from the workshop, and from both activities against the proposed supportive factors for collaborative landscape management, identified in the conceptual framework. We also compared the themes across different groups of stakeholders, to explore if there was agreement/disagreement or difference between different sectors.
Limitations
We are confident that this methodology enabled us to invite and explore expert insights across a range of agricultural and conservation perspectives, including from actors already involved in collaborative landscape management activities. The combination of an asynchronous online survey with an in-person workshop helped ensure that the study benefited from both anonymous input from individuals, in their own time, and without their responses being influenced by others, as well as in-depth knowledge exchange and deliberation in the workshop. Nonetheless, as with any workshop, it is possible that the discussions, and thus the data, were influenced by the most vocal participants and the general biases of those present, whilst the survey had limited opportunities to yield in-depth responses. We have therefore made efforts to present the results in a balanced way and highlighted areas of disagreement and uncertainty. Both activities were limited by the amount of time available for the study, and a richer picture may have been painted with more time for in-depth inquiry.
Appendix B. Examples of landscape scale collaboration from outside of Scotland that were suggested by survey respondents
|
Name |
Location |
Link |
|
EU Interreg PARTRIDGE project |
North Western Europe | |
|
Fiji 4 Returns Framework |
Fiji | |
|
Landscape Enterprise Networks |
Established in England, Italy, Poland and Hungary, and being developed in Scotland | |
|
Norway Nature Index |
Norway (and being trialled in Cairngorms) | |
|
Heart of Borneo Initiative |
Indonesia, Malaysia, Brunei | |
|
North East Cotswold farmer cluster |
England |
Home | The North East Cotswold Farmer Cluster | England (cotswoldfarmers.org) |
|
Selborne Landscape Partnership |
England | |
|
The Australian National Landcare Programme |
Australia | |
|
The Sustainable Farming Incentive |
UK | |
|
The Cevennes National Park |
France |
Cévennes National Park | Cévennes Tourism (cevennes-tourisme.fr) |
|
FASB Initiative |
Brazil | |
|
Dutch Farmer Collectives |
Netherlands |
Appendix C. Online consultation survey questions
Online Consultation: How can landscape scale collaboration be supported to help deliver nature restoration, climate change mitigation and adaptation?
Introduction – *Watch short, recorded presentation* – embed in Qualtrics.
Thank you for taking the time to contribute your insights to this study on how landscape scale collaboration can be supported to deliver nature restoration, and climate change mitigation and adaptation.
This short survey will ask you to respond to a series of questions regarding the factors you think are important for supporting landscape scale collaboration. The questions build on the framework outlined in the presentation, in particular:
- how you think collaborative landscape management should be facilitated,
- how you think government and non-governmental actors should support collaborative landscape management,
- what would help support learning in collaborative landscape management,
- and what conditions and resources are needed for all of this.
The survey consists of a mixture of open-ended questions and sliding scales and should take around 10-15 minutes to complete. You will be asked to name the organisation you represent, but this will not be linked with your responses in the findings or outputs from this study, to ensure you are not identifiable (please refer to the information sheet and consent form for further details).
1) Do you consent to take part in this survey? (You do not have to answer all questions and you may withdraw at any point).
Yes/No (Conditional question – Yes needed to advance).
3) For which organisation do you work?:
Free Text
4) What measures (e.g. administrative, funding, logistical, etc) are required to support land managers to undertake collaborative landscape-scale management to benefit biodiversity and climate mitigation?
Free text
5) What should be the role of a) governmental and b) non-governmental actors in decision-making around collaborative landscape management?
a) governmental actors
Free text
b) non-governmental actors
Free text
6) How can the impact of collaborative landscape-scale activities be monitored and evaluated?
Free text
7) To what extent do you agree that the following are important factors in enabling landscape-scale collaboration to benefit nature restoration and mitigate climate change?:
Building on existing relationships and collaborative activities between landholders.
Essential
Somewhat important
Neutral
Not important
Unnecessary
Not sure
Facilitation of collaboration (e.g. having an advisor who helps convene, plan for and enable collaborative activities).
Essential
Somewhat important
Neutral
Not important
Unnecessary
Not sure
Availability of sufficient time, funding and resources for the planning and implementation of collaborative activities.
Essential
Somewhat important
Neutral
Not important
Unnecessary
Not sure
Developing clear and realistic plans for collaborative activities.
Essential
Somewhat important
Neutral
Not important
Unnecessary
Not sure
Balancing top-down governance and bottom-up initiatives.
Essential
Somewhat important
Neutral
Not important
Unnecessary
Not sure
Navigating complex and competing interests.
Essential
Somewhat important
Neutral
Not important
Unnecessary
Not sure
Support for monitoring and evaluating the effects of collaborative landscape-scale activities.
Essential
Somewhat important
Neutral
Not important
Unnecessary
Not sure
Ensuring application processes for accessing incentives are accessible and user-friendly.
Essential
Somewhat important
Neutral
Not important
Unnecessary
Not sure
8) Are there any other factors you think are important for supporting landscape-scale collaboration? If so, please elaborate.
Free text
9) Are there any factors that tend to constrain or hinder landscape collaboration? If so, please elaborate.
Free text
10) For how long do you think support for facilitation of collaborative landscape activities should last (from the point at which any particular collaboration commences)?
Less than 1 year
1-2 years
2-5 years
5-10 years
Longer than 10 years
Indefinitely
11) For how long do you think support for implementation of collaborative landscape activities should last (from the point at which implementation of a particular activity commences)?
Less than 1 year
1-2 years
2-5 years
5-10 years
Longer than 10 years
Indefinitely
12) Are there any lessons from your experiences or knowledge of collaborative landscape management you would like to share?
Free text
13) Are you aware of any examples of landscape scale collaboration in other countries that could be useful for Scotland to learn from? If so, please mention them here.
Free text
14) Any additional comments.
Free text
*End survey.*
Appendix D. Workshop activities
Landscape-scale collaboration to benefit biodiversity and climate change outcomes – stakeholder engagement – Stakeholder workshop 25/06/2024 Subud Centre, Perth
Aim: To explore stakeholder perspectives and encourage dialogue regarding what is needed to encourage landscape-scale collaboration in the Scottish context.
Welcome and introductions (11:00 – 11:15)
- A brief welcome from the project team.
- Housekeeping stuff – include mention that we will be audio recording and taking notes.
- Expectation that we want to hear from everyone, and everyone’s views are welcome and ought to be respected, including where there are disagreements.
- Run through the agenda.
- An overview from Scottish Government, explaining why we are all here today and Scottish Government’s interest in exploring the possibilities around developing some form of future Landscape Scale Collaboration mechanism within an agri-environment context.
- Brief introductions – name, organisation/sector representing, plus icebreaker question (e.g. favourite vegetable).
Session 1 – Setting the scene (11:15 – 11:50)
Aim: to set the scene with regards to understanding of ‘collaborative landscape management’ for agricultural land and holdings.
To do that, we will hear short talks from:
i) Expert on landscape collaboration approaches, about current understanding in research on landscape-scale collaboration;
ii) initial results from the online consultation survey.
Each presentation will be around 10 minutes, plus 15 minutes for questions at the end of the session.
Session 2 – Share ideas about what is needed to support landscape-scale collaboration in Scotland (11:50 – 13:00)
Aim: to facilitate discussion regarding what participants think is needed to support landscape-scale collaboration in a Scottish context.
This will involve a ‘Carousel’-style activity, whereby stakeholder participants will be split into small groups, rotating around four ‘stations’, each featuring a different discussion question. Proposed questions are:
- What is currently working well in terms of support for collaborative landscape management (drawing on examples from within Scotland and elsewhere)?
- What barriers exist for collaborative landscape management (drawing on examples from within Scotland and elsewhere)?
- In general, what types of support are needed to enable collaborative landscape management?
- How can learning and knowledge exchange about collaborative landscape management be supported?
Participants will be asked to write their group’s responses on pieces of flipchart paper at each station. These will be stuck up around the room for participants to read during the lunch break.
45 minutes – 10-minute explanation – then diminishing amounts of time at subsequent stations (15 mins – 10 mins – 5 mins – 3 mins) 15-minute buffer for overrunning.
Lunch 13:00 – 13:45: Good food & networking.
Session 3 – Plenary discussion (13:45 – 15:00).
Aim: clarify what is needed to support landscape-scale collaboration in Scotland.
This will start with a summary of points brought up during Session 2. Participants will have had time to look at all of the responses that have come up on the flipcharts for the carousel activity. Lead facilitator (SP) will give a brief summary of these as well.
We will then do a ‘think-pair-share’ activity, whereby each participant writes down their thoughts on a sticky note, then compares with the person next to them, and then we ask participants to share with the room. This will be framed around the question:
- how could support for collaborative landscape management in Scotland be done better?
Facilitation note: Encourage participants to be specific about what needs to change, and who can do what, and even, optionally, when.
Then, finally, we will move into more of an open, plenary discussion around opportunities, actions and potential next steps for supporting collaborative landscape management in Scotland.
Facilitation note: Make sure to check and acknowledge differences and disagreements, if not already aired – explore why they might be coming up.
75 minutes – 10-minute review of previous session – 5-minute explanation of next task – 10 minutes for ‘think-pair-share’ question (5 min ‘think’, 5 min ‘pair’) – 50 minutes for general discussion. Then 15 minutes for closing comments.
Finish by around 15:15 – buffer of 15 minutes for closing and leaving.
© The University of Edinburgh, 2024
Prepared by The James Hutton Institute on behalf of ClimateXChange, The University of Edinburgh. All rights reserved.
While every effort is made to ensure the information in this report is accurate, no legal responsibility is accepted for any errors, omissions or misleading statements. The views expressed represent those of the author(s), and do not necessarily represent those of the host institutions or funders.
This refers to the RESAS Strategic Research Programme ‘People and Nature’ project (JHI-D4-1), which aims to examine the indirect drivers of biodiversity loss – social values and behaviours. https://sefari.scot/research/projects/people-and-nature ↑
Collaborative landscape management is the enhancement of ecosystems via combined efforts of multiple farmers and land managers across a landscape. It has potential to help meet Scottish Government targets associated with addressing biodiversity loss and climate change.
This research investigated a variety of models and experiences of collaboration to explore how support for collaborative landscape management in Scotland could be provided. This can help inform how such support may be incorporated in the Agricultural Reform Programme and other relevant policy areas.
Summary of findings on success factors, required support and opportunities
Stakeholders identified the following support needs:
- Coordinated support for collaboration, both across government policies and between government and other stakeholders.
- Facilitation to bring groups together and enable planning, preparation for and implementation of collaborative landscape management approaches. This includes long-term funding and training for facilitators.
- Long-term funding dedicated to incentivising and supporting implementation of collaborative activities. This could include investing in existing collaborative structures. Greater accessibility and flexibility of funding are needed to encourage engagement in collaborative landscape management.
- Encouraging private sector investment to incentivise engagement in collaborative landscape management and enable greater flexibility for context-specific, bespoke projects.
- Training, conferences and knowledge sharing to foster a culture of collaboration.
- Monitoring, evaluation and communication about the benefits of collaborative landscape management approaches.
For further details please read the report.
If you require the report in an alternative format, such as a Word document, please contact info@climatexchange.org.uk or 0131 651 4783.
Research completed in April 2024
DOI: http://dx.doi.org/10.7488/era/4747
Executive summary
To deliver climate change mitigation and adaptation, nature restoration and high quality food production, the Scottish Government produced their vision for agriculture, along with the next steps, to encourage sustainable and regenerative farming in Scotland. A programme of work is underway to reform agricultural payments with a greater emphasis placed on delivering environmental outcomes with a proposed structure of four payment tiers tied to a suite of potential measures that will deliver tangible outcomes.
This study identified the most suitable metrics that could be used to monitor the success of the proposed measures in the agricultural reform programme against environmental outcomes. This includes consideration of cost-effectiveness, practicalities and the skills and capabilities of those tasked with monitoring.
Findings
We found potential metrics for assessing the success of the measures for all outcomes. Most metrics can already be applied as the methods are available, whilst a small number are under development and could be applied in the near to medium term. These metrics fell into several categories:
- Emissions cannot be measured directly, so we suggest using current farm-level tools to assess GHG emissions, known as carbon audits. A field level, real time GHG emission model is in development as well as a tool for doing this for ammonia.
- Many metrics depend on direct sampling of soil or biodiversity and can’t be realistically replaced by proxies or existing data. However, well designed sampling programmes can maximise the efficiency of sampling, e.g. sampling for soil carbon, nutrients, pH and eDNA can be done at the same time.
- The outcomes associated with animal health, nutrition and breeding must be largely monitored through proxy metrics. These are relatively easy to measure and provide useful information directly to the land manager.
- A few metrics, such as pesticide usage data or area under permanent habitat, collected as part of the agricultural census, can be derived from existing data.
- Some of the metrics in development could take advantage of samples/data collected at the start of any monitoring programme (e.g. soil eDNA, acoustic monitoring) and others would come online later (e.g. LIDAR-derived hedge data).
- The measure ‘retain traditional cattle’ could not be related to the outcomes.
- Deciding on a suitable suite of metrics to assess the benefits of the Agriculture Reform Programme is only one step as there are issues related to design, sample size and data to be considered.
Recommendations
A full list of suitable metrics for each measure from the Agricultural Reform list of measures is supplied in an accompanying spreadsheet “MeasuresXMetrics.xlsx”. The spreadsheet can be filtered to look at what metrics are suitable for each measure, which outcome they relate to, whether the metric is suitable for direct assessment, if it provides additional useful information or if the metric is still in development, whether the metric is suitable against multiple outcomes and who can carry out the monitoring.
Table 1 summarises the spreadsheet by showing which metrics relate to each outcome. The final choice of which metrics to collect will depend on two main factors:
- The availability of resources to carry out any monitoring programme
- The sampling philosophy adopted; whether widespread collection of a few metrics, where data collection could be partly done by land managers, versus a programme designed to give accurate data at the national level by sampling intensely from a representative sample of locations with mainly expert-led sampling.
Combining information on who can do the monitoring and potential likely costs of expert-led monitoring, we suggest the following monitoring philosophy is appropriate:
- All enterprises to assess soil erosion and buffer strip effectiveness.
- All livestock enterprises to record growth rate, milk yields, mortality, conception rates, replacement rates, age at slaughter for sheep and cattle.
- ScotEID to require information on sires.
- All enterprises to use farm tool calculators (carbon audits) to model GHG emissions. Livestock enterprises to model ammonia emissions when a suitable tool is available. The requirement to model might be limited to enterprises above a certain size to reduce costs.
- The remaining outcomes would be best assessed using expert-led monitoring in a sample-based programme similar in philosophy to the Welsh approach. The resources available for monitoring and statistical power analysis would be key inputs into developing a sampling approach with decisions about the trade-off between number of metrics recorded versus sample size needing to be made.
Table 1. Metrics identified as worthy of adoption in future monitoring, listed by outcome – a full list of which metrics are suitable to assess each measure are shown in the spreadsheet. Metrics are divided into three categories: Suggested metric – a suitable metric for monitoring the relevant outcome(s) that can be applied now; Additional metric – a useful set of additional information or approaches; and Metric in development – analytical methods are still in development, but samples/data can be collected and archived for future analysis. Metrics suitable for use for multiple outcomes are shown in bold.
|
Outcome |
Suitable metric |
Additional metric |
Metric in development |
|---|---|---|---|
|
Reducing Soil GHG emissions |
Modelled farm emissions of CH4, CO2, N2O |
Field level, real time emission models. | |
|
Increasing soil carbon/organic matter content |
Soil carbon stock (C content and bulk density) Area under permanent vegetation or other carbon positive management |
Soil clay content |
Indicators based on soil FTIR spectroscopy |
|
Increasing resilience to weather events |
Soil carbon stock Water stable aggregates Soil bulk density and porosity Erosion monitoring |
Visual Evaluation of Soil Structure (VESS) |
Indicators based on soil FTIR spectroscopy |
|
Improving soil nutrient content |
Mineralisable nitrogen and available phosphorus |
Indicators based on soil FTIR spectroscopy | |
|
Reducing diffuse pollution |
Mineralisable nitrogen, available phosphorus and pH Soil bulk density and porosity Erosion monitoring and effectiveness of buffer strips |
Visual Evaluation of Soil Structure Detailed monitoring in SEPA catchments to include water quality (nitrate, phosphate etc.) |
Runoff evaluation using LIDAR derived fine resolution topographic data. |
|
Improving water and air quality |
Mineralisable nitrogen, available phosphorus and pH SEPA regulatory monitoring Erosion monitoring and effectiveness of buffer strips |
Detailed monitoring in SEPA catchments to include water quality (nitrate, phosphate etc.) Intensive farm-scale monitoring of ammonia emissions in livestock intensive areas |
Modelled farm emissions of ammonia |
|
Improving soil water retention and flow |
Sub-soil bulk density and porosity Water stable aggregates Erosion monitoring |
Visual Evaluation of Soil Structure | |
|
Improving soil biodiversity |
Soil surface invertebrates Earthworm functional group abundance |
Pesticide Usage Survey data |
Archive sample for eDNA |
|
Removing drivers for biodiversity loss |
Bird, pollinator and plant composition and diversity |
Farmland habitat diversity Pesticide Usage Survey data |
Archive acoustic monitoring files LIDAR derived hedge data |
|
Livestock health |
Growth rate, Milk yields, Mortality, Conception rates, Replacement rates, Age at slaughter | ||
|
Livestock nutrition |
Growth rate, Milk yields, Mortality, Conception rates, Replacement rates, Age at slaughter |
Feed analysis for digestibility/protein | |
|
Livestock genetics |
Applications to ScotEID for calf/lamb passports, with requirement for sire details to be included |
Growth rate, Milk yield, Conception rates, Age at slaughter. | |
|
Livestock methane emissions |
Modelled farm emissions of CH4, CO2, N2O | ||
|
Nutrient management |
Mineralisable nitrogen and available phosphorus Effectiveness of buffer strips Modelled farm emissions of CH4, CO2, N2O |
Modelled farm emissions of ammonia |
Glossary / Abbreviations table
|
Citizen scientist |
Usually used to denote a non-professional scientist. Can range from the public (including land managers) to highly proficient amateur scientists. |
|
FTIR |
Fourier-transformed infrared spectroscopy – an analytical technique using infra-red light to identify the chemical composition of materials. |
|
GHG |
Greenhouse gases such as CH4 methane, CO2 carbon dioxide and N2O nitrous oxide. |
|
LIDAR |
Light Detection and Ranging, is a remote sensing method that uses light in the form of a pulsed laser to measure ranges and hence vegetation structure. |
|
Measure |
An action or set of actions employed to reach the outcomes of the Vision for Agriculture. |
|
Method |
The processes followed to obtain the data required to produce metrics. |
|
Metric |
A quantifiable set of data that can be used to track, compare and assess performance or processes. |
|
RPID |
Scottish Government’s Rural Payments and Inspections Division |
Introduction
This report examines the potential metrics for assessing the environmental outcomes of measures identified in the Scottish Agricultural Reform Programme.
Policy environment
Agriculture is a major contributor to Scottish greenhouse gas (GHG) emissions; currently, it is responsible for c. 20 % of countrywide emissions (Brodie 2023). Agricultural management has also been a major driver of the declines in above- and belowground biodiversity (Walton et al. 2023) and puts significant pressure on Scottish water bodies, preventing them from reaching Good Ecological Status (Environmental Standards Scotland 2022).
Following on from the Scottish Government’s Vision for Agriculture, a new Agriculture and Rural Communities (Scotland) Bill has been passed, which will allow for a new framework for future support payments for farmers (“farmer” is used in this report to cover both farmers and crofters), including for environmental goods. This will encourage sustainable and regenerative farming practices that will help Scotland transition towards net zero, reverse the decline in biodiversity, and improve soil health and water quality.
It is anticipated that there will be a new framework for agricultural payments focused on key outcomes of high-quality food production; climate mitigation and adaptation; nature restoration; and wider rural development alongside a just transition. Greater conditionality will be key, with a transition towards shifting 50% of direct payments to climate action and funding for on-farm nature restoration and enhancement by 2025.
At present a draft list of measures (Appendix A) is being appraised by Scottish Government that covers both land-based and animal-based actions that should lead to improvements in biodiversity, climate, flooding, soil health, water quality and animal health and welfare. However, a system of monitoring and verification is needed to ensure compliance and that the measures are delivering the desired outcomes.
Aims
The aims of this project were:
- To identify potential metrics that could be used to monitor the success of the proposed measures in delivering the desired environmental outcomes (Appendix B). Those metrics that could be used in practice will have to be cost-effective, practical and within the skills and capabilities of those tasked with the monitoring.
- To take an overview across all the metrics and outcomes to refine the list of metrics to avoid duplication and maximise the usefulness of information collected.
Considerations for selecting appropriate metrics
Introduction
To determine whether any changes over time are the result of direct action through applied measures, it is important to be able to compare areas where measures have been applied with other similar areas that are not in the scheme (control sites). Without this, it is not possible to determine whether any change detected is due to the measures or to other drivers.
It is also possible that even if an improvement is not detected on sites where measures have been applied, the measures might mean that a negative change, that would otherwise have occurred, has been avoided.
A Before-After-Control-Impact (BACI) design is commonly used for monitoring the effect of environmental interventions. However, a difficulty is that areas which are originally selected as controls may join the scheme later. Also, as pointed out by Emmett et al. (2014), it can be difficult to select appropriate controls given the numerous other factors, including field contents, size, and boundary characteristics that would need to be held constant across matched pairs. Even if the areas selected as controls are not part of the current scheme, they may not be true controls as they may have benefitted from similar environmental measures under legacy schemes.
As a result of these issues, it can be difficult and costly to assess outcomes at the level of individual farms, though overall performance of measures can be assessed through an appropriate monitoring scheme.
Requirements
Effective monitoring requires an appropriate baseline for measuring outcomes against (Pakeman et al. 2020). A proper baseline gives power to any analysis, as it is detecting change against known values for indicators. For example, agricultural soil monitoring as part of scheme monitoring will need to align with the national soil monitoring programme that is in development.
Similarly, identifying an appropriate sampling design is critical. It needs to cover enterprises in different situations and localities and have the appropriate statistical power to give good evidence on the performance of each measure in at least the medium-term (i.e., to inform revisions to agricultural support schemes). Some outcomes may be detectable quickly, but others, like soil carbon, may take longer to be detectable within realistic sampling regimes (Saby et al. 2008). For other measures it may be difficult to separate the effects of the scheme from market-driven effects, such as the breeding of livestock for reduced methane production, which could be driven by the price of carbon rather than the support from any scheme (Cottle & Conington 2012, 2013).
Selecting metrics
The selection of metrics depends on several factors, including the design of any monitoring scheme, what is being monitored, for whom and for what purpose, and needs to take account of the trade-offs associated with the approach taken. These can be seen as different aspects of taking either a “broad and shallow” or a “narrow and deep” approach to data gathering for the same amount of effort. Data gathered from a “narrow and shallow” approach will be less detailed and likely less robust, whereas a “broad and deep” approach may be too costly to deploy widely.
Sample or population
Taking a sample of the population and focussing monitoring has the benefit of concentrating resources if it is understood that any sampling design has some measure of uncertainty built in. This type of approach has been adopted in monitoring programmes such as Countryside Survey (e.g., Carey et al. 2008) and the monitoring of the Welsh agri-environment scheme Environment and Rural Affairs Monitoring and Modelling Programme (ERAMMP), which focusses monitoring on 300 1 km x 1 km grid squares and assesses the impact of the scheme using information on how much land in each square is under Glastir funded management (see Section 8.1.1). The approach allows for efficient linkage between changes in different outcomes, but with the proviso that there is uncertainty and that it can only give a national-level picture.
Citizen scientist or specialist
For agriculture, options will include asking the farmer or land manager to gather information, drawing data from wider datasets, or drawing in specialists to sample and process data. There are advantages and disadvantages to asking land managers, as opposed to specialists, to carry out the monitoring. Land managers differ from citizen scientists in other monitoring, e.g., the British Trust for Ornithology’s Breeding Bird Survey, which is undertaken by volunteers with a high degree of skill at bird recognition. Expectations would have to be tempered in terms of what can be provided.
Consequently, the advantage of monitoring by the land manager is that it is effectively free, it can be repeated frequently and provides information direct to the land manager. This must be viewed against the benefits of sampling with more accuracy and precision by specialists.
It may be possible to develop hybrid monitoring strategies using the advantages of the different groups, either using land managers to take samples (e.g., soils), which are then sent away for analysis, or deploying monitoring equipment, with the specialists undertaking data analysis. Specialist data analysis is preferable from the point of view of scientific robustness, although monitoring equipment does need expert maintenance, calibration and quality control and is more costly. Alternatively, a tiered approach to monitoring could be followed, with land managers collecting some data whilst more specialised data collection is undertaken on a sample of farms.
Meaningful scales of monitoring
The appropriate scale of monitoring is inherent in what is being monitored. For plants, relatively small areas (a few square metres) tend to be monitored, whilst for butterflies and bees, the area might be a transect 100 m long and 5 m wide, and for birds, the British Trust for Ornithology uses 1 km x 1 km grid squares as the basis of their Breeding Bird Survey.
In consequence, the scale of monitoring for different aspects of the environment and biodiversity will not be the same for all outcomes. There is, therefore, some constraint on the overall approach as it is dependent on finding the most appropriate scale for each outcome.
Who is the monitoring for?
The vision for agriculture includes provision for payments that deliver to defined outcomes. If the aim is to inform management at the farm-scale or smaller, in effect using the results of monitoring in adaptive management, then there may be a benefit to a broad and shallow approach. There is also value in aligning monitoring with appropriate advice and resources for decision making. However, if the monitoring is just aimed at showing which measures are value for money, then a national level focus is more appropriate.
Understanding what is driving change
If measured changes can be linked directly to the impact of targeted funding, or with conditions for an agri-environment scheme, then this is a direct demonstration of the efficacy of the scheme.
However, a narrower set of more detailed monitoring may be better placed to understand more precisely what is driving change as a greater range of measured parameters can be used to examine the processes that lead to change. This improved knowledge might be more useful in developing future schemes and inform adaptive management. A tiered approach to monitoring may deliver the best information.
Can you monitor outcomes, or just activity?
It is possible that suitable methods to measure outcomes at the desired scale are not available or practical. Consequently, it may be that measuring actions or activity remain the only option to assess whether management is driving change in the desired direction. However, there would need to be some form of outcome monitoring at a wider scale to assess overall performance of the scheme.
Does land manager-led monitoring need supervision?
This is a contentious issue, but in other spheres such as sampling for water industry and fish farm compliance there are quality assurance assessments of ‘operator collected data’. Some are targeted based on evidence of some kind, but there is a random element to create pressure to conform.
There is a need to consider whether an inspection system is required to ensure there is pressure to maintain high standards of monitoring. Northern Ireland has decided that the best way to obtain robust data for monitoring is to employ people to do the measurement and use techniques such as GPS monitoring to check sample collection protocols are being followed (https://www.afbini.gov.uk/articles/soil-nutrient-health-scheme).
Methodology
We used an expert led rapid evidence assessment to look for different ways of assessing the success of each measure against environmental outcomes. This involved a multistep approach to developing appropriate metric recommendations to monitor the environmental outcomes of the new agricultural support system.
Step 1
For the land-based proposed measures only, we assessed each proposed measure (Appendix B) to identify which of the outcomes it was relevant to. For example, there are nine outcomes listed for In Field – Cultivated Soils, but not all outcomes are relevant for each measure. For example, the outcomes Reducing Soil Greenhouse Gas (GHG) emissions and Increasing soil carbon/organic matter content are unlikely to be affected by Efficient/Reduced use of synthetic pesticides so it would not be useful to monitor those if this was the sole measure in place.
This step was undertaken by individuals with expertise in each outcome.
Step 2
For each combination of relevant outcomes and measures, we used expert knowledge and a search of relevant literature to identify potential metrics that could be employed to assess compliance and/or the success of the measure in reaching the desired outcome (Appendix C). These were categorised in the following ways:
- Compliance or outcome-based
- Already collected under the current payment scheme, by agencies or third parties, or if novel data metrics will be required
- Practical for field-level monitoring, holding-based monitoring or for national-scale monitoring only, or unsuitable for routine monitoring.
This step was undertaken with the expertise of the research team backed up by literature searches. However, for the land-based measures, one individual was tasked with identifying appropriate metrics across all measures relevant to a particular outcome to ensure a consistency of approach. In contrast, the livestock-based measures are more holistic and required an expert to consider the actions around these in the round to identify appropriate metrics.
Step 3
The assessment in Step 2 generated a large list of metrics with associated methods that could be employed to assess the success of the scheme. A series of three workshops was used to consolidate these to ensure that where possible the same method can be employed across as many measures as possible for simplicity and to help in scaling up from individual measures to the success of the whole scheme. This stage delivered a shortlist of metrics that could be used to assess the success of the measures in delivering the desired outcomes, i.e., cost-effective, practical and within the skills and capabilities of those tasked with implementing the metric(s).
Step 4
This step focussed on identifying data collection approaches for consideration, as well as considering requirements for establishing an initial baseline and for future data collection to assess both compliance/activity and outcomes. Data collected could be integrated into existing data sets, such as the National Soil Inventory of Scotland, to give a longer perspective of change.
Potential metrics for each outcome
The outputs from Steps 1 and 2 are presented in Appendices B and C but are summarised below. Step 3 identified a set of metrics that could be employed in monitoring outcomes. This section identifies those metrics that would provide practical and cost-effective information. Potential metrics are categorised into three levels:
- Suitable metric – a suitable and available metric for monitoring the relevant outcome(s).
- Additional metric – a useful set of additional information or approach.
- Metric in development – analytical methods are still in development, but samples/data can be collected for future analysis.
Reducing soil greenhouse gas (GHG) emissions
The outcome
Greenhouse gas emissions from agriculture are a significant part of the national total. Reducing these emissions is a key goal of the Agricultural Reform Programme and the Climate Change Plan.
Considerations with a metric
Current methods required for direct measurement of GHG fluxes are not suitable for wide-scale use as they are dependent on relatively expensive equipment and a high degree of specialist knowledge to run the equipment.
We suggest that instead of this a modelling approach, based on existing or in development farm/field GHG calculators, is used that would estimate CO2, N2O and CH4 emissions. These are also known as Carbon Audits and are currently funded as part of the Preparing for Sustainable Farming initiative. However, several issues would need considering:
- There are several modelling tools on the market (see section “Reducing Soil Greenhouse Gas (GHG) emissions” in the Appendix), so an updated review (see Leinonen et al. 2019) of their capabilities would be needed to ensure that only suitable products were used, and to ensure consistency of outputs.
- Assistance may be needed, and hence need paying for, in setting up the calculators in the first instance, as in the Carbon Audits in the Preparing for Sustainable Farming initiative.
- Outputs from the calculator depend on the quality of the primary data gathered, which means data quality checks may be a requirement.
- Feed and forage quality might be useful information to feed into the calculators – see section below on Animal health and nutrition.
Land managers will benefit from these whole farm or field-level calculators with the potential to identify cost reductions or increases in productivity through improved forage and manure management. This could be supported by the soil organic matter and nutrient data collected.
Suggested metrics
Suitable metric: Modelled farm emissions of CH4, CO2, N2O
Metric in development: Modelled gas fluxes in real time at the field scale.
Increasing soil carbon/organic matter content
The outcome
Increasing the levels of soil carbon through regenerative agriculture can make agricultural land a sink for carbon and facilitate the journey to net zero.
Issues with a metric
Soil organic carbon can be routinely measured. There are different laboratory methods available, all of which work well, but a standardised approach would need to be selected for any scheme. Dry combustion (Dumas method) is widespread in its application and thought of as the best chemical method for soil carbon determination (Chatterjee et al. 2009). In addition, some consideration needs to be given to dealing with soil samples from calcareous soils where inorganic carbon levels are high (mainly carbonates), which though rare do include soils like machair soils. Additionally, by linking soil carbon to clay content (measured when characterising soil texture) a measure of the land parcel’s status regarding storing carbon is produced. Thresholds of 13:1, 10:1, and 8:1 clay to soil organic carbon could potentially be applied to arable, arable ley, and woodland systems (Prout et al., 2022).
Laboratory measurement is straightforward, but to calculate stocks, there also needs to be a measurement of soil bulk density (total dry mass per unit volume). Consideration of sampling depth(s) is important as some changes, such as a switch to deeper rooting crops may increase subsoil carbon, while changes in soil tillage might affect the vertical distribution of soil carbon. A standardised sampling protocol needs to take this into account. The approach being taken in Northern Ireland is informative. Every farm and every field are being sampled for carbon and nutrients and soil testing is a precondition of eligibility for environmental payments. Soil carbon stocks are large and are heterogeneously distributed, meaning that quantifying changes over short time periods is seldom possible. For instance, the proposal for a directive on Soil Monitoring and Resilience (Soil Monitoring Law) will require samples to be taken every five years. However, to ensure agronomic management changes will deliver and to identify which ones deliver, actions such as the employment of minimum tillage, use of winter cover crops, inputs of organic wastes and increases in permanent vegetation cover (woodland, hedges, grassland) need to be recorded at the field level alongside actions that will reduce soil carbon such as the removal of permanent vegetation cover and ploughing of grasslands.
Further considerations in developing this sampling include:
• Sampling to be carried out by land manager or by experts. There is a trade-off between cost and reliability but given the range of other soil metrics that need to be sampled to assess other outcomes, we suggest that soil sampling is expert led.
• Should samples from the same field be bulked to reduce costs or should they be analysed separately (expensive) to provide measures of error/heterogeneity and the possibility to statistically assess change at the field level rather than at the farm or national level? For instance, the Soil Nutrient Health Scheme in Northern Ireland analyses a bulked sample of 25 cores but this can miss coldspots and hotspots of nutrients (Hayes et al. 2023). The Welsh Soil Project splits each field into three before the W-shaped sampling is done. There is a direct trade-off between the number of fields that can be sampled and the number of samples per field. We suggest that the most useful information comes from sampling as many fields as possible, so a bulked sample per field would be an appropriate sample to measure. Some within field stratification could be done if there was a clear internal boundary, e.g., between dry slope and wetter flat ground.
• Collecting additional information such as the current and past management and cropping at field level would enhance interpretation.
• Several companies already operate soil testing services. In a competitive market, there is a question regarding how consistency is guaranteed and whether a consistency check should be carried out by a third party. United Kingdom Accreditation Service (UKAS) accreditation would be a minimum standard for participating laboratories.
• Sampling of enclosed land with a single habitat per field is straightforward. However, consideration needs to be given on how to sample from unenclosed land which may contain multiple habitats and a wide range of soil types.
Suggested metrics
- Suitable metric: Soil carbon stock, Area under permanent vegetation or other carbon positive management
- Additional metrics: Soil clay content
- Metric in development: Indicators based on soil FTIR spectroscopy.
Increasing resilience to weather events
The outcome
Soils are vulnerable to runoff and erosion after heavy rain and to drought. Improving the resilience of soils will safeguard their continuing productivity, reduce their susceptibility to the runoff of water and nutrients, and subsequent downstream impacts on flooding and water quality.
Issues with a metric
Resilience is a synthetic metric and can be best seen as a multi-dimensional concept. In addition, the thresholds for resilience will depend on soil type. Regarding improving soil resilience, mineral soils that have greater soil carbon concentrations tend to retain water and have better soil structure, allowing water flow through them rather than across them. Soils that show water percolating (high permeability) rather than flow across the surface are at lesser risk of runoff and erosion, whereas compacted soils with lesser porosity and greater bulk densities are much more vulnerable to weather events. Compacted soils also restrict water availability and nutrient dynamics impacting crop growth. The presence of water stable aggregates also helps prevent water and wind breaking down the soil and hence lower the risk of erosion. These indicators are covered elsewhere in this report (see sections Increasing soil carbon/organic matter content, Improving soil nutrient content and Reducing diffuse pollution) and hence not covered here in detail.
Suggested metrics
- Suitable metric: Soil carbon stock, Water stable aggregates, Soil bulk density and porosity, Erosion monitoring
- Additional metric: Visual Evaluation of Soil Structure (VESS)
- Metric in development: Indicators based on soil FTIR spectroscopy
Improving soil nutrient content
The outcome
Maintaining soil nutrient supply to ensure high levels of productivity is important for efficient farming. However, an oversupply of nutrients can lead to losses as emissions of ammonia and nitrous oxide, or as increased nutrient loadings of freshwaters. While Scotland has no widespread and high impact nutrient issues such as Lough Neagh in Northern Ireland, there are localised issues that have been identified through designations such as Nitrate Vulnerable Zones that might be more cost effective/appropriate to measure.
Issues with a metric
The total concentrations of the various soil nutrients are relatively straightforward to sample and analyse and could be combined with sampling for soil carbon. Analysis methods depend on whether a restricted set of macro-nutrients is the focus, or whether micronutrients and heavy metals are also of interest.
Total nutrient levels work well for some nutrients, but there may be an interest in looking at available nutrients where there is an extraction/exchange step to assess what is available to plants and leaching processes. There are standard laboratory methods for this, particularly for nutrients such as potassium and calcium, but phosphate extraction methods have been developed to be specific for different soil acidity levels (pH).
Unfortunately, neither total nutrient levels nor extractable/exchangeable levels work well for nitrogen, as nitrate is very quickly absorbed by roots, leached, or transformed (e.g., to nitrous oxide). Here, an incubation step is needed, meaning that getting a good understanding of available nitrogen requires sampling, dividing the sample, extracting immediately from one half of the sample, incubating the other half for a set time under standard conditions, and then calculating the release of nitrogen by the soil.
There is an immediate trade-off with adding fertiliser to raise nutrient levels, as excess nutrients can be leached and end up in the aquatic environment, or excess nitrogen can be lost as N2O. Hence, a balance must be reached where inputs meet plant requirements, while also fostering accumulation of soil organic matter to maximise intrinsic soil nutrient cycling. Current agronomic practice is to apply inorganic fertiliser at rates based on an understanding of plant uptake, but application rates often exceed those which are required as soil-specific variability in supply of nutrients from soil organic matter is usually not accounted for. Tools such as PLANET (Planning Land Applications of Nutrients for Efficiency and the environmenT), a nutrient management decision support tool for farmers and advisers to carry out field level nutrient planning and for demonstrating compliance with the Nitrate Vulnerable Zone (NVZ) rules, could be useful in this regard.
Maintaining optimal pH for crop growth also appears to reduce soil greenhouse gas emissions (Wang et al., 2021; Zhang et al, 2022), but there is a degree of context specificity, and this may not be appropriate for soils of high organic matter content.
Suggested metrics
- Suitable metric: Mineralisable N and available P, Soil pH
- Metric in development: Indicators based on soil FTIR spectroscopy
Reducing diffuse pollution
The outcome
Diffuse pollution has severe impacts on freshwater biodiversity and water quality with risks that climate change (low and high flow extreme increases, warmer temperatures) exacerbates effects such that moderate nutrient loading improvements may not lead to improved water quality.
Issues with a metric
Monitoring of diffuse pollution operates across scales, from the field scale, to highlight local improvements, to the catchment scale to understand cumulative effects and impacts (Bieroza et al. 2021). Field-scale predictions and observations of runoff prevalence and pathways, monitoring of soil compaction (measured by soil porosity) and soil chemistry (particularly nitrogen and phosphorus levels) provides an idea of risk, as does monitoring of in-field erosion (Hayes et al. 2023). Management at the edge of fields, e.g., buffer strips are designed to reduce diffuse pollution, but for best effectiveness, their location and design need to be targeted to ensure that they effectively treat converging runoff pathways and critical delivery points to the channel network (Stutter et al. 2021). Similarly, nutrient losses from field drains also need to be monitored as these can only be mitigated by specially designed and strategically located buffer strips.
Water sampling provides integrative evidence of the effectiveness of measures as it reflects management upstream in the catchment. Whilst monitoring of chemistry, biodiversity (invertebrates) and sediment will provide an understanding of upstream issues, it may be difficult to attribute impacts to diffuse or point source pollution (Glendell et al. 2019).
Water quality is closely linked with soil nutrient status, particularly nitrogen and phosphorus status of the soils, so relevant information can be acquired by soil sampling. However, there is also the need to monitor runoff generation and pathways, soil erosion, sediment flows and drainage waters. Monitoring is especially useful during extreme events, including high and low flows. An understanding of pollutant concentration changes over differing flow stages (e.g., inter-storm sampling) brings a wealth of information beneficial to management about source and transport behaviours at field to catchment scales.
We suggest that land managers are given responsibility for assessing erosion and water flow pathways and the subsequent monitoring of erosion and sediment flows, and potentially taking water samples of drainage waters for analysis by specialist laboratories. This would mean farmers assessing whether individual buffer strips were effective at preventing water flows, or whether their design allowed for flow around their edges by visiting them during periods of heavy rain. Future erosion pathways could be identified using fine-scale elevation data from LIDAR to model the flow of water across the surface of land (e.g. Reaney et al. 2019. Aquatic biodiversity requires specialist surveyors and could be done at the same time as the above-ground biodiversity assessment (Section 6.9).
SEPA currently collect a wide range of data from multiple sites. We suggest that it would be of benefit to use the current SEPA monitoring of agricultural catchments as the basis for studies linking agricultural management and water quality, by ensuring studies are joined up. This may mean enhancing the range and/or frequency of measures taken. A nested design could be followed, whereby field- and farm-scale sampling are nested within these catchments representing different land use typologies in Scotland, with water quality being monitored at the catchment outlet. The detailed knowledge from these catchments could be linked to farm-level data to make national estimates of benefits.
Farm-level models for looking at nutrient inputs and losses have been developed for England and Wales, e.g., FARMSCOPER. However, the extent to which it can be applied to the soils, climate and farming systems in Scotland has not been tested and this would need carrying out before it could be recommended as a metric for use in assessing the efficacy of measures.
Suggested metrics
- Suitable metric: Mineralisable nitrogen, available phosphorus and pH, Soil bulk density and porosity, Erosion monitoring and effectiveness of buffer strips (including other enhancements e.g., wetlands, wet woodland, sediment traps)
- Additional metric: Visual Evaluation of Soil Structure (VESS), Detailed monitoring in representative SEPA and other research catchments for process-based understanding on management impacts
- Metric in development: Runoff evaluation using LIDAR derived fine resolution topographic data
Improving water and air quality
The outcome
Water quality is tightly linked to freshwater biodiversity. However, it also has implications for the cost of water treatment downstream. Air pollution, particularly of ammonia, can also severely impact local biodiversity.
Issues with a metric
There can be a disconnect between actions at the field scale to reduce nutrient loss and water quality as actions can be poorly sited, poorly implemented and miss important routes of pollutant movement. However, there is clear evidence that reduction in soil nutrient status is the most likely route to deliver improvements in water quality, so monitoring for water quality is intrinsically linked to monitoring of soil nutrient status (Hayes et al. 2023).
High-resolution water quality monitoring that would represent the temporal and spatial variability is expensive and the movement of water in catchments may make linking it to the actions of individual farms problematic. Consequently, we suggest a combination of field/farm-level monitoring of soil nutrient status (i.e., soil organic matter, plant available (mineralisable) N, biologically available P and pH) and detailed monitoring of several representative catchment outlets to improve the understanding of processes. These could be based around SEPA’s existing catchment observation platforms, with additional investment to maximise the robustness of collected evidence.
Further action to reduce point source pollution, such as slurry pit overflow, farmyards and septic tanks, should not be overlooked (Harrison et al. 2019). Monitoring of this would be in the form of capital spend. Best practice should be followed for digestate and slurry application to land.
Currently available sensors for monitoring ammonia emissions tend to be expensive, require technical expertise and are sensitive to meteorological conditions and other atmospheric gases. Lower cost passive samplers, which could be deployed by non-specialists are less accurate, have lower temporal resolution, and require laboratory analysis (Insausti et al., 2020). A similar approach to that proposed for water quality could be implemented, with intensive monitoring of key areas with intensive livestock production systems, coupled with national scale monitoring utilising the National Ammonia Monitoring Network which monitors atmospheric ammonia concentrations monthly. A farm-level calculator for ammonia emissions is in development as part of the Scottish Government’s Strategic Research Programme. This would be the most cost-effective way forward for wide deployment of monitoring.
Suggested metrics
- Suitable metric: Mineralisable nitrogen, available P and pH, Soil bulk density and porosity, Erosion monitoring and effectiveness of buffer strips
- Additional metric: Intensive farm-scale monitoring of ammonia emissions in livestock intensive areas, Visual Evaluation of Soil Structure (VESS), Detailed monitoring in SEPA catchments for process-based understanding on management impacts
- Metric in development: Modelled farm emissions of ammonia
Improving soil water retention and flow
The outcome
Soil water retention is important in reducing soil erosion and diffuse pollution. If water flows through the soil it is slowed, reducing flood peaks, and there is greater interaction between the soil and water reducing the risk of nutrient loss. In contrast, water flowing across the surface of soils leads to erosion and nutrient runoff.
Issues with a metric
There are several detailed methods available to understand water retention and flow through soils, but they are not appropriate for wide-scale monitoring, apart from their potential use in the detailed monitoring of test catchments. These include detailed measures of soil texture, as well as laboratory measures of hydraulic conductivity. Direct measures of soil compaction with penetrometers suffer from variability due to soil water content, stoniness of the soil and differences between manufacturers. They are not suitable for wide-scale monitoring.
However, a set of straightforward measures are available to assess how soil water behaves. As part of the sampling of soil for soil carbon measurements, bulk density is measured to calculate carbon stocks from carbon concentrations. However, topsoil bulk density can vary seasonally and with respect to management. Subsoil bulk density is an indicator in the draft EU soil monitoring and resilience law and provides a more consistent measure of how the soil is behaving. This is a key parameter for understanding the effect of management on this outcome. However, the additional effort of also recording specific gravity of the soil will allow the calculation of soil porosity, another key parameter that is important for assessing soil water retention.
The Visual Evaluation of Soil Structure (VESS) is a qualitative metric that could also be used to supplement other measures and provide land managers with direct information at the field level on the degree of soil compaction, especially if this included both topsoil and subsoil. For quantitative measures of soil structure, the measurement of Water stable aggregates (WSA) should be considered and removes the potential for subjectivity.
Suggested metric
- Suitable metric: Sub-soil bulk density and porosity, Water stable aggregates, Erosion monitoring
- Additional metric: Visual Evaluation of Soil Structure (VESS)
Improving soil biodiversity
The outcome
Maintaining a healthy soil ecosystem is critical to the regulation of key processes, as soil organisms are critical to the cycling of nutrients and to plant growth. For instance, soil animals like earthworms are highly important to water movement in soils.
Issues with a metric
Soil biodiversity, whilst a key soil health indicator (Neilson et al. 2021), is unlikely to be practically assessed by the land manager. Identification of surface-dwelling invertebrates, such as beetles and earthworms, requires specialist taxonomic skills; even for earthworms a total count does not work as all functional groups need to be present for good soil health. Existing data is not available for surface dwelling invertebrates, but data collection methods with pitfall traps are standardised, for example by the Environmental Change Network. However, these methods require at least two visits, so may not be cost-effective. Previous earthworm surveys have been carried out (Boag et al. 1997, Carpenter et al. 2012), we suggest that methodologies should be kept consistent.
Molecular methods have been employed for bacteria, fungi and nematodes. However, methods to characterise complete soil biodiversity using eDNA (environmental DNA) are now emerging. As is typical with emerging technologies, there are issues surrounding data interpretation, thresholds and developing and/or defining baseline comparators. It is, perhaps, too early to suggest using this as a monitoring method, as the science relating molecular data to improvements in soil health is in its infancy. However, as soil sampling is likely to be used to monitor other outcomes, samples could be taken and archived for future use as a baseline to assess change.
Pesticide usage could be a proxy for the pressure on biodiversity, and hence pesticide usage data would be a useful addition to direct monitoring. It is already collected in Scotland, but refining the data to consider impacts on soil organisms and the different application rates would be necessary.
Further consideration needs to be given to:
- Collecting contextual information such as the current and previous crops.
- Whether the optimum times for sampling in spring and autumn coincide with the optimum times for sampling soil carbon and nutrients.
Suggested metrics
- Suitable metric: Surface dwelling invertebrates and earthworm functional group abundance
- Additional metric: Pesticide usage data
- Metric in development: eDNA samples archived as interpretation needs to improve
Removing drivers for biodiversity loss
The outcome
As much of Scotland is affected by agriculture, sensitive agricultural management is important to delivering the goals of the Scottish Biodiversity Strategy.
Issues with a metric
Biodiversity is intrinsically multi-dimensional, but typical agri-environmental monitoring targets habitat diversity, birds, pollinators and plants, as they give information at different scales.
In most schemes, biodiversity monitoring is done by specialists, as it is the status of priority species that has been the driver for the development of the scheme. However, that is not practical in terms of cost at the farm level, so a choice must be made between:
- Land manager-led monitoring aided by tools such as report cards and identification guides. Bird surveys could allow different levels of precision from individual species to groups (e.g., finches). Similarly, pollinator surveys could record at the level of group (bumblebee, honeybee, butterfly, hoverfly) or plant surveys, by numbers of different types of flower (e.g., daisy, pea types) in a set area. Alternatively, there is the possibility of sub-contracting to specialists if grant payments included money for monitoring. Land managers setting out acoustic recording devices also fits into this space. The resulting files could be uploaded to a central organisation responsible for analysis. The methodologies for data analysis are still in development, but sound files could be archived for later analysis when the methodologies have matured to deal with high levels of false positive identifications. The biodiversity audit as part of the whole farm plan also falls into this category.
- Specialist surveys on samples of farms with the sampling design considering the implementation of measures (Pakeman et al. 2020) or being large enough to assess change for most measures, however, they are distributed across the landscape (e.g., the Welsh approach to monitoring Glastir).
There is a clear trade-off here between broad and shallow versus narrow and deep approaches. To enable adaptive management at the farm level, then land manager-led monitoring is important, but there is the risk that the measures deliver higher numbers of generalist species, do not benefit species that are a conservation priority, but the data is incapable of showing this. It may be that a hybrid approach is necessary, so that field/farm-level data is complemented by detailed measures on a sample of land holdings. However, sample sizes need to be sufficient to confidently assess change. Previous monitoring studies, e.g., Perry et al. (2003), could be used to identify appropriate levels of sampling needed.
Currently collected biodiversity data is not appropriate for agri-environment monitoring for a range of reasons, mainly due to mismatches in scale between land holdings and the specific sampling method used. In the case of breeding bird data, it has been used as a measure of general farmland diversity against which the performance of in-scheme farms has been judged.
Proxies for habitat diversity currently collected by RPID would be useful data, but it only characterises area and has no measure of quality associated. Alternatives include using remote sensing data (e.g., habitat maps or LIDAR derived information on hedgerow extent and conditions) that provides information on land cover and structure, but these are only proxies for biodiversity.
Finally, pesticide usage is a clear driver of biodiversity loss. Usage statistics are already collected using a sampling approach to assess a Scotland-level picture. However, the diversity of chemicals applied, and their different application rates would require methodological developments to combine their usage into meaningful statistics.
Suggested metrics
- Suitable metric: Bird, pollinator and plant composition and diversity
- Additional metric: Farmland habitat diversity, pesticide usage survey data
- Metric in development: Acoustic diversity, LIDAR derived hedge data
Improving animal nutrition
The outcome
Improving animal nutrition will reduce the time taken to deliver animals to market. This reduces lifetime emissions especially of methane.
Issues with a metric
Improving livestock nutrition leads to increased animal performance and reduced methane, nitrous oxide and ammonia emissions. Monitoring of nutrition can be undertaken through laboratory analysis of feedstuffs. The key analyses are forage digestibility – which can easily be undertaken by many feed companies – and dietary crude protein. There is also an important trade-off already mentioned between optimising nutrition and the increased fertiliser use, leading to greenhouse gas emissions and/or pollution of water courses. However, these are very much business-related metrics, and their collection may not be informative as a means of national monitoring, particularly as silage quality varies between fields, time of year and across years. The need for its collection as part of a national monitoring scheme is, therefore, debateable.
Instead, we suggest that simple measures of animal performance are collected and form part of routine monitoring of flock/herd status. These reflect actual performance rather than inputs into the system and are easier to record.
Suggested metrics
- Suitable metrics: Growth rates, Milk yields (Dairy cattle only), Mortality, Conception rates, Replacement rates, Age at slaughter
- Additional metric: Feed analysis for digestibility/protein
Improving animal breeding
The outcome
Focusing on animal breeding can improve the productivity of farming systems and, also, increase the quality of products like meat and milk. In terms of reducing methane production, breeding can directly reduce emissions, but also quicker growing animals will release less over their lifetimes.
Issues with a metric
Selective breeding for improved productivity, improved efficiency or reduced methane emissions could drive permanent and cumulative improvement in performance and/or reductions in methane emissions. Monitoring of selective cattle breeding for specific traits could be undertaken through applications for calf passports to ScotEID, but this would rely upon sire details being recorded on passports (which is currently not mandatory) and on the sire’s genetic potential for selected traits being known.
Proxy measures such as growth rates, milk production, conception rates and days to slaughter could also be used to monitor improvements over longer time periods but could be confounded with improvements in nutrition and health.
Suggested metrics
- Suitable metric: Sire details included on applications to ScotEID for calf/lamb passports
- Additional metric: Growth rates, Milk production, Conception rates, Age at slaughter
Improving animal health
The outcome
Improved animal health has a direct benefit to animal welfare. However, it also reduces losses during the production process, improving productivity and reducing methane emissions on a lifetime basis.
Issues with a metric
Several endemic (and exotic) diseases and syndromes can impact on the production efficiency and associated GHG emissions of farmed livestock. Some diseases have a direct impact on individual animals and metrics such as growth rates, reproductive success, and replacement rates. Others have a more indirect impact at herd/flock and national level, through how diseased animals are managed following diagnosis. Data and metrics on the prevalence of key priority diseases and health conditions at a national level are currently not collected, but would be invaluable, if logistically challenging. Eradication may be feasible for some diseases, e.g., Bovine Viral Diarrhoea (BVD), but requires the relevant tools, e.g., vaccines, and diagnostics to be available, in addition to coordination and buy-in across the industry.
The most straightforward was to assess animal health would be to collect a common set of proxy measures, e.g., growth rates, age at slaughter, conception rates, replacement rates and mortality rates will be the most feasible approach to measuring progress on animal health. This approach could also be applied to animal breeding and nutrition.
Recording all these metrics would be useful to both national-level monitoring of performance and for the land manager’s care for their livestock. This could also include records of veterinary medicines used to gauge movement towards sustainable prescribing, though this complex topic (Humphry et al. 2021) is outwith the scope of this report.
Suggested metrics
- Suitable metrics: Growth rate, Milk yields (Dairy cattle only), Mortality, Conception rates, Replacement rates, age at slaughter
Methane suppression
The outcome
Methane is a greenhouse gas with much higher global warming potential than carbon dioxide (methane from non-fossil fuel sources has a global warming potential of 27 times that of C02 with a 100-year time horizon, IPCC 2021). Enteric methane is released by ruminants such as cattle and sheep as part of the natural digestion of plant material by their associated microbiota. Methane is a significant part of agricultural emissions and so reducing it is key to reaching net zero emissions.
Issues with a metric
Selective breeding for reduced enteric methane emissions/increased animal efficiency (section 6.11) is a long-term strategy. In the short term, feed supplements designed to suppress enteric methane production could be used to drive down emissions. Sexed semen could be used to optimise herd dynamics by reducing numbers of male dairy calves and increasing male beef and dairy-beef calves. Direct measurement of methane emissions depends upon specialised equipment and is therefore not practical at the herd or flock level.
Two potential options are available. Firstly, to monitor the usage of methane-reducing feed supplements and calculate emission reductions based on their reduction factors. However, appropriate reduction factors for all feed products may not be available for all systems. The other option is to use current carbon footprinting tools (e.g., Agrecalc, Cool Farm Tool), but these need a subscription, may need the help of a consultant to set up and would benefit from information on forage quality and the impacts of feed supplements (so in effect replacing the need for providing information separately on feed supplements). The use of a standard tool across herds/flocks would allow for comparison.
Suggested metrics
- Suitable metric: Modelled farm emissions of CH4, CO2, N2O
Nutrient management
The outcome
Poor nutrient management can lead to the emissions of nitrous oxide, methane and ammonia. It also runs the risk of point source and diffuse pollution into watercourses.
Issues with a metric
Organic manures help recycle nutrients and build soil organic matter. However, there is the potential for them to be a source of ammonia, methane and nitrous oxide, as well as nutrient runoff in water courses. Much can be done to alleviate this, with well-designed and covered manure stores as well as appropriate application techniques. Gaseous emissions are difficult to monitor directly, so these would have to be modelled using a farm calculator. Impacts on soil nutrients and water quality are dealt with in previous sections so a separate metric for nutrient management is not necessary.
Suggested metrics
- Suitable metric: Modelled farm emissions of CH4, CO2, N2O, Mineralisable nitrogen and available phosphorus, Effectiveness of buffer strips
- Metric in development: Modelled farm emissions of ammonia
Coordinated metric collection
This section examines opportunities to synthesise across the required outcomes to minimise the number of metrics to be collected.
Why is this important?
Any monitoring must be as cost-effective as possible. Consequently, during the design phase decisions should be focussed on making the recording of metrics as straightforward as possible and to build efficiency into any monitoring programme, for example, by sampling multiple metrics on the same visit.
Greenhouse gas emissions
Gas emissions cannot be realistically measured directly. Using current farm-level tools to assess GHG emissions will deliver against multiple outcomes [Reducing Soil Greenhouse Gas (GHG) emissions, Livestock emissions, Nutrient management]. In addition, a tool for estimating ammonia emissions [Improving water and air quality] is in development, as is a field-level, real time emission model. These will further enhance capability in this area.
Coordinated sampling strategies
Many metrics depend on the direct sampling of soil or biodiversity and can’t be realistically replaced by proxies or existing data. However, well designed sampling programmes can maximise the efficiency of sampling, e.g., sampling for soil carbon, nutrients, pH and eDNA can be done at the same time. Even if this were not possible, sampling of soil nutrients, particularly mineralisable nitrogen and available phosphorus, would deliver against multiple outcomes [Improving soil nutrient content, Reducing diffuse pollution, Improving water and air quality, Nutrient management]. Similarly, monitoring soil bulk density is important for multiple outcomes [Increasing soil carbon/organic matter content, Improving soil water retention and flow], as is Water stable aggregates.
Soil monitoring
A range of soil monitoring is already being carried out for different purposes. There is a need to consider how future monitoring could supplement or replace existing work in this area, including:
- Scottish Government’s National Test Programme’s includes soil carbon measurement in Preparing for Sustainable Farming (PSF).
- The Agriculture and Horticulture Development Board Scorecard for soil health which includes soil structure (using VESS Visual Evaluation of Soil Structure), pH, extractable nutrients (phosphorus, potassium and magnesium), earthworms, soil organic matter.
- Linking Environment And Farming (LEAF).
- Red Tractor.
- Soil Association.
Livestock
The outcomes associated with animal health, nutrition and breeding must be largely monitored through proxy metrics, but these are relatively easy to measure and provide useful information direct to the land manager. However, it would be difficult to disentangle the differing contributions of nutrition, health and breeding on the overall performance of the flock/herd. At present, the separate contributions of improving animal nutrition, improving animal health and improving the genetics of the flock/herd are not easily separated but offer three routes for livestock managers to improve performance and consequently reduce emissions, one or more of which can be followed.
National level data
A few metrics can be based on existing data such as data collected as part of the agricultural census or can be derived from existing data such as satellite habitat maps. These are useful additional data, but do not provide the best metrics to assess the success of outcomes. They include: Area under permanent vegetation or other carbon positive management, Detailed monitoring in SEPA catchments to include water quality (nitrate, phosphate etc.), SEPA regulatory monitoring, Pesticide Usage Survey data, Farmland habitat diversity. They can be identified by filtering column I in the terrestrial sheet of MeasuresXMetrics.xlsx file.
Metrics currently in development
There are a range of metrics that are in development, some of which could take advantage of samples/data collected at the start of any monitoring programme (e.g., soil eDNA, acoustic monitoring) but others would come online later (e.g., LIDAR derived hedge data).
Cost-effective data acquisition strategies
Where this report recommends farmer-led metric recording, then this would provide a whole population value that can be followed through time. However, where only a proportion of the population of farms/fields can be sampled there has to be a statistically sound design adopted. This would include a comparison between areas where measures have been applied with other similar areas that are not in the scheme (control sites). A Before-After-Control-Impact (BACI) design is commonly used for monitoring the effect of environmental interventions. One issue to be addressed is that areas which are originally selected as controls may join the scheme later, so starting with a larger control population may guard against this.
An example – Wales
In Wales, the Glastir Monitoring and Evaluation Programme (GMEP) sample consisted of a stratified random sample 150 “Wider Wales” 1 km squares and 150 targeted at priority areas for the agri-environment scheme. It should be noted, however, that the “Wider Wales” squares do include land which is in the scheme, and that even the targeted 1 km squares contain differing amounts of land where specific management options have been applied. As it was found that the “Wider Wales” squares had considerable coverage of the scheme, in the more recent ERAMMP National Field Survey the aim has been to capture as much in-scheme and counterfactual land as possible within the full set of 300 squares.
To allow sampling effort to be spread across years and provide both temporal and spatial coverage, a rolling monitoring programme was followed by GMEP, in which sites are revisited, for example, every four or five years but different sites are sampled in years two and three. This allows better spatial coverage than if each site was revisited every year, while at the same time providing a more powerful estimate of change over say a five-year period, than not revisiting sites at all. The GMEP scheme uses a four-year rolling monitoring programme. Countryside Survey is also now following a rolling programme. Power analysis for the GMEP scheme (Emmett et al., 2014) suggested that across a variety of metrics, around 45 squares per year was the minimum number that need to be monitored before losing significant power to detect change over a period of 8 years (two cycles of the rolling programme).
Other considerations
Soil nutrients and soil carbon would be most appropriately measured at the scale of fields within farms, as this is the level at which relevant measures are applied. On the other hand, surveys of birds and pollinators, which are mobile over a larger area, might be more appropriately recorded for parcels of land, such as 1 km squares, although it is unlikely that the same measures will have been applied consistently across a whole 1 km square. To provide a common spatial unit across different metrics, the GMEP survey used 1 km squares, but, as it is not possible to sample vegetation and soils over the entire square, five randomly placed plots in each square were used for vegetation monitoring and soil samples were taken from the same plots. Vegetation was also recorded in other plot types, for example, along boundaries and field margins.
If fields rather than squares are to be used for soil monitoring, a representative sample for a particular field or part of a larger field can be obtained by bulking individual cores. For example, in the Soil Nutrient Health Scheme in Northern Ireland samplers follow a ‘W’ shaped track and take 25 cores. This should give a good estimate of the mean for an individual field but unless replicate cores are analysed individually it does not provide an estimate of the variability within the field. As a result, it is not possible to determine whether a change in a particular field between two sampling occasions is statistically significant. Under the Scottish Government’s National Test Programme 20% of arable and improved grassland can claim funding for soil testing each year. If this scheme is continued, it could mean complete coverage of all arable and improved grassland fields after five years. The recommendation of Scotland’s Farm Advisory Service (FAS) is that larger fields should be divided into 4 ha units, potentially with the help of the 1:25000 soil map. This approach might provide sufficient replicate samples across a farm as a whole to allow a change to be detected on a specific farm, although it should be noted that unless a suitable control is available it may not be possible to attribute any change to particular measures and that soil carbon changes in response to measures might take longer than five years to be detectable.
A note on data
Monitoring across a range of outcomes and metrics will generate a considerable volume of data. This will require a significant investment in design and development of the databases and in the staff required for data curation.
Alongside the technical aspects of database curation and management, consideration should be given to who owns the data – whether the land manager as it concerns their land holding or the taxpayer as they paid for it, who has access to it? – a narrow access regime provides increased security, especially around GDPR, but wider access allows for a broader range of analyses to be carried out. Furthermore, an overall data controller/owner would likely need to be appointed to comply with GDPR. It should be possible to develop data frameworks, where analysis without direct access to locations is possible (similar to medical data where analysis is separated from any data identifying subjects) and comply with Freedom of Information requests. Arguably, data should follow FAIR data principles and be open access as it has been funded from the public purse, as in the European Soil Observatory.
Conclusions
Some metrics will clearly be valuable in identifying the benefits of future agri-environmental management. For example, the collection of data on soil carbon and methane emissions clearly supports the Scottish Government’s climate ambitions. Others will support policies regarding sustainability (soil erosion) and the health of Scotland’s freshwater resources (reducing diffuse pollution). There is a mix of field data collection, farmer-collected data and modelled information with some usage of existing data.
It should be noted that several metrics have been identified that may only be proxies of the outcome they relate to, such as area of non-farmed habitats or pesticide usage, but they have the advantage of being based on already collected data with the cost savings this brings. Other metrics are still in development but should either be available by the start of the scheme or where samples can be collected for future analysis.
There are several outcomes that are closely related and need consideration together. Improving animal nutrition requires maintaining soil nutrients at a level where protein is not limiting growth. This may require the application of organic and/or inorganic fertilisers. However, excess nutrients can end up as N2O and ammonia emissions from slurry and the leaching of nitrates into freshwater. Careful management to optimise nutrient use is, therefore, required to reach all the desired outcomes: improving soil nutrient content, reducing diffuse pollution, improving water and air quality, livestock nutrition and nutrient management.
A second set of outcomes are also closely related, those dealing with livestock genetics, health and nutrition, alongside reducing methane emissions. Improved efficiency across the livestock sector should increase margins but at the same time reduce the methane footprint of meat.
Some metrics are not useful in isolation and need to be collected as a set to be useful. This is particularly true for animal health, nutrition and genetics where a range of data on growth rates, milk yields, mortality, conception rates and replacement rates are needed to get a full picture.
The final choice of which metrics to collect will depend on the availability of resources to carry out the monitoring and the type of sampling philosophy adopted. Assembly, curation and analysis of the data will all add costs to metric collection but it is important to get the most out of the data. Data ownership is also a key consideration.
Given the division between farmer-led and expert-led monitoring highlighted in the spreadsheet and in Section 6, we suggest the following:
- All enterprises to assess soil erosion and buffer strip effectiveness as this is highly site specific.
- All livestock enterprises to record growth rate, milk yields, mortality, conception rates, replacement rates, age at slaughter for sheep and cattle.
- ScotEID to require information on sires.
- All enterprises to use farm tool calculators to model GHG emissions. Livestock enterprises to model ammonia emissions when a suitable tool is available. The requirement to model might be limited to enterprises above a certain size to reduce costs.
- The remaining outcomes are best assessed using expert-led monitoring in a sample-based programme similar in philosophy to the Welsh approach. Resources available for monitoring and statistical power analysis would be a key part of how to structure this monitoring. They would also determine whether to focus on a small number of metrics and outcomes and cover a larger sample size, or to cover all outcomes on a smaller sample size. The outcomes monitored in this way include those focused on soils, waters and biodiversity.
References
Bieroza, M.Z., Bol, R. & Glendell, M. (2021) What is the deal with the Green Deal: Will the new strategy help to improve European freshwater quality beyond the Water Framework Directive? Science of The Total Environment, 791, 148080. https://doi.org/10.1016/j.scitotenv.2021.148080
Boag, B., Palmer, L.F., Neilson, R., Legg, R. & Chambers, S.J. (1997). Distribution, prevalence and intensity of earthworm populations in arable land and grassland in Scotland. Annals of Applied Biology, 130, 153-165. https://doi.org/10.1111/j.1744-7348.1997.tb05791.x
Brodie, E. (2023) Farm for Scotland’s Future: the case for change. A report for Scottish Environment LINK. https://farmforscotlandsfuture.scot/wp-content/uploads/2023/04/Farm-for-Scotlands-Future-full-report.pdf
Carey, P.D., Wallis, S., Chamberlain, P.M., Cooper, A., Emmett, B.A., Maskell, L.C., McCann, T., Murphy, J., Norton, L.R., Reynolds, B., Scott, W.A., Simpson, I.C., Smart, S.M. & Ullyett, J.M. (2008) Countryside Survey: UK Results from 2007. NERC/Centre for Ecology & Hydrology, 105pp. (CEH Project Number: C03259) https://nora.nerc.ac.uk/id/eprint/5191/
Carpenter, D., Sherlock, E., Jones, D.T., Chiminoides, J., Writer, T., Neilson, R., Boag, B., Keith, A.M. & Eggleton, P. (2012). Mapping of earthworm distribution for the British Isles and Eire highlights the under-recording of an ecologically important group. Biodiversity and Conservation, 21, 475-485. https://doi.org/10.1007/s10531-011-0194-x
Chatterjee, A., Lal, R., Wielopolski, L., Martin, M.Z. & Ebinger, M.H. (2009) Evaluation of different soil carbon determination methods. Critical Reviews in Plant Science, 28, 164-178. https://doi.org/10.1080/07352680902776556
Cottle, D.J. & Conington, J. (2012) Breeding for reduced methane emissions in extensive UK sheep systems. Journal of Agricultural Science, 150, 570-583. doi:10.1017/S0021859611000967
Cottle, D.J. & Conington, J. (2013) Reducing methane emissions by including methane production or feed intake in genetic selection programmes for Suffolk sheep. Journal of Agricultural Science, 151, 6, 872-888. doi:10.1017/S0021859612001037
Emmett, B.E., Abdalla, M., Anthony, S., Astbury, S., August, T., Barrett, G., Biggs, J., Botham, M., Bradley, D., Brown, M., Carter, H., Chadwick, D., Cigna, F., Cooper, D., Cooper, J., Cosby, BJ., Creer, S Cross, P., Edwards, F., Edwards, M., Evans, C., Ewald, N., Fitton, A., Garbutt, A., Grebby, S., Greene, S., Halfpenney, I., Hall, J., Harrison, S., Harrower, C., Henrys, P., Hobson, R., Hughes, S., Isaac, N., Jackson, B., Jarvis, S., Jones, D., Keith, A., Kelly, M., Korenko, J., Lallias, D., Leaver, D., Lebron, I., Malcolm, H., Maskell, L., McDonald, J., Moxley, J., Norton, L., O’Hare, M., Owen, A., Pereira, M., Peyton, J., Powney, G., Pywell, R., Rawlins, B., Robinson, D.A., Rorke, S., Rowland, C., Roy, D., Scarlett, P., Scholefield, P., Scott, A., Scott, L., Scott, R., Siriwardena, G., Smart, S., Smith, P., Swetnam, R., Taylor, R., Tordoff, G., Van Breda, J., Vincent, H., Wagner, M., Waters, E., Watkins, J., White, J., Williams, B., Wood, C. & Wright, S. (2014) Glastir Monitoring & Evaluation Programme. First Year Annual Report to Welsh Government (Contract reference: C147/2010/11). NERC/Centre for Ecology & Hydrology (CEH Project: NEC04780), pp.442. https://gmep.wales/sites/default/files/GMEP-First-Year-Annual-Report-2014-05-17.pdf
Environmental Standards Scotland (2022) Baseline Evidence Review – Water (Strategy and Analysis). https://www.environmentalstandards.scot/wp-content/uploads/2022/09/Baseline-Evidence-Review-Water-2022-09.pdf
Estrada-Carmona, N., Sánchez, A.C., Remans, R. & Jones, S.K. (2022) Complex agricultural landscapes host more biodiversity than simple ones: A global meta-analysis. Proceedings of the National Academy of Sciences, 119, e2203385119. https://doi.org/10.1073/pnas.2203385119
Giles, M.E., Caul, S., King, D., Mitchell, S., Sim, A., Neilson, R. & Paterson, E. (2023). Grass variety selection of microbial community composition is associated with differences in soil CO2 emissions. Applied Soil Ecology, 190, 104968.
Glendell, M., Palarea‐Albaladejo, J., Pohle, I., Marrero, S., McCreadie, B., Cameron, G. & Stutter, M. (2019) Modeling the ecological impact of phosphorus in catchments with multiple environmental stressors. Journal of Environmental Quality, 48, 1336-1346. https://doi.org/10.2134/jeq2019.05.0195
Harrison, S., McAree, C., Mulville, W. & Sullivan, T. (2019) The problem of agricultural ‘diffuse’ pollution: Getting to the point. Science of the Total Environment, 677, 700-717. https://doi.org/10.1016/j.scitotenv.2019.04.169
Hayes, E., Higgins, S., Geris, J., Nicholl, G. & Mullan, D. (2023) Weighted risk assessment of critical source areas for soil phosphorus losses through surface runoff mechanisms. Catena, 225, 107027. https://doi.org/10.1016/j.catena.2023.107027
Humphry, R., Skuce, P., Hayward, A., Henry, M., Hutchinson, I., Gunn, G. & Costa, M. (2021) Measurement of antimicrobial usage: what can we learn across Livestock Sectors? https://sefari.scot/research/measurement-of-antimicrobial-usage-what-can-we-learn-across-livestock-sectors
Insausti, M., Timmis, R., Kinnersley, R. & Rufino, M.C. (2020) Advances in sensing ammonia from agricultural sources. Science of The Total Environment, 706, 135124. https://doi.org/10.1016/j.scitotenv.2019.135124
IPCC (2021) Climate Change 2021: The Physical Science Basis. Contribution of Working Group I to the Sixth Assessment Report of the Intergovernmental Panel on Climate Change. Eds Masson-Delmotte, V., P. Zhai, A. Pirani, S.L. Connors, C. Péan, S. Berger, N. Caud, Y. Chen, L. Goldfarb, M.I. Gomis, M. Huang, K. Leitzell, E. Lonnoy, J.B.R., Matthews, T.K. Maycock, T. Waterfield, O. Yelekçi, R. Yu, and B. Zhou. Cambridge University Press, Cambridge, United Kingdom and New York, NY, USA, 2391 pp. doi:10.1017/9781009157896.
Leinonen, I., Eory, V., MacLeod, M., Sykes, AS., Glenk, K., & Rees, RM. (2019). Comparative analysis of farm-based carbon audits. ClimateXChange. https://www.climatexchange.org.uk/media/3584/farm-based-carbon-audits-final.pdf
Neilson, R., Aitkenhead, M., Lilly, A. & Loades, K. (2021) Monitoring soil health in Scotland by land use category – a scoping study. James Hutton Institute. https://doi.org/10.7488/era/1293
Pakeman, R.J., Beaton, J., Fielding, D., Hewison, R., McKeen, M., Potts, J., Quinzo-Ortega, L., Stephen, T. & Stockan, J. (2020) Evaluation of the Biodiversity outcomes of the 2014-20 SRDP Agri-Environment Climate Scheme through a selection of case studies. Report to NatureScot. https://www.nature.scot/doc/naturescot-research-report-1254-evaluation-biodiversity-outcomes-2014-20-srdp-agri-environment.
Perry, J.N., Rothery, P., Clark, S.J., Heard, M.S. & Hawes, C. (2003) Design, analysis and statistical power of the Farm‐Scale Evaluations of genetically modified herbicide‐tolerant crops. Journal of Applied Ecology, 40, 17-31. https://doi.org/10.1046/j.1365-2664.2003.00786.x
Prout, J.M., Shepherd, K.D., McGrath, S.P., Kirk, G.J.D., Hassall, K.L. & Haefele, S.M. (2022) Changes in organic carbon to clay ratios in different soils and land uses in England and Wales over time. Scientific Reports, 12, 5162. https://doi.org/10.1038/s41598-022-09101-3.
Reaney, S.M., Mackay, E.B., Haygarth, P.M., Fisher, M., Molineux, A., Potts, M. & Benskin, C.M.H. (2019) Identifying critical source areas using multiple methods for effective diffuse pollution mitigation. Journal of Environmental Management, 250, 109366. https://doi.org/10.1016/j.jenvman.2019.109366
Saby, N.P., Bellamy, P.H., Morvan, X., Arrouays, D., Jones, R.J., Verheijen, F.G., Kibblewhite, M.G., Verdoodt, A.N.N., Üveges, J.B., Freudenschuss, A. & Simota, C. (2008) Will European soil‐monitoring networks be able to detect changes in topsoil organic carbon content? Global Change Biology, 14, 2432-2442. https://doi.org/10.1111/j.1365-2486.2008.01658.x
Skuce, P., Holland, J., Kenyon, F., Wells, B., McCracken, D., Neilson, R. & Bartley, D. (2022) Anthelmintics and the Environment – opening a whole can of worms? https://sefari.scot/research/anthelmintics-and-the-environment-%E2%80%93-opening-a-whole-can-of-worms
Staggenborg, J. & Anthes, N. (2022) Long‐term fallows rate best among agri‐environment scheme effects on farmland birds—A meta‐analysis. Conservation Letters, 15, e12904. https://doi.org/10.1111/conl.12904
Stutter, M., Costa, F.B. & Ó hUallacháin, D. (2021) The interactions of site-specific factors on riparian buffer effectiveness across multiple pollutants: A review. Science of the Total Environment, 798, 149238. https://doi.org/10.1016/j.scitotenv.2021.149238
Walton, P., O’Brien, D., Smart, J., Burns, F., Basset, D., Bradfer-Lawrence, T., Foster, S., James, B.D., Mancini, F., Mordue, S., Pakeman, R.J., Pescott, O.L., Simkin, J., Stanbury, A.J. & Towers, M. (2023) State of Nature Scotland 2023. The State of Nature Partnership. https://stateofnature.org.uk/wp-content/uploads/2023/09/TP26056-SoN-Scotland-summary-report-v5-1.pdf.pagespeed.ce.EIp-TYaoGQ.pdf
Wang, Y., Yao, Z., Zhan, Y., Zheng, X., Zhou, M., Yan, G., Wang, L., Werner, C. & Butterbach‐Bahl, K. (2021) Potential benefits of liming to acid soils on climate change mitigation and food security. Global Change Biology, 27, 2807-2821. https://doi.org/10.1111/gcb.15607
Zhang, H.M., Liang, Z., Li, Y., Chen, Z.X., Zhang, J.B., Cai, Z.C., Elsgaard, L., Cheng, Y., van Groenigen, K.J. & Abalos, D. (2022) Liming modifies greenhouse gas fluxes from soils: A meta-analysis of biological drivers. Agriculture, Ecosystems & Environment, 340, 108182. https://doi.org/10.1016/j.agee.2022.108182
List of Appendices
Appendix A. List of measures under consideration
Appendix B. Correspondence between land-based measures and relevant outcomes
Appendix C. Potential monitoring metrics and methods
Measures and metrics spreadsheet
© Published by The James Hutton Institute, 2024 on behalf of ClimateXChange. All rights reserved.
While every effort is made to ensure the information in this report is accurate, no legal responsibility is accepted for any errors, omissions or misleading statements. The views expressed represent those of the author(s), and do not necessarily represent those of the host institutions or funders.
To deliver climate change mitigation and adaptation, nature restoration and high quality food production, the Scottish Government produced their vision for agriculture, along with the next steps, to encourage sustainable and regenerative farming in Scotland.
A programme of work is underway to reform agricultural payments with a greater emphasis placed on delivering environmental outcomes with a proposed structure of four payment tiers tied to a suite of potential measures that will deliver tangible outcomes.
This study identified the most suitable metrics that could be used to monitor the success of the proposed measures in the agricultural reform programme against environmental outcomes. This includes consideration of cost-effectiveness, practicalities and the skills and capabilities of those tasked with monitoring.
Findings:
- Emissions cannot be measured directly, so we suggest using current farm-level tools to assess greenhouse gas (GHG) emissions, known as carbon audits. A field level, real time GHG emission model is in development as well as a tool for doing this for ammonia.
- Many metrics depend on direct sampling of soil or biodiversity and can’t be realistically replaced by proxies or existing data. However, well designed sampling programmes can maximise the efficiency of sampling, e.g. sampling for soil carbon, nutrients, pH and eDNA can be done at the same time.
- The outcomes associated with animal health, nutrition and breeding must be largely monitored through proxy metrics. These are relatively easy to measure and provide useful information directly to the land manager.
- A few metrics, such as pesticide usage data or area under permanent habitat, collected as part of the agricultural census, can be derived from existing data.
- Some of the metrics in development could take advantage of samples/data collected at the start of any monitoring programme (e.g. soil eDNA, acoustic monitoring) and others would come online later (e.g. LIDAR-derived hedge data).
- The measure ‘retain traditional cattle’ could not be related to the outcomes.
- Deciding on a suitable suite of metrics to assess the benefits of the Agriculture Reform Programme is only one step as there are issues related to design, sample size and data to be considered.
For further details, please read the report.
If you require the report in an alternative format such as a Word document, please contact info@climatexchange.org.uk or 0131 651 4783.