
Agriculture accounts for 19% of Scottish greenhouse gas (GHG) emissions and is the third largest emitting sector. Reducing these emissions is critical. ClimateXChange designed and coordinated a programme of research and knowledge exchange that has transformed how the Scottish Government, farmers and the wider agriculture sector have identified ways to reduce emissions on the path to net zero by 2045.
Through a series of influential reports, our work has driven innovative policy development and effective and practical engagement with the sector, providing a solid foundation for agricultural climate mitigation in Scotland. It has enabled and supported collaboration across the agricultural sector with a focus on the feasibility of a wide range of different emission reduction measures.
Accessible and useable research
Over the last two decades Scottish Government’s Strategic Research Programme has developed a robust and highly respected evidence base for emissions reduction in agriculture, measuring GHG reduction interventions by their cost-effectiveness (known as a marginal abatement cost curve (MACC)).
While the MACC has been published in peer-reviewed journals and expert reports (including for the UK Climate Change Committee), it is highly technical analysis that is not easily accessible to non-technical policy and industry actors.
Working closely with Scottish Government’s Rural and Environment Science and Analytical Services (RESAS), ClimateXChange designed and coordinated a series of research projects that would provide accessible and useable research insights from the MACC for policymakers.
Starting in 2021, our Marginal abatement cost curve for Scottish agriculture report (MACC report) set out an accessible assessment of the mitigation potential. It examined the difference between the emissions arising from agricultural activities before and after mitigation measures are implemented and the resulting GHG savings. The report updated estimates of practical cost-effectiveness for a selection of agricultural mitigation options and provided previously unavailable detail on specific measures that have the potential to reduce emissions from the sector.
A second research project in 2023 – A scenario-based approach to emissions reduction targets in Scottish agriculture (Scenarios report) – examined those options in more detail while also drawing out challenges between UK-based methodologies and Scotland-specific data.
CXC has continued to work on detailed research reports – covering specifics from reducing methane emissions in livestock to decarbonising mobile machinery – demonstrating the potential to drill into the detail of each measure.
Engaging with farmers and the reality on farms
Farmer-led groups were established by the Scottish Government in 2020 to develop advice and proposals for the Scottish Government on how to cut emissions and tackle climate change. Our reports provided clear and accessible interpretations of complex analysis. This ensured that these groups could make direct, time-critical use of information that would otherwise have been inaccessible to all but highly experienced economists.
“The ClimateXChange work on the MACC for agriculture and related scenarios was essential in providing the baseline evidence we needed to assess the mitigation potential for emission reductions on farm. The combination of access to serious research expertise and the clear communication of the findings meant we could assess the measures with a wider range of internal and external stakeholders who are not expert economists.”
Macroeconomist, Office of the Chief Economic Advisor, Scottish Government
By presenting individual options in detail and with a wide audience – especially farmers – in mind, our MACC report supported subsequent discussions on practical actions that could realistically be applied on farm. As well as being cited in each of the farmer-led group sector reports and their supporting analysis, our report directly informed the development of a new approach to agricultural support payments.
Supporting the Climate Change Plan and beyond
The MACC and Scenarios reports have proved foundational for the agricultural emissions reductions proposed in the Climate Change Plan. Policymakers took measures outlined in the reports to the farmer-led groups as the starting point for their deliberations, and the groups’ reports in turn reference the CXC evidence. This feedback loop between research, stakeholder engagement, and policymaking has reinforced the credibility and uptake of the findings.
The Climate Change Plan 2026-2040 cites the Scenarios report as the basis for estimating mitigation potential across the Agricultural Reform Programme. Drawing on input from farmer-led groups, stakeholders, and academic analyses to outline practical and technically feasible pathways for emissions reduction across Scotland’s farming systems, its insights fed directly into identifying which measures should be supported within the Programme. This has directly informed the emissions calculation in the Climate Change Plan and what emissions reduction measures were selected for support based on their reduction potential and cost.
“These reports were critical in informing the estimates of abatement that went into the Climate Change Plan. They are our most important sources of estimates, and it would have been impossible to prepare our contribution to the plans without them. In addition to the reports themselves we have hugely valued regular contact with the authors to talk things through and ensure our interpretations are up to date.”
Senior economist, RESAS
Potential measures to reduce emissions from agricultural machinery were identified in both the MACC report, the Scenarios report and specific research. These are cited in the Climate Change Plan as key evidence for the policy package to address agricultural combustion.
Scottish Government colleagues, including the Cabinet Secretary for Environment, Climate Change and Land Reform, as well as farmers and academics have recognised the significant impact of CXC’s suite of research on agriculture’s pathway to net zero. Our work has been referenced extensively in Scottish Government policy documents and supporting published evidence – some of which are linked to below.
Responding to continuing challenges
Despite significant efforts across the sector, agricultural emissions remain largely unchanged. As other sectors cut their emissions this means agricultures share of overall emissions is increasing.
Agriculture faces key challenges in reducing greenhouse gas emissions through the combination of biological processes in the production of a secure food supply, the lack of market-ready technologies and the capital investment required for change.
Our work is continuing to drive policy development, sector engagement, innovation and further research, compounding our impact for years to come. Our research findings and approach to co-developing and co-delivering useable research outputs will continue to have impact for the lifetime of the Climate Change Plan and beyond.
Related projects
Breeding for reduced methane emissions in livestock
Increasing low-carbon energy in Scottish agriculture through a whole systems approach
Decarbonisation of mobile agricultural machinery – an evidence review
Nutritional strategies to reduce enteric methane emissions
Related policy documents
Agricultural reform – list of measures
Pig Sector Farmer-Led Climate Change Group: climate change and greenhouse gas evidence
Arable Farmer-led Group: climate change evidence
Hill, Upland and Crofting Farmer-led Group: climate change evidence
Reducing emissions from agriculture – the role of new farm technologies
Dairy Farmer-led Group: climate change evidence
Greenhouse gas inventory: estimated arable emissions and their mitigation
A New Blueprint For Scotland’s Arable Sector
Research completed: March 2026
DOI: https://doi.org/10.7488/era/7056
Executive summary
Aims
This report examines how Cross Compliance contributes to Scotland’s Vision for Agriculture, and whether introducing greater ambition will support Scotland in achieving its goals.
All farmers and crofters in Scotland who receive income support under the Basic Payment Scheme must observe Cross Compliance requirements, which are a set of rules that enforce laws around animal and plant health as well as sustainable agricultural practices. Cross Compliance requirements are set as Statutory Management Requirements (SMRs) and Good Agricultural and Environmental Conditions (GAECs). Breaches of these requirements can result in a penalty applied to the value of a business’s Basic Payment Scheme payment entitlement.
The report explores the differences between the Cross Compliance rules in Scotland and EU Member States with a conditionality policy, and analyses the strengths, weaknesses and macro-environmental considerations of three selected opportunities which could be implemented to better align with Scotland’s Vision for Agriculture. A conditionality policy in this context is a rule linking EU farm income support to farmers’ compliance with essential environmental, health, welfare, and land‑management standards.
Findings
We found that the contribution of Scottish Cross Compliance to the five outcomes of the Vision for Agriculture are uneven, with stronger alignment to environmental and animal welfare outcomes, and more limited support for thriving agricultural businesses and a just transition. There was limited evidence in the literature on the implementation and outcome of more ambitious Cross Compliance approaches.
We selected three Cross Compliance opportunities based on the evidence assessment and a set of criteria, and examined them in detail:
- Opportunity 1: Enhancement of buffer areas to be in line with best practice for maximum protection to nature and water pollution
- Opportunity 2: Extension of management requirements to reduce soil erosion risk
- Opportunity 3: Incorporation of hedgerow maintenance requirements
We identified four overarching considerations relevant to any development of the current Cross Compliance rules to better deliver on the Vision’s outcomes:
- Balancing environmental ambition with profitability
- Developing a strong monitoring and evidence base, including robust data to justify changes and increase the acceptability of policy adjustments
- Co‑designing rules with farmers, crofters and land managers
- Increasing support, training and communication
Finally, the research emphasised the importance of considering any revisions to Cross Compliance within the wider Scottish agricultural policy framework. Increasing the ambition of Cross Compliance rules in Scotland to improve outcomes may create a gap between the EU conditionality requirements and the Scottish Cross Compliance system.
Conclusions
The opportunities studied here do not constitute an exhaustive list of possible improvements to deliver better economic, environmental and social outcomes, nor an indication of future policy changes to be applied to Cross Compliance rules in Scotland. There is clear potential to strengthen the Cross Compliance rules to support the outcomes of the Vision for Agriculture, but more evidence is needed to support any future changes, as well as holistic consideration of the wider agricultural and environmental policies.
Glossary / Abbreviations table
|
ARC Act |
Agriculture and Rural Communities Act |
|
CAP |
Common Agricultural Policy |
|
EU |
European Union |
|
FYM |
Farmyard Manure |
|
GAEC |
Good Agricultural and Environmental Conditions |
|
MS |
Member State |
|
PESTLE |
Political, Economic, Social, Technical, Legal and Environmental |
|
RAG |
Red-Amber-Green |
|
REA |
Rapid Evidence Assessment |
|
RPID |
Rural Payments & Inspections Division |
|
SEPA |
Scottish Environment Protection Agency |
|
SMRs |
Statutory Management Requirements |
|
SOM |
Soil Organic Matter |
|
SWOT |
Strengths, Weaknesses, Opportunities and Threats |
Introduction
Context
Scotland’s Vision for Agriculture is to be a global leader in sustainable and regenerative agriculture (see Figure 1). Together with the accompanying Route Map[1], it outlines policies aligned with national climate change[2] and biodiversity[3] targets in a post-Brexit context. As noted in the Agriculture and Rural Communities (ARC) Act[4], the overarching objectives of agricultural policy in Scotland include:
- the adoption and use of sustainable and regenerative agricultural practices,
- the production of high-quality food,
- the promotion and support of agricultural practices that protect and improve animal health and welfare,
- the facilitation of on-farm nature restoration, climate mitigation and adaptation, and
- enabling rural communities to thrive.
These five Strategic Outcomes have been developed to articulate and evidence what successful delivery of the ARC Act objectives would mean in practice for Scotland’s agriculture, rural communities and the rural economy.
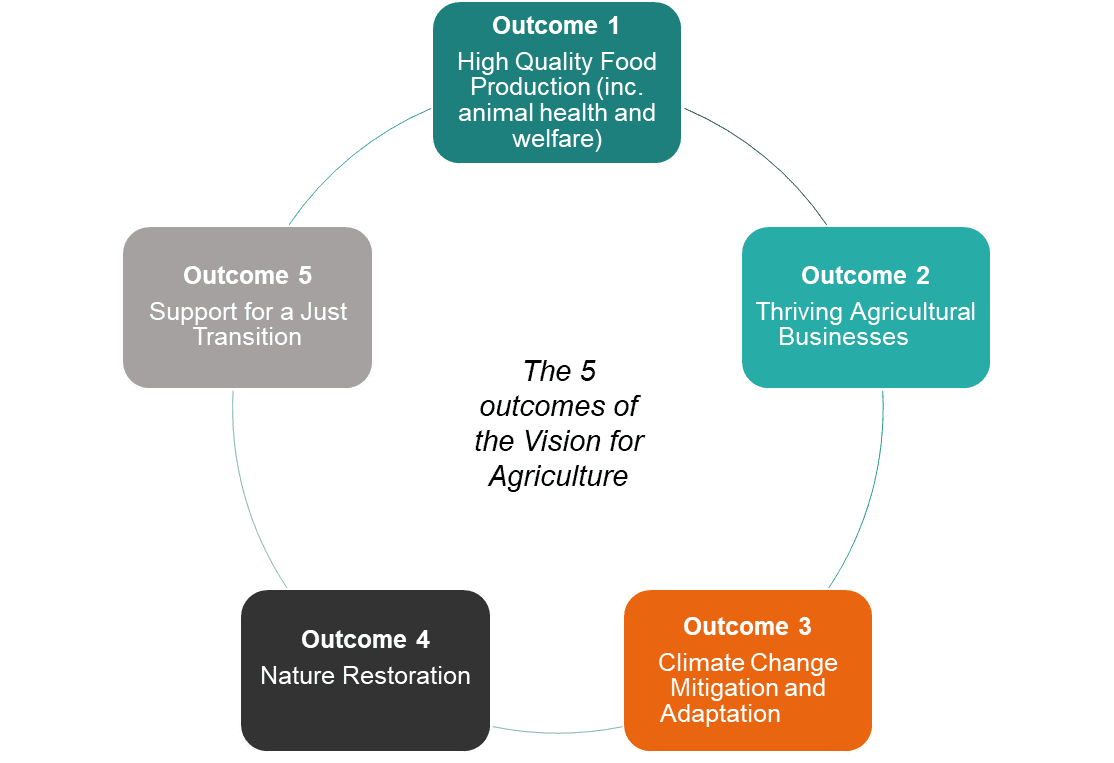
Figure 1: Illustration of the five outcomes of the Scottish Vision for Agriculture
These objectives aim to create a framework that supports environmental and climate goals while ensuring the economic viability and sustainability of Scotland’s agricultural sector.
Cross Compliance
Cross Compliance is a set of rules comprising SMRs (Statutory Management Requirements) and GAECs (Good Agricultural and Environmental Conditions). SMRs are enforced by separate sectorial law in Scotland and include regulations such as the requirements for animal identification. GAECs introduce protections of natural resources such as water, soils & carbon stocks and the minimum level of maintenance required. Therefore, they align closely with Scottish Government climate priorities. Through measures such as maintaining buffer strips, limiting soil erosion or regulating hedge trimming to protect biodiversity, GAECs help mitigate environmental degradation, support ecosystem services and align with several of Scotland’s broader goals of halting biodiversity loss and improving land and water health.
The Cross Compliance rules contribute to Scotland’s environmental targets by setting baseline standards for environmental protection, climate change, good agricultural condition of land, water quality, public health, animal and plant health and animal welfare. Farmers must adhere to these rules to receive support payments, through delivering actions such as buffer strips. Cross Compliance launched in 2005 when the UK was part of the European Union (EU), and Scottish Government has retained the Cross Compliance rules since the UK left the EU in 2020.
Since the UK’s withdrawal from the EU in 2020, Scotland is no longer bound to follow the set of conditionality rules known as “conditionality” included in the Common Agriculture Policy (CAP). This means that Scotland has the legal ability to review and revise Cross Compliance to better support national outcomes and to improve effectiveness. Through the review of GAECs in Scotland there is the potential to have far-reaching climate and biodiversity impacts as roughly 17,000 farmers across Scotland are currently required to meet GAECs requirements.
Aim of this project
This research examines how Cross Compliance contributes to Scotland’s Vision for Agriculture, and to understand whether introducing greater ambition (i.e. conditionality) will support Scotland in achieving its goals. There were three key aims:
- Provide clarity and understanding of the current contribution of Scottish Cross Compliance to the five outcomes of the Vision for Agriculture,
- identify the opportunities and barriers to developing the current set of Cross Compliance rules to better deliver on these outcomes, including from a practical implementation or economic perspective for farmers, crofters and land managers,
- gather any specific lessons from comparable nations in the United Kingdom or the European Union from developments in Cross Compliance in other jurisdictions.
The analysis focusses on GAECS, because SMRs are embedded in separate Scottish Legislation, and therefore GAECs are more likely to be flexible in terms of scope. The research project does not present an analysis of the efficiency and relevance of the current set of Cross Compliance rules in Scotland, nor recommend changing them.
This project looks at the alignment between the Cross Compliance rules and the Vision for Agriculture, exploring differences between these rules in Scotland and other nations with a conditionality policy, and analysing the strengths, weaknesses and macro-environmental considerations of three selected opportunities which could be implemented in order to better align with Scotland’s Vision for Agriculture.
Selection of Cross Compliance opportunities
To select the Cross Compliance opportunities to be analysed for the potential to expand their ambition, a Rapid Evidence Assessment (REA), and stakeholder engagement was undertaken.
Based on the findings, the contribution of the rules was mapped to the outcomes of the Vision for Agriculture, including identifying any evidence gaps, weaknesses and examples of other nations’ Cross Compliance rules showing greater ambition. Based on this assessment and stakeholder inputs, three opportunities were selected for further investigation. The methodological process followed for this project is illustrated in Figure 2.
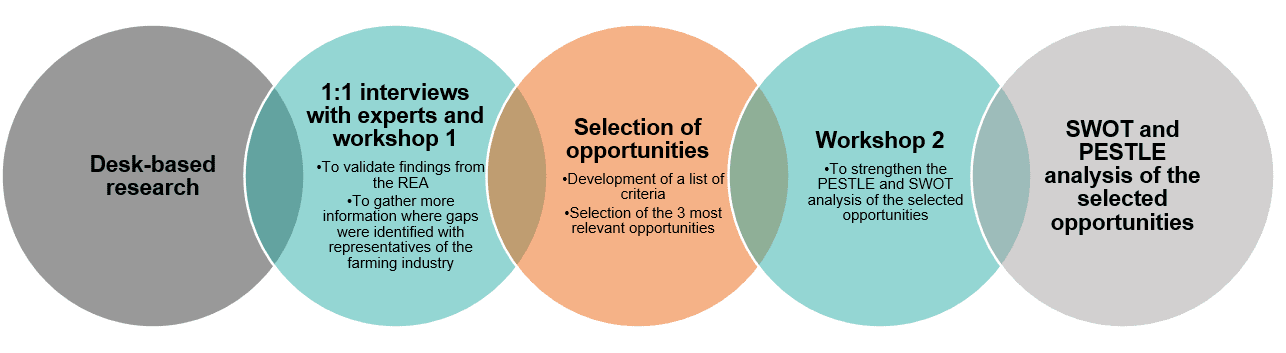
Figure 2: The five-step approach to develop the analysis of Cross Compliance opportunities
Assessment of the published evidence
We explored the role of Cross Compliance in Scotland within the context of the Scottish Government’s Vision for Agriculture.
A structured REA approach was used to ensure transparency and rigour. A search strategy protocol, including key search terms, inclusion criteria and example search strings was developed, reviewed and agreed by the Steering Group. Evidence was gathered systematically, with searches recorded with information on search date and search engine and string used. Sources were screened for relevance and robustness, and relevant evidence was then extracted and appraised to address the research questions and identify knowledge gaps. Appendix A provides further detail and examples on the search strategy developed.
Findings and information gaps
Research question 1:
What are the Cross Compliance requirements in Scotland, which environmental benefits and limitations do they provide and how do they contribute to the Scottish Government’s Vision for Agriculture?
A list of the SMR and GAEC requirements in Scotland was compiled (Table 1) and expert judgement was used to analyse alignment with the five outcomes of Scotland’s Vision for Agriculture, scored using Red-Amber-Green (RAG) rating system:
- ”Strong” indicates strong alignment with the outcome,
- “Partial/moderate” reflects partial or moderate alignment,
- “Negligible” signifies little to no contribution toward that outcome.
This assessment demonstrates that while Scotland’s current Cross Compliance requirements contribute meaningfully to several outcomes within the Vision for Agriculture—particularly in areas such as climate change—their overall impact is uneven. Notably, Outcomes 2 (Thriving Agricultural Businesses) and 5 (Support for a Just Transition) appear to be the least well-supported by existing standards. This is consistent with the intended purpose of Cross Compliance, which focuses on maintaining baseline environmental protections rather than supporting economic or social‑equity outcomes. Nonetheless, for the purposes of this research question- assessing the extent to which current Cross Compliance requirements align with the Vision for Agriculture – these findings point to clear opportunities to improve alignment, raise ambition, and address gaps in delivery.
|
GAEC/SMR |
Contribution to Scottish Governments’ Vision for Agriculture | |||||
|---|---|---|---|---|---|---|
|
Outcome 1- High Quality Food Production (inc. animal health and welfare) |
Outcome 2- Thriving Agricultural Businesses |
Outcome 3- Climate Change Mitigation and Adaptation |
Outcome 4- Nature Restoration |
Outcome 5- Support for a Just Transition | ||
|
GAEC 1 |
Buffer strips along watercourses |
Negligible |
Negligible |
Strong |
Strong |
Negligible |
|
GAEC 2 |
Abstraction of water for irrigation |
Negligible |
Partial/moderate |
Strong |
Partial/moderate |
Negligible |
|
GAEC 3 |
Protection of groundwater against pollution |
Negligible |
Negligible |
Strong |
Partial/moderate |
Negligible |
|
GAEC 4 |
Minimum soil cover |
Partial/moderate |
Negligible |
Strong |
Partial/moderate |
Negligible |
|
GAEC 5 |
Minimum land management reflecting site specific conditions to limit erosion |
Partial/moderate |
Negligible |
Strong |
Negligible |
Negligible |
|
GAEC 6 |
Maintenance of soil organic matter |
Partial/moderate |
Negligible |
Strong |
Partial/moderate |
Negligible |
|
GAEC 7 |
Retention of landscape features |
Negligible |
Negligible |
Strong |
Strong |
Negligible |
|
SMR 1 |
Nitrate Vulnerable Zones |
Partial/moderate |
Partial/moderate |
Strong |
Partial/moderate |
Negligible |
|
SMR 2 |
Conservation of wild birds |
Negligible |
Negligible |
Strong |
Strong |
Negligible |
|
SMR 3 |
Conservation of flora and fauna |
Negligible |
Negligible |
Strong |
Strong |
Negligible |
|
SMR 4 |
Food and feed law |
Strong |
Negligible |
Strong |
Negligible |
Negligible |
|
SMR 5 |
Restrictions on the use of substances having hormonal or thyrostatic action and beta-agonists in farm animals |
Strong |
Negligible |
Negligible |
Negligible |
Negligible |
|
SMR 6 |
Pig identification and registration |
Strong |
Negligible |
Negligible |
Negligible |
Negligible |
|
SMR 7 |
Cattle identification and registration |
Strong |
Negligible |
Negligible |
Negligible |
Negligible |
|
SMR 8 |
Sheep and goat identification |
Strong |
Negligible |
Negligible |
Negligible |
Negligible |
|
SMR 9 |
Prevention and control of TSEs |
Strong |
Negligible |
Partial/moderate |
Partial/moderate |
Negligible |
|
SMR 10 |
Restrictions on the use of plant protection products |
Partial/moderate |
Negligible |
Partial/moderate |
Strong |
Negligible |
|
SMR 11 |
Welfare of calves |
Strong |
Negligible |
Strong |
Negligible |
Negligible |
|
SMR 12 |
Welfare of pigs |
Strong |
Negligible |
Strong |
Negligible |
Negligible |
|
SMR 13 |
Welfare of farmed animals |
Strong |
Negligible |
Strong |
Negligible |
Negligible |
Table 1: Contribution of Cross Compliance requirements to Scottish Governments’ Vision of Agriculture.
Environmental benefits of current Cross Compliance regulations
Information on the environmental benefits of Cross Compliance in Scotland is available in the literature, however available evidence on environmental limitations is limited and largely pre-2020. Based on interviews with the Scottish Government and its agencies, a study by Blackstock et al., 2018 found:
- Concerns that policy instruments that could address soil protection were not as well implemented as they could be (including under GAECs)
- There is scope to strengthen soil protection under the GAECs, and;
- There is potential for policy instruments, including GAECs, to deliver greater biodiversity outcomes if requirements were redesigned or implemented differently.
More recent analysis of the environmental limitations of Cross Compliance was not identified. In this context, ‘environmental limitations’ refers to areas where current Cross Compliance requirements may not fully address all environmental pressures, including emerging risks.
Table 2 presents a summary of the environmental benefits of GAECs (the study was focused on GAECs). A full list including the environmental benefits of SMRs is presented in Appendix B.
Table 2: Main environmental benefits associated with GAEC rules
|
GAEC |
Environmental benefit |
|
Water pollution prevention; soil erosion reduction | |
|
2 – Abstraction of water for irrigation |
Protection of water resources |
|
3 – Protection of groundwater against pollution |
Groundwater protection against pollution |
|
4 – Minimum soil cover |
Food and cover for insects, birds and small mammals; erosion control |
|
5 – Minimum land management reflecting site specific conditions to limit erosion |
Erosion control |
|
6 – Maintenance of soil organic matter |
Biodiversity support; supports air and water quality; Climate change mitigation |
|
7 – Retention of landscape features |
Nature conservation ; Climate change mitigation |
Barriers to implementation
We also identified barriers which can limit the effectiveness of Cross Compliance as a tool for changing the management practises of farmers, crofters, and land managers in Scotland and more widely in the EU. These include:
- Administrative burden: The administrative burden of Cross Compliance, primarily the time and effort required both understand requirements and maintain/collate evidence to demonstrate compliance has been widely discussed and remains a major concern despite attempts by public authorities to reduce the burden. Minimising the administrative burden of Cross Compliance can increase the efficiency of agricultural policy. (El Benni et al., 2025)
- Lack of awareness and training: A lack of awareness around the environmental benefits of compliance indicates the need for a cultural shift within the farming sector. Improved training and communication could help build understanding of how Cross Compliance supports water quality, soil health, biodiversity, and long-term business sustainability. Emphasising the value of environmental protection as part of business resilience, not just for regulatory purposes, may encourage uptake (Blackstock et al., 2018)
- Fear of penalties and inspections: Some farmers and land managers expressed concerns over the risk of prosecution and fines, particularly due to the complexity of rules and fear of inadvertent non-compliance (MacLeod et al., 2008 and Blackstock et al., 2018). This apprehension around inspections can discourage engagement with compliance measures.
- Limited access to advice and guidance: Earlier studies (Baldock et al., 2013 and Bennett at al., 2006) highlighted challenges in accessing clear, practical guidance on Cross Compliance across both Scotland and the EU and suggested that existing support mechanisms were not always user-friendly or well-communicated. While current guidance is now clearly set out by Rural Payments and Services, farmers may still experience difficulties in navigating complex requirements or knowing where to look for further information.
Research question 2: Are there any other UK devolved administrations and/or EU Member States (MS) which have shown greater ambition beyond the basic Cross Compliance requirements?
A key challenge in exploring the second research question was the limited literature sources focussing specifically on Cross Compliance ambition. Many references concentrated on eco-schemes or agri-environment schemes, which, while related, fall outside the scope of this project. Among the sources addressing Cross Compliance directly, the emphasis was often on inspections, breaches, and the communication or interpretation of regulatory requirements rather than their ambition beyond the basic Cross Compliance requirements.
While some sources provided insights into how individual European Member States and other UK devolved administrations implement Cross Compliance, it was often unclear whether these examples represented the most ambitious approaches relative to other countries. In a few cases, sources suggested that certain countries go beyond the basic requirements; however, there was a lack of detailed information on how these enhanced measures were implemented, the outcomes achieved, and any barriers or lessons learned. Table 4 presents some examples. As previously indicated, these examples do not cover each GAEC individually, and it remains unclear whether they represent the most ambitious approaches across Member States. As such, the insights should be interpreted as indicative rather than comprehensive. The examples also largely draw on earlier CAP programming periods, given that comprehensive analysis of implementation and outcomes under the new CAP is less available.
Table 4: Examples of Cross Compliance rules in EU MS presented a wider scope than Scotland
|
Country |
Cross Compliance requirements going beyond current GAEC requirements in Scotland |
Related Scottish GAEC |
References |
|---|---|---|---|
|
France and Spain |
Management of irrigation systems. |
GAEC 2 |
Farmer, M. and Swales, V., 2004. |
|
France |
Unfertilised buffer strips of 5–10 metres width along watercourses. |
GAEC 3 |
European Court of Auditors, 2008 |
|
Belgium Flanders |
Soil analysis (measure related to soil erosion) |
GAEC 5 |
Farmer, M. and Swales, V., 2004 |
|
Netherlands |
|
Jongeneel, R. and Brouwer, F., 2007 | |
|
France |
In the category of other soil erosion standards, France has established an obligation to set up buffer stripes along watercourses. The standard requires farmers who have a watercourse present on the farmland, to set up 5m-10m buffer zones (grass strips) |
Kristensen, L. and Primdahl, J. (2006) | |
|
Netherlands |
Farmers are to report cases of extraordinary erosion | ||
|
Greece & Lithuania |
Arable stubble: incorporation in soil or grazing |
GAEC 6 |
Kristensen, L. and Primdahl, J. (2006) |
|
Czech Republic |
Application of liquid manure | ||
|
Netherlands & Italy |
Green cover on set aside land | ||
|
France & Germany |
Crop rotation providing a yearly cultivation of at least three crops (excluding permanent crops) | ||
|
Greece |
Cultivate grain legumes and incorporate these into the soil on 20 % of the cultivated area of their farm each year to improve soil organic matter (SOM) |
European Court of Auditors, 2008 | |
|
Denmark |
No tillage is allowed on soils with >12% carbon within protected areas |
Environmental Pillar, 2025 |
Due to limited published evidence, we were unable to draw meaningful comparisons with other jurisdictions. The matrix developed and presented in Appendix C provides a high-level overview of EU GAECs that most closely align with the Scottish GAECs, highlights the countries implementing the greatest number of farm practices under these standards, and presents a selected Member State (based on similarity to Scotland climate and agriculture) to illustrate key farm practices and potential opportunities for development of existing GAEC requirements relevant to Scotland. These potential opportunities include:
- GAEC 1- Ploughing bans/restrictions
- GAEC 4- Summer cover crop; ban of ploughing grassland
- GAEC 5- low/no till; Presence of other unproductive areas and strips
- GAEC 6- Crop residues left on soil; biodiversity plan
- GAEC 7- Maintenance and conservation of field margins
The review of published evidence highlighted significant knowledge gaps, and the information available was largely high-level, meaning the insights gathered were not sufficient to identify clear opportunities for Scotland to address the five outcomes of the ‘Vision for Agriculture’ through the current Cross Compliance requirements.
Conclusion
The review of the published evidence found that Scotland’s Cross Compliance requirements align most strongly with environmental and animal welfare outcomes of the Vision for Agriculture but offer limited support for business resilience and a just transition. This is as expected given Cross Compliance’s environmental protection remit. While evidence of more ambitious approaches beyond the baseline was identified, this was generally high-level and often lacked detail on implementation or outcomes. As a result, whilst potential opportunities for Scotland do exist, the lack of detailed evidence makes it challenging to understand how these approaches could be used to enhance Cross Compliance in support of all five Vision outcomes.
Stakeholder engagement
The project engaged with stakeholders through a series of structured interviews and workshops to build on the findings of the REA. The first workshop presented the REA results and worked with expert stakeholders to provide Scottish context, helping to refine the research focus and develop a shortlist of Cross Compliance rules considered to have the greatest potential for positive impact.
The second workshop held with policy experts and the structured interviews focused on a deeper exploration of the selected Cross Compliance opportunities, identifying their strengths, weaknesses and the main macro-environmental factors to be considered, if a change in Cross Compliance rules was implemented.
The stakeholder engagement process involved first the development of a Stakeholder Engagement Plan, an Interview Guide and a Workshop Guide. We conducted 3 structured interviews with experts and then held the first workshop with industry representatives to identify the opportunities to be further analysed. We then conducted a second workshop with Scottish Government representatives and 4 structured interviews with experts to complement and refine our opportunity analysis.
The list of organisations which attended the workshops is presented in Appendix D and the main findings are presented in section 4.1.2.
Stakeholder Engagement research findings
In addition to supporting the identification of opportunities, stakeholders provided input on wider considerations on whether Cross Compliance could or should be evolved to better support the Vision for Agriculture.
- Lack of alignment of Cross Compliance with the Vision for Agriculture: Both the literature analysis and the stakeholder engagement identified that the Vision for Agriculture and the present GAECs are aligned largely on Outcome 3 (Climate Change Mitigation and Adaptation) and to some extend to Outcome 4 (Nature Restoration). Some stakeholders highlighted that compliance with Cross Compliance rules allows the full payment of support schemes such as the Basic Payment Scheme or the Less Favoured Area Support Scheme, and in that regard plays a significant role in contributing to thriving rural communities (Outcome 2), by helping to maintain farm incomes. However, Cross Compliance was created with the intent to help maintaining baseline environmental protections, rather than supporting economic or social‑equity outcomes.
- The need to balance environmental ambition and business profitability, within a broader policy framework: Stakeholders repeatedly highlighted the importance of balancing environmental or social ambition with profitability and farmer’s buy-in. Increasing the level of requirements in the Cross Compliance rules presents some cross-cutting risks such as:
- competitiveness concerns for farmers, crofters and land managers if the enforcement of these rules imply investments, a reduction of productive land, are more labour-intensive, increase the administrative burden, etc.
- Reduced compliance and decrease in enforcement rates, if the rules are not well understood or deemed impractical. This could necessitate more frequent controls from enforcement authorities, that would place an additional burden on public finance.
- An increased number of farmers, crofters or land-managers deciding not to claim Basic Payments, and therefore no longer subject to GAECs, leaving greater gaps in environmental protection.
Several stakeholders stressed the need to consider GAECs within the broader Scottish agricultural policy framework, as Cross Compliance rules interact with other policy mechanisms such as Greening, Tier 2, Agri Environment Climate Scheme, Whole Farm Plan and wider environmental policies and regulations, in order to avoid disconnections and gaps.
- An increase of the environmental ambition of the current Cross Compliance rules could be achieved by introducing new requirements, strengthening the existing ones or by shifting some practices which are currently incentivised by other policy mechanisms such as the Agri-Environment Climate Scheme into the baseline requirements. Depending on the changes, some GAECs may be strengthened without major administrative or economic burden, whereas others may deliver better outcomes with some support through incentivised schemes.
- The involvement of Scottish farmers, crofters and land managers in a co-design process of the rules: The importance of adopting a multi-stakeholder approach to design policy instruments is widely recognised (Reed, M., 2008). Stakeholder participation increases the quality of environmental decisions, improves the legitimacy of the instruments and the likelihood of their adoption. Stakeholders emphasised the importance of engaging with the farming community and co-designing any changes in Cross Compliance rules to ensure practicality, increase buy-in and improve compliance and therefore effectiveness. Several ideas were mentioned, such as the possibility of involving farmers, crofters and land managers in monitoring and self-regulation to improve engagement or strengthen education and awareness by linking compliance to visible environmental outcomes.
- The need for support, training & communication: The importance of improved access to advice, training, and communication has been repeatedly highlighted during the stakeholder engagement activities. For example, soil poaching by livestock near watercourses is a relatively common breach, often due to lack of awareness or habitual livestock management. Training and advice are key to improve compliance, as cumulative impacts of small breaches are poorly understood by farmers.
Information gaps identified
Stakeholder interviews and workshops highlighted several additional research possibilities, which build on the information gaps identified in section 4.1.1. Further research, as detailed below, could improve understanding of how current Cross Compliance supports Scotland’s Vision for Agriculture. It could also indicate how greater ambition in Cross Compliance requirements could support Scotland achieve its goals.
- Strengthening monitoring and scientific evidence, with standardised collation between different farm visit and inspection teams. Stakeholders highlighted the importance of providing evidence-based elements to support any changes in the baseline of Cross Compliance requirements to increase their acceptability. However, the desk-based research performed in this project highlighted the current lack of robust monitoring and evaluation data on GAEC rules and their contribution to economic, environmental or social outcomes.
- A broader mapping of the interaction between the Cross Compliance requirements and the other following schemes included in the Scottish agricultural policy framework, as they related to support of Scotland’s Vision for Agriculture objectives:
- Legal requirements which apply to farmers beyond Cross Compliance (e.g. the General Binding Rules in the Environmental Authorisations (Scotland) Regulations 2018),
- The Whole Farm Plan
- Greening
- The Agri-Environment Climate Scheme
- Farm assurance schemes in Scotland.
- A detailed assessment of comparable EU countries’ Cross Compliance guidelines, to understand real-world standards and practices and their contribution to goals aligned with Scotland’s Vision for Agriculture objectives. This could include a review of the post-2028 CAP proposal to replace enhanced conditionality with “protective practices”.
Selection of opportunities
Based on the results of the evidence assessment, we identified three opportunities for further investigation based on the following criteria:
- Does this opportunity address at least one outcome of the Vision for Agriculture?
- Has this opportunity been implemented elsewhere, to benefit from any lessons learnt?
- Is this opportunity already covered or partly covered by another Scottish Policy?
- Can this opportunity be monitored?
The GAECs selected for further analysis in the final stage of the project were:
- Opportunity 1: Enhancement of buffer areas to be in line with best practice for maximum protection to nature and water pollution (related to GAEC 1 – Buffer strips along watercourses)
- Opportunity 2: Extension of management requirements to reduce soil erosion risk (related to GAEC 5 – Minimum land management reflecting site specific conditions to limit erosion)
- Opportunity 3: Incorporation of hedgerow maintenance requirements (related to GAEC 7 – Retention of landscape features)
Cross Compliance opportunities analysis
This section covers an analysis of the Strengths, Weaknesses, Opportunities and Threats (SWOT), and a high-level assessment of the Political, Economic, Social, Technical, Legal and Environmental (PESTLE) factors associated with the shortlisted opportunities. This analysis was completed using Ricardo’s in house expertise and judgement and findings from the stakeholder engagement activities performed during this project. The full analysis for each opportunity is presented in SWOT and PESTLE tables in Appendix E.
Across all three opportunities, the analysis shows some cross-cutting findings: each option provides additional environmental benefits that contribute to the outcomes of Scotland’s Vision for Agriculture, particularly on climate action, nature restoration, and long‑term resilience. All measures strengthen protection of natural assets: buffer strips or areas improve water quality and riparian habitats; erosion‑focused rules safeguard soils and reduce flood risk; and hedgerow maintenance enhances habitat connectivity, carbon storage and shelter for livestock. These opportunities also support the delivery of stronger environmental standards and visibly demonstrate stewardship, meeting high public expectations.
However, this higher environmental ambition comes with challenges. Each opportunity presents greater management complexity, often requiring a more detailed appreciation of local environmental conditions, seasonal planning, or active maintenance. This raises the cognitive burden on farmers, crofters and land managers, especially where holdings have varied soils, slopes, or landscape features. A recurring theme is the need for substantial advisory support, training, and user‑friendly guidance to bridge knowledge gaps and ensure proportionate, practical rules. All options also increase monitoring and enforcement demands on government, particularly where requirements are context‑specific or condition‑based.
Economically, short‑term costs created by land taken out of production, changes in practice, or additional labour may be balanced by longer‑term productivity and resilience gains, such as reduced soil loss, improved water management, and healthier ecological networks. Politically, all three opportunities align well with current EU conditionality requirements but could be exposed to future divergence, as the EU sets out potential new changes for the future of conditionality. Social considerations also emerge across all opportunities, including the need to ensure fairness between upland and lowland systems, the risk of placing disproportionate demands on smaller farms and crofts, and the possibility of pushback if the rules are viewed as inflexible or overly demanding.
Overall, the common message is that the environmental case for improvement is strong, but successful implementation depends on clarity, flexibility, and well‑resourced support – ensuring that higher ambition complements, rather than compromises, the viability of agricultural businesses.
Opportunity 1: Enhancement of buffer areas to be in line with best practice for maximum protection to nature and water pollution
Opportunity description
This opportunity relates to GAEC 1, which covers buffer strips along watercourses[5], among other practices to protect water against pollution. The requirements, which seek to restrict the storage, application of fertilisers and pesticides and cultivations along watercourses, cover the following:
- Application of manure/fertiliser at a certain distance from a water course or during certain conditions;
- Location of field heaps/storage of manure on holding at certain distances from water courses;
- Cultivation of land a certain distance from top of a bank (exemptions apply).
GAEC 1 was explored as a potential opportunity for improvement to further support and align with the aims of the Vision for Agriculture, particularly outcomes 3 and 4. The proposed opportunity covers an enhancement of buffer areas to increase protections to nature and reduce water pollution, by following best practices guidelines focusing on soil type, watercourse type, buffer strip width, buffer strip species composition, and buffer zone size, based on the REA results with examples from other countries.
Other countries, particularly those in the EU following conditionality rules, have set out various ranges and compositions of buffer zones. GAEC 4 in the EU conditionality rules refers to the establishment of buffer strips along water courses[6]. For example, Ireland, which has similarities in cropping systems to Scotland, has a wider range of buffer zone distances (from 3-250m) for spreading organic fertiliser, and for the storage of farmyard manure (FYM) depending on the type of waterbody and cropping activity. In addition, some EU countries go above the basic GAEC requirements and include practices such as restricting certain crop species, or including specific soil management actions along watercourses.
Summary of the findings
The SWOT and PESTLE analysis identified the potential for strong environmental benefits through the enhancement of watercourse buffer areas. Wider and better‑designed buffer strips help reduce nutrient and soil runoff, which improves water quality and creates healthier habitats along watercourses. Adjusting buffer width, vegetation and management to local soil, slope and watercourse conditions makes them more effective, especially during heavy rainfall. This approach is in line with good practice across a number of EU Member States’ approaches and supports climate adaptation by reducing erosion, stabilising soils and improving soil carbon storage capacity.
However, the changes would make farm management more complex. Different buffer widths and management rules increase the amount of information farmers must keep track of and require greater knowledge of local soils and water systems. Smaller farms or crofts with a higher proportion of land adjacent to watercourses may lose more productive area, which could disproportionately affect their income and long‑term business viability. Regulators would also face higher monitoring demands, as they would need to check site‑specific requirements. In the short term, farmers may face a reduction of productive land and additional maintenance load, although over time the benefits – such as lower water treatment costs and reduced damage from erosion – could be significant.
Finally, farmers, crofters and land manager may push back, and compliance levels may suffer if the rules feel too complicated or punitive, especially without good advisory support.
The full analysis of strengths, weaknesses, opportunities, threats and wider macro-environmental factors is presented in Appendix E, section 8.1.
Opportunity 2: Extension of management requirements to reduce erosion risk
Opportunity description
This opportunity relates to GAEC 5, which currently covers minimum land management reflecting site specific conditions to limit erosion and aims to protect soil against erosion in certain situations. The requirements cover the following:
- Limit erosion from overgrazing or heavy poaching by livestock.
- Put in place measures to limit soil erosion if conditions prevent subsequent crop or cover from being sown (e.g., grubbing and sediment traps/fences)
GAEC 5 was explored as a potential opportunity for improvement to further support and align with the aims of the Vision for Agriculture, particularly outcome 3. The opportunity covers an inclusion of tillage restrictions on specific areas to reduce the risk of erosion.
For EU countries, GAEC 5 is broad and designed to “prevent soil erosion through relevant practices” and different Member States have specific variations on GAEC 5 rules. For example, Ireland includes tillage management rules for both arable and grassland areas:
- For grassland parcels, Ireland’s GAEC 5 mandates that there is no ploughing allowed between the 16th of October and 30th of November, and no ploughing on land with a ≥20% slope between the 1st and 31st of December.
- For arable land, there is no ploughing on land with a ≥15% slope between 1st and 31st of December; if arable land is ploughed between 1st of July to the 30th of November, farmers must sow a green cover within 14 days of ploughing.
In France, ploughing is prohibited downhill during the most sensitive periods (from 1st of December to 15th of February), specifically on plots located on slopes greater than 10%. While there are some exemptions, this greatly reduces soil erosion impacts in these fields.
Summary of the findings
Strengthening erosion‑risk management would bring clear environmental and climate benefits. Limiting tillage on steep or vulnerable land, or during high‑risk periods, helps reduce soil loss and prevents sediment reaching watercourses. These measures improve soil structure, support better water infiltration and reduce runoff, offering stronger protection during increasingly frequent heavy rainfall. Evidence from other countries shows that these targeted restrictions work well in practice and support long‑term soil health.
At the same time, this opportunity would add complexity for farmers. Erosion risk varies widely across Scotland, so rules may differ by field, slope or season. This means farmers may need to build additional knowledge about erosion risks and suitable management options and may have to adjust operations based on conditions each year. Some measures could also reduce flexibility in how land is managed, particularly where steep slopes or varied topography are involved, which may cause concern. The monitoring burden for Scottish Government would also increase due to the need to check more detailed and time‑sensitive requirements.
Short‑term costs may arise through changes to current practice, for example, fencing to protect sensitive areas or establishing ground cover more frequently. But over time, better soil management can deliver important economic benefits, including maintaining soil fertility, reducing remediation needs and preventing more serious erosion damage. As with the other opportunities, acceptance will depend on clear guidance, practical support, and rules that take account of different farm systems and landscapes.
The full analysis of strengths, weaknesses, opportunities, threats and wider macro-environmental factors is presented in Appendix E, section 8.2.
Opportunity 3: Incorporation of hedgerow maintenance requirements
Opportunity description
This opportunity relates to GAEC 7, which currently covers retention of landscape features to protect them. The current GAEC requires the following:
- Dry stone or flagstone dykes, turf and stone-faced banks, walls, hedges, ponds, watercourses or trees must not be removed or destroyed without consent.
- No hedges trimming or lopping of tree branches during the bird nesting and rearing season (there are some exemptions).
- No cultivation of land within two metres of the centre line of a hedge (exemptions apply)
- No application of fertilisers (organic manure, chemical or nitrogen) or pesticides within two metres of the centre line of a hedge (exemptions apply).
GAEC 7 was explored as a potential opportunity to incorporate hedgerow maintenance requirements in Scotland to further support and align with the aims of the Vision for Agriculture.
GAEC 7 in Scotland is equivalent to GAEC 8 in the EU[7], which requires the maintenance of non-productive areas and landscape features, and the retention of landscape features, including hedgerows. As noted previously, other countries have variations on the rules, going further than the minimum requirement. For example, in France, hedges less than or equal to 10 metres wide must be managed for biodiversity, and a hedge may not have any discontinuity (“gap” or portion of the linear feature containing elements that do not meet the definition of a hedge) greater than 5 metres. In Ireland, there is a specific focus on invasive species control on landscape features and non-productive areas, and any replacement hedgerows must consist of traditional local species.
Summary of the findings
Introducing hedgerow maintenance requirements would provide a wide range of environmental, climate and landscape benefits. Well managed hedgerows improve biodiversity, support wildlife movement, store carbon and help reduce wind erosion and runoff. They also play an important role in farming systems by providing shelter for livestock and contributing to healthier soils and water. International experience shows that active management – such as planned cutting, gap filling and using appropriate species – greatly improves hedgerow condition and long‑term function.
However, moving from basic protection to active maintenance increases the workload and knowledge required of farmers. Hedgerows vary in age, type and condition, so it can be difficult to apply one set of rules that fits all situations. This means farmers may need new advice on cutting cycles, species selection and how to manage gaps, while inspectors may need to make more judgement‑based assessments of hedge condition. These factors make monitoring and enforcement more challenging and may increase costs for both farmers and government.
Although farmers could face new short‑term costs – such as replanting, gap filling and more regular maintenance – the potential longer‑term gains could be substantial, including reduced erosion, healthier ecosystems, and improved animal welfare through increased livestock shelter. Public support is likely to be high because hedgerows are visible features and strongly associated with a well‑managed rural environment.
The full analysis of strengths, weaknesses, opportunities, threats and wider macro-environmental factors is presented in Appendix E, section 8.3.
Conclusion
This project examined how Cross Compliance contributes to Scotland’s Vision for Agriculture, and whether introducing greater ambition will support Scotland in achieving its goals. We delivered an analysis of three selected opportunities of enhanced Cross Compliance rules. The selected opportunities do not constitute an exhaustive list of possible improvements to deliver better economic, environmental and social outcomes, nor an indication of future policy changes to be applied to Cross Compliance rules in Scotland.
Current Contribution of Cross Compliance to the Vision for Agriculture
Mapping the current Cross Compliance rules against the five outcomes of the Vision for Agriculture has clarified where Scotland already has a solid foundation (particularly for Outcomes 3 and 4), and where opportunities exist to strengthen alignment.
The project emphasised the importance of considering any revisions to Cross Compliance within the wider Scottish agricultural policy framework, given the interactions between Cross Compliance and mechanisms such as Greening, Tier 2 schemes, the Agri Environment Climate Scheme, Whole Farm Plans, and broader environmental policies and regulations.
Opportunities and barriers to enhanced Cross Compliance
Across the literature, stakeholder engagement, and the analysis of three selected opportunities, a set of cross-cutting themes have been identified.
Common strengths and opportunities
- Enhancing environmental ambition within Cross Compliance through wider buffer areas, strengthened erosion‑control measures, or more active hedgerow maintenance could deliver additional benefits for water quality, biodiversity, soil health, carbon storage, and climate resilience.
- Several improvements would allow for more targeted, locally tailored requirements rather than uniform rules, such as differentiating rules by soil type, slope, etc. Stakeholders noted that this approach is fairer, avoids placing disproportionate burdens on certain farms or crofts, and is likely to deliver better environmental outcomes as it directs effort to the places where risks are highest and benefits greatest.
- These environmental gains could also support long‑term business resilience, for example by reducing erosion damage, improving soil structure, and moderating the impacts of extreme weather.
Shared constraints and risks
- Increasing ambition introduces greater management complexity for farmers, crofters and land managers, and raises the risk of unintentional non‑compliance. For the Scottish Government, there is a risk of increased enforcement challenges where rules are highly site specific or qualitative.
- Stronger rules could lead to increased short‑term economic costs, such as reduced productive area or additional labour, and may create perceptions of competitive disadvantage.
- There is a consistent need for clear guidance, tailored training, advisory support, and co‑design with farmers, crofters and land managers to ensure rules are both practical and acceptable.
The analysis also highlighted the strong role for digital tools, remote sensing, mapping, and precision technologies to support targeting and monitoring. Overall, stakeholders emphasised that environmental ambition must be balanced with profitability, fairness, and proportionality, and must be considered alongside the suite of other policy instruments that also contribute to the Vision’s outcomes.
Lessons from Other Jurisdictions
This project gathered lessons from EU Member States on increasing the ambition of Cross Compliance rules. We identified examples of stronger or more specific requirements, which offered useful indications of possible directions for Scotland. However, the evidence base was high‑level, fragmented, and often outdated, with limited detail on implementation, enforcement, practical delivery, cost-effectiveness or observed outcomes. This makes it difficult to determine which international approaches are genuinely most effective, or most relevant to the Scottish context.
Key information gaps
The literature review found limited evidence on the implementation and outcome of more ambitious Cross Compliance approaches. The project identified several information gaps, limiting Scotland’s ability to make well‑evidenced decisions about increasing ambition within Cross Compliance.:
- Limited monitoring and evaluation data on how existing Cross Compliance requirements perform in practice, and on their contribution to environmental, economic or social outcomes.
- Lack of detailed implementation evidence from other countries, particularly on costs, compliance, enforcement, and effectiveness.
- Unclear interactions between Cross Compliance and other Scottish policy instruments such as Tier 2, Agri Environment Climate Scheme, Whole Farm Plans or Greening, making it difficult to assess the overall contribution to the Vision for Agriculture.
- Ambiguity around future EU conditionality developments, and how Scotland might seek to enhance the Cross Compliance ambition without creating unintended divergence between the EU conditionality and the Scottish Cross Compliance systems.
General considerations
The findings indicate that Scotland has clear opportunities to strengthen environmental outcomes through Cross Compliance. This project identified some overarching considerations for developing the current set of Cross Compliance rules to better deliver on the Vision’s outcomes:
- Balancing environmental ambition with competitiveness
- Developing a strong monitoring and evidence base, including robust data to justify changes and improve the acceptability of policy adjustments
- Co‑designing rules with farmers, crofters, and land managers
- Increasing support, training and communication
References
Baldock, D., Desbarats, J., Hart, K., Newman, S., and Scott, E. (2013) “Assessing Scotland’s Progress in the Environmental Agenda”. Institute for European Environment Policy: London.
Bennett, H., Osterburg, B., Nitsch, H., Kristensen, L., Primdahl, J. and Verschuur, G., 2006. Strengths and Weaknesses of Crosscompliance in the CAP. EuroChoices, 5(2), pp.50-57.
Blackstock K.L, Juarez-Bourke A, Maxwell J.L., Tindale S., Waylen K.A (2018) “Aligning Policy Instruments for Water, Soil and Biodiversity”, Report, James Hutton Institute, Aberdeen, 24pp
Code of good practice – DOs and DON’Ts Guide. (n.d.). Available at: https://www.gov.scot/binaries/content/documents/govscot/publications/advice-and-guidance/2005/03/prevention-environmental-pollution-agricultural-activity-dos-donts-guide/documents/0009561-pdf/0009561-pdf/govscot%3Adocument/0009561.pdf
El Benni, N., Ritzel, C. and Mack, G., 2025. Why the Administrative Burden of Cross Compliance Matters. EuroChoices, 24(1), pp.14-19.
Environmental Pillar (2025) Environmental Pillar response to DAFM’s proposal on GAEC 2. [Online] Available at: Environmental Pillar response to DAFM’s proposal on GAEC 2
European Court of Auditors (2008) Is Cross Compliance an effective policy. [Online] Available at: untitled
European Parliament -Targeted CAP amendments on environmental conditionality (2024) Available at: Targeted CAP amendments on environmental conditionality
Farmer, M. and Swales, V (2004). The development and implementation of Cross Compliance in the EU 15: an analysis (p. 84). Institute for European Environmental Policy.
Farming for a better climate (n.d) -Regenerative Agriculture: Keeping soil covered- practical guide
Friends of the Earth Europe (2022) CAP Strategic Plans: Green Deal or No Deal? . [Online] Available at: FRI-22-Pac-UK6.pdf
Jongeneel, R. and Brouwer, F. (2007) Facilitating the CAP reform: Compliance and competitiveness of European agriculture. Specific Targeted Research or Innovation Project (STREP). Project no. SSPE-CT-2005-006489. [Online] Available at: CROSS COMPLIANCE Facilitating the CAP reform: Compliance and competitiveness of European agriculture Specific Targeted Research or Innovation Project (STREP) Integrating and Strengthening the European Research Area Deliverable 5: Mandatory standards in 7 EU countries and 3 non-EU countries Country Report Netherlands
Kristensen, L. and Primdahl, J. (2006). The Relationship Between Cross Compliance and Agri-environment Schemes Deliverable 13. [online] Available at: https://ieep.eu/wp-content/uploads/2022/12/D13_Cross_compliance_and_agri-environment_schemes.pdf
MacLeod, Moxey, McBain, Bevan, Bell, Vosough Ahmadi and Evans. (2008) “Overview of costs and benefits associated with regulation in Scottish agriculture”. SAC Commercial Ltd, Pareto Consulting, Sue Evans Research
Reed, M. (2008). Stakeholder participation for environmental management: A literature review. Biological Conservation, Volume 141, Issue 10, Available at: https://doi.org/10.1016/j.biocon.2008.07.014
RPS GAECS detailed guidance – Ruralpayments.org. (2025). Good Agricultural and Environmental Conditions (GAECs). [online] Available at: https://www.ruralpayments.org/topics/inspections/all-inspections/Cross Compliance/detailed-guidance/good-agricultural-and-environmental-conditions/
SAC (2024) FARMING FOR NET ZERO: TRANSITIONING SCOTTISH AGRICULTURE available at WWF-Soil-Association-Net-Zero-Farming-Full-Report.pdf
Scot Government (2018). Prevention of environmental pollution from agricultural activity: guidance – gov.scot. [online] Available at: https://www.gov.scot/publications/prevention-environmental-pollution-agricultural-activity-guidance/pages/1/.
Scot Government (2025) Sustainable and regenerative agriculture: code of practice [Online] Section 2: Sustainable and Regenerative Measures – Sustainable and regenerative agriculture: code of practice – gov.scot
SEPA (2009). Engineering in the Water Environment Good Practice Guide Riparian Vegetation Management. [online] Available at: https://www.sepa.org.uk/media/151010/wat_sg_44.pdf.
FAS (2025)- Understanding GAEC 7 and Cross Compliance On-Farm [Online] available: Understanding GAEC 7 and Cross Compliance On-Farm | Helping farmers in Scotland
Appendices
Key words and terms
|
Words and terms |
Notes |
|---|---|
|
REA section1 | |
|
Scotland |
Including Scottish |
|
Cross Compliance |
Including: Conditionality, Direct Payments, Tier 2, enhanced conditionality |
|
Requirements |
Including: Regulations, Conditions, Obligations |
|
Including: Good Agricultural and Environmental Conditions | |
|
SMR |
Including: Statutory Management Requirements |
|
Environmental benefits |
Including: Advantages, Gains, Improvements |
|
Environmental limitations |
Including: Weakness, Constraints, Restrictions, Limits, Gaps, Shortcomings, Limitations, ‘Areas for improvement’ |
|
Vision for agriculture |
Including: Scottish Government, Outcomes, Contribution |
|
Barriers to implementation |
Including: Challenges, Obstacles, Delivery |
|
Farmers |
Including: Crofters and land managers |
|
REA section 2 | |
|
Defra |
Including: England, ELM Scheme |
|
Welsh Government |
Including: Wales |
|
Irish Government |
Including: DAFM, Teagasc, Ireland, Republic of Ireland, ROI, Northern Ireland |
|
European Member States |
Including: EU, European Union, EU-27, EU MS |
|
Greater ambition |
Including: Enhanced impact, Conditionality, Beyond basic Cross Compliance, Pillar 2 |
|
Including: Execution, Delivery, Uptake | |
|
Outcomes |
Including: Impact, Effect, Achievement, output, results, CAP Strategic Objectives |
|
Barriers to implementation |
Including: Challenges, Obstacles, Delivery |
|
Lessons learnt |
Including: Findings, Key takeaways, reflections, insights |
Example search strings
Research question 1:
- TITLE-ABS-KEY “Scotland” AND “(“Cross Compliance” OR “GAEC” OR “SMR”) AND “environmental” (“benefits” OR “limitations”)
- TITLE-ABS-KEY “Scotland” AND (“Cross Compliance” OR “GAEC” OR “SMR”) AND current “environmental” (“weakness* OR “gaps” OR “limitations”)
- TITLE-ABS-KEY “Scotland” AND “(“Cross Compliance” OR “GAEC” OR “SMR”) AND (“implementation” OR “Delivery”) AND (“Barrier*” OR “Challenge*”) AND (“Farmer*” OR “Crofter*”)
Research question 2:
- TITLE-ABS-KEY (“European” OR “member state” OR “Defra” OR “Welsh Government” OR “Irish Government”) AND “ambition” AND “beyond” AND “Cross Compliance”
- TITLE-ABS-KEY “*” AND (“Implementation” OR “Delivery”) AND (“Outcomes” OR “findings”)
*name/detail of increased ambition requirement
Screening criteria
Literature was screened for information on the following inclusion criteria
- Cross Compliance environmental benefits and limitations (REA Section 1)
- Barriers to implementation of current Cross Compliance requirements for farmers and crofters (REA Section 1)
- Cross Compliance requirements contribution to the Scottish Government’s Vision for Agriculture (REA Section 1)
- Cross Compliance gaps or areas of current weakness related to environmental outcomes (REA Section 1)
- Countries which have shown/ are showing requirements with greater ambition beyond the basic Cross Compliance requirements (REA Section 2)
- How these requirements have been implemented, outcomes achieved, barriers to implementation, unexpected consequences and lesson learnt (REA Section 2)
|
Cross Compliance requirement (GAEC/SMR)[8] |
Environmental Benefits |
References |
|
GAEC 1 Buffer strips along watercourses |
|
|
|
GAEC 2 Abstraction of water for irrigation |
|
|
|
GAEC 3 Protection of groundwater against pollution |
| |
|
GAEC 4 Minimum soil cover |
|
|
|
GAEC 5 Minimum land management reflecting site specific conditions to limit erosion |
| |
|
GAEC 6 Maintenance of soil organic matter |
|
|
|
GAEC 7 Retention of landscape features |
|
|
|
SMR 1 Nitrate Vulnerable Zones |
| |
|
SMR 2 Conservation of wild birds |
| |
|
SMR 3 Conservation of flora and fauna |
| |
|
SMR 4 Food and feed law |
| |
|
SMR 10 Restrictions on the use of plant protection products |
|
This table provides a high-level overview of EU GAECs that most closely align with the Scottish GAECs, highlights the countries implementing the highest number of farm practices under these standards, and presents a selected Member State (based on similarity to Scotland climate and agriculture) to illustrate key farm practices and potential opportunities relevant to Scotland.
|
GAEC |
Associated/most closely related GAEC (EU) |
Countries implementing the most farm practices under the GAEC |
Country chosen for comparison |
Farm Practices codes implemented – high level description of basic practices |
Farm Practices codes implemented – high level description of more niche practices |
Potential opportunities to investigate for Scotland |
|
GAEC 1 |
GAEC 4 – Establishment of buffer strips along water courses |
|
Denmark |
|
|
|
|
GAEC 4 |
GAEC 6 – Minimum soil cover to avoid bare soil in periods that are most sensitive |
|
The Netherlands |
|
|
|
|
GAEC 5 |
GAEC 5 – Tillage management, reducing the risk of soil degradation and erosion, including consideration of the slope gradient |
|
Luxembourg |
|
|
|
|
GAEC 6 |
GAEC 2- Protection of wetland and peatland |
|
Sweden |
|
|
|
|
GAEC 3- Ban on burning arable stubble, except for plant health reasons |
|
Belgium (F) |
|
|
| |
|
GAEC 7 |
GAEC 8- Minimum share of agricultural area devoted to non-productive areas or features |
|
Belgium (W) |
|
|
|
|
Other EU GAECs | ||||||
|
GAEC 1 |
|
Luxembourg |
|
| ||
|
GAEC 7 |
|
Ireland |
|
| ||
|
GAEC 9 |
|
Luxembourg |
|
|
The following organisations participated in the first workshop:
- NFU Scotland
- SAOS
- RSPB Scotland
- AHDB Scotland
- Nature Friendly Farming Network
- SAC Consulting
- Land Workers Alliance
- Rural Payments Agency England
The following organisations participated in the second workshop:
- Scottish Government
- Historic Environment Scotland
- SEPA
- RPID
- Crofting Commission
- Scottish Forestry
- NatureScot
Opportunity 1: Enhancement of buffer areas for nature and water pollution
Opportunity 1 – SWOT analysis
|
Strengths |
Weaknesses |
|
|
|
Opportunities |
Threats |
|
|
Opportunity 1 – PESTLE analysis
|
Political |
Economic |
|
|
|
Social |
Technological |
|
|
|
Legal |
Environmental |
|
|
Opportunity 2: Extension of management requirements to reduce erosion risk
Opportunity 2 – SWOT analysis
|
Strengths |
Weaknesses |
|
|
|
Opportunities |
Threats |
|
|
Opportunity 2 – PESTLE analysis
|
Political |
Economic |
|
|
|
Social |
Technological |
|
|
|
Legal |
Environmental |
|
|
Opportunity 3: Incorporation of hedgerow maintenance requirements
Opportunity 3 – SWOT analysis
|
Strengths |
Weaknesses |
|
|
|
Opportunities |
Threats |
|
|
Opportunity 3 – PESTLE analysis
|
Political |
Economic |
|
|
|
Social |
Technological |
|
|
|
Legal |
Environmental |
|
|
How to cite this publication:
Harpham, L , Peters, E, Decherf, C, Gill, D, Wood, C. (2026) How Cross Compliance contributes to Scotland’s Vision for Agriculture, ClimateXChange.
DOI https://doi.org/10.7488/era/7056
© The University of Edinburgh, 2026
Prepared by Ricardo on behalf of ClimateXChange, The University of Edinburgh. All rights reserved.
While every effort is made to ensure the information in this report is accurate as at the date of the report, no legal responsibility is accepted for any errors, omissions or misleading statements. The views expressed represent those of the author(s), and do not necessarily represent those of the host institutions or funders.
This work was supported by the Rural and Environment Science and Analytical Services Division of the Scottish Government (CoE – CXC).
ClimateXChange
Edinburgh Climate Change Institute
High School Yards
Edinburgh EH1 1LZ
+44 (0) 131 651 4783
Agricultural Reform Route Map ↑
Securing a green recovery on a path to net zero: climate change plan 2018–2032 – update – gov.scot ↑
Supporting documents – Biodiversity strategy to 2045: tackling the nature emergency – draft – gov.scot ↑
Agriculture and Rural Communities (Scotland) Act 2024 ↑
Buffer strips along watercourses (GAEC 1) ↑
Conditionality – Agriculture and rural development – European Commission ↑
Conditionality – Agriculture and rural development – European Commission ↑
SMRs 5–9 and 11–13 are not considered to be directly environmentally focused and have therefore been excluded from the table. ↑
Scotland’s Vision for Agriculture is to be a global leader in sustainable and regenerative agriculture. The aims of the vision include producing high-quality food, protecting and improving animal health and welfare, facilitating the restoration of nature, climate mitigation and adaptation, and enabling rural communities to thrive.
This report examines how Cross Compliance contributes to Scotland’s Vision for Agriculture, and whether introducing greater ambition will support Scotland in achieving its goals.
The Cross Compliance requirements are a set of rules that enforce laws around animal and plant health as well as sustainable agricultural practices. All farmers and crofters in Scotland who receive income support under the Basic Payment Scheme must observe Cross Compliance requirements.
The report explores the differences between the Cross Compliance rules in Scotland and EU Member States with a similar policy, and analyses the strengths, weaknesses and macro-environmental considerations of three opportunities which could be implemented to better align with Scotland’s Vision for Agriculture.
Findings
The researchers found that the contribution of Cross Compliance to the five outcomes of the Vision for Agriculture are uneven, with stronger alignment to environmental and animal welfare outcomes, and more limited support for thriving agricultural businesses and a just transition. There was limited evidence in the literature on the implementation and outcome of more ambitious Cross Compliance approaches.
The authors identified four overarching considerations relevant to any development of the current rules to better deliver on the Vision’s outcomes:
- Balancing environmental ambition with profitability
- Developing a strong monitoring and evidence base, including robust data to justify changes and increase the acceptability of policy adjustments
- Co designing rules with farmers, crofters and land managers
- Increasing support, training and communication
The research also emphasised the importance of considering any revisions to Cross Compliance within the wider Scottish agricultural policy framework.
While this report is not an exhaustive analysis of possible improvements nor an indication of future policy changes, is does identify clear potential to strengthen the Cross Compliance rules to support the outcomes of the Vision for Agriculture. More evidence is needed as well as holistic consideration of the wider agricultural and environmental policies.
For further information, please read the report.
If you require the report in an alternative format, such as a Word document, please contact info@climatexchange.org.uk or 0131 651 4783.
Research completed: October 2025
DOI: https://doi.org/10.7488/era/7009
Executive summary
Scotland’s peatlands store large amounts of carbon and play a key role in climate regulation and biodiversity conservation. However, extracting peat for use in horticultural growing media – materials used to grow plants in containers or controlled systems – damages these ecosystems and releases greenhouse gas emissions.
The Scottish Government has committed to ending the use of peat in horticulture, while recognising the sector’s economic importance. In 2024, potatoes, fruit and vegetables, and ornamental plants such as flowers and shrubs together contributed £831 million to Scottish crop output, representing over half of the total value.
This report assesses whether it is possible to move to peat-free growing materials in Scottish horticulture. It draws on published studies, industry reports and extensive engagement with the sector, including workshops and interviews with growers, growing media manufacturers, retailers and researchers. Stakeholders provided practical insight into how peat-free systems are working in practice, the challenges businesses face, and the solutions currently being trialled across the industry.
Key findings
- Scotland can achieve peat-free horticulture. Businesses across the horticulture sector are already using a range of alternative growing materials.
- The main challenge is system coordination. For a successful transition to peat free horticulture, infrastructure, standards, supply chains and technical growing practice are best aligned.
- Parts of the sector have already made progress. Retail growing media are now largely peat-free, while some tree growers and producers of ornamental plants have significantly reduced their use of peat
- Some growing approaches face greater challenges in a peat-free transition. Growers must test propagation systems and production of seed potatos and ericaceous crops – acid-loving plants such as blueberries – over a longer period to ensure peat-free methods work reliably.
- Cost, supply chain capacity and consistency of materials remain key barriers.
- With coordinated implementation and realistic timelines, Scotland has the resources and industry capability to support a peat-free transition.
Conclusions
This report finds that the principal challenge for Scotland’s peat-free transition is the coordination of infrastructure, standards, supply chains and technical growing practice – rather than a lack of alternatives or willingness in the sector.
Evidence from trials, real business use and stakeholder experience shows that growing without peat can be successful when materials are reliable, standards are clear, and the appropriate support is provided. Where these conditions are uncertain or developing, growers and manufacturers reported that technical uncertainty can translate into commercial risk.
The transition should therefore be understood as a process of system redesign rather than simple material substitution. With coordinated implementation and investment, and continued collaboration across the sector, Scotland can phase out horticultural peat while keeping plant growing productive and reliable.
Overall, the evidence indicates that Scotland can achieve transition to a peat-free horticulture sector. Scotland has the resources, industry capability and emerging technical knowledge needed to support this transition. The pace of this change will depend on clear policy direction, realistic timescales, and continued support for infrastructure, standards, and shared trials.
Glossary
|
Term |
Definition |
|---|---|
|
Air-filled porosity |
A basic measure of how well soil or growing media allows air to reach plant roots. Refers to the proportion of the material’s volume that is filled with air after the growing medium has been fully watered and excess water has drained away. Expressed as a percentage, with higher values indicating more air space and lower bulk density. |
|
Amateur grower |
Individuals growing plants, typically in a home or community setting, for personal enjoyment. May sell plants face-to-face at local events for charitable purposes e.g. National Gardening Scheme. Not making a regular profit. |
|
Bare-root plants |
Plants that are sold with their roots exposed, without soil or growing medium. |
|
Biochar |
A highly porous, carbon-rich material produced by heating organic biomass (e.g. wood, crop residues or manure) in a low-oxygen environment through pyrolysis. |
|
Biosecurity |
Practices that prevent the introduction and spread of plant diseases and pests. |
|
Black peat |
Found in the lower, older layers of a peat bog. Composed of plant matter which is in more advanced stages of decomposition than in upper layers. Dark brown to black in colour, with dense, compacted structure. |
|
Blonde peat |
Sometimes referred to as white peat. Youngest form of peat, extracted from the uppermost layers of peat bogs. Less decomposed than black peat, with a more fibrous and open structure. |
|
Bulk density |
A measure of how heavy a growing medium is for a given volume. It reflects how compact the material is, with higher bulk density indicating a heavier, more compact medium with fewer air spaces, and lower bulk density indicating a lighter, more open structure. Bulk density affects handling, transport costs, plant stability, and root aeration, and is therefore an important factor when comparing peat-based and peat-free growing media. |
|
Carbon sequestration |
The process by which carbon dioxide is captured and stored in natural sinks such as peatlands, forests and soils. |
|
Cation exchange capacity (CEC) |
The ability of a growing media or soil to hold and exchange positively charged ions (cations), including key nutrients. High CEC media retains and supplies cations more effectively. |
|
Circular economy |
A circular economy is one that reduces demand for raw materials, designs products to last, and encourages reuse, repair, and recycling. It aims to keep materials in use for as long as possible, extract maximum value from them while in use, and recover and regenerate products and materials at the end of their service life. |
|
Carbon dioxide equivalent (CO2e) |
A standard metric for measuring the total climate change impact of different greenhouse gases (GHGs). It converts the emissions of various GHGs, such as methane and nitrous oxide, into a single unit representing the amount of CO2 that would cause the same amount of warming. |
|
Coir |
A natural fibre extracted from the outer layer of coconut husks, commonly used as a peat alternative in growing media. |
|
Composted bark |
The outermost part of woody plants (usually softwoods) which are crushed and screened before fermenting in heaps. Used in growing media chiefly to improve drainage and increase air capacity. May increase CEC and pH buffering of media. |
|
Composted green waste (CGW) |
Biodegradable organic waste, primarily composed of plant material, that has been decomposed and recycled as a soil amendment or growing media component. Production, quality control and lab testing for CGW is covered by The British Standard Institution PAS 100 across the UK. |
|
Environmental horticulture |
Defined by the Horticultural Trades Association (HTA) as encompassing ‘a wide range of activities—including companies that cultivate ornamental plants, manufacturers of garden equipment, wholesalers and retailers such as garden centres, and specialists in landscape and arboriculture who maintain home gardens and expansive parks.’ |
|
Ericaceous plants |
Group of plants in the family Ericaceae, which thrive in acid (low pH) soil environments. Includes economically important genera such as Vaccinium (blueberry, cranberry), Rhododendron and Camellia. |
|
Greenhouse Gas (GHG) emissions |
GHG’s – including carbon dioxide, methane, nitrous oxide and fluorinated gases – which trap heat when released into the atmosphere, contributing to global warming and climate change. |
|
Horticulture |
The science and art of cultivating plants. The horticulture industry can broadly be broken down into two main sectors – environmental and production. |
|
Hydroponics |
A method of growing plants without soil or growing media, using nutrient-rich water solutions. |
|
Life Cycle Assessment (LCA) |
A method used to evaluate the environmental impact of a product, including carbon footprint, resource use and emissions. |
|
Liner |
Young plants grown individually from cuttings in modular trays ready to be potted-up or planted-out. The term ‘liner’ is often used interchangeably with ‘plug’. |
|
Loam |
A type of soil composed of roughly equal proportions of sand, silt and clay particles. |
|
Microbial activity |
The presence and function of microorganisms in soil or growing media, impacting plant health and nutrient availability. |
|
Oomycetes |
A group of fungus-like microorganisms, commonly known as ‘water-moulds’, which often act as decomposers. Thrive in moist environments and include damaging pathogens such as Phytophthora spp. |
|
Plant pathogen |
Biological agents which cause disease in plants, negatively impacting plant health, quality and crop yield. Includes microorganisms such as bacteria, fungi and viruses. |
|
Pathogen screening |
The process of testing growing media for harmful microorganisms. |
|
Peat |
Organic material formed when dead plant matter collects and breaks down slowly in cool, waterlogged, oxygen deficient conditions. Introduced into UK horticultural use in the 1930’s and renowned for its water retentive properties and favourable structure. |
|
Peat-free growing media |
Growing media composed of non-peat components, including coir, wood fibre, composted bark and composted green waste. Peat-free media is typically made up of a combination of ingredients to achieve the desired growing properties. |
|
Peat soils |
Soil with a surface peat layer with more than 60% organic matter and of at least 50cm thickness. |
|
Peaty soils |
Soil with a shallower peat layer at the surface less than 50cm thickness over mineral layers. |
|
Perlite |
Formed from a naturally occurring volcanic glass, which is mined and heated to produce a lightweight, porous material. Commonly used to improve aeration and drainage in growing media. |
|
pH buffering capacity |
Describes how well a growing medium can resist changes in pH when fertilisers or other inputs are added. A medium with good buffering capacity maintains a more stable pH, helping to ensure nutrients remain available for healthy development. |
|
Phytotoxicity |
Adverse effects on plant growth and development caused by phytotoxins (substances which are toxic or poisonous to plants). In the context of growing media, excessive fertiliser may result in phytotoxicity. |
|
Plug plants |
Young plants grown individually from seed in modular trays ready to be potted-up or planted-out. |
|
Professional grower |
Individuals or groups regularly growing and selling plants with a view to making a profit. |
|
Propagation |
The process of growing new plants from seeds, cuttings, or tissue culture through both sexual and asexual means. |
|
Responsible sourcing |
The ethical procurement of raw materials that ensures environmental sustainability and fair labour practices. |
|
Responsible Sourcing Scheme (RSS) |
A framework that assesses the environmental, economic, and social sustainability of growing media components. |
|
Soft fruit |
Soft, juicy fruit borne on low growing plants (not trees) such as strawberries, raspberries and blueberries. |
|
Sphagnum moss |
A plant species that grows on peatlands and other wet habitats, often harvested for horticultural use as a water-retentive substrate. |
|
Standardisation and quality Control |
Efforts to ensure consistency, safety, and performance across the growing media production sector. |
|
Supply chain reliability |
The ability to ensure consistent availability and quality of growing media materials. |
|
SWOT Analysis |
A strategic planning tool that evaluates: Strengths, Weaknesses, Opportunities, and Threats. |
|
Vermiculite |
A naturally occurring mineral, which is mined and heated to produce an expanded, lightweight material. Primarily used in horticulture to retain moisture and nutrients, can also improve aeration, although not to the same degree as perlite. |
|
Wood fibre |
Fibres extracted mechanically/thermally from wood and wood waste, used in peat-free growing media for high air capacity, good drainage and low bulk density. |
Context for transition to peat-free horticulture
4.1 Research purpose
The Scottish Government has committed to phasing out the use of peat in horticulture. This commitment is reflected in policy measures including National Planning Framework 4 (NPF4) (Scottish Government, 2023a) and the consultation Ending the Sale of Peat in Scotland (Scottish Government, 2023b), which together restrict new commercial peat extraction licences and set out the basis for stakeholder engagement on the transition. Scottish Ministers have also written to UK counterparts to advocate for coordinated UK-wide legislation and a clear roadmap for ending horticultural peat use, underscoring inter-governmental support for a structured transition (Scottish Government, 2026).
This research (October 2024 to September 2025; Appendix A) examined the transition to peat-free growing media from a Scottish perspective and focussed on:
- The level of confidence in available peat alternatives, including their performance, supply reliability, sustainability and cost.
- The preparedness of the horticulture sector to reduce and eliminate peat use.
- The main barriers to transition across Scottish horticulture.
- Challenges associated with peat-dependent crops and growth stages, particularly ericaceous plants and propagation.
- The scope for industry collaboration through coordinated grower trials.
- The role and practicality of peat-free standards.
- The overall feasibility of a sector-wide transition.
Background
Peat emerged as a key growing media component in UK horticulture in the 1970s, having first been commercialised as a constituent in loam-based media for container planting in the 1930s (Alexander et al., 2008; Prasad et al., 2024; Waller, 2012). Its combination of high water-holding capacity, good air porosity and structural stability ensures optimal conditions for healthy root development, while its low bulk density and friable texture make it easy to handle (Schmilewski, 2008). The inherently low nutrient content of peat allows growers to tailor treatments to suit specific crops, making it a versatile growing medium (National Institute of Agricultural Botany, 2024). Traditionally peat has been regarded as free from pathogens, pests, and weed seeds both at point of extraction and during controlled production. Its processing and grading are considered straightforward, and its pricing has historically been highly competitive (Barrett et al., 2016), making it a preferred choice in both professional and amateur horticulture.
Peatlands play a crucial role in carbon sequestration but, when degraded, become significant sources of greenhouse gas emissions (International Union for Conservation of Nature and Natural Resources, 2021). Analysis by The Wildlife Trusts (2022) estimates that up to 31 million tonnes of carbon dioxide have been released since 1990 as a result of peat extraction for UK horticulture. Although peatlands cover only about 3-4% of the Earth’s land surface, they store more carbon than any other terrestrial ecosystem, holding roughly twice as much as all the world’s forest biomass combined (United Nations Environment Programme, 2022).
Around 20% (c.1.8 million hectares) of Scotland’s land area is peatland (Bruneau and Johnson, 2014). Approximately 80% of UK peatlands are degraded, the majority located in Scotland, with 90% of raised bogs and 70% of blanket bogs in damaged condition (NatureScot, 2015). Although only around 1,000 hectares (0.05%) are harvested annually for horticulture – producing roughly 270,000 m³ of peat (Scottish Government, 2025, pers. comm.) – extraction disproportionately affects lowland raised bogs, one of the most threatened peatland habitats (UK Centre for Ecology and Hydrology, n.d.). Peat extracted in Scotland accounted for 18% of the total volume used in UK growing media in 2022 (Horticultural Trades Association, 2022a).
Concerns about the carbon emissions and biodiversity loss resulting from peat extraction were first raised in the 1980s and 1990s (Waller, 2012), prompting the formation of the Peat Working Group in 1992 and the introduction of stricter harvesting regulations. The UK Government’s first formal reduction goal appeared in Minerals Planning Guidance 13 (Department for Environment, Food and Rural Affairs, 1995), which aimed for 40% of growing media materials in England to be non-peat by 2005 (Alexander et al., 2008). This trajectory was reinforced in the 2011 Natural Environment White Paper (The Natural Choice), which set voluntary targets to phase out peat use in amateur gardening by 2020 and in professional horticulture by 2030 (HM Government, 2011).
Subsequent national and UK policy has sought to progress this transition. The phasing out of peat-based horticultural products is a devolved matter, with each nation developing its own approach within the context of an intended UK-wide ban. In England, the Department for Environment, Food and Rural Affairs (2023) previously set out a series of proposed phase-out dates under the former UK Government, including a statutory ban on the retail sale of peat-based products for amateur use by 2024, a phased reduction for professional growers by 2026, and a full prohibition by 2030. The current UK Government has reiterated its intention to legislate for a ban on the sale of peat and peat-containing products, although implementation remains contingent on parliamentary time and no specific timetable has yet been confirmed (Defra, 2025a). A Private Members’ Bill seeking to give legislative effect to a ban in England and Wales has been introduced to the UK Parliament and is awaiting a second reading (UK Parliament, 2025).
In Scotland, the Government has committed to ending the sale of peat-based horticultural products. The 2021–22 Programme for Government (Scottish Government, 2021) included a pledge to develop and consult on a ban as part of a wider strategy to transition away from peat. This commitment was progressed in February 2023 through a public consultation seeking stakeholder views on prohibiting sales, initially in the retail market and subsequently for professional growers (Scottish Government, 2023b).
Current use of peat in the horticulture industry
Figures released by the HTA (2022) and Defra (2025b) reveal that total peat use in UK horticulture declined slowly between 2011 and 2019, remaining close to 2 million m³ per year (Figure 1). In 2020, peat use increased temporarily, coinciding with a surge in home gardening and plant production during national COVID-19 lockdowns (White et al., 2021). From 2021 onwards, peat use fell rapidly; total volumes declined by around two-thirds between 2020 and 2023, associated with a sharp reduction in retail peat use; professional peat use also declined, but at a slower pace. By 2023, retail and professional use had converged at similar levels, each accounting for around half of remaining peat consumption.
Figure 1: Total peat usage across retail and professional sectors 2011-2023 (Defra, 2025b; HTA, 2022)
Between 2011 and 2023, the retail horticulture sector consistently used more growing media than the professional sector, typically between two and four times as much (Figure 2). Retail volumes fluctuated, but remained high overall, at 2.34 million m³ in 2023, compared with 0.81 million m³ used by professional growers. This reflects the much larger scale of the consumer growing-media market relative to commercial plant production. This highlights an important dynamic in the transition to peat-free media. Although the retail sector has reduced its peat use more rapidly, it remains the largest user of growing media overall. As a result, changes in the composition of retail products continue to exert a strong influence on total peat demand.
Figure 2: Total growing media usage across retail and professional sectors 2011-2023 (Defra, 2025b; HTA, 2022)
What are the alternatives to horticultural peat in growing media?
Current alternatives
Ongoing research and commercial trials have led to the development of several viable alternatives to peat, either individually or through the blending of more than one constituent material. Table 1 summarises a range of materials currently used, trialled, or proposed as alternatives to peat in horticultural growing media. It provides a high-level overview of each material’s origin, current level of commercial adoption, and primary functional role within growing-media blends.
The table is intended as an orientation tool for policymakers and practitioners, supported by full SWOT and detailed analyses of performance, constraints and sustainability considerations presented in Appendix F and Appendix G respectively. Currently, the most widely adopted materials across both professional and amateur horticultural sectors are wood fibre, coir and composted bark (Defra, 2025b; HTA, 2022).
Table 1: Overview of alternatives
|
Material |
Source |
Characteristics/uses |
|---|---|---|
|
Anaerobic digestate (AD) Limited/early commercial adoption |
By-product of anaerobic digestion. Consists of nutrient-rich material remaining after organic waste is broken down in oxygen-free conditions during biogas production. |
Supplies high levels of essential nutrients. Is used primarily to enhance the fertiliser value of growing-media blends, rather than as a structural base. |
|
Composted bark Widespread commercial adoption |
By-product of forestry and wood-processing industries. Bark is composted through piling and turning, screened, and often nitrogen-treated prior to use. |
Provides high air-holding capacity and structural openness (particle size dependent). Low inherent nutrient content allows fertilisation to be tailored to crop requirements. |
|
Biochar Limited/early commercial adoption |
Carbon-rich, porous material produced by heating organic biomass (e.g. wood, crop residues or manure) under low-oxygen conditions (pyrolysis). |
Contributes stable structure, porosity, nutrient retention and water-holding capacity when used as a blended additive. |
|
Composted bracken Limited/early commercial adoption |
Harvested from natural/managed areas where bracken grows abundantly. Biomass is composted before use. |
Improves structure and aeration, with potential nutrient contribution when composted. Can be suitable for ericaceous crops where composted material is acidic. |
|
Coir and coir pith Widespread commercial adoption |
By-product of the coconut industry, consisting of fibres and fine pith derived from the outer husk of coconuts. |
Provides a good balance of water retention and aeration, with high re-wetting capacity. Functionality varies depending on blend composition. |
|
Composted green waste (CGW) Widespread commercial adoption |
Derived from commercial and public waste streams, including local authority green waste and agricultural residues. |
Typically nutrient-rich. Used to enrich peat-free mixes and contribute organic matter. |
|
Composted heather No current commercial market |
Upland biomass harvested as part of moorland vegetation management; chopped and composted to produce a fibrous material. |
Early trials suggest potential for ericaceous growing media where an acidic product can be produced; evidence base remains under development. |
|
Hemp fibre (Cannabis sativa) No current commercial market |
Fast-growing fibre crop that can be produced domestically; fibre derived from the woody core (hurds or shiv). |
Lightweight material with good air-holding capacity and moderate water retention; may have nitrogen immobilisation effects due to high C:N ratio (similar consideration as wood fibre). |
|
Loam Widespread commercial adoption |
Fertile mineral soil composed of a balanced mixture of sand, silt and clay. |
Provides mineral content, structure and water-holding capacity; traditionally used as a base component in growing media. |
|
Marine sediment No current commercial market |
Dredged material collected from coastal or marine environments and subjected to remediation prior to reuse. |
Potential to contribute mineral fraction and influence water/nutrient dynamics when appropriately remediated; suitability is highly dependent on salinity/contaminant control and particle-size distribution. |
|
Reclaimed peat Limited/early commercial adoption |
Peat recovered from previously disturbed sources (e.g. construction/dredging spoil, excavation arisings, or other waste streams) and processed for reuse. |
Retains some of peat’s structural and water-holding properties; typically blended with composted or fibrous materials to improve performance. |
|
Rice husk ash (RHA) No current commercial market |
By-product of rice milling, produced by controlled burning and processing of rice husks. |
Enhances structure, aeration and water-holding capacity in growing-media blends. |
|
Sheep wool Limited/early commercial adoption |
By-product of the wool industry, typically using low-grade fleece unsuitable for textile manufacture. |
Retains water, supplies slow-release nitrogen and improves aeration. |
|
Spent mushroom compost (SMC) Limited/early commercial adoption |
By-product of commercial mushroom production, following pasteurisation of spent growing substrate. |
Nutrient-rich organic material used primarily as a conditioner or minor component in growing media to enhance fertility and structure. |
|
Farmed Sphagnum No current commercial market |
Harvested from cultivated peatland systems using propagated Sphagnum moss, not wild-harvested. |
Highly effective water retention and structure that improves aeration; particularly suited to propagation and sensitive crops. |
|
Wood fibre Widespread commercial adoption |
Derived from primary and secondary wood-processing residues; fibres are processed under high temperature and pressure and often nitrogen-treated. |
Enhances structure and air-holding capacity; commonly blended with other components in peat-free growing media. |
Widespread commercial adoption
Across the UK and Scottish horticultural sectors, a range of peat alternatives are now in widespread commercial use, reflecting rapid diversification of the growing media market since the early 2010s. Wood fibre, composted bark, coir, composted green waste and loam form the core constituents of many current retail and professional blends, although their relative importance differs markedly between sectors. Wood fibre, composted bark and coir underpin both professional and retail formulations, whereas composted green waste is used predominantly in the retail market, with very limited penetration into professional growing systems. Each of these components contributes distinct physical and chemical properties, allowing manufacturers to engineer bespoke mixes tailored to specific crop needs and end markets. Most commercial products therefore rely on combinations of these materials, as no single component replicates the balance of air porosity, water-holding capacity and stability traditionally provided by peat (Gruda, 2019; Peano et al, 2012).
Limited or early commercial adoption
While a range of emerging or regionally available feedstocks (e.g. bracken, sheep wool, anaerobic digestate, biochar, spent mushroom compost and reclaimed peat) have been explored in peat-free media formulation, the published evidence base on their performance, quality variability and commercial feasibility remains relatively sparse. Many assessments are preliminary, often confined to small-scale trials or expert commentary rather than coordinated multi-site studies. Further research is therefore required to clarify where these materials may be deployed most effectively and at what scale (Calisti et al., 2023; Johnson and Di Gioia, 2023; Kennard, 2020; Medina et al., 2009; Pitman and Webber, 2013).
Although several of these materials demonstrate technical promise in specific contexts, uptake remains constrained by factors including supply consistency, variability in quality, sustainability considerations, regulatory requirements and the need for additional processing. In interviews, manufacturers of professional growing media consistently described these materials as “promising but peripheral”, noting that they are typically incorporated through pilot collaborations, niche retail products or experimental blends rather than forming part of core formulations.
No current commercial market in Scottish horticulture
A further group of materials is not yet established at commercial scale within UK professional growing media markets but is attracting interest in the context of longer-term peat-free strategies. These include composted heather, rice husk ash, marine sediment, hemp fibre and farmed Sphagnum. Rather than offering immediate substitutes, these materials represent prospective feedstocks that could contribute to future supply diversification and reduced dependence on imported substrates.
Several of these materials present theoretical or demonstrated advantages in specific contexts, including regional resource availability, circular-economy potential, carbon storage capacity and favourable structural properties. For example, cultivation of Sphagnum biomass through paludiculture systems has been investigated as a renewable peat substitute (Gaudig et al., 2017; Wichtmann et al., 2016), while rice husk ash and marine sediment have been assessed in blended substrates in controlled horticultural trials (Mattei et al., 2017; Omar et al., 2023). However, evidence of large-scale agronomic performance, supply-chain logistics and quality standardisation remains limited across most materials. Published studies are typically experimental, pilot-scale or regionally specific, and few materials have yet been widely validated under recognised horticultural quality standards such as PAS 100 or the Responsible Sourcing Scheme.
Stakeholder interviews characterised these options as high-potential but low-readiness, with further work required to clarify processing requirements, certification pathways, performance consistency and economic viability before widespread commercial uptake could occur. As Scotland progresses its transition away from peat, the future role of such materials will depend on continued research, market development and regulatory alignment rather than immediate substitution potential.
Mineral components and functional additives in peat-free media
The transition to peat-free growing media has prompted a more deliberate combination of organic and mineral components to maintain the structural and functional properties required for reliable plant growth. Mineral additives such as perlite, vermiculite and clay pumice are central to this task. Each offers specific physical benefits that provide structure and buffering capacity, and can be used to improve drainage, air holding capacity, nutrient retention and physical stability. These materials are increasingly important for standardising performance and reducing variability in peat-free formulations.
Alongside mineral additives, manufacturers and researchers have turned to supplements to strengthen the performance of peat-free media. These include biostimulants and wetting agents (surfactants). Biostimulants – including algae extracts, beneficial bacteria, fungal inoculants and mineral salts – are believed to enhance natural plant processes, promoting more efficient uptake of water and nutrients (Kisvarga et al., 2022). Wetting agents, available in liquid or granular form, improve water absorption and distribution within the media, helping to reduce runoff and water waste. Although many wetting agents are derived from synthetic chemicals, more sustainable alternatives are emerging. RHS peat-free trials have reported significant benefits from biostimulant use (RHS, 2025, pers. comm), and some growing media suppliers are now incorporating these into their professional peat-free formulations.
Media blending
It is widely recognised that there is no “silver bullet” replacement for peat (Koseoglu et al., 2021). Peat uniquely combines high porosity, water-holding capacity, structural stability and low inherent fertility, allowing growers to exercise precise control over nutrition and acidity (pH). Alternative constituents typically provide some, but not all, of these properties in isolation. As a result, the academic literature consistently emphasises that effective peat-free substrates must be formulated through blending multiple components, selected to balance water retention, drainage, nutrient availability and physical stability according to crop type and production system (Gruda and Bragg, 2020; Schmilewski, 2008). International reviews of growing-media systems note that blending is unavoidable, as no individual material replicates peat’s multifunctionality (Bragg and Alexander, 2019). This conclusion is reinforced by recent European analyses, which show that while bio-based resources such as wood fibre, composted bark, composted green waste and coir are available at scale, each presents technical or logistical limitations that must be addressed through careful combination and optimisation (Hirschler et al., 2022).
Tailoring mixes to specific crop needs
Evidence from stakeholder engagement across Scotland indicates that growers and growing media manufacturers who have successfully reduced peat typically rely on formulations combining wood fibre, composted bark, coir and – particularly for retail mixes – composted green waste. Manufacturers have refined these mixes through tailored approaches to wood fibre processing, coir buffering, and bark composting to improve consistency and performance.
European research identifies clear technical thresholds for peat-free material – typically up to 40% wood fibre, 50% composted bark, or 40% composted green waste – beyond which plant growth and substrate structure decline (Blok et al., 2021; Raviv, 2013). These findings underline that peat-free horticulture is not a simple substitution exercise, but one that depends on optimised blends informed by research, collaborative trials and coordinated supply-chain development. Diversification of materials improves performance and resilience, reducing exposure to single-stream supply risks and reflecting wider European recommendations to mobilise bio-based resources while maintaining quality and consistency (Gruda & Bragg, 2020; Hirschler et al., 2022; Schmilewski, 2014).
The transition to peat-free growing media frequently necessitates adjustments to irrigation and nutrient regimes, particularly in nurseries managing diverse crops under shared irrigation systems where substrate water and nutrient dynamics differ. Stakeholders emphasised the importance of tailoring media to specific crops and growth stages, with individual nurseries often requiring fine-textured propagation media alongside coarser, more water-retentive mixes for container-grown plants. As a result, growers commonly source multiple blends from different suppliers. This approach supports crop performance and operational flexibility, but has implications for procurement, consistency and supply-chain coordination.
While research demonstrates that peat-free growing media can support successful plant growth across a wide range of crops, outcomes are contingent on effective management of irrigation, nutrient supply and physical properties through optimised blending. Continued refinement, supported by targeted trials, collaboration and knowledge exchange, will be critical to broadening adoption and strengthening confidence in the performance of peat-free formulations (Bek et al., 2020; Hirschler et al., 2022; Koseoglu et al., 2021; Royal Horticultural Society, 2023; Sradnik et al., 2023). Appendix H presents an industry-led case study demonstrating how blended peat-free and peat-reduced growing media can be designed to meet crop performance requirements using widely available materials.
Sustainability of alternatives
It is essential that the sustainability of alternatives is clearly understood. This can be assessed through three complementary approaches:
- Environmental assessment: This approach quantifies the environmental footprint of peat alternatives by analysing carbon emissions, energy use, water consumption and end-of-life impacts (Hospido et al., 2010). Studies assessing substitutes such as coir highlight that environmental outcomes vary depending on production methods, transport distances and assessment boundaries, underscoring the need for careful interpretation of life-cycle results (Peano et al., 2012; Toboso-Chavero et al., 2021).
- Social sustainability: This dimension considers labour conditions, health implications and workplace safety within raw material supply chains. Sahu et al. (2019) identified significant health risks among workers involved in coir production, many of whom were women lacking adequate personal protective equipment (PPE), while Peano et al. (2012) highlighted occupational health risks associated with the processing of composted green waste.
- Responsible Sourcing Scheme (RSS): The Responsible Sourcing Scheme for growing media is an industry-led framework that assesses the environmental and ethical performance of growing media products through a transparent scoring system covering energy use, water use, social compliance, habitat and biodiversity, pollution, renewability and resource-use efficiency. By providing clear ratings and independent auditing, the RSS supports informed decision-making by manufacturers, retailers and growers about the environmental impacts of growing media mixes and encourages continuous improvement in material sourcing (Responsible Sourcing Scheme, n.d.).
Environmental assessment
The assessment summarised in Table 2 provides a high-level overview of the environmental sustainability of sixteen potential alternatives to peat used in horticultural growing media. It draws on published life-cycle assessments (LCAs), industry reports, peer-reviewed literature and stakeholder interviews, supplemented with Scotland-specific evidence where available. Key sources include Gabryś and Fryczkowska (2022), Gruda (2019), Hashemi et al. (2024), Hirschler et al. (2022), Litterick et al. (2019), Peano et al. (2012), Stichnothe (2022), and Toboso-Chavero et al. (2021). Each material is assessed across four sustainability dimensions:
- Emissions during production: Based on available LCAs, including direct fossil fuel use and indirect biogenic carbon release. Where quantitative data are reported, emissions are expressed as kg CO₂e per tonne (or per m³ for peat), with ranges reflecting methodological variation and uncertainty.
- Transport emissions: Differentiating between locally sourced materials with short supply chains and imported feedstocks associated with long-haul transport.
- Risk of offshoring impacts: A qualitative assessment of whether peat substitution may displace carbon or environmental burdens to other regions (e.g. imported coir or Baltic peat).
- Scottish availability: The extent to which materials can realistically be sourced within Scotland, informing circular-economy potential, transport emissions and exposure to offshored impacts.
The qualitative ratings used in Table 2 (Low, Moderate and High) are intended to support comparative interpretation rather than provide precise measurements. Relative to other peat alternatives, a Low rating indicates lower production emissions, limited processing requirements and/or short supply chains based on available evidence. Moderate ratings reflect higher energy inputs, greater processing or transport requirements, or mixed evidence across impact categories. High ratings indicate materials that consistently show higher emissions, longer supply chains or greater risks of offshoring environmental impacts. Full quantitative data, assumptions and sources underpinning these classifications are provided in Appendix I. Table 2 should therefore be read as a comparative overview, highlighting broad patterns in environmental performance across material groups rather than precise rankings between individual material.
Table 2: Summary environmental assessment of peat alternatives used in horticultural growing media
|
Material group |
Materials |
Production emissions |
Transport and offshoring |
Scottish availability |
Overall sustainability signal |
|
Local woody materials |
Composted bark |
Low |
Low-moderate |
High |
Favourable |
|
Wood fibre |
Low |
Low |
High |
Favourable | |
|
Local organic wastes and by-products |
Anaerobic digestate (AD) |
Low |
Low |
High |
Favourable |
|
Biochar |
Moderate |
Moderate |
Moderate |
Mixed/context-dependent | |
|
Composted bracken |
Low |
Low |
High |
Promising but data-limited | |
|
Composted green waste |
Low-moderate |
Low |
High |
Favourable | |
|
Sheep wool |
Low |
Low |
High |
Promising but data-limited | |
|
Soils and sediments |
Loam |
Moderate |
Low |
Moderate |
Mixed/context-dependent |
|
Marine sediment |
Moderate |
Low |
Moderate |
Promising but data-limited | |
|
Imported agricultural by-products |
Coir and coir pith |
Moderate |
High |
Low |
Higher environmental risk |
|
Imported agricultural by-products |
Rice husk ash (RHA) |
Moderate-high |
High |
Low |
Higher environmental risk |
|
Novel or emerging materials |
Composted heather |
Low |
Low |
Moderate |
Promising but data-limited |
|
Hemp fibre (Cannabis sativa) |
Moderate |
Moderate |
Moderate |
Promising but data-limited | |
|
Farmed Sphagnum |
Low-moderate |
Low |
Moderate |
Promising but data-limited | |
|
Peat (domestic and imported) |
Peat |
High |
Moderate-high |
Declining/ constrained |
Unfavourable |
|
Reclaimed peat |
Moderate-high |
Low-moderate |
Low-moderate |
Mixed/context-dependent | |
|
Spent mushroom compost |
Low-moderate |
Low |
Moderate |
Mixed/context-dependent |
Overall, the assessment indicates that environmental performance is strongly influenced by material provenance, processing intensity and supply-chain geography. Transport and offshoring ratings are based on indicative UK and European sourcing assumptions; however, actual impacts will vary depending on specific supply routes, processing locations and logistics. Across all assessed dimensions, locally sourced woody materials, particularly wood fibre and composted bark, consistently demonstrate more favourable environmental profiles than peat and imported alternatives, reflecting low production emissions, short supply chains and high Scottish availability.
Among waste-derived materials, anaerobic digestate performs favourably across all sustainability dimensions, reflecting its status as a locally available by-product with low marginal emissions and strong alignment with circular-economy objectives. Composted green waste similarly shows favourable environmental performance, with emissions largely confined to processing activities. Other locally available materials, including composted bracken and sheep’s wool, demonstrate promising circular-economy potential but remain constrained by limited life-cycle evidence and uncertainty around scalability. Biochar presents potential benefits as a carbon-stable amendment; however, its overall sustainability signal remains context-dependent, varying with feedstock type, energy inputs and the scale of domestic processing capacity.
Materials requiring primary extraction or intensive processing, such as loam and marine sediment, show more mixed environmental profiles. While both benefit from relatively short transport distances, their circular-economy potential is limited by extraction impacts, energy requirements and, in the case of marine sediment, contamination risks and evidence gaps around horticultural suitability at scale. In contrast, imported agricultural by-products, particularly coir and rice husk ash, consistently present higher transport emissions and greater risks of offshoring environmental impacts, limiting their sustainability within a Scottish context despite the widespread use of coir as a peat substitute.
Finally, materials that retain a direct link to peat extraction, including reclaimed peat and spent mushroom compost, offer only partial or transitional environmental benefits. While reclaimed peat avoids new extraction and spent mushroom compost is waste-derived with low additional emissions – and may become inherently peat-free as mushroom production transitions away from peat – both currently remain constrained in their ability to support long-term peatland protection and a fully peat-free growing-media transition (for full SWOT analysis please see Table 24 in Appendix F).
Social sustainability of alternatives
Social sustainability in peat-free growing media encompasses labour conditions, occupational health and safety, and the distribution of social impacts across domestic and international supply chains. While the environmental case for peat substitution is well established, the social implications of alternative materials are more variable and, in some cases, less visible. Addressing these issues is critical to ensuring that the transition to peat-free horticulture does not externalise social risks onto workers or communities elsewhere. Table 32 in Appendix J sets out key social sustainability considerations.
Social sustainability is highest where supply chains are domestic, formalised and regulated, with well-characterised and controllable occupational risks (e.g. anaerobic digestate (AD), wood fibre, loam, spent mushroom compost (SMC)). Moderate–high ratings reflect generally regulated contexts moderated by seasonal labour, dust or bioaerosol exposure, agrochemical inputs or emerging-sector uncertainty (e.g. wool, farmed Sphagnum, composted green waste (CGW)). Moderate ratings capture identifiable exposure risks or regulatory complexity (e.g. hemp, marine sediment). Lower ratings arise where informal labour structures, persistent health concerns or structural sustainability conflicts externalise social risk (e.g. coir, reclaimed peat, rice husk ash).
Responsible Sourcing Scheme (RSS) calculator
Published in August 2024, Guidance Notes: Responsible Sourcing Scheme for Growing Media established an industry-led framework for assessing the sustainability of growing media ingredients. The Responsible Sourcing Scheme (RSS) evaluates key input materials used in horticulture against multiple environmental and social criteria to support more informed decision-making by growers, retailers and consumers. Scores are based on manufacturer data that is subject to independent auditing to enhance transparency and credibility. A detailed summary of the RSS methodology and scoring system is provided in Appendix K.
While the scheme incorporates measures related to carbon and climate within criteria such as energy use and pollution, it does not directly quantify greenhouse gas (GHG) emissions or carbon sequestration in the manner of a full lifecycle assessment. Instead, climate-relevant impacts are inferred through proxy indicators such as fossil fuel consumption, transport inputs and other resource use measures. Methane and nitrous oxide are acknowledged within the broader framework but are not systematically modelled as discrete climate impact outputs.
As a result, the RSS provides a structured, transparent and multi-criteria tool for comparing the relative sustainability of growing media ingredients, but its treatment of carbon and climate impacts is indirect and not comprehensive. This has implications where peat-reduction policy is closely linked to quantified carbon outcomes, especially when comparing materials with differing biogenic carbon dynamics or soil carbon effects.
Positioning the RSS alongside more detailed climate-accounting approaches highlights the trade-offs between usability and precision: the scheme’s graded index supports practical sourcing decisions and market signalling, whereas lifecycle-based carbon inventories offer deeper quantification of climate footprints for research and policy evaluation.
Industry perspectives on environmental sustainability
Stakeholder engagement confirmed that environmental performance remains central to the rationale for peat reduction, though interpretations of “sustainability” varied considerably in practice. Manufacturers and growers emphasised carbon reduction, circular-economy principles and local sourcing as core sustainability strategies.
Several participants highlighted closed-loop systems and renewable energy use, including compost production powered by food-waste-derived biogas and investment in carbon-capture technologies. Others prioritised regional sourcing to reduce transport emissions, with some growers deliberately avoiding imported coir in favour of domestic forestry residues. Resource diversification was also identified as a key strategy, with interest in utilising biomass streams such as bracken and wool to support circular supply chains and reduce reliance on imports.
However, stakeholders also cautioned against environmental trade-offs and “hidden carbon costs,” particularly in relation to long-distance transport of coir and continued reliance on imported peat. Concerns were also raised about contamination in green-waste compost and the need for robust quality assurance to maintain product performance and consumer confidence.
Knowledge gaps in sustainability assessment of alternatives
Although multiple frameworks exist to assess the sustainability of peat-free growing media – including Life Cycle Assessment (LCA), social risk analysis and the Responsible Sourcing Scheme (RSS) – there remain significant methodological and evidential gaps. These gaps affect the comparability, transparency and policy relevance of sustainability claims associated with peat alternatives. More detailed explanation of these gaps is given in Appendix L.
Availability of alternatives
Overview
The transition to peat-free growing media depends on reliable access to alternative materials at sufficient scale and consistent quality. Availability is determined by domestic resource capacity, competition from other sectors, processing infrastructure, and the feasibility of imports. In Scotland, forestry and agricultural by-products provide a strong resource base, however, meeting national demand will require addressing technical, logistical and regulatory constraints.
Established inputs such as wood fibre, composted bark, green waste and imported coir already underpin much of the UK market. Alongside these, several materials remain at limited or developmental stages, including bracken, wool, heather residues, anaerobic digestate, biochar and farmed Sphagnum. Evaluating their role requires consideration of market scale, processing capacity and their contribution to displacing remaining peat use. At UK level, peat consumption has fallen substantially in recent years, however, further substitution depends on the reliable supply and optimisation of the principal alternative materials. Appendix M provides a quantitative comparison of the four most widely adopted alternatives relative to remaining UK peat demand, indicating their current market volumes and the constraints that may limit further expansion. In summary:
- Wood fibre and composted bark represent the most significant near-term substitutes, constrained by bioenergy competition and processing capacity.
- Composted green waste provides meaningful volume but depends on consistent quality assurance to manage contamination risks.
- Bracken and low-grade sheep wool offer renewable, locally available feedstocks with potential for niche or supplementary use, though operational and regulatory barriers remain.
- Loam, digestate fibre and biochar are unlikely to provide large-scale substitution, serving primarily additive or specialist functions.
- Emerging materials – including farmed Sphagnum, heather residues, hemp and marine sediments – show longer-term or localised potential but are not currently scalable.
- Imported materials such as coir and rice husk ash can supplement domestic supply but introduce carbon and supply-chain vulnerabilities.
Overall, achieving national peat replacement will require coordinated expansion of domestic processing capacity, improved resource recovery systems and targeted innovation to scale viable alternatives.
Global context of the supply chain of raw materials
The availability of alternative raw materials is shaped not only by technical suitability but by competing industrial demands and wider geopolitical dynamics. Supply-chain pressures are experienced differently across the sector: growers report direct exposure to trade, availability and logistical constraints, whereas manufacturers more commonly emphasise regulatory consistency, feedstock certification and contamination standards (Litterick et al., 2019).These structural dynamics influence the reliability, scalability and long-term resilience of Scotland’s peat-free transition.
Assessment of key alternatives indicates three broad patterns of exposure:
- Domestic materials, including wood fibre, composted bark and composted green waste, are subject to limited geopolitical risk but face strong internal competition from bioenergy, construction and agricultural markets (Koseoglu and Roberts, 2025). Availability is therefore closely linked to forestry outputs, waste-management systems and energy policy.
- Import-dependent materials, notably coir and rice husk ash, are exposed to global market volatility, shipping costs and potential export controls, increasing supply uncertainty for Scottish growers (Koseoglu and Roberts, 2025). These materials remain sensitive to geopolitical developments and international trade conditions.
- Emerging or under-utilised Scottish resources, such as bracken, heather residues, anaerobic digestate fibre and sheep wool, carry minimal geopolitical exposure but depend on regulatory alignment, processing infrastructure and land-management incentives to become viable at commercial scale (Gaudig et al., 2017; Hill, 2022; Pitman and Webber, 2013).
Taken together, these findings indicate that material security depends less on absolute resource availability and more on cross-sector competition, infrastructure capacity and regulatory coherence within Scotland and the wider UK. A detailed material-by-material assessment of competing uses and geopolitical exposure is provided in Appendix N.
Biosecurity in peat-free growing media production
Biosecurity is a critical consideration in peat-free horticulture, as contaminated growing media can introduce plant pathogens and threaten crop health (Elliot et al., 2023; Frederickson-Matika et al., 2024; Litterick et al., 2025; Vandecasteele et al., 2018). Scotland’s transition away from peat brings renewed attention to these risks, particularly given the increased use of organic and recycled inputs. Key challenges are summarised in Appendix O and include:
- Pathogen risk in organic substrates: Organic and recycled materials may harbour plant pathogens, underscoring the need for clearly defined sanitisation protocols and plant-health-specific quality standards (Elliot et al., 2023; Vandecasteele et al., 2018).
- Limited plant-health coverage in certification schemes: Existing accreditation frameworks primarily address human-health and contamination thresholds, with limited explicit provision for plant-pathogen risk (Elliot et al., 2023).
- Traceability and import assurance considerations: Effective risk management depends on consistent material tracking, proportionate import controls and clear guidance on waste reuse and disposal (Elliot et al., 2023; Litterick et al., 2025).
- Variation in substrate risk profiles: Biosecurity risk differs between materials. Green waste composts certified under BSI PAS 100 are generally considered moderate risk, as the standard focuses on human-health criteria rather than plant-pathogen assurance. Heat-treated wood fibre and composted bark are typically regarded as lower risk. Virgin peat has historically been considered comparatively low risk due to limited microbial activity; however, detections of Fusarium oxysporum f. sp. melonis and Rhizoctonia spp. have been reported (Frederickson-Matika, 2024; Litterick et al., 2025).
Evidence indicates a lack of sector-wide standardisation in sanitisation regimes, particularly regarding time, temperature and moisture thresholds – an issue most pronounced among smaller producers (Litterick et al., 2025). While peat has often been regarded as comparatively low risk due to limited biological activity, studies have demonstrated that peat-based substrates can support the survival and proliferation of plant pathogens where contamination occurs (Benavent-Celma et al., 2023; James, 2005).
Systematic, comparative surveillance of baseline pathogen loads across peat and peat-free media however remains limited (Müller et al., 2025). Current evidence therefore does not support a definitive conclusion that peat-free substrates inherently present greater biosecurity risk than peat. Rather, risk appears to be influenced by processing controls, quality assurance systems and supply-chain management. Achieving equivalent assurance across materials depends on transparent quality control, consistent testing and clearly defined sanitisation standards (Elliot et al., 2023). Biosecurity considerations therefore form one component of the broader technical, environmental and supply-chain assessment required when evaluating peat alternatives and designing resilient media blends for Scottish horticulture (Müller et al., 2025).
The economics of peat-free growing media
Recent analysis (Koseoglu & Roberts, 2025) and stakeholder engagement indicate that cost remains a significant barrier to peat-free transition. Of the 18 grower interviews analysed in Phase 2 of this research, 16 (89%) reported increased growing media costs following transition to peat-free or peat-reduced mixes. Reported increases most commonly fell within a range of approximately 10-40% when comparing like-for-like volumes of peat-free media with previously purchased peat-based mixes. Some growers cited substantially higher differentials, including instances where price was reported to have doubled. These figures reflect grower-reported purchase prices rather than standardised per-unit market comparisons. These stakeholder-reported increases are broadly consistent with findings from a UK-wide Royal Horticultural Society (2023) survey, which identified a 15–25% higher average cost for peat-free compared with peat-reduced growing media among responding businesses (n=35).
Cost impacts appear to vary across sectors, with ornamental, forestry, fruit and vegetable, and potato mini-tuber growers all reporting upward pressure, though the magnitude differed according to crop type, blend formulation and procurement arrangements. In some cases, growers indicated that transition would not have been economically viable without external financial support. Despite the consistency of reported cost increases, there remains limited peer-reviewed research directly comparing peat and peat-free media under equivalent production conditions, highlighting a gap in systematically collected cost data.
Material cost differentials
Stakeholder interviews and recent supply-chain analysis identify relative cost differences between major peat-free constituents (Table 3). Manufacturers indicated that composted bark and wood fibre are currently among the more cost-competitive peat-free components. Stakeholder-reported pricing suggested composted bark was below some peat-blended media, while wood fibre was moderately higher. In contrast, coir-based mixes were consistently described as substantially more expensive, with reported cost increases of 30-50% attributed to washing, buffering and international freight. Hirschler and Osterburg (2025), and Koseoglu and Roberts (2025) similarly identify coir as among the more expensive peat-free constituents, reflecting its processing requirements and transport intensity.
Composted green waste feedstocks are often available at relatively low bulk prices within the recycling sector. However, higher bulk density and additional processing requirements (e.g. screening, drying and quality control) contribute to final blended media costs, making simple raw price comparisons with peat imprecise (Koseoglu and Roberts, 2025). Digestate-based composts were reported at intermediate price points, reflecting maturation and handling requirements despite waste-derived feedstocks. A comparative cost analysis in a commercial plant nursery context found that compost derived from anaerobic digestion could present cost advantages relative to peat when assessed on a lifecycle cost basis, including labour and handling impacts (Restrepo et al., 2013).
For materials that do not yet have an established place in the UK growing media market (e.g. hemp fibre, marine sediment, rice husk ash, farmed Sphagnum and composted heather), reliable cost data are largely unavailable. These materials are typically produced at pilot scale, are regionally specific, or are not yet integrated into established supply chains. As a result, pricing information is either unpublished, commercially confidential, or highly context-dependent. This makes direct comparison with peat or mainstream alternatives difficult at present.
Table 3: Relative cost differences and cost drivers for widely adopted peat-free constituents
|
Material |
Indicative cost position (relative to peat) * |
Key cost drivers |
|
Composted bark |
Comparable to or slightly above peat |
Processing, screening |
|
Coir and coir pith |
Substantially above peat |
Import, washing, buffering |
|
Composted green waste (CGW) |
Moderately above or competitive, depending on processing and blend context (no standardised pricing) |
Processing, screening, drying |
|
Wood fibre |
Moderately above peat |
Processing, screening |
* Relative positions reflect stakeholder and literature evidence rather than fixed market pricing.
Independent market analysis in Germany found that peat-free growing media cost on average approximately 21% more than peat-containing products at retail, although prices for individual growing-media components did not differ consistently. This suggests that mix formulation, processing and market structure contribute to observed price differentials (Hirschler & Osterburg, 2025). It is important to note that growing media component prices are subject to fluctuation due to factors including energy costs, freight rates, exchange rates, seasonal demand and regulatory changes. For this reason, the table above presents relative cost positions and principal cost drivers rather than fixed price estimates.
Ancillary production costs
Growers emphasised that cost increases extend beyond media purchase prices. Transition to peat-free substrates often requires adjustments to irrigation regimes, fertiliser strategies and handling systems. Several growers reported increased labour inputs associated with altered media structure, including more frequent tray filling adjustments and manual interventions. One nursery estimated overall production costs increased by 25-30% following transition, reflecting nutrient and labour inputs rather than media costs alone. Larger producers reported that economies of scale, in-house blending and automation mitigated some cost increases. In contrast, smaller nurseries and independent growers, with lower purchasing power and limited mechanisation, reported sharper per-unit impacts.
Supply-chain and structural cost drivers
Analysis by Koseoglu and Roberts (2025) identifies several structural factors that influence the cost profile of peat-free growing media. These drivers extend beyond the headline price of individual constituents and reflect broader supply-chain characteristics.
Transport dynamics are a key consideration. Many peat alternatives differ from peat in bulk density and compressibility, affecting transport efficiency and haulage costs per usable volume. Modern supply-chain analyses and industry assessments identify transport configuration, logistics and processing requirements as significant structural contributors to cost outcomes (Hirschler and Osterburg, 2025; Koseoglu et al., 2021; Vandecasteele et al., 2018).
Processing requirements also contribute to overall cost. Producing horticulture-grade compost involves screening, grading and quality assurance steps that increase handling and infrastructure demands. Tightened contamination thresholds—particularly relating to plastics—require investment in improved screening systems and covered storage (Scottish Environment Protection Agency, 2025; Waste and Resources Action Programme, 2016). For imported materials such as coir, additional washing, buffering and long-distance freight introduce further logistical and processing inputs. In parallel, production systems historically designed for fine, flowable peat may require modification to accommodate more fibrous or structurally variable substrates, requiring operational adjustments and transitional capital investment.
Taken together, these system-level factors mean that cost outcomes are shaped not only by raw material choice but also by infrastructure capacity, logistics configuration and scale of operation. Larger manufacturers may absorb some pressures through in-house blending and automation, whereas smaller operators can experience proportionately higher impacts. Evidence suggests that some of these cost differences may reduce over time as domestic recycling and processing capacity expands and supply chains mature (Koseoglu & Roberts, 2025). However, in the short to medium term, these factors continue to influence the economic conditions under which peat-free media are produced and adopted.
Conclusions – alternative growing media
Section 5 demonstrates that peat-free growing media is now a technically viable but systemically complex transition. There is no single “drop-in” substitute for peat. Instead, successful peat-free production depends on carefully optimised blends that combine materials with complementary physical, chemical and biological properties. Wood fibre, composted bark, composted green waste (retail) and coir currently underpin most UK formulations, with other materials contributing additive, niche or developmental roles.
Evidence from stakeholder engagement and technical literature indicates that peat-free growing media must be formulated to achieve a reliable air–water balance, with crop and stage-specific adjustments driven primarily by particle-size distribution, container geometry and irrigation regime rather than a fixed recipe. Pore-size distribution governs performance: finer fractions increase water retention but may reduce aeration, while coarser fractions increase air-filled porosity and drainage. As crops move from propagation into larger containers, mixes are refined to reflect changing rooting volume and structural demand. In plugs and trays, short substrate columns retain proportionally more water and can limit air-filled porosity, while propagation substrates are typically maintained at low nutrient and soluble salt levels to avoid inhibiting germination or early root development. For ericaceous crops, maintaining a suitably low pH remains a critical constraint shaping constituent choice and limiting pH-raising inputs.
Across sustainability dimensions, performance varies primarily by provenance and processing intensity. Locally sourced woody materials and domestic organic by-products generally demonstrate more favourable environmental and social profiles, reflecting shorter supply chains, lower transport emissions and regulated labour conditions. Import-dependent materials, particularly coir and rice husk ash, remain technically effective but introduce higher transport emissions and greater risk of offshoring environmental and social impacts. Emerging materials – including farmed Sphagnum, bracken, wool and hemp – show promise in circular-economy terms but require further validation, scaling and certification before widespread deployment.
Availability is shaped less by theoretical resource abundance and more by infrastructure capacity, cross-sector competition and regulatory coherence. Forestry residues and organic waste streams provide Scotland with a strong domestic resource base, yet scaling substitution depends on investment in processing, contamination control, quality assurance and logistics. Biosecurity assurance, particularly for recycled and organic substrates, remains a critical component of system resilience.
Economic evidence confirms that cost remains a material barrier. Most growers report increased media expenditure following transition, typically in the range of 10-40%, with additional operational costs associated with irrigation, nutrition and handling adjustments. Structural supply-chain factors – including processing intensity, bulk density, transport efficiency and scale of operation – play a significant role in shaping final cost outcomes. While some cost differentials may reduce as supply chains mature, short-to medium-term pressures remain.
Taken together, the evidence indicates that Scotland’s peat-free transition will depend on coordinated expansion of domestic processing capacity, optimisation of blended formulations, strengthened quality and biosecurity standards, and continued innovation to diversify supply. Peat substitution is achievable, but it is best understood as a process of system redesign rather than simple material replacement. Table 4 summarises the relative performance of each component, drawing together the sustainability, supply, cost, and horticultural suitability metrics discussed in this section. Peat is included as a baseline for comparison; although technically reliable and historically cost-competitive, its extraction is incompatible with Scotland’s long-term peatland protection and climate objectives
Table 4: Overall summary of peat alternatives
|
Material |
Sustainability |
Availability |
Relative cost signal |
Technical suitability |
|
Anaerobic digestate (AD) |
Strong |
Limited |
Moderately higher |
Functional |
|
Composted bark |
Strong |
Established |
Comparable/ lower |
Reliable |
|
Biochar |
Mixed |
Limited |
Moderately higher |
Functional |
|
Composted bracken |
Strong |
Limited |
Insufficient evidence |
Functional |
|
Coir and coir pith |
Mixed |
Established |
Substantially higher |
Reliable |
|
Composted green waste (CGW) |
Strong |
Established |
Moderately higher |
Functional |
|
Composted heather |
Mixed |
Not currently |
Insufficient evidence |
Functional |
|
Hemp fibre (Cannabis sativa) |
Mixed |
Not currently |
Insufficient evidence |
Functional |
|
Loam |
Mixed |
Limited |
Moderately higher |
Functional |
|
Marine sediment |
Mixed |
Not currently |
Insufficient evidence |
Functional |
|
Peat (baseline for comparison) |
Significant conflict |
Limited |
Comparable/ lower |
Reliable |
|
Reclaimed peat |
Significant conflict |
Limited |
Insufficient evidence |
Reliable |
|
Rice husk ash (RHA) |
Mixed |
Not currently |
Insufficient evidence |
Functional |
|
Sheep wool |
Mixed |
Limited |
Moderately higher |
Functional |
|
Spent mushroom compost |
Mixed |
Established |
Moderately higher |
Functional |
|
Farmed Sphagnum |
Mixed |
Not currently |
Insufficient evidence |
Reliable |
|
Wood fibre |
Strong |
Established |
Moderately higher |
Reliable |
Table 5: Compact key for Table 4. Ratings reflect stakeholder evidence and published studies within a Scottish context.
|
Rating dimension |
Green |
Yellow |
Red |
White |
|
Sustainability |
Strong environmental and social alignment |
Mixed/context dependent |
Significant environmental or policy conflict | |
|
Availability |
Established commercial supply (Scotland/UK) |
Limited or emerging supply |
Not currently scalable | |
|
Relative cost signal |
Comparable to or lower than peat |
Moderately higher* |
Substantially higher |
Insufficient evidence |
|
Technical suitability |
Reliable performance in peat-free blends |
Functional but mainly additive/niche |
Note: ‘Moderately higher’ costs typically fall within 10-40% above peat where evidence exists.
Feasibility of alternatives in Scotland
Sector context and current transition status
Horticulture in Scotland sits within the broader agricultural sector and, for the purposes of this research, encompasses ornamentals, trees for forestry and woodland creation, fruit and vegetables, and potato mini-tubers. The analysis also considers growing media manufacturers and retailers, reflecting the central role of substrate supply in peat reduction.
In 2024, potatoes, vegetables, fruit, and flowers and nursery stock together contributed an estimated £831.4 million to Scotland’s crop output, accounting for 54.5% of the total (Scottish Government, 2025b) (Figure 3). Nurseries producing plants for forestry and woodland creation generated approximately £19 million in turnover in the same year (Scottish Forestry, 2024). In the UK, household expenditure on growing media was estimated at £790 million in 2023 (Oxford Economics, 2024), underscoring the scale of the growing media market and its relevance to peat-free transition.
Figure 3: Output value Scottish potatoes and horticultural sectors, 2024 (Scottish Government, 2025b) Values represent farm output at current prices. Potatoes includes seed, ware and early potato production. Combined output from potatoes and horticultural crops accounted for approximately 54.5% of total Scottish crop output value in 2024 (Scottish Government, 2025b)
To complement published evidence, detailed interviews were conducted with 18 professional growers during Phase 2 of the research, with a further four growers engaged through stakeholder workshops in Phase 1 (total n = 22). Growers were selected to achieve broad representation across the sector, including variation in crop type, business size, and geographic location (including areas beyond the central belt (Appendix D)). This sampling approach aimed to capture a robust range of operational experiences and perspectives on peat-free feasibility.
Current transition status of Scottish growers
Across the professional growers interviewed, most remain in a peat-reduced phase rather than fully peat-free production. Peat continues to underpin commercial systems, although varying degrees of substitution with materials such as wood fibre, coir and composted bark were reported.
Ornamentals
All ornamental nurseries interviewed continue to use peat to some extent. Typical blends contain 50-70% peat for main crops, with wood fibre and coir serving as the principal alternatives. Propagation remains heavily reliant on peat-based media, often incorporating mineral components to modify drainage and structure. One micro-scale nursery reported fully peat-free production of herbaceous plants and grasses; however, they were unable to source trees, shrubs or aquatic plants that had not been propagated in peat, limiting their ability to eliminate peat entirely from their supply chain.
Trees for forestry and woodland
Among tree growers supplying forestry and woodland creation projects, two operate fully peat-free systems, while one uses a peat-reduced mix but could not specify the peat proportion at the time of interview. However, challenges remain: one peat-free grower was considering reverting to a 40% peat mix to mitigate crop losses, and another reintroduced a small proportion of peat in 2024 to address stalling growth in two species. In addition, externally sourced tree seed is sometimes stratified in peat prior to delivery, preventing complete removal of peat from the production chain.
Fruit
Fruit growers have made substantial progress toward peat-free production but expressed concern about reliance on coir as a primary substrate. Blueberries remain a notable exception due to their requirement for acidic growing conditions and are typically cultivated in a 50:50 peat-coir blend. Growers reported reluctance to reduce peat content further, citing potential risks to yield and fruit quality associated with substrate pH stability.
Mushrooms
Mushroom growers have also advanced toward peat-free production, with both businesses interviewed harvesting and marketing peat-free crops. However, transition remains at an early stage. Increased costs, reduced yields and smaller fruiting bodies were reported. As a result, both growers currently operate mixed production systems, combining peat-free and 100% peat-based substrates to maintain market supply while reducing overall peat use.
Potato mini-tubers
All surveyed potato mini-tuber growers have reduced peat use, operating at approximately 60–85% peat content. All three source media from the same manufacturer and supplement mixes with coir and wood fibre. Nevertheless, growers expressed caution about further reductions until high-performing alternative substrates are validated through trialling.
Scottish grower-led trials and experimentation
Despite continued reliance on peat overall, growers demonstrated a clear willingness to undertake on-site trials to advance peat-free production. These ranged from informal business-led experimentation to structured collaborations with researchers and growing-media manufacturers.
All eight interviewed ornamental growers had undertaken or were currently conducting trials, as were two of the three forestry tree producers. In the fruit sector, one large cooperative is trialling both novel materials and established peat substitutes as part of efforts to reduce reliance on coir as a primary substrate. All three mini-tuber producers reported engagement in internal or externally supported trials. Although both mushroom growers are already marketing peat-free crops, they described themselves as being in an ongoing learning phase, with further experimentation under way. Trial durations typically spanned one to three growing seasons, reflecting crop-specific requirements and the early stage of sector-wide transition. Trial length was frequently constrained by staff capacity and, in some cases, by cost.
Outcomes were mixed and highly crop-specific. Bedding plants, herbs, perennials and grasses generally performed well in peat-free blends incorporating wood fibre and coir. In contrast, ericaceous species and propagation-stage crops often exhibited reduced germination rates or weaker root establishment. Some growers reported that mixes containing more than 50% alternative materials were associated with reduced vigour or nutrient imbalance. Several also noted that successful transition required adjustments to irrigation and fertiliser regimes; however, these adaptations were not always implemented due to labour constraints and additional input costs. This suggests that performance outcomes depend as much on cultural and management adaptation as on substrate composition.
Despite variable results, growers consistently viewed trialling as essential to building technical confidence and practical experience. Smaller and more specialised nurseries reported greater flexibility in experimenting with new blends, whereas larger operations expressed caution due to the financial risk associated with large-scale crop loss. Encouragingly, a growing number of businesses have achieved marketable crops in fully peat-free media and continue to refine blends annually in collaboration with manufacturers. This iterative, grower-led experimentation reflects an emerging culture of innovation, even as challenges relating to media consistency, water management and cost remain.
Grower motivations for trialling and transition were shaped by a combination of anticipatory, market-driven and value-based factors. Many described experimentation as preparation for anticipated legislation, seeking to position themselves ahead of a potential peat ban. Others cited customer and supply-chain pressures, particularly from local authorities and retail groups requesting peat-free products. A smaller number framed transition as principle-led, aligned with internal sustainability commitments. Some growers also anticipated reputational or market advantages, although several reported that these had yet to translate into measurable commercial returns.
Current barriers
Barriers for professional growers
Stakeholder engagement identified a consistent set of barriers constraining professional growers’ transition to peat-free production. These span financial, technical, regulatory and structural dimensions and affect businesses across scales and sectors. A detailed account is provided in Appendix P. Overall, these findings align with published research highlighting the economic and technical complexity of peat substitution (Bek et al., 2020; Koseoglu and Roberts, 2025).
Cost and resource pressures were the most frequently cited constraint. Peat-free and peat-reduced media were cited as typically 30-40% more expensive than peat-based products, reflecting higher freight, processing and input costs. While local authorities and retailers increasingly request peat-free plants, growers reported limited willingness within the supply chain to absorb higher prices. Rising fertiliser costs and increased water demand further compound financial pressures. Transition may also require capital investment in storage, handling and irrigation systems, and in some cases new machinery to accommodate bulkier or less uniform substrates.
Technical compatibility and consistency present additional challenges. Peat-free blends, particularly those containing high proportions of wood fibre, were reported to clog or compact unevenly in automated filling and transplanting equipment. Variability between batches – linked to raw-material sourcing or processing – was frequently cited as undermining crop consistency and confidence in performance. Some growers also reported reduced structural stability in wood-based substrates over longer production cycles.
Labour and productivity impacts were widely noted. Peat-free mixes often require closer monitoring, more frequent irrigation and adjustments to nutrient regimes. In some cases, crops such as lavender required up to an additional month to reach marketable size. These factors increase labour inputs and extend production timelines, creating particular strain for smaller nurseries operating on narrow margins.
Skills and knowledge gaps continue to impede progress. Several growers reported limited understanding of substrate composition and management requirements, contributing to inconsistent irrigation and feeding practices. Training provision in production horticulture was described as limited within Scotland, restricting access to specialist technical support.
Representation and communication barriers were also identified. Some participants felt underrepresented within existing trade bodies and disconnected from UK-wide initiatives. Membership costs, limited regional engagement and a perceived emphasis on retail rather than commercial production were cited as factors limiting participation.
Business scale and geography shape adaptive capacity. Smaller and more remote nurseries face higher transport costs, minimum-order constraints and restricted supplier choice. Without the purchasing power to commission bespoke blends, many rely on generic formulations that may not be optimised for their crop range or local climatic conditions.
Finally, biosecurity and regulatory requirements introduce additional complexity. Plant-health rules governing cross-border trade and the use of certain organic materials can limit access to suitable peat-free substrates. For example, UK-Northern Ireland trade arrangements restrict the re-entry of certain wood-fibre media, while PAS 100-certified composts are considered unsuitable for some crops, such as raspberries, due to pathogen risk. In contrast, some growers rely on alternative assurance schemes, such as Dutch RHP certification, which apply more specific controls for horticultural growing media.
Barriers for media manufacturers
Published evidence on barriers specific to manufacturers remains limited. However, stakeholder engagement and sector reports consistently identify material supply, infrastructure capacity, input quality, economic viability, and policy clarity as key constraints to scaling peat-free growing media production in Scotland and the wider UK. While demand for alternatives such as wood fibre, bark, coir, and composted green waste continues to increase, feedstock reliability, processing capacity, and regulatory certainty have not developed at the same pace. A detailed account of these barriers is provided in Appendix Q.
Material supply constraints were identified as a primary challenge. Although domestic bark arisings from UK forestry and sawmilling are substantial in aggregate volume, only a proportion consistently meets the quality, particle size, and phytosanitary standards required for professional growing media. Competition for suitable bark from other sectors e.g. bioenergy, further limits availability and contributes to price volatility. Wood fibre supply is subject to similar pressures, with processing capacity constrained and feedstocks dependent on forestry outputs and wider industrial market cycles. As a result, reliance on imported alternatives – particularly coir – reflects both quality specifications and cross-sector competition, rather than absolute domestic scarcity. Tightening biosecurity requirements for bark imports add further cost and logistical complexity.
Infrastructure and logistics limitations compound these constraints. Stakeholders highlighted that even where raw materials are available, UK capacity for grading, maturation, blending, and quality control remains insufficient to ensure consistent, high-quality substrates at scale. Materials such as digestate fibre require specialised processing and extended stabilisation periods, while the bulk density and storage requirements of wood fibre and composted materials increase capital and transport costs. Both the Growing Media Taskforce (2022) and Office for the Internal Market (2023) identify infrastructure investment as critical to achieving reliable, scalable peat-free production.
Input quality and standards were also cited as significant barriers. Manufacturers report variability in wood fibre and composted materials arising from differences in source material, processing methods, and contamination levels. Green waste contamination – including plastics and persistent herbicide residues – continues to undermine confidence in recycled inputs. The absence of harmonised grading systems and clearly defined technical standards was described as a structural gap in the sector. The reformed Growing Media Association (Bragg, N., 2025, pers. comm.; HortWeek, 2025a) is developing new technical frameworks; however, stakeholders emphasised that coordinated research, independent trials, and transparent performance data are required to validate materials and support wider adoption.
Economic constraints further limit supply chain resilience. Transitioning away from peat has increased production costs, driven by new machinery requirements, higher storage needs, and increased transport expenditure. Wood fibre processing may require capital investment of £500k–£2 million per facility (Growing Media Taskforce, 2022), while expanding processing capacity for peat-free inputs such as coir may require investment of approximately £0.8–£1.2 million per plant (Office for the Internal Market, 2023). Heavier alternatives such as composted green waste incur substantially higher transport costs because of their greater bulk density, historically estimated at up to around 90% higher than peat on a per-volume basis (English Nature and the Royal Society for the Protection of Birds, 2002).
Policy uncertainty was identified as a cross-cutting barrier. Manufacturers reported that the absence of clear, harmonised timelines for peat restrictions across UK nations constrains long-term planning and discourages capital investment in infrastructure and equipment.
Barriers for plant retailers
Plant retailers play a key intermediary role in the transition to peat-free horticulture, linking consumers, growers, wholesalers and manufacturers. However, they face intersecting supply chain, economic, behavioural and policy barriers that constrain both the availability and uptake of peat-free products. Around half of retail plant businesses surveyed by the Scottish Government (2023b) expected to be negatively affected by a peat ban, underscoring the sector’s exposure to transition risks. Appendix R provides further detail.
Supply chain and infrastructure constraints were identified as a primary concern. Limited domestic processing capacity and inconsistent availability of peat-free growing media restrict the ability of some retailers to offer a fully peat-free product range. Larger businesses reported that shortages during peak trading periods could intensify competition for available volumes, potentially disadvantaging smaller outlets with less purchasing power (Office for the Internal Market, 2023). Storage and handling requirements present additional pressures. Peat-free media performance in storage varies by formulation, and trade guidance indicates that prolonged storage of bagged peat-free compost can lead to quality deterioration. Dry, covered storage and faster stock turnover are therefore recommended, potentially increasing space, handling and cost demands – particularly for smaller retailers.
Economic pressures further constrain progress. Peat-free growing media were reported by stakeholders to be approximately 30-40% more expensive than peat-based equivalents, with several retailers indicating that they absorb part of this differential to maintain competitive pricing. Smaller independent businesses, lacking the purchasing leverage of national chains, may be particularly exposed to input price volatility. Consumer price sensitivity reinforces these pressures: affordability remains a primary reason cited for continued peat use (Koseoglu and Roberts, 2025). In some cases, imported peat-based products remain cheaper than domestically produced peat-free alternatives, creating competitive imbalance within the retail market.
Quality and consistency concerns were also raised. Retailers reported variability in nutrient balance, pH, moisture retention and contamination within peat-free products. Trials conducted by the Stockbridge Technology Centre (HortWeek, 2025b) identified variability in the performance of retail media samples. Inconsistent product performance can generate negative customer feedback, reduce repeat purchases and undermine confidence. Retailers also noted that some peat-free plants may require more attentive irrigation management, increasing display maintenance demands.
Cultural and consumer barriers compound these practical challenges. Although surveys indicate that many consumers express a preference for peat-free options, this is not consistently reflected in purchasing behaviour (Dahlin et al., 2019; Office for the Internal Market, 2023). Retailers described a gap between environmental intention and consumer action, with some customers remaining sceptical regarding peat-free compost performance or perceiving it as less reliable. While experienced or sustainability-motivated gardeners often adapt successfully to peat-free systems, general awareness of best practice remains limited. Time constraints during peak seasonal trading reduce opportunities for customer education, though collaborative initiatives involving retailers, growers and manufacturers seek to address this through outreach and guidance materials (Horticultural Trades Association, n.d.).
Policy and standards gaps were identified as an additional barrier. Retailers reported that the absence of a unified certification or labelling framework for peat-free media allows wide variation in quality and environmental claims, complicating procurement decisions and consumer communication. Regulatory divergence between domestic and international markets was also highlighted: imported plants grown in peat are not currently subject to equivalent restrictions, potentially creating competitive imbalance. Clearer labelling, consistent enforcement and harmonised standards were identified as measures that could strengthen market confidence and support transition.
Sector and crop specific barriers
The transition to peat-free production is not uniform across horticulture; certain crop groups and production systems present distinct and heightened barriers, examined in greater detail in Appendix S.
Ericaceous crops – including rhododendrons, heathers and blueberries – are technically challenging to produce without peat due to their adaptation to acidic, low-nutrient soil conditions. Commercial grower monitoring in the UK identifies acid-loving ericaceous crops among those most difficult to transition away from peat (Koseoglu and Roberts, 2025). Growers cautioned that a rapid or inflexible ban could reduce plant diversity and limit the availability of specialist cultivars. These concerns are economically significant: Scotland is a major contributor to the UK berry sector, which generated an estimated £624 million in Gross Value Added (GVA) in 2023, with blueberries one of the four principal berry crops alongside strawberries, raspberries and blackberries (HortiDaily, 2025).
Experimental evidence in ericaceous systems indicates that peat-free components such as coir can support plant growth in bark-based substrates, although performance, nutrient dynamics and pH stability remain highly formulation- and management-dependent and must be considered alongside wider sustainability considerations (Kingston et al., 2020; Scagel, 2003). Industry trials have also reported encouraging results: a recent commercial peat-free trial of Inkarho rhododendrons demonstrated that well-formulated peat-free mixes can achieve satisfactory growth and quality under nursery conditions (HortWeek, 2025d).
Potato mini-tuber production – a foundational stage of the UK seed potato industry – presents distinct structural and biosecurity constraints. Scotland accounts for approximately 75% of Great Britain’s certified seed potato area, positioning it as a cornerstone of the UK seed potato supply chain (Thomson, 2024).The sector contributes substantially to the rural economy and underpins both domestic ware production and export markets. Production operates under stringent certification and plant health regimes, overseen by statutory authorities, to maintain Scotland’s high-health status and minimise the risk of pathogen introduction and spread (Scottish Government, n.d.). Within this tightly regulated context, growers are highly risk-averse to changes that could compromise crop uniformity, traceability or disease status.
Research demonstrates that substrate physical properties are critical determinants of tuber number, size uniformity and overall crop performance in controlled mini-tuber systems (McGrann et al., 2020). Variability in alternative substrates can therefore affect operational reliability in a production model where consistency is paramount. Growers reported concerns regarding handling characteristics and perceived biosecurity risks associated with unfamiliar peat-free media. While definitive evidence linking peat-free substrates to increased pathogen transmission remains limited, recent analysis highlights uncertainty around the provenance, processing and sanitisation of some peat-free constituents, reinforcing caution in high-value seed systems (Litterick et al., 2025). Higher substrate costs and limited downstream market demand for peat-free seed production were also cited as barriers, particularly within a specialised sector with limited leverage over input suppliers.
Propagation represents one of the most technically sensitive stages in peat-free cultivation across multiple crop types. Successful germination and early root development depend on tightly controlled substrate physical properties, including moisture retention, aeration, structural stability and nutrient buffering (Gruda, 2019; Schmilewski, 2008). Evidence from both academic studies and industry trials indicates that variability in peat-free constituents – particularly wood fibre and compost-based materials – can affect water dynamics and nutrient availability during early growth stages, increasing management sensitivity (Koseoglu and Roberts, 2025; Litterick et al., 2025). These challenges are especially pronounced in fine-seeded crops and pressed block systems, where structural cohesion and uniform moisture distribution are critical.
Peat-based plugs and liners remain widely used within UK propagation supply chains, and a substantial proportion of young plants are sourced from overseas production systems that continue to rely on peat-containing media (Office for the Internal Market, 2023). This constrains short-term full substitution at nursery level, even where domestic growers are transitioning. Targeted research into peat-free blocking systems highlights the technical complexity involved: trials in vegetable propagation have demonstrated that achieving sufficient block strength, stability during handling and consistent water distribution requires careful optimisation of fibre composition and processing (Eyre et al., 2022). Practical on-farm evaluations similarly report variability in cohesion and transplant performance in peat-free blocks, reinforcing the need for further refinement (Walker and Litterick, 2024). Ongoing research programmes, including work led by Coventry University (2023) aim to address these structural and performance constraints; however, growers emphasise the need for coordinated commercial-scale trials, clearer regulatory alignment and targeted investment to reduce technical and financial risk.
Evidence of viability in peat-free systems
Although significant technical and structural barriers persist in certain sectors, evidence from both stakeholder experience and published research indicates that peat-free production is already functioning effectively across a range of horticultural systems.
Peer-reviewed studies demonstrate that well-formulated peat-free substrates can achieve plant growth and quality comparable to peat-based media in ornamental and edible crops, provided irrigation and nutrient regimes are appropriately adapted (Gruda, 2019; Maher et al., 2008; Schmilewski, 2008). Recent UK-based trials similarly report satisfactory performance in container-grown systems following refinement of fertilisation and water management practices (Litterick et al., 2025; Royal Horticultural Society, 2024).
Performance outcomes appear to vary by crop type and production duration. Short-cycle crops, including bedding plants, grasses and herbaceous perennials, were widely regarded by stakeholders as comparatively lower-risk during transition, although successful establishment following planting may depend on appropriate irrigation management. Limited growing time in the substrate reduces exposure to longer-term structural degradation or pH drift, and rapid turnover minimises financial risk associated with media experimentation. Substrates incorporating bark or wood fibre typically exhibit higher air-filled porosity and improved drainage relative to peat (Gruda, 2019); for species adapted to well-drained conditions, including alpines and certain Mediterranean-origin plants, growers reported equivalent or improved performance under peat-free regimes.
Beyond agronomic outcomes, several businesses identified reputational and market alignment benefits. Growing public concern regarding peatland degradation and climate impacts has increased scrutiny of peat use in horticulture (Scottish Government, 2023b). Early adoption of peat-free systems was described by some growers as strengthening environmental credentials and supporting brand differentiation.
These findings indicate that transition feasibility is uneven across crop types and production systems. While long-cycle and mechanically intensive systems face greater constraints, many ornamental and short-cycle crops are already being produced successfully without peat. This heterogeneity reinforces the need for proportionate, sector-specific transition strategies.
What might support a successful transition for the horticultural industry in Scotland?
Standards for growing media
Evidence of need: confidence, consistency and risk
Stakeholder engagement, consultation responses and published research identify variability in peat-free growing media as a structural barrier to transition. Across professional horticulture, retail and supply chains, there was broad agreement that legislative restriction alone is unlikely to deliver reliable substitution without strengthened quality assurance (see Appendix T for more detail).
Responses to the “Ending the sale of peat in Scotland” consultation (Scottish Government, 2023b) linked inconsistent crop performance to variability in raw materials, processing standards and quality control; similar concerns were raised in England and Wales (Department for Environment, Food & Rural Affairs, 2022). One growing media organisation reported mortality rates of up to 30% in lime-sensitive species when raised on poorly buffered substrates, illustrating the commercial consequences of inadequate formulation or testing.
Published literature supports these findings. Alternative materials such as wood fibre, composted bark and coir can perform comparably to peat but require careful processing and formulation to ensure consistent physical and chemical properties (Gruda, 2019; Schmilewski, 2008). Variability in particle size distribution, salinity, pH buffering capacity and biological activity is particularly consequential in propagation systems, where tolerance for error is low (Gruda, 2019). Recent UK research has further highlighted calls for clearer national sanitisation standards and routine pathogen testing within a formal quality framework (Litterick et al., 2025).
While PAS 100 provides quality benchmarks for composted materials (Waste and Resources Action Programme, 2016), no harmonised UK-wide standard governs the full range of peat-free constituents or finished-product performance.
Sector specific requirements
Although support for strengthened standards was consistent, stakeholder requirements vary according to crop sensitivity, production system and biosecurity exposure. Table 6 summarises sector-specific risk profiles and corresponding standardisation needs.
Table 6: Sector-specific standardisation requirements to support peat-free transition
|
Sector/system |
Primary risks |
What is going wrong? |
What kind of standard would help? |
|
Professional growers (all) |
Reduced efficiency and increased production risk |
Inconsistent crop performance, machinery compatibility issues, greater sensitivity to irrigation and nutrient management. |
Clear minimum performance standards for finished growing media (e.g. physical structure, stability, nutrient buffering and water-holding capacity). |
|
Media manufacturers |
Variable raw materials and contamination |
Differences in input quality (wood fibre fines, compost maturity, contamination) affecting consistency. |
Defined processing standards, contamination limits, input traceability requirements. |
|
Plant retailers |
Customer complaints and loss of trust leading to loss of income |
Inconsistent product performance and differences between retail and professional grades. |
Clear labelling and certification to distinguish tested, quality-assured products. |
|
Ericaceous crops |
Crop failure over long growing cycles |
pH drift and nutrient instability affecting plant health over time. |
Crop-specific performance thresholds (pH buffering capacity and low-salinity limits). |
|
Potato mini-tuber systems |
Biosecurity and yield loss |
Uncertainty over pathogen status and inconsistent moisture retention affecting tuber development. |
Mandatory sanitisation and pathogen testing, alongside defined water-holding performance benchmarks. |
|
Propagation (seed systems) |
Poor germination and early losses |
Rapid surface drying and uneven moisture in fine-seeded trays. |
Defined moisture retention and particle size standards for propagation media. |
|
Plug plant supply chains |
Limited control over substrate used in young plants |
Many plugs are sourced from external or overseas propagators using peat-based media, with restricted choice due to licensing and supply arrangements. |
Traceability and disclosure requirements for plug media composition, alongside incentives for peat-free propagation capacity. |
|
Pressed growing block systems |
Incompatibility with mechanised production systems |
Peat-free blocks may lack strength and moisture stability for reliable mechanical transplanting, requiring more frequent irrigation and increasing nutrient loss. |
Defined performance standards for block strength, cohesion and moisture retention under mechanised handling conditions. |
Ornamental nurseries emphasised reliability in propagation and plug production. As one large tree and shrub nursery stated, “One bad load of compost can set you back a season – if the roots don’t take, you’ve lost that crop window.” Participants called for defined thresholds relating to particle size distribution, structural stability and microbiological status.
Soft fruit producers, many of whom have adopted coir-based systems, expressed concern regarding variability in buffering and salinity management. “Coir works for us, but only if it’s treated right,” noted one grower. Standards ensuring consistent processing and transparent sourcing were viewed as essential.
Potato mini-tuber systems adopted a more precautionary position, emphasising biosecurity and sterility as non-negotiable. Stakeholders questioned whether a single generic standard would adequately reflect pathogen sensitivity thresholds in high-risk systems.
Growing media manufacturers advocated segmentation between amateur and professional markets, reflecting tighter performance tolerances in commercial propagation and mechanised systems.
These perspectives indicate that any standards framework must accommodate differentiated performance thresholds rather than assume uniform risk tolerance across sectors.
Implementation models and pathways
Stakeholders identified both international reference models and emerging UK initiatives that could inform implementation. Several participants pointed to the Dutch RHP certification scheme as an example of structured quality assurance. RHP certifies raw materials and finished growing media products against defined and regularly updated quality standards covering physical, chemical and biological parameterrs – including water uptake, air content, pH, electrical conductivity and nutrient status – applied across the production chain. Stakeholders emphasised that the scheme’s value lies in its combination of technical thresholds, traceability and independent verification. As one ornamental grower observed, certification provides “a baseline – if it’s certified, you know what you’re working with.”
Workshop discussions outlined practical components of a potential UK-aligned pathway:
- Establish defined parameter bands for key constituents and finished products, including contaminant and microbiological thresholds.
- Require batch-level testing and documented growth trials, subject to third-party audit.
- Differentiate standards between amateur and professional markets.
- Introduce a recognisable certification mark linked to transparent compliance criteria.
- Implement structured monitoring to assess the impact of standards on peat reduction rates.
Industry coordination is advancing. The regrouped Growing Media Association has initiated development of a PAS-style specification drawing on PAS 100 and PAS 110 (HortWeek, 2025a). According to stakeholders, the draft includes chemical, physical and microbiological testing parameters, defined target ranges and documented growth testing, with independent audit and corrective timelines.
Governance implications
Interview evidence indicates that stakeholder confidence is closely linked to the credibility and coordination of any standards framework. Voluntary guidance alone was widely viewed as insufficient; independent oversight and transparent verification were considered central to supporting trust in peat-free media.
Participants stressed the importance of UK-wide alignment to avoid market fragmentation, while ensuring Scottish priorities are reflected in emerging PAS-style developments. Structured knowledge exchange – including dissemination of certified product data and crop-specific guidance for high-risk systems – was identified as an important complementary measure.
Overall, stakeholder evidence suggests that effective standards will depend not only on technical specification, but on governance clarity, coordination across administrations and credible independent verification. Standards were therefore framed as an enabling mechanism within the wider peat-free transition, rather than an end point in themselves.
Growing trials
In this context, a horticultural growing trial refers to a structured comparison of alternative growing media under commercial production conditions, typically assessing crop performance, physical and chemical substrate properties, and operational compatibility over defined crop cycles.
National trial activity and capacity constraints
Evidence from stakeholder engagement and national initiatives indicates broad recognition that structured trials are essential to reducing technical risk in peat-free transition. However, commercial growers reported significant constraints in conducting robust trials independently, citing limitations in time, staffing and data-logging capacity. Several interviewees described running meaningful comparative trials as “almost a full-time job,” noting reliance on in-house agronomy rather than external research support.
The need for structured trial support has been shaped in part by the long-standing policy trajectory toward peat reduction. In 2011, the UK Government set a voluntary target to phase out peat use in professional horticulture by 2030 (HM Government, 2011). Stakeholders emphasised that pursuing this transition without coordinated trial programmes increases commercial exposure. Participants expressed willingness to trial alternative media where external agronomic expertise, supervision and data analysis were available, highlighting the importance of partnership models rather than isolated experimentation.
Views differed regarding optimal trial design. Some growers favoured on-site trials, arguing that microclimatic conditions, irrigation systems and machinery compatibility are highly site-specific. Others supported centralised research-led trials, citing benefits such as biosecurity control and methodological consistency. Across sectors, however, there was agreement that trials must be conducted at commercially meaningful scale; small-plot experiments were widely considered insufficient to influence decision-making.
Several UK initiatives provide relevant models. The AHDB-ADAS CP138 project combined predictive modelling with on-site grower demonstrations, identifying both opportunities and constraints in peat substitution (Agriculture and Horticulture Development Board, 2019). More recently, the Royal Horticultural Society’s Transition to Peat-Free Fellowship (launched in 2022) represents the largest coordinated UK trial programme to date. The five-year project partners the RHS, Defra and commercial media suppliers with multiple nurseries to test peat-free formulations across diverse crop groups, including ericaceous and other traditionally sensitive plants. Interim findings indicate that peat-free media can perform comparably to peat under standard irrigation regimes in several nursery settings, with final results expected in 2027 (Royal Horticultural Society, 2024; n.d.).
Priority crops and technical evidence gaps
Stakeholder engagement identified specific crop categories where technical uncertainty remains high and where targeted, crop-specific trials were viewed as a priority.
Ericaceous ornamentals (including rhododendrons, azaleas and heathers) were frequently cited. While short-term trials have demonstrated encouraging performance in peat-free systems (HortWeek, 2025d), growers expressed uncertainty regarding long-term pH stability and nutrient buffering over extended production cycles.
Propagation systems emerged as a consistent priority. Stakeholders emphasised the need for focused trials on plug plants and growing blocks, where physical cohesion and moisture stability are critical to mechanical transplanting and uniform root development. As one specialist noted, peat substitutes must be sufficiently cohesive to support blocking systems without crumbling during handling.
Potato mini-tuber production, however, was identified as a distinct and higher-risk category requiring targeted investigation. Given Scotland’s central role in certified seed potato production and the sector’s stringent biosecurity and traceability requirements, growers described substrate reliability and pathogen control as non-negotiable. Research demonstrates that substrate physical properties directly influence tuber number, size uniformity and crop performance in controlled systems (McGrann et al., 2020). Stakeholders therefore emphasised the need for dedicated commercial-scale trials to evaluate peat-free media under certified mini-tuber production conditions.
Several niche crops adapted to Scottish conditions – including short-lived perennials such as Meconopsis – were also flagged as requiring bespoke trial design, particularly where moisture sensitivity is pronounced. More broadly, stakeholders emphasised that priority should be given to crop systems that remain dependent on specific physical and chemical properties traditionally provided by peat. Ongoing national initiatives are testing a number of these sensitive groups, including carnivorous plants.
Support mechanisms and coordination considerations
Stakeholder engagement highlighted that future Scottish trial activity should build on existing UK initiatives rather than duplicate them. Several participants suggested formal Scottish participation within established programmes – for example, extending the Royal Horticultural Society’s peat-free trial network to include Scottish-coordinated sites – to ensure representation of local climatic and production conditions.
Interviewees emphasised that trial participation requires structured support. Suggested mechanisms included financial assistance for host nurseries, provision of agronomic expertise to design and monitor experiments, and training in data collection and analysis. Some growers proposed a “trial facilitator” model, whereby an industry-funded agronomist supports multiple nurseries with experimental setup and data logging, reducing individual administrative burden.
Clear dissemination of findings was repeatedly identified as essential. While national initiatives have produced reports and resources, stakeholders expressed concern that results are not always easily comparable across crop types and systems. Participants suggested that a coordinated Scottish knowledge platform could consolidate certified trial data, case studies and technical guidance.
Key stakeholder-identified actions include:
- Embed commercial-scale trials within existing UK frameworks, ensuring Scottish sites are included where relevant to capture regional conditions.
- Provide technical and financial support for host nurseries, including access to agronomic expertise and structured data collection.
- Prioritise crop systems identified as high risk, including ericaceous species, propagation and potato mini-tubers.
- Facilitate peer-to-peer learning, through field demonstrations, workshops and structured mentoring between early adopters and other growers.
Across interviews, stakeholders characterised the current constraint less as unwillingness to transition, and more as residual uncertainty in specific systems. Structured, collaborative trials were viewed as mechanisms to generate transferable evidence under commercial conditions. Trial outcomes were also viewed as providing an empirical foundation for the refinement of future growing media standards.
Enabling conditions for industry transition
While standards (Section 7.1) and structured trials (Section 7.2) address technical uncertainty and product consistency, stakeholder engagement identified a broader set of enabling conditions that influence the pace and stability of peat-free transition. These relate to financial exposure, feedstock availability, regulatory frameworks and knowledge infrastructure. Progress in these areas was viewed as necessary to enable sustained commercial uptake.
Financial and infrastructure considerations
Stakeholders emphasised that transition carries both capital and operational cost implications. Survey evidence from UK growers suggests that fully peat-free growing media may cost approximately 15-25% more per cubic metre than peat-reduced alternatives (Royal Horticultural Society, 2023), although reported differentials vary by crop type and contract structure. Additional costs may arise from equipment modification, irrigation adjustments, storage infrastructure and staff training. Several participants indicated that targeted, time-limited financial mechanisms – including capital grants, transitional funding or co-funded research participation – could reduce early-adopter risk in sectors operating under tight margins (Royal Horticultural Society, 2023). These suggestions were framed as short-term adjustment support during market transition rather than long-term subsidy dependence.
Feedstock competition was identified as a structural consideration. Participants noted increasing demand for wood-based materials across sectors, particularly between growing media manufacturers and biomass energy producers. Formal analysis of peat-policy impacts has similarly reported cross-sector competition for wood residues used in biomass fuel production (Office for the Internal Market, 2023). UK biomass market data indicate that the country is a major importer and consumer of wood pellets for electricity and renewable heat generation (Department for Energy Security and Net Zero, 2023), indicating that demand from the energy sector may influence the availability and pricing of wood residues and by-products used in peat-free growing media formulations.
Regulatory and supply chain constraints
Access to suitable alternative feedstocks is influenced by waste classification systems, contamination thresholds and approval processes. Stakeholders reported that regulatory complexity can delay or deter the use of secondary materials, including anaerobic digestate and recycled wood products, limiting domestic diversification of inputs.
In parallel, concerns were raised regarding contamination in green waste streams, particularly where contractual clauses permit low levels of non-organic material. Variability in compost quality affects manufacturer confidence and restricts its suitability for sensitive applications. Stakeholders suggested that clearer guidance, proportionate review of waste classifications and strengthened enforcement of contamination standards could improve supply reliability, subject to environmental safeguards.
These issues highlight that peat-free transition is not solely a matter of product reformulation, but also of regulatory coherence and supply chain infrastructure.
Knowledge, education and applied research gaps
Beyond crop-specific trials, stakeholders identified broader knowledge gaps affecting implementation. These include:
- Limited long-term, Scotland-specific performance data across diverse crop systems.
- Incomplete quantification of transition costs across different production scales.
- Insufficient applied guidance on irrigation, fertiliser regimes and storage management for peat-free media.
- Uneven access to structured training and peer-to-peer knowledge exchange.
While research is ongoing at UK level, participants emphasised the importance of accessible, crop-specific best-practice guidance and coordinated dissemination mechanisms. Structured knowledge exchange was viewed as complementary to standards and trials, enabling technical learning to translate into operational confidence.
Coordination and policy coherence
Across interviews and survey evidence, stakeholders framed peat-free transition as a system-level adjustment rather than a single technical substitution. Standards, trials, feedstock supply, infrastructure investment and training were described as interdependent components of a stable transition pathway.
Effective coordination across administrations and sectors was therefore viewed as important not only for regulatory clarity, but for maintaining supply-chain confidence and market competitiveness during adjustment. Stakeholders did not characterise the primary constraint as unwillingness to transition, but rather as exposure to uneven implementation conditions across crops and supply chains.
In this context, government’s role was framed as enabling coherence across these domains – ensuring that technical progress, market signals and regulatory frameworks operate in alignment. Stakeholders therefore characterised successful transition not as a question of technical feasibility, but of coordinated implementation across the wider horticultural system.
Feasibility and sequencing of transition in Scotland
The evidence presented in Sections 5-7 shows that peat-free growing media are already working in parts of Scottish horticulture. Many ornamental crops, short-cycle plants and some forestry systems are being produced successfully in peat-free or significantly peat-reduced substrates. However, full removal of peat across all sectors will take time and will not progress at the same pace in every crop group. Feasibility is therefore not a single question. It depends on three main factors:
- Time needed for manufacturers to expand reliable supply of alternatives.
- Time needed for growers to test and validate new mixes under commercial conditions.
- Degree of policy alignment across the UK.
Taken together, these factors suggest that transition is achievable, but that sequencing and coordination will be critical.
Infrastructure and validation lead time
Media manufacturers require time to increase processing capacity for key materials such as wood fibre and composted bark. Installing new refiners, dryers and screening equipment can take two to three years. Expanding production of high-quality compost with consistently low contamination may take three to five years, particularly where additional quality controls are needed. Emerging materials, such as farmed Sphagnum, are likely to require longer development periods before they can contribute at commercial scale (c.5-10 years).
Growers also need time. Most businesses test new growing media over several seasons before adopting them fully. This reflects biological cycles rather than reluctance to change. Crops must be assessed for germination, root development, growth rate, yield and long-term health. For short-cycle ornamental crops, two to three growing seasons may be sufficient. For longer-cycle crops such as shrubs, trees, blueberries and some fruit crops, growers commonly require five years or more to confirm reliable performance.
High-biosecurity systems, particularly potato mini-tuber production, present the longest adaptation horizon. These systems operate under strict certification requirements and low tolerance for variation in substrate performance. Growers reported that multi-year validation would be essential before complete peat removal could be considered. In these sectors, shorter timelines were viewed as commercially high risk.
These lead times are therefore driven by infrastructure investment cycles and biological validation requirements, rather than by lack of technical potential.
Variation across crop systems
The transition does not affect all sectors equally. Retail growing media is already largely peat-free, and many ornamental producers have significantly reduced peat use. In the soft fruit sector, most Scottish berry production (with the exception of blueberries) is already peat-free, typically using coir-based systems. This shows that peat-free production can work at commercial scale. However, coir is imported and associated with transport emissions and wider environmental impacts. It is a functional alternative to peat, but not an environmentally neutral one.
In contrast, ericaceous crops, blueberries and other acid-demanding species remain more dependent on peat due to pH stability and nutrient-buffering requirements. While peat-free systems are being trialled, long-term performance under commercial conditions requires further validation.
Propagation systems, including plugs and pressed growing blocks also present technical sensitivity. These systems depend on precise moisture retention, particle size and structural cohesion. Although progress is being made, growers emphasised the need for continued trialling and refinement.
This unevenness suggests that a single, uniform timetable may not reflect sector realities. A phased approach that recognises crop-specific constraints would better align with the evidence presented in earlier sections.
UK alignment and competitive considerations
Several stakeholders raised concerns about moving significantly ahead of the rest of the UK. If peat-grown plants or peat-based growing media remain available in other nations, Scottish producers could face higher production costs while competing in shared markets. In addition, young plants and plugs are often sourced from outside Scotland, and in some cases from overseas production systems that continue to use peat. Without UK-wide alignment, full removal of peat at nursery level may be constrained by upstream supply chains. These issues do not undermine the case for transition. However, they highlight the importance of policy coordination and clarity to avoid unintended competitive disadvantage or carbon displacement.
Indicative phasing
Based on stakeholder evidence and the technical analysis presented earlier in this report, a broadly phased pattern of transition can be identified:
- Retail and amateur markets are closest to full peat removal.
- Mainstream professional crops, including many ornamentals and forestry plants, are capable of substantial further reduction in the medium term, subject to continued infrastructure expansion and trial validation.
- High-sensitivity systems, including potato mini-tubers, certain propagation systems and ericaceous crops, are likely to require longer validation periods before complete peat substitution is commercially secure.
These phases are indicative rather than prescriptive. The precise pace of change will depend on infrastructure investment, research outcomes, standards development and UK policy alignment.
Indicative time horizons by sector
Stakeholder evidence provides a clearer picture of the likely time required for different parts of the industry to transition fully away from peat. Figure 4 illustrates how these sector-specific timelines translate into indicative transition windows from 2026 onwards. These estimates reflect infrastructure lead times, crop testing cycles and normal equipment replacement schedules. They are indicative and based on reported industry experience rather than fixed commitments.
Growing media manufacturers
Manufacturers highlighted that expansion of domestic processing capacity cannot occur immediately. The following timelines reflect capital investment cycles and regulatory approval processes. They relate only to those materials for which stakeholders provided specific evidence on infrastructure lead times during engagement. Not all alternative materials assessed elsewhere in this report were discussed in comparable detail in relation to scaling timelines.
- Wood fibre and composted bark: typically 2-3 years to install additional refining, drying and screening equipment. Availability of horticultural-grade fine bark remains a constraint.
- Composted green waste: 3-5 years to establish consistently low-contamination, PAS-100 compliant production lines at scale.
- Digestate-derived materials: 3-4 years of further research, pilot work and process refinement to manage ammonium levels and ensure consistent product quality.
- Coir: supply chains are established but remain import-dependent and subject to quality variability.
- Farmed Sphagnum: stakeholders suggested 5-10 years before commercial-scale volumes could realistically be available in Scotland, subject to cost, sterilisation and land-use considerations.
Grower sub-sectors
Time needed for adoption varies significantly by crop type and production system.
- Retail and amateur markets: largely peat-free already; remaining transition expected within 1-2 years based on current trends.
- Ornamental growers: small growers reported that 2-3 growing seasons may suffice. Larger operations anticipate 5-10 years where machinery modification or infrastructure redesign is required.
- Tree growers for forestry and woodland: smaller producers indicated rapid adaptation is possible if suitable substrates are available; larger nurseries suggested 3–5 years to trial mixes under site-specific conditions.
- Fruit and vegetable growers: Strawberries and raspberries are largely peat-free already (coir-based systems). Blueberries and other longer-cycle fruit crops require extended validation, often beyond 5 years. Vegetable growers commonly cited around 5 years as a realistic planning horizon, subject to secure material supply.
- Potato mini-tuber growers: the most cautious sector. Stakeholders suggested that full conversion of facilities could require up to 10 years, reflecting biosecurity requirements, multi-season validation and certification constraints.
- Ericaceous crops: stakeholders indicated that longer timelines are likely, potentially within the 5–10 year horizon identified for high-sensitivity systems, reflecting ongoing challenges in achieving stable low-pH, peat-free systems at scale.
Overall pattern
Taken together, stakeholder evidence suggests a broadly phased trajectory beginning around 2026:
- Short term (1-2 years): Retail markets and low-risk systems complete transition.
- Medium term (3-5 years): Mainstream professional crops achieve substantial reduction, supported by expanded processing capacity and validated blends.
- Longer term (5-10 years): High-sensitivity and high-biosecurity systems transition once multi-year evidence confirms performance and reliability.
These time horizons are contingent on infrastructure expansion, standards development, coordinated trials and UK policy alignment. Timeframes are indicative and assume transition commencing in 2026.
Figure 4: Indicative stakeholder-informed timelines for peat-free transition across grower sub-sectors. Teal bars indicate the earliest feasible transition window reported by stakeholders. Grey extensions show potential additional time required where technical or infrastructure constraints persist. Timelines are illustrative planning horizons rather than forecasts of when peat use will cease.
Conditions for effective transition
Across all sectors, stakeholders consistently emphasised that successful transition depends on coordinated implementation rather than isolated action.
Key enabling conditions include:
- Clear and consistent quality standards for peat-free media;
- Structured, commercially meaningful growing trials;
- Reliable domestic processing capacity;
- Access to technical guidance and workforce training;
- Clarity and alignment of policy across the UK.
Where these conditions are in place, evidence suggests that peat-free production can operate effectively. Where they are absent, technical uncertainty and commercial risk increase.
Overall, the feasibility of transition in Scotland is therefore best understood as a question of sequencing and coordination rather than of technical possibility. The industry has demonstrated willingness to adapt. The remaining challenge lies in aligning infrastructure, standards, research and policy to support consistent and economically stable implementation.
Conclusions
This research examined the technical, environmental, social and economic evidence on alternatives to horticultural peat in Scotlandthrough a literature review, workshops and 46 stakeholder interviews.
No single material fully replicates peat, which has a unique mix of physical, chemical and biological properties. However, stakeholder evidence consistently shows that well formulated blends – notably those based on wood fibre, composted bark and coir – already support commercial production, while others show strong development potential.
Some types of growing, particularly soft fruit production, rely on imported materials. This increases transport emissions and can create supply-chain risks, which may affect long-term environmental and economic resilience. The main challenge is therefore not a lack of alternatives, but ensuring consistent performance through effective blending of materials, suitable infrastructure, clear quality standards and adapted crop management. Across the UK, the supply of leading alternatives exceeds remaining peat use. Wood fibre alone could replace current peat use. However, a reliable supply depends on having enough processing capacity, clear grading standards and the ability to manage competition from other sectors for raw materials, as well as effective transport systems. Supply therefore depends less on whether raw materials exist, and more on investment, quality control, and coordination across the market. In the longer term, Scotland could improve environmental performance and strengthen supply security by reducing its reliance on imported materials.Different parts of the sector can move away from peat at different speeds. Retail growing media and many ornamental growers have made substantial progress in reducing peat use. Soft fruit growers operate successfully using coir-based systems for most crops, with the exception of blueberries. In contrast, some systems are more difficult to change, including ericaceous (acid-loving) crops, potato mini-tubers, and certain propagation systems. These systems face distinct challenges. Potato mini-tuber production operates under strict biosecurity (plant health) and certification requirements. Ericaceous crops require stable low-pH conditions across growing cycles. Propagation systems depend on highly controlled moisture balance and media structure during early growth stages. These differences reflect that the transition involves adapting production systems, not simply replacing one material with another. Stakeholders did not indicate resistance to change, but highlighted commercial risks where performance is uncertain.
The success of a peat-free transition depends on careful planning and realistic timing. It takes time to develop infrastructure– typically 2-5 years for core materials and longer for emerging alternatives such as farmed Sphagnum. Crop production cycles and the need to test over several seasons can take additional time – up to 5–10 years for large or sensitive systems. A single timeline for the whole sector would not reflect these differences, so a phased approach based on evidence and experience is more practical.
Overall, the evidence indicates that Scotland can move to peat-free growing. The speed of change will depend not on technical limits but on strong coordination, clear policy direction and building confidence through standards and collaboration. With the right planning, investment and alignment across the sector, Scotland can phase out peat while maintaining production and a reliable supply. The transition also offers an opportunity to protect peatlands, strengthen local recycling and reuse of materials, and support a more resilient and sustainable horticulture sector.
Next Steps
- Stakeholder feedback highlights several key factors that will affect the pace and success of a peat-free transition across the Scottish horticulture sector.Clear transition planning: The sector requires a phased transition timeline based on evidence. Different parts of the industry need different amounts of time to adapt. Policy coherence across UK administrations would help reduce competitive distortion and investment uncertainty.
- Domestic processing capacity: The UK needs more investment in facilities to process alternative materials, including bark grading, compost quality assurance, and blending infrastructure. Increasing domestic capacity may help ensure steady supply and reduce price volatility.
- Quality assurance and biosecurity standards: The UK could develop consistent frameworks for peat-free growing media, similar to PAS 100 – the UK quality standard for compost. Frameworks should cover how materials are processed, limits on contaminants, tracking of sources, and plant-health safeguards. Clear standards could improve consistency and build trust among growers.
- Coordinated commercial-scale trials: The industry requires multi-season trials to test peat-free materials in high-sensitivity sectors such as ericaceous crops, propagation systems and potato mini-tuber production. This will help generate reliable evidence of performance.
- Market signals and procurement: Stronger demand signals will encourage businesses to invest. This could include public-sector procurement and sustainability-linked sourcing approaches. Visible, long-term demand could help companies plan and expand production.
- Technical guidance and workforce support: Growers would benefit from better access to training and practical advice. This includes support on adapting irrigation, nutrition, and handling techniques suited to peat-free systems.
References
Abad, M., Fornes, F., Carrión, C., and Noguera, V. (2005) Physical Properties of Various Coconut Coir Dusts Compared to Peat, HortScience, 40(7), DOI: 10.21273/HORTSCI.40.7.2138
Agriculture and Horticulture Development Board (2014) Developing alternatives to peat in casing materials from mushroom production. Available at: https://projectbluearchive.blob.core.windows.net/media/Default/Research%20Papers/Horticulture/M%20060_Report_Annual_2014.pdf (Accessed: 7 October 2025).
Agriculture and Horticulture Development (2019) CP138: Transition to responsibly sourced growing media use within UK Horticulture. Available at: https://horticulture.ahdb.org.uk/cp-138-transition-to-responsibly-sourced-growing-media-use-within-uk-horticulture#:~:text=financial%20cost,20%20year%20timeframe%20and%20beyond (Accessed 26 October 2025).
Anbarasu, M., Gurusamy, A., and Saravanan, S. (2024) Properties of different graded coir pith by Keen-Raczkowski box and Brunauer-Emmett-Teller analysis, Journal of Environmental Biology, 45(3), pp. 357-362.
Ahmad, M., Upamali Rajapaksha, A., Lim, J.E., Zhang, M., Bolan, N., Mohan, D., Vithanage, M., Lee, S.S., Sik Ok, Y. (2014) Biochar as a sorbent for contaminant management in soil and water: A review, Chemosphere, 99, pp. 19-33.
Alexander, P.D., Bragg, N.C., Meade, R., Padelopoulos, G. and Watts, O. (2008) Peat in horticulture and conservation: the UK response to a changing world, Mires and Peat, 3, article 8. DOI: 10.19189/001c.128260.
Alburquerque, J.A., de la Fuente, C., Ferrer-Costa, A., Carrasco, L., Cegarra, J., Abad, M. and Bernal, M.P. (2012) Assessment of the fertiliser potential of digestates from farm and agroindustrial residues, Biomass and Bioenergy, 40, pp. 181-189.
Ali, S.N., Aziz, A.A., Kasim, N.N., Tajuddin, S.A., Omar, N.F., and Nasirun, N. (2023) Assessing the effect of biochar addition in growing medium on plant growth performance of Bok Choy (Brassica rappa subsp. Chinensis) using sustainable soilless agriculture system, International Journal of Innovation and Industrial Revolution, 5(13), pp. 104-118.
Amaducci, S., Scordia, D., Liu, F.H., Zhang, Q., Guo, H., Testa, G. and Cosentino, S.L. (2015) Key cultivation techniques for hemp in Europe and China, Industrial Crops and Products, 68, pp. 2–16.
Anaerobic Digestion and Bioresources Association (2025) ADBA Policy & Market Report. Available at: https://adbioresources.org/resources/reports/ (Accessed: 11 February 2026).
Aspray, T.J., and Tompkins, D. (2019) Plastic in food waste at compost sites. Scottish Environment Protection Agency. Available at: https://www.r-e-a.net/wp-content/uploads/2020/12/compost_input_quality_report.pdf (Accessed: 23 January 2026).
Baran, A., Tarnawski, M. and Urbaniak, M (2019) As assessment of bottom sediment as a source of plant nutrients and an agent for improving soil properties, Environmental Engineering and Management Journal, 18 (8), pp. 1647-1656.
Barrett, G.E., Alexander, P.D., Robinson, J.S. and Bragg, N.C. (2016) Achieving environmentally sustainable growing media for soilless plant cultivation – A review, Scientia Horticulturae, 212, pp. 220-234.
Bek, D., Lennartsson-Turner, M., Lanari, N., Conroy, J. and Evans, A. (2020) Transitioning towards peat-free horticulture in the UK: an assessment of policy, progress, opportunities and barriers. Available at: https://pureportal.coventry.ac.uk/en/publications/transitioning-to-peat-free-horticulture-in-the-uk-an-assessment-o (Accessed: 7 October 2025).
Benavent-Celma, C., McLaggan, D., van West, P., and Woodward, S. (2023) Survival of Phytophthora cryptogea and Phytophthora cactorum in Commercial Potting Substrates for Eucalyptus globulus Plants, Agriculture, 13(3), 581. DOI: https://doi.org/10.3390/agriculture13030581
Beretta, D. and Ripamonti, M. (2021) Evaluation of wood fibre as component of substrates for container nursery crops, Acta Horticulturae, 1305, pp. 77-82.
Blok, C., Eveleens, B. and van Winkel, A. (2021) Growing media for food and quality of life in the period 2020–2050, Acta Horticulturae, 1305, pp. 341-355.
Bragg, N. and Alexander, P. (2019) A review of the challenges facing horticultural researchers as they move toward sustainable growing media, Acta Horticulturae, 1266, pp. 7-14.
Bruneau, P., and Johnson, S., (2014) Scotland’s peatland – definitions & information resources. Scottish Natural Heritage Commissioned Report No 701. Available at: SNH Commissioned https://www.nature.scot/sites/default/files/2025-06/naturescot-commissioned-report-701.pdf(Accessed 6 October 2025).
Bulrush (2023) Frequently asked questions on the use of peat-free substrate mixes. Available at: https://www.bulrush.co.uk/media/BUL-peatfree-FAQs.pdf (Accessed: 16 February 2026).
Caballero Mejia, C.C., Brand, M.H. and Lubell-Brand, J.D. (2025) Hemp hurd fiber as a substitute for peat in container production of petunia and geranium, HortScience, 60(8), pp. 1251-1259.
Carlile, W.R., Cattivello, C. and Zaccheo, P. (2015) Organic growing media: constituents and properties, Vadose Zone Journal, 14(6), pp. 1-13.
Carus, M. (2017) The European Hemp Industry: Cultivation, processing and applications for fibres, shivs, seeds and flowers, European Industrial Hemp Association. Available at: https://eiha.org/media/2017/12/17-03_European_Hemp_Industry.pdf (Accessed: 24 January 2026).
Calisti, R., Regni, L., Pezzolla, D., Cucina, M., Gigliotti, G., and Proietti, P. (2023) Evaluating Compost from Digestate as a Peat Substitute in Nursery for Olive and Hazelnut Trees, Sustainability, 15(1), 282. DOI: https://www.mdpi.com/2071-1050/15/1/282?
Chambers, J. (1996) Peat for purists, The Horticulturist, 5(3), pp. 11-12.
Chartered Institute of Horticulture (2025) Horticulture sector unites to boost peat-free gardening. Available at: https://www.horticulture.org.uk/news/horticulture-sector-unites-to-boost-peat-free-gardening/ (Accessed: 16 February 2026).
Chen, J., Jin, C., Sun, S., Yang, D., He, Y., Gan, P., Gerald Nalume, W., Ma, Y., He, W. and Li, G. (2023) Recognising the challenges of composting: critical strategies for control, recycling, and valorisation of nitrogen loss, Resources, Conservation and Recycling, 198, 107172. DOI: https://doi.org/10.1016/j.resconrec.2023.107172 (Accessed: 16 February 2026).
Chrysargyris, A., Tzortzakis, N., Prasad, M. and Menexes, G. (2020) Biochar type, ratio and nutrient levels in growing media affect seedling production and plant performance, Agronomy, 10(9), 1421. DOI: 10.3390/agronomy10091421
Dahlin, J., Beuthner, C., Halbherr, V., Kurz, P., Nelles, M. and Herbes, C. (2019) Sustainable compost and potting soil marketing: private gardener preferences, Journal of Cleaner Production, 208, pp. 1603-1612.
da Silva Alves, L., Tolardo, G., Caitano, C.E.C., Vieira Júnior, W.G., Gomes Freitas, P.N. and Cunha Zied, D. (2024) Use of spent mushroom substrate for cherry tomato seedlings; a potential alternative to peat in horticulture, Biological Agriculture & Horticulture, 40(2), pp. 127-140.
Department for Energy Security and Net Zero (2023) Biomass Strategy. Available at: https://www.gov.uk/government/publications/biomass-strategy (Accessed: 20 February 2026).
Department for Environment, Food and Rural Affairs (1995) Minerals Planning Guidance 13: Guidelines for peat provision in England. Available at: https://cumbria.gov.uk/elibrary/Content/Internet/538/755/1929/17716/17720/17723/42130142912.pdf (Accessed: 6 October 2025).
Department for Environment, Food and Rural Affairs (2021) Sheep and goats: health regulations. Available at: https://www.gov.uk/guidance/monitoring-prevention-and-control-of-disease-in-sheep-and-goats (Accessed: 10 February 2026).
Department for Environment, Food and Rural Affairs (2022) Ending the retail sale of peat in horticulture in England and Wales. Available at: https://consult.defra.gov.uk/soils-and-peatlands/endingtheretailsaleofpeatinhorticulture/ (Accessed: 16 February 2026).
Department for Environment, Food and Rural Affairs (2023) Media reporting on the peat-ban for the professional Horticulture sector. Available at: https://deframedia.blog.gov.uk/2023/03/24/media-reporting-on-peat-ban-for-the-professional-horticulture-sector/ (Accessed: 7 October 2025).
Department for Environment, Food and Rural Affairs (2025a) Environmental Improvement Plan 2025. Available at: https://www.gov.uk/government/publications/environmental-improvement-plan-2025 (Accessed: 12 March 2026).
Department for Environment, Food and Rural Affairs (2025b) Research and analysis: Peat usage in growing media production. Available at: https://www.gov.uk/government/publications/peat-usage-in-growing-media-production (Accessed: 7 October 2025).
Dias, G.C., Machado, R.M., Alves-Pereira, I., Ferreira, R.A. and Gruda, N.S. (2025) Potential of Pine Bark to Replace Perlite in Coir-Based Substrates: Effects on Nutrient Uptake, Growth and Phytochemicals in Lettuce Under Two Salinity Levels, Plants, 14(16), 2577. DOI: 10.3390/plants14162577
Domeño, I., Irigoyen, I. and Muro, J. (2009) Evolution of organic matter and drainages in wood fibre and coconut fibre substrates, Scientia Horticulturae, 122(2) pp. 269-274.
Drax (2025) Support mechanism for Drax Power Station. Available at: https://www.drax.com/support-mechanism-for-dps/ (Accessed: 7 October 2025).
Elliot, M., Green, S., Litterick, A. and Yeomans, A. (2023) Identifying the plant health risks associated with plant waste disposal and peat-free growing media. Plant Health Centre. Available at: https://www.planthealthcentre.scot/sites/www.planthealthcentre.scot/files/2023-03/PHC2021_02%20Plant_waste_disposal_Policy_Summary.pdf (Accessed: 7 October 2025).
English Nature and Royal Society for the Protection of Birds (2002) Peatering Out: towards a sustainable UK growing media industry. Available at: https://doczz.net/doc/8281851/peatering-out—towards-a-sustainable-uk-growing-media (Accessed: 7 October 2025).
Environment Agency (2025) Compost from waste: resource framework. Available at: https://www.gov.uk/guidance/compost-from-waste-resource-framework#when-the-final-product-is-not-considered-waste (Accessed: 23 January 2026).
Environmental Standards Scotland (2024) Scotland’s soils should be protected in law. Available at: https://environmentalstandards.scot/keep-up-to-date/scotlands-soils-should-be-protected-in-law/? (Accessed: 25 January 2026).
European Supermarket Magazine (2024) Sainsbury’s Launches Peat-Free Mushrooms. Available at: https://www.esmmagazine.com/fresh-produce/sainsburys-launches-peat-free-mushrooms-274729 (Accessed: 31 January 2026).
Evans, M.R., Konduru, S. and Stamps, R.H. (1996) Source variation in physical and chemical properties of coconut coir dust, HortScience, 31, pp. 965-967.
Eyre, C., Watson, A., Whiteside, C., and Seymour, P. (2022) Vegetable Propagation: Grower-led peat reduction and replacement demonstration trials 2021. Available at: https://projectbluearchive.blob.core.windows.net/media/Default/Research%20Papers/Horticulture/FV464a_Veg%20prop%20Final%20Report_2022.pdf (Accessed: 16 February 2026).
Federal Ministry for the Environment, Climate Action, Nature Conservation and Nuclear Safety (2013) Ordinance on the Recovery of Bio-Waste on Land used for Agricultural, Silvicultural and Horticultural Purposes. Available at: https://www.bundesumweltministerium.de/fileadmin/Daten_BMU/Download_PDF/Abfallwirtschaft/bioabfv_engl_bf.pdf (Accessed: 23 January 2026).
Ferrans, L., Schmieder, F., Mugwira, R., Marques, M. and Hogland, W. (2022) Dredged sediments as a plant-growing substrate: estimation of health risk index, Science of the Total Environment, 846, 157463. DOI: https://doi.org/10.1016/j.scitotenv.2022.157463
Fielding,D., Pakeman, R.J., Newey, S., and Smith, S.W. (2025) The impact of moorland cutting and prescribed burning on early changes in above-ground carbon stocks, plant litter decomposition and soil properties, British Ecological Society: Ecological Solutions and Evidence, 6(3), 70112. DOI: https://doi.org/10.1002/2688-8319.70112.
Food and Environment Research Agency (2024) UK Best Practice Guidance: Bracken Management. Available at: https://www.nature.scot/sites/default/files/2024-06/introduction-bracken.pdf (Accessed: 10 February 2026).
Forestry Commission (2021) Export wood, wood products and bark from Great Britain: How to export certain types of regulated wood, wood products and bark from Great Britain to the world. Available at: https://www.gov.uk/guidance/export-wood-wood-products-and-bark-from-great-britain (Accessed: 16 February 2026).
Forest Research (2025) Forestry Statistics. Available at: https://www.forestresearch.gov.uk/tools-and-resources/statistics/publications/forestry-statistics/forestry-statistics-2025/ (Accessed: 11 February 2026).
Fratini, C., Anselmi, S., and Renzi, M. (2025) Dredge Sediment as an Opportunity: A Comprehensive and Updated Review of Beneficial Uses in Marine, River, and Lagoon Eco-Systems, Environments, 12(6), 200. DOI: https://doi.org/10.3390/environments12060200
Frederickson-Matika, D., Schiffer-Forsyth, K., Hedley, P.E., Cock, P.J.A. and Green, S. (2024) Detection of oomycete pathogens in UK peat-free growing media and implications for plant health, Journal of Horticultural Science and Biotechnology, 100(2), pp. 272-283.
Gabryś, T. and Fryczkowska, B. (2022) Using Sheep’s Wool as an Additive to the Growing Medium and its Impact on Plant Development on the Example of Chlorophytum comosum, Journal of Ecological Engineering, 23(6), pp. 205-212.
Gahlert, F., Prager, A., Schulz, J., Krebs, M., Gaudig, G. and Joosten, H. (2012) Sphagnum Propagules from Spores: First Experiences, in Proceedings of the 14th International Peat Congress. Stockholm: International Peat Society. Available at: https://www.moorwissen.de/files/doc/publikationen/Gahlert%20et%20al.%20%282012%29%20Sphagnum%20propagules%20from%20spores.pdf (Accessed: 9 October 2025).
Gardner, M., Reed, S., and Davidson, M. (2020) Assessment of Worker Exposure to Occupational Organic Dust in a Hemp Processing Facility, Annals of Work Exposures and Health, 64(7), pp. 745-753.
Ganesan, K., Rajagopal, K., and Thangavel, R. (2008) Rice husk ash blended cement: Assessment of optimal level of replacement for strength and permeability properties of concrete, Construction and Building Materials, 22(8), pp. 1675-1683.
Gaudig, G., Fengler, F., Krebs, M., Prager, A., Schulz, J., Wichmann, S., & Joosten, H. (2014) Sphagnum Farming in Germany – a Review of Progress, Mires and Peat, 13, 08. DOI: https://doi.org/10.19189/001c.129422
Gaudig, G., Krebs, M., Prager, A., and Wichmann, S. (2017) Sphagnum farming From Species Selection to the Production of Growing Media: A Review, Mires and Peat, 20, Article 13. DOI: https://doi.org/10.19189/MaP.2018.OMB.340
Gitea, M.A., Borza, I.M., Domuta, C.G., Gitea, D., Rosan, C.A., Vicas, S.I. and Pasca, M.B. (2024) A Sustainable Approach Based on Sheep Wool Mulch and soil Conditioner for Prunus domestica (Stanley Variety) Trees Aimed at Increasing Fruit Quality and Productivity in Drought Conditions, Sustainability, 16(17), 7287. DOI: https://doi.org/10.3390/su16177287
Godwin, R.J., White, D.R., Dickin, E.T., Kaczorowska-Dolowy, M., Millington, W.A., Pope, E.K. and Misiewicz, P.A. (2022) The effects of traffic management systems on the yield and economics of crops grown in deep, shallow and zero tilled sandy loam soil over eight years, Soil and Tillage Research, 223, 105465. DOI: https://doi.org/10.1016/j.still.2022.105465
Growing Kent and Medway (2025) Mushroom Crop Waste and Valorisation: The potential of mushrooms by-products for a biobased circular economy. Available at: https://www.growingkentandmedway.com/reports/ (Accessed: 31 January 2026).
Growing Media Taskforce (2022) Response to the Defra consultation: Ending the retail sale of peat in horticulture in England and Wales. Available at: https://hta.org.uk/media/jhfdycfh/growing-media-taskforce-horticultural-peat-consultation-response-2.pdf (Accessed: 16 February 2026).
Gruda, N. and Schnitzler, W.H. (2004) Suitability of wood fiber substrate for production of vegetable transplants: I. Physical properties of wood fiber substrates, Scientia Horticulturae, 100 (1-4), pp. 309-322.
Gruda, N.S. (2019) Increasing sustainability of growing media constituents, Agronomy, 9(6), 298. DOI: 0.3390/agronomy9060298
Gruda, N. and Bragg, N. (2020) Developments in alternative organic materials for growing media in soilless culture systems, in Gruda, N.S. (ed.) Advances in horticultural soilless culture. London: Burleigh Dodds/Taylor & Francis.
Gwenzi, W. (2025) Potential environmental and human health risks of biochar systems: a call for comprehensive health risk assessments, Biochar for Environmental Remediation, pp. 433-445.
Habeeb, G.A., and Mahmud, H. (2010) Study on properties of rice husk ash and its use as cement replacement material, Materials Research, 13(2), pp. 185-190.
Hashemi, F., Mogensen, L., van der Werf, H.M., Cederberg, C. and Knudsen, M.T. (2024) Organic food has lower environmental impacts per area unit and similar climate impacts per mass unit compared to conventional, Communications Earth & Environment, 5, 250. DOI: https://doi.org/10.1038/s43247-024-01415-6
Health and Safety Executive (2022) Wood Dust: Controlling the Risks. Available at: https://www.hse.gov.uk/pubns/wis23.htm (Accessed: 11 February 2026).
Herfort, S., Pflanz, K., Larsen, M-S., Mertscgun, T. and Grüneberg, H. (2023) Influence of Sheep’s Wool Vegetation Mats on the Plant Growth of Perennials, Horticulturae, 9(3), 384. DOI: https://doi.org/10.3390/horticulturae9030384
Hill, J. (2022) Wool you look at that? Sheep wool pellets as fertilizer in container-grown crops. MSc thesis, Swedish University of Agricultural Sciences. Available at: https://stud.epsilon.slu.se/17669/3/hill-j-20220413.pdf (Accessed: 8 October 2025).
Hirschler, O., Osterburg, B., Weimar, H., Glasenapp, S. and Ohmes, M.-F. (2022) Peat replacement in horticultural growing media: availability of bio-based alternatives. Thünen Working Paper 190. Available at: https://www.researchgate.net/publication/363334205_Peat_replacement_in_horticultural_growing_media_Availability_of_bio-based_alternative_materials (Accessed: 7 October 2025).
Hirschler, O. and Osterburg, B. (2025) Achieving peat-free hobby gardening for climate mitigation in Germany: Insights into prices of growing media constituents, potting soils and policy options, Resources, Conservation and Recycling, 220, 108330. DOI: https://doi.org/10.1016/j.resconrec.2025.108330
HM Government (2011) The Natural Choice: securing the value of nature. Available at: https://www.gov.uk/government/publications/the-natural-choice-securing-the-value-of-nature (Accessed: 12 March 2026).
HortiDaily (2025) British berry industry faces rising costs and retail pressures. Available at: https://www.hortidaily.com/article/9732410/british-berry-industry-faces-rising-costs-and-retail-pressures/ (Accessed: 16 February 2026).
HortNews (2025) Latest HTA grower workshop boosts learning and knowledge on peat-free. Available at: https://hortnews.com/latest-hta-grower-workshop-boosts-learning-and-knowledge-on-peat-free/ (Accessed: 16 February 2026).
Horticultural Trades Association (2022a) Growing Media Monitor Report: Trends in the composition of UK growing media supplied 2011-2022. Available at: https://hta.org.uk/growingmediamonitor (Accessed: 9 October 2025).
Horticultural Trades Association (2022b) Horticulture skills shortage to impact garden supply chain. Available at: https://hta.org.uk/news/horticulture-skills-shortage-to-impact-garden-supply-chain (Accessed: 16 February 2026).
Horticultural Trades Association (n.d.) Horticulture industry launches nationwide projects to grow customer knowledge on peat-free gardening. Available at: https://hta.org.uk/news-events-current-issues/news/horticulture-industry-launches-nationwide-projects-to-grow-customer-knowledge-on-peat-free-gardening (Accessed: 16 February 2026).
HortWeek (2025a) VIDEO: GMA chief on new growing media quality standard. Available at: https://www.hortweek.com/video-gma-chief-speaks-new-growing-media-peat-peat-free-quality-standard-gma-reforms/retail/article/1932816 (Accessed: 16 February 2026).
HortWeek (2025b) Research finds that peat-frees have considerable variability. Available at: https://www.hortweek.com/research-finds-peat-frees-considerable-variability/retail/article/1905658 (Accessed: 16 February 2026).
HortWeek (2025c) Top 100 garden centre products: EPOS data March 2025. Available at: https://www.hortweek.com/top-100-garden-centre-products-epos-data-march-2025/retail/article/1911655 (Accessed: 9 October 2025).
HortWeek (2025d) Rhododendron peat-free trial deemed a success. Available at: https://www.hortweek.com/rhododendron-peat-free-trial-deemed-success/ornamentals/article/1934146 (Accessed: 16 February 2026).
Hospido, A., Carballa, M., Moreira, M., Omil, F., Lema, J.M. and Feijoo, G. (2010) Environmental assessment of anaerobically digested sludge reuse in agriculture: potential impacts of emerging micropollutants, Water Research, 44(10), pp. 3225–3233.
Hossain, M.T., Zaman, M., Sakib, S., and Ikhtiar Mahmud, S.M. (2024) Hazard Assessment of Rice Husk Ash Generated from Rice Mills in Bangladesh and Way Forward to Overcome or Adopt the Hazards, IOP Science, 1305, 012016. DOI: 10.1088/1757-899X/1305/1/012016
House of Lords Library (2022) In Focus: The UK’s horticultural sector. Available at: https://lordslibrary.parliament.uk/the-uks-horticultural-sector/ (Accessed: 16 February 2026).
International Coconut Community (2023) Market Review of Coconut Fiber: March 2023. Available at: https://coconutcommunity.org/page-statistics/market-review/market-review-of-coconut-fiber-march-2023 (Accessed: 11 February 2026).
International Labour Organization (2024) Assessment of the realization of the fundamental right to a safe and healthy working environment in the coconut sector in Sri Lanka: Analytical Summary. Available at: https://www.ilo.org/publications/assessment-realization-fundamental-right-safe-and-healthy-working-0 (Accessed: 10 February 2026).
International Renewable Energy Agency (2024) Renewable Energy and Jobs Annual Review 2024, International Renewable Energy Agency, Abu Dhabi, and International Labour Organization, Geneva.
International Union for Conservation of Nature (2014) Briefing Note no.6: Commercial peat extraction. Available at: https://live-twt-d8-iucn.pantheonsite.io/sites/default/files/2024-03/Briefing%206%20Commercial%20peat%20extraction.pdf (Accessed: 9 October 2025).
International Union for Conservation of Nature UK Peatland Programme (2018) UK Peatland Strategy: 2018-2040. Available at: https://www.iucn-uk-peatlandprogramme.org/uk-strategy (Accessed: 10 February 2026).
International Union for Conservation of Nature and Natural Resources (2021) Issues Brief: Peatlands and Climate Change. Available at: https://iucn.org/resources/issues-brief/peatlands-and-climate-change (Accessed: 9 October 2025).
James, R.L. (2005) Fusarium populations within peat-based growing media: USDA Forest Service Nursery Coeur d’Alene, Idaho. Nursery disease notes. Northern Region, USDA Forest Service: Forest Health Protection. Available at: https://rngr.net/publications/seed-and-seedling-diseases-in-the-western-us/fusarium-populations-within-peat-based-growing-media-usda-forest-service-nursery-coeur-dalene-idaho (Accessed: 13 February 2026).
Jobin, P., Caron, J. and Rochefort, L. (2014) Developing new potting mixes with Sphagnum fibers, Canadian Journal of Soil Science, 94(5), pp. 585-593.
Johnson, T. and Di Gioia, F. (2023) Spent mushroom compost as an alternative to peat-based soilless media for greenhouse potted basil production, Acta Horticulturae, 1426, pp. 317-324.
Kaur, G. and Kander, R. (2023) The Sustainability of Industrial Hemp: A Literature Review of Its Economic, Environmental, and Social Sustainability, Sustainability, 15(8), 6457. DOI: https://doi.org/10.3390/su15086457
Kennard, B. (2020) Sustainable Uses of Bracken & Wool in the Black Mountains Area: Feasibility Study. Black Mountains Land Use Partnership: Managing Resources Sustainably in the Black Mountains Sustainable Management Scheme Project. Available at: https://www.blackmountains.wales/wp-content/uploads/2021/03/Sustainable-Use-Report.pdf (Accessed: 15 February 2026).
Kingston, P., Scagel, C., Bryla, D., and Strik, B. (2020) Influence of perlite in peat- and coir-based media on vegetative growth and mineral nutrition of highbush blueberry, HortScience, 55(5), pp. 658-663.
Kisvarga, S., Farkas, D., Boronkay, G., Neményi, A. and Orlóci, L. (2022) Effects of Biostimulants in Horticulture, with Emphasis on Ornamental Plant Production, Agronomy, 12(5), 1043. DOI: https://doi.org/10.3390/agronomy12051043
Komorowska, M., Niemiec, M., Sikora, J., Gródek-Szostak, Z., Gurgulu, H., Chowaniak, M., Atilgan, A. and Neuberger, P. (2023) Evaluation of Sheep Wool as a Substrate for Hydroponic Cucumber Cultivation, Agriculture, 13(3), 554. DOI: https://doi.org/10.3390/agriculture13030554
Koseoglu, N., Roberts, M., and Bacigalupo, A. (2021) Understanding the barriers and opportunities for eliminating peat from the growing media mixes from the perspective of different supply side stakeholders. The James Hutton Institute. Available at: https://www.hutton.ac.uk/sites/default/files/files/publications/Understanding-Barriers-Opportunities-Peat-Growing-Media-Supply-Side.pdf (Accessed: 13 October 2025).
Koseoglu, N. and Roberts, M. (2025) Supply Chain Dynamics of Moving from Peat-Based to Peat-Free Horticulture, Sustainability, 17(13), 6159. DOI: https://doi.org/10.3390/su17136159
Lavoie, J., Dunkerley, C.J., Kosatsky, T., and Dufresne, A. (2006) Exposure to aerosolized bacteria and fungi among collectors of commercial, mixed residential, recyclable and compostable waste, Science of the Total Environment, 370(1), pp. 23-28.
Legislation.gov.uk (2013) Scottish Statutory Instruments: The Animal By-Products (Enforcement) (Scotland) Regulations 2013, No. 307. Available at: https://www.legislation.gov.uk/ssi/2013/307/introduction/made (Accessed: 11 February 2026).
Lehmann, J. and Joseph, S. (2015) Biochar for Environmental Management: Science, Technology and Implementation. Second Edition. London, Routledge.
Leiber-Sauheitl, K., Bohne, H. and Böttcher, J. (2021) First Steps toward a Test Procedure to Identify Peat Substitutes for Growing Media by Means of Chemical, Physical, and Biological Material Characteristics, Horticulturae, 7, 164. DOI: 10.3390/horticulturae7070164
Li, M., Ning, W-P., Gao, T-T., Fazry, S., Othman, B.A., Najm, A.A.K., and Law, D. (2024) Rice husk ash based growing media impact on cucumber and melon growth and quality, Scientific Reports, 14, 5147. DOI: 10.1038/s41598-024-55622-4.
Litterick, A., Bell, J., Sellars, A. and Carfrae, J. (2019) Rapid Evidence Assessment of the Alternatives to Horticultural Peat in Scotland. Edinburgh: ClimateXChange. Available at: https://www.climatexchange.org.uk/projects/alternatives-to-horticultural-peat-in-scotland/ (Accessed: 6 October 2025).
Litterick, A.M., Holmes, S., Frederickson-Matika, D.E. and Green, S. (2025) How safe are peat-free growing media?, Plants, People, Planet, 7(6), pp. 1684-1699.
Lu, W., Sibley, J.L., Gilliam, C.H., Bannon, J.S. and Zhang, Y. (2006) Estimation of U.S. bark generation and implications for horticultural industries, Journal of Environmental Horticulture, 24, pp. 29-34.
Macci, C., Vannucchi, F., Peruzzi, E., Doni, S., Lucchetti, S., Waska, K., Heřmánková, M., Scodellini, R., Cincinelli, A., Nicese, F.P. and Azzini, L. (2025) A low impact sediment and green waste co-compost: can it replace peat in the nursery sector?, Environment, Development and Sustainability, 27(5), pp. 10761-10788.
Macdonald, R. (2024) Site visit notes: Beadamoss, Wright Farm Produce, 19th November 2024.
Maher, M., Prasad, M. and Raviv, M. (2008) Organic soilless media components, in Raviv, M. and Lieth, J.H. (Eds.) Soilless Culture: Theory and Practice. Amsterdam: Elsevier, pp. 459–504.
Mansour, E., Loxton, C., Elias, R.M., and Ormondroyd, G.A. (2014) Assessment of health implications related to processing and use of natural wool insulation products, Environment International, 73, pp. 402-412.
Mapline, 2026) Phase 2 grower distribution. Available at: https://app.mapline.com/map/map_5d9bcce1 (Accessed: 14 January 2026).
Marrs, R.H. and Watt, A.S. (2006) Biological flora of the British Isles: Pteridium aquilinum (Bracken), Journal of Ecology, 94(6), pp. 1179-1206.
Marrs, R.H. and Watt, A.S. (2006) Biological Flora of the British Isles: Pteridium aquilinum (L.) Kuhn, Journal of Ecology, 94(6), pp. 1272-1321.
Mattei, P., D’Acqui, L.P., Nicese, F.P., Lazzerini, G., Masciandaro, G., Macci, C., Doni, S., Sarteschi, F., Giagnoni, L., and Renella, G. (2017) Use of phytoremediated sediments dredged in maritime port as plant nursery growing media, Journal of Environmental Management, 186, pp. 225–232.
McGrann, G.R.D., Feehan, L., Duff, J., Saubeau, G., Ormiston, N., and McHugh, R.C. (2020) Evaluation of alternative approaches for production of healthy PBTC mini tubers: Final Report. Available at: https://horticulture.ahdb.org.uk/11103401-approaches-for-the-production-of-healthy-mini-tubers (Accessed: 16 February 2026).
Medina, E., Paredes, C., Pérez-Murcia, M.D., Bustamante, M.A. and Moral, R. (2009) Spent mushroom substrates as component of growing media for germination and growth of horticultural plants, Bioresource Technology, 100(18), pp. 4227–4232.
Messori, F., Carr, S., Barker, J., and Carpenter, A. (n.d.) Evidence Review on the Use of Wool in Peatland Restoration [Draft]. Available at: https://www.dalefootcomposts.co.uk/research-development.aspx (Accessed: 11 February 2026).
Miserez, A., Pauwels, E., Schamp, B., Reubens, B., De Nolf, W., De Nolf, L., Nelissen, V., Grunert, O., Ceusters, J., and Vancampenhout, K. (2019) The potential of management residues from heathland and forest as a growing medium constituent and possible peat alternative for containerized ornamentals, Acta Horticulturae, 1266, DOI: 10.17660/ActaHortic.2019.1266.55
Molde, C. (2011) Controlling exposure to dust and bioaerosols on farms growing common commercial mushrooms (Agaricus bisporus): Horticulture Development Company – Factsheet 02/11. Available at: https://archive.ahdb.org.uk/knowledge-library/controlling-exposure-to-dust-and-bioaerosols-on-farms-growing-common-commercial-mushrooms-agaricus-bisporus (Accessed: 11 February 2026).
Moorland Management (2024) Moorland Management Best Practice: Heather cutting in upland and moorland environments. Available at: https://www.moorlandmanagement.co.uk/guidance/heather-cutting (Accessed: 10 February 2026).
Müller, A., Schmidt, J., Maiberg, V., Gehring, O., and Schikora, A. (2025) Microbial communities and substrate properties influence the fate of a human pathogen in horticultural substrates with different peat content, Frontiers in Horticulture, 4. DOI: https://doi.org/10.3389/fhort.2025.1568055
Mwangi, R.W., Mustafa, M., Kappel, N., Csambalik, L., Szabó, A. (2024) Practical applications of spent mushroom compost in cultivation and disease control of selected vegetables species, Journal of Material Cycles and Waste Management, 26, pp. 1918-1933.
National Institute for Agricultural Botany (2024) Alternatives to peat for horticulture. Available at: https://www.niab.com/news-views/blogs/alternatives-peat-horticulture Accessed: 10 October 2025).
Natural Resources Wales (2025) End of waste: Compost produced from source-segregated biodegradable waste – Guidance Note. Available at: https://www.r-e-a.net/wp-content/uploads/2025/12/GN022_End-of-waste_Compost-produced-from-source-segregated-biodegradable-waste.pdf (Accessed: 23 January 2026).
NatureScot (2015) Scotland’s National Peatland Plan: working for our future. Available at: https://www.nature.scot/doc/scotlands-national-peatland-plan-working-our-future (Accessed: 7 October 2025).
Neacsu, M., Russell. W., and Duncan, S. (2025) Hemp-based Growing Media as a Sustainable Replacement of Coir for Scottish Soft Fruit Industry: Policy Brief. Available at: https://www.abdn.ac.uk/media/site/rowett/documents/Rowett-Institute-Policy-Brief-2025-Hemp-based-Growing-Media-as-a-Sustainable-Replacement-of-Coir-for-Scottish-Soft-Fruit-Industry.pdf (Accessed: 9 February 2026).
Negrini, G., Ferrante, A. and Pagano, M. (2020) Performance of greenhouse tomatoes in coir-based substrates compared with peat, Acta Horticulturae, 1273, pp. 87-94.
Nemati, M.R., Fortin, J.-P., Beaulieu, C., Lemke, R., Thériault, G. and Simard, R.R. (2014) Potential use of biochar in growing media, Vadose Zone Journal, 13(10). DOI: 10.2136/vzj2014.06.0074
Nerlich, A., Karlowsky, S., Schwarz, D., Förster, N. and Dannehl, D. (2022) Soilless Tomato Production: Effects of Hemp Fiber and Rock Wool Growing Media on Yield, Secondary Metabolites, Substrate Characteristics and Greenhouse Gas Emissions Horticulturae, 8, 272. DOI: 10.3390/horticulturae8030272
National Farmers’ Union (2023) UK Horticulture Growth Strategy. Available at: https://www.nfuonline.com/news/nfu-horticulture-strategy/ (Accessed: 16 February 2026).
Nicese, F.P., Azzini, L., Lucchetti, S., Macci, C., Vannucchi, F., Masciandari, G., Luca Pantani, O., Arfaioli, P., Imran Pathan, S., Pietramellara, G. and Manzini, J. (2024), Co-Composting of Green Waste and Dredged Sediments Can Reduce the Environmental Impact of Potted Nursery without Affecting Plant Growth, Applied Sciences, 14(4), 1538. DOI: https://doi.org/10.3390/app14041538
Nilsson, M. (2022) Biochar and hemp as peat substitutes in organic growing media: effects on nutrient availability and uptake. MSc thesis, Swedish University of Agricultural Sciences. Available at: http://urn.kb.se/resolve?urn=urn:nbn:se:slu:epsilon-s-18348 (Accessed: 24 January 2026).
Noble, R. and Roberts, S.J. (2003) A Review of the literature on eradication of plant pathogens and nematodes during composting, disease suppression and detection of plant pathogens in compost. Banbury, UK, The Waste and Resources Action Plan. Available at: https://www.r-e-a.net/wp-content/uploads/2023/05/LitReviewPlantPathogensNematodes.pdf (Accessed: 16 February 2026).
Noble, R. and Roberts, S.J. (2004) Eradication of plant pathogens and nematodes during composting: a review, Plant Pathology, 53(5), pp. 548–568.
Office for the Internal Market (2023) Impact of a proposed ban of the sale of horticultural peat in England. Available at: https://www.gov.uk/government/publications/report-impact-of-a-proposed-ban-of-the-sale-of-horticultural-peat-in-england-on-the-effective-operation-of-the-uk-internal-market/impact-of-a-proposed-ban-of-the-sale-of-horticultural-peat-in-england (Accessed: 9 October 2025).
Omar, N.F., Kasim, N.N., Zainal Abidin, S.Z., Ali, S.N., and Abdul, A. (2023) The impact of rice husk ash (RHA) as soilless growing medium on Sawi Caixin Giant (Brassica parachinensis) growth performance, International Journal of Innovation and Industrial Revolution, 5(13), pp. 49-64.
Othman, N.Z., Sarjuni, M.N.H., Rosli, M.A., Nadri, M.H., Yeng, L.H., Ying, O.P., and Sarmidi, M.R. (2020) Spent Mushroom Substrate as Biofertilizer for Agriculture Application, Valorisation of Agro-industrial Residues – Volume I: Biological Approaches, pp. 37-57.
Oxford Economics (2024) The Economic Impact of Environmental Horticulture and Landscaping in the UK. Available at: https://www.oxfordeconomics.com/resource/the-economic-impact-of-environmental-horticulture-and-landscaping-in-the-uk/ (Accessed: 27 October 2025).
Pakeman, R.J. (2023) A Rapid Evidence Review of the Implications of Not Controlling Bracken with Asulam in Scotland. Aberdeen: James Hutton Institute. DOI: 10.5281/zenodo.8011214
Pathmeswaran, P., Lokupitiya, E., Waidyarathne, K.P., and Lokupitiya, R.S. (2018) Impact of extreme weather events on coconut productivity in three climatic zones of Sri Lanka, European Journal of Agronomy, 96, pp. 47-53.
Peano, L., Loerincik, Y., Margni, M., and Rossi, V. (2012) Comparative life cycle assessment of horticultural growing media based on peat and other growing media constituents: Final report. Quantis, Switzerland.
Pearson, C., Littlewood, E., Douglas, P., Robertson, S., Gant, T.W., and Hansell, A.L. (2015) Exposures and health outcomes in relation to bioaerosol emissions from composting facilities: a systematic review of occupational and community studies, Journal of Toxicology and Environmental Health, Part B, 18(1), pp. 43-69.
Peat-free Partnership (n.d.) Legislation timeline: The path to peat-free – a timeline of legislation to end peat sales in the UK. Available at: https://peatfreepartnership.org.uk/who-we-are/legislation-timeline/ (Accessed: 20 February 2026).
Pitman, R.M. and Webber, J. (2013) The character of composted bracken and its potential as a peat replacement medium, European Journal of Horticultural Science, 78(4), pp. 145-152.
Poudel, P., Duenas, A.E.K. and Di Gioia, F. (2023) Organic waste compost and spent mushroom compost as potential growing media, Frontiers in Plant Science, 14, 1229157. DOI: https://doi.org/10.3389/fpls.2023.1229157
Prasad, R., Redmile-Gordon, M., Gush, M.B. and Griffiths, A. (2024) Characterisation of peat-free growing media, Acta Horticulturae, 1389, pp. 153-162.
Prasara-A, J., and Gheewala, S.H. (2017) Sustainable utilization of rice husk ash from power plants: A review, Journal of Cleaner Production, 167, pp. 1020-1028.
Rangel-Buitrago, N., Rizzo, A., Neal, W.J., and Mastronuzzi, G. (2023) Sediment pollution in coastal and marine environments, Marine Pollution Bulletin, 192. DOI: https://doi.org/10.1016/j.marpolbul.2023.115023
Raviv, M. (2013) Composts in Growing Media: What’s New and What’s Next? Acta Horticulturae, 982, pp. 39-52.
Reidy, S. (2025) Rabobank: Fertilizer prices trending higher in 2025. Available at: https://www.world-grain.com/articles/21317-rabobank-fertilizer-prices-trending-higher-in-2025? (Accessed: 16 February 2026).
Renella, G. (2021) Recycling and Reuse of Sediments in Agriculture: Where Is the Problem? Sustainability, 13(4), 1648. DOI: https://doi.org/10.3390/su13041648
Renewable Energy Association (2021). A future built on renewable energy and clean technology. London: Renewable Energy Association. Available at: https://www.r-e-a.net/wp-content/uploads/2021/02/REA_Strategy_Exec_Summary_February_2021.pdf (Accessed: 7 October 2025).
Responsible Sourcing Scheme (n.d.) Responsible Sourcing Criteria. Available at: https://responsiblesourcing.org.uk/responsible-sourcing-criteria/ (Accessed: 7 February 2026).
Restrepo, A.P., García, J.G., Moral, R., Vidal, F., Pérez-Murcia, M.D., Bustamante, M.A., and Paredes, C. (2013) A comparative cost analysis for using compost derived from anaerobic digestion as a peat substitute in a commercial plant nursery, Ciencia e Investigacion Agraria, 40(2), pp. 253-264.
Riddell, I. and Bowsher-Gibbs, J. (2025) Advancing a sustainable Scottish supply chain for industrial hemp and co-products. Glasgow: Scottish Enterprise. Available at: https://www.scottish-enterprise.com/media/jhlh3wub/advancing-a-sustainable-scottish-supply-chain-for-industrial-hemp-and-co-products.pdf (Accessed: 13 October 2025).
Robertson, S., Douglas, P., Jarvis, D., and Marczylo, E. (2019) Bioaerosol exposure from composting facilities and health outcomes in workers and in the community: A systematic review update, International Journal of Hygiene and Environmental Health, 222(3), pp. 364-386.
Robroek, B.J.M., Jassey, V.E.J., Payne, R.J., MartÍ, M., Bragazza, L., Bleeker, A., Buttler, A., Caporn, S.J.M., Dise, N.B., Kattage, J., Zajac, K., Svensson, B.H., van Ruijven, J. and Verhoeven, J.T.A. (2017) Taxonomic and functional turnover are decoupled in European peat bogs, Nature Communications, 8, 1161. DOI: https://doi.org/10.1038/s41467-017-01350-5.
Royal Horticultural Society (2023) Industrial Transition to Peat-Free Survey 2023 Report. Available at: https://www.rhs.org.uk/science/pdf/peat-free-survey-2023-report.pdf. (Accessed: 25 October 2025).
Royal Horticultural Society (2024) RHS Science reveals peat-free doesn’t need additional water. Available at: https://www.rhs.org.uk/science/articles/peat-free-irrigation (Accessed: 16 February 2026).
Royal Horticultural Society (n.d.) The RHS Transition to Peat-Free Fellowship. Available at: https://www.rhs.org.uk/science/transition-to-peat-free (Accessed: 20 February 2026).
Ryans, F., Lennartsson-Turner, M., Schmutz, U., Faedo, L., Conroy, J., Foster, G., and Collins, R. (2023) Design and evaluation of peat-free blocking media. Available at: https://www.coventry.ac.uk/research/research-directories/current-projects/2023/design-and-evaluation-of-peat-free-blocking-media/ (Accessed: 16 February 2026).
Sahu, N., Parida, C. and Mishra, J. (2019) Study on health hazards of workers in coir industry, The Pharma Innovation Journal, 8(6), pp. 28-30.
Sax, M.S., and Scharenbroch, B. (2017) Assessing Alternative Organic Amendments as Horticultural Substrates for Growing Trees in Containers, Journal of Environmental Horticulture, 35 (2), pp. 66-78.
Scagel, C.F. (2003) Growth and Nutrient Use of Ericaceous Plants Grown in Media Amended with Sphagnum Moss Peat or Coir Dust, HortScience, 38(1), pp. 46-54.
Scarlat, N., Dallemand, J.-F. and Fahl, F. (2018) Biogas: Developments and perspectives in Europe, Renewable Energy: An International Journal, 129, pp. 457-472.
Schmilewski, G. (2008) The role of peat in assuring the quality of growing media, Mires and Peat, 3(2), pp. 1-8.
Schmilewski, G. (2014) Producing growing media responsibly to help sustain horticulture, Acta Horticulturae, 1034, pp. 299-306.
Schmilewski, G. and Nordzieke, B. (2019) Researched, developed and commercialized: GreenFiber, Acta Horticulturae, 1266, pp. 361-368.
Scotland’s Environment (2023) Soils: What are we doing? Available at: Soils | Scotland’s environment web (Accessed: 25 January 2026).
Scotland’s Rural College (2020) Alternative crop factsheet: Mushrooms – April 2020. Available at: https://www.sruc.ac.uk/media/bl0pf5dr/sac_mushroom-factsheet-v1-0.pdf (Accessed: 23 January 2026).
Scotland’s Soils (2024) National soil map of Scotland. Available at: https://soils.environment.gov.scot/maps/soil-maps/national-soil-map-of-scotland/ (Accessed: 25 January 2026).
Scottish Environment Protection Agency (2025a) WAS-G-DEF-06: End-of-waste criteria for compost. Available at: https://beta.sepa.scot/regulation/authorisations-and-compliance/easr-authorisations/waste-activities/anaerobic-digestion-and-composting/composting-in-an-open-system-less-than-or-equal-to-500-tonnes/ (Accessed: 23 January 2026).
Scottish Environment Protection Agency (n.d.) Dredging authorisation guidance. Available at: https://beta.sepa.scot/topics/water/dredging/dredging-authorisation-guidance/ (Accessed: 23 January 2026).
Scottish Environment Protection Agency (2025b) Waste from all sources generated and managed 2023: An Official Statistics Publication for Scotland. Available at: https://data.gov.scot/sepa/waste/wfas.html (Accessed: 11 February 2026).
Scottish Forestry (2024) Economic Impact of Forest Based Activities in Scotland. Available at: https://www.forestry.gov.scot/sites/default/files/pub-documents/Economic-impact-of-forest-based-activities-in-scotland-2024.pdf (Accessed: 15 February 2026).
Scottish Forestry (2025) Markets for Scottish Timber. Available at: https://www.forestry.gov.scot/markets-scottish-timber (Accessed: 11 February 2026).
Scottish Government (2009) The Scottish Soil Framework. Available at: https://www.gov.scot/publications/scottish-soil-framework/ (Accessed: 2 February 2026).
Scottish Government (2021) Programme for Government 2021 to 2022. Available at: https://www.gov.scot/publications/fairer-greener-scotland-programme-government-2021-22/pages/2/ (Accessed 21 October 2025).
Scottish Government (2023a) National Planning Framework 4. Available at: https://www.gov.scot/publications/national-planning-framework-4/ (Accessed: 7 October 2025).
Scottish Government (2023b) Ending the sale of peat in Scotland: consultation analysis. Available at: https://www.gov.scot/publications/ending-sale-peat-scotland-analysis-consultation-responses/ (Accessed 7 October 2025).
Scottish Government (2025a) Peatland ACTION five year partnership plan 2025 – 2030. Available at: https://www.gov.scot/publications/peatland-action-five-year-partnership-plan-2025-2030/ (Accessed: 26 January 2026).
Scottish Government (2025b) Total income from farming estimates 2018–2024. Available at: https://www.gov.scot/publications/total-income-from-farming-estimates-2018-2024/ (Accessed: 7 October 2025).
Scottish Government (n.d.) Plant Health: Potatoes. Available at: https://www.gov.scot/policies/plants/potatoes/ (Accessed: 16 February 2026).
Sdao, A.E., Gruda, N.S. and De Lucia, B. (2025) Beyond Peat: Wood Fiber and Two Novel Organic Byproducts as Growing Media – A Systematic Review, Plants, 14(13), 1945. DOI: https://doi.org/10.3390/plants14131945
Shackley, S., Hammond, J., Gaunt, J. and Ibarrola, R. (2014) The feasibility and costs of biochar deployment in the UK, Carbon Management, 2(3), pp. 335-356.
Smith, J.L., and Lee, K. (2003) Soil as a Source of Dust and Implications for Human Health, Advances in Agronomy, 80, pp. 1-32.
Solbraa, K. (1979) Composting of bark: Different bark qualities and their uses in plant production, Meddeleser fra Norsk Institutt for Skogforskning, 34 (13), pp. 281-333.
Sonneveld, C. and Voogt, W. (2009) Plant nutrition of greenhouse crops. First edition. Dordrecht: Springer.
Snellings, R., Cizer, O., Horckmans, L., Durdziński, P.T., Dierckx, P., Neilson, P., Van Balen, K. and Vandewalle, L. (2016) Properties and pozzolanic reactivity of flash calcined dredging sediments, Applied Clay Science, 129, pp. 35-39.
Sradnick, A., Werner, M. and Körner, O. (2023) Make a choice: A rapid strategy for minimizing peat in horticultural press pots substrates using a constrained mixture design and surface response approach, PLOS ONE, 18(7), e0289320. DOI: https://doi.org/10.1371/journal.pone.0289320.
Steiner, C. and Harttung, T. (2014) Biochar as growing media additive and peat substitute, Solid Earth, 5, pp. 995-999.
Stelte, W., Reddy, N., Barsberg, S., and Sanadi, A. (2022) Coir from coconut processing waste as a raw material for applications beyond traditional uses, BioResources, 18(1), pp. 2187-2212.
Stichnothe, H. (2022) Life cycle assessment of peat for growing media and evaluation of the suitability of using the Product Environmental Footprint methodology for peat, The International Journal of Life Cycle Assessment, 27(12), pp. 1270-1282.
Sulaiman (2025) ‘Rice Husk, Rice Husk Ash, and Their Applications’, in Jawaid, M., and Parmar, B. (Eds.) Rice Husk Biomass: Processing, Properties and Applications. Singapore, Springer, pp. 43-54.
Tambone, F., Scaglia, B., D’Imporzano, G., Schievano, A., Genevini, P. and Adani, F. (2010) Assessing amendment and fertilizing properties of digestates from anaerobic digestion through a comparative study with digested sludge and compost, Chemosphere, 81(5), pp. 577-583.
Thomson, S. (2024) The Estimated Economic Contribution of Scotland’s Seed and Ware Potato Sectors: Version 1. Available at: https://ruralexchange.scot/blog/novel-insights-on-the-economic-contribution-of-the-potato-sector-29/ (Accessed: 12 March 2026).
Toboso-Chavero, S., Madrid-López, C., Villalba, G., Gabarrell Durany, X., Hückstädt, A.B., Finkbeiner, M. and Lehmann, A. (2021) Environmental and social life cycle assessment of growing media for urban rooftop farming, The International Journal of Life Cycle Assessment, 26(10), pp. 2085-2102.
Tozzi, F., Del Bubba, M., Petrucci, W.A., Pecchioli, S., Macci, C., Hernández García, F., Martínez Nicolás, J.J. and Giordani, E. (2020) Use of a remediated dredged marine sediment as a substrate for food crop cultivation: Sediment characterization and assessment of fruit safety and quality using strawberry as a model species of contamination transfer, Chemosphere, 238, 124651. DOI: https://doi.org/10.1016/j.chemosphere.2019.124651
The Wildlife Trusts (2022) Devastating climate impact of using peat in UK horticulture revealed. Available at: https://www.wildlifetrusts.org/news/devastating-using-peat-uk-horticulture (Accessed: 7 October 2025).
UK Centre for Ecology and Hydrology (n.d.) Peatlands factsheet. Available at: https://www.ceh.ac.uk/sites/default/files/Peatland%20factsheet.pdf (Accessed: 21 October 2025).
UK Parliament (2025) Horticultural Peat (Prohibition of Sale) Bill. Available at: https://bills.parliament.uk/bills/3886 (Accessed: 7 October 2025).
United Nations Environment Programme (2022) Global assessment reveals huge potential of peatlands as a climate solution. Available at: https://www.unep.org/news-and-stories/press-release/global-assessment-reveals-huge-potential-peatlands-climate-solution (Accessed: 7 October 2025).
Vandecasteele, B., Muylle, H., De Windt, I., Van Acker, J., Ameloot, N., Moreaux, K. and Debode, J. (2018) Plant fibres for renewable growing media: reducing N drawdown and pathogens via defibration, acidification or biocontrol fungi, Journal of Cleaner Production, 203, pp. 1143–1154.
Vandecasteele, B., Hofkens, M., De Zaeytijd, J. and Melis, P. (2023) Towards environmentally sustainable growing media for strawberry cultivation: Effect of biochar and fertigation on circular use of nutrients, Agricultural Water Management, 284. DOI: 10.1016/j.agwat.2023.108361
Viancelli, A., Comelli, C., Maria Nogara, C., De Araujo, V., and Michelon, W. (2024) The impact of pesticides: Assessing residue persistence, environmental contamination, and human health risks, Journal of Toxicological Studies, 2(2), 1667. DOI: https://doi.org/10.59400/jts.v2i2.1667
Victor, L. (2020) AD and Composting Industry Market Survey Report 2020 Final Version. Available at: https://www.r-e-a.net/resources/wrap-industry-survey-report-anaerobic-digestion-and-composting/ (Accessed: 11 February 2026).
Walker, R. and Litterick, A. (2024) Field lab: Eliminating peat and plastic from propagation using growing media blocks – Final report. Available at: https://www.innovativefarmers.org/media/ioqdpmpm/if-final-report-growblocks-2024-v2-final.pdf (Accessed: 14 October 2025).
Waller, P. (2012) The rise and fall of peat in UK horticulture. In: Peatlands in Balance – Proceedings of the 14th International Peat Congress, 2012, Stockholm, Sweden. International Peatland Society. Available at: https://peatlands.org/document/the-rise-and-fall-of-peat-in-uk-horticulture/ (Accessed 9 October 2025).
Waste Industry Safety and Health Forum (2023) Bioaerosols in waste and recycling: Information Document. Available at: https://www.wishforum.org.uk/wp-content/uploads/2023/11/INFO-23-Bioaerosols-in-waste-and-recycling-V1-Oct-2023.pdf (Accessed: 8 February 2026).
Waste and Resources Action Programme (2016) Compost and digestate quality for horticultural markets. Banbury: Waste & Resources Action Programme. Available at: https://wrap.org.uk/resources/report/digestate-and-compost-agriculture-dc-agri-project-reports (Accessed: 7 October 2025).
Waste and Resources Action Programme (2017) BSI PAS 110: Producing Quality Anaerobic Digestate. Available at: https://www.wrap.ngo/resources/guide/bsi-pas-110-producing-quality-anaerobic-digestate#download-file (Accessed: 11 February 2026).
White, E. V., Gatersleben, B., Wyles, K. J., Murrell, G., Golding, S. E., Scarles, C., and Xu, S. (2021) Gardens and wellbeing during the first UK Covid-19 lockdown (Research Report No. 1). Available at: https://www.surrey.ac.uk/sites/default/files/2021-07/garden-report.pdf (Accessed: 8 October 2025).
Wichtmann, W., Schröder, C., and Joosten, H. (Eds.) (2016) Paludiculture – productive use of wet peatlands: Climate protection – biodiversity – regional economic benefits. Stuttgart, Germany, Schweizerbart Science Publishers.
Wissner, P., Bohne, H., Heumann, S., and Emmel, M. (2017) Plant biomass from heathland management: a possible peat substitute? Acta Horticulturae, 1168, DOI: 10.17660/ActaHortic.2017.1168.4
Wood Recyclers’ Association (2025) UK waste wood market remained buoyant in 2024 with over 96% of material processed. Available at: https://woodrecyclers.org/uk-waste-wood-market-remained-buoyant-in-2024-with-over-96-of-material-processed/ (Accessed: 11 February 2026).
Woznicki, T., Kusnierek, K., Vandecasteele, B. and Sønsteby, A. (2024) Reuse of coir, peat and wood fibre in strawberry production, Frontiers in Plant Science, 14, 1307240. DOI: https://doi.org/10.3389/fpls.2023.1307240
Yadav, T.C., Singh, Y.P., Yadav, S., Singh, A. and Patle, T. (2023) Spatial variability in soil properties and site-specific management delineation using fuzzy clustering, International Journal of Plant & Soil Science, 35(6), pp. 49-78.
Yin, M., Li, X., Liu, Q. and Tang, F. (2022) Rice husk ash addition to acid red soil improves the soil property and cotton seedling growth, Scientific Reports, 12, 1704. DOI: 10.1038/s41598-022-05199-7
How to cite this publication:
Macdonald, R, Hinchcliffe, W, Elliot, M, Everett, R, Hinchcliffe, E (2025) ‘ Transition to peat-free horticulture in Scotland’, ClimateXChange. DOI https://doi.org/10.7488/era/7009
© The University of Edinburgh, 2026
Prepared by Royal Botanic Garden Edinburgh, Scotland’s Rural College and International Union for the Conservation of Nature on behalf of ClimateXChange, The University of Edinburgh. All rights reserved.
While every effort is made to ensure the information in this report is accurate as at the date of the report, no legal responsibility is accepted for any errors, omissions or misleading statements. The views expressed represent those of the author(s), and do not necessarily represent those of the host institutions or funders.
This work was supported by the Rural and Environment Science and Analytical Services Division of the Scottish Government (CoE – CXC).
ClimateXChange
Edinburgh Climate Change Institute
High School Yards
Edinburgh EH1 1LZ
+44 (0) 131 651 4783
The appendices of this report are available in PDF from the link below. If you require them in an alternative format, please contact info@climatexchange.org.uk or 0131 651 4783.
Scotland’s peatlands store large quantities of carbon and play a critical role in climate regulation and biodiversity conservation. However, extracting peat for horticultural growing media damages these ecosystems and releases greenhouse gas emissions. The Scottish Government has committed to ending the use of peat in horticulture while recognising the economic importance of the sector.
This report assesses the feasibility of transitioning to peat-free growing media in Scottish horticulture. It draws on published studies, industry reports and extensive engagement with the sector, including workshops and interviews with growers, growing media manufacturers, retailers and researchers. Stakeholders provided practical insight into how peat-free systems are working in practice, the challenges businesses face, and the solutions currently being trialled across the industry.
Key findings
- Peat-free horticulture in Scotland is achievable. A range of alternative growing media are already supporting commercial production across several horticultural systems.
- The main challenge is coordinating the transition to align infrastructure, standards, supply chains and technical practice.
- Progress has already been made in several parts of the sector. Retail growing media are now largely peat-free, and many ornamental and forestry producers have significantly reduced peat use.
- Some production systems face greater technical constraints. Crops that favour acidic soil, potato mini-tuber production and propagation systems require to assess the viability of alternatives.
- Cost, supply chain capacity and consistency of materials remain key barriers.
- With coordinated implementation and realistic timelines, Scotland has the resources and industry capability needed to support a peat-free transition.
This research indicates that the principal challenge for Scotland’s peat-free transition is not the absence of viable alternatives or willingness within the sector, but the coordination of infrastructure, standards, supply chains and technical practice.
With coordinated implementation, investment in processing infrastructure and continued collaboration across the horticulture sector, Scotland can phase out horticultural peat while maintaining productive and resilient growing systems.
The pace of change will depend on a combination of clear policy direction, realistic transition timelines and continued support for infrastructure, standards development and collaborative trials.
For further information, please read the report.
The main report is available as PDF and in HTML. The appendices are available as a separate PDF. If you require the report or appendices in an alternative format, such as a Word document, please contact info@climatexchange.org.uk or 0131 651 4783.
Minimising peat excavation is crucial to avoid carbon emissions, protect biodiversity and ensure downstream water quality. Building on peatlands inevitably results in the excavation and disturbance of peat. To inform how best to balance the benefits of renewable energy projects with the requirement to protect and restore peatland habitats, there is a need to gather evidence on the impacts and opportunities regarding the reuse of excavated peat.
This project investigates the opportunities, impacts, and challenges associated with the reuse of excavated peat from windfarm construction sites. From a review of published evidence, stakeholder discussions and site visits to peatland wind farms, the researchers have proposed identified three main issues and made three recommendations.
Issues
Issue 1: Avoidance of peat excavation: As a critical first step to protect peatland, biodiversity, and maintain water cycle connectivity, peat excavation must be minimised.
Issue 2: Preparation and planning issues: Site surveys often lack the requisite detail to effectively avoid deep peat areas during construction leading to problems with removal of greater volumes of peat than expected that require reuse.
Issue 3: Carbon storage: Accurate carbon calculations are needed to fully understand the impact of the wind farm. However, this study found that more peat is often excavated than planned, highlighting the need for greater accuracy in carbon excavation measurements.
Recommendations
Recommendation 1: The development of guidance for site planning and peat reuse hierarchy and principles. The guidance should aim to avoid or minimise peat excavation wherever possible and identify locally relevant reuse options. And use of hierarchy and guiding pronicples of peat reuse should aim to maximise the positive environmental outcomes.
Recommendation 2: Create an environmental outcomes framework to ensure a balanced approach to peat reuse. The framework should prioritise minimising carbon loss, promoting positive biodiversity outcomes and ensuring downstream water quality.
Recommendation 3: Enhance monitoring of environmental outcomes from reuse of peat to improve and inform the reuse hierarchy and implementation of best practice techniques. This should include:
- Monitoring accurate peat excavation volumes at the end of construction to build a dataset to be used within the sector for more accurate carbon calculations and reuse planning.
- Regular monitoring of wetness of the peat, carbon fluxes and vegetation surveys to understand the broader environmental impact of peat reuse.
- Greater data sharing and collaboration between energy companies and the academic community to refine the reuse hierarchy and best practice in the field.
For further information, please read the report.
If you require the report in an alternative format, such as a Word document, please contact info@climatexchange.org.uk or 0131 651 4783.
Research completed: January 2025
DOI: http://dx.doi.org/10.7488/era/6333
Executive summary
Minimising peat excavation is crucial in order to avoid carbon emissions, protect biodiversity and ensure downstream water quality. Built development on peatlands results in the excavation and disturbance of peat. In order to ensure evidence-based planning and consenting decisions there is a need to gather evidence on the impacts and opportunities regarding the reuse of excavated peat. This will help to inform how best to balance the benefits of renewable energy with the need to protect and restore peatland habitats, ensuring sustainable development practices.
This project investigates the opportunities, impacts, and challenges associated with the reuse of excavated peat from windfarm construction sites. It provides a greater understanding of the current knowledge concerning wind farm development on peatland, peat and peaty soils across Scotland. We propose a hierarchy of peat reuse options based on environmental impact and offer recommendations for data collection and monitoring to enhance the evidence base.
The research combined a review of published evidence with stakeholder engagement and site visits.
Findings
We found very little academic research specifically investigating best practice for the reuse of peat on windfarms. We therefore used stakeholder discussions and site visits to understand the current situation, what is occurring at different sites within Scotland, and likely environmental costs and benefits of different reuse options.
Key issues
Avoidance of peat excavation: Minimising peat excavation is crucial. As a critical first step of the mitigation hierarchy, different stakeholders agree the need to limit volumes to protect peatland, biodiversity, and maintain hydrological connectivity.
Preparation and planning issues: Site surveys often lack the requisite detail to effectively avoid deep peat areas during construction. It also leads to problems with planning how to reuse greater volumes of peat than expected. Additional training for construction operatives would enable them to minimise peat disturbance and maintain the excavated peat’s structure.
Carbon storage: Accurate carbon calculations are needed to fully understand the impact of the wind farm. However, this study found that more peat is often excavated than planned, highlighting the need for greater accuracy in carbon excavation measurements. Monitoring the condition of reused peat is also necessary to enable better understanding of carbon storage and other ecosystem services.
There are a range of construction activities that result in the excavation of peat, such as the construction and maintenance of roads and tracks, compounds and substations, crane pads and turbine blade laydown areas, cabling, drainage ditches and borrow pits. The main reuse methods include borrowpit reinstatement, restoration activities and landscaping. These reuse options may have varying environmental outcomes (Table 1), consideration for which needs to be part of the planning process when constructing a wind farm and planning the reuse of excavated peat within the project.
Recommendations
Recommendation 1: Guidance on excavation peat reuse
Because detailed evidence to confirm the different environmental outcomes is not available, we recommend a simple hierarchy of peat reuse options accompanied by additional guidance and requirements, which are essential for maximising environmental outcomes. We recommend this comprises:
- Recommendation 1a: Preparation and planning steps:
- Avoid / minimise peat excavation wherever possible and
- Appraise site circumstances and locally relevant potential reuse options
- Recommendation 1b: Hierarchy of peat reuse
- Recommendation 1c: Peat reuse implementation principles: to guide the site-specific choice of methods and implementation to maximise environmental outcomes.
The hierarchy is not useable as a standalone guide – it must be accompanied by the additional components – as shown in Figure 1 below.
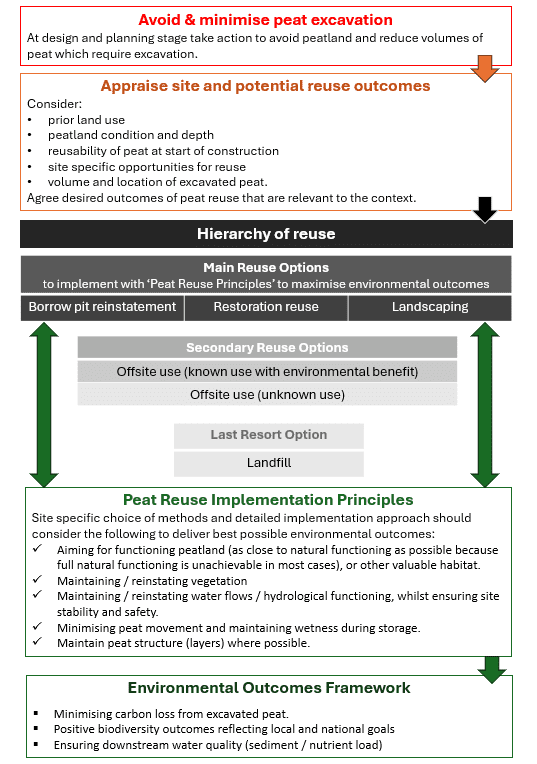
Figure 1 Guidance for Excavated Peat Reuse
Recommendation 2: Environmental outcomes framework
To ensure the multiple potential environmental benefits of peat reuse are considered, avoiding a single-issue focus.
To ensure a balanced approach to peat reuse, we recommend targeting the following environmental outcomes:
- Minimising carbon loss: Reducing carbon emissions from excavated peat.
- Positive biodiversity outcomes: Achieving biodiversity goals at both local and national levels.
- Ensuring downstream water quality: Minimising sediment and nutrient load in water bodies.
Recommendation 3: Enhanced monitoring of environmental outcomes from reuse of peat
Enhanced research and monitoring are required to improve and inform the reuse hierarchy and implementation of best practice techniques going forward:
- Post-construction assessment: Providing accurate peat excavation volumes at the end of construction to build a dataset to be used within the sector for more accurate carbon calculations and reuse planning.
- Post-construction monitoring: Regular monitoring of wetness of the peat, carbon fluxes and vegetation surveys to understand the broader environmental impact of peat reuse.
- Data sharing and collaboration: Encouraging greater data sharing and collaboration between energy companies and the academic community to refine the reuse hierarchy and best practice in the field.
Next steps and future research
These results highlight our current understanding of peat reuse methods occurring in wind farm construction in Scotland. We have highlighted which environmental issues are critical and how the reuse of peat can maintain the habitat, allowing for environmentally conscious construction techniques to take precedence.
However, a clear conclusion from the information gained during this process is that planning prior to construction is key, as well as ensuring that stakeholders work together to achieve best practice.
After these main outcomes from the hierarchy, the attention needs to focus on delivering site specific reuse. It also became apparent that although there is a lot of knowledge within the peatland and wind farm sectors, there have been limited studies collecting data to inform best practice. This needs to be encouraged to understand current research gaps and advise on the right management methods to reduce peatland degradation in the long term.
Table 1: Synthesis of reuse options and simplified overview of potential environmental outcomes (Note: this table summarises potential outcomes indicated by research during this study, but evidence is limited and site-by-site circumstances vary significantly so currently this differentiation on environmental grounds cannot be fully reflected in the recommended ‘hierarchy of peat reuse’.)
|
Method of reuse |
Carbon store |
Hydrology connectivity |
Availability |
Comment |
|---|---|---|---|---|
|
Borrow pit reinstatement |
++ Low risk of carbon loss Low chance of carbon sequestration (carbon increase) in the long term |
+ Only if well planned, with impermeable layers and outflows built in |
+++ Large storage potential, should have capacity for all excavated peat, however where there is more (or less) peat than planned may lead to issues |
Borrow pits have potential to provide an environmentally robust reuse option, however only if best practice is followed and there are contingencies in place if changes in planned volumes occur |
|
Around turbine foundations and crane pad verges |
— High risk of carbon loss through peat drying out and erosion |
– When constructed these areas will automatically have drainage channels cut. The reuse of peat here will likely be impacted by this drainage |
+ Small volume |
Use to encourage vegetation re-growth around construction areas. Often used as a way of merging the built infrastructure with the surrounding landscape |
|
Side of road/ track or “landscaping” |
– Risk of carbon loss through peat drying out and erosion, however if vegetation regrowth occurs this is less likely |
– Addition of peat should connect the reused peat with wider environment to maintain hydrology, however this depends on flow patterns and drainage channels across roads |
+ Small volume |
If vegetation regrowth occurs and there is limited bare peat this has potential to become part of the wider landscape |
|
Incorporation of peat in restoration / reinstatement projects |
+++ Low risk of carbon loss, has potential to build carbon (dependent on restoration / reuse project) |
+++ If well planned, should have hydrological connectivity with landscape |
+ Small volume |
Usually these projects are highly monitored to assess progress – useful for data gathering in the short term alongside the benefits of using excavated peat in areas that may have been degraded previously |
Glossary
|
Acrotelm |
The upper of two layers in peatland system. Acrotelmic peat consist of fresh or newly decomposed peat forming vegetation and is generally quite fibrous This layer possesses some tensile strength and depending on the height of the water table can be anoxic. |
|
Arisings |
Excavated material that is created during excavation and construction activities. |
|
Blanket Bog |
A type of peatland that is relatively rare globally, however, commonly found in Scotland, due to its cool, wet climate. Blanket bogs are characterised by a peat depth of 0.5 to 3m, situated on flat or gentle slopes and have poor drainage (see ‘Raised Bog’ below as alternative type). |
|
Borrow pit |
In windfarm development, an excavation site (or quarry) where materials like soil, gravel, or rock are dug up for use in the construction. These materials are typically used for building access roads, turbine foundations, and other infrastructure. |
|
Catotelm |
The lower of two layers in a peatland system. Catotelmic peat consist of waterlogged, highly decomposed dense organic material with low tensile strength. This layer is highly amorphous and tends to disrupt completely on excavation causing difficulty with handling and storage. |
|
Dissolved organic carbon |
Organic carbon compounds that can pass through a filter with a maximum pore size of 0.7 micrometres. |
|
EU Habitats Directive (92/43/EEC) |
A European directive for the protection and conservation of natural habitats and of wild fauna and flora which has been transposed into Scottish legislation through the Habitats regulations, amended in 2021 post EU exit. https://eur-lex.europa.eu/eli/dir/1992/43/oj/eng |
|
Peat |
Peat is an organic material that forms in cool, waterlogged conditions. It consists of partially decomposed organic matter, primarily plant material and no mineral fraction. Over time, the accumulation of this organic material creates a peat and peaty soil that are rich in carbon. |
|
Peat soil |
Also referred as organic soil, in Scotland it is defined as soil with a surface peat layer with more than 60% organic matter and of at least 50cm thickness. |
|
Peaty soil |
Organo-mineral soil which have a shallow peat layer at the surface (less than 50cm thickness) over mineral layers. |
|
Peatland |
Peatland is defined by the presence of peat soil or peaty soil types. This means that “peat-forming” vegetation is growing and actively forming peat, or it has been grown and formed peat at some point in the past. It is a type of wetland ecosystem where peat material accumulates. These areas are characterized by waterlogged conditions that slow down the decomposition of organic matter, leading to the formation of peat. Peatlands have a specific type of vegetation, are rich in biodiversity and play a crucial role in carbon storage. Peatlands can include blanket bog, upland raised bog, lowland raised bog and fens. |
|
Peatland Management Plan |
A Peatland Management Plan used in development projects on peat typically includes several key components to ensure the sustainable use and conservation of peatland ecosystems. The plan describes baseline peat conditions, detail on excavation and reuse volumes and potential impact, how the peat will be handled, stored, or reused once extracted. This is an integral part of consent conditions. |
|
Piled foundations |
Deep foundations that use long, thin columns (piles) driven or drilled into the ground to support wind turbine structures. These foundations are essential for ensuring stability, especially in areas with weak or variable soil conditions and high-water tables. Also reduce the volume of peat needed to be excavated. |
|
Priority peatland habitat |
Peatland habitats can be divided into four broad classes (blanket bog, upland raised bog, lowland raised bog and fen), depending on the types of plants that formed the peat. Priority peatland habitats are sub-sets of these broad habitats which have been recognised under the Scottish Biodiversity Framework as being important to protect for their conservation and biodiversity value. |
|
Raised Bog |
A type of wetland characterized by a dome-shaped surface of peat, formed by the accumulation of partially decayed plant matter, which rises above the surrounding groundwater levels and is primarily fed by rainfall rather than groundwater. |
|
Reinstatement |
Using peat and/or peatland vegetation that has been removed or excavated during the construction of a development, often surrounding infrastructure. This form of peat use involves protecting excavated peat, and returning it to where it was taken from, in its original order (acrotelm overlying catotelm). This should aim to reinstate the hydrology of the returned material to support peatland function following best practice, although full return of function is very difficult to achieve. |
|
Restoration |
Carrying out interventions which in combination with natural processes restores the hydrological function, coverage and condition of peatland habitat vegetation, resulting in a peatland that is actively forming peat and hence sequestering carbon. Further detail will be stated in the forthcoming Scotland’s Peatland Standard. |
|
Revegetation |
Using excavated peat and/or vegetation in the surrounding construction infrastructure or for landscaping. This form of peat use will often result in revegetation but may not result in functioning peatland. Nevertheless, it can have a role in protecting the surrounding peatland conserving carbon and biodiversity providing that best practice is followed. |
Abbreviations
|
CO2 |
Carbon dioxide |
|
DOC |
Dissolved organic carbon |
|
ECoW |
Ecological Clerk of Works |
|
GHG |
Greenhouse Gas |
|
IUCN |
The International Union for Conservation of Nature |
|
ha |
Hectares |
|
HRA |
Habitats Regulations Appraisal |
|
km |
Kilometres |
|
kWh |
Kilowatt-hour |
|
m |
meters |
|
MW |
Megawatt |
|
NPF4 |
National Planning Framework |
|
PEAG |
The Scottish Government’s Peatland Expert Advisory Group |
|
PMP |
Peatland Management Plan |
|
POC |
Particulate organic carbon |
|
REA |
Rapid evidence assessment |
|
SEPA |
Scottish Environment Protection Agency |
|
WMLR |
Waste Management Licensing (Scotland) Regulations |
Introduction
Aims and scope
This project explored opportunities, impacts and challenges for the reuse of excavated peat from windfarm development sites. It is intended to inform application of National Planning Framework 4 (NPF4), regarding the development of wind farms on peatland, peat and peaty soils. It aimed to provide recommendations for a hierarchy of peat reuse options based on environmental impact along with recommendations for data collection and monitoring to continually improve and update the evidence base.
The project focused on gathering evidence of impacts and opportunities for excavated peat reuse on-site but also considered potential for positive off-site opportunities. Evidence of environmental costs and benefits in terms of emissions, peatland function, habitat, biodiversity, hydrology, stability and structure in relation to reuse practices was evaluated.
Defining ‘reuse of peat’ for this report
This report was commissioned to understand the reuse of peat on wind farm sites during the construction process. We recognise there are differing definitions of “reuse”.
Throughout the study we adopted the definition of “reuse” of peat as:
the use of peat and/or peatland vegetation that has been excavated during the construction of a wind farm.
In this context, the “reuse” of peat can involve reinstatement, revegetation or restoration processes both onsite and offsite, during the construction of a wind farm.
Research methods
A combination of research methods were used:
- A Rapid Evidence Assessment to gather and evaluate the academic literature and other relevant studies.
- Desk-based evaluation of existing wind farm developments on peatland in Scotland to understand current practices.
- Site visits to active and completed wind farm developments on peatland to observe examples of reuse practices in situ.
- Stakeholder engagement, via discussions during site visits, individual research interviews and a workshop to complement desk-research.
It was anticipated that there was limited literature available – in the absence of this, the site visits and stakeholder engagement were critical to the project. Full details of methods are provided in the Appendices.
Background
Scotland is committed to reaching net zero by 2045, how we use and manage our land is vital to achieving this, including the use of land to produce renewable energy. Balancing the benefits from renewable energy with land-based emissions and nature and biodiversity goals is vital, particularly where wind farms intersect with sensitive habitats, like peatland and on carbon-rich soils.
Globally, peatlands are the largest terrestrial carbon store estimated to hold 660 gigatonnes of carbon and 10% of non-glacial freshwater, however, only 17% of these ecosystems are protected (Austin et al., 2025). Globally, 20% of all blanket bogs are located within the UK and Ireland[1]. In Scotland alone, blanket bogs cover around 1.8 million hectares, which is 23% of the land area (Ferretto et al., 2019). Situating new wind farms in the right location is crucial. Although wind farm developments are expected to save carbon emissions by offsetting fossil energy sources (Renou-Wilson and Farrell, 2009), where wind farms are situated on peatlands, there is a risk of land-based carbon emissions, negating the reduction associated with offsetting fossil energy sources. The quality of the peatland habitat is an important factor, as areas that are already degraded and emitting carbon, could be improved through restoration of the whole environment. When applications are made for wind farm construction there are often enhancement conditions attached to these new developments leading to restoration, but some restoration may have been necessary without the wind farm construction occurring. Peatland condition categories[2] range from pristine, near natural, modified, drained and actively eroding in relation to GHG emissions and restoration potential. Historically, Scotland’s peatlands have not been protected across the whole habitat, with afforestation being prioritised up until recently. Wind farm construction in these areas, is likely to lead to environmental improvements, with stakeholders working together to reduce peatland degradation and ambitious programmes of peatland restoration being undertaken.
[1] https://www.wwt.org.uk/discover-wetlands/wetlands/peat-bogs
[2] https://www.nature.scot/sites/default/files/2023-02/Guidance-Peatland-Action-Peatland-Condition-Assessment-Guide-A1916874.pdf
Research findings
Availability of literature
Overall, the literature searches presented over fifty academic studies and governmental reports, which provided useful information related to the impact of landscape management on peatland as well as some interactions between peatland and wind farm developments. However, there were no empirical studies monitoring changes in reused peat on windfarm developments over time. This is a major research gap. Understanding how the reuse of peat may change the peat itself had to be extrapolated from studies measuring changes within laboratories or evaluations of the landscape scale after a number of years since wind farm construction had occurred. Studies did consider the impact of peat excavation on the environment, hydrology and risks of erosion or the degradation of the peatland habitat. The literature did present a large number of studies focusing on the restoration of peatland habitats, however, these were not readily extrapolatable to the current study on reuse of peat, as the parameters related to restoration are substantially different. A large number of the papers and reports were focused on the Scottish environment which suggests that Scotland is leading the way in this area of research.
Summary of stakeholder engagement achieved
We obtained contributions from 31 individuals during our stakeholder engagement (for a more in-depth synopsis of stakeholder engagement findings see Appendix). Stakeholders highlighted what they viewed as the positive features of some reuse options, such as where the water flows in borrow pits (one method of peat reuse) have been managed to keep the water table near the surface. Stakeholders we spoke to were aware of the gaps in evidence and lack of specific studies and so based their views on their own observations or monitoring on sites they were involved with. Overall stakeholders agreed that a number of factors need to be considered carefully to have any chance of achieving optimal environmental outcomes from reuse of peat on windfarm sites – simply putting peat in a convenient location on site would not be beneficial as peat would dry out, erode or lose its structure and functioning. Key considerations were – what was the condition of peat prior to excavation, the need to plan how to minimise disturbance, handling, drying and transport of peat after excavation, consideration of the water levels and flows, vegetation cover and the stability of reused peat in situ.
Summary of site research conducted
During five site visits across varied locations in Scotland, a range of different peat reuse practices were observed including:
- different approaches to infilling borrow pits,
- use in landscaping (for example alongside tracks or to cover cables),
- infill of other site features including historical peat cuttings,
- incorporation of peat into peatland restoration.
Across sites the condition of peat prior to excavation and reuse varied, as did the nature of reuse even where the same general type of reuse was used, for example borrow pit size, shape, fill level, structure, hydrology and vegetation varied across sites where this practice was used. For more information related to site visits see the Appendix.
Summary of literature and stakeholder research findings
In Scotland, peatlands store over 2,735 million tonnes of carbon covering approximately two million hectares (Smith et al., 2007), equating to around 25% of Scotland’s land area. These peatlands are often considered good candidates for onshore wind farms due to the windy and exposed environments they are located in and because they are often considered poor (or unprofitable) for other land uses, like forestry and farming activities.
The main construction activities which result in substantial disturbance for a wind farm development are track construction for maintenance and access roads, trenches for cabling, quarried aggregate extraction (borrow pits) and turbine foundation excavation. This large-scale disturbance can affect peat stability, degradation (such as habitat condition, plant assemblages, carbon storage, etc), as well as the hydrology of the habitat. Other disturbances are related to building infrastructure to support the wind farm development like crane pad constructions, temporary and permanent compounds, as well as substations to join the electricity generated to the grid. Estimates of the direct disturbance to the peatland habitat per wind turbine vary greatly but have been reported to be between 0.2 to 1 hectare per turbine, with the turbines within a wind farm usually taking up less than 10% of the wind farm area (Sander et al., 2024). However, if this area is on deep peatland, there will be greater environmental impact, than on shallow peat or mineral soils.
Larger turbines, which are more widely spaced (typically on a 300-500 m grid, with the distance between turbines around five times rotor diameter), capture energy on a much smaller spatial ‘footprint’ than smaller ones on wind farms (Renou-Wilson and Farrell, 2009). However, this is also site-dependent and varies if repowering occurs, as repowering may use the same footprint as the previous turbines, or it could locate the turbines at a new area within the development, thus increasing the environmental impact.
Construction of a wind farm requires a significant array of associated infrastructure to be installed, this infrastructure may have impacts on the surrounding peatland either through the removal of peat from that habitat, removal and replacement of peat in less suitable locations or reducing the quality of the environment within the area the peat was moved to, compression, flooding, drainage, erosion or mass movement of the peat (Lindsay, 2018). Active peatlands are hydrologically linked and naturally stabilised therefore if hydrologically disrupted, the stability can be lost (Wawrzyczek et al., 2018). An unstable habitat can lead to wider environmental problems, with issues greater than just carbon loss, for example peat slides.
Peat and windfarms in Scotland
Peat is an amorphous organic deposit, considered to be the largest terrestrial carbon store. Peat is highly compressible and porous consisting of up to 90% water by volume. Active peat-forming mire has also been found to be effective in delaying storm run-off, reducing soil erosion and retaining inorganic nutrients when it is undrained (Bragg, 2002).
Across Europe it has been calculated that 25% of peatlands are degraded (Tanneberger et al., 2021). Under the EU Habitats Directive (92/43/EEC), there are 36 European regions with designated blanket bogs and of these, 12 have wind farm developments, including 644 wind turbines, 253 km of vehicular access tracks and an affected area of ~208 hectares, mainly in Ireland and Scotland where the extent of peatland is also higher (Chico et al., 2023). However, when this is compared to the Scottish soil maps, the extent of wind farm developments in Scotland on peatland is even higher, with 1,063 wind turbines and 635 km of vehicular access tracks on peatland in Scotland alone according to national inventory data (Chico et al., 2023).
Currently, 48% of wind farms in Scotland have already been built on peat[1] with this number likely to increase in the future. Wind farm developments can have an impact on the peatland habitats and emissions, during construction, operation, and decommissioning stages. This reduces the wind farms’ ability to reach the goal of net zero. Using a carbon calculator[2] to assess the carbon saving of wind farm developments compared to carbon lost through construction on Scottish peatland provides guidance on a wind farm’s carbon footprint. However, due to the heterogeneity of peatlands and the lack of detail at the required scale when completing peatland surveys pre-planning, it has been found that the amount of peat excavated is often more than the amounts used within the carbon calculations.
[1] John Muir Trust – Scotland’s peatland policy update.
[2] https://www.gov.scot/publications/carbon-calculator-for-wind-farms-on-scottish-peatlands-factsheet/
Current practices: excavation
Both in discussion with stakeholders and within the literature, the instability of peat deposits was highlighted, with small movements leading to slope terracing, slumps or the collapse of peat banks – these events are relatively common. Furthermore, disturbed peat can lose more than 50% of its strength compared to undisturbed peat and, in many cases, behaves as a viscous material that will readily flow, particularly when affected by high rainfall (Jennings and Kane, 2015). These inherent properties of peat carry risk and need to be considered during the wind farm construction process as the destabilisation of peat mass through drainage or excavation operations could lead to an increase in landslides / bog flow events (Dykes, 2022).
From discussions with stakeholders, it is clear that the exact volume of peat to be excavated can differ from estimates calculated in the EIA at application stage. This is usually due to a combination of initially unknown factors prior to the construction process – the exact depth, viscosity and bulk density of the peat material that needs to be excavated. Calculations are usually based on predefined excavation requirements for the size of the turbine alongside average peat depths for the area provided by preliminary site surveys, using an interpolated model of a peat depth probe survey. However, the depth of peat can also vary significantly over time, with changes in the peatland hydrology, leading to peat shrinkage occurring during drought conditions (Morton and Heinemeyer, 2019). Thus the timing of peat surveys may affect peat excavation calculations, as well as the scale of the survey and heterogeneity of the habitat. Table 2 describes common reasons for excavation as part of the construction process and how they differ in approach.
Table 2. Common reasons for excavation on site and how they differ in approach when applied to peat and peatland.
|
Excavation types |
Approach |
|---|---|
|
Construction and maintenance of roads and tracks |
Significant lengths of tracks need to be created linking wind turbines and wind farm infrastructure. The main methods that can be implemented are either cut and fill or to introduce floating roads. These roads will impact the drainage of the surrounding peatland by blocking or modifying flow and if floating the peat below can also be compressed, exacerbating drainage issues. |
|
Construction of crane pads |
Crane Pads are usually located adjacent to the turbine foundations to facilitate turbine components being lifted during turbine erection and future maintenance or repairs. Depending on the load, crane pads are usually unpaved, however, compacted with layers of gravel. For some installations, the turbine foundation is used as a crane pad after initial construction. |
|
Turbine blade laydown areas |
A designated space near the turbine foundation where large components are stored before installation. These are often temporary excavations and reinstated after construction. |
|
Cabling |
Usually installed along tracks so typically does not require additional excavation, although may require a small amount of disturbance and/or influence the scheduling of any reinstatement following tracks. |
|
Turbine base |
The digging of the foundations of turbine bases generates large volumes of peat that need to be reused. They also introduce alkaline concrete into the environment which may impact the pH of the surrounding habitat and may require drainage installation to protect the foundation and avoid uplift. |
|
Compounds and substations |
Temporary compounds provide facilities for workers and equipment. Substations are usually permanent installations, often with steel frames and cladding, crucial for power collection and transmission. The peat needs to be removed, before a hardstanding area is laid, using gravel. These areas also need to be linked to the access roads early in the construction process. |
|
Drainage ditches |
Drainage is necessary around wind turbine foundations and wind farm infrastructure to maintain integrity and is usually a permanent feature of the windfarm. Often this leads to a lowering of water levels associated with drainage around infrastructure. Drainage may impact a much wider area than the drain margin and as well as lowering water levels surface subsidence may also occur. |
|
Borrow pit |
The volume of peat excavated depends on the depth at which usable aggregate materials are found. The quantity and quality of aggregate in the borrow pit can be hard to judge before the pit is opened so the volume of excavated peat may be higher or lower than anticipated. |
Roads and tracks
Construction and maintenance roads and tracks are the most extensive direct impact of a wind farm on peatland as the roads need to allow access to every turbine, plus all the other infrastructure buildings but could also provide access to areas for restoration and enhancement activities. Initially, roads were just cuttings made on shallower peat down to the mineral base. However, this meant that the roads were lower than the surrounding peatland and frequently led to drainage issues.
Construction methods have adapted from just cuttings to the ‘cut and fill’ method (where the peat is dug out until the mineral subsoil is reached and backfilling the trench with aggregate until the road is around the same level as the surrounding bog surface (Lindsay, 2018)) or the preferred method of floating roads (using a geotextile mesh on top of deep peat). Floating roads have limited peat removal as a geotextile mesh is laid on top of the peat, with aggregate poured on top. Another geogrid may then be added with more aggregate before the final ‘running surface’ is laid (Lindsay, 2018).
Stakeholders described how the design of the road network through a wind farm is largely driven by the placement of the turbines (often on ridges which may be where the deepest peat is located) and following the contours of slope (increasing the distances of the road network within the peatland habitat). Tracks also need to bear large weights, for example, the cranes used for wind turbine construction can weigh up to 200 tonnes (this also has implications for the construction of crane pads). A study showed the orientation of the road in relation to the flow of water within a peatland had a large impact (Elmes et al., 2022) and led to flow obstruction and changes to the overall hydrology when running perpendicular to the flow in comparison to parallel. However, this sort of nuanced planning is rarely discussed as part of the construction process. Infrastructure like work compounds and substations also require access roads (with drainage). Thus, the size of the area of peat that is disturbed by the development may be greater than first considered.
Drainage
It was highlighted by stakeholders – and during the site visits – that drainage is usually the first construction activity occurring when developing wind farm infrastructure and is often necessary around the turbine bases and accompanying roads and tracks to reduce the risk of surface flooding. Drainage ditches are also excavated around wind farm foundations to improve the stabilisation of the turbine foundations and to protect machinery. This process of draining peatlands is known to be detrimental, causing subsidence through oxidation of the peat (Williams-Mounsey et al., 2021) and carbon loss. However, peat further away from the drainage ditch (> 1m) will only lose 20% of its previous moisture content, with the main effect of peatland drainage leading to removal of surface water rather than deep water-table drawdown (Lindsay, 2014). Drying of the peat may also lead to cracking, which may lead to rainwater penetrating the base of the peat and lubricate the interface between the peat and the mineral subbase (Lindsay, 2018).
Excavation works
Other large-scale disturbances of the peat are through excavation works. This can be for granular material used during construction (taken from borrow pits); excavation of the wind turbine foundations (although piled foundations can reduce the overall negative impact); and trenches for laying cabling/pipework, leading to substantial quantities of peat that may need to be stored prior to reuse. Piled foundations are usually built over deep peat, rather than excavating large quantities of peat; long, thin columns (piles) are driven or drilled into the ground to support wind turbine structures. These foundations reduce the volume of peat needed to be excavated whilst ensuring stability of the structure. Turbine towers experience large forces and must be placed on a solid foundation embedded within the underlying mineral subsoil or bedrock (Lindsay, 2018). Stakeholders said that often large quantities of peat may be deposited on nearby surfaces temporarily, if trucks aren’t continuously available to receive the excavated material, or dependent on the stage of the construction process. However, it is best practice to only move the peat once (to maintain structure and water content) thus, if the requisite planning is in place, a reuse strategy can be implemented where excavated material is moved to its final location in one step.
Stockpiling peat occurs where peat has been excavated and may need to be temporarily stored prior to reuse due to logistical constraints. As well as becoming a potential source of GHG emissions due to its exposure to aerobic conditions, when peat is stored, changes have been observed within its hydrochemistry, leading to it becoming less acidic and less nutrient-rich (Detrey, 2022). Over time, dewatering also occurs, which alters the hydrophysical properties (porosity) of the peat, these are key for sustaining critical peatland ecohydrological functionality (Lehan et al., 2022).
Ground preparation for stablishing crane pads and turbine blade laydown areas often requires excavating peat to create a stable foundation, leading to the removal of substantial peat volumes, with similar issues as discussed related to other excavation works. This will expand the area of impact further away from the turbine, with underlying changes to the hydrology, potential for release of GHG emissions, vegetation changes and degradation of peatland (Wawrzyczek et al., 2018). Some of these areas are temporary. For example, at some sites visited, areas which had previously been turbine blade laydown areas had peat reinstated and vegetation was able to naturally regenerate. However, this only occurs if it is part of the plan created by the developers, as some laydown areas will remain as areas with stable foundations which are available for future use.
Current practices: use of excavated peat – reuse practices
Excavated peat needs to be moved from the excavation site and is often initially stockpiled until an appropriate time for reuse. The time peat is stockpiled can vary substantially and will be impacted by where it was excavated from, the volume, and timing of the excavation related to overall construction of wind farm site. Lehan, et al., (2022) undertook a restoration study, to assess the impact of time on the hydrophysical properties of peat blocks that were stockpiled for 3, 7, 11, and 14 months. In this study, stockpiling peat was differentially impacted dependent on whether it was shallower or deeper peats, where limited impact from stockpiling was observed in the shallower peats, regardless of stockpiling time; however, in the deeper peats as stockpiling time increased there was a decrease in microporosity as well as mobile porosity (drainable porosity) (Lehan et al., 2022). It may be necessary to rewet the peat or aim to keep it wet whilst stockpiled.
Peat that has started to dry out will be less likely to function when reused. When the surface of the peat starts to dry out development of a hydrophobic layer may occur which causes irreversible changes to the ability of peat to be fully rewetted and reduces the infiltration capacity of the peat (Evans et al., 1999), increasing the desiccation of the peat overall and exacerbating the issue over time. There could also be a similar issue occurring around drainage channels, changing the overall hydrology of the habitat. There are a number of different potential reuse practices that occur on site, with varying quantities of peat, depth of peat and aims (Table 3).
Table 3. Generalised overview of current and potential future reuse practices for excavated peat
|
Reuse practice – onsite |
Approach |
|---|---|
|
Borrow pit reinstatement | Borrow pit reinstatement is one of the main sites for the reuse of peat. Guidance from SEPA highlights the WMLR[1] paragraph 9(1)b restriction that spreading on land subject to man-made development including quarry restoration should not exceed up to a maximum of 2 metres depth of material. |
|
Around turbine foundations and crane pad verges |
Use to reinstate the natural habitat and to encourage vegetation re-growth. Often used as a way of merging the built infrastructure with the surrounding landscape. |
|
Side of road/ track or “landscaping” |
This often occurs as a way of managing levels within the wind farm area, particularly where tracks have been constructed as floating and sometimes will become higher than the surrounding peatland. Vegetation at the side of the road and in the deposited material is not often considered and it is assumed natural regeneration will occur. |
|
Incorporation of peat in restoration / reinstatement projects |
This is not standard practice and has to date only occurred as part of research trials in areas directly adjacent to wind farm construction sites, where peat is used as a substrate for other restoration work. Often these sites are already partially disturbed due to the construction process or historically (through forestry, man-made drainage or cuttings). Examples from stakeholder discussions:
|
|
Offsite use |
Literature review referred to some potential ways to reuse peat off-site, but we found no evidence these are practiced in Scotland. All stakeholders stated that offsite reuse of peat does not occur. Suggestions have been made that peat could be used offsite, but these are largely hypothetical. |
When excavating peat, it is imperative that the different layers are kept separate (acrotelm, catotelm) and not mixed with the underlying mineral substrate. This is because of the different properties of these layers and mixing will degrade the peat and reduce its function. Although peat excavation during wind farm construction is likely to occur, large excavations of peat should be avoided. Peatland management plans are mandatory when submitting planning applications for wind farm developments on peaty soils (as part of Policy 5 of the NPF4 framework). These plans provide a draft outline of the volume of peat to be excavated and the reuse activities that will be performed as part of the development. The reuse of peat is unlikely to have wider environmental benefits in areas that are not already disturbed by the wind farm construction or considered degraded; depositing excavated peat on undisturbed vegetation is likely to be detrimental.
To prevent the loss of carbon and the increase in GHG emissions which would occur from the degrading peat, it is essential that a considerable time is spent planning prior to the excavation process – reducing the distance the peat is moved, keeping the times the peat is moved to a minimum and understanding the volumes of peat involved. From discussions with a number of stakeholders it was suggested that, although the level of planning and motivations of the energy companies to reuse peat without degrading it is high, it is often dependent on the capabilities and understanding of the operators doing the work. A number of training courses have been organised for the construction sector specifically to improve this. However, these courses are voluntary. Training the construction sector in the importance of peatlands, restoration techniques and sensitivity during construction, will enable greater preservation of this valuable resource. In almost all discussions with stakeholders the reuse of peat occurred onsite, there were discussions regarding offsite use, but these were more abstract in terms of what was possible, rather than what was occurring. The reasoning given that the majority of reuse is on site is because the SEPA guidance[1] states that unless the excavated peat is used for construction purposes in its natural state on the site from where it is excavated, it will be subject to regulatory control and considered waste.
[1] https://www.sepa.org.uk/media/287064/wst-g-052-developments-on-peat-and-off-site-uses-of-waste-peat.pdf
Overall, although the terminology is the same between different wind farm construction sites – the reuse of peat within borrowpits, landscaping or restoration, it is always site specific. There may be commonalities between the sites, for example, the need to maintain hydrological connectivity, and the importance of peatland vegetation. There will also be significant differences related to volume of peat excavated, previous habitat conditions and use, weather conditions and water table level, knowledge and preparedness of the contractors. Within 3.5.2, 3.5.3 and 3.5.4 we present case studies representing recent site visits.
Quantities of peat excavated during wind farm construction
Reviewing a number of reports, for example the “Good Practice during Wind Farm Construction” (NatureScot), “Research and guidance on restoration and decommissioning of onshore wind farms” (NatureScot), “Developments on peatland: guidance on the assessment of peat volumes, reuse of excavated peat and the minimisation of waste” (SEPA[1]), “Developments on Peat and Off-site uses of waste peat” (SEPA), as well as habitat management plans for specific wind farms, all state the importance of collecting relevant and detailed site investigation data at an early stage of the application process to enable a full understanding of the site character and to inform a more accurate design process. This is in full agreement with the academic literature (e.g. Jorat et al., 2024) and discussions with stakeholders. During the planning process the amount of peat that needs to be excavated and how it will be reused is identified (see Table 3 for an example of the average areas involved in excavations). However, due to the heterogeneity of the environment and the lack of granularity of peat depth survey’s there is some ambiguity related to total peat volumes until excavation has started.
[1] Scottish Renewables, Scottish Environment Protection Agency. 2012. Guidance on the Assessment of Peat Volumes, Reuse of Excavated Peat and the Minimisation of Waste
Table 4. Area of turbines adapted from Albanito et al., 2022, also includes calculation of the average volume of peat per turbine taken from reviewed peatland management plans of operational wind farms in Scotland
|
Wind farm capacity (megawatts, MW) | |||
|
Input |
<10 MW |
>10 to <50 MW |
>50 MW |
|
Average length of turbine foundations (m) |
10 |
15 |
22.18 |
|
Average width of turbine foundations (m) |
10 |
15 |
22.18 |
|
Average surface area of turbine foundation (m2) |
100 |
225 |
492 |
|
Average depth of excavated peat (m) |
1.455 |
1.365 |
1.350 |
|
Average volume of turbine foundations (m3) |
145.5 |
307.13 |
664.14 |
|
Length of access track (or floating road) (m) |
418 |
6513 |
32490 |
|
Width of access track (or floating road) (m) |
5.66 |
5.66 |
5.66 |
|
Average surface area of access track (m2) |
2366 |
36,864 |
183,893 |
|
Floating road depth (m)* |
0.53 | ||
|
Average volume of floating road (m3)* |
1254 | ||
|
Length of hard standing (m)* |
37.99 | ||
|
Width of hard standing (m)* |
32.29 | ||
|
Average surface area of hard standing (m2)* |
1226.7 | ||
|
Extend to drainage around drainage features at site (m)* |
60 | ||
|
Average volume** of peat per turbine (m3) anticipated to be excavated (includes road network and cabling linking turbines to grid) |
8060 (± 1464) |
Average volume* per wind farm (m3) |
328,446 (± 59,650) |
*Independent of wind farm capacity (MW)
**Average taken from reviewed peatland management plans of operational wind farms in Scotland.
Case studies – Borrow pit reinstatement
To successfully reinstate peat within borrow pit excavations, it is important to consider the borrow pit location, hydrological connectivity, depth, vegetation cover, and to preserve the layering of the peat (Figure 2). It is best practice to reinstate the borrow pit profile to a comparative level to the surrounding landscape, with gentle slopes that blend into the landscape, it’s design should maintain hydrological connectivity with the wider environment whilst also holding water within the peat soil. Often “cells” are created within the borrow pit to enable easier reinstatement, these cells are sometimes lined with clay to reduce the permeability through to the underlying parent material. This is to enhance the hydrological connectivity of the reinstated borrow pit and aims to keep the area wet. However, an outflow is also needed so that the area doesn’t become permanently waterlogged (Figure d). It is assumed that natural regeneration of peatland vegetation will occur, therefore seeding is not usually part of the PMP, however if seeding were to occur this would usually be two years after construction as part of the planning conditions process.
|
a) |
b) |
|
c) |
d) |
|
e)  |
f)  |
Figure 2. Examples of borrow pits a) newly completed (< 1 year); b) in the process of being in-filled, one cell completed – cell wall construction (light coloured) and peat infill (dark coloured); c) 15-year old borrow pit with examples of functional peatland vegetation (from natural revegetation); d) 15-year old borrow pit that was not designed with drainage, has led to waterlogging (arrow indicates ponding); e) 10-year old borrow pit, quite dry, with more of an acidic grassland habitat; f) newly completed (< 1 year) situated on a slope, quite shallow peat.
Case studies – roadside verges / landscaping
Peat deposited alongside roadside verges often occurs more in terms of landscaping rather than for preservation of the peat (and carbon within it) (Figure 3). However, the volumes are relatively small compared to borrow pit reinstatement. If the peat does not become integrated with the surrounding hydrology, it will likely dry out and decompose over time, releasing CO2 into the environment and possibly erode away.
|
a)  |
b)  |
|
c)  |
d) |
Figure 3. Example of peat reused along roadside as part of landscaping process, a) drainage and indication of below ground cabling visible, vegetated peat reused for this infill; b) drainage channels and depth of floating road visible (newly constructed < 1 year), c) newly constructed (<1 year) landscaping, mixing of peat and mineral soil visible; d) Established peat at edge of floating road (15 years after construction), has maintained level and has peatland vegetation growing on it through natural revegetation. (Photographic permissions granted)
Case studies – incorporation within restoration projects
The reuse of peat is not considered for peatland restoration in the majority of cases. However, there are some examples where excavated peat has been used as part of the restoration process but this has only been permitted as an experimental approach. This is because once the peat is excavated (in the quantities it is being removed for wind farm construction), it has often lost structure and hydrological connectivity, and left as a stockpile until reinstatement begins (which varies from site to site).
Thus, the excavated peat has likely started to degrade, using this for restoration is unlikely to improve the habitat to the same level restoration with non-degraded peat would do. However, on some sites there are opportunities for reuse that could enable restoration if the appropriate planning and coordination between experts occurs. An example can be seen in Figure 4 (a and b). Key to the success of this kind of trial is planning how to implement it, for example a) efforts were made to move the peat only once – from excavation to reuse site; b) the layers of peat were kept separate and maintained across translocation; c) training was provided to the contractors involved in this reuse and restoration project. At a different site, excavated peat was used to infill peat cuttings that had occurred previously, however this infill can still be seen 10 years later (Figure 44c – differences in vegetation).
Although there are differences still visible in vegetation, the process for infilling used in situ vegetation. When reinstating the peat within the cuttings, the existing vegetation was stripped off and placed aside, the cuttings were then filled with acrotelmic peat generated from the excavation of nearby turbine bases. The vegetation was then replaced to reinstate the area and stabilise the peat. Although this may not have restored the peatland habitat to equivalent to undisturbed areas, as differences in vegetation are still visible. As the degradation was separate to wind farm construction, comparisons need to be made with how the environment was prior to wind farm construction, rather than comparison to pristine peatlands. Understanding whether the reuse of peat has been successful in maintaining a functioning peatland or at least preventing the loss of peat (and carbon) is very important, vegetation and water table monitoring occurs on some sites regularly to assess this (Figure 44d).
|
a) |
b) |
|
c)  |
|
 d)
d)Figure 4. Examples of incorporation in restoration projects – a) Restoration trial (as part of the forest to bog project), where excavated peat was deposited at the side of a constructed track. However, to enhance restoration, prior to peat addition, vegetation was removed and the site ‘smoothed’, before the excavated peat was layered on top (to a depth of 150 mm or 300 mm dependent on trial site), after which the vegetation was put back on top of the reused peat. B) Zoomed in photo of trial site in a) peat vegetation covering trial site, with very little bare peat. C) Landscape restoration through the infill of furrows – here infill is within peat cuttings (but similar infill also occurs within the furrows of former forested sites). D) Dip well monitoring of water levels to assess success of peat reuse. (Photographic permissions granted)
Offsite use of excavated peat
Throughout this research it was discussed with stakeholders whether excavated peat could be used offsite from the wind farm construction; as to date only one paper was found. Balode et al., (2024) discussed various off-site novel uses for peat within the energy sector, building materials and additives, as well as agriculture and the wider environment (Figure 5); however, the paper does not focus solely on reuse and hence these uses are unlikely to occur within wind farm construction industry as the quantities involved in reuse are not going to warrant the creation of a comprehensive supply chain.
It is important to note that throughout the stakeholder consultation, it was repeatedly stated that reuse of peat off-site did not generally occur. Mainly this is due to two reasons, firstly classification – if the peat was taken off-site, it would be categorised as waste, which would likely entail a cost; secondly the necessary volumes of peat and the logistics of transportation would make it too costly to the project. If the reuse of peat offsite from wind farm construction was to be encouraged than new SEPA guidance and recommendations would need to be developed.
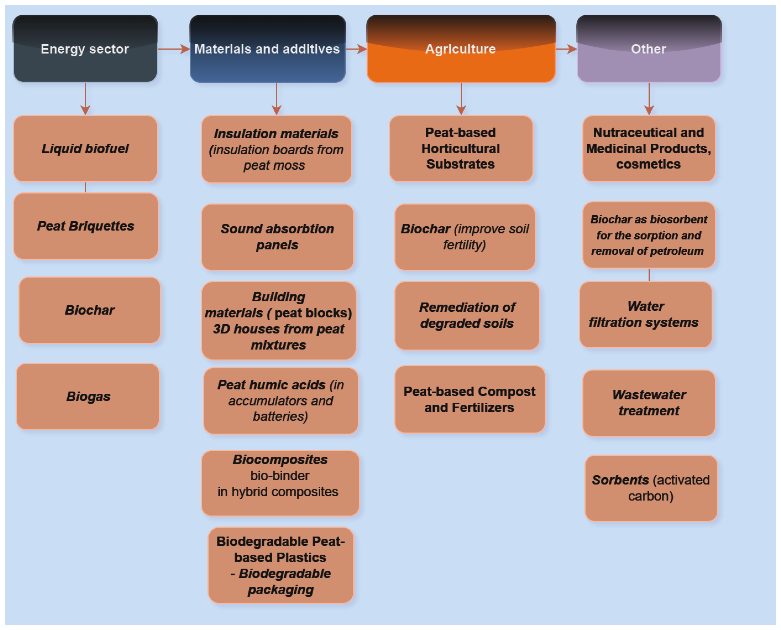
Figure 5. Novel applications of peat from Balode et al., (2024).
Environmental outcomes of peat reuse
The results of the literature review indicates that all anthropogenic activities within a peatland will impact the fate of nutrients. The fluctuating water table, local geochemistry and hydrology are the main drivers of a peatlands’ groundwater chemistry and discharge (Monteverde et al., 2022). Wind farm construction can increase the fluvial macronutrient loading of catchment streams (Heal et al., 2020), however, forest felling has been shown to lead to greater dissolved organic carbon (DOC) within felled areas compared to wind farm catchments (Zheng et al., 2018). It is important to note that often wind farms are developed on felled forest sites that were previously peatland, e.g. Whitelees and Camster, however it has been calculated that nearly 14 million trees have been cut down as part of wind farm construction projects over the last 20 years (2000 – 2020)[1]. Thus, academic studies comparing habitats as if they are discrete categories like a felled forest compared to a wind farm development need to include previous land use as part of their analysis. In other words, undisturbed peatland to forestry to felled forest and windfarm may produce different results compared to an undisturbed peatland to wind farm, but if only considering the final use they would be classed as having the same management factors influencing them. It is also unclear whether the environmental perturbations are additive and would likely occur if the area hadn’t previously been changed? Also the timing of monitoring is important, for example a newly constructed wind farm showed 5 g m2 losses in dissolved organic carbon (compared to control samples) over an 18-month period (Grieve and Gilvear, 2008) but it is unclear if losses reduce over time – this is a research gap. Is there an initial flush that quickly dissipates? Or are those losses continuous without signs of improvement. Grieve and Gilvear (2008) believe this 5 g m2 loss represents between 25% and 50% of annual carbon sequestration in peatlands in central Scotland, so it is quite substantial.
[1] https://www.heraldscotland.com/news/18270734.14m-trees-cut-scotland-make-way-wind-farms
The structure and hydrology of removed and replaced peat will not resemble that of the undisturbed peat and likely undergo further degradation through settlement and oxidation (Lindsay, 2018). Excavated peat is often used to blend the transition from undisturbed areas to those which are part of the construction. The disturbance to the peat results in negative impact to the habitat (Jorat et al., 2024), however using excavated peat to link undisturbed areas with disturbed areas will encourage vegetation regrowth in keeping with the surrounding landscape and may stablise the disturbed peat. Error! Reference source not found. provides an overview of the potential environmental outcomes for some of these reuse options.
Understanding how each reuse option impacts the wider environment will inform the hierarchy. Repowering of wind farms, upgrading the turbines and technology used within a wind farm site once it has reached the end of use-limit, is one method of reducing disturbance on peatland. However, this still requires extensive planning, as the newer turbines are often larger, needing different spacing between turbines and larger foundations. Approximately 30% more land surface area will be disturbed for repowering using a new rather than reengineered foundation (Waldron et al., 2018). If the surrounding peatland has not recovered from the previous development, this could lead to greater degradation than using new locations.
It is unsurprising that wind farm construction leads to wide-scale changes to the peatland habitat, which are known to be sensitive habitats with unique attributes related to their hydrology and carbon richness. Within this report we have been focused solely on the impact of wind farms on the excavation of peat and its reuse, however once in situ wind farms may still have an impact on the surrounding peatland. For example, a study by Moravec et al., (2018) showed that wind turbines can affect ground surface temperatures (which has the potential to change soil hydrology); and these changes varied with proximity to wind turbine (Armstrong et al., 2016). These impacts may also last for the lifetime of the wind farm, a large-scale review of the impacts of pipeline construction on soil and crops found that pipelines caused soil degradation for years and decades following installation and that soil compaction and soil horizon mixing detrimentally impacted soil function (Brehm and Culman, 2022).
Table 5: Synthesis of reuse options and simplified overview of potential environmental outcomes (Note: this table summarises potential outcomes indicated by research during this study, but evidence is limited and site-by-site circumstances vary significantly so currently this differentiation on environmental grounds cannot be fully reflected in the recommended ‘hierarchy of peat reuse’.)
|
Method of reuse |
Carbon store |
Hydrology connectivity |
Availability |
Comment |
|---|---|---|---|---|
|
Borrow pit reinstatement |
++ Low risk of carbon loss Low chance of carbon sequestration (carbon increase) in the long term |
+ Only if well planned, with impermeable layers and outflows built in |
+++ Large storage potential, should have capacity for all excavated peat, however where there is more (or less) peat than planned may lead to issues |
Borrow pits have potential to provide an environmentally robust reuse option, however only if best practice is followed and there are contingencies in place if changes in planned volumes occur |
|
Around turbine foundations and crane pad verges |
— High risk of carbon loss through peat drying out and erosion |
– When constructed these areas will automatically have drainage channels cut. The reuse of peat here will likely be impacted by this drainage |
+ Small volume |
Use to encourage vegetation re-growth around construction areas. Often used as a way of merging the built infrastructure with the surrounding landscape |
|
Side of road/ track or “landscaping” |
– Risk of carbon loss through peat drying out and erosion, however if vegetation regrowth occurs this is less likely |
– Addition of peat should connect the reused peat with the wider environment to maintain hydrology, however, depends on flow patterns and drainage channels across roads |
+ Small volume |
If vegetation regrowth occurs and there is limited bare peat this has potential to become part of wider landscape |
|
Incorporation of peat in restoration / reinstatement projects |
+++ Low risk of carbon loss, has potential to build carbon (dependent on restoration / reuse project) |
+++ If well planned, should have hydrological connectivity with landscape |
+ Small volume |
Usually these projects are highly monitored to assess progress – useful for data gathering in the short term alongside the benefits of using excavated peat in areas that may have been degraded previously |
Limitations of data
Through the rapid evidence assessment (REA) we did not consider peatland restoration methods as part of the scope, however there are some strategies that go beyond restoration practices and should be a consideration as part of the reuse of peat. For example, rewetting peatland, drain blocking, revegetation, and fire management (Balode et al., 2024). Although there is academic research on the impact of peatland degradation, how wind farms can reduce reliance on fossil fuels and the social acceptance of wind farms within the environment, there is a lack of published research directly quantifying the impact of wind farms on peatlands, or providing evidence of best practice. Reliance on grey literature and stakeholder discussions is necessary to cover this research gap. For example, where novel reuse methods have been used, the industry has led monitoring of those sites, collected data and written these up as internal reports, which are not obviously available for the wider industry and academia to use. However, “standard practice” is rarely reviewed in academia nor comprehensive data collected, thus it is very difficult to make recommendations on what works best through standard literature reviews. Grey literature may be written with bias, there may be a lack of replication within the data, and it will not have been peer reviewed and is thus less reliable as a data source.
Often there is limited detail within peat management plans and planning applications for wind farms. For example, it is assumed that all excavated material will be peat; differences between peat layers (acrotelm and catotelm) are not distinguished and there is no reference to the vegetation layer. Depending on volumes, the only indication of reuse is stated as backfilling around turbine bases and landscaping around access tracks. As well as the aforementioned issues with the reuse of excavated peat, one important consideration that is often not discussed is that the different layers of peat excavated (acrotelm and catotelm) have different physical properties. Whilst the reuse options discussed above may be appropriate for acrotelm peat, they are unlikely to be suitable for catotelmic peat (generally below 1m depth peat)[1].
[1] https://www.sepa.org.uk/media/287064/wst-g-052-developments-on-peat-and-off-site-uses-of-waste-peat.pdf
Knowledge and evidence gaps
There is a lack of understanding related to the outcome of peat reuse – is it to restore peatland bog function, or is it to try to reduce losses of carbon from the excavated peat? Or is it to do something with the excavated peat that will minimally impact the wider environment? The likelihood is that the overall outcome will be somewhere between these points.
Although there is a significant amount of academic research on the impact of wind farms on peatland, there were clear gaps related to what should be deemed ‘best practice’. For example, there is no published work on the measurement of peatland parameters as part of the reinstatement of borrow pits on wind farms – how can best practice be defined when there is no indication of something working in practice, or a clear understanding of what ‘success’ looks like in this context? There have also not been any in-depth assessments of carbon loss after excavation and reuse – discussions were held in relation to loss of carbon as the peat dried out, but there is a lack of direct studies focusing on this over time. This information is also absent from the grey literature. There was a lot of discussion with stakeholders regarding what they believe works best from a real-world perspective (rather than lab based academic studies), but this still lacked underlying reported evidence, and was only discussed in terms of past experience of what worked (to reuse the peat available, and perceived that it remained within the field rather than eroding) and what hasn’t worked, remaining largely unmeasured and therefore unproven. Interestingly, where a wind farm had used a novel method of reuse, there was a monitoring plan set up by the energy company and evidence was gathered to justify this method. Highlighting how energy companies can lead the way in providing evidence of good practice.
Generally, there was a lack of monitoring occurring, both in terms of whether the construction process adheres to what has been set out in the PMPs but also to ascertain whether the approach has worked (and thus could be referred back to and repeated elsewhere). There is also a disconnect between the desired outcomes compared to the aims of the wind farm operators. For the wind farm developers, there is a need to balance aspects such as effectiveness and safety within the construction process (i.e. the need for drainage), with restoration, when that part of the construction process is complete. Removing drainage if it is no longer necessary within the wind farm infrastructure would enable an area to return to a more natural peatland habitat, although dialogue is required to ensure a shared understanding of how this might be defined.
Legislation and advisory documents change over time, for example “Scotland’s Peatland Standard”[1] (SPS) is currently being developed. This document will provide technical information and guidance to promote peatland protection. It will define the minimum for sustainable management and restoration requirements that Scottish Government expects all peatland owners, managers and contactors to follow. Thus, in future could potentially fill some of these knowledge gaps discussed.
[1] https://www.nature.scot/climate-change/nature-based-solutions/nature-based-solutions-practice/peatland-action/peatland-action-how-do-i-restore-and-manage-my-peatland-0
Recommendations
We have developed the hierarchy below for reuse of peat through the literature review, stakeholder discussions and site visits presented within this report. We considered the role and nature of a potential hierarchy for peat reuse methods during this project, considering:
- What needs to be included in a hierarchy and in which order.
- What additional guidance or principles would help guide an environmentally beneficial approach to peat reuse.
- Highlighting the research gaps at this time that need to be addressed to better inform a hierarchy of peat reuse methods.
Based on the findings of this study we have three recommendations:
Recommendation 1: Guidance on excavation peat reuse
1a: Planning and preparation steps
1b: A draft hierarchy of reuse methods
1c: Peat reuse and implementation principles
Recommendation 2: Environmental outcomes framework to ensure the multiple potential environmental benefits of peat reuse are considered, avoiding a single-issue focus.
Recommendation 3: Enhanced monitoring of environmental outcomes from reuse of peat – these investigations need to be targeted to address the specific research gaps highlighted in our study, and also better routine monitoring of site reuse implementation and environmental outcomes.
Our recommendations come from learnings acquired during this study. Through a rapid evidence assessment, an understanding was gained of the current research occurring on peatlands and wind farm developments, alongside site visits to see what was occurring in the field and a series of stakeholder discussions and workshops to fill in the gaps where reports or data were lacking. An area of clear agreement across stakeholders, both in terms of construction and also the conservation sector, is to minimise the amount of peat excavated. Avoidance of peat excavation can mean different things to different stakeholders, for example:
- Is avoidance about minimising the volume of peat excavated? (reduction of waste and minimising cost) – Yes
- Is avoidance about minimising the areas of carbon-rich soil impacted by excavation? (limited footprint of impact) – Yes
- Is avoidance about minimising the loss of area of peatland in pristine / good conditions? (protected biodiversity) – Yes
- Is avoidance about minimising loss of hydrological connectivity across on-site/off-site peatland and the wider functions of larger peat bodies? (ecosystem services) – Yes
Depending on the perspective of the stakeholder they may agree or disagree with some of the above statements, however they are overlapping in terms of reducing the impact of wind farm construction across peatlands. Avoidance is the essential first step in the hierarchy of reuse.
At times the timeline between site acquirement, site surveys, planning approval, and construction company deployment, leads to issues related to preparation and planning. Discussion with stakeholders highlighted that often the site surveys presented as part of the planning applications may not be at the detailed scale necessary to identify areas with the deepest peat (that should be avoided) at the construction stage. The construction contractors would like to avoid the areas with the deepest peat (due to costs and time, as well as to minimise the amount of peat disturbed) but are limited by what has previously been set out within the planning application. The condition of the existing peatland across the landscape prior to wind farm construction may not have been fully assessed, thus if the peat is already degraded the starting point for the reuse of peat will be lower and has the potential to degrade faster when disturbed.
Understanding the hydrological connectivity of the landscape will enable appropriate placement of drainage, this links closely to site condition – if there are already drier areas within the peatland, they may become drier over time with increased drainage. In some instances it is possible to reduce drainage after construction, if the areas being drained are reinstated with peat, however this is a consideration that should be made at the planning stage. Greater training needs to be provided for the construction operatives, both in terms of implementation of activities, but also to understand why it is important; as key to maintaining the quality of the peat during reuse, is minimising disturbance and maintaining the peat structure from the outset.
The importance of peatland for carbon storage is widely discussed both within the literature and by stakeholders, however, a key disconnection between the planning process and the completion of windfarm construction is the accuracy of the carbon calculations – it was widely discussed that in the majority of developments more peat is excavated than was planned. The actual amount of excavated peat is not used to recalculate the carbon loss and thus the overall impact of the wind farm development is not fully assessed. It also means the contractors inevitably have more peat excavated than was planned for reuse, thus the options for reuse of this peat may lack adequate planning for how to reuse appropriately. It is a pity contractors aren’t required to report how much peat has been excavated during the construction process, as this could improve the accuracy of estimates over time, but currently this data is not available or monitored. The condition of the peat that is reused is rarely monitored (at excavation or afterwards), therefore it is unclear whether this peat will continue storing the carbon it contains or whether carbon will be released into the atmosphere. Academic studies collecting empirical data on the release of carbon from disturbed peat are rare, and do not occur at a field scale or if they do these assessments usually occur in relation to agricultural disturbance rather than windfarm construction and are not wholly applicable. Where the peat was excavated from is also an important consideration for reuse – if it is taken from a borrow pit excavation this lends itself to borrow pit reinstatement, however if it is removed for cabling and road installation than returning the peat to this area (referred to as landscaping) may be a better option.
Recommendation 1: Guidance for Peat Reuse Options
Because detailed evidence to confirm the different environmental outcomes is not available, our recommendation is for a simple hierarchy of peat reuse options accompanied by some additional guidance and requirements which are essential for maximising environmental outcomes:
- Recommendation 1a: Preparation and Planning Steps:
- Avoiding / minimising peat excavation and
- Appraise site circumstances and locally relevant potential reuse options
- Recommendation 1b: Hierarchy of Peat Reuse
- Recommendation 1c: Peat Reuse Implementation Principles: to guide the site-specific choice of methods and implementation to maximise environmental outcomes.
The hierarchy is not useable as a standalone guide – it must be accompanied by the additional components – as shown in
.
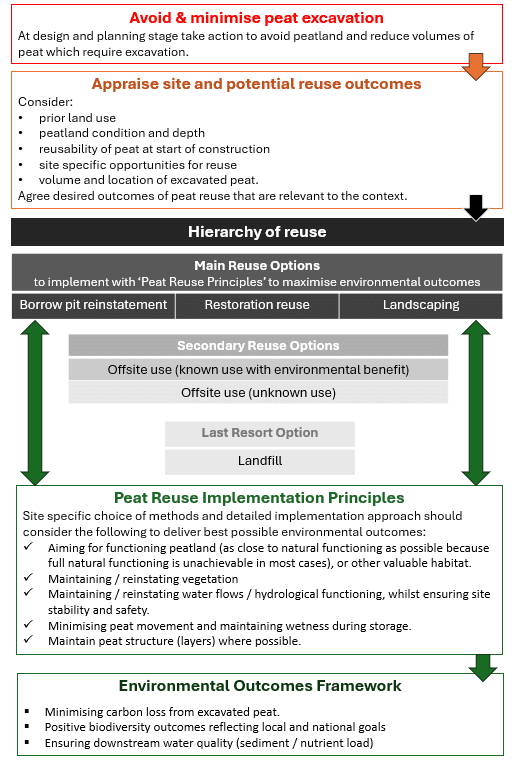
Figure 6: Guidance for Excavated Peat Reuse
Recommendation 1a: Preparation and planning steps
Is critical to conduct investigations to inform preparation and planning in order to maximise environmental outcomes – including first taking action to avoid peat extraction. Our recommended preparation and planning steps are set out in Table 6.
Table 6: Preparation and planning steps to accompany the hierarchy of peat reuse
|
Step 1: Avoidance | |
As per NPF4, avoidance of peat excavation is always the priority, in agreement with the NPF4 mitigation hierarchy. As part of the avoidance strategy, a “restorability assessment” should also be included – this should determine the condition of any peat that is due to be excavated and makes an assessment of the potential for reinstating the peat in that location. Taking into account the peatland condition, where it is located within the wider landscape, accessibility and how easy it may be to restore degradation in the future. As part of the avoidance strategy, as well as macro-level site decisions (e.g. develop on peat or not), micro-level decisions on site and in project designing and contracting should be considered to reduce the volume of peat excavated and/or impacted. For example, ensuring peat depth assessments are accurate and are used to guide any micro-siting[1] decisions. | |
|
Step 2: Preparation and planning: Appraise site and potential reuse outcomes | |
|
Preparation is critical for identifying the most beneficial options available on site and their feasibility. What is the depth of peat across the site? What has the peat been categorised as? If it is not in good condition, does it have potential for restoration? Has it been modified? Or drained? Aligning the details submitted within the application process (EIA) with further surveys, identifying depth and condition of peat at the exact locations for the tracks, turbines, general infrastructure and proposed reuse locations. Planning, with the desired outcome in mind, is crucial to the successful reuse of peat. Knowing the volumes of peat to be excavated and from where on the site. Knowing the depth of peat and the thickness of each layer (acrotelm and catotelm). Planning where the borrow pit and stockpile need to be located. Planning peat movements to minimise disturbance. Contacting other stakeholders that may be able to enhance reuse of peat activities. | |
|
Prior land use: |
Understanding what the starting land condition is. Has the land been used for other activities prior to wind farm planning? For example, many wind farms are being built on previous forest sites; some may have been used for grazing or are semi-natural habitats? These previous activities will impact drainage across the site, some areas may be drier or need to have the drained area restored, stump flipping may need to occur, and also natural regeneration of forest may affect the vegetative composition. |
|
Peat condition and depth: |
If the peat is in “good” condition prior to wind farm construction, this may negate some of the energy savings of renewable energy generation, as some studies have suggested that the carbon saved from the wind farm development won’t offset the damage to the environment. However, there are very few areas of pristine peatland in Scotland, and it is more likely to be a mosaic of conditions across the landscape – which may need to be considered regarding the progress of construction. The depth of peat in the area is also important, as deeper peats have different properties in terms of acrotelm, catotelm and underlying parent material. Very shallow peats are also a concern as they are more liable to mixing of soil and peat layers. |
|
Reusability of peat at start of construction |
The condition of peat prior to excavation will have an impact on its reusability. If the surrounding peatland is degraded, reused peat is unlikely to improve the conditions in the surrounding area (unlike peat extracted for restoration purposes). Inevitably, there will always be some degradation as peat is excavated (whether that’s through a loss of carbon or changes in porosity, hydrology, or vegetation coverage); thus minimising the amount of peat excavated will protect the environment. However, the counter point is that if the peat excavated is in very poor condition to begin with, it may not be able to be reused, and perhaps should not be excavated? |
|
Site specific opportunities for reuse: |
For all wind farms (and construction sites), the geographic limits for development activities are set (the development envelope). If there are areas where the reuse of peat would be more appropriate that is outside this area, than the reuse cannot occur there. Consideration should also be given to the site layout and options for reuse destinations – what is being constructed first and where. For example, the floating roads are often the first part of the infrastructure constructed to allow access to all areas. Where are the water courses and flows within the site, what is the connectivity with the wider landscape and habitats e.g. Is there an overlap with prior landuse or adjacent restoration work? Is the order of excavation and reuse appropriate to minimise carbon loss? |
|
Agree desired outcome for use of excavated peat: |
Setting a feasible intention (e.g. habitat to aim for) considering the site conditions and opportunities at the outset. |
Recommendation 1b: Hierarchy of reuse
The rational for the hierarchy of reuse set out in Table 7 reflects the available evidence for environmental outcomes of peat reuse. The main options all have potential to deliver positive environmental outcomes in comparison to the secondary options or landfilling but there is insufficient evidence to rank the main options further. Their feasibility and environmental outcomes will depend upon the site context and the way they are implemented.
The table provides a supplement to the available information on good practices for use and handling of soil and peat. The evidence of environmental outcomes of reuse options has many gaps currently. Where there is evidence, it cannot always be confidently applied to specific sites and circumstances. Therefore, these principles / considerations are taking the precautionary principal approach and should be used as stepping stones reflecting the consensus amongst technical experts about things which are important to consider in the absence of a complete evidence base.
Table 7: Underlying rationale and details related to hierarchy of reuse of peat
|
(1) Main re-use options | ||
|
Borrow pit reinstatement or infill |
Borrow pit reinstatement involves putting excavated peat into a borrow pit at the end of the period of use. Potential desired outcomes can vary and should be informed by the planning steps. Key priorities: Aim for a functioning bog, then consider other locally valuable habitats. Management / design needs to prioritise setting up the reinstated borrow pit appropriately for desired outcomes e.g. including an impermeable layer at the bottom of the pit; water outlet to hydrologically link the borrow pit to the rest of the peatland habitat; layered in a similar way to how it was excavated (including a vegetation layer). Aim to only move peat once if possible. Otherwise, if the peat that is removed from the borrow pit will be returned to the borrow pit it will need to be stockpiled prior to reuse. Reinstating the surface vegetation appropriately should enable recolonisation of the surface layer which will aid the development of a functioning bog habitat and increase biodiversity. Rationale:
| |
|
Other reinstatement |
There are other areas impacted by wind farm developments that could be consider for reinstatement – for example areas that have been used for building compounds, crane pads, temporary access tracks etc Reinstatement involves the reuse of peat to blend the natural habitat with the infrastructure disturbance as a way to encourage vegetation re-growth. Key priorities: Maintaining hydrological connectivity between the reuse of peat and the landscape in situ. High risk of the peat drying out leading to erosion. To reduce this risk it is important to follow the peatland restoration technical compendium and future requirements of the forthcoming Scotland Peatland Standard. | |
|
Restoration |
Restoration involves the reuse of excavated peat by incorporating it into areas of peatland on site that have previously been degraded through anthropogenic activities – for example forestry or peat-cuttings directly accessible from the development site. This can offset (compensate) for some of the residual impact of the development or for enhancing peatland conditions in support of the reinstatement of functional peatland. A number of discussions with stakeholders presented examples of this type of restoration occurring on wind farm developments. Although the results are unpublished, the results show promise as a way of delivering enhanced environmental benefits as part of the construction process. Key priorities: Design must be site specific aiming for functioning peatland or other locally valuable habitat. After a thorough site survey, areas that are degraded peat should be identified and considered part of the reuse process. For long term success of this reuse method there needs to be collaboration between peatland restoration experts alongside the construction sector and use of the peatland restoration technical compendium alongside the Scotland Peatland Standard. Rationale:
| |
|
Landscaping (road verges, embankment slopes etc) |
Landscaping involves reinstatement of peat above cabling and alongside floating roads and embankments. Often the excavated peat is from where the cable is to be laid and will be returned to where it was extracted from, however alongside roads and embankments may be from other areas. Key priorities: Care needs to be taken to maintain peat layering and planning related to hydrology needs to occur (as the peat above the cable risks being hydrologically isolated if situated between the floating road and drainage channels). Floating roads are often higher than the surrounding habitat, as aggregate and geotextile mesh has been put down as part of the construction process, this creates an island effect. It is important to consider the vegetation when reusing peat as part of the landscaping process. It is crucial to not reinstate peat on top of vegetation, this may mean that vegetation needs to be lifted away to reuse peat prior to returning the vegetation to the area. Rationale:
| |
|
Secondary options (2,3) | ||
|
There is limited interest in reusing peat offsite and for the majority of construction projects it does not appear to occur. Questions were asked of stakeholders to assess if excavated peat could be reused within the horticulture sector, whisky industry or other aspects of the construction or energy sector. In all instances the answer was a definitive no, there is no evidence for the reuse of peat offsite in these sectors as part of wind farm construction, it does not occur. This is likely due to the volumes of peat involved and the sporadic nature of the supply chain, also as the Scottish Government has committed to phasing out the use of peat in horticulture this is unlikely to gain momentum as a viable option. There are instances where an area has lost peat previously due to land use activities and offers an opportunity for excavated peat to be reused as part of restoration. An example from the stakeholder consultation was where the reuse of peat from a wind farm construction was used to reinstate an area of mining that had occurred nearby. It is important to note that if onsite reuse cannot occur all endeavours should be made to undertake these secondary options prior to the last option of landfill which should be avoided. | ||
|
(2) Offsite (known use) |
This reuse occurs on a case-by-case basis and usually occurs where the land ownership or construction operators are linked. For it to occur more frequently, greater planning and preparation needs to be implemented prior to excavation and transport. | |
|
(3) Offsite (unknown use) |
Where peat has been extracted and there was no reuse plan in place for it, this could lead to unknown use offsite. This reuse is very unlikely to occur but when it does it is usually in small quantities e.g. for novel trials of reuse options. This is because once peat leaves the site it will be considered waste and is also costly to transport. | |
|
(4) Last resort option | ||
|
Landfill |
This should be considered a “last resort” option, and all other options should be prioritised before this. | |
Recommendation 1c: Peat Reuse Implementation Principles
The effectiveness and likely outcomes of different methods of peat reuse is heavily dependent on-site specific context, feasibility of achieving the desired outcome, and the detailed design of the method (such as borrow pit infill design). Thus, any hierarchy needs to be flexible, but decisions should be guided by a set of principles to maximise environmental outcomes. These include:
- Aiming for functioning peatland (as close to natural functioning as possible because full natural functioning is likely to be unachievable in most cases), or other valuable habitat if not possible.
- Maintaining / reinstating vegetation
- Maintaining / reinstating water flows / hydrological functioning, whilst ensuring site stability and safety.
- Minimising peat movement
- Maintain peat structure (layers) where possible.
See Table 8 below for more detail.
Putting these into practice is facilitated by the preparation steps set out in Recommendation 1a above. For example greater detail could be requested prior to planning consent, because most peatland management plans lack depth and site-specific details. Requiring this information prior to the start of the construction process will increase the likelihood that planning, and preparation will be undertaken to the necessary extent to improve the outcomes of peat reuse. This would move the onus from contractor and place it with the energy company / landowner that ‘owns’ the consent and is responsible for full legal compliance. Greater detail within the PMPs would also provide a more accurate understanding of the true quantities of peat to be excavated, by including a requirement under the consent for accurate recording and in turn enhance the reuse strategy to be implemented. This could also provide future developments with more accurate calculations to use within their planning applications and PMPs. However, it is beyond the scope of this research to identify where responsibility lies for receiving and reviewing such additional material.
It was clear through the stakeholder consultation that there are a number of very knowledgeable groups working within the sector (Appendix B, including environmental government organisations, wind farm contractors, energy companies, environmental consultants from the private sector, as well as academics and conservation organisations). Capturing this knowledge to ensure recommendations for best practice are supported by what is practical will improve the wind farm construction process in the future.
Table 8: Peat reuse implementation principles – further explanation
|
Peat reuse implementation principles | |
|
Hydrological connectivity |
Mapping out the connectivity of the site, will enable better drainage planning, targeted to ensure site stability / safety and support the desired peat reuse goal e.g., desired habitat. It will also enable more successful reuse of the peat if it is kept wet and can connect into the hydrology of the surrounding land at the location of reuse. |
|
Minimise peat handling and disturbance |
If enough planning has occurred, it may be possible to only need to move the peat once – from where it is excavated to the site of reuse. This also avoids storage of excavated peat, which generally leads to undesirable changes in peat properties, e.g. loss of water, bulk density increase, carbon loss, damage to microbial populations |
|
Separation of peat layers |
When excavating peat, the success of reuse will be increased if the different peat layers are kept separate (acrotelm, catotelm, and underlying mineral soil) as they have very different properties. |
|
Maintain wetness of stockpiles |
Stockpiling of excavated peat should be avoided where possible. If necessary to stockpile peat, stockpiles should be watered when necessary to maintain wetness. If the surface of peat dries out, a hydrophobic layer may form. This reduces the overall infiltration rate of the peat blocks and may lead to further desiccation and other negative impacts, as noted above under ‘Minimise disturbance and avoid storage/stockpiling’. |
Recommendation 2: Environmental outcomes framework
Multiple environmental outcomes should be targeted through peat reuse. To avoid excessive focus on one environmental measure of success, we recommend the following environmental outcomes should be considered when deciding on which peat reuse option to implement on site. These environmental outcomes should be monitored to assess success (see Table 9 for rationale):
- Minimising carbon loss from excavated peat
- Positive biodiversity outcomes reflecting local and national goals
- Ensuring downstream water quality (sediment / nutrient load)
Following on from Recommendation 1 and the hierarchy of reuse options, environmental outcomes framework indicates the priority environmental outcomes for peat reuse. These should be considered by the consenting authority as part of the planning process, in conjunction with the EIA process and developers should be considering these in their development plans. We recommend the consenting authority to check that the applicant has fully considered these areas within the planning proposal as part of their strategy for reuse. The environmental outcomes framework should also guide subsequent monitoring and evaluation, during and after construction. Clarity on what environmental outcomes could potentially be achieved from peat reuse can support all parties to deliver better environmental outcomes.
Table 9: Rationale for Environmental Outcomes Framework for Peat Reuse
|
Outcome |
Rationale for inclusion in the Framework |
|
Minimising carbon loss from excavated peat |
Carbon can be lost as the peat is disturbed primarily through hydrological changes and erosion – these two processes are interlinked, as erosion is more likely when peat starts to dry out. Leading to the loss of particulate organic carbon (POC) which is more easily transported by wind or water erosion. As the peat dries out and is exposed to oxygen, aerobic decomposition of the organic matter starts to occur, releasing the stored carbon as CO2. As carbon is lost subsidence of the peatland may also occur, this has knock-on concerns for the wider environment and safety and stability of the wind farm. Where the excavated peat has been left bare of vegetation carbon loss and erosion are also a greater risk. |
|
Positive biodiversity outcomes reflecting local and national goals |
Enabling the regrowth of peatland vegetation (particularly indicative peatland species like sphagnum mosses) helps rebuild peat structure and enhances carbon sequestration potential, but it also improves the wider biodiversity within the environment. However, studies focusing on peatland restoration have shown that vegetation is slow to recover and even ten years after restoration the vegetation present can still be dissimilar to pristine peatlands (Kareksela et al., 2015). Thus greater consideration is necessary related to vegetation regrowth to maximise its potential. Within our recommendations we have advised on best practice for the reuse of peat, however action should also be taken to maintain vegetative cover alongside this reuse. Whether this is through moving the vegetation layer as part of the reinstatement of reused peat, seeding the reused peat, or if there is existing vegetation in the area planned for peat reuse, stripping this off and placing aside, so that the vegetation can be replaced once the reused peat is reinstated in the area and stabilise the peat. |
|
Ensuring downstream water quality (sediment / nutrient load) |
Excavated peat can lead to increases in dissolved organic carbon (DOC) within water systems leading to changes in downstream water quality, as well as increased sediment loads. This can be through the physical disturbance of the construction process increasing water erosion and DOC leaching. Drainage can cause hydrological alterations and redirect water flows, mobilising sediments (POC) and DOC leading to increased carbon losses and peatland erosion (Grieve & Gilvear, 2008). |
Recommendation 3: Improved research and monitoring
In discussion with stakeholders, some monitoring is occurring post wind farm construction for peat reuse, usually by the landowner or energy company, however as discussed previously this monitoring is not mandatory and usually focuses on novel uses, or where the reuse appears to have been successful. We recommend:
- Monitoring of environmental outcomes of peat reuse for the life of the windfarm, EIAs often require follow up monitoring in relation to biodiversity post-construction, however Peatland Management Plans (PMPs) do not. We recommend greater considerations is given to PMPs as part of follow up monitoring to include:
- Monitoring of peat levels, and wetness around the wind farm, irrespective of reuse option, this should occur to identify areas that may be drying out due to drainage, or where too much waterlogging may be occurring because of the changes in hydrology caused by the construction process.
- Monitoring of vegetation cover and types, for example through vegetation surveys are used as indications of functioning peatlands, but other measures (like DOC within the water catchment or carbon fluxes) could provide a more nuanced understanding of the impact reuse is having on the wider environment.
- Greater sharing of this data and collaboration with the academic community, would also enable further distinctions of best practice to occur. We recommend a formal advisory relationship to form between developers and the research community facilitated by Scottish Government, so that data sharing can occur and consenting authorities have access to better knowledge of effective peat reuse being undertaken. Data that has historically been collected but has not been reported on could be shared initially to assess how a collaborative data sharing process may work. The current lack of data sharing and credible longitudinal studies was noticeable at the site visits for wind farms that had been commissioned 10+ years previously – key details had been lost with job changes / retirement that could have benefitted the wind farm sector as a whole, with improved understanding of what is now visibly working and what hasn’t worked so well.
Research gaps
There are many research gaps that have been highlighted throughout this study. These could be addressed through the following actions:
- The exact volume of peat excavated across a wind farm development is not known at completion of construction → We recommend asking the contractors to update records at the end of construction. Building on this we recommend a study to assess the differences between the amount of peat stated to be extracted prior to the wind farm development commencing compared to the wind farm after construction has finished. This could also be used to improve the accuracy of the carbon calculator providing a more accurate picture of the true carbon losses after completion of construction.
- Understanding how the carbon content changes within the peat volume over time for all reuse options → We recommend monitoring projects focusing on carbon loss and GHG emissions
- Seeing how the full GHG balance for infilled borrow pits changes dependent on size and age of the borrowpit → We recommend that monitoring of infilled borrow pits including size and volume, and hydro connectivity needs to occur at regular intervals
- The environmental outcomes of borrow pits have not been fully assessed → We recommend collecting monitoring data of the regeneration of plants and biodiversity over time will enable this.
- Reviewing available printed information on best practice (and standard practice) → Likely this is very limited and may involve contacting energy companies to access internal data and reports. We recommend greater collaboration between the energy companies and academia, with a greater amount of data sharing. Funding opportunities are usually the best way to encourage engagement between different stakeholders.
- The level of revegetation on peat that had previously been excavated appears to be reliant on natural recolonisation, how well this occurs is not thoroughly understood. → We recommend monitoring how plants recolonise the excavated peat that has been reused which would enable a better understanding of best practice. From discussions with stakeholders there is limited reseeding occurring and it is largely left to natural revegetation. However, this is more likely to occur if the surface plants are maintained (removing the in situ plants, redistributing the reused peat and returning the plants on top should enhance recolonisation rates).
Conclusions
These results highlight our current understanding of peat reuse methods occurring in wind farm construction in Scotland. We have identified the critical environmental issues and how the reuse of peat can maintain the habitat, allowing for environmentally conscious construction techniques to take precedence.
However, the overriding synthesis of the information gained during this process is that planning prior to construction is key, as well as ensuring that stakeholders work together to achieve best practice. Avoidance of excavation of deep peat is the first priority. Next, acknowledging that once peat is excavated full consideration of how best to reuse it (ideally only moving it once and keeping the different layers separate, while aiming to keep the peat wet and/or maintaining hydrological connectivity) are crucial.
After these main outcomes from the hierarchy, attention needs to focus on delivering site specific reuse. It also became apparent that although there is a lot of knowledge within the peatland and wind farm sector, there has been limited studies collecting data to inform best practice. This needs to be encouraged to understand current research gaps and advise on the right management methods to reduce peatland degradation in the long term.
References
Albanito, F., Roberts, S., Shepherd, A., Hastings, A., 2022. Quantifying the land-based opportunity carbon costs of onshore wind farms. Journal of Cleaner Production 363, 132480.
Armstrong, A., Burton, R.R., Lee, S.E., Mobbs, S., Ostle, N., Smith, V., Waldron, S., Whitaker, J., 2016. Ground-level climate at a peatland wind farm in Scotland is affected by wind turbine operation. Environmental Research Letters 11, 044024.
Austin, K.G., Elsen, P.R., Coronado, E.N.H., DeGemmis, A., Gallego-Sala, A.V., Harris, L., Kretser, H.E., Melton, J.R., Murdiyarso, D., Sasmito, S.D., Swails, E., Wijaya, A., Winton, R.S., Zarin, D., 2025. Mismatch Between Global Importance of Peatlands and the Extent of Their Protection. Conservation Letters 18, e13080.
Balode, L., Bumbiere, K., Sosars, V., Valters, K., Blumberga, D., 2024. Pros and Cons of Strategies to Reduce Greenhouse Gas Emissions from Peatlands: Review of Possibilities, Applied Sciences.
Bragg, O.M., 2002. Hydrology of peat-forming wetlands in Scotland. Science of the Total Environment 294, 111-129.
Brehm, T., Culman, S., 2022. Pipeline installation effects on soils and plants: A review and quantitative synthesis. Agrosystems, Geosciences & Environment 5, e20312.
Chico, G., Clewer, T., Midgley, N.G., Gallego-Anex, P., Ramil-Rego, P., Ferreiro, J., Whayman, E., Goeckeritz, S., Stanton, T., 2023. The extent of wind farm infrastructures on recognised European blanket bogs. Scientific Reports 13, 3919.
Detrey, I., 2022. Bog in a Box: Is long term peat storage for future restoration viable? University of the Highlands and Islands, UHI.
Dykes, A.P., 2022. Landslide investigations during pandemic restrictions: initial assessment of recent peat landslides in Ireland. Landslides 19, 515-525.
Elmes, M.C., Petrone, R.M., Volik, O., Price, J.S., 2022. Changes to the hydrology of a boreal fen following the placement of an access road and below ground pipeline. Journal of Hydrology: Regional Studies 40, 101031.
Evans, M.G., Burt, T.P., Holden, J., Adamson, J.K., 1999. Runoff generation and water table fluctuations in blanket peat: evidence from UK data spanning the dry summer of 1995. Journal of Hydrology 221, 141-160.
Ferretto, A., Brooker, R., Aitkenhead, M., Matthews, R., Smith, P., 2019. Potential carbon loss from Scottish peatlands under climate change. Regional Environmental Change 19, 2101-2111.
Grieve, I.C., Gilvear, D., 2008. Effects of wind farm construction on concentrations and fluxes of dissolved organic carbon and suspended sediment from peat catchments at Braes of Doune, central Scotland. Mires and Peat 4.
Heal, K., Phin, A., Waldron, S., Flowers, H., Bruneau, P., Coupar, A., Cundill, A., 2020. Wind farm development on peatlands increases fluvial macronutrient loading. Ambio 49, 442-459.
Jennings, P., Kane, G., 2015. Geotechnical engineering for wind farms on peatland sites, Geotechnical Engineering for Infrastructure and Development, pp. 595-600.
Jorat, M.E., Minto, A., Tierney, I., Gilmour, D., 2024. Future Carbon-Neutral Societies: Minimising Construction Impact on Groundwater-Dependent Wetlands and Peatlands, Sustainability.
Kareksela, S., Haapalehto, T., Juutinen, R., Matilainen, R., Tahvanainen, T., Kotiaho, J.S., 2015. Fighting carbon loss of degraded peatlands by jump-starting ecosystem functioning with ecological restoration. Science of the Total Environment 537, 268-276.
Lehan, K., McCarter, C.P.R., Moore, P.A., Waddington, J.M., 2022. Effect of stockpiling time on donor-peat hydrophysical properties: Implications for peatland restoration. Ecological Engineering 182, 106701.
Lindsay, R., 2014. Impacts of artifical drainage on peatlands. IUCN UK Committee Peatland Programme. Briefing Note Number 3.
Lindsay, R., 2018. Peatlands and Wind farms: Conflicting Carbon Targets and Environmental Impacts, In: Finlayson, C.M., Milton, G.R., Prentice, R.C., Davidson, N.C. (Eds.), The Wetland Book: II: Distribution, Description, and Conservation. Springer Netherlands, Dordrecht, pp. 413-425.
Monteverde, S., Healy, M.G., O’Leary, D., Daly, E., Callery, O., 2022. Management and rehabilitation of peatlands: The role of water chemistry, hydrology, policy, and emerging monitoring methods to ensure informed decision making. Ecological Informatics 69, 101638.
Moravec, D., Barták, V., Puš, V., Wild, J., 2018. Wind turbine impact on near-ground air temperature. Renewable Energy 123, 627-633.
Morton, P.A., Heinemeyer, A., 2019. Bog breathing: the extent of peat shrinkage and expansion on blanket bogs in relation to water table, heather management and dominant vegetation and its implications for carbon stock assessments. Wetlands Ecology and Management 27, 467-482.
Natural England, 2013. Natural England Evidence Reviews: guidance on the development process and methods (NEER001). Natural England.
Renou-Wilson, F., Farrell, C., 2009. Peatland vulnerability to energy-related developments from climate change policy in Ireland: the case of wind farms. Mires and Peat 4.
Sander, L., Jung, C., Schindler, D., 2024. Global Review on Environmental Impacts of Onshore Wind Energy in the Field of Tension between Human Societies and Natural Systems, Energies.
Scottish Environment Protection Agency, 2017. Developments on peatland: guidance on the assessment of peat volumes, reuse of excavated peat and the minimisation of waste. SEPA Guidance, WST-G-052, version 1, available from https://www.sepa.org.uk/media/287064/wst-g-052-developments-on-peat-and-off-site-uses-of-waste-peat.pdf
Scottish Natural Heritage, 2013. Research and guidance on restoration and decommissioning of onshore wind farms. NatureScot Commission Report No 591, available at https://www.nature.scot/doc/naturescot-commissioned-report-591-research-and-guidance-restoration-and-decommissioning-onshore
Scottish Renewables, Scottish Natural Heritage, Scottish Environment Protection Agency, Forestry Commission Scotland and Historic Environment Scotland, 2015. Good Practice during Wind Farm Construction, version 3, available from https://www.nature.scot/doc/good-practice-during-wind-farm-construction
Smith, J., Nayak, D.R., Smith, P., 2014. Wind farms on undegraded peatlands are unlikely to reduce future carbon emissions. Energy Policy 66, 585-591.
Smith, P., Smith, J., Flynn, H., Killham, K., Rangel-Castro, I., Foereid, B., Aitkenhead, M., Chapman, S., Towers, W., Bell, J., Lumsdon, D., Milne, R., Thomson, A., Simmons, I., Skiba, U., Reynolds, B., Evans, C., Frogbrook, Z., Bradley, I., Whitmore, A., Falloon, P., Scottish Executive, Welsh Assembly Government, 2007. ECOSSE: Estimating Carbon in Organic Soils – Sequestration and Emissions: Final Report, Web only.
Tanneberger, F., Moen, A., Barthelmes, A., Lewis, E., Miles, L., Sirin, A., Tegetmeyer, C., Joosten, H., 2021. Mires in Europe—Regional Diversity, Condition and Protection, Diversity.
Waldron, S., Smith, J., Taylor, K., McGinnes, C., Roberts, N., McCallum, D., 2018. Repowering onshore wind farms: a technical and environmental exploration of foundation reuse. Carbon Landscapes and Drainage KE Network-led report. DOI 10.17605/OSF.IO/SCZDE
Wawrzyczek, J., Lindsay, R., Metzger, M.J., Quétier, F., 2018. The ecosystem approach in ecological impact assessment: Lessons learned from wind farm developments on peatlands in Scotland. Environmental Impact Assessment Review 72, 157-165.
Williams-Mounsey, J., Grayson, R., Crowle, A., Holden, J., 2021. A review of the effects of vehicular access roads on peatland ecohydrological processes. Earth-Science Reviews 214, 103528.
Zheng, Y., Waldron, S., Flowers, H., 2018. Fluvial dissolved organic carbon composition varies spatially and seasonally in a small catchment draining a wind farm and felled forestry. Science of the Total Environment 626, 785-794.
Appendix A – Research scope, questions and methods
Research Scope and Questions
To provide a comprehensive overview of the current state of knowledge, identify key knowledge gaps, and highlight areas for future research and policy development in sustainable peatland management within the context of renewable energy infrastructure, particularly in Scotland, this review has centred on the below questions:
Current practices:
- How are excavated peat management and reuse practices being employed (of relevance for Scottish wind farm developments) both on-site and off-site?
Environmental impacts of current methods:
- What are the impacts and/or benefits of current peat reuse practices in relation to hydrology and water quality, carbon emissions and storage, biodiversity and habitats?
- Are there any environmental risks associated with current peat reuse practices, such as increased sediment load, erosion or landscape instability?
- How do impacts change over time – what timeframes are relevant and are there long-term impacts of peatland disturbance and reuse practices?
Limitations and challenges:
- What are the technical limitations of using excavated peat on-site?
- How do regulatory frameworks impact the options for peat reuse?
Best practices:
- From current available evidence, what peat reuse practices are preferable for minimising GHG emissions and wider negative environmental impacts?
- How can peat management plans be optimised to maximise environmental benefits and minimise carbon losses?
Development of a reuse hierarchy
- Hierarchy of Peat Reuse
- Preparation and Planning Steps
- Peat Reuse Implementation Principles
Research Methods
The following sections describe the information collation methods and data sources used in this study, these methods have been kept purposefully brief here, for more detail please see the appendices. A project database was compiled in Excel and is supplied separately to this project report.
Rapid Evidence Assessment
The method used for performing the evidence review was based on the Natural England (2013) evidence review methodology to ensure that the approach was transparent, objective and rigorous, allowing for robust evidential conclusions to be drawn from the available information for a full description see Appendix A.
Rapid Evidence Assessment methodology
The method used for performing the evidence review was based on the Natural England (2013) evidence review methodology to ensure that the approach was transparent, objective and rigorous, allowing for robust evidential conclusions to be drawn from the available information.
Scope
This rapid evidence assessment (REA) focused on synthesizing current evidence related to peatland excavation and reuse within the context of wind farm construction and similar large-scale developments. The assessment covered:
- Current standard practices of peatland excavation and management in development projects.
- Environmental impacts of peatland disturbance.
- Opportunities for reuse of excavated peat on-site and off-site, including their environmental benefits and limitations over different timescales
- Best practices for minimizing peatland disturbance and optimizing peat management plans.
Evidence search approach
The methodology comprises five main steps:
- Define search strategy including keyword list compilation and define inclusion/exclusion criteria.
- Searching for evidence and record findings.
- Title and abstract screen.
- Evidence extraction.
- Evidence synthesis and evidence gap identification.
Step 1: Keyword list compilation
To establish a systematic search strategy, a list of key search words, search terms and suitable combinations were developed (included in separately shared document). These search terms were recorded for systematic use by the review team to reduce bias.
Step 2: Identification of information sources
In order to develop a comprehensive and relevant evidence base, appropriate information sources were identified. To reduce the risk of publication bias on the evidence base a range of information sources were used, which enabled access to peer-reviewed literature, grey-literature, and unpublished sources.
For this review Science Direct and Scopus were used to identify peer-reviewed information. Google Scholar and Research Gate provided further access to peer-reviewed information to enhance the literature search. Grey literature was also identified in the search and included industry reports and relevant committee proceedings.
Step 3: Evidence search
To facilitate the repeatability and transparency of the search process evidence searches were carried out as Boolean searches (AND, OR, NOT, etc). For example, using Boolean operators we searched (“excavated peat” OR “peatlands” OR “peat bogs” OR “carbon rich soils”) AND (“reuse” OR “recycling” OR “repurposing” OR “reclamation” OR “displaced” OR “borrow pits”) AND (“wind farms” OR “wind turbines” OR “wind energy” OR “onshore wind” OR “renewable energy”) AND (“sustainability” OR “environmental impact” OR “eco-friendly” OR “carbon footprint” OR “climate change” OR “carbon flux” OR “soil restoration” OR “land rehabilitation” OR “habitat restoration” OR “conservation”). The results of each search were recorded, including the number of search hits and number of relevant records returned, date of search and database used. Any other sources, such as evidence provided by stakeholders or generated through stakeholder engagement meetings were also documented similarly.
Developing and establishing search strings was treated as an iterative process and, as such, search strings were amended or adapted to optimise search relevance particularly where the number of search hits or relevance of records retrieved are excessively large or small.
Step 4: Title and abstract screen
In order to allow for a systematic and repeatable approach to screening whilst minimising individual subjectivity and bias, results of the evidence search were screened by title and abstract against pre-established inclusion and exclusion criteria for the review question(s). Evidence that did not satisfy the inclusion criteria were not taken forward for further analysis. References and key details (search date, search terms, publication name, database source and a DOI) were captured for all selected literature. Duplicates are also removed at this stage.
Step 5: Evidence extraction
To allow for interpretation and evaluation of the available literature evidence. A consistent, systematic approach to extracting evidence was taken for each item in the evidence item. Information was extracted on the basis of the review questions. Collated information included details of the type of study, the situation studied, key outcomes, endpoints and geographical extent (reported in separately shared excel document).
Step 6: Evidence synthesis and evidence gap identification
The compilation of evidence allowed for the type and amount of evidence obtained to be scrutinised and for any key evidence gaps or conversely areas of extensive evidence to be highlighted. This allowed for conclusions to be drawn based on the findings review and further enabled the appraisal of whether the collated evidence was adequate and suitable for addressing the review question. The collated information from the review of the literature is detailed in Supplementary Document 1 (finalisation in process).
Availability of the literature
The Rapid Evidence Assessment methodology used (Appendix A) obtained over 250 articles and reports through a range of keyword searches, in Science Direct and Google Scholar as described above. These were screened based on their title and abstract to identify relevant articles. This resulted in 50 articles and reports that were flagged as relevant for further scrutiny. These articles were then reviewed, and key information was extracted and is included within this report.
Desk-based research into current practices
A list of current wind farms in Scotland was obtained from the renewable energy planning database[12] (October 2024, quarter 3) sorted by energy type, location and whether they were currently operational (Figure 7). A sample of wind farms were chosen (as examples of a range of sizes of wind farms and locations across Scotland), to review the information provided within the peatland management plans, amount of peat to be excavated (if stated within application) and other related environmental planning information where obtained.
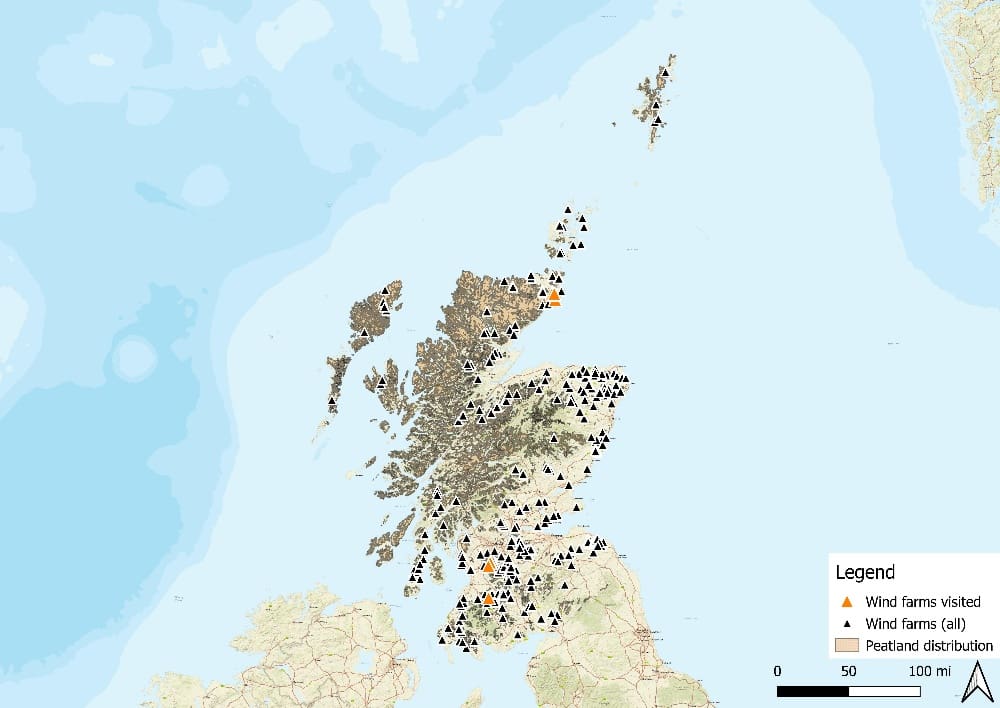
Figure 7. The distribution of wind farms across Scotland with peatland also highlighted. A list of current wind farms in Scotland was obtained from the renewable energy planning database[13] (October 2024, quarter 3) sorted by energy type, location and whether they were currently operational these were plotted on to a map of Scotland along with the distribution of peatland taken from Carbon and Peatland 2016 map[14].
Site visits
Five wind farm site visits were undertaken in November 2024 (Figure 3), these included three wind farms in the North-east of Scotland and two wind farms in the South-west of Scotland. These sites were chosen to cover a broad geographic distribution, a range of ages (different amounts of time since construction), and variation in peat depth. Visiting these sites provided a greater understanding of what was happening as part of the wind farm construction process, alongside providing context as to how peatland management plans are implemented and the many possible variations which can occur due to the amount of peat extracted, weather conditions and the inherent habitat quality prior to wind farm construction. These site visits also provided ‘real world’ examples of management practices in use, including (a) borrow pit reinstatement (over varying time periods – currently under construction, recent construction (< 5 years), 5-10 years since reinstatement, 10+ years since reinstatement), and (b) the replacement of peat at the side of the constructed roads (as part of the landscaping process and/or to maintain peat levels across the habitat).
Stakeholder Engagement Methods
During the study stakeholders were engaged for the following reasons:
- To gain insights into current practices for reuse of peat excavated on wind farms in Scotland.
- To gather views on the strengths, weaknesses, applicability and environmental outcomes of different reuse methods.
- To gather suggestions for examples and sites which could provide learning about the two points above.
- To gain input into the development of recommendations for reuse of excavated peat.
Appendix B Stakeholder engagement
Summary stakeholder engagement approach
Methods of stakeholder engagement:
Several different types of stakeholder engagement were employed in the study to gain further insights into relevant issues, current and potential future peat reuse methods, related considerations and impacts and to help identify sites to visit, get sign-posted to relevant documentation and research resources, and to understand considerations which are being or could be taken into account when decisions about reuse of excavated peat are made. Table 10 provides a brief overview of methods.
Table 10. Overview of stakeholder engagement methods
|
Dates |
Activities |
Purpose |
|
Oct-Dec 2025 |
Research interviews with stakeholders / technical specialists. |
Supplement desk-research. |
|
Nov 2025 |
Site visits to wind farms incorporating local / other stakeholder engagement. |
Gain insights into reuse activities on site, local context, site characteristics and how decisions were made. |
|
Dec 2025 |
Academic / technical specialist online workshop |
Supplement desk research, sense-check and refine draft recommendations. |
Approach to identifying and selecting stakeholders to engage:
The project sought engagement with a range of different types of stakeholders academics and experts, such as those with a track record of relevant publications (i.e. on topics linked to the use of peat on wind farms in Scotland); practitioners from the energy sector (e.g. Ecological Clark of Works (ECoW) / Ecology officers) with wind farm sites in Scotland and from the construction sector that have been involved in building wind farms in Scotland; Civil Servants (Forestry and Land Scotland, PEAG); and conservation organisations (IUCN UK Peatland Programme). A selection of stakeholders were invited to attend the academic workshop, as well as a series of one-to-one discussions.
This approach to stakeholder engagement enabled the facilitation of site visits along with group discussions.
We identified stakeholders via:
- Introduction / recommendations from the project steering group – a group of specialists from across relevant Scottish Government Agencies (see Section 8.1.7.3)
- Desk research / REA – to identify relevant academics
- ‘Snowballing’ – asking our contacts and contacts via the steering group or other interviewees to recommend relevant technical experts or industry contacts who could provide access or insights about wind farm sites.
- We have sought a diversity of sites, with reasonable access – but to include a site further North if possible due to variation in vegetation colonisation rates for reuse on site.
When selecting wind farm sites to visit we aimed to achieve a diverse range of sites with reasonable access where we would be able to observe a range of different types and ages of reuse of excavated peat. We chose to include sites in different locations, including some further North due to variation in vegetation colonisation rates which we were advised in earlier stakeholder interviews could likely influence the outcome / progression of reuse methods. We contacted several wind farmer developers / operators – some via introduction and some via publically available contact details and also landowners such as Forestry and Land Scotland. The final selection of sites for visit was based on who was willing to host a visit and practical feasibility in the project timescale and available resources (see Section 9.4). During the visits our hosts often shared wider insights about considerations for reuse of peat and examples from other sites which had worked well or less well – these insights are included in the summary findings here.
When selecting stakeholders to interview we tried to ensure a diverse range of perspectives, but we did not set out to achieve a rigorous sampling approach – we had to take a more pragmatic approach to gather insights from willing participants. The snow-balling approach was valuable in helping us identify people to speak to with relevant scientific and technical knowledge and who could provide insights into what had happened on specific sites. We made a deliberate effort to speak to some stakeholders from outside industry organisations, including academics, non-profit organisations and contractors/technical consultants to achieve some balance in our research. A full list of interviews is in Section 8.1.7.1.
Stakeholder workshop
We held an online workshop for academics and technical specialists on 16th December 2025 from 14:00 to 16:30. In total, 23 people attended (in addition to the Ricardo project team) including academic researchers, non-profit organisations, government agencies, energy company peatland specialists, see Section 8.1.7.2 for the list of attendees.
Workshop aims and objectives:
- Gather insights from previous research and ongoing studies which may not yet be published, to fill research gaps.
- Get insights into challenges / complexities which may need to be taken into account as we develop recommendations e.g. considerations for applying research results to different contexts / climates.
- Discuss, test and refine initial ideas for a hierarchy of excavated peat reuse (or similar simple structured approach which could help guide decisions on peat reuse, depending on what has come from our earlier research.
Whilst the focus of the workshop was to engage academic researchers and technical experts, we also had attendees from industry who were technical specialists with relevant insights to share about their experiences with peat reuse in practice and the day-to-day challenges associated with planning, implementation and evaluation of peat reuse.
Workshop agenda:
Table 11. Workshop agenda
Time |
Session |
14:00 |
Introduction: project framing, context and scope; participant introductions. |
14:20 |
Project literature review overview & stakeholder feedback |
14:55 |
Examples of current practices drawn from sites visits / stakeholder interviews: comments, questions, sharing other examples. |
15:10 |
Stakeholder discussion / feedback |
15:30 |
Present initial recommendations / peatland reuse hierarchy |
15:40 |
Stakeholder feedback on recommendations / hierarchy |
16:10 |
Final Polls: Feedback on options for recommendations |
16:20 |
WRAP up and next steps |
Findings from the workshop are incorporated into the stakeholder research results below (Section 8.1.6) and results of polls in Figure 8.
Figure 8: Results of word cloud (a) and other polls (b and c) undertaken during stakeholder workshop
a)
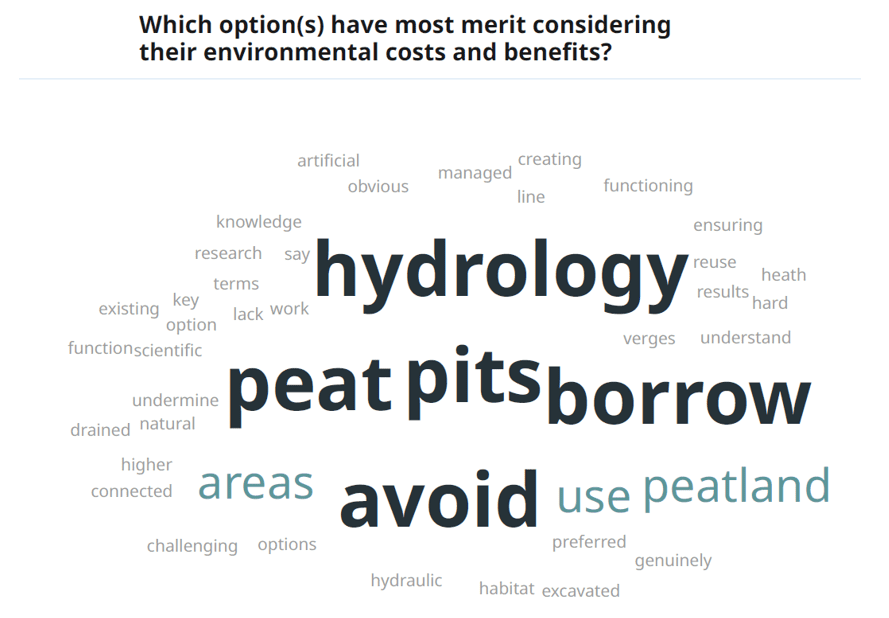
b)
c)
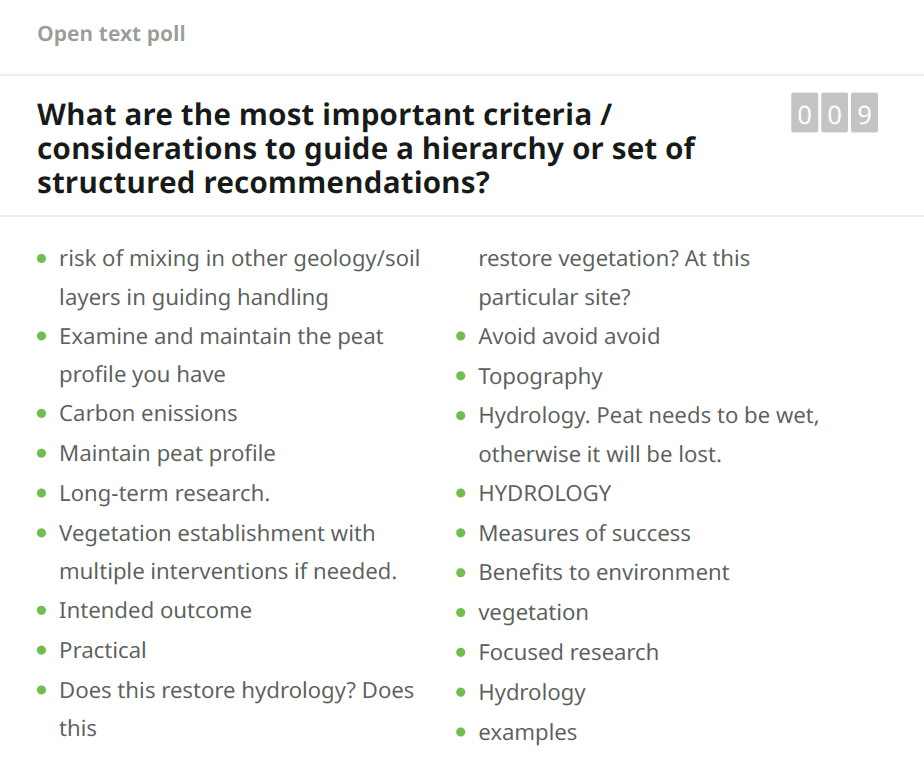
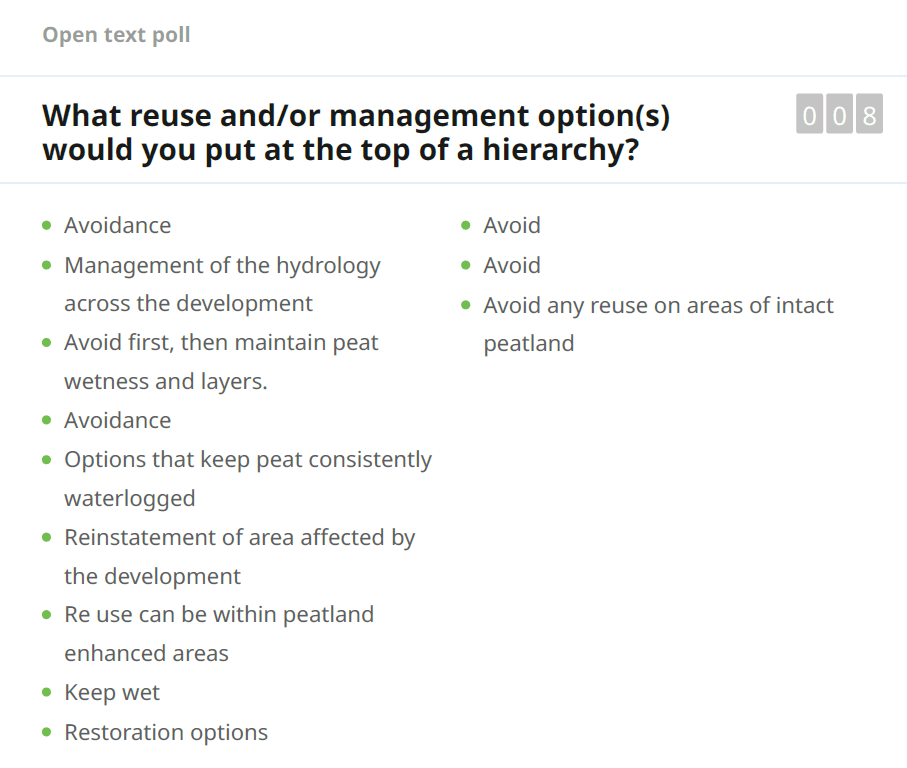
Method of analysis of stakeholder engagement findings:
|
Recording: Interviews |
Transcripts and detailed notes of each stakeholder interview were recorded during the interviews and edited afterwards as needed to create an accurate record. |
|
Recording: Site visits |
During site visits photos and notes were taken relating to the site-specific context, practices and decisions. General learning was also noted, where for example the site host had experience across other sites or reuse practices. |
|
Recording: Workshop |
Transcripts and detailed notes were recorded during the workshop, as well as the results of polls and participation in interactive aspects of the workshop. |
|
Analysis |
Our project team systematically reviewed notes recorded from each element of the stakeholder engagement to identify comments related to the questions:
|
Key findings from stakeholder engagement
Current peat reuse practices
During the workshop and stakeholder interviews a variety of practices were explained, along with associated issues, challenges and likely environmental outcomes or state of knowledge about the outcomes. The approaches are summarised in Table
Table 12. Current peat reuse practices
|
Current practice |
Detail, benefits and issues |
|---|---|
|
Borrow pit reinstatement, revegetation and habitat creation. |
During site visits and interviews many examples of peat being put into disused borrow pits were shared. Common practices include:
Other practice examples included:
Issues flagged included:
Insights shared about environmental outcomes:
|
|
Roadside verge reinstatement or revegetation. |
A very common practice – excavated peat is stored alongside the road after construction, typically until after cables have also been laid, and then peat is reinstated. Sometimes:
Issues flagged included:
Insights shared about environmental outcomes:
|
|
Infill historical peat cuttings |
Not common but is used sometimes where peat cuttings are on site. Limited information was provided – unclear whether turves were placed on top or natural revegetation happened. Example of storage in peat cuttings before use in incorporation into a restoration project was also cited. Issues flagged included:
Insights into environmental outcomes:
|
|
Incorporate excavated peat into peatland restoration projects (pilot projects) |
During two site visits and in other conversations examples of pilot projects to incorporate excavated peat into peatland restoration. Methods included:
Issues flagged included:
Insights shared about environmental outcomes:
|
|
Drainage related practices |
Multiple stakeholders shared views and experiences on the role of drainage on site currently and typical practices. Current practices vary:
Issues flagged included:
Insights shared about environmental outcomes:
|
|
Peat handling & storage practices |
Typical practice examples:
Insights shared about environmental outcomes:
|
|
Off-site reuse of peat |
No stakeholders cited any examples of peat being reused off-site – many had years of experience in the sector and had never known this to happen. |
Other feedback provided by stakeholders on current practices included:
- Variable ‘aims’ of reuse currently – ranging from developers who are trying to create functioning peatland on previously degraded land through to examples where people suggested there was no clear intention beyond finding a place to put the excess peat.
- Compliance with guidance: multiple stakeholders shared a view / example that guidance is not always followed particularly in relation to peat infill depths and handling practices – reasons were unclear, although separately a skills gap was mentioned.
- Quality of PMPs: varied – some followed fairly standard practice without consideration of the uniqueness of the site, whilst some were more nuanced / based on more detailed analysis of possibilities and potential outcomes
- Enforcement / monitoring of PMPs: enforcement / monitoring during constructure can be inconsistent – sometimes very good collaboration and active consideration of effective approaches to achieve good environmental outcomes and sometimes poor / ineffective. Monitoring after construction and commissioning is not common practice, except were linked to habitat management plans which have a formal requirement for monitoring over the life of the site.
- Influence of contracting process and responsibilities: separate contracts for different parts of the windfarm design and construction are commonly let which can make it difficult to develop and maintain a coherent plan for peat management through from planning permission through to final build and ongoing management. The wind turbine specification can also dictate excavation e.g. to achieve desired gradient for installation, but with more site surveys and consideration between developer, turbine supplier and site works contractor there may be potential to develop techniques which require less excavation.
- Important of site selection / micro-siting: the flexibility to move turbines, based on more detailed site surveys of peat is important to reduce peat excavation.
- Reuse of peat is well policed – must be in line with SEPA Reuse Guidance and therefore industry stakeholders follow this approach without feeling able to vary from this.
Potential future reuse practices
|
Practice |
Details, benefits and issues |
|
Deliberately targeting specific end habitat e.g. in borrow pits |
Stakeholders suggested that it may be feasible to design reuse more intentionally with target end-habitat in mind e.g. designing the borrow-pit structure and planning peat excavation and handling specifically with the aim of targeting a valuable habitat – peat bog recreation if feasible or if not, another locally suitable and ideally wet habitat type. There was uncertainty about how to ensure success and what outcome was feasible on a site-by-site basis given the variability between sites in terms of prior land condition, surrounding context and land scape and land ‘capability’ for habitats. |
|
Further use in restoration |
|
|
Infill of drainage ditches (where safety/stability allows) |
Stakeholders flagged that, whilst it is important for site safety and stability to ensure suitable drainage is maintained, there could be opportunities to infil more drainage ditches or increase overall wetness on site to benefit existing peatland habitats on site or increase the likelihood of successful peatland habitat forming where peat reuse has aimed for this outcome. |
|
Off-site uses |
We asked whether uses such as agriculture/horticulture whiskey industry use would be feasible or environmentally beneficial in any circumstance or whether they knew of any other examples. No stakeholders felt that off-site use was a good idea due to:
|
Insights about environmental outcomes from peat reuse
Examples and comments on positive environmental outcomes:
- Peat / vegetation recovery in restoration / hag infill – appears successful (in short-term) on flatter ground.
- Softer trackside verges – vegetation and less slope – can prevent silt migrating into bogs.
- Typical vegetation recovery: acid grassland mix initially, then (5-10yrs later) heathers / heath, and then hopefully wetter ones will progress to bog.
Examples and comments on negative environmental outcomes:
- Most peat reused on wind farms turns into non-peatland habitat – it doesn’t function as peatland because hydrological conductivity is lost. At best going to form an upland wet heath, more likely to be an acid grassland.
- If non-functioning peatland carbon will not be saved within the system Need to keep the carbon gaining and building within the system.
- With poor water management silt is migrating into wet bogs.
- Contamination of nutrient poor peatbog with mineral sources changes nutrient balance and therefore makes peatbog hard to achieve in reuse/restoration – flushed peat or fen more likely. Several stakeholders flagged that it can be challenging to prevent mineral contamination – storage and handling care is needed, and isn’t always feasible in practice.
Other comments on environmental outcomes:
- Potential measurement approaches:
- GI stage, peat probing / wetness, catchment mapping, qualitative sample (no one does this despite guidance), Van Post Scale (peat character).
- Dip wells – across sites.
- Water index via satellite imagery linked to Sentinal programme.
- Pressure loggers – data recording for three months.
- Options for assessing carbon; current government calculator, in house planning tools; revised carbon calculated – potential for different assumptions about loss of carbon on excavated peat.
- Important to balance carbon / biodiversity outcomes. Some stakeholders flagged this in general and also one highlighted the challenge of balancing this in the context of deciding whether to rewet peat during storage – if abstraction from river is required this could have negative consequences for river habitat.
- Several flagged nervousness about assuming reused and restored peat delivers the same environmental outcomes as natural peatlands.
Other considerations for excavated peat reuse
Drainage installation, maintenance and infill: stakeholders agreed that ensuring the right amount of drainage during construction and afterwards is important, but did not all agree on how well this is currently being achieved and whether it is possible provide clearer guidance on this.
Peat handling & storage: many stakeholders flagged the need to minimise movement and handling of peat, aim to keep peat local, minimise handling / travel distance. Use of large diggers and trucks makes this hard. Issues included:
- Need to keep the peat moist: actively or passively
- Need to maintain layers / structure and avoid contamination with mineral soils / aggregate as this will change the nutrient profile and functional structure of the peat.
- Peat can liquify in trucks if handled.
- Cost for moving peat
- Some flagged that temporary storage in ‘groins’ between road junctions is often preferred as there is more space to work there, whilst other advocated designated storage areas. What is practical will vary site to site.
‘Land-made-available’ limitation: land envelope can restrict end destination of any peat reuse ‘on site’ – instances where sensible areas for ‘peat reuse’ are outside the envelope.
Site data availability: planning the peat re-use in advance would be good but often don’t get chance to plan until actually on site and work starts – trees often obscure lidar data.
Excavation timing: contractors don’t get much choice/penalties for delays – timing will influence ability to keep peat wet, keep structure etc.
Evidence gaps
Stakeholders flagged the following issues and gaps in evidence:
- Limited monitoring of implementation and outcomes of Peatland Management Plans (PMPs). Monitoring isn’t required for PMPs in the same way as for Habitat Management Plans (which are monitored for the life of the wind farm), and therefore limited data is available on prior land condition, peat reuse/management methods, and environmental outcomes.
- Approach and quality of assessments and monitoring could be better. Current over reliance on the presence or absence of specific vegetation as an indicator was highlighted – finding a species at a specific location in a large site doesn’t represent the entire site. Better quality peatland condition assessments are needed, ideally landscape based incorporating species, hydrology and other factors rather than quadrat based. This would provide better data for planning reuse / management and a better baseline for impact monitoring, particularly important as construction is often on degraded peat.
- Lack of longitudinal studies into environmental outcomes of peat reuse/management approaches. People cited specific gaps such as study of behaviour and environmental outcomes of peat drying at the side of the road after reinstatement; impacts of storage techniques such as surface roughing to help water infiltration vs allowing crust to form; GHG emissions following disturbance and reinstatement.
- General gap in terms of the understanding of peatland and peat behaviour in the context of wind farm construction. This includes peatland hydrology and how this is affected by disruption, how peat behaves in storage, the impact of movement on peat quality and potential for reestablishment in new destination
- Evidence of the validity of measures such as water table and indicator species as indictors of GHG emissions / ‘functioning peat bog’ for reinstated / restored peatlands. Stakeholders flagged there is no research on peatland excavation and then reuse, hence need to establish the relationship with vegetation, hydrology.
- Limited literature on remote sensing for wind farm monitoring.
- Lack of clear guidance on some aspects of engineering and site management e.g. balancing drainage and wetness, storage practices.
- Lack of research to show whether implementation of best practice is feasible. NPF4 Policy 5 states that ideally carbon rich soils are actively sequestering carbon, and this should be the aim of the PMP. There is a need for research to show if this is possible – this relates to points above about behaviour of peat after disturbance / validity of indicators.
Priorities and recommendations
In general stakeholders were reluctant to give detailed feedback on which methods of peat reuse on site should be a priority because of variability of site circumstances (e.g. land capability, condition) and the lack of concrete research to provide evidence of the environment outcomes which could be anticipated.
Some key comments and points on priorities were:
- Revegetation and minimising bare peat is key to avoid negative cycle of drying and/or erosion: to help success it is important to have follow up surveys and action if issues are identified.
- Need to minimise extraction of peat.
- Advice must allow for flexibility and be nuanced due to the diversity of peatlands.
- Suggested hierarchy:
- Avoid;
- Reinstate in location contiguous to other peatland where carbon can be retained and retain hydrology and long-term species composition will be at least consistent with species within the species disturbed.
- Re-use off site to the same effect.
- Alternative suggestion: two different hierarchies, one with the aim of functioning peatland, and one for the aim of using peat in a way that would result it being used for another purpose e.g. wet heath, dry heath.
- Essential component is maintaining connectivity of the re-use areas with the hydrology and its immediate area, but also looking further at the wider hydrological unit. This also includes connectivity with the peatland restoration areas that will be undertaken on the site.
- Guidance documents can be perfect, however, on the ground can be challenging e.g. to ensure hydrological connectivity – potential need for incentive to go for the best outcome and need to involve different parties to achieve this.
List of stakeholder discussion interviews and workshop attendees
Interviewees
|
Susan Nicol |
Forestry and Land Scotland |
|
Andy Gillan |
RJ Mcleod |
|
Mark Mulqueeny |
SSE |
|
Derek Healy |
Duncan Mackay and Sons |
|
James Allison |
Scottish Power |
|
Emma Taylor |
SEPA |
|
Roxane Anderson |
University of Highlands and Islands |
|
Gill Steel |
Ironside Farrar |
|
Siue Allen |
Ironside Farrar |
|
Malcolm Crosby |
Forestry and Land Scotland |
|
Richard Clarke |
Forestry and Land Scotland |
|
Sue White |
Shetland Community Trust |
|
David McGinty |
SSE Renewables |
Workshop attendees
|
Name |
Organisation |
Role |
|
Andy Mills |
OWC Ltd |
Geomorphologist writing many PMP’s |
|
Andy Gillan |
RJ McLeod Contractors |
Construction projects on peatlands |
|
Irene Tierney |
IMTECO Ltd |
Ecologist writing many PMP’s |
|
Emma Hinchliffe |
IUCN UK Peatland Programme |
Director |
|
Cerian Baldwin |
PeatlandACTION |
Technical director involved in development, Scottish Peatland Standard and reviewing PMPs and EIAs in relation to peat |
|
Alan Cundill |
SEPA |
Senior Specialist Scientist interested in reuse/management of peat |
|
Claire Campbell |
SEPA |
Senior Specialist Scientist and reviewing PMP’s |
|
Jessica Fìor-Berry |
IUCN UK Peatland Programme |
Peatland Programme policy lead |
|
Karen Rentoul |
NatureScot |
Policy advice manager for uplands and also peatlands |
|
Rachel Short |
ScottishPower Renewables |
Senior ecology manager responsible for design, construction and operation of wind farms, many on peatlands |
|
Fiona Donaldson |
SEPA |
Waste policy unit interested in management of excavated peat |
|
Grace Gubbins |
NatureScot |
Involved in the development of the biodiversity metric for the planning system, also supporting peatland expert advisory group |
|
Roxane Andersen |
University of Highlands and Islands |
Peatland scientist, also sit on peatland expert advisory group |
|
Chris Marshall |
SLR Consulting |
Peatland lead dealing with many PMP’s |
|
Susan Nicol |
Forestry and Land Scotland |
Land managers leasing land for wind farms |
|
Kirsten Lees |
University of Derby |
Peatland restoration with focus on carbon |
|
Ainoa Pravia |
Forest Research |
Ecologist (for peatlands) |
|
Iain Detrey |
EA |
Peatland adviser (for England) |
|
Nicholle Bell |
University of Edinburgh |
Peatland restoration, and alternative reuse options |
|
Kerry Dinsmore |
SG |
Principal science advisor on peatlands, also on steering committee |
Project steering group
Ben Dipper (Scottish Government)
Kerry Dinsmore (Scottish Government)
Patricia Bruneau (Nature Scot)
Scottish Government policy team representatives
Appendix C Wind Farm Site Research (site visits & desk research)
Wind farm planning document review
This section reviews the desk-based research describing existing wind farms management plans including data on numbers of wind farms across Scotland on peat soils.
Wind farm site visit summary
This section combines the results of the desk-based research describing existing wind farm management plans alongside the information gathered during the site visits. We aimed to visit a diverse range of sites with reasonable access where we would be able to observe a range of different types and ages of reuse of excavated peat. We chose to include sites in different locations, the north-east and south-west of Scotland. In both areas we visited a newly constructed wind farm, alongside older wind farms within the same locality. This provided examples with different vegetation colonisation rates which could influence the success of reuse methods. We contacted several wind farmer developers / operators, the final selection of sites for visit was based on who was willing to host a visit and practical feasibility in the project timescale and available resources.
Desk-based findings
We reviewed the planning information prior to site visits. This included information on when the work was completed / site commissioned to generate energy, the number of turbines that had been built (both initially and in phased extensions), land ownership and whether other stakeholder were involved in the process (e.g. wildlife rangers based on site, ECoW’s).
Sample site selection
Site selection was undertaken taking into account key variables to ensure that a representative sample of wind farms across Scotland was obtained. Primarily, this included considering a range of development site sizes and locations across Scotland, while ensuring that wind farms were both operational and included relevant Peat Management Plans (PMPs). To note, the number of wind turbines was used as a proxy for development size, while the requirement for developments to have PMPs significantly reduced availability of case studies (even though this is an NPF4 requirement).
Peatland management plans
The key limitations in the approach concerned the accuracy of the data held within the PMPs, for which accessing documents with the requisite information (peat depths and volumes) was the first challenge. In those PMPs that were available, the peat volumes were based on peat survey depths, which are extrapolated across sites via peat probe information, meaning that there is a degree of uncertainty between distinct probe points. There is therefore a high degree of mathematical assumption based on converting peat depth extrapolations to volumes via combining this data with site stripping boundaries. Utilising survey information also assumes competence of all surveyors, despite peat surveys (and peat identification more generally) being a highly specialist skill that geo-environmentalists, geotechnical specialists and even soil scientists would not necessarily have experience of. In addition, peat volumes included in PMPs can change during the construction phase, such as where design is updated, or due to poor implementation of PMP measures. This means that volumes at project inception are often unlikely to be the same once wind farms are conducted, given the dynamic nature of the construction phase and typically iterative design approaches.
Overview of key finding from site visits
Key highlights are included in the main section 3.5.2, 3.5.3 and 3.5.4. A number of borrow pits were visited at each of the sites – these varied in effectivity, levels of monitoring and time since reinstatement. Landscaping examples where peat had been put down along the roadside were clearly visible in the newly constructed wind farms, in the older wind farms this was less obvious, in some cases the peat had become part of the surrounding peatland, however the likelihood was that in some areas it had been lost to the wider environment through erosion. Novel restoration reuse was seen, this was experimental and not common practice. No peat was taken off-site for reuse elsewhere.
Limitations of site visits
Although we were very grateful to the stakeholders for taking the time to show us the wind farms and distil their knowledge of the process, it was clear that this view was only able to provide a snapshot in time analysis of what had occurred at that site. Also depending on time from commissioning, some key details related to the reuse of peat were lost (e.g. exact volumes of peat used within infill of peat excavations, how borrow pit reinstatements were originally designed). Thus, it is harder to identify best practice and what has worked and what hasn’t if the methodology is unreported. The site visits could have been impacted by the weather conditions on the day (e.g. low cloud and drizzle for the final site visit), this made note taking and photographing examples harder and some of the finer details may not be visible in the photographs.
How to cite this publication:
Crotty, F., Dowson, F., Schofield, K., Barker, M., Ginns, B., David, T., Herold, L. (2025) ‘Reuse of excavated peat on wind farm development sites’, ClimateXChange. DOI: http://dx.doi.org/10.7488/era/6333
© The University of Edinburgh, 2025
Prepared by Ricardo on behalf of ClimateXChange, The University of Edinburgh. All rights reserved.
While every effort is made to ensure the information in this report is accurate as at the date of the report, no legal responsibility is accepted for any errors, omissions or misleading statements. The views expressed represent those of the author(s), and do not necessarily represent those of the host institutions or funders.
This work was supported by the Rural and Environment Science and Analytical Services Division of the Scottish Government (CoE – CXC).
ClimateXChange
Edinburgh Climate Change Institute
High School Yards
Edinburgh EH1 1LZ
+44 (0) 131 651 4783
https://www.wwt.org.uk/discover-wetlands/wetlands/peat-bogs ↑
https://www.nature.scot/sites/default/files/2023-02/Guidance-Peatland-Action-Peatland-Condition-Assessment-Guide-A1916874.pdf ↑
John Muir Trust – Scotland’s peatland policy update. ↑
https://www.gov.scot/publications/carbon-calculator-for-wind-farms-on-scottish-peatlands-factsheet/ ↑
https://www.legislation.gov.uk/ssi/2011/228/contents ↑
https://www.sepa.org.uk/media/287064/wst-g-052-developments-on-peat-and-off-site-uses-of-waste-peat.pdf ↑
Scottish Renewables, Scottish Environment Protection Agency. 2012. Guidance on the Assessment of Peat Volumes, Reuse of Excavated Peat and the Minimisation of Waste ↑
https://www.heraldscotland.com/news/18270734.14m-trees-cut-scotland-make-way-wind-farms ↑
https://www.sepa.org.uk/media/287064/wst-g-052-developments-on-peat-and-off-site-uses-of-waste-peat.pdf ↑
https://www.nature.scot/climate-change/nature-based-solutions/nature-based-solutions-practice/peatland-action/peatland-action-how-do-i-restore-and-manage-my-peatland-0 ↑
Micro-siting is where small adjustments to the wind farm lay out are made to avoid / minimise damage to peat (or other sensitive environments) on site. ↑
Renewable Energy Planning Database: quarterly extract – GOV.UK ↑
Renewable Energy Planning Database: quarterly extract – GOV.UK ↑
https://www.data.gov.uk/dataset/ed1922b7-1136-442c-af4d-a36ebad8839f/carbon-and-peatland-2016-map-wind-farm-spatial-framework ↑
It was unclear whether stakeholder was referring to current or previous guidance. ↑
A method described to us where rocks are piled, rather than smaller aggregate to create a more porous substrate allowing for greater water flow. ↑
The Climate Change Committee’s 2023 Report to the Scottish Parliament called for stronger action on food system emissions. Policy interventions need to address the environmental impacts of food production and consumption while ensuring dietary improvements and economic sustainability.
This report assesses Scotland’s diet and climate policy landscape, identifying areas for policy development and providing recommendations to support the Scottish Government’s climate, public health and food security goals going forward.
The study combined desk-based research, stakeholder engagement and categorisation using a PESTLE (Political, Economic, Social, Technological, Legal, and Environmental) framework.
Summary of findings
Scotland’s complex diet and climate policy landscape includes several emerging developments and opportunities, yet challenges persist. These challenges typically reflect areas that would benefit from policy coordination and development.
- Political alignment and coordination: Scottish Government has taken steps to articulate sustainable food ambitions through legislation such as the Good Food Nation Act. Fragmentation across different policy fields (health, agriculture, environment, economy) limits integrated food system transformation. Coordination between local, devolved, and UK governments remains limited, leading to conflicting priorities. The absence of clear emissions targets for food production constrains alignment with net-zero ambitions.
- Economic levers and constraints: Investments in local food initiatives and growing interest in sustainable supply chains signal progress. Fiscal policies have the effect of benefiting high-emission food production over sustainable alternatives. Financial barriers constrain local authorities, small producers, and community groups in adopting agroecological approaches. The cost of sustainable food options continues to limit access and dietary change.
- Social attitudes and engagement: Public interest in sustainable diets is increasing, and some awareness campaigns have gained traction. Cultural traditions, cost concerns, and inconsistent messaging shape public resistance to reducing red meat consumption. Food insecurity remains a barrier to sustainable diet access for lower-income households. Greater public engagement is needed to build trust and understanding of dietary policy aims.
- Technological tools and innovation: Advances in precision agriculture and digital tools offer potential for more sustainable production. Lack of a standardised food emissions-tracking system limits evidence-based policymaking for reducing environmental impact. Rural areas often lack the digital infrastructure to adopt new technologies. Inadequate sustainability labelling limits informed consumer choice.
- Legal frameworks: The Good Food Nation Act provides a foundation for coordinated food policy development. The evidence suggests a lack of strong enforcement mechanisms to drive change. Regulation of food marketing, labelling, and ultra-processed foods is limited. Devolved and UK-wide inconsistencies create legal misalignment across food, health, and trade policy.
- Environmental integration: Scotland has made progress in climate policy and land stewardship through initiatives like the Land Use Strategy. There are challenges in balancing different land use functions such as forestry, agriculture, and biodiversity protection. Climate adaptation strategies for agriculture need to be better developed, due to increasing climate risks. The ecological role of grazing land in biodiversity and carbon sequestration is underutilised in policy planning.
For further information, please read the report.
If you require the report in an alternative format, such as a Word document, please contact info@climatexchange.org.uk or 0131 651 4783.
Research completed: March 2025
DOI: http://dx.doi.org/10.7488/era/6180
Executive summary
The Climate Change Committee’s 2023 Report to the Scottish Parliament called for stronger action on food system emissions. Policy interventions need to address the environmental impacts of food production and consumption while ensuring dietary improvements and economic sustainability.
This report assesses Scotland’s diet and climate policy landscape, identifying areas for policy development and providing recommendations to support the Scottish Government’s climate, public health and food security goals going forward.
The study combined desk-based research, stakeholder engagement and categorisation using a PESTLE (Political, Economic, Social, Technological, Legal, and Environmental) framework.
Key findings
Scotland’s complex diet and climate policy landscape includes several emerging developments and opportunities, yet challenges persist. These challenges typically reflect areas that would benefit from policy coordination and development.
- Political alignment and coordination: Scottish Government has taken steps to articulate sustainable food ambitions through legislation such as the Good Food Nation Act. Fragmentation across different policy fields (health, agriculture, environment, economy) limits integrated food system transformation. Coordination between local, devolved, and UK governments remains limited, leading to conflicting priorities. The absence of clear emissions targets for food production constrains alignment with net-zero ambitions.
- Economic levers and constraints: Investments in local food initiatives and growing interest in sustainable supply chains signal progress. Fiscal policies have the effect of benefiting high-emission food production over sustainable alternatives. Financial barriers constrain local authorities, small producers, and community groups in adopting agroecological approaches. The cost of sustainable food options continues to limit access and dietary change.
- Social attitudes and engagement: Public interest in sustainable diets is increasing, and some awareness campaigns have gained traction. Cultural traditions, cost concerns, and inconsistent messaging shape public resistance to reducing red meat consumption. Food insecurity remains a barrier to sustainable diet access for lower-income households. Greater public engagement is needed to build trust and understanding of dietary policy aims.
- Technological tools and innovation: Advances in precision agriculture and digital tools offer potential for more sustainable production. Lack of a standardised food emissions-tracking system limits evidence-based policymaking for reducing environmental impact. Rural areas often lack the digital infrastructure to adopt new technologies. Inadequate sustainability labelling limits informed consumer choice.
- Legal frameworks: The Good Food Nation Act provides a foundation for coordinated food policy development. The evidence suggests a lack of strong enforcement mechanisms to drive change. Regulation of food marketing, labelling, and ultra-processed foods is limited. Devolved and UK-wide inconsistencies create legal misalignment across food, health, and trade policy.
- Environmental integration: Scotland has made progress in climate policy and land stewardship through initiatives like the Land Use Strategy. There are challenges in balancing different land use functions such as forestry, agriculture, and biodiversity protection. Climate adaptation strategies for agriculture need to be better developed, due to increasing climate risks. The ecological role of grazing land in biodiversity and carbon sequestration is underutilised in policy planning.
Opportunities for action and policy implications
A summary of key opportunities for action is presented in the table below. A fuller articulation of these opportunities, with supporting detail, is included in Section 6, Conclusions and policy implications.
|
Building a resilient and sustainable Scottish food system |
|
Key insights and policy pathways |
|
Political |
|
|
Economic |
|
|
Social |
|
|
Technological |
|
|
Legal |
|
|
Environmental |
|
Glossary and abbreviations table
|
Agroecology |
A sustainable farming approach that applies ecological principles to agriculture and prioritises local knowledge, biodiversity, and low-input systems. |
|
Carbon sequestration |
The process of capturing and storing atmospheric carbon dioxide, often through natural systems like forests and soils. |
|
Climate Change Committee (CCC) |
The Climate Change Committee is an independent, statutory body established under the UK’s Climate Change Act 2008. Its primary role is to advise the UK Government and devolved administrations on emissions targets and to report to Parliament on progress in reducing greenhouse gas emissions and preparing for climate change. |
|
Food for Life (Scotland) |
Food for Life Scotland is a programme operated by the Soil Association, funded by the Scottish Government, with the mission to make good food the easy choice for all. The initiative focuses on harnessing the power of public food to positively impact health, the environment, and the local economy. |
|
Food sovereignty |
The right of people, communities, and countries to define their own food systems, including the production, distribution, and consumption of food. |
|
Food system transformation |
A fundamental shift in the way food is produced, distributed, and consumed to improve sustainability, health, and equity. |
|
Fortification |
The process of adding essential vitamins and minerals (such as iron, iodine, vitamin D, or folic acid) to food to improve its nutritional quality and prevent or correct dietary deficiencies in a population. Common examples include the fortification of flour with folic acid or milk with vitamin D. |
|
Good Food Nation (Scotland) Act |
The Good Food Nation (Scotland) Act 2022 establishes a framework for Scotland mandating the creation of national and local Good Food Nation Plans, aiming to ensure that food-related policies contribute to various aspects of well-being, including health, economic development, and environmental sustainability. |
|
Just Transition |
A policy framework to ensure that the shift to a low-carbon economy is fair and inclusive, protecting workers and communities. |
|
Net-zero |
Achieving a balance between greenhouse gas emissions produced and those removed from the atmosphere. |
|
PESTLE analysis |
A strategic framework used to identify and analyse Political, Economic, Social, Technological, Legal, and Environmental factors for understanding the broader context for decision-making. |
|
Precision Livestock Farming (PLF) |
Precision Livestock Farming refers to the application of advanced technologies and data-driven methods to monitor and manage individual animals within a herd. PLF aims to enhance animal health, welfare, productivity, and environmental sustainability. |
|
Plant based |
A diet or product primarily made from plants (e.g., vegetables, fruits, grains, legumes, nuts, and seeds). While not always strictly vegan or vegetarian, plant-based diets typically minimise or avoid animal products. |
|
Plant based meat alternatives (PBMAs) |
Food products designed to mimic the taste, texture, and appearance of conventional meat but are made from plant-based ingredients. |
|
Procurement |
The strategic process by which organisations acquire goods, services, or works from external sources to fulfil their operational needs. This process encompasses a series of steps designed to ensure that acquisitions are made in a timely, cost-effective, and quality-assured manner. |
|
Reformulation |
The process of altering the ingredients of food or drink products to improve their nutritional profile; for example, by reducing salt, sugar, or saturated fat, while maintaining taste and consumer acceptability. |
|
Regenerative agriculture |
A system of farming practices that aims to restore and enhance soil health, biodiversity, water cycles, and ecosystem resilience while producing food. |
|
Scope 3 emissions |
Refers to accounting for the indirect greenhouse gas emissions that occur across a retailer’s value chain, such as those from the production of goods they sell, transportation, packaging, and consumer use and disposal. Including Scope 3 emissions provides a more comprehensive picture of a retailer’s wider environmental impact beyond their direct operations. |
|
Scottish Dietary Goals (SDGs) |
A set of nutritional targets established by the Scottish Government to improve the overall health of the population by promoting healthier eating habits. These goals outline the recommended intake levels for various nutrients and food groups, aiming to reduce the prevalence of diet-related conditions such as obesity, heart disease, and type 2 diabetes. |
|
Scottish National Adaptation Plan 2024-2029 (SNAP3) |
The Scottish National Adaptation Plan 2024-2029 (SNAP3) is Scotland’s strategic framework aimed at enhancing the nation’s resilience to the impacts of climate change over a five-year period. SNAP3 outlines a comprehensive approach to adaptation, ensuring that Scotland’s communities, economy, and environment are prepared for current and future climate challenges. |
|
Semi-structured interview |
A qualitative data collection method that uses a flexible interview guide with open-ended questions. It allows the interviewer to explore specific topics in depth while also adapting questions based on participants’ responses. |
|
Stakeholder mapping |
A strategic process used to identify, analyse, and visualise individuals or groups (stakeholders) who have an interest in or are affected by a project, organisation, or policy. This technique helps to understand stakeholders’ influence, interests, and relationships, facilitating effective communication and engagement strategies. |
|
Supply chain |
The network of organisations, people, activities, information, and resources involved in the creation and delivery of a product or service from the supplier to the end customer. |
|
Sustainable diet |
A diet that promotes health and well-being while reducing environmental impact and supporting food system resilience. |
|
Systematic literature review |
A structured and comprehensive method for identifying, evaluating, and synthesising all relevant research on a specific topic using transparent and replicable procedures. |
|
Third Sector |
The part of an economy or society comprising non-governmental and non-profit organisations, such as charities, community groups, voluntary organisations, social enterprises, and cooperatives. |
|
Ultra-processed food |
Industrially formulated foods that typically contain additives and minimal whole ingredients; often linked to poor health outcomes. |
|
Urban agriculture |
The practice of growing, processing, and distributing food within or around cities and towns (e.g., community gardens, rooftop farms, vertical farming, backyard gardening, and small-scale livestock or aquaculture). It can support local food systems, access to fresh produce, and community engagement, climate resilience, and urban greening. |
|
Vertical farming |
A method of growing crops in vertically stacked layers, often in controlled indoor environments. This allows year-round production and is commonly used in urban areas to reduce food miles and increase local food resilience. |
|
Zoonotic disease |
A disease that can be transmitted between animals and humans. These diseases can be caused by viruses, bacteria, parasites, or fungi, and can spread through direct contact, food, water, or vectors like mosquitoes. Zoonotic diseases are a key concern in public health, agriculture, and environmental management due to their potential for outbreaks and global spread. |
Table 1: Glossary and abbreviations used in the report
Introduction
How can Scotland balance climate goals, public health, and economic resilience in food policy?
Scotland’s diet and climate policy landscape is shaped by multiple, often competing priorities, making policy development and implementation particularly complex. Scotland’s net-zero ambitions don’t sit in isolation and delivery is influenced by UK Government food policy and wider cross-border complexities. Any approach must align with, Scotland-specific advice such as Recommendation R2024-003 from the Climate Change Committee’s (CCC) 2023 Report to the Scottish Parliament, which calls for stronger action on food system emissions (CCC, 2023). The CCC’s carbon budget for Scotland is due to be published in May 2025, and the CCC has highlighted that agriculture is projected to become the second-highest emitting sector by 2040. Efforts to reduce the environmental impact of food consumption need to be balanced with public health goals, economic considerations, and social acceptability. While the Scottish Government plans to introduce measures such as restricting unhealthy food promotion and encouraging sustainable agricultural practices, significant barriers remain. Public resistance to dietary change, particularly reductions in red meat consumption, reflects deep-seated cultural attitudes and concerns about choice, affordability and accessibility. Furthermore, promoting lower meat diets could lead to economic contraction in agriculture-related sectors, especially the red meat sector (Allan, Comerford & McGregor, 2019). If food system transitions are to be just, they must ensure that rural economies and farming communities remain viable while meeting climate targets, requiring sensitive and adaptive policy solutions.
Another layer of complexity arises from policy fragmentation and governance challenges. Responsibilities for food, health, environment, and agriculture are divided across multiple sectors and levels of government, including devolved and UK-wide authorities, leading to inconsistencies in strategy and implementation. Furthermore, the socio-economic impacts of dietary policy shifts, including how changes affect low-income households or food supply chains, are not yet fully understood due to limited data and evaluation frameworks. Addressing these challenges will require a holistic approach that integrates cross-sectoral collaboration, rigorous evidence, and stakeholder engagement to navigate trade-offs and identify the most feasible pathways for change.
Aims of the project
This report addresses two primary aims:
- Analysis of a mixed-method evidence base for diet and climate policy in Scotland using a structured PESTLE framework.
- Identification of evidence gaps and the proposal of actionable recommendations to inform future policy development.
These two aims seek to support the Scottish Government in developing policies aligned with climate targets, while also advancing a just transition that considers the nutritional needs of communities, and the livelihoods of people employed in the food system.
Methodology
Research design
This research adopted a mixed-method design to analyse the intersection of diet and climate policy in Scotland. It combined desk-based research, stakeholder engagement, and thematic categorisation using a PESTLE framework (Political, Economic, Social, Technological, Legal, and Environmental dimensions).
Research approach and evidence sources
The study integrated three core sources of evidence:
- Literature review: A systematic review of academic, grey, and policy literature, including documents from the Scottish Government, Climate Change Committee, Food Standards Scotland, and international case studies. Further detail on the literature review method can be found in Appendices C and D.
- Stakeholder engagement: 14 semi-structured interviews with stakeholders from government, academia, and civil society provided insight into governance challenges, socio-economic impacts, and practical barriers to policy implementation. Further detail on the method can be found in Appendix E.
- Workshops: Three stakeholder workshops (one in-person, two online)[1] were conducted to validate findings, prioritise areas for further policy development, and co-develop recommendations. These involved scenario planning and structured group discussion. Workshop protocols and details of participating stakeholders are displayed in Appendix F.
Ethics and data management
The research followed ethical guidelines from the University of Bath and ClimateXChange. All participants gave informed consent and were offered anonymity. Data handling adhered to the Scottish Government’s “open as possible, closed as necessary” principle. Triangulation across data sources helped ensure reliability and consistency.
Stakeholder mapping
Stakeholders were identified through desk research and consultations (see Appendix A) and classified into categories including government, academia, third sector, public health, industry, and community groups. A database of 447 stakeholders was compiled (Appendix B).
PESTLE framework
The PESTLE framework guided the thematic analysis of areas for policy development and opportunities, ensuring comprehensive coverage of structural, social, and environmental dimensions. It helped surface interdependencies and evidence gaps across policy domains.
Limitations and future research
Due to time constraints, the analysis could not include quantitative modelling or longitudinal data. While the research drew from diverse sectors, representation from the food industry was more limited. Further research should explore economic modelling of dietary transitions, consumer behaviour dynamics, and legal feasibility of regulatory measures.
Further methodological detail, including workshop protocols and stakeholder lists, is available in the Appendices.
Analysis of diet and climate policy evidence
While the literature, stakeholder meetings, and workshops all highlighted the need for more integrated, cross-sectoral approaches to diet and climate policy, each source also highlighted distinct emphases.
- The literature focused on systemic analysis and policy gaps, often referring to structural barriers, need for further regulation, and the dominance of voluntary policy mechanisms.
- The stakeholder meetings added a degree of nuance on political sensitivities, informal policymaking, and institutional fragmentation, often surfacing insights that were missing from the literature, such as the influence of farming identities, lobbying, and inter-departmental misalignment (i.e. the lack of coordination between government departments, such as health, agriculture, and climate, which can lead to contradictory or disconnected policies).
- The stakeholder workshops, by contrast, reflected the practical and lived experience of policy implementation, giving voice to tensions related to affordability, cultural norms, and supply chain dynamics, and offering grounded ideas for cross-sector collaboration.
- Taken together, these sources converged on key challenges but revealed gaps in empirical evidence on effective interventions and highlighted the need for more inclusive, community-informed policy processes.
The following sections present an analysis of the issues shaping diet and climate policy, drawing on insights from the literature review, stakeholder meetings, and workshops.
We begin by outlining key areas for policy development, offering a comprehensive view of the diverse factors influencing policy in Scotland. For clarity, each PESTLE dimension is analysed separately, although we recognise that many issues cut across multiple dimensions. In addition to the summaries in Sections 5.1–5.6 of the report, extended analyses and illustrative examples are provided in Appendices G–L.
PESTLE Political dimension
The PESTLE Political dimension highlights key political drivers and barriers shaping Scotland’s food system, focusing on governance, policy coherence, and regulatory alignment. Despite ambitious climate and health goals, food policy remains fragmented; characterised by siloed strategies, short-term political cycles, and limited public engagement.
There are clear opportunities to improve alignment between national and local policies, embed measurable targets under the Good Food Nation Act, and integrate food more fully into net-zero strategies. Policy coherence is particularly lacking in areas such as dietary change, where targets, especially for meat reduction, are absent or politically sensitive.
Public procurement and food supply chain resilience require stronger alignment with sustainability priorities. Resistance to livestock reduction, driven by cultural, economic, and political factors, continues to constrain progress. Meanwhile, policy support for plant-based foods, oversight of emissions-intensive agriculture, and trade resilience post-Brexit, remain underdeveloped.
Improving citizen participation and learning from international best practice are also essential to ensure legitimacy and policy effectiveness. Overall, stronger strategic leadership and more integrated, inclusive policymaking are critical to enable a just transition in Scotland’s food system.
For further detail and illustrative examples, see Appendix G.
PESTLE Economic dimension
This section outlines key economic enablers and constraints in Scotland’s transition to a more sustainable and just food system. While the need for climate-compatible diets and resilient supply chains is increasingly recognised, economic policy and market structures remain poorly aligned with sustainability goals.
The analysis highlights persistent gaps in financial incentives for low-carbon agriculture, agroecology, and alternative proteins. Current financial support regimes continue to favour high-emission livestock production, while support for biodiversity and ecosystem services is limited. High upfront costs and infrastructure barriers also constrain farmers’ ability to adopt sustainable practices.
Trade and supply chains add further complexity to the landscape. Import/Export policies risk carbon leakage and should go further to reflect Scotland’s net-zero ambitions. Small producers face limited access to public procurement and mainstream markets, which are dominated by large retailers and multinationals.
A lack of stable, long-term funding also undermines urban agriculture, community food initiatives, and public food provision. Consumer incentives are misaligned; VAT law and pricing structures serve to limit the uptake of plant-based foods, while environmental and health costs remain externalised. Without targeted interventions, dietary shifts might also result in greater reliance on ultra-processed food or alternative animal products, with implications for health.
A clear transition strategy is needed to support rural economies, address workforce shortages, and align financial incentives, trade policies, and consumer support with Scotland’s net-zero goals.
For further evidence and examples, see Appendix H.
PESTLE Social dimension
The next section explores the social factors that influence dietary behaviours, food access, cultural norms, and public engagement with food system sustainability in Scotland. While awareness of sustainable diets is growing, economic inequality, cultural barriers, and information gaps continue to limit equitable access to healthier and more climate-compatible food choices.
The analysis shows that low-income, rural, and marginalised groups face structural challenges to adopting sustainable diets, including affordability, limited access to healthy food options, and digital exclusion. Taxation policies, such as levies on red meat, may also disproportionately affect households with limited economic flexibility unless protections are in place. High energy costs, limited cooking facilities, and restricted access to healthy food outside the home reduce the feasibility of dietary shifts for many communities.
Consumer environments and behaviours present further challenges. Ultra-processed foods dominate many retail and foodservice settings, while alternative proteins remain scarce or poorly understood. Misperceptions, unclear labelling, and cultural or sensory barriers to meat alternatives reduce consumer confidence in plant-based foods. Public institutions, such as schools and hospitals, have been slow to integrate sustainability into procurement and meal provision, missing valuable opportunities to shape norms and access around sustainable food.
Cultural identity, health concerns, and trust also play a critical role in shaping diet. Intergenerational tensions, media confusion, and stigma around plant-based eating reinforce resistance to change. The term “sustainable diet” is understood in multiple ways, and guidance on nutritional adequacy, especially for meat reduction, remains limited. There is also a need to strengthen support for regenerative and culturally inclusive farming practices.
Crucially, the evidence highlights an over-reliance on individual responsibility for dietary change, which overlooks the need for supportive food environments and system-level shifts. Policies that reshape food environments, through procurement, pricing, education, and public messaging, are likely to be more effective and equitable in the longer term. More specifically, focusing on health-based messaging, trusted community voices, and social norm–based approaches would help build broader public support.
In summary, socially informed policies must address structural inequalities, cultural diversity, and behavioural dynamics to ensure a just transition toward sustainable diets. This includes improving affordability and access, embedding sustainability in public food settings, and aligning dietary policies with both climate and public health goals.
Further detail and evidence examples are available in Appendix I.
PESTLE Technological dimension
Technology plays a critical role in shaping the sustainability, efficiency, and resilience of Scotland’s food system. The analysis highlights the lack of a comprehensive monitoring framework to evaluate the impact of dietary shifts on emissions, public health, food security, and biodiversity. Without clear indicators and centralised data systems, it is difficult to assess progress toward climate and health goals or ensure that dietary policies are evidence driven. Metrics for agroecological practices and sustainable diet transitions remain underdeveloped, impeding efforts to support and scale lower-impact farming approaches.
Digital infrastructure limitations, particularly poor rural broadband, continue to restrict the uptake of precision livestock farming and climate-smart technologies. Awareness of these tools remains low among producers, while Government support for adoption is often fragmented. Similarly, industry accountability is weakened by the absence of transparent data reporting and standardised carbon footprinting systems. Inconsistent greenhouse gas accounting methods, a lack of methane tracking at farm level, and the need for sector-specific targets for beef production further undermine emissions mitigation efforts.
Food system resilience also depends on improved technological capacity in supply chains. Current systems do not adequately support food origin tracking, nor do they account for high-emission foods in dietary data, weakening emissions attribution and policy precision. The sustainability impacts of emerging plant-based products remain poorly assessed, and infrastructure gaps limit the scaling of regional food systems and local supply chain technologies.
Digital tools could be used more effectively to promote sustainable consumer choices and increase transparency in food sourcing, animal welfare, and product quality. However, greater investment in infrastructure, digital literacy, and data coordination is required to unlock this potential.
In summary, a more technologically enabled food policy landscape in Scotland will require investment in data infrastructure, tailored emissions metrics, precision agriculture, and digital tools to support both consumer engagement and policy accountability. Doing so will help ensure that Scotland’s net-zero, biodiversity, and health ambitions are underpinned by robust evidence and smart, scalable solutions.
Further detail and evidence examples are available in Appendix J.
PESTLE Legal dimension
With reference to the role of legal and regulatory frameworks, the PESTLE analysis reveals that Scotland currently lacks targeted legal mechanisms to incentivise low-carbon food production. Regulatory gaps and weak enforcement of environmental standards limit the transition to sustainable agriculture, while power imbalances in the supply chain, favouring large corporations over smaller producers, remain largely unaddressed. The Good Food Nation Act, though an important step forward, does not extend regulatory authority over retailers, large-scale producers, or food manufacturers, limiting its system-wide impact.
Other issues requiring attention exist in consumer protection and information. Weak regulation of unhealthy food marketing, especially in out-of-home settings, undermines public health efforts. The continued reliance on voluntary reformulation agreements with industry, combined with the lack of mandatory carbon footprint labelling, limits consumers’ ability to make informed dietary choices aligned with Scotland’s climate and health goals. Meanwhile, the absence of mandatory nutritional fortification, such as for non-dairy milk products, can impede public health initiatives aimed at addressing nutritional deficiencies.
Legal and governance barriers also slow policy implementation. Complexities in devolved and UK-level responsibilities contribute to policy inconsistency, particularly on dietary and emissions targets. Additionally, legal risks around nutrient adequacy in meat and dairy reduction strategies may discourage more ambitious dietary guidance.
Within agriculture, current carbon audit schemes lack sufficient enforceable emissions targets and are perceived as bureaucratic, offering limited incentives for change. Unclear guidance on carbon markets and inconsistent rules on emissions reporting (including Scope 3 emissions from retailers) reduce transparency and slow investment in climate-smart farming.
In summary, legal reform is needed to strengthen regulatory levers across the food system, extending beyond the public sector to include retailers and industry, enforcing sustainability and nutrition standards, and improving consumer protections. Aligning governance frameworks, reducing administrative burdens, and embedding human rights principles into dietary policy are therefore needed to enable effective system-wide change.
Further detail and evidence examples are available in Appendix K.
PESTLE Environmental dimension
This final section examines the environmental factors affecting Scotland’s transition to a sustainable food system. The evidence highlights that many community food initiatives and new entrants to agroecological farming face significant barriers, particularly in accessing secure land and financial support. Temporary land use agreements and bureaucratic processes can limit the growth of community food systems, despite existing policy. In some cases, unregulated forestry expansion can risk displacing agricultural land, with limited assessment of net carbon impacts or broader public interest outcomes.
Scotland’s climate mitigation policies in agriculture remain focused on food-based emissions without addressing the wider transformation needed across the food system. Adaptation strategies for extreme weather, water resource management, and soil health are underdeveloped, leaving farmers vulnerable to increasingly unpredictable conditions. Localised environmental impacts of emissions-intensive farming are often overlooked in national-level emissions data, reducing policy responsiveness to regional ecological pressures.
The analysis also highlights the need for a more strategic approach to land use. With the majority of Scottish farmland classed as “Less Favoured”[2] and unsuitable for plant protein production, blanket approaches to livestock reduction may generate trade-offs for biodiversity, carbon sequestration, and rural livelihoods. Well-managed grazing land has shown potential to support biodiversity and store more carbon than forestry in some contexts, yet these contributions are not widely acknowledged in land-use planning.
From a consumption perspective, the environmental footprint of ultra-processed and highly standardised food products remains a concern, as do the resilience risks associated with crop monocultures and supply chain vulnerabilities. There is growing recognition that agricultural technologies, diversification, and the promotion of locally adapted crop varieties can play a role in building resilience, but these approaches require greater policy support and coordination.
In summary, delivering a climate-resilient and environmentally sustainable food system in Scotland will require integrated land-use and adaptation planning, support for agroecological transitions, and a shift toward more diverse and regionally appropriate production systems. Environmental priorities must be balanced with social and economic sustainability to secure long-term food system resilience.
Further detail and evidence examples are available in Appendix L.
Analysis of areas for policy development
We next move on to consider evidence linked to the foregoing PESTLE analysis. The PESTLE analysis of diet and climate areas for policy development in Scotland has revealed several critical evidence gaps that limit progress towards a sustainable, resilient, and equitable food system. This section summarises areas for development, evaluates the feasibility of addressing them through targeted initiatives, and prioritises areas for immediate and long-term action. A summary of identified areas for further policy development, feasibility of addressing issues, scope for collaboration, and suggested priority levels for each PESTLE dimension are set out in Table 4.1.1.1.
Disclaimer: While this report identifies multiple areas for policy development, it is acknowledged that various initiatives and programmes may already be addressing some of these areas to differing extents. The intention is not to overlook ongoing efforts, but to highlight where further action, coordination, or scaling may still be required.
|
1. Areas for further policy development: Political | |
|
A. Key areas: |
|
|
B. Feasibility options for development: |
Phase 1: Foundations[3]:
Phase 2: Scaling and alignment[4]:
Phase 3: Structural reform[5]:
|
|
C. Areas for collaboration: |
|
|
D. Priority level: |
|
|
2. Areas for further policy development: Economic | |
|
A. Key areas for development: |
|
|
B. Feasibility options for development: |
Phase 1: Foundations:
Phase 2: Scaling and alignment:
Phase 3: Structural reform:
|
|
C. Areas for collaboration: |
|
|
D. Priority level: |
|
|
3. Areas for further policy development: Social | |
|
A. Key areas for development: |
|
|
B. Feasibility options for development |
Phase 1: Foundations:
Phase 2: Scaling and alignment:
Phase 3: Structural reform:
|
|
C. Areas for collaboration: |
|
|
D. Priority level: |
|
|
4. Areas for further policy development: Technological | |
|
A. Key areas for development: |
|
|
B. Feasibility options for development: |
Phase 1: Foundations:
Phase 2: Scaling and alignment:
|
|
C. Areas for collaboration: |
|
|
C. Priority level: |
|
|
5. Areas for further policy development: Legal | |
|
A. Key areas for development: |
|
|
B. Feasibility options for development: |
Phase 1: Foundations:
Phase 2: Scaling and alignment:
Phase 3: Structural reform:
|
|
C. Areas for collaboration: |
|
|
D. Priority level: |
|
|
6. Areas for further policy development: Environmental | |
|
A. Key areas for development: |
|
|
B. Feasibility options for development: |
Phase 1: Foundations:
Phase 2: Scaling and alignment:
Phase 3: Structural reform:
|
|
C. Areas for collaboration: |
|
|
D. Priority level: |
|
PESTLE evidence analysis of areas for further policy development
In summary, addressing areas for policy development identified through the evidence review would require a combination of more immediate actions, pilot initiatives, and longer-term policy reforms. Targeting governance and coordination should be prioritised as a foundation upon which to develop emissions tracking, economic incentives for sustainability, and environmental resilience strategies. Based on the analysis of evidence, addressing these areas through targeted research, cross-sector collaboration, and data standardisation would be essential for leveraging meaningful progress on sustainable diet transitions.
Conclusions and policy implications
Diet, climate, and public health intersect in complex ways with food systems, shaping both environmental sustainability and human well-being. Dietary patterns influence greenhouse gas emissions, biodiversity, and resource use, whilst also influencing non-communicable diseases and health risks. A transition to sustainable diets presents an opportunity to improve public health and reduce environmental impact, though significant barriers including affordability and accessibility must be tackled. In Scotland, the transition to sustainable diets is complicated by cultural and economic reliance on established food industries, particularly livestock farming. Whilst high red and processed meat consumption poses health and environmental concerns, economic dependencies, consumer habits, and social norms around food identity and tradition all contribute to resistance to change.
Crucially, policymakers must navigate inevitable trade-offs between economic stability and sustainability. The Scottish red meat sector supports jobs and rural economies, making policies to reduce meat consumption economically sensitive. Furthermore, plant-based diets remain costly due to supply chain and financial support structures, with change carrying the risk of exacerbating social inequalities. Balancing voluntary industry commitments with regulatory measures and fiscal policies is needed to drive change whilst minimising economic disruption.
This report has highlighted the complex connections between diet, climate, and public health in food systems, and the urgent need for integrated policy responses for sustainable diet transitions. The UK’s 7th Carbon Budget (CB7) (Climate Change Committee, 2025) reinforces this urgency, proposing a substantial reduction in livestock numbers and a shift towards more sustainable dietary patterns. Scotland’s food system has the potential to reduce greenhouse gas emissions while improving public health, yet fragmented policies, gaps in governance, and limited economic incentives inhibit meaningful progress. In line with CB7, this report underscores the importance of policy coherence, aligned with public engagement, agricultural and industry support, fiscal measures, and public health initiatives.
Informing next steps for policy development
Whilst significant strides have been made with policies like the Good Food Nation Act (Scottish Government, 2022a), further action is needed to strengthen accountability, set clear sustainability targets, and improve cross-sectoral collaboration. Managing the economic implications of dietary transitions is also crucial to ensuring a just transition—without targeted support, rural inequalities may deepen, and resistance to change may grow. Lessons from other countries have shown that a mix of financial incentives, public procurement reforms, and consumer engagement strategies can drive sustainable dietary shifts while maintaining economic stability.
Such goals require coordinated action across government, agriculture, the food industry, public health, and civil society. A whole-systems approach must ensure sustainability policies are both equitable and inclusive. Priorities could therefore include:
- Strengthening governance and policy coordination: Develop a cross-sectoral food policy framework aligning climate, health, and agricultural objectives. Enhance local-national coordination for food system implementation. Establish clear emissions reduction targets for food production and dietary transitions and clarify the role of dietary transitions in meeting this target.
- Improving economic incentives for sustainable food systems: Redirect agricultural support payments towards sustainable and regenerative farming. Explore the role for fiscal policies (e.g. e.g. support payments or taxation) to make sustainable food choices more affordable. Invest in local food infrastructure and supply chains to reduce dependence on imports.
- Addressing social and cultural barriers to dietary change: Expand public, agricultural, and food system engagement and participation and leverage procurement opportunities to increase awareness and availability of climate-friendly diets. Improve policies regarding food affordability to ensure sustainable diets are accessible to all income groups. Develop culturally sensitive strategies for dietary shifts, considering food traditions.
- Investing in technology and data monitoring for food system resilience: Support the development of a UK-wide standard for emissions tracking in food production and consumption, recognising the complexity of this task and the need for cross-jurisdictional coordination. Introduce digital food labelling to increase consumer awareness of sustainability impacts.
- Supporting legal and regulatory measures: Enforce sustainability standards in food production and marketing. Align devolved and UK-wide dietary policies for consistency. Improve public procurement regulations to prioritise sustainable food sourcing.
- Integrating environmental considerations into food policy: Develop land-use policies balancing food security, biodiversity, and climate goals. Strengthen climate adaptation strategies for Scottish agriculture. Explore the potential role of well-managed grazing land in supporting biodiversity and contributing to carbon sequestration, while recognising that evidence on sequestration benefits remains contested.
Scotland has an opportunity to lead in sustainable food policy by embedding climate and health goals into food system governance. A cross-sectoral, just transition approach is essential to creating a food system that protects the environment, supports local economies, and enhances public health to secure long-term benefits for both people and the planet.
References
Allan, G., Comerford, D. and McGregor, P., 2019. The system-wide impact of healthy eating: Assessing emissions and economic impacts at the regional level. Food Policy, 86, p.101725. https://doi.org/10.1016/j.foodpol.2019.05.008
Ambler-Edwards, S., Bailey, K.S., Kiff, A., Lang, T., Lee, R., Marsden, T.K., Simons, D.W. and Tibbs, H., 2009. Food futures: Rethinking UK strategy. London: Chatham House. [online] Available at: Food futures: rethinking UK strategy. A Chatham House report -ORCA (Accessed: 25/11/24).
Attorp, A. and Hubbard, C., 2022. Governing the UK agri-food system post-Brexit, in Shucksmith, M. and Bosworth, G. (eds.) Rural governance in the UK. Abingdon: Routledge, pp. 78–98.
Baker, P., Conquest, A. and Moxey, A., 2023. The evidence for private sector drivers for climate action in Scottish agriculture. LUC. [online] Available at: The evidence for private sector drivers in the Scottish agricultural supply chain (Accessed: 17/12/24).
Bauer, J.M., Aarestrup, S.C., Hansen, P.G. and Reisch, L.A., 2022. Nudging more sustainable grocery purchases: Behavioural innovations in a supermarket setting. Technological Forecasting and Social Change, 179, p.121605. https://doi.org/10.1016/j.techfore.2022.121605
Beckert, M., Smith, P. and Chapman, S., 2016. Of trees and sheep: Trade-offs and synergies in farmland afforestation in the Scottish uplands. In: S. Kratzer and M. Schönhart, eds. Land use competition: Ecological, economic and social perspectives. Cham: Springer, pp.183–192. https://doi.org/10.1007/978-3-319-33628-2_11
Bellamy, A.S., Furness, E., Mills, S., Clear, A., Finnigan, S.M., Meador, E., Milne, A.E. and Sharp, R.T., 2023. ‘Promoting dietary changes for achieving health and sustainability targets’, Frontiers in Sustainable Food Systems, 7, 1160627. https://doi.org/10.3389/fsufs.2023.1160627.
Bhunnoo, R. and Poppy, G.M., 2020. A national approach for transformation of the UK food system. Nature Food, 1(1), pp.6–8. https://doi.org/10.1038/s43016-019-0003-3
Billen, G., Aguilera, E., Einarsson, R., Garnier, J., Gingrich, S., Grizzetti, B., Lassaletta, L., Le Noë, J. and Sanz-Cobena, A., 2021. Reshaping the European agro-food system and closing its nitrogen cycle: The potential of combining dietary change, agroecology, and circularity. One Earth, 4(6), pp.839–850. https://doi.org/10.1016/j.oneear.2021.05.011
Booth, A., 2006. Clear and present questions: Formulating questions for evidence based practice. Library Hi Tech, 24(3), 355-368. https://doi.org/10.1108/07378830610692127
Boyle, N.B., Jenneson, V., Okeke-Ogbuafor, N., Morris, M.A., Stead, S.M., Dye, L., Halford, J.C. and Banwart, S.A., 2024. ‘Connected Food: First steps for an ambitious national food strategy’, Nutrients, 16(19), p. 3371. https://doi.org/10.3390/nu16193371.
Brennan, M., 2023. Food systems transformation in Scotland—The journey to, vision of, and challenges facing the new Good Food Nation (Scotland) Act. Sustainability, 15(19), p.14579. https://doi.org/10.3390/su151914579
Brett, S.N., 2022. Examining the opportunities for agricultural experiences as part of Scottish secondary school pupils’ learning under Curriculum for Excellence. Doctoral dissertation, University of Glasgow. [online] Available at: Examining the opportunities for agricultural experiences as part of Scottish secondary school pupils’ learning under Curriculum for Excellence – Enlighten Theses (Accessed: 14/1/25).
Briggs, H.R., Tallontire, A.M. and Dougill, A.J., 2019. Exploring the contribution of vertical farming to sustainable intensification from the point of view of the innovator and the farmer. Sustainability Research Institute, University of Leeds. [online] Available at: https://sri.leeds.ac.uk/publications/vertical-farming-sustainability (Accessed: 25/1/25).
Brodie, E., 2023. The potential for nature-based solutions in Scottish agriculture. [online] Available at: The Potential for Nature-based Solutions in Scottish Agriculture (Accessed: 25/11/24).
Bryant, C., Couture, A., Ross, E., Clark, A. and Chapman, T., 2024. A review of policy levers to reduce meat production and consumption. Appetite, p.107684. https://doi.org/10.1016/j.appet.2024.107684.
Centre for Climate Change and Social Transformations (CAST), 2024. Briefing 31: How Wales can speed up decarbonisation: Insights from transport and mobility, food and agriculture, and the circular and sharing economy. [online] Available at: CAST Briefing 31: How Wales can speed up decarbonisation: Insights from transport and mobility, food and agriculture, and the circular and sharing economy – CAST (Accessed: 3/11/24).
Cleland, E., McBey, D., Darlene, V., McCormick, B.J. and Macdiarmid, J.I., 2025. Still eating like there’s no tomorrow? A qualitative study to revisit attitudes and awareness around sustainable diets after 10 years. Appetite, 206, p.107799. https://doi.org/10.1016/j.appet.2024.107799.
Climate Change Committee (CCC) (2025) The Seventh Carbon Budget. Climate Change Committee. [online] Available at: https://www.theccc.org.uk/publication/7th-carbon-budget/ (Accessed: 4/3/25).
Climate Change Committee (CCC), 2023. Progress on reducing emissions in Scotland-2023 Report to Parliament. [online] Available at: https://www.theccc.org.uk/publication/progress-in-reducing-emissions-in-scotland-2023-report-to-parliament/ (Accessed 21/10/24).
Climate Change Committee (CCC), 2020. The Sixth Carbon Budget: The UK’s path to Net Zero. [online] Available at: https://www.theccc.org.uk/publication/sixth-carbon-budget/
(Accessed 25/11/24).
Comrie, L., Wilson, C., Nneli, A., Whybrow, S., Chalmers, N., and Macdiarmid, J.I., 2024. Modelling the impact of reductions in meat and dairy consumption on nutrient intakes and disease risk. [online] Available at: https://www.foodstandards.gov.scot/publications-and-research/publications/modelling-the-impact-of-reductions-in-meat-and-dairy-consumption-on-nutrient-intakes-and-disease-risk (Accessed: 14/12/24
Cotton, C., Gosschalk, K., Gray, H. and White, E., 2024. Consumer Scotland Net Zero 2024. Consumer Scotland. [online] Available at: [xm24-02-consumers-and-net-zero-net-zero-consumer-survey-yougov-final-report-pdf-version-for-publication.pdf] (Accessed: 14/1/25).
Culliford, A.E., Bradbury, J. and Medici, E.B., 2023. Improving communication of the UK sustainable healthy dietary guidelines—the Eatwell Guide: A rapid review. Sustainability, 15(7), p.6149. https://doi.org/10.3390/su15076149
Department for Environment, Food & Rural Affairs (Defra), 2024. Assessing carbon displacement risk in the agri-food sector: The development and application of a carbon displacement and wider impacts framework. October 2024. Defra. [online] Available at: ADAS Collaborate on Project Investigating Carbon Displacement (Accessed: 25/11/25).
Dogbe, W., Revoredo-Giha, C. and Russell, W., 2024. An analysis of the current and potential market opportunities for hempseed and fibre: the case of Scotland? Agriculture & Food Security, 13(1), p.57. https://doi.org/10.1186/s40066-024-00388-6.
Dogbe, W., Wang, Y. and Revoredo-Giha, C., 2024. Nutritional implications of substituting plant-based proteins for meat: Evidence from home scan data. Agricultural and Food Economics, 12(1), p.30. https://doi.org/10.1186/s40100-024-00272-2.
EAT (n.d.) Summary Report of the EAT-Lancet Commission. [online] Available at: https://eatforum.org/eat-lancet-commission/eat-lancet-commission-summary-report/
(Accessed: 2/11/24).
Eating Better, 2022. Sandwiches unwrapped 2022. [online] Available at: eb_sandwichreport_may22_final.pdf (Accessed 24/3/25).
Edwards-Jones, G., 2010. Does eating local food reduce the environmental impact of food production and enhance consumer health? Proceedings of the Nutrition Society, 69(4), pp.582–591. https://doi.org/10.1017/S0029665110002004
Ellis, N.R. and Tschakert, P., 2019. Triple-wins as pathways to transformation? A critical review. Geoforum, 103, pp.167-170. https://doi.org/10.1016/j.geoforum.2019.04.017
Eory, V., Topp, K., Rees, B., Jones, S., Waxenberg, K., Barnes, A., Smith, P., MacLeod, M. and Wall, E., 2023. A scenario-based approach to emissions reduction targets in Scottish agriculture. ClimateXChange (CXC). [online] Available at: A scenario-based approach to emissions reduction targets in Scottish agriculture (Accessed 14/1/25).
Fardet, A. and Rock, E., 2020. Ultra-processed foods and food system sustainability: What are the links? Sustainability, 12(15), p.6280. https://doi.org/10.3390/su12156280
Nourish Scotland, 2021. Farming for 1.5° final report. [online] Available at: https://www.farming1point5.org/publications [Accessed 17/12/24].
Ferguson, H.J., Bowen, J.M., McNicol, L.C., Bell, J., Duthie, C.A. and Dewhurst, R.J., 2024. The impacts of precision livestock farming tools on the greenhouse gas emissions of an average Scottish dairy farm. Frontiers in Sustainable Food Systems, 8, p.1385672. https://doi.org/10.3389/fsufs.2024.1385672
Follett, E., Davis, L., Wilson, C. and Cable, J., 2024. Working for the environment: farmer attitudes towards sustainable farming actions in rural Wales, UK, Environment, Development and Sustainability, pp. 1–20. https://doi.org/10.1007/s10668-024-03764-7.
Food and Drink Federation (FDF), 2020. Product reformulation: Understanding Scottish consumer attitudes. [online] Available at: Research shows consumers are actively seeking healthier food | The Food & Drink Federation (Accessed: 3/11/24).
Food, Farming and Countryside Commission (FFCC), 2024. From food security to food resilience. [online] Available at: From Food Security to Food Resilience – Food, Farming and Countryside Commission (Accessed: 17/12/24).
Food, Farming and Countryside Commission (FFCC), 2023. So, what do we really want from food? Citizens are hungry for change: Starting a national conversation about food. [online] Available at: [So, what do we really want from food? – Food, Farming and Countryside Commission] (Accessed: 3/11/24).
Food Standards Agency (FSA), 2022. Alternative proteins consumer survey. [online] Available at: FSA report template (Accessed: 23/1/25).
Food Standards Scotland (FSS) (2024) New research shows existing dietary advice can help us meet climate change mitigation goals. Food Standards Scotland. [online] Available at: https://www.foodstandards.gov.scot/news-and-alerts/new-research-shows-existing-dietary-advice-can-help-us-meet-climate-change-mitigation-goals (Accessed: 23/1/25).
Food Standards Scotland (FSS), 2023. Consumer attitudes towards the diet and food environment in Scotland. Food Standards Scotland. [online] Available at: https://www.foodstandards.gov.scot/publications-and-research/publications/consumer-attitudes-towards-the-diet-and-food-environment-in-scotland (Accessed: 17/12/24).
Food Standards Scotland (FSS), 2021a. Overview of the total food and drink landscape in Scotland 2021. [online] Available at: https://www.foodstandards.gov.scot/publications-and-research/publications/overview-of-the-total-food-and-drink-landscape-in-scotland-2021
(Accessed: 25/11/24).
Food Standards Scotland (FSS), 2021b. The out of home environment in Scotland. Food Standards Scotland. [online] Available at: https://www.foodstandards.gov.scot/publications-and-research/publications/the-out-of-home-environment-in-scotland (Accessed: 3/11/24).
Foster, J.A. and Poston, A., 2024. Occupant experience of domestic kitchen environments in low-energy social and affordable housing in Scotland. Building Research & Information, 52(7), pp.799–816. https://doi.org/10.1080/09613218.2024.2312504.
Gargano, G., 2021. The bottom-up development model as a governance instrument for the rural areas: The cases of four Local Action Groups (LAGs) in the United Kingdom and in Italy. Sustainability, 13(16), p.9123. https://doi.org/10.3390/su13169123.
Gill, M., Fowler, K. and Scott, E.M., 2024. ‘Bridging the gap between science and food policy: nutrition as a driver of policy drawing on Scotland as a case study’, Proceedings of the Nutrition Society, pp. 1–15. https://doi.org/10.1017/S0029665124000267.
Hasnain, S., Green, R., Williams, A., Dangour, A.D., Smith, P. and Hillier, J., 2020. Mapping the UK food system – a report for the UKRI Transforming UK Food Systems Programme. University of Oxford. [online] Available at: https://www.foodsystemresearch.org.uk/publications/mapping-the-uk-food-system (Accessed: 3/11/24).
Hielkema, M.H. and Lund, T.B., 2021. ‘Reducing meat consumption in meat-loving Denmark: Exploring willingness, behavior, barriers and drivers’, Food Quality and Preference, 93, 104257. https://doi.org/10.1016/j.foodqual.2021.104257.
Holmes, E.J., 2018. Brexit, beef, and beans: a sustainable food-system approach for the UK. Master’s thesis, Norwegian University of Life Sciences, Ås. [online] Available at: 249964646.pdf (Accessed: 18/2/25).
Houzer, E. and Scoones, I., 2021. Are livestock always bad for the planet? Rethinking the protein transition and climate change debate. Institute of Development Studies. [online] Available at: https://www.ids.ac.uk/publications/are-livestock-always-bad-for-the-planet-rethinking-the-protein-transition-and-climate-change-debate/ (Accessed: 26/1/24.
Hunt, L., Pettinger, C. and Wagstaff, C., 2023. A critical exploration of the diets of UK disadvantaged communities to inform food systems transformation: A scoping review of qualitative literature using a social practice theory lens. BMC Public Health, 23(1), p.1970. https://doi.org/10.1186/s12889-023-16775-3.
Jaacks, L., Frank, S., Vonderschmidt, A., Stewart, C., Runions, R., Kennedy, J., McNeill, G. and Alexander, P., 2024. Understanding the climate impact of food consumed in Scotland. University of Edinburgh. [online] Available at: https://era.ed.ac.uk/bitstream/handle/1842/41611/CXC-Understanding-the-climate-impact-of-food-consumed-in-Scotland-evidence-assessment-February-2024.pdf?sequence=3&isAllowed=y (Accessed: 27/10/24).
Jenkins, B., Avis, K., Willcocks, J., Martin, G., Wiltshire, J. and Peters, E., 2023. Adapting Scottish agriculture to a changing climate – assessing options for action. Ricardo Energy & Environment. [online] Available at: https://www.gov.scot/publications/adapting-scottish-agriculture-to-a-changing-climate (Accessed: 25/10/24).
Jenkins, B., Herold, L., de Mendonça, M., Loughnan, H., Willcocks, J., David, T., Ginns, B., Rock, L., Wilshire, J., Avis, K., 2024. Breeding for reduced methane emissions in livestock. ClimateXChange. [online] Available at: http://dx.doi.org/10.7488/era/5569 (Accessed: 3/11/24).
Kemper, J.A., 2020. ‘Motivations, barriers, and strategies for meat reduction at different family lifecycle stages’, Appetite, 150, 104644. https://doi.org/10.1016/j.appet.2020.104644.
Kennedy, J., Clark, M., Stewart, C., Runions, R., Vonderschmidt, A., Frank, S., Scarborough, P., Comrie, F., McDonald, A., McNeill, G., Alexander, P. and Jaacks, L., 2025. Impact of reducing meat and dairy consumption on nutrient intake, health, cost of diets and the environment: A simulation among adults in Scotland. Research Square [online] Available at: Impact of reducing meat and dairy consumption on nutrient intake, health, cost of diets and the environment: A simulation among adults in Scotland (Accessed: 3/3/25).
Kmetkova, D., Zverinova, I., Scasny, M. and Máca, V., 2024. Acceptability of meat tax and subsidy removal by meat-eaters: insights from five European countries (No. 2024/42). Charles University Prague, Faculty of Social Sciences, Institute of Economic Studies. [online] Available at: https://ies.fsv.cuni.cz (Accessed: 14/1/25).
Kwasny, T., Dobernig, K. and Riefler, P., 2022. ‘Towards reduced meat consumption: A systematic literature review of intervention effectiveness, 2001–2019’, Appetite, 168, 105739. https://doi.org/10.1016/j.appet.2021.105739.
Lambe, F., Weitz, N., Hilgert, A., Kemp-Benedict, E. and Carlsen, H., 2025. Applying the Unlocking a Better Future framework for a just transition in Scotland: Opportunities for the Scottish Government to promote socio-economic transformations needed to help tackle the climate and nature emergencies. Stockholm Environment Institute. [online] Available at: https://www.sei.org/publications/just-transition-scotland-unlocking-a-better-future/ (Accessed: 17/1/25.
Lampkin, N., Shrestha, S., Sellars, A., Baldock, D., Smith, J., Mullender, S., Keenleyside, C., Pearce, B. and Watson, C.A., 2021. Preparing the evidence base for post-Brexit agriculture in Scotland – case studies on alternative payments. Scotland’s Rural College (SRUC) and Institute for European Environmental Policy (IEEP). [online] Available at: https://www.gov.scot/publications/preparing-the-evidence-base-for-post-brexit-agriculture-in-scotland/ (Accessed: 3/2/25).
Leat, P., Revoredo-Giha, C. and Lamprinopoulou, C., 2011. ‘Scotland’s food and drink policy discussion: Sustainability issues in the food supply chain’, Sustainability, 3(4), pp. 605–631. https://doi.org/10.3390/su3040605.
Lee, A.J., Cullerton, K. and Herron, L.M., 2020. ‘Achieving food system transformation: Insights from a retrospective review of nutrition policy (in) action in high-income countries’, International Journal of Health Policy and Management, 10(12), pp. 766–776. https://doi.org/10.34172/ijhpm.2020.69.
Lozada, L.M. and Karley, A., 2022. The adoption of agroecological principles in Scottish farming and their contribution towards agricultural sustainability and resilience. The James Hutton Institute. [online] Available at: https://www.hutton.ac.uk/research/projects/agroecology-scotland (Accessed: 1/11/24).
Malone, T. and Lusk, J.L., 2017. Taste trumps health and safety: Incorporating consumer perceptions into a discrete choice experiment for meat. Journal of Agricultural and Applied Economics, 49(1), pp.139–157. https://doi.org/10.1017/aae.2016.39.
McAreavey, R., Choudhary, S., Obayi, R., Attorp, A., Barbulescu, R., Martinez Perez, A. and Nayak, R., 2023. The impact of labour shortages on UK food availability and safety. [online] Available at: https://www.food.gov.uk/research/the-impact-of-labour-shortages-on-uk-food-availability-and-safety (Accessed: 14/1/25).
McBey, D., McCormick, B.J.J., Hussain, M. and Macdiarmid, J.I., 2024. ‘Does sociodemographic strata determine local access to plant-based meat alternatives?’, Proceedings of the Nutrition Society, 83(OCE4), p. E350. https://doi.org/10.1017/S0029665124003723.
McBey, D., Rothenberg, L., Cleland, E., McCormick, B.J. and Macdiarmid, J., 2024. What do young people think about sustainable diets? The Rowett Institute, University of Aberdeen. [online] Available at: https://aura.abdn.ac.uk/bitstream/handle/2164/24312/McBey_etal_What_do_young_VOR.pdf?sequence=1 (Accessed: 20/1/25).
McBey, D., Sánchez, G.M., McCormick, B.J.J., Horgan, G.W. and MacDiarmid, J.I., 2024. Consumer ranked likely effectiveness of interventions to reduce meat consumption, Proceedings of the Nutrition Society, 83(OCE4), p. E296. https://doi.org/10.1017/S0029665124002963.
McBey, D., Watts, D. and Johnstone, A.M., 2019. Nudging, formulating new products, and the lifecourse: A qualitative assessment of the viability of three methods for reducing Scottish meat consumption for health, ethical, and environmental reasons, Appetite, 142, 104349. https://doi.org/10.1016/j.appet.2019.104349.
McNicol, L.C., Bowen, J.M., Ferguson, H.J., Bell, J., Dewhurst, R.J. and Duthie, C.A., 2024. Adoption of precision livestock farming technologies has the potential to mitigate greenhouse gas emissions from beef production, Frontiers in Sustainable Food Systems, 8, 1414858. https://doi.org/10.3389/fsufs.2024.1414858.
Meyerricks, S. and White, R.M., 2021. Communities on a threshold: Climate action and wellbeing potentialities in Scotland, Sustainability, 13(13), 7357. https://doi.org/10.3390/su13137357.
Milner, J., Green, R., Dangour, A.D., Haines, A. and Wilkinson, P., 2015. Health effects of adopting low greenhouse gas emission diets in the UK, BMJ Open, 5(4), e007364. https://doi.org/10.1136/bmjopen-2014-007364.
Mitev, A., Portes, J., Osman, M., Codur, A.M., Abraham, C. and Kroll, L., 2023. The implications of behavioural science for effective climate policy: Output 1: Literature review and background report. Centre for Climate Change and Social Transformations (CAST) and The Behavioural Insights Team. [online] Available at: https://cast.ac.uk/resources/reports/the-implications-of-behavioural-science-for-effective-climate-policy/ (Accessed: 15/10/24).
Myrgiotis, V., Williams, M., Rees, R.M. and Topp, C.F., 2019. Estimating the soil N₂O emission intensity of croplands in northwest Europe. Biogeosciences, 16(8), pp.1641–1655. https://doi.org/10.5194/bg-16-1641-2019.
National Farmers’ Union Scotland (NFUS), n.d. Written evidence from the National Farmers Union Scotland (NFUS) (MET0027). Available at: https://committees.parliament.uk/writtenevidence/110519/pdf/ (Accessed: 19/1/25).
Nneli, A., Revoredo-Giha, C. and Dogbe, W., 2023. ‘Could taxes on foods high in fat, sugar and salt (HFSS) improve climate health and nutrition in Scotland?’, Journal of Cleaner Production, 421, 138564. https://doi.org/10.1016/j.jclepro.2023.138564.
Obesity Action Scotland (OAS), 2019. Reformulation. [online] Available at: https://www.obesityactionscotland.org/publications/reformulation/ (Accessed: 2/11/24).
Pechey, R., Reynolds, J.P., Cook, B., Marteau, T.M. and Jebb, S.A., 2022. Acceptability of policies to reduce consumption of red and processed meat: A population-based survey experiment, Journal of Environmental Psychology, 81, 101817. https://doi.org/10.1016/j.jenvp.2022.101817.
Public Health Scotland (PHS), 2024. Action needed to prioritise health in Scotland’s food environment. [online] Available at: https://www.publichealthscotland.scot/news/2024/march/action-needed-to-prioritise-health-in-scotlands-food-environment/ (Accessed: 16/12/24).
Pultar, A., Ferrier, J. & Jahanbakhsh, A., 2024. Transforming industry: Strategic policy insights for Scotland’s industrial decarbonisation. [online] Available at: [https://pure.hw.ac.uk/ws/portalfiles/portal/139634343/IDRIC_Policy_Synthesis_Report_for_Scotland_-_2024.pdf (Accessed: 25/11/24).
Rathnayaka, S.D., Revoredo-Giha, C. and de Roos, B., 2024. Assessing Scotland’s self-sufficiency of major food commodities, Agriculture & Food Security, 13(1), p. 34. https://doi.org/10.1186/s40066-024-00452-3.
Reay, D.S., Warnatzsch, E.A., Craig, E., Dawson, L., George, S., Norman, R. and Ritchie, P., 2020. ‘From farm to fork: growing a Scottish food system that doesn’t cost the planet’, Frontiers in Sustainable Food Systems, 4, 72. https://doi.org/10.3389/fsufs.2020.00072.
Rhymes, J., Stockdale, E. and Napier, B., 2023. The future of UK vegetable production: Technical report. WWF. [online] Available at: https://www.wwf.org.uk/ourreports/future-uk-vegetable-production-technical-report (Accessed: 3/11/24).
Ruani, M.A., Reiss, M.J. and Kalea, A.Z., 2023. Diet-nutrition information seeking, source trustworthiness, and eating behavior changes: An international web-based survey. Nutrients, 15(21), p.4515. https://doi.org/10.3390/nu15214515.
Rubio Ramon, G., 2024. Building animal nations: industrial animal agriculture in the making of Catalonia and Scotland. ERA [online] Available at: https://era.ed.ac.uk/handle/1842/41639 (Accessed: 26/1/25).
SAC Consulting, n.d. The impact of extreme weather events on Scottish agriculture. WWF Scotland. [online] Available at: https://www.wwf.org.uk/scotland/reports/impact-of-extreme-weather-on-scottish-agriculture (Accessed: 29/11/24.
Scottish Government, 2024. Local food for everyone: Our journey. [online] Available at: https://www.gov.scot/publications/local-food-for-everyone-our-journey/ (Accessed: 15/12/24).
Scottish Government, 2023. Reducing emissions from agriculture – the role of new farm technologies. [online] Available at: https://www.gov.scot/publications/reducing-emissions-from-agriculture-role-of-new-farm-technologies/ (Accessed: 2/11/24).
Scottish Government, 2022a. National Good Food Nation Plan. [online] Available at: https://www.gov.scot/publications/national-good-food-nation-plan/ (Accessed: 19/10/24).
Scottish Government, 2022b. The next step in delivering our vision for Scotland as a leader in sustainable and regenerative farming. [online] Available at: https://www.gov.scot/publications/next-step-in-delivering-our-vision-for-scotland-as-a-leader-in-sustainable-and-regenerative-farming/ (Accessed: 27/10/24).
Scottish Government, 2013. Revised dietary goals for Scotland. [online] Available at: https://www.gov.scot/publications/revised-dietary-goals-for-scotland/ (Accessed: 28/10.24).
Scottish Government, n.d.(a). Agriculture and the environment. [online] Available at: https://www.gov.scot/policies/agriculture-and-the-environment/ (Accessed: 21/10/24).
Scottish Parliament, n.d.(b). Briefing for the Citizen Participation and Public Petitions Committee on Petition PE1963: Phase in meat production ban by 2040. [online] Available at: Briefing for petition PE1963: Phase in meat production ban by 2040 (Accessed 23/1/25).
Shortland, F., Hall, J., Hurley, P., Little, R., Nye, C., Lobley, M. and Rose, D.C., 2023. Landscapes of support for farming mental health: Adaptability in the face of crisis. Sociologia Ruralis, 63, pp.116–140. https://doi.org/10.1111/soru.12399.
Smith, A.M., Duncan, P., Edgar, D. and McColl, J., 2021. Responsible and sustainable farm business: Contextual duality as the moderating influence on entrepreneurial orientation. The International Journal of Entrepreneurship and Innovation, 22(2), pp.88–99. https://doi.org/10.1177/1465750320939779.
Sovacool, B.K., Bazilian, M., Griffiths, S., Kim, J., Foley, A. and Rooney, D., 2021. ‘Decarbonizing the food and beverages industry: A critical and systematic review of developments, sociotechnical systems and policy options’, Renewable and Sustainable Energy Reviews, 143, 110856. https://doi.org/10.1016/j.rser.2021.110856.
Spiro, A., Hill, Z. and Stanner, S., 2024. Meat and the future of sustainable diets—Challenges and opportunities’, Nutrition Bulletin, 49(4), pp. 572–598. https://doi.org/10.1111/nbu.12685.
Sutherland, L.A., Banks, E., Boyce, A. and Martinat, S., 2023. Establishing an agricultural knowledge and innovation system. The James Hutton Institute. [online] Available at: establishing-an-agriculture-knowledge-and-innovation-system-in-scotland-workshop-report-jan-2023.pdf (Accessed: 17/12/24).
Sutherland, L.A. and Burton, R.J., 2011. Good farmers, good neighbours? The role of cultural capital in social capital development in a Scottish farming community. Sociologia Ruralis, 51(3), pp.238–255. https://doi.org/10.1111/j.1467-9523.2011.00536.x.
Thomson, S.G., Moxey, A.P. and Hall, J., 2021. The transition to future (conditional) agricultural support – NFU Scotland’s approach. NFU Scotland. [online] Available at: https://www.nfus.org.uk/news/news/conditional-agricultural-support (Accessed: 8/1/25).
Tregear, A., Morgan, E., Spence, L., and Bell, M., 2024. Dietary guidance for healthy and climate friendly diets: A review of international evidence. Food Standards Scotland. [online] Available at: https://www.foodstandards.gov.scot/publications-and-research/dietary-guidance-for-healthy-and-climate-friendly-diets (Accessed: 20/10/24).
van der Horst, D., Lane, M., Creasy, A., Gillette, K., Soriano-Hernández, P., Jia, H. and Smith, R.S., 2021. Edinburgh and the n-minute neighbourhood concept: an exploratory study. Available at: https://www.research.ed.ac.uk/en/publications/edinburgh-and-the-n-minute-neighbourhood-concept-an-exploratory- (Accessed: 14/1/25).
Vittersø, G., Torjusen, H., Laitala, K., Tocco, B., Biasini, B., Csillag, P., de Labarre, M.D., Lecoeur, J.L., Maj, A., Majewski, E. and Malak-Rawlikowska, A., 2019. Short food supply chains and their contributions to sustainability: Participants’ views and perceptions from 12 European cases’, Sustainability, 11(17), p. 4800. https://doi.org/10.3390/su11174800.
White, J.T. and Bunn, C., 2017. Growing in Glasgow: Innovative practices and emerging policy pathways for urban agriculture, Land Use Policy, 68, pp. 334–344. https://doi.org/10.1016/j.landusepol.2017.07.052.
Wiltshire, J., Freeman, D., Willcocks, J. and Wood, C., 2021. The potential for leguminous crops in Scotland. Ricardo Energy & Environment. [online] Available at: The potential for leguminous crops in Scotland (Accessed: 23/1/25).
Witheridge, J. and Morris, N.J., 2016. An analysis of the effect of public policy on community garden organisations in Edinburgh, Local Environment, 21(2), pp. 202–218. https://doi.org/10.1080/13549839.2014.940357.
Appendix A: Diet & climate policy stakeholder identification and mapping methodology
Purpose and Scope
The stakeholder mapping exercise aimed to identify and understand the individuals and organisations who influence or are affected by climate and diet policies in Scotland. It was designed to support inclusive, evidence-informed policy review by incorporating a broad range of perspectives.
The mapping focused on ten key policy areas:
- Agriculture
- Food systems
- Public health
- Carbon emissions
- Land use and forestry
- Water use and pollution
- Economic and social impacts
- Food security
- Consumer behaviour and education
- Urban planning and food infrastructure
Stakeholders were assessed for their relevance to these areas and the potential for involvement in the policy process.
Methods
- Desk research: Systematic searches of government documents, NGO and advocacy websites, academic literature, and media reports to compile a draft list of stakeholders.
- Expert consultation: Meetings with policymakers, researchers, and advisors to validate the list and identify additional stakeholders.
- Categorisation: Stakeholders were grouped by type (e.g., government, academia, NGOs, industry, health, community, media, public).
- Influence–Interest Mapping: Stakeholders were classified based on their level of influence over, and interest in, diet and climate policy. A rubric guided the assignment of High, Medium, or Low categories for each.
Stakeholder Categories
Stakeholders were grouped into eight high-level categories:
- Government bodies and regulators (e.g., Scottish Government, SEPA, Food Standards Scotland)
- Research and academia (e.g., University research centres, think tanks)
- NGOs and advocacy groups (e.g., Nourish Scotland, Friends of the Earth Scotland)
- Agriculture and food industry (e.g., NFU Scotland, food producers, retailers)
- Public health bodies (e.g., NHS Scotland, Public Health Scotland)
- Community organisations (e.g., local sustainability hubs, rural associations)
- Media and influencers (e.g., journalists, campaigners)
- General public and citizen groups (e.g., low-income groups, consumer organisations)
Ongoing Adaptation
Stakeholder positions and influence are dynamic. The mapping process includes continuous review to respond to evolving policy priorities and to adapt engagement strategies accordingly.
Appendix B: Findings from the stakeholder identification and mapping analysis
|
# |
Stakeholder name |
Stakeholder primary category |
Stakeholder sub-category |
|---|---|---|---|
|
1 |
Defra |
(1) Government bodies, agencies & regulators |
(1a) UK Government bodies |
|
2 |
UK Government |
(1) Government bodies, agencies & regulators |
(1a) UK Government bodies |
|
3 |
UK Parliament |
(1) Government bodies, agencies & regulators |
(1a) UK Government bodies |
|
4 |
HM Revenue and Customs |
(1) Government bodies, agencies & regulators |
(1a) UK Government bodies |
|
5 |
Marine Scotland Directorate |
(1) Government bodies, agencies & regulators |
(1b) Scottish Government bodies |
|
6 |
Agriculture and Rural Economy Directorate |
(1) Government bodies, agencies & regulators |
(1b) Scottish Government bodies |
|
7 |
Diet and Healthy Weight Team |
(1) Government bodies, agencies & regulators |
(1b) Scottish Government bodies |
|
8 |
Good Food Nation Working Group |
(1) Government bodies, agencies & regulators |
(1b) Scottish Government bodies |
|
9 |
Health & Social Care Directorate |
(1) Government bodies, agencies & regulators |
(1b) Scottish Government bodies |
|
10 |
Population Health Directorate |
(1) Government bodies, agencies & regulators |
(1b) Scottish Government bodies |
|
11 |
Scottish Government |
(1) Government bodies, agencies & regulators |
(1b) Scottish Government bodies |
|
12 |
Food Security Unit |
(1) Government bodies, agencies & regulators |
(1b) Scottish Government bodies |
|
13 |
Future Environment Division |
(1) Government bodies, agencies & regulators |
(1b) Scottish Government bodies |
|
14 |
Energy and Climate Change Directorate |
(1) Government bodies, agencies & regulators |
(1b) Scottish Government bodies |
|
15 |
Scottish Government (SGRPID, Animal health) (dairy production) |
(1) Government bodies, agencies & regulators |
(1b) Scottish Government bodies |
|
16 |
Environment and Forestry Directorate |
(1) Government bodies, agencies & regulators |
(1b) Scottish Government bodies |
|
17 |
Learning Directorate Support & Wellbeing Unit |
(1) Government bodies, agencies & regulators |
(1b) Scottish Government bodies |
|
18 |
Scottish Labour Party |
(1f) Scottish political parties |
(1b) Scottish Government bodies |
|
19 |
Food Standards Agency Scotland (FSAS) |
(1) Government bodies, agencies & regulators |
(1c) Advisory agencies and regulators |
|
20 |
Decoupling Advisory Group |
(1) Government bodies, agencies & regulators |
(1c) Advisory agencies and regulators |
|
21 |
Resource Efficient Scotland |
(1) Government bodies, agencies & regulators |
(1c) Advisory agencies and regulators |
|
22 |
Scotland’s Climate Assembly |
(1) Government bodies, agencies & regulators |
(1c) Advisory agencies and regulators |
|
23 |
Scotland’s Futures Forum |
(1) Government bodies, agencies & regulators |
(1c) Advisory agencies and regulators |
|
24 |
Just Transition Commission |
(1) Government bodies, agencies & regulators |
(1c) Advisory agencies and regulators |
|
25 |
Scottish Environment Protection Agency (SEPA) |
(1) Government bodies, agencies & regulators |
(1c) Advisory agencies and regulators |
|
26 |
NatureScot (SNH) |
(1) Government bodies, agencies & regulators |
(1c) Advisory agencies and regulators |
|
27 |
Environmental Standards Scotland (ESS) |
(1) Government bodies, agencies & regulators |
(1c) Advisory agencies and regulators |
|
28 |
Environment and Forestry Directorate |
(1) Government bodies, agencies & regulators |
(1c) Advisory agencies and regulators |
|
29 |
Scottish Forestry |
(1) Government bodies, agencies & regulators |
(1c) Advisory agencies and regulators |
|
30 |
Energy and Climate Change Directorate |
(1) Government bodies, agencies & regulators |
(1c) Advisory agencies and regulators |
|
31 |
Scottish Climate Intelligence Service |
(1) Government bodies, agencies & regulators |
(1c) Advisory agencies and regulators |
|
32 |
Scotland Farm Advisory Service (FAS) |
(1) Government bodies, agencies & regulators |
(1c) Advisory agencies and regulators |
|
33 |
Adaptation Scotland |
(1) Government bodies, agencies & regulators |
(1c) Advisory agencies and regulators |
|
34 |
Agriculture and Rural Economy Directorate |
(1) Government bodies, agencies & regulators |
(1c) Advisory agencies and regulators |
|
35 |
Scottish Food Commission |
(1) Government bodies, agencies & regulators |
(1c) Advisory agencies and regulators |
|
36 |
Ministerial Working Group on Food |
(1) Government bodies, agencies & regulators |
(1c) Advisory agencies and regulators |
|
37 |
Good Food Nation Working Group |
(1) Government bodies, agencies & regulators |
(1c) Advisory agencies and regulators |
|
38 |
Environment, Climate Change and Land Reform |
(1) Government bodies, agencies & regulators |
(1c) Advisory agencies and regulators |
|
39 |
Economic Development and Fair Work |
(1) Government bodies, agencies & regulators |
(1c) Advisory agencies and regulators |
|
40 |
Agriculture and Horticulture Development Board |
(1) Government bodies, agencies & regulators |
(1c) Advisory agencies and regulators |
|
41 |
Scottish Government Rural Payments and Inspections Division |
(1) Government bodies, agencies & regulators |
(1c) Advisory agencies and regulators |
|
42 |
Scottish Natural Heritage |
(1) Government bodies, agencies & regulators |
(1c) Advisory agencies and regulators |
|
43 |
Scottish Water |
(1) Government bodies, agencies & regulators |
(1c) Advisory agencies and regulators |
|
44 |
Scottish Enterprise |
(1) Government bodies, agencies & regulators |
(1c) Advisory agencies and regulators |
|
45 |
Crown Estate |
(1) Government bodies, agencies & regulators |
(1c) Advisory agencies and regulators |
|
46 |
European Union Network for the Implementation and Enforcement of Environmental Law (IMPEL) (dairy production) |
(1) Government bodies, agencies & regulators |
(1c) Advisory agencies and regulators |
|
47 |
Committee on Climate Change (CCC) |
(1) Government bodies, agencies & regulators |
(1c) Advisory agencies and regulators |
|
48 |
Forestry Commission (FC) |
(1) Government bodies, agencies & regulators |
(1c) Advisory agencies and regulators |
|
49 |
Scottish Science Advisory Council (SSAC) |
(1) Government bodies, agencies & regulators |
(1c) Advisory agencies and regulators |
|
50 |
Science and Advice for Scottish Agriculture (SASA) |
(1) Government bodies, agencies & regulators |
(1c) Advisory agencies and regulators |
|
51 |
Sustainable Development Commission |
(1) Government bodies, agencies & regulators |
(1c) Advisory agencies and regulators |
|
52 |
Climate Adaptation Team |
(1) Government bodies, agencies & regulators |
(1c) Advisory agencies and regulators |
|
53 |
SEA Gateway |
(1) Government bodies, agencies & regulators |
(1c) Advisory agencies and regulators |
|
54 |
Scottish Land Commission |
(1) Government bodies, agencies & regulators |
(1c) Advisory agencies and regulators |
|
55 |
Health Protection Scotland |
(1) Government bodies, agencies & regulators |
(1c) Advisory agencies and regulators |
|
56 |
Retail Industry Leadership Group (ILG) |
(1) Government bodies, agencies & regulators |
(1c) Advisory agencies and regulators |
|
57 |
Agri-tourism Monitor Farm Programme |
(1) Government bodies, agencies & regulators |
(1c) Advisory agencies and regulators |
|
58 |
Education and Skills |
(1) Government bodies, agencies & regulators |
(1c) Advisory agencies and regulators |
|
59 |
Business Gateway |
(1) Government bodies, agencies & regulators |
(1c) Advisory agencies and regulators |
|
60 |
Highland and Islands Enterprise |
(1) Government bodies, agencies & regulators |
(1c) Advisory agencies and regulators |
|
61 |
Transport Authority |
(1) Government bodies, agencies & regulators |
(1c) Advisory agencies and regulators |
|
62 |
Revenue Scotland (leather sector) |
(1) Government bodies, agencies & regulators |
(1c) Advisory agencies and regulators |
|
63 |
Forestry and Land Scotland |
(1) Government bodies, agencies & regulators |
(1c) Advisory agencies and regulators |
|
64 |
Historic Environment Scotland |
(1) Government bodies, agencies & regulators |
(1c) Advisory agencies and regulators |
|
65 |
Crofting Commission |
(1) Government bodies, agencies & regulators |
(1c) Advisory agencies and regulators |
|
66 |
Scottish Law Commission |
(1) Government bodies, agencies & regulators |
(1c) Advisory agencies and regulators |
|
67 |
Scottish Fiscal Commission |
(1) Government bodies, agencies & regulators |
(1c) Advisory agencies and regulators |
|
68 |
Scottish Funding Council (SFC) |
(1) Government bodies, agencies & regulators |
(1c) Advisory agencies and regulators |
|
69 |
Scottish Human Rights Commission (SHRC) |
(1) Government bodies, agencies & regulators |
(1c) Advisory agencies and regulators |
|
70 |
Scottish Council on Global Affairs (SCGA) |
(1) Government bodies, agencies & regulators |
(1c) Advisory agencies and regulators |
|
71 |
Policy Connect |
(1) Government bodies, agencies & regulators |
(1c) Advisory agencies and regulators |
|
72 |
Advisory Group on Economic Recovery |
(1) Government bodies, agencies & regulators |
(1c) Advisory agencies and regulators |
|
73 |
City of Edinburgh Council |
(1) Government bodies, agencies & regulators |
(1d) Local councils |
|
74 |
Highland Council |
(1) Government bodies, agencies & regulators |
(1d) Local councils |
|
75 |
Scottish Borders Council |
(1) Government bodies, agencies & regulators |
(1d) Local councils |
|
76 |
West Lothian Council |
(1) Government bodies, agencies & regulators |
(1d) Local councils |
|
77 |
Angus Council |
(1) Government bodies, agencies & regulators |
(1d) Local councils |
|
78 |
South Lanarkshire Council |
(1) Government bodies, agencies & regulators |
(1d) Local councils |
|
79 |
East Ayrshire Council |
(1) Government bodies, agencies & regulators |
(1d) Local councils |
|
80 |
Argyll and Bute Council |
(1) Government bodies, agencies & regulators |
(1d) Local councils |
|
81 |
Convention of Scottish Local Authorities (CoSLA) |
(1) Government bodies, agencies & regulators |
(1d) Local councils |
|
82 |
East Dunbartonshire Council |
(1) Government bodies, agencies & regulators |
(1d) Local councils |
|
83 |
South Ayrshire Council |
(1) Government bodies, agencies & regulators |
(1d) Local councils |
|
84 |
Aberdeen City Council |
(1) Government bodies, agencies & regulators |
(1d) Local councils |
|
85 |
Dundee City Council |
(1) Government bodies, agencies & regulators |
(1d) Local councils |
|
86 |
Inverclyde Council |
(1) Government bodies, agencies & regulators |
(1d) Local councils |
|
87 |
East Lothian Council |
(1) Government bodies, agencies & regulators |
(1d) Local councils |
|
88 |
East Renfrewshire Council |
(1) Government bodies, agencies & regulators |
(1d) Local councils |
|
89 |
Glasgow City Council |
(1) Government bodies, agencies & regulators |
(1d) Local councils |
|
90 |
Orkney Islands Council |
(1) Government bodies, agencies & regulators |
(1d) Local councils |
|
91 |
Shetland Islands Council |
(1) Government bodies, agencies & regulators |
(1d) Local councils |
|
92 |
Stirling Council |
(1) Government bodies, agencies & regulators |
(1d) Local councils |
|
93 |
West Dunbartonshire Council |
(1) Government bodies, agencies & regulators |
(1d) Local councils |
|
94 |
Scottish National Party |
(1) Scottish political parties |
(1e) Scottish Government bodies |
|
95 |
Scottish Conservative Party |
(1) Scottish political parties |
(1e) Scottish political parties |
|
96 |
Scottish Green Party |
(1b) Scottish Government bodies |
(1f) Scottish political parties |
|
97 |
University of Edinburgh |
(2) Research & academia |
(2b) Academic institutions |
|
98 |
University of Glasgow |
(2) Research & academia |
(2b) Academic institutions |
|
99 |
University of Stirling |
(2) Research & academia |
(2b) Academic institutions |
|
100 |
University of Dundee |
(2) Research & academia |
(2b) Academic institutions |
|
101 |
University of Strathclyde |
(2) Research & academia |
(2b) Academic institutions |
|
102 |
University of Aberdeen |
(2) Research & academia |
(2b) Academic institutions |
|
103 |
Scotland’s Rural College (SRUC) |
(2) Research & academia |
(2b) Academic institutions |
|
104 |
Scottish School of Forestry |
(2) Research & academia |
(2b) Academic institutions |
|
105 |
St Andrew’s University |
(2) Research & academia |
(2b) Academic institutions |
|
106 |
Royal Veterinary College |
(2) Research & academia |
(2b) Academic institutions |
|
107 |
UHI Inverness |
(2) Research & academia |
(2b) Academic institutions |
|
108 |
Glasgow Caledonian University |
(2) Research & academia |
(2b) Academic institutions |
|
109 |
The Queen’s Nursing Institute Scotland |
(2) Research & academia |
(2b) Academic institutions |
|
110 |
Heriot-Watt University |
(2) Research & academia |
(2b) Academic institutions |
|
111 |
Royal College of Nursing |
(2) Research & academia |
(2b) Academic institutions |
|
112 |
Scottish Environment, Food and Agriculture Research Institutions (SEFARI) |
(2) Research & academia |
(2c) Research centres |
|
113 |
James Hutton Institute |
(2) Research & academia |
(2c) Research centres |
|
114 |
Sustainability Exchange |
(2) Research & academia |
(2c) Research centres |
|
115 |
Centre for Ecology and Hydrology (NERC) |
(2) Research & academia |
(2c) Research centres |
|
116 |
University of Edinburgh Climate Change Institute (ECCI) |
(2) Research & academia |
(2c) Research centres |
|
117 |
Forest Research (FC) |
(2) Research & academia |
(2c) Research centres |
|
118 |
Scottish Environment, Food and Agriculture Research Institutions (SEFARI) |
(2) Research & academia |
(2c) Research centres |
|
119 |
Scotland Beyond Net Zero |
(2) Research & academia |
(2c) Research centres |
|
120 |
Scottish Alliance for Food (SCAF) |
(2) Research & academia |
(2c) Research centres |
|
121 |
Global Academy of Agriculture and Food Security, University of Edinburgh |
(2) Research & academia |
(2c) Research centres |
|
122 |
Sea Mammal Research Unit (SMRU) |
(2) Research & academia |
(2c) Research centres |
|
123 |
Biomathematics and Statistics Scotland (BioSS) |
(2) Research & academia |
(2c) Research centres |
|
124 |
Centre for Climate Justice, Glasgow Caledonian University |
(2) Research & academia |
(2c) Research centres |
|
125 |
Rowett Institute |
(2) Research & academia |
(2c) Research centres |
|
126 |
British Geological Survey |
(2) Research & academia |
(2c) Research centres |
|
127 |
British Geological Society (BGS) |
(2) Research & academia |
(2c) Research centres |
|
128 |
University of Strathclyde Fraser of Allander Institute (FAI) |
(2) Research & academia |
(2c) Research centres |
|
129 |
Nesta |
(2) Research & academia |
(2c) Research centres |
|
130 |
Research Innovation Scotland |
(2) Research & academia |
(2c) Research centres |
|
131 |
David Hume Institute |
(2) Research & academia |
(2c) Research centres |
|
132 |
What Works Scotland |
(2) Research & academia |
(2c) Research centres |
|
133 |
Research establishments |
(2) Research & academia |
(2c) Research centres |
|
134 |
ScotCen Social Research |
(2) Research & academia |
(2c) Research centres |
|
135 |
Pareto Consulting |
(2) Research & academia |
(2c) Research centres |
|
136 |
Food Researchers in Edinburgh (FRIED) |
(2) Research & academia |
(2c) Research centres |
|
137 |
Royal Society of Edinburgh |
(2) Research & academia |
(2d) Policy think tanks |
|
138 |
Institute for Public Policy Research (IPPR) Scotland |
(2) Research & academia |
(2d) Policy think tanks |
|
139 |
Green Alliance |
(2) Research & academia |
(2d) Policy think tanks |
|
140 |
Reform Scotland |
(2) Research & academia |
(2d) Policy think tanks |
|
141 |
Chatham House |
(3) Third Sector & advocacy groups |
(2d) Policy think tanks |
|
142 |
Common Weal |
(3) Third Sector & advocacy groups |
(2d) Policy think tanks |
|
143 |
Future Economy Scotland |
(3) Third Sector & advocacy groups |
(2d) Policy think tanks |
|
144 |
Common Wealth |
(3) Third Sector & advocacy groups |
(2d) Policy think tanks |
|
145 |
Food Ethics Council |
(3) Third Sector & advocacy groups |
(2d) Policy think tanks |
|
146 |
Policy Exchange |
(3) Third Sector & advocacy groups |
(2d) Policy think tanks |
|
147 |
Centre Think Tank |
(3) Third Sector & advocacy groups |
(2d) Policy think tanks |
|
148 |
Conservative Environment Network |
(3) Third Sector & advocacy groups |
(2d) Policy think tanks |
|
149 |
Capita |
(3) Third Sector & advocacy groups |
(2d) Policy think tanks |
|
150 |
THEOS |
(3) Third Sector & advocacy groups |
(2d) Policy think tanks |
|
151 |
The Badenoch and Strathspey Conservation Group (BSCG) |
(3) Third Sector & advocacy groups |
(3a) Environmental NGOs & advocacy groups |
|
152 |
Friends of the Earth Scotland |
(3) Third Sector & advocacy groups |
(3a) Environmental NGOs & advocacy groups |
|
153 |
Stop Climate Chaos Scotland |
(3) Third Sector & advocacy groups |
(3a) Environmental NGOs & advocacy groups |
|
154 |
Keep Scotland Beautiful |
(3) Third Sector & advocacy groups |
(3a) Environmental NGOs & advocacy groups |
|
155 |
Creative Carbon Scotland |
(3) Third Sector & advocacy groups |
(3a) Environmental NGOs & advocacy groups |
|
156 |
Scottish Environment LINK |
(3) Third Sector & advocacy groups |
(3a) Environmental NGOs & advocacy groups |
|
157 |
Scottish Wildlife Trust |
(3) Third Sector & advocacy groups |
(3a) Environmental NGOs & advocacy groups |
|
158 |
Scottish Wild Land Group |
(3) Third Sector & advocacy groups |
(3a) Environmental NGOs & advocacy groups |
|
159 |
Trees for Life |
(3) Third Sector & advocacy groups |
(3a) Environmental NGOs & advocacy groups |
|
160 |
RSPB Scotland |
(3) Third Sector & advocacy groups |
(3a) Environmental NGOs & advocacy groups |
|
161 |
Environmental Rights Centre for Scotland (ERCS) |
(3) Third Sector & advocacy groups |
(3a) Environmental NGOs & advocacy groups |
|
162 |
Scottish Countryside Rangers’ Associations |
(3) Third Sector & advocacy groups |
(3a) Environmental NGOs & advocacy groups |
|
163 |
Action to Protect Rural Scotland (APRS) |
(3) Third Sector & advocacy groups |
(3a) Environmental NGOs & advocacy groups |
|
164 |
The Cairngorms Campaign |
(3) Third Sector & advocacy groups |
(3a) Environmental NGOs & advocacy groups |
|
165 |
British Trust for Conservation Volunteers (BTCV) |
(3) Third Sector & advocacy groups |
(3a) Environmental NGOs & advocacy groups |
|
166 |
British Trust for Ornithology |
(3) Third Sector & advocacy groups |
(3a) Environmental NGOs & advocacy groups |
|
167 |
The Scottish Conservation Projects Trust (SCPT) |
(3) Third Sector & advocacy groups |
(3a) Environmental NGOs & advocacy groups |
|
168 |
Plantlife International |
(3) Third Sector & advocacy groups |
(3a) Environmental NGOs & advocacy groups |
|
169 |
The Wildfowl & Wetlands Trust |
(3) Third Sector & advocacy groups |
(3a) Environmental NGOs & advocacy groups |
|
170 |
The British Trust for Ornithology (BTO) |
(3) Third Sector & advocacy groups |
(3a) Environmental NGOs & advocacy groups |
|
171 |
Zero Waste Scotland |
(3) Third Sector & advocacy groups |
(3a) Environmental NGOs & advocacy groups |
|
172 |
Zero Waste Scotland |
(3) Third Sector & advocacy groups |
(3a) Environmental NGOs & advocacy groups |
|
173 |
Groundwork Trusts |
(3) Third Sector & advocacy groups |
(3a) Environmental NGOs & advocacy groups |
|
174 |
The National Biodiversity Network (NBN) Trust |
(3) Third Sector & advocacy groups |
(3a) Environmental NGOs & advocacy groups |
|
175 |
The Botanical Society of the British Isles (BSBI) |
(3) Third Sector & advocacy groups |
(3a) Environmental NGOs & advocacy groups |
|
176 |
The Conservation Volunteers |
(3) Third Sector & advocacy groups |
(3a) Environmental NGOs & advocacy groups |
|
177 |
Greenspace Scotland |
(3) Third Sector & advocacy groups |
(3a) Environmental NGOs & advocacy groups |
|
178 |
Net Zero Nation |
(3) Third Sector & advocacy groups |
(3a) Environmental NGOs & advocacy groups |
|
179 |
Green Action Trust |
(3) Third Sector & advocacy groups |
(3a) Environmental NGOs & advocacy groups |
|
180 |
Environmental Protection Scotland (EPS) |
(3) Third Sector & advocacy groups |
(3a) Environmental NGOs & advocacy groups |
|
181 |
Uplift UK |
(3) Third Sector & advocacy groups |
(3a) Environmental NGOs & advocacy groups |
|
182 |
Labour Climate and Environment Forum (LCEF) |
(3) Third Sector & advocacy groups |
(3a) Environmental NGOs & advocacy groups |
|
183 |
Climate Emergency UK |
(3) Third Sector & advocacy groups |
(3a) Environmental NGOs & advocacy groups |
|
184 |
Tipping Point UK |
(3) Third Sector & advocacy groups |
(3a) Environmental NGOs & advocacy groups |
|
185 |
Royal Scottish Geographical Society |
(3) Third Sector & advocacy groups |
(3a) Environmental NGOs & advocacy groups |
|
186 |
Scotland The Big Picture |
(3) Third Sector & advocacy groups |
(3a) Environmental NGOs & advocacy groups |
|
187 |
Sustainable Thinking Scotland (STS) |
(3) Third Sector & advocacy groups |
(3a) Environmental NGOs & advocacy groups |
|
188 |
Fishery Trusts |
(3) Third Sector & advocacy groups |
(3a) Environmental NGOs & advocacy groups |
|
189 |
Greener Kirkcaldy |
(3) Third Sector & advocacy groups |
(3a) Environmental NGOs & advocacy groups |
|
190 |
Sustainable Cupar |
(3) Third Sector & advocacy groups |
(3a) Environmental NGOs & advocacy groups |
|
191 |
Energy Saving Trust |
(3) Third Sector & advocacy groups |
(3a) Environmental NGOs & advocacy groups |
|
192 |
Esmee Fairbairn Foundation |
(3) Third Sector & advocacy groups |
(3a) Environmental NGOs & advocacy groups |
|
193 |
Linlithgow Climate Challenge |
(3) Third Sector & advocacy groups |
(3a) Environmental NGOs & advocacy groups |
|
194 |
Changeworks |
(3) Third Sector & advocacy groups |
(3a) Environmental NGOs & advocacy groups |
|
195 |
Scottish Policy Group British Ecological Society |
(3) Third Sector & advocacy groups |
(3a) Environmental NGOs & advocacy groups |
|
196 |
National Trust for Scotland |
(3) Third Sector & advocacy groups |
(3a) Environmental NGOs & advocacy groups |
|
197 |
Scottish Farming and Wildlife Advisory Group (SCOTFWAG) |
(3) Third Sector & advocacy groups |
(3a) Environmental NGOs & advocacy groups |
|
198 |
John Muir Trust |
(3) Third Sector & advocacy groups |
(3a) Environmental NGOs & advocacy groups |
|
199 |
Greenpeace UK |
(3) Third Sector & advocacy groups |
(3a) Environmental NGOs & advocacy groups |
|
200 |
WRAP |
(3) Third Sector & advocacy groups |
(3a) Environmental NGOs & advocacy groups |
|
201 |
The Woodland Trust |
(3) Third Sector & advocacy groups |
(3a) Environmental NGOs & advocacy groups |
|
202 |
The British Ecological Society (BES) |
(3) Third Sector & advocacy groups |
(3a) Environmental NGOs & advocacy groups |
|
203 |
WWF Scotland |
(3) Third Sector & advocacy groups |
(3a) Environmental NGOs & advocacy groups |
|
204 |
Sustainable Scotland Network (SSN) |
(3) Third Sector & advocacy groups |
(3a) Environmental NGOs & advocacy groups |
|
205 |
Sustain |
(3) Third Sector & advocacy groups |
(3a) Environmental NGOs & advocacy groups |
|
206 |
Peers for the Planet |
(3) Third Sector & advocacy groups |
(3a) Environmental NGOs & advocacy groups |
|
207 |
Nature Foundation |
(3) Third Sector & advocacy groups |
(3a) Environmental NGOs & advocacy groups |
|
208 |
Fidra |
(3) Third Sector & advocacy groups |
(3a) Environmental NGOs & advocacy groups |
|
209 |
FEL Scotland |
(3) Third Sector & advocacy groups |
(3a) Environmental NGOs & advocacy groups |
|
210 |
Sustainable Wellbeing Environment Network |
(3) Third Sector & advocacy groups |
(3a) Environmental NGOs & advocacy groups |
|
211 |
Party for the Animals |
(3) Third Sector & advocacy groups |
(3a) Environmental NGOs & advocacy groups |
|
212 |
Marine Conservation Society |
(3) Third Sector & advocacy groups |
(3a) Environmental NGOs & advocacy groups |
|
213 |
Four Paws UK |
(3) Third Sector & advocacy groups |
(3a) Environmental NGOs & advocacy groups |
|
214 |
Scottish Communities Climate Action Network (SSCAN) |
(3) Third Sector & advocacy groups |
(3a) Environmental NGOs & advocacy groups |
|
215 |
Earth In Common |
(3) Third Sector & advocacy groups |
(3a) Environmental NGOs & advocacy groups |
|
216 |
World Animal Protection |
(3) Third Sector & advocacy groups |
(3a) Environmental NGOs & advocacy groups |
|
217 |
OneKind |
(3) Third Sector & advocacy groups |
(3a) Environmental NGOs & advocacy groups |
|
218 |
Open Seas |
(3) Third Sector & advocacy groups |
(3a) Environmental NGOs & advocacy groups |
|
219 |
Edinburgh Community Food |
(3) Third Sector & advocacy groups |
(3b) Food policy NGOs & advocacy groups |
|
220 |
Nourish Scotland |
(3) Third Sector & advocacy groups |
(3b) Food policy NGOs & advocacy groups |
|
221 |
Soil Association Scotland |
(3) Third Sector & advocacy groups |
(3b) Food policy NGOs & advocacy groups |
|
222 |
Scottish Food Coalition |
(3) Third Sector & advocacy groups |
(3b) Food policy NGOs & advocacy groups |
|
223 |
Good Food Scotland |
(3) Third Sector & advocacy groups |
(3b) Food policy NGOs & advocacy groups |
|
224 |
FareShare Scotland |
(3) Third Sector & advocacy groups |
(3b) Food policy NGOs & advocacy groups |
|
225 |
Community Food and Health (Scotland) |
(3) Third Sector & advocacy groups |
(3b) Food policy NGOs & advocacy groups |
|
226 |
Independent Food Aid Network UK (IFAN) |
(3) Third Sector & advocacy groups |
(3b) Food policy NGOs & advocacy groups |
|
227 |
Eating Better |
(3) Third Sector & advocacy groups |
(3b) Food policy NGOs & advocacy groups |
|
228 |
Nutrition Scotland |
(3) Third Sector & advocacy groups |
(3b) Food policy NGOs & advocacy groups |
|
229 |
Plant-Based Food Alliance |
(3) Third Sector & advocacy groups |
(3b) Food policy NGOs & advocacy groups |
|
230 |
The Food Foundation |
(3) Third Sector & advocacy groups |
(3b) Food policy NGOs & advocacy groups |
|
231 |
Glasgow Community Food Network |
(3) Third Sector & advocacy groups |
(3b) Food policy NGOs & advocacy groups |
|
232 |
Impatience Insiders |
(3) Third Sector & advocacy groups |
(3b) Food policy NGOs & advocacy groups |
|
233 |
Propagate Scotland |
(3) Third Sector & advocacy groups |
(3b) Food policy NGOs & advocacy groups |
|
234 |
One Planet Food |
(3) Third Sector & advocacy groups |
(3b) Food policy NGOs & advocacy groups |
|
235 |
Food and Agriculture Stakeholder Taskforce (FAST) |
(3) Third Sector & advocacy groups |
(3b) Food policy NGOs & advocacy groups |
|
236 |
Sustainable Food Places |
(3) Third Sector & advocacy groups |
(3b) Food policy NGOs & advocacy groups |
|
237 |
Food Standards Agency |
(3) Third Sector & advocacy groups |
(3b) Food policy NGOs & advocacy groups |
|
238 |
Food For Life Scotland (Soil Association) |
(3) Third Sector & advocacy groups |
(3b) Food policy NGOs & advocacy groups |
|
239 |
British Nutrition Foundation |
(3) Third Sector & advocacy groups |
(3b) Food policy NGOs & advocacy groups |
|
240 |
British Dietetic Association (BDA) |
(3) Third Sector & advocacy groups |
(3b) Food policy NGOs & advocacy groups |
|
241 |
UK Food Group |
(3) Third Sector & advocacy groups |
(3b) Food policy NGOs & advocacy groups |
|
242 |
Food Citizens Scotland |
(3) Third Sector & advocacy groups |
(3b) Food policy NGOs & advocacy groups |
|
243 |
Climavore |
(3) Third Sector & advocacy groups |
(3b) Food policy NGOs & advocacy groups |
|
244 |
Community Supported Agriculture Network UK (CSA) |
(3) Third Sector & advocacy groups |
(3b) Food policy NGOs & advocacy groups |
|
245 |
Trussell |
(3) Third Sector & advocacy groups |
(3b) Food policy NGOs & advocacy groups |
|
246 |
Food Train |
(3) Third Sector & advocacy groups |
(3b) Food policy NGOs & advocacy groups |
|
247 |
Independent Food Aid Network |
(3) Third Sector & advocacy groups |
(3b) Food policy NGOs & advocacy groups |
|
248 |
Young Scot |
(3) Third Sector & advocacy groups |
(3c) Community NGOs and advocacy groups |
|
249 |
Scottish Women’s Convention |
(3) Third Sector & advocacy groups |
(3c) Community NGOs and advocacy groups |
|
250 |
Volunteer Scotland |
(3) Third Sector & advocacy groups |
(3c) Community NGOs and advocacy groups |
|
251 |
Engender |
(3) Third Sector & advocacy groups |
(3c) Community NGOs and advocacy groups |
|
252 |
Obesity Action Scotland |
(3) Third Sector & advocacy groups |
(3c) Health NGOs and advocacy groups |
|
253 |
Scottish Obesity Alliance |
(3) Third Sector & advocacy groups |
(3c) Health NGOs and advocacy groups |
|
254 |
Obesity Health Alliance |
(3) Third Sector & advocacy groups |
(3c) Health NGOs and advocacy groups |
|
255 |
Health and Social Care Alliance Scotland |
(3) Third Sector & advocacy groups |
(3c) Health NGOs and advocacy groups |
|
256 |
People’s Health Trust |
(3) Third Sector & advocacy groups |
(3c) Health NGOs and advocacy groups |
|
257 |
Voluntary Health Scotland |
(3) Third Sector & advocacy groups |
(3c) Health NGOs and advocacy groups |
|
258 |
Centre for Sustainable Healthcare |
(3) Third Sector & advocacy groups |
(3c) Health NGOs and advocacy groups |
|
259 |
Children’s Health Scotland |
(3) Third Sector & advocacy groups |
(3c) Health NGOs and advocacy groups |
|
260 |
Royal Environmental Health Institute of Scotland (REHIS) |
(3) Third Sector & advocacy groups |
(3c) Health NGOs and advocacy groups |
|
261 |
UK Health Alliance on Climate Change |
(3) Third Sector & advocacy groups |
(3c) Health NGOs and advocacy groups |
|
262 |
Cancer Research UK |
(3) Third Sector & advocacy groups |
(3c) Health NGOs and advocacy groups |
|
263 |
Scottish Public Health Network (ScotPHN) |
(3) Third Sector & advocacy groups |
(3c) Health NGOs and advocacy groups |
|
264 |
Scottish Youth Parliament (SYP Scot Youth) |
(3) Third Sector & advocacy groups |
(3d) Community NGOs & advocacy groups |
|
265 |
Scottish Community Alliance |
(3) Third Sector & advocacy groups |
(3d) Community NGOs & advocacy groups |
|
266 |
Involve UK |
(3) Third Sector & advocacy groups |
(3d) Community NGOs & advocacy groups |
|
267 |
JustRight Scotland |
(3) Third Sector & advocacy groups |
(3d) Community NGOs & advocacy groups |
|
268 |
Foundation Scotland |
(3) Third Sector & advocacy groups |
(3d) Community NGOs & advocacy groups |
|
269 |
Eco-Congregation Scotland |
(3) Third Sector & advocacy groups |
(3d) Community NGOs & advocacy groups |
|
270 |
Edinburgh Communities Climate Action Network (ECCAN) |
(3) Third Sector & advocacy groups |
(3d) Community NGOs & advocacy groups |
|
271 |
Faith in Community Scotland |
(3) Third Sector & advocacy groups |
(3d) Community NGOs & advocacy groups |
|
272 |
Good Law Project |
(3) Third Sector & advocacy groups |
(3d) Community NGOs & advocacy groups |
|
273 |
Scottish Human Rights Commission |
(3) Third Sector & advocacy groups |
(3d) Community NGOs & advocacy groups |
|
274 |
Another Way |
(3) Third Sector & advocacy groups |
(3d) Community NGOs & advocacy groups |
|
275 |
Planning Democracy |
(3) Third Sector & advocacy groups |
(3d) Community NGOs & advocacy groups |
|
276 |
Scottish Council for Voluntary Organisations (SCVO) |
(3) Third Sector & advocacy groups |
(3d) Community NGOs & advocacy groups |
|
277 |
Transform Community Development |
(3) Third Sector & advocacy groups |
(3d) Community NGOs & advocacy groups |
|
278 |
Community Development Lens (CoDeL) |
(3) Third Sector & advocacy groups |
(3d) Community NGOs & advocacy groups |
|
279 |
Cyrenians |
(3) Third Sector & advocacy groups |
(3d) Community NGOs & advocacy groups |
|
280 |
Eco Congregation Scotland |
(3) Third Sector & advocacy groups |
(3d) Community NGOs & advocacy groups |
|
281 |
Environmental Rights Centre for Scotland (ERC) |
(3) Third Sector & advocacy groups |
(3d) Community NGOs & advocacy groups |
|
282 |
Federation of City Farms and Community Gardens Scotland (FEL Scotland) |
(3) Third Sector & advocacy groups |
(3d) Community NGOs & advocacy groups |
|
283 |
Get Growing Scotland |
(3) Third Sector & advocacy groups |
(3d) Community NGOs & advocacy groups |
|
284 |
Worker Support Centre |
(3) Third Sector & advocacy groups |
(3d) Community NGOs & advocacy groups |
|
285 |
Unite Scotland |
(3) Third Sector & advocacy groups |
(3d) Community NGOs & advocacy groups |
|
286 |
UK Health Alliance on Climate Change |
(3) Third Sector & advocacy groups |
(3d) Community NGOs & advocacy groups |
|
287 |
Social Farms & Gardens |
(3) Third Sector & advocacy groups |
(3d) Community NGOs & advocacy groups |
|
288 |
Global Justice Now |
(3) Third Sector & advocacy groups |
(3d) Community NGOs & advocacy groups |
|
289 |
Scottish Trade Union Congress |
(3) Third Sector & advocacy groups |
(3d) Community NGOs & advocacy groups |
|
290 |
Compassion in World Farming (CIWIF) |
(4) Agriculture & food industry |
(4a) Agricultural organisations |
|
291 |
Community Land Scotland |
(4) Agriculture & food industry |
(4a) Agricultural organisations |
|
292 |
Nature Friendly Farming Network (NFFN) |
(4) Agriculture & food industry |
(4a) Agricultural organisations |
|
293 |
Landworkers’ Alliance |
(4) Agriculture & food industry |
(4a) Agricultural organisations |
|
294 |
Rare Breeds Survival Trust (RBST) Scotland |
(4) Agriculture & food industry |
(4a) Agricultural organisations |
|
295 |
Mossgiel Organic Farm |
(4) Agriculture & food industry |
(4a) Agricultural organisations |
|
296 |
Association of Independent Crop Consultants |
(4) Agriculture & food industry |
(4a) Agricultural organisations |
|
297 |
Basis Registration Ltd (BASIS |
(4) Agriculture & food industry |
(4a) Agricultural organisations |
|
298 |
Scottish Quality Crops |
(4) Agriculture & food industry |
(4a) Agricultural organisations |
|
299 |
Tenant Farming Association |
(4) Agriculture & food industry |
(4a) Agricultural organisations |
|
300 |
Scottish Dairy Growth Board |
(4) Agriculture & food industry |
(4a) Agricultural organisations |
|
301 |
Scottish DairyHub |
(4) Agriculture & food industry |
(4a) Agricultural organisations |
|
302 |
Bovine genetics and reproductive services |
(4) Agriculture & food industry |
(4a) Agricultural organisations |
|
303 |
The Scottish Dairy Cattle Association |
(4) Agriculture & food industry |
(4a) Agricultural organisations |
|
304 |
Young Farmers |
(4) Agriculture & food industry |
(4a) Agricultural organisations |
|
305 |
Scottish Organic Producers Association (SOPA) |
(4) Agriculture & food industry |
(4a) Agricultural organisations |
|
306 |
National Farmers Union Scotland (NFUS) |
(4) Agriculture & food industry |
(4a) Agricultural organisations |
|
307 |
The Country Landowners’ Association |
(4) Agriculture & food industry |
(4a) Agricultural organisations |
|
308 |
Scottish Water |
(4) Agriculture & food industry |
(4a) Agricultural organisations |
|
309 |
Food, Farming and Countryside Commission (FFCC) |
(4) Agriculture & food industry |
(4a) Agricultural organisations |
|
310 |
Crown Estate Scotland |
(4) Agriculture & food industry |
(4a) Agricultural organisations |
|
311 |
Royal Highland and Agricultural Society of Scotland |
(4) Agriculture & food industry |
(4a) Agricultural organisations |
|
312 |
Agricultural Industries Confederation |
(4) Agriculture & food industry |
(4a) Agricultural organisations |
|
313 |
Advanced Plant Growth Centre (James Hutton Institute) |
(4) Agriculture & food industry |
(4a) Agricultural organisations |
|
314 |
Scottish Agricultural Organisation Society (SAOS) |
(4) Agriculture & food industry |
(4a) Agricultural organisations |
|
315 |
ADAS |
(4) Agriculture & food industry |
(4a) Agricultural organisations |
|
316 |
Agricultural Industries Confederation |
(4) Agriculture & food industry |
(4a) Agricultural organisations |
|
317 |
Agricultural Industries Confederation Scotland |
(4) Agriculture & food industry |
(4a) Agricultural organisations |
|
318 |
Crop Protection Association |
(4) Agriculture & food industry |
(4a) Agricultural organisations |
|
319 |
Linking Environment and Farming (LEAF) |
(4) Agriculture & food industry |
(4a) Agricultural organisations |
|
320 |
National Farmers Union Scotland (NFUS) |
(4) Agriculture & food industry |
(4a) Agricultural organisations |
|
321 |
Red Tractor |
(4) Agriculture & food industry |
(4a) Agricultural organisations |
|
322 |
Ricardo (Future Farming Resilience Fund) |
(4) Agriculture & food industry |
(4a) Agricultural organisations |
|
323 |
SRUC/SAC Consulting |
(4) Agriculture & food industry |
(4a) Agricultural organisations |
|
324 |
Scottish Land and Estates |
(4) Agriculture & food industry |
(4a) Agricultural organisations |
|
325 |
Scottish Rural College |
(4) Agriculture & food industry |
(4a) Agricultural organisations |
|
326 |
Agriculture and Horticulture Development Board |
(4) Agriculture & food industry |
(4a) Agricultural organisations |
|
327 |
DairyUK |
(4) Agriculture & food industry |
(4a) Agricultural organisations |
|
328 |
Farm Quality Assurance Schemes |
(4) Agriculture & food industry |
(4a) Agricultural organisations |
|
329 |
Assured Integrated Milk Supplier (AIMS) |
(4) Agriculture & food industry |
(4a) Agricultural organisations |
|
330 |
Scottish Agricultural Organisation Society |
(4) Agriculture & food industry |
(4a) Agricultural organisations |
|
331 |
Organic Soil Association |
(4) Agriculture & food industry |
(4a) Agricultural organisations |
|
332 |
Dourie Farming Company Ltd |
(4) Agriculture & food industry |
(4a) Agricultural organisations |
|
333 |
Scottish Land & Estates |
(4) Agriculture & food industry |
(4a) Agricultural organisations |
|
334 |
Scottish Gamekeepers’ Association |
(4) Agriculture & food industry |
(4a) Agricultural organisations |
|
335 |
South of Scotland Regional Economic Partnership |
(4) Agriculture & food industry |
(4a) Agricultural organisations |
|
336 |
Scottish Crofting Federation |
(4) Agriculture & food industry |
(4a) Agricultural organisations |
|
337 |
National Association of Agricultural Contractors |
(4) Agriculture & food industry |
(4a) Agricultural organisations |
|
338 |
UK Irrigation Association |
(4) Agriculture & food industry |
(4a) Agricultural organisations |
|
339 |
Scottish Tenant Farmers Association |
(4) Agriculture & food industry |
(4a) Agricultural organisations |
|
340 |
Bank of Scotland Business |
(4) Agriculture & food industry |
(4a) Agricultural organisations |
|
341 |
Royal Bank of Scotland |
(4) Agriculture & food industry |
(4a) Agricultural organisations |
|
342 |
Pasture for Life |
(4) Agriculture & food industry |
(4a) Agricultural organisations |
|
343 |
Scottish Association of Meat Wholesalers |
(4) Agriculture & food industry |
(4b) Food production organisations |
|
344 |
Scottish Ecological Design Association (SEDA) |
(4) Agriculture & food industry |
(4b) Food production organisations |
|
345 |
Milk Supply Association (MSA) |
(4) Agriculture & food industry |
(4b) Food production organisations |
|
346 |
Social Enterprise Scotland |
(4) Agriculture & food industry |
(4b) Food production organisations |
|
347 |
Scotland Loves Local Campaign |
(4) Agriculture & food industry |
(4b) Food production organisations |
|
348 |
Scotland the Bread |
(4) Agriculture & food industry |
(4b) Food production organisations |
|
349 |
Circular Communities Scotland |
(4) Agriculture & food industry |
(4b) Food production organisations |
|
350 |
Campbells Prime Meat |
(4) Agriculture & food industry |
(4b) Food production organisations |
|
351 |
Packaging Recycling Group Scotland |
(4) Agriculture & food industry |
(4b) Food production organisations |
|
352 |
Scotch Beef |
(4) Agriculture & food industry |
(4b) Food production organisations |
|
353 |
Food and Drink Federation Scotland (FDF Scotland) |
(4) Agriculture & food industry |
(4b) Food production organisations |
|
354 |
Scotland Food and Drink |
(4) Agriculture & food industry |
(4b) Food production organisations |
|
355 |
British Meat Processors’ Association |
(4) Agriculture & food industry |
(4b) Food production organisations |
|
356 |
Quality Meat Scotland (QMS) |
(4) Agriculture & food industry |
(4b) Food production organisations |
|
357 |
Food and Agriculture Organisation (FAO) |
(4) Agriculture & food industry |
(4b) Food production organisations |
|
358 |
Marine Stewardship Council (MSC) |
(4) Agriculture & food industry |
(4b) Food production organisations |
|
359 |
RSPCA |
(4) Agriculture & food industry |
(4b) Food production organisations |
|
360 |
Scotch Whisky Association (SWA) |
(4) Agriculture & food industry |
(4b) Food production organisations |
|
361 |
FoodDrinkEurope |
(4) Agriculture & food industry |
(4b) Food production organisations |
|
362 |
Food and Drink Leadership Forum |
(4) Agriculture & food industry |
(4b) Food production organisations |
|
363 |
Scotlean |
(4) Agriculture & food industry |
(4b) Food production organisations |
|
364 |
UNISON Scotland |
(4) Agriculture & food industry |
(4b) Food production organisations |
|
365 |
Scottish Wholesale Association |
(4) Agriculture & food industry |
(4b) Food production organisations |
|
366 |
British Contract Manufacturers and Packers Association |
(4) Agriculture & food industry |
(4b) Food production organisations |
|
367 |
The Packaging Federation |
(4) Agriculture & food industry |
(4b) Food production organisations |
|
368 |
Scottish Fair Trade Forum |
(4) Agriculture & food industry |
(4b) Food production organisations |
|
369 |
Resource Management Association Scotland (RMAS) |
(4) Agriculture & food industry |
(4b) Food production organisations |
|
370 |
Consumer Scotland |
(4) Agriculture & food industry |
(4c) Supermarkets and retailers |
|
371 |
Bute Produce |
(4) Agriculture & food industry |
(4c) Supermarkets and retailers |
|
372 |
Remake Scotland |
(4) Agriculture & food industry |
(4c) Supermarkets and retailers |
|
373 |
Scottish Grocers’ Federation’s Go Local programme |
(4) Agriculture & food industry |
(4c) Supermarkets and retailers |
|
374 |
European Trade Union Federation of Textiles, Clothing and Leather (leather sector) |
(4) Agriculture & food industry |
(4c) Supermarkets and retailers |
|
375 |
Product accreditation (leather sector) |
(4) Agriculture & food industry |
(4c) Supermarkets and retailers |
|
376 |
Association of Convenience Stores (ACS) |
(4) Agriculture & food industry |
(4c) Supermarkets and retailers |
|
377 |
British Retail Consortium (BRC) |
(4) Agriculture & food industry |
(4c) Supermarkets and retailers |
|
378 |
Scottish Retail Consortium |
(4) Agriculture & food industry |
(4c) Supermarkets and retailers |
|
379 |
Global markets (leather sector) |
(4) Agriculture & food industry |
(4c) Supermarkets and retailers |
|
380 |
Scottish Grocers’ Federation |
(4) Agriculture & food industry |
(4c) Supermarkets and retailers |
|
381 |
Scottish Trades Union Congress (STUC) |
(4) Agriculture & food industry |
(4c) Supermarkets and retailers |
|
382 |
ASDA Supermarket |
(4) Agriculture & food industry |
(4c) Supermarkets and retailers |
|
383 |
Tesco |
(4) Agriculture & food industry |
(4c) Supermarkets and retailers |
|
384 |
Morrison’s |
(4) Agriculture & food industry |
(4c) Supermarkets and retailers |
|
385 |
Sainsbury’s |
(4) Agriculture & food industry |
(4c) Supermarkets and retailers |
|
386 |
The Refillery Edinburgh |
(4) Agriculture & food industry |
(4c) Supermarkets and retailers |
|
387 |
NHS Scotland |
(5) Public health bodies |
(5a) Public health bodies |
|
388 |
Public Health Scotland |
(5) Public health bodies |
(5a) Public health bodies |
|
389 |
NHS Borders |
(5) Public health bodies |
(5a) Public health bodies |
|
390 |
NHS Lothian |
(5) Public health bodies |
(5a) Public health bodies |
|
391 |
NHS Grampian |
(5) Public health bodies |
(5a) Public health bodies |
|
392 |
NHS Forth Valley |
(5) Public health bodies |
(5a) Public health bodies |
|
393 |
Directorate of Health and Social Care |
(5) Public health bodies |
(5a) Public health bodies |
|
394 |
Ministry of Public Health and Social Care |
(5) Public health bodies |
(5a) Public health bodies |
|
395 |
Highlands and Islands Climate Hub |
(6) Community organisations |
(6a) Local food networks and sustainability hubs |
|
396 |
Fife Communities Climate Action Network (FCCAN) |
(6) Community organisations |
(6a) Local food networks and sustainability hubs |
|
397 |
North East Scotland Climate Action Resource Hub (NESCAN) |
(6) Community organisations |
(6a) Local food networks and sustainability hubs |
|
398 |
Transition Black Isle |
(6) Community organisations |
(6a) Local food networks and sustainability hubs |
|
399 |
Edinburgh Food Social |
(6) Community organisations |
(6a) Local food networks and sustainability hubs |
|
400 |
Forth Valley Food Futures |
(6) Community organisations |
(6a) Local food networks and sustainability hubs |
|
401 |
Highland Good Food Partnership |
(6) Community organisations |
(6a) Local food networks and sustainability hubs |
|
402 |
Climate Hebrides |
(6) Community organisations |
(6a) Local food networks and sustainability hubs |
|
403 |
Appetite for Angus Food & Drink Network |
(6) Community organisations |
(6a) Local food networks and sustainability hubs |
|
404 |
Arran’s Food Journey |
(6) Community organisations |
(6a) Local food networks and sustainability hubs |
|
405 |
Ayrshire Food an’ a that |
(6) Community organisations |
(6a) Local food networks and sustainability hubs |
|
406 |
Bute Kitchen |
(6) Community organisations |
(6a) Local food networks and sustainability hubs |
|
407 |
East Lothian Food and Drink |
(6) Community organisations |
(6a) Local food networks and sustainability hubs |
|
408 |
Eat Drink Hebrides |
(6) Community organisations |
(6a) Local food networks and sustainability hubs |
|
409 |
Eat SW Scotland |
(6) Community organisations |
(6a) Local food networks and sustainability hubs |
|
410 |
Food from Argyll |
(6) Community organisations |
(6a) Local food networks and sustainability hubs |
|
411 |
Food from Fife |
(6) Community organisations |
(6a) Local food networks and sustainability hubs |
|
412 |
Forth Valley Food and Drink Network |
(6) Community organisations |
(6a) Local food networks and sustainability hubs |
|
413 |
Great Perthshire |
(6) Community organisations |
(6a) Local food networks and sustainability hubs |
|
414 |
Lanarkshire Larder |
(6) Community organisations |
(6a) Local food networks and sustainability hubs |
|
415 |
North East Scotland Food & Drink Network |
(6) Community organisations |
(6a) Local food networks and sustainability hubs |
|
416 |
Orkney Food and Drink |
(6) Community organisations |
(6a) Local food networks and sustainability hubs |
|
417 |
A Taste of Shetland |
(6) Community organisations |
(6a) Local food networks and sustainability hubs |
|
418 |
Glasgow Allotments Forum |
(6) Community organisations |
(6a) Local food networks and sustainability hubs |
|
419 |
Abundant Borders |
(6) Community organisations |
(6a) Local food networks and sustainability hubs |
|
420 |
Transition Edinburgh |
(6) Community organisations |
(6a) Local food networks and sustainability hubs |
|
421 |
Edible Edinburgh |
(6) Community organisations |
(6a) Local food networks and sustainability hubs |
|
422 |
Transition Stirling |
(6) Community organisations |
(6a) Local food networks and sustainability hubs |
|
423 |
Moray Food Network |
(6) Community organisations |
(6a) Local food networks and sustainability hubs |
|
424 |
Falkirk Food Futures |
(6) Community organisations |
(6a) Local food networks and sustainability hubs |
|
425 |
Dundee Urban Orchard |
(6) Community organisations |
(6a) Local food networks and sustainability hubs |
|
426 |
Fair Food Aberdeenshire |
(6) Community organisations |
(6a) Local food networks and sustainability hubs |
|
427 |
Wester Hailes Growing Communities |
(6) Community organisations |
(6a) Local food networks and sustainability hubs |
|
428 |
Scottish Rural Action |
(6) Community organisations |
(6b) Rural community associations |
|
429 |
Countryside Alliance |
(6) Community organisations |
(6b) Rural community associations |
|
430 |
Carbon Brief |
(7) Media & influencers |
(7a) Journalists and media outlets |
|
431 |
The Grocer |
(7) Media & influencers |
(7a) Journalists and media outlets |
|
432 |
The Scottish Farmer |
(7) Media & influencers |
(7a) Journalists and media outlets |
|
433 |
The Scotsman |
(7) Media & influencers |
(7a) Journalists and media outlets |
|
434 |
The Highland Times |
(7) Media & influencers |
(7a) Journalists and media outlets |
|
435 |
The National |
(7) Media & influencers |
(7a) Journalists and media outlets |
|
436 |
Health Food Business Magazine |
(7) Media & influencers |
(7a) Journalists and media outlets |
|
437 |
Meat Management Magazine |
(7) Media & influencers |
(7a) Journalists and media outlets |
|
438 |
HealthandCare.Scot |
(7) Media & influencers |
(7a) Journalists and media outlets |
|
439 |
Laura Young (‘Less Waste Laura’ |
(7) Media & influencers |
(7b) Influencers & activists |
|
440 |
Students Organising for Sustainability (SOS-UK) |
(8) General public & citizens’ groups |
(8a) Vulnerable populations |
|
441 |
Inclusion Scotland |
(8) General public & citizens’ groups |
(8a) Vulnerable populations |
|
442 |
People and Planet |
(8) General public & citizens’ groups |
(8a) Vulnerable populations |
|
443 |
The Commitment |
(8) General public & citizens’ groups |
(8a) Vulnerable populations |
|
444 |
Scotland’s Regeneration Forum (SURF) |
(8) General public & citizens’ groups |
(8a) Vulnerable populations |
|
445 |
Just Fair |
(8) General public & citizens’ groups |
(8a) Vulnerable populations |
|
446 |
Poverty Alliance |
(8) General public & citizens’ groups |
(8a) Vulnerable populations |
|
447 |
Citizens Advice Scotland |
(8) General public and citizen groups |
(8b) Consumer rights organisations |
Appendix C: Systematic literature review methodology
Two main citation indexes were used to systematically search for articles: Scopus (for published academic literature); and Publish or Perish (for unpublished ‘grey’ literature).
In addition, a set of non-systematically derived articles supplemented the main systematic literature review protocol and more detail can be found below.
For the systematic search protocol, search parameters comprised Title-Abstract-Keyword searches of articles published in English since 2015. Because of the breadth of the topic, no categories were excluded from the search parameters. As Publish or Perish searches Google Scholar records, articles were limited to the first 200 returns by relevance.
The SPICE framework (Booth, 2006) was used to configure the systematic review search string and incorporated the following framework:
- Setting: E.g. Scotland’s policy environment and the social, economic, and environmental factors specific to Scotland.
- Perspective: E.g. policymakers, public groups, industry stakeholders, and other groups affected by diet and climate policies.
- Intervention: E.g. climate-related dietary policy actions, public health initiatives, economic incentives, or educational campaigns.
- Comparison: E.g. other regional or international diet and climate policies or scenarios where similar policy interventions are absent.
- Evaluation: E.g. outcomes in terms of emissions reductions, public health improvements, economic impacts, or stakeholder engagement effectiveness.
The Title-Abstract-Keyword citation indexes were searched using the following strings, which were adapted during pilot searches because of limitations to search capabilities across each index and to optimise returns:
Scopus: TITLE-ABS-KEY ((“scot*” OR “united kingdom” OR “wales” OR “england” OR “northern ireland”) AND (“diet*” OR “food”) AND (“climate” OR “carbon” OR “emissions” OR “environment*”) AND (“policy*” OR “regulat*” OR “strateg*” OR “lever*” OR “mechanism*”) AND (“behaviour*” OR “percept*” OR “attitud*” OR “consum*” OR “meat” OR “dairy” OR “vegan” OR “vegetarian” OR “plant-based” OR “nutrition” OR “health” OR “wellbeing” OR “equit*” OR “sustainab*” OR “adaptation” OR “mitigation” OR “resilien*” OR “biodiver*” OR “econom*” OR “cost” OR “agricultur*” OR “produc*” OR “process*” OR “retail*” OR “trade*” OR “import*” OR “export*”))
Publish or Perish: scot* AND diet* OR food AND climate OR carbon OR emissions OR environment* AND policy* OR regulat* OR strateg* OR lever OR mechanism* AND behaviour*
Search results from each index were imported into Zotero where duplicates were removed.
Titles/abstracts were screened for eligibility based on the following criteria:
- Inclusion criteria:
- Publication language English
- Published since 2020
- Scotland, UK or other devolved policy contexts
- Relevant to one or more of the five PESTLE dimensions
- Availability of full text by 31/1/25
- Exclusion criteria:
- Publication language not English
- Published before 2020 or focused on policy contexts prior to 2015
- Without direct or indirect relevance to Scottish, UK or other devolved policy contexts
- Without relevance to at least one of the five PESTLE dimensions
- Conference proceedings
- Methodological papers and study protocols
Each article was screened and assigned to one of three Zotero folders: Include; Exclude; Unsure. With reference to the latter, at the end of the initial screening these articles were re-examined and re-categorised to the Include or Exclude folder.
- The following data were extracted from all included articles:
- Article title
- Last name of first author
- Year of publication
- Article URL
- Article type (e.g., empirical study, policy document)
- Study context and Aims/Objectives
- Results:
- Key findings
- Conclusions
- Areas for policy development
In addition to the systematic literature review, relevant articles from a variety of other sources supplemented the review to ensure a comprehensive and contextually relevant analysis. Articles were identified through:
- Stakeholder Contributions – During stakeholder one-to-one discussions, participants suggested key reports, policy documents, and research papers that they considered highly relevant to the topic.
- Citation Searches – Both forward citation searches (identifying newer papers that cited key sources) and reverse citation searches (reviewing references cited within important papers) were conducted to expand the review.
- General Web Searches – Broader searches using Google were performed to capture relevant grey literature, media reports, and other non-peer-reviewed sources that may not be included in academic databases.
- Targeted Website Searches – Specific searches were conducted on Scottish Government, NGO, and stakeholder websites to access reports, policy briefings, and unpublished data relevant to the research focus.
Appendix D: Systematic literature review flowchart

Appendix E: Stakeholder meeting methodology
Purpose and Overview:
The one-to-one stakeholder meetings[10] were conducted to gather qualitative insights into Scotland’s complex diet and climate policy landscape. These conversations were intended to complement the literature review and stakeholder workshops by eliciting the perspectives of individuals with practical experience and policy insight across relevant sectors of Government (supplemented by Third Sector and Academia).
Stakeholder Identification and Selection
Stakeholders were purposively selected based on their relevance to the intersecting themes of diet and climate policy, including specific expertise or engagement in areas such as emissions reduction, food security, policy development and advocacy, rural and environmental science, public health, environmental policy, agriculture, food production, and food insecurity. The selection process drew on:
- Expert recommendations from Scottish Government contacts and members of the research steering group.
- A stakeholder mapping exercise (see Appendices A and B).
Format and Approach
- A total of 14 semi-structured informal online meetings were conducted.
- Meetings followed a tailored topic guide to allow flexibility while covering core themes such as governance, policy coherence, barriers to implementation, and perceived gaps in evidence or support.
- Discussions typically lasted 30–60 minutes and were designed to be conversational, allowing participants to reflect on both strategic and operational aspects of policy and practice.
- Meetings were not recorded, but the researcher took detailed notes throughout.
Ethical Considerations and Data Management
- Ethical approval was obtained through the University of Bath.
- All participants were provided with information on the project and gave informed verbal consent.
Analytical Use
Insights from the stakeholder meeting notes were synthesised alongside the literature review and workshop outputs. They fed directly into the PESTLE analysis, helping to identify areas for policy development, clarify governance issues, and shape recommendations across the political, economic, social, technological, legal, and environmental dimensions.
Semi-structured meeting protocol
The following questions guided the meetings:
1. Understanding their role and work
- Can you tell me about your current role and your team’s focus within the Scottish Government?
- Does your work intersect with diet policy in Scotland, and what are the key objectives your team is working towards in this area?
2. Stakeholder relationships and collaboration
- Who are the key stakeholders you collaborate with (e.g., other government departments, industry, civil society)?
- Are there any stakeholders or groups whose influence or involvement you feel is missing or underrepresented in this policy area?
- How would you describe the strength of your collaboration with other key stakeholders? Are there any gaps or challenges in communication or partnership?
3. Policy levers for diet change
- What policy levers do you believe are most effective for promoting dietary changes that would both improve public health and reduce environmental impact?
- In your view, are there particular dietary behaviours or food systems that should be prioritised for change in order to meet Scotland’s climate and health goals?
- What challenges do you see in implementing these policies, either from a political, social, or logistical standpoint?
4. Identifying gaps in existing policy
- Do you think there are any gaps in current diet-related policies that hinder progress towards climate goals or healthier diets?
- Are there areas where more integration or alignment between climate and health policies could be beneficial?
- Where do you see the biggest opportunities for new or improved policies in this space?
5. Future policy directions and needs
- What emerging trends or issues do you think will have the biggest influence on future diet, and climate or health policy in Scotland?
- In what ways do you think Scottish diet policy could evolve to address both climate change and public health more effectively?
Meeting participants
The following table summarises details of meeting participants
|
# |
Organisation |
Policy Area |
|
1 |
Academia |
Diet & Climate |
|
2 |
Third-Sector (Environment) |
Emissions |
|
3 |
Scottish Government |
Food Security |
|
4 |
Scottish Government |
Diet |
|
5 |
Scottish Government |
Policy engagement |
|
6 |
Scottish Government |
Rural and environmental science |
|
7 |
Academia |
Diet policy perceptions |
|
8 |
UK Government |
Diet policy |
|
9 |
Scottish Government |
Health |
|
10 |
Scottish Government |
Environment |
|
11 |
UK Government |
Agriculture & Environment |
|
12 |
Scottish Government |
Food insecurity |
|
13 |
Third Sector (Health) |
Diet & Health |
|
14 |
Scottish Government |
Climate and Diet |
Appendix F: Stakeholder workshop protocols
Workshop Purpose
The workshops aimed to explore stakeholder perspectives on Scotland’s diet and climate policy landscape, identify priority issues and gaps, and generate ideas for practical cross-sector solutions. These sessions supported the development of policy-relevant insights through collaborative, activity-based engagement. Stakeholders were identified based on the mapping exercise and consultations with Scottish Government colleagues to identify a range of interests and influence (including Government, third sector organisations, academics, agriculture and food producers, health, community, and environmental groups).
Workshop Formats
Three stakeholder workshops were delivered:
- One in-person workshop (full protocol detailed below)
- Two online workshops, which followed a shortened format with similar core activities
|
Time |
Activity |
|
10:00–10:30am |
Arrival and tea/coffee |
|
10:30–10:40am |
Welcome and introduction |
|
10:40–11:15am |
Activity 1: Priority Mapping |
|
11:15–11:25am |
Break |
|
11:25am–12:30pm |
Activity 2: Policy Challenge Brainstorm |
|
12:30–1:15pm |
Lunch |
|
1:15–2:00pm |
Activity 3: Future Diet Scenarios |
|
2:00–2:10pm |
Break |
|
2:10–3:00pm |
Activity 4: Prioritisation, Feedback and Closing |
In-Person Workshop Structure and Schedule
|
Time |
Activity |
|
10:00–10:15am |
Introduction and opening remarks |
|
10:15–11:00am |
Activity 1: Priority Mapping |
|
11:00–11:10am |
Break |
|
11:10–12:00pm |
Activity 2: Policy Challenge Brainstorm |
|
12:00–12:10pm |
Break |
|
12:10–12:45pm |
Activity 3: Consolidating Priorities and Voting |
|
12:45–1:00pm |
Wrap-up and next steps |
Online Workshop Structure and Schedule[11]
Participant Recruitment
Stakeholders were purposively recruited based on a preceding stakeholder mapping exercise. This mapping exercise identified relevant individuals and organisations across key sectors including Scottish Government, public health, agriculture, environment, food industry, third sector, and academia. The rationale for recruitment was guided by the segmentation of stakeholders within the mapping process, ensuring representation across high-interest and high-influence categories, as well as those with complementary or contrasting perspectives. All workshops included a cross-sector mix to support inclusive dialogue and the development of well-rounded policy insights.
Facilitation and Materials
Workshops were facilitated by a research team using a structured agenda and visual/interactive materials. In-person materials included A0 wall charts, colour-coded sticky notes, printed worksheets, and feedback forms. Online workshops used virtual whiteboards, editable templates, and polling tools to replicate similar participatory methods in a digital environment.
Core Activities (all formats)
- Activity 1: Priority Mapping
Stakeholders identified sector-specific priorities, areas for policy development, and coordination needs using a structured mapping exercise. These inputs were categorised visually (in-person) or on a shared document (online) and discussed in plenary. - Activity 2: Policy Challenge Brainstorm
Mixed-sector groups tackled pre-defined policy challenges (e.g., reducing meat consumption, supporting farmers, addressing inequalities). Each group identified key barriers and proposed short-term policy solutions, then shared findings with the wider group. - Activity 3: Prioritisation and Feedback
Stakeholders reviewed the workshop’s emerging priorities and selected the most important using voting dots (in-person) or virtual polling (online). This was followed by group discussion and final reflections.
Additional In-Person Activity
- Future Diet Scenarios
Small groups considered hypothetical future policy scenarios for 2040 (e.g., localisation of food systems, technological innovation, policy-led dietary shifts). Discussions explored sector-specific impacts, challenges, opportunities, and future policy needs.
Data Collection and Follow-Up
Participant contributions were captured via workshop artefacts (e.g., sticky notes, templates, whiteboards), discussion summaries, and anonymised feedback forms. An optional follow-up survey was distributed by email. Thematic analysis of all outputs informed policy insights and recommendations.
To support co-production and refine the emerging findings, we incorporated iteration loops for feedback. Formative workshop outputs were shared with participants and relevant stakeholders following the sessions, and feedback was actively invited to validate interpretations, identify omissions, and strengthen final conclusions.
Participating stakeholders
|
Workshop |
Format |
Stakeholders |
|---|---|---|
|
1 |
In-person |
Food Standards Scotland. |
|
Nourish Scotland | ||
|
Public Health Scotland | ||
|
Soil Association Scotland | ||
|
Nature Friendly Farming Network | ||
|
Rowett Institute, University of Aberdeen. | ||
|
University of Edinburgh | ||
|
Scottish Government (Tobacco, Gambling, Diet and Healthy Weight Unit). | ||
|
Scottish Government (Policy) | ||
|
CoDeL/Scottish Rural Action | ||
|
Glasgow Allotments Forum | ||
|
3[12] |
Online |
Climate Change Committee |
|
Quality Meat Scotland | ||
|
Scottish Tenant Farmers’ Association | ||
|
Scottish Government (Diet Policy) | ||
|
University of Edinburgh | ||
|
Four Paws UK | ||
|
4 |
Online |
Scottish Food Commission |
|
Scottish Crofting Federation | ||
|
Public Health Scotland | ||
|
Scottish Communities Climate Action Network | ||
|
Eating Better | ||
|
CLIMAVORE CIC | ||
|
Abundant Borders |
Appendix G: Extended Political analysis: Areas for further policy development and supporting evidence
Appendix H: Extended Economic analysis: Areas for further policy development and supporting evidence
|
Key Theme |
Area For Policy Development |
|---|---|
|
1: Financial Incentives and Risk Mitigation for Sustainable Food Production | |
|
Strengthen financial incentives for low-carbon food production |
Policies lack regulatory and financial mechanisms to support low-carbon food production, scale up innovative technologies, and integrate climate adaptation strategies. Current financial support favours emissions-intensive farming, and financial relief programs for extreme weather risks are absent. |
|
Supporting evidence: Literature review |
No explicit agroecology support in agricultural payments The Scottish farm payment system does not prioritise agroecological transitions. Unlike the EU’s Farm-to-Fork Strategy, Scotland lacks clear pesticide reduction, soil health improvement, or biodiversity restoration targets linked to financial incentives. (Lozada, & Karley, 2022). |
|
Supporting evidence: Stakeholder meetings | |
|
Supporting evidence: Workshops |
“Not regenerative food production happening. Take Edinburgh – there is Lauriston community farm – a 100acre site. It would take 200 of these farms to produce enough food for population of Edinburgh…Identify key sites for more food production and increase awareness of the risks to our food sector. Increase resources put towards the issue.” (Workshop 1). |
|
Compensate farmers for delivering ecosystem services |
Financial incentives for biodiversity and climate protection remain underdeveloped, limiting green investment and market development. |
|
Supporting evidence: Literature review |
Examines how financial incentives for biodiversity and climate protection in Scotland remain inadequate, limiting farmer participation in sustainability initiatives. Financial incentives under the CAP have been insufficient to encourage widespread adoption of biodiversity-supporting measures. Farmers prioritize economic viability over environmental incentives, leading to low engagement in voluntary sustainability schemes. Scotland lags behind other EU countries, such as Austria and the Netherlands, in providing effective support and financial rewards for climate-friendly farming. (Brown, Kovacs, Zinngrebe et al, 2019). |
|
Supporting evidence: Stakeholder meetings |
– |
|
Supporting evidence: Workshops |
“Need to pay producers and farmers for the non-food products they produce – no financial incentive to help protect biodiversity and climate. does seem to be demand for this, biodiversity net gain, or green investment the financial model doesn’t work yet for woodland carbon code is not accessible for commercial projects anymore there was a boom for carbon measure bio net gain, but no longer, markets have not developed yet certainly in Scotland.” (Workshop 3). |
|
Scale up the use of alternative proteins in animal feed |
Microbial proteins, insect- and hemp-based animal feeds lack commercial scaling support, restricting their ability to replace imported soy and improve sustainability. |
|
Supporting evidence: Literature review |
Limited support for scaling alternative protein animal feeds. Microbial proteins and insect-based feeds remain niche due to insufficient commercial scaling to reduce reliance on imported soy and enhance sustainable feed alternatives. (Scottish Government, 2023). Many countries across Europe and Asia have updated their legal frameworks to capitalise on the significant benefits that industrial hemp offers. In contrast, development of the hemp sector in Scotland has been slow, largely due to restrictive regulations. Industrial hemp can sequester more carbon dioxide than many conventional crops, enhance soil biodiversity, remove toxins through phytoremediation, and act as a natural insecticide and pesticide. It is also a valuable source of protein, dietary fibre, essential micronutrients, and bioactive phytochemicals. (Dogbe, Revoredo-Giha & Russell, 2024). |
|
Supporting evidence: Stakeholder meetings |
– |
|
Supporting evidence: Workshops |
– |
|
Support farmers in transitioning to agroecological and climate-resilient practices |
Farmers face financial and technical challenges in transitioning to sustainable agricultural systems. High upfront costs prevent the adoption of key technologies such as biochar application and precision livestock farming tools. |
|
Supporting evidence: Literature review |
Slow adoption of low-emission farming practices: Farmers face high upfront costs for adopting new technologies, such as animal sensors and biochar application. Targeted financial incentives or support could improve uptake. (Scottish Government, 2023). |
|
Supporting evidence: Stakeholder meetings |
– |
|
Supporting evidence: Workshops |
– |
|
Promote economic and agricultural equity across the food system |
Addressing the regressive nature of food taxes by redirecting financial resources toward more sustainable farming practices. |
|
Supporting evidence: Literature review |
Implementing both tax policies and using the resulting revenue to subsidise consumers—particularly low-income households—can create a more equitable and less regressive public policy approach. By redistributing income through targeted payments or support schemes, this strategy helps mitigate the financial burden on vulnerable groups while still incentivising healthier and more sustainable food choices. (Nneli, Dogbe & Revoredo-Giha, 2023). |
|
Supporting evidence: Stakeholder meetings |
– |
|
Supporting evidence: Workshops |
“Taxes are regressive-redirect subsidies to more sustainable farming.” (Workshop 1). |
|
Address perceptions surrounding the economic viability of sustainable farming choices |
Enduring perception that beef farming is more profitable than vegetable crop production, influencing farmer choices and limiting opportunities for community wealth-building. |
|
Supporting evidence: Literature review |
– |
|
Supporting evidence: Stakeholder meetings |
– |
|
Supporting evidence: Workshops |
“For farmers: cows are more profitable than cabbage, so beef farming might be better for (e.g.) community wealth building.” (Workshop 4). |
|
Reform agricultural financial support to align with sustainability goals |
Current financial support continues to prioritise high-emission livestock farming, without clear incentives for climate-friendly production or crop diversification. |
|
Supporting evidence: Literature review |
Scotland’s agricultural subsidies continue to favour high-emission livestock farming, with no clear mechanisms in the Good Food Nation Act to incentivise climate-friendly farming, diversify toward low-carbon crops, or enhance carbon footprint labelling for consumers. (Brennan, 2023). |
|
Supporting evidence: Stakeholder meetings |
– |
|
Supporting evidence: Workshops |
– |
|
Assess and recognise the economic value of grazing land |
Despite Scotland’s extensive grazing land, concerns remain about the economic efficiency of meat production relative to its high cost. |
|
Supporting evidence: Literature review |
– |
|
Supporting evidence: Stakeholder meetings |
Economic value of grazing land: Despite abundant grazing land in Scotland and the UK, the relatively high cost of meat raises concerns about economic efficiency. (Stakeholder Meeting 8). |
|
Supporting evidence: Workshops |
– |
|
Manage the rural economic impacts of reducing livestock numbers |
Reducing livestock farming without strategic policy support could threaten the financial stability of meat producers and contribute to rural depopulation. |
|
Supporting evidence: Literature review |
– |
|
Supporting evidence: Stakeholder meetings |
Impact of livestock reduction on rural communities: Livestock reduction policies may exacerbate rural depopulation due to economic reliance on agriculture. (Stakeholder Meeting 6). |
|
Supporting evidence: Workshops |
– |
|
Address price dynamics in meat and dairy markets |
Higher red meat prices can sometimes drive increased production, complicating efforts to lower consumption. |
|
Supporting evidence: Literature review |
– |
|
Supporting evidence: Stakeholder meetings |
Price dynamics and production response: Increases in red meat prices can lead to higher production levels, complicating efforts to reduce consumption. (Stakeholder Meeting 14). |
|
Supporting evidence: Workshops |
– |
|
Improve the affordability and accessibility of meat and dairy alternatives |
High prices for plant-based alternatives, driven by supermarket pricing and financial support structures, limit consumer accessibility. |
|
Supporting evidence: Literature review |
Price is a major factor preventing Scottish consumers from switching to plant-based meat. Subsidising plant-based alternatives or taxing meat products were ranked as potential solutions. (McBey, Sánchez, McCormick et al., 2024). |
|
Supporting evidence: Stakeholder meetings |
Higher markup on plant-based food in retail: Plant-based foods often carry a premium price, limiting affordability for many consumers. (Stakeholder Meeting 2). |
|
Supporting evidence: Workshops |
“We assess that there is currently a price-premium on especially convenience alternatives to meat and dairy. This has many reasons, but people are clear that it will need to be addressed.” (Workshop 3). |
|
2. Trade and Supply Chain Misalignment with Climate Goals | |
|
Align trade and supply chains with climate goals |
Scotland’s food trade policies do not fully integrate net-zero ambitions, increasing the risk of offshoring environmental impacts. Expanding sustainable supply chains requires investment in skills, infrastructure, and collaborative mechanisms. |
|
Supporting evidence: Literature review |
Export Dependencies: Highlights risks of offshoring emissions by reducing local production but offers limited strategies for linking domestic production to dietary transitions. (Thomson, Moxey & Hall, 2021). |
|
Supporting evidence: Stakeholder meetings |
Food imports and emissions: Import reliance complicates carbon accounting and weakens domestic economic resilience. (Stakeholder Meeting 2). |
|
Supporting evidence: Workshops |
“Offsetting/Offshoring of emissions.” (Workshop 1). |
|
Address procurement barriers for local and small-scale producers |
Large multinational suppliers dominate public contracts, limiting opportunities for local and sustainable food producers. |
|
Supporting evidence: Literature review |
Current public procurement policies favour large multinational suppliers, making it difficult for local producers to compete for contracts. This limits market access for regional food systems and reduces opportunities to support sustainable, locally sourced food. (Scottish Government, 2024). |
|
Supporting evidence: Stakeholder meetings |
– |
|
Supporting evidence: Workshops |
– |
|
Strengthen livestock supply chain infrastructure |
Transport, distribution, and processing capacity shortages, including a lack of small abattoirs, create challenges for small-scale farmers. |
|
Supporting evidence: Literature review |
Rural and island regions face transport and distribution challenges, making it less efficient to get food to markets. Processing capacity is limited: Lack of small abattoirs and local processing facilities hinders small farmers from scaling up. (Scottish Government, 2024). |
|
Supporting evidence: Stakeholder meetings |
– |
|
Supporting evidence: Workshops |
– |
|
Encourage consumer support for domestic agriculture |
Strengthening links between primary producers and public-sector buyers can improve market access and resilience. |
|
Supporting evidence: Literature review |
– |
|
Supporting evidence: Stakeholder meetings |
– |
|
Supporting evidence: Workshops |
“Links between primary producers and public sector…Opportunities for local producers to supply public sector.” (Workshop 1). |
|
Enhance school meals by funding local and sustainable procurement |
Initiatives like Food for Life have the potential to improve the quality and sustainability of school food. However, uptake is often limited by financial constraints at the local authority level, where budgets are already stretched and competing priorities make it difficult to invest in more sustainable food procurement. |
|
Supporting evidence: Literature review |
– |
|
Supporting evidence: Stakeholder meetings |
– |
|
Supporting evidence: Workshops |
“Using school dinners for quality Much better now in terms of options. E.g., food for life in East Ayrshire- but financial pressures has been hammered. Transferring circa £10 million from agriculture budget to school food budget to support local procurement policies.” (Workshop 1). |
|
Balance business influence in food policy decisions |
Food policy decision-making often prioritises business interests over sustainability and inclusivity. The limited integration of industry sustainability commitments weakens efforts to reduce food system emissions. |
|
Supporting evidence: Literature review |
Decision-making processes privilege the business sector, sidelining civil society concerns and limiting democratic participation in food policy development (Food Farming & Countryside Commission (FFCC), 2023). |
|
Supporting evidence: Stakeholder meetings |
Challenges in engaging food retailers: Difficulty in engaging with retailers and industry stakeholders hinders sustainable food practices. (Stakeholder Meeting 8). |
|
Supporting evidence: Workshops |
“The role of the food industry: their involvement in research, funding of research… Industrial lobbying is strong.” (Workshop 4). |
|
Expand market access for agroecological and small-scale producers |
Small-scale agroecological producers face challenges accessing mainstream markets dominated by large retailers. |
|
Supporting evidence: Literature review |
Limited financial incentives: Most environmental incentive schemes do not explicitly support agroecological transitions. Many agroecological farmers self-fund their practices, creating financial vulnerability. (Lozada & Karley, 2022). |
|
Supporting evidence: Stakeholder meetings |
Linking producers and consumers: Policies and markets often fail to effectively connect producers with consumers, limiting market efficiency. (Stakeholder Meeting 3). |
|
Supporting evidence: Workshops |
– |
|
Minimise emissions from imported food products |
Policies targeting dietary change may drive increased food imports, undermining local sustainability. In general, meat from countries with high deforestation or intensive farming may have a higher footprint than Scottish-produced meat. |
|
Supporting evidence: Literature review |
This case study applied a carbon displacement framework to hypothetical carbon policies affecting UK beef production. It found that financial pressure to cut emissions could force some UK producers out of business, potentially leading to increased beef imports from countries with higher emissions, thereby raising global emissions. While modest emission reductions are possible through cost-effective practices, deeper cuts would likely require greater financial and technical support. The findings suggest further analysis of UK beef production is needed. (Department for Food, Rural and Environmental Affairs (Defra), 2024). |
|
Supporting evidence: Stakeholder meetings |
Consumption-focused policies risk increasing imports rather than reducing global emissions. Policies targeting consumption may inadvertently increase imports, undermining local sustainability. (Stakeholder Meeting 2). |
|
Supporting evidence: Workshops |
– |
|
Balance demand-side and supply-side strategies in food policy |
Over-reliance on demand-side measures without sufficient supply-side interventions limits systemic change in sustainable food systems. |
|
Supporting evidence: Literature review |
– |
|
Supporting evidence: Stakeholder meetings |
Overemphasis on demand-side strategies: Insufficient focus on supply-side measures weakens the resilience of sustainable food systems. (Stakeholder Meeting 11). |
|
Supporting evidence: Workshops |
– |
|
Balance domestic food standards with pressures from import competition |
High food standards increase production costs, but low-cost imports undermine sustainability efforts. Trade strategy should prevent lower-welfare imports from undercutting UK farmers. |
|
Supporting evidence: Literature review |
– |
|
Supporting evidence: Stakeholder meetings |
– |
|
Supporting evidence: Workshops |
“Cost of produce will increase with greater standards and requirements, and then we see imports coming in that are favoured for being cheap, not just meat but cereals too. when supply chains get too long, its harder to see where its coming from… e.g. horse meat scandal need shorter supply chain and more locally produced food.” (Workshop 3). |
|
Address the impacts of resource-intensive food production |
The food industry prioritises high-value convenience foods with inefficient transportation systems, reducing sustainability. |
|
Supporting evidence: Literature review |
– |
|
Supporting evidence: Stakeholder meetings |
Resource-intensive convenience food production: The industry favours low-volume, high-value, resource-intensive convenience foods, and inefficient transportation, reducing sustainability. (Stakeholder Meeting 11). |
|
Supporting evidence: Workshops |
– |
|
Enhance food system resilience to global and domestic shocks |
Structural vulnerabilities in food imports, land control, and export distribution impact local food security and community wealth-building. |
|
Supporting evidence: Literature review |
– |
|
Supporting evidence: Stakeholder meetings |
– |
|
Supporting evidence: Workshops |
“Chatham House report – Choke points identified in red/amber/green rating. Current barrier is imported food. It seems we have enough land to address our vulnerability, but the control of the land is an issue. This includes food for animals and fertilizers and exported goods not going to local areas which might not contribute to community wealth building.” (Workshop 4). |
|
Manage carbon leakage risks in livestock trade and production |
Carbon taxes on livestock risk increasing imports and causing carbon leakage without complementary trade adjustments. |
|
Supporting evidence: Literature review |
There is a significant risk of carbon leakage resulting from import substitution, where domestic efforts to reduce emissions in meat production may inadvertently lead to increased imports from countries with more carbon-intensive farming practices. Currently, there is no clear mitigation strategy in place to address this issue, which could undermine national climate targets and shift environmental impacts abroad rather than reducing them overall. (Scottish Parliament, n.d.b). |
|
Supporting evidence: Stakeholder meetings |
– |
|
Supporting evidence: Workshops |
– |
|
Promote sustainable practices in supermarket and retail food supply |
Since most food decisions are made in supermarkets, responsible retail practices are crucial for shifting consumer demand toward sustainability. |
|
Supporting evidence: Literature review |
Sustainability-oriented retailers can use innovative behavioural tools to promote healthier and climate-friendlier foods (such as vegetables) while meeting the “triple bottom line”. A real-life supermarket trial in Denmark tested if multi-layered nudges can increase the purchase of fruit and vegetables. The intervention led to small increases in sales. These findings showcase the possibility that supermarkets, in principle, have agency and ability to nudge consumers towards more sustainable diets. (Bauer, Aarestrup, Hansen, et al., 2022). |
|
Supporting evidence: Stakeholder meetings |
– |
|
Supporting evidence: Workshops |
“Supermarkets are where vast majority of decisions are made so we need to get that side of retail right.” (Workshop 3). |
|
Develop sustainable supply chain partnerships |
Strengthening collaborations for key crops and improving processing infrastructure can enhance food system sustainability. |
|
Supporting evidence: Literature review |
– |
|
Supporting evidence: Stakeholder meetings |
– |
|
Supporting evidence: Workshops |
“Supply chains for human consumption- SAOS-Bere Barley; processing facilities-peas and beans.” (Workshop 1). |
|
Align market demand with sustainable food choices |
Consumer preferences, such as demand for sweeter apples, shape market dynamics and need to be considered in food system planning. |
|
Supporting evidence: Literature review |
Found that of the three perceptions measured, consumers derive the most utility out of how they perceive a product’s taste, rather than how healthy or safe they believe the product to be. (Malone & Lusk, 2017). |
|
Supporting evidence: Stakeholder meetings |
– |
|
Supporting evidence: Workshops |
“Demand-market wants sweeter apples.” (Workshop 1). |
|
3. Funding Gaps for Food Systems | |
|
Ensure stable funding for urban agriculture |
Urban agriculture development is constrained by unstable, short-term funding, limiting its potential contribution to sustainable diets and climate goals. |
|
Supporting evidence: Literature review |
Urban agriculture (UA) currently relies heavily on short-term or temporary funding streams, which can limit its capacity to scale and sustain operations. This lack of stable, long-term investment undermines its potential to contribute meaningfully to long-term dietary change, local food security, and climate resilience. A more consistent and strategic funding approach is needed to unlock the full benefits of UA as part of a sustainable food system. (White & Bunn, 2017). |
|
Supporting evidence: Stakeholder meetings |
– |
|
Supporting evidence: Workshops |
– |
|
Secure long-term food budgets in public institutions |
Dedicated, ring-fenced funding is needed for food provision in schools and hospitals to support quality and sustainability. |
|
Supporting evidence: Literature review |
– |
|
Supporting evidence: Stakeholder meetings |
Promoting plant-based menus through procurement: Public procurement policies offer significant opportunities to promote plant-based menus in public institutions such as schools, hospitals, and government offices. Effectively leveraging these regulations could support sustainability goals and encourage healthier dietary habits. (Stakeholder Meeting 1). |
|
Supporting evidence: Workshops |
“Budget and funding Food budgets not ring fenced in schools/hospitals” (Workshop 1). |
|
Strengthen support for community-based food initiatives and the third sector |
Long-term funding is needed to sustain community-led food programs, address health inequalities, and support vulnerable groups. Over-reliance on overstretched third-sector organisations risks undermining their role in strengthening local food networks. |
|
Supporting evidence: Literature review |
– |
|
Supporting evidence: Stakeholder meetings |
– |
|
Supporting evidence: Workshops |
“Lack of long-term funding for community/voluntary organisations.” (Workshop 1). |
|
Subsidise public dining to promote health and community wellbeing |
Affordable, healthy meals outside the home can encourage better eating habits, inspire home cooking, and foster social dining spaces. |
|
Supporting evidence: Literature review |
– |
|
Supporting evidence: Stakeholder meetings |
Lack of nutritional and environmental standards for out-of-home food: There is a lack of comprehensive regulations governing the nutritional and environmental standards of food sold in restaurants, cafes, and takeaway services. This regulatory gap limits the effectiveness of policy interventions aimed at fostering healthier and more sustainable dietary habits. (Stakeholder Meeting 13). |
|
Supporting evidence: Workshops |
“Education – aspects of bringing nutritious food into schools as well as teaching children about healthy foods Public diners – we subsidise everything else! So why do we not subsidise food. Work with culture around eating out of the home to provide healthy and affordable meals for everyone. May support inspiring people re cooking at home, as well as providing a social space.” (Workshop 4). |
|
4. Consumer-Focused Fiscal Policies and Incentives | |
|
Address VAT disparities for plant-based foods |
Some plant-based meat alternatives (processed or prepared products such as hot takeaway food) are subject to VAT. Extending VAT exemptions could encourage meat reduction. |
|
Supporting evidence: Literature review |
Some plant-based meat alternatives are not VAT-exempt. This disparity in fiscal treatment creates a financial barrier to choosing more sustainable and lower-emission protein sources. Extending VAT exemptions or other financial incentives to plant-based meat alternatives could encourage greater consumer uptake, support dietary shifts aligned with climate and health goals, and promote market growth in the plant-based sector. (Kennedy, Clark, Stewart et al., 2025). |
|
Supporting evidence: Stakeholder meetings |
– |
|
Supporting evidence: Workshops |
– |
|
Reduce economic dependence on alcohol and processed food sectors |
Scotland’s food system is heavily reliant on the economic contributions of alcoholic beverages and processed foods, raising concerns about long-term sustainability. |
|
Supporting evidence: Literature review |
– |
|
Supporting evidence: Stakeholder meetings |
– |
|
Supporting evidence: Workshops |
“Food systems are linked to economic opportunities for people in Scotland – but our food industry is heavily tied to alcoholic drinks and processed foods.” (Workshop 4). |
|
Internalise environmental and health costs within the food system |
The current food system externalises costs like healthcare burdens from poor diets and environmental degradation onto society, rather than incorporating them into economic policies. |
|
Supporting evidence: Literature review | |
|
Supporting evidence: Stakeholder meetings |
Externalisation of costs: The current food system externalises many economic costs, such as healthcare expenses linked to poor diets and environmental degradation costs, which are not adequately accounted for in economic policies. (Stakeholder Meeting 11). |
|
Supporting evidence: Workshops |
– |
|
Manage dietary shifts resulting from red meat reduction policies |
Reducing red meat consumption may lead to increased demand for white meat and dairy, with potentially conflicting environmental and health outcomes. Negative perceptions of plant-based alternatives could also limit dietary shifts. |
|
Supporting evidence: Literature review |
– |
|
Supporting evidence: Stakeholder meetings |
Substitution of red meat and perceptions of plant-based alternatives: Red meat reduction policies may unintentionally drive demand toward other meat products, such as white meat, due to negative perceptions of the healthiness of plant-based alternatives. (Stakeholder Meeting 13). |
|
Supporting evidence: Workshops |
– |
|
Prevent over-reliance on ultra-processed foods in sustainable diet transitions |
Moving away from fresh meat could increase reliance on ultra-processed alternatives, posing health and sustainability concerns. |
|
Supporting evidence: Literature review |
– |
|
Supporting evidence: Stakeholder meetings |
– |
|
Supporting evidence: Workshops |
“There’s a risk that moving away from fresh meat means to a turn to ultra-processed food.” (Workshop 4). |
|
Balance growth in the plant-based sector with sustainability objectives |
There is a risk that increased plant-based food demand could lead to more industrial production while factory farming persists. |
|
Supporting evidence: Literature review |
Increasing demand for plant-based diets in the UK, including Scotland, may drive industrialized food production rather than promoting sustainable agriculture. As plant-based food demand rises, major food corporations may scale up industrial production, leading to more monoculture farming and intensification. (Rhymes, Stockdale & Napier, 2023). |
|
Supporting evidence: Stakeholder meetings |
– |
|
Supporting evidence: Workshops |
“Risk that promoting plant-based food leads to an increase in industrial production of plant-based foods alongside continued factory farming.” (Workshop 4). |
|
5. Structural and Social Barriers in Agricultural transition | |
|
Assess the viability of agroecological farming models |
Limited research on the financial and social sustainability of agroecology prevents evidence-based policymaking. |
|
Supporting evidence: Literature review |
There is currently no comprehensive cost-benefit analysis comparing agroecological farming with conventional agricultural systems in the Scottish context. This lack of evidence limits policymakers’ and producers’ ability to make informed decisions about transitioning to more sustainable practices. In particular, there is a need for robust financial models that capture the long-term economic, environmental, and social resilience benefits of agroecology, including reduced input costs, improved soil health, biodiversity gains, and greater climate adaptability. Addressing this evidence gap is essential for supporting policy development and encouraging wider adoption of agroecological approaches. (Lozada & Karley, 2022). |
|
Supporting evidence: Stakeholder meetings |
– |
|
Supporting evidence: Workshops |
– |
|
Strengthen support for rural and agricultural workers |
Inadequate policies limit rural workers’ access to land, resources, and affordable housing, creating barriers to sustainable food system employment. |
|
Supporting evidence: Literature review |
Current policies fall short in addressing structural barriers faced by rural agricultural workers, particularly in relation to secure access to land, essential resources, and affordable housing. These challenges limit opportunities for participation in sustainable food production and contribute to rural inequality. To support a just transition in the food system, policies must more effectively promote equitable access and create enabling conditions for rural livelihoods, especially for new entrants and marginalised communities. (Centre for Climate and Social Transformations (CAST), 2024). |
|
Supporting evidence: Stakeholder meetings |
– |
|
Supporting evidence: Workshops |
– |
|
Develop economic transition strategies for the livestock sector |
A clear economic transition strategy is needed to support industries affected by reduced red meat and dairy consumption. Triple Win economic models could help guide policy by capturing co-benefits across community wellbeing, public health, and cost savings. |
|
Supporting evidence: Literature review |
Triple win economic models are frameworks or strategies designed to deliver simultaneous benefits (or “wins”) across three key domains—usually economic, environmental, and social outcomes. These models are particularly popular in sustainability, public policy, and development sectors. (Ellis & Tschakert, 2019). |
|
Supporting evidence: Stakeholder meetings |
– |
|
Supporting evidence: Workshops |
“There is a gap in the development of triple win economic modelling which policy and decision makers can rely on and inform how the money best should be spent. An example is a study made in England on “broken pavements”, the cost claims by people, the cost avoidance of the council not being held accountable against the claims against the total cost implication for NHS i.e. NHS had to pick up the cost because of people hurt by damaged pavement. Community growing and the cost avoidance of seeking health care services is missing.” (Workshop 1) |
|
Support new entrants to farming and food production |
Rising land costs and financial barriers make it difficult for new farmers to secure land and adopt sustainable practices. |
|
Supporting evidence: Literature review |
Limited financial incentives: Most environmental incentive schemes do not explicitly support agroecological transitions. Many agroecological farmers self-fund their practices, creating financial vulnerability. Access to land tenure and financial support is a major barrier for new entrants, despite them being more likely to adopt agroecology. Lozada & Karley, 2022). |
|
Supporting evidence: Stakeholder meetings |
Land ownership and affordability issues: Competition and rising land costs are pricing out farmers, limiting opportunities for sustainable agricultural transitions. (Stakeholder Meeting 1). |
|
Supporting evidence: Workshops |
– |
|
Build a resilient and skilled workforce across the food sector |
To address labour shortages in the food sector, policies should improve migration pathways, expand skills development, and offer incentives to attract and retain workers. |
|
Supporting evidence: Literature review |
– |
|
Supporting evidence: Stakeholder meetings |
– |
|
Supporting evidence: Workshops |
“Workforce strategies, skills development and incentives to overcome labour shortages and create attractive career opportunities.” (Workshop 1). |
Appendix I: Extended Social analysis: Areas for further policy development and supporting evidence
|
Key Theme |
Area For Policy Development |
|---|---|
|
1. Food Access and Affordability Inequalities | |
|
Ensure equitable access to sustainable and healthy diets |
Lower-income, rural, and marginalised groups face financial and logistical barriers to adopting sustainable diets. Existing policies and financial support do not adequately ensure food affordability, while tax-based approaches like red meat levies lack protections for vulnerable households. |
|
Supporting evidence: Literature review |
Public awareness of sustainable diets and their environmental impacts has increased over the past decade, but this growth is uneven across socioeconomic groups. Higher-deprivation (HD) groups face greater barriers, including availability and access, cost concerns and scepticism about health and environmental benefits, limiting their willingness to adopt sustainable dietary practices. (Food Standards Scotland (FSS), 2021a). |
|
Supporting evidence: Stakeholder meetings |
Low-income and rural communities face higher food costs, limited access to affordable healthy food, and reduced resilience to economic shocks. (Stakeholder Meeting 4). |
|
Supporting evidence: Workshops |
“Food insecurity also discussed – cost of healthy food as a barrier, and food banks often do not allow a healthy diet.” (Workshop 4, Group 2). |
|
Enhance inclusion and participation in local food systems |
Food systems should be designed to accommodate diverse needs, including time constraints, geographic location, and preferred access points. |
|
Supporting evidence: Literature review |
Suggests attending to a range of consumer-related changes: Medium-term actions: The nature of consumer demand and its capacity to adjust to social and cultural expectations in the light of market realities and policy priorities. The national, devolved, regional, local dimensions of food and its role as a determinant of identity. The desired consumer outcomes including the nature of a sustainable diet. The role of regulation, ‘consumer choice editing’ and marketing in shaping consumer choice A description of the EU/UK’s ‘sustainable consumer diet’. The development of communication and education strategies to engage the public on key food issues. (Ambler-Edwards, Bailey, Kiff et al., 2009). |
|
Supporting evidence: Stakeholder meetings |
Consumers may not feel fully in control of their dietary choices due to economic, social, and cultural constraints. (Stakeholder Meeting 9). |
|
Supporting evidence: Workshops |
“How do people want to interact with this system? Time poor, etc. Geography, Creating the spaces that people want to access the food they need at their location.” (Workshop 1). |
|
Increase the availability of affordable, healthy food options outside the home |
Policies insufficiently address affordability and accessibility of healthier out-of-home food choices, disproportionately affecting lower-income consumers. |
|
Supporting evidence: Literature review |
There is a persistent gap in policy and practice regarding the affordability and accessibility of healthier food options in out-of-home (OOH) settings, such as restaurants, cafés, takeaways, and workplace canteens. While public health initiatives emphasise the importance of nutritious diets, current policies often fall short in ensuring that healthier choices are both financially viable and widely available across different socioeconomic groups. Food Standards Scotland (FSS), 2023). |
|
Supporting evidence: Stakeholder meetings |
There is a lack of comprehensive regulations governing the nutritional and environmental standards of food sold in restaurants, cafes, and takeaway services. This regulatory gap limits the effectiveness of policy interventions aimed at fostering healthier and more sustainable dietary habits. (Stakeholder Meeting 13). |
|
Supporting evidence: Workshops |
– |
|
Improve access to cooking facilities, skills, and food literacy |
Households with limited cooking equipment, high energy costs, or inadequate storage face difficulties in preparing sustainable meals. |
|
Supporting evidence: Literature review |
The study investigates how residents in energy-efficient, affordable housing in Scotland experience their kitchen environments. With a national push toward low-carbon housing, the paper explores whether energy-efficient designs support or constrain occupants in their daily cooking and living practices. Architectural Design, Building Services & Energy Use, fixtures and storage affected diet and had social and psychological impacts. (Foster & Poston, 2024). |
|
Supporting evidence: Stakeholder meetings |
Households with limited access to proper cooking equipment, affordable energy, or sufficient food storage options face challenges in preparing healthy, sustainable meals. (Stakeholder Meeting 8). |
|
Supporting evidence: Workshops |
“Appeal: Social and cultural barriers/appeal of healthy food Including skills and knowledge and time poor Less links with food production and consumption Place of food in society (value not just cost).” (Workshop 1). |
|
Address the psychological, cultural, and economic barriers influencing food choices |
Financial stress, mental health challenges, and economic insecurity impact the ability to make sustainable food choices, with food often serving as a coping mechanism. |
|
Supporting evidence: Literature review |
The study identified links between kitchen environments and unintended consequences of their design on occupants. These included architectural issues such as draughts, limited natural light, noisy or ineffective ventilation systems, non-opening kitchen windows, and difficulties in placing appliances. Not all findings were exclusive to low-energy homes, highlighting the need for targeted research to explore these issues further. A deeper understanding is required to assess whether tenants’ adaptive behaviours may influence their diet and affect their respiratory, physical, and mental health. (Foster & Poston, 2024). |
|
Supporting evidence: Stakeholder meetings |
Mental health, stress, and economic precarity influence people’s ability to make sustainable food choices, with food often used as a coping mechanism in challenging circumstances. (Stakeholder Meeting 1). |
|
Supporting evidence: Workshops |
– |
|
2. Availability of Healthier and Sustainable Food Options | |
|
Expand access to alternative proteins in mainstream food environments |
The availability of meat-free options remains low in common food products, with only 12% of ready-to-eat sandwiches in the UK being meat-free. |
|
Supporting evidence: Literature review |
The food service sector is leading change by rapidly expanding meat-free sandwich options—34% of its range is now meat-free, with half of those being plant-based. In contrast, major food retailers are falling behind, with some even reducing their meat-free offerings since 2019. Notably, alternative proteins as fillings have risen by 620% since 2019, reflecting increased investment in this area. Among the big supermarkets, Sainsbury’s has improved its plant-based range, while Tesco, Morrisons, and Asda have scaled back. Vegetarian sandwiches have seen a 22% drop across retailer ranges. Overall, meat and cheese still dominate, and most high salt or fat sandwiches contain meat, limiting healthy and sustainable choices. Despite growth, plant-based sandwiches remain the most expensive, making them less accessible—especially during a cost-of-living crisis. (Eating Better, 2022). The availability of meat-free alternatives, especially for popular items like sandwiches, remains low, with only 12% of ready-to-eat sandwiches in the UK being meat-free. (Stewart, Runions, McNeill, et al., 2024). |
|
Supporting evidence: Stakeholder meetings |
– |
|
Supporting evidence: Workshops |
“Lead by example: public sector organisations and institutions to move to offering balanced, plant-based diets. this would make it more of a norm.” (Workshop 4). |
|
Address urban food swamps and improve access to healthy food |
Many urban areas suffer from an overconcentration of fast food and ultra-processed options, requiring targeted policy interventions. |
|
Supporting evidence: Literature review |
Geographical and socioeconomic inequalities limit access to healthy and sustainable food, leading to “food deserts.” (Mitev, Portes, Osman et al., 2023). |
|
Supporting evidence: Stakeholder meetings |
Urban areas face “food swamps,” characterised by the prevalence of fast food and ultra-processed foods, which require targeted interventions. (Stakeholder Meeting 1). |
|
Supporting evidence: Workshops |
“Planning to support healthier environments Support local food and production initiatives e.g., to support those in urban areas and food deserts Opportunities- GFN and implementing local plans including procurement.” (Workshop 1). |
|
Improve consumer information and transparency through food labelling |
Consumers lack clear sustainability information on takeaway and restaurant food, limiting informed choices. Honest food labelling should ensure transparency on welfare standards, environmental impact, and product origins. |
|
Supporting evidence: Literature review |
Consumers often feel uninformed about the sustainability of food choices when dining out or ordering takeaways, limiting their ability to make environmentally conscious decisions. (Food Standards Scotland (FSS), 2021a). |
|
Supporting evidence: Stakeholder meetings |
Awareness campaigns should address how consumer choices are manipulated by food marketing strategies. (Stakeholder Meeting 13). |
|
Supporting evidence: Workshops |
– |
|
Reduce the consumption of ultra-processed foods |
Despite high levels of ultra-processed food consumption in the UK, policies do not promote shifts toward minimally processed, locally sourced foods. |
|
Supporting evidence: Literature review |
The report highlights that the UK has high levels of ultra-processed food consumption. There is an opportunity for policies that encourage dietary shifts towards minimally processed locally sourced foods through public awareness campaigns and incentives. Hasnain et al (2020). |
|
Supporting evidence: Stakeholder meetings |
Ultra-processed foods, such as those offered by large fast-food chains (e.g., Domino’s Pizza), are often inconsistent with the principles of a sustainable food culture due to their high environmental footprint. (Stakeholder Meeting 11). |
|
Supporting evidence: Workshops |
– |
|
Overcome negative perceptions of plant-based meat alternatives |
Concerns over food standards post-Brexit and perceptions of plant-based meat alternatives (PBMAs) as ultra-processed discourage consumer adoption. |
|
Supporting evidence: Literature review | |
|
Supporting evidence: Stakeholder meetings |
Red meat reduction policies may unintentionally drive demand toward other meat products, such as white meat, due to negative perceptions of the healthiness of plant-based alternatives. (Stakeholder Meeting 13). |
|
Supporting evidence: Workshops |
“Public perception will be challenging, fear of Frankenfood.” (Workshop 1). |
|
Integrate sustainable food practices into social and public environments |
While schools promote healthy meals, there is little policy support for sustainable food options in fast food outlets and other social settings. |
|
Supporting evidence: Literature review |
Support for social contexts: Encourage sustainable food options in fast food outlets and social settings, addressing the cultural importance of such spaces for young people. (McBey, Rothenberg, Cleland et al., 2024). |
|
Supporting evidence: Stakeholder meetings |
There is a lack of comprehensive regulations governing the nutritional and environmental standards of food sold in restaurants, cafes, and takeaway services. This regulatory gap limits the effectiveness of policy interventions aimed at fostering healthier and more sustainable dietary habits. (Stakeholder Meeting 13). |
|
Supporting evidence: Workshops |
“Local planning systems – don’t currently have levers to determine what food outlets are available in a local area.” (Workshop 4). |
|
Address sensory and aesthetic barriers to alternative protein adoption |
The taste, texture, and unfamiliarity of plant-based foods, along with the “disgust factor” of lab-grown meat and edible insects, limit their acceptance. |
|
Supporting evidence: Literature review |
The appeal of plant-based diets is often hindered by unfamiliar flavours, textures, and food neophobia, making them less enticing for some consumers. Additionally, perceived sensory drawbacks and the “disgust factor” present major obstacles to the acceptance of novel protein sources such as edible insects and lab-grown meat, limiting their mainstream adoption. (Food Standards Agency (FSA), 2022). |
|
Supporting evidence: Stakeholder meetings |
Red meat reduction policies may unintentionally drive demand toward other meat products, such as white meat, due to negative perceptions of the healthiness of plant-based alternatives. (Stakeholder Meeting 13). |
|
Supporting evidence: Workshops |
– |
|
3. Cultural, Health, and Equity Considerations | |
|
Ensure cultural equity in dietary policy |
Policies promoting meat reduction must consider cultural dietary practices, such as Halal diets, to ensure equitable food access. |
|
Supporting evidence: Literature review |
– |
|
Supporting evidence: Stakeholder meetings |
The intersection of cultural dietary practices (e.g., Halal diets in Glasgow) with meat reduction policies raises equity considerations. (Stakeholder Meeting 4). |
|
Supporting evidence: Workshops |
“Risk of culturally appropriate food.” (Workshop 1). |
|
Assess health impacts of meat reduction and provide targeted guidance |
The Scottish Dietary Goals include a general recommendation to limit red and processed meat intake to 70g per day, but they do not offer specific or targeted guidance for individuals who consume high levels of meat. |
|
Supporting evidence: Literature review |
Scottish Dietary Goals do not include specific guidelines to support high consumers of red and processed meat in transitioning to healthier, lower-emission diets, limiting the effectiveness of dietary and sustainability interventions. There is a need for guidelines that help high consumers of red and processed meat transition toward healthier, lower-emission diets, which are currently missing from Scottish Dietary Goals. (Comrie et al., 2024). |
|
Supporting evidence: Stakeholder meetings |
Poor health outcomes and dietary patterns in Scotland may worsen if red meat reduction strategies do not account for suitable nutritional replacements. (Stakeholder Meeting 13). |
|
Supporting evidence: Workshops |
“Price, affordability, and accessibility of food that is recommended in the dietary goals. People rely on ultraprocessed food to plug the gap in their diets due to affordability of healthier or more sustainable items such as locally grown fruit, veg, or meat. From an education perspective, people know what they should be doing, but it is not possible to do this for many people – need to stop focusing on information, and instead focus on improving provision. We are worsening inequalities by asking people to buy more fruit and vegetables but not making this available equally to them.” (Workshop 4). |
|
Expand the focus of dietary policy beyond individual health |
Policy approaches should move beyond solely focusing on meat reduction messaging and instead integrate messaging that promotes increased consumption of fibre, fruit, and vegetables. Given the limited success of standalone meat reduction campaigns, a more holistic and positive framing may be more effective. |
|
Supporting evidence: Literature review |
– |
|
Supporting evidence: Stakeholder meetings |
– |
|
Supporting evidence: Workshops |
“Focus seems to be on meat reduction when it could be on fibre/ F+V increase.” (Workshop 3). |
|
Overcome misperceptions and structural barriers to healthier eating |
Many Scots mistakenly believe they meet dietary guidelines, while strong taste preferences create resistance to reformulated foods. Early education and culturally sensitive messaging are needed. |
|
Supporting evidence: Literature review |
Many Scottish adults believe their diet meets guidelines, but in reality, most do not. 70% of people consuming high-salt foods (e.g., ready meals, processed meats) believe they are eating within or below the recommended limits. 66% of people consuming confectionery and biscuits frequently think they are within sugar guidelines. Awareness of unhealthy consumption remains a key issue, suggesting that consumer education and product reformulation could play a crucial role in closing this gap. (Food and Drink Federation Scotland (FDF), 2020). |
|
Supporting evidence: Stakeholder meetings |
– |
|
Supporting evidence: Workshops |
“Address misconceptions around healthy diets – raise awareness that current dietary patterns (on average, across the country) are unhealthy, and that a meat reduction would in fact be healthy for many people. This should also present plant-based foods as a sustainable option, not just a trend / fad. This could start with early years and be incorporated into the curriculum. It should take account of varied cultures and traditions, and acknowledge how massively the Scottish population has changed.” (Workshop 4). |
|
Build public trust in agriculture and dietary recommendations |
Greater transparency and engagement are needed to rebuild consumer trust in agricultural institutions. Conflicting media narratives have fuelled public distrust in dietary recommendations. |
|
Supporting evidence: Literature review |
Significant issue in policies aimed at rebuilding trust in agricultural institutions through transparency and community engagement, particularly in the context of transitioning from meat and dairy to plant-based agriculture. Meat as the Default: Many Scots see meat as an essential part of a meal, making plant-based alternatives feel unnatural. Scepticism About Health Claims: People distrust health recommendations due to conflicting messages in the media. Limited Awareness of Environmental Impact: Most consumers do not link meat consumption to climate change. Price and Convenience: Many participants perceived plant-based options as expensive, inconvenient, or unfamiliar. (McBey, Watts & Johnstone, 2019). |
|
Supporting evidence: Stakeholder meetings |
Media narratives can contribute to the negative depictions of farmers, influencing public perceptions and stakeholder relationships. (Stakeholder Meeting 1). |
|
Supporting evidence: Workshops |
“Public perception will be challenging, fear of Frankenfood.” (Workshop 1). |
|
Address the social stigma associated with plant-based diets |
The perception of plant-based diets as elitist or judgmental discourages dietary shifts, requiring reframing to improve acceptance. |
|
Supporting evidence: Literature review |
Found that some participants expressed frustration with what they viewed as urban-centric or moralising narratives around veganism, which they felt overlooked the realities of Scottish rural and farming communities. For example, one participant criticised “vegan warriors” who aggressively promote veganism without understanding rural food systems, labelling such activism as unhelpful and antagonistic. (Brett, 2022). |
|
Supporting evidence: Stakeholder meetings |
Social stigma affects dietary shifts, with plant-based diets sometimes perceived as elitist or judgmental. (Stakeholder Meeting 11). |
|
Supporting evidence: Workshops |
“The terms “plant-based” and “vegan” as negative connotations-threats to identity of farmers.” (Workshop 1). |
|
Shape media narratives around farmers and sustainable diets |
Media portrayals can contribute to negative depictions of farmers, influencing public perceptions and policy debates. |
|
Supporting evidence: Literature review |
Discusses how Scottish farmers are judged by urban-centric standards, where cultural capital is eroded by media-fuelled stereotypes (e.g., greedy landowners, climate change deniers). Explores how these portrayals undermine rural social cohesion and farmer legitimacy. (Sutherland & Burton, 2011). |
|
Supporting evidence: Stakeholder meetings |
Media narratives can contribute to the villainisation of farmers, influencing public perceptions and stakeholder relationships. (Stakeholder Meeting 6). |
|
Supporting evidence: Workshops |
– |
|
Clarify the definition of “plant-based” in policy and markets |
The term “plant-based” carries different meanings for different stakeholders, creating confusion in communication and labelling. |
|
Supporting evidence: Literature review |
Found that meat substitutes were interpreted differently in terms of nutrition, cost, convenience, etc. (McBey, Watts & Johnstone, 2019). |
|
Supporting evidence: Stakeholder meetings |
– |
|
Supporting evidence: Workshops |
“Plant-based-what does it mean? Something different to everyone.” (Workshop 1). |
|
Improve knowledge and support for regenerative agricultural practices |
Raising awareness and providing policy support for regenerative farming practices can improve adoption and sustainability outcomes. |
|
Supporting evidence: Literature review |
Leadership, coherence and commitment to align policy implementation and delivery with the Scottish Government’s vision, targets, and ambitions for agriculture, nature recovery, net zero vision and a Just Transition, and to avoid a reinvention – or worse, a watering down, of the status quo (i.e., the CAP), and outline 17 steps towards regenerative agriculture (Brodie, 2023). |
|
Supporting evidence: Stakeholder meetings |
Insufficient subsidies and grants to support diversification into sustainable agriculture. (Stakeholder Meeting 6). |
|
Supporting evidence: Workshops |
“Few examples available of successful regenerative practices.” (Workshop 4). |
|
Strengthen dialogue and cooperation among producers |
Improving communication and collaboration among agricultural producers can support coordinated and sustainable food production. |
|
Supporting evidence: Literature review |
Building trust and engagement with the farming, crofting, and land management sector — including its representative bodies and media — is essential for increasing the uptake of nature-based solutions (NbS). Recommendations for the Scottish Government: Clearly communicate what is expected from the sector under the Agricultural Reform Programme (ARP), and by when. Current uncertainty is contributing to inertia and resistance to change. Frame communications around the business benefits of adopting NbS — such as improving resilience to economic and climate-related shocks, supporting food production, and boosting profitability. Messaging should directly counter sector narratives that portray NbS as peripheral or burdensome. Share compelling, real-world examples of farmers and land managers who have successfully embedded NbS into their core operations, and promote these stories through sector media outlets like The Scottish Farmer and Landward. Ensure that individuals with direct experience in farming, crofting, and land management are actively involved in the design and testing of ARP policy. Their input is vital to ensure credibility, practicality, and sector buy-in. (Brodie, 2023). |
|
Supporting evidence: Stakeholder meetings |
Scotland’s agricultural vision emphasizes sustainable and regenerative farming practices, aiming to improve land management, enhance biodiversity, and promote long-term environmental viability. (Stakeholder Meeting 14). |
|
Supporting evidence: Workshops |
“Dialogue between producers-agriculture cooperation.” (Workshop 3). |
|
Restore cultural connections to food and farming traditions |
Addressing the legacy of industrial food production by fostering appreciation for food origins, sustainability, and health impacts. |
|
Supporting evidence: Literature review |
Explores the strong consumer attachment to locally produced food in Scotland, highlighting how this loyalty is often associated with perceptions of sustainability, trust, and quality. It notes that local origin is frequently seen as a proxy for environmentally responsible and healthier food choices, even when this may not always reflect the full environmental impact. Recommends enhancing consumer education to improve understanding of food origin, sustainability credentials, and health claims. This includes raising awareness about how production methods, supply chains, and labelling affect environmental and health outcomes—helping consumers make more informed, evidence-based choices. (Leat, Revoredo-Giha & Lamprinopoulou, 2011). |
|
Supporting evidence: Stakeholder meetings |
Consumers often lack awareness of food provenance, challenging narratives around food sovereignty. (Stakeholder Meeting 11). |
|
Supporting evidence: Workshops |
“Improve relationship with food. Industrial farming/food production to overcome hunger in late 19th/early 20th centuries has altered how we understand and interact with food. Need to improve relationship with food, bringing back cultural elements and also an appreciation of where food comes from, how it is grown/processed, and how it affects our planet and our health.” (Workshop 4). |
|
Promote sustainable meat reduction in culturally significant meals |
Policies overlook opportunities to encourage lower meat intake in culturally significant meals, while social traditions make plant-based alternatives feel unfamiliar or unnatural. |
|
Supporting evidence: Literature review |
This study conducted focus groups across Scotland to assess attitudes toward reducing meat in familiar dishes. Explored acceptance of plant-based alternatives to staple meat-based meals. Participants expressed mixed reactions, with older and rural Scots more resistant to replacing meat in “staple” meals. (McBey, Watts & Johnstone, 2019). |
|
Supporting evidence: Stakeholder meetings |
Strong cultural attachments to traditional diets, particularly in rural communities, create barriers to dietary change. (Stakeholder Meeting 3). |
|
Supporting evidence: Workshops |
“Traditions, habits, and culture: Cultural traditions around ways of living – needing food to fuel a physical working day. A meat industry has grown around that – the fish industry hasn’t grown in the same way / as strong. These traditions, which have started in childhood, when people see food being produced, carry those habits into school and beyond.” (Workshop 4). |
|
Enhance cultural sensitivity in policy design and public messaging |
Campaigns should consider cultural, regional, and social differences to avoid alienating certain groups. |
|
Supporting evidence: Literature review |
Existing studies on barriers to, and enablers for, reducing meat consumption largely focus on the general population or students. Found that social norms, fear of stigmatisation and availability and price of meat and meat alternatives appear to be key factors. These differ significantly between subgroups within the population, influenced by factors such as age, gender, culture and socio-economic status. (Spiro, Hill & Stanner, 2024). |
|
Supporting evidence: Stakeholder meetings |
The intersection of cultural dietary practices (e.g., Halal diets in Glasgow) with meat reduction policies raises equity considerations. (Stakeholder Meeting 4). |
|
Supporting evidence: Workshops |
– |
|
Support farmer-to-farmer knowledge exchange and peer learning |
Expanding opportunities for sustainability-focused peer learning and knowledge sharing among farmers. |
|
Supporting evidence: Literature review |
Transformation in agricultural land management is critical to achieving Scottish Government’s aims of mitigating climate change, addressing the biodiversity crisis, and achieving a just transition for land and agriculture. Providing advice and collaborative learning opportunities through the Farm Advisory Service (FAS) is the key mechanism to deliver behaviour change in the agricultural sector. The Scottish Government is seeking to better integrate the FAS into an agricultural knowledge and innovation system (AKIS) for Scotland. AKIS is a system of innovation which links organisations, institutions, incentives and funding. This research comprises an evidence review and options appraisal for an agricultural knowledge and innovation system (AKIS) for Scotland. (Sutherland, Banks, Boyce et al., 2023). |
|
Supporting evidence: Stakeholder meetings |
– |
|
Supporting evidence: Workshops |
– |
|
Address generational tensions in dietary transitions |
In Scotland, younger generations tend to be more climate-conscious in their attitudes toward diet, with greater openness to reducing meat consumption and considering environmental impacts. However, actual behaviour may not always align with these intentions. Resistance from older family and community norms can also create barriers to change. |
|
Supporting evidence: Literature review |
A 2024 survey by Consumer Scotland found that 85% of individuals aged 16-24 expressed concern about climate change, compared to 76% of the general population. This heightened awareness among younger Scots is influencing their dietary choices. For instance, a 2023 report by Food Standards Scotland revealed that 45% of 16-24-year-olds reported reducing their meat or fish consumption, a higher proportion than in older age groups. Additionally, the same report noted that 30% of individuals over 65 years would not consider eating less meat or fish, indicating a generational difference in attitudes towards meat consumption. (Cotton, Gosschalk, Gray et al., 2024). |
|
Supporting evidence: Stakeholder meetings |
Younger generations tend to be more environmentally conscious in their dietary choices, often favouring sustainable and plant-based options. However, their efforts to adopt climate-friendly eating habits frequently encounter resistance rooted in longstanding traditions, cultural expectations, and dietary norms upheld by older family members and the broader community. These intergenerational tensions can pose significant barriers to meaningful change. (Stakeholder Meeting 4). |
|
Supporting evidence: Workshops |
“Carbon labelling on foods – WHO suggests young people more likely to change their diet because of climate concerns than health concerns – I think this links with young people’s climate anxiety etc.” (Workshop 4). |
|
Improve access to mental health support for farmers |
Financial stress, environmental uncertainties, and policy changes contribute to high mental health burdens among farmers, requiring targeted interventions. |
|
Supporting evidence: Literature review |
Poor mental health is an increasing concern within the farming sector. This article examines the adaptability of “landscapes of support” — a term used to describe the range of mental health support available to farmers, including services provided by government bodies, non-profits, and community organisations. Focusing on the UK, the study draws on a literature review, interviews with 22 support providers, surveys of 93 support actors and 207 farmers, and a concluding workshop. The findings reveal that while many organisations adapted during the COVID-19 pandemic by using digital tools and expanding media outreach, they also faced significant barriers, including funding shortfalls, limited training, staff burnout, and poor rural connectivity. The article identifies opportunities to strengthen these support systems to ensure they are more resilient in the face of future crises. (Shortland, Hall, Hurley et al., 2023). |
|
Supporting evidence: Stakeholder meetings |
– |
|
Supporting evidence: Workshops |
– |
|
4. Digital and Seasonal Food | |
|
Address digital inequalities in food access |
Rural and lower-income consumers face barriers to accessing food delivery technologies, creating disparities in digital food system participation. |
|
Supporting evidence: Literature review |
Policy interventions must account for unequal access to digital tools and platforms, particularly among rural populations and lower-income households. These groups may face barriers such as limited broadband connectivity, lack of digital literacy, or affordability issues, which restrict their ability to engage with online food systems, including grocery delivery, meal planning apps, or sustainability-focused platforms. Addressing these disparities is essential to ensure equitable participation in emerging food technologies and digital food environments. (Scottish Government, 2023). |
|
Supporting evidence: Stakeholder meetings |
Digital tools (e.g., benefit calculators) depend on reliable internet access and digital literacy, potentially excluding vulnerable populations with poor dietary outcomes. (Stakeholder Meeting 12). |
|
Supporting evidence: Workshops |
– |
|
Ensure equity in seasonal diet transitions |
A shift toward seasonal diets should not exacerbate existing social and economic disparities in food access. |
|
Supporting evidence: Literature review |
Local produce often needs long-term storage (e.g. apples, onions, potatoes, cabbage) to remain available year-round. Storage leads to nutrient degradation, especially for vitamin C and antioxidants. Frozen local foods preserve better but require energy-intensive processing (e.g., blanching), which can also reduce nutrients like B vitamins. No studies yet published have considered the overall health benefits of eating a wholly local diet compared to a similar diet produced non-locally. (Edwards-Jones, 2010). |
|
Supporting evidence: Stakeholder meetings |
– |
|
Supporting evidence: Workshops |
“Shift towards seasonality, but this could amplify existing inequalities.” (Workshop 1). |
|
5: Consumer Education and Behavioural Change | |
|
Enhance consumer education on sustainable diets |
Without targeted behavioural support, most people in Scotland struggle to align their diets with the Eatwell Guide, limiting progress toward CCC targets. |
|
Supporting evidence: Literature review |
The research finds that most people in Scotland do not follow the Eatwell Guide, making meat and dairy an important source of nutrients. This suggests that simply recommending dietary shifts without supporting consumer behavior change will be ineffective. Policy Gap: Absence of strong public awareness campaigns to help consumers transition to healthier, more sustainable diets, such as: Educational initiatives on how to replace meat and dairy with nutrient-rich plant-based foods. Supermarket incentives or labeling schemes to highlight healthier, climate-friendly food choices. (Food Standards Scotland (FSS), 2024). |
|
Supporting evidence: Stakeholder meetings |
Meat consumption trends in Scotland suggest an increase, highlighting the challenge of shifting dietary habits toward sustainability. (Stakeholder Meeting 6). |
|
Supporting evidence: Workshops |
“Dietary guidance- Eatwell Plate- if we followed it emissions would be reduced e.g., high volume of red meat eaters Which metrics are we using e.g., chicken (low carbon?) People don’t pay attention to dietary guidance.” (Workshop 1). |
|
Clarify nutritional guidance for dietary transitions |
Policies fail to provide comprehensive public education on suitable dietary substitutions and the potential risks of reducing meat and dairy consumption. |
|
Supporting evidence: Literature review |
Micronutrient Risks: The report highlights that reducing meat and dairy consumption can lead to decreased intakes of certain key nutrients (e.g., calcium, iron, vitamin B12), especially without careful substitutions. Groups with existing low nutrient intakes are at heightened risk under scenarios of reduced meat and dairy intake. Policies to enhance public understanding of appropriate dietary substitutions and potential nutrient risks associated with reduced meat and dairy are limited, suggesting an opportunity for educational initiatives. (Comrie et al., 2024). |
|
Supporting evidence: Stakeholder meetings |
The recommended 70g per day of red meat is often seen as a dietary requirement rather than a maximum limit, affecting efforts to normalise lower meat consumption. (Stakeholder Meeting 2). |
|
Supporting evidence: Workshops |
– |
|
Strengthen consumer connections to sustainable and local food systems |
A disconnect between modern food habits and local food traditions reduces demand for low-carbon, locally produced foods. |
|
Supporting evidence: Literature review |
Better and bolder communication is needed to overcome a disconnect between what people buy and how they consume food and the production processes that have negative environmental impacts. Issues around food production and land use, and the links to food consumption need to be addressed. (Centre for Climate Change and Social Transformations (CAST), 2024). |
|
Supporting evidence: Stakeholder meetings |
disconnection between people, nature, and food systems weakens public engagement with sustainable diets. (Stakeholder Meeting 11). |
|
Supporting evidence: Workshops |
“Local and community action around education and reconnecting to the land. Promoting interconnectedness between producers and consumers. This will look different depending on the setting – urban and rural environments will look different in the nature available to them and how they connect with nature. Requires input from local authorities, education institutions, local business/producers/suppliers to work together.” (Workshop 4). |
|
Define and communicate what constitutes a ‘sustainable diet’ |
The term “sustainable diet” is interpreted in varying ways, from affordability to environmental impact, complicating policy communication and engagement. |
|
Supporting evidence: Literature review |
Public understanding of what constitutes a “sustainable diet” is often diverse and inconsistent. For some, the concept is primarily linked to environmental impact, such as reducing carbon emissions or minimizing food waste. For others, it may be more closely associated with affordability, food security, or simply ensuring access to enough food to meet basic nutritional needs. This variation in interpretation highlights the need for clearer public communication and education around the multiple dimensions of sustainable diets—including environmental, economic, cultural, and health-related factors—to build a shared understanding and support informed decision-making. (Cleland, McBey, Darlene et al., 2025). |
|
Supporting evidence: Stakeholder meetings |
– |
|
Supporting evidence: Workshops |
– |
|
Improve dietary messaging for young people |
Adolescents are aware of environmental issues but lack understanding of the impact of meat consumption. Stronger educational initiatives and trusted voices are needed to clarify dietary choices. |
|
Supporting evidence: Literature review |
Adolescents were generally knowledgeable about the basic principles of sustainable diets but lacked familiarity with the term itself. Environmental impacts of food, such as packaging and transportation (food miles), were more commonly understood than the broader sustainability of diets, such as reducing meat consumption. Many young people prioritized other environmental actions, such as reducing plastic waste and air travel, over dietary changes. (McBey, Rothenberg, Cleland et al., 2024). |
|
Supporting evidence: Stakeholder meetings |
Limited institutional mechanisms exist to incorporate youth perspectives into food and climate policy discussions, despite high climate awareness among younger populations. (Stakeholder Meeting 4). |
|
Supporting evidence: Workshops |
“Messaging – who are the trusted messages? Social media – young people and protein, influencers – do we need to recruit these people?” (Workshop 3). |
|
Raise public awareness of the links between diet and climate change |
Many consumers do not associate meat consumption with climate change, reducing engagement with sustainable dietary changes. Clear communication is needed about the pathway to net zero and the role of diets. |
|
Supporting evidence: Literature review |
Research found that many consumers lack awareness of the connection between meat consumption and climate change. Meat is often viewed primarily through the lens of taste, tradition, or nutrition, with little consideration given to its environmental footprint. As a result, the role of meat production in contributing to greenhouse gas emissions, land use, and biodiversity loss is not widely understood. This highlights the need for targeted public education campaigns to bridge the knowledge gap and promote more climate-conscious dietary choices. (McBey, Watts & Johnstone, 2019). |
|
Supporting evidence: Stakeholder meetings |
– |
|
Supporting evidence: Workshops |
“We advocate strongly for the government to be very clear what the most impactful household choices are that people can take to reduce emissions and being clear that an average reduction of meat and dairy consumption is part of it.” (Workshop 3). |
|
Address misconceptions about alternative proteins |
Widespread misconceptions about lab-grown meat and edible insects hinder their public acceptance as sustainable protein options. |
|
Supporting evidence: Literature review |
Consumer Confidence in Safety and Regulation Cultural Acceptance and Public Perception (Food Standards Agency Scotland (FSAS), 2022). |
|
Supporting evidence: Stakeholder meetings |
Red meat reduction policies may unintentionally drive demand toward other meat products, such as white meat, due to negative perceptions of the healthiness of plant-based alternatives. (Stakeholder Meeting 13). |
|
Supporting evidence: Workshops |
– |
|
Provide practical support for individuals undergoing dietary change |
While policies encourage sustainable diets, they do not provide practical tools like meal plans, recipes, or visual guides to aid consumer transitions. |
|
Supporting evidence: Literature review |
Recommends creating accessible tools—such as recipes, meal plans, visual guides, and infographics—to help translate dietary guidelines into practical, everyday actions. These resources can support individuals in making informed, sustainable food choices by demonstrating how to implement the guidelines in realistic and appealing ways. (Culliford, Bradbury & Medici, 2023). |
|
Supporting evidence: Stakeholder meetings |
– |
|
Supporting evidence: Workshops |
– |
|
Use health-focused messaging to promote sustainable dietary change |
Policies focus on environmental messaging, but emphasising health benefits could be a more effective motivator for dietary shifts. |
|
Supporting evidence: Literature review |
Integrate sustainability into education and school food programmes: Revise school curricula to incorporate up-to-date evidence on sustainable diets, emphasising the connections between food choices, climate action, and health outcomes. Complement this by implementing sustainable and nutritious school meal programs that model environmentally responsible eating habits, helping to normalize healthy, climate-friendly diets from an early age. (McBey, Rothenberg, Cleland et al., 2024). |
|
Supporting evidence: Stakeholder meetings |
Co-benefits of policy alignment: Opportunities exist to align health and sustainability goals, particularly through meat reduction strategies (Stakeholder Meeting 9). |
|
Supporting evidence: Workshops |
“To ensure that an average reduction in meat and dairy consumption is compatible with healthy diets and ideally ensure positive impacts on health and nutrition.“ (Stakeholder Workshop 4). |
|
Tackle misinformation about diet and climate impacts |
Many people doubt that reducing meat consumption is an effective climate action, believing other behaviours (e.g., reducing plastic use) are more impactful. Improved communication and avoiding oversimplification are needed. |
|
Supporting evidence: Literature review |
Increased awareness: Over the last decade, public awareness of sustainable diets and their environmental impacts has grown. However, this increase is uneven across different socioeconomic groups. Persistent barriers: Despite increased awareness, barriers to reducing meat consumption—such as cultural norms, cost, and scepticism about meat alternatives—persist. Dietary change resistance: Many still perceive actions like reducing meat consumption as less impactful compared to other actions (e.g., reducing plastic use). (Cleland, McBey, Darlene et al., 2025). |
|
Supporting evidence: Stakeholder meetings |
– |
|
Supporting evidence: Workshops |
“Misinformation in terms of the public health impacts of changing diets. Communication needs to be clearer. Nuance around processing being seen as unhealthy and organic as healthy.” (Workshop 3). |
|
Reframe public understanding of protein needs |
Public understanding of protein needs is often skewed, reinforcing resistance to reducing meat consumption. |
|
Supporting evidence: Literature review |
Across all stages of the family lifecycle, continued meat consumption was frequently justified by the belief that individuals require nutrients found in meat, such as iron and protein. These nutritional reflections were typically not grounded in scientific evidence but were instead based on ingrained beliefs shaped by social upbringing, rather than informed by alternative or external sources of information. (Kemper, 2020). |
|
Supporting evidence: Stakeholder meetings |
Overemphasis on protein requirements contributes to resistance against reducing meat consumption. (Stakeholder Meeting 2). |
|
Supporting evidence: Workshops |
– |
|
Strengthen consumer awareness of food provenance |
Many consumers are unaware of where their food comes from, weakening narratives around food sovereignty and local sourcing. |
|
Supporting evidence: Literature review |
– |
|
Supporting evidence: Stakeholder meetings |
Consumers often lack awareness of food provenance, challenging narratives around food sovereignty. (Stakeholder Meeting 11). |
|
Supporting evidence: Workshops |
– |
|
Empower consumers to make sustainable food choices |
Providing consumers with the right information and tools can support the adoption of more sustainable eating habits. |
|
Supporting evidence: Literature review |
– |
|
Supporting evidence: Stakeholder meetings |
Encouraging consumers to make informed dietary choices can enhance their ability to adopt sustainable eating habits. (Stakeholder Meeting 1). |
|
Supporting evidence: Workshops |
– |
|
Strengthen proactive public engagement in dietary change efforts |
Providing early, transparent information to shape public discourse and build informed support for food system changes. |
|
Supporting evidence: Literature review |
Reviews research on how providing information about the impact of meat consumption and the benefits of meat substitutes positively affects respondents in China and the US. This information increases their intentions to support meat reduction policies, including more costly measures like a meat tax. (Bryant, Couture, Ross, et al., 2024). |
|
Supporting evidence: Stakeholder meetings |
– |
|
Supporting evidence: Workshops |
“Inoculation-plant information ahead of public debate.” (Workshop 1). |
|
Strengthen public health and policy support for sustainable dietary shifts |
Public health campaigns and food policies lack coordinated efforts to actively promote widespread transitions to sustainable diets. |
|
Supporting evidence: Literature review |
Policy Coordination: Highlights regional land use planning but provides limited discussion on integrating dietary policy into broader climate and health strategies. (Reay, Warnatzsch, Craig, et al., 2020). |
|
Supporting evidence: Stakeholder meetings |
Misalignment between climate, health, and food policies. Current policy frameworks lack coherence, creating conflicting objectives. (Stakeholder Meeting 13). |
|
Supporting evidence: Workshops |
– |
|
Balance individual responsibility with systemic food system change |
Policies often overemphasise personal responsibility for diet change, while systemic food environment shifts are more effective and less stigmatising. |
|
Supporting evidence: Literature review |
Challenges the overemphasis on individual behaviour change as the primary solution to sustainability and public health issues. Instead, it advocates for a shift toward structural and policy-driven approaches that facilitate collective action and address the root causes embedded in social, economic, and environmental systems. By focusing on systemic transformation, such as changes in food infrastructure, regulation, and institutional practices, this approach underscores the need for environments that enable and sustain more equitable and widespread change beyond individual responsibility. (Meyerricks & White, 2021). |
|
Supporting evidence: Stakeholder meetings |
Policies often overemphasize individual responsibility for dietary choices, while structural food environment changes are more effective and less stigmatizing. (Stakeholder Meeting 13). |
|
Supporting evidence: Workshops |
“Current resilience strategies rely on individuals to be able to prepare themselves, rather than creating a robust food system within Scotland.” (Workshop 1). |
|
Encourage social norm-based approaches to dietary change |
Policies do not leverage peer influence to normalise reduced meat consumption and encourage widespread dietary shifts. |
|
Supporting evidence: Literature review |
Reviews interventions aimed at reducing meat consumption, categorising them into personal, socio-cultural, and external factors. Personal interventions include educational campaigns, emotionally framed messages, and skill-building (e.g., vegetarian cooking courses). Socio-cultural factors involve changing social norms and addressing cultural resistance to plant-based diets. Opportunities for promoting social norms around sustainable diets through public campaigns and community programmes. (Kwasny, Dobernig & Riefler, 2022). |
|
Supporting evidence: Stakeholder meetings |
Gender norms influence dietary choices, with meat consumption often associated with masculinity, creating barriers to plant-based diets. (Stakeholder Meeting 1). |
|
Supporting evidence: Workshops |
“Need to make climate-friendly diets the norm? Need long term changes.” (Workshop 1). |
|
Improve understanding of the long-term impacts of dietary shifts |
Most studies focus on short-term dietary changes without exploring the effectiveness of multi-pronged interventions over time. |
|
Supporting evidence: Literature review |
Explores the nutritional and behavioural implications of substituting plant-based proteins for animal proteins in Scotland, using household purchase data. Identifies price sensitivity as a driver of dietary change but does not address long-term behavioural adoption or resistance. (Dogbe, Wang & Revoredo-Giha, 2024). |
|
Supporting evidence: Stakeholder meetings |
– |
|
Supporting evidence: Workshops |
– |
|
Address the prioritisation of cost and convenience over sustainability in food choices |
Sustainability concerns are often secondary to cost and convenience when consumers make food choices. |
|
Supporting evidence: Literature review |
Examined the effects of decreasing meat and dairy intake on nutrient consumption and disease risk among Scottish adults. Although many individuals express genuine concern for sustainability and environmental impact, these values are often compromised by practical considerations, particularly cost and convenience. In everyday decision-making, affordability and ease of access tend to take precedence, revealing a gap between environmental awareness and actionable behaviour. This highlights the need for policies and systems that make sustainable choices more accessible, affordable, and integrated into daily life. (Food Standards Scotland (FSS), 2022). |
|
Supporting evidence: Stakeholder meetings |
– |
|
Supporting evidence: Workshops |
“Inability to pay for things- poverty in working population Hard to get to nutrition when you have long term challenge Need for equipment for prep; time-knowledge-cost No freedom of choice in these circumstances Good food is very inaccessible to those with nothing (not home and skills).” (Workshop 1). |
|
Normalise reduced meat consumption in everyday diets |
The recommended limit of 70g per day for red and processed meat in Scotland is often misinterpreted as a dietary requirement rather than a maximum, which can undermine efforts to normalise lower meat consumption. |
|
Supporting evidence: Literature review |
It is important to emphasise that the UK recommendation of a maximum of 70g/day on average is a recommendation for individuals, not a population average, and a wide range of intakes for red and processed meat has been reported, for example, a range of 0–208g/day in men aged 19–64 years. (Spiro, Hill & Stanner, 2024). |
|
Supporting evidence: Stakeholder meetings |
The recommended 70g per day of red meat is often seen as a dietary requirement rather than a maximum limit, affecting efforts to normalise lower meat consumption. (Stakeholder Meeting 4). |
|
Supporting evidence: Workshops |
“We also find that people are often not very clear about health benefits of a reduction especially in red meat consumption and the role of protein etc…. This is further confused by the NHS recommendation of 70g red meat, which can be misunderstood as a required minimum, rather than a maximum.” (Workshop 3). |
|
Assess the effectiveness of dietary behaviour change campaigns |
Large-scale dietary campaigns often fail to drive change, with community-based, trusted sources being more impactful. |
|
Supporting evidence: Literature review |
Examined how often people seek, trust, and rely on 22 different sources of diet and nutrition information when making dietary changes. While sources like health websites, internet searches, and diet books were most frequently consulted, participants reported the highest trust in nutrition scientists, professionals, and scientific journals. This highlights a disconnect between popularity and trustworthiness. Trust, more than frequency of use, was a stronger predictor of influence on dietary change. Sources deemed less trustworthy were less likely to be relied upon, and seeking information alone didn’t always lead to effective dietary shifts. These patterns varied across sources. (Ruani, Reiss & Kalea, 2023). |
|
Supporting evidence: Stakeholder meetings |
Blanket dietary change campaigns are often ineffective and challenging to evaluate. For greater impact, information should come from trusted, community-based sources. (Stakeholder Meeting 13). |
|
Supporting evidence: Workshops |
– |
|
Evaluate the relative impacts of different behavioural interventions on food choices |
Strategies like calorie labelling have shown limited effectiveness in driving significant dietary change. |
|
Supporting evidence: Literature review |
There are currently no plans to introduce a mandatory eco-labelling scheme, nor is the government set to endorse any existing or new framework. This decision reflects the limited evidence to date that eco-labels significantly influence consumer or business behaviour at the point of sale (Defra, 2024). Nonetheless, similar to the role nutrition labelling has played, eco-labelling could potentially encourage some level of product reformulation by manufacturers. (Spiro, Hill, & Stanner, 2024). |
|
Supporting evidence: Stakeholder meetings |
Behavioural interventions like calorie labelling have limited impact on dietary habits. (Stakeholder Meeting 13). |
|
Supporting evidence: Workshops |
– |
|
Shape food environments to promote healthier and more sustainable choices |
Addressing the knowledge-action gap through nudging strategies and food system interventions. |
|
Supporting evidence: Literature review |
Behavioural nudges, such as making vegetarian options the default choice on menus, have been shown to significantly reduce meat consumption, with studies reporting reductions ranging from 20% to as high as 85%. These strategies work by subtly reshaping consumer choice environments, making plant-based selections more accessible and socially normative without restricting individual freedom. (Mitev, Portes, Osman et al., 2023). |
|
Supporting evidence: Stakeholder meetings |
– |
|
Supporting evidence: Workshops |
“Food environments, choice, nudging?…“Knowledge-action gap.” (Workshop 3). |
|
Promote sustainable everyday eating habits |
Promote practical, habitual dietary shifts that are sustainable and health-supportive over the long term. |
|
Supporting evidence: Literature review |
– |
|
Supporting evidence: Stakeholder meetings |
Encouraging consumers to make informed dietary choices can enhance their ability to adopt sustainable eating habits. (Stakeholder Meeting 1). |
|
Supporting evidence: Workshops |
“Healthy “enough” (vis-à-vis everyday diets).” “Habits of eating.” (Workshop 1). |
|
Rethink policy approaches to dietary change |
Shifting from fear-based, top-down behaviour change strategies to more effective and inclusive policy tools. |
|
Supporting evidence: Literature review |
Examines the comparative evolution of rural development policies and Local Action Groups (LAGs) within a multi-level governance (MLG) framework. It focuses on two UK cases (Argyll and the Islands in Scotland; Coast, Wolds, Wetlands and Waterways in England) and two Italian cases (Delta 2000 in Emilia-Romagna; Capo Santa Maria di Leuca in Puglia). Findings highlight how LAGs’ mechanisms, outcomes, and partnerships vary, but consistently demonstrate that while EU funding and policy frameworks provide critical support, it is the bottom-up leadership of local actors that most significantly drives success in rural development initiatives. (Gargano, 2021). |
|
Supporting evidence: Stakeholder meetings |
– |
|
Supporting evidence: Workshops |
“The tools and language of policy Behaviour change is top-down using fear” (Workshop 1). |
Appendix J: Extended Technological analysis: Areas for further policy development and supporting evidence
|
Key Theme |
Area For Policy Development |
|---|---|
|
1: Data Gaps and Infrastructure for Policy Monitoring | |
|
Develop a comprehensive monitoring framework for sustainable diets |
There is no structured system to track the effects of dietary shifts on emissions, health, food security, biodiversity, and sustainability, limiting policy effectiveness. |
|
Supporting evidence: Literature review |
Lack of Clear Enforcement Mechanisms for Emission Reductions The 30% agricultural emissions reduction target (by 2032) is ambitious, but the text does not specify: How reductions will be enforced (e.g., penalties for non-compliance vs. voluntary incentives). Sector-specific targets for beef, sheep, dairy, and arable farming. How progress will be measured and verified beyond voluntary reporting. Policy Gap: Scotland lacks a detailed, binding framework for ensuring compliance with emission reductions in agriculture. Policy Need: Develop a carbon budgeting system for farms with clear compliance measures, incentives, and accountability mechanisms. Scottish Government, n.d.). |
|
Supporting evidence: Stakeholder meetings |
– |
|
Supporting evidence: Workshops |
“Lack of data. Need to look at what is the actual impact of farming on climate in Scotland – what are the negatives we currently have and then learning from best practise to bring others on that journey. using real Scottish data to drive change. it should go wider than GHGs. its about biodiversity, habitat and plant protection and ecosystem, water use and flood management, soil quality, animal welfare etc. baselining standards – over 170 farms there are some that are already at net zero, or close.” (Workshop 3). |
|
Establish a standardised data infrastructure to support policy integration |
The lack of a unified system to collect, share, and analyse food system data hinders the integration of climate, health, and sustainability goals into policy decisions. |
|
Supporting evidence: Literature review |
Emissions Estimation Uncertainty: The report notes significant variability in greenhouse gas (GHG) emissions estimates for food consumed in Scotland, partly due to differences in accounting for land use change and specific food consumption patterns. Improved data accuracy, especially for children and region-specific consumption, could strengthen policy targeting emissions from specific food groups. Data Gaps in Food Production Origins: The report identifies a need for detailed information on the origins of foods consumed in Scotland. This information is essential for accurately attributing emissions, particularly as some Scottish produce is processed outside Scotland before being reimported for local consumption. Policy could address this by improving traceability in food supply chains Integration of Post-Retail Emissions: Only some models account for emissions from consumer actions, such as energy used in cooking or food waste. Policy could incentivize behaviours that reduce these post-retail emissions, such as promoting energy-efficient cooking practices and reducing food waste at home. (Jaacks, Frank, Vonderschmidt et al., 2024). |
|
Supporting evidence: Stakeholder meetings |
Data for policy tracking: Robust data systems are needed to inform policy decisions and track their effectiveness over time. (Stakeholder Meeting 13). |
|
Supporting evidence: Workshops |
“Within Scottish Government: Make climate & diet part of a Good Food Nation objective. Include dietary change as one of Scotland’s climate goals. Work for better join up across policy areas, work against narrowness. Make this a priority for multiple departments.” (Workshop 4). |
|
Set clear targets and indicators for sustainable diet policies |
The absence of effective metrics makes it difficult to evaluate the impact of policies on health, emissions reduction, and food system sustainability. |
|
Supporting evidence: Literature review |
No Specific Emissions Targets for Dairy Farming Scotland has national climate targets but lacks dairy-specific GHG reduction goals. Policy intervention: Develop dairy sector-specific emissions reduction targets tied to efficiency improvements. Infrastructure and Data Challenges Limited data collection on methane emissions at the farm level makes tracking improvements difficult. Policy intervention: Expand research funding and create national livestock emissions databases. (Ferguson, Bowen, McNicol et al., 2024). |
|
Supporting evidence: Stakeholder meetings |
Measuring dietary change: Identifying effective metrics to measure progress in dietary change is a key challenge. (Stakeholder Meeting 2). |
|
Supporting evidence: Workshops |
– |
|
Enhance monitoring and metrics for agroecological practices |
The absence of clear indicators for assessing agroecology’s environmental, economic, and social performance limits its policy integration, while the lack of systematic data collection prevents evidence-based policymaking for sustainable farming transitions. |
|
Supporting evidence: Literature review |
Limited Research on the Economic Viability of Agroecology No comprehensive cost-benefit analysis of agroecological farming vs. conventional farming in Scotland. Need for financial models that demonstrate the long-term resilience benefits of agroecology. Set Clear Targets for Sustainable Diets and Agriculture Introduce climate-aligned dietary guidelines, including reduced red meat and dairy consumption. Support horticulture expansion to increase domestic fruit, vegetable, and pulse production. Align agroecology with Scotland’s Circular Economy and Net-Zero strategies (Lozada & Karley, 2022). |
|
Supporting evidence: Stakeholder meetings |
– |
|
Supporting evidence: Workshops |
“Lots of local producers-just not captured in the figures. Recognising the informal sectors e.g., farm shops, allotments.” (Workshop 1). |
|
Improve industry accountability through transparent data reporting |
The absence of clear industry accountability frameworks hinders progress toward aligning food production and retail practices with dietary and sustainability targets. |
|
Supporting evidence: Literature review |
Data and Accountability: The need for robust, accessible data and transparent mechanisms to hold stakeholders accountable is underdeveloped in policy. (Scottish Government, 2024). |
|
Supporting evidence: Stakeholder meetings |
Data for policy tracking: Robust data systems are needed to inform policy decisions and track their effectiveness over time. (Stakeholder Meeting 13). |
|
Supporting evidence: Workshops |
– |
|
Develop robust metrics for tracking dietary change and emissions reduction |
The absence of standardised indicators makes it difficult to assess the climate impact of dietary shifts and monitor progress toward emissions reduction goals. |
|
Supporting evidence: Literature review |
Variability in Emissions Estimates Across food based dietary guidelines (FBDGs): Highlights the wide range of emissions reductions attributed to different dietary guidelines, which vary due to methodological differences across models. This variability can make it challenging to establish standardized or widely accepted climate benchmarks within FBDGs, which may complicate Scotland’s efforts to adopt clear, evidence-based climate targets. (Tregear, Morgan, Spence et al., 2024). |
|
Supporting evidence: Stakeholder meetings |
Measuring dietary change: Identifying effective metrics to measure progress in dietary change is a key challenge. (Stakeholder Meeting 2). |
|
Supporting evidence: Workshops |
– |
|
Expand broadband access to enable precision agriculture |
Poor broadband connectivity in rural areas restricts the adoption of connected animal sensors and precision farming technologies, reducing agricultural efficiency. |
|
Supporting evidence: Literature review |
Connectivity and Infrastructure Barriers to Digital Agriculture: Many rural areas lack broadband access, preventing the adoption of connected animal sensors and precision agriculture. Investment in rural digital infrastructure is essential. (Scottish Government, 2023). |
|
Supporting evidence: Stakeholder meetings |
– |
|
Supporting evidence: Workshops |
– |
|
2: Agricultural Emissions and Climate Reporting | |
|
Improve agricultural emissions reporting and accountability |
Existing reporting mechanisms do not adequately integrate climate-smart farming technologies, reducing accountability and hindering emissions tracking. |
|
Supporting evidence: Literature review |
Monitoring and Accountability: Annual progress reporting on agricultural emissions reductions must be strengthened. Policies should integrate climate-smart farming technology adoption into monitoring frameworks. (Scottish Government, n.d.) |
|
Supporting evidence: Stakeholder meetings |
– |
|
Supporting evidence: Workshops |
– |
|
Establish a standardised carbon footprinting and emissions tracking system |
The inconsistent use of carbon calculators and the absence of methane emissions data at the farm level, combined with inconsistent GHG emissions calculation methods, make it difficult to assess and mitigate agricultural emissions effectively. |
|
Supporting evidence: Literature review |
Developing a standardised carbon footprinting tool Farmers currently use multiple, inconsistent carbon calculators. Recommendation: Create a universal farm carbon calculator, integrated with existing farm software and databases. Nourish Scotland (2021). |
|
Supporting evidence: Stakeholder meetings |
– |
|
Supporting evidence: Workshops | |
|
Reassess methane accounting methods and livestock emissions data |
Methane calculations should be reviewed due to methane’s short atmospheric half-life. There is also a need to ensure fair assessments of emissions from lamb and beef production, particularly in extensive grazing systems. |
|
Supporting evidence: Literature review |
– |
|
Supporting evidence: Stakeholder meetings |
– |
|
Supporting evidence: Workshops |
“Need to review data that exists e.g. lamb emission data – lamb is just below beef in terms of emissions, which is unusual as they are the most extensively reared. Environmental impact takes into account amount of land you are using and in NZ where herd size is bigger but they are confined to smaller areas and use hard feed, and somehow they are more emission friendly? it seems Scotland is penalised for highland roaming. i think we need to get a new calculation for this.” (Workshop 3). |
|
Define specific emissions reduction goals for beef production |
While Scotland has national emissions targets, it lacks sector-specific goals for beef production, a major contributor to agricultural emissions. |
|
Supporting evidence: Literature review |
No Sector-Specific GHG Reduction Targets for Beef Farming While Scotland has national emissions targets, no specific reduction goals exist for beef production. Policy intervention: Develop beef-sector-specific climate goals, aligning with methane reduction strategies. (McNicol, Bowen, Ferguson et al., 2024). |
|
Supporting evidence: Stakeholder meetings |
– |
|
Supporting evidence: Workshops |
– |
|
Develop a centralised database for methane efficiency traits in livestock |
Unlike Ireland’s cattle breeding data system, Scotland lacks an integrated tool to track genetic progress in methane reduction, limiting breeding efficiency. [13] |
|
Supporting evidence: Literature review |
Scotland lacks a centralised database for methane traits in livestock, like the Irish Cattle Breeding Federation (ICBF). Integration with existing breeding tools like ScotEID and EGENES is needed to track genetic progress, alongside cross-country collaboration to enhance data sharing and breeding efficiency (Jenkins, Herold, de Mendonça et al., 2024). |
|
Supporting evidence: Stakeholder meetings |
– |
|
Supporting evidence: Workshops |
– |
|
Increase farmer awareness and uptake of precision livestock farming (PLF) technologies |
Many farmers do not view PLF tools as effective for reducing greenhouse gas emissions, limiting their adoption despite proven environmental benefits. |
|
Supporting evidence: Literature review |
Many farmers do not perceive PLF tools as effective greenhouse gas (GHG) reduction strategies, despite their proven benefits, limiting adoption. Policy intervention: Increase extension services, training programs, and peer-to-peer learning initiatives. (Ferguson, Bowen, McNicol et al., 2024). |
|
Supporting evidence: Stakeholder meetings |
– |
|
Supporting evidence: Workshops |
– |
|
Enhance technological capacity for supply chain resilience against climate disruptions |
The potential of technology to improve the resilience of food supply chains against climate-related disruptions remains underutilised. |
|
Supporting evidence: Literature review |
– |
|
Supporting evidence: Stakeholder meetings |
Technology for Supply Chain Resilience: The potential of emerging and existing technologies to strengthen the resilience of food supply chains in the face of climate-related disruptions remains significantly underexplored and underutilised. Digital tools, data analytics, automation, and innovations offer opportunities to improve monitoring, forecasting, and responsiveness across the supply chain. However, their application in building climate resilience is still limited, and greater attention is needed to scale up these solutions and integrate them into policy and practice. (Stakeholder Meeting 8). |
|
Supporting evidence: Workshops |
– |
|
3. Food Consumption and Emissions Attribution Issues | |
|
Improve food consumption data accuracy for policy evaluation |
High-emission foods like meat and dairy are often underreported in dietary assessments, limiting the accuracy of policy evaluations. |
|
Supporting evidence: Literature review |
Recognising underreporting issues, especially for high-emission foods like meat and dairy, could guide improvements in dietary assessment methods Underreporting in Food Consumption Data: Recognizing underreporting issues, especially for high-emission foods like meat and dairy, could guide improvements in dietary assessment methods. Policies might encourage better data collection and reporting to ensure more accurate emissions assessments and tailored dietary interventions. (Jaacks, Frank, Vonderschmidt et al., 2024). |
|
Supporting evidence: Stakeholder meetings |
– |
|
Supporting evidence: Workshops |
– |
|
Enhance food origin tracking for accurate emissions attribution |
The absence of comprehensive tracking for imported and processed Scottish foods makes it difficult to develop precise climate policies. |
|
Supporting evidence: Literature review |
Need for comprehensive information on the origins of foods consumed in Scotland to improve emissions accounting. The absence of detailed data, particularly for Scottish produce that is processed abroad and reimported, hinders accurate emissions attribution and the development of effective climate policies. (Jaacks, Frank, Vonderschmidt et al., 2024). |
|
Supporting evidence: Stakeholder meetings |
– |
|
Supporting evidence: Workshops |
“Scottish solutions and data are needed to tackle climate change in Scotland. We need national data and should stop using international data for GHGE and water use for our modelling.” (Workshop 1). |
|
Increase the granularity of Scotland’s net-zero emissions data |
Scotland’s emissions tracking system focuses on high-level data without accounting for regional variations, reducing policy precision. |
|
Supporting evidence: Literature review |
Need for comprehensive information on the origins of foods consumed in Scotland to improve emissions accounting. The absence of detailed data, particularly for Scottish produce that is processed abroad and reimported, hinders accurate emissions attribution and the development of effective climate policies Data Gaps in Food Production Origins: The report identifies a need for detailed information on the origins of foods consumed in Scotland. This information is essential for accurately attributing emissions, particularly as some Scottish produce is processed outside Scotland before being reimported for local consumption. Policy could address this by improving traceability in food supply chains. (Jaacks, Frank, Vonderschmidt et al., 2024). |
|
Supporting evidence: Stakeholder meetings |
– |
|
Supporting evidence: Workshops |
– |
|
Assess the sustainability impacts of plant-based alternatives |
Clear methodologies are required to compare the sustainability of plant-based meat alternatives with traditional meat products. |
|
Supporting evidence: Literature review |
– |
|
Supporting evidence: Stakeholder meetings |
Assessing Sustainability of Plant-Based Alternatives: Robust and transparent methodologies are urgently needed to assess the sustainability of plant-based meat alternatives in comparison to conventional meat products. Current assessment approaches often vary widely in scope and metrics, making it difficult to draw consistent conclusions about environmental, nutritional, and socio-economic impacts. Developing standardised frameworks would enable clearer comparisons, guide consumers and policymakers, and support innovation in the alternative protein sector. (Stakeholder Meeting 13). |
|
Supporting evidence: Workshops |
– |
|
Use digital tools to promote local, ethical, and sustainable food choices |
Encourage consumers to connect with local suppliers and assess animal welfare and product quality through observable online rating systems. |
|
Supporting evidence: Literature review |
– |
|
Supporting evidence: Stakeholder meetings |
– |
|
Supporting evidence: Workshops |
“Use digital shopping to encourage people to find and use local suppliers of animal produce and check welfare/quality – like a Tripadvisor score.” (Workshop 1). |
|
Expand infrastructure and technical support for local food systems |
There is inadequate policy support for expanding infrastructure and providing technical assistance to scale up local and regional food production. |
|
Supporting evidence: Literature review |
There is currently a lack of dedicated funding mechanisms or targeted incentives to support the scaling up of low-carbon technologies within food production and processing. This gap limits the widespread adoption of innovations that could significantly reduce greenhouse gas emissions across the sector. Without strategic investment and policy support, many promising technologies remain at the pilot or early adoption stage, limiting their potential to contribute to national climate goals and a more sustainable food system. (Sovacool, Bazilian, Griffiths et al., 2021). |
|
Supporting evidence: Stakeholder meetings |
– |
|
Supporting evidence: Workshops |
– |
Appendix K: Extended Legal analysis: Areas for further policy development and supporting evidence
|
Key Theme |
Area For Policy Development |
|---|---|
|
1. Regulatory Gaps in Sustainable Food Systems and Supply Chains | |
|
Strengthen regulation and incentives for low-carbon food production |
There are no targeted resources, tax benefits, or regulatory measures to encourage low-carbon food production, limiting sustainability efforts. |
|
Supporting evidence: Literature review |
Lack of specific policies to incentivise low-carbon food production or regulate high-emission food products. The absence of targeted subsidies, tax benefits, or regulatory measures limits the transition to more sustainable food systems and weakens efforts to reduce the environmental impact of food production and consumption.
(Milner, Green, Dangour et al. (2015). |
|
Supporting evidence: Stakeholder meetings |
– |
|
Supporting evidence: Workshops |
– |
|
Enhance the polluter-pays principle and support for sustainable farming |
Inadequate enforcement of environmental accountability and limited financial support for farmers transitioning to sustainable practices slow climate-resilient food system reforms. |
|
Supporting evidence: Literature review |
Enforcement of the polluter-pays principle[14] remains inadequate, with limited financial incentives and regulatory measures to ensure industry accountability. Additionally, there is insufficient support for farmers transitioning to environmentally sustainable practices, limiting progress toward a more climate-resilient food system. (Food Farming & Countryside Commission (FFCC), 2023). |
|
Supporting evidence: Stakeholder meetings |
– |
|
Supporting evidence: Workshops |
– |
|
Ensure fair and transparent supply chains |
Weak regulations allow power imbalances between large corporations and small producers to persist, reinforcing supply chain inequalities and environmental harm. Regulating supply chains avoids the barrier of relying on voluntary behaviour change. |
|
Supporting evidence: Literature review |
Regulatory gaps constrain efforts to ensure fairness and transparency in supply chains, particularly in addressing power imbalances between large corporations and small producers. Weak enforcement of fair practices within the food supply chain sustains inequalities and contributes to environmental harm. (Food, Farming and Countryside Commission (FFCC), 2024). |
|
Supporting evidence: Stakeholder meetings |
– |
|
Supporting evidence: Workshops |
– |
|
Expand the reach of the Good Food Nation (Scotland) Act |
The GFN Act primarily governs public sector food policies but lacks mechanisms to regulate supermarkets, food manufacturers, and large-scale agricultural producers. |
|
Supporting evidence: Literature review |
Limited Leverage Over the Private Sector: The GFN Act focuses primarily on public sector food policy but does not impose obligations on supermarkets, food manufacturers, or large-scale agricultural producers. Without mandatory private sector participation, major food system emissions and supply chain issues may remain unaddressed. (Brennan, 2023). |
|
Supporting evidence: Stakeholder meetings |
– |
|
Supporting evidence: Workshops |
– |
|
Clarify the role of carbon markets in agriculture |
Farmers struggle to engage in carbon markets due to unclear regulations, unstable pricing, and a lack of standardised methodologies. |
|
Supporting evidence: Literature review |
Scottish farmers have limited engagement with carbon markets due to a lack of standardised methodologies, clear regulations, and stable pricing mechanisms. This uncertainty prevents broader participation, reducing opportunities for farmers to benefit financially from carbon sequestration efforts and limiting the agricultural sector’s contribution to climate mitigation. (Baker, Conquest & Moxey, 2023). |
|
Supporting evidence: Stakeholder meetings |
– |
|
Supporting evidence: Workshops |
– |
|
Enhance retailer accountability in a sustainable food system |
Retailers are not required to report Scope 3 emissions from the products they buy and sell, limiting accountability for sustainability impacts. |
|
Supporting evidence: Literature review |
Regulatory Influence and Future Expectations: (Baker, Conquest & Moxey, 2023). |
|
Supporting evidence: Stakeholder meetings |
– |
|
Supporting evidence: Workshops |
– |
|
Support local and regenerative food production |
Local food systems face barriers such as limited land and sea access and complex licensing requirements that disadvantage smaller producers. |
|
Supporting evidence: Literature review |
– |
|
Supporting evidence: Stakeholder meetings |
– |
|
Supporting evidence: Workshops |
“Access to land, access to seas, complex licensing systems that play into the hands of multinational corporations who have the means and expertise to complete these.” (Workshop 1). |
|
2: Regulation of Food Marketing, Composition, and Consumer Information | |
|
Strengthen regulation of unhealthy food promotions |
Weak marketing rules allow unhealthy food advertising that worsens health inequalities. Stronger regulation and fiscal measures are needed to shift sales toward healthier, sustainable options. |
|
Supporting evidence: Literature review |
Impact of food promotions on diet: Unhealthy foods are heavily promoted, influencing consumer choices and increasing the purchase of unhealthy items. Children in lower-income areas are more exposed to unhealthy food marketing and have higher childhood obesity rates. Cost-of-living pressures have made nutritious food less affordable, worsening dietary inequalities. Weak oversight of marketing and promotional strategies for less healthy food options allows widespread exposure, particularly in vulnerable communities. This lack of regulation risks exacerbating health inequalities by reinforcing dietary patterns linked to poor health outcomes. (Public Health Scotland (PHS), 2024). |
|
Supporting evidence: Stakeholder meetings |
– |
|
Supporting evidence: Workshops |
– |
|
Establish nutritional and environmental standards for out-of-home food |
The absence of comprehensive regulations for food sold in restaurants, cafes, and takeaways weakens policy efforts to promote healthier and more sustainable dietary habits. There is also a lack of sufficient planning levers to regulate food outlets. |
|
Supporting evidence: Literature review |
Sustainability Measures: There is a lack of policies addressing the environmental impacts of takeaway packaging and food delivery systems. Nutritional Standards for Out-of-Home (OOH) Foods Regulation of high-calorie, high-salt, and high-sugar foods sold out-of-home remains limited. Promotion Regulation Oversight of promotions for less healthy food options—particularly in quick service restaurants (QSRs)—is weak. Equity in Access Current policies do not adequately ensure that healthier OOH food options are affordable and accessible for lower-income communities. (Food Standards Scotland (FSS), 2021b). |
|
Supporting evidence: Stakeholder meetings |
– |
|
Supporting evidence: Workshops |
– |
|
Mandate reformulation requirements for unhealthy foods |
The reliance on voluntary industry commitments for food reformulation weakens public health efforts, as there are no legal obligations for reducing unhealthy ingredients. |
|
Supporting evidence: Literature review |
The UK and Scottish Governments rely on voluntary industry measures for food reformulation, with no legal obligation for companies to reduce unhealthy ingredients. This weakens efforts to improve public health and reduce diet-related diseases, leaving progress dependent on inconsistent voluntary compliance. Lack of mandatory reformulation: The UK and Scottish Governments support mandatory reformulation only if voluntary efforts fail. Currently, there is no legal requirement for companies to reformulate unhealthy foods. (Obesity Action Scotland (OAS), 2019). |
|
Supporting evidence: Stakeholder meetings |
– |
|
Supporting evidence: Workshops |
– |
|
Implement carbon footprint labelling for food |
There are currently no mandatory requirements for carbon footprint labelling on food products, which limits consumers’ ability to make informed, low-emission dietary choices. |
|
Supporting evidence: Literature review |
Regulation and Accountability (Climate Change Committee, 2020). |
|
Supporting evidence: Stakeholder meetings |
– |
|
Supporting evidence: Workshops |
– |
|
Ensure the right to adequate nutrition |
Dietary policies must uphold human rights by ensuring all populations, particularly marginalised communities, have equitable access to nutritious food. |
|
Supporting evidence: Literature review |
– |
|
Supporting evidence: Stakeholder meetings |
Ensuring the right to adequate nutrition: Issues surrounding the right to adequate nutrition, particularly for marginalized communities, have been highlighted. Dietary policies must align with human rights obligations to ensure equitable access to nutritious food for all populations. (Stakeholder Meeting 4). |
|
Supporting evidence: Workshops |
– |
|
Address gaps in food standards, including non-dairy milk fortification |
The absence of mandatory fortification for non-dairy milk alternatives raises concerns about potential nutritional inadequacies for populations relying on these products as dairy substitutes. |
|
Supporting evidence: Literature review |
– |
|
Supporting evidence: Stakeholder meetings |
Gaps in food standards, including non-dairy milk fortification: There are gaps in regulatory frameworks related to food standards, including the lack of mandatory fortification for non-dairy milk alternatives. This may contribute to nutritional inadequacies among populations that rely on these products as dairy substitutes. (Stakeholder Meeting 13). |
|
Supporting evidence: Workshops |
– |
|
3: Legal and Governance Barriers to Policy Implementation | |
|
Align devolved and UK dietary policies |
Legal complexities in the division of powers create difficulties in developing cohesive dietary and climate policies across the UK, leading to inconsistencies between devolved administrations and the UK Government. |
|
Supporting evidence: Literature review |
– |
|
Supporting evidence: Stakeholder meetings |
Challenges in aligning devolved and UK dietary policies: Aligning diet and climate policies between devolved administrations (e.g., Scotland) and the UK Government presents legal challenges. The division of powers complicates the development of cohesive dietary policies, resulting in inconsistent approaches across the UK. (Stakeholder Meeting 9). |
|
Supporting evidence: Workshops |
– |
|
Manage legal risks from dietary shifts |
There are concerns that dietary guidelines encouraging reduced meat and dairy consumption could lead to nutrient deficiencies, creating potential legal risks if public health is adversely affected. |
|
Supporting evidence: Literature review |
– |
|
Supporting evidence: Stakeholder meetings |
Legal risks from unintended nutritional deficiencies: Stakeholders have raised concerns about potential legal risks if dietary guidelines inadvertently lead to health issues, such as nutrient deficiencies. This is particularly relevant with blanket recommendations to reduce meat and dairy consumption without considering adequate nutritional alternatives. (Stakeholder Meeting 9). |
|
Supporting evidence: Workshops |
– |
|
4: Administrative and Market Challenges in Sustainable Agriculture | |
|
Evaluate the effectiveness of carbon audits in agriculture |
While carbon audits for farmers are encouraged, they lack enforceable targets or evidence of significant emissions reductions, making them more bureaucratic than effective. |
|
Supporting evidence: Literature review |
Limited Impact of Carbon Audits: There is no clear evidence that carbon audits have led to significant emission reductions in Scottish agriculture. Administrative Burden and Costs: Farmers must provide carbon data to multiple buyers, leading to high reporting demands. Uncertainty About Market-Based Carbon Incentives: Voluntary carbon credit markets are underdeveloped, leading to hesitation from farmers. (Baker, Conquest & Moxey (2023). |
|
Supporting evidence: Stakeholder meetings |
– |
|
Supporting evidence: Workshops |
– |
Appendix L: Extended Environmental analysis: Areas for further policy development and supporting evidence
|
Key Theme |
Area For Policy Development |
|---|---|
|
1. Land Use, Tenure, and Access for Sustainable Agriculture | |
|
Improve land tenure security for community food systems |
Temporary land use agreements create instability for community gardens, while bureaucratic hurdles, insecure tenure, and limited land availability continue to restrict community food-growing efforts, despite the Community Empowerment (Scotland) Act 2015.[15] |
|
Supporting evidence: Literature review |
While the importance of secure land access for community gardens is acknowledged, the prevalence of temporary land use arrangements creates instability, limiting long-term planning and the sustainability of community-based food initiatives. (Meyerricks, & White, 2021). |
|
Supporting evidence: Stakeholder meetings |
– |
|
Supporting evidence: Stakeholder workshops |
“Need community to take on land and community need funding to do so. There is something about learning from crofting practices in the context of a sustainable food system. Some challenges are related to the free market and the crofting regulation, the right to buy and the lack of regulation.” (Workshop 4). |
|
Support new agroecological farmers with land and financial access |
New farmers struggle to secure land and financial resources, limiting the transition to sustainable farming systems. |
|
Supporting evidence: Literature review |
Limited access to secure land tenure and financial support remains a significant barrier for new entrants into farming, even though this group is often more open to adopting agroecological and sustainable practices. Addressing these access issues is essential to enable a new generation of climate-conscious farmers. (Lozada & Karley, 2022). |
|
Supporting evidence: Stakeholder meetings |
Land ownership and affordability issues: Competition and rising land costs are pricing out farmers, limiting opportunities for sustainable agricultural transitions. (Stakeholder Meeting 1). |
|
Supporting evidence: Stakeholder workshops |
– |
|
Strengthen strategic oversight for land use change |
Unregulated forestry expansion risks displacing agricultural land without a public interest test or requirements for net carbon sequestration assessment. |
|
Supporting evidence: Literature review |
Market-driven forestry expansion poses a risk of displacing agricultural land without adequate strategic oversight. There is currently no requirement for a “public interest test” to assess the impact of afforestation on farming, nor a mandate for large forestry projects to demonstrate long-term net carbon sequestration, limiting sustainable land use planning and balance between agriculture and forestry. (Scottish Government, 2024). |
|
Supporting evidence: Stakeholder meetings |
– |
|
Supporting evidence: Stakeholder workshops |
“The ARCZero[16] pilot in Northern Ireland showed that well managed grazing land stores more carbon in the soil and promotes more biodiversity than forestry. SG should account for this when planning future goals for land use.” (Workshop 3). |
|
Develop alternative land use strategies for rough grazing areas |
There is no clear plan for repurposing Scotland’s vast rough grazing areas, limiting sustainable land management and biodiversity conservation. Livestock farming remains the only viable option for some land. |
|
Supporting evidence: Literature review |
There is no clear plan for repurposing the 60% of Scotland’s rough grazing land that may not be suitable for crop production. The absence of strategic land use policies limits opportunities for sustainable land management, climate mitigation, and biodiversity conservation. (Kennedy, Clark, Stewart et al., 2025). |
|
Supporting evidence: Stakeholder meetings |
– |
|
Supporting evidence: Stakeholder workshops |
“Reducing livestock farming=farming concerns and biodiversity concerns-livestock farming only viable thing for certain land.” (Workshop 1). |
|
Recognise the role of grazing land in carbon sequestration and biodiversity |
Well-managed grazing land can sequester more carbon and support greater biodiversity than forestry, which should be considered in Scotland’s land-use planning. |
|
Supporting evidence: Literature review |
Afforestation projects are viewed as potentially effective measures for carbon sequestration and therefore climate change mitigation. Much of the land in temperate regions suitable for afforestation is used for agriculture and consequently afforestation of farmland is frequently proposed. Landowners are commonly reluctant to sacrifice fertile land for purposes other than food and feed production. In Scotland’s uplands, grazed pastures are a common land use that could be put under pressure by demands for woodland planting. This chapter explores how farm woodland planting for carbon sequestration and biofuel production affects livestock output. The concepts presented show that there is great potential for integrating agriculture and forestry to achieve environmental benefits without compromising productivity. (Beckert, Smith & Chapman, 2016). |
|
Supporting evidence: Stakeholder meetings |
– |
|
Supporting evidence: Stakeholder workshops |
“The ARCZero pilot in Northern Ireland showed that well managed grazing land stores more carbon in the soil and promotes more biodiversity than forestry. SG should account for this when planning future goals for land use.” (Workshop 3). |
|
Balance livestock reduction with land use trade-offs |
With more than 85% of Scottish farmland classified as ‘Less Favoured Area’ (LFA) and often unsuitable for plant protein cultivation, reducing livestock could disrupt feed crop markets and impact farm incomes. Addressing mixed messages on CO₂ impacts of extensively grazed grasslands versus forestry is needed while ensuring food production resilience in a changing climate. |
|
Supporting evidence: Literature review |
Afforestation is widely regarded as a promising strategy for carbon sequestration and climate change mitigation. However, much of the land suitable for afforestation in temperate regions is already used for agriculture, leading to frequent proposals for planting trees on farmland. Landowners are often hesitant to give up productive land traditionally used for food and feed. In Scotland’s uplands, where grazed pasture is common, there is particular concern about the impact of woodland expansion on livestock farming. This article examines how woodland planting for carbon sequestration and biofuel production can influence livestock output. It highlights the significant potential for integrating forestry and agriculture in ways that deliver environmental benefits without reducing overall productivity. (Beckert, Smith & Chapman, 2016). |
|
Supporting evidence: Stakeholder meetings |
– |
|
Supporting evidence: Stakeholder workshops |
“Don’t forget >85% of Scottish farmland is ‘less favoured’ so mostly cannot be used to grow plant proteins. Also poor quality crops are sold for animal feed. A reduction in livestock will impact this market and reduce farm incomes.” (Workshop 3). |
|
Acknowledge biophysical limitations on agriculture |
Natural constraints determine what crops can be grown in different regions, influencing food production and sustainability. |
|
Supporting evidence: Literature review |
In Scotland, natural constraints such as climate, soil quality, altitude, and water availability significantly shape agricultural decisions—especially regarding what crops can be grown and where. These physical limitations, in combination with socio-economic and policy considerations, influence both food production capacity and agricultural sustainability. This article reviews how regional climate and infrastructure influence where legumes can be grown, considering their role in sustainable agriculture. (Wiltshire, Freeman, Willcocks et al., 2021). |
|
Supporting evidence: Stakeholder meetings |
– |
|
Supporting evidence: Stakeholder workshops |
“Biophysical constraints on what can be grown. Lobby groups preserving industries. Reputation of Scottish food producers.” (Workshop 1). |
|
2. Areas for Policy Development in Agricultural Climate Mitigation and Adaptation | |
|
Expand agricultural climate policies beyond food emissions |
Current policies measure emissions from specific foods but fail to consider how broader agricultural and food system changes could drive more effective climate mitigation. |
|
Supporting evidence: Literature review |
Current assessments highlight emissions from specific foods but fail to consider the broader impact of systemic shifts in agricultural practices and food system transformations, limiting opportunities for comprehensive climate mitigation strategies. (Nneli, Revoredo-Giha & Dogbe, 2023). |
|
Supporting evidence: Stakeholder meetings |
– |
|
Supporting evidence: Stakeholder workshops |
– |
|
Avoid rebound effects in precision livestock farming (PLF) efficiency gains |
Productivity improvements from PLF could inadvertently lead to higher total emissions if herd expansion offsets efficiency gains. |
|
Supporting evidence: Literature review |
There is a risk that productivity gains from Precision Livestock Farming (PLF) could lead to an overall increase in total emissions, as improved efficiency per unit could be offset by herd expansion. (McNicol, Bowen, Ferguson et al., 2024). |
|
Supporting evidence: Stakeholder meetings |
– |
|
Supporting evidence: Stakeholder workshops |
– |
|
Strengthen policy responses to climate risks in agriculture |
Policies fail to address the financial impact of extreme weather on farming, lack strategies for water conservation, and fail to enforce improved soil management. |
|
Supporting evidence: Literature review |
Current policies fail to sufficiently address the financial impacts of extreme weather on agriculture, particularly within the beef sector. Water scarcity risks remain unmanaged due to the lack of strategies for rainwater capture and groundwater conservation. Furthermore, despite increasing concerns about soil degradation, there are no clear policy requirements for improved soil management. SAC Consulting, n.d.). |
|
Supporting evidence: Stakeholder meetings |
Fragmented governance across Government divisions, leading to disjointed approaches to diet, climate, and health policies: Disjointed approaches to diet, climate, and health policies due to lack of coordinated structures. (Stakeholder Meeting 3). |
|
Supporting evidence: Stakeholder workshops |
– |
|
Integrate grazing land’s role in biodiversity and carbon capture |
Policies fail to recognise the role of sustainable grazing systems in enhancing biodiversity and carbon sequestration. |
|
Supporting evidence: Literature review |
Current policies do not fully acknowledge or integrate the potential role of grazing systems in supporting biodiversity and carbon sequestration. The absence of clear guidelines or incentives limits opportunities to enhance sustainable grazing practices that contribute to environmental and climate goals National Farmers Union Scotland (NFUS , n.d.). |
|
Supporting evidence: Stakeholder meetings |
– |
|
Supporting evidence: Stakeholder workshops |
– |
|
Address localised environmental impacts of intensive farming |
While overall farming emissions may appear low across systems, specific regions with intensive agricultural activities experience significant localized environmental impacts. |
|
Supporting evidence: Literature review |
The use of nitrogen fertilisers in agriculture is a major contributor to nitrous oxide (N₂O) emissions — a potent greenhouse gas. Reducing these emissions poses a significant global challenge, and doing so requires reliable methods for estimating N₂O output across different farming systems. Scientists commonly rely on biogeochemistry (BGC) models to estimate soil-based emissions, but these models can present difficulties: large-scale studies often lack local detail, while small-scale studies may not be widely applicable. In addition, many studies provide limited information on the reliability of their results. This study took a novel approach by focusing on eastern Scotland, a region with well-documented farming practices. Researchers applied a robust BGC model to assess N₂O emissions, nitrate (NO₃) leaching, and nitrogen uptake in crops such as barley, wheat, and oilseed rape. The high-resolution modelling revealed that although eastern Scotland’s intensive cropping systems are efficient, they exhibit elevated N₂O emission intensities per hectare, largely due to the use of synthetic fertilisers. (Myrgiotis, Williams, Rees et al., 2019). |
|
Supporting evidence: Stakeholder meetings |
Localised environmental impacts of emissions-intensive farming: While the overall environmental impact of farming may be low when averaged across systems, localized environmental impacts can be significant, particularly in areas with emissions-intensive agricultural activities. (Stakeholder Meeting 8). |
|
Supporting evidence: Stakeholder workshops |
– |
|
Balance environmental goals with socioeconomic sustainability |
Environmental goals can coexist with job security and the sustainability of fragile communities, but current policy does not always reflect this balance. |
|
Supporting evidence: Literature review |
This study explores what it means to be a responsible farm business in today’s world, especially after COVID-19 and Brexit. Being a responsible business involves tackling poverty, inequality, and environmental harm, but different groups—like customers, the media, and global organisations—have different views on what that means. Farms are part of a complex rural system filled with tensions and contradictions. This research focuses on how farmers can understand and manage these tensions to run more responsible and sustainable businesses. Using data from one farm and interviews with five others in the same community, the study develops a framework to show how farmers balance competing demands. It looks at how farmers’ entrepreneurial mindset (or Entrepreneurial Orientation, EO) is shaped by experience and changing times. The study argues that good policies, informed by real-world farming experiences, can support responsible decision-making. (Smith, Duncan, Edward et al., 2021). |
|
Supporting evidence: Stakeholder meetings |
– |
|
Supporting evidence: Stakeholder workshops |
“An acknowledgement that supporting our environment does not need to come at the expense of jobs or supporting fragile communities.” (Workshop 1). |
|
Understand the complexities of meat production and consumption |
Variations in where meat is produced and consumed across the UK and internationally influence territorial emissions differently, shaping the regional impacts of dietary change. |
|
Supporting evidence: Literature review |
Highlights how territorial specialization in meat production and consumption across Europe creates uneven nitrogen and GHG burdens. Countries like the UK import much of their animal feed and meat, meaning dietary change impacts vary regionally based on local vs outsourced emissions. (Billen, Aguilera, Einarsson et al., 2021). |
|
Supporting evidence: Stakeholder meetings |
– |
|
Supporting evidence: Stakeholder workshops |
“Complexities around where especially meat is produced and where it is consumed across the UK and internationally. Changes in diet in different regions will affect territorial emissions differently.” (Stakeholder Workshop 3). |
|
Rethink agri-tech and livestock systems for sustainability |
Climate and environmental protection should focus on transforming food systems and reducing reliance on livestock feed crops like soy, rather than shifting all animals indoors. |
|
Supporting evidence: Literature review |
UK livestock systems rely heavily on imported soy. Holmes proposes a shift to legume-supported agroecology, noting this is better for soil, climate, and economic sovereignty. (Holmes, 2018). |
|
Supporting evidence: Stakeholder meetings |
– |
|
Supporting evidence: Stakeholder workshops |
“Issues around agri tech and comms being that to protect climate and the environment, we do not need to put all animals indoors, rather than addressing the food systems themselves and the dependence we have on livestock production and the impact of feeding livestock e.g. deforestation to produce soy that only goes to feed livestock.” (Workshop 3). |
|
Ensure net zero goals align with animal welfare standards |
Efforts to intensify food production for climate targets must not compromise animal welfare standards. |
|
Supporting evidence: Literature review |
Climate change affects agriculture in many different ways. The CCC advises that adaptation efforts should address risks such as flooding, heavier rainfall, and rising temperatures. It also recommends improving the sector’s ability to handle new challenges like shifting pest and disease patterns. These climate impacts will affect multiple areas of farming. For instance, both crops and livestock will face heat stress and a rise in pests and diseases due to warmer, wetter conditions. Waterlogged soils can reduce crop yields, while livestock may suffer from lower welfare, affecting fertility and production, such as milk yields. (Jenkins, Avis, Willcocks et al., (2023). |
|
Supporting evidence: Stakeholder meetings |
– |
|
Supporting evidence: Stakeholder workshops |
“Animal welfare: Intensifying food production to meet net zero goals could come at the expense of animal welfare.” (Workshop 4). |
|
3: Environmental Impacts and Food Systems | |
|
Address the environmental impact of ultra-processed foods |
Ultra-processed foods, including those from large fast-food chains, often have a high environmental footprint and run counter to principles of sustainable food culture. |
|
Supporting evidence: Literature review |
Global food systems are increasingly unsustainable for human health, the environment, animal welfare, biodiversity, food culture, social equity, and small-scale farmers. While the high consumption of animal-based foods has long been seen as a key contributor to this problem, growing attention is now being paid to the role of ultra-processed foods (UPFs). This review examines whether concerns about UPFs are valid. It looks at the typical ingredients and additives in UPFs and the farming practices used to produce them. The findings show that UPFs are closely linked to emissions-intensive farming and livestock systems, and they negatively impact nearly every aspect of food system sustainability. This is largely due to the global spread of cheap, highly processed products made from low-cost ingredients. Although UPFs generally have lower greenhouse gas emissions than conventional meat and dairy, especially those low in animal-based calories, reducing UPF consumption—without replacing it with other energy-dense foods—can still lead to significant environmental benefits. To improve sustainability, the review recommends cutting back on UPFs and shifting toward minimally processed, seasonal, organic, and locally produced foods. (Fardet & Rock, 2020). |
|
Supporting evidence: Stakeholder meetings |
Environmental impact of ultra-processed foods: Ultra-processed foods, such as those offered by large fast-food chains (e.g., Domino’s Pizza), are often inconsistent with the principles of a sustainable food culture due to their high environmental footprint. (Stakeholder Meeting 11). |
|
Supporting evidence: Stakeholder workshops |
– |
|
Strengthen food system resilience against climate and supply risks |
Enhancing farm resilience to weather extremes, power disruptions, and crop variability by reconsidering older, more resilient crop varieties, reducing dependence on a limited range of crops, and growing local varieties better suited to conditions. Greater policy focus is needed on planning and adaptation strategies to support farmers facing climate-related disruptions. |
|
Supporting evidence: Literature review |
Report on analysis highlighting how much of Scotland’s traditional food culture connected to native plants has been lost, with significant implications for climate resilience. This loss is rooted in historical events such as land enclosure, the Highland Clearances, the dissolution of monasteries, and strict regulation of industries like whisky production, which excluded traditional local ingredients. These processes contributed to the erasure of knowledge and practices around native plants—plants that could play a vital role in adapting to climate change through low-input, locally adapted food systems. (Lozada & Karley, 2022). |
|
Supporting evidence: Stakeholder meetings |
– |
|
Supporting evidence: Stakeholder workshops |
“We need to be more resilient. Even weather concerns > power cuts etc. can have a huge impact on the resilience of a farm. A bad year of weather patterns can completely skew a crop trial, and previous variants that we maybe do not use/grow as much now, could potentially be more resilient. Poultry especially is much more sensitive to zoonotic/disease strains around years ago.” (Workshop 3). |
How to cite this publication:
Nash, N. (2025) Analysing a Complex Policy Landscape: Diet and Climate in Scotland’, ClimateXChange. DOI
© The University of Edinburgh, 252025
Prepared by University of Bath on behalf of ClimateXChange, The University of Edinburgh. All rights reserved.
While every effort is made to ensure the information in this report is accurate, no legal responsibility is accepted for any errors, omissions or misleading statements. The views expressed represent those of the author(s), and do not necessarily represent those of the host institutions or funders.
This work was supported by the Rural and Environment Science and Analytical Services Division of the Scottish Government (CoE – CXC).
ClimateXChange
Edinburgh Climate Change Institute
High School Yards
Edinburgh EH1 1LZ
+44 (0) 131 651 4783
If you require the report in an alternative format such as a Word document, please contact info@climatexchange.org.uk or 0131 651 4783.
A second in-person workshop (Workshop 2) was planned in Edinburgh on Friday 24th January but had to be cancelled at the last minute due to disruption from Storm Eowyn. ↑
The ‘Less Favoured Area’ classification refers to areas where farming is naturally more difficult due to factors like poor soil, steep slopes, or challenging climates. See: Less Favoured Area Support Scheme (Scotland) Regulations 2001 (S.S.I. No. 50 of 2001). | FAOLEX ↑
Initial steps that can be taken using existing structures or resources. Includes scoping, piloting, stakeholder engagement, and coordination-building activities. ↑
Actions that require broader collaboration, policy alignment across sectors, or formal programme development. Often builds on earlier pilots or evidence. ↑
Longer-term actions requiring legislative change, significant investment, or systemic redesign. These aim to embed lasting transformation. ↑
Scotland’s Agricultural Reform Programme, particularly through greening payments and conditional support mechanisms (e.g., environmental conditionality), does include some financial incentives intended to encourage more sustainable production. ↑
Food Data Transparency Partnership – GOV.UK ↑
Food labelling is largely governed by UK-wide legislation. ↑
About the Scottish Government’s National Adaptation Plan (SNAP3) – Adaptation Scotland ↑
Meeting 14 involved a group meeting rather than a one-to-one meeting, in which multiple participants contributed to the conversation. ↑
Note: The online workshops omitted the future scenarios activity due to time constraints but retained the same core activities and objectives. ↑
NB: Workshop 2 was cancelled the day before it was due to take place because of Storm Eowyn. ↑
Integrated cattle breeding data systems allow the tracking of genetic traits of livestock over time. This can include feed efficiency and methane emissions. By linking performance data to genetic profiles, these systems support selective breeding for lower-emission animals. Without such a tool, it is more difficult to monitor and accelerate genetic progress toward reducing methane emissions from cattle in a coordinated and efficient way. ↑
An environmental policy principle stating that those who produce pollution should bear the costs of managing it to prevent damage to human health or the environment. ↑
The Community Empowerment (Scotland) Act 2015 is legislation that aims to strengthen the voices of communities in decisions that affect them. It gives communities additional rights and opportunities to influence public service provision, ownership of land and buildings, and participation in local planning and decision-making to improve outcomes. See Community Empowerment (Scotland) Act 2015 ↑
The ARCZero project is a farmer-led initiative in Northern Ireland aimed at measuring and managing carbon flows within agricultural systems to achieve net-zero carbon emissions. Comprising seven diverse farms, the project employs advanced techniques such as detailed soil sampling and LiDAR scanning to assess both greenhouse gas emissions and carbon sequestration capacities. By establishing comprehensive carbon balance sheets, ARCZero empowers farmers to implement informed strategies that reduce emissions and enhance carbon storage, contributing to more sustainable and climate-resilient farming practices. ↑
Research completed: March 2025
DOI: http://dx.doi.org/10.7488/era/6006
Executive summary
Our soils underpin all nature-based systems and are therefore vital for Scotland’s communities and economy. From food security to transport disruption through events such as landslides, the climate resilience value of investing in healthy soils is recognised by the Climate Change Committee as a priority adaptation area for Scotland.
There are many risks threatening Scottish soils across different soil types and land covers. However, unlike air and water, there is no single overarching soil policy providing security and governance for Scottish soils. Soils are spread across multiple policy divisions, which results in a lack of cohesive leadership in tackling threats to soils.
The aim of this route map is to consolidate the challenges of managing soil systems to develop an overarching strategy for delivering improved soil security across Scottish landscapes.
Key points
There is increasing awareness of the important role soils play for our communities, economy and environment in terms of their ability to contribute to climate regulation, flood resilience, food security, support forestry and assist biodiversity. This is reflected in recent policy updates which have outlined objectives that directly relate to improvements in soil health and/or security, such as:
- The 3rd Scottish National Adaptation Plan 2024-2029
- Scotland’s National Peatlands Plan
- National Planning Framework 4
- UK Forestry Standard 5th Edition
- The Vision for Agriculture and Agricultural Reform Programme (Agriculture and Rural Communities Act)
- Scottish Biodiversity Strategy to 2045
This route map acknowledges the challenges of addressing soil security in a policy context due to the absence of an overarching soil-specific policy. Currently actions to support soils sit across different policies, which focus on different environmental challenges at different scales. Nevertheless, this route map outlines opportunities to gain value and effectiveness through better coordination of existing activities and policy delivery.
Next steps
Objectives
This route map recommends six objectives for Scotland to achieve our vision of ‘thriving soils for Scotland’s communities, economy and environment’:
- Lead – Inspire and collaborate to deliver the vision for Scottish soils
- Protect – Prevent further damage to soils
- Restore – Repair damaged soils
- Enhance – Strengthen soils for the future
- Evidence – Data, knowledge and wisdom relating to Scottish soils
- Mobilise – Communicate, engage and participate towards thriving soils in Scotland
Next steps
We recommend that the delivery of the route map is supported by ensuring the following:
- Scottish Government support the vision and common goals through the allocation of a soil policy group to lead and coordinate the delivery of this route map
- Baseline Scottish soil status to ascertain a starting point towards ‘thriving’ soils
- Collaboratively identify specific cross-sectoral actions to protect, restore and enhance Scottish soils
- Mobilise actions into practice through bespoke implementation plans
- Monitor progress and review future developments
Glossary
|
Brownfield |
Refers to land that was previously urban/used for industry |
|
Ecosystem services |
Ecosystem Services are the direct and indirect contributions ecosystems (known as natural capital) provide for human wellbeing and quality of life. This can be in a practical sense, providing food and water and regulating the climate, as well as cultural aspects such as reducing stress and anxiety. In fact, the vast number of services provided by ecosystems can be categorised into more manageable groups of: provisional; regulating; cultural; and the slightly more ambiguous, supporting services |
|
Eutrophication |
The gradual increase in the concentration of nutrients (e.g. nitrogen and phosphorus) in aquatic ecosystem |
|
Flood resilience |
Reduce the intensity and/or frequency of flood events and severity |
|
Food security |
To have reliable access to a sufficient quantity of affordable and nutritious food |
|
Greenfield |
Land that was previously undeveloped |
|
Net zero |
A target of completely negating the amount of greenhouse gases produced by human activity, to be achieved by reducing emissions and implementing methods of absorbing carbon dioxide from the atmosphere |
|
Peatlands |
Peat is a defined soil type that has at least 50 cm organic horizon. NatureScot use Ramsar Convention’s definition of peatland: “Peatlands are ecosystems with a peat deposit that may currently support vegetation that is peat-forming, may not, or may lack vegetation entirely”. The Soil Survey for Scotland states that peat should have an organic layer or layers that exceed 50 cm deep from the soil surface and an organic matter content of more than 60% |
|
Peaty soils |
Also known as organo-mineral soil. Mineral soils with a peaty topsoil which is less that 50cm thick |
|
Soil acidification |
Soil acidification is the lowering of soil pH due to an accumulation of hydrogen ions. Soils with a pH of less than 5.5 is considered ‘acidic’ |
|
Soil carbon sequestration |
Soils are in constant exchange with the atmosphere, they take in carbon (via photosynthesis, root exudates and the addition of organic material) and release carbon (through gas emissions associated with respiration or indirectly via leaching). Where a net gain in carbon exists the soils are considered to be ‘sequestering’ carbon |
|
Soil carbon stock |
The mass of carbon stored in the soil organic matter per area |
|
Soil compaction |
Soil compaction is a form of physical degradation in which soil biological activity and soil productivity for agricultural and forest cropping are reduced, resulting in environmental consequences away from the immediate area directly affected |
|
Soil contamination |
Soil contamination is when soil is polluted, implying the presence of chemicals and materials in soil that have a significant adverse effect on any organisms or soil functions. Soil pollutants include inorganic and organic compounds, some organic wastes and the so-called “chemicals of emerging concern” |
|
Soil degradation |
Soil degradation is defined as a change in the soil health status resulting in a diminished capacity of the ecosystem to provide goods and services for its beneficiaries |
|
Soil enhancement |
To improve soil health and resilience beyond its current state and the status quo |
|
Soil erosion |
The process of soil being gradually damaged and removed by the waves, rain, or wind, or the result of this process |
|
Soil function / functionality |
Soil Functions refers to the six key roles that soil plays in an ecosystem, including providing a medium for plant growth, supplying and purifying water, recycling nutrients and organic wastes, serving as a habitat for soil organisms, modifying the atmosphere, and acting as an engineering medium |
|
Soil health |
Physical, biological and chemical status of a soil which provide a range of soil functions (e.g. see AHDB Soil health card for Scotland) |
|
Soil management |
A collective term describing a range of practices and applications imposed on soils for a range of purposes (e.g. food production, ground preparation, urban developments, conservation etc) |
|
Soil organic matter |
Soil organic matter means all living, or once-living, materials within, or added to, the soil. This includes roots developing during the growing season, incorporated crop stubble or added manures and slurries |
|
Soil protection |
Refers to activities which contribute to the prevention of degradation of soils |
|
Soil resilience |
Soil’s ability to buffer or ‘cope’ with stresses such as extreme weather events and disturbance |
|
Soil restoration |
To ‘repair’ soils which have been degraded in some way (e.g. physical, chemical or biological degradation) |
|
Soil risks/risks to soil |
Refers to the threats and pressures on soils which may negatively impact on soil health and/or soil function |
|
Soil salinisation |
Soil salinization is a term that indicates the phenomenon or process of accumulation of water-soluble salt in the soil |
|
Soil sealing |
The covering of soil (generally with an impermeable material) for the purpose of urban development |
|
Soil security |
To defend soils from risks, dangers and threat that jeopardise its existence, health and function |
|
Soil structure |
The spatial arrangement of soil particles (called aggregates, crumbs, blocks or peds). Soil structure influences soil functions, for example how water moves through it and susceptibility to degradation such as erosion and compaction. |
|
Water storage capacity / water retention |
The ability for soils to hold or maintain water |
Why we need a “Soil Route Map for Scotland”
We rely on soils for a wide range of primary functions (outlined on Scotland’s Soil Website) as soils underpin all nature-based systems and are therefore core to Scotland’s communities, environment and economy (Figure 1). However, evidence shows that there are several risks associated with poor soil management which threatens the future security of Scottish soils.
The costs associated with inaction are not only related to environmental impacts as these risks cascade to include socio-economic repercussions. Baggaley et al (2024) estimated that compacted soils in Scotland costs land managers up to £49 million annually in yield losses, up to £26 million per year in additional fertiliser use required to operate with compacted soils and up to £76,000 per household from increased flood risk and insurance claims attributed to soil compaction and soil sealing (Appendix A). From food security to transport disruption (e.g. through landslides) the climate resilience value of investing in healthy soils is recognised by the Climate Change Committee as a priority adaptation area for Scotland.

Risks to soil health
There are many risks to the health and security of our soil systems. Table 1 shows risks outlined in the Scottish Soil Framework (2009) and more recently in the Environmental Standards Scotland (ESS) report (2024). This highlights that many of the risks identified in the Scottish Soil Framework (2009) are still prevalent and jeopardising the future security of Scotland’s soils and the many functions they provide (Figure 1).
Table 1. Risks to Scottish soils outlined in the Scottish Soil Framework (2009)
Threats to soils ranked across all soil functions at the national scale (1 being the highest risk) and the Environmental Standards Scotland Report (2024), ranking threats as high, medium or low based on a set of criteria.
|
Scottish Soil Framework (2009) |
Environmental Standards Scotland Report (2024) | |
|
Climate change impacts on soil |
1 |
– |
|
Loss of organic matter and carbon |
2 |
Medium |
|
Soil sealing |
3 |
Low |
|
Acidification and eutrophication |
4 |
– |
|
Loss of soil biodiversity |
5 |
High |
|
Soil contamination |
6 |
Medium |
|
Soil erosion and landslide |
7 |
High |
|
Pesticide application |
8 |
– |
|
Soil compaction |
9 |
High |
|
Salinisation |
10 |
– |
|
Risks from the inconsistent approaches to data collection and monitoring |
– |
High |
|
Risks from carbon sequestration schemes |
– |
Medium |
|
Water retention/capacity of soils |
– |
Medium |
|
Application of waste to land |
– |
Medium |
|
Landfilling of waste soil |
– |
Medium |
|
Soilborne diseases and pests |
– |
Low |
In terms of prioritising these risks, the two publications suggest different rankings, with the Scottish Soil Framework (2009) listing the impacts of climate change, the loss of organic matter (and carbon), soil sealing and soil degradation from acidification and eutrophication as the top four threats to Scottish soils. The ESS report (2024) ranked soil erosion and landslides, soil compaction, the loss of biodiversity and risks associated with inconsistent approaches to data collection and monitoring as being of highest priority. Opinions from a recent stakeholder workshop (Appendix B) identified soil disturbance, erosion and organic matter loss to be the highest priorities within agricultural and forestry sectors, with soil sealing ranking highest in the urban/built environment sector. At the landscape scale, the lack of a soil-specific policy was noted as the highest risk to soils in Scotland.
Soil degradation
Soil degradation (i.e. soils with diminished functionality) has wide reaching impacts, not just on soil properties, but also in terms of soil functionality and the broad ecological services which soils provide, which can also result in wider economic impacts. For example, impacts of soil degradation can include loss of yields, greater fuel use, loss of land, increased greenhouse gas emissions, increased diffuse pollution and degraded water quality, increased flooding events and flooding intensity and loss or damage to cultural and archaeological sites.
Soil degradation is not limited to one soil or land use type; it cuts across landscapes making the protection of soils challenging as there is no single solution. Therefore, due to the broad range of soil and land use types across Scotland (Appendix B), addressing the risks to soils will require a multi-layered, cross-sectoral approach. Despite this, unlike air and water, there is no single overarching soils policy focus with governance of soils being spread across multiple policy divisions This has resulted in a fragmented approach to tackling the threats to soil resources.
In addition to the wide range of policy objectives which impact on soils, the Scottish Government has a long history of investing in research for future policy development and delivery through the Environment, Natural Resources and Agriculture Strategic Research Programme (SRP) and Centres for Expertise (ClimateXChange, CREW and SEFARI). Through the current SRP (2022-2027), approximately £50 million a year is invested to ensure that ‘Scotland maintains its position at the very cutting edge of advances in agriculture, natural resources and the environment’, with the research of soils being vital across SRP themes (see Appendix D). The protection and enhancement of soils is essential for achieving many of Scottish Government’s policy objectives (e.g. net zero, food security, flood resilience, biodiversity and climate adaptation). However, without an overarching vision for Scottish soils and soil-specific policy, it can be challenging to harness such evidence into impactful implementation to better protect Scottish soils.
The Route Map
The aim of the route map is to consolidate the challenges of managing soil systems (see Appendix E) across multiple land uses and policy themes and to develop an overarching strategy for delivering improved soil security across Scottish landscapes. The route map is also intended to indicate – and drive forward – positive actions towards the protection, restoration and enhancement of Scottish soils while delivering objectives across the nature-based policies highlighted. Specific aims of the route map for Scotland include:
- Review existing soil protection within Scottish policy – to support the development of a route map, current knowledge and public policy-related research is reviewed to ascertain how Scotland’s policy objectives are underpinned by healthy soils and how available knowledge is used in decision making and policy development.
- Develop a framework for the ‘Soil route map for Scotland’ – set a vision to act as a common goal across policy themes and identify objectives which offer an effective pathway for improving soil security in the future.
- Implementation considerations of the ‘Soil route map for Scotland’ – explore potential actions that offer opportunities for delivering the route map objectives across existing policy deliverables.
Soil protection in existing Scottish policy and legislation
Currently, in Scotland the legislative landscape for soils is fragmented across multiple policy divisions within Scottish Government and largely aims to protect other environmental areas (such as water and biodiversity) from poor management of soils, rather than soil itself. However, soil security and soils are referenced across environmental acts, policies and strategies, as outlined below.
The Scottish Soil Framework (2009)
The Scottish Soil Framework (2009) is the most comprehensive, soil-specific document, to date, bringing together the wide range of risks to soils as well as activities that contribute to overcoming these risks through 13 positive soil outcomes, which are;
- Soil organic matter stocks protected and enhanced where appropriate.
- Soil erosion reduced and where possible remediated.
- Soil structure maintained.
- Greenhouse gas emission from soils reduced to optimum balance.
- Soil biodiversity, as well as above ground biodiversity, protected.
- Soils making a positive contribution to sustainable flood management.
- Water quality enhanced through improved soil management.
- Soil’s productive capacity to produce food, timber and other biomass maintained and enhanced.
- Soil contamination reduced.
- Reduced pressure on soils by using brownfield sites in preference to greenfield.
- Soils with significant historical and cultural features protected.
- Knowledge and understanding of soils enhanced, evidence base for policy review and development strengthened.
- Effective coordination of all stakeholders’ roles, responsibilities and actions
A Scottish Soil Framework Progress Report (2013) highlighted developments since the framework’s publication, which highlights a range of activities such as the launch of the Centres of Expertise (2011), the publication of The State of Scotland’s Soil report (2011) and the development of the ‘Scotland’s Soil Website’.
Other key policy documents
A review of where soils are included in a Scottish policy context is outlined in Appendix F. Recent developments in Scottish policies include some focused consideration of soils, such as:
- Scotland’s National Peatland Plan and Peatland ACTION has the vision to see peatlands in a healthy state and widely regarded as resilient by 2030 and the rewards of restoration effort undertaken in previous decades should be evident by 2050 and beyond.
- The National Planning Framework 4 (NPF4) – the policy intent of NPF4-Policy 5 is “to protect carbon-rich soils, restore peatlands and minimise disturbance to soils from development with policy outcomes of a) valued soils are protected and restored, b) soils, including carbon-rich soils, are sequestering and storing carbon, c) soils are healthy and provide essential ecosystem services for nature, people and our economy.”
- Scottish Forestry and UK Forestry Standard (UKFS) 5th edition – chapter 8 provides the ‘UKFS Requirements for Forests and Soil’ and ‘UKFS Guidelines on Forests and Soil’ for soil protection, acidification, contamination, compaction, disturbance, erosion fertility and organic matter (carbon) loss.
- The Vision for Agriculture and Agricultural Reform Programme (Agriculture and Rural Communities Act) – this includes compliance via Good Agricultural and Environmental Conditions (GAECS) in terms of maintaining a minimum soil cover (GAEC 4) to protect soil against erosion after harvest, to protect soil against erosion in certain situations (GAEC 5) and maintaining soil organic matter levels (GAEC 6). In addition to compliance, support has been available since 2022 for soil testing and nutrient management (The National Test Programme, Preparing for Sustainable Farming), which will become a requirement under the Whole Farm Plan introduced to Tier 1 payment requirements, with additional support associated with the introduction of measures contributing to regenerative agricultural practices (including continuous soil cover as outlined in the Agricultural Reform list of measures).
- The 3rd Scottish National Adaptation Plan 2024-2029 – Outlines the importance of soils and the need for further protection as outlined in ‘Nature Connects objective’ for landscape scale approaches “Landscape scale solutions are implemented for sustainable and collaborative land use, including protecting and enhancing Scotland’s soils.”
- The Scottish Biodiversity Strategy to 2045 provides a range soil specific objectives, (particularly objective 3 for agricultural soils) notably the action to “ensure increased uptake of high diversity, nature-rich, high soil-carbon, low intensity farming methods while sustaining high quality food production”. This includes the action to revise and update Scotland’s Soil Framework and action/implementation plan by 2030; to develop evidence-based Soil Health Indicators (SHIs) that can be considered for inclusion in Whole Farm Plans and forest management plans (and monitoring frameworks to assess change in soil health) as well as improving information and guidance for land managers.
There is a wide range of Scottish policy themes that are linked to soil systems across our landscapes (Appendix F), however the list above demonstrates that the protection of soils is concentrated to only a few policies. It is worth noting that despite soil protection being a key objective in some of these strategies and policies, the degree to which implementation into action occurs is often more difficult to assess. The varied challenges associated with soil management are outlined in Appendix D. The Scottish Biodiversity Strategy to 2045 offers the most recent policy area to set out specific objectives relating to soil protection is which, despite some gaps, has made great strides in collaborative discussion and objective setting in terms of soil health, particularly in the agricultural section. .
Soils are also considered within a range of Scottish regulations as outlined on Scotland’s Soil website, with their relevance to soils highlighted in Appendix F:
- The Pollution Prevention and Control (Scotland) Regulations (2012)
- Waste Management Licensing (Scotland) Regulations (2011)
- The Water Environment (Controlled Activities) (Scotland) Regulations (2011)
- Action Programme for Nitrate Vulnerable Zones (Scotland) Regulations (2008)
- Radioactive Contaminated Land (Scotland) (Amendments) Regulations (2007)
- The Contaminated Land (Scotland) Regulations (2005) & Statutory Guidance SE/2006/44
- Conservation (Natural Habitats, &c.) Regulations (1994)
- Sludge (Use in Agriculture) Regulations (1989 and later amendments)
Developing a framework for the “Soil Route Map for Scotland”
The vision for the soil route map is “Thriving soils for Scotland’s communities, economy and environment”. This was developed to encompass the 13 outcomes (listed in Section 4) of the Scottish Soils Framework, which is a comprehensive and representative list of essential soil functions and reflects the contribution soils have to Scottish communities and economic stability.
Six objectives to achieve this vision and address the range of soil risks identified (Table 1) are outlined below (see Figure 2). These objectives are considered essential to support a series of proactive actions which offer practical opportunities for positive change towards soil security in Scotland and are further described in Table 2 below. Appendix G provides further description of approaches taken in the route map development.

Table 2. Description of the six objectives within the Route Map for Scotland
|
Objective |
Description |
|
LEAD (L) |
‘Inspire and collaborate to deliver the vision for Scottish soils’ Provide an overarching vision and evidence-based policy framework to support the various levels of leadership in conducting activities that relate to the protection, restoration and enhancement of Scottish soils, which is mobilised through effective communication, upskilling and engagement. |
|
PROTECT (P) |
‘Prevent further damage to soils’ Ensure soils across Scottish landscapes are safeguarded against further decline in soil health or increase in vulnerability to physical loss from risks outlined in Table 1 |
|
RESTORE (R) |
‘Repair damaged soils’ Provide evidence-based guidance, policies and where appropriate legal pathways to identify and alleviate degraded soils across different land uses in Scotland. |
|
ENHANCE (En) |
‘Strengthen soils for the future’ Recognising change and additional measures to soil improvement above and beyond the status quo, which contribute to future proofing via resilient healthy soils and maximising the potential of our soils for generations to come. |
|
MOBILISE (M) |
‘Communicate, engage, participate’ The delivery of the route map will rely heavily on engaged participation, collaboration and effective communication of the objectives and best practices to achieve them through strengthening delivery mechanisms and processes that will enable actions whether that be via legal pathways or otherwise. This includes participation across policy makers, regulators, researchers, land managers, practitioners, local councils, community groups and land use partnerships working collaboratively to foster positive changes for the future. |
|
EVIDENCE (Ev) |
‘Data-information-knowledge-wisdom’ Utilising data to underpin interdisciplinary and cross-sectoral evidence-led decision making and monitoring progress. Harnessing local and cultural knowledge and wisdom to identify areas of success and potential opportunities for change. |
Potential implementation of the route map
The six key objectives in the route map (Figure 2 and Table 2) provide a framework to address the range of challenges faced by soils and allow flexibility for specific actions within each objective to be applied across temporal and spatial scales. The aim of the route map is to build upon existing progress, to explore opportunities and develop a cohesive (and inclusive) plan which is effectively communicated to drive the delivery of objectives outlined.
The Scottish policy landscape can appear complex as it represents the diverse environmental landscapes of Scotland which are intertwined with our communities and national economy. Therefore, a vital component of successful implementation will be the active engagement and participation across multiple organisations, agencies and industries spanning a range of sectors that represent the cross-sectoral importance of our soils.
The route map proposes a blended approach of strategic policy-led coordination driven by the identified policies which impact on soils (Appendix F) and a risk-led delivery of actions requiring coordination across multiple stakeholders, outlined across the six objectives.
The risks to soils span different land use types providing cross-cutting themes affecting multiple policy areas. A risk-led approach to identifying actions provides an opportunity for policy teams and wider delivery sectors to come together to collaboratively address soil risks which can then be delivered/implemented within existing policy frameworks. As there are specific, place-based risks and pressures associated with soils, it will be important to engage across the range of stakeholders and sectors with soil-related interests, to share experiences and to exchange knowledge towards a better understanding of good soil management specific to that place.
Objective 1 – Leadership (L)
|
Actions to support the implementation of leadership | |
|
L1 |
Assemble a ‘Soil Policy Team’ within Scottish Government |
|
L2 |
Update the Scottish Soil Framework |
|
L3 |
Review the potential of statutory targets to be introduced and potential alignment with EU Soil Monitoring Law and Nature Restoration Law |
Action L1: Assemble a ‘Soil Policy Team’ within Scottish Government
This route map highlights that the legislative landscape for soils is particularly fragmented across different policy areas. To better coordinate the delivery of a cross-sectoral route map for Scottish soils, this action proposes the establishment of a soil-focused policy team to lead in the progression of collaboration to effectively implement objectives and achieve the objectives outlined.
Action L2: Update the Scottish Soil Framework.
This route map provides an initial cross-sectoral framework for integrating soil-focused activities across the current suite of environmental protection policies to safeguard Scottish soils (and wider environment) from future challenges. It is recommended that the Scottish Soil Framework (2009) be updated to contribute to policy priorities including those set out in the 3rd Scottish National Adaptation Plan 2024-2029, Scotland’s National Peatland Plan, National Planning Framework 4 (NPF4), UK Forestry Standard (UKFS) 5th edition, the Vision for Agriculture and Scottish Biodiversity Strategy to 2045 as well as supporting the objectives set out in the recent Natural Environment (Scotland) Bill (2025) and National Flood Resilience Strategy (2024) through soils underpinning nature-based systems (Figure 1) and being central to many nature-based solutions. An updated Scottish Soil Framework will also support progress of the route map objectives and the continuation of the current Soil Policy Working Group (comprising representatives from core Scottish Government policy and analytical services divisions, ClimateXChange, NatureScot, SEPA and Historic Environment Scotland) to allow for regular updates on any developments that influence or impact Scottish soils and to maintain momentum in the delivery of activities relating to soil protection, restoration and enhancement.
Action L3: Review the potential of statutory targets to be introduced and potential alignment with EU Soil Monitoring Law and Nature Restoration Law.
In the ESS report (2024) it was noted that ‘Scotland, formerly a world leader with the Soils Framework, is now falling behind international best practice in this area and should consider mirroring developments in Europe and initiate statutory duties to protect and monitor soils’. It is suggested that statutory duties include mandatory targets for the restoration of drained peatland soil, assessment of contaminated land and soil sealing policy as well as legislative proposals that reflect the proposed EU Soil Monitoring Law and Nature Restoration Law.
Currently, there is no EU-wide soil-specific legislation, however as part of the European Green Deal and EU Biodiversity Strategy 2030 the European Union has developed their EU Soil Strategy for 2030. The Kunming-Montreal Global Biodiversity Framework (GBF) and International Initiative for the Conservation and Sustainable Use of Soil Biodiversity were adopted at the Convention on Biological Diversity COP 15 meeting in December 2022 to support the restoration, maintenance and enhancement of soil health. Following this, the EU proposed a new Soil Monitoring Law in July 2023 to protect and restore soils and ensure that they are used sustainably.
Targets can provide common goals to work towards and benchmarks for assessing progress. However, these need to be in tune with the overarching vision and objectives and in relation to specific soil characteristics and varied land cover types we have in Scotland. Consideration needs to be given to the implications which target-setting can have to avoid unintended consequences. For example, targets for increased soil carbon contents can be set, however managing soil carbon is complex and involves dynamic biogeochemical processes as part of the global carbon cycle (see Appendix H). The simple message of ‘increasing soil carbon’ may lead to management practices which are conducted in goodwill, but whilst leading to improvements in soil health, may also inadvertently lead to increased greenhouse gas emissions from soils.
A workshop was held to review stakeholder views on soil monitoring in Scotland and the potential of EU alignment (Appendix I). The workshop outputs (Appendix I) outline opportunities for Scotland to produce a more appropriate monitoring platform in relation to Scotland’s unique landscape which would better reflect Scotland’s communities, economy and environment (reflected in Objective 5, Action Ev3). Therefore, Action L3 proposes a two-stage review.
- A thorough examination of the principles and objectives of the EU Soil Strategy for 2030 and the proposed EU Soil Monitoring Law.
- An assessment of how these principles and objectives can be best implemented in Scotland. The assessment should consider both the potential for a tailored, bespoke soil protection plan that reflects Scotland’s unique landscape and priorities (as informed by stakeholder engagement) and an evaluation of whether direct alignment with the EU framework would be beneficial and feasible for Scotland. This includes reviewing the range of metrics which may be appropriate to apply as targets within future statutory requirements. Finally, to identify opportunities for Scotland-specific targets offering multiple benefits to soil health with transparency in relation to any trade-offs.
Objective 2 – Protect, Restore and Enhance (PREn)
|
Identify actions needed to protect (P), restore (R) and enhance (En) soil – Identifying what needs to be achieved in practical soil management. | |
|
PREn1 |
Coordinate task groups for shared best practice |
|
PREn2 |
Place-based evidence reviews to identify actions needed |
The route map suggests a collaborative, cross-sectoral approach to mobilise Scottish soil security through evidence-led leadership, soil protection, soil restoration and soil enhancement for the future. To achieve this collaborative approach, Objective 2 suggests the operation of task groups to come together to share knowledge and best practice to protect, restore and enhance soils in relation to risks identified (Section 3).
Action PREn1: Coordinate task groups for shared best practice
Within each ‘task group’ the aim would be to review what activities currently work well and what else can be done to protect, restore and enhance soils in relation to risks identified (Table 1, Section 3). The groups should be forward-thinking and involve appropriate representatives from across different sectors who work with, or are affected by soils (i.e. landowners, practitioners, local authorities, community groups, policy makers, regulators and researchers etc). It is suggested that the task groups have clear terms of reference to outline core purpose, terms for delivery and effective coordination of all stakeholders’ roles, responsibilities and actions. This offers opportunities for co-delivery across various policy objectives to be explored. For example;
Theme 1: Soil sealing and management of soils in construction and urban development
This task group will aim to protect high value soils from sealing and opportunities to reduce, reuse and recycle soil resources. In addition, the task group will share knowledge on soil ‘value’ across land use, land capability and the provision of ecosystem services (and nature-based solutions). Examples of areas the task group could review;
- Review of tools used to assess soil ‘value’ to provide further support for informed decision-making in relation to new developments, such as how soils and other assessments (for example, The Land Capability for Agriculture) are used in Environmental Impact Assessments during the land use planning process. There are opportunities to support soil protection (particularly high carbon soils) and offer further guidance on interpreting soil data/information for improved understanding of soil systems and their value across soil types/land use types and associated wider functions, contributing to more informed decision making.
- Engage with local authorities (e.g. Heads of Planning Scotland) and agencies (e.g. SEPA) to provide support on soil protection, restoration and enhancement (where appropriate) in local development plans and Strategic Environmental Assessments (as outlined by SEPA)
- Promote and support the reuse of valuable soil during developments as outlined by SEPA and review good practice codes (E.g. SEPA Guidance (2017) ; SR/SEPA guidance (2012) and Construction Code of Practice for the Sustainable Use of Soils on Construction Sites, Defra, UK to reduce soil ‘waste’ and limit the quantity of soil going to landfill.
Theme 2: Erosion, compaction and slope stability (physical integrity of the soil)
Review where current guidance exists for supporting the physical integrity of soils as well as the prevention and restoration of soils affected by, or at risk to soil erosion, compaction or diminished stability. Explore where this guidance can be translated across to other land uses/sectors to enable wider application and support co-delivery across sectors. For example, there is guidance relating to soil structure for agriculture in the ‘Valuing your Soils’ brochure, which may offer transferrable knowledge. In addition, the Centres of Expertise have guidance which offers an initial evidence base to develop this action further, such as;
- Assessing the socio-economic impacts of soil degradation on Scotland’s water environment
- Effect of Soil Structure and Field Drainage on Water Quality and Flood Risk
- Soil Erosion and Diffuse Water Pollution Mitigation
Theme 3: Application of chemicals (nutrient management and soil contamination)
Explore best practice to protect soils from contamination resulting from the application of chemicals (e.g. pesticides), poor nutrient management (e.g. synthetic fertilisers), wastes applied (e.g. sewage sludge) and emerging contaminants (e.g. PFAS, microplastics, pharmaceuticals within or additional to those in wastes applied). Review strategies for alleviating soils already affected by contamination as well as identifying soils at future risk and in need of further protection. For example, the task group could review guidance and legislation which exists to protect soils from poor nutrient management and contamination to identify pathways to improve awareness and implementation through existing policies such as;
- Scottish Nitrogen Balance Sheet to reduce excess nitrogen in soil systems which can lead to leached nitrates (affecting waters) and emitted as nitrous oxides (indirect and indirect greenhouse gas emissions). This will be considered in the nutrient management plans to come within the Whole Farm Plan of the Agriculture Reform Program, and nitrogen balance sheet of the Climate Change Plan. How can the implementation of improved nitrogen management be applied more widely across sectors?
- Diffuse pollution prevention (CREW) offers soil management guidance to minimise negative effects on local watercourses
- The James Hutton Institute and Fidra have outlined the impacts of unregulated microplastic, organic chemical and pharmaceutical contaminants on soil health (Re-assessment of environmental risks of sewage sludge, 2024), some of which are currently not regulated or included in soil routine soil testing.
- Environmental Standards Scotland has begun investigatory work on the application and effectiveness of Environmental Protection Act Part 2A. Support local authorities to identify and remediate contaminated soils as part of the Environmental Protection Act, Part 2a
Theme 4: Soils in private sector sustainability plans and corporate responsibility
In recent years there has been growing interest in soil health, soil carbon sequestration potential and the role of soils to support biodiversity and other ecosystem services with respect to sustainability reporting within the private sector. This is a rapidly evolving field as businesses look to evaluate how their business may impact climate and nature as well as identifying risks associated with their business being impacted by adverse climate and nature-related events as outlined in TCFD (Taskforce for climate-related financial disclosures) and TNFD (Taskforce for nature-related financial disclosures). There are a range of emerging tools and guidance available for companies to use which offers opportunities for further guidance in relation to soil management in relation to ecosystem services and how this may link to supply chain resilience, nature-related risks and private investment opportunities for nature restoration and carbon sequestration.
Theme 5: Soil monitoring and metrics
To understand the extent to which soils need protecting and restoring requires, to some extent, the need to monitor soil condition. The ESS report (2024) highlighted the lack of a comprehensive monitoring network in Scotland, resulting in, for example, not knowing whether the number of soil erosion incidences (and magnitude of erosion) is increasing or decreasing. There are a range of approaches to monitoring soils and stakeholders agreed (Appendix I) that to formalise a soil monitoring programme for Scotland, an agreed purpose or set of objectives for the programme going forward is required. This will provide clarity in the specific metrics needed to monitor soil health, risk and resilience in Scotland and inform the development of the soil monitoring framework in terms of establishing baselines, whether targets and benchmarks should be incorporated, the degree to which stratification may be required and how the data could contribute to further research and support evidence-led decision making. This also includes scoping opportunities for the soil monitoring programme to contribute to environmental modelling and amalgamated landscape-scale datasets for wider environmental assessment. Therefore, there is scope to review how best to monitor developments in soil protection, restoration and enhancement across the actions proposed (and appropriate metrics required to do so). This may entail exploring the possibility of a Directive on Soil Monitoring and Resilience to be established as outlined in the ESS report (2024). Initial recommendations in relation to evidencing and monitoring Scottish soils are outlined in Objective 4.
Action PREn2: Place-based evidence reviews to identify actions needed
A core objective of the task groups would be to support the delivery of existing ‘good’ practice and explore potential alignment of these practices across other sectors through place-based, cross-sectoral evidence reviews on appropriate practical measures to protect, restore and enhance soils; as well as exploring mechanisms and pathways to mobilise activities identified. This may include identifying where the underpinning research and practical experiences can be translated to inform task groups on future applications, as well as identifying gaps to explore. For example, there may be gaps or areas for improvement in relation to soil literacy and soil-based skills, which could be addressed so that soils can be better protected, restored and enhanced in the future. Evidence reviews will support mechanisms for decision making and identifying ‘minimum viable product’ that can be deployed to initiate change following the evaluation of impacts (positive and negative) in terms of overall trade-offs.
Objective 3 – Mobilise (M)
Task groups might be put in place to identify pathways for implementation, which use existing avenues in the first instance. The groups could also give insight into new opportunities for the implementation of actions that protect, restore, and enhance soils.
Action M1: Identify existing legal/regulatory avenues for implementing actions for soil protection, restoration and enhancement via implementation plans
Current codes of practice and guidance exist across most sectors. These can be updated with latest evidence providing a streamlined approach to safeguarding soils across sectors. Common language, metrics and messaging will support landscape-scale problem-solving. Therefore, it would be useful to develop and expand good practice guidance across Scottish land uses, to share knowledge and best practice, develop commonalities and ensure alignment across the different sectors, for example:
- Agricultural codes of practice include GAECS, Whole Farm Plan, Prevention of environmental pollution from agricultural activity guidance (PEPFAA), ‘Valuing Your Soils’ brochure
- Explore opportunities to include additional measures to GAECS or the Whole Farm Plan such as tests for ‘soil compaction’ and/or ‘soil degradation’ to be performed utilising evidence and guidance that is already available, in order to identify and alleviate soil compaction and wider degradation. This would also enable the development and promotion of clear guidance for practitioners and support the Scottish Biodiversity Strategy to 2045 recommendation that by 2030 farm and forestry machinery contractors are engaged in ensuring appropriate use of equipment, uptake of decision-making tools and training, to minimise and ultimately avoid compaction damage to soils.
- Review opportunities to harness and better utilise information collated through the Agricultural Reform Programme’s Whole Farm Plan, which includes soil testing alongside carbon and biodiversity audits (and will introduce nutrient plans in 2028). This may include the provision of further advice on how to interpret the information collected into sustainable soil management that supports soil heath and resilience in terms of aligning to the objectives of soil protection, restoration and enhancement. In addition, there may be opportunities for the knowledge gathered from soil testing to be collated in some way, for the purpose of supporting evidence and monitoring (e.g. national soil health status and a Scottish soil monitoring framework) and research (e.g. for national soil mapping, modelling changes and forecasting, better understanding of the interaction between soils and land management practices).
- The Agricultural Reform Programme Tier 4 offers opportunities for mobilising soil protection, restoration and enhancement measures as it refers to additional, ‘complementary’ activities that support good practices, such as developing new skills, knowledge, training and continued professional development, as well as advisory services and business support (advice, knowledge exchange and linkages to wider land management support from Scottish Government officials and/or public partners) and development of measurement tools.
- ‘Valuing Your Soils’ brochure was published in 2015 and provided case studies of effective management related to challenges such as managing soil pH, nutrient management, compaction and drainage. The booklet provided peer-to-peer learning in the form of short, clear messages and on-farm examples (case-studies). An update to the ‘Valuing your Soils’ brochure offers a mechanism for communicating and mobilising recommendations related to the route map’s objectives on soil protection, restoration and enhancement in relation to the risks identified and incorporating recent developments across the agricultural reform programme.
- UK Forestry Standards
- Review whether there is scope to update and widen woodland management guidance and plans (between 2023 and 2030) to reflect greater emphasis on actions that will improve biodiversity including use of elements from ‘Site Condition Monitoring’ and ‘Woodland Ecological Condition’ monitoring as recommended in the Scottish Biodiversity Strategy to 2045.
- There is also scope to include ‘soil compaction’ or ‘soil degradation tests’ as outlined above, which will support the development and promotion of clear guidance for practitioners on soil compaction and ensure that by 2030 farm and forestry machinery contractors are engaged in ensuring appropriate use of equipment, uptake of decision-making tools and training, to minimise and ultimately avoid compaction damage to soils – as recommended in the Scottish Biodiversity Strategy to 2045.
- Peatland Action
- Review whether there is scope to include some protection or further guidance for ‘peaty soils’ in relation to different land uses (notably planning, agriculture and forestry) to enhance the protection of high carbon soils.
- Originally proposed in The Scottish Strategic Framework for Biodiversity, the development of the targeting of peatland restoration for cost-effective delivery (i.e. identifying priority restoration projects) including for greater private investment in peatland restoration. It is also noted that there’s a need to “scale delivery of the Peatland Action programme, restoring the condition of peatlands as a key ecosystem in line with net zero targets and supporting the expansion and upskilling of the peatland restoration workforce”.
- Ensure all peatland restoration projects are completed to the same standards regardless of funding source, including transparency in data collected for defining peatland condition used to calculate baseline emissions.
Action M2: Identify existing and new avenues to implement actions for soil protection, restoration and enhancement via landscape-scale implementation plans
The delivery of actions will need to be coordinated at the landscape-scale and will involve engagement with a range of cross-sectoral stakeholders. To begin this process there are opportunities to engage with existing initiatives, for example Regional Land Use Partnerships, Climate Adaptation Partnerships, Landscape Enterprise Networks and Local Authorities. Developing from M1, action M2 seeks to provide evidence-based opportunities and solutions following the identification of gaps, limitations and barriers to implementation. This will entail reviewing the appropriateness and applicability of solutions across sectors, land cover and soil type (for example where soils are naturally compacted) as well as exploring pathways for effective implementation.
Objective 4 – Monitor (Ev)
|
Actions to support current and future baselining, monitoring and evidencing Scottish soils | |
|
Ev1 |
Baseline soil ‘status’ across land use types of Scotland. |
|
Ev2 |
Identify evidence gaps and future improvement options across different land uses |
|
Ev3 |
Scottish soil monitoring framework |
|
Ev4 |
Evidence-led recommendations for future soil protection, restoration and enhancement. |
To effectively manage our landscapes for improved soil protection and future resilience to risks, there is a need to establish a baseline i.e. what is the current status of our soils.
Several attempts have been made to define a set of metrics to monitor soil physical, biological and chemical properties and wider soil functionality (and ecosystem services). A recent UK workshop on soil monitoring reviewed approaches to soil monitoring across the four nations to evaluate the readiness of soil-assessment-focussed research used within UK policy delivery. The workshop highlighted that despite the challenges of identifying the most appropriate strategy for monitoring such complex systems, “there is great potential value in working to ensure the data collected has a degree of consistency, to support wider targets and understanding of soil heath.” Further research into harmonisation of soil monitoring across the four nations is currently being undertaken to develop this knowledge further.
Action Ev1: Baseline soil ‘status’ across land cover types of Scotland.
The assessment of Scottish soils is currently conducted via a range of mechanisms governed by different policy groups across different land uses (e.g. agriculture, peatland, forestry, planning, construction/development, sport & recreation, protected areas etc). Despite this, there is a general consensus amongst policy makers and academics (Appendix I) that there is a need to progress with the current data and knowledge available to create a baseline of soils in terms of soil health plus its vulnerability to risks and the wider potential impacts on soil function. It is acknowledged that there is already a lot of data available in Scotland and so there is a good base from which to develop baselines and a monitoring framework.
Benchmarking soils are not easy as changes occur at different temporal (and spatial) scales and are so diverse that in turn their value in terms of services they provide, vary significantly across sectors and can be quite subjective. In order to set meaningful targets, and to appropriately benchmark across soil-land use types, a specific soil policy lead (team) should be identified. At present there is no single agreed soil monitoring framework for Scotland and little standardisation or harmonisation of data across different sectors. Therefore, this objective proposes further progression of the Scottish Soil Monitoring Action Plan (2012) which followed the State of Scotland’s Soil Report (2011) as well as developments being made through Scotland’s Strategic Research Programme 2022 to 2027 (Appendix D), Centres for Expertise research (E.g. Monitoring soil health in Scotland by land use category – a scoping study) and National Soil Inventory of Scotland (demonstrated on the Scotland’s Soils website) towards a Scottish Soil Monitoring Framework (which aligns with other UK monitoring schemes where appropriate).
Specifically, this objective calls for some agreement on the most appropriate metrics to baseline soil ‘status’ (an indication of soil health, soil functionality and soil’s vulnerability to risk) and resource a baselining exercise from which changes in soils over time can be assessed.
Action Ev2: Identify evidence gaps and future improvement options across different land uses
This action is to identify evidence gaps with respect to monitoring soil protection, restoration and enhancement across different land uses, as identified by the soil monitoring workshop (Appendix I). For example,
- Review the extent of current soil monitoring and how it may vary across land use types;
- Assess the availability and accessibility of data across sectors and identify where improvements can be made;
- Evaluate methods and metrics used and to study soils and how they may vary across sectors due to the contextual differences in soil functioning and ecosystem services provided. Explore where there are opportunities for some harmonisation to better identify the functions offered by soils at a landscape scale (for example how soils are valued across land uses and better connect land management practices to the potential ecosystem services and nature-based solutions which different soils can provide) and understand the drivers of change in soil management and subsequent soil condition across land uses and sectors;
- Identify priority issues for soil protection, restoration and possible enhancement across landscapes. This includes vulnerable soil types which areas are at most risk of degradation and potential locations for the greatest opportunities for protection, restoration and/or enhancement of soils.
- Establish how are ‘degraded’ soils currently defined across land use/soil types and policy themes and to what extent are Scottish soils degraded;
- Review opportunities to better assess soil health and vulnerability to risks through emerging technologies and novel applications in terms of what they provide/contribute to soil protection, their technical readiness and potential to incorporate/implement into baselining soil protection (e.g. Infra-red, soil acoustics, X-Ray Diffraction, eDNA and microbiome characterisation, LIDAR, AI, etc).
Action Ev3: A Scottish Soil Monitoring Framework
A soil monitoring programme will need clear vision, purpose and objectives to ensure the monitoring programme is transparent, robust, fit for purpose and can be interpreted by wide-ranging audiences. Therefore a ‘task group’ comprising key stakeholders is suggested (see Table 3) to agree objectives and technical content of a monitoring framework as well as terms of reference for the governance and management of a soil monitoring framework. This would develop upon the findings from the ‘Scottish Soil Monitoring Framework’ workshop December 2024 (Appendix I). Other considerations include: deciding on the most appropriate metrics to be included in a monitoring framework, align to policy and reporting needs; encourage data sharing (e.g. personal, research, government and third-party data sources), review what tools/mechanisms/technology are available to assess soils in Scotland and to ensure that any framework is future-proofed. There is also scope to review metrics used across different schemes (e.g. agri-environmental schemes and the measuring, reporting, verification used in carbon schemes) and corporate reporting frameworks (see Table 3) to promote some harmonisation across terminology and approaches used in relation to soils, such as how they are valued and how current soil status and/or soils may change over time are measured and interpreted.
A Scottish soil monitoring framework would directly deliver to the Scottish Biodiversity Strategy objective of “set up monitoring frameworks to assess change in soil health, based on evidence from the Strategic Research Programme (2022-2027)”. The framework will provide evidence to monitor and validate impacts as well as contribute to future evidence-led decision making and inform further research developments.
Action Ev4: Evidence-led recommendations for future soil protection, restoration and enhancement.
Action Ev4 is to review progress towards the objectives set out in the route map. The evaluation of progress should allow for flexibility and adaptability to include future/emerging challenges and pressures which may be environmental (e.g. changing climates and emerging contaminants), industry-related (e.g. market vulnerabilities and/or new environmental reporting requirements) and/or community-based (e.g. workforce needs). Action Ev4 will identify knowledge gaps and opportunities for further information to be collected out with the soil monitoring framework, which would provide valuable insight on the progression to soil security in Scotland. For example, identifying what works and does not work to inform where improvements could be made as well as future research needs across fundamental and applied science. This will enable Scotland to be a leading example in mobilising actions towards thriving soils through effective landscape-scale and cross-sectoral soil protection, restoration and enhancement measures, which support future Scottish communities, the economy and environment.
Conclusions
This route map provides an overview of the range of risks threatening Scotland’s soils and highlights challenges in tackling these risks across different soil types, site characteristics, land use types and a range of cross-cutting policy themes at the landscape scale.
Without co-ordination from an overarching soil policy, it will be difficult to overcome the existing, and future, challenges in deploying actions to specifically target landscape-scale challenges relating to soil security in Scotland.
The route map sets out early thinking about the actions which might be put in place to lead, mobilise and gather evidence, in the first instance. The proposed actions that will protect, restore and enhance soils need to be grounded in the latest evidence, requiring development work by interdisciplinary and cross-sectoral task groups to inform evolving overarching policy.
The 3rd Scottish National Adaptation Plan objective NC2 specifically outlines the need to take actions at the landscape scale, in a collaborative way, in order to protect and enhance Scotland’s soils, increasing their resilience to the impacts of climate change, and land use challenges. Therefore, this route map provides an opportunity to build on the existing progress and momentum that has been developed in specific policy areas, to ensure soil protection, restoration and enhancement of all of Scottish soils.
Appendices
Appendix A Socio-economic impacts of soil degradation
Infographic on the assessment of socio-economic impacts of soil degradation on Scotland’s water environment (Baggaley et al 2024)

Appendix B Soils of Scotland

Soils of Scotland, taken from the Scotland’s Soils Web National soil map of Scotland | Scotland’s soils
Appendix C Summary of Workshop 1 outputs – Identifying risks and opportunities for Scottish soils
The workshop aimed to collate stakeholder views and opinions in relation to current issues and opportunities for soil security in Scotland. In particular, to review changes and developments since the publication of the Scottish Soil Framework (2009).
Participants were grouped (where possible ensuring there was a mixture of research & policy representatives and organisation across groups) and asked to engage with two group activities and two individual activities outlined below;
Group Activity 1:
Each group was asked to discuss and note “What do you think are the key risks/threats for soil security and/or soil health in Scottish” and “What do you think are driving these risks?” relating to the specific land use of the session (Agriculture, Forestry, Urban and Integrated landscapes) and feedback to the wider group.
Individual Activity 1:
Following the group discussion and sharing of key risks, threats to soil and their drivers, participants were given 5 stickers each (black for researchers, red for policy/regulator representatives) to vote on the risk they thought is of most priority. Participants could choose to allocate all of their stickers to one specific risk or to spread them out across a range of risks (providing some indication on the weight of concern across the risks identified). Participants were also encouraged to move around the room and review risk/threats identified by other groups when allocating their stickers.
Group Activity 2:
Each group was asked to discuss and note –
- What policy/regulation is in place (relating to Agricultural soils)? Comments noted on pink post-it notes or directly on the list of policies outlined in the SSF (print out provided)
- What research, evidence, data, guidance is used to support soils in agriculture? Comments noted on blue post-it notes
- What do you think are the key gaps, updates and/or opportunities to better protect soil? Comments noted on yellow post-it notes
Discussions were to be specific to the land use session (Agriculture, Forestry, Urban and Integrated landscapes) with the groups feeding back to the wider group of participants
Individual Activity 2:
Following the group discussion and sharing of key gaps and opportunities to better protect soil within agriculture/forests/urban/landscapes in Scotland – participants were again given 5 stickers each (black for researchers, red for policy/regulators) to vote on the gaps and opportunities they thought is of highest priority. Participants could choose to allocate all stickers to one specific gap/opportunity or spread them out across a range of gaps/opportunities (providing some indication on the weighted priority across gaps/opportunities identified). Participants were also encouraged to move around the room and review gaps/opportunities identified by other groups when allocating their stickers.
Information provided by participants was collected and transcribed.
Summary of workshop outputs:
The top 5 risks and threats to Scottish soils voted for by participants across agriculture, forestry, urban and integrated landscapes.
|
Agriculture |
Forestry |
Urban |
Landscape | |
|
1 |
Soil disturbance, erosion & organic matter loss |
Soil disturbance, erosion & organic matter loss |
Soil sealing & consumption |
Lack of soil-specific governance and policy |
|
2 |
Biodiversity loss |
Biodiversity loss |
Cumulative effects of climate change |
Under valuing soils as an asset/resource |
|
3 |
Soil contamination & environmental pollution |
Climate change (Tree species, pests, weather impacts) |
Soil contamination (historic) |
Difficulty dealing with spatial heterogeneity |
|
4 |
Climate change & extreme weather events |
Wider impacts (loss of peat) |
Soil classification as ‘waste’ going to landfill, limited reuse |
Loss of soil function (via compaction, erosion) |
|
5 |
Lack of collaborative, catchment scale management |
Market pressures & demands (driving specific tree species) |
Undervaluing soil as an asset |
Data available, sharing, accessibility |
The top 5 gaps/opportunities voted for by participants relating to ‘securing Scottish soil’ across the four land use sessions.
|
Rank |
Agriculture |
Forestry |
Urban |
Landscape |
|---|---|---|---|---|
|
1 |
Need for soil governance or policy (joint 1st) |
Better data availability & accessibility |
Review classification of soil as ‘waste’ |
Need for soil governance or policy. Mainstream & update SSF |
|
2 |
Better data availability & accessibility (joint 1st) |
Need for soil governance or policy |
Strategic planning for rainwater runoff |
Better data availability & accessibility |
|
3 |
System scale modelling & visualisation tool |
Re-design of schemes to better mitigate impacts on soil |
Improve enforcement of soil reuse & contamination rules |
Integrate soils focus into place-based approaches |
|
4 |
More peer-to-peer learning |
Improve soil literacy, education & training |
Assess soil data/information is utilised in planning |
Better links across policy areas |
|
5 |
Improve soils literacy |
Include soil assessment in licensing plantations |
Biodiversity (above & belowground) in urban soils |
Spatial data integration |
Appendix D Soil research across Scottish Government’s Strategic Research Programme (2022-2027)
Underpinning evidence for informing policy comes from the Scottish government research programme (SRP). Research relevant to soils occurs in all 6 themes in the SRP and Underpinning National Capacity;
- Theme A: Plant and Animal Health
- Theme B: Sustainable Food System and Supply
- Theme C: Human impacts on the Environment
- Theme D: Natural Resources
- Theme E: Rural Futures
- Theme F: BioSS research
It is also a key part of the work within CxC and CREW for example the project on the socio-economic cost of soil degradation funded through CREW and the Soils Fellowship funded through CxC. Soils research highlighted here includes work on understanding how soils function, how changes can be monitored and translation it so it can be used by a range of stakeholders.
The table below gives an outline of how soils underpin SRP themes as well as where there is ongoing direct soil-focused research
|
Theme |
Topic |
Link to Scottish soils |
|---|---|---|
|
A: Plant and Animal Health |
A1. Plant Disease |
Soil health can influence the prevalence of pests and diseases which may impact plant and animal health. Soils can be a carrier of plant and animal diseases, and soil properties can impact their availability. Soil borne diseases can be a form of soil contamination. |
|
A2. Animal disease | ||
|
A3. Animal Welfare | ||
|
B: Sustainable Food System and Supply |
B1. Crop improvement |
The combination of land management and climate change influences trajectories of soil properties. Long term trials allow the adaptation and mitigation potential, sustainability and trade-offs associated with management practices to be analysed. This includes an exploration of the interactions between management practices and crop cultivars. |
|
B2. Livestock improvement |
Understanding soils in the context of livestock management is important part of understanding feed availability, carbon footprints and how managing livestock is impacted by climate change. | |
|
B3. Improving agricultural practice |
Soils are vital for sustainable productivity and impact food and drink quality and subsequently human nutrition and overall health. | |
|
B4. Food supply and security | ||
|
B5. Food and drink improvements |
Soil contamination including contaminants of emerging concern are held in soils and can be transferred to vegetation and water courses. B5:(Contaminants of emerging concern in the food chain) B6:( Antimicrobial Resistance) | |
|
B6. Diet and food safety |
Soil contamination including contaminants of emerging concern are held in soils and can be transferred to vegetation and water courses. B5:(Contaminants of emerging concern in the food chain) B6:( Antimicrobial Resistance) | |
|
B7. Human Nutrition |
Understanding human nutrition can be linked to the “One Health Concept” but the focus of this work is on human interactions and choices linked to food. | |
|
C: Human impacts on the Environment |
C2. Agricultural GHGs |
Development of options for a monitoring agricultural GHGs within a soil monitoring framework. Interactions between soil health and land management decisions across land covers |
|
C3. Land Use (inc. mapping) |
Soil data and information contributes to wider landscape quality and functioning | |
|
C4. Circular Economy (inc. waste) |
Understanding the circular economy can be linked to issues of “waste to land” and “soil as a waste” but there is no specific work on these here. | |
|
C5. Large Scale Modelling |
Development of options for a soil monitoring framework and the requirements for the incorporation of monitoring data in large scale modelling across landscapes. | |
|
C6. Use of Outdoors and Greenspace |
Understanding the use and value of our outdoors and greenspace is important part of understanding soils in these areas but the focus of this work is on how these areas are used and viewed by people. | |
|
Theme D: Natural Resources |
D1. Air Quality |
Soil is in constant exchange with the atmosphere. Soil impacts air quality through GHGs. Soil health is impacted by air quality |
|
D2. Water (including flooding) |
Nature based solutions – Soil is in constant exchange with the water cycle. Soils can retain water (important for flood resilience), filter and buffer chemicals (important for water quality). Soil leaching and erosion can be problematic for water quality and flood resilience | |
|
D3. Soils |
Soil health can be impacted by management decisions. Understanding soil functional relationships across different land covers supports improved land management decisions. It also identifies trade-offs and win-win scenarios. Understanding forestry systems, soil health and ecosystem carbon dynamics is important for landscape scale decision making. New technologies and analysis protocols can lead to the ability to rapidly sample soils and also identify changes providing indications of soil contamination. Farmer led soil assessments and data provide tools for on farm decision making. Exploring the potential for real time monitoring and whether this can help inform management in cultivated systems. Peatlands are a unique habitat and understanding GHG fluxes, being able to monitor the interactions between these fluxes, water balance and biodiversity under restoration in a changing climate is important for understanding their impacts on wider ecosystem services such as water quality. | |
|
D4. Biodiversity |
Soil biodiversity underpins and can be an indicator of soil functions in both semi-natural and cultivated ecosystems. It therefore supports plant communities and underpins our wider biodiversity and natural capital. Understanding links between soil biodiversity, which can be more responsive than other indicators of soil health, soil functions and wider ecosystem services is important for understanding the potential impacts of climate change and setting baselines that better represent soil functions. | |
|
D5. Natural Capital |
Combining data on climate and soil functions in modelling approaches provides insight into changes in soil vulnerability and risks in a changing climate. Implementation of the LCA in a research platform, enabling it to be updated with new soils and climate data and run with future climate projections to explore consequences on land use. | |
|
Theme E: Rural Futures |
E1. Rural Economy |
Indirect link – soils underpin ecosystem services of rural communities. Healthy soils will contribute to a healthy economy and rural community. |
|
E2. Rural Communities | ||
|
E3. Land Reform | ||
|
Theme F: Vision and Impact : Horizon scanning |
Development of statistical methods to analyse diverse soils data and inform the design of a monitoring framework. (BIOSS statistical research) | |
|
Underpinning National Capacity
|
Soils Data and website |
Combining and Managing soils data in Scotland’s soils database increases its power to do policy relevant research. Translation of soils data and making the data available to a wide range of stakeholders. Including the development of apps. |
|
Soils Archive |
Management of the soil archive allows for the testing of laboratory protocols and the analysis of samples for new indicators | |
Appendix E Challenges to landscape-scale soil management
To effectively as well as stakeholder feedback (link to Workshop outputs) highlighted a range of challenges associated with managing soils in a changing climate, which are summarised below
|
Challenge |
Description |
|---|---|
|
Lack of soil focused governance |
No overarching policy to support accountability and leadership to drive soil protection in Scotland |
|
Climate change |
Soils play a vital role in climate change adaptation and mitigation. Soils are impacted by variable weather patterns and more frequent extreme weather events (flooding and droughts), which can have knock on effects to soil protection, fertility and productivity, flood resilience, water quality etc. |
|
Diversity of Scottish soils |
Scotland’s soils (Appendix B) are diverse, providing a range of specific functions to the wider ecosystem. They include mineral soils which provide fertile land for food production, deep peat storing carbon to depths in excess of 10 meters, soils which are linked to specific land covers and soils where protection is critical to protect wider ecosystem services such as water quality and quantity. However, this variation across soil types, topography, local weather patterns, land capability, land use history and current land use leads to multiple layers of complexity affecting overall soil health and security. This requires the provision of management guidance and a monitoring framework that is fit for purpose across different soil types and land covers. |
|
Multiple demands on Scottish soils |
Balancing the multiple demands on soils requires an assessment of the multiple requirements from our land. For example Scottish food security (e.g The production food contributing to Good Food Nation (Scotland) Act (2022)); the production of raw ingredients for wider produce (e.g. whisky production, which requires agricultural soils for barley production but impacts peatlands via peat burning in some malting processes); production of animal feed; soil sealing to support housing developments, infrastructure and urbanisation; platform for achieving forestry targets. |
|
Defining soil ‘value’ across sectors and land uses. |
How soils are ‘valued’ varies across land uses and soil types. This leads to variable levels of knowledge, evidence and protection across land uses. Soils have a wide range of properties, and not all soils can deliver the same services. There is scope for decision-making and management to be more place-based in relation to specific value and functions provided by different soils. |
|
Defining, measuring and monitoring soil health, security & resilience |
Clearer guidance is required in terms of defining, understanding and measuring various components of soil systems and well as capturing (and understanding) their dynamic nature, such as soil carbon sequestration potential. There is also a need for keeping abreast of UK and wider EU initiatives on defining and monitoring soil health and the indicators that maybe required to align with these. |
|
Linking soil health to functionality |
Soil health indicators are context dependant and are not a one size fits all. It is important to understand how ‘soil health’ should be defined and quantified across different soil and land use types where what the soil can deliver (soil functionality) and the ‘value’ of those functions in those areas also vary. |
|
Soil biodiversity |
Lack of research relating to the role of soil biodiversity in soil health and protection, particularly in terms of monitoring changes in soil biodiversity, which can often require complex measurements. There is however increasing availability of powerful data analysis techniques that allow more detailed interpretation of this kind of data and along with the availability of archived samples the ability to investigate change. |
|
External (industry) challenges |
Markets & supply chains can have direct and indirect influences on our landscapes and soils. With more attention on soil health within corporate nature-related target-setting and reporting, it is important that there are resources available to guide appropriate interpretation and implementation of soil knowledge for future sustainability, environmental net gain, resilient landscapes and carbon management. |
|
Emerging challenges |
It is important to consider emerging and future challenges (e.g. new pollutants, increased demands on our soils etc) which may impact soils. For example, ensuring mechanisms exist which support new challenges being identified, monitored and support exists to protect soils from any negative impacts and future degradation. |
|
Soil literacy |
As soils support a wide range of ecosystem functions across different sectors, there can be some inconsistencies in relation to how soils are described, understood, valued, evidenced and managed. Improved soil literacy across sectors (e.g. clearer definitions, understanding the dynamic nature of soils, interpreting core soil metrics and potential limitations of soil tests/models) will support informed decision making and land management going forward. It is also important to address any skills gaps that may hinder the delivery of healthy, resilient soils across Scotland. |
Appendix F Where soils sit across different policies and legislation
List of policies and their connection to soil protection.
|
Policy |
Are soils mentioned? |
Specific action/objective to address soil risks? | |||||
|---|---|---|---|---|---|---|---|
|
Physical (soil loss) |
Physical / structural (compaction) |
Conservation of OM and C |
Soil biology / biodiversity |
Chemical / contamination) |
General health & protection | ||
|
Y |
Y |
Y |
Y |
Y |
Y |
Y | |
|
Y |
Y |
Y |
Y |
Y |
Y |
Y | |
|
Y |
Y |
Y |
Y |
Y |
Y |
Y | |
|
Y |
Y |
Y |
Y |
Y |
Y |
Y | |
|
Y |
Y |
Y |
Y |
Y |
Y |
Y | |
|
Y |
Y |
Y |
Y |
Y |
Y |
Y | |
|
Y |
Y |
Y |
Y |
Y | |||
|
Building standards technical handbook 2020: domestic, 2020 |
Y |
Y |
Y |
Y | |||
|
Y |
Y |
Y | |||||
|
Y |
Y |
Y | |||||
|
The Action Programme for Nitrate Vulnerable Zones (Scotland) Regulations, 2008 |
Y |
Y |
Y | ||||
|
Environmental Protection Act 1990 – Part IIA Contaminated Land (2006) |
Y |
Y |
Y | ||||
|
The Pollution Prevention and Control (Scotland) Regulations (2012) |
Y |
Y |
Y | ||||
|
Statutory Guidance Waste Management Licensing (Scotland) Regulations (2011) |
Y |
Y |
Y | ||||
|
The Radioactive Contaminated Land (Scotland) (Amendment) Regulations (2007) |
Y |
Y |
Y | ||||
|
The Water Environment (Controlled Activities) (Scotland) Regulations (2011) |
Y |
Y |
Y | ||||
The policies below include reference to soil health more generally:
Appendix G How the ‘Soil Route Map’ was developed
The route map was developed across three key phases:
Phase 1: What do we already know?
The initial phase involved reviewing current policies, regulations, frameworks and evidence (research) across different land uses to ascertain current knowledge as well as policy and/or legislative support in relation to soil health and security in Scotland. This included a review of The Scottish Soils Framework (2009) in terms of developments in knowledge and actions since its publication.
Phase 2: What are the key challenges for securing Scottish soils in a changing climate? Consolidating evidence, guidance and opinions. The second phase of the project comprises the collation of key messages derived from a stakeholder workshop. These discussions included researchers, policy makers, regulators, and representatives from charities and other governmental agencies.
Phase 3: Opportunities and pathways to implementing soil security in Scotland for ‘The Route map’. The development of the proposed route map comprises an iterative process with phase 3 being the refinement of consolidated evidence from phases 1 and 2, into an easy-to-follow report outlining future opportunities, potential barriers/challenges, research gaps and where additional resources may be required.
Stakeholder Engagement
A key component of the route map development is the input from stakeholders across all areas of land management to contribute to- and provide feedback on- the route map development, which included three sets of workshops:
Workshop 1: Identification of the risks and threats to soils across land covers to review the challenges across different land use sectors (August 2024);
Workshop 2: Discuss the development of a soil monitoring framework for Scotland, potential alignment with the EU Soil Monitoring Law and how a monitoring framework could support the objectives within the soil route map (November 2024);
Workshop 3: Refining the vision and objectives of the Scottish soil route map
Within all phases of the route map development, consideration was given to the specific barriers and opportunities outlined in the Scottish National Adaptation Plan 3, particularly the underpinning research and how this is translated into policies and how these can be implemented to protect soils better in the absence of overarching governance relating specifically to soils in a Scottish policy context.
Appendix H The carbon cycle

The carbon cycle from The British Soil Science Society – Science Note on Soil Carbon. Carbon stocks and flows on land and in the oceans (adapted from Jenkinson, 2010). The numbers in bold are stocks in Gigatonnes (Gt) C: those in italics are flows in Gt C per year. Topsoil and subsoil stocks exclude peatlands.
Appendix I Workshop outputs – A Scottish Soil Monitoring Framework (SSMF)
The workshop comprised 4 group activities (outlined below) to discuss the development of a Scottish soil monitoring framework (SSMF) with attendees from across Scottish research institutes, Scottish Government, NatureScot, SEPA and Historic Environment Scotland.
Activity 1: What do we want to achieve with a SSMF? Objective setting – What should be monitored? For example;
- Soil health status – a record of physical, biological, chemical characteristics at a given moment in time and space.
- Soil vulnerability to risk – climate and weather resilience, contamination and diffuse pollution risks, soil compaction, rate of sealing, vulnerability to physical loss (erosion) and destabilisation (landslides)
- Soil functionality – for example how soils are contributing to biogeochemical cycling and climate change, water storage, water quality and flood management and supporting ecosystem biodiversity etc.
- Soils across land use – are the objectives of a SSMF the same across different sectors and land uses? (peatlands, agriculture, forestry, horticulture, urban, recreational and mixed land uses)
- Should a SSMF review compliance, regulation and licensing
- How could a SSMF inform the delivery of policy objectives and support future decision making?
Activity 2: Reviewing the proposed EU Soil Law and how it relates to Scottish data – Presentation by Dr Allan Lilly followed by a group discussion
Activity 3: Reviewing options for;
- Baselining Scottish soils – what for and which metrics would be needed
- Benchmarking – e.g. Is it appropriate to set targets or benchmarks for Scottish soils? What are the Pros and cons
- Stratification of landscapes and data – how to stratify monitoring needs across different objectives and across different soil types and land cover/uses?
Activity 4: Group discussion on how we move from theory to action? Is there sufficient knowledge/data to initiate a SSMF?
Summary of workshop outputs:
Visions of a soil monitoring framework
- To be a leader across the 4 nations of the UK and internationally
- To have sustainable soils in perpetuity
- Linking monitoring to decision making and ultimately evidence-based policy
- A system to be able to respond rapidly to policy questions
Key overarching messages from stakeholders
- Strengthening Scottish soil monitoring with a bespoke soil monitoring framework (SSMF) could make Scotland a ‘global exemplar’
- Reviewing the EU Soil Monitoring Law demonstrates opportunities for Scotland to develop a more advanced monitoring framework that is more appropriate and beneficial for Scottish landscapes and land uses.
- Creating a SSMF that can support and co-deliver across different policy objectives (E.g. Biodiversity strategy, vision for agriculture, flood resilience, SNAP3, NPF4 etc)
- A bespoke SSMF would build a useable resource that supports and informs future evidence-based policy making and delivery (e.g. climate adaptation and mitigation, food security, flood resilience, water quality and air quality) and further utilises historic government funded data/platforms to provide broad scale conclusions and modelling requirements, as well as directing future research and policy needs.
- We are not starting from scratch – Scotland already has a lot of data and knowledge to utilise and build upon. A monitoring framework needs to start with the soil properties and strong conceptual understanding of the soil functions.
- “Let’s get started” – Do what we can with what we have and make improvements over time.
Overall Summary
There was wide support for a soil monitoring framework in Scotland that evidences why and how changes in soils may be occurring, as well as being able to better benchmark progress towards ‘thriving’ soils in Scotland. Stakeholders agreed that there is a significant amount of data already available providing a firm foundation from which to develop a SSMF, but in order to develop this further an overarching objective(s) is needed to inform the design and functionality of a SSMF. Across stakeholders present, there was a strong consistent message that the SSMF needs to be able to answer questions across scales, disciplines, sectors and land uses, as well as not letting financial constraints be a barrier for inaction (particularly when the ultimate costs of soil degradation is taken into account as highlighted by Baggaley et al., 2024). There was significant discussion regarding the types of data that may be required to inform soil health, functionality and security as well as how data could/should be translated to inform decision making i.e. how a SSMF can be designed to facilitates the translation of data into knowledge, action and wisdom. This discussion raised many questions relating to data requirements in terms of identifying appropriate soil metrics which will inform on the current state of soil resources as well as allowing the monitoring of changes in soils over time.
There were a variety of views on the use of a baseline, benchmarks and stratification. There was a view that a baseline of Scottish soils was needed even if it is imperfect. It was clarified that a baseline was just that and that it was not a “Preferred state”. Again, there was much discussion with respect to identifying which metrics/properties should be recorded in a baseline assessment and what is needed in terms of harmonisation of existing data sets to achieve the best possible baseline with the data available. Stakeholders were confident that potentially sufficient data exists to derive one, particularly through the national soil surveys (NSIS1 and NSIS2) and monitoring of forest soils (e.g. Forest soil sustainability, BIOSOIL) but that there is a lack data for soils relating to urban/suburban and recreational soils. However, it was highlighted that NSIS 2 was carried out nearly 20 years ago (2007-2009) and so changes in soil condition may have already occurred.
There was a lot of debate about whether there should be soil targets and benchmarks set. The use of benchmarks to incentivise actions and to better monitor progress was emphasised. Conversely there was concern with respect to identifying suitable benchmarks across different soil types and land uses. This includes the dependency on soil type, land use and management practices and the challenges of what defines a benchmark for multi-functional land uses or how to incorporate potential land use change over time. Stakeholders demonstrated caution with respect to the implementation of benchmarks as it is difficult to predict and manage potential unintended consequences, knock-on effects and trade-offs that target setting could bring. Stakeholders highlighted that there is a risk that benchmarks and targets lead to an oversimplification of soils and therefore the overarching message of holistic soil (and ecosystem) health and resilience may become lost as land managers strive to accomplish specific targets set.
Stakeholders agreed that a SSMF needs to represent all soil and land use types, but that there are challenges relating to how best Scotland’s landscapes should be stratified (e.g. based on soil type, land use (or sector) and/or by management) in the SSMF. It was suggested that a tiered or modular approach may be most suitable to reflect the complexity of Scottish landscapes, allowing for simple actions to be identified from collated data/information (and support adaptive learning over time). The challenge of encapsulating changes in land use and land management within a robust statistical SSMF design was identified at the workshop. Therefore, the potential to stratify or interpretation the SSMF based on soil vulnerability was proposed.
An overarching reaction of the workshop relates to the phrase “perfect is the enemy of good” in terms of there being a consensus that a SSMF is needed/wanted by stakeholders but that current data or knowledge gaps shouldn’t be barriers preventing the development of a SSMF. There was a sense of optimism that an agreement on SSMF objectives, purpose and design (metrics included) can be made to generate a transparent work-in-progress SSMF with its implementation informing future developmental needs. A key factor in implementing a monitoring framework is the presentation of data derived from it and ensuring that information is appropriately and proportionately translated to support the needs across Scottish Government, agencies, researchers, investors and land managers.
References
Agriculture and Horticulture Development Board (AHDB). (2022), Soil Health scorecard approach Sampling protocol and benchmarking tables – Scotland version 1, https://ahdb.org.uk/knowledge-library/the-soil-health-scorecard (Accessed: 9th May 2025)
Baggaley NJ, Fraser F, Hallett P, Lilly, A, Jabloun, M, Loades K, Parker T, Rivington M, Sharififar M, Zhang Z, Roberts M. (2024) Assessing the socio-economic impacts of soil degradation on Scotland’s water environment. CRW2022_04. Centre of Expertise for Waters (CREW). ISBN: 978-1-911706-26-7. https://www.crew.ac.uk/publication/socio-economic-impacts-soil-degradation (Accessed: 9th May 2025)
Environmental Standards Scotland (2024)The risks to Scotland’s soils: a scoping report https://environmentalstandards.scot/our-work/our-analytical-work/the-risks-to-scotlands-soils-a-scoping-report/ (Accessed: 9th May 2025)
Forestry Commission (2023) The UK Forestry Standard – The Government’s approach to sustainable forestry (5th Edition) ISBN: 978-1-83915-021-0 https://assets.publishing.service.gov.uk/media/651670336a423b0014f4c5c0/Revised_UK_Forestry_Standard_-_effective_October_2024.pdf (Accessed: 9th May 2025)
Hough RL (2024). Using new contaminants information to re-assess environmental risks from sewage sludge. Prepared for Fidra (SCIO and Scottish registered charity no.SC043895). file:///C:/Users/nb40022/AppData/Local/Temp/MicrosoftEdgeDownloads/ea300424-f0a0-4053-a73a-d429479ccbdd/JHI-Fidra-Sludge-Contaminants-Risk-Report_Updated_2025.pdf (Accessed: 9th May 2025)
Jenkinson DS (2010) Climate change – a brief introduction for scientists and engineers or anyone else who has to do something about it. Rothamsted Research. https://repository.rothamsted.ac.uk/item/8v478/climate-change-a-brief-introduction-for-scientists-and-engineers-or-anyone-else-who-has-to-do-something-about-it (Accessed: 9th May 2025)
Land Use for Net Zero (LUNZ) Hub (2024) Approaches to Soil Monitoring across the Four Nations: Workshop on Cross-UK Soil Monitoring and Research https://lunzhub.com/resources/approaches-to-nationwide-soil-monitoring-across-the-uk/ (Accessed: 9th May 2025)
Neilson R, Aitkenhead M, Lilly A, Loades K, (2021) Monitoring soil health in Scotland by land use category – a scoping study ClimateXChange. DOI: https://doi.org/10.7488/era/1293 (Accessed: 9th May 2025)
NatureScot (2015) Scotland’s National Peatland Plan: Working for our future https://www.nature.scot/doc/scotlands-national-peatland-plan-working-our-future (Accessed: 9th May 2025)
Scotland’s Climate Change committee (2023) Adapting to climate change- Progress in Scotland https://www.theccc.org.uk/publication/adapting-to-climate-change-progress-in-scotland/ (Accessed: 9th May 2025)
Scotland’s Soils Website (2025) https://soils.environment.gov.scot/ (Accessed: 9th May 2025)
Scottish Government (2024) Adaptation Scotland, Climate-Ready Places https://adaptation.scot/take-action/climate-ready-places/ (Accessed: 9th May 2025)
Scottish Government (2023) Agricultural Reform List of Measures https://www.ruralpayments.org/topics/agricultural-reform-programme/arp-list-of-measures/ (Accessed: 9th May 2025)
Scottish Government (2024) Agricultural Reform Route Map https://www.ruralpayments.org/topics/agricultural-reform-programme/arp-route-map/ (Accessed: 9th May 2025)
Scottish Government (2022) Delivering our Vision for Scottish Agriculture Proposals for a new Agriculture Bill ISBN: 978-1-80435-843-6 (web only) https://www.gov.scot/binaries/content/documents/govscot/publications/consultation-paper/2022/08/delivering-vision-scottish-agriculture-proposals-new-agriculture-bill/documents/delivering-vision-scottish-agriculture-proposals-new-agriculture-bill/delivering-vision-scottish-agriculture-proposals-new-agriculture-bill/govscot%3Adocument/delivering-vision-scottish-agriculture-proposals-new-agriculture-bill.pdf (Accessed: 9th May 2025)
Scottish Government (2007) Environmental Protection Act 1990: Part IIA Contaminated Land The Radioactive Contaminated Land (Scotland) Regulations 2007 Statutory Guidance ISBN 978 0 7559 7058 2 (Web only) https://www.gov.scot/binaries/content/documents/govscot/publications/regulation-directive-order/2008/03/radioactive-contaminated-land-scotland-regulations-2007-statutory-guidance/documents/0058314-pdf/0058314-pdf/govscot%3Adocument/0058314.pdf (Accessed: 9th May 2025)
Scottish Government (2006) Environmental Protection Act 1990: Part IIA Contaminated Land Statutory Guidance: Edition 2 May 2006. SE/2006/44. ISBN 0-7559-6097-1 https://www.gov.scot/publications/environmental-protection-act-1990-part-iia-contaminated-land-statutory-guidance/ (Accessed: 9th May 2025)
Scottish Government (2018 ) Good Agricultural and Environmental Conditions (GAECs) https://www.ruralpayments.org/topics/inspections/all-inspections/cross-compliance/detailed-guidance/good-agricultural-and-environmental-conditions/ (Accessed: 9th May 2025)
Scottish Government (2024) Preparing for Sustainable Farming full guidance https://www.ruralpayments.org/topics/agricultural-reform-programme/preparing-for-sustainable-farming–psf–full-guidance/ (Accessed: 9th May 2025)
Scottish Government (2023) Scotland’s National Planning Framework 4. ISBN: 978-1-80525-482-9 (web only) https://www.gov.scot/binaries/content/documents/govscot/publications/strategy-plan/2023/02/national-planning-framework-4/documents/national-planning-framework-4-revised-draft/national-planning-framework-4-revised-draft/govscot%3Adocument/national-planning-framework-4.pdf (Accessed: 9th May 2025)
Scottish Government (2024) Scottish Biodiversity Strategy to 2045 Tackling the Nature Emergency in Scotland ISBN: 978-1-83601-150-7 (web only) https://www.gov.scot/binaries/content/documents/govscot/publications/strategy-plan/2024/11/scottish-biodiversity-strategy-2045/documents/scottish-biodiversity-strategy-2045-tackling-nature-emergency-scotland/scottish-biodiversity-strategy-2045-tackling-nature-emergency-scotland/govscot%3Adocument/scottish-biodiversity-strategy-2045-tackling-nature-emergency-scotland.pdf (Accessed: 9th May 2025)
Scottish Government (2024) Scottish National Adaptation Plan (Version3: 2024 – 2029) Actions today, for a climate resilient future, ISBN: 978-1-83601-729-5 (web only) https://www.gov.scot/binaries/content/documents/govscot/publications/strategy-plan/2024/09/scottish-national-adaptation-plan-2024-2029-2/documents/scottish-national-adaptation-plan-2024-2029/scottish-national-adaptation-plan-2024-2029/govscot%3Adocument/scottish-national-adaptation-plan-2024-2029.pdf (Accessed: 9th May 2025)
Scottish Government (2009) The Scottish Soil Framework, ISBN: 978-0-7559-9013-9 https://www.gov.scot/publications/scottish-soil-framework/ (Accessed: 9th May 2025)
Scottish Government (2013) The Scottish Soil Framework – Progress report https://soils.environment.gov.scot/media/1018/115131209_scottish_soil_framework_-ssf-_progress_report.pdf (Accessed: 9th May 2025)
Scottish Government (2025) Whole Farm Plan full guidance https://www.ruralpayments.org/topics/all-schemes/whole-farm-plan/ (Accessed: 9th May 2025)
UK Government (2008) The Action Programme for Nitrate Vulnerable Zones (Scotland) Regulations 2008 https://www.legislation.gov.uk/ssi/2008/298/contents/made (Accessed: 9th May 2025)
UK Government (1994) The Conservation (Natural Habitats, &c.) Regulations 1994 https://www.legislation.gov.uk/uksi/1994/2716/contents (Accessed: 9th May 2025)
UK Government (2005) The Contaminated Land (Scotland) Regulations 2005 https://www.legislation.gov.uk/ssi/2005/658/contents/made (Accessed: 9th May 2025)
UK Government (2012) The Pollution Prevention and Control (Scotland) Regulations 2012 https://www.legislation.gov.uk/ssi/2012/360/contents (Accessed: 9th May 2025)
UK Government (1989) The Sludge (Use in Agriculture) Regulations 1989 https://www.legislation.gov.uk/uksi/1989/1263/contents/made (Accessed: 9th May 2025)
UK Government (2015) The Sludge (Use in Agriculture) Regulations 1989 -Changes to Legislation Results https://www.legislation.gov.uk/changes/affected/uksi/1989/1263 (Accessed: 9th May 2025)
UK Government (2011) The Waste Management Licensing (Scotland) Regulations 2011 https://www.legislation.gov.uk/sdsi/2011/9780111012147/contents (Accessed: 9th May 2025)
UK Government (2011) The Water Environment (Controlled Activities) (Scotland) Regulations 2011 https://www.legislation.gov.uk/ssi/2011/209/contents/made (Accessed: 9th May 2025)
How to cite this publication:
Buckingham, S., and Baggaley, N. (2025) ‘Securing soils in a changing climate: A soil route map for Scotland’, ClimateXChange. http://dx.doi.org/10.7488/era/6006
© The University of Edinburgh, 2025
Prepared by SAC Consulting on behalf of ClimateXChange, The University of Edinburgh. All rights reserved.
While every effort is made to ensure the information in this report is accurate, no legal responsibility is accepted for any errors, omissions or misleading statements. The views expressed represent those of the author(s), and do not necessarily represent those of the host institutions or funders.
This work was supported by the Rural and Environment Science and Analytical Services Division of the Scottish Government (CoE – CXC).
ClimateXChange
Edinburgh Climate Change Institute
High School Yards
Edinburgh EH1 1LZ
+44 (0) 131 651 4783